Embed Size (px)
Citation preview
AQA GCSE Geography
Complete Case Study and
Example Booklet
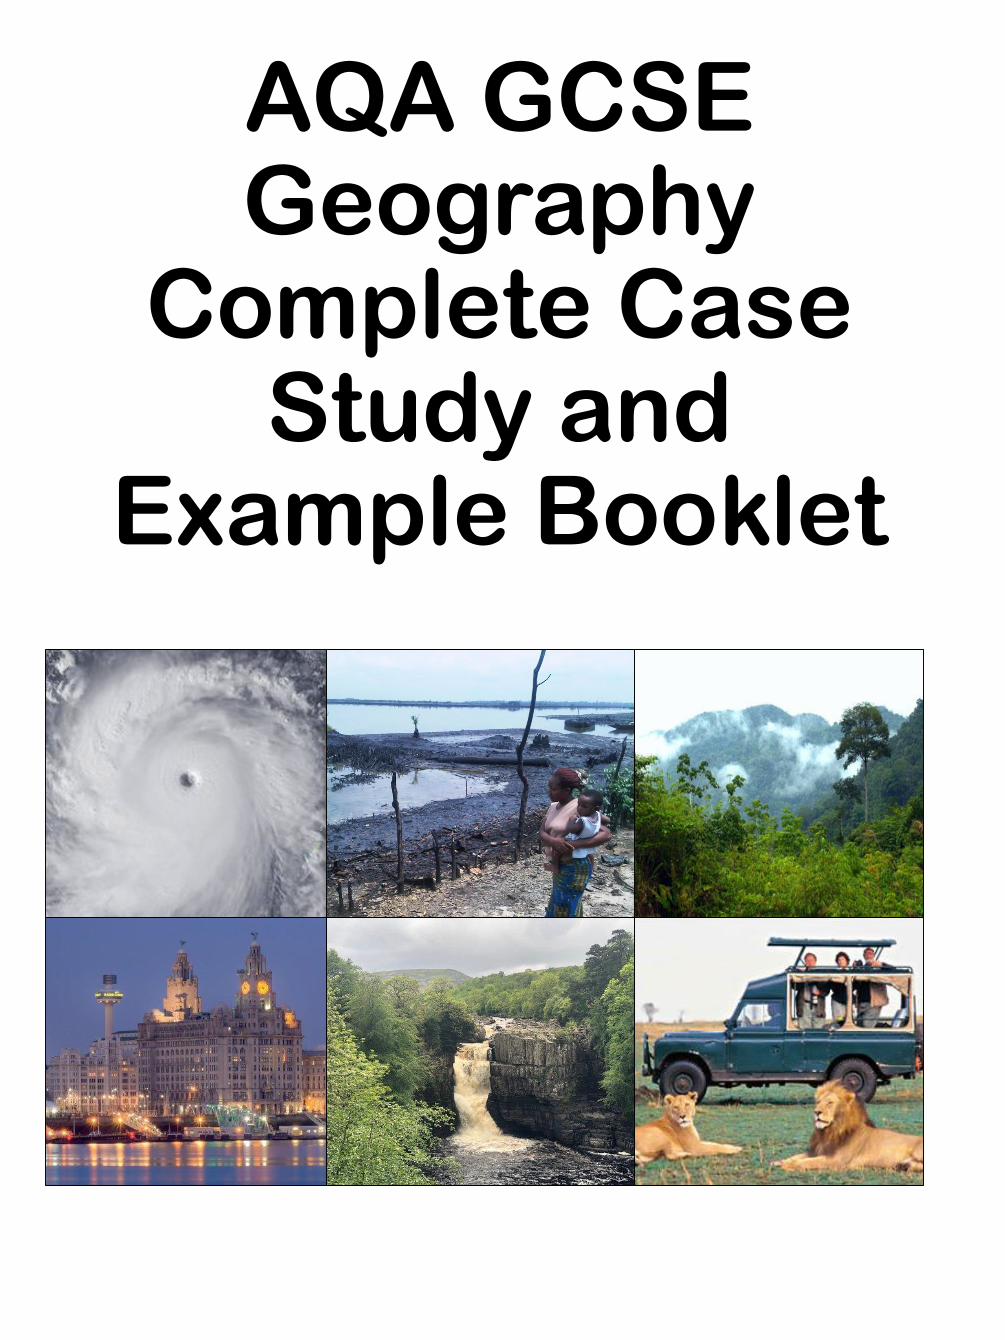
Complete list of case studies and named examples for the course:
Effects of and responses to a tectonic hazard in a HIC L’Aquila
Effects of and responses to a tectonic hazard in a LIC Nepal
Impacts of a Tropical Storm on people and the
environment
Typhoon Haiyan
Extreme weather event in the UK Somerset Levels
Example of a small scale ecosystem Freshwater pond, UK
Case Study of a Tropical Rainforest Malaysian Rainforest
Development of a Cold Environment Svalbard
Coastal landforms and processes Dorset
Coastal management strategies Lyme Regis
Distinctive fluvial landforms River Tees
River Management strategies Banbury
Paper 1
Paper 2
Urban growth in an NEE (opportunities and challenges) Rio de Janeiro
Urban growth in the UK (opportunities and challenges) Liverpool
UK Urban regeneration project Albert Dock
Growth of tourism in an LIC to reduce development gap Kenya
Rapid economic development in an LIC Nigeria
Modern industrial development can be more
environmentally sustainable
Torr Quarry, Somerset
Advantages and disadvantages of a fossil fuel Natural gas in the
Amazon
Local renewable energy scheme in an LIC Rice husk biomass,
Bihar India
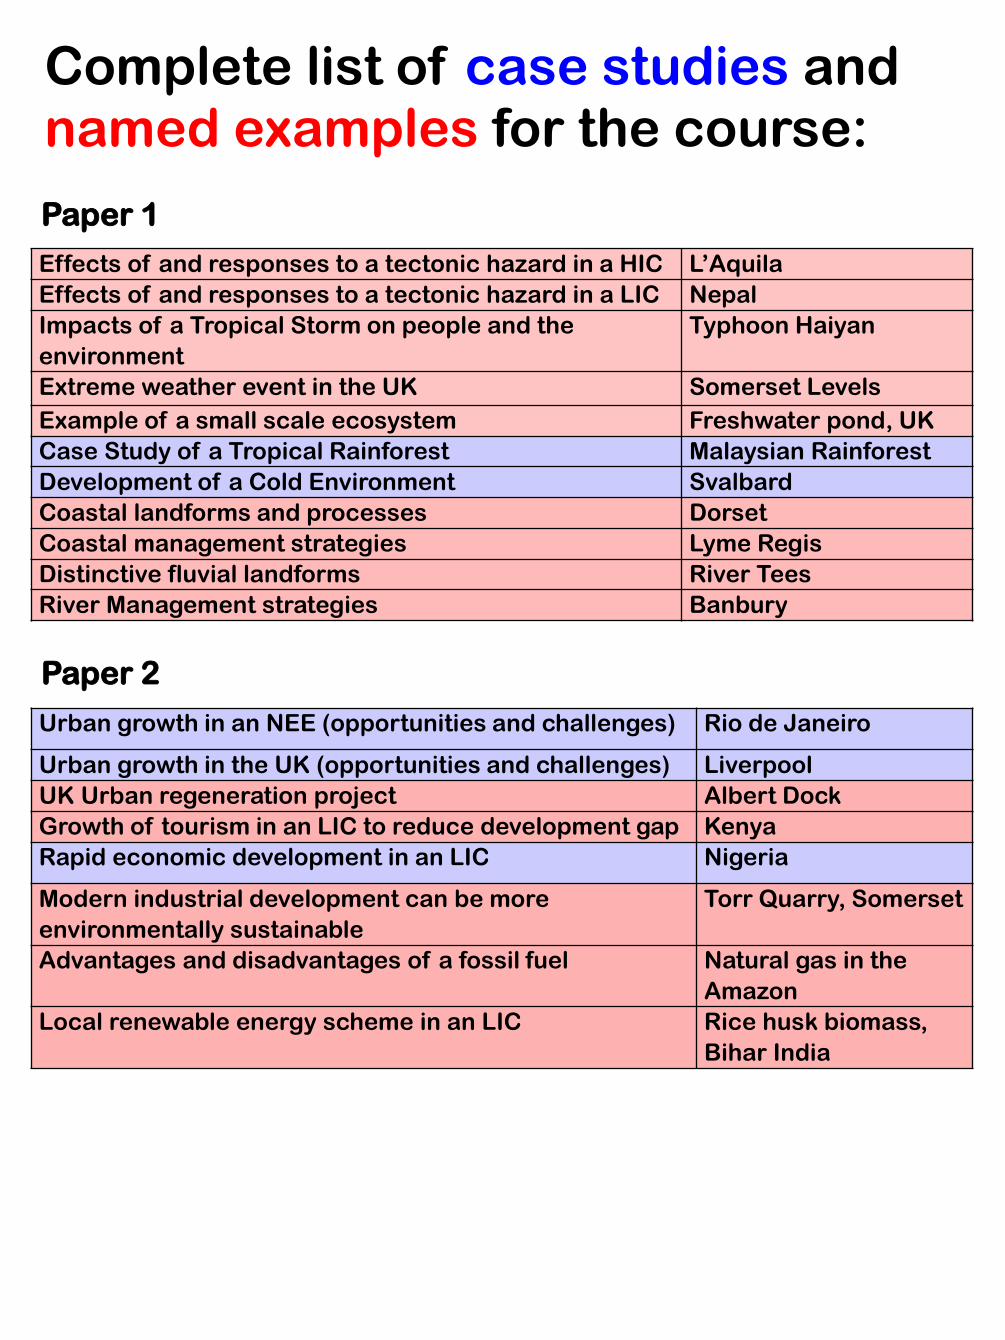
L’Aquila Earthquake
What? 6.3 Magnitude Earthquake
Where? L’Aquila, Central Italy
When? 6th April 2009
Why?The oceanic African
plate is subducting
beneath the continental
Eurasian plate.
IMPACTS
Economic
PRIMARY SECONDARY PRIMARY SECONDARY
Businesses destroyed
Bridge connecting city to
nearby towns destroyed.
$11.4m total damage
House prices and rents
increased
Decreased tourism in L’Aquila
Social
PRIMARY SECONDARY PRIMARY SECONDARY
15,000 buildings collapsed
Salvatore Hospital damaged
308 people killed
67,500 people homeless
University applicants declined
Fires killed people in damaged
buildings
Environmental
PRIMARY SECONDARY PRIMARY SECONDARY
Destruction of habitats
1000 square km of land
affected by surface ruptures
300 aftershocks up to 4.5 on
richter scale.
Landslides triggered by
aftershocks
RESPONSES
Immediate
Long-term
Italian Red Cross were
searching for survivors
within an hour.
40,000 tents issued to
homeless.
Hotels sheltered 10,000
homeless people.
Students university fees
scrapped.
Taxes cancelled for residents in
2010
Investigation into why
‘earthquake proof’ buildings
collapsed.
Why were the responses
effective?
• Italy is a rich country so
the government had
available funds after
earthquake.
• Emergency response
was rapid due to good
training.
• Excellent medical
facilities to treat the
injured.
Your example of an earthquake in a HIC
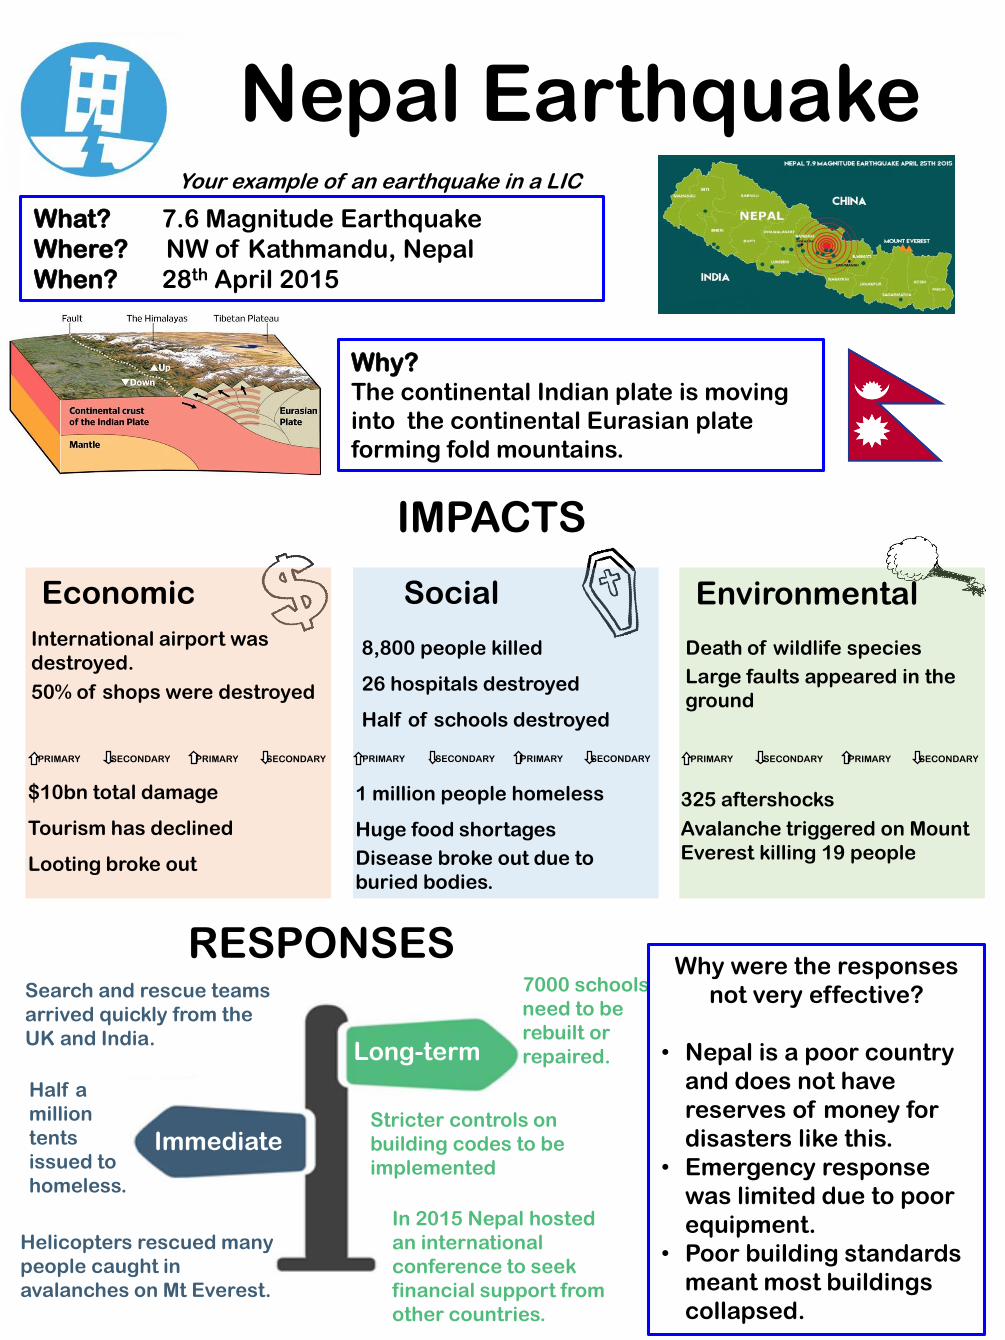
Nepal EarthquakeYour example of an earthquake in a LIC
What? 7.6 Magnitude Earthquake
Where? NW of Kathmandu, Nepal
When? 28th April 2015
Why?The continental Indian plate is moving
into the continental Eurasian plate
forming fold mountains.
IMPACTS
Economic
PRIMARY SECONDARY PRIMARY SECONDARY
International airport was
destroyed.
50% of shops were destroyed
$10bn total damage
Tourism has declined
Looting broke out
Social
PRIMARY SECONDARY PRIMARY SECONDARY
8,800 people killed
26 hospitals destroyed
Half of schools destroyed
1 million people homeless
Huge food shortages
Disease broke out due to
buried bodies.
Environmental
PRIMARY SECONDARY PRIMARY SECONDARY
Death of wildlife species
Large faults appeared in the
ground
325 aftershocks
Avalanche triggered on Mount
Everest killing 19 people
RESPONSES
Immediate
Long-term
Helicopters rescued many
people caught in
avalanches on Mt Everest.
Half a
million
tents
issued to
homeless.
Search and rescue teams
arrived quickly from the
UK and India.
7000 schools
need to be
rebuilt or
repaired.
Stricter controls on
building codes to be
implemented
In 2015 Nepal hosted
an international
conference to seek
financial support from
other countries.
Why were the responses
not very effective?
• Nepal is a poor country
and does not have
reserves of money for
disasters like this.
• Emergency response
was limited due to poor
equipment.
• Poor building standards
meant most buildings
collapsed.
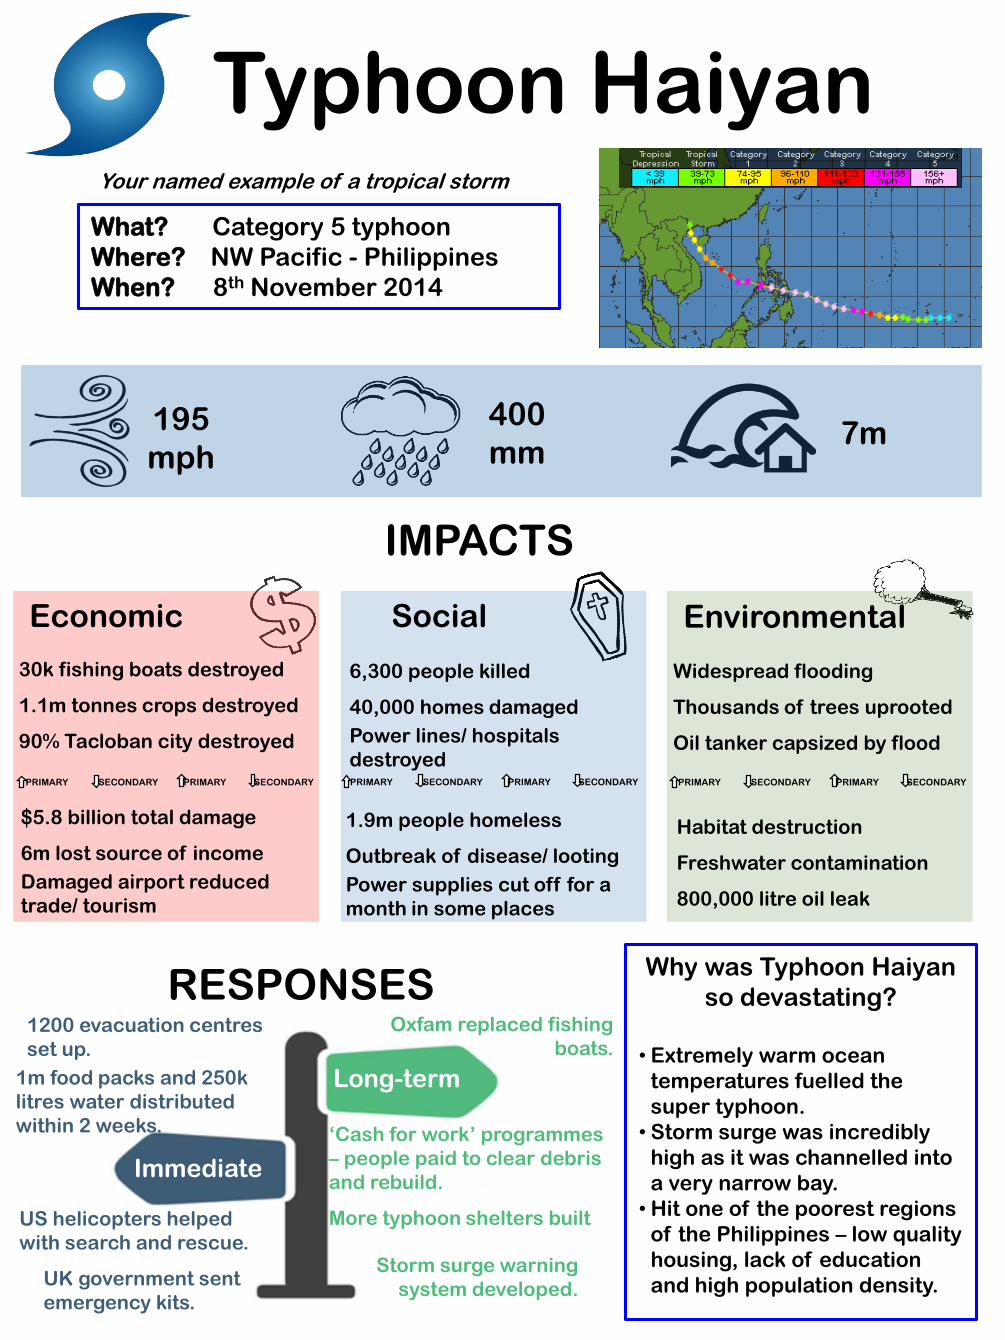
Typhoon Haiyan
What? Category 5 typhoon
Where? NW Pacific - Philippines
When? 8th November 2014
195
mph
400
mm7m
IMPACTS
Economic
PRIMARY SECONDARY PRIMARY SECONDARY
30k fishing boats destroyed
1.1m tonnes crops destroyed
90% Tacloban city destroyed
$5.8 billion total damage
6m lost source of income
Damaged airport reduced
trade/ tourism
Social
PRIMARY SECONDARY PRIMARY SECONDARY
6,300 people killed
40,000 homes damaged
Power lines/ hospitals
destroyed
1.9m people homeless
Outbreak of disease/ looting
Power supplies cut off for a
month in some places
Environmental
PRIMARY SECONDARY PRIMARY SECONDARY
Widespread flooding
Thousands of trees uprooted
Oil tanker capsized by flood
Habitat destruction
Freshwater contamination
800,000 litre oil leak
RESPONSES
Immediate
Long-term
1200 evacuation centres
set up.
UK government sent
emergency kits.
US helicopters helped
with search and rescue.
1m food packs and 250k
litres water distributed
within 2 weeks.
Oxfam replaced fishing
boats.
‘Cash for work’ programmes
– people paid to clear debris
and rebuild.
More typhoon shelters built
Storm surge warning
system developed.
Why was Typhoon Haiyan
so devastating?
• Extremely warm ocean
temperatures fuelled the
super typhoon.
• Storm surge was incredibly
high as it was channelled into
a very narrow bay.
• Hit one of the poorest regions
of the Philippines – low quality
housing, lack of education
and high population density.
Your named example of a tropical storm
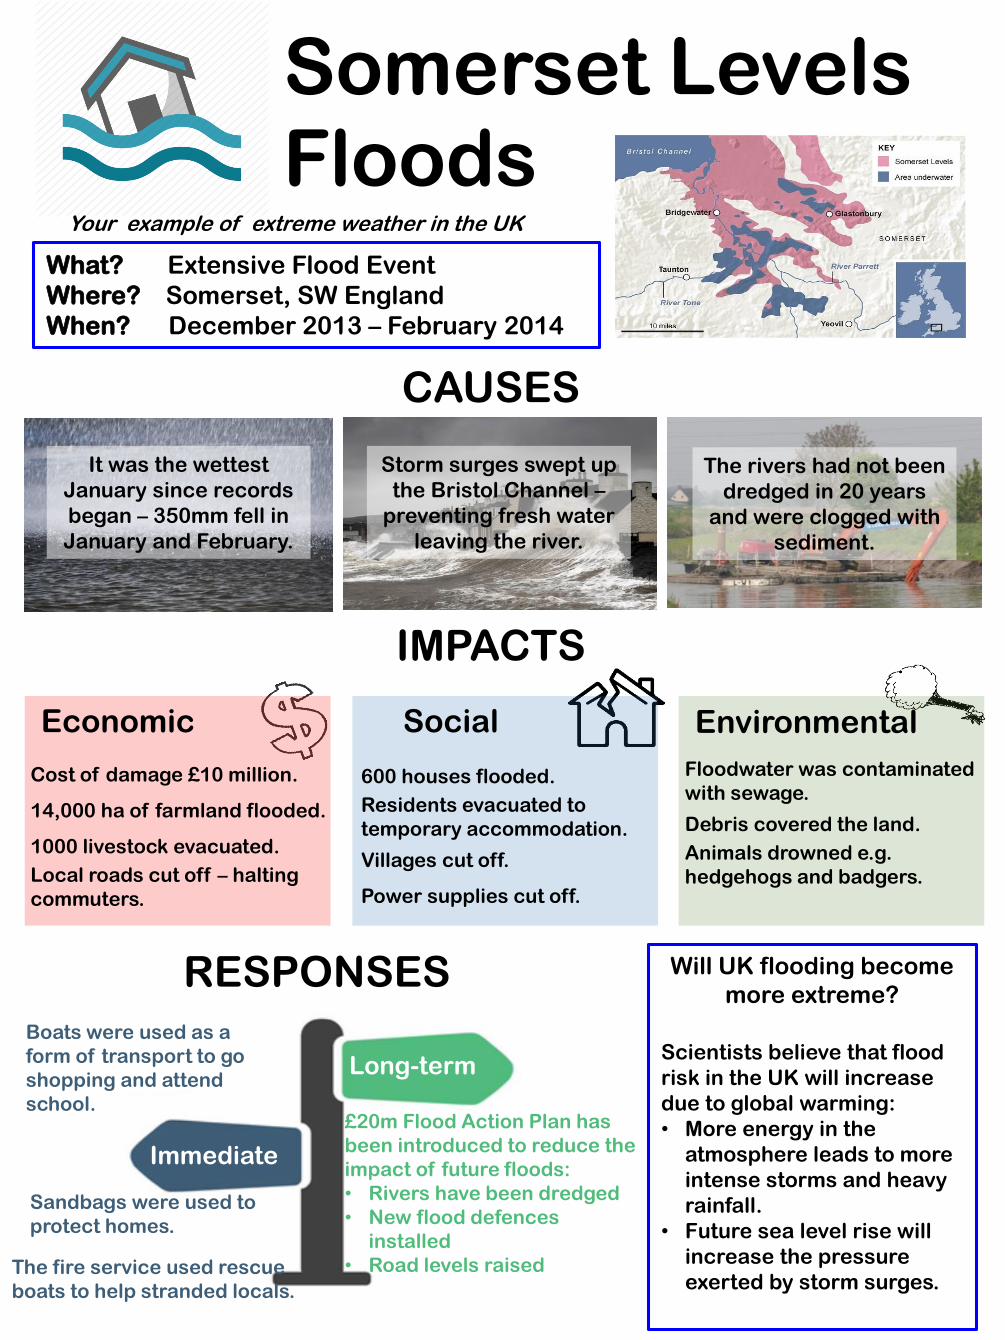
Somerset Levels Floods
Your example of extreme weather in the UK
What? Extensive Flood Event
Where? Somerset, SW England
When? December 2013 – February 2014
CAUSES
It was the wettest
January since records
began – 350mm fell in
January and February.
Storm surges swept up
the Bristol Channel –
preventing fresh water
leaving the river.
The rivers had not been
dredged in 20 years
and were clogged with
sediment.
IMPACTS
Economic
Cost of damage £10 million.
14,000 ha of farmland flooded.
1000 livestock evacuated.
Local roads cut off – halting
commuters.
Social
600 houses flooded.
Residents evacuated to
temporary accommodation.
Villages cut off.
Power supplies cut off.
Environmental
Floodwater was contaminated
with sewage.
Debris covered the land.
Animals drowned e.g.
hedgehogs and badgers.
RESPONSES
Immediate
Long-term
The fire service used rescue
boats to help stranded locals.
Sandbags were used to
protect homes.
Boats were used as a
form of transport to go
shopping and attend
school.£20m Flood Action Plan has
been introduced to reduce the
impact of future floods:
• Rivers have been dredged
• New flood defences
installed
• Road levels raised
Will UK flooding become
more extreme?
Scientists believe that flood
risk in the UK will increase
due to global warming:
• More energy in the
atmosphere leads to more
intense storms and heavy
rainfall.
• Future sea level rise will
increase the pressure
exerted by storm surges.
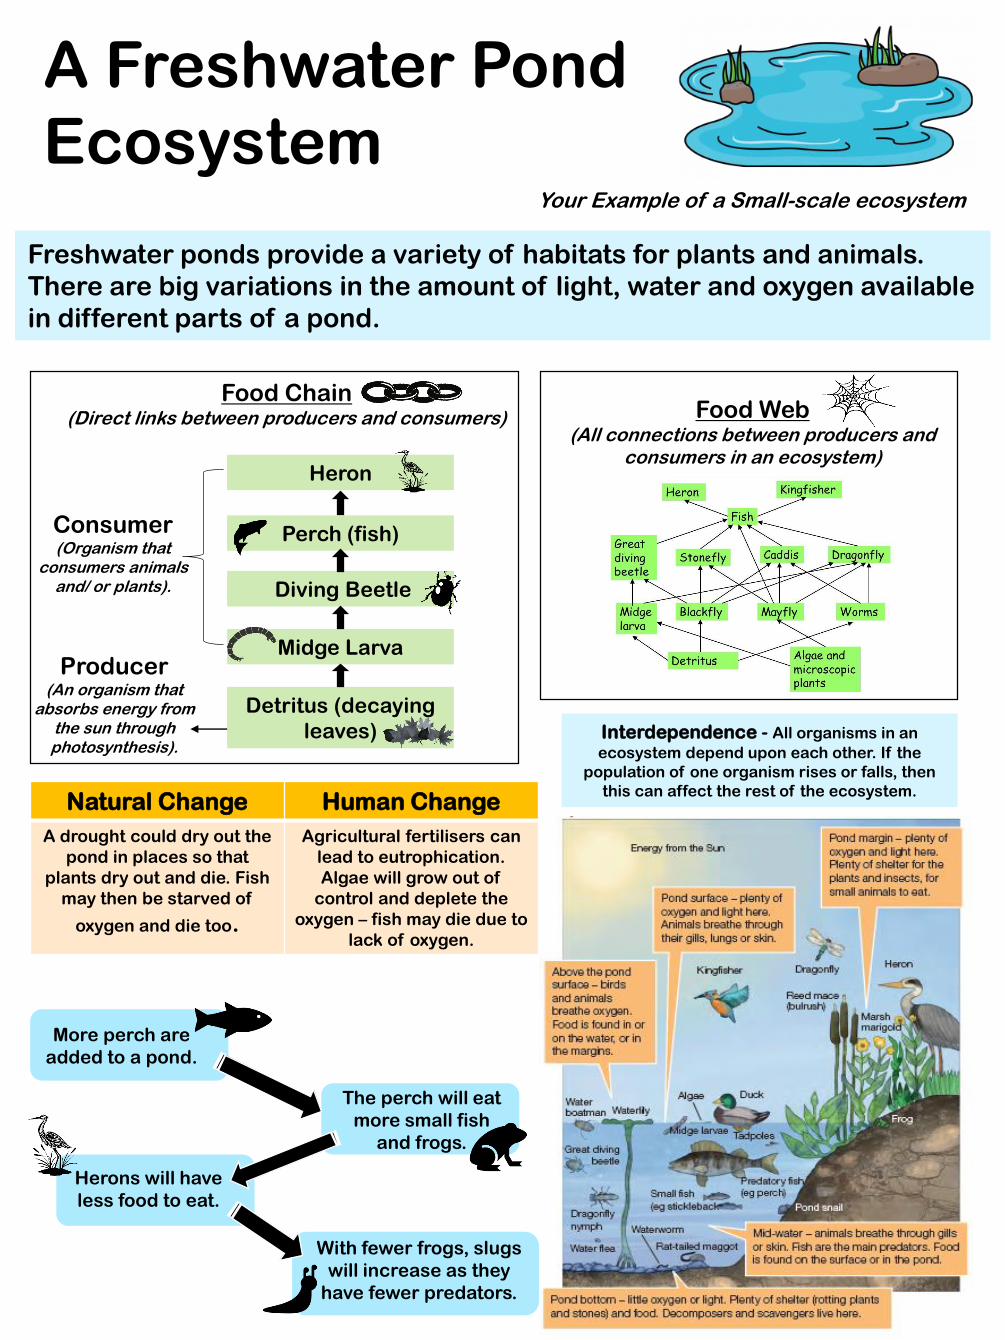
A Freshwater Pond
EcosystemYour Example of a Small-scale ecosystem
Freshwater ponds provide a variety of habitats for plants and animals.
There are big variations in the amount of light, water and oxygen available
in different parts of a pond.
Food Chain(Direct links between producers and consumers)
Detritus (decaying
leaves)
Midge Larva
Diving Beetle
Perch (fish)
Heron
Producer(An organism that
absorbs energy from the sun through photosynthesis).
Consumer(Organism that
consumers animals and/ or plants).
Food Web(All connections between producers and
consumers in an ecosystem)
Interdependence - All organisms in an
ecosystem depend upon each other. If the
population of one organism rises or falls, then
this can affect the rest of the ecosystem.Natural Change Human Change
A drought could dry out the
pond in places so that
plants dry out and die. Fish
may then be starved of
oxygen and die too.
Agricultural fertilisers can
lead to eutrophication.
Algae will grow out of
control and deplete the
oxygen – fish may die due to
lack of oxygen.
More perch are
added to a pond.
The perch will eat
more small fish
and frogs.
With fewer frogs, slugs
will increase as they
have fewer predators.
Herons will have
less food to eat.
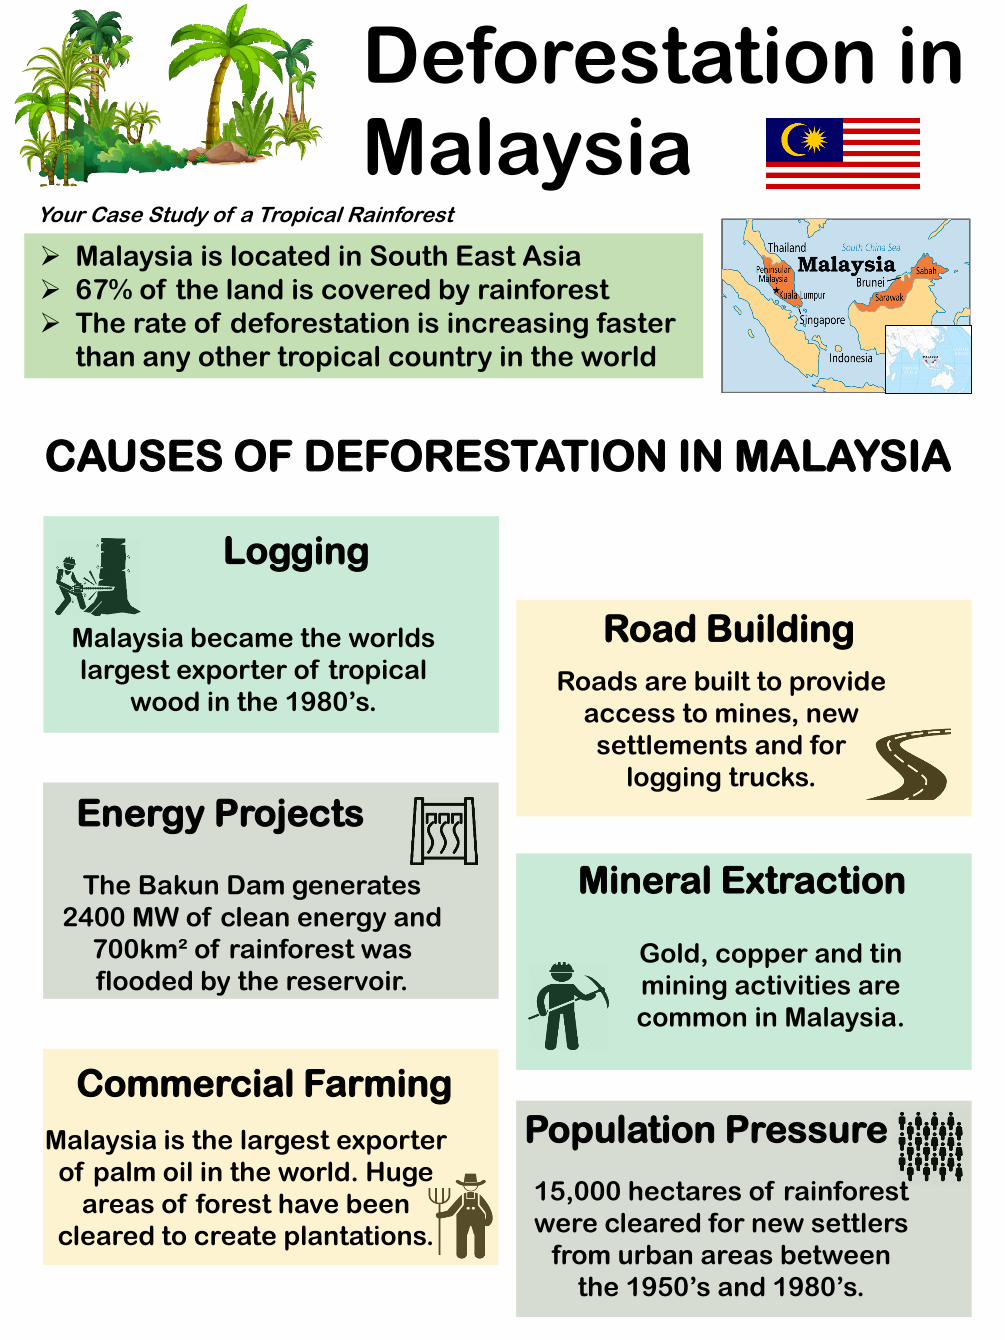
Deforestation in Malaysia
Malaysia is located in South East Asia
67% of the land is covered by rainforest
The rate of deforestation is increasing faster
than any other tropical country in the world
CAUSES OF DEFORESTATION IN MALAYSIA
Logging
Malaysia became the worlds
largest exporter of tropical
wood in the 1980’s.
Road Building
Roads are built to provide
access to mines, new
settlements and for
logging trucks.
Energy Projects
The Bakun Dam generates
2400 MW of clean energy and
700km² of rainforest was
flooded by the reservoir.
Mineral Extraction
Gold, copper and tin
mining activities are
common in Malaysia.
Commercial Farming
Malaysia is the largest exporter
of palm oil in the world. Huge
areas of forest have been
cleared to create plantations.
Population Pressure
15,000 hectares of rainforest
were cleared for new settlers
from urban areas between
the 1950’s and 1980’s.
Your Case Study of a Tropical Rainforest
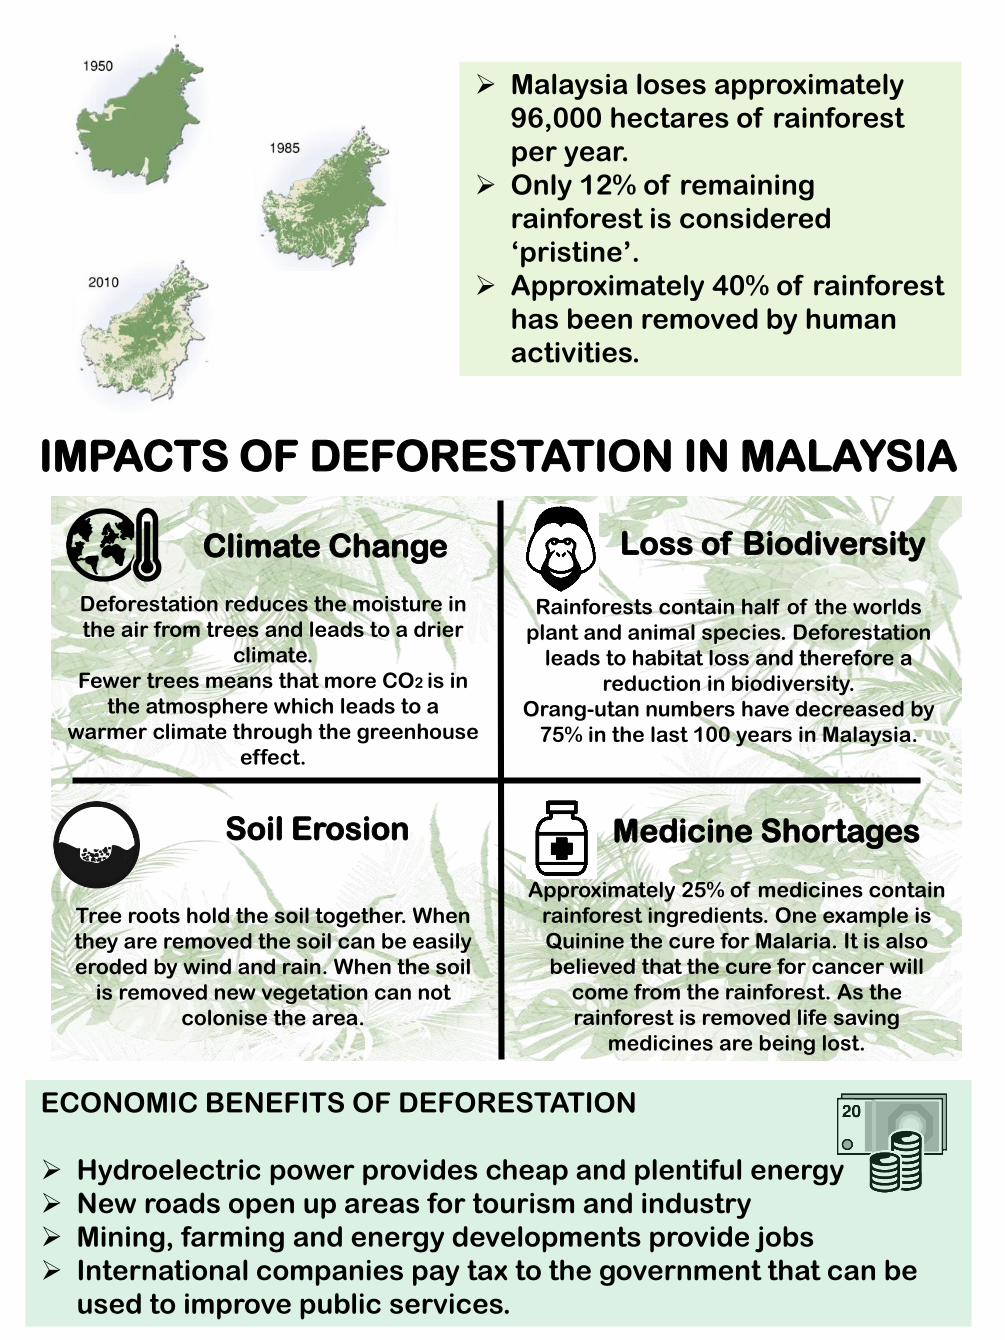
ECONOMIC BENEFITS OF DEFORESTATION
Hydroelectric power provides cheap and plentiful energy
New roads open up areas for tourism and industry
Mining, farming and energy developments provide jobs
International companies pay tax to the government that can be
used to improve public services.
Malaysia loses approximately
96,000 hectares of rainforest
per year.
Only 12% of remaining
rainforest is considered
‘pristine’.
Approximately 40% of rainforest
has been removed by human
activities.
IMPACTS OF DEFORESTATION IN MALAYSIA
Climate Change
Deforestation reduces the moisture in
the air from trees and leads to a drier
climate.
Fewer trees means that more CO2 is in
the atmosphere which leads to a
warmer climate through the greenhouse
effect.
Loss of Biodiversity
Rainforests contain half of the worlds
plant and animal species. Deforestation
leads to habitat loss and therefore a
reduction in biodiversity.
Orang-utan numbers have decreased by
75% in the last 100 years in Malaysia.
Soil Erosion
Tree roots hold the soil together. When
they are removed the soil can be easily
eroded by wind and rain. When the soil
is removed new vegetation can not
colonise the area.
Medicine Shortages
Approximately 25% of medicines contain
rainforest ingredients. One example is
Quinine the cure for Malaria. It is also
believed that the cure for cancer will
come from the rainforest. As the
rainforest is removed life saving
medicines are being lost.
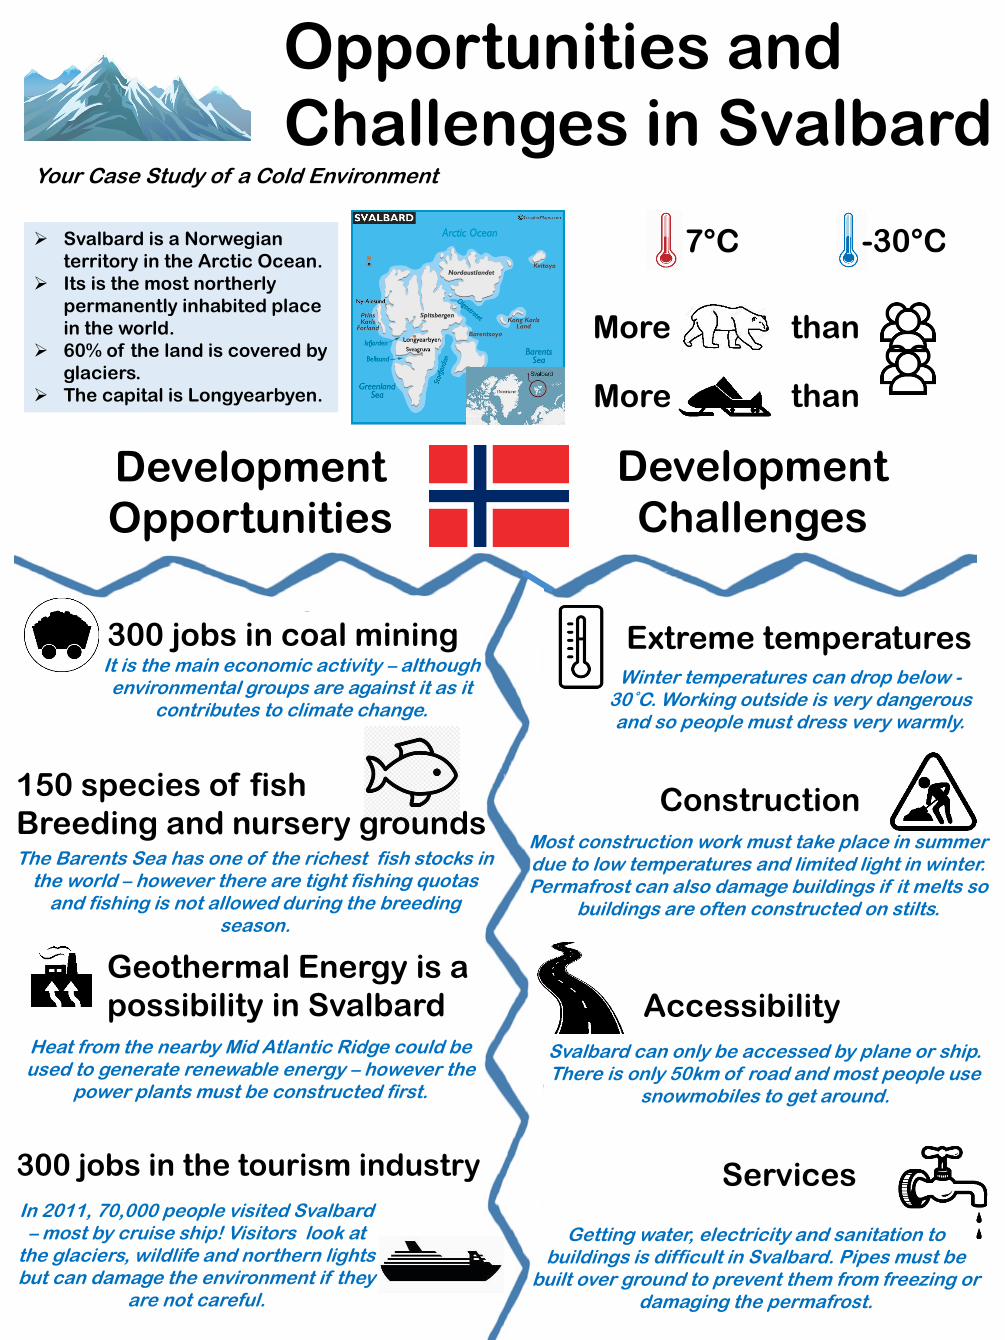
Opportunities and
Challenges in Svalbard
Svalbard is a Norwegian
territory in the Arctic Ocean.
Its is the most northerly
permanently inhabited place
in the world.
60% of the land is covered by
glaciers.
The capital is Longyearbyen.
7°C -30°C
More
More
than
than
Development
Opportunities
Development
Challenges
300 jobs in coal miningIt is the main economic activity – although environmental groups are against it as it
contributes to climate change.
150 species of fish
Breeding and nursery groundsThe Barents Sea has one of the richest fish stocks in
the world – however there are tight fishing quotas and fishing is not allowed during the breeding
season.
Geothermal Energy is a
possibility in SvalbardHeat from the nearby Mid Atlantic Ridge could be used to generate renewable energy – however the
power plants must be constructed first.
300 jobs in the tourism industry
In 2011, 70,000 people visited Svalbard – most by cruise ship! Visitors look at
the glaciers, wildlife and northern lights but can damage the environment if they
are not careful.
Extreme temperaturesWinter temperatures can drop below -
30˚C. Working outside is very dangerous and so people must dress very warmly.
ConstructionMost construction work must take place in summer due to low temperatures and limited light in winter. Permafrost can also damage buildings if it melts so
buildings are often constructed on stilts.
Services
Getting water, electricity and sanitation to buildings is difficult in Svalbard. Pipes must be
built over ground to prevent them from freezing or damaging the permafrost.
Accessibility
Svalbard can only be accessed by plane or ship. There is only 50km of road and most people use
snowmobiles to get around.
Your Case Study of a Cold Environment
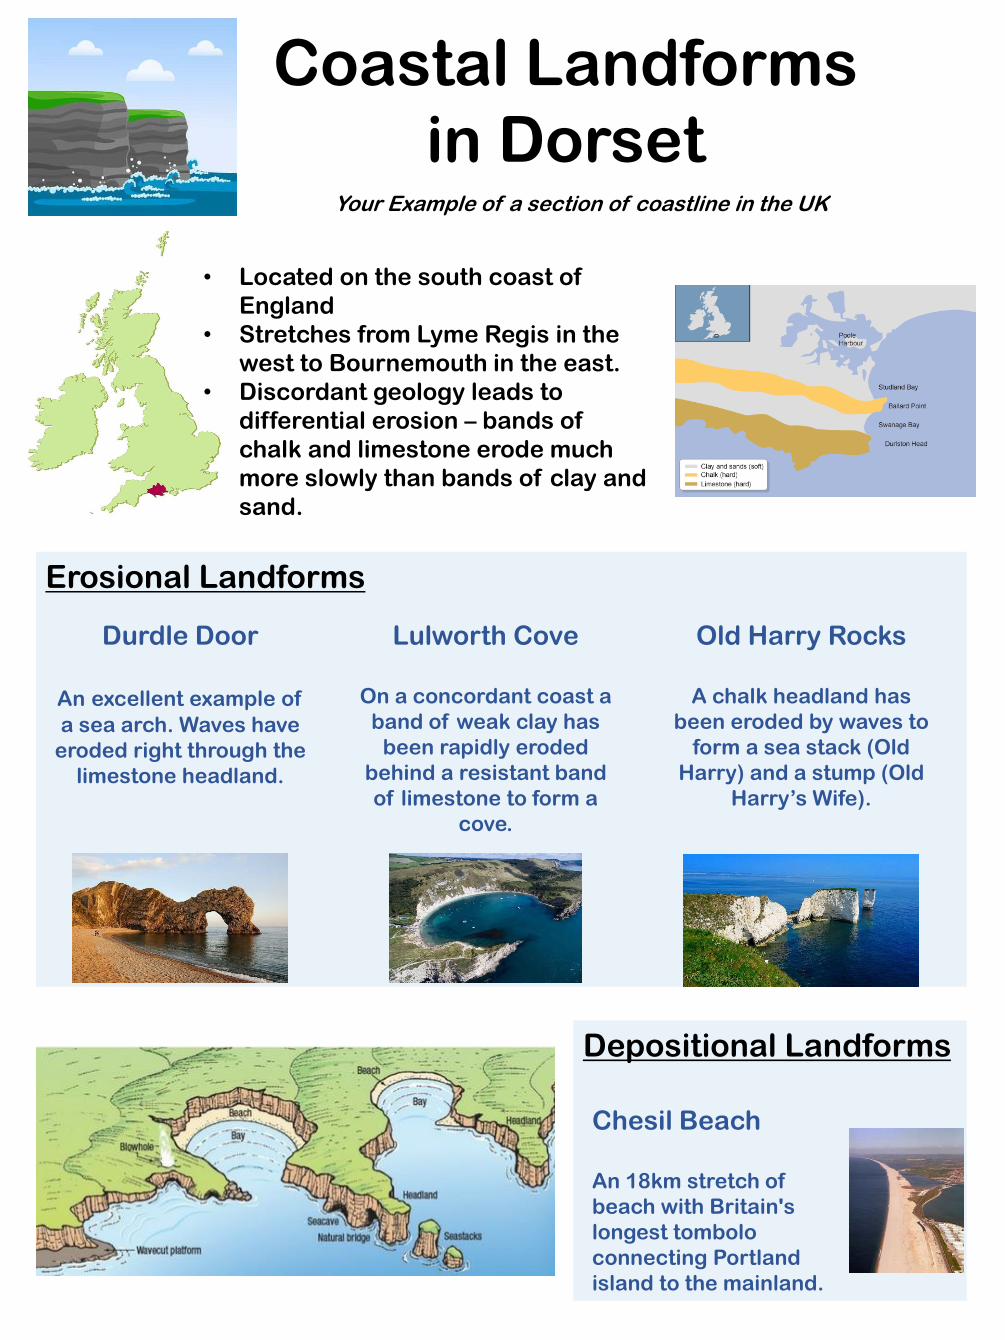
Coastal Landforms
in Dorset
• Located on the south coast of
England
• Stretches from Lyme Regis in the
west to Bournemouth in the east.
• Discordant geology leads to
differential erosion – bands of
chalk and limestone erode much
more slowly than bands of clay and
sand.
Erosional Landforms
Durdle Door
An excellent example of
a sea arch. Waves have
eroded right through the
limestone headland.
Lulworth Cove
On a concordant coast a
band of weak clay has
been rapidly eroded
behind a resistant band
of limestone to form a
cove.
Old Harry Rocks
A chalk headland has
been eroded by waves to
form a sea stack (Old
Harry) and a stump (Old
Harry’s Wife).
Depositional Landforms
Chesil Beach
An 18km stretch of
beach with Britain's
longest tombolo
connecting Portland
island to the mainland.
Your Example of a section of coastline in the UK
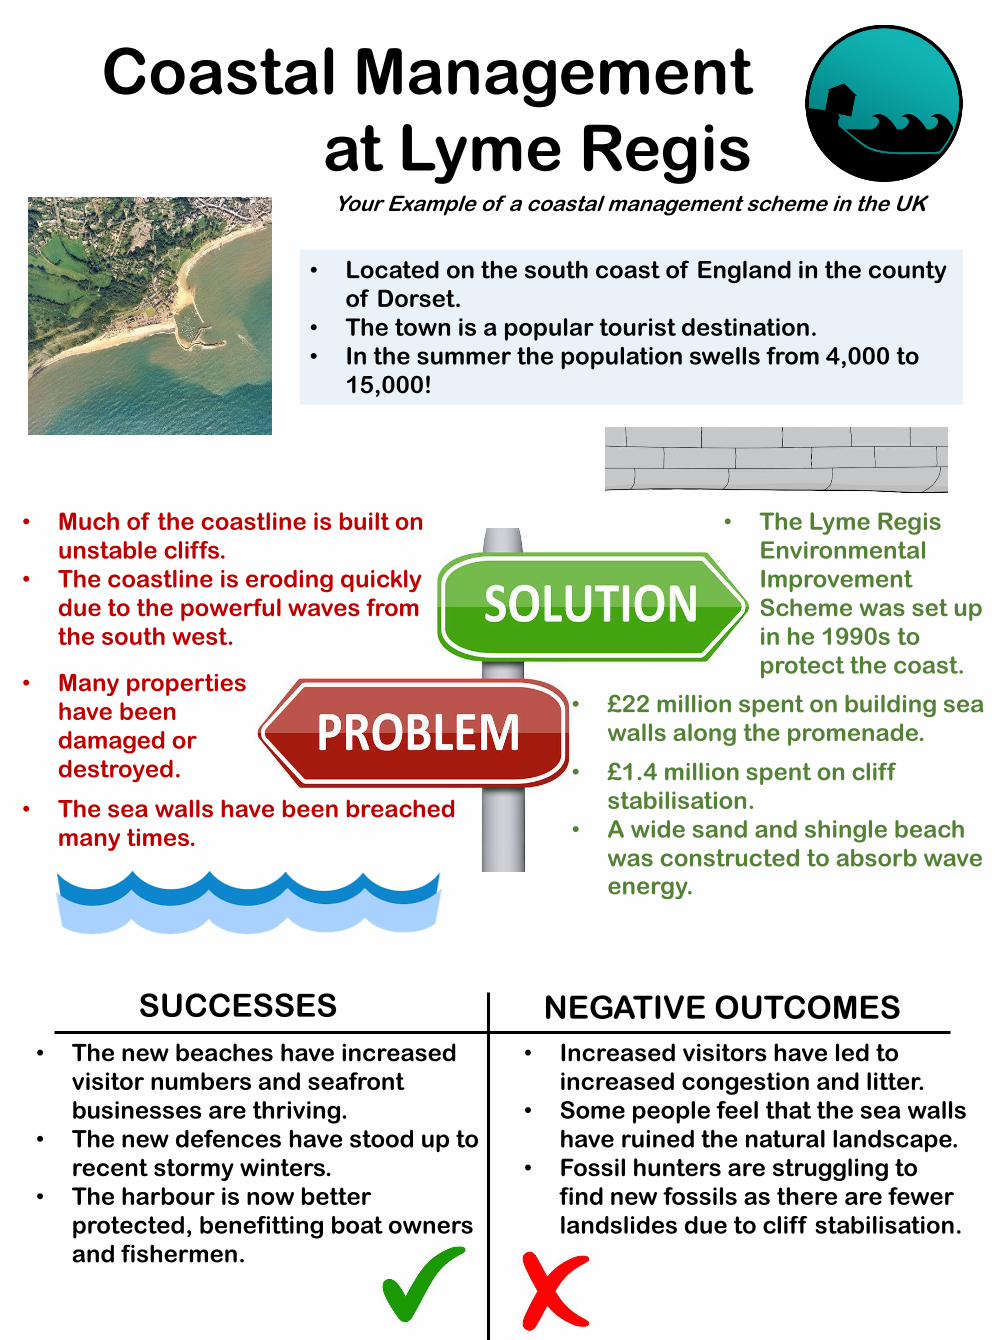
Coastal Management
at Lyme Regis
• Located on the south coast of England in the county
of Dorset.
• The town is a popular tourist destination.
• In the summer the population swells from 4,000 to
15,000!
• Much of the coastline is built on
unstable cliffs.
• The coastline is eroding quickly
due to the powerful waves from
the south west.
• Many properties
have been
damaged or
destroyed.
• The sea walls have been breached
many times.
• The Lyme Regis
Environmental
Improvement
Scheme was set up
in he 1990s to
protect the coast.
• £22 million spent on building sea
walls along the promenade.
• £1.4 million spent on cliff
stabilisation.
• A wide sand and shingle beach
was constructed to absorb wave energy.
SUCCESSES NEGATIVE OUTCOMES
• The new beaches have increased
visitor numbers and seafront
businesses are thriving.
• The new defences have stood up to
recent stormy winters.
• The harbour is now better
protected, benefitting boat owners
and fishermen.
• Increased visitors have led to
increased congestion and litter.
• Some people feel that the sea walls
have ruined the natural landscape.
• Fossil hunters are struggling to
find new fossils as there are fewer
landslides due to cliff stabilisation.
Your Example of a coastal management scheme in the UK
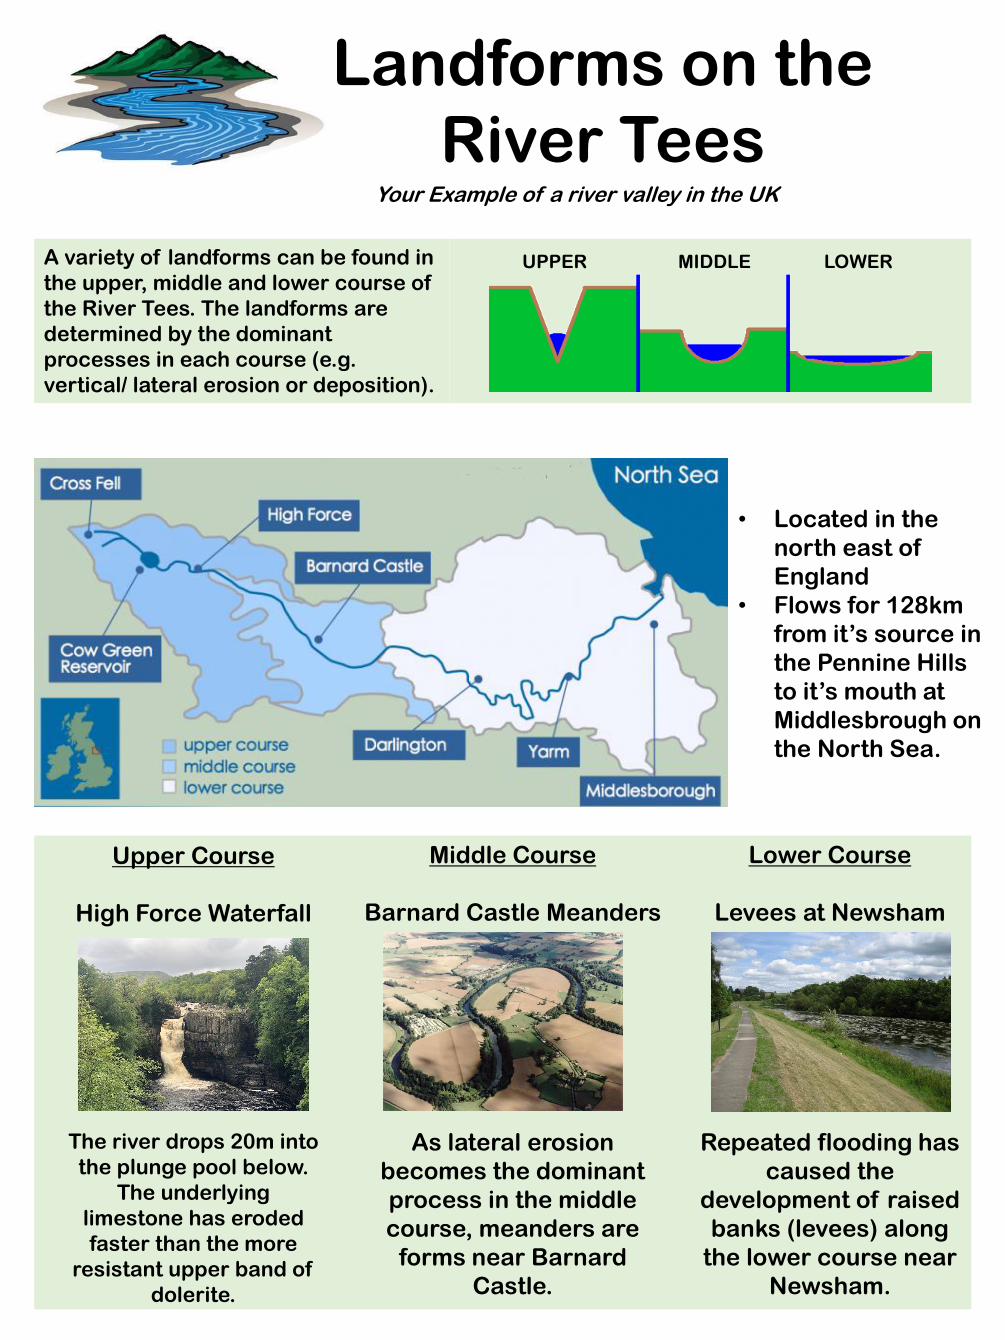
Landforms on the
River TeesYour Example of a river valley in the UK
• Located in the
north east of
England
• Flows for 128km
from it’s source in
the Pennine Hills
to it’s mouth at
Middlesbrough on
the North Sea.
A variety of landforms can be found in
the upper, middle and lower course of
the River Tees. The landforms are
determined by the dominant
processes in each course (e.g.
vertical/ lateral erosion or deposition).
UPPER MIDDLE LOWER
Upper Course
High Force Waterfall
The river drops 20m into
the plunge pool below.
The underlying
limestone has eroded
faster than the more
resistant upper band of
dolerite.
Middle Course
Barnard Castle Meanders
As lateral erosion
becomes the dominant
process in the middle
course, meanders are
forms near Barnard
Castle.
Lower Course
Levees at Newsham
Repeated flooding has
caused the
development of raised
banks (levees) along
the lower course near
Newsham.
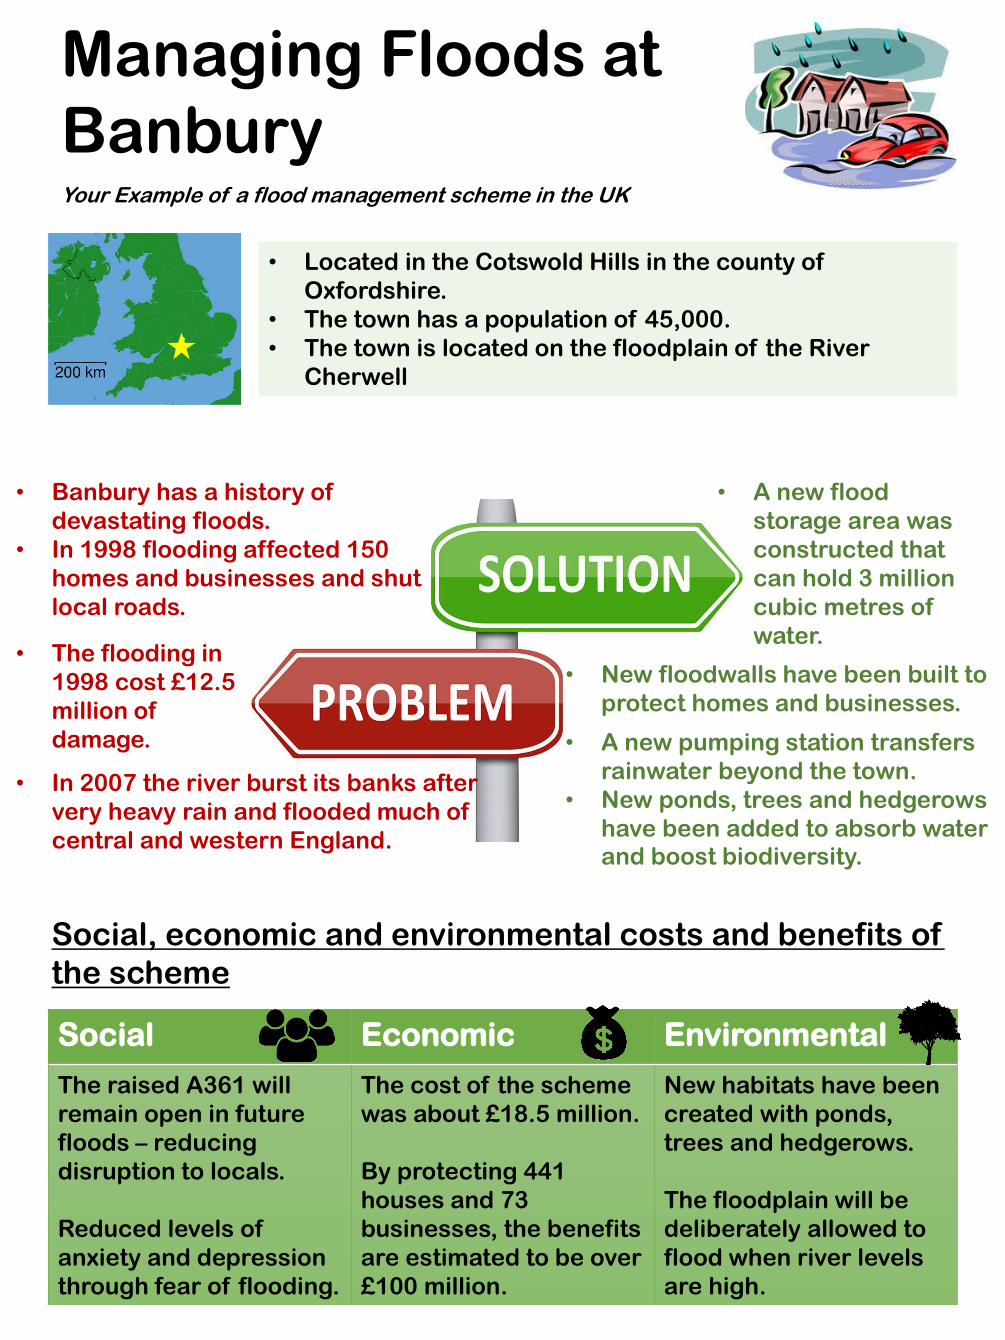
Managing Floods at
BanburyYour Example of a flood management scheme in the UK
• Located in the Cotswold Hills in the county of
Oxfordshire.
• The town has a population of 45,000.
• The town is located on the floodplain of the River
Cherwell
• Banbury has a history of
devastating floods.
• In 1998 flooding affected 150
homes and businesses and shut
local roads.
• The flooding in
1998 cost £12.5
million of
damage.
• In 2007 the river burst its banks after
very heavy rain and flooded much of
central and western England.
• A new flood
storage area was
constructed that
can hold 3 million
cubic metres of
water.
• New floodwalls have been built to
protect homes and businesses.
• A new pumping station transfers
rainwater beyond the town.
• New ponds, trees and hedgerows
have been added to absorb water and boost biodiversity.
Social, economic and environmental costs and benefits of
the scheme
Social Economic Environmental
The raised A361 will
remain open in future
floods – reducing
disruption to locals.
Reduced levels of
anxiety and depression
through fear of flooding.
The cost of the scheme
was about £18.5 million.
By protecting 441
houses and 73
businesses, the benefits
are estimated to be over
£100 million.
New habitats have been
created with ponds,
trees and hedgerows.
The floodplain will be
deliberately allowed to
flood when river levels
are high.
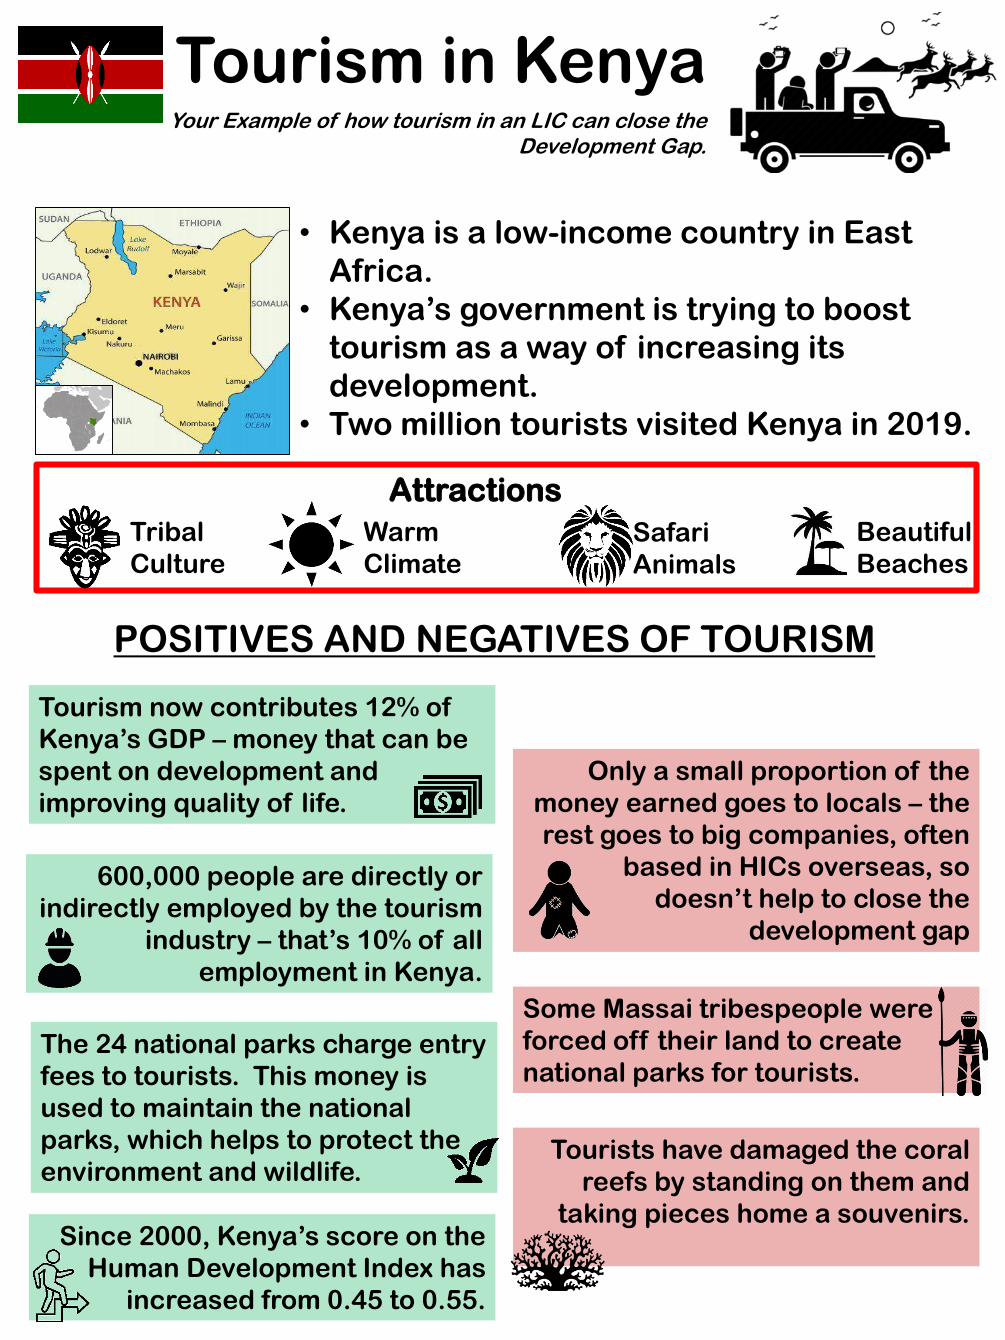
Tourism in KenyaYour Example of how tourism in an LIC can close the
Development Gap.
• Kenya is a low-income country in East
Africa.
• Kenya’s government is trying to boost
tourism as a way of increasing its
development.
• Two million tourists visited Kenya in 2019.
Attractions
Tribal
Culture
Warm
Climate
Safari
Animals
Beautiful
Beaches
POSITIVES AND NEGATIVES OF TOURISM
Tourism now contributes 12% of
Kenya’s GDP – money that can be
spent on development and
improving quality of life.
Only a small proportion of the
money earned goes to locals – the
rest goes to big companies, often
based in HICs overseas, so
doesn’t help to close the
development gap
600,000 people are directly or
indirectly employed by the tourism
industry – that’s 10% of all
employment in Kenya.
Some Massai tribespeople were
forced off their land to create
national parks for tourists. The 24 national parks charge entry
fees to tourists. This money is
used to maintain the national
parks, which helps to protect the
environment and wildlife.Tourists have damaged the coral
reefs by standing on them and
taking pieces home a souvenirs.Since 2000, Kenya’s score on the
Human Development Index has
increased from 0.45 to 0.55.
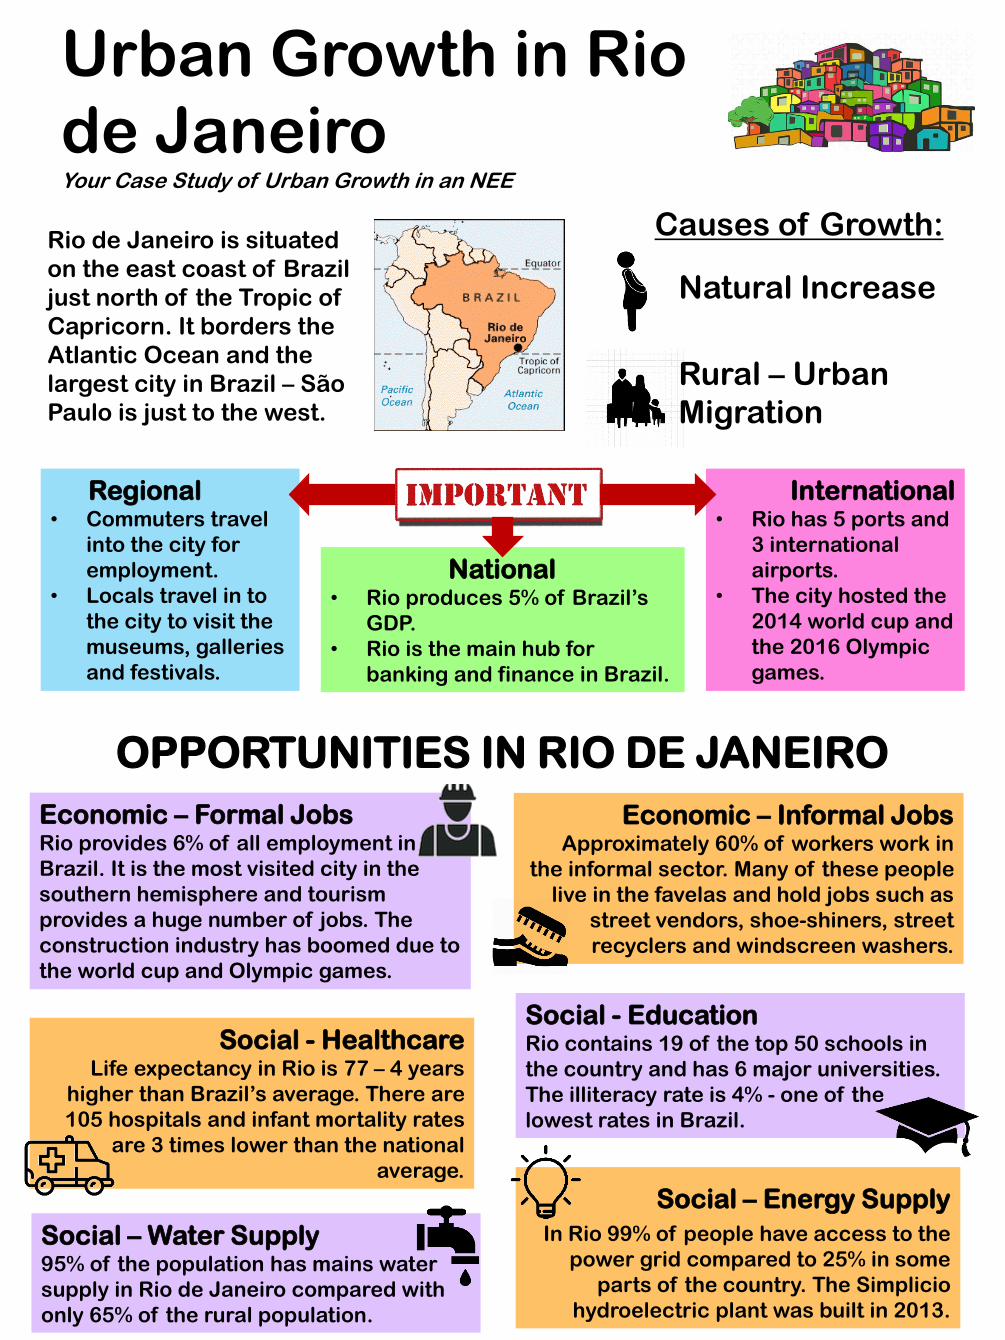
Urban Growth in Rio
de JaneiroYour Case Study of Urban Growth in an NEE
Rio de Janeiro is situated
on the east coast of Brazil
just north of the Tropic of
Capricorn. It borders the
Atlantic Ocean and the
largest city in Brazil – São
Paulo is just to the west.
Causes of Growth:
Natural Increase
Rural – Urban
Migration
Regional• Commuters travel
into the city for
employment.
• Locals travel in to
the city to visit the
museums, galleries
and festivals.
National• Rio produces 5% of Brazil’s
GDP.
• Rio is the main hub for
banking and finance in Brazil.
International• Rio has 5 ports and
3 international
airports.
• The city hosted the
2014 world cup and
the 2016 Olympic
games.
OPPORTUNITIES IN RIO DE JANEIRO
Economic – Formal JobsRio provides 6% of all employment in
Brazil. It is the most visited city in the
southern hemisphere and tourism
provides a huge number of jobs. The
construction industry has boomed due to
the world cup and Olympic games.
Economic – Informal JobsApproximately 60% of workers work in
the informal sector. Many of these people
live in the favelas and hold jobs such as
street vendors, shoe-shiners, street
recyclers and windscreen washers.
Social - EducationRio contains 19 of the top 50 schools in
the country and has 6 major universities.
The illiteracy rate is 4% - one of the
lowest rates in Brazil.
Social - HealthcareLife expectancy in Rio is 77 – 4 years
higher than Brazil’s average. There are
105 hospitals and infant mortality rates
are 3 times lower than the national
average.
Social – Water Supply95% of the population has mains water
supply in Rio de Janeiro compared with
only 65% of the rural population.
Social – Energy Supply
In Rio 99% of people have access to the
power grid compared to 25% in some
parts of the country. The Simplicio
hydroelectric plant was built in 2013.
CHALLENGES IN RIO DE JANEIRO
Economic – UnemploymentEconomic inequality is high in Rio. The
richest 1% of people earn 12% of the
city’s GDP. In favelas the unemployment
rate is over 20% and those that do have a
job are usually employed in the
unreliable informal economy.
Economic – CrimeMurder, kidnapping, carjacking and
armed assault occur regularly. Powerful
gangs control drug trafficking in many of
the favelas.
Social – HealthcareIn 2013 only 55% of the city had a local
family health clinic. Services for pregnant
women and the elderly were very poor,
especially in the West Zone.
Social - EducationIn Rio only half of all children continue
their education beyond 14 as many of
them get a job to support their families.
Teenage pregnancy is also high.Environmental – Water Pollution
Guanabara Bay is highly polluted as 200
tonnes of raw sewage and 50 tonnes of
industrial waste pour into the bay each
day. Ships also rinse their oil tanks into
the bay regularly.
Environmental – Air PollutionThe number of cars in Rio has grown by
40% in the last decade and air pollution
kills 5,000 people a year.
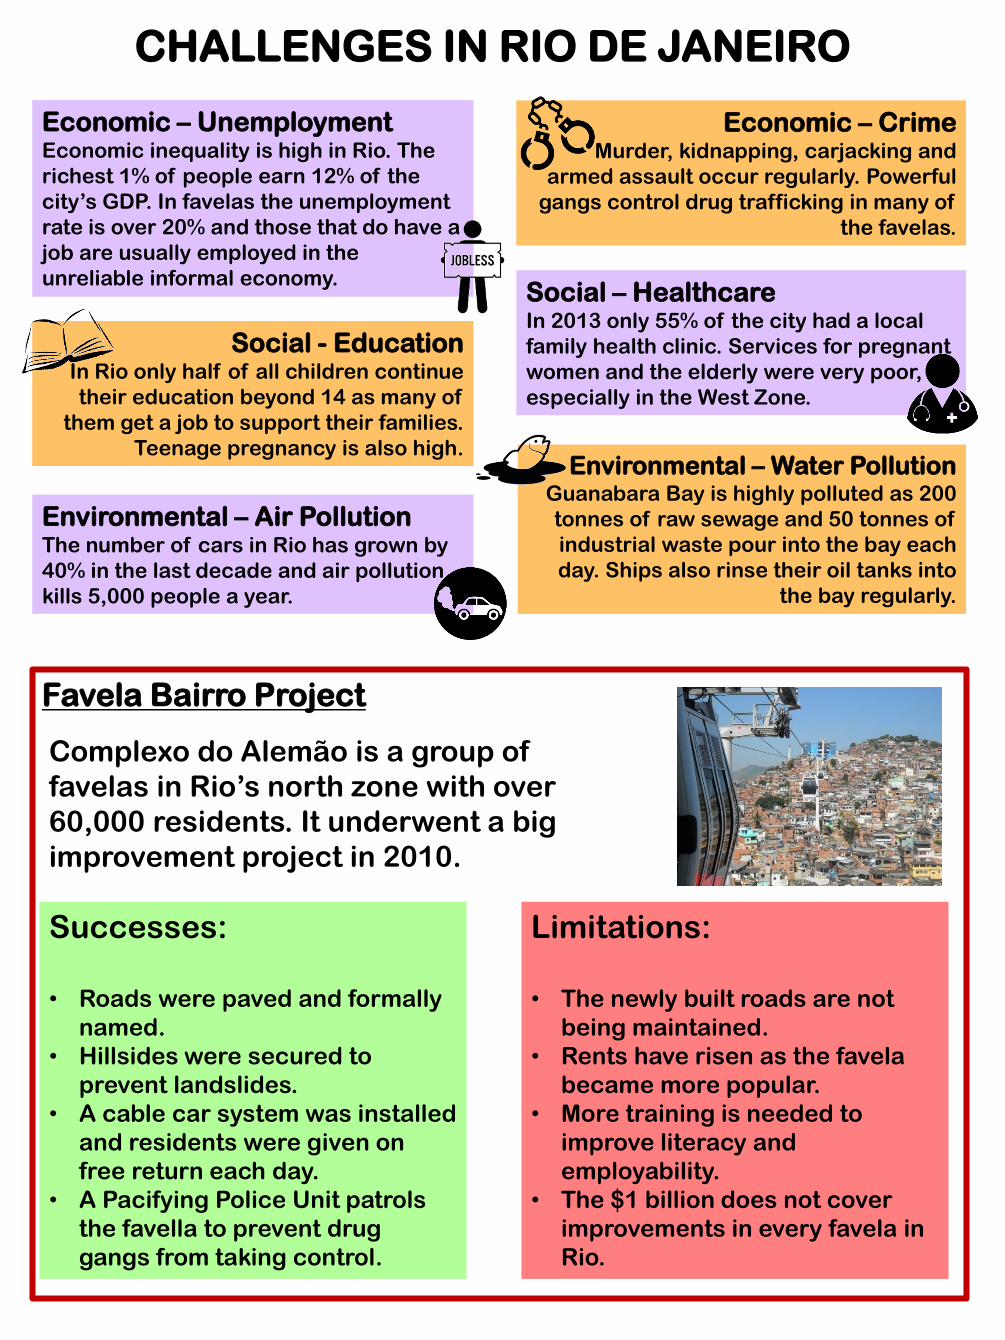
Favela Bairro Project
Complexo do Alemão is a group of
favelas in Rio’s north zone with over
60,000 residents. It underwent a big
improvement project in 2010.
Successes:
• Roads were paved and formally
named.
• Hillsides were secured to
prevent landslides.
• A cable car system was installed
and residents were given on
free return each day.
• A Pacifying Police Unit patrols
the favella to prevent drug
gangs from taking control.
Limitations:
• The newly built roads are not
being maintained.
• Rents have risen as the favela
became more popular.
• More training is needed to
improve literacy and
employability.
• The $1 billion does not cover
improvements in every favela in
Rio.
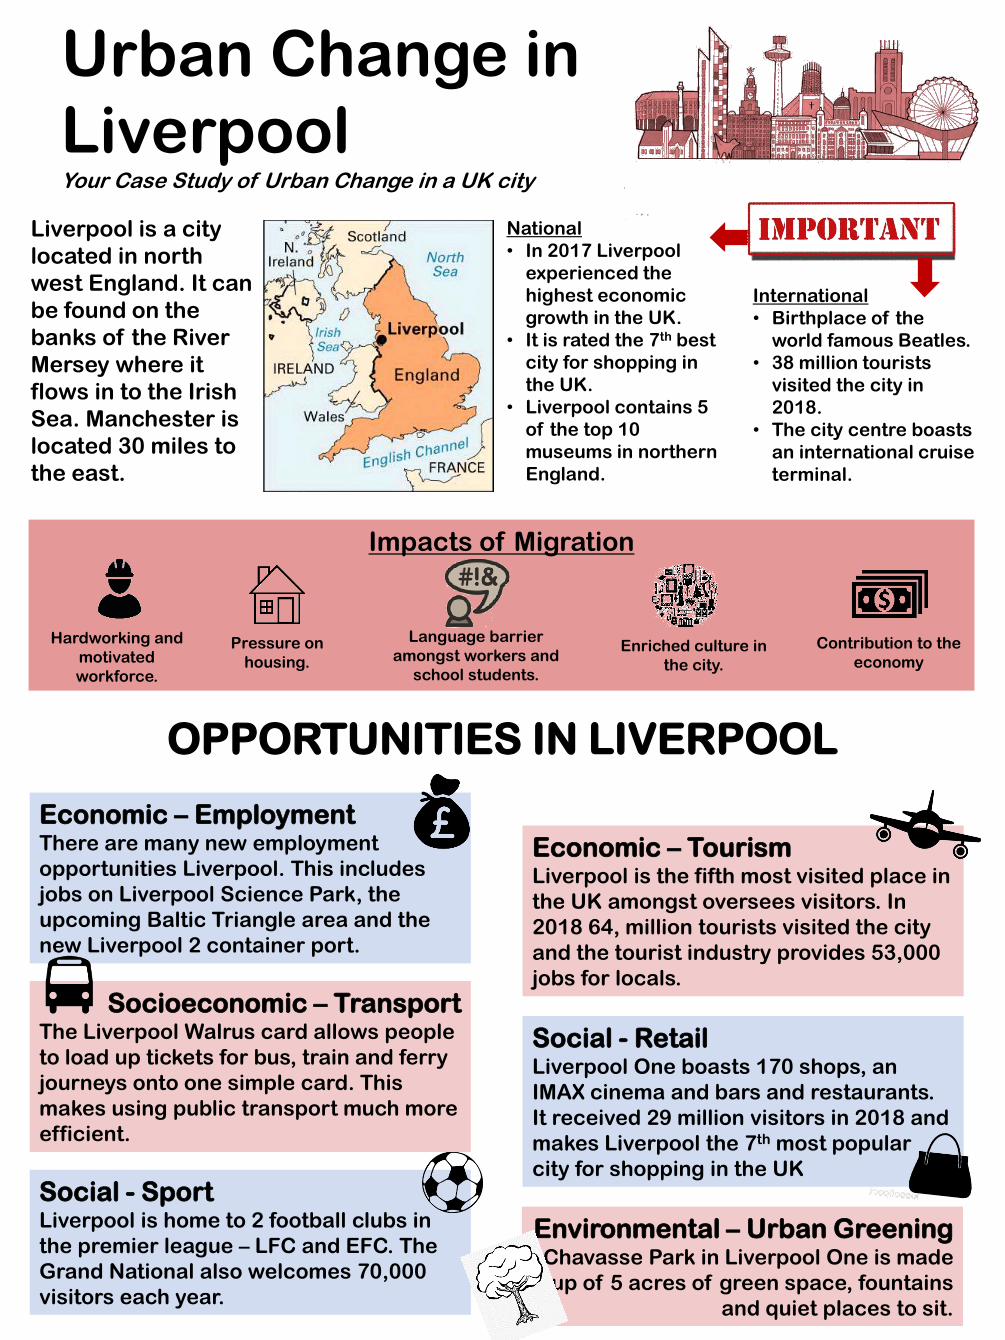
Urban Change in
LiverpoolYour Case Study of Urban Change in a UK city
Liverpool is a city
located in north
west England. It can
be found on the
banks of the River
Mersey where it
flows in to the Irish
Sea. Manchester is
located 30 miles to
the east.
National
• In 2017 Liverpool
experienced the
highest economic
growth in the UK.
• It is rated the 7th best
city for shopping in
the UK.
• Liverpool contains 5
of the top 10
museums in northern
England.
International
• Birthplace of the
world famous Beatles.
• 38 million tourists
visited the city in
2018.
• The city centre boasts
an international cruise
terminal.
Impacts of Migration
Hardworking and
motivated
workforce.
Pressure on
housing.
Language barrier
amongst workers and
school students.
Enriched culture in
the city.
Contribution to the
economy
OPPORTUNITIES IN LIVERPOOL
Economic – Employment There are many new employment
opportunities Liverpool. This includes
jobs on Liverpool Science Park, the
upcoming Baltic Triangle area and the
new Liverpool 2 container port.
Economic – Tourism Liverpool is the fifth most visited place in
the UK amongst oversees visitors. In
2018 64, million tourists visited the city
and the tourist industry provides 53,000
jobs for locals.
Socioeconomic – Transport The Liverpool Walrus card allows people
to load up tickets for bus, train and ferry
journeys onto one simple card. This
makes using public transport much more
efficient.
Social - RetailLiverpool One boasts 170 shops, an
IMAX cinema and bars and restaurants.
It received 29 million visitors in 2018 and
makes Liverpool the 7th most popular
city for shopping in the UK
Social - SportLiverpool is home to 2 football clubs in
the premier league – LFC and EFC. The
Grand National also welcomes 70,000
visitors each year.
Environmental – Urban GreeningChavasse Park in Liverpool One is made
up of 5 acres of green space, fountains
and quiet places to sit.
CHALLENGES IN LIVERPOOL
Economic – Industrial Decline In the 20th century, industrial decline
occurred in Liverpool. It left much of the
inner city very deprived. Areas such as
Anfield and Toxteth are among the most
deprived areas in England.
Economic – Housing InequalitiesAreas that have been regenerated often
boast better quality housing. The
average semi detached house price in
Anfield is£101,000 and in Woolton it is
£230,000.
Social - EducationIn more deprived areas school students
achieve lower exam results. The
proportion of students achieving 5 A*-C
GCSEs in Woolton is 75% and in Anfield
is only 54%.
Social – Unhealthy LifestylesIn deprived areas, drinking, smoking and
poor diets are more common. In Woolton
there are 2,100 annual alcohol related
deaths and in Anfield there are 3,400.
Environmental - DerelictionAs people left inner city areas, buildings
were left empty. Derelict buildings are
targets for graffiti and vandalism. Many
areas such as Anfield became run down.
Environmental – Greenfield SitesAs people left inner city areas, buildings
were left empty. Derelict buildings are
targets for graffiti and vandalism. Many
areas such as Anfield became run down.
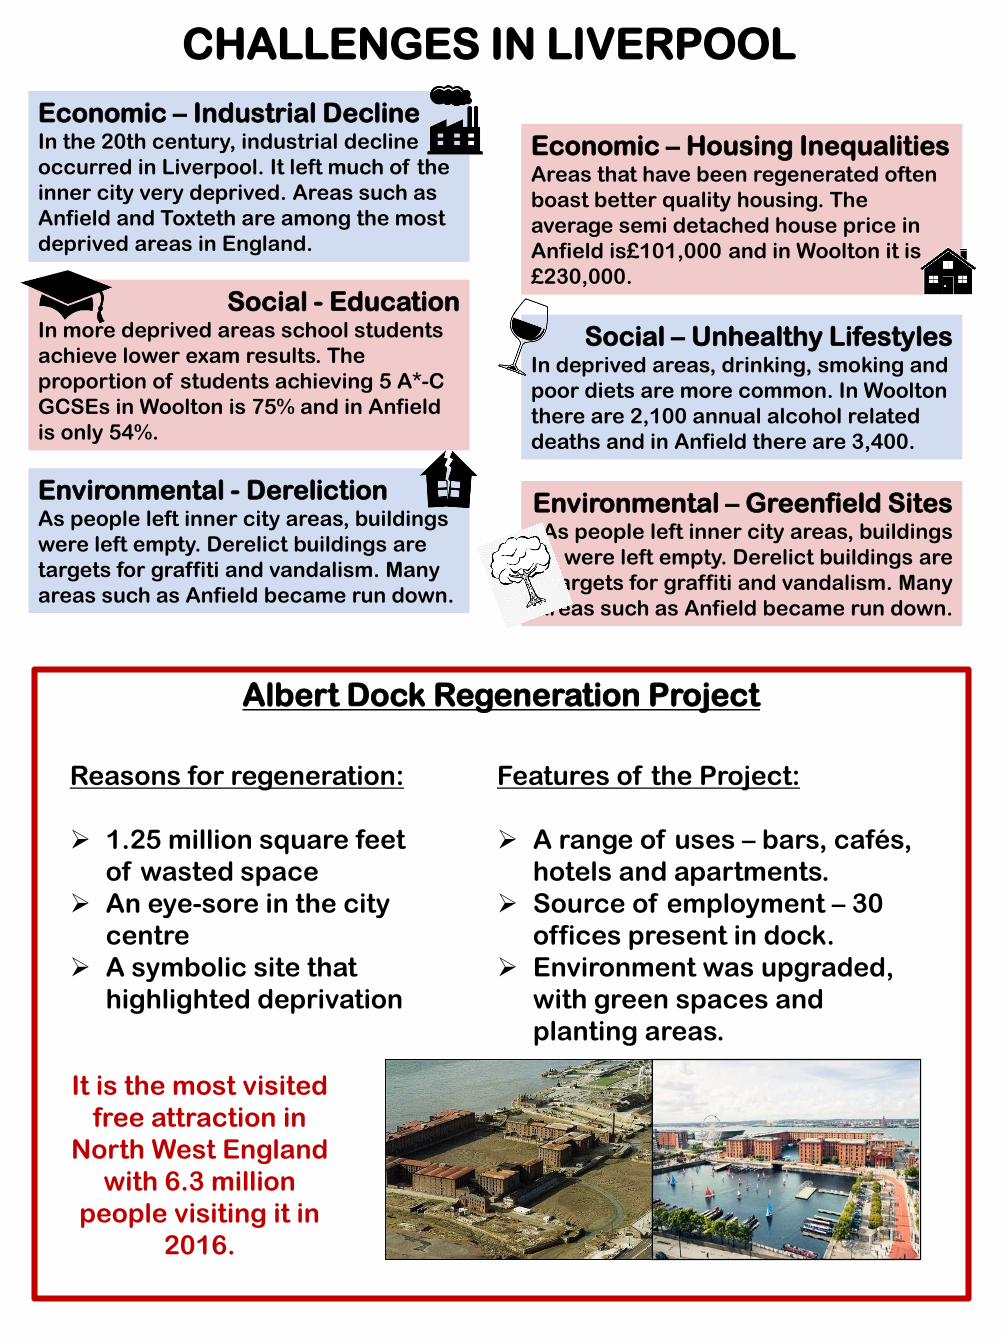
Albert Dock Regeneration Project
Reasons for regeneration:
1.25 million square feet
of wasted space
An eye-sore in the city
centre
A symbolic site that
highlighted deprivation
Features of the Project:
A range of uses – bars, cafés,
hotels and apartments.
Source of employment – 30
offices present in dock.
Environment was upgraded,
with green spaces and
planting areas.
It is the most visited
free attraction in
North West England
with 6.3 million
people visiting it in
2016.
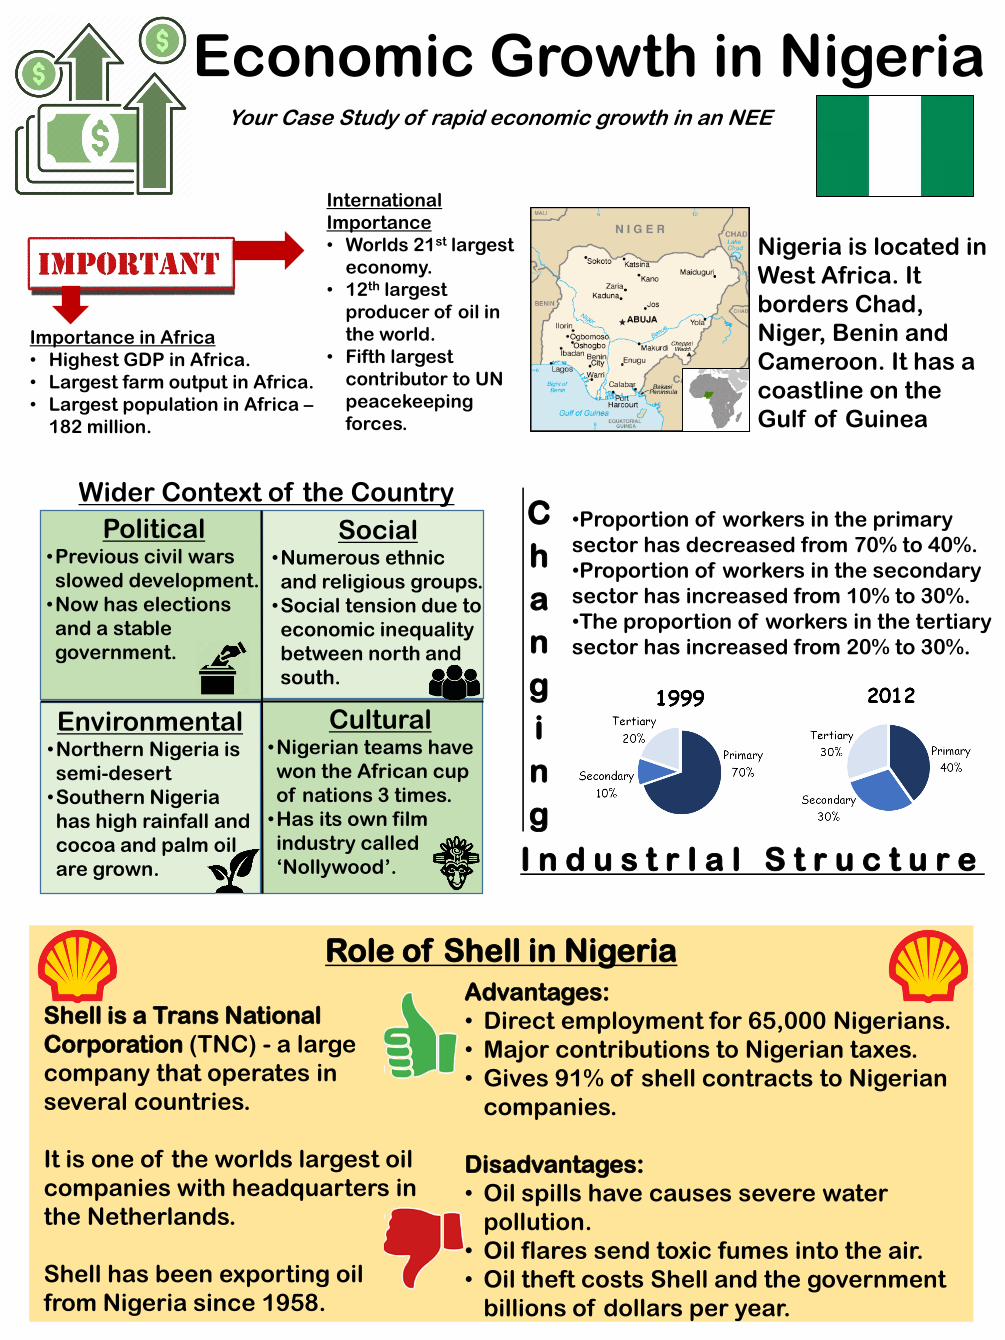
Economic Growth in NigeriaYour Case Study of rapid economic growth in an NEE
Nigeria is located in
West Africa. It
borders Chad,
Niger, Benin and
Cameroon. It has a
coastline on the
Gulf of Guinea
Importance in Africa
• Highest GDP in Africa.
• Largest farm output in Africa.
• Largest population in Africa –
182 million.
International
Importance
• Worlds 21st largest
economy.
• 12th largest
producer of oil in
the world.
• Fifth largest
contributor to UN
peacekeeping
forces.
Political•Previous civil wars
slowed development.
•Now has elections
and a stable
government.
Social•Numerous ethnic
and religious groups.
•Social tension due to
economic inequality
between north and
south.
Environmental•Northern Nigeria is
semi-desert
•Southern Nigeria
has high rainfall and
cocoa and palm oil
are grown.
Cultural•Nigerian teams have
won the African cup
of nations 3 times.
•Has its own film
industry called
‘Nollywood’.
Wider Context of the CountryC
h
a
n
g
i
n
g
I n d u s t r I a l S t r u c t u r e
•Proportion of workers in the primary
sector has decreased from 70% to 40%.
•Proportion of workers in the secondary
sector has increased from 10% to 30%.
•The proportion of workers in the tertiary
sector has increased from 20% to 30%.
Role of Shell in Nigeria
Shell is a Trans National
Corporation (TNC) - a large
company that operates in
several countries.
It is one of the worlds largest oil
companies with headquarters in
the Netherlands.
Shell has been exporting oil
from Nigeria since 1958.
Advantages:
• Direct employment for 65,000 Nigerians.
• Major contributions to Nigerian taxes.
• Gives 91% of shell contracts to Nigerian
companies.
Disadvantages:
• Oil spills have causes severe water
pollution.
• Oil flares send toxic fumes into the air.
• Oil theft costs Shell and the government
billions of dollars per year.
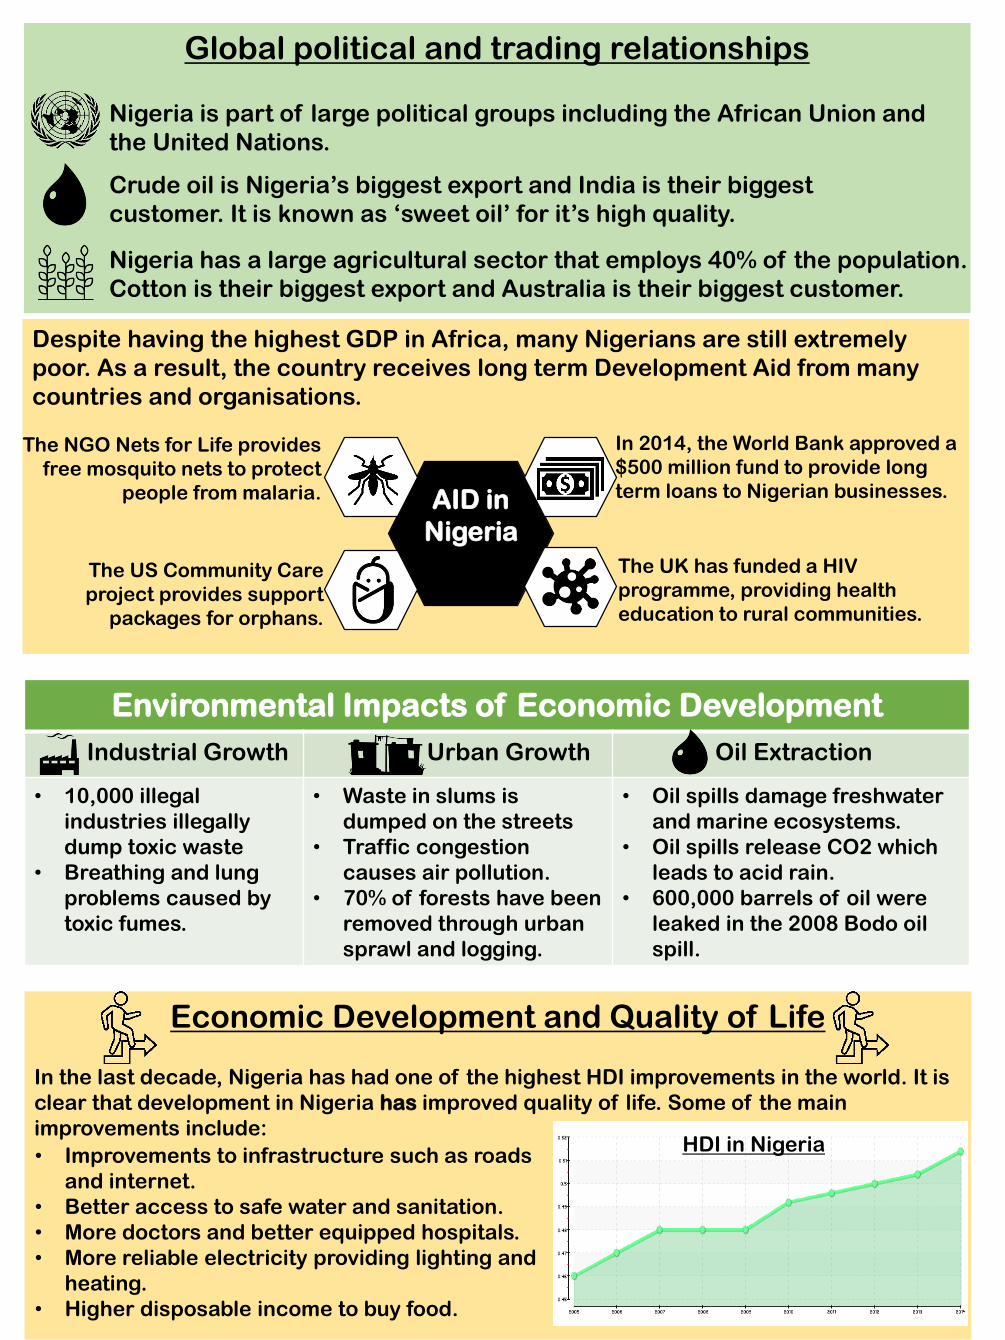
Global political and trading relationships
Nigeria is part of large political groups including the African Union and
the United Nations.
Nigeria has a large agricultural sector that employs 40% of the population.
Cotton is their biggest export and Australia is their biggest customer.
Crude oil is Nigeria’s biggest export and India is their biggest
customer. It is known as ‘sweet oil’ for it’s high quality.
Despite having the highest GDP in Africa, many Nigerians are still extremely
poor. As a result, the country receives long term Development Aid from many
countries and organisations.
AID in
Nigeria
In 2014, the World Bank approved a
$500 million fund to provide long
term loans to Nigerian businesses.
The UK has funded a HIV
programme, providing health
education to rural communities.
The US Community Care
project provides support
packages for orphans.
The NGO Nets for Life provides
free mosquito nets to protect
people from malaria.
Environmental Impacts of Economic Development
Industrial Growth Urban Growth Oil Extraction
• 10,000 illegal
industries illegally
dump toxic waste
• Breathing and lung
problems caused by
toxic fumes.
• Waste in slums is
dumped on the streets
• Traffic congestion
causes air pollution.
• 70% of forests have been
removed through urban
sprawl and logging.
• Oil spills damage freshwater
and marine ecosystems.
• Oil spills release CO2 which
leads to acid rain.
• 600,000 barrels of oil were
leaked in the 2008 Bodo oil
spill.
Economic Development and Quality of Life
In the last decade, Nigeria has had one of the highest HDI improvements in the world. It is
clear that development in Nigeria has improved quality of life. Some of the main
improvements include:HDI in Nigeria
• Improvements to infrastructure such as roads
and internet.
• Better access to safe water and sanitation.
• More doctors and better equipped hospitals.
• More reliable electricity providing lighting and
heating.
• Higher disposable income to buy food.
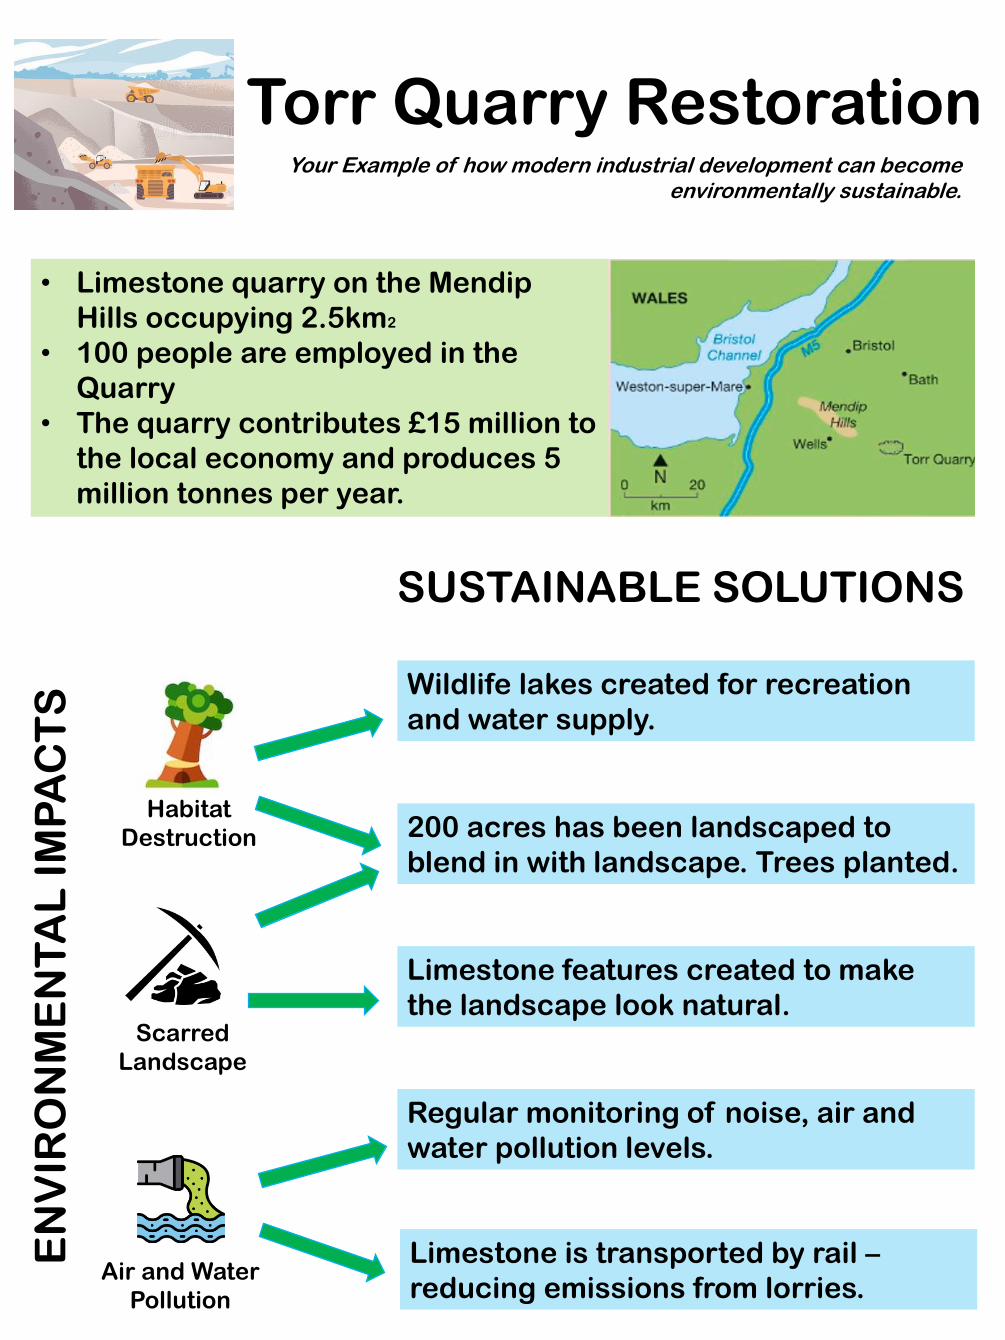
Torr Quarry Restoration
• Limestone quarry on the Mendip
Hills occupying 2.5km2
• 100 people are employed in the
Quarry
• The quarry contributes £15 million to
the local economy and produces 5
million tonnes per year.
Your Example of how modern industrial development can become environmentally sustainable.
EN
VIR
ON
ME
NT
AL
IM
PA
CT
S
SUSTAINABLE SOLUTIONS
Habitat
Destruction
Air and Water
Pollution
Scarred
Landscape
Wildlife lakes created for recreation
and water supply.
200 acres has been landscaped to
blend in with landscape. Trees planted.
Limestone features created to make
the landscape look natural.
Regular monitoring of noise, air and
water pollution levels.
Limestone is transported by rail –
reducing emissions from lorries.
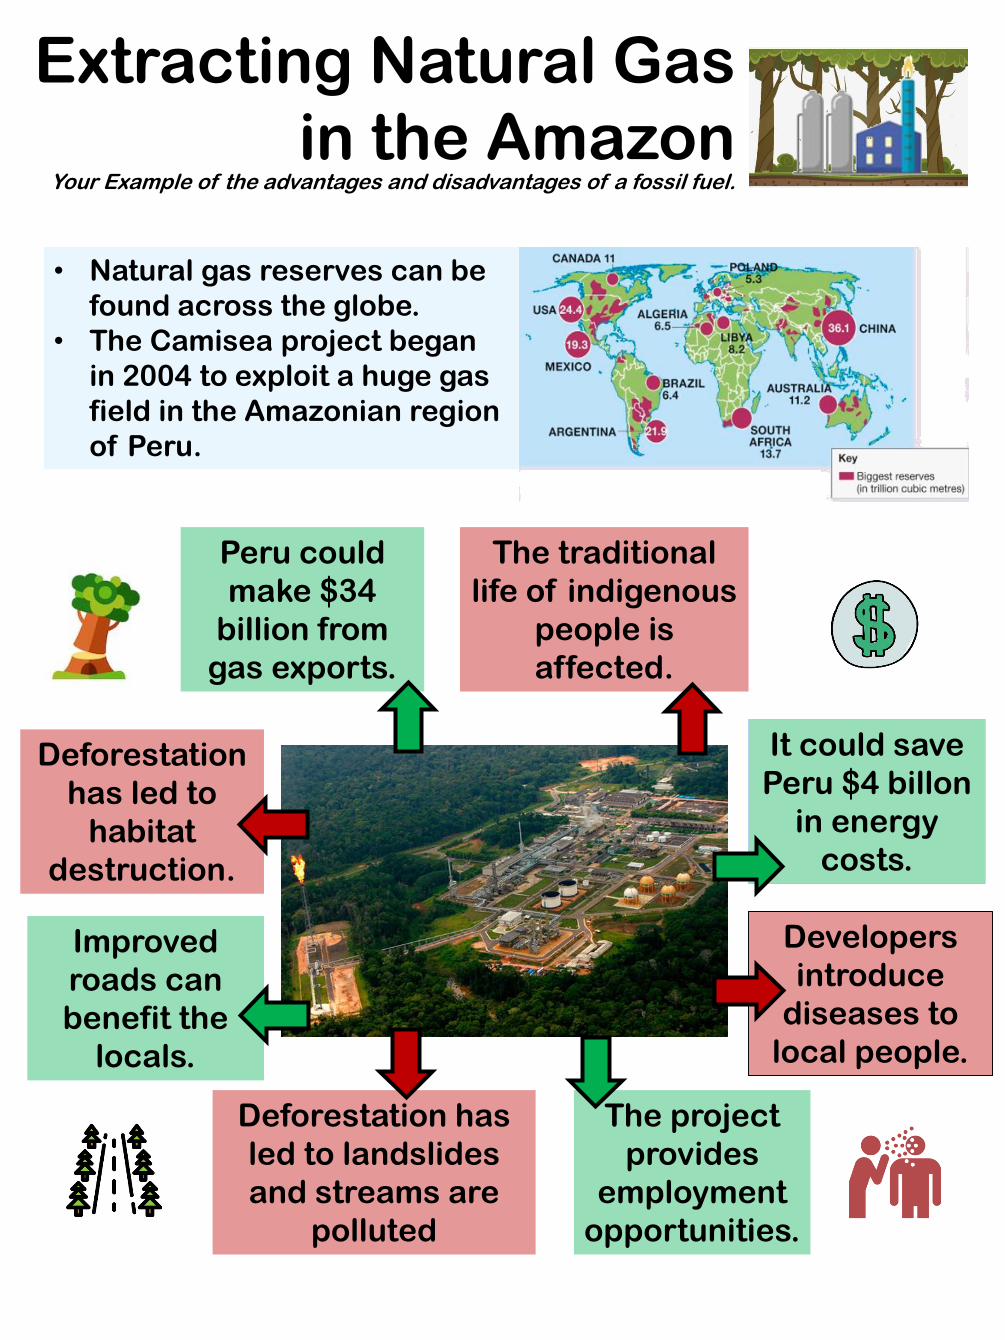
Extracting Natural Gas
in the AmazonYour Example of the advantages and disadvantages of a fossil fuel.
The traditional
life of indigenous
people is
affected.
• Natural gas reserves can be
found across the globe.
• The Camisea project began
in 2004 to exploit a huge gas
field in the Amazonian region
of Peru.
It could save
Peru $4 billon
in energy
costs.
Deforestation
has led to
habitat
destruction.
Peru could
make $34
billion from
gas exports.
Developers
introduce
diseases to
local people.
The project
provides
employment
opportunities.
Deforestation has
led to landslides
and streams are
polluted
Improved
roads can
benefit the
locals.
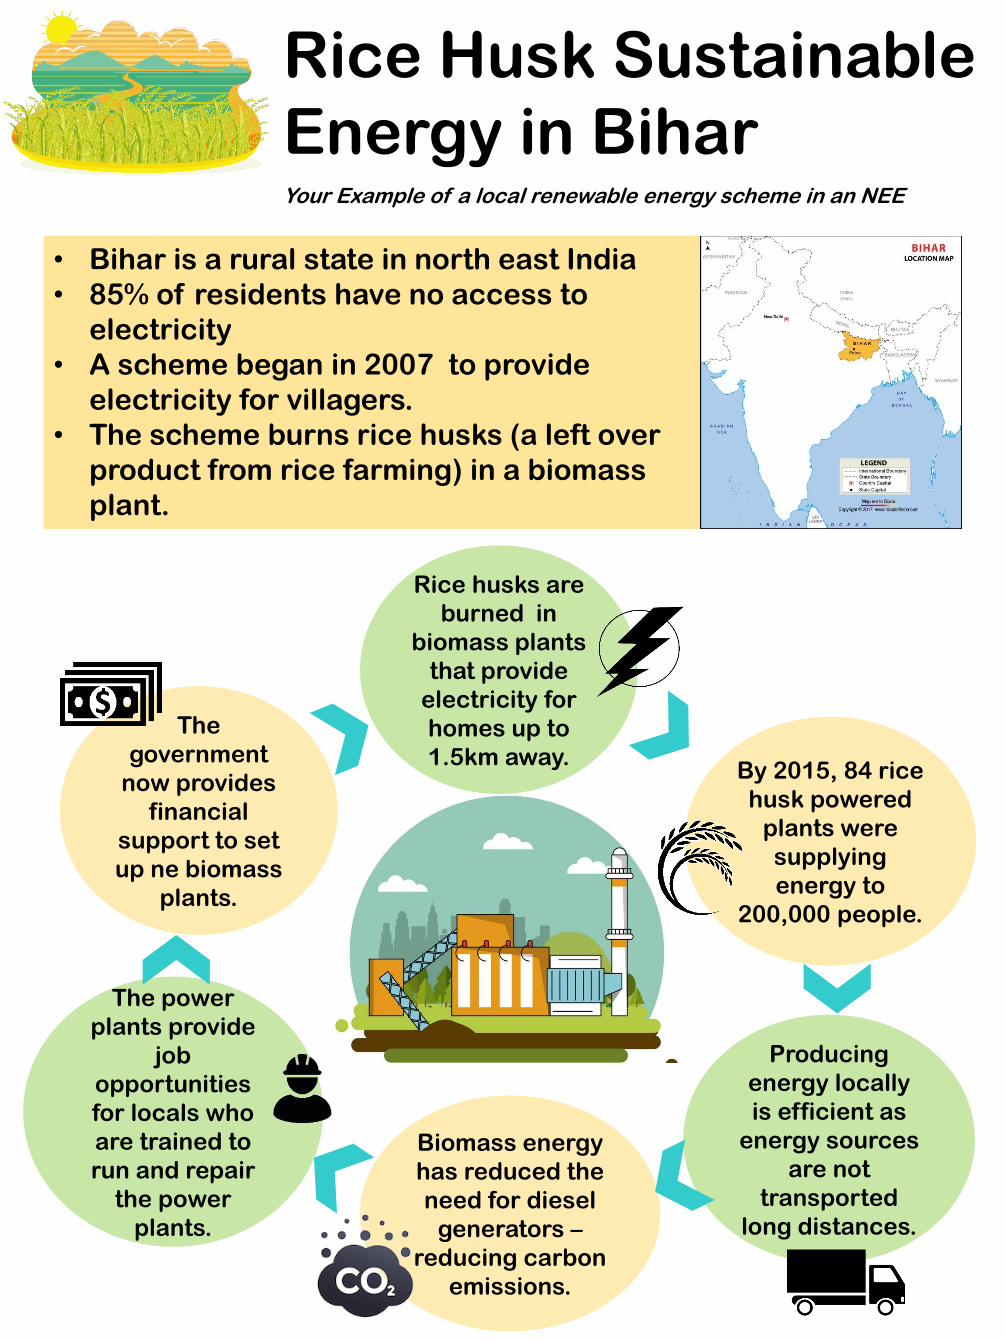
Rice Husk Sustainable
Energy in BiharYour Example of a local renewable energy scheme in an NEE
• Bihar is a rural state in north east India
• 85% of residents have no access to
electricity
• A scheme began in 2007 to provide
electricity for villagers.
• The scheme burns rice husks (a left over
product from rice farming) in a biomass
plant.
Biomass energy
has reduced the
need for diesel
generators –
reducing carbon
emissions.
By 2015, 84 rice
husk powered
plants were
supplying
energy to
200,000 people.
Producing
energy locally
is efficient as
energy sources
are not
transported
long distances.
Rice husks are
burned in
biomass plants
that provide
electricity for
homes up to
1.5km away.
The power
plants provide
job
opportunities
for locals who
are trained to
run and repair
the power
plants.
The
government
now provides
financial
support to set
up ne biomass
plants.