Embed Size (px)
Citation preview

How the IEA Guides Energy Decisions Towards Fossil Fuel Dependence and Climate Change
Investor Briefing April 2018
Investors are increasingly asking fossil fuel companies about how their strategy reflects climate risk. The Task Force on Climate-Related Financial Disclosures (TCFD) recommends testing the robustness of investments in a climate scenario. Often, such stress-tests use the International Energy Agency’s 450 Scenario (450S) or its replacement the Sustainable Development Scenario (SDS). However, as we show in this briefing, these scenarios fall short of the Paris goals. Such scenarios may give a false sense of confidence of portfolios’ robustness, or that the Paris goals can be met with limited change in investment practice. Investors testing their portfolios against the SDS would be potentially undervaluing climate transition risk.
The SDS emissions profile matches that of the Copenhagen-era 450S, which aimed for only a 50 percent chance of keeping warming below 2 degrees. The IEA’s Beyond 2 Degrees Scenario (B2DS) is a welcome step in the right direction, but cannot be seen to be fully aligned with the Paris goals. It ignores the goal of 1.5°C, and relies on the availability of unproven technologies such as carbon capture and storage and negative emissions.
This briefing accompanies a new report Off Track: How the IEA Guides Energy Decisions Towards Fossil Fuel Dependence
and Climate Change from Oil Change International and IEEFA available at: http://priceofoil.org/iea-off-track/. It outlines the limitations of key IEA scenarios and the risks for investors of relying on them to assess climate risk. We recommend how investors might engage with the IEA to ensure more robust scenarios and suggest actions investors can take in the meantime to better assess climate risk.
Off Track
Key issues with IEA Scenarios for investors
• The SDS fails to align with Paris goals
• Other, lower-profile IEA “climate scenarios” (not in the World Energy Outlook) also fail to align with Paris goals
• IEA scenarios are overly reliant on unproven negative emissions technology
• Focus by the IEA on the New Policies Scenario (which would set the world on course for between 2.7 and 3.3˚C of warming)
• The New Policies Scenario is used by policy makers and fossil fuel industry to justify new projects locking in carbon and capital

02
The IEA is the world’s most influential source of energy information. It aims to support energy management, policy and investment decisions in its 30 member countries and in the private sector, “to ensure reliable, affordable and clean energy.”1 In particular, its flagship yearly 700-page World Energy Outlook (WEO) serves as a map of the future energy landscape until 2040, aiming to be “used by public and private sector stakeholders as a framework for policy-making, planning and investment decisions.”2 The majority of the WEO, and almost all of the IEA’s public communications are focused on the New Policies Scenario (NPS), so that is the scenario to which decision makers usually turn for a forecast of energy demand. The NPS is steering those decisions towards levels of fossil fuel use that would cause severe climate change.
New investments in fossil fuel supply are often justified by proponents on the basis of NPS demand projections, which if correct would lead to 2.7 - 3.3 degrees Celsius of warming. These investments in turn help to make those projections correct: they become a self-fulfilling prophecy. The WEO plays a key role in enabling and justifying decisions on some of the world’s most polluting energy developments, including:
Proposed coal mines in Queensland, Australia: In its permit application for its Carmichael coal mine, the largest in Australia, Adani gave rising demand in India and China as the rationale for the project,3 citing the federal government’s Australian Energy Resources Assessment, whose forecasts were based on the WEO.4 With a project life of up to 90 years, the mine could keep the coal flowing long after the world needs to have reduced emissions to zero. When the Queensland Land Court reviewed the application and objections to it, Adani’s expert witness again relied on the WEO forecasts of Chinese and Indian coal consumption as justification for the project. The judge accepted the IEA as a credible source, and recommended government approval of the project, which it subsequently granted.5 Energy Minister Josh Frydenburg commented on the approval by saying that there is a “strong moral case” for coal to relieve energy poverty, citing the WEO’s New Policies Scenario (NPS) forecast of increased global fossil fuel consumption by 2040.6
Arctic oil: The US Bureau of Ocean Energy Management used WEO (NPS) forecasts of U.S. and global energy demand (as well as those of the EIA) as justification for its 2012-17 Outer Continental Shelf oil leasing program, which included arctic Alaska.7 Lisa Murkowski, chair of the US Senate Energy Committee, and a lead advocate of increased oil drilling onshore and offshore Alaska, repeatedly brought up the WEO demand forecasts, and invited the IEA to present to her committee.8 As regulators began to respond to rising public opposition to arctic drilling, oil industry lobby groups pointed to the WEO forecast of increased global oil demand, arguing that arctic oil was crucial to meeting rising demand.9
Pathway to climate disaster
New investments in fossil fuel supply are often justified by proponents on the basis of NPS demand projections, which if correct would lead to 2.7 - 3.3 degrees Celsius of warming.
03
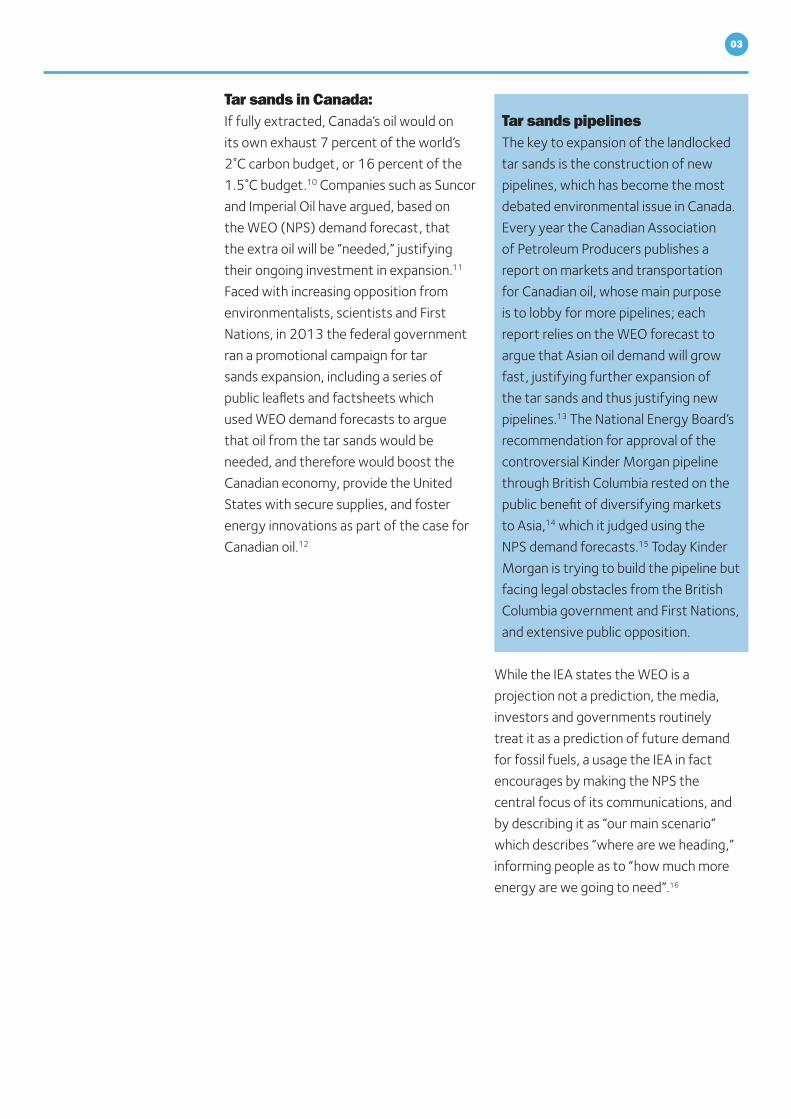
Tar sands in Canada:If fully extracted, Canada’s oil would on its own exhaust 7 percent of the world’s 2˚C carbon budget, or 16 percent of the 1.5˚C budget.10 Companies such as Suncor and Imperial Oil have argued, based on the WEO (NPS) demand forecast, that the extra oil will be “needed,” justifying their ongoing investment in expansion.11 Faced with increasing opposition from environmentalists, scientists and First Nations, in 2013 the federal government ran a promotional campaign for tar sands expansion, including a series of public leaflets and factsheets which used WEO demand forecasts to argue that oil from the tar sands would be needed, and therefore would boost the Canadian economy, provide the United States with secure supplies, and foster energy innovations as part of the case for Canadian oil.12
While the IEA states the WEO is a projection not a prediction, the media, investors and governments routinely treat it as a prediction of future demand for fossil fuels, a usage the IEA in fact encourages by making the NPS the central focus of its communications, and by describing it as “our main scenario” which describes “where are we heading,” informing people as to “how much more energy are we going to need”.16
Tar sands pipelines The key to expansion of the landlocked tar sands is the construction of new pipelines, which has become the most debated environmental issue in Canada. Every year the Canadian Association of Petroleum Producers publishes a report on markets and transportation for Canadian oil, whose main purpose is to lobby for more pipelines; each report relies on the WEO forecast to argue that Asian oil demand will grow fast, justifying further expansion of the tar sands and thus justifying new pipelines.13 The National Energy Board’s recommendation for approval of the controversial Kinder Morgan pipeline through British Columbia rested on the public benefit of diversifying markets to Asia,14 which it judged using the NPS demand forecasts.15 Today Kinder Morgan is trying to build the pipeline but facing legal obstacles from the British Columbia government and First Nations, and extensive public opposition.

04
The 2017 WEO focuses primarily on one main scenario - the New Policies Scenario (NPS) which assumes the continuation of current policies, and the “cautious implementation”17 of intended policies that have been announced. The focus of the WEO, occupying about 80 percent of the narrative and almost all of the public communications, is on describing an energy future, the “New Policies Scenario”, that would lead to somewhere between 2.7 and 3.3 degrees of warming. The NPS occupies the majority of the narrative in the WEO and is given more comprehensive detail in data tables than the two secondary scenarios (CPS and SDS). Every year, the press release accompanying the WEO focuses almost entirely on describing the projections of the NPS, with occasionally a brief mention of the climate scenario (450S or SDS) at the end.18 Unsurprising then, that the media coverage tends to have forecast-like headlines like “Upcoming surge in shale oil production will be ‘biggest oil and gas boom in history,’”19 “‘Oil era is far from over,’ says IEA’s annual report”20 and “Global oil demand to withstand rise of electric vehicles -IEA.”21
The WEO also has two secondary scenarios, with different degrees of government action on energy and climate change:
• Current Policies Scenario (CPS): assumes no new policies are introduced.
• Sustainable Development Scenario (SDS): assumes governments succeed in achieving climate, air pollution and access-to-energy goals, as expressed in the Sustainable Development Goals.22
The Sustainable Development Scenario - not aligned with the Paris AgreementIntroduced in 2017 to replace the 450S, the IEA says the SDS aims to set the world on course for achieving the Paris climate goals, deliver universal energy access by 2030, and dramatically cut air pollution. However, it fails to align with the Paris goals. Indeed, the SDS describes a future not so different from the present. It sees just a 53 percent reduction in coal by 2040, 25 percent reduction in oil, and an actual increase in gas.
The remaining carbon budgets associated with the Paris goals are now extremely small: at current rates of emissions, the 1.5˚C budget will be exhausted in eight years, and the 2˚C budget in nineteen years.23 By accepting a mere 50% probability of success, by assuming negative emissions technologies will be invented, and by assuming unrealistically low non-energy emissions, the SDS significantly understates the degree of change in energy systems needed to achieve the goals. Oil Change International finds that:24
• Emissions under the SDS would exhaust the 1.5˚C carbon budget by 2023, and the 2˚C budget by 2040.
• The SDS has the same emissions profile as the IEA’s Copenhagen-era 450S, which aimed to give only a 50 percent chance of keeping warming below 2˚C .
• Of the SDS’ recommended upstream oil and gas investment, between 70 and 94 percent would be surplus to the Paris goals.
The World Energy Outlook Scenarios

05
The IEA’s More Ambitious Climate Scenarios
In 2017, the IEA published two new scenarios (outside the WEO), which would give a 66% probability of keeping warming below 2°C: the Faster Transitions Scenario and the Beyond 2 Degrees Scenario.
These are a welcome step in the right direction, but they cannot be seen to be fully aligned with the Paris goals. Not only do both scenarios ignore the goal of 1.5°C, their one-in-three odds of exceeding 2°C constitute an uncomfortably high level of risk, and certainly do not match the current understanding of 2°C as a “defense line that needs to be stringently defended.” 25
Furthermore, both scenarios rely on the availability of unproven technologies such as carbon capture and storage and/or negative emissions. If successful, such technologies may help humanity reduce warming further than would otherwise be possible. But given that we do not know whether they will become available, we argue that we must not predicate avoiding the dangers above 2°C on their invention. We argue that scenarios should be transparent about how they would look if those technologies do not become available. The IEA started developing a 1.5°C scenario in 2016, but apart from a very brief mention in WEO 2016 (with no data), that scenario has not been published, and was not even mentioned in WEO 2017.
Oil Change International proposes two alternative approaches to aligning scenarios with the Paris goals:
• A single scenario with a high probability (say, 80 or 90 percent) of keeping warming below 2°C, reflecting the notion of “stringent defense”; or
• Two scenarios: one with modest probability (say, 66 percent) of keeping warming below 2°C and the other with 50% probability of keeping below 1.5°C – the aim of energy decisions should then be to keep emissions as far as possible below the 2°C scenario, and as close as possible to the 1.5°C scenario.
The Faster Transition Scenario (FTS) was commissioned by the German government and published in March 2017 in a standalone report co-published with IRENA. That report examined the implications of the scenario in some detail, including global aggregate figures on energy production and consumption, although unfortunately did not provide data tables with a geographical breakdown (as provided for the NPS, SDS and CPS in the WEO); this limits its analytical usage, such as by investors. It reappeared in WEO 2017 though with only three pages of discussion and almost no data.
The FTS takes a welcome precautionary approach to negative emissions technology, aiming to describe what would be necessary if such technologies are not successfully invented. On the other hand, it relies on three optimistic assumptions that may understate the pace of change needed even for a 66% chance of keeping warming below 2°C:
• Carbon capture and storage (also an unproven technology, although at a later stage of development than most negative emissions methods): that 3 Gt of CO2 will be captured per year by 2035;
• Non-energy emissions: that emissions from cement calcination will be just 90 Gt from 2015 to 2100 (45 years’ worth at current rates);
• Delayed action:, that a greater pace of emissions reductions will occur after the time period the scenario describes (up to 2050).
Oil Change International has estimated that these three assumptions inflate the space for fossil fuel emissions by 31 percent.26

06
while the B2DS shows a vision of what technology might be possible, it does not provide a useful guide to climate-constrained investment or policy.
The Beyond 2 Degrees Scenario (B2DS) was published for the first time as a secondary scenario in the IEA’s 2017 edition of the Energy Technology Perspectives report. Data is available on the IEA’s website for those who have bought the report.27
While not making the same assumptions as the FTS about non-energy emissions or delayed action,28 the B2DS is however very bullish about new, unproven technologies (deliberately so, because its purpose is to show what technology could achieve). Most significantly for its forecasts of fossil fuel demand, it relies heavily on both CCS and negative emissions. For CCS, it requires capture of 5.8 Gt per year of fossil fuel emissions by 2040 and 10.9 Gt per year by 2060 – both highly optimistic targets. As for negative emissions, it requires sucking a further 4.9 Gt per year out of the atmosphere through bioenergy-CCS.29 The latter could require a land area up to three times the size of India.30 Thus while the B2DS shows a vision of what technology might be possible, it does not provide a useful guide to climate-constrained investment or policy.

07
Over recent years, there has been increasing recognition that continuing with fossil fuel business as usual is not compatible with avoiding dangerous climate change. As this has been highlighted by groups like Carbon Tracker, investors in fossil fuel companies have become concerned that if governments succeed in sufficiently constraining emissions, some fossil fuel assets will become “stranded”. This has led to increasing scrutiny of how such investments would fare in an emissions-constrained world.
The TCFD recommends a more robust approach to climate risk mitigation which uses scenarios to consider business performance in more than one possible future. In particular, these futures should include at least one where climate goals are met.31
Some have mistakenly interpreted this requirement as being met by the 450S, or its replacement the SDS. Global investment banks such as Barclays32 and HSBC,33 and pension funds such as CalPERS34 have used the 450S to define their expectations of companies for aligning with climate goals. For example, the Asian Infrastructure Investment Bank uses the 450S to guide how “energy infrastructure investments need to be reshaped to meet the Paris Agreement goals.”35
By testing investment and lending portfolios against a scenario that falls short of the Paris goals, it may give a false sense of confidence of portfolios’ robustness, or that the goals can be met with limited change in investment practices. Even the SDS significantly overstates the level of oil and gas investment required compared to the level that fits within the Paris goals.
In consequence, even those governments, companies, and/or investors trying to align their decisions with climate limits are inadvertently falling short of the Paris goals’ ambition, or worse, locking in emissions that would push us beyond those limits.
The following oil and gas companies, and coal companies, have all stated that their portfolios of assets are robust in the 450S or SDS:
• ExxonMobil;36
• Shell;37
• BP;38
• Total;39
• Glencore40
• BHP Billiton41; and
• Chevron.42
This is perhaps unsurprising, given that the scenarios involves so little change from the status quo. Spencer Dale, BP’s Chief Economist, has said, “Even in the IEA 450 scenario, by 2035, the level of oil and gas is pretty much around the same level as today. Which, if you think about the very sharp decline rates, means you have to keep on investing.”43
Call for Testing Portfolios in Climate Scenario
even those trying to align their decisions with climate limits are inadvertently falling short of the Paris goals’ ambition, or worse, locking in emissions that would push us beyond those limits.
08
Losing money on fossil fuel investments (including their associated rail, port and pipeline infrastructure) is not the only, or even the biggest threat to financial investors: they also face losses due to the impact of climate change itself, both to their investments in climate-vulnerable sectors such as food, property and insurance, and to the wider economy. Estimates since the Stern Review of 2006 have commonly put the impact at several percent of global GDP by the late twenty-first century, and a more recent study of historic correlations between temperature and economic activity suggested that unmitigated climate change could cause as much as a 20 percent reduction in 2100 output.44 A study by the Economist Intelligence Unit, commissioned by Aviva Investors, estimated that $4.3 trillion of today’s financial assets are at risk from climate change. These estimates are based on discount rates used by investors; with the lower discount rates used in the public sector, the value at risk could rise to $43 trillion.45
Even the SDS significantly overstates the level of oil and gas investment required compared to the level that is within the Paris goals.

09
We can estimate how much excess investment the IEA is calling for out to 2040, compared to what would be needed if the Paris goals are met. Oil Change International used Rystad Energy’s UCube database to create cost curves for oil and gas, and examine where they intersect with the demand levels in IEA scenarios, in order to assess which production will be competitive at those levels. They treat oil and liquified natural gas (LNG) each as trading in a single global market; they divide dry gas into five regional markets, assuming total gas demand is shared between the markets in the same proportions as in the IEA’s B2DS.
In doing so Oil Change International represents the Paris goals using the IPCC carbon budgets for a 66 percent probability of keeping warming below 2°C and for a 50 percent probability of keeping it below 1.5°C. Oil Change International assumes that 70 percent of the 2°C budget is used by 2040, and 100 percent of the 1.5°C budget. They further assume that those budgets are shared between oil, gas, and coal in the same proportions (by emissions) as the B2DS.
According to Oil Change International’s analysis:
• Between 78 percent and 96 percent of the upstream oil and gas investment under the NPS - $11.2 to $13.8 trillion – is likely incompatible with meeting the Paris goals.
• Between 70 percent and 94 percent of the investment under the SDS – $7.3 to $9.9 trillion – is incompatible with the Paris goals.
Misdirected capital
Oil Dry gas
Main IEA scenarios:
Range of Paris goals:
NPS
2°C
SDS
1.5°C 46
9,730
2,025
6,420
343
North America
654
150
654
5
Europe and Russia
1,345
394
1,196
116
Asia – Pacific
1,120
394
964
85
Mideast & Africa
519
22
292
1
LNG TOTAL
S. & C America
485
67
214
13
868
116
725
13
14,361
3,168
10,465
576
Table 1: Cumulative capital expenditure in oil and gas extraction, 2018-40, in four scenarios (US $ bn)
Sources: Rystad Energy,47 Oil Change International analysis

010
Oil Dry gas
Main IEA scenarios:
Range of Paris goals: 49
NPS
2°C
SDS
1.5°C 50
3,300
785
2,577
200
North America
301
97
301
4
Europe and Russia
384
145
350
43
Asia – Pacific
308
75
256
5
Mideast & Africa
167
10
104
0
LNG TOTAL
S. & C America
115
27
76
5
291
45
259
5
4,866
1,184
3,923
263
Table 2: Cumulative capital expenditure (US $ bn) in oil and gas extraction, 2018-25, in four scenarios
Sources: Rystad Energy 51, Oil Change International analysis
Whereas Table 1 shows the capital investment over the full period of the IEA scenarios (2018-2040), investors may be more interested in the nearer term. In Table 2, we show the capital investment over the period 2018-2025 in the two main IEA scenarios, compared with the Paris goals.
The important thing here is not the precise numbers48 but the general finding: the investment called for in both the NPS and the SDS considerably exceeds the amount that would be aligned with the Paris goals.

011
NPS SDS0
2
4
6
8
10
12
14
16
Cao
ex, U
S $
tn
Range of Paris Goals
Figure 1: Cumulative capital expenditure in oil and gas extraction, 2018-40, in four scenarios
This excess investment, beyond that aligned with the Paris goals, can lead to two possible outcomes. Either the sunk capital locks in emissions, causing the goals to be missed. Or the goals are achieved, and the capital is wasted, becoming fully stranded (non-producing) assets and potentially causing economic upheaval. In calling for more investment, the IEA will help cause one of these two outcomes.

12
Recommendations for investors
• Engage with the IEA encouraging it to:
• Develop a scenario that is aligned with the Paris goals of keeping warming well below 2 degrees, and pursuing efforts to keep it to 1.5 degrees:– this could be done by showing a
range, from being aligned with a 66 percent chance of 2 degrees to a 50 percent chance of 1.5 degrees;
– alternatively, there could be a single scenario with a high probability (say, 80 or 90 percent) of staying below 2 degrees;– the scenario should be transparent
about reliance on any unproven technologies such as carbon capture and storage and show how the scenario would look without such technology assumptions.
• Make that scenario the WEO’s main scenario – including the majority of the narrative, and the main data tables – on internationally agreed policy goals on climate, energy access and air pollution.
• Be fully transparent about potential conflicts of interest: the IEA should publicly disclose any company involvement in the WEO or other information product, whether through staff secondment, data provision or other means.
• Until the WEO has been reformed, stress-test investment decisions against multiple futures by focusing on particular drivers (such as rapid renewable energy growth or oil price crash). – There are growing numbers of
forecasts focused specifically on clean energy, both long-range from Bloomberg New Energy Finance (BNEF) and from the International Renewable Energy Agency (IRENA), which though not aiming for a climate goal give a more genuine picture of potential disruption.
• Avoid basing decisions on business-as-usual scenarios such as the NPS that would lead to severe climate change, and instead plan for a safe-climate future.
• Treat the SDS and B2DS with caution as they are not aligned with the Paris Agreement goals they do not fully reflect the risk to investments.
013
EndnotesContact
Charlie Kronick, (Greenpeace UK)Charlie.kronick @greenpeace.org+44 7801 212 963
Greg Muttitt, Oil Change International, [email protected]
Louise [email protected]+44 7751 256 163
1 1 IEA, “Our Mission,” http://www.iea.org/about/
2 IEA, “World Energy Outlook,” https://www.iea.org/weo/
3 Adani Mining Pty Ltd, Carmichael Coal Mine and Rail Project Environment Impact Statement, Volume 1 Section 1 Introduction, p.1-4, http://eisdocs.dsdip.qld.gov.au/Carmichael%20Coal%20Mine%20and%20Rail/EIS/EIS/Project%20Wide/01-introduction-project-wide.pdf
4 Geoscience Australia and Australian Bureau of Agricultural & Resource Economics, Australian Energy Resource Assessment, 2010, pp. 14, 139-140, 149, 151- I 152, 163. The assessment used the reference scenario in WEO 2009 (the subsequent edition of the assessment, in 2014, used the NPS to a similar extent).
5 Adani Mining Pty Ltd v Land Services of Coast and Country Inc & Ors [2015] QLC 48, pp.112-113, 127, https://archive.sclqld.org.au/qjudgment/2015/QLC15-048.pdf
6 Josh Frydenburg, interview with Barry Cassidy, Insiders, ABC, October 18, 2015, http://www.abc.net.au/news/2015-10-18/no-federal-subsidies-carmichael-mine-strong-moral-case-for-coal/6863702
7 BOEM, “Proposed Final Outer Continental Shelf Oil & Gas Leasing Program 2012-2017,” June 2012, p.101
8 Senate Energy and Natural Resources Committee, “Sen. Murkowski: Offset Tightening World Oil Supplies with Domestic Production,” February 3, 2011, https://www.energy.senate.gov/public/index.cfm/republican-news?ID=DB163FBA-384D-4570-B14B-079F2C262F93
9 Arctic Energy Center, “Activists ignore key facts in attack on arctic development”, September 16, 2015, http://arcticenergycenter.com/ungrounded-activism/
10 Adam Scott and Greg Muttitt, “Climate On The Line Why New Tar Sands Pipelines Are Incompatible With The Paris Goals,” Oil Change International, January 2017, http://priceofoil.org/2017/01/19/climate-on-the-line-why-new-tar-sands-pipelines-are-incompatible-with-the-paris-goals/
11 Richard Kruger presentation, at Imperial Oil Ltd 2017 Business Update Webcast, November 1, 2017. Steve Williams presentation, at Suncor Energy Annual Shareholder Meeting, April 29, 2014
12 Government of Canada, “Oil Sands A strategic resource for Canada, North America and the global market”, https://www.nrcan.gc.ca/sites/www.nrcan.gc.ca/files/energy/pdf/eneene/pubpub/pdf/12-0653-OS-Energy_Security-EconoBenefits_us-eng.pdf; Government of Canada, “Oil Sands Economic contributions,” https://www.nrcan.gc.ca/sites/www.nrcan.gc.ca/files/energy/pdf/oilsands-sablesbitumineux/15-0510%20Oil%20Sands%20-%20Brochure_e.pdf; Government of Canada, “Oil Sands: Global Leadership In Innovation”, http://www.nrcan.gc.ca/sites/www.nrcan.gc.ca/files/energy/files/13-0145-OS-Innovation_e.pdf
13 CAPP, Crude Oil Forecast, Markets & Transportation 2017, p.22
14 National Energy Board Report OH-001-2014, Trans Mountain Expansion Project, May 2016, pp.xiii, 301-5
15 Muse Stancil, Market Prospects and Benefits Analysis of the Trans Mountain Expansion Project, September 2015, pp.16-20, https://apps.neb-one.gc.ca/REGDOCS/File/Download/2825856
16 Tim Gould and Laura Cozzi webinar, “Where are we heading? The New Policies Scenario,” November 24, 2017, available at https://www.youtube.com/watch?v=M6yuRJYeSuM
17 “The New Policies Scenario assumes only cautious implementation of current commitments and plans. This is done in view of the many institutional, political and economic obstacles which exist, as well as, in some cases, a lack of detail in announced intentions and about how they will be implemented.” IEA, World Energy Model Documentation, p.5
18 IEA press releases: November 14, 2017; November 16, 2016; November 10, 2015, November 12, 2014; November 12, 2013; all at http://www.iea.org/newsroom/news/
19 Globe and Mail, November 14, 2017, https://www.theglobeandmail.com/globe-investor/inside-the-market/upcoming-surge-in-shale-oil-production-will-be-biggest-oil-and-gas-boom-in-history/article36970388/
20 Deutsche Welle, November 14, 2017, http://www.dw.com/en/oil-era-is-far-from-over-says-ieas-annual-report/a-41371952
21 Reuters, November 14, 2017, https://uk.reuters.com/article/uk-oil-outlook-iea/global-oil-demand-to-withstand-rise-of-electric-vehicles-iea-idUKKBN1DE002
22 SDG 7, 13 and 3.9
23 As of end-2011, the remaining carbon budgets were respectively 1,000 and 550 GtCO2 (IPCC, Climate Change 2014, Synthesis Report (SYR), table 2.2, p.64, http://ipcc.ch/pdf/assessment-report/ar5/syr/AR5_SYR_FINAL_All_Topics.pdf) Emissions were 160 GtCO2 in 2012-15 (Carbon Dioxide Information Analysis Center / Global Carbon Project, 2016 Budget v1.0,http://cdiac.ornl.gov/GCP/); and an estimated 36.4 Gt from fossil fuels in 2016 and 36.8 Gt in 2017, plus4.8 Gt from land use change in each of 2016 and 2017 (. Corinne le Quéré et al, “Global Carbon Budget 2017,” Earth Syst. Sci. Data, 10, 2018, pp.429-430, https://doi.org/10.5194/essd-10-405-2018
24 Greg Muttitt. “ Off Track: How the International Energy Agency Guides Energy Decisions Towards Fossil Fuel Dependence and Climate Change”. Oil Change International and IEEFA, April 2018.
25 UNFCCC Subsidiary Body for Scientific and Technological Advice, Forty-second session, Bonn, 1–11 June 2015, Report on the structured expert dialogue on the 2013–2015 review, http://unfccc.int/resource/docs/2015/sb/eng/inf01.pdf, p.18
26 Greg Muttitt, “Why the International Energy Agency Still Gets It Wrong on Fossil Fuels”, Oil Change International, March 23, 2017, http://priceofoil.org/2017/03/23/why-the-international-energy-agency-still-gets-it-wrong-on-fossil-fuels/
27 www.iea.org/etp2017 (requires password, from report)
28 Covering a time period to 2060, the B2DS does not need to assume delayed action on emissions. Furthermore, it integrates industrial process emissions (primarily from cement calcination) into its analysis, so the only external component is from land use change, which is somewhat optimistic but not to an excessive extent.
29 International Energy Agency, “Energy Technology Perspectives 2017- Catalysing Energy Technology Transformations”, June 6, 2017. IEA, ETP 2017, data tables
30 Pete Smith et al, “Biophysical and economic limits to negative CO2 emissions.” Nature Climate Change, December 7, 2015, p.5. DOI: 10.1038/NCLIMATE2870.
31 Task Force on Climate-related Financial Disclosures, Recommendations, 14 December 2016, pp.27-32 (pp.34-39 of pdf), https://www.fsb-tcfd.org/wp-content/uploads/2016/12/16_1221_TCFD_Report_Letter.pdf
32 Leslie Hayward, “Barclays: $22 Trillion in Oil Revenue at Risk from COP-21 Negotiations”, The Fuse, December 10, 2015, http://energyfuse.org/barclays-22-tillion-in-oil-revenue-at-risk-from-cop-21-negotiations/
33 Paul Spedding et al, HSBC Global Research, “Oil & carbon revisited: Value at risk from ‘unburnable’ reserves”, 25 January 2013
34 CalPERS, “Support Proposal #7 Requesting Climate Change Risk Reporting”, May 18, 2016, https://www.calpers.ca.gov/docs/chevron-corporation-shareowner-letter.pdf
35 Asian Infrastructure Investment Bank, “Energy Sector Strategy: Sustainable Energy for Asia,” June 15, 2017, p.12, https://www.aiib.org/en/policies-strategies/strategies/sustainable-energy-asia/.content/index/_download/aiib-energy-sector-Strategy-2017.pdf
36 ExxonMobil, “2018 Energy & Carbon Summary,” February 2018, pp.10, 11 http://cdn.exxonmobil.com/~/media/global/files/energy-and-environment/2018-energy-and-carbon-summary.pdf
37 Shell, “Energy Transitions And Portfolio Resilience,” p.33, https://www.shell.com/sustainability/sustainability-reporting-and-performance-data/performance-data/greenhouse-gas-emissions/portfolio-resilience-to-iea-450-scenario/_jcr_content/par/textimage_728121788.stream/1479323448964/c0617ee1311 deff3f478035526b0dba05fc700c9dd087bfe459a89e2b6471413/ ir-shell-and-energy-transitions-reporta4v20-124048.pdf
38 BP PLC, Energy Outlook 2035 Presentation, February 10, 2016
39 Total, “Integrating Climate into our Strategy,” May 2016, p.7, http://www.total.com/sites/default/files/atoms/files/integrating_climate_into_our_strategy_eng.pdf
40 The company assesses performance in an “ambitious action” scenario, which is aligned to the IEA’s 450 Scenario. Glencore, “Climate Change Considerations for Our Business 2017”, pp.10, 20, http://www.glencore.com/assets/sustainability/doc/sd_reports/2017-Climate-change-considerations-for-our-business.pdf
41 BHP Billiton, “Climate Change: Portfolio Analysis,” September 2015, pp.1, 4, https://www.bhp.com/~/media/5874999cef0a41a59403d13e3f8de4ee.ashx
42 Chevron, “Climate Change Resilience: A Framework for Decision Making,” March 2018, p.25, https://www.chevron.com/-/media/shared-media/documents/climate-change-resilience.pdf
43 BP PLC, Energy Outlook 2035 Presentation, February 10, 2016
44 Marshall Burke et al, “Global non-linear effect of temperature on economic production,” Nature, 2015, http://web.stanford.edu/~mburke/climate/BurkeHsiangMiguel2015.pdf
45 Economist Intelligence Unit, “The cost of inaction: Recognising the value at risk from climate change,” 2015, p.2, https://www.aviva.com/content/dam/aviva-corporate/documents/socialpurpose/pdfs/thoughtleadership/EIU-cost-of-inaction.pdf
46 If these investment numbers aligned with the 1.5°C target seem very small, bear in mind that the remaining carbon budget of 313 Gt CO2 will be exhausted within eight years at current rates of emissions.
47 Rystad UCube, February 6, 2018 and March 25, 2018, uncommercial projects included (as commerciality is determined by oil price, which in this case is determined by interaction with demand projections rather than Rystad assumptions).We assume all LNG goes to Asia-Pacific and Europe.
48 Like any modelling or forecasting exercise, the approach involves several approximations. A cost curve analysis requires specification of a time period (in this case, 2018-2040), whereas in reality competition occurs dynamically in real time. We have treated the oil market as global, whereas some parts of global oil consumption (particularly continental markets where there is also an inland supply) are influenced more by local factors. Similarly, the dry gas market is more complex than five regional blocs, shaped by the precise locations and capacities of pipelines. Finally, there are interactions between oil and gas, and between the different gas markets, which are not reflected here. With those caveats, cost curve analysis gives a reasonable overall picture of which supplies will be competitive, and hence we are able to draw general conclusions from it.
49 Cumulative production is assessed for the period 2018-40, compared with the four scenarios in a cost curve, as before. The projects are the same as in Table 1, but we are counting just the 2018-25 capex for those projects.
50 If these investment numbers aligned with the 1.5°C target seem very small, bear in mind that the remaining carbon budget of 313 Gt CO2 will be exhausted within eight years at current rates of emissions.
51 Rystad UCube, February 6, 2018 and March 25, 2018, uncommercial projects included (as commerciality is determined by oil price, which in this case is determined by interaction with demand projections rather than Rystad assumptions). Cumulative production is assessed for the period 2018-40, compared with the four scenarios in a cost curve, as before. The projects are the same as in Table 1, but we are counting just the 2018-25 capex for those projects.
Disclaimer: Neither Greenpeace nor Oil Change International is an investment or financial advisor, and neither makes any representation regarding the advisability of investing in any particular company or investment fund or vehicle. A decision to invest in any such investment fund or entity should not be made in reliance on any of the statements set forth in this investor briefing. While the authors have obtained information believed to be reliable, none of the authors shall be liable for any claims or losses of any nature in connection with information contained in such document, including but not limited to, lost profits or punitive or consequential damages. This publication should not be viewed as a comprehensive guide of all questions an investor should ask an institution, but rather as a starting point for questions specifically related to the issues presented in this publication. The opinions expressed in this publication are based on the documents specified in the endnotes. We encourage readers to read those documents.