Embed Size (px)
Citation preview
APRIL 2018
ABB Division Fact Sheets
55%45%
28%
19%
24%29%
23% 14%
42%21%
82%
18%
47%
21%
32%
35%28%
37%
54%46%
32
41
27
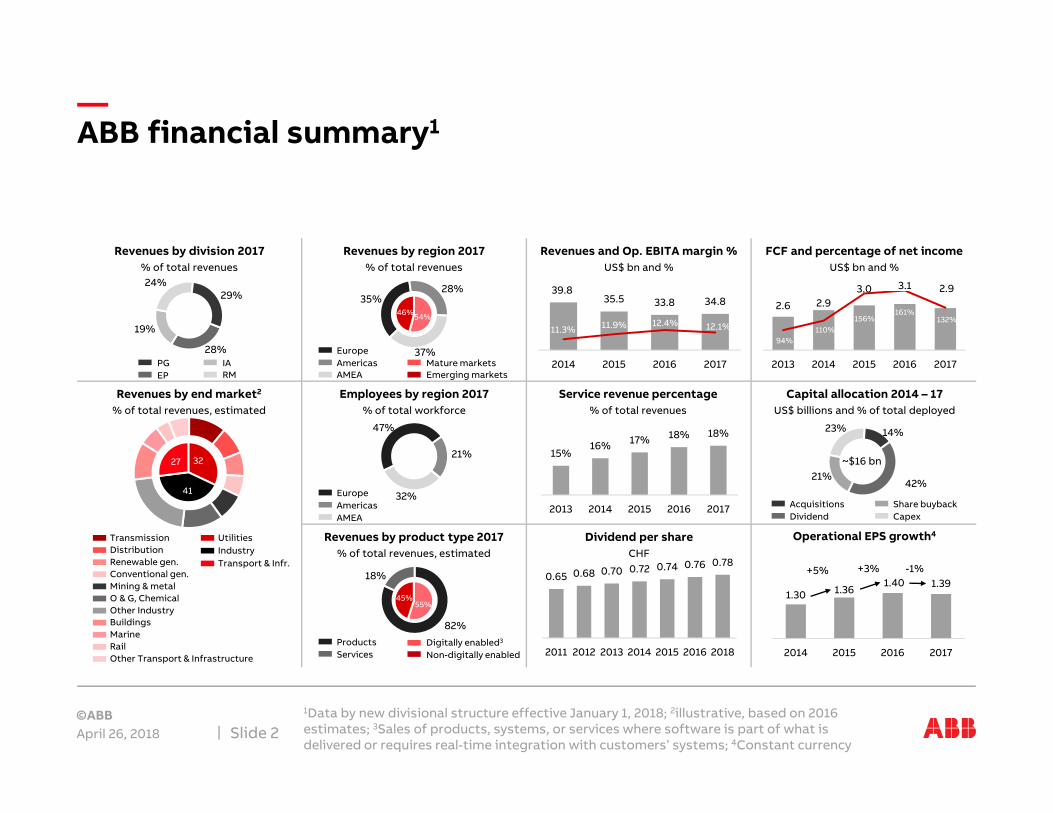
ABB financial summary1
April 26, 2018
1Data by new divisional structure effective January 1, 2018; 2illustrative, based on 2016 estimates; 3Sales of products, systems, or services where software is part of what is delivered or requires real-time integration with customers’ systems; 4Constant currency
Slide 2
Revenues by division 2017% of total revenues
PGEP
IARM
TransmissionDistributionRenewable gen.Conventional gen.Mining & metalO & G, ChemicalOther IndustryBuildings
UtilitiesIndustryTransport & Infr.
Revenues by end market2
% of total revenues, estimated
MarineRailOther Transport & Infrastructure
Revenues by region 2017% of total revenues
Mature marketsEmerging markets
EuropeAmericasAMEA
Employees by region 2017% of total workforce
EuropeAmericasAMEA
Revenues by product type 2017% of total revenues, estimated
Digitally enabled3
Non-digitally enabledProductsServices
Revenues and Op. EBITA margin % US$ bn and %
39.835.5 33.8 34.8
11.3% 11.9% 12.4% 12.1%
2014 2015 2016 2017
Service revenue percentage% of total revenues
15%16% 17% 18% 18%
2013 2014 2015 2016 2017
Dividend per share CHF
0.65 0.68 0.70 0.72 0.74 0.76 0.78
2011 2012 2013 2014 2015 2016 2018
Capital allocation 2014 – 17 US$ billions and % of total deployed
DividendShare buybackCapex
Acquisitions
~$16 bn
Operational EPS growth4
1.30 1.361.40 1.39
2014 2015 2016 2017
+5% +3%
FCF and percentage of net income US$ bn and %
2.6 2.93.0 3.1 2.9
94%110%
156% 132%
2013 2014 2015 2016 2017
161%
-1%
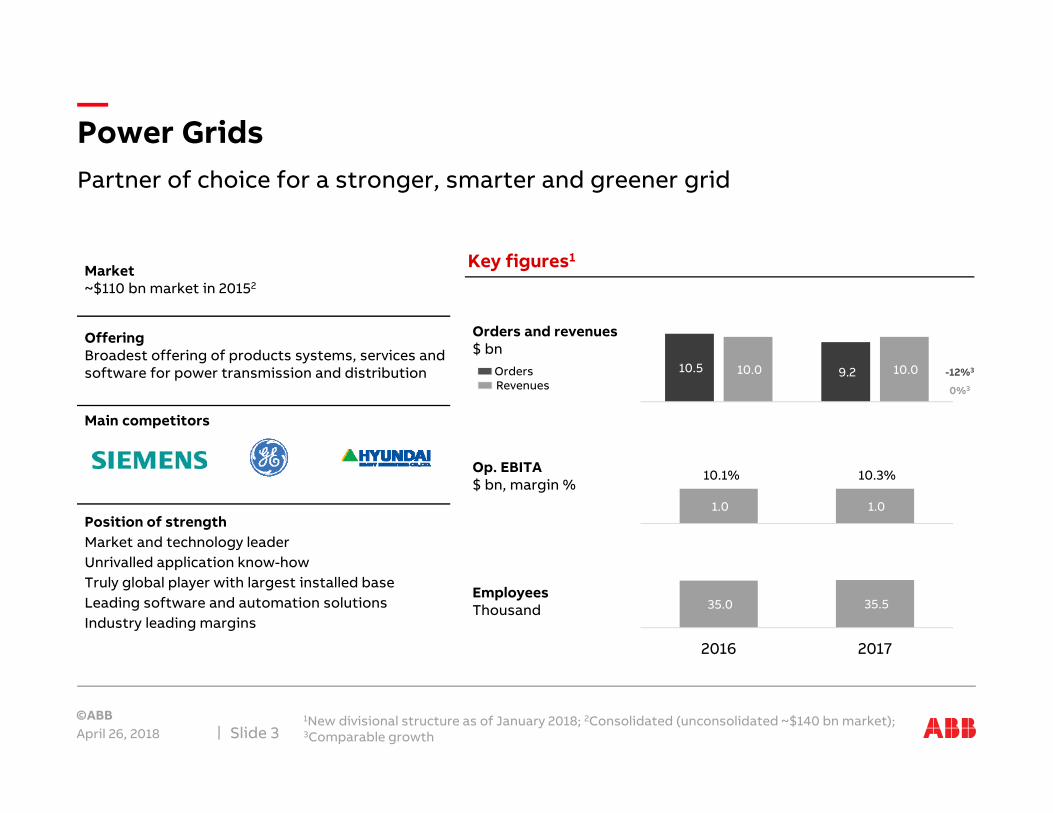
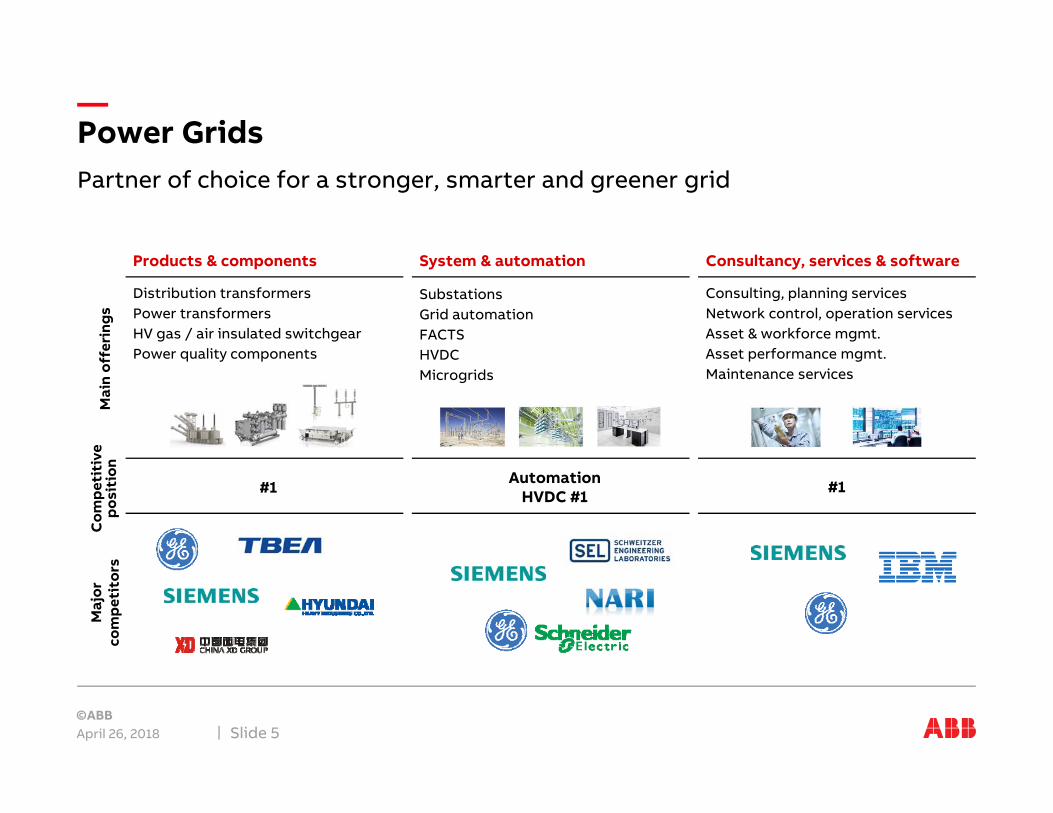
Main competitors
Partner of choice for a stronger, smarter and greener grid
Power Grids
April 26, 20181New divisional structure as of January 2018; 2Consolidated (unconsolidated ~$140 bn market); 3Comparable growthSlide 3
Market ~$110 bn market in 20152
Position of strength Market and technology leaderUnrivalled application know-howTruly global player with largest installed baseLeading software and automation solutionsIndustry leading margins
OfferingBroadest offering of products systems, services and software for power transmission and distribution
Key figures1
1.0 1.0
10.1% 10.3%
35.0 35.5
2016 2017
Op. EBITA$ bn, margin %
EmployeesThousand
10.5 9.2 10.0 10.0
Orders and revenues$ bn
OrdersRevenues
-12%3
0%3
29
40
31
78
148
15
85
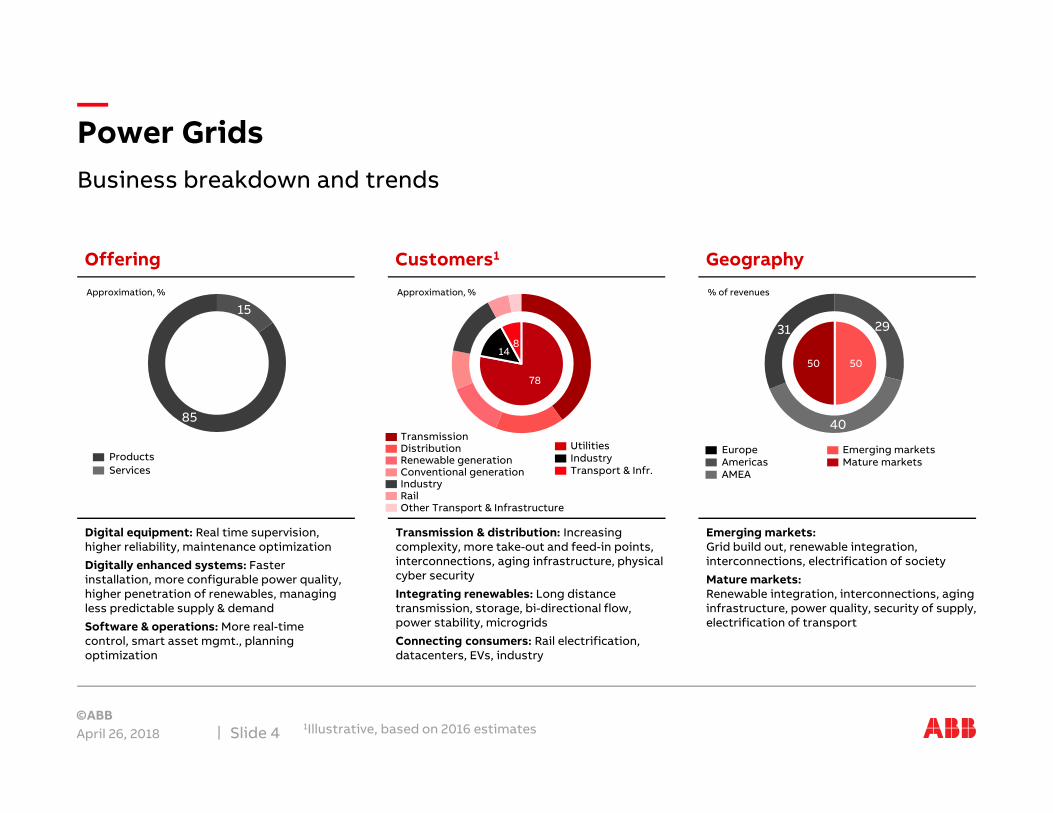
Offering
Business breakdown and trends
Power Grids
April 26, 20181Illustrative, based on 2016 estimatesSlide 4
Customers1 Geography
Approximation, % Approximation, % % of revenues
Transmission & distribution: Increasing complexity, more take-out and feed-in points, interconnections, aging infrastructure, physical cyber security
Integrating renewables: Long distance transmission, storage, bi-directional flow, power stability, microgrids
Connecting consumers: Rail electrification, datacenters, EVs, industry
Emerging markets:Grid build out, renewable integration, interconnections, electrification of society
Mature markets:Renewable integration, interconnections, aging infrastructure, power quality, security of supply, electrification of transport
Digital equipment: Real time supervision, higher reliability, maintenance optimization
Digitally enhanced systems: Faster installation, more configurable power quality, higher penetration of renewables, managing less predictable supply & demand
Software & operations: More real-time control, smart asset mgmt., planning optimization
EuropeAmericasAMEA
Emerging marketsMature markets
UtilitiesIndustryTransport & Infr.
TransmissionDistributionRenewable generationConventional generationIndustryRailOther Transport & Infrastructure
ProductsServices
5050
Partner of choice for a stronger, smarter and greener grid
Power Grids
April 26, 2018 Slide 5
Consulting, planning servicesNetwork control, operation servicesAsset & workforce mgmt.Asset performance mgmt.Maintenance services
Distribution transformersPower transformersHV gas / air insulated switchgear Power quality components
Products & components
Substations Grid automationFACTSHVDCMicrogrids
System & automation Consultancy, services & software
Com
peti
tive
po
siti
onM
ain
offe
ring
sM
ajor
co
mpe
tito
rs
Automation HVDC #1#1 #1
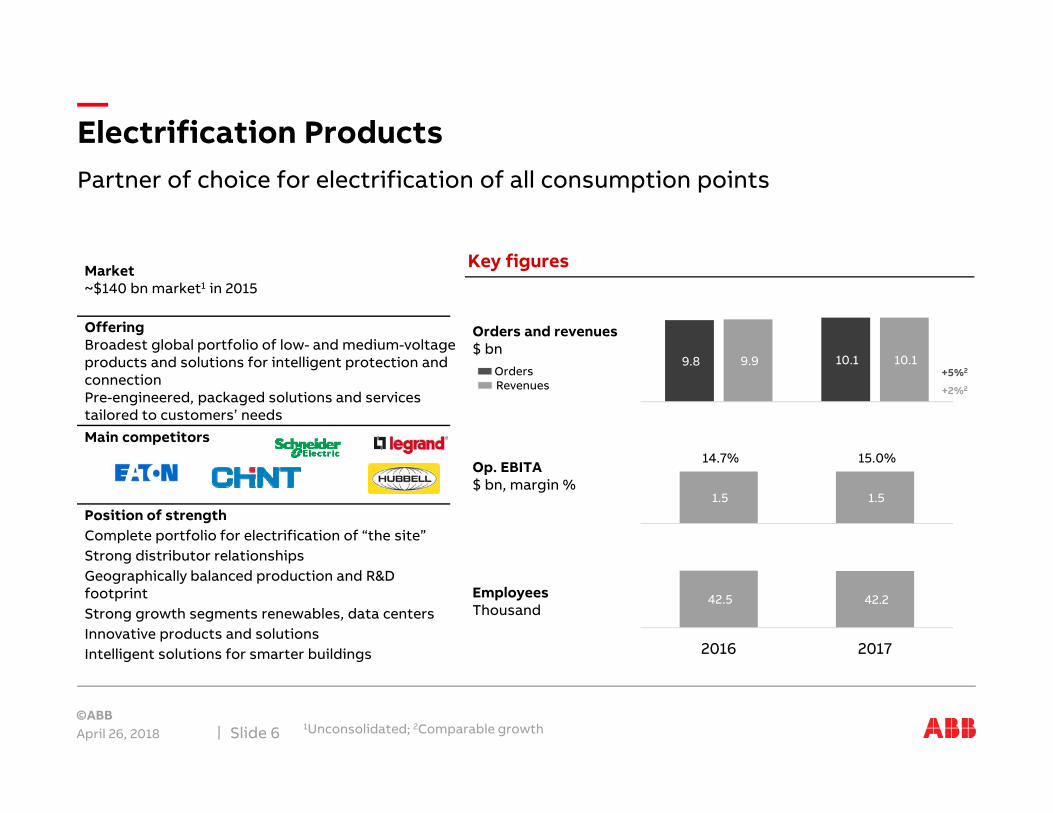
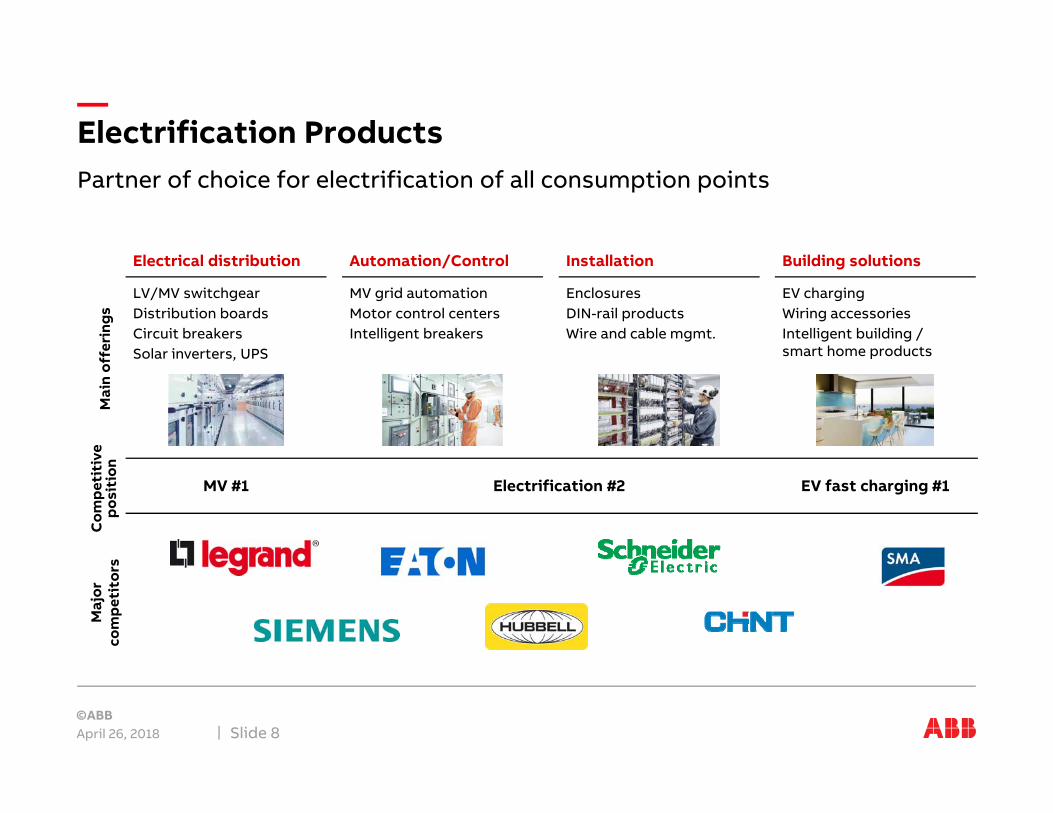
Partner of choice for electrification of all consumption points
Electrification Products
April 26, 2018 Slide 6
Main competitors
Market ~$140 bn market1 in 2015
Position of strength Complete portfolio for electrification of “the site”Strong distributor relationshipsGeographically balanced production and R&D footprintStrong growth segments renewables, data centersInnovative products and solutionsIntelligent solutions for smarter buildings
OfferingBroadest global portfolio of low- and medium-voltage products and solutions for intelligent protection and connectionPre-engineered, packaged solutions and services tailored to customers’ needs
Key figures
1.5 1.5
14.7% 15.0%
42.5 42.2
2016 2017
Op. EBITA$ bn, margin %
EmployeesThousand
9.8 10.1 9.9 10.1
Orders and revenues$ bn
OrdersRevenues
+5%2
+2%2
1Unconsolidated; 2Comparable growth
37
27
36
465446
620
12
97
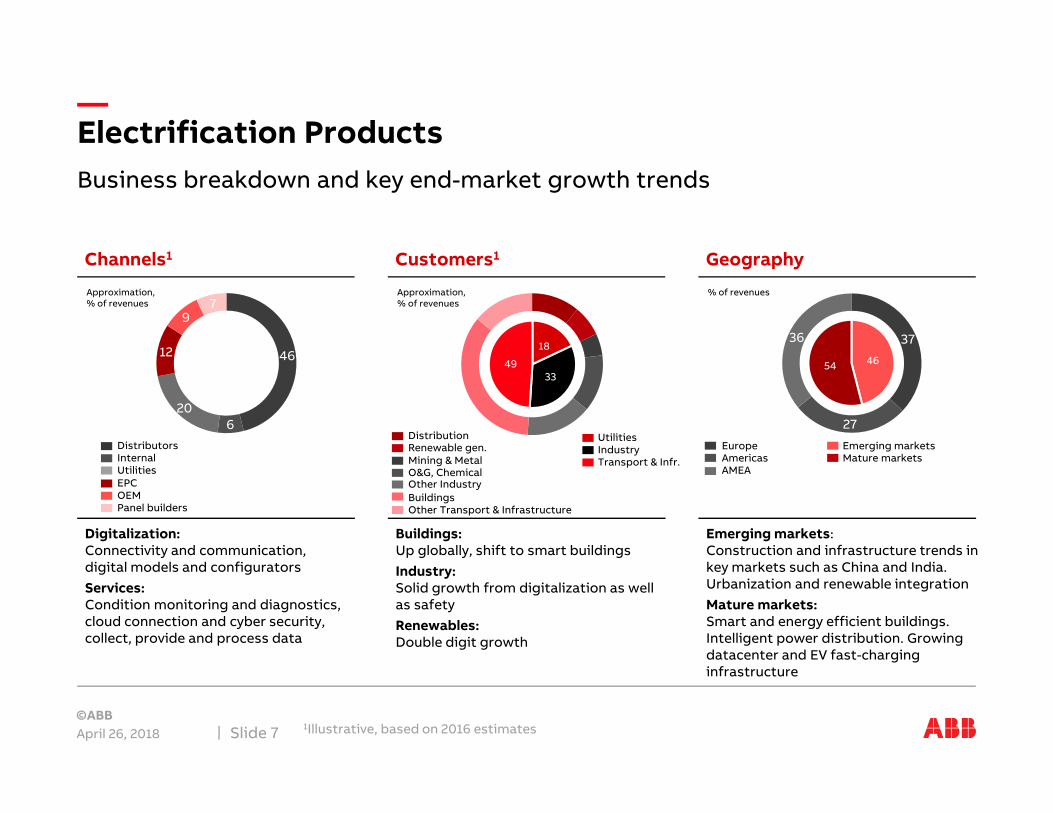
Channels1
Business breakdown and key end-market growth trends
Electrification Products
April 26, 20181Illustrative, based on 2016 estimatesSlide 7
Customers1 Geography
DistributorsInternalUtilitiesEPCOEMPanel builders
Buildings:Up globally, shift to smart buildingsIndustry:Solid growth from digitalization as well as safetyRenewables:Double digit growth
Digitalization:Connectivity and communication, digital models and configuratorsServices: Condition monitoring and diagnostics, cloud connection and cyber security, collect, provide and process data
DistributionRenewable gen.Mining & MetalO&G, ChemicalOther IndustryBuildingsOther Transport & Infrastructure
UtilitiesIndustryTransport & Infr.
EuropeAmericasAMEA
Emerging marketsMature markets
18
3349
Approximation, % of revenues
Approximation, % of revenues
% of revenues
Emerging markets:Construction and infrastructure trends in key markets such as China and India. Urbanization and renewable integrationMature markets: Smart and energy efficient buildings. Intelligent power distribution. Growing datacenter and EV fast-charging infrastructure
Partner of choice for electrification of all consumption points
Electrification Products
April 26, 2018 Slide 8
LV/MV switchgearDistribution boardsCircuit breakersSolar inverters, UPS
MV grid automationMotor control centersIntelligent breakers
EV chargingWiring accessoriesIntelligent building / smart home products
EnclosuresDIN-rail productsWire and cable mgmt.
Electrical distribution Automation/Control Installation Building solutions
Com
peti
tive
po
siti
onM
ain
offe
ring
sM
ajor
co
mpe
tito
rs
Electrification #2MV #1 EV fast charging #1

Main competitors
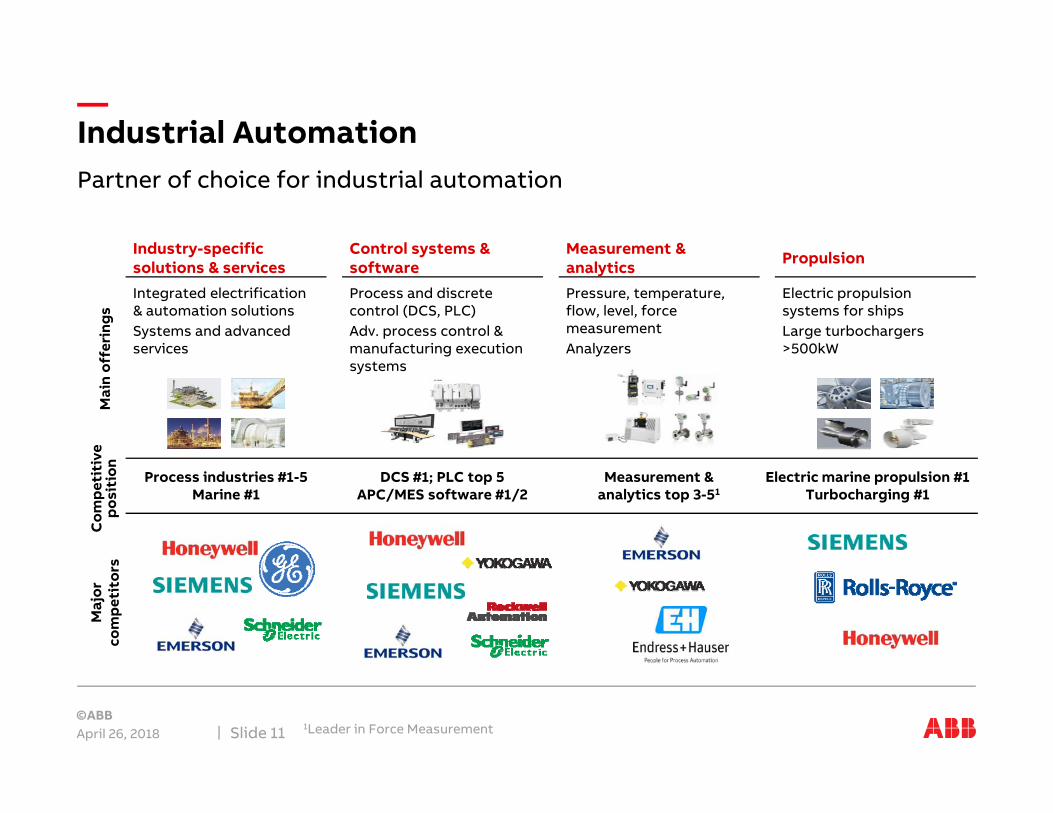
Partner of choice for industrial automation
Industrial Automation
April 26, 20181New divisional structure as of January 2018; 2Unconsolidated; 3Comparable growthSlide 9
Market ~$120 bn market in 20152
Position of strength Integrated control product, system and service offeringAdvanced process control & optimization software and know-howIntegrated power and automation solutionsLargest installed base, advanced services Deep domain and process expertise
OfferingControl systems, software, measurement & analytics Industry-specific power & automation solutions, products (e.g. electric ship propulsion) and services
Key figures1
0.9 1.0
13.4% 13.9%
22.3 25.2
2016 2017
Op. EBITA$ bn, margin %
EmployeesThousand
6.0 6.6 6.7 6.9
Orders and revenues$ bn
OrdersRevenues
+2%3
-3%3
42
20
3842
58
Offering
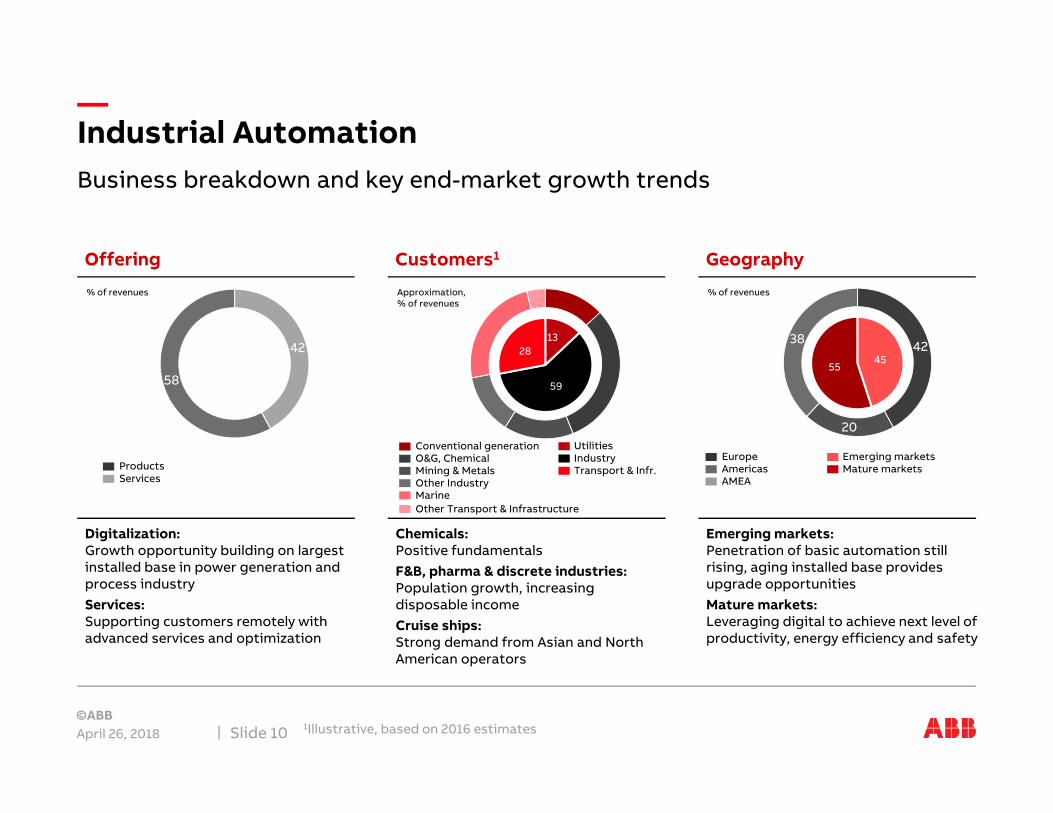
Business breakdown and key end-market growth trends
Industrial Automation
April 26, 20181Illustrative, based on 2016 estimatesSlide 10
Customers1 Geography
Chemicals:Positive fundamentalsF&B, pharma & discrete industries: Population growth, increasing disposable incomeCruise ships:Strong demand from Asian and North American operators
Emerging markets:Penetration of basic automation still rising, aging installed base provides upgrade opportunitiesMature markets:Leveraging digital to achieve next level of productivity, energy efficiency and safety
Digitalization:Growth opportunity building on largest installed base in power generation and process industryServices:Supporting customers remotely with advanced services and optimization
UtilitiesIndustryTransport & Infr.
Conventional generationO&G, ChemicalMining & MetalsOther IndustryMarineOther Transport & Infrastructure
EuropeAmericasAMEA
Emerging marketsMature marketsProducts
Services
13
59
2845
55
% of revenues Approximation, % of revenues
% of revenues
Partner of choice for industrial automation
Industrial Automation
April 26, 20181Leader in Force MeasurementSlide 11
Integrated electrification & automation solutionsSystems and advanced services
Process and discrete control (DCS, PLC)Adv. process control & manufacturing execution systems
Electric propulsion systems for shipsLarge turbochargers >500kW
Pressure, temperature, flow, level, force measurementAnalyzers
Industry-specific solutions & services
Control systems & software
Measurement & analytics Propulsion
Com
peti
tive
po
siti
onM
ain
offe
ring
sM
ajor
co
mpe
tito
rs
DCS #1; PLC top 5APC/MES software #1/2
Process industries #1-5Marine #1
Electric marine propulsion #1Turbocharging #1
Measurement &analytics top 3-51
Main competitors
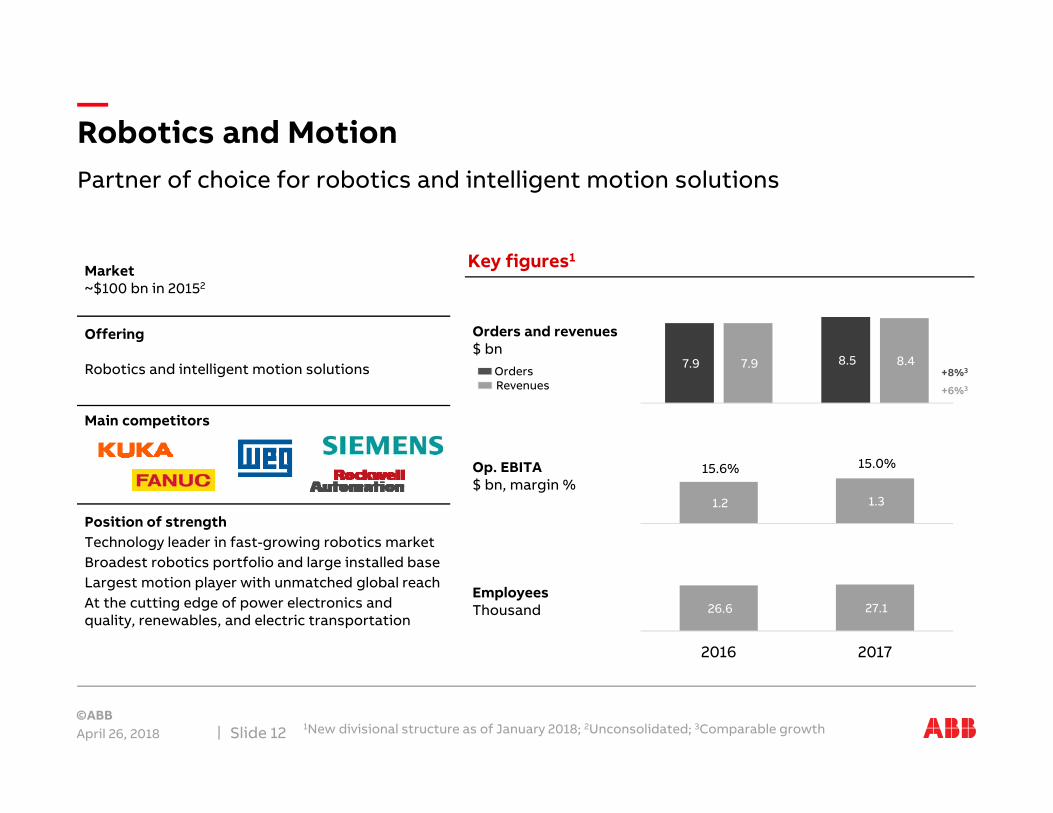
Partner of choice for robotics and intelligent motion solutions
Robotics and Motion
April 26, 20181New divisional structure as of January 2018; 2Unconsolidated; 3Comparable growthSlide 12
Market ~$100 bn in 20152
Position of strength Technology leader in fast-growing robotics marketBroadest robotics portfolio and large installed base Largest motion player with unmatched global reachAt the cutting edge of power electronics and quality, renewables, and electric transportation
Offering
Robotics and intelligent motion solutions
Key figures1
1.2 1.3
15.6% 15.0%
26.6 27.1
2016 2017
Op. EBITA$ bn, margin %
EmployeesThousand
7.9 8.5 7.9 8.4
Orders and revenues$ bn
OrdersRevenues
+8%3
+6%3
35
33
32
85
15
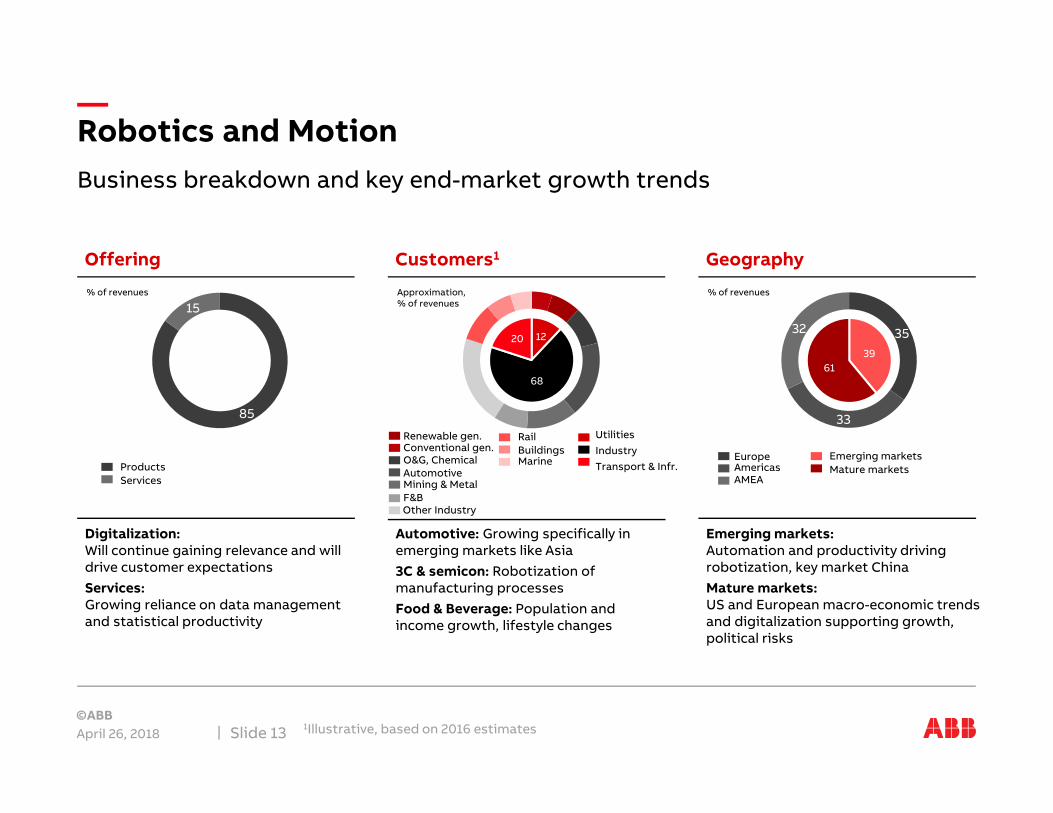
Offering
Business breakdown and key end-market growth trends
Robotics and Motion
April 26, 20181Illustrative, based on 2016 estimatesSlide 13
Customers1 Geography
Automotive: Growing specifically in emerging markets like Asia3C & semicon: Robotization of manufacturing processesFood & Beverage: Population andincome growth, lifestyle changes
Emerging markets: Automation and productivity driving robotization, key market ChinaMature markets: US and European macro-economic trends and digitalization supporting growth, political risks
Digitalization: Will continue gaining relevance and will drive customer expectationsServices: Growing reliance on data management and statistical productivity
Products Services
12
68
2039
61
EuropeAmericasAMEA
Emerging marketsMature markets
UtilitiesIndustryTransport & Infr.
RailBuildingsMarine
Renewable gen.Conventional gen.O&G, ChemicalAutomotiveMining & MetalF&BOther Industry
% of revenues Approximation, % of revenues
% of revenues
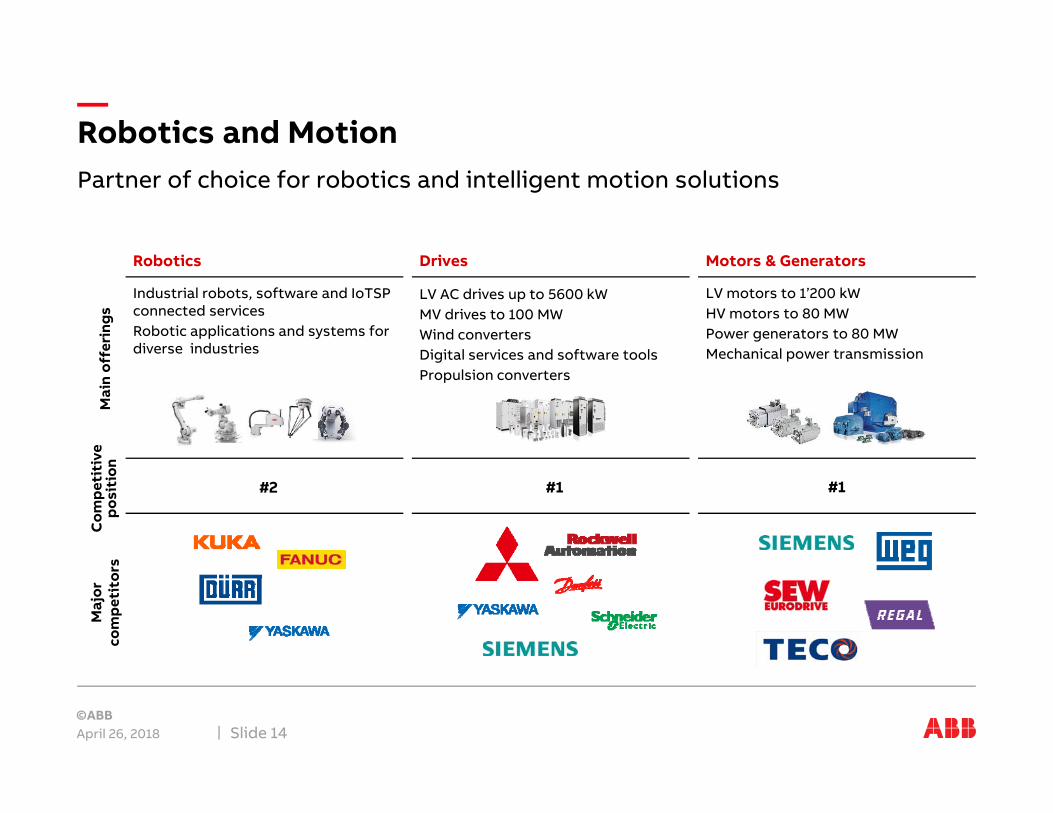
Partner of choice for robotics and intelligent motion solutions
Robotics and Motion
April 26, 2018 Slide 14
LV motors to 1’200 kWHV motors to 80 MWPower generators to 80 MWMechanical power transmission
Industrial robots, software and IoTSPconnected servicesRobotic applications and systems for diverse industries
Robotics
LV AC drives up to 5600 kWMV drives to 100 MWWind convertersDigital services and software toolsPropulsion converters
Drives Motors & Generators
Com
peti
tive
po
siti
onM
ain
offe
ring
sM
ajor
co
mpe
tito
rs
#1#2 #1
ABB LtdInvestor RelationsP.O. Box 8131CH-8050 ZürichPhone: +41 (0) 43 317 71 11E-mail: [email protected]
www.abb.com/investorrelations
This presentation contains non-GAAP measures of performance. Definitions of these measures and reconciliations between these measures and their US GAAP counterparts can be found in “Supplemental Financial Information” under “Financial results & presentations” – “Quarterly results & annual reports” on our website at www.abb.com/investorrelations
Contact us
April 26, 2018 Slide 15