Embed Size (px)
Citation preview
Approaches to and methods for evaluating new technologies in Technology Transfer Offices: How long is a piece of string?
Suma Athreye, rapporteur
Edited by:
Annarita Ferreri
Sergio Grande
2016
EUR 28684 EN
This publication is a Conference and Workshop report by the Joint Research Centre (JRC), the European
Commission’s science and knowledge service. It aims to provide evidence-based scientific support to the
European policymaking process. The scientific output expressed does not imply a policy position of the
European Commission. Neither the European Commission nor any person acting on behalf of the Commission is
responsible for the use that might be made of this publication.
JRC Science Hub
https://ec.europa.eu/jrc
JRC107304
EUR 28684 EN
PDF ISBN 978-92-79-70522-9 ISSN 1831-9424 doi:10.2760/67528
Luxembourg: Publications Office of the European Union, 2016
© European Union, 2016
Reuse is authorised provided the source is acknowledged. The reuse policy of European Commission documents is regulated by Decision 2011/833/EU (OJ L 330, 14.12.2011, p. 39).
For any use or reproduction of photos or other material that is not under the EU copyright, permission must be
sought directly from the copyright holders.
How to cite this report: Athreye, S., Ferreri, A., Grande, S., Approaches to and methods for evaluating new
technologies in Technology Transfer Offices: How long is a piece of string?, EUR 28684 EN, Publications Office
of the European union, Luxembourg, 2016, ISBN 978-92-79-70522-9, doi:10.2760/67528, JRC107304.
All images © European Union 2016
i
Contents
Acknowledgements ................................................................................................ 1
Executive summary ............................................................................................... 2
1 Introduction ....................................................................................................... 3
2 Working with the innovator and working with the investor: approach to valuation ...... 5
3 From research to market: Experience of an IP valuation among European TTOs ......... 8
4 Summary and implications ................................................................................ 11
List of tables ....................................................................................................... 12
List of abbreviations ............................................................................................. 13
Annexes ............................................................................................................. 14
Annex 1. Review of the academic literature on the value of patents for firms ............ 14
Annex 2. Technology valuation methods commonly used in Technology Transfer Offices
22
References ......................................................................................................... 25
1
Acknowledgements
On 22 November, the third edition of the annual best practices workshops of the
European TTO Circle was held in Brussels. The focus of this workshop was the evaluation
of intangibles and novel technologies. The author is very grateful to Giancarlo Caratti,
Annarita Ferreri who organised the workshop, all the participants listed below whose
presentations form the basis of this report, to Talita Soares, (EARTO) for her notes on
the second session of the workshop and lastly to Sergio Grande and Pauline Nguru for
the smooth running of the workshop.
List of speakers
Massimiliano Granieri (MITO)
Ian Brewer, Valuation Consulting
Ian Tracey, The Knowledge Transfer Network
Ludo Pyis, AREOPA
Zane Smilga, VERHAERT Innovations
Victor Paulissen, TNO
Tony Prézeau, CEA
Aude De Clercq, ESA
Eva Maria Vaquero, CIEMAT
Kathleen De Belder & Katrien Meuwis, IMEC
The workshop presentations can be directly accessed by clicking on the hyperlinks at the
following website:
https://ec.europa.eu/jrc/communities/community/tto-circle-
community/event/evaluation-intangibles-and-novel-technologies-art-or-science
2
Executive summary
The lack of a practical method to value Intellectual Property Rights (IPRs) is the main
challenge faced by Technology Transfer Offices (TTOs) in the commercialization of
inventions generated by university scientists. This report reports the discussions of a day
long workshop organised by the JRC on two issues of interest to TTOs, viz. methods for
valuation that can close the gap in investor and inventor perceptions and how best to
value early stage technologies.
Trying to value a novel technology is akin to asking how long is a piece of string? There
can be no definitive valuation of a novel technology; its value to users will vary
depending on the use to which the technology will be put and the size of that product
market, whether buyer or seller is conducting the valuation, and whether the valuation is
subjective or objective. However, TTOs that grapple with this problem need to select the
technologies that need valuation as well as identify those that need nurturing before they
can be transferred to a private firm for further development. The report presents the
different options for both that were shared at the workshop held on 22 November 2016.
The first part of the report contains the approaches to valuation used by private sector
technology brokers who typically manage a portfolio of technologies in different
technology domains. These approaches and methods may prove useful for TTOs that are
organised centrally at the university level. The main problem highlighted is deciding
which technologies to pursue and what assets the university should count as capable of
generating intellectual property income streams.
The second part of the report focuses on the approaches used to value of RTOs early
stage technologies by TTO circle members - most of the presentations were by TTOs
organised around specific technology area. The depth of knowledge about the area
meant that these organisations typically had the resources to evaluate the potential of
technologies and markets much better and implemented a form of real options valuations
in preferring to develop and spin out the technology before selling it. Patents were used
a means to pin the technology to the company.
The valuation needs of the two types of TTO organisations are different but they share
some common obstacles. The uncertainties faced by the TTO in valuation could be
partially mitigated by maintaining a register of technology valuations by technology class
which other TTO members could use in their negotiations with private firms. These data
may also allow more sophisticated real options analysis about the sorts of investment
and time horizons that may be required to make incubation pay-off for the TTO. A
second concern shared by all TTOs is the tension between exploitation of technology by
society and the often implicit requirement of generating a profit for the university.
Clarity about the objective of technology transfer activities should be part of the mandate
of TTOs.
Quick guide
Sections 2 and 3 summarize the discussions on valuing novel technologies that took
place during the workshop. Section 2 outlines the approaches presented by private sector
technology brokers to address the gap between the expectations of the inventor and
investor while Section 3 discusses European TTO practices related to dealing with early
stage technologies. Section 4 concludes with some implications for policy and practice. In
addition, the report also contains two brief reviews of the academic literature on patent
and technology valuation in the annexes for the benefit of TTO managers. Annex 1
reviews the academic literature on the value of patents held by firms which uses three
methodologies: market value approaches; patent renewal methodologies; and survey
based inventor valuations. Annex 2 reviews three standard approaches to valuation used
by TTOs viz. Cost-based methods, market based and income based approaches
(including real option approaches).
3
1 Introduction
Trying to value a novel technology is akin to asking how long is a piece of string? There
can be no definitive valuation of a novel technology; its value to users will vary
depending on the use to which the technology will be put and the size of that product
market, whether buyer or seller is conducting the valuation, and whether the valuation is
subjective or objective.
However, the lack of a practical method to value Intellectual Property is a main challenge
faced by Technology Transfer Offices (TTOs) in the commercialization of inventions
generated by university scientists. A survey conducted jointly by the Joint Research
Council/World Intellectual Property Organization (JRC/WIPO) in 2011, found that
valuation was a problem encountered mostly in the commercialization phase.
Disagreements about valuations often result in investors being reluctant to commit funds
for further exploitation. In contrast to firms performing research and development (R&D)
which conduct valuations as part of the process of protecting their Intellectual Property
(IP) and applying for patents, the JRC/WIPO survey found that only around a third of
TTOs carry out valuation exercises in relation to IP protection. When valuing early stage
technology, TTOs use a combination of qualitative and quantitative approaches and more
than half rely on internal expertise. The survey found that 53% of TTOs use only internal
expertise, 33% combine internal with external experts and 13% outsource this task to
external bodies. TTOs use several commercial search tools/databases (e.g., EPO-
PATSTAT, QPAT-Orbit, Thomson Delphion, used to assess freedom of operation)1. To
estimate potential market values, websites such as marketsearch.com and
reportlinker.command databases such as Thomson Innovation, Dianeconsulting,
Avention/onesource and business-insight.com can be used. When technology licensing is
the preferred option for commercialization sources such as the International Public
Relations Association (IPRA), Edgar (upwork.com), royaltysource.com, etc., can be used
to define royalty rates.2
It is unquestionable that the practice of valuation is likely to be more difficult for TTOs
compared to firms for at least two reasons that are at the heart of what is involved in
technology exchanges. First, TTOs must manage the different expectations of the
inventor and investor (which arise from asymmetric knowledge and information about
the technology), mediating which can be difficult. The TTO must keep the industrial
partner on board for further development and commercialisation of technology but as a
member of the university body they are also somehow speaking on behalf of the
inventor. Second, the focal invention may be at an early stage and commercialization
possibilities and the value of the technology in particular uses will likely not become clear
until there has been more investment and development. Early stage novel technologies
are likely to need more nurturing and more investment before transfer or
commercialization is possible and funds for these are usually available in very limited
quantities to the TTO.
The organisation of the TTO may also need to be considered in the extent to which these
two issues apply. When TTOs are organised as a centralised department, commercialising
technologies from several different technology departments it is likely that they will
behave similarly to technology brokers who manage a portfolio of technologies with more
general competences for managing technology. However, when TTOs are organised
around one broad technology area, then more in-depth knowledge is available about both
the technology and its possible uses. In this situation, a real options analysis where a
TTO evaluates the cost of incubation, the time horizon of returns and returns from
eventual sale against an outright sale of technology can be very useful.
Sections 2 and 3 of the report summarize the discussions on valuing novel technologies
that took place during the workshop organised by the JRC. Section 2 summarizes the
1 EPO-PATSTAT is the European Patent Office Patent Statistical Database; QPAT is a patent search system run
by Questel-Orbit; Thomson Delphion provides access to full text patent specifications. 2 WIPO/JRC presentation – Grenoble 19-20 October 2011.

4
(private sector) approaches presented to address the gap between the expectations of
the inventor and investor and Section 3 discusses European TTO practices related to
dealing with early stage technologies that were presented at the JRC workshop. Section 4
concludes with some implications for policy and practice.
The report also contains two brief reviews of the academic literature on patent value and
technology valuation. Annex 1 outlines the three methodologies used to identify the
value of patents to firms viz. market value approaches, patent renewal methodologies
and survey based inventor valuations. Although they can provide useful benchmarks of
value in particular technology classes, patent value approaches are ex post in nature,
whereas TTOs generally have to manage a portfolio of technologies and need ex ante
assessments of valuation, which are more difficult to establish. Annex 2 reviews the
standard approaches to valuation used by TTOs viz, the cost, market and income based
approaches. It is hoped that individual TTOs will find these annexes useful to identify the
most appropriate approach for their purpose.
5
2 Working with the innovator and working with the investor:
approach to valuation
How should TTOs and other innovation brokers select which, among the many inventions
in their portfolios, they should evaluate? There are two aspects to this question. First,
TTOs need more information from researchers about the technology business case rather
than myriad details about its novelty and the prior art. Second, and relatedly, novel
technologies are often early stage technologies so the real commercialization prospects
may be unknown. Therefore, it is not surprising that, despite representing the inventors’
interests, TTOs are often swayed by the buyer, who often makes the best case for actual
use of the technology. This underlines that it is possible to rigorously value a technology
only in the context of specific uses.
The problem of asymmetric information between buyer and seller on the true nature of
the technology and, especially, its value seems to be among the most frequent problems
encountered by TTOs, who are organised organized as technology brokers, and when the
final use of the technology is still unknown. Massimiliano Granieri,(MITO, Italy)
emphasized that assessment of a patent portfolio in terms of its exploitation is quite
different from evaluating a patent to define its value or price in an imminent transaction.
In particular, for TTOs with a large portfolio of inventions, selection of inventions for
rigorous valuation is very important, a point confirmed by Zane Smilga (Verhaerrt,
Netherlands). However, MITO and Verhaert outlined slightly different approaches to
tackling this issue.
Verhaert recognized that there is an inherent conflict between what the technology’s
owners can demonstrate and prove versus what the technology buyers require for their
business and are prepared to pay for. As technology brokers, they use a number of tools
to envisage, validate and prove potential value/technology. In particular, they explore
the value potential of the same technology in relation to different applications, solutions
and business scenarios, using a proprietary Quick to Evaluate Business Opportunity
software program. They undertake this value potential analysis at a “high level” for
multiple applications of a technology and select the cases with the highest potential value
for further exploration.
MITO uses a slightly different method based on a proprietary software algorithm.3 This
algorithm proceeds in three steps. First, it calculates the available IP portfolio for
valorization by deducting the IP already committed; IP that is co-owned, IP that is a
national priority and IP that is near to expiry. Second, it identifies potential portfolio
“slices” where value can be achieved based on multiple technology uses, geographical
coverage and the patent’s residual life. Third, it ranks the portfolio according to
achievable revenue. In this purely empirical exercise, which does not establish a market
value, as little as 15% of the portfolio can be judged to have value potential.
Ludo Pyis (AREOPA) presented a very sophisticated approach to valuing IP assets based
on a detailed inventory of the firm’s intellectual capital assets that could be protected and
used to deliver value and an income stream. AREOPA’s method regards both patents and
human capital and other intangibles as capable of creating value and multiple revenue
streams (e.g., based on income derived from patents and value derived from human
capital based consultancy). These revenue streams are estimated using the latest
accounting standards such as IAS38. AREOPA has developed and placed trade secrets on
77 econometric formulas that enable, based on the collection of evidence, identification
of present and future value for TTOs.
Even in cases where the end use of the technology is clear, as in the case of merger and
acquisition (M&A) transactions, Ian Brewer (Valuation Consulting), noted many caveats
3 Please see details of the algorithm in the presentation downloadable from:
https://ec.europa.eu/jrc/communities/sites/jrccties/files/2._granieri_brussels_2016.pdf
6
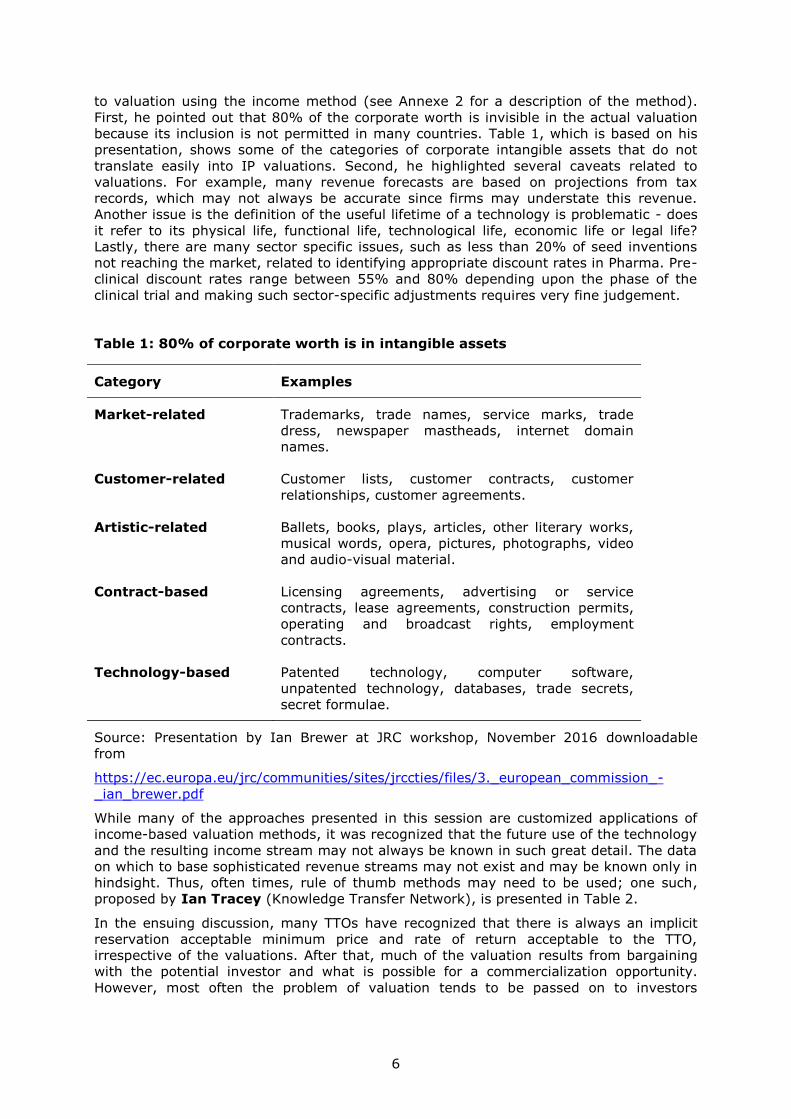
to valuation using the income method (see Annexe 2 for a description of the method).
First, he pointed out that 80% of the corporate worth is invisible in the actual valuation
because its inclusion is not permitted in many countries. Table 1, which is based on his
presentation, shows some of the categories of corporate intangible assets that do not
translate easily into IP valuations. Second, he highlighted several caveats related to
valuations. For example, many revenue forecasts are based on projections from tax
records, which may not always be accurate since firms may understate this revenue.
Another issue is the definition of the useful lifetime of a technology is problematic - does
it refer to its physical life, functional life, technological life, economic life or legal life?
Lastly, there are many sector specific issues, such as less than 20% of seed inventions
not reaching the market, related to identifying appropriate discount rates in Pharma. Pre-
clinical discount rates range between 55% and 80% depending upon the phase of the
clinical trial and making such sector-specific adjustments requires very fine judgement.
Table 1: 80% of corporate worth is in intangible assets
Category Examples
Market-related Trademarks, trade names, service marks, trade
dress, newspaper mastheads, internet domain
names.
Customer-related Customer lists, customer contracts, customer
relationships, customer agreements.
Artistic-related Ballets, books, plays, articles, other literary works,
musical words, opera, pictures, photographs, video
and audio-visual material.
Contract-based Licensing agreements, advertising or service
contracts, lease agreements, construction permits,
operating and broadcast rights, employment
contracts.
Technology-based Patented technology, computer software,
unpatented technology, databases, trade secrets,
secret formulae.
Source: Presentation by Ian Brewer at JRC workshop, November 2016 downloadable
from
https://ec.europa.eu/jrc/communities/sites/jrccties/files/3._european_commission_-
_ian_brewer.pdf
While many of the approaches presented in this session are customized applications of
income-based valuation methods, it was recognized that the future use of the technology
and the resulting income stream may not always be known in such great detail. The data
on which to base sophisticated revenue streams may not exist and may be known only in
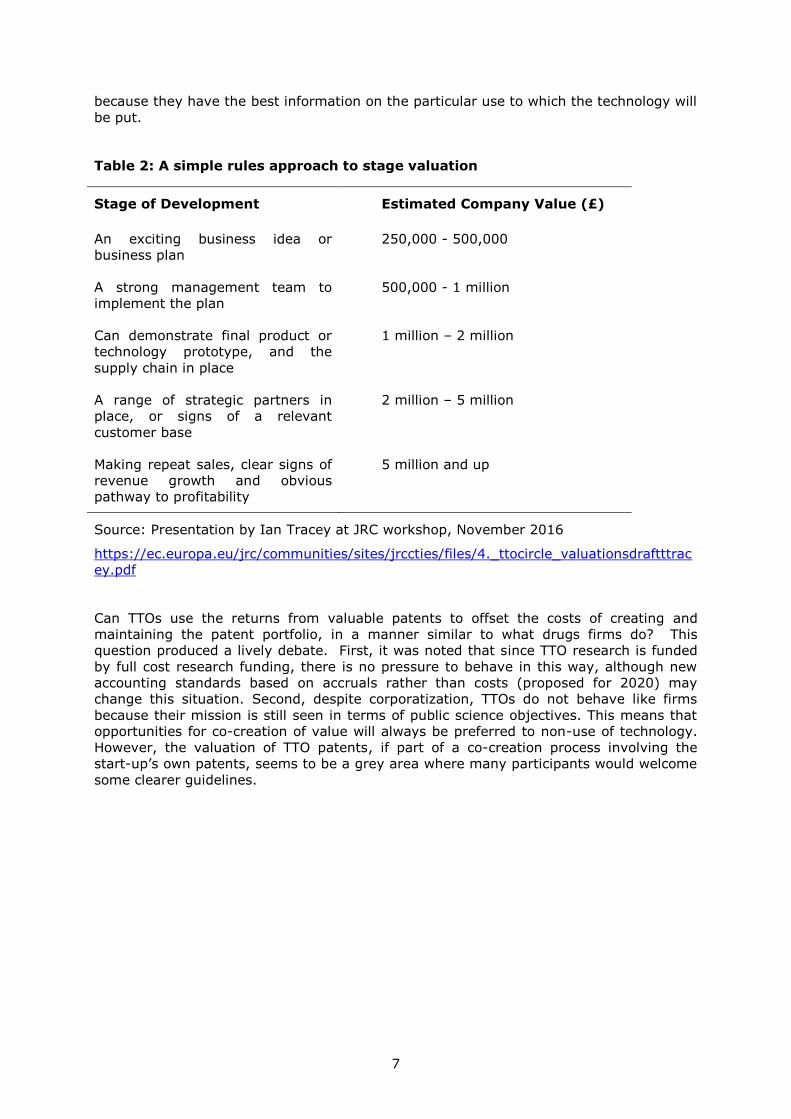
hindsight. Thus, often times, rule of thumb methods may need to be used; one such,
proposed by Ian Tracey (Knowledge Transfer Network), is presented in Table 2.
In the ensuing discussion, many TTOs have recognized that there is always an implicit
reservation acceptable minimum price and rate of return acceptable to the TTO,
irrespective of the valuations. After that, much of the valuation results from bargaining
with the potential investor and what is possible for a commercialization opportunity.
However, most often the problem of valuation tends to be passed on to investors
7
because they have the best information on the particular use to which the technology will
be put.
Table 2: A simple rules approach to stage valuation
Stage of Development Estimated Company Value (£)
An exciting business idea or
business plan
250,000 - 500,000
A strong management team to
implement the plan
500,000 - 1 million
Can demonstrate final product or
technology prototype, and the
supply chain in place
1 million – 2 million
A range of strategic partners in
place, or signs of a relevant
customer base
2 million – 5 million
Making repeat sales, clear signs of
revenue growth and obvious
pathway to profitability
5 million and up
Source: Presentation by Ian Tracey at JRC workshop, November 2016
https://ec.europa.eu/jrc/communities/sites/jrccties/files/4._ttocircle_valuationsdraftttrac
ey.pdf
Can TTOs use the returns from valuable patents to offset the costs of creating and
maintaining the patent portfolio, in a manner similar to what drugs firms do? This
question produced a lively debate. First, it was noted that since TTO research is funded
by full cost research funding, there is no pressure to behave in this way, although new
accounting standards based on accruals rather than costs (proposed for 2020) may
change this situation. Second, despite corporatization, TTOs do not behave like firms
because their mission is still seen in terms of public science objectives. This means that
opportunities for co-creation of value will always be preferred to non-use of technology.
However, the valuation of TTO patents, if part of a co-creation process involving the
start-up’s own patents, seems to be a grey area where many participants would welcome
some clearer guidelines.
8
3 From research to market: Experience of an IP valuation
among European TTOs
It is worth noting that even in market-based economies such as the UK, where
technology transfer via university licensing is quite well developed, patentable
technologies are a small part of the technology transfer activities of universities, and
universities produce many technologies that are not amenable to patenting (Athreye and
Rossi 2017). Siegel et al. (2007) argue that alternative non-patent modes of
commercialization, such as establishing and incubating spin-offs, are becoming more
attractive as modes for technology commercialization and technology transfer. Not all
intellectual capital is patentable and sometimes spin-offs are the best way to
commercialize a technology. In terms of the frameworks for valuation presented in Annex
2, the choice between incubating a technology rather than trying to license it
immediately is an example of real options theory applied to the valuation of early stage
technologies.
TTOs who are focussed on a particular technology area, often face the choice between
sale of early stage technology now or incubate the technology now and for a better
priced sale later. Five examples of best practice related to very early stage technologies
were presented in the second session of the workshop. Each provided interesting insights
into the types of dilemmas experienced by TTOs, and the prevailing managerial mind sets
in TTOs that influenced them to adopt particular commercialization strategies. These
examples were presented as case studies.
Victor Paulisen (TNO) discussed the case of a multiple use optomechatronics
technology with potential for application in various fields. This technology is now the
subject of 11 patents and involves a great deal of knowhow. TNO needed to establish an
infrastructure to develop this technology further, retaining the organization’s
independence to perform research and engage in innovation activities using the
technology and investigating relevant markets. TNO looked at various different sectors
where the technology might be used and identified five main markets and a number of
subsectors before defining the fields of use. A separate company, Nearfield, was set up to
commercialize the non–integrated circuit uses of the technology.
TNO entered into two agreements with Nearfield. At the research stage, it entered an IP
non-assert and a license agreement, which gave market access to the technology without
a royalty charge, and a cooperation agreement with Nearfield to develop the technology
further. It was agreed that, in the production phase, a royalty payment and a license
agreement would be applied with an exclusive license for patent and non-exclusive
agreement for knowhow. Payment related to the cooperation agreement was in the form
of shares in Nearfield. This reflected the TTO’s perception that this agreement needed to
favour the investor as, otherwise, the product development would not continue.
Tony Prezeau (CEA) referred to two ways that CEA commercialized its technology:
Technology push and market pull. The technology push model implies the existence of
promising technologies, a motivated entrepreneur, but no identification of potential
industry partners. Thus, technology push is greater than market pull. In the market pull
model, an experienced entrepreneur with good market vision sees a diversified and
state-of-the-art technology portfolio to support his ideas. An industry partnership was
established with CEA. Although CEA is involved in eight or nine start-ups a year, the
industry partnership model is more popular due mainly to faster return on investment.
CEA engages in decision modelling to provide start-up support and predict whether a
technology portfolio is better transferred through a partnership or the creation of a new
business based on the techno/market fit. However, the presenter warned that
simulations present only a partial picture; not everything can be rationalized and,
especially, human factors. He presented two examples – one, Movea, a company set up
in 2007 that owns over 500 patents involving motion caption sensors and intelligence.
Movea went through a long incubation period because of the difficulty of identifying a
good business model. Finally, Movea was sold to InvenSense in 2014 for $50million.
9
Overall, the investment was profitable, but for several years CEA was unsure of the value
of its patent portfolio related to motion capture sensors and intelligence despite market
studies suggesting their potential as consumer goods. Another CEA start-up, Wavelens,
was championed by an entrepreneur who believed strongly in the technology but found it
difficult to obtain venture capital funding or other types of funding. CEA invested in the
development of a proof of concept for the technology, which resulted in interest being
shown by many firms, one of which eventually bought the company and the IP and
launched a partnership project with Leti, (CEA Tech’s parent company).
In CEA’s experience, large US and EU companies are interested in packaged IP, an
already existing business model and proof of concept rather than the actual technology.
It is more difficult to attract investors based on only the technology. The existence of
concrete IP is fundamental to a successful start-up. The financial aspects of technology
transfer are complex because pay-offs require industry partnerships, which may not exist
at the time that the public investment in the technology is being made and costs are
being incurred. It is impossible to reduce everything to an equation without subjective
elements, such as intuition, intruding into the decision regarding commercialization.
Aude de Clercq (ESA) noted that the aim of the ESA technology transfer programme for
non-space application is to promote competitiveness in the space industry and to develop
the technology. Its approach to commercialization is based on the dissemination of
knowledge. It supports start-up companies and has a portfolio of 400 patents, in various
fields. ESA faced some difficulties in 2014 when changes were introduced to portfolio
management which was accompanied by budgetary issues. ESA used consultants to help
manage these problems.
They proposed a methodology to create a score-card based on four criteria: Technology
(maturity, technology royalty and licensing, industrial feasibility, complete or incomplete
technology); IP (patent strength, competitive patents, relevance of protection); level of
competitiveness (technology in the market, competition, control of different assets);
market (sectors of application, market needs, value added, time to market). Based on
these criteria the consultants suggested a dissemination strategy, but did not spend time
on valuation for licensing since the main objective aim was to diffuse the technology and
cover the costs of the research. ESA values the fact that its technology portfolio is being
used. It tries to support start-up companies. Since 2014, ESA has been conducting a
process of capitalizing its patents, but this effort is still in its early stages. They have
encountered problems such as lack of recording of patent invoices before 2014, the need
to separate out the costs of patents in development, the costs of patents granted, and
the costs of patent applications.
Kathleen De Belder and Katrien Meuwis (IMEC) presented an example of a TTO in
the electronics sector. IMEC has a variety of programmes. The electronics sector involves
a significant level of in-licensing which, in turn, involves technology transfer and patent
valuation as both the buyer and seller of technologies. As buyers of patents for in-
licensing within spin-off companies, IMEC evaluates patents based on several criteria
such as status, countries and scope. IMEC discovered that the price it was willing to pay
was often lower than what firms were asking. However, its experience of being a buyer
helped in the selling of patents. IMEC believes that selling patents without knowhow is
difficult since it is important to look at all the risks involved (history, buyer’s image,
usage, age, value, etc.). Much effort is needed to conduct due diligence and detect
infringements (call-back research and consultants are expensive). In the context of
pricing, IMEC consults industry standards, foreign markets and citations. IMEC also
related the case of a patent sale, something the other TTOs did not mention.
Eva Vaquero (CIEMAT) represented a different type of TTO. CIEMAT is the second
largest research body in Spain and operates in 12 thematic areas and 47 different
research lines. Currently, it manages 439 research projects. Its challenge is to organize
knowhow encompassed by the organization in order to make it available to industry
partners. Spanish law recognizes three types of intangible resources: IPR, industrial
property (patents) and other property types (technical services, capabilities). It is not
10
possible to provide strong protection for all these intangibles so CIEMAT has developed a
proprietary software system to manage these intangible resources, and a database
containing information on them. The database is external-facing and allows firms to
search for and generate technology transfer contracts. Development of similar systems
might be useful for other large multi-technology TTOs.
An outstanding feature of the presentations was the universally shared belief that
commercialization of university knowledge requires support from industrial partners.
However, the mode of commercialization chosen would seem to depend on the time
horizon within which returns are expected. Short times to commercialization could favour
patents and licensing, but longer time horizons and the availability of capital (often
involving TTO investments) may favour incubation of start-ups to realize the full potential
of the technology. In general start-ups were considered a superior route to the
commercialization of university technology.
It was apparent, also, that TTOs’ core missions and objectives differ. Some TTOs, such as
ESA, saw their core mission as being to diffuse the technology as widely as possible,
consistent with a public science mission. Others were under pressure from universities
and government to generate revenue to support their research activities. Almost all of
the TTOs represented felt the need for greater clarity about the public science role of
TTOs, which was frequently seen as inconsistent with the objective of generating revenue
from research.
11
4 Summary and implications
Asking about the value of novel and early stage technology is akin to asking how long is
a piece of string? The value of technology differs depending on how it is commercialized
and for how long it can be developed. The benefits of technology to society and industry
flow from the commercialization effort, to which valuation contributes. This report has
reviewed several current practices in valuing patentable technologies. It has also
highlighted the fact that the nature of problems faced are likely to be related to the
overall organisation of university/RTO TTOs, with large centralised TTOs being more
similar in their organisation and management to technology broker firms while
decentralised technology area specific TTOs may not face the same kinds of issues.
Indeed, the presentations suggested the problem confronting technology area focussed
TTOs is on the best mode of commercialisation while the problem confronting technology
brokers typically is the choice of which technology to select for commercialisation.
The methods used by private firms to value their technology are of limited use to TTOs
because, in their role of broker between the inventor and the industry, they need to
evaluate the technology before it can be offered for sale. However, the range of value
methods presented could act as useful benchmarks for such TTOs. We also reviewed
existing methods of valuation available to TTOs, but more detailed analysis which can
highlight the match between technology and the method of valuation might be something
that the JRC could consider commissioning in the future. More analysis would shed light
on the appropriateness of certain methods of valuation for particular technology
compared with others, and provide suitable benchmarks for early stage valuation of
different technologies.
The uncertainty related to valuation for both types of TTOs could be mitigated by such
methods as compiling a database of valuations by technology class, to which TTO
members could refer in their negotiations with industry partners. These data might also
allow more sophisticated real options analysis to identify the best means of
commercialization through spin-off activity with incubation or patenting and outright sale
of the technology. Currently, this choice depends crucially on whether or not a
technology is patentable but a serious use of real options could demonstrate more viable
options.
Lastly, policy bodies need to take account of the discomfort felt by TTOs at the
compromising of their public science role, which has long term social benefits that far
exceed the profits made by universities. There also needs to be more debate about the
funding of public R&D and TTOs might find it useful to try to measure not only the private
returns from technology but also the social returns on their technology investments.
Private rates of return include the costs borne by the TTO (or university) and the benefits
that flow to the TTO. Social rates of return would also include the costs and benefits to
the rest of the economy (particularly taxpayers and industry partners that co-invest in
the technology).
All these suggestions will strengthen the evidence base of policy and managerial action
directed to the commercialisation of publicly funded research.

12
List of tables
Table 1: 80% of corporate worth is in intangible assets ............................................. 6
Table 2: A simple rules approach to stage valuation .................................................. 7
Table 3: Estimated patent values from patent renewal studies ..................................18
13
List of abbreviations
DCF discounted cash flow
IP Intellectual Property
IPRs Intellectual Property Rights
IPRA International Public Relations Association
JRC Joint Research Council
M&A Merger and Acquisition
TTO Technology Transfer Office
R&D Research and Development
rNPV risk adjusted net present value
WIPO World Intellectual Property Organization
14
Annexes
Annex 1. Review of the academic literature on the value of patents for firms
In a wide-ranging review of the literature on patent value, Arora, Athreye and Huang
(2009) identify three main approaches used by firms to estimate the value of patents to
firms: The market value approach; the patent renewal approach; and, the inventor
survey approach.4 The market value approach uses stock market values and the
investor’s implied evaluation of the firm’s tangible and intangible capital stock (which
includes patent stock). The patent renewal approach analyses patent renewal records
and the costs of patenting and renewing, in order to assess the distribution of patent
revenue from the perspective of the patent holder. Although what is measured using this
method is different from the market value approach, we expect the measures to be
related. A valuable patent enhances a firm’s profitability which, in turn, means that a
stock market investor will value the patent-holding firm higher than some other firm. In
a perfectly competitive market it should be possible to derive one measure of patent
value from another.
Unlike, the market value and patent renewal approaches, which are objective evaluations
in the sense that they use stock market and patent renewal data to infer the returns to
the firm from patenting, the inventor survey approach is very different: It proposes a
subjective evaluation (by the inventor) of the value of his/her invention. The subjective
approach is prone to biases and over-estimation; Arora, Athreye and Huang (2009) found
that inventor survey approaches produced the highest patent value estimates. In what
follows, we examine each of these three approaches in turn.
The market value approach
In the long run, in a competitive market, a firm’s market value should be directly
proportional to the costs of replacement of its assets. In practice, tangible assets are the
easiest to measure. Patents add to the firm’s intellectual capital and have the capacity to
generate future income. Firms in position of such intellectual capital are able to earn
higher rates of return for the same physical capital and, therefore, will be preferred by
stock market investors. Such firms will exhibit stock market values that are
systematically ‘in excess’ of the replacement/book value of their tangible assets. This is
the reasoning that informs the market value approach. Estimates of patent values are
obtained by regressing the firm’s market value per unit of capital (as observed by stock
market investors) on its patent stock and adding this to the stock of physical capital, to
obtain the elasticity of market value with respect to patent stock.
Griliches (1981) first applied this approach to an analysis of the data related to 157 US
listed companies during the period 1968–1974, arguing that a successful patent was
worth around $200,000 ($382,960 in 2005 values). Pakes (1985), analysing data on 120
US public firms for the period 1968-1975, find that a 1% increase in the number of
patents, on average, represents only a 0.044% increase in the firm’s market value, while
each additional patent is associated with an increase in the firm's market value of
$810,000 (equivalent to $3,041,148 in 2017). Cockburn and Griliches (1988) analyse
cross-sectional data for 772 US manufacturing firms and report the average value of a
patent in 1980 at around $400,000 (equivalent to $837,703 in 2017) and that this was
significantly higher for industries where the effectiveness of patents (a variable to
measure appropriability conditions) was two standard deviations higher than the
average.
Methodologically, most studies in this tradition follow Griliches (1981) and use Tobin’s Q
as the dependent variable. Tobin’s Q is defined as the firm’s current market value divided
by the replacement cost of its physical (tangible) assets. The explanatory variables used
usually include R&D investment stock divided by tangible assets, patent stock divided by
tangible assets and R&D investment stock. Most findings are reported as the percentage
increase in market value associated with one additional patent application or one
4 This section draws heavily on Arora, Athreye and Huang’s (2009) unpublished review.
15
additional patent citation. A few studies provide estimates of monetary values based, in
most cases, on average industry parameters.
Although market value studies controlled traditionally for R&D stock, an important
improvement during the 1990s was the introduction of measures to control for innovation
quality, which can be an important omitted variable giving rise to large estimates for
patent value. Trajtenberg (1990) and Hall et al. (2005) pioneered the use of patent
citations as an instrument to measure the quality of innovation. Trajtenberg (1990)
collected data on the value of and total gains from innovation in the case of tomography
scanners, and the associated patents and citations to these technology patents. He found
that patent counts weighted by citation rather than simple patent counts were
significantly correlated with the value of innovation in that case. Hall et al. (2005), based
on 1976-1995 data for US public firms, argue that, on average, one additional citation to
patent increased the firm's market value by 3%. However, the returns to additional
citations are skewed. Hall et al.’s analysis shows that receiving twice the median number
of citations can increase Tobin’s Q by about 35%, while receiving three times the median
number of citations can increase the market value premium to 50%.
Market value studies show that the value of patents varies by technology sector. Lanjouw
and Schankerman (2004), in the context of the US, use claims, citations and family size
as indicators to construct a patent quality index for 1975-1993 patents. They found that,
for a US public firm, an increase in the patent quality index distribution from the 50th to
75th percentile was associated with increased market value of 9.4% for drugs, 7.7% for
health products, 2.5% for electronics and 1.3% for mechanical. The study also found that
the 16% increase in citations in Hall et al.’s (2005) study was due to changes in
innovation quality and that the remaining 84% reflected an increase in the "propensity to
cite", which might be caused by computerization in patent offices. Measurement errors
such as this will typically impose a downward bias on the estimated returns from
patenting.
In sum, not all studies that adopt market value approach report monetary values for
patents, but based on the estimates in those that do, the maximal estimate of the value
(in 2005) of an additional patent is $13,244,914 (Connolly and Hirschey, 1988) and the
minimal is $382,960 (Griliches, 1981).
The patent renewal approach
Another approach to estimating the value of patents assumes that patent owners aim to
maximize the private value of their patents, which accrues over a number of years. The
patent owner’s objective is to maximize the discounted value of the returns from a patent
minus the cost of the patenting process. If the discounted value of the return is greater
than the cost of the renewal fee, the patent owner will choose to renew the patent.
Based on these micro foundations, several studies use the proportion of patents renewed
every year and the cost of renewal, to estimate the distribution of the initial returns and
the decay rate of the returns.
Patent renewal studies vary in what they include in their models as constraints to the
patent renewal decision. Shankerman and Pakes (1986), Pakes (1986), Pakes and
Simpson (1989), Lanjouw (1998), Baudry and Dumont (2006) and Bessen (2008) model
only the renewal decision. Putnam (1996) and Deng (2007) include the patent
application and the renewal decision together. However, their models do not differ
fundamentally from the earlier model proposed by Shankerman and Pakes (1986).
Putnam and Dent include the cost of application as a constant variable in their
application-renewal model, while adopting the rule and mechanism of the renewal
decision in Shankerman and Pakes (1986). The rule is that the patent will be renewed
only if the discounted present value of the return from the renewed patent is greater
than the renewal fee. The mechanism in Putnam (1996) and Deng (2007) is that the
value of patent right is allowed to decay deterministically.
16
The studies by Pakes (1986), Pakes and Simpson (1989) Lanjouw (1998) and Baudry
and Dumont (2006) relax the assumption that the returns to patent rights decay
deterministically. They allow for a stochastic return, uncertainty and learning in the
renewal decision; additionally, Lanjouw (1998) allows for litigation. The patent value is
split between the value of the current year’s return from patent protection and the value
of the option to renew the following year should the patentee desire to do this. If the
value of the current year’s return is less than the renewal fee, but the value of the option
to renew the next year is sufficient to allow the patentee to recover the loss, the
patentee will renew the patent. In a patent renewal model with a deterministic decay
rate, the patentee will choose not to renew.
Pakes (1986), Pakes and Simpson (1989) and Lanjouw (1998) also use dynamic
programming to estimate the length of time required to learn about patent value, finding
that the learning process is not overly lengthy. In a period of some 5–6 years, most
patentees discover the value of the patent rights. The major contribution made by
stochastic return models of decay is the finding that, because learning is concentrated in
the early period of patent rights, the uncertainty surrounding patent value usually
disappears after a period of 5–6 years. With the exception of Bessen (2008), none of the
studies link patent data and firm-level data. Baudry and Dumont (2006) use a method
similar to that proposed in Pakes (1986), but apply a more generalized stochastic process
(binomial tree) that is standard in the finance literature, to evaluate the value of the
option to renew the patent in the next year.
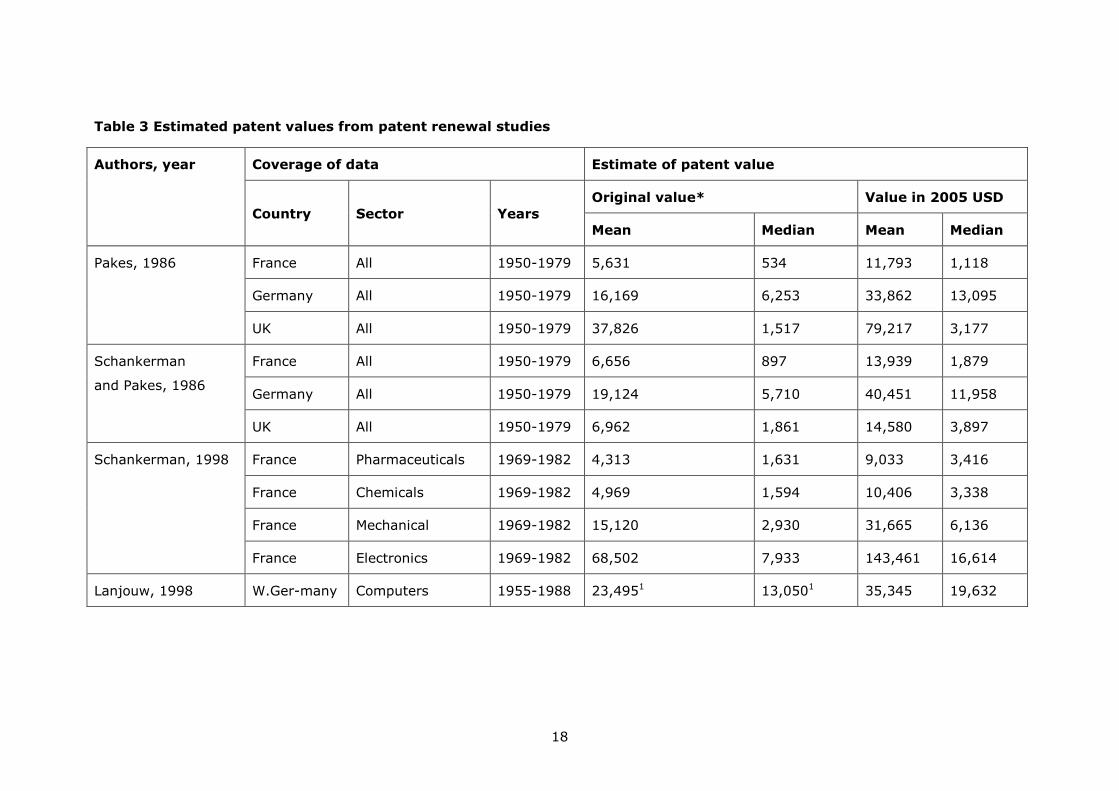
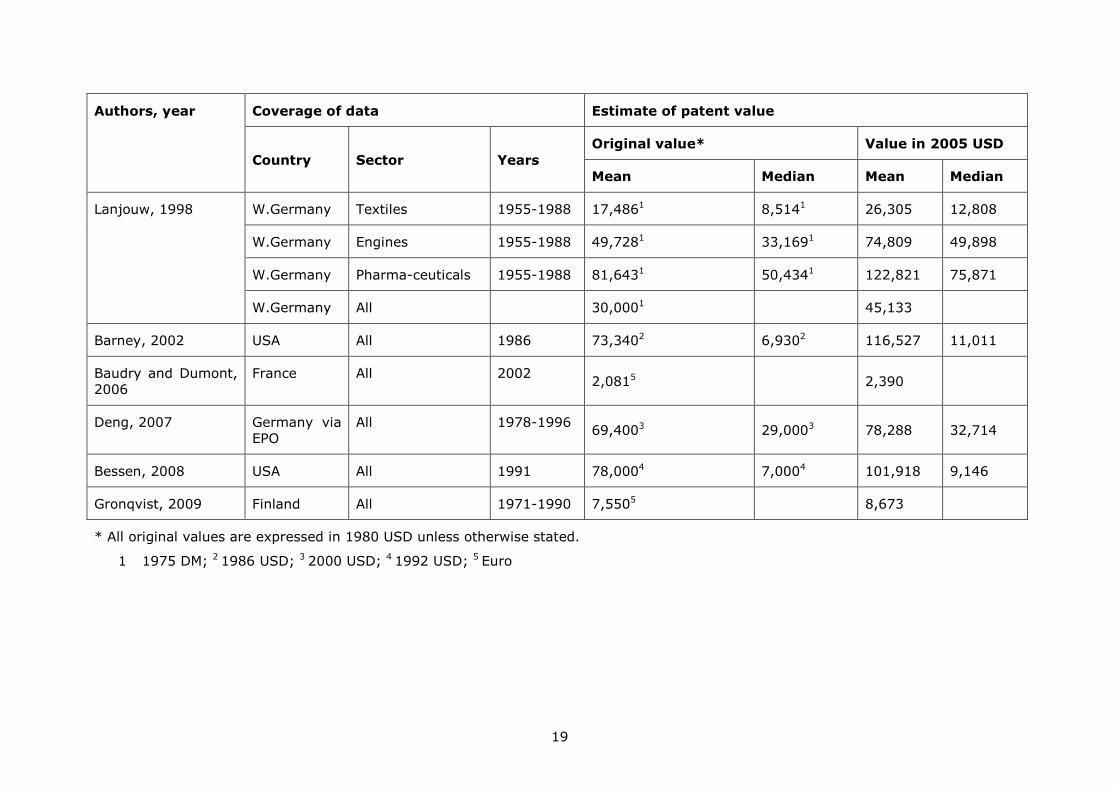
Table 3 summarizes the findings from a number of studies of patent value. The higher
values of means relative to medians suggest a high level of positive skew in the data. In
Table 3, the maximal estimate of the mean value of a patent is $116,527 (Barney, 2002)
and the minimal estimate is $2,390 (Baudry and Dumont, 2006). There are differences,
also, in the returns to patenting across broad technology sectors with pharmaceuticals
earning the highest returns.
The means and medians of the estimates reported in Table 3 are thousands or tens of
thousands of dollars, which is considerably lower than estimates using either the market
value approach or the inventor survey approach (see Section 2.3). This is in line with our
earlier discussion that the value of patent rights (which is what renewal studies measure)
is likely to be lower than the value of patent protection.
Table 3 shows, also, that patent renewal studies (similar to the market value studies
discussed earlier) demonstrate that patent returns vary by sector although this may be
conditioned by national technological specializations. Thus, Lanjouw (1998), in a study of
West German patents, finds that pharmaceutical patents earn the highest returns
(median value $19,632), while Schankerman (1998) in a study of French patents and in
a similar time frame to the Lanjouw study, finds pharmaceutical patents to have the
lowest value (median value $3416).
Another significant contribution to this stream of literature is Bessen (2008) who, using
patents matched to firm level variables, adds to the model controls for patent quality
(e.g., forward citation and litigation), R&D expenditure and the assignee’s number of
employees. On this basis, Bessen (2008) is able to show that large firms have higher
value patent than small firms, and that the number of lawsuits involving a patent is a
better proxy for patent quality than forward citations to the patent.
The patent renewal approach is powerful because it uses observed behaviour. However,
there are two principal methodological issues related to using this approach. First, in
assessing the returns to patent protection, knowing the value of the median patent is
insufficient or even misleading; the mean value is arguably more important.5 Estimating
mean values requires assumption about the nature of the distribution and renewal
studies typically assume log-normality. This assumption of log normality has not been
5 Ultimately, patent renewal studies focus on the most valuable patents since these are always likely to be
renewed to their full term. Therefore, this approach can provide only a lower bound to the value of the firm’s patent portfolio.
17
adequately tested in patent renewal studies. Silverberg and Verspagen (2007) apply
extreme value statistics to citation and value measures of patent significance and find
that while, overall, the distributions appeared to resemble a lognormal, they tend to have
fat tails.
Second, and related to the first issue, the approach assumes that each renewal decision
for each patent is taken independently of renewal decisions related to other patents.
However, we know that a commercial product or process, typically, is covered by several
patents and, at the time of filing, the firm does not know which will be more valuable.
Over time, the more useful (valuable) patents become known to the firm and are
renewed, while those that are less valuable are not renewed. In other words, a
substantial fraction of patents are filed as options. As information is revealed, the
worthless options are discarded and the worthwhile options are preserved. Moreover, it
could be that, in the case of very valuable inventions, many patents are filed, most of
which eventually are discarded. By not considering this interdependence explicitly, patent
renewal studies may present misleadingly low values for patent protection.
Finally, this approach ignores other sources of returns from patent protection such as the
ability to deter rivals.
The inventor survey approach
In contrast to the first two objective approaches, estimations of the market value of
patents can be based on the subjective estimates of inventors at the date of invention.
For example, in the PatVal-EU survey of EPO patent inventors in France, Germany, Italy,
Netherlands, Spain and the UK (Giuri et al., 2007), inventors were asked to give their
best estimates of the minimum price that the patent owner - whether a firm, some other
organization or the inventor would have put on the patent rights on the day that the
patent was granted. The estimated mean of the resulting patent value distribution is
greater than €3 million ($3,831,611) and the median is around 13% of the mean
($510,882 ) (Gambardella et al., 2008).
Harhoff et al. (2003) analyse the 10,780 German patent applications filed in 1977, using
a model similar to an ordered probit. The upper bound of the value of patent rights not
renewed to full term is estimated at $50,807. This value is higher than the sum of the
patent renewal fees and the cost of patent attorneys, estimated by the authors to be
about $33,763.6 Reitzig (2004a) analyses the data from an EPO survey conducted in
1994, on 612 patents from five different industries. He finds that patent protected
inventions, on average, are worth $2.37 million to their owners.7 Giummo (2010)
analyses the records of private corporations on the compensation paid to employees for
their inventions, which is a requirement of the German Employee Invention Act. The
mean cumulative value of the sample patents is approximately $287,094.8
6 Original estimates were in DM and the value of the upper bound was estimated to be DM45,144 while the sum
of patent renewal fees and cost of attorneys was estimated to be DM 30,000. 7 Original estimates were in Euros and patented protected inventions were estimated to be worth €2.04m. 8 The original estimates were reported as DM283,268 (1977 value).
18
Table 3 Estimated patent values from patent renewal studies
Authors, year Coverage of data Estimate of patent value
Country Sector Years
Original value* Value in 2005 USD
Mean Median Mean Median
Pakes, 1986 France All 1950-1979 5,631 534 11,793 1,118
Germany All 1950-1979 16,169 6,253 33,862 13,095
UK All 1950-1979 37,826 1,517 79,217 3,177
Schankerman
and Pakes, 1986
France All 1950-1979 6,656 897 13,939 1,879
Germany All 1950-1979 19,124 5,710 40,451 11,958
UK All 1950-1979 6,962 1,861 14,580 3,897
Schankerman, 1998 France Pharmaceuticals 1969-1982 4,313 1,631 9,033 3,416
France Chemicals 1969-1982 4,969 1,594 10,406 3,338
France Mechanical 1969-1982 15,120 2,930 31,665 6,136
France Electronics 1969-1982 68,502 7,933 143,461 16,614
Lanjouw, 1998 W.Ger-many Computers 1955-1988 23,4951 13,0501 35,345 19,632
19
Authors, year Coverage of data Estimate of patent value
Country Sector Years
Original value* Value in 2005 USD
Mean Median Mean Median
Lanjouw, 1998 W.Germany Textiles 1955-1988 17,4861 8,5141 26,305 12,808
W.Germany Engines 1955-1988 49,7281 33,1691 74,809 49,898
W.Germany Pharma-ceuticals 1955-1988 81,6431 50,4341 122,821 75,871
W.Germany All 30,0001 45,133
Barney, 2002 USA All 1986 73,3402 6,9302 116,527 11,011
Baudry and Dumont,
2006
France All 2002 2,0815 2,390
Deng, 2007 Germany via
EPO
All 1978-1996 69,4003 29,0003 78,288 32,714
Bessen, 2008 USA All 1991 78,0004 7,0004 101,918 9,146
Gronqvist, 2009 Finland All 1971-1990 7,5505 8,673
* All original values are expressed in 1980 USD unless otherwise stated.
1 1975 DM; 2 1986 USD; 3 2000 USD; 4 1992 USD; 5 Euro

21
The maximal estimate of the mean value of a patent in the studies cited above is
$3,831,611 (Gambardella et al., 2008) and the minimal estimate is $50,807 (Harhoff et
al., 2003). An important contribution of the PatVal and other inventor surveys is that
they focus on patents applied for rather than patents granted. Thus, the PatVal approach
eliminates biases that can creep into patent value estimates obtained using older
approaches, which examine patents already granted. Another important contribution
(alluded to earlier) is that PatVal documents the extent to which patents are used for
blocking (social welfare decreasing) and licensing (social welfare enhancing). However,
this comes at a cost. In being subjective, PatVal leaves room for other kinds of biases in
the valuation estimation, for example, inventors are likely to overestimate the
importance of their work, and an inventor’s valuation of his or her patent may diverge
significantly from the firm’s valuation.
Bessen (2009) offers some explanations for the discrepancies (in the range of hundreds
of thousands of dollars) among estimates based on the market value approach and the
higher estimates in the inventor survey approaches, particularly PatVal. He argues as
follows. First, EPO patents are likely to be several times more valuable than the
corresponding US patents because the EPO imposes stricter standards and inventors
obtain fewer EPO patents per invention. Second, inventors’ estimates relate to the value
of the invention rather than the value of patent rents, which are estimated by the market
value approach. The value of the invention, according to Bessen, includes the value of
the patent rents plus the rents the firm earns from its lead time advantage, learning-by-
doing, etc. Thus, the value that the firm puts on the invention is likely to be greater than
the value of patent rents. Third, Bessen argues that the survey responses might be
inflated in the case that there are multiple patents on a single invention. Selling just one
of these patents to a competitor may prevent the original firm from using the invention
and, thus, the reservation value might reflect the value of all the patents covering the
invention.
22
Annex 2. Technology valuation methods commonly used in Technology Transfer
Offices
The methods used to value the patents held by a firm are of limited use to TTOs.
Although the values of patents for particular technologies can be useful benchmarks, the
TTO office needs an ex ante valuation of the technology. Approaches to assessing the
value of patents, such as those outlined in Section 2, consider patents and technologies
in use in particular goods markets. However, a TTO may not always be able to assess in
which market the technology will be used most profitably. Indeed, the purpose of
technology transfer arrangements is often to allow firms to determine the best use of the
technology. Patents, by conferring an ownership right to a piece of technology enable
such transfer.
Once a technology is deemed patentable, the task facing a TTO is to determine a
monetary valuation of the future licensing incomes that may be derived from the
product. As Pitkethly (1997) points out, in effect, this is an estimate of future licensing
incomes based on different economic scenarios. However, as Siegel et al. (2007)
suggest, since TTOs are an intermediary safeguarding university IP, there is also a desire
to maximize the returns from the IP portfolio for the university. Scientists’ evaluations of
their technology may not be accurate and may not match potential buyers’ evaluations of
that technology; TTOs can be caught in situations of asymmetric information, which
complicate the process of assessing value.
There are several methods for valuing IP, but scholars of patent valuation emphasize
three main technology valuation approaches, proposed by Parr and Smith (1994). These
are the cost-based, market-based and income-based approaches. Below, we review each
of these in turn.
Cost based approach to technology valuation
Cost based approaches seek to value the technology based on the costs incurred in
production (Carte, 2005). Costs refer to all direct costs incurred in generating the
technology, obtaining a patent and commercialization. The objective of this method is to
fully recover the total investment from the sales value of the patent. Monitoring costs is
straightforward and is a relatively simple method if the future uses of the technology are
unknown or if the invented technology is a radical innovation, allowing no market
comparisons.
Smith and Parr (1994, 2000) identify two variants of the cost method - reproduction cost
and replacement cost. The reproduction cost method assesses the costs from the
university’s perspective and asks what the buyer should pay to exactly replicate the
product. The replacement cost method assesses the cost from the point of view of the
buyer (usually a firm) and asks what the firm would have to pay in order to produce a
technology with comparable functionality. This is akin to an opportunity cost measure for
the firm buying the technology.
The reproduction and replacement estimates may not coincide, which can be a problem
for TTOs since cost based approaches may reflect the presence of asymmetric
information between scientist and buyer, rather than being an objective method to settle
any differences. Furthermore, the cost based approach takes no account of future income
streams that might be attributed to the technology. This may be acceptable in the case
of radical and early stage technologies, but not for mature technologies or technologies
that have substitutes.
Market based approaches
Market based approaches, pioneered by Stewart (2001), adopt an intellectual capital
model, which posits that the market value of a TTO reflects the total value of its tangible
and intangible assets. Thus, using this methodology, the difference between the book
value and market value represents the value of the patent. In this respect, the market
based approach is quite similar to the market value approaches reviewed in Section 2.1.
However, in the absence of projected/actual earnings, TTOs often asses the market value
23
of the technology based on comparative valuation of the focal technology and other
similar technologies being used by buyers.
Wu and Tseng (2006) show that using a market based approach usually results in two
values for the patent: A minimum value which is based on the cost of developing the
patent, and a sale value which is based on demand (number of buyers). In terms of
practicalities, Damodaran (2007) and Flignor and Orozco (2006) recommend that
comparative valuation should be conducted in two steps. First, screening commercial
transactions to identify similar businesses or assets being traded in the market; and,
second, conducting an adjustment in which the valuation parameters are defined by
estimates based on market data. In the screening stage, business analysts typically use
companies in the same industry or transactions of similar (technology) patents. Copeland
et al. (2005) suggest using an earnings-multiple approach to apportion the assets, while
Damodaran (2007) suggests adjusting for such factors as market growth.
The market based approach is data intensive and suitable for use in contexts where huge
amounts of data are available. It has been used to determine royalty rates based on
industry standards reflected in databases such as the Licensing Economics Review.
However, as Shane and Elgar (2004) note, in the case of research that generates radical
innovations, it is often very difficult to find similar technologies and variables to use for
comparison. Similarly, in the case of multipurpose technologies, the method can break
down or become computationally expensive.
Income based approaches
Income based approaches are more complex computationally, but share the common
premise that the value of the patented technologies should reflect their income earning
potential. There are four main methods: The discounted cash flow (DCF), risk adjusted
net present value (rNPV), NPV with Monte Carlo simulation, and real options.
Brearly and Myers (1998) note that DCF methods are used by managers to calculate
internal rates of return and payback times or life of asset such as bonds, securities and
buildings. The main difficulty related to DCF is finding an adequate rate of discount since
future income streams depend on many factors such as the overall functioning of the
economy. In practice, these problems can be overcome by the use of capital asset pricing
models and the cash flows of other companies with equivalent risks. Once a discount rate
is established, the investor compares the discounted rate of return with the internal rate
of return and funds those projects with a higher internal rate of return or one equal to
the discounted rate of return.
DCF methods underlie the calculation of NPV, which is defined by:
𝑁𝑃𝑉 = −𝐼 ± ∑ 𝐹𝐶𝑡𝑛
𝑡=1
(1 + 𝑘)𝑡
where I refers is the value of investment, FCt is present cash flow value, k is the discount
rate and t is the payback life of the technology. A positive NPV indicates a technology
that is economically viable, while a negative NPV indicates a technology that is not
economically viable. If NPV=0, I indicates that the investment in the technology is
recovered and the NPV method yields similar results to the cost method discussed
earlier. The payback life of the project t is an interesting variable since it is generally
based on the number of periods that a TTO manager considers reasonable to recover the
investment in the technology. It is likely that firms may have a shorter implicit t than
TTOs.
Technologies developed by universities are embryonic or in the early or intermediate
stage of development. Razgaitis (2009) identifies four types of risk that need to be
evaluated when valuing technologies. First, there are risks specific to the technology,
such as the stage of development, and risks associated to R&D activities, product
development and design for manufacture (prototyping) and the (rising) costs of raw
materials. Second, there are risks associated to the market such as forecasting market
demand, acceptance of the technology product, product lifecycle and purchasing power of
24
the target market. Third, there are IP related risks such as the scope of the protection
and the protection of trade secrets. Fourth, government policy and societal values can
make certain types of technologies infeasible. In recent years many applications of stem
cell technologies, such as cloning, or use of genetically modified seed, have encountered
ethical objections in Europe.
The rNPV takes a static view of these risks and assigns both a risk rate and a discount
rate to NPV calculations. These two rates can vary according to the stage of development
of the technology; the pharmaceutical industry tends to favour this valuation method
since prior research shows that the probable success of a drug differs at different stages
in the drug’s technological development (e.g., discovery stages have the highest risk,
while the risks can be considerably reduced at the clinical trials stage). In general, the
rNPV method involves five stages of calculation. First, the cash flow in the technology
development phase is calculated; second, the cash flow for the market phase is
calculated; third, the discount rate is applied to the cash flow to obtain the DCF; fourth,
there is an adjustment made for the risk (probability of success) involved in each stage;
five, the risk adjusted DCF are summed. In terms of the NPV equation, the rNPV can be
written as (note that p(t) refers to the probability of success at any stage):
𝑟𝑁𝑃𝑉 = −𝐼 ± ∑ 𝑝(𝑡)𝐹𝐶(𝑡)
𝑛
𝑡=1
(1 + 𝑘)𝑡
rNPV methods can be made more sophisticated by the incorporation of probability
distributions instead of point probabilities. Thus, one could use a binomial distribution of
p(t) modelling the probability of success or failure at every stage, or employ Monte Carlo
methods which allow the inclusion of any probability distribution to model the risk profile.
Given the irreversibility of technological investments, uncertainties inherent in the
development and commercialization of early stage and novel technologies, and the
possibility of postponement of these investments, a more promising development is real
options theory for evaluation. When DCFs are modest or minimal, TTOs often have to
rely on some form of subjective judgement in order to decide whether or not to pursue
commercialization. Van Putten and Macmillan (2004) explain that options provide the
right, but not the obligation to invest in a project. Therefore, their value is driven by the
possibility of achieving a large upside gain combined with the fact that TTOs can usually
abandon a project before the investment becomes too high, which limits the downside.
Therefore, the value of an option must increase as the uncertainty (and, thus, the
potential upside) surrounding the underlying asset increases, whether the asset is
financial or “real.”
There are several examples of real options valuations from the pharmaceutical sector,
where agents keen to acquire a technology have a number of options. They can decide
on investment in an early stage technology in the expectation of a large gain in the
future but, at a lower premium, they may choose to acquire a more developed version of
the technology, at a higher price but with lower risk. Similarly, university TTOs can use
real options to decide whether it is better to choose commercialization now or to
postpone licensing in order to develop the technology further for particular applications.
Section 5 shows that in several TTOs, this form of thinking implicitly underlies the choice
between commercialization through patenting or incubation.
25
References
Arora, A., Athreye, S. and Huang, C. ‘Returns to patenting: a literature review’.
Unpublished Mimeo, 2009.
Athreye, S., and Rossi, F. ‘Leveraging Public Research for Innovation and Growth:
United Kingdom Country Study’, Unpublished Mimeo, 2017.
Baudry, M. and Dumont, B. ‘Patent renewals as options: improving the mechanism for
weeding out lousy patents’, Review of Industrial Organization, Vol. 28, No 1, 2006, pp.
41-62.
Bessen J. ‘The value of US patents by owner and patent characteristics’, Research Policy,
Vol. 37, No 5, 2008, pp. 932-945.
Bessen, J. ‘Estimates of patent rents from firm market value’, Research Policy, Vol. 38,
No 10, 2009, pp. 1604-1616.
Carte, N. ‘The maximum achievable profit method of patent valuation’, International
Journal of Innovation and Technology Management,2005, Volume 2(02), 135-151.
Cockburn, I. and Griliches, Z. ‘Industry effects and appropriability measures in the stock
market's valuation of R&D and patents’, The American Economic Review, Vol. 78, No 2,
1988, pp. 419-423.
Connolly, R.A. and Hirschey, M. ‘Market value and patents: a Bayesian approach’,
Economics Letters, Vol. 27, No 1, 1988, pp. 83-87.
Coombs, J.E. and Bierly, P.E. ‘Measuring technological capability and performance’, R&D
Management, Vol. 36, No 4, 2006, pp. 421-438.
Copeland, T.; Koller, T.; Wessels, D. ‘Valuation: Measuring and Managing the Value of
Companies’, 3rd Edition, 2005, New Jersey: John Wiley & Sons, Inc.
Damodaran, A. (2007), "Valuation Approaches and Metrics: A Survey of the Theory and
Evidence", Foundations and Trends® in Finance: Vol. 1: No. 8, pp 693-784.
Deng, Y. ‘Private value of European patents’, European Economic Review, Vol. 51, No 7,
2007, pp. 1785-1812.
Flignor,P. and Orozco, D. ‘ Intangible asset & intellectual property valuation: A
multidisciplinary perspective’ Ipthought. com, 2006, World Intellectual Property
Organisation, Geneva.
Gambardella, A., Harhoff, D. and Verspagen B. ‘The value of European patents’,
European Management Review, Vol. 5, No(2) 2008, pp. 69-84.
Giummo, J. ‘German employee inventors' compensation records: a window into the
returns to patented inventions’, Research Policy, Vol. 39, No 7,2010, pp. 969-984.
Giuri, P., Mariani, M., Brusoni, S., Crespi, G., Francoz, D., Gambardella, A., Garcia-
Fontes, W., Geuna, A., Gonzales, R., Harhoff, D., Hoisl, K., Le Bas, C., Luzzi, A.,
Magazzini, L., Nesta, L., Nomaler,O., Palomeras, N., Patel, P., Romanelli, M. and
Verspagen, B. ‘Inventors and invention processes in Europe: results from the PatVal-EU
survey’, Research Policy, Vol. 36, No 8, 2007, pp. 1107-1127.
Greenhalgh, C. and Longland, M. 2005. ‘Running to stand still? The value of R&D, patents
and trade marks in innovating manufacturing firms, International Journal of the
Economics of Business, 2005, vol. 12, issue 3, pages 307-328. Routledge
Griliches, Z. ‘Market value, R&D, and patents’, Economics Letters, Vol. 7, No 2, 1981, pp.
183-187.
Grönqvist, C. ‘The private value of patents by patent characteristics: evidence from
Finland’, The Journal of Technology Transfer, Vol. 34, No 2, 2009, pp. 159-168.
26
Hall, B.H., Jaffe, A. and Trajtenberg, M. ‘Market value and patent citations’, The RAND
Journal of Economics, Vol. 36, No 1, 2005, pp. 16-38.
Harhoff, D., Scherer, F.M. and Vopel, K. ‘Citations, family size, opposition and the value
of patent rights’, Research Policy, Vol. 32, No 8, 2003, pp. 1343-1363.
Lanjouw, J.O. ‘Patent protection in the shadow of infringement: simulation estimations of
patent value’, Review of Economic Studies, Vol. 65, No 4, 1998, pp. 671-710.
Lanjouw, J.O. and Schankerman, M. ‘Patent quality and research productivity: measuring
innovation with multiple indicators’, The Economic Journal, Vol. 114, No 495, 2004, pp.
441-465.
Pakes, A. ‘On patents, R&D, and the stock market rate of return’, The Journal of Political
Economy, Vol. 93, No 2, 1985, pp. 390-409.
Pakes, A. ‘Patents as options: some estimates of the value of holding European patent
stocks’, Econometrica, Vol. 54, No 4, 1986, pp. 755-784.
Pakes, A. and Simpson. M. ‘Patent renewal data’, Brookings Papers on Economic Activity.
Microeconomics, 1989, pp. 331-410.
Pitkethly, R. ‘The Valuation of Patents: A review of patent valuation methods
with consideration of option based methods and the potential for further research,
Judge Institute Working Paper WP 21/97, The Judge Institute of Management Studies,
Cambridge, 1997.
Putnam, J. ‘The value of international patent rights, unpublished PhD Dissertation,
Economics Department, Yale University, Yale, CT, 1996.
Razgaitis, R. ‘Valuation and Dealmaking of Technology-Based Intellectual Property:
Principles, Methods, and Tools’, 2009, Hoboken: John Wiley & Sons.
Reitzig, M. ‘The private values of 'thickets' and 'fences': towards an updated picture of
the use of patents across industries’, Economics of Innovation & New Technology, Vol.
13, No 5, 2004, pp. 457-476.
Schankerman, M. and Pakes, A., ‘Estimates of the value of patent rights in European
countries during the post-1950 period’, The Economic Journal, Vol. 96, No 384, 1986, pp.
1052-1076.
Shane, S. and Elgar, E. ‘Academic Entrepreneurship: University Spin-offs and Wealth
Creation’, 2004, New York: Edward Elgar Pub.
Silverberg, G. and Verspagen, B. ‘The size distribution of innovations revisited: an
application of extreme value statistics to citation and value measures of patent
significance’, Journal of Econometrics, 2007.
Parr, R.L.; Smith, G.V. ‘Quantitative Methods of Valuing Intellectual Property’,
in: M. Simensky, L. G. Bryer (Eds.), “The New Role of Intellectual Property in
Commercial Transactions”, Wiley, pp. 39–68, 1994 ,New York.
Siegel, D.S.,Veugelers, R., Wright, M. ‘ Technology transfer offices and commercialization
of university intellectual property: performance and policy implications’. Oxford Review
Of Economic Policy, Vol: 23, 2007,Pages: 640-660.
Smith, G.V., & Parr, R.L. ‘Valuation of intellectual property and intangible assets’ (Vol.
13), 2000, Wiley.
Stewart, T.A. ‘The wealth of knowledge: intellectual capital and the twenty-first century
organization’, 2001, New York: Doubleday.
Trajtenberg, M. ‘A penny for your quotes: patent citations and the value of innovations’,
The RAND Journal of Economics, Vol. 21, No 1, 1990, pp. 172-187.

27
Van Putten, A. B. and Macmillan, I.C. ‘Making real options work’ Harvard Business
Review 82(12) January 2005, pages 134-41.
Wu, M.C., & Tseng, C.Y. ‘Valuation of patent–a real options perspective’. Applied
Economics Letters,13(5), 2006, 313-318.

GETTING IN TOUCH WITH THE EU
In person
All over the European Union there are hundreds of Europe Direct information centres. You can find the address of the centre nearest you at: http://europea.eu/contact
On the phone or by email
Europe Direct is a service that answers your questions about the European Union. You can contact this service:
- by freephone: 00 800 6 7 8 9 10 11 (certain operators may charge for these calls),
- at the following standard number: +32 22999696, or
- by electronic mail via: http://europa.eu/contact
FINDING INFORMATION ABOUT THE EU
Online
Information about the European Union in all the official languages of the EU is available on the Europa website at: http://europa.eu
EU publications You can download or order free and priced EU publications from EU Bookshop at:
http://bookshop.europa.eu. Multiple copies of free publications may be obtained by contacting Europe
Direct or your local information centre (see http://europa.eu/contact).
KJ-N
A-2
8684-E
N-N
doi:10.2760/67528
ISBN 978-92-79-70522-9