Embed Size (px)
Citation preview
pharmacoepidemiology and drug safety 2007; 16: 1136–1140(www.interscience.wiley.com) DOI: 10.1002/pds.1459
Published online 17 August 2007 in Wiley InterScienceORIGINAL REPORT
Applying quantitative methods for detecting new drug safetysignals in pharmacovigilance national database
Gloria Shalviri1,2*, Kazem Mohammad1, Reza Majdzadeh1 and Kheirollah Gholami3
1School of Public Health and Institute of Public Health Research, Tehran University of Medical Sciences, Tehran, IslamicRepublic of Iran2Present Address: Iranian ADR Monitoring center, Ministry of Health, Fakhre Razi Ave, Enghlab Ave, Tehran 13145,Islamic Republic of Iran3School of Pharmacy, Tehran University of Medical Sciences, Tehran, Islamic Republic of Iran
SUMMARY
Objectives To applies three different methods of signal detection to the registered adverse events in Iranian Pharma-covigilance database over the period of 1998–2005.Methods All adverse drug reactions (ADRs) reported to Iranian Pharmacovigilance Center (IPC) from March 1998through January 2005, were used for the analysis. The data were analysed based on three different signal detection methodsincluding reporting odds ratios (RORs), information component (IC) and proportional reporting ratios (PRRs). The signalsdetected were categorised based on the number of reports per drug-adverse event combination, severity of the event andlabelled or unlabelled ADRs.Results During the study period, 6353 cases of ADR reports describing 11 130 reactions were received by IPC. The datasetinvolved 4975 drug-adverse event combinations. The count of drug-event combinations was 1, 2 and 3 or more for 3470, 726and 779 combinations, respectively. According to PRRs, there were 2838, 872 and 488 drug-event combinations known as asignal for the pairs with the reporting frequency of 1, 2 and 3 reports, respectively. The results of estimating RORs showedthat 2722, 862 and 481 drug-adverse event combinations were detected to be signal for the pairs with the reporting frequencyof 1, 2 and 3 reports, respectively, while measuring IC and IC-2SD detected 1120, 378 and 235 for the same reportingfrequencies. Diclofenac-induced paralysis and tramadol-induced severe reactions were the most important signals.Conclusion Applying quantitative signal detection methods to the database of national pharmacovigilance centres isnecessary to early detection of drug safety alerts. Copyright # 2007 John Wiley & Sons, Ltd.
key words— signal; adverse drug reaction; pharmacoepidemiology
Received 10 September 2006; Accepted 28 June 2007
INTRODUCTION
The principle of pharmacovigilance science is timelydetection of new and previously unknown adverse drugreactions (ADRs). Discovery of previously undetectedadverse effects of medicines has been defined as one of
* Correspondence to: G. Shalviri, Iranian ADR Monitoring Center,Ministry of Health, Fakhre Razi Ave, Enghlab Ave, Tehran 13145,Islamic Republic of Iran. E-mail: [email protected]
Copyright # 2007 John Wiley & Sons, Ltd.
the potential contributions of pharmacoepidemiol-ogy.1 The World Health Organization (WHO) definesa drug safety signal as ‘Reported information on apossible causal relationship between an adverse eventand a drug, the relationship being unknown orincompletely documented previously’.2 However,the concept of signal is also included in any newinformation from various sources, indicating apossible risk associated with a medicine, which isdifferent in quantity (more frequency) or quality (more
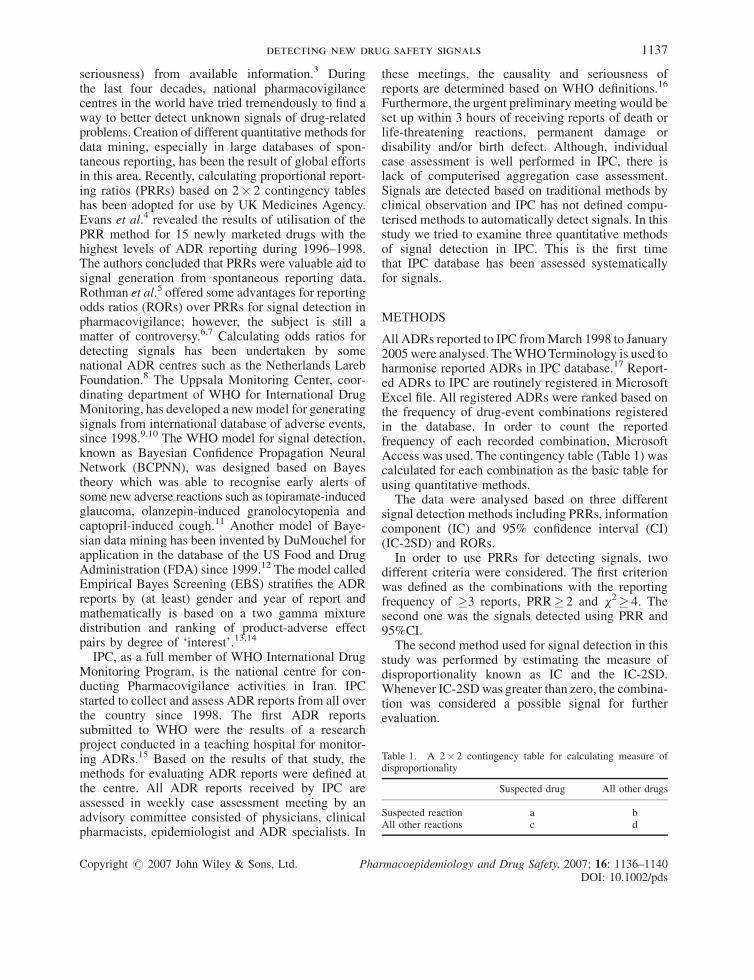
Table 1. A 2� 2 contingency table for calculating measure ofdisproportionality
Suspected drug All other drugs
Suspected reaction a bAll other reactions c d
detecting new drug safety signals 1137
seriousness) from available information.3 Duringthe last four decades, national pharmacovigilancecentres in the world have tried tremendously to find away to better detect unknown signals of drug-relatedproblems. Creation of different quantitative methods fordata mining, especially in large databases of spon-taneous reporting, has been the result of global effortsin this area. Recently, calculating proportional report-ing ratios (PRRs) based on 2� 2 contingency tableshas been adopted for use by UK Medicines Agency.Evans et al.4 revealed the results of utilisation of thePRR method for 15 newly marketed drugs with thehighest levels of ADR reporting during 1996–1998.The authors concluded that PRRs were valuable aid tosignal generation from spontaneous reporting data.Rothman et al.5 offered some advantages for reportingodds ratios (RORs) over PRRs for signal detection inpharmacovigilance; however, the subject is still amatter of controversy.6,7 Calculating odds ratios fordetecting signals has been undertaken by somenational ADR centres such as the Netherlands LarebFoundation.8 The Uppsala Monitoring Center, coor-dinating department of WHO for International DrugMonitoring, has developed a new model for generatingsignals from international database of adverse events,since 1998.9,10 The WHO model for signal detection,known as Bayesian Confidence Propagation NeuralNetwork (BCPNN), was designed based on Bayestheory which was able to recognise early alerts ofsome new adverse reactions such as topiramate-inducedglaucoma, olanzepin-induced granolocytopenia andcaptopril-induced cough.11 Another model of Baye-sian data mining has been invented by DuMouchel forapplication in the database of the US Food and DrugAdministration (FDA) since 1999.12 The model calledEmpirical Bayes Screening (EBS) stratifies the ADRreports by (at least) gender and year of report andmathematically is based on a two gamma mixturedistribution and ranking of product-adverse effectpairs by degree of ‘interest’.13,14
IPC, as a full member of WHO International DrugMonitoring Program, is the national centre for con-ducting Pharmacovigilance activities in Iran. IPCstarted to collect and assess ADR reports from all overthe country since 1998. The first ADR reportssubmitted to WHO were the results of a researchproject conducted in a teaching hospital for monitor-ing ADRs.15 Based on the results of that study, themethods for evaluating ADR reports were defined atthe centre. All ADR reports received by IPC areassessed in weekly case assessment meeting by anadvisory committee consisted of physicians, clinicalpharmacists, epidemiologist and ADR specialists. In
Copyright # 2007 John Wiley & Sons, Ltd. Pha
these meetings, the causality and seriousness ofreports are determined based on WHO definitions.16
Furthermore, the urgent preliminary meeting would beset up within 3 hours of receiving reports of death orlife-threatening reactions, permanent damage ordisability and/or birth defect. Although, individualcase assessment is well performed in IPC, there islack of computerised aggregation case assessment.Signals are detected based on traditional methods byclinical observation and IPC has not defined compu-terised methods to automatically detect signals. In thisstudy we tried to examine three quantitative methodsof signal detection in IPC. This is the first timethat IPC database has been assessed systematicallyfor signals.
METHODS
All ADRs reported to IPC from March 1998 to January2005 were analysed. The WHO Terminology is used toharmonise reported ADRs in IPC database.17 Report-ed ADRs to IPC are routinely registered in MicrosoftExcel file. All registered ADRs were ranked based onthe frequency of drug-event combinations registeredin the database. In order to count the reportedfrequency of each recorded combination, MicrosoftAccess was used. The contingency table (Table 1) wascalculated for each combination as the basic table forusing quantitative methods.
The data were analysed based on three differentsignal detection methods including PRRs, informationcomponent (IC) and 95% confidence interval (CI)(IC-2SD) and RORs.
In order to use PRRs for detecting signals, twodifferent criteria were considered. The first criterionwas defined as the combinations with the reportingfrequency of �3 reports, PRR� 2 and x2� 4. Thesecond one was the signals detected using PRR and95%CI.
The second method used for signal detection in thisstudy was performed by estimating the measure ofdisproportionality known as IC and the IC-2SD.Whenever IC-2SD was greater than zero, the combina-tion was considered a possible signal for furtherevaluation.
rmacoepidemiology and Drug Safety, 2007; 16: 1136–1140DOI: 10.1002/pds
1138 g. shalviri ET AL.
Estimating RORs and 95%CI for each drug-eventcombination was the third method used in this study.
The signals detected by each method were cate-gorised based on the number of reports per drug-adverse event combination, severity of the event andlabelled or unlabelled ones. In this respect, measuresof disproportionality were calculated for the combi-nations with number of reports �1, �2 or �3separately. Every drug-event combination which wasnot mentioned in the 2004 version of The MartindaleExtra Pharmacopea was classified as an unlabelledreaction. To determine severe reactions, the WHOdefinition for serious ADR was used.18 Accordingly, aserious reaction is one which resulted in one or moreof the following:
1. D
Tab
Frethe
�1
�2
�3
Co
eath or life-threatening situation
2. H ospitalisation or prolonged hospital stay 3. P ersistent organ damage or disability 4. C ongenital birth defect.The methods applied to signal detection were thencompared in recognising different types of adverseevents.
RESULTS
There were 6353 cases of ADR reports describing11 130 reactions, reported to IPC during the studyperiod. The dataset involved 4975 drug-event com-binations, which were assessed for detecting signals.
The count of drug-event combinations was 1, 2 and3 or more for 3470, 726 and 779 combinations,respectively. There were 500 drug items responsiblefor 468 reaction terms in the database.
According to PRR and 95%CI, there were 2838,872 and 488 drug-event combinations known as a
le 2. Comparing signal detection methods in detecting new and
quency ofcombination
Method No. ofdet
PRR� 2, x2� 4 29ROR, CI> 1 27PRR, CI> 1 28
IC, IC-2SD> 0 11PRR� 2, x2� 4 8
ROR, CI> 1 8PRR, CI> 1 8
IC, IC-2SD> 0 3PRR� 2, x2� 4 4
ROR, CI> 1 4PRR, CI> 1 4
IC, IC-2SD> 0 2
pyright # 2007 John Wiley & Sons, Ltd. Pha
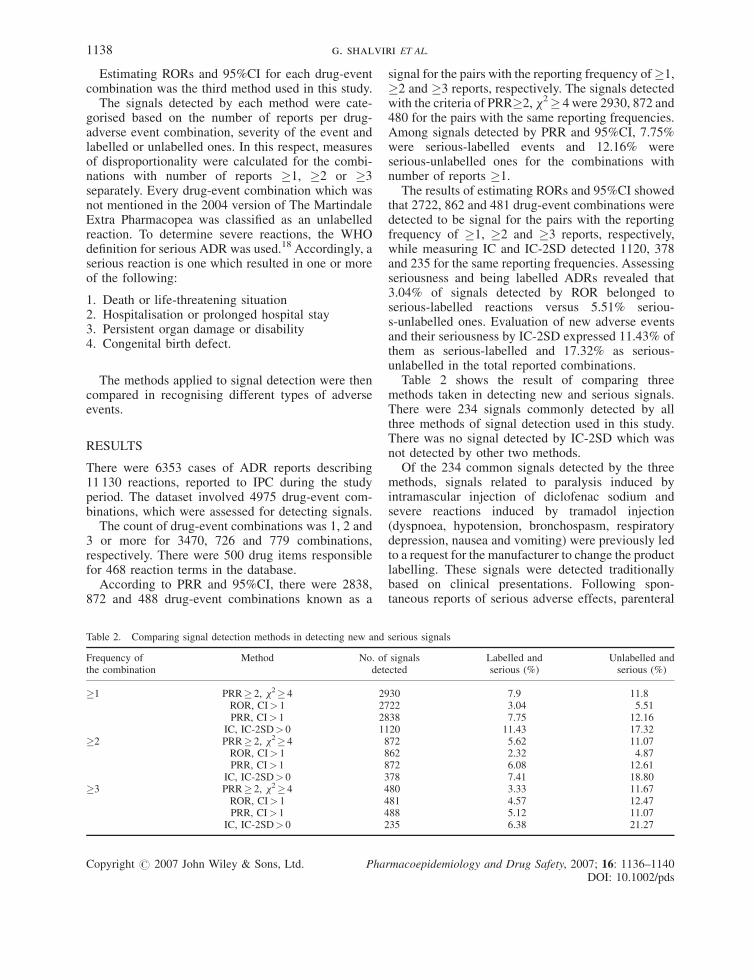
signal for the pairs with the reporting frequency of �1,�2 and �3 reports, respectively. The signals detectedwith the criteria of PRR�2, x2� 4 were 2930, 872 and480 for the pairs with the same reporting frequencies.Among signals detected by PRR and 95%CI, 7.75%were serious-labelled events and 12.16% wereserious-unlabelled ones for the combinations withnumber of reports �1.
The results of estimating RORs and 95%CI showedthat 2722, 862 and 481 drug-event combinations weredetected to be signal for the pairs with the reportingfrequency of �1, �2 and �3 reports, respectively,while measuring IC and IC-2SD detected 1120, 378and 235 for the same reporting frequencies. Assessingseriousness and being labelled ADRs revealed that3.04% of signals detected by ROR belonged toserious-labelled reactions versus 5.51% seriou-s-unlabelled ones. Evaluation of new adverse eventsand their seriousness by IC-2SD expressed 11.43% ofthem as serious-labelled and 17.32% as serious-unlabelled in the total reported combinations.
Table 2 shows the result of comparing threemethods taken in detecting new and serious signals.There were 234 signals commonly detected by allthree methods of signal detection used in this study.There was no signal detected by IC-2SD which wasnot detected by other two methods.
Of the 234 common signals detected by the threemethods, signals related to paralysis induced byintramascular injection of diclofenac sodium andsevere reactions induced by tramadol injection(dyspnoea, hypotension, bronchospasm, respiratorydepression, nausea and vomiting) were previously ledto a request for the manufacturer to change the productlabelling. These signals were detected traditionallybased on clinical presentations. Following spon-taneous reports of serious adverse effects, parenteral
serious signals
signalsected
Labelled andserious (%)
Unlabelled andserious (%)
30 7.9 11.822 3.04 5.5138 7.75 12.1620 11.43 17.3272 5.62 11.0762 2.32 4.8772 6.08 12.6178 7.41 18.8080 3.33 11.6781 4.57 12.4788 5.12 11.0735 6.38 21.27
rmacoepidemiology and Drug Safety, 2007; 16: 1136–1140DOI: 10.1002/pds
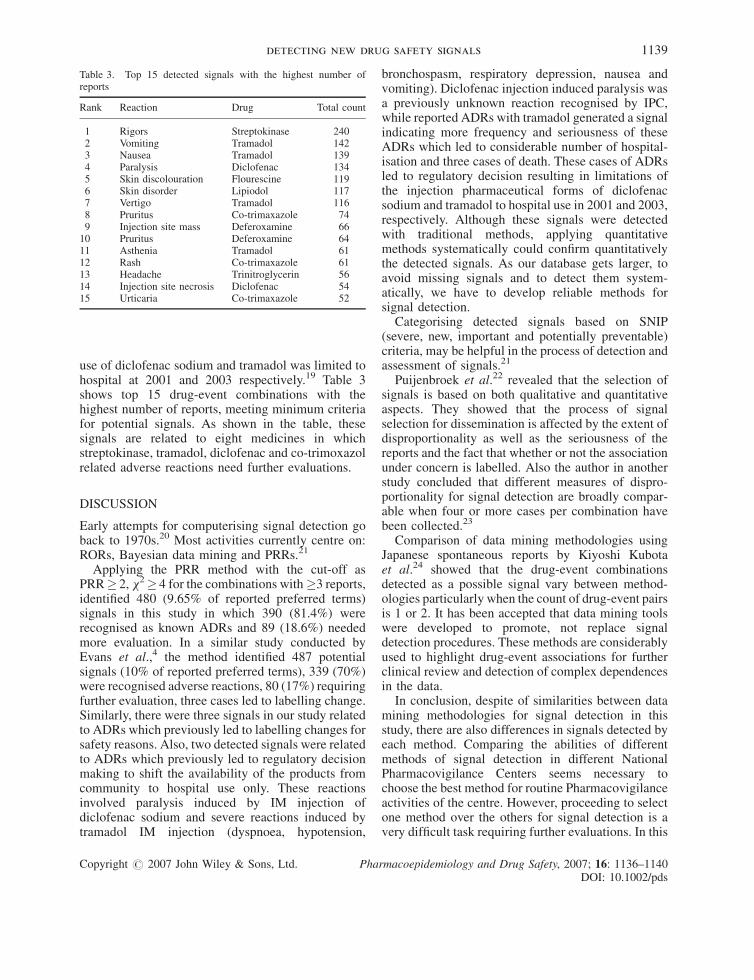
Table 3. Top 15 detected signals with the highest number ofreports
Rank Reaction Drug Total count
1 Rigors Streptokinase 2402 Vomiting Tramadol 1423 Nausea Tramadol 1394 Paralysis Diclofenac 1345 Skin discolouration Flourescine 1196 Skin disorder Lipiodol 1177 Vertigo Tramadol 1168 Pruritus Co-trimaxazole 749 Injection site mass Deferoxamine 66
10 Pruritus Deferoxamine 6411 Asthenia Tramadol 6112 Rash Co-trimaxazole 6113 Headache Trinitroglycerin 5614 Injection site necrosis Diclofenac 5415 Urticaria Co-trimaxazole 52
detecting new drug safety signals 1139
use of diclofenac sodium and tramadol was limited tohospital at 2001 and 2003 respectively.19 Table 3shows top 15 drug-event combinations with thehighest number of reports, meeting minimum criteriafor potential signals. As shown in the table, thesesignals are related to eight medicines in whichstreptokinase, tramadol, diclofenac and co-trimoxazolrelated adverse reactions need further evaluations.
DISCUSSION
Early attempts for computerising signal detection goback to 1970s.20 Most activities currently centre on:RORs, Bayesian data mining and PRRs.21
Applying the PRR method with the cut-off asPRR� 2, x2� 4 for the combinations with �3 reports,identified 480 (9.65% of reported preferred terms)signals in this study in which 390 (81.4%) wererecognised as known ADRs and 89 (18.6%) neededmore evaluation. In a similar study conducted byEvans et al.,4 the method identified 487 potentialsignals (10% of reported preferred terms), 339 (70%)were recognised adverse reactions, 80 (17%) requiringfurther evaluation, three cases led to labelling change.Similarly, there were three signals in our study relatedto ADRs which previously led to labelling changes forsafety reasons. Also, two detected signals were relatedto ADRs which previously led to regulatory decisionmaking to shift the availability of the products fromcommunity to hospital use only. These reactionsinvolved paralysis induced by IM injection ofdiclofenac sodium and severe reactions induced bytramadol IM injection (dyspnoea, hypotension,
Copyright # 2007 John Wiley & Sons, Ltd. Pha
bronchospasm, respiratory depression, nausea andvomiting). Diclofenac injection induced paralysis wasa previously unknown reaction recognised by IPC,while reported ADRs with tramadol generated a signalindicating more frequency and seriousness of theseADRs which led to considerable number of hospital-isation and three cases of death. These cases of ADRsled to regulatory decision resulting in limitations ofthe injection pharmaceutical forms of diclofenacsodium and tramadol to hospital use in 2001 and 2003,respectively. Although these signals were detectedwith traditional methods, applying quantitativemethods systematically could confirm quantitativelythe detected signals. As our database gets larger, toavoid missing signals and to detect them system-atically, we have to develop reliable methods forsignal detection.
Categorising detected signals based on SNIP(severe, new, important and potentially preventable)criteria, may be helpful in the process of detection andassessment of signals.21
Puijenbroek et al.22 revealed that the selection ofsignals is based on both qualitative and quantitativeaspects. They showed that the process of signalselection for dissemination is affected by the extent ofdisproportionality as well as the seriousness of thereports and the fact that whether or not the associationunder concern is labelled. Also the author in anotherstudy concluded that different measures of dispro-portionality for signal detection are broadly compar-able when four or more cases per combination havebeen collected.23
Comparison of data mining methodologies usingJapanese spontaneous reports by Kiyoshi Kubotaet al.24 showed that the drug-event combinationsdetected as a possible signal vary between method-ologies particularly when the count of drug-event pairsis 1 or 2. It has been accepted that data mining toolswere developed to promote, not replace signaldetection procedures. These methods are considerablyused to highlight drug-event associations for furtherclinical review and detection of complex dependencesin the data.
In conclusion, despite of similarities between datamining methodologies for signal detection in thisstudy, there are also differences in signals detected byeach method. Comparing the abilities of differentmethods of signal detection in different NationalPharmacovigilance Centers seems necessary tochoose the best method for routine Pharmacovigilanceactivities of the centre. However, proceeding to selectone method over the others for signal detection is avery difficult task requiring further evaluations. In this
rmacoepidemiology and Drug Safety, 2007; 16: 1136–1140DOI: 10.1002/pds
1140 g. shalviri ET AL.
study the total number of detected signals by IC-2SDis lower than the other two methods but the proportionof serious signals detected by IC is appeared to behigher than the others.
ACKNOWLEDGEMENTS
This research has been possible by a grant provided byInstitute of Public Health Research.
REFERENCES
1. Strom BL. What is pharmacoepidemiology? In Pharmacoepi-demiology, Strom BL (ed.). John Wiley & sons Ltd: New York,2000; 3–15.
2. Meyboom RHB, Egberts ACG, Edwards IR. Principles of signaldetection in pharmacovigilance. Drug Saf 1997; 16(6):355–365.
3. Hauben M, Zhou X. Quantitative methods in pharmacovigi-lance, focus on signal detection. Drug Saf 2003; 26(3):159–186.
4. Evans SJW, Waller PC, Davis S. Use of proportional reportingratios (PRRs) for signal generation from spontaneous adversedrug reaction reports. Pharmacoepidemiol Drug Saf 2001; 10:483–486.
5. Rothman KJ, Lanes S, Sacks ST. The reporting odds ratio and itsadvantages over the proportional reporting ratio. Pharmacoe-pidemiol Drug Saf 2004; 13: 519–523.
6. Hennessy S. Disproportionality analysis of spontaneous reports[editorial]. Pharmacoepidemiol Drug Saf 2004; 13: 503–504.
7. Waller P. The reporting odds ratio versus the proportionalreporting ratio: ‘deuce’ [editorial]. Pharmacoepidemiol DrugSaf 2004; 13: 525–526.
8. Wilson AM, Thabane L, Holbrook A. Application of datamining techniques in pharmacovigilance. Br J Clin Pharmacol57: 2. 127–134.
9. Bate A, Lindquist M, Edwards IR, Orre R. A data miningapproach for signal detection and analysis. Drug Saf 2002;25(6): 393–397.
10. Edwards IR, Lindquist M, Bate A. Data mining. In Pharma-covigilance, Mann RD, Andrews EB (eds). John Wiley & Sons,Ltd: New York, 2002: 292–300.
Copyright # 2007 John Wiley & Sons, Ltd. Pha
11. WHO. Collaborating center for international drug monitoring,viewpoint, watching for safer medicines. Part 2. the UppsalaMonitoring Center, 2004; 56.
12. Szarfman A, Machado SG, O’Neill RT. Use of screeningalgorithms and computer systems to efficiently signal high-er-than-expected combinations of drugs and events in the USFDA’s spontaneous reports database. Drug Saf 2002; 25(6):381–392.
13. Clark JA, Klnicewicz SL, Stang PE. Overview-Spontaneoussignaling. In Pharmacovigilance, Mann RD, Andrews EB (eds).John Wiley & Sons, Ltd., 2002: 247–271.
14. Gould AL. Practical pharmacovigilance analysis strategies.Pharmacoepidemiol Drug Saf 2003; 12: 559–574.
15. Gholami K, Shalviri G. Factors associated with preventability,predictability and severity of ADRs. Ann Pharmacother 1999;33: 236–240.
16. World Health Organization. Safety monitoring of medicinalproducts, guidelines for setting up and running pharmacovigi-lance center, Geneva, Uppsala Monitoring Center. 1996.
17. WHO. Adverse reaction terminology. The Uppsala MonitoringCenter, 2003.
18. World Health Organization. The importance of pharmacovigi-lance, safety monitoring of medicinal products. WHO: Geneva,2002.
19. Gholami K, Shalviri G, Zarbakhsh A, Daryabari N, Yousefian S.New guideline for tramadol usage following adverse drugreactions reported to the Iranian Pharmacovigilance Center.Pharmacoepidemiol Drug Saf 2007; 16: 229–237.
20. Begaud B. Statistical methods of evaluating pharmacovigilancedata. In Pharmacovigilance, Mann RD, Andrews EB (eds). JohnWiley & Sons, Ltd: New York, 2002; 282–289.
21. Clark JA. Algorithms. In Pharmacovigilance, Mann RD,Andrews EB (eds). John Wiley & Sons, Ltd: New York,2002; 229–246.
22. Puijenbroek EP, Grootheest K, Diemont WL, Leufkens HGM,Egberts ACG. Determinants of signal selection in a spontaneousreporting system for adverse drug reactions. Br J Clin Phar-macol 2001; 52: 579–586.
23. Puijenbroek EP, Bate A, Leufkens HGM, Lindquist M, Orre R,Egberts ACG. A comparison of measures of disproportionalityfor signal detection in spontaneous reporting systems foradverse dug reactions. Pharmacoepidemiol Drug Saf 2002;11: 3–10.
24. Kubota K, Koide D, Hirai T. Comparison of data miningmethodologies using Japanese spontaneous reports. Pharma-coepidemiol Drug Saf 2004; 13: 387–394.
rmacoepidemiology and Drug Safety, 2007; 16: 1136–1140DOI: 10.1002/pds