Embed Size (px)
Citation preview
Examensarbete
Application of the ChlorOut concept in a Waste Wood fired CFB Boiler Mårten Carlberg
Institutionen för energi och teknik Examensarbete 2008:02 Department of Energy and Technology ISSN 1654-9392 Uppsala 2008

Abstract
Application of the ChlorOut concept in a Waste Wood fired CFB boiler Mårten Carlberg Boilers converting from sulphur rich fossil fuels to alkali and chlorine rich bio fuels often experience an increased super heater corrosion. This is partly due to the increased formation of KCl during combustion of bio fuels. The problem could, for instance, be handled with a sulphur containing additive to the fuel or to the flue gases. This diploma work was carried out at Vattenfall Power Consultant AB and it focuses on the so-called ChlorOut concept. The ChlorOut concept has been developed by Vattenfall to minimise deposit formation and corrosion. It consists of IACM, an instrument for on-line measurements of gaseous alkali chlorides, and a sulphate-containing additive that converts alkali chlorides to less corrosive alkali sulphates. The sulphate-containing additive is often ammonium sulphate, (NH4)2SO4. The main objective was to evaluate a ChlorOut installation in a CFB (Circulating Fluidised Bed) boiler in Germany. This boiler burns waste wood and has experienced super heater corrosion problems. IACM measurements showed very high levels of alkali chlorides in the flue gas. Results showed that adding (NH4)2SO4 reduced KCl measured by IACM and also the chlorine content in deposits in the super heater region. The deposits was collected by using temperature controlled steel rings on a deposit probe. The fast response for KCl from IACM enables controlling the flow of (NH4)2SO4 when fuel quality varies. The results indicated a reduction of the chlorine induced corrosion in the boiler when using the ChlorOut concept. Handledare: Håkan Kassman Ämnesgranskare: Tatjana Stern Examinator: Bengt Hillring

Sammanfattning Det ökande intresset för miljöfrågor genomsyrar idag debatten om hur vår framtida energiförsörjning skall se ut. Länderna inom den europeiska unionen (EU) har enats om att den totala energitillförseln inom EU år 2020 skall bestå av 20 % förnyelsebara energikällor. För att möta detta mål har exempelvis olika styrmedel införts vilka gör det fördelaktigt för energiproducenter att ställa om sin produktion. Resultatet har blivit att mer och mer vindkraft byggs samt en ökning i konverteringen från fossilbränslen till koldioxidneutrala biobränslen i förbränningsanläggningar. Det ökande användandet av biobränslen har gett upphov till nya problem som måste lösas. Biobränslen kräver nya brännare, och en mer varierande bränslekvalitet kräver mer aktiv styrning av förbränningsprocessen. Ett annat problem som uppstått är en ökning av korrosionen på överhettartuber och pannväggar med negativa ekonomiska konsekvenser som resultat. En av anledningarna till korrosionsökningen är biobränslenas höga halter av alkalimetaller (Na (natrium), K (kalium)) och klor (Cl) som under förbränning bildar alkaliklorider (KCl (kaliumklorid), NaCl (natriumklorid)). Alkaliklorider är oftast i gasfas när de når området med överhettartuberna i förbränningsanläggningar men kondenserar ut i smält fas på de kallare tuberna. En ökad korrosion på grund av en ökad halt klorid på överhettartuber från biobränsleeldade pannor har kunnat påvisas i [1] och [2]. Problemet hanteras idag i huvudsak genom samförbränning av biobränslen och ett fossilt bränsle som torv eller genom tillsats av ett additiv. Additivet kan tillsättas till bädden eller till rökgaserna och innehåller svavel. Svavel är effektivt eftersom det kan binda alkaliklorider till alkalisulfater (K2SO4, Na2SO4) som har högre smältpunkt än kloriderna och kondenserar därför till partiklar i rökgasen innan de når överhettarna. Både samförbränning [3] och tillsatts av ett additiv till rökgaserna [4], [5] har visat sig effektivt för reduktionen av alkaliklorider. Vattenfall Power Consultant AB reducerar idag alkaliklorider, inom konceptet ChlorOut, genom tillsats av additiv till rökgaserna. ChlorOut består av ett instrument, IACM (In situ Alkali Chloride Monitor) som kontinuerligt mäter mängden alkaliklorid och svaveldioxid (SO2) i rökgaser samt ett additiv (oftast ammoniumsulfat, (NH4)2SO4) som sprayas på rökgaserna innan överhettarna vid temperaturer under 1000°C (SNCR, Selective Non Catalytic Reduction, området). KCl halten som mäts av instrumentet används till att styra mängden sulfat som doseras till rökgaserna. I olika mätkampanjer har ammoniumsulfat visat sig reducera mängden klorid i beläggningar på överhettartuber bättre än vad samförbränning gjort [6], [7]. En extra effekt när man tillsätter ammoniak i SNCR området är reduktion av NOx (kväveoxider). CO (kolmonoxid) tenderar också att påverkas vid tillsats av ammoniumsulfat.
I detta examensarbete har en ChlorOut installation utvärderats i en CFB (Circulating Fluidized Bed) panna i Bergkamen, Tyskland. Pannan bränner RT-flis (Retur Trä flis) och IACM mätningarna visar ovanligt höga halter av alkaliklorider i rökgaserna. Inom arbetet har olika doseringspunkter för ammoniumsulfaten utvärderats för att bästa effekt av sulfaten skall uppnås. Mätningar som utförts är beläggningsmätningar med en beläggningssond samt kontinuerliga IACM mätningar. Data från anläggningens egen mätutrustning har också använts. Analyser av beläggningar utfördes med ett SEM/EDX mikroskop (Scanning Electron Microscopy/Energy Dispersive X-Ray Analysis). Resultaten från analyserna visar att det är möjligt att mäta andelen alkaliklorider i rökgasen med IACM instrumentet. Resusltaten visar även att en tillsats av ammoniumsulfat till rökgasen i Bergkamen reducerar andelen alkaliklorider i rökgasen. Samtidiga beläggningsmätningar visar att andelen klor i beläggningarna minskar vid dosering av sulfat i jämförelse med då ingen dosering utfördes. Resultaten visar även att ett ökat flöde av ammoniumsulfat ökar sulfateringen av alkaliklorider i rökgasen och minskar andelen klor i beläggningarna. Ett användbart mått för bestämning av korrosionsrisken hos ett bränsle har varit kvoten S/Cl. Detta mått är pålitligt men tar tid att få fram. Inom detta arbete har kvoten SO2/KCl, mätt med IACM, tagits fram och jämförts med kloridinnehållet i beläggningarna mätta med beläggningssonden. Resultaten visar att on-line svaren från IACM instrumentet kan användas för att förutse korrosionsrisken i en förbränningsanläggning. Kvoten kan även vara lämplig för styrningen av ammoniumsulfatflödet in i pannan.
Table of contents 1 List of abbreviations................................................................. 1 2 Introduction .............................................................................. 2
2.1 Aim..................................................................................... 3 2.2 Method................................................................................ 3
3 Literature survey ...................................................................... 4 3.1 Bio-fuel properties.............................................................. 4
3.1.1 Waste Wood ............................................................... 5 3.2 Reactions with K, Cl and S during combustion ................ 6
3.2.1 Potassium (K) ............................................................. 6 3.2.2 Chlorine (Cl)............................................................... 6 3.2.3 Sulphur (S) ................................................................. 6
3.3 Chlorine-induced corrosion ................................................ 8 3.4 The ChlorOut concept ........................................................ 9 3.5 Nitrogen oxide .................................................................. 10
3.5.1 Formation of nitrogen oxide..................................... 10 3.5.2 Reduction of NO....................................................... 11
3.6 Carbon monoxide ............................................................. 11 4 Experimental........................................................................... 12
4.1 Plant description ............................................................... 12 4.2 ChlorOut system in Bergkamen ....................................... 13
4.2.1 Pump stations ........................................................... 13 4.2.2 Dosage points ........................................................... 14 4.2.3 IACM, In situ Alkali Chloride Monitor.................... 14
4.3 Test plan ........................................................................... 15 4.3.1 Test period 1 ............................................................. 15 4.3.2 Test period 2 ............................................................. 16
4.4 Measuring methods .......................................................... 16 4.4.1 Deposit measurements.............................................. 16 4.4.2 IACM measurements................................................ 18 4.4.3 Operational data........................................................ 19
4.5 Analytical methods ........................................................... 19 4.5.1 SEM/EDX analyses .................................................. 19
5 Results...................................................................................... 20 5.1 Test period 1 ..................................................................... 21
5.1.1 Operational data........................................................ 21 5.1.1.1 SO2, CO and NO .................................................. 22
5.1.2 IACM........................................................................ 22 5.1.3 Deposit growth ......................................................... 24
5.1.4 Elemental analysis .................................................... 25 5.1.4.1 Wind-side ............................................................. 28 5.1.4.2 Lee-side ................................................................ 28
5.1.5 Cross-sectional analysis............................................ 30 5.1.5.1 Reference tests...................................................... 30 5.1.5.2 ChlorOut tests....................................................... 30
5.2 Test period 2 ..................................................................... 32 5.2.1 Operational data........................................................ 32 5.2.2 IACM........................................................................ 33 5.2.3 Deposit growth ......................................................... 34 5.2.4 Elemental analysis .................................................... 35 5.2.5 Cross-sectional analysis............................................ 38
5.2.5.1 Reference tests...................................................... 38 5.2.5.2 ChlorOut tests....................................................... 39
6 Discussion ................................................................................ 41 6.1 Effect of ChlorOut............................................................ 41
6.1.1 Corrosion .................................................................. 42 6.1.2 Nitrogen oxide, NO .................................................. 43 6.1.3 Carbon monoxide, CO.............................................. 43 6.1.4 Deposit growth ......................................................... 44 6.1.5 Influence of oxygen .................................................. 45
6.2 Relation SO2/KCl ............................................................. 47 6.3 Dosage point ..................................................................... 48
7 Conclusions ............................................................................. 50 8 Acknowledgments................................................................... 51 9 References ............................................................................... 52
1
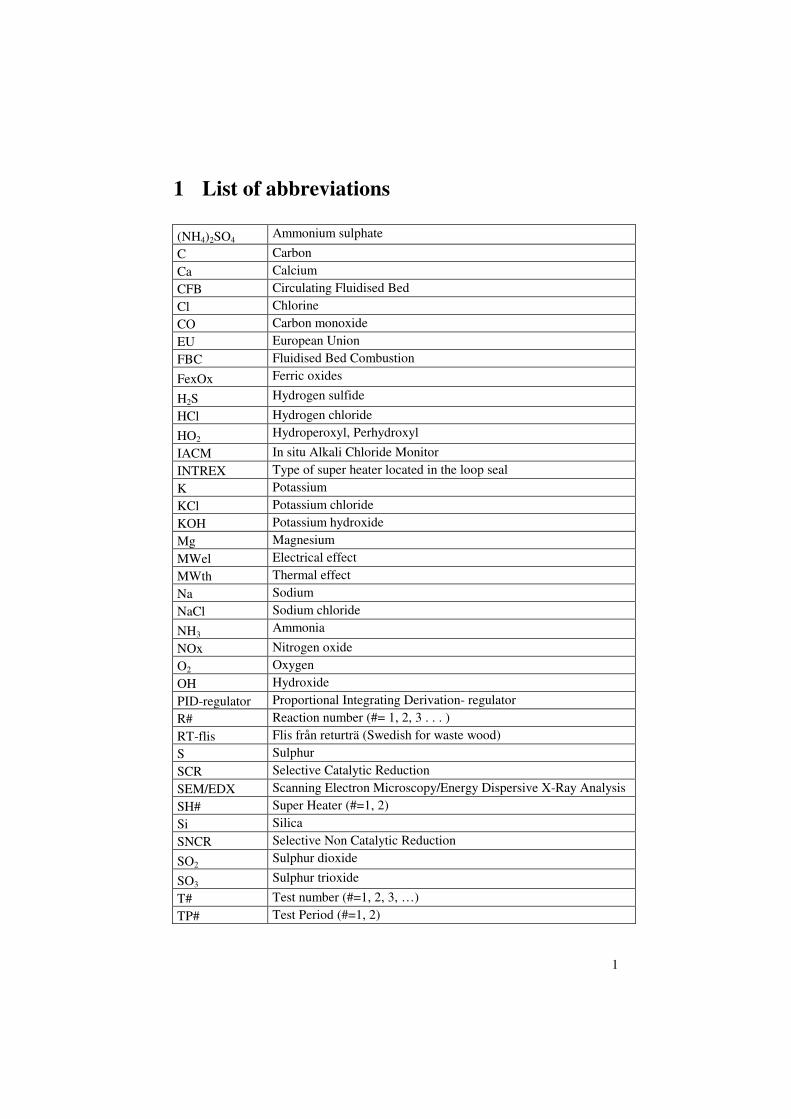
1 List of abbreviations
(NH4)2SO4 Ammonium sulphate
C Carbon
Ca Calcium
CFB Circulating Fluidised Bed
Cl Chlorine
CO Carbon monoxide
EU European Union
FBC Fluidised Bed Combustion
FexOx Ferric oxides
H2S Hydrogen sulfide
HCl Hydrogen chloride
HO2 Hydroperoxyl, Perhydroxyl
IACM In situ Alkali Chloride Monitor
INTREX Type of super heater located in the loop seal
K Potassium
KCl Potassium chloride
KOH Potassium hydroxide
Mg Magnesium
MWel Electrical effect
MWth Thermal effect
Na Sodium
NaCl Sodium chloride
NH3 Ammonia
NOx Nitrogen oxide
O2 Oxygen
OH Hydroxide
PID-regulator Proportional Integrating Derivation- regulator
R# Reaction number (#= 1, 2, 3 . . . )
RT-flis Flis från returträ (Swedish for waste wood)
S Sulphur
SCR Selective Catalytic Reduction
SEM/EDX Scanning Electron Microscopy/Energy Dispersive X-Ray Analysis
SH# Super Heater (#=1, 2)
Si Silica
SNCR Selective Non Catalytic Reduction
SO2 Sulphur dioxide
SO3 Sulphur trioxide
T# Test number (#=1, 2, 3, …)
TP# Test Period (#=1, 2)
2
2 Introduction
The growing interest for environmental questions permeates today the debate of how our future energy systems will look like. A goal for the year 2020 was set by the European Union that 20 % of the unions total energy production should come from renewable energy sources. An effect of the goal is, for example, an increase in wind power production and increased conversion from fossil fuels to CO2 (carbon dioxide) neutral biofuels during combustion for energy production. The increased use of biofuels can lower the CO2 to the atmosphere but it has also given birth to new problems that have to be handled. A more active control of the combustion due to varying quality of biofuels, new burners and increased corrosion are a few problems encountered in the adaptation to the new goals. Increased corrosion has economical concerns as it often implies a more frequent change of the super heaters. The cause for the increased corrosion is mainly the high alkali content in the biofuels that during combustion forms alkali chlorides (KCl (potassium chloride), NaCl (sodium chloride)). These alkali chlorides have a low melting point and can easily condense as chloride melts on cold surfaces in the boiler. Increased chlorine induced corrosion has been observed in several boilers when burning biofuels with high alkali and chloride contents like waste wood, straw and forest residues [1], [2]. The increased corrosion is today, in general, handled by co-burning the bio fuel with sulphur granulates or with a sulphur rich fuel such as peat or coal. Another solution is adding a sulphur-containing additive to the flue gas. Both co-combustion of peat [3] and adding a sulphur-containing additive to the flue gas [4], [5] have shown effective in the reduction of alkali chlorides condensed on super heaters. Sulphur is effective as it can form alkali sulphates (K2SO4 (potassium sulphate), Na2SO4 (sodium sulphate)) from sulphation of alkali chlorides in the flue gas or from direct formation of alkali sulphates during combustion. The sulphates have higher melting point than the chlorides and condense to particles in the flue gas before they hit the super heaters. Silicates and earth alkalis are also preventing the release of alkali chlorides to the flue gas during co-combustion. Vattenfall Research and Development AB (VRD) has developed the so called ChlorOut concept, for measuring and reducing alkali chlorides in flue gases. The concept consists of an instrument, IACM (In situ Alkali Chloride Monitor), which continuously measures the alkali chloride and SO2 content in the flue gas and an additive, normally ammonium sulphate ((NH4)2SO4), for sulphating the alkali chlorides to alkali sulphates. The flow of the additive is regulated towards a set value for the alkali chloride. During comparative tests ChlorOut has shown more effective in reducing the chlorides deposited on super heaters than co-burning biofuels with other fuels [6], [7]. Variations in CO (carbon monoxide) and NO (nitrogen oxide) are often seen when adding ammonium sulphate to the flue gas. Major decreases in NO levels while
3
observations of both minor increasing [8] and major decreasing [4] CO levels have been observed. 2.1 Aim
The aim with this diploma work is to evaluate a ChlorOut installation in a CFB (Circulating Fluidised Bed) boiler in Bergkamen Germany. The boiler burns waste wood and has super heater corrosion problems. IACM measurements show very high levels of alkali chlorides in the flue gas. 2.2 Method
Measurements preformed within this work are IACM and deposit measurements. Deposit measurements were made with a deposit probe with deposit rings that were exposed to the flue gases and then analysed. The tool for analysis was a SEM/EDX microscope (Scanning Electron Microscopy/Energy Dispersive X-Ray Analysis)
4
3 Literature survey
The literature survey covers questions relevant for a ChlorOut installation in a boiler fired with biofuels. Special weight will be put on sulphur, chlorine and potassium and how they react when present in the deposit of a super heater surface. Since NO and CO are of interest a section will also treat the reactions concerning them. 3.1 Bio-fuel properties
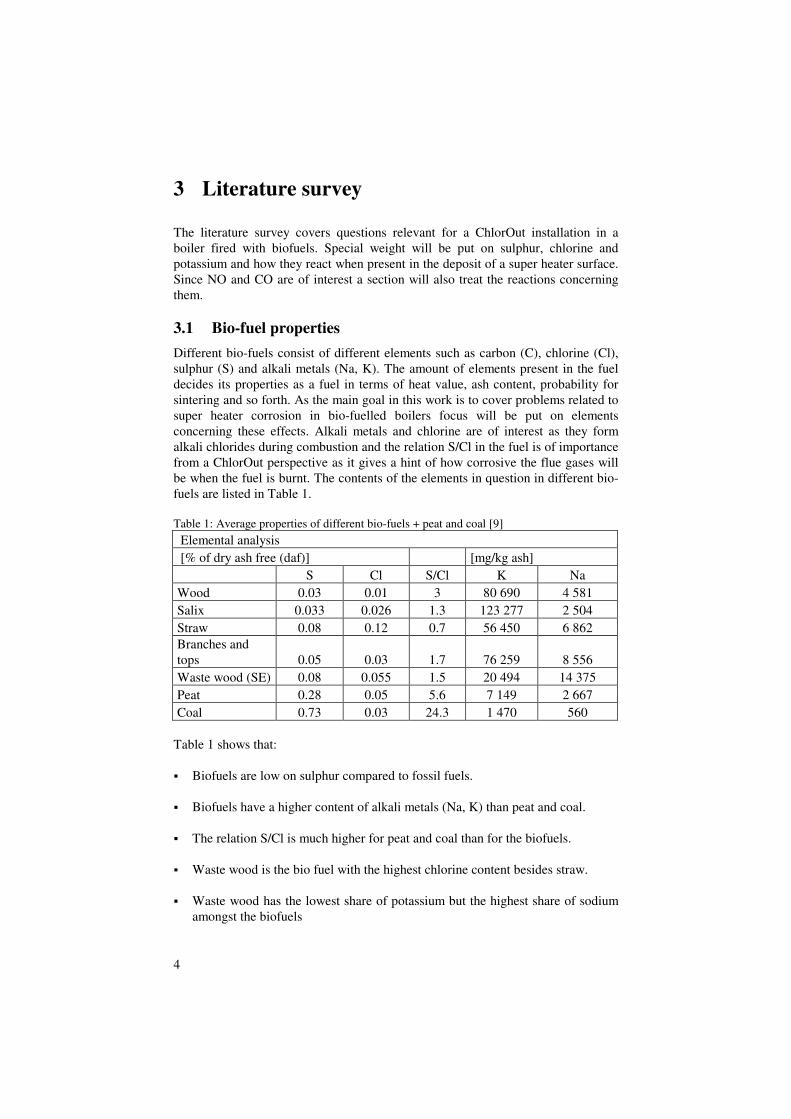
Different bio-fuels consist of different elements such as carbon (C), chlorine (Cl), sulphur (S) and alkali metals (Na, K). The amount of elements present in the fuel decides its properties as a fuel in terms of heat value, ash content, probability for sintering and so forth. As the main goal in this work is to cover problems related to super heater corrosion in bio-fuelled boilers focus will be put on elements concerning these effects. Alkali metals and chlorine are of interest as they form alkali chlorides during combustion and the relation S/Cl in the fuel is of importance from a ChlorOut perspective as it gives a hint of how corrosive the flue gases will be when the fuel is burnt. The contents of the elements in question in different bio-fuels are listed in Table 1. Table 1: Average properties of different bio-fuels + peat and coal [9] Elemental analysis [% of dry ash free (daf)] [mg/kg ash] S Cl S/Cl K Na Wood 0.03 0.01 3 80 690 4 581 Salix 0.033 0.026 1.3 123 277 2 504 Straw 0.08 0.12 0.7 56 450 6 862 Branches and tops 0.05 0.03 1.7 76 259 8 556 Waste wood (SE) 0.08 0.055 1.5 20 494 14 375 Peat 0.28 0.05 5.6 7 149 2 667 Coal 0.73 0.03 24.3 1 470 560
Table 1 shows that: � Biofuels are low on sulphur compared to fossil fuels. � Biofuels have a higher content of alkali metals (Na, K) than peat and coal. � The relation S/Cl is much higher for peat and coal than for the biofuels. � Waste wood is the bio fuel with the highest chlorine content besides straw. � Waste wood has the lowest share of potassium but the highest share of sodium
amongst the biofuels
5
3.1.1 Waste Wood
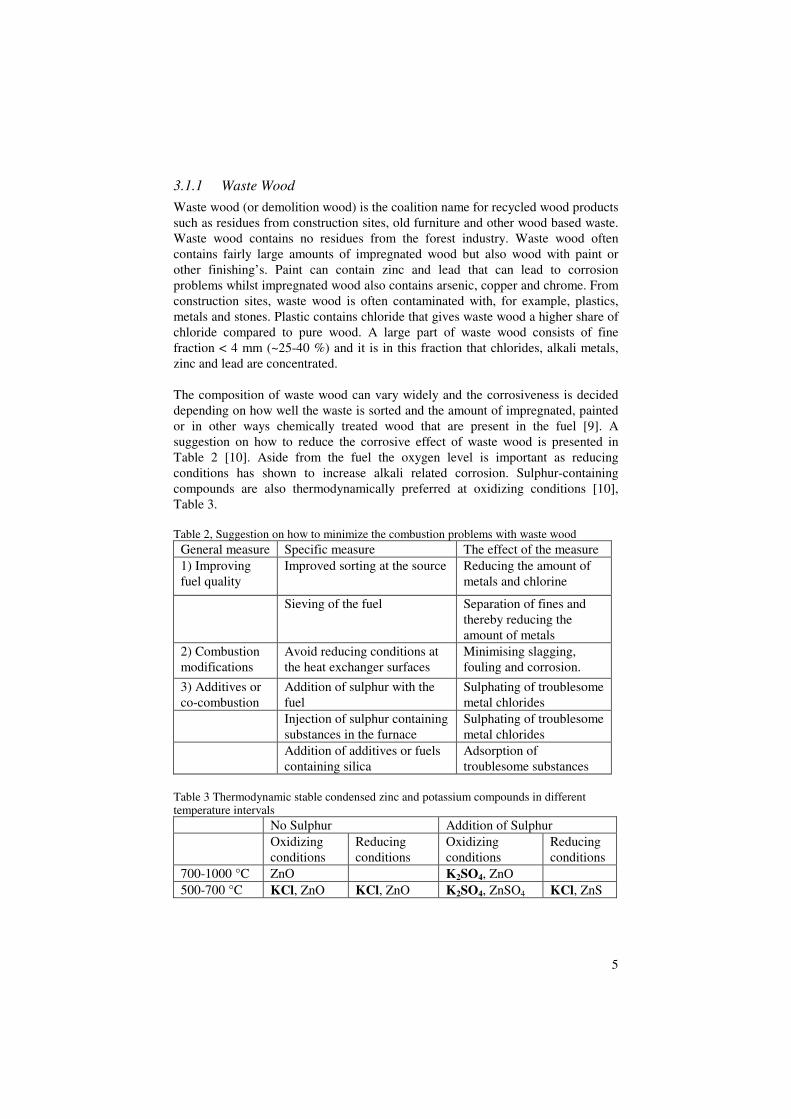
Waste wood (or demolition wood) is the coalition name for recycled wood products such as residues from construction sites, old furniture and other wood based waste. Waste wood contains no residues from the forest industry. Waste wood often contains fairly large amounts of impregnated wood but also wood with paint or other finishing’s. Paint can contain zinc and lead that can lead to corrosion problems whilst impregnated wood also contains arsenic, copper and chrome. From construction sites, waste wood is often contaminated with, for example, plastics, metals and stones. Plastic contains chloride that gives waste wood a higher share of chloride compared to pure wood. A large part of waste wood consists of fine fraction < 4 mm (~25-40 %) and it is in this fraction that chlorides, alkali metals, zinc and lead are concentrated. The composition of waste wood can vary widely and the corrosiveness is decided depending on how well the waste is sorted and the amount of impregnated, painted or in other ways chemically treated wood that are present in the fuel [9]. A suggestion on how to reduce the corrosive effect of waste wood is presented in Table 2 [10]. Aside from the fuel the oxygen level is important as reducing conditions has shown to increase alkali related corrosion. Sulphur-containing compounds are also thermodynamically preferred at oxidizing conditions [10], Table 3. Table 2, Suggestion on how to minimize the combustion problems with waste wood
General measure Specific measure The effect of the measure
1) Improving fuel quality
Improved sorting at the source Reducing the amount of metals and chlorine
Sieving of the fuel Separation of fines and thereby reducing the amount of metals
2) Combustion modifications
Avoid reducing conditions at the heat exchanger surfaces
Minimising slagging, fouling and corrosion.
3) Additives or co-combustion
Addition of sulphur with the fuel
Sulphating of troublesome metal chlorides
Injection of sulphur containing substances in the furnace
Sulphating of troublesome metal chlorides
Addition of additives or fuels containing silica
Adsorption of troublesome substances
Table 3 Thermodynamic stable condensed zinc and potassium compounds in different temperature intervals
No Sulphur Addition of Sulphur Oxidizing
conditions Reducing conditions
Oxidizing conditions
Reducing conditions
700-1000 °C ZnO K2SO4, ZnO 500-700 °C KCl, ZnO KCl, ZnO K2SO4, ZnSO4 KCl, ZnS
6
3.2 Reactions with K, Cl and S during combustion
The reactions concerning K, S and Cl are important when handling super heater corrosion problems and are therefore treated separately in this chapter. 3.2.1 Potassium (K)
Potassium is released during combustion mainly as KCl. It has been shown during combustion of straw that the potassium release to gas phase at temperatures above 500°C correlated with the chlorine concentration in the fuel. Higher temperatures increase the amount of KCl in the gas phase [11]. Knudsen et al. [12] introduces two important parameters concerning the release of potassium during combustion of biofuels, which are K/Si and Cl/K molar ratios. Silicates (Si) have an inhibiting effect on the release of potassium as potassium is easily incorporated in potassium silicates, which are less volatile than for example alkali chlorides. This implies that at high K/Si ratios a higher release of potassium into gas phase can be seen than at low K/Si ratios. This has also been investigated by Jensen et al.[13] and Knudsen [11]. Jensen et al. suggested that potassium silicates are formed by reactions of silicates with KCl. Equilibrium calculations performed by Knudsen for wheat straw show that in silica poor combustion environments potassium is released into gas phase mainly as KOH, KCl and K2SO4 whereas in silica rich environments most of the potassium is bound into solid silica compounds. In a silica rich environment where the Cl/K ratio is high the calculations yields an almost complete K release into KCl and no potassium silicates at temperatures over 900°C. This indicates that the Cl/K relation affects the release of potassium more than Si/K. Earth alkali metals e.g. Mg (magnesium) and Ca (calcium) have also shown to have an effect on the release of potassium when burning annual crops. Thy et al. [14] performed measurements showing a much higher release of potassium when the quota (Mg+Ca)/Si was high than low. This is also shown by Knudsen who suggests that calcium and magnesium have stronger bonds to silicon than potassium at increasing temperatures. 3.2.2 Chlorine (Cl)
Chlorine is released into gas phase in two steps. Throughout the pyrolysis, below 500°C, chlorine is released as chlorinated hydrocarbons, hydrogen chloride (HCl) or alkali chlorides, mostly potassium chloride (KCl). At temperatures between 400°C and 700°C the release is very small but is then resumed during combustion at temperatures between 700°C and 900°C [11], [15].
3.2.3 Sulphur (S)
At low temperatures and during oxidizing conditions sulphur is almost completely bound in particles as alkali sulphates. As the temperature rises and in the presence of calcium and silicates the alkali sulphates start to dissociate to sulphur dioxide (SO2). At high temperatures >1000°C most of the sulphur is in the form of SO2
[11]. Under reducing conditions sulphur may be released as H2S or S2 but under oxygen rich conditions almost all sulphur is bound in the form of SO2 [15]. SO2 can be oxidized into SO3 with oxygen as in R1.
7
R1. 322 21 SOOSO ↔+
The direct reaction R1 between sulphur dioxide and oxygen is, according to Jörgensen et al [16], believed to be too slow to be important for the overall formation of SO3 during the cooling of the flue gas. They show, under homogeneous conditions, that SO3 is mainly formed, at temperatures below ~700°C, by the sequence R2, R3.
R2. )()( 22 MHOSOMOHSO +↔++
R3. 2322 HOSOOHOSO +↔+
At lower temperatures NO tends to promote formation of SO3 by reacting with HO2 as seen in R4 forming OH, which then can react with SO2 as in R2 [15].
R4. OHNOHONO +↔+ 22
The contribution of NO on the oxidation of SO2 to SO3 is according to [15] small. SO3 can also be formed in the boiler with a catalyst. A known good catalyst for the oxidation of SO2 is ferric oxide (Fe2O3). The catalytic effect of iron oxides for SO2 � SO3 in fly ash has been investigated by P. Marier et al.[17]. The laboratory study performed showed on a linear increase in the oxidation of SO2 � SO3 with increasing amounts of iron oxide in the flue gas at temperatures between 500 - 700°C. Iron oxides on boiler walls and tube surfaces have also been shown to have a catalytic effect on SO2 � SO3. L.A. Hansen et al. [2] suggests this from observations of deposits where alkali chlorides have been sulphated in the deposit to alkali sulphates. This is also supported by Srivastava et al. [18] and Jörgensen et al.[16] Generally, iron oxides have shown high catalytic activity at ~600°C but are active at lower temperatures as well. Its catalytic activity peaks at ~700°C [16]. The consumption of SO3 often takes place near the flame where oxygen is needed according to reactions R5 and R6. [18]
R5. 222)(3 OHOSOHOSO g +→+
R6. 22)(3 OSOOSO g +→+
8
3.3 Chlorine-induced corrosion
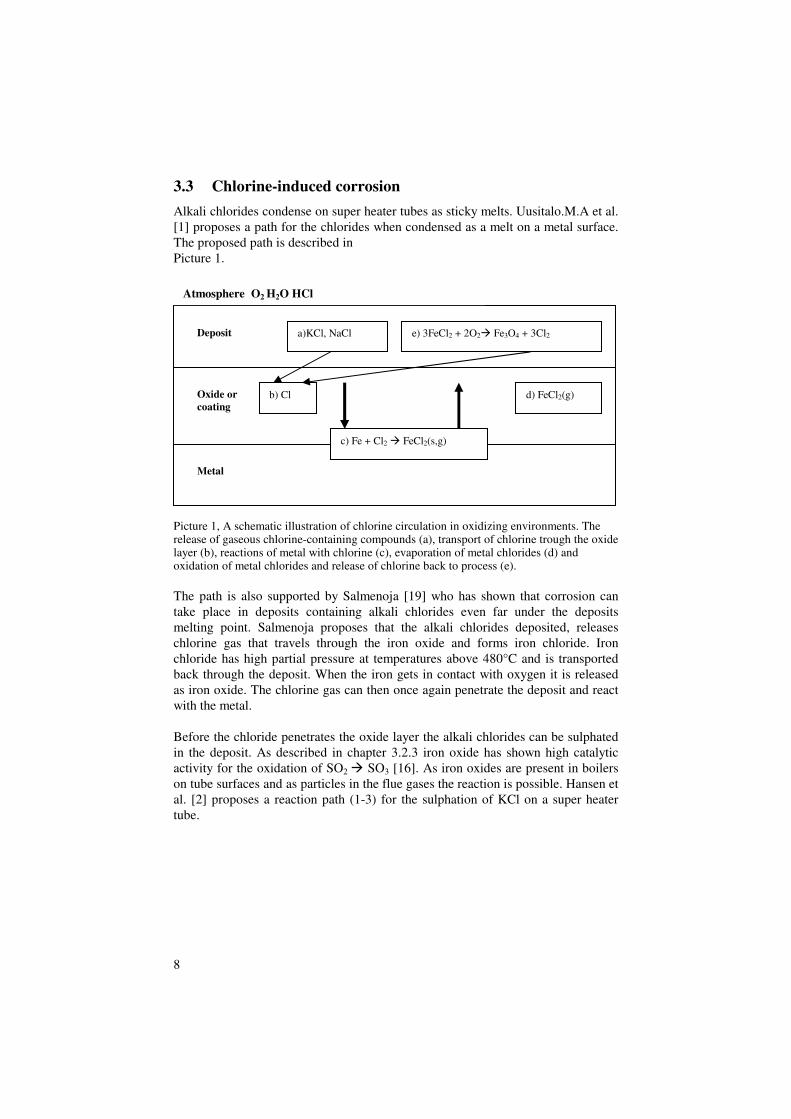
Alkali chlorides condense on super heater tubes as sticky melts. Uusitalo.M.A et al. [1] proposes a path for the chlorides when condensed as a melt on a metal surface. The proposed path is described in Picture 1.
Picture 1, A schematic illustration of chlorine circulation in oxidizing environments. The release of gaseous chlorine-containing compounds (a), transport of chlorine trough the oxide layer (b), reactions of metal with chlorine (c), evaporation of metal chlorides (d) and oxidation of metal chlorides and release of chlorine back to process (e). The path is also supported by Salmenoja [19] who has shown that corrosion can take place in deposits containing alkali chlorides even far under the deposits melting point. Salmenoja proposes that the alkali chlorides deposited, releases chlorine gas that travels through the iron oxide and forms iron chloride. Iron chloride has high partial pressure at temperatures above 480°C and is transported back through the deposit. When the iron gets in contact with oxygen it is released as iron oxide. The chlorine gas can then once again penetrate the deposit and react with the metal. Before the chloride penetrates the oxide layer the alkali chlorides can be sulphated in the deposit. As described in chapter 3.2.3 iron oxide has shown high catalytic activity for the oxidation of SO2 � SO3 [16]. As iron oxides are present in boilers on tube surfaces and as particles in the flue gases the reaction is possible. Hansen et al. [2] proposes a reaction path (1-3) for the sulphation of KCl on a super heater tube.
Metal
Oxide or
coating
Deposit a)KCl, NaCl e) 3FeCl2 + 2O2� Fe3O4 + 3Cl2
b) Cl d) FeCl2(g)
c) Fe + Cl2 � FeCl2(s,g)
Atmosphere O2 H2O HCl
9
1. Initially, KCl deposits on the super heater surface, e.g., by condensation of gaseous KCl.
2. KCl reacts with FexOy , FeCl2, K2SO4, or a fourth (unknown) species and
forms a melt phase. This reaction is not unlikely to happen as KCl forms eutectic mixtures with FeCl2 (at 355°C), with K2SO4 (at 690°C), and possibly also with FexOy, even though the latter has not been verified.
3. The melted KCl reacts with gaseous SO3 and forms K2SO4. Gaseous SO3
may be present, as FexOy is known for catalysing the oxidation of SO2 to SO3.
The impact of sulphur on chlorine-induced corrosion has been investigated by Salmenoja K. [19]. Salmenoja measured the ratio S/Cl in the flue gas and found that the risk for corrosion was small at a molar relation >4, moderate at 2-4 and big at <2. The active reaction decreasing the corrosion is R7 that yields K2SO4, which condense earlier in the boiler, and prevents the chlorine from getting stuck on the super heaters.
R7. HClSOKOHOSOKCl 2212 42222 +→+++
Co-combustion tests performed by Vattenfall in a 30 MWth CFB boiler showed that a molar ratio S/Cl=6 was needed to reduce the KCl level by 50 %. The high ratio resulted in a rather high concentration of SO2 in the flue gas [5]. High concentration of SO2 in the flue gas can yield high SO2 emissions that increase the risk for low temperature corrosion. The high SO2 problem comes from the slow reaction between sulphur dioxide and oxygen in R7. The problem could in theory be avoided by adding SO3 directly to the flue gases, which is more reactive than SO2. This is done in the ChlorOut concept. 3.4 The ChlorOut concept
The ChlorOut concept aims to reduce the amounts of alkali chlorides (here after expressed as potassium chloride, KCl, as potassium is the most frequent alkali in biofuels) from the flue gases during combustion of biofuels and wastes. The concept consists of an in situ instrument called IACM (In situ Alkali Chloride Monitor), which measures the content of KCl and SO2 in the flue gas and a sulphur-containing additive that is sprayed on the flue gases up stream the super heaters. The sulphate flow is often controlled by the IACM measurements to a set KCl level. The additive used is a solution of ammonium sulphate, (NH4)2SO4, which is decomposed to SO3 and NH3 according to R8. From a ChlorOut perspective the important product is SO3 that reacts with alkali chlorides in the flue gas according to R9. SO3 is in equilibrium with SO2 and O2 in the boiler (R10) and the rate constant for the reaction is pushed toward SO3 due to oxidizing conditions. By adding SO3 directly to the flue gases the alkali chlorides are more effectively reduced than by adding sulphur to the fuel and the increased SO2 emissions are smaller [5]. An extra effect when adding ammonia to flue gases is reduction of NO in the so-called SNCR reaction (R11).
10
R8. )(2)(3)(3)(424 2)( gggaq OHSONHSONH ++→
R9. )()(422)(3)( 2),(2 gSgg HClSOKOHSOClNaK +→++
R10. )(2)(2)(3 21 ggg OSOSO +↔
R11. )(2)(2)(2)()(3 6444 ggggg OHNONONH +→++
As mentioned in chapter 3.2.3, SO2 can be oxidized to SO3 with iron oxides as catalyst. This reaction should in theory increase with increasing SO2 why a relation between SO2 and KCl in the flue gas and the chlorine content in deposits should be interesting. This has so far not been done. 3.5 Nitrogen oxide
3.5.1 Formation of nitrogen oxide
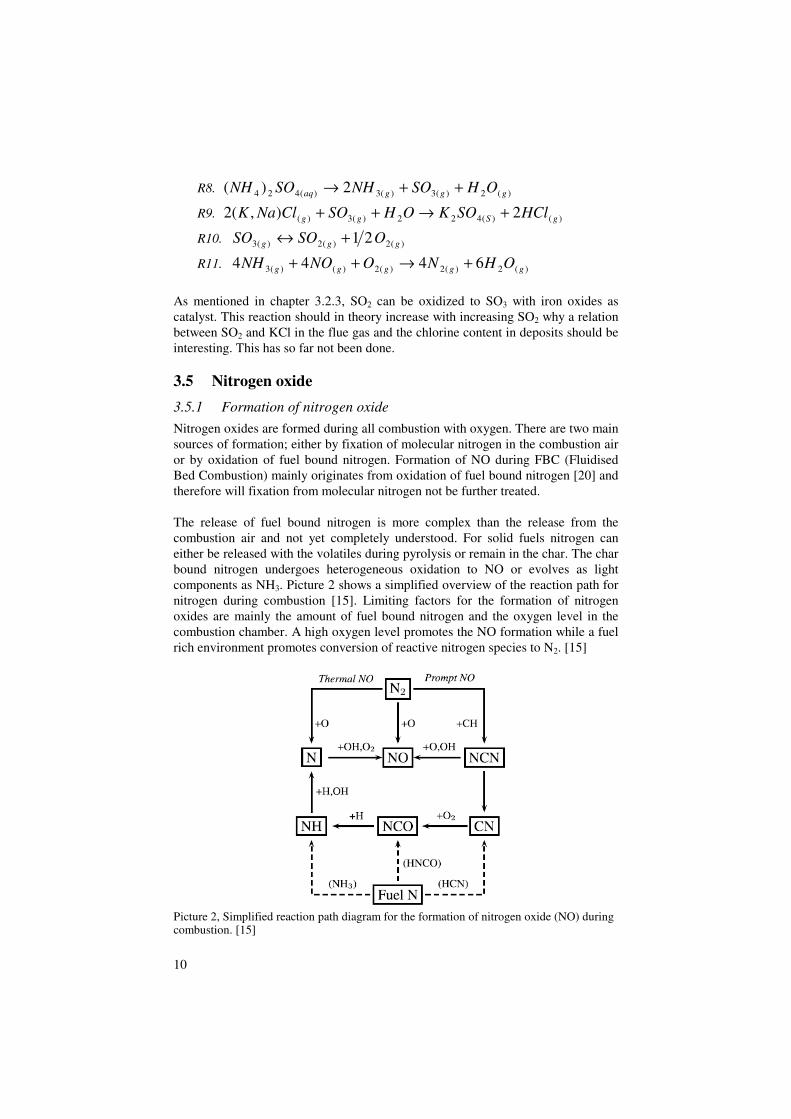
Nitrogen oxides are formed during all combustion with oxygen. There are two main sources of formation; either by fixation of molecular nitrogen in the combustion air or by oxidation of fuel bound nitrogen. Formation of NO during FBC (Fluidised Bed Combustion) mainly originates from oxidation of fuel bound nitrogen [20] and therefore will fixation from molecular nitrogen not be further treated. The release of fuel bound nitrogen is more complex than the release from the combustion air and not yet completely understood. For solid fuels nitrogen can either be released with the volatiles during pyrolysis or remain in the char. The char bound nitrogen undergoes heterogeneous oxidation to NO or evolves as light components as NH3. Picture 2 shows a simplified overview of the reaction path for nitrogen during combustion [15]. Limiting factors for the formation of nitrogen oxides are mainly the amount of fuel bound nitrogen and the oxygen level in the combustion chamber. A high oxygen level promotes the NO formation while a fuel rich environment promotes conversion of reactive nitrogen species to N2. [15]
Picture 2, Simplified reaction path diagram for the formation of nitrogen oxide (NO) during combustion. [15]
11
3.5.2 Reduction of NO
NO is mainly reduced in combustion processes by the SNCR (Selective Non- Catalytic Reduction) or the SCR (Selective Catalytic Reduction) technology. During conventional SNCR, ammonia or urea is injected to the boiler at a flue gas temperature above 800°C. NO is then reduced through reactions R12 and R12b.
R12. OHNHOHNH 223 +→+
R12b. OHNNONH 222 +→+
3.6 Carbon monoxide
CO is formed during all combustion of carbon under oxygen lean conditions and can be oxidized into CO2 with OH radicals as in R13.
R13. HCOOHCO +↔+ 2
CO competes with other compounds for the OH radicals that can inhibit the oxidation of CO. Predicted results on CO oxidation with 5 % O2 indicates that NO has a promoting effect on the CO oxidation below 780°C. Under reducing conditions NO has shown to inhibit the oxidation [15]. When adding ammonia or urea CO often increases [8] as ammonia competes with CO for the OH radicals as can be seen in R12. SO2 has also shown an inhibiting effect on the CO oxidation in CFB boilers by interacting with the OH radical pool. The interaction is rather complicated and is described by reference [15]. The work on the area continues as recent results [15] show that addition of small amounts of sulphur to the combustion of low-sulphur fuels has enhanced the oxidation of CO. The presence of HCl in the flue gas has both shown to have an inhibiting and a promoting effect on the CO oxidation [15]. Results from experiments by Hindyiarti et al. [21] show that CO oxidation strongly depends on the KCl level in reducing conditions. When KCl was fed to the CO oxidation system the CO oxidation dramatically went down and when the feeding was ended the oxidation rate went up. This strongly indicates that KCl has an inhibiting effect on the CO oxidation.
12
4 Experimental
4.1 Plant description
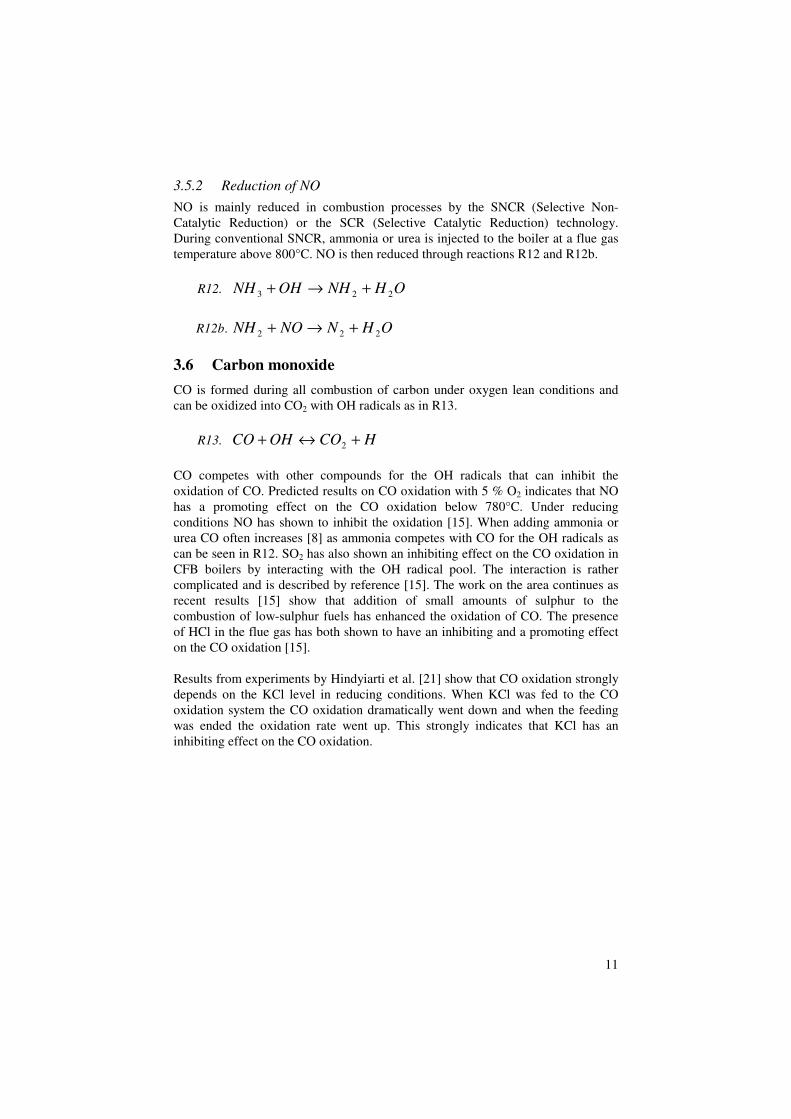
The investigated boiler is situated in Bergkamen, mid-west Germany. The boiler is a 20 MWel /~58 MWth CFB from Foster Wheeler [22] without flue gas condensation. The boiler produces steam from mainly waste wood to the turbine with a flow of 22 kg/s (90 bar, 500°C (final SH temp from INTREX)). The electrical efficiency of the turbine is 35 %. The outgoing flue gas temperature from the stack is around 150°C. Picture 3 shows a schematic picture of the Bergkamen boiler. The boiler is constructed with two super heaters after two cyclones and two INTREX’s at the bottom of the cyclones. Super heater 1 and 2 are respectively made of steel 13CrMo44 (SS2216) and 10CrMo910 (SS2218). Average outgoing steam temperature in SH2 and SH1 is approximately 390°C and 375°C respectively. The super heaters are continuously cleaned with a soot blower using process steam. The soot blowing in Bergkamen were, during the tests, performed approximately every 3-4 hours.
Picture 3, Schematic picture of a CFB boiler with Foster Wheeler design [22]. Location of equipment and dosage points are noted in the picture.
13
4.2 ChlorOut system in Bergkamen
The temporary ChlorOut installation in Bergkamen consists of a container for the ammonium sulphate, two pumping units for pumping the sulphate in to the boiler, regulators to regulate air and water pressure, lances with 6 hole nozzles for an even distribution of the sulphate in to the boiler and an IACM instrument which continuously measured alkali chloride and SO2 in the boiler. The location of the different parts of the ChlorOut system is shown in Picture 3 (above). A more thorough description of the parts follows. 4.2.1 Pump stations
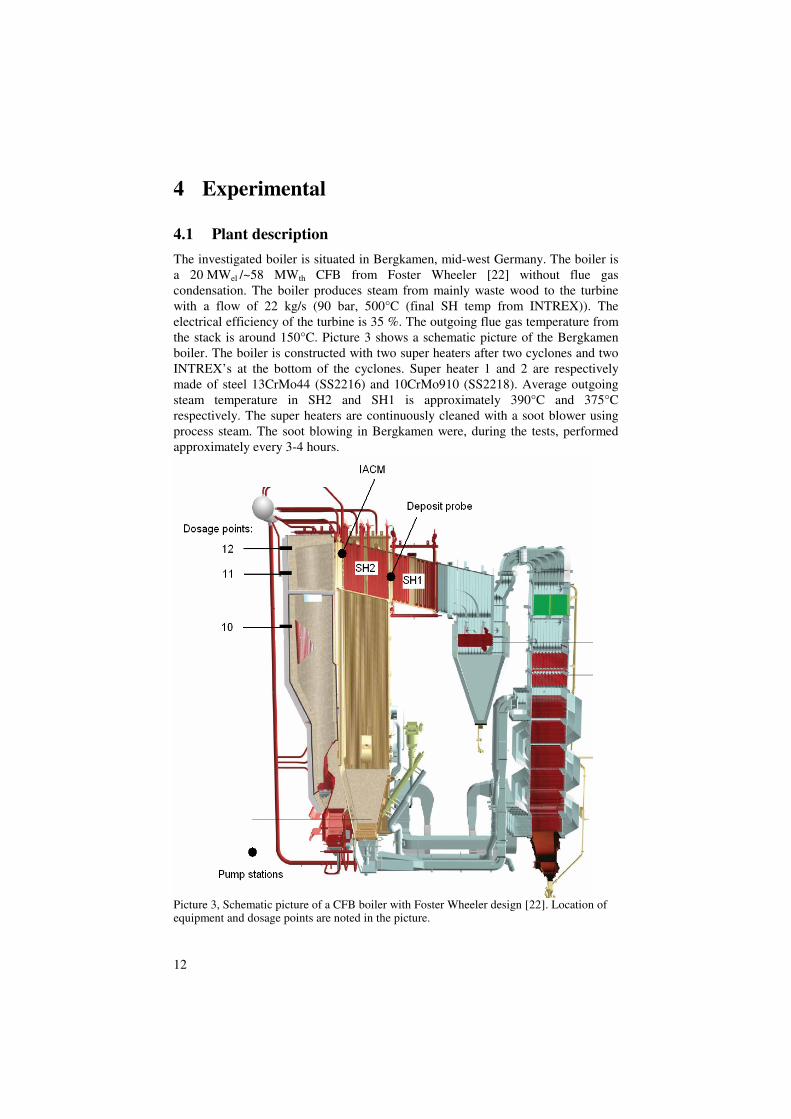
Two pump stations (each as shown in Error! Reference source not found.) were placed on the ground floor in the boiler house together with the ammonium sulphate tanks. The flows of the pump stations were controlled either by motor frequency regulation or by a flow meter. The pumps were connected to one dosage point each. The tanks used during operation within this work were temporary one cubic meter storage tanks. For long-term operation a bigger tank will most likely be selected. The sulphate was pumped through armoured rubber tubes to the dosage points.
Picture 4, Pump station for ammonium sulphate
14
4.2.2 Dosage points
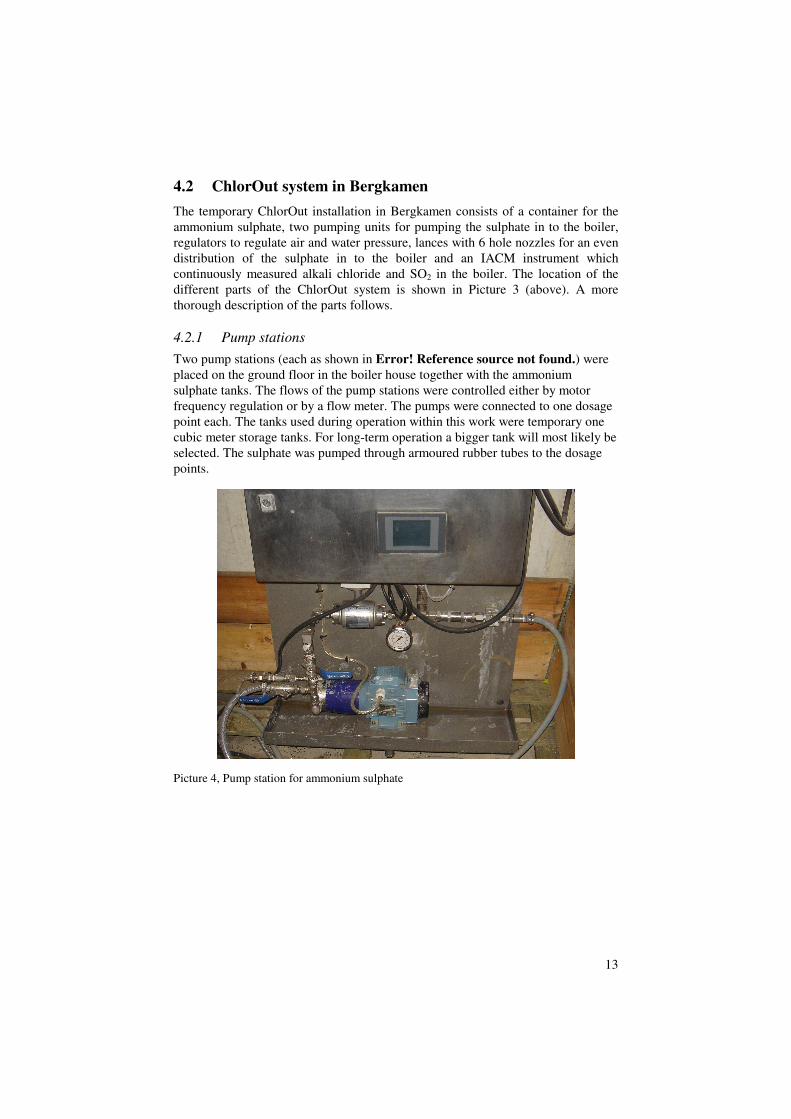
During the measurements in Bergkamen different dosage points were investigated. Two of the points, 11 and 12, were placed above the cyclone and one, 10, in the upper part of the cyclone as can be seen in Picture 3 and Picture 5. Each dosage point consisted of two lances, one in each cyclone. The distance from dosage points 11 and 12 to super heater 2 is approximately 5 meters.
Picture 5, Dosage point 12 and 11 (left) and 10 (right) 4.2.3 IACM, In situ Alkali Chloride Monitor
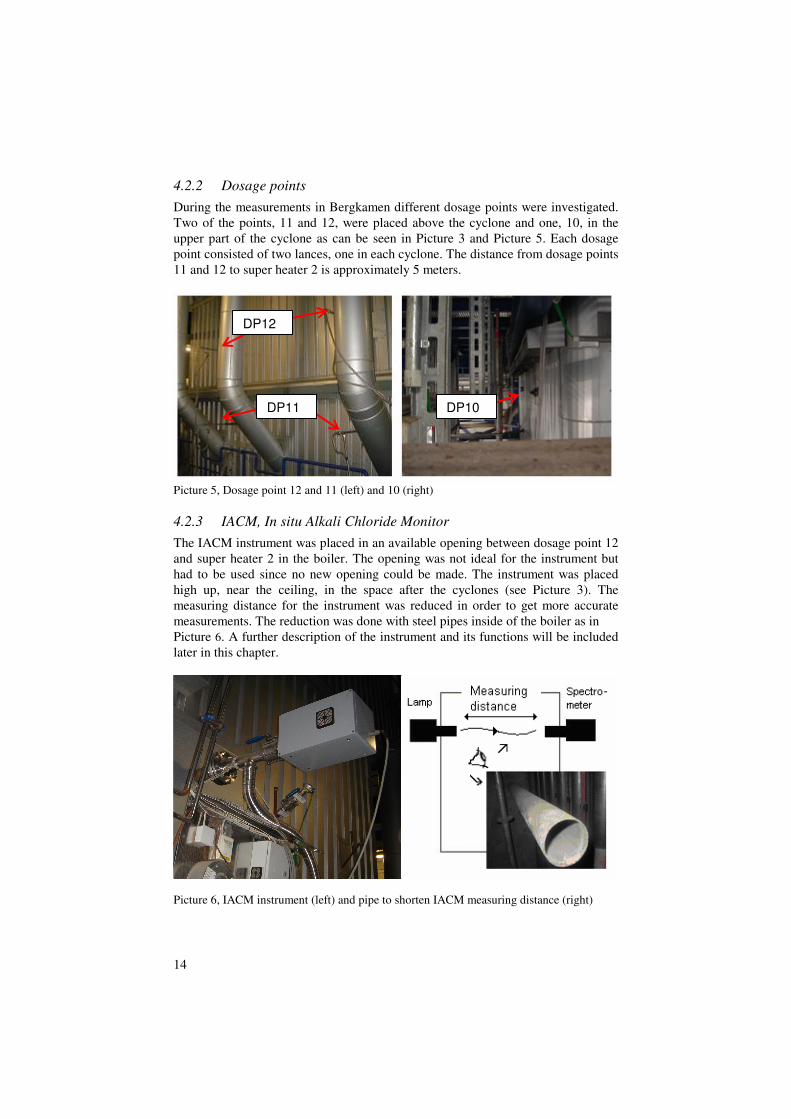
The IACM instrument was placed in an available opening between dosage point 12 and super heater 2 in the boiler. The opening was not ideal for the instrument but had to be used since no new opening could be made. The instrument was placed high up, near the ceiling, in the space after the cyclones (see Picture 3). The measuring distance for the instrument was reduced in order to get more accurate measurements. The reduction was done with steel pipes inside of the boiler as in Picture 6. A further description of the instrument and its functions will be included later in this chapter.
Picture 6, IACM instrument (left) and pipe to shorten IACM measuring distance (right)
DP12
DP11 DP10
15
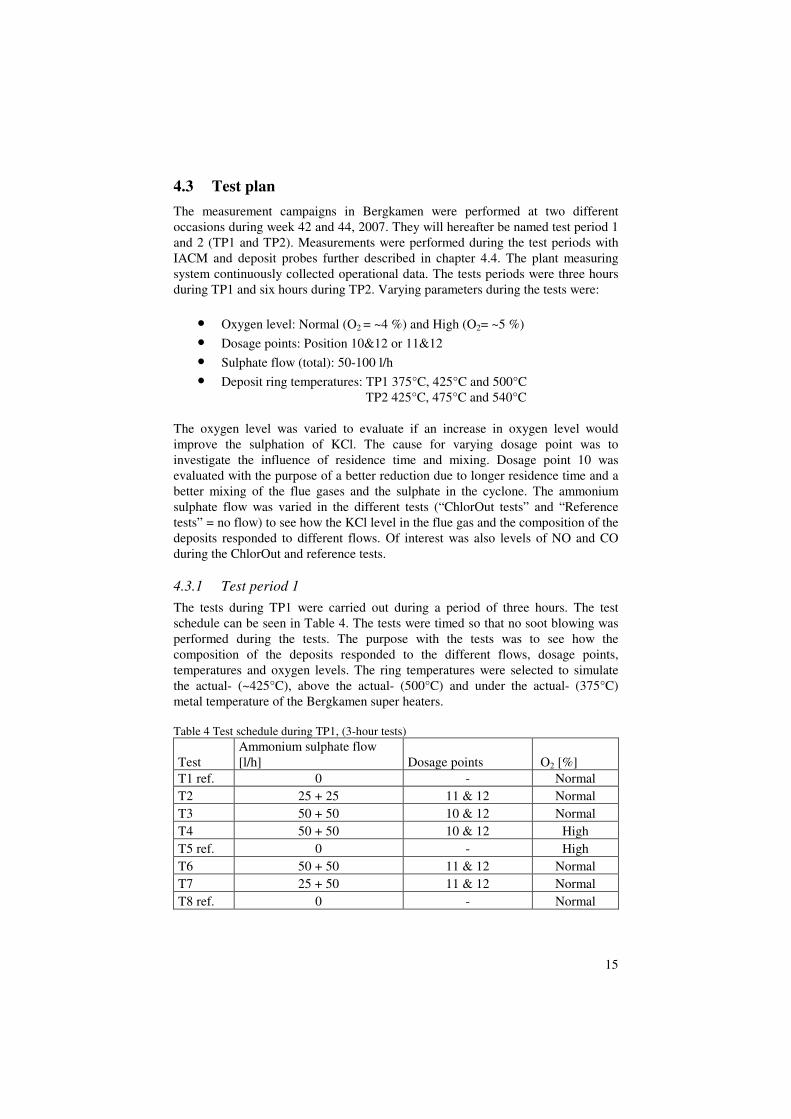
4.3 Test plan
The measurement campaigns in Bergkamen were performed at two different occasions during week 42 and 44, 2007. They will hereafter be named test period 1 and 2 (TP1 and TP2). Measurements were performed during the test periods with IACM and deposit probes further described in chapter 4.4. The plant measuring system continuously collected operational data. The tests periods were three hours during TP1 and six hours during TP2. Varying parameters during the tests were:
• Oxygen level: Normal (O2 = ~4 %) and High (O2= ~5 %)
• Dosage points: Position 10&12 or 11&12
• Sulphate flow (total): 50-100 l/h
• Deposit ring temperatures: TP1 375°C, 425°C and 500°C TP2 425°C, 475°C and 540°C
The oxygen level was varied to evaluate if an increase in oxygen level would improve the sulphation of KCl. The cause for varying dosage point was to investigate the influence of residence time and mixing. Dosage point 10 was evaluated with the purpose of a better reduction due to longer residence time and a better mixing of the flue gases and the sulphate in the cyclone. The ammonium sulphate flow was varied in the different tests (“ChlorOut tests” and “Reference tests” = no flow) to see how the KCl level in the flue gas and the composition of the deposits responded to different flows. Of interest was also levels of NO and CO during the ChlorOut and reference tests. 4.3.1 Test period 1
The tests during TP1 were carried out during a period of three hours. The test schedule can be seen in Table 4. The tests were timed so that no soot blowing was performed during the tests. The purpose with the tests was to see how the composition of the deposits responded to the different flows, dosage points, temperatures and oxygen levels. The ring temperatures were selected to simulate the actual- (~425°C), above the actual- (500°C) and under the actual- (375°C) metal temperature of the Bergkamen super heaters. Table 4 Test schedule during TP1, (3-hour tests)
Test Ammonium sulphate flow [l/h] Dosage points O2 [%]
T1 ref. 0 - Normal T2 25 + 25 11 & 12 Normal T3 50 + 50 10 & 12 Normal T4 50 + 50 10 & 12 High T5 ref. 0 - High T6 50 + 50 11 & 12 Normal T7 25 + 50 11 & 12 Normal T8 ref. 0 - Normal
16
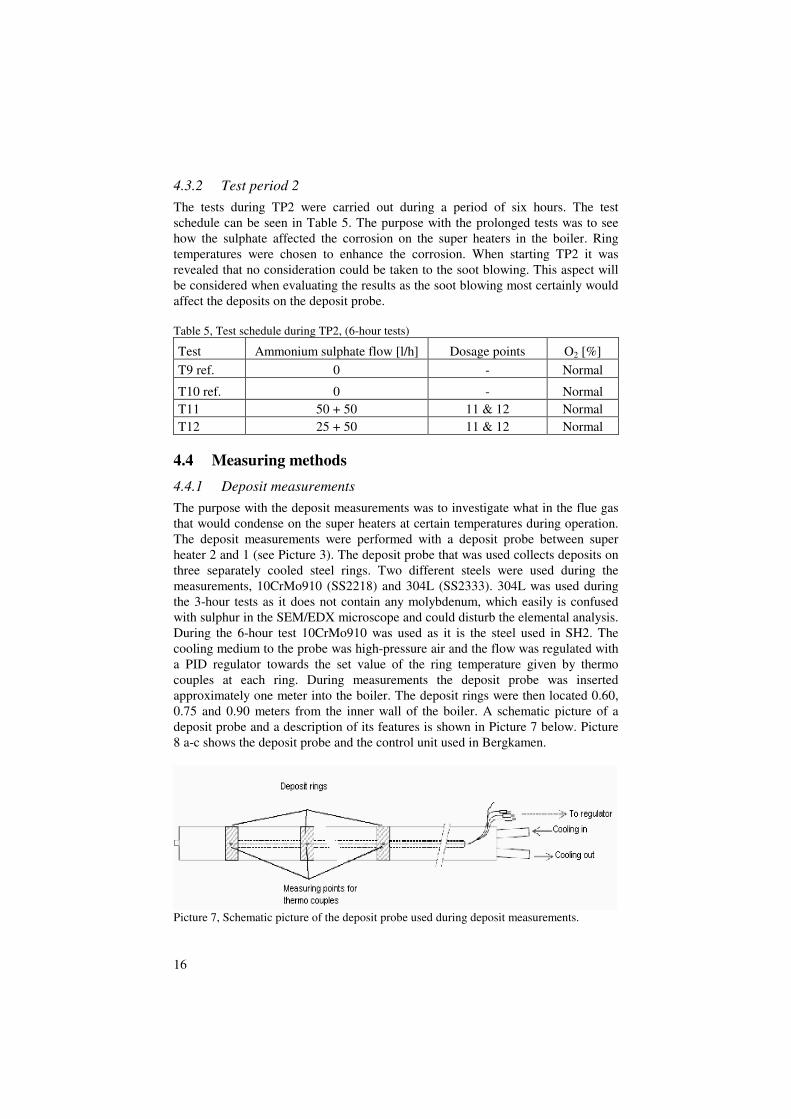
4.3.2 Test period 2
The tests during TP2 were carried out during a period of six hours. The test schedule can be seen in Table 5. The purpose with the prolonged tests was to see how the sulphate affected the corrosion on the super heaters in the boiler. Ring temperatures were chosen to enhance the corrosion. When starting TP2 it was revealed that no consideration could be taken to the soot blowing. This aspect will be considered when evaluating the results as the soot blowing most certainly would affect the deposits on the deposit probe. Table 5, Test schedule during TP2, (6-hour tests)
Test Ammonium sulphate flow [l/h] Dosage points O2 [%] T9 ref. 0 - Normal
T10 ref. 0 - Normal T11 50 + 50 11 & 12 Normal T12 25 + 50 11 & 12 Normal
4.4 Measuring methods
4.4.1 Deposit measurements
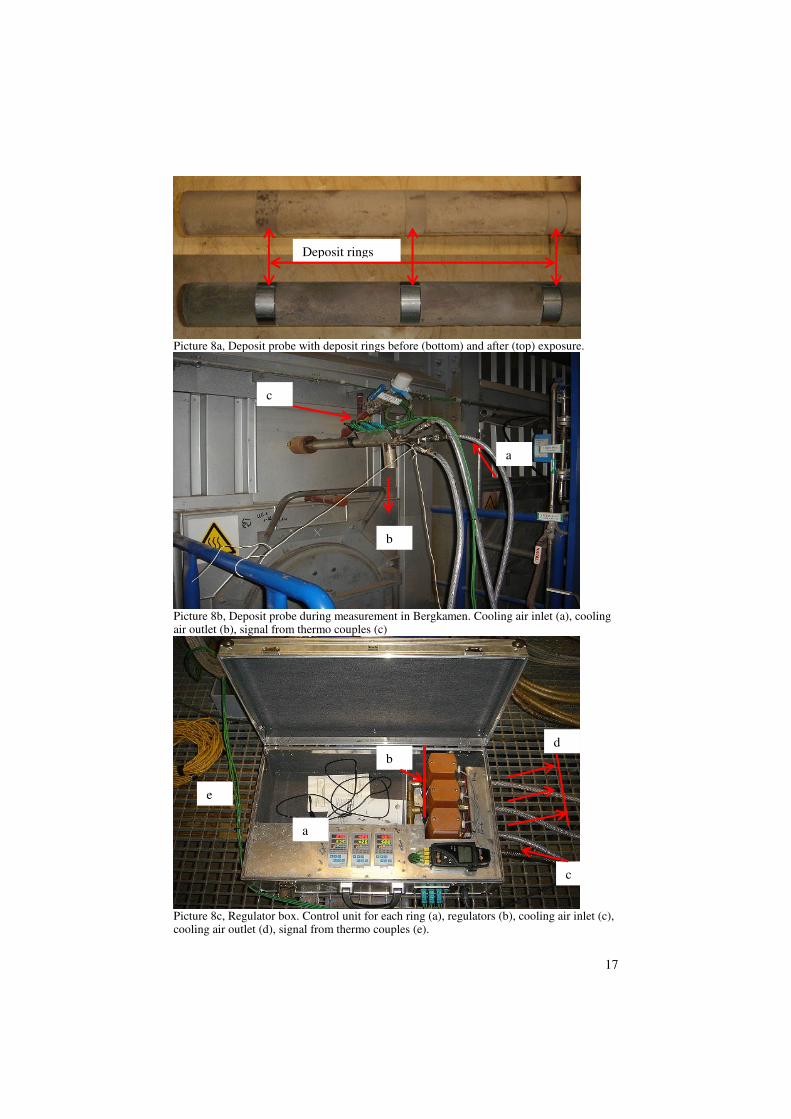
The purpose with the deposit measurements was to investigate what in the flue gas that would condense on the super heaters at certain temperatures during operation. The deposit measurements were performed with a deposit probe between super heater 2 and 1 (see Picture 3). The deposit probe that was used collects deposits on three separately cooled steel rings. Two different steels were used during the measurements, 10CrMo910 (SS2218) and 304L (SS2333). 304L was used during the 3-hour tests as it does not contain any molybdenum, which easily is confused with sulphur in the SEM/EDX microscope and could disturb the elemental analysis. During the 6-hour test 10CrMo910 was used as it is the steel used in SH2. The cooling medium to the probe was high-pressure air and the flow was regulated with a PID regulator towards the set value of the ring temperature given by thermo couples at each ring. During measurements the deposit probe was inserted approximately one meter into the boiler. The deposit rings were then located 0.60, 0.75 and 0.90 meters from the inner wall of the boiler. A schematic picture of a deposit probe and a description of its features is shown in Picture 7 below. Picture 8 a-c shows the deposit probe and the control unit used in Bergkamen.
Picture 7, Schematic picture of the deposit probe used during deposit measurements.
17
Picture 8a, Deposit probe with deposit rings before (bottom) and after (top) exposure.
Picture 8b, Deposit probe during measurement in Bergkamen. Cooling air inlet (a), cooling air outlet (b), signal from thermo couples (c)
Picture 8c, Regulator box. Control unit for each ring (a), regulators (b), cooling air inlet (c), cooling air outlet (d), signal from thermo couples (e).
a
b
c
b d
c
e
a
Deposit rings
18
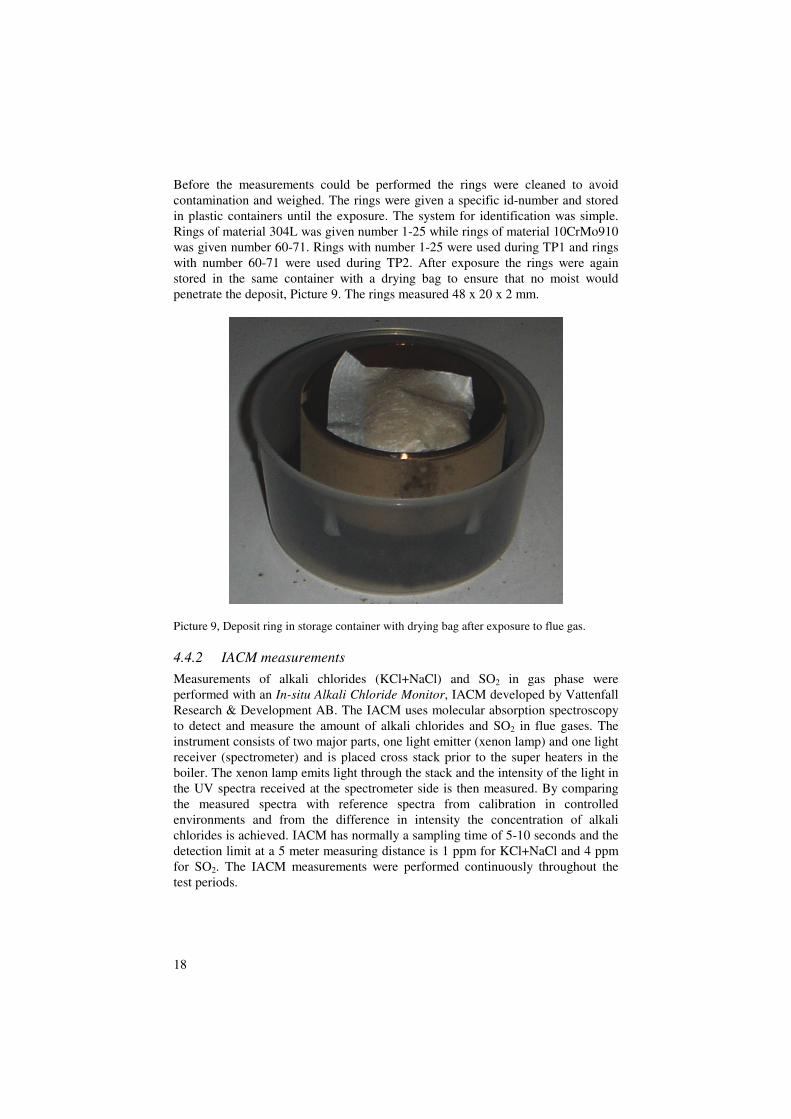
Before the measurements could be performed the rings were cleaned to avoid contamination and weighed. The rings were given a specific id-number and stored in plastic containers until the exposure. The system for identification was simple. Rings of material 304L was given number 1-25 while rings of material 10CrMo910 was given number 60-71. Rings with number 1-25 were used during TP1 and rings with number 60-71 were used during TP2. After exposure the rings were again stored in the same container with a drying bag to ensure that no moist would penetrate the deposit, Picture 9. The rings measured 48 x 20 x 2 mm.
Picture 9, Deposit ring in storage container with drying bag after exposure to flue gas. 4.4.2 IACM measurements
Measurements of alkali chlorides (KCl+NaCl) and SO2 in gas phase were performed with an In-situ Alkali Chloride Monitor, IACM developed by Vattenfall Research & Development AB. The IACM uses molecular absorption spectroscopy to detect and measure the amount of alkali chlorides and SO2 in flue gases. The instrument consists of two major parts, one light emitter (xenon lamp) and one light receiver (spectrometer) and is placed cross stack prior to the super heaters in the boiler. The xenon lamp emits light through the stack and the intensity of the light in the UV spectra received at the spectrometer side is then measured. By comparing the measured spectra with reference spectra from calibration in controlled environments and from the difference in intensity the concentration of alkali chlorides is achieved. IACM has normally a sampling time of 5-10 seconds and the detection limit at a 5 meter measuring distance is 1 ppm for KCl+NaCl and 4 ppm for SO2. The IACM measurements were performed continuously throughout the test periods.
19
4.4.3 Operational data
Data for operating conditions were obtained from the plants own measuring systems. These data include among others, boiler loads, various temperatures, levels of NO, CO, HCl, SO2 and O2. SO2 and O2 were measured directly after the super heaters while HCl, NO and CO was measured after the flue gas filter prior to the stack. 4.5 Analytical methods
4.5.1 SEM/EDX analyses
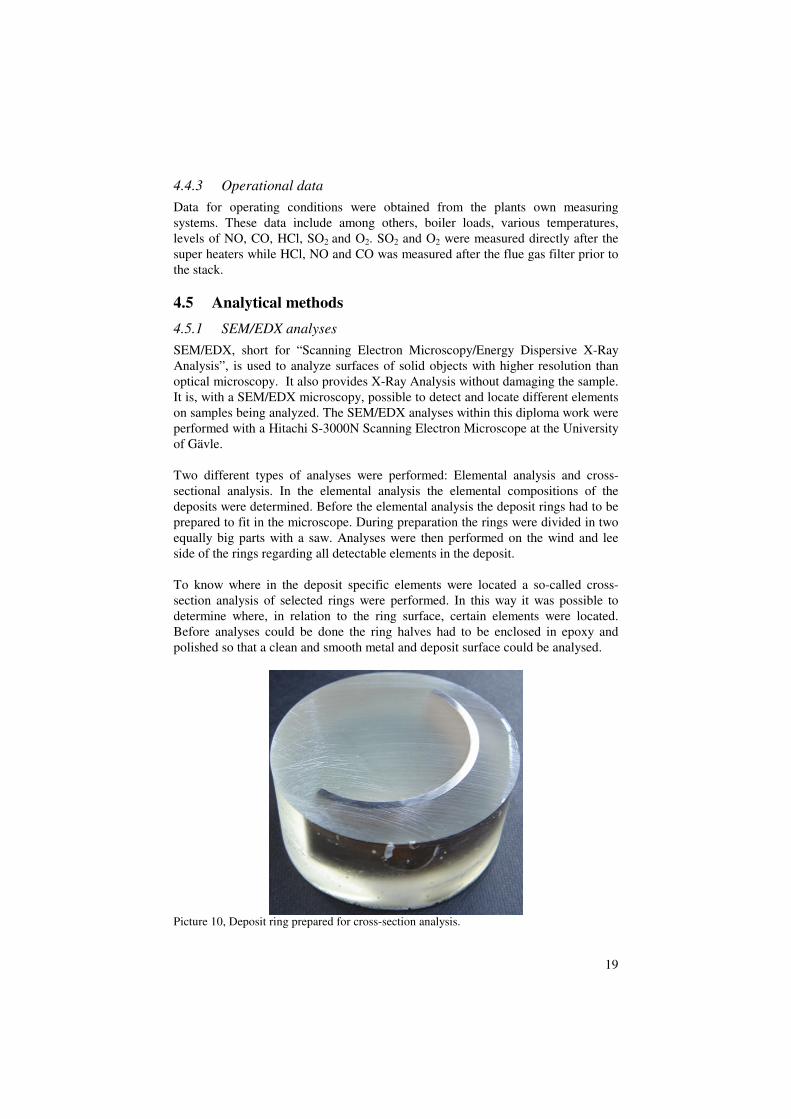
SEM/EDX, short for “Scanning Electron Microscopy/Energy Dispersive X-Ray Analysis”, is used to analyze surfaces of solid objects with higher resolution than optical microscopy. It also provides X-Ray Analysis without damaging the sample. It is, with a SEM/EDX microscopy, possible to detect and locate different elements on samples being analyzed. The SEM/EDX analyses within this diploma work were performed with a Hitachi S-3000N Scanning Electron Microscope at the University of Gävle. Two different types of analyses were performed: Elemental analysis and cross-sectional analysis. In the elemental analysis the elemental compositions of the deposits were determined. Before the elemental analysis the deposit rings had to be prepared to fit in the microscope. During preparation the rings were divided in two equally big parts with a saw. Analyses were then performed on the wind and lee side of the rings regarding all detectable elements in the deposit. To know where in the deposit specific elements were located a so-called cross-section analysis of selected rings were performed. In this way it was possible to determine where, in relation to the ring surface, certain elements were located. Before analyses could be done the ring halves had to be enclosed in epoxy and polished so that a clean and smooth metal and deposit surface could be analysed.
Picture 10, Deposit ring prepared for cross-section analysis.
20
5 Results
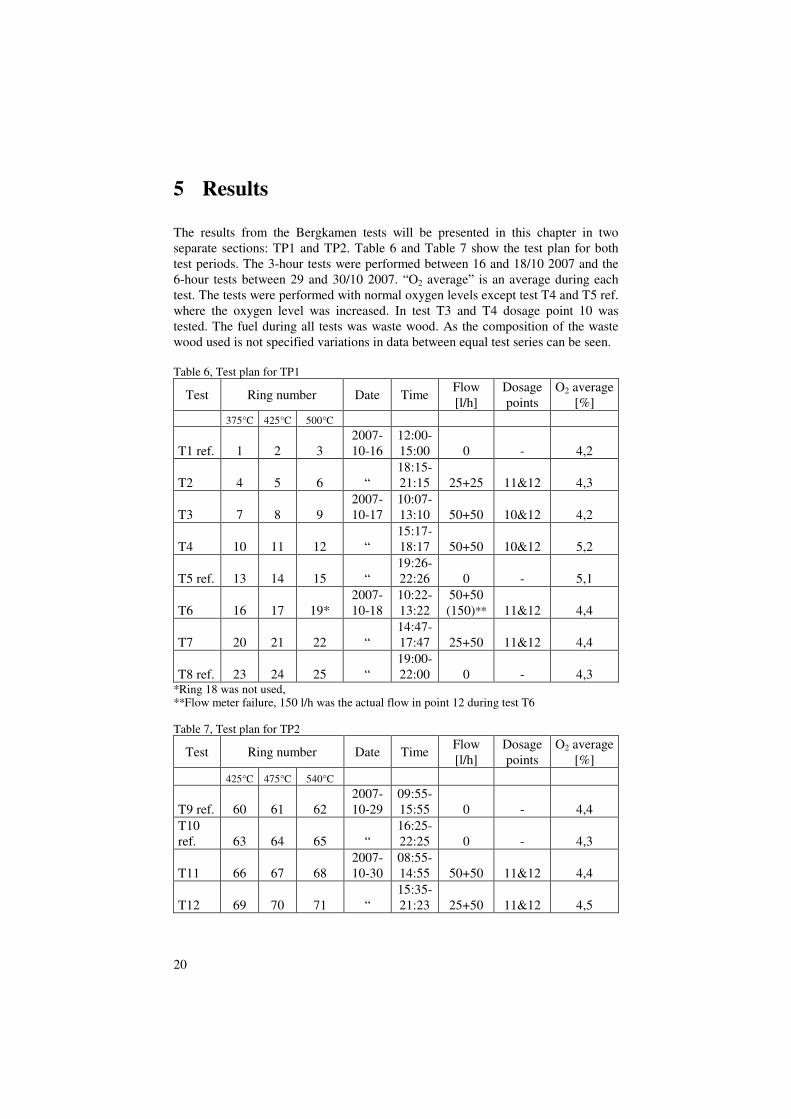
The results from the Bergkamen tests will be presented in this chapter in two separate sections: TP1 and TP2. Table 6 and Table 7 show the test plan for both test periods. The 3-hour tests were performed between 16 and 18/10 2007 and the 6-hour tests between 29 and 30/10 2007. “O2 average” is an average during each test. The tests were performed with normal oxygen levels except test T4 and T5 ref. where the oxygen level was increased. In test T3 and T4 dosage point 10 was tested. The fuel during all tests was waste wood. As the composition of the waste wood used is not specified variations in data between equal test series can be seen. Table 6, Test plan for TP1
Test Ring number Date Time Flow [l/h]
Dosage points
O2 average [%]
375°C 425°C 500°C
T1 ref. 1 2 3 2007-10-16
12:00- 15:00 0 - 4,2
T2 4 5 6 “ 18:15- 21:15 25+25 11&12 4,3
T3 7 8 9 2007-10-17
10:07- 13:10 50+50 10&12 4,2
T4 10 11 12 “ 15:17- 18:17 50+50 10&12 5,2
T5 ref. 13 14 15 “ 19:26- 22:26 0 - 5,1
T6 16 17 19* 2007-10-18
10:22- 13:22
50+50 (150)** 11&12 4,4
T7 20 21 22 “ 14:47- 17:47 25+50 11&12 4,4
T8 ref. 23 24 25 “ 19:00- 22:00 0 - 4,3
*Ring 18 was not used, **Flow meter failure, 150 l/h was the actual flow in point 12 during test T6 Table 7, Test plan for TP2
Test Ring number Date Time Flow [l/h]
Dosage points
O2 average [%]
425°C 475°C 540°C
T9 ref. 60 61 62 2007-10-29
09:55- 15:55 0 - 4,4
T10 ref. 63 64 65 “
16:25- 22:25 0 - 4,3
T11 66 67 68 2007-10-30
08:55- 14:55 50+50 11&12 4,4
T12 69 70 71 “ 15:35- 21:23 25+50 11&12 4,5
21
5.1 Test period 1
5.1.1 Operational data
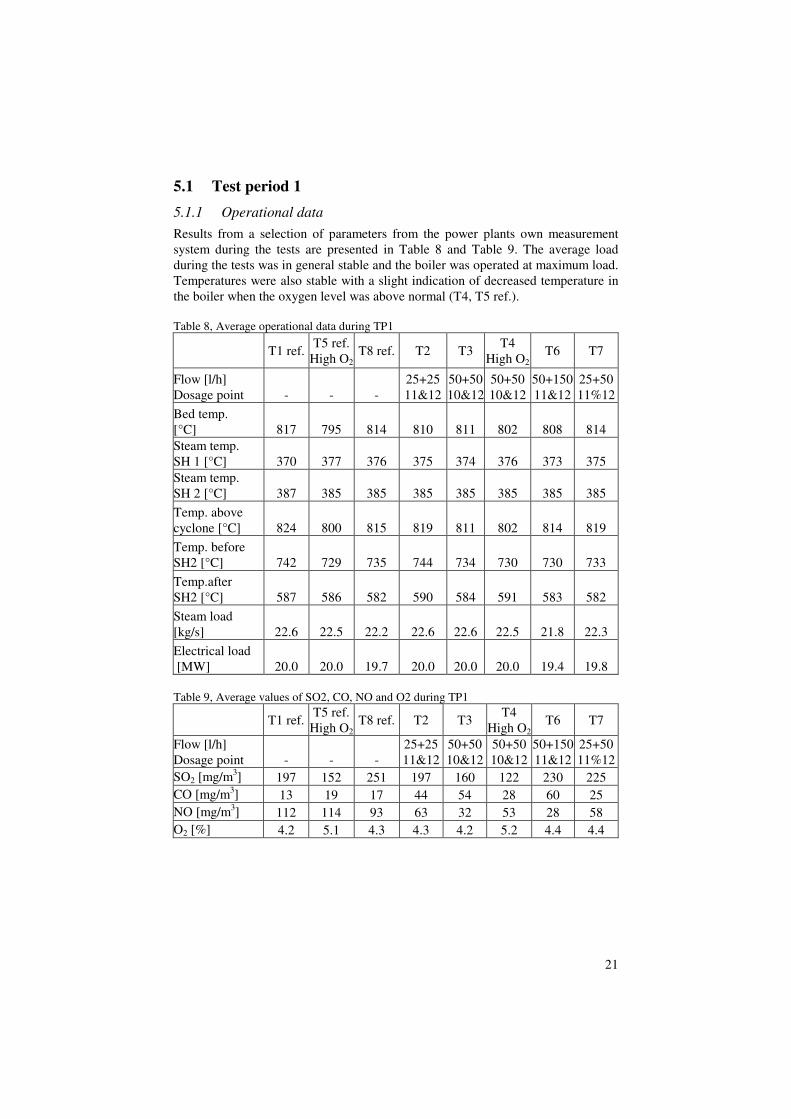
Results from a selection of parameters from the power plants own measurement system during the tests are presented in Table 8 and Table 9. The average load during the tests was in general stable and the boiler was operated at maximum load. Temperatures were also stable with a slight indication of decreased temperature in the boiler when the oxygen level was above normal (T4, T5 ref.). Table 8, Average operational data during TP1
T1 ref.
T5 ref. High O2
T8 ref. T2 T3 T4
High O2 T6 T7
Flow [l/h] Dosage point - - -
25+25 11&12
50+50 10&12
50+50 10&12
50+150 11&12
25+50 11%12
Bed temp. [°C] 817 795 814 810 811 802 808 814 Steam temp. SH 1 [°C] 370 377 376 375 374 376 373 375 Steam temp. SH 2 [°C] 387 385 385 385 385 385 385 385
Temp. above cyclone [°C] 824 800 815 819 811 802 814 819
Temp. before SH2 [°C] 742 729 735 744 734 730 730 733
Temp.after SH2 [°C] 587 586 582 590 584 591 583 582
Steam load [kg/s] 22.6 22.5 22.2 22.6 22.6 22.5 21.8 22.3
Electrical load [MW] 20.0 20.0 19.7 20.0 20.0 20.0 19.4 19.8 Table 9, Average values of SO2, CO, NO and O2 during TP1
T1 ref. T5 ref.
High O2 T8 ref. T2 T3
T4 High O2
T6 T7
Flow [l/h] Dosage point - - -
25+25 11&12
50+50 10&12
50+50 10&12
50+150 11&12
25+50 11%12
SO2 [mg/m3] 197 152 251 197 160 122 230 225 CO [mg/m3] 13 19 17 44 54 28 60 25 NO [mg/m3] 112 114 93 63 32 53 28 58 O2 [%] 4.2 5.1 4.3 4.3 4.2 5.2 4.4 4.4
22
5.1.1.1 SO2, CO and NO NO drops as previewed during the ChlorOut tests due to reaction R11 and the overall trend is that CO rises somewhat when adding ammonium sulphate to the flue gas. This could possible be explained by increased competition for OH radicals as described in 3.6. Position 10 seems to have an inhibiting effect on the CO oxidation but it is hard to predict if the high CO level in test T3 is entirely due to the dosage point. The increased oxygen level in T4 lowers CO and increases NO, compared to T3. Test T6 also show a high CO level indicating that high ammonium sulphate flows also could result in somewhat higher CO levels. There is a slight indication that position 11 gives higher SO2 levels than position 10. When increasing the oxygen level in test T4 the test show even lower SO2 levels than the reference tests. A reduction in SO2, when increasing the oxygen level, can also be observed in T5 ref.
SO2,CO and NO
0
50
100
150
200
250
300
T1
re
f.
T5
re
f.
T8
re
f
T2
T3
T4
T6
T7
[mg
/m3
]
SO2 CO NO
Figure 1, SO2, CO and NO in boiler during TP1
The results from the chapter could be summarized as follows: NO decreases and
CO increases during the ChlorOut tests compared to the reference tests. SO2
varies somewhat but with no clear trend.
5.1.2 IACM
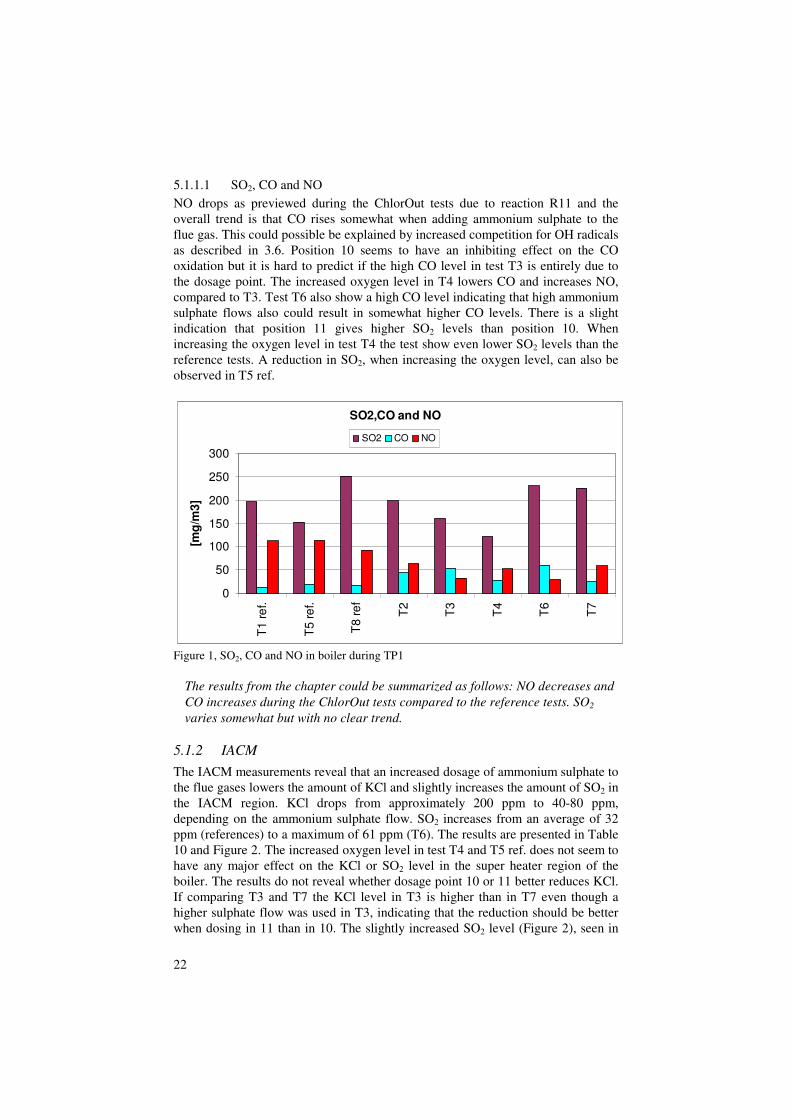
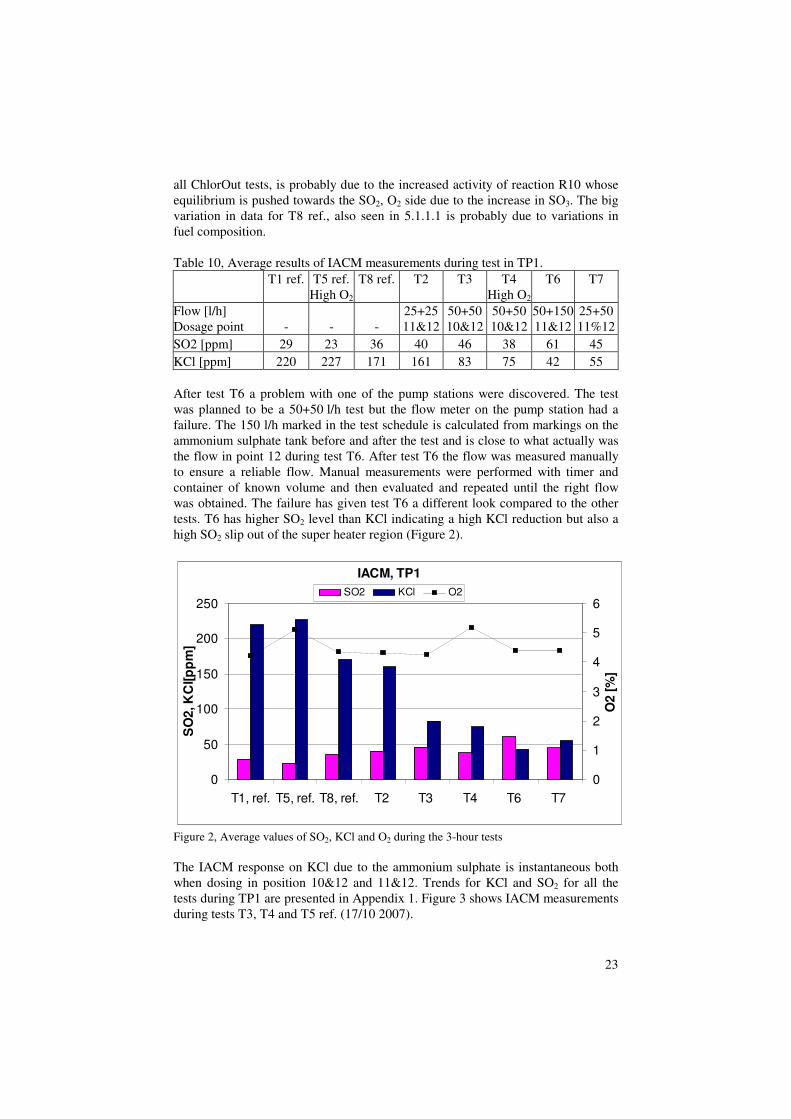
The IACM measurements reveal that an increased dosage of ammonium sulphate to the flue gases lowers the amount of KCl and slightly increases the amount of SO2 in the IACM region. KCl drops from approximately 200 ppm to 40-80 ppm, depending on the ammonium sulphate flow. SO2 increases from an average of 32 ppm (references) to a maximum of 61 ppm (T6). The results are presented in Table 10 and Figure 2. The increased oxygen level in test T4 and T5 ref. does not seem to have any major effect on the KCl or SO2 level in the super heater region of the boiler. The results do not reveal whether dosage point 10 or 11 better reduces KCl. If comparing T3 and T7 the KCl level in T3 is higher than in T7 even though a higher sulphate flow was used in T3, indicating that the reduction should be better when dosing in 11 than in 10. The slightly increased SO2 level (Figure 2), seen in
23
all ChlorOut tests, is probably due to the increased activity of reaction R10 whose equilibrium is pushed towards the SO2, O2 side due to the increase in SO3. The big variation in data for T8 ref., also seen in 5.1.1.1 is probably due to variations in fuel composition. Table 10, Average results of IACM measurements during test in TP1.
T1 ref. T5 ref.
High O2 T8 ref. T2 T3 T4
High O2 T6 T7
Flow [l/h] Dosage point - - -
25+25 11&12
50+50 10&12
50+50 10&12
50+150 11&12
25+50 11%12
SO2 [ppm] 29 23 36 40 46 38 61 45 KCl [ppm] 220 227 171 161 83 75 42 55 After test T6 a problem with one of the pump stations were discovered. The test was planned to be a 50+50 l/h test but the flow meter on the pump station had a failure. The 150 l/h marked in the test schedule is calculated from markings on the ammonium sulphate tank before and after the test and is close to what actually was the flow in point 12 during test T6. After test T6 the flow was measured manually to ensure a reliable flow. Manual measurements were performed with timer and container of known volume and then evaluated and repeated until the right flow was obtained. The failure has given test T6 a different look compared to the other tests. T6 has higher SO2 level than KCl indicating a high KCl reduction but also a high SO2 slip out of the super heater region (Figure 2).
IACM, TP1
0
50
100
150
200
250
T1, ref. T5, ref. T8, ref. T2 T3 T4 T6 T7
SO
2, K
Cl[p
pm
]
0
1
2
3
4
5
6O
2 [
%]
SO2 KCl O2
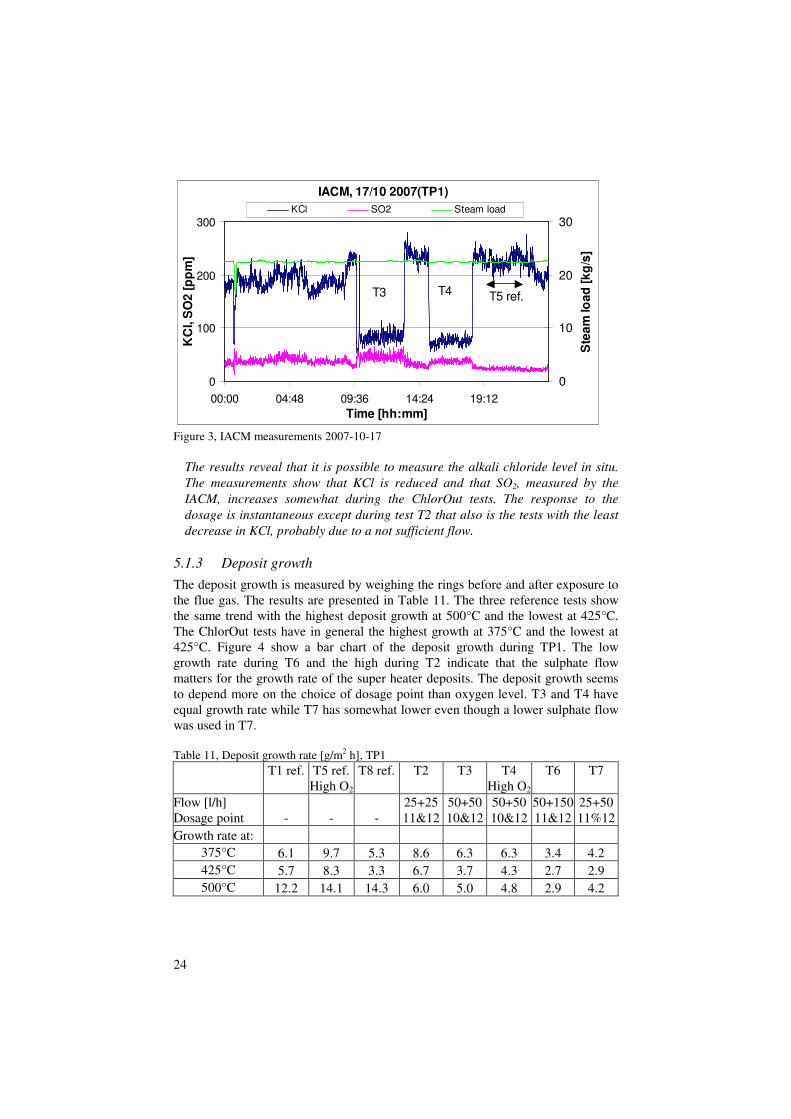
Figure 2, Average values of SO2, KCl and O2 during the 3-hour tests The IACM response on KCl due to the ammonium sulphate is instantaneous both when dosing in position 10&12 and 11&12. Trends for KCl and SO2 for all the tests during TP1 are presented in Appendix 1. Figure 3 shows IACM measurements during tests T3, T4 and T5 ref. (17/10 2007).
24
IACM, 17/10 2007(TP1)
0
100
200
300
00:00 04:48 09:36 14:24 19:12
Time [hh:mm]
KC
l, S
O2 [
pp
m]
0
10
20
30
Ste
am
lo
ad
[k
g/s
]
KCl SO2 Steam load
T3 T4 T5 ref.
Figure 3, IACM measurements 2007-10-17
The results reveal that it is possible to measure the alkali chloride level in situ.
The measurements show that KCl is reduced and that SO2, measured by the
IACM, increases somewhat during the ChlorOut tests. The response to the
dosage is instantaneous except during test T2 that also is the tests with the least
decrease in KCl, probably due to a not sufficient flow.
5.1.3 Deposit growth
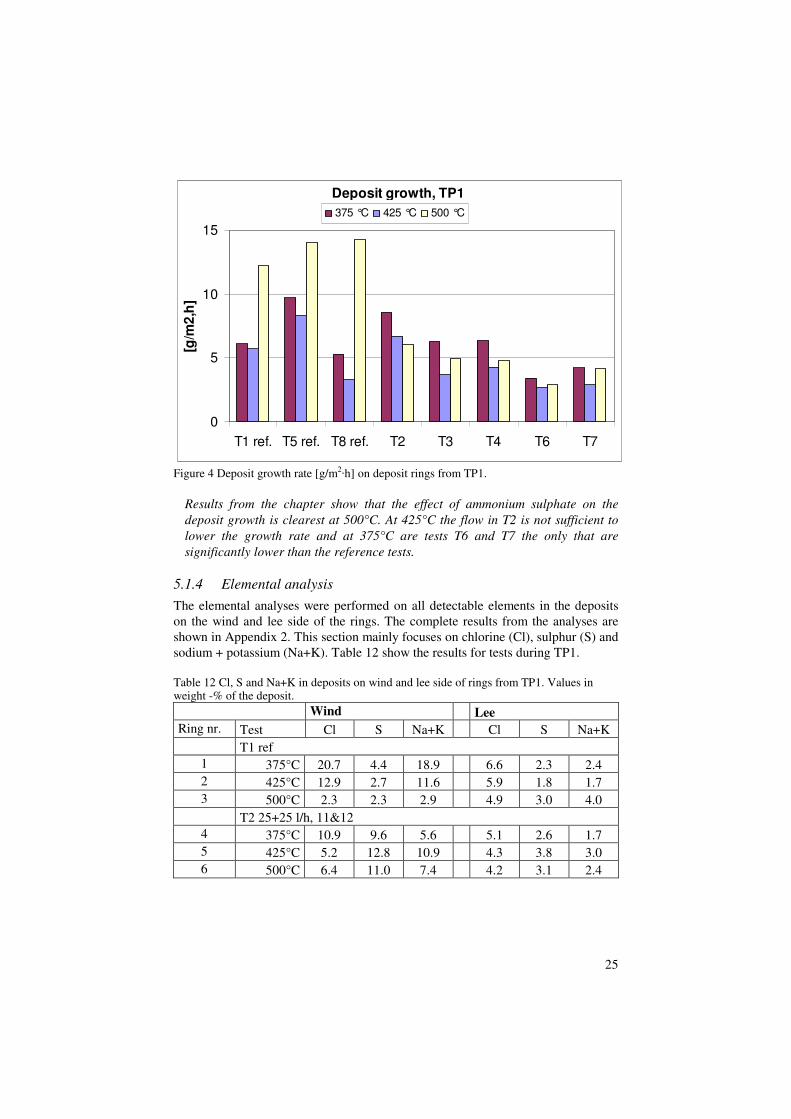
The deposit growth is measured by weighing the rings before and after exposure to the flue gas. The results are presented in Table 11. The three reference tests show the same trend with the highest deposit growth at 500°C and the lowest at 425°C. The ChlorOut tests have in general the highest growth at 375°C and the lowest at 425°C. Figure 4 show a bar chart of the deposit growth during TP1. The low growth rate during T6 and the high during T2 indicate that the sulphate flow matters for the growth rate of the super heater deposits. The deposit growth seems to depend more on the choice of dosage point than oxygen level. T3 and T4 have equal growth rate while T7 has somewhat lower even though a lower sulphate flow was used in T7. Table 11, Deposit growth rate [g/m2 h], TP1
T1 ref. T5 ref.
High O2 T8 ref. T2 T3 T4
High O2 T6 T7
Flow [l/h] Dosage point - - -
25+25 11&12
50+50 10&12
50+50 10&12
50+150 11&12
25+50 11%12
Growth rate at: 375°C 6.1 9.7 5.3 8.6 6.3 6.3 3.4 4.2 425°C 5.7 8.3 3.3 6.7 3.7 4.3 2.7 2.9 500°C 12.2 14.1 14.3 6.0 5.0 4.8 2.9 4.2
25
Deposit growth, TP1
0
5
10
15
T1 ref. T5 ref. T8 ref. T2 T3 T4 T6 T7
[g/m
2,h
]
375 °C 425 °C 500 °C
Figure 4 Deposit growth rate [g/m2
·h] on deposit rings from TP1.
Results from the chapter show that the effect of ammonium sulphate on the
deposit growth is clearest at 500°C. At 425°C the flow in T2 is not sufficient to
lower the growth rate and at 375°C are tests T6 and T7 the only that are
significantly lower than the reference tests.
5.1.4 Elemental analysis
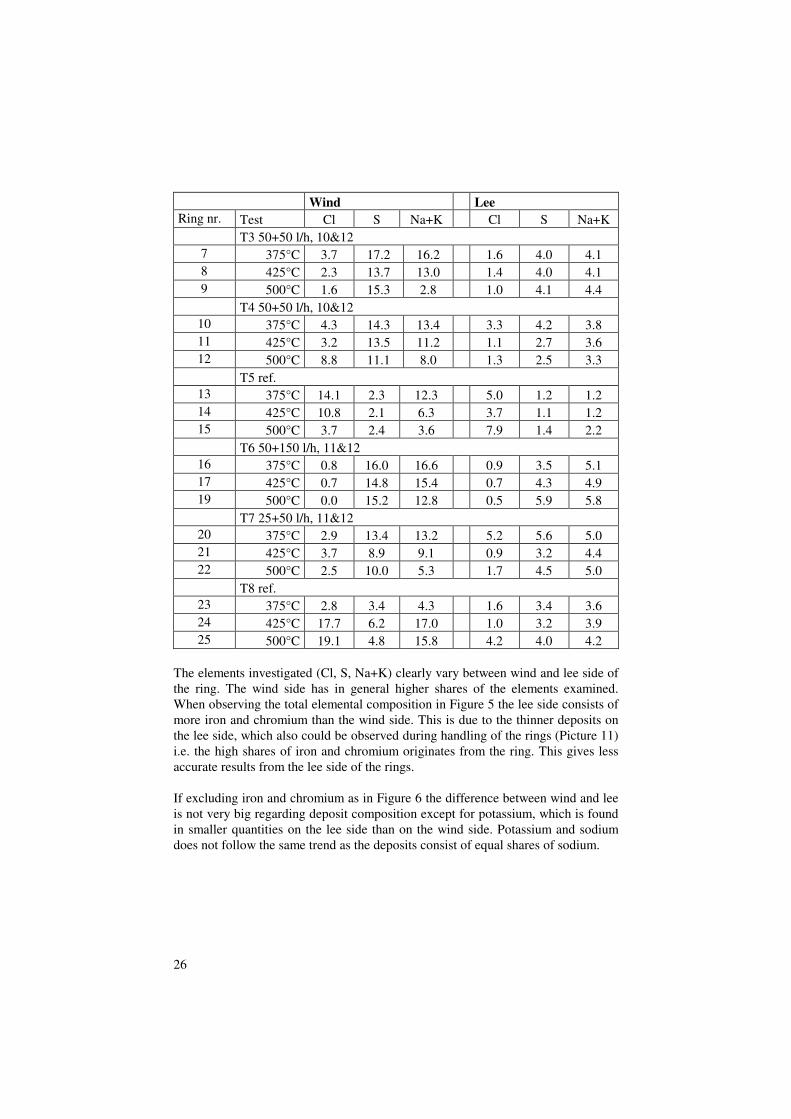
The elemental analyses were performed on all detectable elements in the deposits on the wind and lee side of the rings. The complete results from the analyses are shown in Appendix 2. This section mainly focuses on chlorine (Cl), sulphur (S) and sodium + potassium (Na+K). Table 12 show the results for tests during TP1. Table 12 Cl, S and Na+K in deposits on wind and lee side of rings from TP1. Values in weight -% of the deposit. Wind Lee
Ring nr. Test Cl S Na+K Cl S Na+K T1 ref
1 375°C 20.7 4.4 18.9 6.6 2.3 2.4 2 425°C 12.9 2.7 11.6 5.9 1.8 1.7 3 500°C 2.3 2.3 2.9 4.9 3.0 4.0 T2 25+25 l/h, 11&12
4 375°C 10.9 9.6 5.6 5.1 2.6 1.7 5 425°C 5.2 12.8 10.9 4.3 3.8 3.0 6 500°C 6.4 11.0 7.4 4.2 3.1 2.4
26
Wind Lee
Ring nr. Test Cl S Na+K Cl S Na+K T3 50+50 l/h, 10&12
7 375°C 3.7 17.2 16.2 1.6 4.0 4.1 8 425°C 2.3 13.7 13.0 1.4 4.0 4.1 9 500°C 1.6 15.3 2.8 1.0 4.1 4.4 T4 50+50 l/h, 10&12
10 375°C 4.3 14.3 13.4 3.3 4.2 3.8 11 425°C 3.2 13.5 11.2 1.1 2.7 3.6 12 500°C 8.8 11.1 8.0 1.3 2.5 3.3
T5 ref. 13 375°C 14.1 2.3 12.3 5.0 1.2 1.2 14 425°C 10.8 2.1 6.3 3.7 1.1 1.2 15 500°C 3.7 2.4 3.6 7.9 1.4 2.2
T6 50+150 l/h, 11&12 16 375°C 0.8 16.0 16.6 0.9 3.5 5.1 17 425°C 0.7 14.8 15.4 0.7 4.3 4.9 19 500°C 0.0 15.2 12.8 0.5 5.9 5.8
T7 25+50 l/h, 11&12 20 375°C 2.9 13.4 13.2 5.2 5.6 5.0 21 425°C 3.7 8.9 9.1 0.9 3.2 4.4 22 500°C 2.5 10.0 5.3 1.7 4.5 5.0
T8 ref. 23 375°C 2.8 3.4 4.3 1.6 3.4 3.6 24 425°C 17.7 6.2 17.0 1.0 3.2 3.9 25 500°C 19.1 4.8 15.8 4.2 4.0 4.2
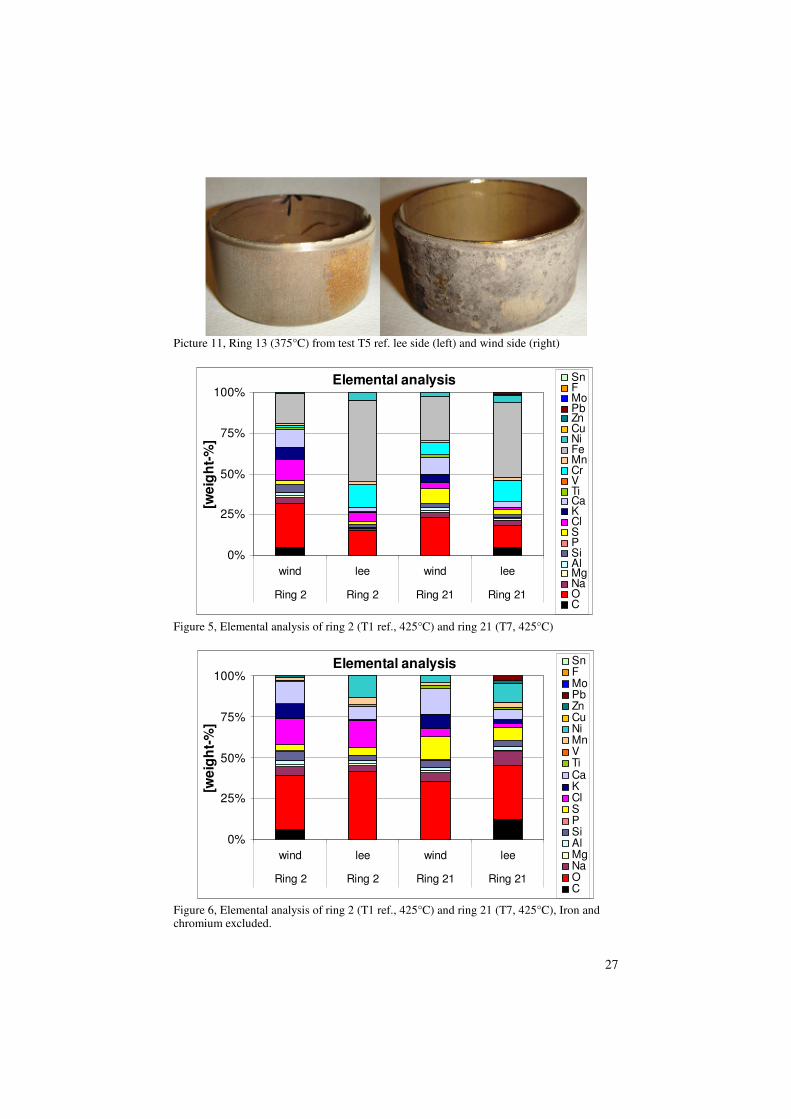
The elements investigated (Cl, S, Na+K) clearly vary between wind and lee side of the ring. The wind side has in general higher shares of the elements examined. When observing the total elemental composition in Figure 5 the lee side consists of more iron and chromium than the wind side. This is due to the thinner deposits on the lee side, which also could be observed during handling of the rings (Picture 11) i.e. the high shares of iron and chromium originates from the ring. This gives less accurate results from the lee side of the rings. If excluding iron and chromium as in Figure 6 the difference between wind and lee is not very big regarding deposit composition except for potassium, which is found in smaller quantities on the lee side than on the wind side. Potassium and sodium does not follow the same trend as the deposits consist of equal shares of sodium.
27
Picture 11, Ring 13 (375°C) from test T5 ref. lee side (left) and wind side (right)
Elemental analysis
0%
25%
50%
75%
100%
wind lee wind lee
Ring 2 Ring 2 Ring 21 Ring 21
[we
igh
t-%
]
SnFMoPbZnCuNiFeMnCrVTiCaKClSPSiAlMgNaOC
Figure 5, Elemental analysis of ring 2 (T1 ref., 425°C) and ring 21 (T7, 425°C)
Elemental analysis
0%
25%
50%
75%
100%
wind lee wind lee
Ring 2 Ring 2 Ring 21 Ring 21
[we
igh
t-%
]
SnFMoPbZnCuNiMnVTiCaKClSPSiAlMgNaOC
Figure 6, Elemental analysis of ring 2 (T1 ref., 425°C) and ring 21 (T7, 425°C), Iron and chromium excluded.
28
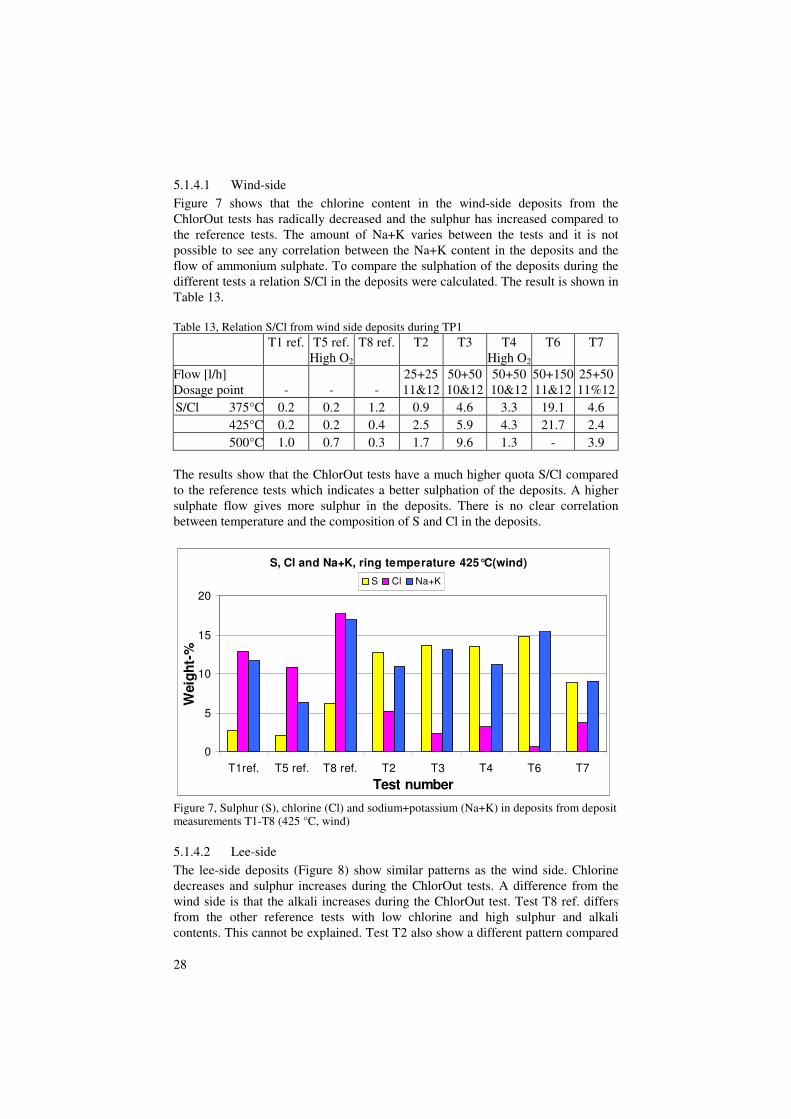
5.1.4.1 Wind-side Figure 7 shows that the chlorine content in the wind-side deposits from the ChlorOut tests has radically decreased and the sulphur has increased compared to the reference tests. The amount of Na+K varies between the tests and it is not possible to see any correlation between the Na+K content in the deposits and the flow of ammonium sulphate. To compare the sulphation of the deposits during the different tests a relation S/Cl in the deposits were calculated. The result is shown in Table 13. Table 13, Relation S/Cl from wind side deposits during TP1
T1 ref. T5 ref.
High O2 T8 ref. T2 T3 T4
High O2 T6 T7
Flow [l/h] Dosage point - - -
25+25 11&12
50+50 10&12
50+50 10&12
50+150 11&12
25+50 11%12
S/Cl 375°C 0.2 0.2 1.2 0.9 4.6 3.3 19.1 4.6 425°C 0.2 0.2 0.4 2.5 5.9 4.3 21.7 2.4 500°C 1.0 0.7 0.3 1.7 9.6 1.3 - 3.9
The results show that the ChlorOut tests have a much higher quota S/Cl compared to the reference tests which indicates a better sulphation of the deposits. A higher sulphate flow gives more sulphur in the deposits. There is no clear correlation between temperature and the composition of S and Cl in the deposits.
S, Cl and Na+K, ring temperature 425°C(wind)
0
5
10
15
20
T1ref. T5 ref. T8 ref. T2 T3 T4 T6 T7
Test number
Weig
ht-
%
S Cl Na+K
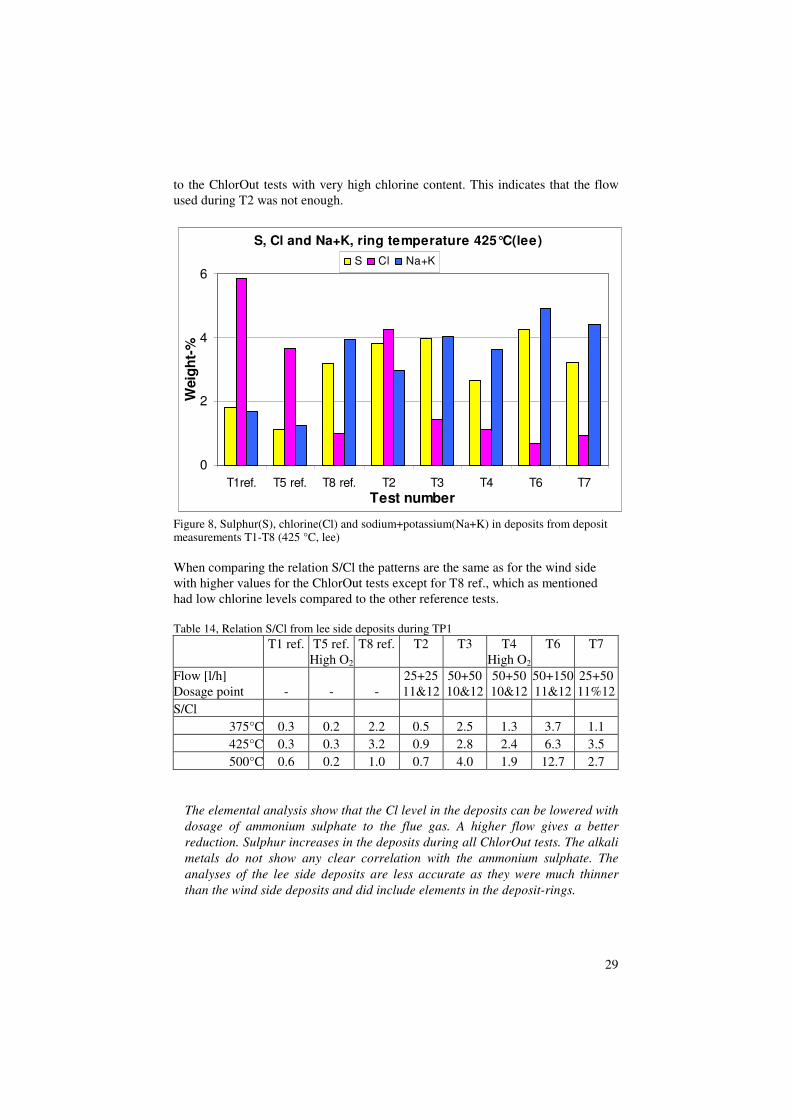
Figure 7, Sulphur (S), chlorine (Cl) and sodium+potassium (Na+K) in deposits from deposit measurements T1-T8 (425 °C, wind) 5.1.4.2 Lee-side The lee-side deposits (Figure 8) show similar patterns as the wind side. Chlorine decreases and sulphur increases during the ChlorOut tests. A difference from the wind side is that the alkali increases during the ChlorOut test. Test T8 ref. differs from the other reference tests with low chlorine and high sulphur and alkali contents. This cannot be explained. Test T2 also show a different pattern compared
29
to the ChlorOut tests with very high chlorine content. This indicates that the flow used during T2 was not enough.
S, Cl and Na+K, ring temperature 425°C(lee)
0
2
4
6
T1ref. T5 ref. T8 ref. T2 T3 T4 T6 T7
Test number
Weig
ht-
%
S Cl Na+K
Figure 8, Sulphur(S), chlorine(Cl) and sodium+potassium(Na+K) in deposits from deposit measurements T1-T8 (425 °C, lee) When comparing the relation S/Cl the patterns are the same as for the wind side with higher values for the ChlorOut tests except for T8 ref., which as mentioned had low chlorine levels compared to the other reference tests. Table 14, Relation S/Cl from lee side deposits during TP1
T1 ref. T5 ref.
High O2 T8 ref. T2 T3 T4
High O2 T6 T7
Flow [l/h] Dosage point - - -
25+25 11&12
50+50 10&12
50+50 10&12
50+150 11&12
25+50 11%12
S/Cl 375°C 0.3 0.2 2.2 0.5 2.5 1.3 3.7 1.1 425°C 0.3 0.3 3.2 0.9 2.8 2.4 6.3 3.5 500°C 0.6 0.2 1.0 0.7 4.0 1.9 12.7 2.7
The elemental analysis show that the Cl level in the deposits can be lowered with
dosage of ammonium sulphate to the flue gas. A higher flow gives a better
reduction. Sulphur increases in the deposits during all ChlorOut tests. The alkali
metals do not show any clear correlation with the ammonium sulphate. The
analyses of the lee side deposits are less accurate as they were much thinner
than the wind side deposits and did include elements in the deposit-rings.
30
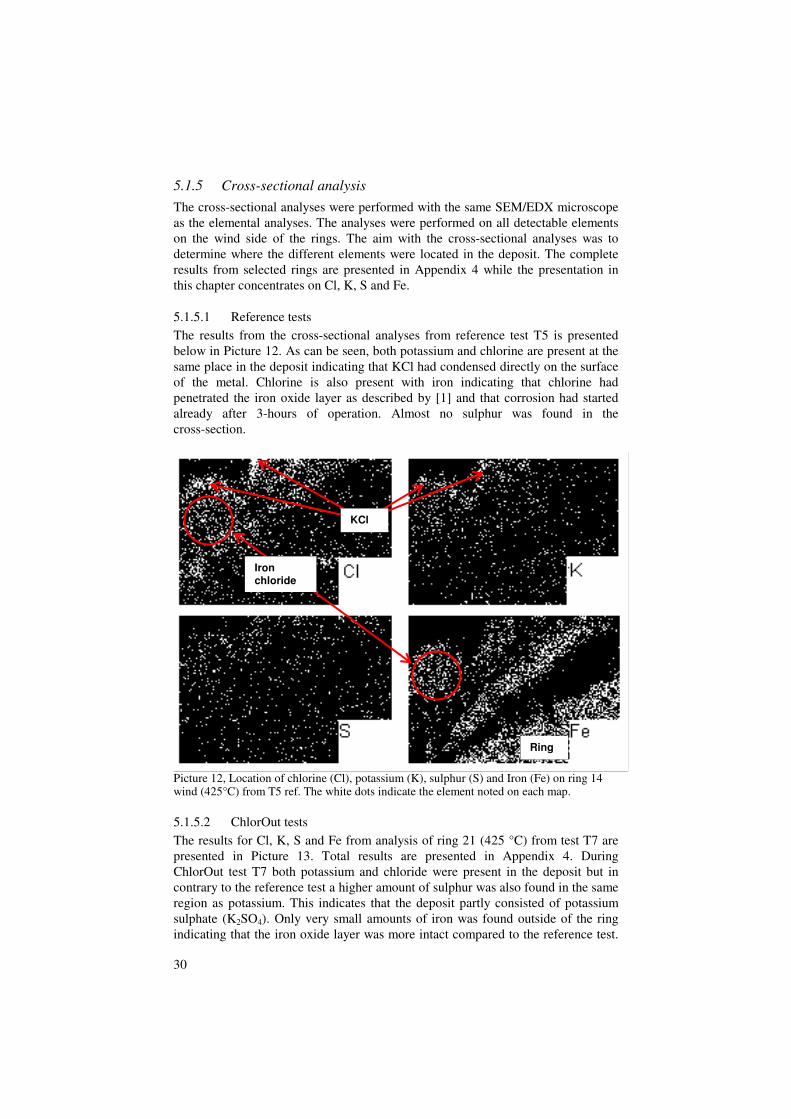
5.1.5 Cross-sectional analysis
The cross-sectional analyses were performed with the same SEM/EDX microscope as the elemental analyses. The analyses were performed on all detectable elements on the wind side of the rings. The aim with the cross-sectional analyses was to determine where the different elements were located in the deposit. The complete results from selected rings are presented in Appendix 4 while the presentation in this chapter concentrates on Cl, K, S and Fe. 5.1.5.1 Reference tests The results from the cross-sectional analyses from reference test T5 is presented below in Picture 12. As can be seen, both potassium and chlorine are present at the same place in the deposit indicating that KCl had condensed directly on the surface of the metal. Chlorine is also present with iron indicating that chlorine had penetrated the iron oxide layer as described by [1] and that corrosion had started already after 3-hours of operation. Almost no sulphur was found in the cross-section.
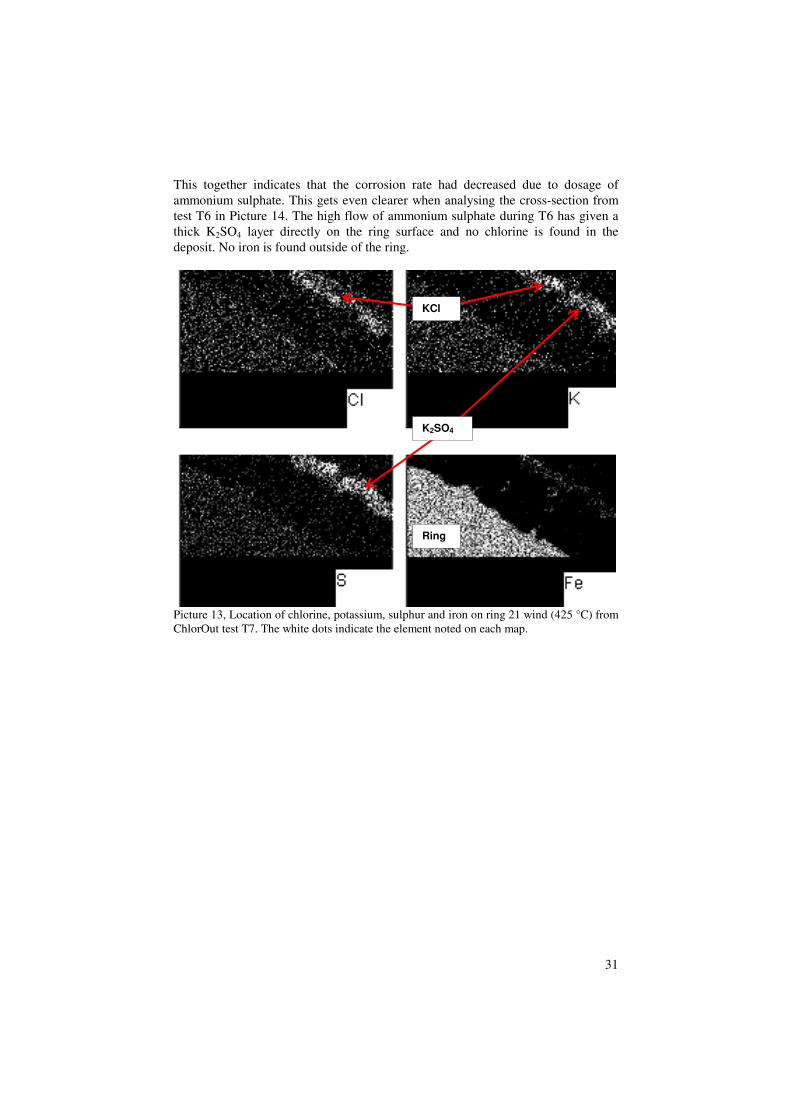
Picture 12, Location of chlorine (Cl), potassium (K), sulphur (S) and Iron (Fe) on ring 14 wind (425°C) from T5 ref. The white dots indicate the element noted on each map. 5.1.5.2 ChlorOut tests The results for Cl, K, S and Fe from analysis of ring 21 (425 °C) from test T7 are presented in Picture 13. Total results are presented in Appendix 4. During ChlorOut test T7 both potassium and chloride were present in the deposit but in contrary to the reference test a higher amount of sulphur was also found in the same region as potassium. This indicates that the deposit partly consisted of potassium sulphate (K2SO4). Only very small amounts of iron was found outside of the ring indicating that the iron oxide layer was more intact compared to the reference test.
Ring
KCl
Iron chloride
31
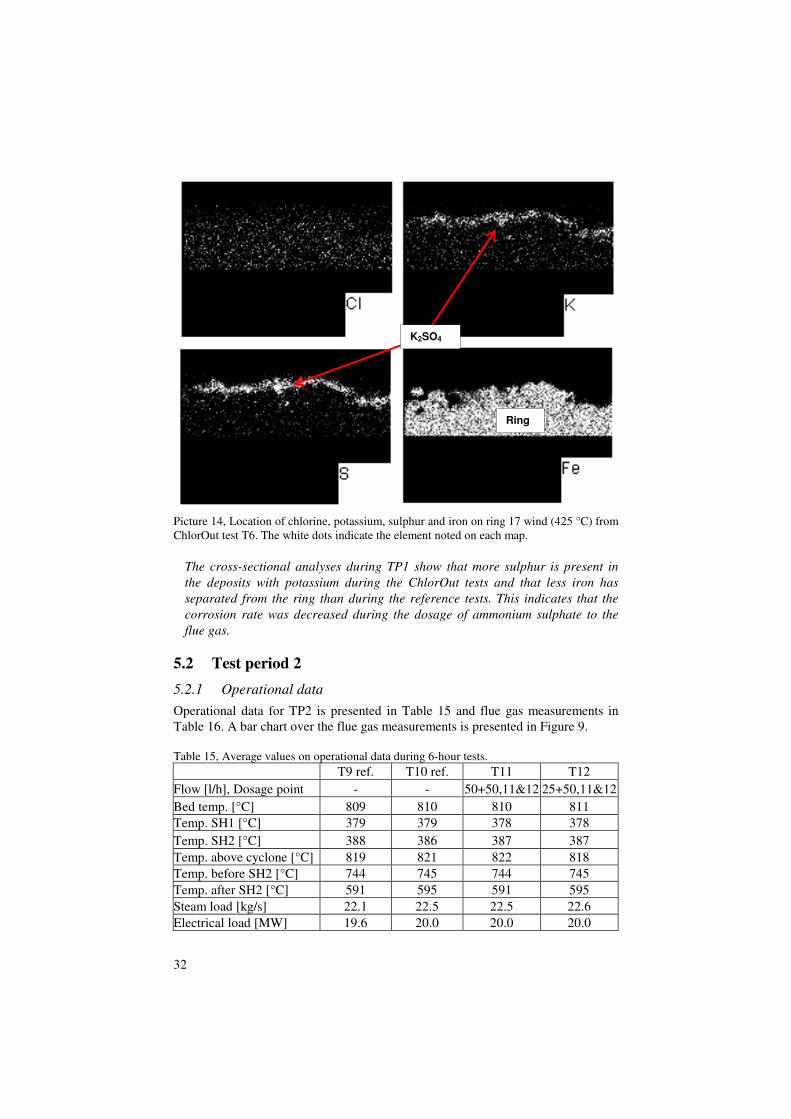
This together indicates that the corrosion rate had decreased due to dosage of ammonium sulphate. This gets even clearer when analysing the cross-section from test T6 in Picture 14. The high flow of ammonium sulphate during T6 has given a thick K2SO4 layer directly on the ring surface and no chlorine is found in the deposit. No iron is found outside of the ring.
Picture 13, Location of chlorine, potassium, sulphur and iron on ring 21 wind (425 °C) from ChlorOut test T7. The white dots indicate the element noted on each map.
KCl
K2SO4
Ring
32
Picture 14, Location of chlorine, potassium, sulphur and iron on ring 17 wind (425 °C) from ChlorOut test T6. The white dots indicate the element noted on each map.
The cross-sectional analyses during TP1 show that more sulphur is present in
the deposits with potassium during the ChlorOut tests and that less iron has
separated from the ring than during the reference tests. This indicates that the
corrosion rate was decreased during the dosage of ammonium sulphate to the
flue gas.
5.2 Test period 2
5.2.1 Operational data
Operational data for TP2 is presented in Table 15 and flue gas measurements in Table 16. A bar chart over the flue gas measurements is presented in Figure 9. Table 15, Average values on operational data during 6-hour tests. T9 ref. T10 ref. T11 T12 Flow [l/h], Dosage point - - 50+50,11&12 25+50,11&12 Bed temp. [°C] 809 810 810 811 Temp. SH1 [°C] 379 379 378 378 Temp. SH2 [°C] 388 386 387 387 Temp. above cyclone [°C] 819 821 822 818 Temp. before SH2 [°C] 744 745 744 745 Temp. after SH2 [°C] 591 595 591 595 Steam load [kg/s] 22.1 22.5 22.5 22.6 Electrical load [MW] 19.6 20.0 20.0 20.0
K2SO4
Ring
33
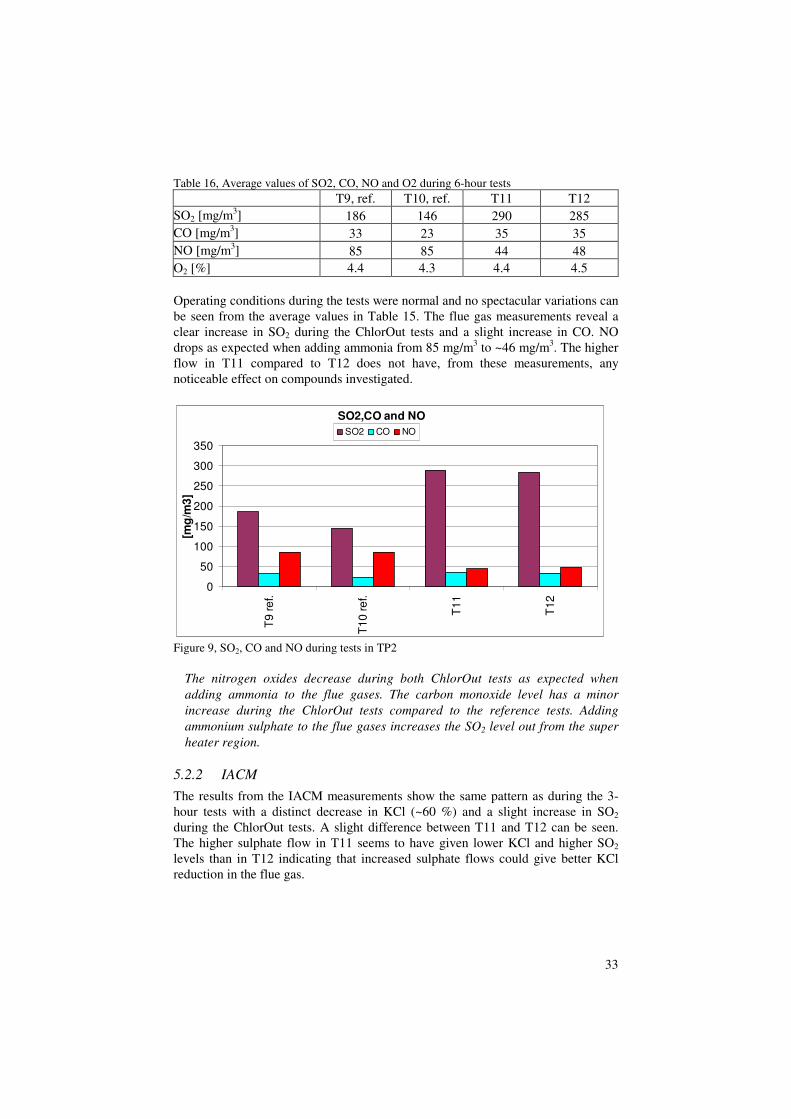
Table 16, Average values of SO2, CO, NO and O2 during 6-hour tests T9, ref. T10, ref. T11 T12 SO2 [mg/m3] 186 146 290 285 CO [mg/m3] 33 23 35 35 NO [mg/m3] 85 85 44 48 O2 [%] 4.4 4.3 4.4 4.5 Operating conditions during the tests were normal and no spectacular variations can be seen from the average values in Table 15. The flue gas measurements reveal a clear increase in SO2 during the ChlorOut tests and a slight increase in CO. NO drops as expected when adding ammonia from 85 mg/m3 to ~46 mg/m3. The higher flow in T11 compared to T12 does not have, from these measurements, any noticeable effect on compounds investigated.
SO2,CO and NO
0
50
100
150
200
250
300
350
T9
re
f.
T10
re
f.
T11
T12
[mg
/m3
]
SO2 CO NO
Figure 9, SO2, CO and NO during tests in TP2
The nitrogen oxides decrease during both ChlorOut tests as expected when
adding ammonia to the flue gases. The carbon monoxide level has a minor
increase during the ChlorOut tests compared to the reference tests. Adding
ammonium sulphate to the flue gases increases the SO2 level out from the super
heater region.
5.2.2 IACM
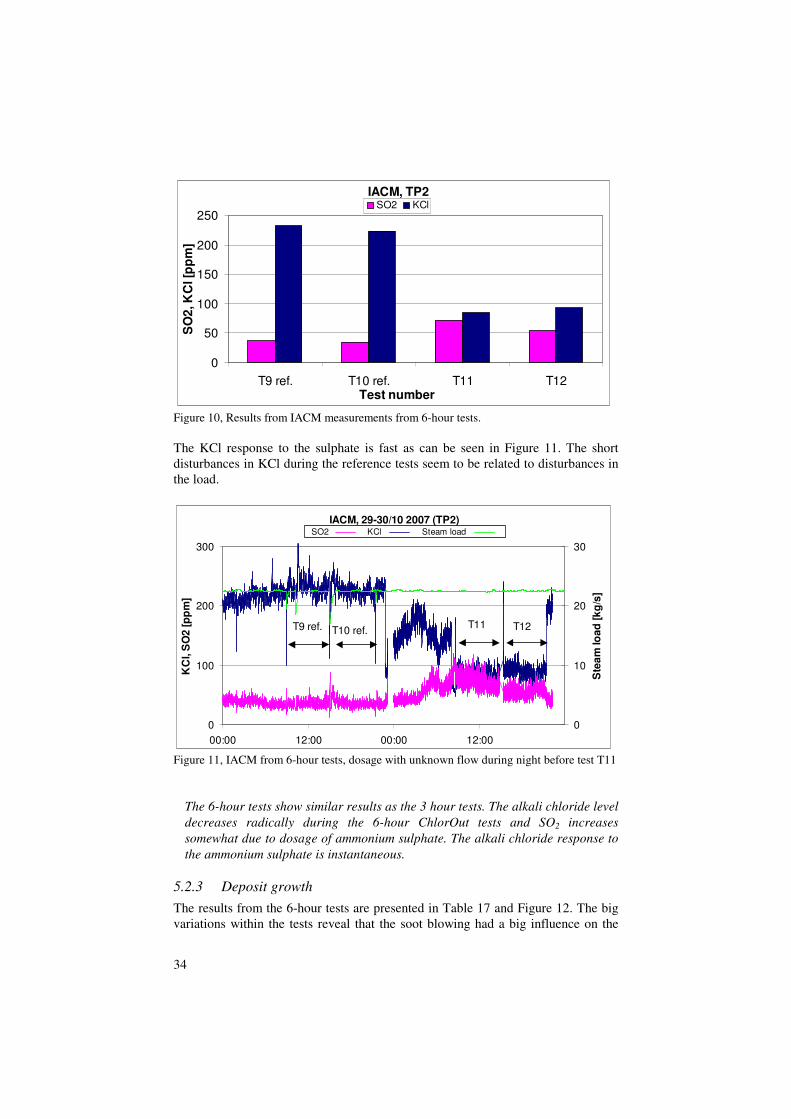
The results from the IACM measurements show the same pattern as during the 3-hour tests with a distinct decrease in KCl (~60 %) and a slight increase in SO2 during the ChlorOut tests. A slight difference between T11 and T12 can be seen. The higher sulphate flow in T11 seems to have given lower KCl and higher SO2 levels than in T12 indicating that increased sulphate flows could give better KCl reduction in the flue gas.
34
IACM, TP2
0
50
100
150
200
250
T9 ref. T10 ref. T11 T12Test number
SO
2, K
Cl [p
pm
]
SO2 KCl
Figure 10, Results from IACM measurements from 6-hour tests. The KCl response to the sulphate is fast as can be seen in Figure 11. The short disturbances in KCl during the reference tests seem to be related to disturbances in the load.
IACM, 29-30/10 2007 (TP2)
0
100
200
300
00:00 12:00 00:00 12:00
KC
l, S
O2 [
pp
m]
0
10
20
30
Ste
am
lo
ad
[k
g/s
]
T11 T12T10 ref.T9 ref.
SO2 Steam loadKCl
Figure 11, IACM from 6-hour tests, dosage with unknown flow during night before test T11
The 6-hour tests show similar results as the 3 hour tests. The alkali chloride level
decreases radically during the 6-hour ChlorOut tests and SO2 increases
somewhat due to dosage of ammonium sulphate. The alkali chloride response to
the ammonium sulphate is instantaneous.
5.2.3 Deposit growth
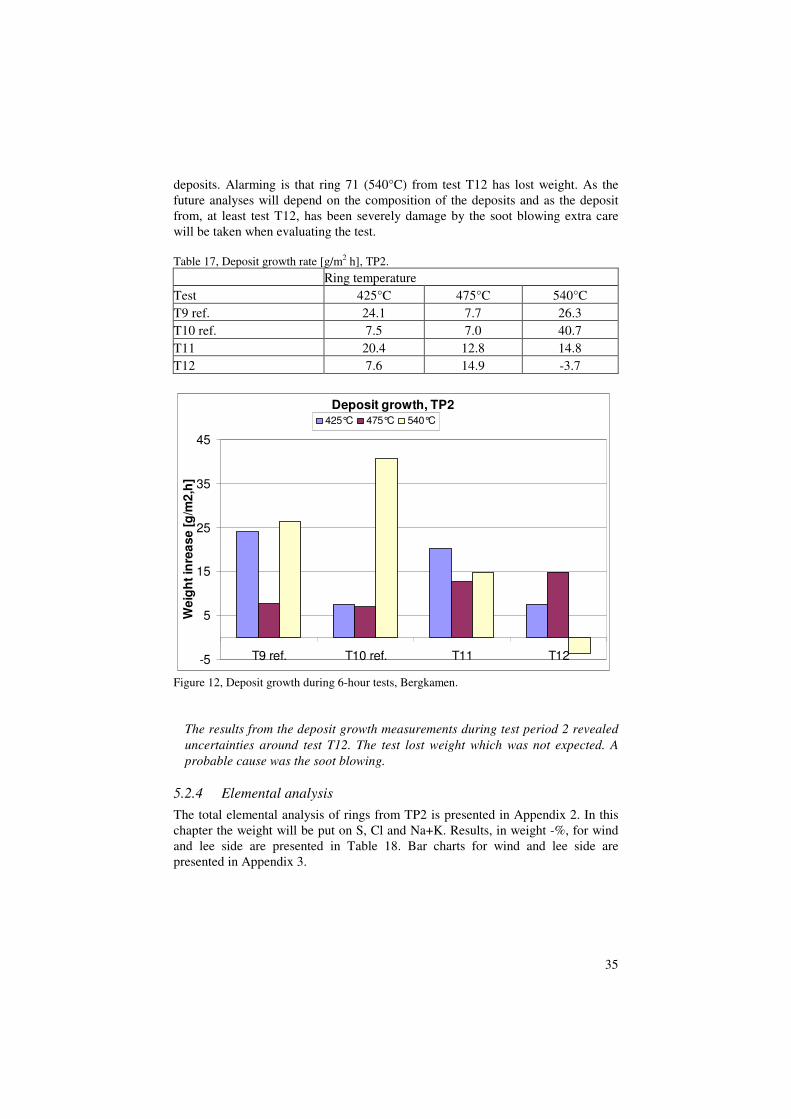
The results from the 6-hour tests are presented in Table 17 and Figure 12. The big variations within the tests reveal that the soot blowing had a big influence on the
35
deposits. Alarming is that ring 71 (540°C) from test T12 has lost weight. As the future analyses will depend on the composition of the deposits and as the deposit from, at least test T12, has been severely damage by the soot blowing extra care will be taken when evaluating the test. Table 17, Deposit growth rate [g/m2 h], TP2.
Ring temperature Test 425°C 475°C 540°C T9 ref. 24.1 7.7 26.3 T10 ref. 7.5 7.0 40.7 T11 20.4 12.8 14.8 T12 7.6 14.9 -3.7
Deposit growth, TP2
-5
5
15
25
35
45
T9 ref. T10 ref. T11 T12
Weig
ht
inre
ase [
g/m
2,h
]
425°C 475°C 540°C
Figure 12, Deposit growth during 6-hour tests, Bergkamen.
The results from the deposit growth measurements during test period 2 revealed
uncertainties around test T12. The test lost weight which was not expected. A
probable cause was the soot blowing.
5.2.4 Elemental analysis
The total elemental analysis of rings from TP2 is presented in Appendix 2. In this chapter the weight will be put on S, Cl and Na+K. Results, in weight -%, for wind and lee side are presented in Table 18. Bar charts for wind and lee side are presented in Appendix 3.
36
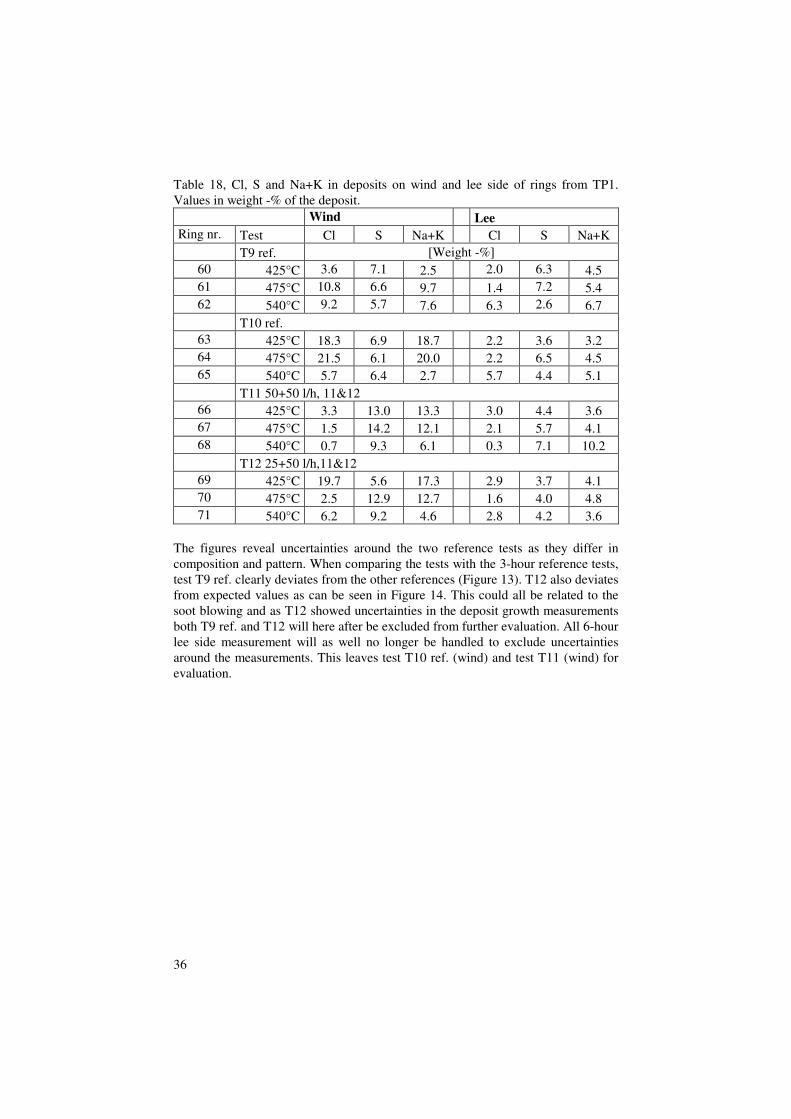
Table 18, Cl, S and Na+K in deposits on wind and lee side of rings from TP1. Values in weight -% of the deposit.
Wind Lee
Ring nr. Test Cl S Na+K Cl S Na+K T9 ref. [Weight -%]
60 425°C 3.6 7.1 2.5 2.0 6.3 4.5 61 475°C 10.8 6.6 9.7 1.4 7.2 5.4 62 540°C 9.2 5.7 7.6 6.3 2.6 6.7
T10 ref. 63 425°C 18.3 6.9 18.7 2.2 3.6 3.2 64 475°C 21.5 6.1 20.0 2.2 6.5 4.5 65 540°C 5.7 6.4 2.7 5.7 4.4 5.1
T11 50+50 l/h, 11&12 66 425°C 3.3 13.0 13.3 3.0 4.4 3.6 67 475°C 1.5 14.2 12.1 2.1 5.7 4.1 68 540°C 0.7 9.3 6.1 0.3 7.1 10.2
T12 25+50 l/h,11&12 69 425°C 19.7 5.6 17.3 2.9 3.7 4.1 70 475°C 2.5 12.9 12.7 1.6 4.0 4.8 71 540°C 6.2 9.2 4.6 2.8 4.2 3.6
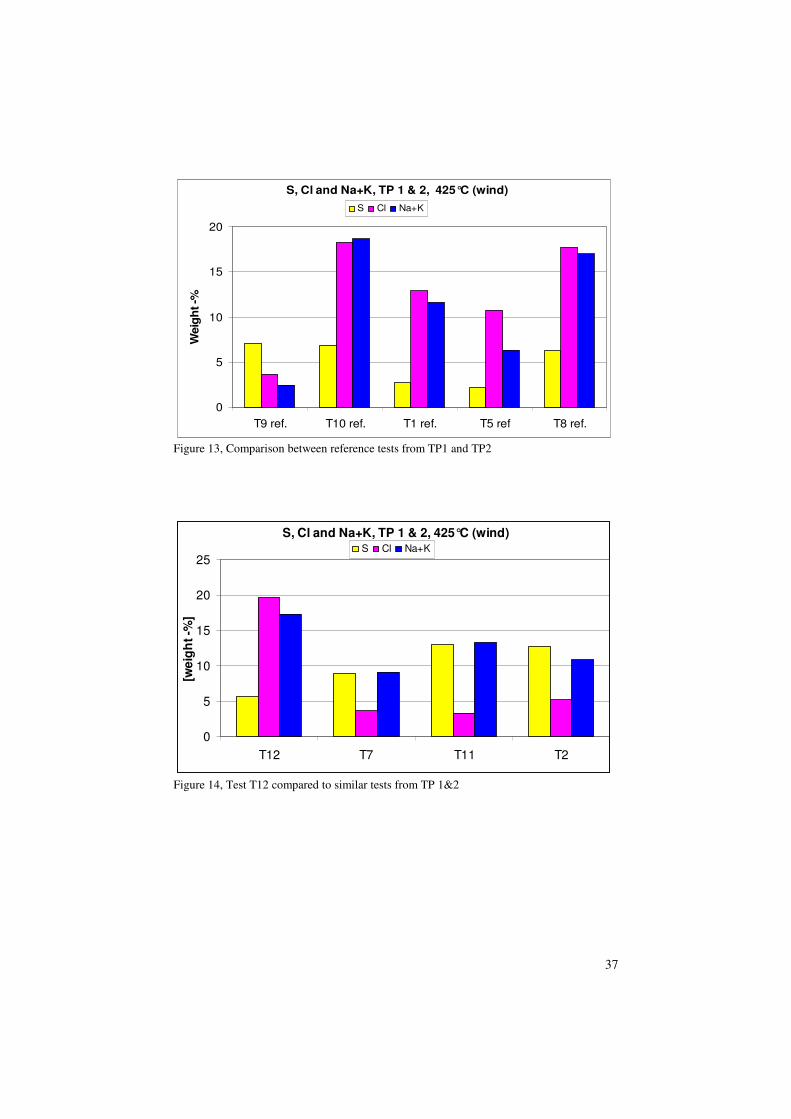
The figures reveal uncertainties around the two reference tests as they differ in composition and pattern. When comparing the tests with the 3-hour reference tests, test T9 ref. clearly deviates from the other references (Figure 13). T12 also deviates from expected values as can be seen in Figure 14. This could all be related to the soot blowing and as T12 showed uncertainties in the deposit growth measurements both T9 ref. and T12 will here after be excluded from further evaluation. All 6-hour lee side measurement will as well no longer be handled to exclude uncertainties around the measurements. This leaves test T10 ref. (wind) and test T11 (wind) for evaluation.
37
S, Cl and Na+K, TP 1 & 2, 425°C (wind)
0
5
10
15
20
T9 ref. T10 ref. T1 ref. T5 ref T8 ref.
Weig
ht -%
S Cl Na+K
Figure 13, Comparison between reference tests from TP1 and TP2
S, Cl and Na+K, TP 1 & 2, 425°C (wind)
0
5
10
15
20
25
T12 T7 T11 T2
[we
igh
t -%
]
S Cl Na+K
Figure 14, Test T12 compared to similar tests from TP 1&2
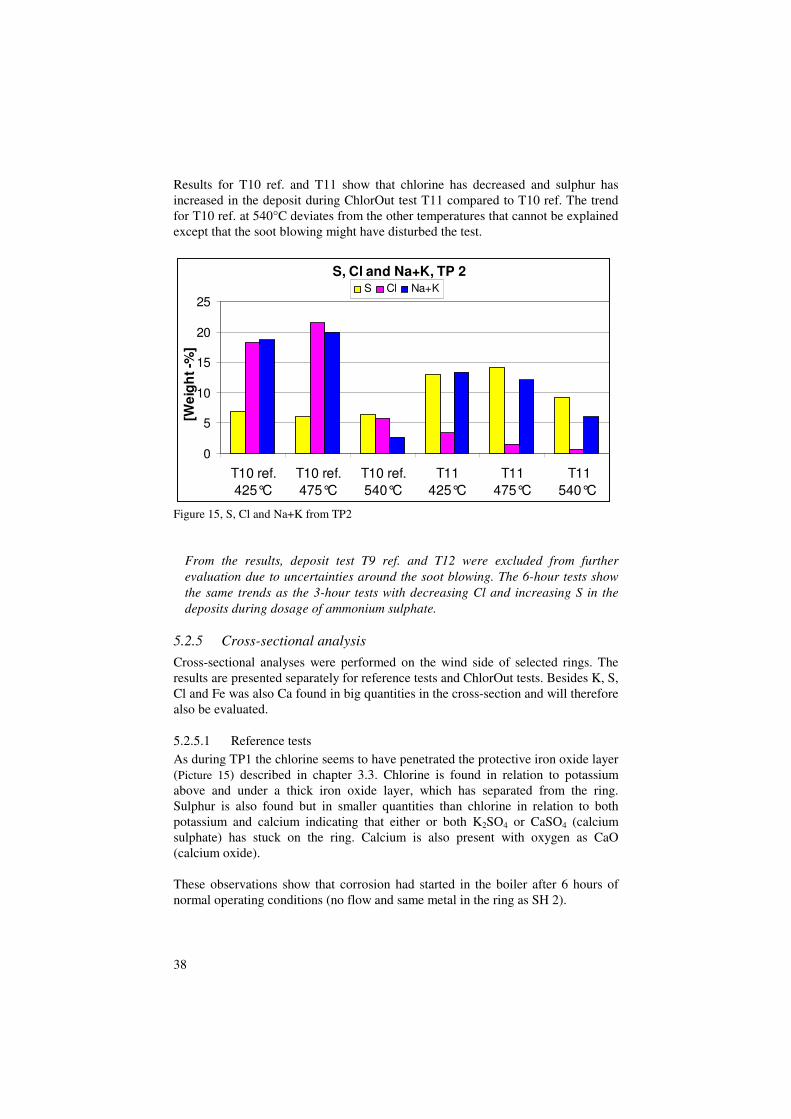
38
Results for T10 ref. and T11 show that chlorine has decreased and sulphur has increased in the deposit during ChlorOut test T11 compared to T10 ref. The trend for T10 ref. at 540°C deviates from the other temperatures that cannot be explained except that the soot blowing might have disturbed the test.
S, Cl and Na+K, TP 2
0
5
10
15
20
25
T10 ref.
425°C
T10 ref.
475°C
T10 ref.
540°C
T11
425°C
T11
475°C
T11
540°C
[We
igh
t -%
]
S Cl Na+K
Figure 15, S, Cl and Na+K from TP2
From the results, deposit test T9 ref. and T12 were excluded from further
evaluation due to uncertainties around the soot blowing. The 6-hour tests show
the same trends as the 3-hour tests with decreasing Cl and increasing S in the
deposits during dosage of ammonium sulphate.
5.2.5 Cross-sectional analysis
Cross-sectional analyses were performed on the wind side of selected rings. The results are presented separately for reference tests and ChlorOut tests. Besides K, S, Cl and Fe was also Ca found in big quantities in the cross-section and will therefore also be evaluated. 5.2.5.1 Reference tests As during TP1 the chlorine seems to have penetrated the protective iron oxide layer (Picture 15) described in chapter 3.3. Chlorine is found in relation to potassium above and under a thick iron oxide layer, which has separated from the ring. Sulphur is also found but in smaller quantities than chlorine in relation to both potassium and calcium indicating that either or both K2SO4 or CaSO4 (calcium sulphate) has stuck on the ring. Calcium is also present with oxygen as CaO (calcium oxide). These observations show that corrosion had started in the boiler after 6 hours of normal operating conditions (no flow and same metal in the ring as SH 2).
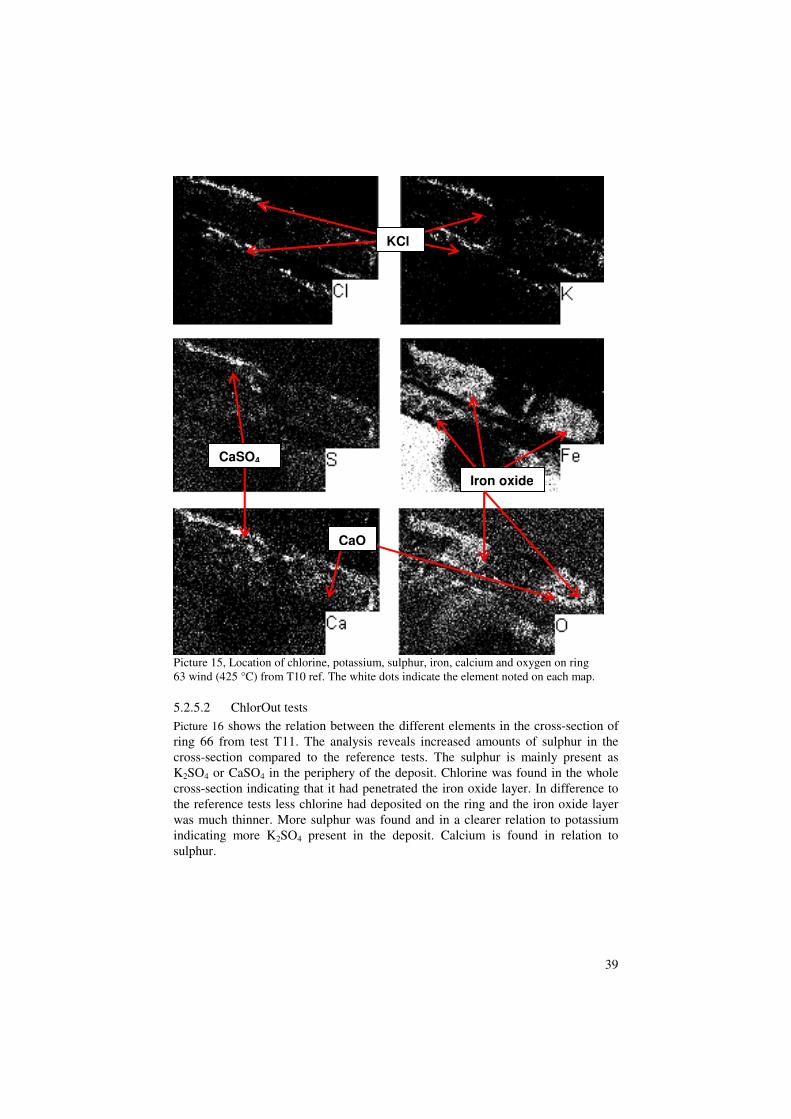
39
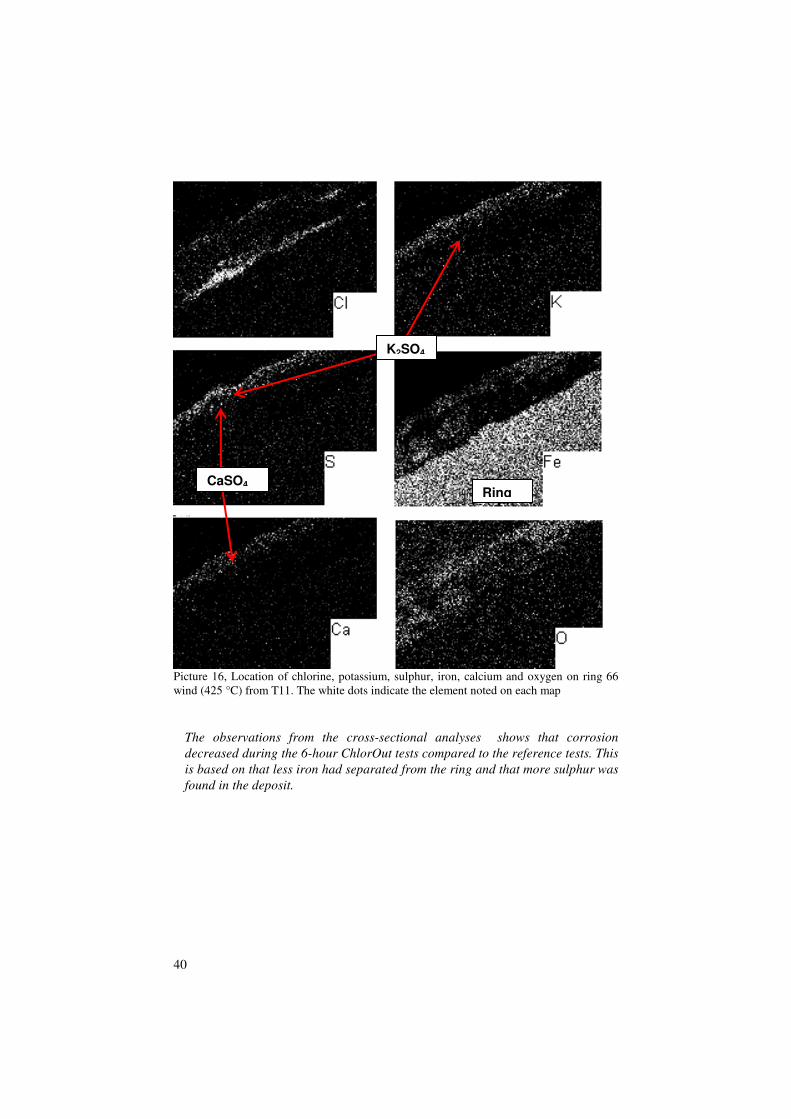
Picture 15, Location of chlorine, potassium, sulphur, iron, calcium and oxygen on ring 63 wind (425 °C) from T10 ref. The white dots indicate the element noted on each map. 5.2.5.2 ChlorOut tests Picture 16 shows the relation between the different elements in the cross-section of ring 66 from test T11. The analysis reveals increased amounts of sulphur in the cross-section compared to the reference tests. The sulphur is mainly present as K2SO4 or CaSO4 in the periphery of the deposit. Chlorine was found in the whole cross-section indicating that it had penetrated the iron oxide layer. In difference to the reference tests less chlorine had deposited on the ring and the iron oxide layer was much thinner. More sulphur was found and in a clearer relation to potassium indicating more K2SO4 present in the deposit. Calcium is found in relation to sulphur.
KCl
Iron oxide
CaSO4
CaO
40
Picture 16, Location of chlorine, potassium, sulphur, iron, calcium and oxygen on ring 66 wind (425 °C) from T11. The white dots indicate the element noted on each map
The observations from the cross-sectional analyses shows that corrosion
decreased during the 6-hour ChlorOut tests compared to the reference tests. This
is based on that less iron had separated from the ring and that more sulphur was
found in the deposit.
K2SO4
CaSO4 Ring
41
6 Discussion
In this chapter follows a discussion of the results presented in chapter 5. 6.1 Effect of ChlorOut
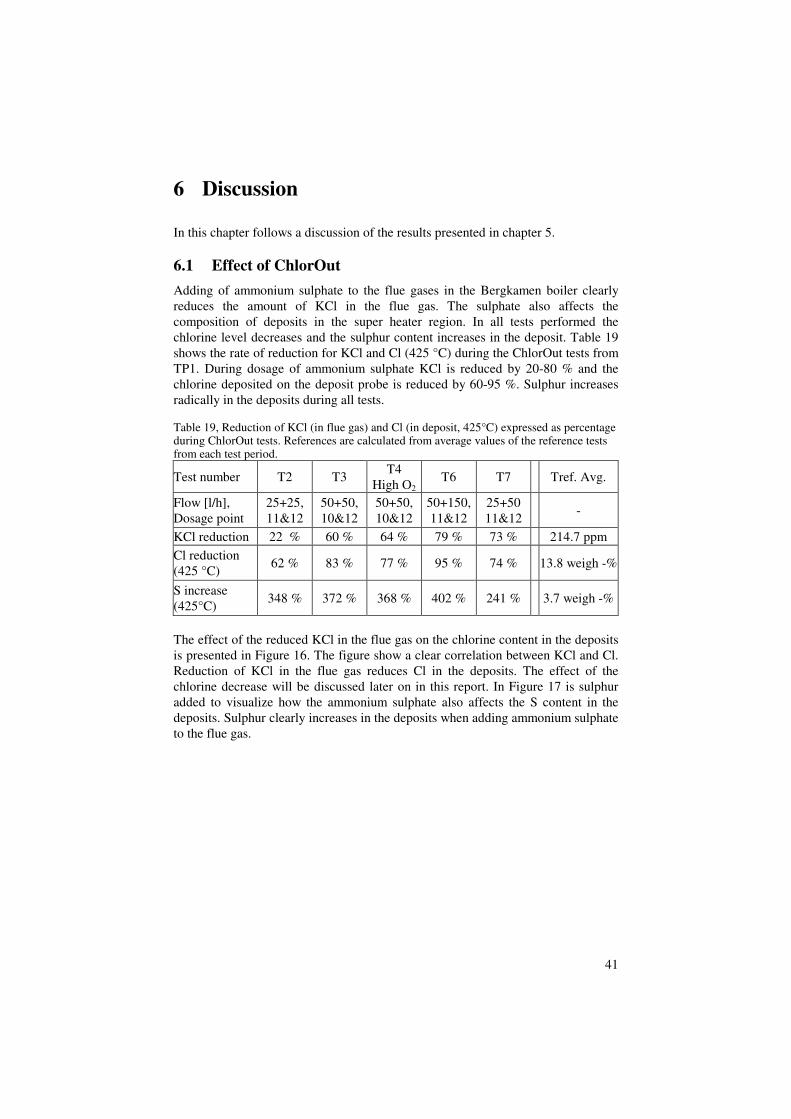
Adding of ammonium sulphate to the flue gases in the Bergkamen boiler clearly reduces the amount of KCl in the flue gas. The sulphate also affects the composition of deposits in the super heater region. In all tests performed the chlorine level decreases and the sulphur content increases in the deposit. Table 19 shows the rate of reduction for KCl and Cl (425 °C) during the ChlorOut tests from TP1. During dosage of ammonium sulphate KCl is reduced by 20-80 % and the chlorine deposited on the deposit probe is reduced by 60-95 %. Sulphur increases radically in the deposits during all tests. Table 19, Reduction of KCl (in flue gas) and Cl (in deposit, 425°C) expressed as percentage during ChlorOut tests. References are calculated from average values of the reference tests from each test period.
Test number T2 T3 T4
High O2 T6 T7
Tref. Avg.
Flow [l/h], Dosage point
25+25, 11&12
50+50, 10&12
50+50, 10&12
50+150, 11&12
25+50 11&12
-
KCl reduction 22 % 60 % 64 % 79 % 73 % 214.7 ppm Cl reduction (425 °C)
62 % 83 % 77 % 95 % 74 % 13.8 weigh -%
S increase (425°C)
348 % 372 % 368 % 402 % 241 %
3.7 weigh -%
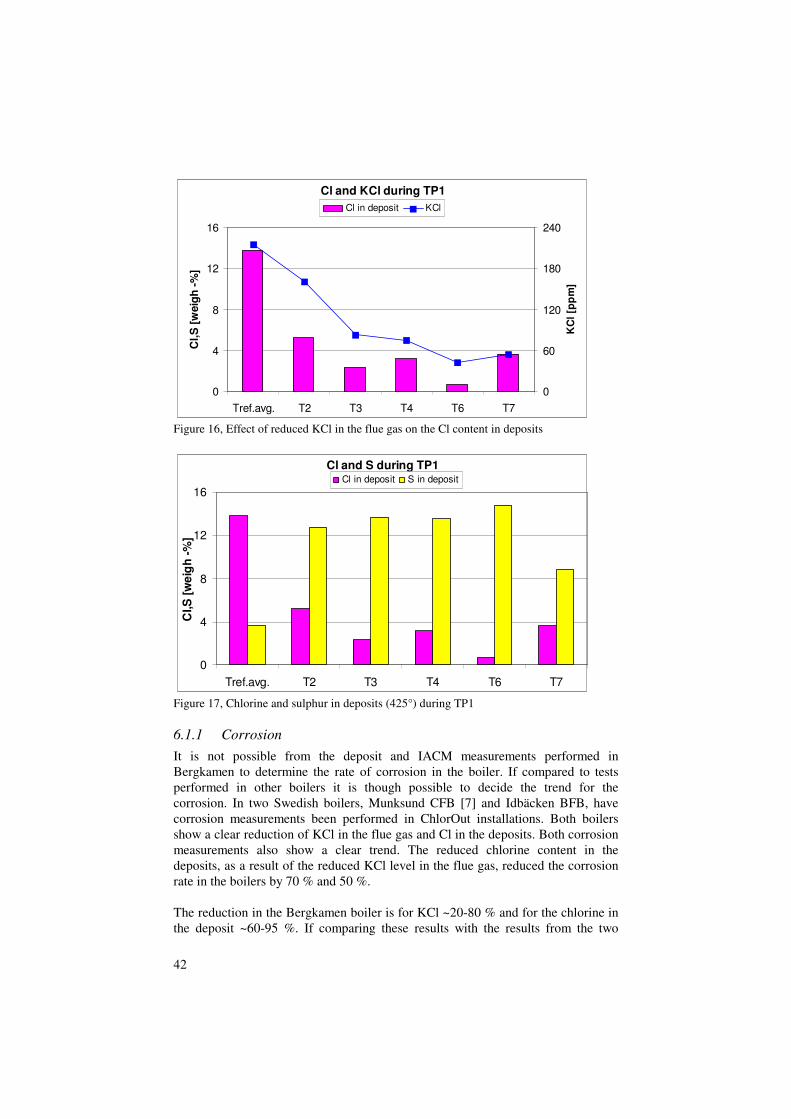
The effect of the reduced KCl in the flue gas on the chlorine content in the deposits is presented in Figure 16. The figure show a clear correlation between KCl and Cl. Reduction of KCl in the flue gas reduces Cl in the deposits. The effect of the chlorine decrease will be discussed later on in this report. In Figure 17 is sulphur added to visualize how the ammonium sulphate also affects the S content in the deposits. Sulphur clearly increases in the deposits when adding ammonium sulphate to the flue gas.
42
Cl and KCl during TP1
0
4
8
12
16
Tref.avg. T2 T3 T4 T6 T7
Cl,S
[w
eig
h -
%]
0
60
120
180
240
KC
l [p
pm
]
Cl in deposit KCl
Figure 16, Effect of reduced KCl in the flue gas on the Cl content in deposits
Cl and S during TP1
0
4
8
12
16
Tref.avg. T2 T3 T4 T6 T7
Cl,S
[w
eig
h -
%]
Cl in deposit S in deposit
Figure 17, Chlorine and sulphur in deposits (425°) during TP1 6.1.1 Corrosion
It is not possible from the deposit and IACM measurements performed in Bergkamen to determine the rate of corrosion in the boiler. If compared to tests performed in other boilers it is though possible to decide the trend for the corrosion. In two Swedish boilers, Munksund CFB [7] and Idbäcken BFB, have corrosion measurements been performed in ChlorOut installations. Both boilers show a clear reduction of KCl in the flue gas and Cl in the deposits. Both corrosion measurements also show a clear trend. The reduced chlorine content in the deposits, as a result of the reduced KCl level in the flue gas, reduced the corrosion rate in the boilers by 70 % and 50 %. The reduction in the Bergkamen boiler is for KCl ~20-80 % and for the chlorine in the deposit ~60-95 %. If comparing these results with the results from the two
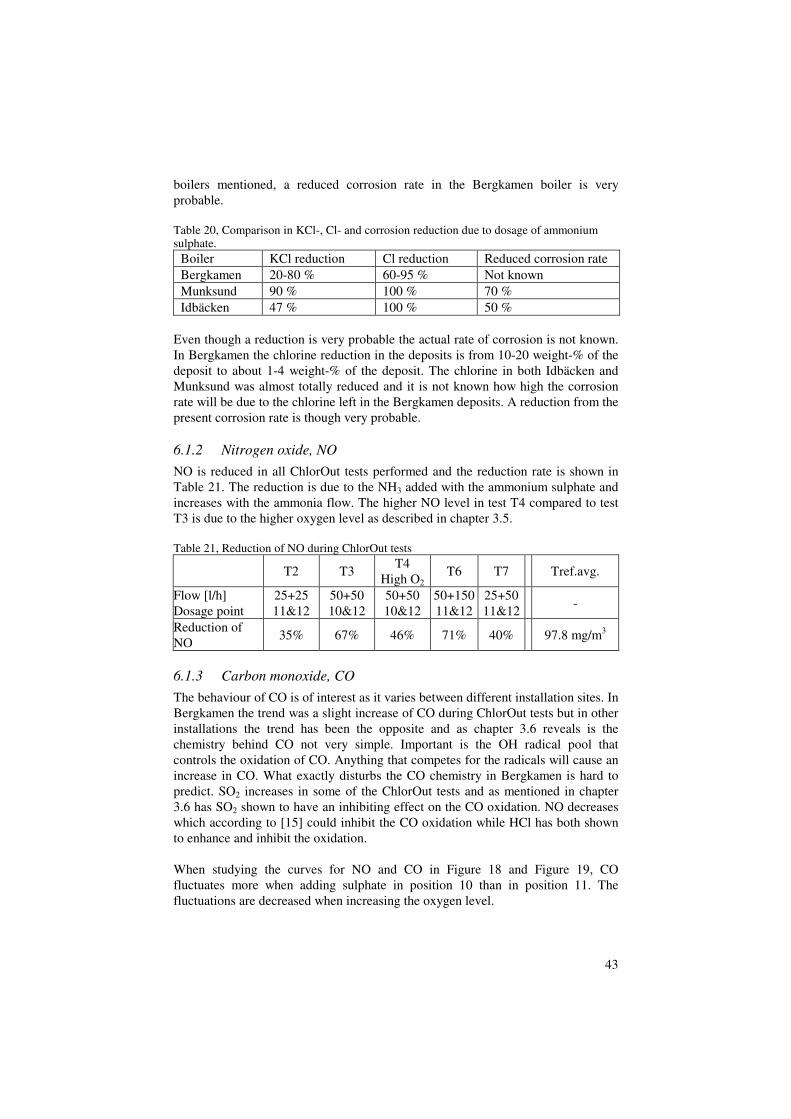
43
boilers mentioned, a reduced corrosion rate in the Bergkamen boiler is very probable. Table 20, Comparison in KCl-, Cl- and corrosion reduction due to dosage of ammonium sulphate.
Boiler KCl reduction Cl reduction Reduced corrosion rate Bergkamen 20-80 % 60-95 % Not known Munksund 90 % 100 % 70 % Idbäcken 47 % 100 % 50 %
Even though a reduction is very probable the actual rate of corrosion is not known. In Bergkamen the chlorine reduction in the deposits is from 10-20 weight-% of the deposit to about 1-4 weight-% of the deposit. The chlorine in both Idbäcken and Munksund was almost totally reduced and it is not known how high the corrosion rate will be due to the chlorine left in the Bergkamen deposits. A reduction from the present corrosion rate is though very probable. 6.1.2 Nitrogen oxide, NO
NO is reduced in all ChlorOut tests performed and the reduction rate is shown in Table 21. The reduction is due to the NH3 added with the ammonium sulphate and increases with the ammonia flow. The higher NO level in test T4 compared to test T3 is due to the higher oxygen level as described in chapter 3.5. Table 21, Reduction of NO during ChlorOut tests
T2 T3 T4
High O2 T6 T7
Tref.avg.
Flow [l/h] Dosage point
25+25 11&12
50+50 10&12
50+50 10&12
50+150 11&12
25+50 11&12
-
Reduction of NO
35% 67% 46% 71% 40%
97.8 mg/m3
6.1.3 Carbon monoxide, CO
The behaviour of CO is of interest as it varies between different installation sites. In Bergkamen the trend was a slight increase of CO during ChlorOut tests but in other installations the trend has been the opposite and as chapter 3.6 reveals is the chemistry behind CO not very simple. Important is the OH radical pool that controls the oxidation of CO. Anything that competes for the radicals will cause an increase in CO. What exactly disturbs the CO chemistry in Bergkamen is hard to predict. SO2 increases in some of the ChlorOut tests and as mentioned in chapter 3.6 has SO2 shown to have an inhibiting effect on the CO oxidation. NO decreases which according to [15] could inhibit the CO oxidation while HCl has both shown to enhance and inhibit the oxidation. When studying the curves for NO and CO in Figure 18 and Figure 19, CO fluctuates more when adding sulphate in position 10 than in position 11. The fluctuations are decreased when increasing the oxygen level.
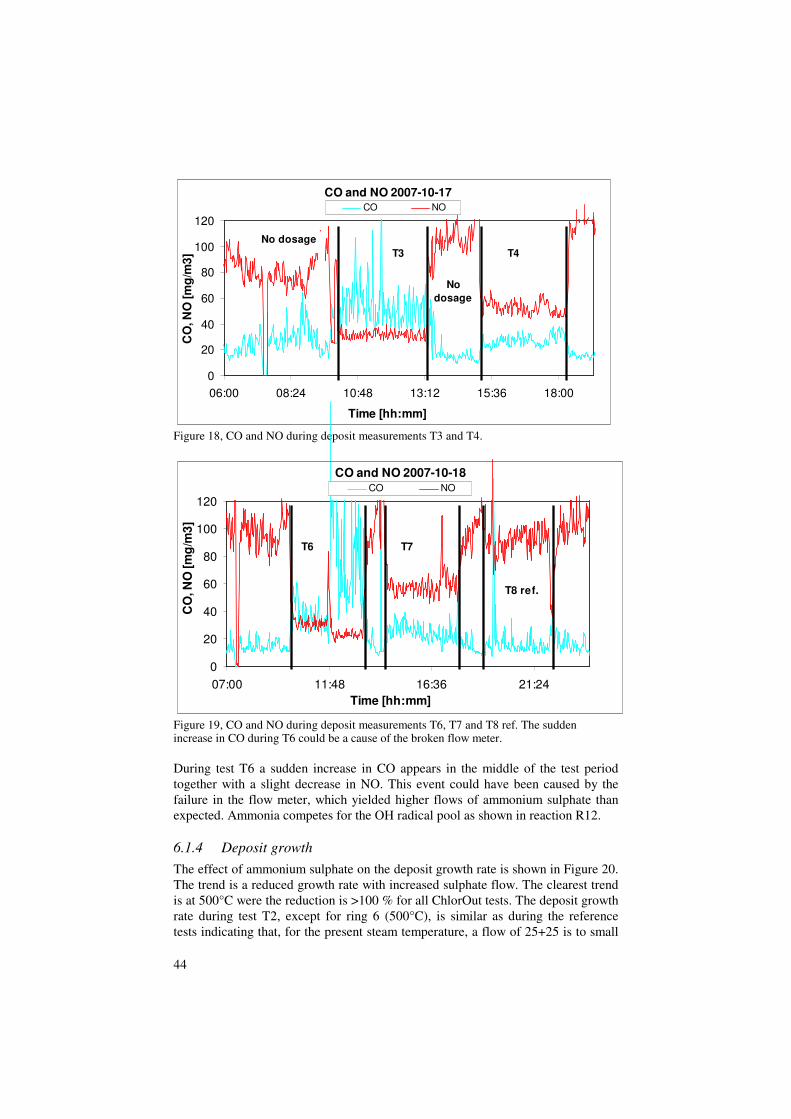
44
CO and NO 2007-10-17
0
20
40
60
80
100
120
06:00 08:24 10:48 13:12 15:36 18:00
Time [hh:mm]
CO
, N
O [
mg
/m3
]
CO NO
T3 T4
No dosage
No
dosage
Figure 18, CO and NO during deposit measurements T3 and T4.
CO and NO 2007-10-18
0
20
40
60
80
100
120
07:00 11:48 16:36 21:24
Time [hh:mm]
CO
, N
O [
mg
/m3
]
CO NO
T6 T7
T8 ref.
Figure 19, CO and NO during deposit measurements T6, T7 and T8 ref. The sudden increase in CO during T6 could be a cause of the broken flow meter. During test T6 a sudden increase in CO appears in the middle of the test period together with a slight decrease in NO. This event could have been caused by the failure in the flow meter, which yielded higher flows of ammonium sulphate than expected. Ammonia competes for the OH radical pool as shown in reaction R12. 6.1.4 Deposit growth
The effect of ammonium sulphate on the deposit growth rate is shown in Figure 20. The trend is a reduced growth rate with increased sulphate flow. The clearest trend is at 500°C were the reduction is >100 % for all ChlorOut tests. The deposit growth rate during test T2, except for ring 6 (500°C), is similar as during the reference tests indicating that, for the present steam temperature, a flow of 25+25 is to small
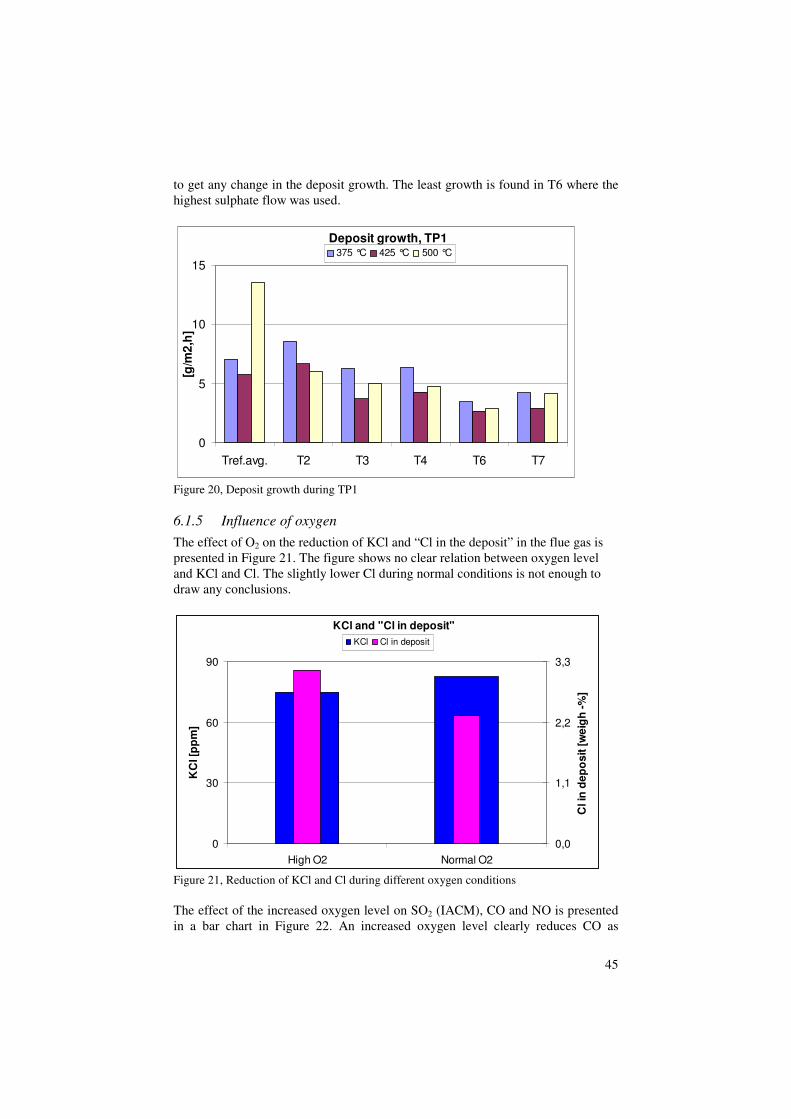
45
to get any change in the deposit growth. The least growth is found in T6 where the highest sulphate flow was used.
Deposit growth, TP1
0
5
10
15
Tref.avg. T2 T3 T4 T6 T7
[g/m
2,h
]
375 °C 425 °C 500 °C
Figure 20, Deposit growth during TP1 6.1.5 Influence of oxygen
The effect of O2 on the reduction of KCl and “Cl in the deposit” in the flue gas is presented in Figure 21. The figure shows no clear relation between oxygen level and KCl and Cl. The slightly lower Cl during normal conditions is not enough to draw any conclusions.
KCl and "Cl in deposit"
0
30
60
90
High O2 Normal O2
KC
l [p
pm
]
0,0
1,1
2,2
3,3
Cl in
de
po
sit
[w
eig
h -
%]
KCl Cl in deposit
Figure 21, Reduction of KCl and Cl during different oxygen conditions The effect of the increased oxygen level on SO2 (IACM), CO and NO is presented in a bar chart in Figure 22. An increased oxygen level clearly reduces CO as
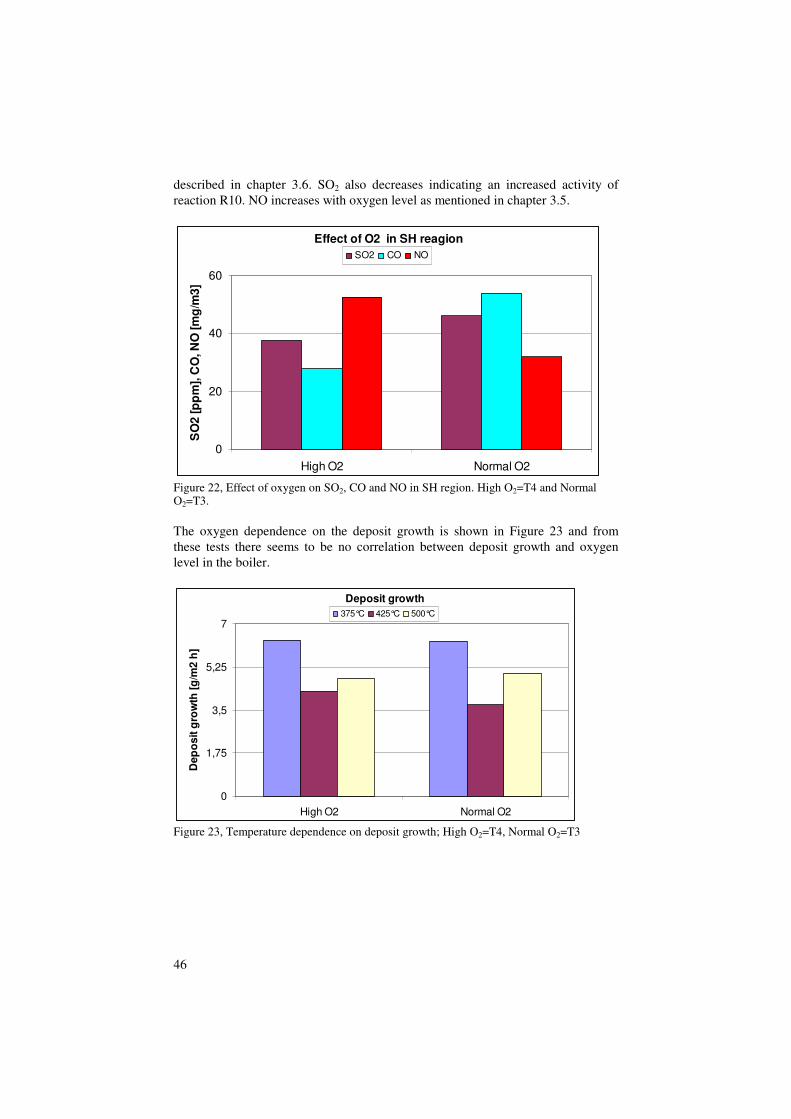
46
described in chapter 3.6. SO2 also decreases indicating an increased activity of reaction R10. NO increases with oxygen level as mentioned in chapter 3.5.
Effect of O2 in SH reagion
0
20
40
60
High O2 Normal O2
SO
2 [
pp
m],
CO
, N
O [
mg
/m3
]
SO2 CO NO
Figure 22, Effect of oxygen on SO2, CO and NO in SH region. High O2=T4 and Normal O2=T3. The oxygen dependence on the deposit growth is shown in Figure 23 and from these tests there seems to be no correlation between deposit growth and oxygen level in the boiler.
Deposit growth
0
1,75
3,5
5,25
7
High O2 Normal O2
De
po
sit
gro
wth
[g
/m2
h]
375°C 425°C 500°C
Figure 23, Temperature dependence on deposit growth; High O2=T4, Normal O2=T3
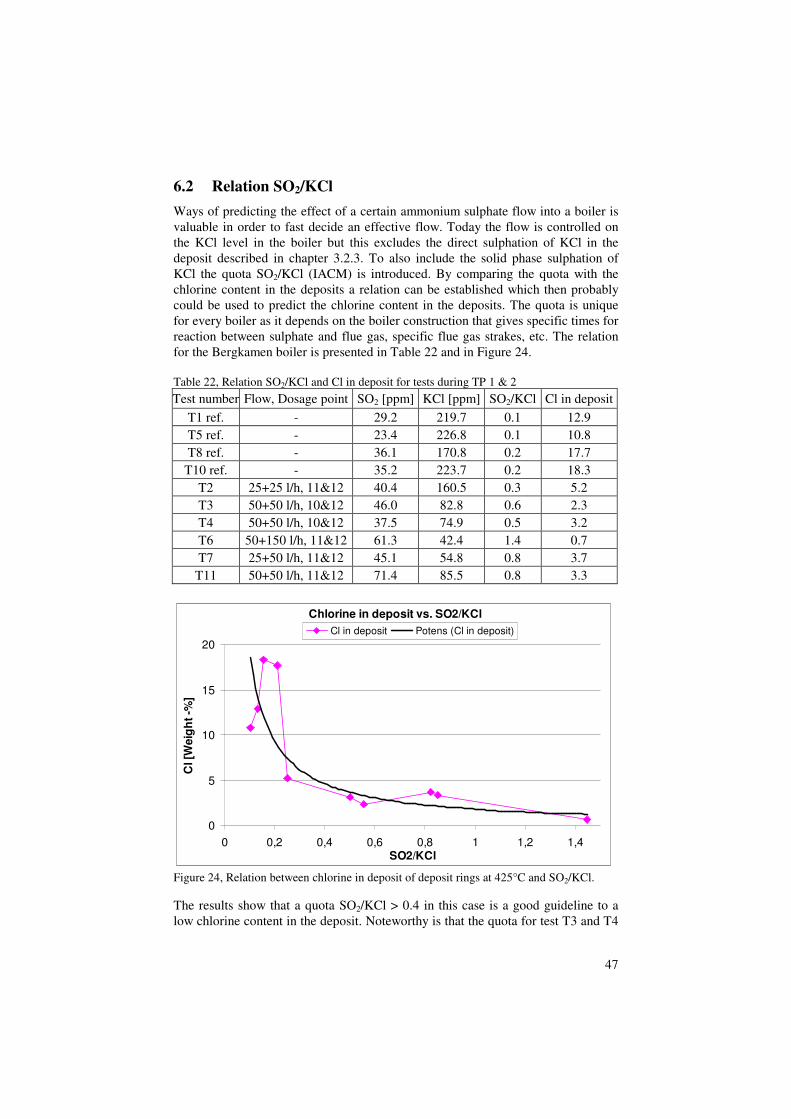
47
6.2 Relation SO2/KCl
Ways of predicting the effect of a certain ammonium sulphate flow into a boiler is valuable in order to fast decide an effective flow. Today the flow is controlled on the KCl level in the boiler but this excludes the direct sulphation of KCl in the deposit described in chapter 3.2.3. To also include the solid phase sulphation of KCl the quota SO2/KCl (IACM) is introduced. By comparing the quota with the chlorine content in the deposits a relation can be established which then probably could be used to predict the chlorine content in the deposits. The quota is unique for every boiler as it depends on the boiler construction that gives specific times for reaction between sulphate and flue gas, specific flue gas strakes, etc. The relation for the Bergkamen boiler is presented in Table 22 and in Figure 24. Table 22, Relation SO2/KCl and Cl in deposit for tests during TP 1 & 2
Test number Flow, Dosage point SO2 [ppm] KCl [ppm] SO2/KCl Cl in deposit T1 ref. - 29.2 219.7 0.1 12.9 T5 ref. - 23.4 226.8 0.1 10.8 T8 ref. - 36.1 170.8 0.2 17.7
T10 ref. - 35.2 223.7 0.2 18.3 T2 25+25 l/h, 11&12 40.4 160.5 0.3 5.2 T3 50+50 l/h, 10&12 46.0 82.8 0.6 2.3 T4 50+50 l/h, 10&12 37.5 74.9 0.5 3.2 T6 50+150 l/h, 11&12 61.3 42.4 1.4 0.7 T7 25+50 l/h, 11&12 45.1 54.8 0.8 3.7
T11 50+50 l/h, 11&12 71.4 85.5 0.8 3.3
Chlorine in deposit vs. SO2/KCl
0
5
10
15
20
0 0,2 0,4 0,6 0,8 1 1,2 1,4SO2/KCl
Cl [W
eig
ht
-%]
Cl in deposit Potens (Cl in deposit)
Figure 24, Relation between chlorine in deposit of deposit rings at 425°C and SO2/KCl. The results show that a quota SO2/KCl > 0.4 in this case is a good guideline to a low chlorine content in the deposit. Noteworthy is that the quota for test T3 and T4
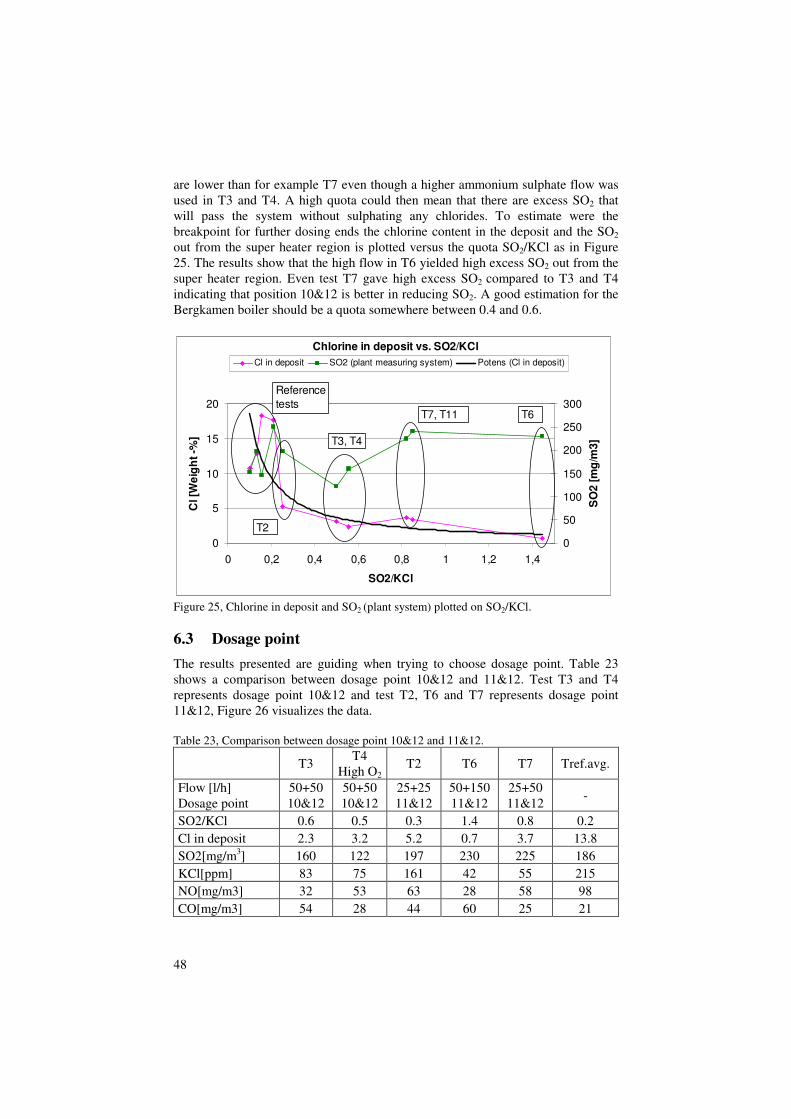
48
are lower than for example T7 even though a higher ammonium sulphate flow was used in T3 and T4. A high quota could then mean that there are excess SO2 that will pass the system without sulphating any chlorides. To estimate were the breakpoint for further dosing ends the chlorine content in the deposit and the SO2 out from the super heater region is plotted versus the quota SO2/KCl as in Figure 25. The results show that the high flow in T6 yielded high excess SO2 out from the super heater region. Even test T7 gave high excess SO2 compared to T3 and T4 indicating that position 10&12 is better in reducing SO2. A good estimation for the Bergkamen boiler should be a quota somewhere between 0.4 and 0.6.
Chlorine in deposit vs. SO2/KCl
0
5
10
15
20
0 0,2 0,4 0,6 0,8 1 1,2 1,4
SO2/KCl
Cl [W
eig
ht
-%]
0
50
100
150
200
250
300
SO
2 [
mg
/m3
]
Cl in deposit SO2 (plant measuring system) Potens (Cl in deposit)
Reference
tests
T2
T3, T4
T7, T11 T6
Figure 25, Chlorine in deposit and SO2 (plant system) plotted on SO2/KCl. 6.3 Dosage point
The results presented are guiding when trying to choose dosage point. Table 23 shows a comparison between dosage point 10&12 and 11&12. Test T3 and T4 represents dosage point 10&12 and test T2, T6 and T7 represents dosage point 11&12, Figure 26 visualizes the data. Table 23, Comparison between dosage point 10&12 and 11&12.
T3 T4
High O2 T2 T6 T7 Tref.avg.
Flow [l/h] Dosage point
50+50 10&12
50+50 10&12
25+25 11&12
50+150 11&12
25+50 11&12
-
SO2/KCl 0.6 0.5 0.3 1.4 0.8 0.2 Cl in deposit 2.3 3.2 5.2 0.7 3.7 13.8 SO2[mg/m3] 160 122 197 230 225 186 KCl[ppm] 83 75 161 42 55 215 NO[mg/m3] 32 53 63 28 58 98 CO[mg/m3] 54 28 44 60 25 21
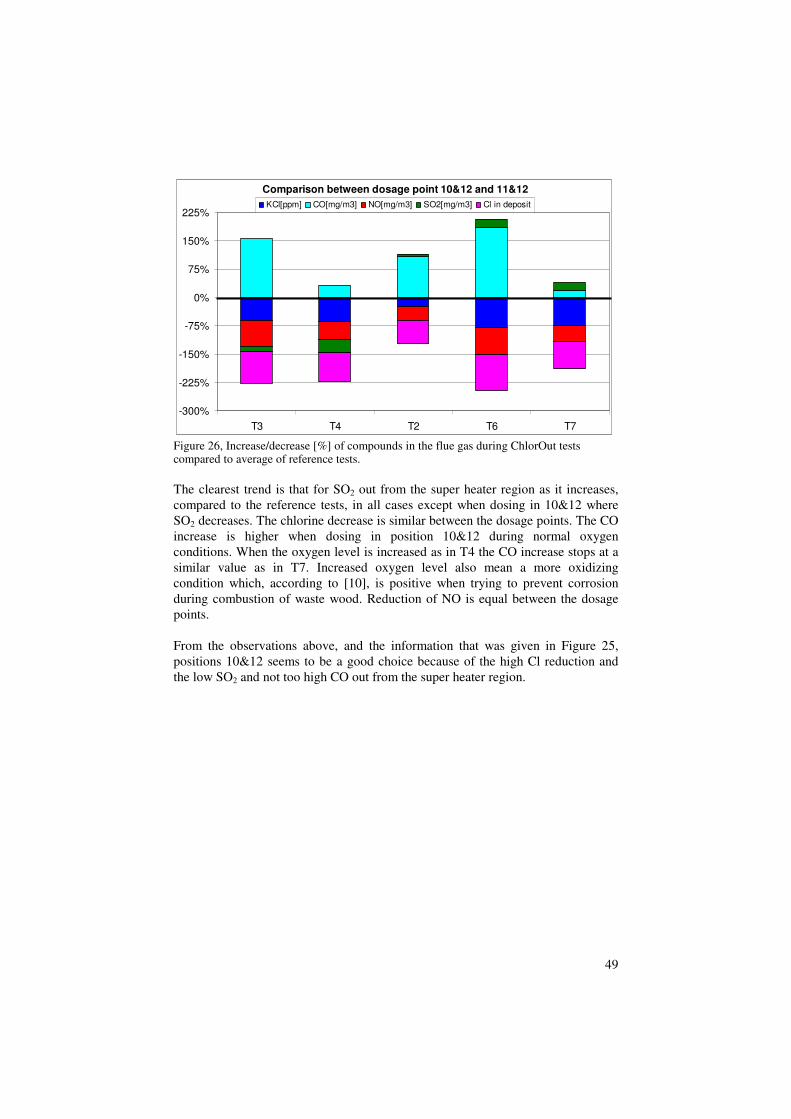
49
Comparison between dosage point 10&12 and 11&12
-300%
-225%
-150%
-75%
0%
75%
150%
225%
T3 T4 T2 T6 T7
KCl[ppm] CO[mg/m3] NO[mg/m3] SO2[mg/m3] Cl in deposit
Figure 26, Increase/decrease [%] of compounds in the flue gas during ChlorOut tests compared to average of reference tests. The clearest trend is that for SO2 out from the super heater region as it increases, compared to the reference tests, in all cases except when dosing in 10&12 where SO2 decreases. The chlorine decrease is similar between the dosage points. The CO increase is higher when dosing in position 10&12 during normal oxygen conditions. When the oxygen level is increased as in T4 the CO increase stops at a similar value as in T7. Increased oxygen level also mean a more oxidizing condition which, according to [10], is positive when trying to prevent corrosion during combustion of waste wood. Reduction of NO is equal between the dosage points. From the observations above, and the information that was given in Figure 25, positions 10&12 seems to be a good choice because of the high Cl reduction and the low SO2 and not too high CO out from the super heater region.
50
7 Conclusions
The aim with this thesis work was to measure and reduce the alkali chloride level, mainly potassium chloride (KCl), in the flue gases from burning waste wood in a CFB boiler in Bergkamen, Germany. The effects of the reduced KCl level in the boiler on the super heater deposits were then investigated. Measurements of the alkali chloride level were performed with the IACM (In situ Alkali Chloride Monitor) instrument developed by Vattenfall Research and Development AB. Reduction of KCl in the flue gases was achieved by adding ammonium sulphate, (NH4)2SO4, to the flue gases before the super heaters. The effect of the change in composition of the deposits on the super heaters was evaluated from a corrosion point of view. Conclusions from the work are:
• It was possible to measure the KCl level in the Bergkamen boiler with the IACM instrument.
• Adding (NH4)2SO4 to the flue gases in the CFB in Bergkamen decreased the KCl level in the flue gases.
• The work shows that it is possible, with the ChlorOut concept, to measure and reduce KCl in boilers with very high levels of KCl in the flue gas.
• The deposit measurements showed that the reduction of alkali chlorides in the super heater region reduced the chlorine and increased the sulphur deposited on the super heaters.
• The reduced chlorine content in the deposits will most likely decrease the chlorine-induced corrosion experienced in the boiler.
• Cross-sectional analyses showed that less iron separated from the deposit rings and that less chlorine and more sulphur was present in the deposits during dosage of (NH4)2SO4.
• A reduction in deposit growth was achieved during dosage of ammonium sulphate. The effect was clearest at 500°C.
• NO was reduced and a minor increase in CO could be seen during dosage of ammonium sulphate.
Besides evaluating the chemical effects of ammonium sulphate I have also, in this work, introduced the quota SO2/KCl in gas phase as a reference for the chlorine deposited on the super heaters. I have also showed that a quota 0.4-0.6 is suitable for a low chlorine content in the deposits and a SO2-low flue gas out from the super heater region in the Bergkamen boiler. The quota is boiler specific and could be used to control the flow of ammonium sulphate to the boiler.

51
8 Acknowledgments
I would like to thank the boiler staff in Bergkamen and especially Stephan Kalbertod for letting me perform the measurements and also Harri Vilokki from Foster Wheeler for providing me with operational data and lunch. The staff at VPC Nyköping also deserve acknowledgment for guiding me and for answering questions when needed. A special thanks to my supervisor Håkan Kassman for guiding me in the jungle of consulting and report writing and Anders Hjörnhede for technical support.
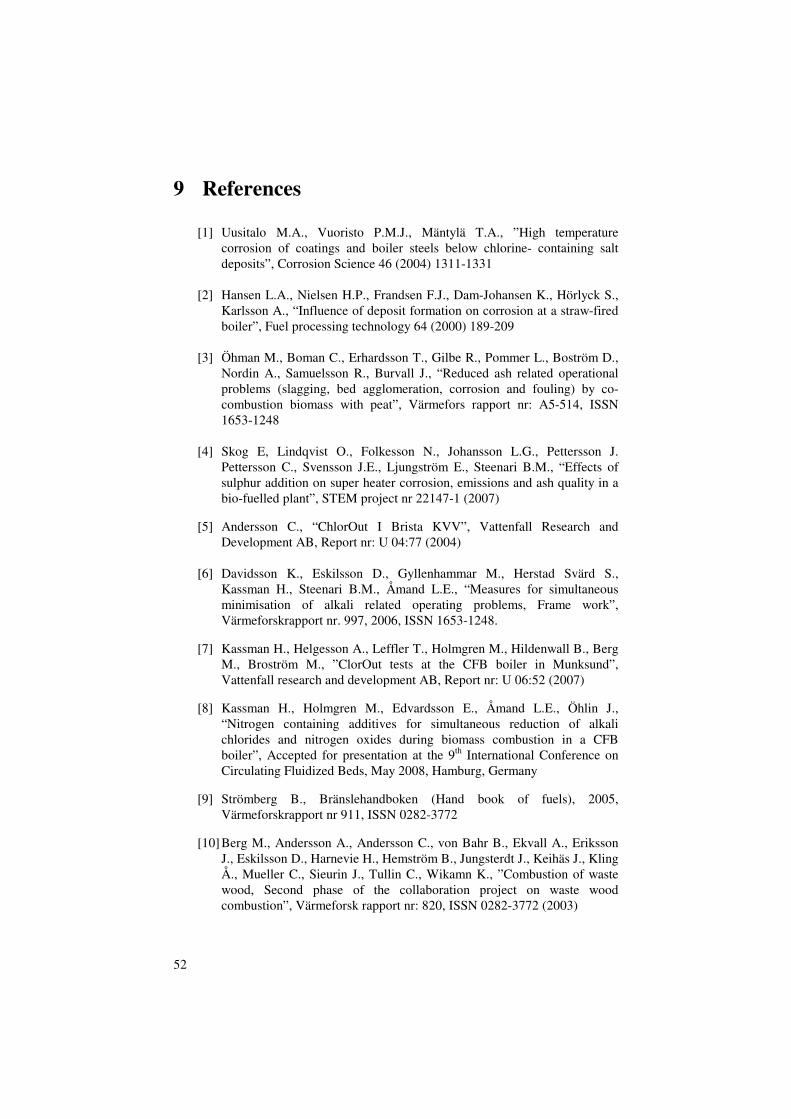
52
9 References
[1] Uusitalo M.A., Vuoristo P.M.J., Mäntylä T.A., ”High temperature corrosion of coatings and boiler steels below chlorine- containing salt deposits”, Corrosion Science 46 (2004) 1311-1331
[2] Hansen L.A., Nielsen H.P., Frandsen F.J., Dam-Johansen K., Hörlyck S.,
Karlsson A., “Influence of deposit formation on corrosion at a straw-fired boiler”, Fuel processing technology 64 (2000) 189-209
[3] Öhman M., Boman C., Erhardsson T., Gilbe R., Pommer L., Boström D.,
Nordin A., Samuelsson R., Burvall J., “Reduced ash related operational problems (slagging, bed agglomeration, corrosion and fouling) by co-combustion biomass with peat”, Värmefors rapport nr: A5-514, ISSN 1653-1248
[4] Skog E, Lindqvist O., Folkesson N., Johansson L.G., Pettersson J.
Pettersson C., Svensson J.E., Ljungström E., Steenari B.M., “Effects of sulphur addition on super heater corrosion, emissions and ash quality in a bio-fuelled plant”, STEM project nr 22147-1 (2007)
[5] Andersson C., “ChlorOut I Brista KVV”, Vattenfall Research and
Development AB, Report nr: U 04:77 (2004)
[6] Davidsson K., Eskilsson D., Gyllenhammar M., Herstad Svärd S., Kassman H., Steenari B.M., Åmand L.E., “Measures for simultaneous minimisation of alkali related operating problems, Frame work”, Värmeforskrapport nr. 997, 2006, ISSN 1653-1248.
[7] Kassman H., Helgesson A., Leffler T., Holmgren M., Hildenwall B., Berg
M., Broström M., ”ClorOut tests at the CFB boiler in Munksund”, Vattenfall research and development AB, Report nr: U 06:52 (2007)
[8] Kassman H., Holmgren M., Edvardsson E., Åmand L.E., Öhlin J.,
“Nitrogen containing additives for simultaneous reduction of alkali chlorides and nitrogen oxides during biomass combustion in a CFB boiler”, Accepted for presentation at the 9th International Conference on Circulating Fluidized Beds, May 2008, Hamburg, Germany
[9] Strömberg B., Bränslehandboken (Hand book of fuels), 2005,
Värmeforskrapport nr 911, ISSN 0282-3772
[10] Berg M., Andersson A., Andersson C., von Bahr B., Ekvall A., Eriksson J., Eskilsson D., Harnevie H., Hemström B., Jungsterdt J., Keihäs J., Kling Å., Mueller C., Sieurin J., Tullin C., Wikamn K., ”Combustion of waste wood, Second phase of the collaboration project on waste wood combustion”, Värmeforsk rapport nr: 820, ISSN 0282-3772 (2003)
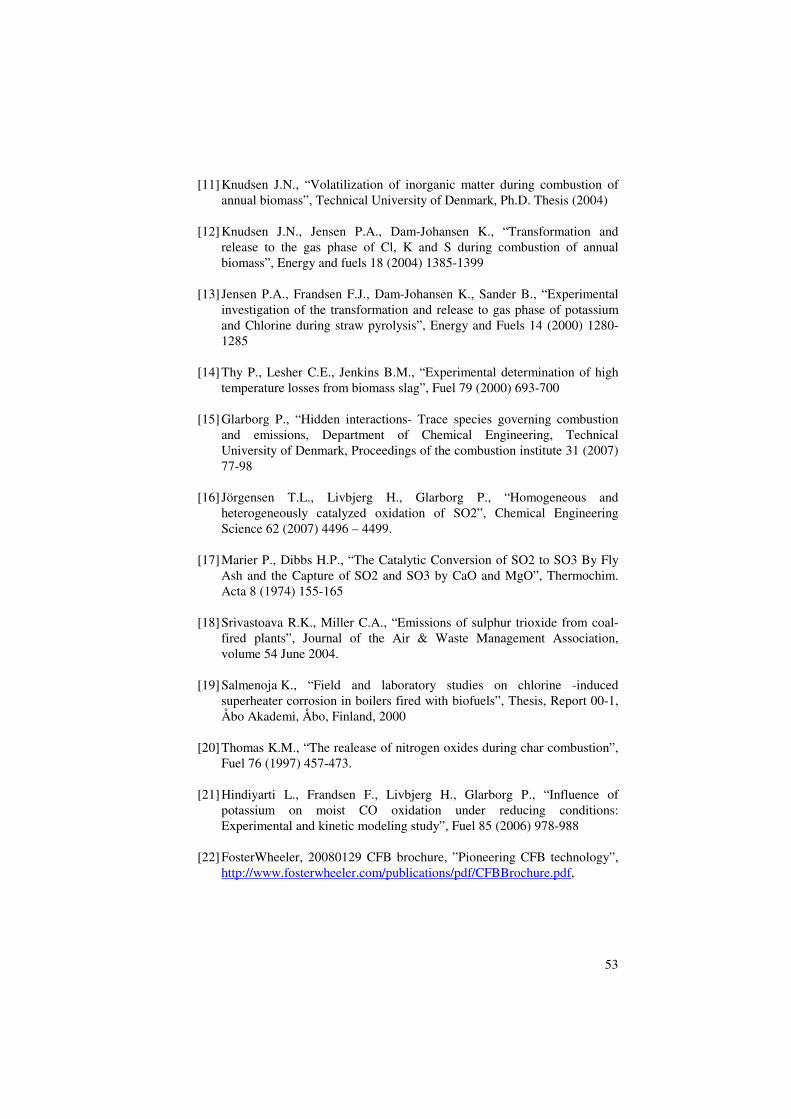
53
[11] Knudsen J.N., “Volatilization of inorganic matter during combustion of annual biomass”, Technical University of Denmark, Ph.D. Thesis (2004)
[12] Knudsen J.N., Jensen P.A., Dam-Johansen K., “Transformation and
release to the gas phase of Cl, K and S during combustion of annual biomass”, Energy and fuels 18 (2004) 1385-1399
[13] Jensen P.A., Frandsen F.J., Dam-Johansen K., Sander B., “Experimental
investigation of the transformation and release to gas phase of potassium and Chlorine during straw pyrolysis”, Energy and Fuels 14 (2000) 1280-1285
[14] Thy P., Lesher C.E., Jenkins B.M., “Experimental determination of high
temperature losses from biomass slag”, Fuel 79 (2000) 693-700 [15] Glarborg P., “Hidden interactions- Trace species governing combustion
and emissions, Department of Chemical Engineering, Technical University of Denmark, Proceedings of the combustion institute 31 (2007) 77-98
[16] Jörgensen T.L., Livbjerg H., Glarborg P., “Homogeneous and
heterogeneously catalyzed oxidation of SO2”, Chemical Engineering Science 62 (2007) 4496 – 4499.
[17] Marier P., Dibbs H.P., “The Catalytic Conversion of SO2 to SO3 By Fly
Ash and the Capture of SO2 and SO3 by CaO and MgO”, Thermochim. Acta 8 (1974) 155-165
[18] Srivastoava R.K., Miller C.A., “Emissions of sulphur trioxide from coal-
fired plants”, Journal of the Air & Waste Management Association, volume 54 June 2004.
[19] Salmenoja K., “Field and laboratory studies on chlorine -induced
superheater corrosion in boilers fired with biofuels”, Thesis, Report 00-1, Åbo Akademi, Åbo, Finland, 2000
[20] Thomas K.M., “The realease of nitrogen oxides during char combustion”,
Fuel 76 (1997) 457-473.
[21] Hindiyarti L., Frandsen F., Livbjerg H., Glarborg P., “Influence of potassium on moist CO oxidation under reducing conditions: Experimental and kinetic modeling study”, Fuel 85 (2006) 978-988
[22] FosterWheeler, 20080129 CFB brochure, ”Pioneering CFB technology”,
http://www.fosterwheeler.com/publications/pdf/CFBBrochure.pdf,
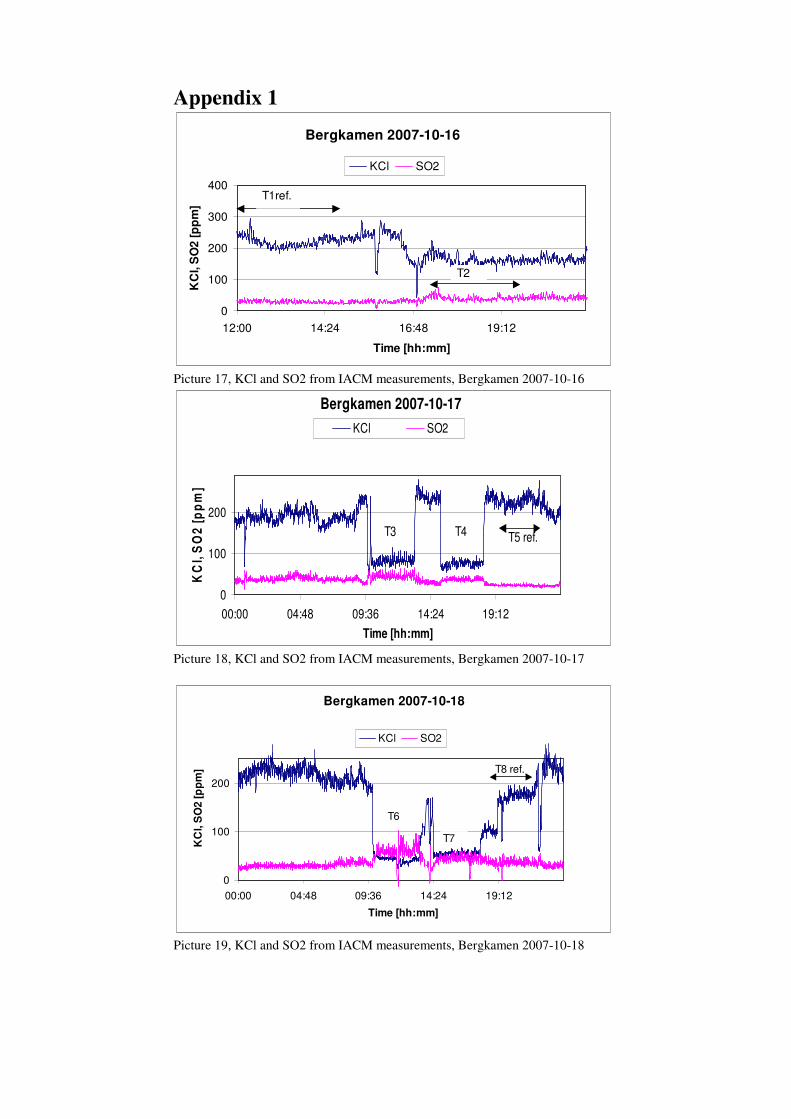
Appendix 1
Bergkamen 2007-10-16
0
100
200
300
400
12:00 14:24 16:48 19:12
Time [hh:mm]
KC
l, S
O2
[p
pm
]
KCl SO2
T1ref.
T2
Picture 17, KCl and SO2 from IACM measurements, Bergkamen 2007-10-16
Bergkamen 2007-10-17
0
100
200
00:00 04:48 09:36 14:24 19:12
Time [hh:mm]
KC
l, S
O2
[p
pm
]
KCl SO2
T3 T4 T5 ref.
Picture 18, KCl and SO2 from IACM measurements, Bergkamen 2007-10-17
Bergkamen 2007-10-18
0
100
200
00:00 04:48 09:36 14:24 19:12
Time [hh:mm]
KC
l, S
O2 [
pp
m]
KCl SO2
T6
T7
T8 ref.
Picture 19, KCl and SO2 from IACM measurements, Bergkamen 2007-10-18
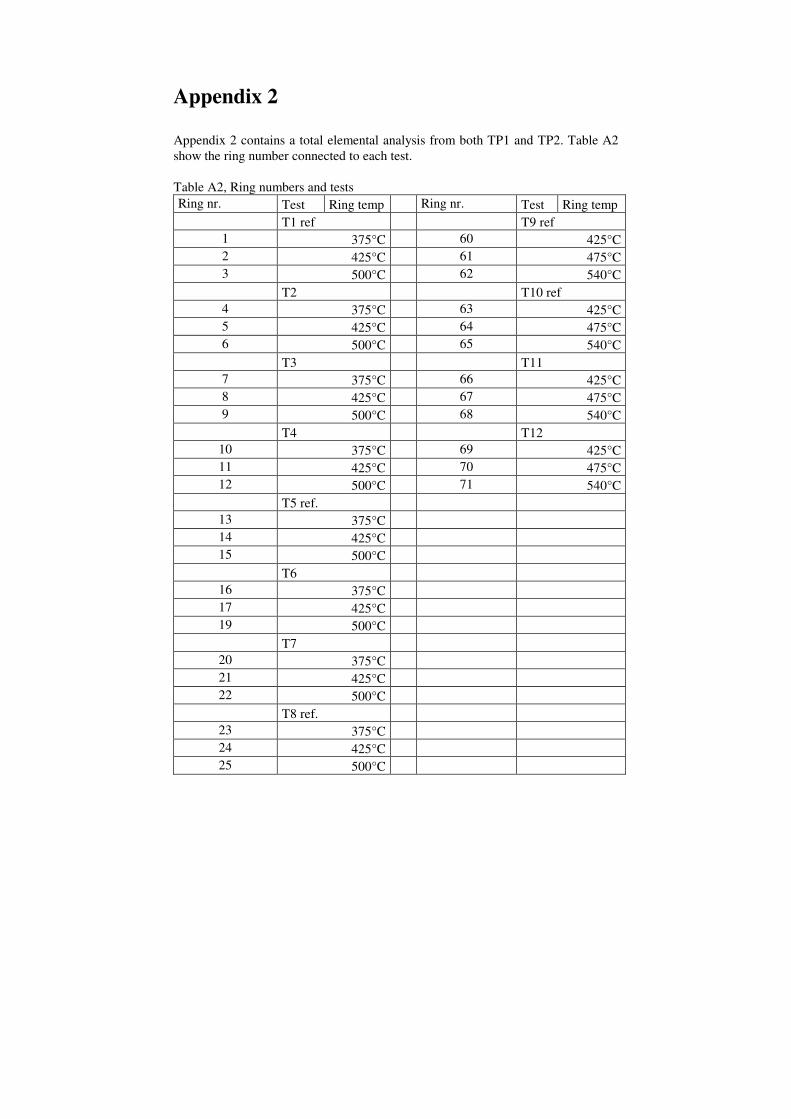
Appendix 2
Appendix 2 contains a total elemental analysis from both TP1 and TP2. Table A2 show the ring number connected to each test. Table A2, Ring numbers and tests Ring nr. Test Ring temp Ring nr. Test Ring temp T1 ref T9 ref
1 375°C 60 425°C 2 425°C 61 475°C 3 500°C 62 540°C T2 T10 ref
4 375°C 63 425°C 5 425°C 64 475°C 6 500°C 65 540°C T3 T11
7 375°C 66 425°C 8 425°C 67 475°C 9 500°C 68 540°C T4 T12
10 375°C 69 425°C 11 425°C 70 475°C 12 500°C 71 540°C
T5 ref. 13 375°C 14 425°C 15 500°C
T6 16 375°C 17 425°C 19 500°C
T7 20 375°C 21 425°C 22 500°C
T8 ref. 23 375°C 24 425°C 25 500°C
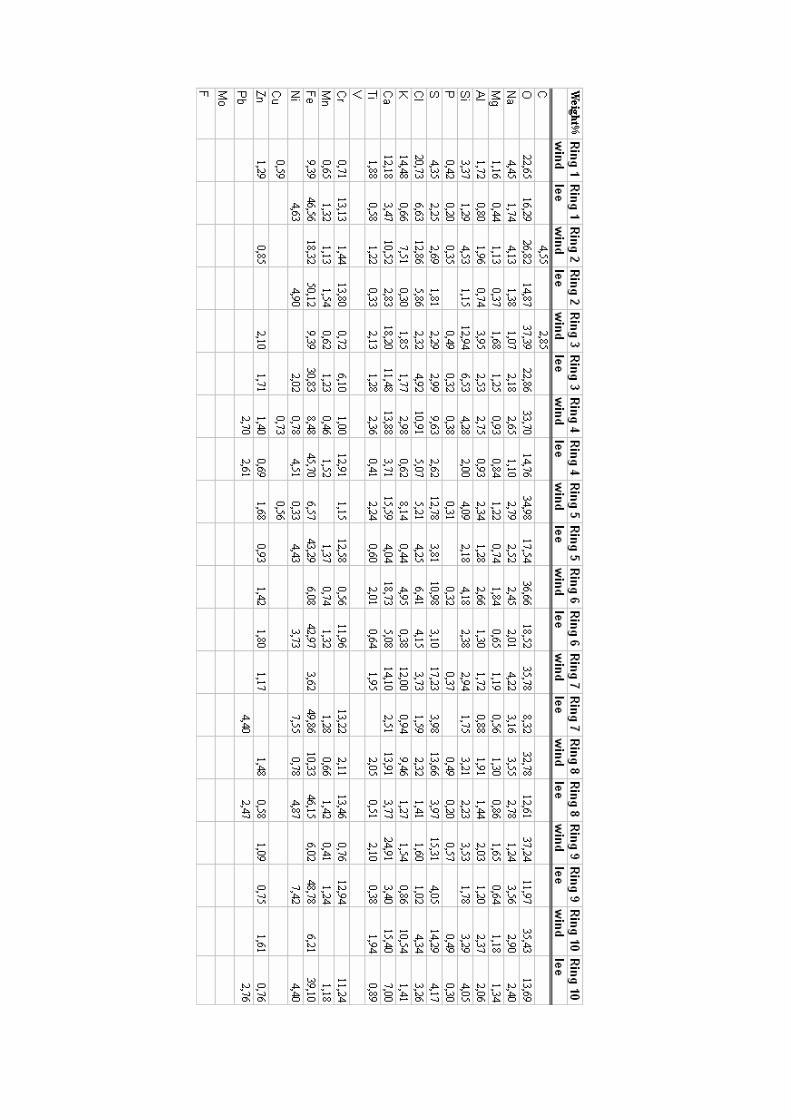
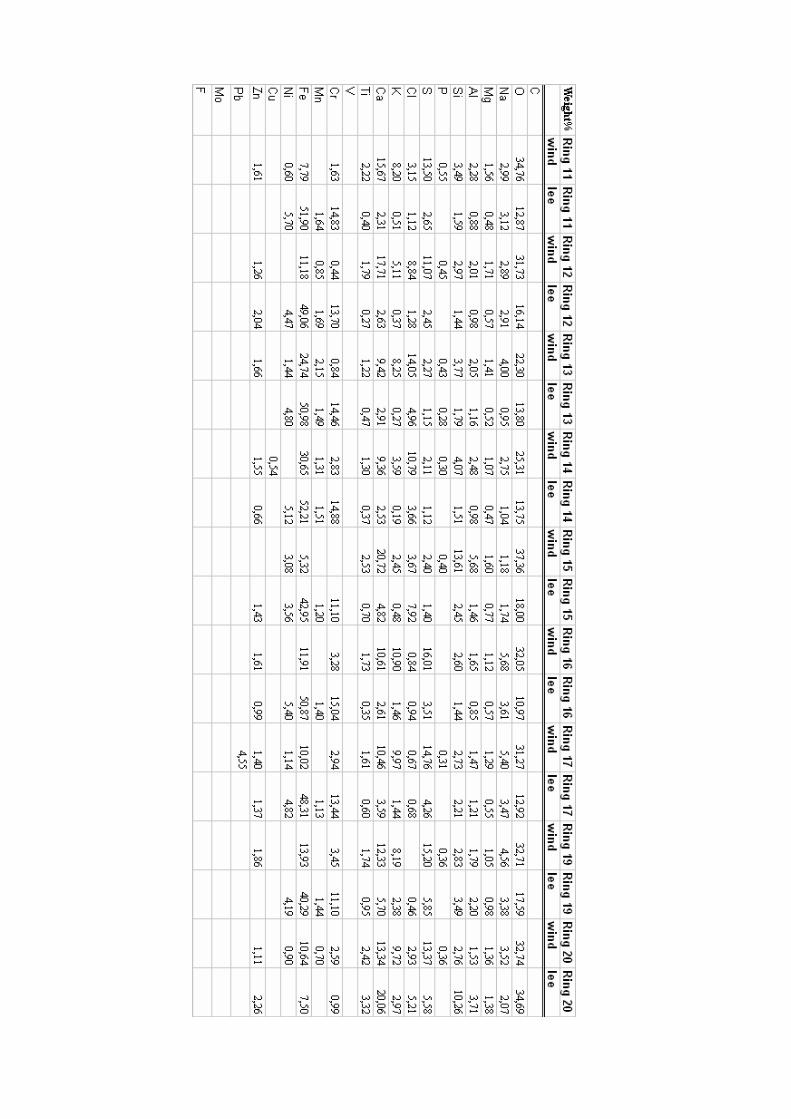
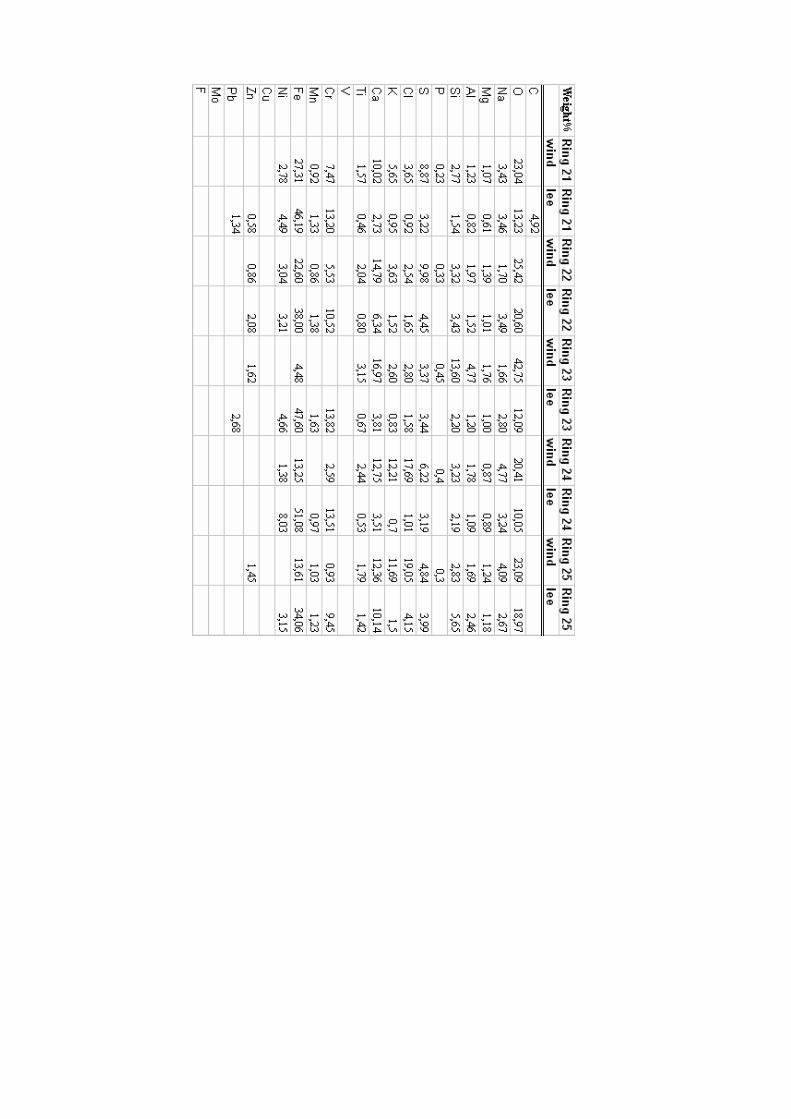
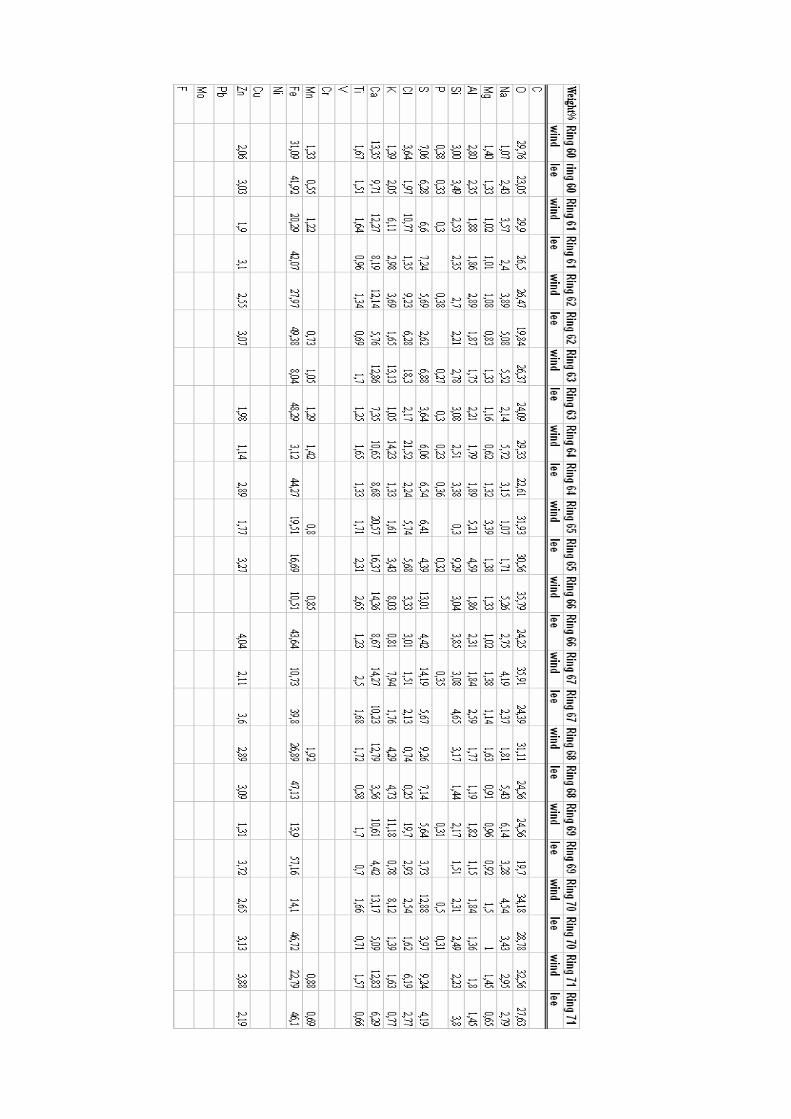
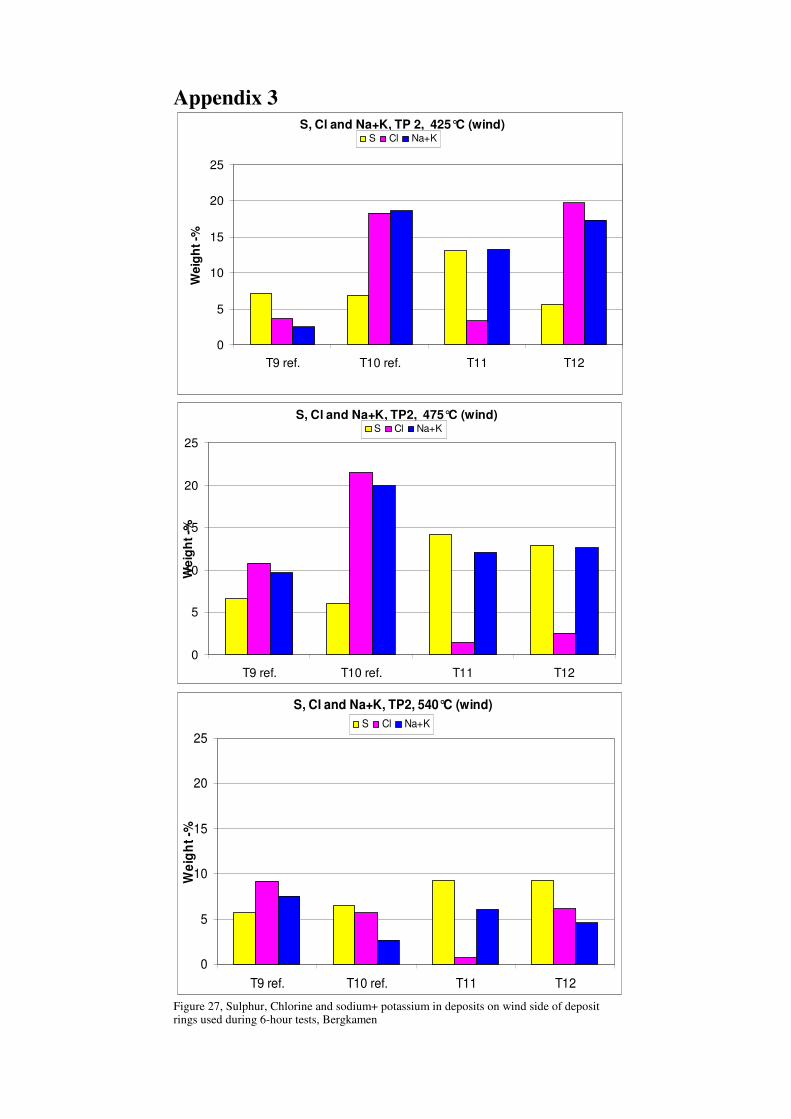
Appendix 3
S, Cl and Na+K, TP 2, 425°C (wind)
0
5
10
15
20
25
T9 ref. T10 ref. T11 T12
Weig
ht
-%
S Cl Na+K
S, Cl and Na+K, TP2, 475°C (wind)
0
5
10
15
20
25
T9 ref. T10 ref. T11 T12
We
igh
t -%
S Cl Na+K
S, Cl and Na+K, TP2, 540°C (wind)
0
5
10
15
20
25
T9 ref. T10 ref. T11 T12
We
igh
t -%
S Cl Na+K
Figure 27, Sulphur, Chlorine and sodium+ potassium in deposits on wind side of deposit rings used during 6-hour tests, Bergkamen
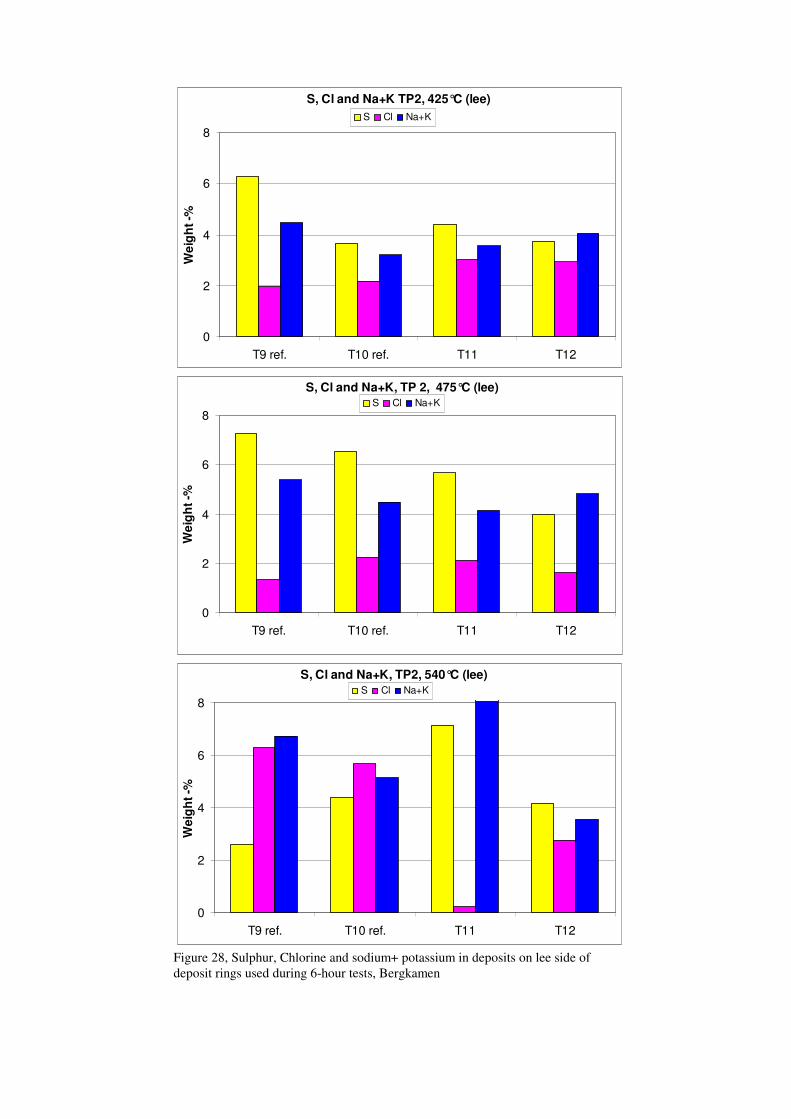
S, Cl and Na+K TP2, 425°C (lee)
0
2
4
6
8
T9 ref. T10 ref. T11 T12
We
igh
t -%
S Cl Na+K
S, Cl and Na+K, TP 2, 475°C (lee)
0
2
4
6
8
T9 ref. T10 ref. T11 T12
We
igh
t -%
S Cl Na+K
S, Cl and Na+K, TP2, 540°C (lee)
0
2
4
6
8
T9 ref. T10 ref. T11 T12
Weig
ht
-%
S Cl Na+K
Figure 28, Sulphur, Chlorine and sodium+ potassium in deposits on lee side of deposit rings used during 6-hour tests, Bergkamen

Appendix 4
In Appendix 4 are the complete cross-sectional analyses of the rings evaluated in chapter 4.2.5 and 4.3.5 in the report gathered. The carbon (C) analysed is epoxy from the enclosure of the ring that have displaced the loose deposits. Elements above and under the carbon are in reality in connection with each other. The carbon is mostly seen on rings from the 6-hour tests as these deposits were looser and had partly already let go of the ring before the enclosure.
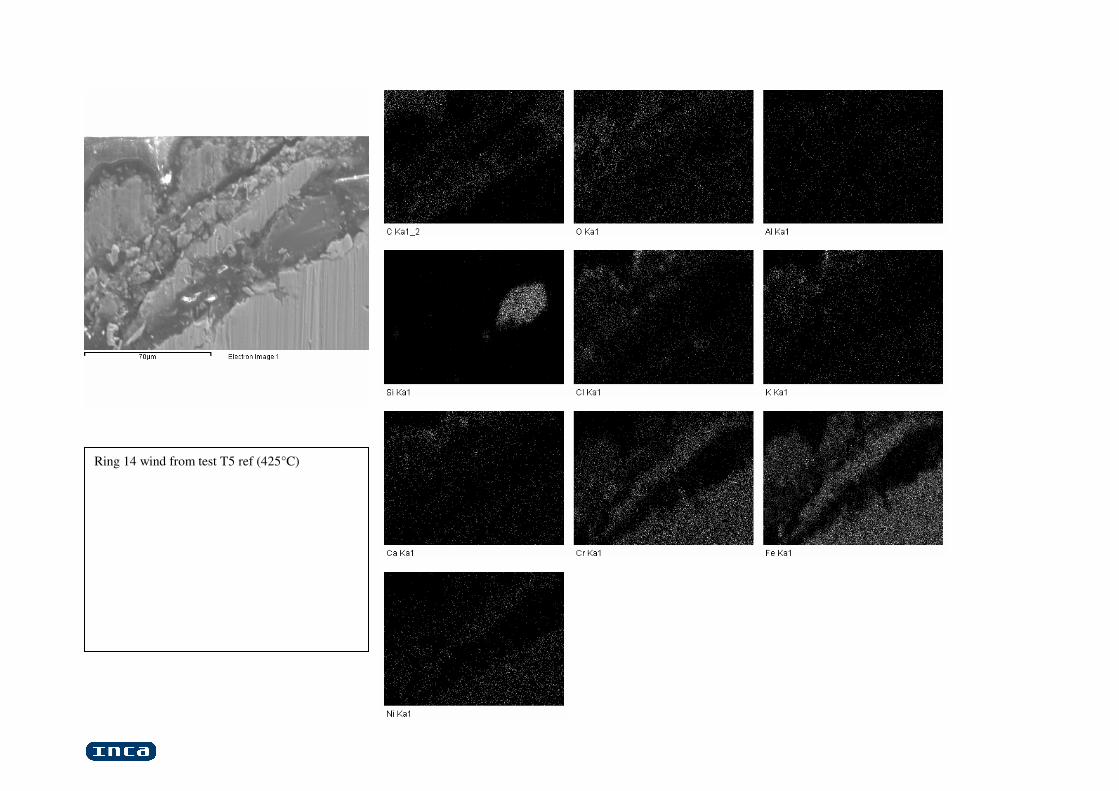
Appendix 4
2007-11-20 14:38:08
Ring 14 wind from test T5 ref (425°C)
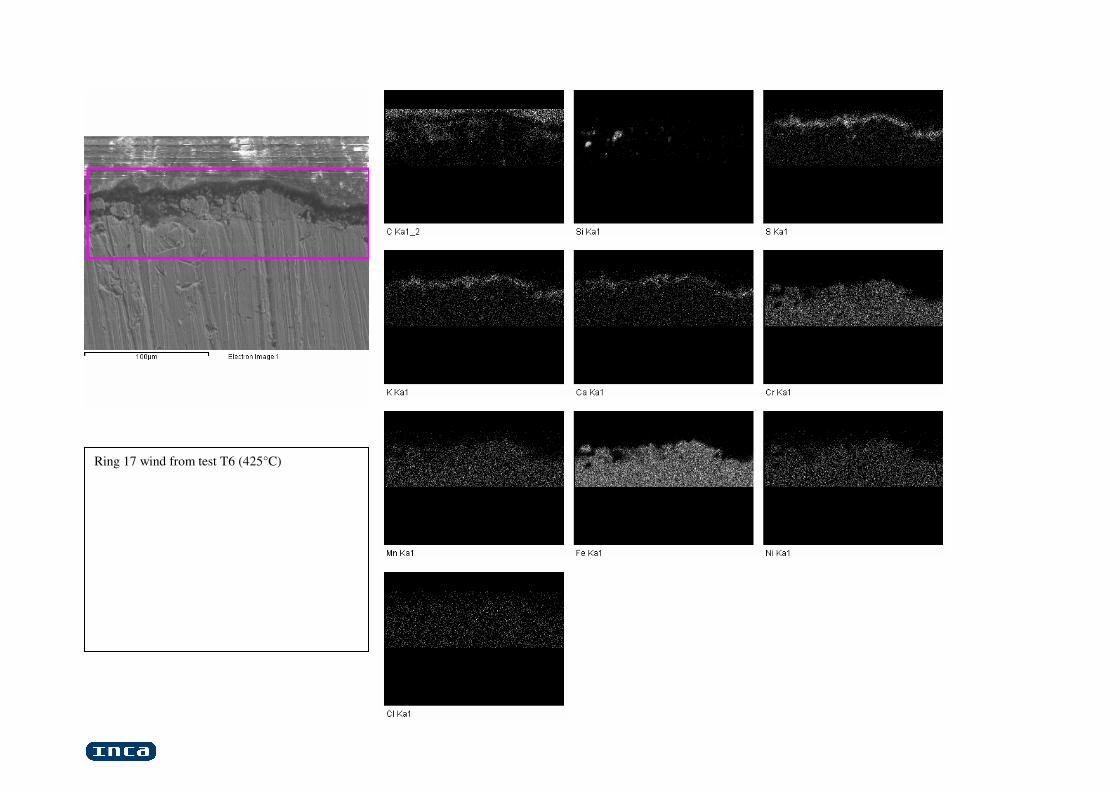
2007-11-29 11:39:57
Ring 17 wind from test T6 (425°C)
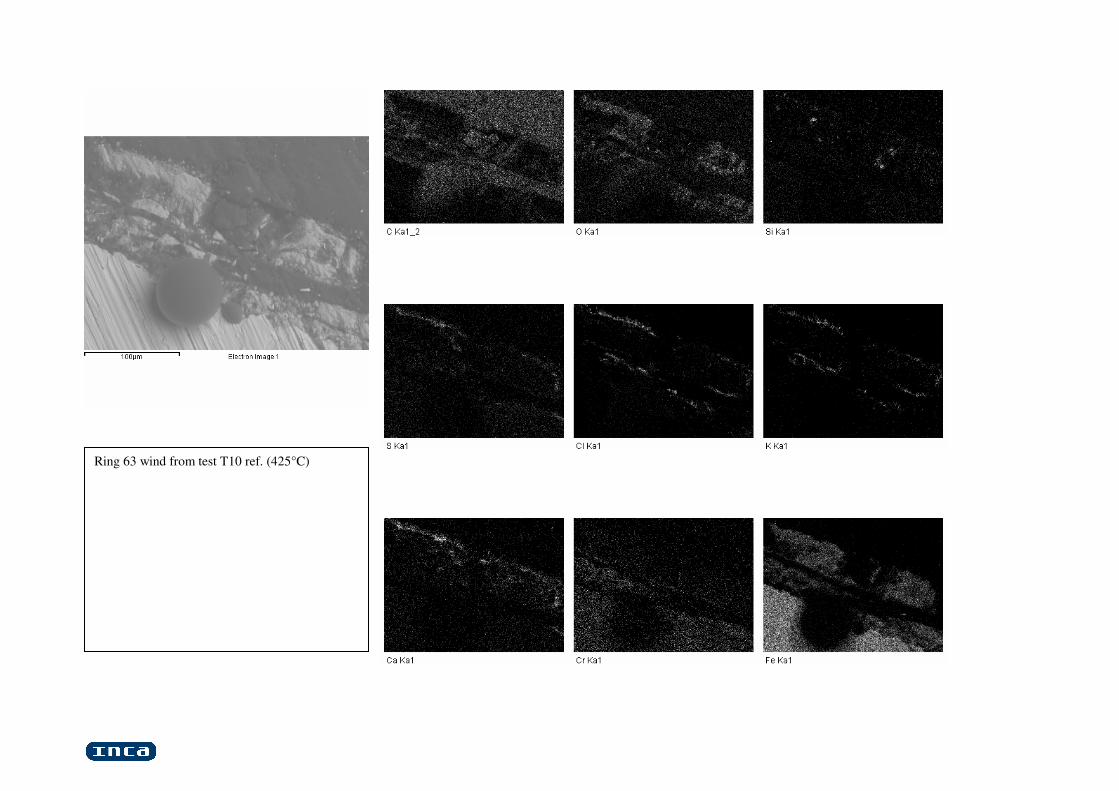
2007-11-20 09:48:15
Ring 63 wind from test T10 ref. (425°C)
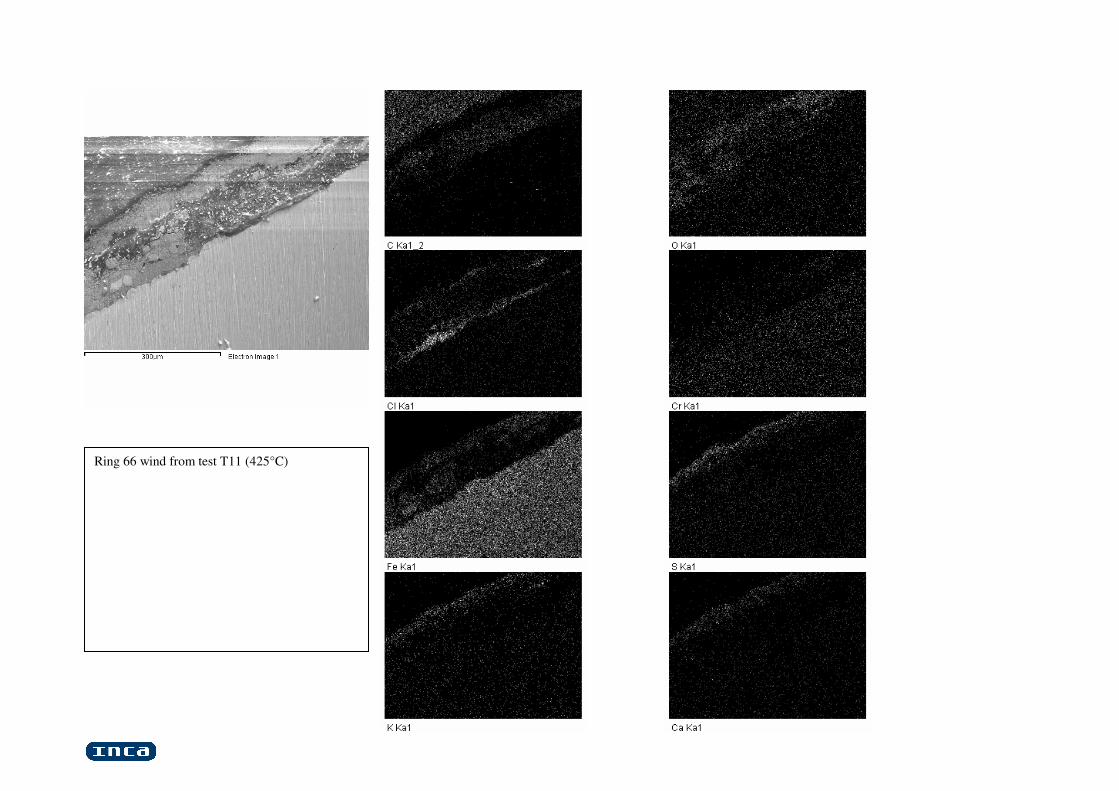
2007-11-20 11:46:15
Ring 66 wind from test T11 (425°C)


____________________________________________________________________ SLU SLU Institutionen för energi och teknik Department of Energy and Technology Box 7032 Box 7032 750 07 UPPSALA SE-750 07 UPPSALA Tel. 018-67 10 00 SWEDEN pdf.fil: www.et.slu.se Phone +46 18 671000