Embed Size (px)
Citation preview

Application note – Measurements with a Smart Phone
1
ODEON APPLICATION NOTE –Measurements with a Smart P hone
CLC, GK and JHR -‐ October 2013
Toys can be tools⋯ Scope This application note shows how to obtain “snap-‐shot” measurements for further analysis on a PC using any
edition of ODEON 12 with highly portable measurement equipment – all you need is:
1. A smart phone. 2. A recording app (e.g. the Pfitzinger Voice Design field recorder (http://pfitzingervoicedesign.com/). 3. An omni directional microphone (i436 by MicW, www.micwaudio.com/ ). 4. Some balloons or even lighter some hand claps. 5. Any edition of ODEON version 12.
The measurement equipment is extremely light weight and easy to set up compared to a full featured measurement system (dodecahedron loudspeaker, amplifier, PC, cables etc. ) yet it can provide decent measurement results for room acoustics parameters such as EDT, T20, T30, C80 (C80 is only available in ODEON
Auditorium and Combined). Therefore, there is little excuse not to make measurements when it may be useful. When visiting a site, while taking a few snap-‐shots for documentation using the camera in the Smart phone, by all means, as a room acoustician – why not making a few acoustic snap-‐shots of the room? The main limitations of this method are that the very low frequencies may not be measurable, and a calibration of the sound source is not possible; thus the strength parameter (G) cannot be measured using this method,
as this requires a calibrated measurement system.
Application note – Measurements with a Smart Phone
2
Equipment In contrast to a fully featured sweep-‐based measurement using a PC with ODEON installed, a snap-‐shot
measurement is carried out using an external impulsive stimulus, such as a hand clap or popping of a balloon. The external stimulus acts as the source, while the phone with microphone acts as the receiver.
Smart phone An Android smart phone, Samsung Galaxy S2 plus, was used for this application note. Most smartphones (Android, iPhone, Windows mobile…) should be suitable for snap-‐shot measurements as the frequency response of the input and output of the device is not very critical for parameters like T30 and C80, which do
not rely on calibrated levels. Microphone For the measurements in this application note we have
used the inexpensive omnidirectional microphone i436 by MicW (http://www.micwaudio.com/), which offers professional recording quality on a mobile device. The
microphone is available in a package which includes cables and adapter that allows mounting it on a tripod. The directional characteristics and the frequency response of the microphone are shown in figure 1.
Figure 1: The i436 microphone is a measurement microphone that complies with the IEC 61672 Class 2 sound level meter standard [1]. In contrast to the microphone in a Smart-‐phone which may not be a decent measurement microphone the i436 is omni directional, has an almost flat frequency response and has a Signal to noise ratio of 62 dB.
Application note – Measurements with a Smart Phone
3
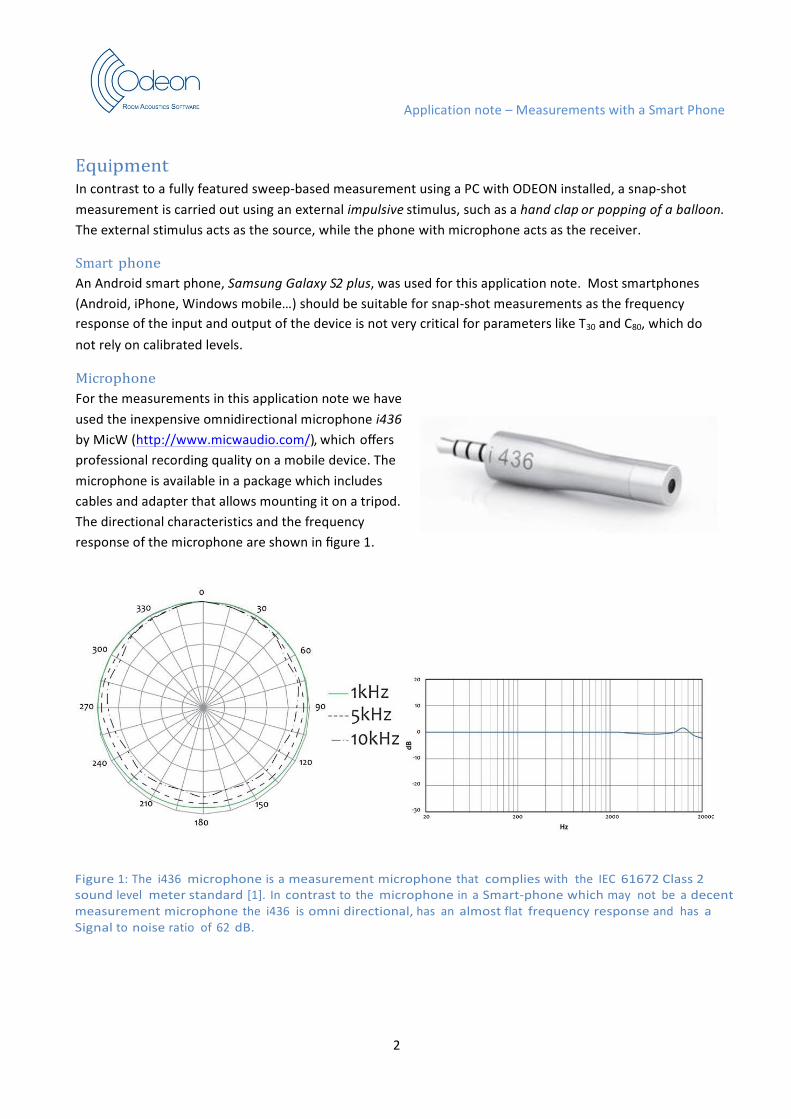
The recording app ODEON analyses .wav files. In order to record such files an app, which support this format, must be installed on the Smart-‐phone – the app should also be capable of indicating if overload (clipping) occurs during the recording.
Mono
Figure 2: Screenshot of the Pfitzinger Voice Design field recorder. The Mono setting has to be used instead of Stereo.
We have used the Pfitzinger Voice Design (PVD) “Field recorder” application that was purchased and installed from the Smart-‐phone through Google Play (https://play.google.com). This application runs on Android Smart-‐phones. Similar applications are available for iPhones, iPads and other tablets. One of those is the
Hindenburg Field Recorder (Version Mobile): http://hindenburgsystems.com/products/hindenburg-‐field-‐ recorder.
The sound source As sound source, we used balloons that are capable of emitting an impulse with substantial sound power when popped by a sharp object e.g. a needle. The sound power can be adjusted by filling the balloon with more or less air. If the balloon is pumped very hard it can be extremely loud – use hearing protectors to prevent hearing damage! For small rooms the impulse created by a balloon might cause overload. In that
case a lower level impulse can be created simply by clapping hands. Other stimuli that may be used are popping of a paper bag or the gunshot of a starting pistol. Hard footsteps on floor can also be used for low frequencies. Balloons are usually quite capable of producing high sound power, which can sufficiently cover
the middle and high frequency range. Big balloons are better at the low frequencies (63 and 125 Hz).
Application note – Measurements with a Smart Phone
4
Using handclaps as the sound source, the power is quite limited. For achieving a satisfactory signal to noise
ratio with handclapping the background noise should be as low as possible and the room should not be very large. ODEON may not be able to derive results at all octave bands, but still measurements at the middle
frequency bands are normally not so difficult. Occasionally, a hard footstep can be used to fill the gap for low frequency measurements that cannot be achieved with the previous types of stimuli.
Method When the microphone connection and the application have been tested measurements can begin. If you are two persons one can make the recording with the microphone and the other may create the impulse (e.g. popping the balloon). If you are on your own, place the microphone on a tripod (using the tripod adapter for
the i436) or, as an alternative option, place the microphone on a stable surface. Settings in the PVD Field Recorder application The type of recording should be set to mono when using the i436 microphone (in fact we did not succeed using the stereo setting). In this case – and for all room acoustic measurements in ODEON -‐ a mono type
microphone should be used. It is important to have a recording application that provides overload or clipping indication so you get a warning if overload occurs during a recording. If overload exists you may adjust the recording level/input
gain. In Pfitzinger Voice Design field recorder the input gain can be controlled by adjusting the Boost value. Another option is to make the next recording using a less pumped balloon (or a softer hand-‐clap).
Even though you are only using one microphone input, different microphone inputs can be chosen from the In: list (MicA to MicE). For the Smart-‐phone used in this application note MicB gave the best results (we tried the MicA setting too but it gave overload at very low sound pressure levels). It is recommended to experiment using the different microphone inputs, but always make sure that the selected microphone is the external one
– there may be multiple internal microphones in some smart phones even if they cannot record in stereo. The Bandpass filter center setting must be off.
Export to ODEON Normally a recording application such as the Pfitzinger Voice Design field recorder saves its recordings
into .WAV files that can be directly used in ODEON using the Load impulse response tool [2]. If the recording
application derives a different audio format, the files must be converted to .WAV in an external application, before loading into ODEON.
Case study A number of snap-‐shot measurements were carried out in the lunch area at Scion DTU in Lyngby, Denmark (figure 3). The lunch area is part of a large coupled space and is separated from the rest of the space by a wooden screen. The lunch area has the approximate dimensions: 21 meters by 7 meters and the height is
around 4 meters.

Application note – Measurements with a Smart Phone
5
Figure 3: Lunch Room at Scion DTU Lyngby, Denmark and our snapshot-‐recording equipment. We popped four balloons as the excitation stimuli. The distance between the source (balloon) and the microphone varied from about 8 meters to 3 meters. All four explosions were recorded at the same .WAV file. The measured impulse response as displayed in ODEON is shown in figures 4 and 5. Figure 4 shows the broadband pressure impulse response, while figure 3 shows the same impulse response squared (energy impulse response). Since the sound power emitted by different balloons is not stable and reproducible, the
strength of the impulse response cannot be fully controlled[3]. This is why there is not a monotonic behaviour for the strength of the impulse response while moving closer to the source. ODEON automatically detects the onset time (vertical dashed-‐pink line) of the response and automatically truncates the response at the noise floor (vertical dashed-‐red line). The truncation is performed for each band individually (figures 4 and 5).
Using the crop function available in the measuring system (Measured response|Crop) we can isolate further the
selected impulse response and save it to a new .WAV file[4]. In order to crop an impulse response we can just drag a rectangle around the desired area (from left upper corner to right lower corner of the area of interest) – then we can press the C shortcut to save the selected time rage as a separate file.
(Continues on page 7)

Application note – Measurements with a Smart Phone
6
SPL(
dB
)
Figure 4: A recording containing 4 impulse responses using balloon explosions in the room of Fig. 3. The broadband signal is shown. The distances between microphone and balloon were 8, 7, 5 and 4 meters, respectively. The impulse responses were recorded in a single .WAV file which has duration of approximately 40 seconds. The file was further analysed in ODEON.
C :\Odeon12C ombined\Measurements\PVD\131010-142436.wav
Raw decay curve (broad band)
-2 -4 fecb -6 fecb
E, Measured
Noise floor -8
-10 -12 -14 -16 -18 -20 -22 -24 -26 -28 -30 -32 -34 -36 -38 -40 -42 -44 -46 -48 -50 -52 -54 -56 -58 -60
fecb Onset time
fecb Truncation time
Chair moved accidentally during
the recording.
-30
-25
-20
-15
-10 -5 0
time (seconds)
5 10
Odeon©1985-2013 Licensed to: Odeon A/S
Figure 5: Broadband impulse responses of figure 4 squared. ODEON will automatically isolate the impulse response that gives the highest signal to noise ratio. The onset time is indicated by a vertical pink-‐dashed line while the truncation time due to noise floor is indicated by a vertical red-‐dashed line.

Application note – Measurements with a Smart Phone
7
p
(Continues from page 5) The selection does not need to be very precise because ODEON will re-‐detect the onset and truncation times. However, the tail should be long enough to allow an estimate of the background noise. Figure 6 shows the cropped (isolated) impulse response for the 1000 Hz octave band and figure 7 shows the squared impulse response. The noise floor is clearly visible at the squared impulse response display.
C:\Odeon12Combined\Measurements\PVD\131010-142436Cropped.w av
Ray Impulse response at 1000Hz
13
12 bcef Omni microphone
11
10
9 8
7 6
5
4 3
2 1
0
-1 -2
-3 -4
-5
-6 -7
-8 -9
-10
-11 -12 -13
fecb Onset time
bcef Truncation time
-0.15
-0.1
-0.05 0
0.05
0.1
0.15
0.2
0.25
0.3
0.35
0.4
0.45
0.5
0.55
0.6
0.65
0.7
0.75
0.8
Odeon©1985-2013 Licensed to: Odeon A/S time (seconds)
Figure 6: Cropped impulse response from Fig. 4, filtered at 1000 Hz.

Application note – Measurements with a Smart Phone
8
SPL(
dB
)
Figure 7: Same impulse response as for Fig. 6, but squared and displayed in dB. The noise floor detected by ODEON is indicated by a horizontal dotted line.
Figure 8 shows the energy decay curves for the eight octave bands (63Hz to 8 kHz) available in ODEON. The
decay curves are used for the derivation of the room acoustic parameters.
C :\Odeon12C ombined\Measurements\PVD\131010-142436.wav Decay curcves
46 44 42
40 38 36 34 32 30 28
26 24 22 20 18 16 14 12
10 8 6 4 2 0
-2
-4 -6 -8
-10
-12
fecb fecb fecb fecb fecb fecb fecb fecb
T(30)=*.** s at 63Hz T(30)=0.75 s at 125Hz
T(30)=0.65 s at 250Hz
T(30)=0.68 s at 500Hz T(30)=0.57 s at 1000Hz
T(30)=0.51 s at 2000Hz
T(30)=0.48 s at 4000Hz T(30)=0.41 s at 8000Hz
0 0.05 0.1 0.15 0.2 0.25 0.3 0.35 0.4 0.45 0.5 0.55 0.6
Odeon©1985-2013 Licensed to: Odeon A/S time(seconds)
Figure 8: Energy decay curves of the eight bands from 63 Hz to 8000 Hz, for the selected cropped impulse response in figures 6 and 7.
Room acoustic parameters
The Room acoustic parameter list in the ODEON software provides a list of room acoustic parameters
calculated from the impulse response (truncated where the decay enters the noise floor). Depending on the edition of ODEON, different parameters are available. ODEON Auditorium and
ODEON Combined editions provide the full set of parameters, which can be modified or extended by the user. Figure 9 shows the default set of room acoustic parameters for the impulse response of figures 6 and 7, as
displayed in ODEON Combined edition when the wave file is loaded using the Load impulse response tool . Some parameters may not be correctly derived due to the lack of information. For example SPL does not have a meaningful value because the system of the balloon (source) and the microphone (receiver) cannot be calibrated and LF80 is not correct either as there is no figure-‐8 microphone involved in the measurement. It is
possible to exclude such parameters from being displayed as part of a result display by unchecking the
Measured field in the Room acoustic parameter list. In a similar way other parameters can be selected or deselected for display.

Application note – Measurements with a Smart Phone
9
Table 1 shows a collection of room acoustic parameters at 1 kHz for the four different positions – four
different impulse responses (see figure 4). Even using the simple equipment described in this application
note it seems we are able to capture the sound filed quiet accurately, with all the variations included.
Figure 9: Room Acoustic parameters derived from the impulse response shown in Fig.6 and 7. Wherever the * character is displayed the parameter cannot be calculated, due to lack of sufficient dynamic range or due to insufficient length of the impulse response.
Parameters 8m distance 7m distance 5m distance 4m distance EDT,1kHz(s) 0.53 0.48 0.36 0.29 T30,1kHz(s) 0.55 0.55 0.57 0.51 Ts,1kHz(ms) 35 32 26 19 C80,1kHz(dB) 9.4 10.1 11.9 14.6 Peak/Noise 69.95 65.61 72.42 66.95
Table 1: Selected room acoustic parameters for the four different receiver positions in the room (figure 4).
Warning against overload As already mentioned it is important to be aware of overload when recording impulse responses, so no clipping occurs in the recorded impulse responses. Clipping is best spotted looking at the broadband squared impulse response recording, while octave-‐band filtered versions of the response may hide the problem. In
Application note – Measurements with a Smart Phone
10
SPL(
dB
)
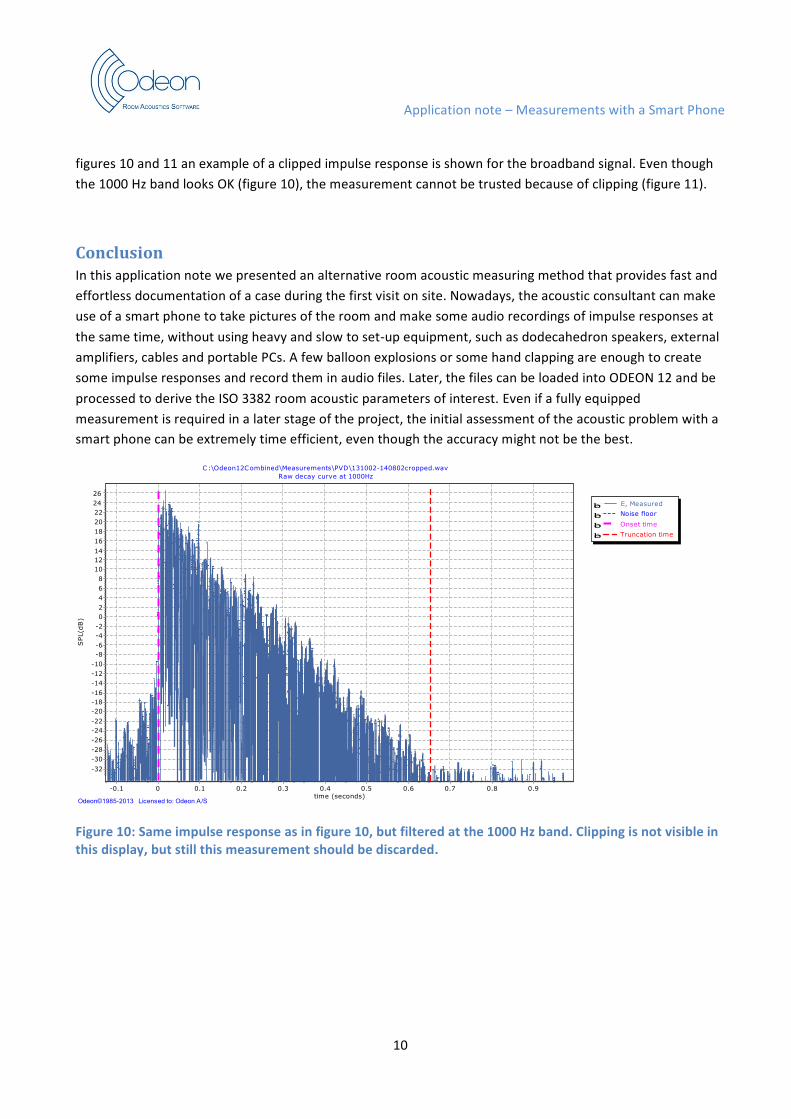
figures 10 and 11 an example of a clipped impulse response is shown for the broadband signal. Even though the 1000 Hz band looks OK (figure 10), the measurement cannot be trusted because of clipping (figure 11).
Conclusion In this application note we presented an alternative room acoustic measuring method that provides fast and effortless documentation of a case during the first visit on site. Nowadays, the acoustic consultant can make use of a smart phone to take pictures of the room and make some audio recordings of impulse responses at
the same time, without using heavy and slow to set-‐up equipment, such as dodecahedron speakers, external amplifiers, cables and portable PCs. A few balloon explosions or some hand clapping are enough to create some impulse responses and record them in audio files. Later, the files can be loaded into ODEON 12 and be
processed to derive the ISO 3382 room acoustic parameters of interest. Even if a fully equipped measurement is required in a later stage of the project, the initial assessment of the acoustic problem with a smart phone can be extremely time efficient, even though the accuracy might not be the best.
C :\Odeon12C ombined\Measurements\PVD\131002-140802cropped.wav
Raw decay curve at 1000Hz
26 24 fecb
E, Measured
22 20 18 16 14 12 10 8 6 4 2 0
-2 -4 -6 -8
-10 -12 -14 -16 -18 -20 -22 -24 -26 -28 -30 -32
fecb Noise floor
fecb Onset time fecb Truncation time
-0.1 0
0.1
0.2
0.3
0.4
0.5
0.6
0.7
0.8
0.9
Odeon©1985-2013 Licensed to: Odeon A/S time (seconds)
Figure 10: Same impulse response as in figure 10, but filtered at the 1000 Hz band. Clipping is not visible in this display, but still this measurement should be discarded.

Application note – Measurements with a Smart Phone
11
SPL(
dB
)
C :\Odeon12C ombined\Measurements\PVD\131002-140802cropped.wav Raw decay curve (broad band)
0 -2
fecb -4
fecb -6
E, Measured Noise floor
-8 -10 -12 -14 -16 -18 -20 -22 -24 -26 -28 -30 -32 -34 -36 -38 -40 -42 -44 -46 -48 -50 -52 -54 -56 -58
Clipping
fecb Onset time
fecb Truncation time
-0.1 0 0.1 0.2 0.3 0.4 0.5 0.6 0.7 0.8 0.9
Odeon©1985-2013 Licensed to: Odeon A/S time (seconds)
Figure 11: Clipping at the broadband impulse response, due to overload during the recording.
References 1. IEC 61672-‐1, Electroacoustics-‐ Sound Level Meters. 2002-‐05. 2. C.L. Christensen & G. Koutsouris. ODEON Room Acoustics Software, manual, version 12, Odeon A/S,
Denmark 2013 (http://www.odeon.dk/pdf/ODEONManual12.pdf). 3. Claus Lynge Christensen, George Koutsouris and Jens Holger Rindel. The ISO 3382 parameters. Can we
measure them? Can we simulate them? International Symposium on Room Acoustics, Toronto, Canada. June 2013 (http://www.odeon.dk/publications#Pap).
4. Claus Lynge Christensen. Impulse Response Measurements, ODEON video tutorials: http://www.odeon.dk/impulse-‐response-‐measurements