Embed Size (px)
Citation preview
APPENDIX K
BC MINISTRY OF ENVIRONMENT EIS
Part A: Stage 2 EIS Report
A acis Isla d WWTP Ne Outfall Syste
Va cou er Fraser Port Authority
Project a d E iro e tal Re ie Applicatio

This page intentionally left blank
12 March 2018
ANNACIS ISLAND WASTEWATER TREATMENT PLANT TRANSIENT MITIGATION AND OUTFALL PROJECT
Stage 2 Environmental Impact Study
RE
PO
RT
Report Number: 1525010-119-R-Rev0
Distribution:
1 copy Metro Vancouver 1 copy CDM Smith Canada ULC
Submitted to: Metro Vancouver Metrotower Office Complex 4730 Kingsway Burnaby, BC V5H 0C6

STAGE 2 ENVIRONMENTAL IMPACT STUDY
12 March 2018 Report No. 1525010-119-R-Rev0 ii
Executive Summary
BACKGROUND
Metro Vancouver (MV), through the Greater Vancouver Sewerage and Drainage District, owns and operates three
secondary wastewater treatment plants that discharge to the lower Fraser River. The largest plant, Annacis Island
Waste Water Treatment Plant (AIWWTP) is located adjacent to the Fraser River on Annacis Island, Delta, British
Columbia. The AIWWTP is being expanded by Metro Vancouver to increase secondary treatment hydraulic
capacity to approximately 1.25 million people and is being upgraded to meet current seismic standards.
Once complete, the AIWWTP Stage V upgrade will increase treatment capacity to accommodate the region’s future population growth, provide additional reliability in maintaining sewage treatment capabilities in the event of
a large earthquake, take advantage of green energy captured on-site, and better manage odour issues. A major
component of the Stage V Expansion is the upgrade and replacement of the AIWWTP outfall in the lower Fraser
River.
To discharge effluent from the new outfall, the project requires an amendment of Operational Certificate ME-00387
under the Integrated Liquid Waste and Resource Management Plan (ILWRMP) pursuant to the provincial
Environment Management Act (EMA). As per the BC Municipal Wastewater Regulation (BC Reg 87/2012;
OC 230/2012), (also pursuant to EMA), an Environmental Impact Study (EIS) of the effluent discharge is required
to identify whether or not receiving water uses could be impaired by the hydraulic upgrade. The EIS is used by BC
Ministry of Environment in their permitting decisions and is used by the discharger, in this case MV, as part of their
due diligence to verify that they meet the requirements of EMA, the ILWRMP, and the federal Fisheries Act
(R.S.C., 1985, c. F-14).
Golder Associates Ltd. was retained by CDM Smith Canada ULC on behalf of MV to prepare an EIS for the new
outfall diffuser system, in support of the application to amend Operational Certificate ME-00387, in accordance
with provincial guidance that specifies a staged EIS process. This report represents stage two of that process and
is a refined evaluation of potential effluent-related impacts on the receiving environment and public health based
on the final project design.
OBJECTIVES
This Stage 2 EIS is intended to provide a technical assessment of predicted water quality as a means to evaluate
whether adverse effects on the receiving environment and public health might result from the Stage V Upgrade.
The objectives of the study are outlined below.
Refine the receiving environment characterization of the Study Area to include additional information
gathered since the Stage 1 EIS was submitted.
Refine effluent plume modelling to include near-field plume modelling and far-field hydrodynamic water
quality dispersion modelling.
Determine the initial dilution of the effluent plume via modeling and estimate constituent concentrations in the
near-field at the edge of the initial dilution zone (IDZ) and in the far-field within the Study Area. Assess the
potential for adverse effects on aquatic life and impairment of other receiving environment uses identified for
the Study Area, through a risk-based impact assessment of the predicted near-field and far-field
concentrations.
STAGE 2 ENVIRONMENTAL IMPACT STUDY
12 March 2018 Report No. 1525010-119-R-Rev0 iii
Identify uncertainties in the impact assessment.
Provide recommendations to be considered in post-discharge monitoring for the AIWWTP outfall after the
Stage V upgrade.
APPROACH
The Stage V upgrade is a hydraulic upgrade and does not involve any process changes that could change effluent
quality. This EIS therefore assumes that effluent quality will remain the same as that most recently characterized
between 2012 and 2016. Effluent quality reported for this period was assessed to determine if, after the Stage V
upgrade, effluent quality would meet ILWRMP requirements and federal Wastewater Systems Effluent Regulation
(WSER; SOR/2012-139) (WSER) limits. Although nutrient concentrations in effluent are not expected to change
from those reported for the current discharge, nutrient loadings would be expected to increase under Stage V
flows. The projected increase in nutrient loadings to the receiving environment was evaluated in the impact
assessment with respect to the potential for nutrient enrichment in the lower Fraser River.
Consistent with provincial guidance, water quality predictions generated at the edge of the IDZ (near-field) and at
areas of concern beyond the IDZ (far-field) were assessed to evaluate the potential for adverse effects on public
health and water uses relevant to the Study Area: i.e., protection of aquatic life, secondary recreational contact,
wildlife use, and agricultural uses (livestock and irrigation). For this assessment, the IDZ where mixing of the
effluent and the receiving water occurs is defined as a cylindrical body of water around the outfall with a lateral
radius of 100 m from the outfall and extending upwards to the surface of the water column. The Study Area is
primarily located in an industrial area with no recreational beaches or drinking water intakes. Recreational areas
are located further downstream and the Fraser River is not a drinking water source. The five areas of concern
identified as far-field assessment nodes for this assessment therefore relate to the Corporation of Delta irrigation
intake and sturgeon and salmonid rearing habitat identified in the Study Area. One far-field node was upstream of
the AIWWTP, with the other four nodes located downstream.
Constituents that exceeded both ambient river concentrations at the edge of the IDZ and an applicable water
quality objective or guideline were identified as preliminary near-field COPCs. Preliminary near-field COPCs were
further evaluated by comparing predicted concentrations to measured concentrations at the edge of the IDZ for
the currently approved AIWWTP discharge. This comparison was undertaken to evaluate if there was an expected
incremental increase in IDZ concentrations due to the Stage V upgrade. Available toxicological information was
also reviewed for preliminary COPCs to evaluate the potential for adverse effects on ecological and public health
from the predicted Stage V IDZ concentrations. Concentrations of near-field COPCs were predicted at the far-field
assessment nodes and screened against applicable water quality objectives and guidelines and ambient river
concentrations.
Constituents assessed in the impact assessment included conventional parameters, metals, nutrients, and a range
of organic constituents that included pesticides (herbicides, insecticides, and fungicides), alkylphenols,
polychlorinated biphenyls, polybrominated diphenyl ethers, hormones and sterols, and polycyclic aromatic
hydrocarbons. Approximately 140 constituents were assessed in the impact assessment. The receiving
environment impact assessment also identified and evaluated persistent, bioaccumulative, and toxic constituents
(PBTs) to evaluate the potential for adverse effects from fish consumption.

STAGE 2 ENVIRONMENTAL IMPACT STUDY
12 March 2018 Report No. 1525010-119-R-Rev0 iv
IMPACT STUDY CONCLUSIONS
Overall, the Stage 2 impact assessment presented in Section 7 indicates that pollution as defined by EMA is
unlikely to occur as a result of the Stage V hydraulic upgrade to the AIWWTP. This conclusion is based on
assessment of the receiving water quality predictions for approximately 140 constituents (Section 6) and in
consideration of the uncertainty assessment (Section 8); specifically:
Adverse effects are not expected on aquatic life, or impairment of other receiving environment uses identified
for the Study Area, or public health. This conclusion is based on the assessment of predicted concentrations
at the edge of the IDZ made for an effluent flow rate of two times the average dry weather flow (2xAWDF)
and at lower effluent flow rates considered in the uncertainty assessment. This conclusion also applies to the
assessment of predicted concentrations at far-field nodes in the Fraser River.
No effect of the project on risk of adverse effects on wildlife and people consuming fish from the Fraser River
is not expected because no change in effluent quality is anticipated and concentrations of PBT constituents
at the IDZ are not predicted to increase with the Stage V upgrade. Fish tissue monitoring is recommended to
confirm this conclusion.
Secondary treated whole effluent at the point of discharge is not expected to be acutely lethal to aquatic life
and conditions within the IDZ would likewise not be expected to be acutely lethal to aquatic life. When the
new effluent outfall is commissioned, acute toxicity testing will be carried out to confirm these predictions and
is expected to be a condition of the amended Operational Certificate.
The most recent characterization of effluent presented in the Stage 2 EIS (i.e., 2016) indicates that the AIWWTP
effluent meets conditions of Section 6(1) of WSER, and as such its deposit is authorized under Section 36(4) of
the Fisheries Act.
POST-DISCHARGE MONITORING
Post-Stage V monitoring is intended to confirm and verify the findings of the Stage 2 EIS and address identified
uncertainties. Long term AIWWTP effluent monitoring and receiving environment monitoring programs are
implemented by MV.
Sediment and fish tissue sampling to confirm the findings of the EIS is proposed for consideration by MV. This
confirmatory work is not necessarily intended for long-term inclusion in the currently implemented receiving
environment monitoring programs. Initially, it is intended to provide data to confirm whether the sediment quality
is influenced by the Stage V upgrade and to confirm the findings of the assessment of PBT constituents. Sampling
of sediment quality and fish tissues is recommended prior to and following commissioning of the Stage V
discharge, with future recommendations to be made based on the findings of those studies.
STAGE 2 ENVIRONMENTAL IMPACT STUDY
12 March 2018 Report No. 1525010-119-R-Rev0 v
Study Limitations
This report was prepared for the exclusive use of Metro Vancouver and CDM Smith Canada ULC. No other party
may use or rely on this report or any portion thereof without Golder’s express written consent. Golder will consent to any reasonable request by the Client to approve the use of this report by other parties as Approved Users.
Regulators are considered Approved Users. Any use that a third party may make of this report, or any reliance on
or decisions made based on it, is the responsibility of the third parties. Golder Associates Ltd. accepts no
responsibility for damages, if any, suffered by any third party as a result of decisions made or actions based on
this report. We disclaim responsibility for consequential financial effects on transactions or property values, or
requirements for follow-up actions and costs.
In preparing this report, we have relied in good faith on information provided by others, notably CDM Smith Canada
ULC and Envirowest Consultants Inc. We assume that the information provided is factual and accurate. We accept
no responsibility for any deficiency, mis-statement or inaccuracy contained in this report as a result of omissions,
misinterpretations or fraudulent acts of persons interviewed or contacted. As indicated in the report, Golder is
responsible for the content of this report with the exception of Section 6.0 and Appendix A that was prepared by
CDM Smith Canada ULC and Appendix D that was prepared by Envirowest Consultants Inc.
The services performed as described in this report were conducted in a manner consistent with the level of care
and skill normally exercised by other members of the engineering and science professions currently practicing
under similar conditions, subject to the time limits and financial and physical constraints applicable to the services.
The content of this report is based on information compiled during preparation of the report, our present
understanding of site conditions, the assumptions stated in this report, and our professional judgement in light of
such information at the time of preparation of this report. This report provides a professional opinion and, therefore,
no warranty is expressed, implied, or made as to the conclusions, advice and recommendations offered in this
report. This report does not provide a legal opinion regarding compliance with applicable laws. With respect to
regulatory compliance issues, it should be noted that regulatory statutes and the interpretation of regulatory
statutes are subject to change.
The findings and conclusions of this report are valid only as of the date of the report. If new information is
discovered in future work, or if the assumptions stated in this report are not met, Golder Associates Ltd. should be
requested to re-evaluate the conclusions of this report, and to provide amendments as required.
STAGE 2 ENVIRONMENTAL IMPACT STUDY
12 March 2018 Report No. 1525010-119-R-Rev0 vi
Table of Contents
1.0 INTRODUCTION .................................................................................................................................................... 1
1.1 Project Description .................................................................................................................................... 1
1.3 Stage 2 EIS Objectives ............................................................................................................................. 4
1.4 Consultation with Ministry of the Environment .......................................................................................... 4
1.5 Report Overview ....................................................................................................................................... 5
2.0 RECEIVING ENVIRONMENT CHARACTERIZATION AND USE ......................................................................... 7
2.1 Background and Study Area ..................................................................................................................... 7
2.2 Physical Setting ........................................................................................................................................ 8
2.2.1 Hydrology ............................................................................................................................................ 8
2.2.2 Water and Sediment Quality ............................................................................................................... 8
2.3 Ecological Resources ............................................................................................................................. 11
2.3.1 Fish and Fish Habitat ........................................................................................................................ 12
2.3.2 Fish Health and Tissue Concentrations ............................................................................................ 14
2.3.3 Benthic invertebrates ........................................................................................................................ 16
2.3.4 Mammals .......................................................................................................................................... 17
2.3.5 Birds .................................................................................................................................................. 17
2.3.6 Species at Risk ................................................................................................................................. 18
2.4 Receiving Environment Uses and Relevant Water Quality Guidelines ................................................... 21
2.4.1 Protected Areas and Parks ............................................................................................................... 21
2.4.2 Fisheries ........................................................................................................................................... 22
2.4.3 Recreational Activities ....................................................................................................................... 23
2.4.4 Other Uses ........................................................................................................................................ 24
2.4.5 Withdrawals and Discharges ............................................................................................................. 24
2.4.6 Applicable Water Quality Objectives and Guidelines ........................................................................ 26
3.0 REGULATORY SETTING .................................................................................................................................... 29
3.1 Integrated Liquid Waste and Resource Management Plan ..................................................................... 29
3.2 Environmental Management Act and the Municipal Wastewater Regulation .......................................... 29
3.3 Fisheries Act and the Federal Wastewater Systems Effluent Regulation ............................................... 30
3.4 Port of Vancouver Project Review Process ............................................................................................ 30
4.0 IMPACT STUDY SCOPE AND SPATIAL BOUNDARIES ................................................................................... 32
STAGE 2 ENVIRONMENTAL IMPACT STUDY
12 March 2018 Report No. 1525010-119-R-Rev0 vii
5.0 EFFLUENT ASSESSMENT ................................................................................................................................. 35
5.1 Summary of Effluent Constituents .......................................................................................................... 35
5.1.1 pH ..................................................................................................................................................... 36
5.1.2 Total Suspended Solids .................................................................................................................... 36
5.1.3 Carbonaceous Biochemical Oxygen Demand (CBOD) ..................................................................... 36
5.1.4 Ammonia ........................................................................................................................................... 36
5.1.5 Nutrient Enrichment .......................................................................................................................... 37
5.1.6 Pathogens ......................................................................................................................................... 37
5.1.7 Metals ............................................................................................................................................... 38
5.1.8 Organics ............................................................................................................................................ 38
5.1.9 Endocrine Disrupting Compounds .................................................................................................... 38
5.1.10 Sterols ............................................................................................................................................... 39
5.2 Effluent Criteria Applicable to the AIWWTP ............................................................................................ 39
5.3 Summary of Effluent Chemistry and Toxicity Testing ............................................................................. 40
5.3.1 Effluent Chemistry ............................................................................................................................. 40
5.3.2 Ammonia ........................................................................................................................................... 41
5.3.3 Effluent Toxicity ................................................................................................................................. 42
5.4 Nutrient Loading Assessment ................................................................................................................. 43
5.4.1 Factors Affecting Primary Productivity in the Lower Fraser River ..................................................... 43
5.4.2 Predicted Nutrient Loadings under Stage V Flows ............................................................................ 44
5.5 Selection of Organic Constituents for the Receiving Impact Assessment ............................................... 45
6.0 RECEIVING WATER QUALITY PREDICTIONS ................................................................................................. 46
6.1 Multiport Diffuser Design Concept .......................................................................................................... 46
6.2 Input Data for the Analysis ...................................................................................................................... 48
6.3 Predicting Concentrations at the Edge of the IDZ ................................................................................... 50
6.3.1 Methodology: Predictions at the IDZ Boundary ................................................................................. 50
6.3.2 Far-field Dilution ................................................................................................................................ 52
6.3.2.1 H3D Model Structure and Inputs ................................................................................................... 52
6.3.2.2 H3D Results: Background Buildup ................................................................................................. 53
6.3.2.3 H3D Results: Concentrations at Far-Field Assessment Nodes ..................................................... 55
6.3.2.4 H3D Results: Behavior of the Effluent Plume in the Far Field ....................................................... 55
6.3.3 Instantaneous Dilution in the Near-field ............................................................................................ 58
STAGE 2 ENVIRONMENTAL IMPACT STUDY
12 March 2018 Report No. 1525010-119-R-Rev0 viii
6.3.4 Calculating Mass Loads from Effluent Sampling Data ...................................................................... 59
6.3.5 Temperature and Ammonia .............................................................................................................. 60
6.3.5.1 Comparison of the Effect of Effluent Temperature on Ambient Water Temperature ...................... 60
6.3.5.2 Ammonia Predictions ..................................................................................................................... 61
6.4 Results of Predicted Concentrations at the Edge of the IDZ ................................................................... 63
7.0 RECEIVING ENVIRONMENT IMPACT ASSESSMENT ...................................................................................... 64
7.1 Methods .................................................................................................................................................. 64
7.1.1 Data Sources .................................................................................................................................... 64
7.1.2 Data Review ...................................................................................................................................... 65
7.1.3 Screening of Near-Field and Far-Field Predictions ........................................................................... 66
7.1.4 Assessment of PBT Constituents ...................................................................................................... 69
7.2 Near-Field Assessment Results ............................................................................................................. 69
7.2.1 Aquatic Life, Wildlife, Livestock and Irrigation Uses .......................................................................... 69
7.2.2 Public Health ..................................................................................................................................... 74
7.3 Far-Field Assessment Results ................................................................................................................ 78
7.3.1 Aquatic Life, Wildlife, Livestock, and Agricultural Uses ..................................................................... 78
7.3.2 Public Health ..................................................................................................................................... 79
7.4 Assessment of PBT Constituents ........................................................................................................... 80
7.4.1 Identification of PBT Constituents ..................................................................................................... 80
7.4.2 Evaluation of Near-field PBT Water Concentrations ......................................................................... 82
8.0 STAGE 2 EIS UNCERTAINTY ASSESSMENT ................................................................................................... 86
9.0 IMPACT CONCLUSIONS .................................................................................................................................... 90
10.0 STAGE V POST-DISCHARGE MONITORING AND CONFIRMATORY MONITORING ..................................... 91
10.1 Summary of Current Long-Term Monitoring Relevant to the Stage V Upgrade ...................................... 91
10.2 AIWWTP Effluent Sampling Program and the REM Water Quality Program .......................................... 92
10.3 Confirmatory Sampling ........................................................................................................................... 93
11.0 CLOSURE ............................................................................................................................................................ 94
12.0 REFERENCES ..................................................................................................................................................... 95
12.1 Literature Cited ....................................................................................................................................... 95
12.2 Personal Communication ...................................................................................................................... 105
STAGE 2 ENVIRONMENTAL IMPACT STUDY
12 March 2018 Report No. 1525010-119-R-Rev0 ix
TABLES
Table 1-1: Stage 2 Environmental Impact Study: Authorship and Professional Certification .......................................... 6
Table 2-1: Species at Risk with Potential to Occur in Aquatic or Riverbank Areas within the Study Area ..................... 19
Table 2-2: Parks Located in the Vicinity of the Study Area............................................................................................ 21
Table 2-3: 2013 First Nations Kept Catches in the Lower Fraser River (below Port Mann Bridge) ............................... 23
Table 2-4: Withdrawal Rates to the Fraser River Main Channel between Pattullo Bridge and Tilbury Island ............... 25
Table 2-5: Discharge Rates to the Fraser River Main Channel between Pattullo Bridge and Tilbury Island ................. 26
Table 5-1: Annacis Island WWTP Effluent Quality Compared to National and Operational Certificate Effluent Limits .. 40
Table 5-2: Stage AIWWTP Upgrade: Predicted Phosphorus and Nitrogen Loadings to the Lower Fraser River Receiving Environment in Early Fall (September/Early October)1 ................................................................ 44
Table 6-1. Monthly Background Buildup Dilution for Use in Long-term Average Assessments..................................... 55
Table 6-2: Number of Monthly Effluent and Ambient Model Input Parameters .............................................................. 58
Table 6-3. Ammonia Compliance Summary .................................................................................................................. 61
Table 6-4. Predicted Monthly Average Effluent Ammonia Concentrations .................................................................... 62
Table 7-1: Constituents considered in the PBT Assessment of the AIWWTP Stage 2 EIS .......................................... 81
Table 7-2: Stage V AIWWTP Upgrade: Predicted Polychlorinated Biphenyl (PCB) Loadings to the Lower Fraser River Receiving Environment 1 .............................................................................................................................. 83
Table 8-1: Identified Uncertainties in the Stage 2 EIS for the AIWWTP Outfall Diffuser Proposed to Provide Capacity for Stage V flows .......................................................................................................................................... 86
FIGURES
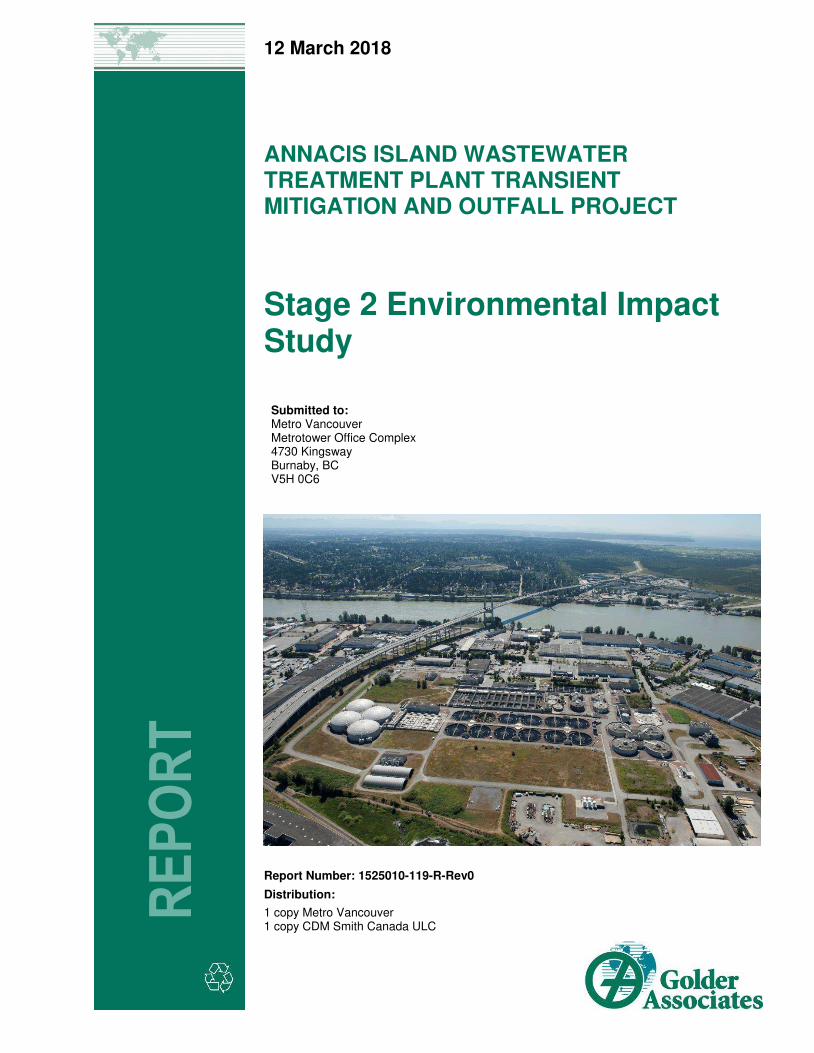
Figure 1: Annacis Island WWTP Stage 2 Environmental Impact Assessment Study Area ............................................. 3
Figure 2. Annacis Island WWTP Water Quality Assessment Node Locations............................................................... 33
Figure 3: Proposed Diffuser Location ............................................................................................................................ 47
Figure 4: Conceptual IDZ .............................................................................................................................................. 48
Figure 5. Transect Locations (by model row number) in H3D Model Grid that Correspond to Figures 6-8. .................. 56
Figure 6. Maximum Water Column Average Concentration (hourly). The concentrations are taken along the transect locations shown in Figure 5. ......................................................................................................................... 57
Figure 7. 24-h Moving Average of Maximum Water Column Average Concentration. The concentrations are taken along the transect locations shown in Figure 5. ........................................................................................... 57
Figure 8. 30-d Moving Average of Maximum Water Column Average Concentration. The concentrations are taken along the transect locations shown in Figure 5. ........................................................................................... 58
Figure 9. Predicted Unionized Ammonia at the Edge of the IDZ ................................................................................... 63
Figure 10: Flow chart of screening methodology used to determine near-field and far-field COPCs ............................ 68
STAGE 2 ENVIRONMENTAL IMPACT STUDY
12 March 2018 Report No. 1525010-119-R-Rev0 x
APPENDICES
APPENDIX A Multiport Diffuser Design and Initial Dilution Modeling Report (CDM Smith 2018)
APPENDIX B Lower Fraser River Ambient Water Quality Summary
APPENDIX C Stage V Pre-Upgrade Sediment Characterization Report (supplied as a separate attachment)
APPENDIX D Description of Ecological Attributes in Support of the Stage 2 EIS (Envirowest 2018)
APPENDIX E Stage 2 EIS Screening Tables
APPENDIX F Supplemental Assessment: Water Quality Screening Tables
STAGE 2 ENVIRONMENTAL IMPACT STUDY
12 March 2018 Report No. 1525010-119-R-Rev0 xi
LIST OF ABBREVIATIONS AND ACRONYMS
AIWWTP Annacis Island Wastewater Treatment Plant
ADWF Average dry weather flow
AVS/SEM Acid-volatile sulfides and simultaneously extracted metals
BAF Bioaccumulation factor
BC British Columbia
BC CDC British Columbia Conservation Data Centre
BCCSN British Columbia Cetacean Sighting Network
ENV British Columbia Ministry of Environment and Climate Change Strategy
BCF Bioconcentration factor
BOD Biological oxygen demand
CBOD Carbonaceous biological oxygen demand
CBOD5 Carbonaceous biological oxygen demand measured over five days
CCME Canadian Council of Ministers of the Environment
CDII Corporation of Delta Irrigation Intake
CDM Smith CDM Smith Canada ULC
CEAA Canadian Environmental Assessment Act
CEPA Canadian Environmental Protection Act
CFD Cumulative frequency distribution.
COPC Constituents of potential concern
COSEWIC Committee on the Status of Endangered Wildlife in Canada
CRA Commercial, recreational, and aboriginal
DDT Dichlorodiphenyltrichloroethane
Delta Corporation of Delta
DFO Fisheries and Oceans Canada
DI Don Island
DIN Dissolved inorganic nitrogen
DP Dissolved phosphorus
ECCC Environment and Climate Change Canada
E.coli Escherichia coli
EDC Endocrine disrupting compound
EE2 17α-ethinyl-estradiol
EIS Environmental impact study
EMA Environment Management Act
EMC Environmental Monitoring Committee
FRAP Fraser River Action Plan

STAGE 2 ENVIRONMENTAL IMPACT STUDY
12 March 2018 Report No. 1525010-119-R-Rev0 xii
FRAMP Fraser River Ambient Monitoring Program
FREMP Fraser River Estuary Management Program
FRO Fraser River Objective
FRWQO Fraser River Water Quality Objective
FRSQO Fraser River Sediment Quality Objective
FSC Food, social and ceremonial (purposes)
Golder Golder Associates Ltd.
GVS&DD Greater Vancouver Sewerage and Drainage District
HQ Hazard quotient
IBA Important Bird Area
IDZ Initial dilution zone
ILCR Incremental lifetime cancer risk
ILWRMP Integrated Liquid Waste and Resource Management Plan
ISQG Interim Sediment Quality Guideline
LC50 Median lethal concentration resulting in mortality to 50% of a test group
LWMP Liquid Waste Management Plan
MCA Marine conservation analysis
MDL Method detection limit
MELP Ministry of Environment, Lands, and Parks
MoE Ministry of Environment
MV Metro Vancouver
MWR Municipal Wastewater Regulation
NAR Not at Risk
NH3 Ammonia
NH3-N Un-ionized ammonia as nitrogen
NH4+ Ionized ammonia
NO3- Nitrate
NO2- Nitrite
NWA National Wildlife Area
PAH Polycyclic aromatic hydrocarbon
PBDE Polybrominated diphenyl ether
PBT Persistent, bioaccumulative, and toxic
PCB Polychlorinated biphenyl
PCDD Polychlorinated dibenzodioxins
PCDF Polychlorinated dibenzofurans
PFOS Perflourooctane Sulfonic Acid
the Port the Port of Vancouver
STAGE 2 ENVIRONMENTAL IMPACT STUDY
12 March 2018 Report No. 1525010-119-R-Rev0 xiii
PPCP Pharmaceutical and personal care product
QA/QC Quality assurance/quality control
QP Qualified professional
RDLs Reported detection limits
REM Receiving Environment Monitoring Program
RSL Regional screening levels
SAR Species at Risk
SARA Species At Risk Act
SC Special Concern
TB Timberland basin
TEQ Toxic equivalency quotient
TN Total nitrogen
TI Tilbury Island
TOC Total organic carbon
TOR Terms of reference
TP Total phosphorus
TRC Total residual chlorine
TSMP Toxic Substances Management Policy
TSS Total suspended solids
US EPA US Environmental Protection Agency
v/v Volume by volume
WAI Western Annacis Island
WHO World Health Organization
WHSRN Western Hemisphere Shorebird Reserve Network
WQG Water quality guidelines
WMA Wildlife Management Areas
WSER Wastewater Systems Effluent Regulation
WWTP Wastewater treatment plant
STAGE 2 ENVIRONMENTAL IMPACT STUDY
12 March 2018 Report No. 1525010-119-R-Rev0 xiv
UNITS
% percent
< less than
°C degrees Celcius
d days
h hours
kg/d kilograms per day
kg/y kilograms per year
km kilometres
L3/T cubic litre per tonne
m metres
m3 cubic metres
m3/day cubic metres per day
m3/s cubic metres per second
m3/year cubic metres per year
mg-N/L milligrams of nitrogen per litre
µg/L micrograms per litre
mg/L milligrams per litre
ML/d million litres per day
ng/L nanograms per litre
pH acidity units
pg/L picograms per litre
STAGE 2 ENVIRONMENTAL IMPACT STUDY
12 March 2018 Report No. 1525010-119-R-Rev0 1
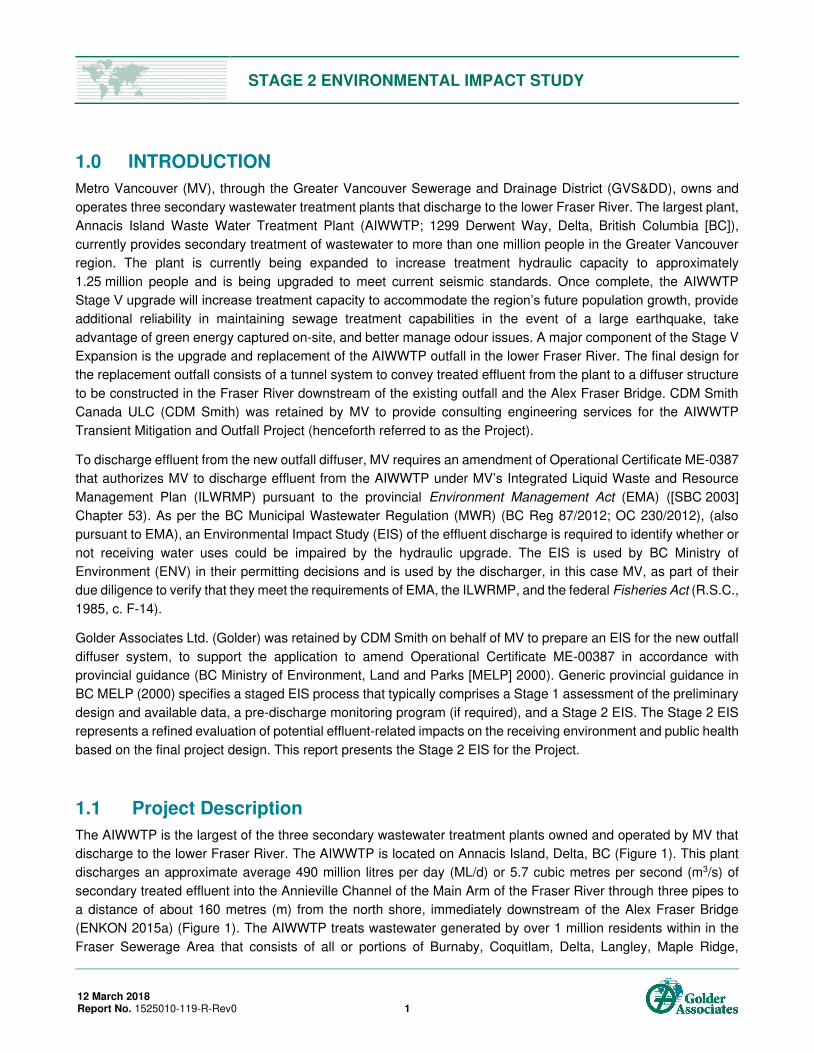
1.0 INTRODUCTION
Metro Vancouver (MV), through the Greater Vancouver Sewerage and Drainage District (GVS&DD), owns and
operates three secondary wastewater treatment plants that discharge to the lower Fraser River. The largest plant,
Annacis Island Waste Water Treatment Plant (AIWWTP; 1299 Derwent Way, Delta, British Columbia [BC]),
currently provides secondary treatment of wastewater to more than one million people in the Greater Vancouver
region. The plant is currently being expanded to increase treatment hydraulic capacity to approximately
1.25 million people and is being upgraded to meet current seismic standards. Once complete, the AIWWTP
Stage V upgrade will increase treatment capacity to accommodate the region’s future population growth, provide additional reliability in maintaining sewage treatment capabilities in the event of a large earthquake, take
advantage of green energy captured on-site, and better manage odour issues. A major component of the Stage V
Expansion is the upgrade and replacement of the AIWWTP outfall in the lower Fraser River. The final design for
the replacement outfall consists of a tunnel system to convey treated effluent from the plant to a diffuser structure
to be constructed in the Fraser River downstream of the existing outfall and the Alex Fraser Bridge. CDM Smith
Canada ULC (CDM Smith) was retained by MV to provide consulting engineering services for the AIWWTP
Transient Mitigation and Outfall Project (henceforth referred to as the Project).
To discharge effluent from the new outfall diffuser, MV requires an amendment of Operational Certificate ME-0387
that authorizes MV to discharge effluent from the AIWWTP under MV’s Integrated Liquid Waste and Resource
Management Plan (ILWRMP) pursuant to the provincial Environment Management Act (EMA) ([SBC 2003]
Chapter 53). As per the BC Municipal Wastewater Regulation (MWR) (BC Reg 87/2012; OC 230/2012), (also
pursuant to EMA), an Environmental Impact Study (EIS) of the effluent discharge is required to identify whether or
not receiving water uses could be impaired by the hydraulic upgrade. The EIS is used by BC Ministry of
Environment (ENV) in their permitting decisions and is used by the discharger, in this case MV, as part of their
due diligence to verify that they meet the requirements of EMA, the ILWRMP, and the federal Fisheries Act (R.S.C.,
1985, c. F-14).
Golder Associates Ltd. (Golder) was retained by CDM Smith on behalf of MV to prepare an EIS for the new outfall
diffuser system, to support the application to amend Operational Certificate ME-00387 in accordance with
provincial guidance (BC Ministry of Environment, Land and Parks [MELP] 2000). Generic provincial guidance in
BC MELP (2000) specifies a staged EIS process that typically comprises a Stage 1 assessment of the preliminary
design and available data, a pre-discharge monitoring program (if required), and a Stage 2 EIS. The Stage 2 EIS
represents a refined evaluation of potential effluent-related impacts on the receiving environment and public health
based on the final project design. This report presents the Stage 2 EIS for the Project.
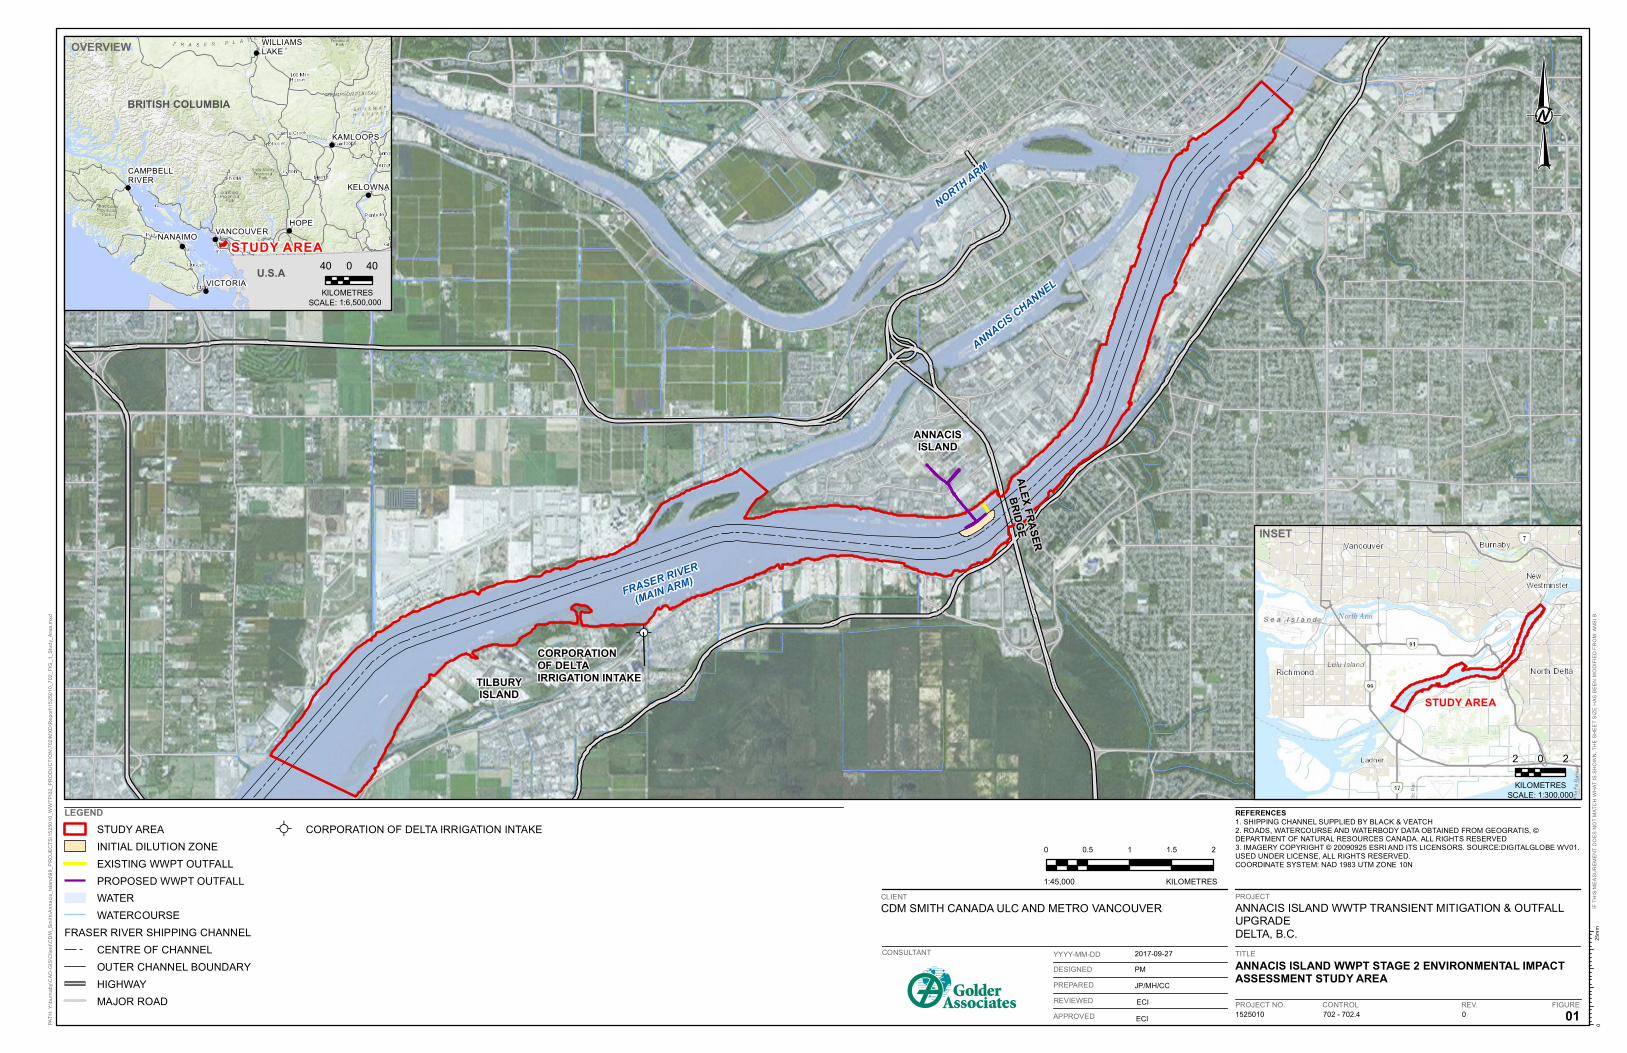
1.1 Project Description
The AIWWTP is the largest of the three secondary wastewater treatment plants owned and operated by MV that
discharge to the lower Fraser River. The AIWWTP is located on Annacis Island, Delta, BC (Figure 1). This plant
discharges an approximate average 490 million litres per day (ML/d) or 5.7 cubic metres per second (m3/s) of
secondary treated effluent into the Annieville Channel of the Main Arm of the Fraser River through three pipes to
a distance of about 160 metres (m) from the north shore, immediately downstream of the Alex Fraser Bridge
(ENKON 2015a) (Figure 1). The AIWWTP treats wastewater generated by over 1 million residents within in the
Fraser Sewerage Area that consists of all or portions of Burnaby, Coquitlam, Delta, Langley, Maple Ridge,
STAGE 2 ENVIRONMENTAL IMPACT STUDY
12 March 2018 Report No. 1525010-119-R-Rev0 2
Richmond, New Westminster, Pitt Meadows, Port Coquitlam, Port Moody, Surrey, White Rock, and a small portion
of the City of Vancouver. The sewage treated at the AIWWTP is comprised of industrial, commercial, and domestic
wastewaters and surface run-off/stormwater.
The AIWWTP is currently being expanded by MV to increase the secondary treatment hydraulic capacity and a
new outfall is required to augment or replace the existing outfall facilities. Metro Vancouver is currently
implementing Stage V improvements to increase the peak wet weather capacity of the plant from 12.6 m3/s to
18.9 m3/s, and future Stage VIII plans are also being made to further increase the peak wet weather capacity to
25.3 m3/s. A new outfall diffuser system is required because the current AIWWTP is not able to provide sufficient
dilution to the effluent, particularly at times of slack water and low flow in the river, and lacks sufficient hydraulic
capacity to discharge the planned flow increases at high river levels (CDM Smith 2017) (Appendix A).
!»
FRASER RIVER
(MAIN ARM)
AL
EX
FR
AS
ER
BR
IDG
E
ANNACIS
ISLAND
TILBURY
ISLAND
CORPORATION
OF DELTA
IRRIGATION INTAKE
NORTH A
RM
ANNACIS C
HANNEL
PA
TH
: Y
:\b
urn
ab
y\C
AD
-GIS
\Clie
nt\
CD
M_
Sm
ith
\An
na
cis
_Is
lan
d\9
9_
PR
OJE
CT
S\1
52
50
10
_W
WT
P\0
2_
PR
OD
UC
TIO
N\7
02
\MX
D\R
ep
ort
\15
25
01
0_
70
2_
FIG
_1
_S
tud
y_
Are
a.m
xd
IF T
HIS
ME
AS
UR
EM
EN
T D
OE
S N
OT
MA
TC
H W
HA
T I
S S
HO
WN
, T
HE
SH
EE
T S
IZE
HA
S B
EE
N M
OD
IFIE
D F
RO
M: A
NS
I B
25
mm
0
0 0.5 1 1.5 2
1:45,000 KILOMETRES
CLIENT
CDM SMITH CANADA ULC AND METRO VANCOUVER
REFERENCES
1. SHIPPING CHANNEL SUPPLIED BY BLACK & VEATCH
2. ROADS, WATERCOURSE AND WATERBODY DATA OBTAINED FROM GEOGRATIS, ©DEPARTMENT OF NATURAL RESOURCES CANADA. ALL RIGHTS RESERVED
3. IMAGERY COPYRIGHT © 20090925 ESRI AND ITS LICENSORS. SOURCE:DIGITALGLOBE WV01.
USED UNDER LICENSE, ALL RIGHTS RESERVED.
COORDINATE SYSTEM: NAD 1983 UTM ZONE 10N
PROJECT
ANNACIS ISLAND WWTP TRANSIENT MITIGATION & OUTFALLUPGRADEDELTA, B.C.
TITLE
ANNACIS ISLAND WWPT STAGE 2 ENVIRONMENTAL IMPACT
ASSESSMENT STUDY AREA
1525010 702 - 702.4 0 01
2017-09-27
PM
JP/MH/CC
CONSULTANT
PROJECT NO. CONTROL REV. FIGURE
YYYY-MM-DD
DESIGNED
PREPARED
REVIEWED
APPROVED
LEGEND
STUDY AREA
INITIAL DILUTION ZONE
EXISTING WWPT OUTFALL
PROPOSED WWPT OUTFALL
WATER
WATERCOURSE
FRASER RIVER SHIPPING CHANNEL
CENTRE OF CHANNEL
OUTER CHANNEL BOUNDARY
HIGHWAY
MAJOR ROAD
!» CORPORATION OF DELTA IRRIGATION INTAKE
!
!
!
!
!
!
!
!
!
U.S.A
BRITISH COLUMBIA
VICTORIA
VANCOUVER
KAMLOOPS
KELOWNA
NANAIMO
CAMPBELLRIVER
HOPE
WILLIAMSLAKE
STUDY AREA
OVERVIEW
40 0 40
1:6,500,000
KILOMETRES
SCALE:
STUDY AREA
2 0 2
KILOMETRES
INSET
1:300,000SCALE:
ECI
ECI

STAGE 2 ENVIRONMENTAL IMPACT STUDY
12 March 2018 Report No. 1525010-119-R-Rev0 4
1.2 Company Information
The main contact information for the company is:
Metro Vancouver
Ken Masse, Senior Project Engineer
Project Delivery, Liquid Waste Services
Metrotower Office Complex
4730 Kingsway
Burnaby, BC, V5H 0C6
1.3 Stage 2 EIS Objectives
This Stage 2 EIS is intended to provide a technical assessment of predicted water quality as a means to evaluate
whether adverse effects on aquatic and public health might result from the Stage V Upgrade based on the
replacement outfall diffuser design described by CDM Smith (2017) in Appendix A as well as existing effluent and
receiving environment data.
The objectives of the study are outlined below.
Refine the receiving environment characterization of the Study Area provided in the Stage 1 EIS based on
additional information gathered since the Stage 1 EIS was submitted.
Refine effluent plume modelling to include near-field plume modelling and far-field hydrodynamic water
quality dispersion modelling.
Determine the initial dilution of the effluent plume via modeling and estimate the concentration of constituents
of potential concern (COPCs) at the edge of the initial dilution zone (IDZ) for an effluent flow rate of 2xAWDF.
The IDZ is the three-dimensional zone around the point of discharge where mixing of the effluent and the
receiving water occurs. For a large waterbody such as the lower Fraser River, the IDZ is commonly defined
as a cylindrical body of water around the outfall with a lateral radius of 100 m from the outfall and extending
upwards to the surface of the water column.
Conduct an assessment of expected impacts to water quality in the receiving environment and a risk-based
evaluation of potential impacts to ecological and public health and agricultural use based on predicted water
quality in the near-field at the IDZ for an effluent flow rate of 2xAWDF and in the far-field at several
assessment nodes.
Identify uncertainties in the impact assessment.
Provide recommendations to be considered for an AIWWTP outfall post-discharge monitoring program.
1.4 Consultation with Ministry of the Environment
Golder prepared a draft terms of reference (TOR) for the Stage 2 EIS based on BC MELP (2000) guidance for
preparing EIS documents, as well as input provided by ENV in their review of the Stage 1 EIS. ENV subsequently
approved the draft TOR for the Stage 2 EIS dated 22 March 2017.
STAGE 2 ENVIRONMENTAL IMPACT STUDY
12 March 2018 Report No. 1525010-119-R-Rev0 5
The consultation noted here was of a technical and regulatory nature. In addition, MV has been engaged in
consultation with First Nations, municipalities, other stakeholders, and MV citizens on broader issues relating to
upgrades in sewage treatment infrastructure. Consultation with regulators and key stakeholders on this effluent
discharge permit amendment has been an ongoing process.
1.5 Report Overview
Consistent with the suggested scope outlined in BC MELP (2000), this Stage 2 EIS is comprised of tasks grouped
under the following general headings:
Characterization of the Receiving Environment (Sections 2.1 to 2.3)
Receiving Environment Use (Section 2.4)
Regulatory Setting (Section 3.0)
Impact Study Scope and Spatial Boundaries (Section 4.0)
Effluent Assessment (Section 5.0)
Receiving Water Quality Predictions (Section 6.0)
Receiving Environment Impact Assessment (Section 7.0)
Uncertainty Assessment (Section 8.0)
Impact Conclusions (Section 9.0)
Recommendations for AIWWTP outfall post-discharge monitoring program (Section 10.0)
STAGE 2 ENVIRONMENTAL IMPACT STUDY
12 March 2018 Report No. 1525010-119-R-Rev0 6
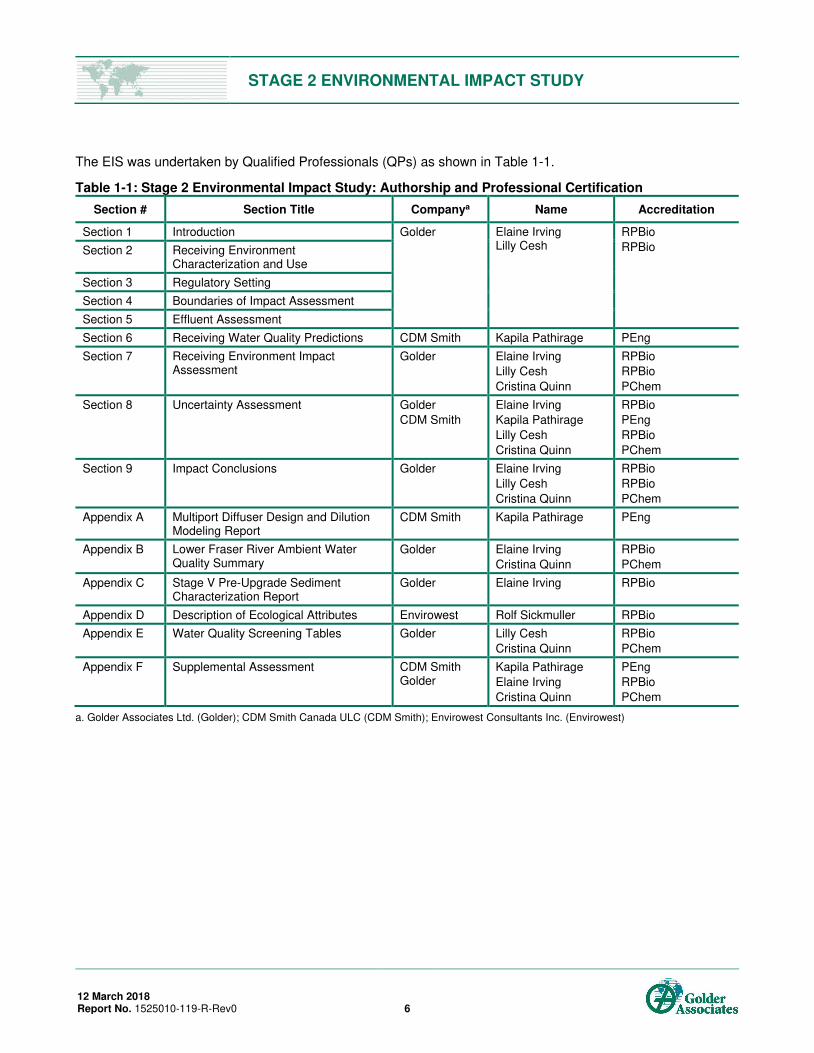
The EIS was undertaken by Qualified Professionals (QPs) as shown in Table 1-1.
Table 1-1: Stage 2 Environmental Impact Study: Authorship and Professional Certification
Section # Section Title Companya Name Accreditation
Section 1 Introduction Golder Elaine Irving Lilly Cesh
RPBio
RPBio Section 2 Receiving Environment Characterization and Use
Section 3 Regulatory Setting
Section 4 Boundaries of Impact Assessment
Section 5 Effluent Assessment
Section 6 Receiving Water Quality Predictions CDM Smith Kapila Pathirage PEng
Section 7 Receiving Environment Impact Assessment
Golder Elaine Irving
Lilly Cesh
Cristina Quinn
RPBio
RPBio
PChem
Section 8 Uncertainty Assessment Golder
CDM Smith
Elaine Irving
Kapila Pathirage
Lilly Cesh
Cristina Quinn
RPBio
PEng
RPBio
PChem
Section 9 Impact Conclusions Golder Elaine Irving
Lilly Cesh
Cristina Quinn
RPBio
RPBio
PChem
Appendix A Multiport Diffuser Design and Dilution Modeling Report
CDM Smith Kapila Pathirage PEng
Appendix B Lower Fraser River Ambient Water Quality Summary
Golder Elaine Irving
Cristina Quinn
RPBio
PChem
Appendix C Stage V Pre-Upgrade Sediment Characterization Report
Golder Elaine Irving RPBio
Appendix D Description of Ecological Attributes Envirowest Rolf Sickmuller RPBio
Appendix E Water Quality Screening Tables Golder Lilly Cesh
Cristina Quinn
RPBio
PChem
Appendix F Supplemental Assessment CDM Smith Golder
Kapila Pathirage
Elaine Irving
Cristina Quinn
PEng
RPBio
PChem
a. Golder Associates Ltd. (Golder); CDM Smith Canada ULC (CDM Smith); Envirowest Consultants Inc. (Envirowest)
STAGE 2 ENVIRONMENTAL IMPACT STUDY
12 March 2018 Report No. 1525010-119-R-Rev0 7
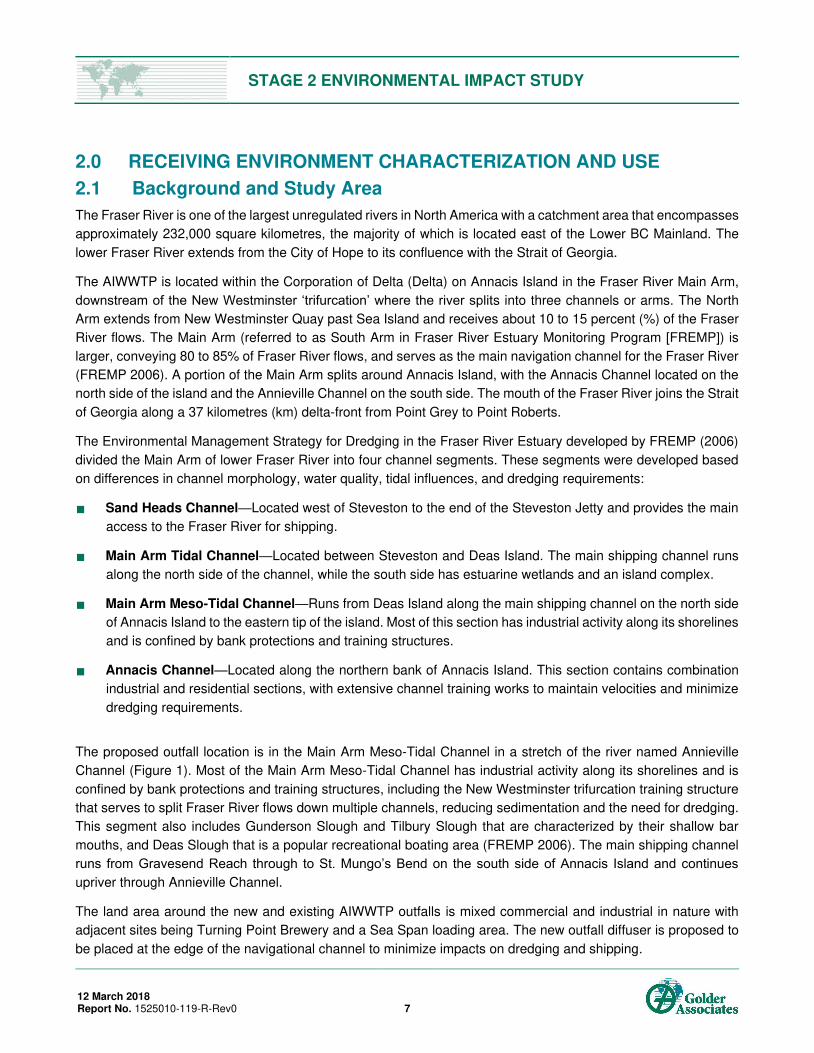
2.0 RECEIVING ENVIRONMENT CHARACTERIZATION AND USE
2.1 Background and Study Area
The Fraser River is one of the largest unregulated rivers in North America with a catchment area that encompasses
approximately 232,000 square kilometres, the majority of which is located east of the Lower BC Mainland. The
lower Fraser River extends from the City of Hope to its confluence with the Strait of Georgia.
The AIWWTP is located within the Corporation of Delta (Delta) on Annacis Island in the Fraser River Main Arm,
downstream of the New Westminster ‘trifurcation’ where the river splits into three channels or arms. The North
Arm extends from New Westminster Quay past Sea Island and receives about 10 to 15 percent (%) of the Fraser
River flows. The Main Arm (referred to as South Arm in Fraser River Estuary Monitoring Program [FREMP]) is
larger, conveying 80 to 85% of Fraser River flows, and serves as the main navigation channel for the Fraser River
(FREMP 2006). A portion of the Main Arm splits around Annacis Island, with the Annacis Channel located on the
north side of the island and the Annieville Channel on the south side. The mouth of the Fraser River joins the Strait
of Georgia along a 37 kilometres (km) delta-front from Point Grey to Point Roberts.
The Environmental Management Strategy for Dredging in the Fraser River Estuary developed by FREMP (2006)
divided the Main Arm of lower Fraser River into four channel segments. These segments were developed based
on differences in channel morphology, water quality, tidal influences, and dredging requirements:
Sand Heads Channel—Located west of Steveston to the end of the Steveston Jetty and provides the main
access to the Fraser River for shipping.
Main Arm Tidal Channel—Located between Steveston and Deas Island. The main shipping channel runs
along the north side of the channel, while the south side has estuarine wetlands and an island complex.
Main Arm Meso-Tidal Channel—Runs from Deas Island along the main shipping channel on the north side
of Annacis Island to the eastern tip of the island. Most of this section has industrial activity along its shorelines
and is confined by bank protections and training structures.
Annacis Channel—Located along the northern bank of Annacis Island. This section contains combination
industrial and residential sections, with extensive channel training works to maintain velocities and minimize
dredging requirements.
The proposed outfall location is in the Main Arm Meso-Tidal Channel in a stretch of the river named Annieville
Channel (Figure 1). Most of the Main Arm Meso-Tidal Channel has industrial activity along its shorelines and is
confined by bank protections and training structures, including the New Westminster trifurcation training structure
that serves to split Fraser River flows down multiple channels, reducing sedimentation and the need for dredging.
This segment also includes Gunderson Slough and Tilbury Slough that are characterized by their shallow bar
mouths, and Deas Slough that is a popular recreational boating area (FREMP 2006). The main shipping channel
runs from Gravesend Reach through to St. Mungo’s Bend on the south side of Annacis Island and continues upriver through Annieville Channel.
The land area around the new and existing AIWWTP outfalls is mixed commercial and industrial in nature with
adjacent sites being Turning Point Brewery and a Sea Span loading area. The new outfall diffuser is proposed to
be placed at the edge of the navigational channel to minimize impacts on dredging and shipping.
STAGE 2 ENVIRONMENTAL IMPACT STUDY
12 March 2018 Report No. 1525010-119-R-Rev0 8
The proposed Stage 2 EIS project study area represents an extension of the preliminary study area adopted for
the Stage 1 EIS as shown in Figure 1. For the Stage 2 assessment, the Study Area located within the Main Arm
Meso-Tidal Channel is proposed to extend 5.5 km upstream of the outfall, where MV has their reference location
for the AIWWTP Receiving Environment Monitoring (REM) program, to 8 km downstream to the southern extent
of Tilbury Island. Existing ambient river conditions within the Study Area were characterized based on a compilation
of available data and information. Receiving environment uses within the Study Area were documented, as well
as current discharges and water withdrawals.
2.2 Physical Setting
2.2.1 Hydrology
The Main Arm of the Fraser River, where the Study Area is located, carries 80 to 85% of the river flow
(FREMP 2006), with flows since 2008 ranging from 605 to 11,700 m3/s (Environment and Climate Change
Canada’s [ECCC] Pacific Water Quality Monitoring & Surveillance Program; see CDM Smith [2017] Appendix A
for hydrograph depiction of flow rates). Low flows typically occur between September and March, while peak flows
occur between April and August in response to freshet and runoff of precipitation (Bull 2004).
The river system in the vicinity of the proposed outfall location is a complex estuarine environment due to tidal
influences and the encroachment of saline water from the ocean. Flows in the vicinity of the proposed discharge
location are subject to tidal influence that affects water velocity, water depth, and vertical mixing. Salt water
migrates up the Fraser River as a result of a combination of density differences between salt and fresh water and
rising tides in the Strait of Georgia, and exists as a saline “salt wedge” along the bottom of the river. Fresh water is less dense than salt water and will typically flow out over top of the denser saline waters. The rising tide causes
the wedge of salt water to migrate upstream underneath the outflowing freshwater of the Fraser River. Salt water
intrusion at Annacis Island is reported to occur only at lower flows (Milliman 1980), as the salt wedge extends
upstream to New Westminster during low flows on the Fraser River. During freshet, the salt wedge only migrates
up the Fraser River channel as far as Steveston Bend and does not reach the Study Area.
2.2.2 Water and Sediment Quality
Within the Fraser River Basin, natural sources of metals such as weathering of the mineral constituents of sediment
substrates, are mobilized and sediment is transported downstream to the lower reaches of the Fraser River and
further into the Fraser River estuary towards the Strait of Georgia (FRAP 1999a, Bull et al 2004). Flows are highest
during the freshet season and thus a large proportion of sediment movement occurs during this period. Both the
hydraulic regime of the Fraser River and natural geological sources of sediment within the catchment influence
water and sediment quality in the lower Fraser River.
Industrial activities such as manufacturing, shipping, and pulp and paper milling have historically occurred and
continue to occur on the Fraser River, although manufacturing and shipping are more prominent in the lower
reaches (Swain et al. 1998). Other than the AIWWTP, there are two other municipal waste water treatment plants
(WWTPs) in operation on the lower Fraser River (i.e., Lulu Island and Northwest Langley WWTPs) but the
AIWWTP is the largest. Runoff from urban areas in the greater Vancouver area may also influence Fraser River
water and sediment quality because the storm water system discharges directly into the lower Fraser River.
STAGE 2 ENVIRONMENTAL IMPACT STUDY
12 March 2018 Report No. 1525010-119-R-Rev0 9
Water Quality
Receiving environment water quality for the Project was defined as ambient water quality within the Study Area,
with the term ‘ambient’ referring to water quality outside the direct influence of effluent discharges, consistent with terminology used by the Fraser River Ambient Monitoring Program (FRAMP) (ENKON 2016a).
Ambient water quality data obtained from regional and federal data sources were compiled and statistics calculated
for the period from January 2012 to September 2016, to characterize ambient water quality in the lower Fraser
River (Appendix B). The statistics, presented in tabular format in Tables B2 to B9, were screened against
applicable receiving environment water quality guidelines as identified in Section 2.4.6. A characterization of
ambient water quality within the EIS Study Area shown in Figure 1 is provided below based on interpretation of
the screening results presented in Appendix B. These statistics were used as inputs to represent ambient river
concentrations in the generation of short-term and monthly water quality predictions as described in Section 6.0.
Conventional Parameters, Nutrients, and Metals
The lower Fraser River within the Study Area tends to be slightly alkaline and well oxygenated, with soft to
moderately soft water hardness (Tables B2 to B4). Upstream migration of the salt wedge from the Strait of Georgia
under certain low flow conditions as described in Appendix A influences water quality; notably by increasing levels
of salinity, conductivity, and total dissolved solids.
Under high flow conditions from April to August, total suspended solids (TSS) concentrations are naturally high
due to the downstream transport of sediment from natural geological sources. Elevated total concentrations of
metals such as aluminum, chromium, copper, iron, manganese, and zinc, that can exceed Fraser River Water
Quality Objectives (FRWQOs) as well as federal and provincial water quality guidelines (WQGs), are evident
during these months due to the increased transport of particulate metals to the lower Fraser River during freshet
(Tables B2 to B4). In contrast, dissolved concentrations of these metals are considerably lower, indicating that
only a proportion of total metal concentrations are potentially available for uptake by aquatic biota. The same
disparity between total and dissolved concentrations is observed for phosphorus during freshet, where total
concentrations increase by an order of magnitude but dissolved concentrations are lower and more consistent
throughout the year.
The Fraser River can also be naturally turbid under low flow conditions although to a lesser degree than during
freshet. Thus suspended sediments present in the water column continue to exert some influence on total metal
and nutrient concentrations in the Study Area throughout the year (Tables B2 to B4).
Organic Constituents
Of the subset of organic constituents identified in Section 5.5 to be carried through the Stage 2 EIS assessment,
polychlorinated biphenyls (PCBs) and 17α-ethinyl-estradiol (EE2) were the only organic constituents reported
above applicable guideline values under ambient conditions (Tables B5 to B7). EE2 values were derived from a
dataset where all reported values were less than the method detection limits (MDLs) reported by the analytical
laboratory and the majority of reported MDLs were higher than the short-term BC WQG for the protection of aquatic
life (0.75 nanograms per litre [ng/L]). As discussed in Section 7.0, the EE2 data available for the Fraser River
through the AIWWTP REM program have uncertainty associated with them due to the limited ability of analytical
laboratories to measure EE2 at MDLs lower than the BC WQG. As described in Section7.0, there is also
uncertainty regarding PCB data included in the ambient dataset due to detected concentrations in quality
assurance/quality control (QA/QC) blank samples, including laboratory blank samples.
STAGE 2 ENVIRONMENTAL IMPACT STUDY
12 March 2018 Report No. 1525010-119-R-Rev0 10
Bacteriological Parameters
The 2012-2016 geometric mean values for fecal coliforms and Escherichia coli (E. coli) calculated for the AIWWTP
‘disinfection season’ from April to October were below their respective FRWQOs and in the case of E. coli below
the water quality guideline for recreational use (Tables B8 and B9). The corresponding geometric mean value for
Enterococus was above the FRWQO but below the water quality guideline for recreational use.
Sediment Quality
In the lower Fraser River, fine sediments are transported more readily because less energy is required to mobilize
them. Depositional areas of these fine sediments can form where the current is reduced as a result of the
morphology of the river or a physical obstruction to the river flow. The center of the lower Fraser River channel
where current and flow are highest tends to be scoured and substrate predominantly comprises sand with a small
quantity of silt. Areas closer to shore or where eddies in the current form tend to accumulate finer sediment such
as clay-silt with a higher proportion of organic matter. As confirmed by a sediment characterization study initiated
in 2016 to support this EIS provided in Appendix C, the Study Area is similarly structured in that the proportion of
fine material in sediment tends to decrease from the near-shore towards the center of the channel. Finer sediment
material, both clay and organic, has a higher surface area in comparison to coarser sediment material, and
therefore more binding sites that contaminants can adsorb to.
Sediment sampling in the lower Fraser River as a component of the FRAMP to monitor ambient sediment quality
focusses on depositional areas with finer sediments where contaminant loads are expected to be the highest. To
date FRAMP has surveyed ambient sediment quality in 2006, 2011 and 2016 (Enkon 2007, Keystone 2011,
ENKON 2016b). Prior to 2006, sediment quality had been surveyed in the lower Fraser River by a number of
initiatives, including the FREMP surveys, the Fraser River Action Plan (FRAP) in the 1990s, as well as monitoring
by ENV (FREMP 1996, FRAP 1999b, Bull 2004).
2016 Sediment Characterization Survey
Prior to 2016, the most recent sediment sampling program specific to the AIWWTP (Thomas 2007) concluded that
sediment substrates in the vicinity of the existing AIWWTP outfall comprised coarse hard-packed sand that proved
challenging to sample. To support this EIS, a study was initiated in 2016 to provide a characterization of sediment
conditions in the vicinity and downstream of the planned location for the new AIWWTP outfall, as well as at
upstream reference stations. Methods, results, and conclusions from this study are provided in Appendix C with a
summary below.
The EIS sediment characterization study involved the collection of nine sediment grab samples from near-shore
and mid-channel locations upstream and downstream of the AIWWTP. These samples were analyzed for grain
size distribution, moisture, total organic carbon (TOC), polycyclic aromatic hydrocarbons (PAHs), metals,
acid-volatile sulfides and simultaneously extracted metals (AVS/SEM), fecal coliforms, E. coli and enterococci.
Trace organics analysis was conducted on a subset of five stations, mostly in near-shore areas. Samples were
analyzed for alkyl phenols, sterols, hormones, pesticides, PCBs, polychlorinated dibenzo-p-dioxins and furans
(PCDD/Fs), and polybrominated diphenyl ethers (PBDEs).

STAGE 2 ENVIRONMENTAL IMPACT STUDY
12 March 2018 Report No. 1525010-119-R-Rev0 11
Stations sampled upstream and downstream of the AIWWTP had sediment characteristics depending on proximity
to the Fraser River shore. Mid-channel stations located close to the dredged navigational channel in higher flow
areas were comprised predominantly of coarse sand with low TOC. Concentrations of metal and organic
constituents at these stations were below applicable Fraser River Sediment Quality Objectives (FRSQOs) and BC
and federal sediment quality guidelines, with the exceptions of nickel and chromium. These observations are
consistent with ambient monitoring of sediments along the lower Fraser River, where similar exceedances have
been reported for these metals, suggesting that these metals are related to natural geological conditions.
Sandy or silty loam sediments were present at stations in lower flow areas located closer to shore. These
sediments had a higher proportion of fines compared to those from the mid-channel. Concentrations of metals,
organic, and biological constituents reported at these stations tended to be higher than those reported at mid-
channel stations, but were generally still below available FRSQOs, BC lower SWQGs, and Canadian Council of
Ministers of the Environment (CCME) Interim Sediment Quality Guideline (ISQG) values. Where exceedances
were observed, they were relatively small and were consistent with those reported by FRAMP for sediment
sampled along the length of the lower Fraser River.
Sediments from near-shore stations upstream and downstream of the AIWWTP had higher concentrations of fecal
coliforms, E. coli, and enterococci compared to mid-channel stations where concentrations were at or near MDLs.
Concentrations of bacteriological parameters reported at the upstream reference station in Annacis Channel were
within the reported range for the co-located ambient station sampled by FRAMP in late winter 2016.
The near-shore station closest to the existing outfall (NF-3) had the highest concentration of E. coli and fecal
coliforms. The coprostanol/ (coprostanol+cholestenol) ratio calculated for this station suggested an influence of
human waste on sediment quality. The other eight stations sampled had ratios within the range reported by
ENKON (2016a) for stations along the Main Arm of the lower Fraser River that did not indicate an influence of
human waste on sediment quality.
2.3 Ecological Resources
Ecological resources in the lower Fraser River have been the subject of numerous studies and initiatives including
the FREMP and the FRAP, as well as other monitoring or research initiatives by government, industry, and
academia. Ecological resource information, with respect to the physical habitat characteristics and aquatic
resources relevant to the Study Area, was accessed from information sources that included but were not limited
to the following:
FREMP, an organization jointly established by the provincial and federal governments in the 1980s that
disbanded in 2013
FRAP
FRAMP
Fisheries and Oceans Canada, Pacific Region website
BC Conservation Data Centre (BC CDC)
Government of Canada, Species At Risk Act (SARA) Public Registry
STAGE 2 ENVIRONMENTAL IMPACT STUDY
12 March 2018 Report No. 1525010-119-R-Rev0 12
Committee on the Status of Endangered Wildlife in Canada (COSEWIC) status reports for listed marine
mammal species
British Columbia Cetacean Sighting Network (BCCSN)
British Columbia Species and Ecosystems Explorer
British Columbia Marine Conservation Analysis (MCA) atlas and public database
iMapBC (DataBC)
Relevant peer-reviewed scientific literature and government data reports
2.3.1 Fish and Fish Habitat
Fish Habitat
Habitat along the shorelines of the Annieville Channel where the Study Area is located have been highly modified.
Most habitats along this section of the river comprise either a narrow riparian fringe woodland, intermitted marsh,
or mudflat. High river flows combined with rock armouring of the South Surrey Interceptor and channel restrictions
associated with the Alex Fraser Bridge have resulted in a diverse bathymetry in proximity to the Project
(Appendix A). The most notable bathymetric feature includes a deep scour hole extending downstream of the
South Surrey Interceptor and past the Project. Other notable bathymetric features include sand waves established
in the downstream extent of the scour hole that become increasingly mobile during high freshet flows.
The former FREMP classified the shorelines of the Fraser River based on the relative value of the habitat features
(FREMP 2006). The FREMP (2006) colour-coded system classified the overall habitat value of the estuarine
shoreline and identified development constraints associated with each classification. The definition of habitat was
limited to functional habitat values provided by estuarine environments for fish and wildlife. The FREMP (2006)
classification system comprised a three tiered colour-coded system:
Red-coded shorelines sustained highly productive fish and wildlife habitats
Yellow-coded shorelines sustained moderately productive habitats
Green-coded shorelines were characterized by habitats of low productivity
The FREMP classification system applied only to intertidal habitat and riparian habitat extending up to 30 m
landward of the shoreline. Habitats below local low water, hence below the intertidal zone, were not addressed by
the system. This is particularly relevant, as the new outfall will not encounter habitats above local low water
(i.e., within the intertidal or upland zones). Fish habitat information regarding shoreline, intertidal, and sub-tidal
habitats in the vicinity of the proposed location for the new outfall is provided in Appendix D, including a description
of ecological attributes to support this Stage 2 EIS.
The FREMP habitat classifications of the south shoreline of Annacis Island are predominantly high (red)
productivity or moderate (yellow) productivity. The high and moderate productivity classifications are largely a
function of riparian vegetation and intermittent fringe marsh establishment along the shoreline. Low (green)
productivity habitat is present in the footing protection structure of the Alex Fraser Bridge north support structure
immediately upstream of the Project, and the ship docks at the upstream extent of Annacis Island.
STAGE 2 ENVIRONMENTAL IMPACT STUDY
12 March 2018 Report No. 1525010-119-R-Rev0 13
The south shoreline of the Main Arm (i.e., Corporation of Delta shoreline) includes all three habitat classifications.
Moderate productivity shoreline is generally more prevalent, interspersed with low productivity shoreline and
occasional high productivity habitat. High productivity habitat is more prevalent along the Tilbury Island shoreline.
Fish
An estuarine fish assemblage occupies the lower Fraser River to the upper limits of tidal influence at Mission
(McPhail 2007). The river sustains nationally important commercial, recreational, and aboriginal fisheries, as
regulated by the federal Fisheries Act and fish species of management concern in the context of commercial,
recreational, or Aboriginal fisheries and species at risk.
The lower river contains a number of euryhaline species that are adaptable to a range of salinities, (e.g., lampreys,
sturgeon, smelts, salmon, and trout); however, there are also purely freshwater species (McPhail 2007).
Freshwater species include five minnows [brassy minnow (Hybognathus hankinsoni), peamouth chub (Mylocheilus
caurinus), northern pikeminnow (Ptychocheilus oregonensis), longnose dace (Rhinichthys cataractae), and
leopard dace (R. falcatus))] and three sucker species [bridgelip sucker (Catostomus columbianus), largescale
sucker (C. macrocheilus), and mountain sucker (C. platyhyncus)].
The fish community of the lower Fraser River is dominated by cyprinids, salmonids, and catostomids (Richardson
et al. 2000).The Fraser River is a salmonid-bearing system. Salmonid use of the Main Arm from Steveston to New
Westminster is largely upstream adult migration in the fall and downstream juvenile migration and rearing in the
spring to midsummer (FREMP 2006). Seven species of salmonids (Oncorhynchus spp.) occur within the lower
Fraser River: chinook salmon (O. tshawytscha); chum salmon (O. keta); coho salmon (O. kisutch); cutthroat trout
clarkii subspecies (O. clarkii clarkii); pink salmon (O. gorbuscha); rainbow trout; and sockeye salmon (O. nerka)
(Water and Land Use Committee 2006). Adult salmon migrate upriver annually to spawn and hundreds of millions
of juveniles migrate downstream to and through the estuary and ultimately to the sea (Rosenau and Angelo 2007).
The Main Arm also supports eulachon (Thaleichthys pacificus) during their migration to upstream spawning
habitats as close to the Project as New Westminster and sustains white sturgeon (Acipenser transmontanus). In
recent years, juvenile sturgeon have been captured along the south shore of Annacis Island. Despite having
special conservation assessment status (COSEWIC 2003) and provincial conservation priority (BC CDC), the
lower Fraser River white sturgeon population is not included in Schedule 1 of the SARA.
Out-migrating juvenile salmonids utilize intermittent intertidal marshes established along the Main Arm. The
marshes provide rearing habitat for juvenile chinook salmon, chum salmon, coho salmon and white sturgeon
(Healey 1991, Salo 1991, Cohen 2012, Nelson et al. 2004). Specific occurrences of species identified by the BC
CDC and iMapBC adjacent to the Project are limited to juvenile white sturgeon. The absence of other documented
occurrences in proximity to the outfall is not indicative of species absence, as salmon and coarse fish species
have been captured in reaches of the Fraser River upstream and downstream of the outfall.
More detailed information on the ecological attributes of species of management concern that are the subject of
provincial and or federal management policies and/or programs is provided in Appendix D. Species of
management concern include salmon (Oncorhynchus spp.), eulachon, sturgeon (Acipenser spp.), and char
(Salvelinus spp.).
STAGE 2 ENVIRONMENTAL IMPACT STUDY
12 March 2018 Report No. 1525010-119-R-Rev0 14
2.3.2 Fish Health and Tissue Concentrations
Fish health and contaminant tissue concentrations in the lower Fraser River have been the subject of several
monitoring initiatives undertaken since the 1990s, including the FRAP in the 1990s, a study by BC MoE in 2003,
and more recently monitoring studies in 2004, 2007 and 2012 by FRAMP (Raymond et al. 1999, FRAP 1999b,
Bull 2004, ENKON 2009, ENKON 2014). These studies monitored resident Fraser River species with a focus on
small-bodied fish that are more likely to show site fidelity compared with other more mobile fish species
(i.e., peamouth chub [Mylocheilus caurinus], large scale sucker [Catostomus macrocheilus]). Studies have also
been undertaken to determine contaminant concentrations in white sturgeon in the Fraser River and anadromous
salmon species that utilise the Fraser River as they migrate between freshwater and marine environments.
A summary of the main findings of these programs and studies with relevance to the Main Arm of the lower Fraser
River is provided below.
Monitoring of Fish Health and Contaminant Tissue Residues in the Lower Fraser River
In a synthesis of fish health information available for the Fraser River, FRAP (1999) concluded that concentrations
of legacy contaminants like dichlorodiphenyltrichloroethane (DDT), organochlorines, dioxins/furans, and metals
measured in fish collected from the Fraser River had decreased from the 1970’s to the late 1990’s. The synthesis
incorporated the results of both historical studies and a study specifically undertaken for FRAP by Raymond et al.
(1999). Although PCB concentrations in fish sampled from the Fraser River were below the provincial guideline
for human consumption at that time, FRAP (1999) identified the potential for effects of dioxin-like PCBs on wildlife
consumers of fish.
Fish tissue monitoring by ENV in 2003 reported that concentrations of dioxins and furans in starry flounder
(Platichthys stellatus) sampled close to the Fraser River mouth met the Fraser River Objective (FRO) to protect
human health (Bull 2004). A similar comparison to FROs for PCBs in starry flounder was inconclusive because
the detection limit for fish tissue was higher than the objective derived to prevent biomagnification in the food web
and protect wildlife from the consumption of whole fish. Historically, concentrations in starry flounder from the
same location have been below the FRO for PCBs in fish tissue (surveys in 1994 and 1995). In 1988, five
unspecified fish species were sampled by ENV from this location and concentrations in all five species were below
the PCB FRO (Bull 2004).
The most recent monitoring of fish health and contaminants in tissues collected from the lower Fraser River was
undertaken for the FRAMP in 2004, 2007, and 2012 (ENKON 2009, 2014). A summary is provided below of
findings from the most recent 2012 survey, in which sentinel fish species largescale sucker (Catostomus
macrocheilus) and peamouth chub were sampled in the Main Stem upstream of the AIWWTP, in the Main Arm
close to Steveston, and in the North Arm.
Health metrics measured in peamouth chub from three study areas in the lower Fraser River showed few
among-area differences. Lengths, weights, condition factors, and relative reproductive organ size did not
significantly differ between areas. These findings contrasted with the findings of the 2007 and 2004 surveys
reported by ENKON (2009), where both sexes of peamouth chub collected from the Main Arm were
significantly longer and heavier than chub collected from the other two areas.
STAGE 2 ENVIRONMENTAL IMPACT STUDY
12 March 2018 Report No. 1525010-119-R-Rev0 15
Health metrics measured in largescale sucker from three study areas in the lower Fraser River showed some
significant differences among the three study areas related to length, weight, and condition factor. Suckers
collected from the Main Arm were longer and heavier than those collected from the other two areas. In
contrast, suckers collected from the Main Stem were shorter and lighter than the two other areas. Male fish
from the Main Arm had the highest condition factor and males from the Main Stem had the lowest condition
factor. These findings were consistent with those reported by ENKON (2009) for the 2007 survey.
Tissue concentrations of dioxins and furans, PCBs, and benzo[a]pyrene reported for the three study areas in
2012 met FROs for dioxins/furan toxic equivalency quotients (TEQs), total PCBs, and benzo[a]pyrene.
Concentrations of methylmercury in the three areas were above the CCME fish tissue guideline for the
protection of wildlife consumers. Most other constituents measured in fish met applicable provincial or federal
guidelines. Where concentrations exceeded guideline values, they did so by a margin essentially equal to
the guideline within the limits of analytical precision.
Concentrations of arsenic, PCBs, and PBDEs measured in composite liver and whole body samples from
peamouth chub and largescale sucker whole body samples collected from the Main Stem were lower than
those collected further downstream in the Main Arm and in the North Arm. A similar spatial pattern for PCBs
was observed in the 2004 and 2007 surveys.
Since the FRAMP fish monitoring was initiated in 2004, a decrease in total PCB concentrations in peamouth
chub livers has been observed. Overall, total PCB concentrations reported in peamouth chub muscle and
liver were substantially lower in the 2012 and 2007 surveys compared to historically reported concentrations
(1971-1995).
With respect to total mercury, concentrations in fish tissue appear to have decreased from historical tissue
concentrations reported for the lower Fraser River (i.e., 1973-1995). FRAMP first measured methylmercury
in fish collected from the lower Fraser River in 2012 and concentrations in peamouth chub and largescale
sucker whole body samples were highest in the Main Stem and lowest in the North Arm.
Concentrations of dioxins and furans and copper did not significantly differ between the three areas in 2012,
similar to the findings of the 2004 and 2007 surveys.
Analysis of stable carbon and nitrogen isotopes in muscle tissue to confirm site fidelity of largescale sucker
and peamouth chub indicated that these fish species sampled from the Main Arm showed site fidelity and did
not move into other sampling areas. While largescale suckers also showed site fidelity in the Main Stem and
North Arm sampling areas, there was an indication that peamouth chub may have moved between the North
Arm and the Main Stem.
With specific reference to the AIWWTP, historical sampling of peamouth chub in the vicinity of Annacis Island by
EVS (1996) documented that cadmium, copper, iron, lead, and zinc were detected in fish tissue but there was no
apparent pattern of contamination associated with the AIWWTP.
STAGE 2 ENVIRONMENTAL IMPACT STUDY
12 March 2018 Report No. 1525010-119-R-Rev0 16
Fish Contaminant Tissue Studies in the Lower Fraser River
Both Cullon et al. (2009) and Kelly et al. (2011) sampled adult salmon for tissue analysis during their upstream
migration from the Strait of Georgia to upstream spawning grounds, either close to the mouth of the Fraser River
or from the lower Fraser River.
Cullon et al. (2009) determined concentrations of persistent organic compounds in adult chinook salmon and
compared concentrations to those determined in chinook smolts collected from the central Strait of Georgia prior
to ocean migration. The authors concluded from this comparison that 97 to 99% of PCB, dioxin and furan, DDT,
and hexachlorocyclohexane concentrations reported in returning adult chinook were accumulated by the fish in
the marine environment as opposed to the Fraser River and its tributaries. In a desktop study to investigate PCB
accumulation by Pacific salmon in Washington State, US, Hope (2012) also concluded that the majority of PCB
accumulation by the salmon likely occurred in the marine environment as opposed to the freshwater environment.
In a subsequent study of Fraser River salmonids, Kelly et al. (2011) determined concentrations of PCBs, dioxins
and furans, PBDEs, organochlorine pesticides, and metals in the muscle and eggs of adult sockeye and chinook
salmon. The salmon were sampled from the lower Fraser River while migrating upstream in 2007. Mercury and
arsenic concentrations were below applicable human health consumption guidelines. Concentrations of PCBs,
dioxins and furans, PBDEs, and organochlorine pesticides were detected in muscle and the authors concluded
that concentrations of these lipophilic compounds can be magnified in adult salmon as they migrate upstream but
that the maternal transfer to eggs is slow relative to less hydrophobic constituents. Mean TEQs of PCBs and
dioxins and furans in eggs sampled from female sockeye and chinook salmon sampled by this 2007 study were
below a TEQ benchmark in salmonid eggs associated with 30% egg mortality. Reported 2007 TEQs were also
substantially lower than TEQs reported in eggs from salmonids sampled from the Great Lakes region between
1986 and 1997.
A study in the early-1990s by McDonald et al. (1997) reported that concentrations of metals, PCBs, dioxins and
furans, and chlorophenols in muscle and liver tissues sampled from adult white sturgeon from the lower Fraser
River were lower than concentrations measured in sturgeon muscle and liver samples from the upper Fraser River.
At that time, pulp mills were a source of organic contaminants in the upper Fraser River.
2.3.3 Benthic invertebrates
A characterization of benthic invertebrate communities in the Main Arm was provided by Swain et al. (1998) based
on a study by Northcote et al. (1976). In this historical study, benthic invertebrates were sampled at stations located
along the lower Fraser River in late summer/fall of 1972 and 1973, when the river was characterized by average
to high flows and the salt wedge was located closer to the river mouth. The benthic invertebrate community
assessment was based on comparison of benthic metrics such as abundance and diversity between stations. The
average number of taxa collected from mud and sand substrates in the Main Arm was lower than that estimated
for the North Arm; however, diversity was similar between the two arms for both substrate types. Benthic
communities present at the most upstream station in the Main Arm located near Tilbury and Deas islands were
composed of oligochaetes, leeches, Pisidium clams, crustaceans such as amphipods and isopods, and dipteran
insect larvae (chironomids, a type of non-biting midge). At that time of year (late summer/fall), Swain et al. (1998)
suggested that it would be reasonable to expect more freshwater organisms in the Main Arm compared to earlier
in the year when salinity intrusion extends farther upstream in the lower Fraser River.

STAGE 2 ENVIRONMENTAL IMPACT STUDY
12 March 2018 Report No. 1525010-119-R-Rev0 17
More recently in 2016, a preliminary benthic survey as part of the sediment characterization study to support this
EIS confirmed that benthic communities downstream of the AIWWTP were dominated by oligochaetes and
chironomids. Invertebrates were more abundant at stations closer to shore compared to the mid-channel where
higher flows prevailed and the navigational channel is subject to periodic dredging. One mid-channel station in the
navigational channel was devoid of a benthic invertebrate community. Invertebrate density at the other
mid-channel station outside of the navigational channel was less than 5% of the mean density of the two near-
shore stations. The two nearshore stations had comparable invertebrate densities. The absence of a benthic
invertebrate community within the mid-channel at the proposed outfall location was confirmed by an evaluation of
three samples collected in February 2017 (Appendix D).
2.3.4 Mammals
Marine and non-marine mammals expected to occur in the Study Area and a description of their habitat use and
diet is provided in Appendix D; a brief summary is provided in this section.
With respect to marine mammals, Steller sea lions (Eumetopias jubatus) and Harbour seals (Phoca vitulina) are
expected to occur in the Study Area. California sea lions (Zalophus californianus) congregate at Sandheads near
Steveston, Richmond, and may occasionally travel up the lower Fraser River to proximity of the Project during
adult salmon migrations. Stellar sea lions are considered to be a species of special concern both provincially and
federally (Section 2.3.6). They spend the majority of time in marine waters or at terrestrial rookeries and haul-out
sites, but occasionally enter freshwater environments (COSEWIC 2013). Use of the lower Fraser River by Steller
sea lions includes feeding congregations in the river during spring eulachon runs (Bigg 1985) and occasional
rafting behaviour up to 35 km upstream of the mouth of the river (Olesiuk unpublished data, cited in COSEWIC
2013). There are no known haul-outs within the Study Area and presence would largely be transient in nature.
Harbour seals are found in coastal waters, some lakes, and many rivers including the lower Fraser River upstream
to Hell’s Gate. Preferred haul-out sites include tidal mud flats, sand bars, reefs, and log booms. They are
considered to be year-round residents in the lower Fraser River, but move around locally in association with tides,
food, reproductive behaviour, and season.
Ten (10) native mammal species likely occur within and in proximity to the proposed new outfall location. These
include North American river otter (Lontra canadensis), mink (Neovison vison), American beaver (Castor
canadensis), common muskrat (Ondatra zibethicus), and coyote (Canis latrans). Habitat use by these species is
primarily limited to terrestrial areas and/or portions of the river proximal to the riverbank.
2.3.5 Birds
The Study Area overlaps with the Boundary Bay – Roberts Bank – Sturgeon Bank Important Bird Area (IBA)
designated because of its importance for large congregations of overwintering waterfowl and shorebirds, colonial
waterbirds, and seabirds, as well as numerous species at risk (IBA 2016). This IBA consists of a complex of
marine, estuarine, freshwater and agricultural areas and extends from Boundary Bay to the City of Surrey, west to
the Fraser River estuary. The IBA covers most of the Study Area with the exception of the stretch of river between
Annacis Island and the Alex Fraser Bridge.
STAGE 2 ENVIRONMENTAL IMPACT STUDY
12 March 2018 Report No. 1525010-119-R-Rev0 18
A portion of the IBA (45%) located downstream of the Study Area is protected in conservation management areas
such as parks and wildlife management areas. The majority of protected areas are situated around inter- and sub-
tidal areas. Two provincial Wildlife Management Areas (WMAs; South Arm Marshes WMA and Roberts Bank
WMA), one national wildlife area (Alaksen National Wildlife Area [NWA]), and one national migratory bird sanctuary
(George C. Reifel Migratory Bird Sanctuary) occur southwest of the Study Area on the Fraser River-Pacific Ocean
delta. These areas were established to protect congregations of overwintering birds, waterfowls, shorebirds, and
seabirds. They support critical numbers of North American dunlin (Calidris alpina), North American trumpeter swan
(Cygnus buccinator), North American black-bellied plover (Pluvailis squatarola), and also provide habitat for
migrating and overwintering bird species like the migrating snow goose (Chen caerulescens) and dabbling ducks
(e.g., American widgeon [Anas americana], northern pintail [Anas acuta]; Environment Canada 2016).
A discussion of terrestrial and aquatic birds observed or expected to occur in the Study Area is provided in
Appendix D, including potential foraging and nesting areas. In summary, many songbirds, waterbirds, raptors,
seabirds, and shorebirds are present in riparian areas, along the shoreline, or on the river within the Study Area.
Typical birds found within the riparian areas include eagles, ducks, crows, woodpeckers, hummingbirds, sparrows,
warblers, and finches. Typical birds in the open areas of the shoreline include spotted sandpipers
(Actitis macularius) and killdeer (Charadrius vociferus). Birds that nest in marsh vegetation along the riverbank
include marsh wren (Cistothorus palustris) and red-winged blackbird (Agelaius phoeniceus). River foraging birds
include raptors (e.g., eagles), dabbling ducks (e.g., mallard, wigeon), diving ducks (e.g., mergansers, goldeneyes),
geese, seabirds (e.g., gulls and cormorants), herons, and shorebirds (e.g., sandpipers). The primary raptor
expected to fish within the vicinity of the Project is the bald eagle (Haliaeetus leucocephalus) and several bald
eagle nests are established on Annacis Island. A number of swallow species are found within the Study area that
would forage on aerial insects over the river surface.
2.3.6 Species at Risk
Federal and provincial environmental agencies have separate systems to classify Species at Risk (SAR), as
described below. Background information was used to compile a list of SAR which could potentially occur in the
Study Area (Appendix D; Table D-1). Focal SAR included those listed on Schedule 1 of the federal SARA Public
Registry and/ or provincially Blue-listed or Red-listed species that have been documented near the Study Area, or
are expected to occur in the Study Area based on site and habitat conditions.
Federal Rank – COSEWIC and SARA
Federally, species ranking is the responsibility of COSEWIC established under Section 14 of the SARA. Below is
a listing of the status categories used by COSEWIC to rank or list a species:
Extinct - a species that no longer exists
Extirpated - a species no longer existing in the wild in Canada, but occurring elsewhere
Endangered - a species facing imminent extirpation or extinction
Threatened - a species likely to become endangered if limiting factors are not reversed
Special Concern - a species that is particularly sensitive to human activities or natural events, but is not an
endangered or threatened species

STAGE 2 ENVIRONMENTAL IMPACT STUDY
12 March 2018 Report No. 1525010-119-R-Rev0 19
Data Deficient - a species for which there is inadequate information to make a direct, or indirect, assessment
of its risk of extinction
Not at Risk - a species that has been evaluated and found to be not at risk
The SARA Public Registry is the official depository and source of data and information relating to federally listed
species at risk. Schedule 1 on the Public Registry is the official list of wildlife species at risk receiving legal
protection under the SARA.
Provincial Rank – BC CDC
In BC, the BC CDC assigns a provincial rank to a species, which is based solely on its status within the province.
In order to simplify interpretation of species ranks in BC, three categories have been created: Red, Blue, and
Yellow, which provides a foundation for managing and protecting SAR in the province. The provincial listing
categories are described below:
Red - any indigenous species, subspecies or plant community that is Extirpated, Endangered, or Threatened
in BC. Extirpated elements no longer exist in the wild in BC, but do occur elsewhere. Endangered elements
are facing imminent extirpation or extinction. Threatened elements are likely to become endangered if limiting
factors are not reversed.
Blue - any indigenous species, subspecies or community considered to be Vulnerable (Special Concern) in
BC. Vulnerable elements are of special concern because of characteristics that make them particularly
sensitive to human activities or natural events.
Yellow – any indigenous species in BC which appear to be secure and not at risk of extinction. Yellow-listed
species may have subspecies which are Red-listed or Blue-listed. Yellow-listed species are not discussed in
this assessment, unless they have federal designation under SARA.
Species Review
Based on the SAR search documented in Appendix D, two mammals, seven birds, five fish, three invertebrates,
and thirteen plants were identified as focal SAR for the Study Area. Table 2-1 provides a summary of the focal
SAR with the potential to occur in aquatic or riverbank areas of the Study Area or have been documented within
2 km of the centreline of the Fraser River along the length of the Study Area (prepared by Envirowest; Appendix D).
Table 2-1: Species at Risk with Potential to Occur in Aquatic or Riverbank Areas within the Study Area
Scientific Name Common Name Provincial
Listing COSEWIC Rankinga
SARA Designationb
Nearby Occurancec
Mammals
Eumetopias jubatus Steller sea lion Blue SC 1 - SC No
Myotis lucifugus Little brown myotis Yellow E 1-E No
Birds
Ardea herodias fannini Great blue heron fannini subspecies
Blue SC 1-SC Yes
Butorides virescens Green heron Blue No Ranking No Designation Yes
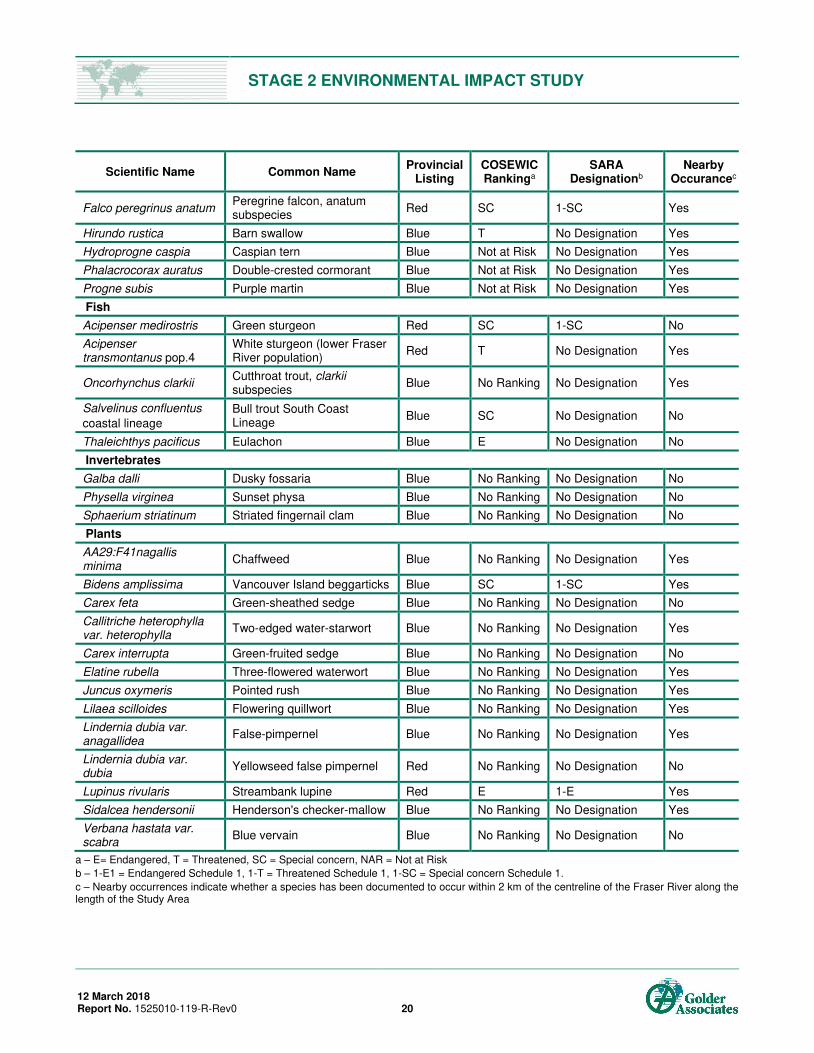
STAGE 2 ENVIRONMENTAL IMPACT STUDY
12 March 2018 Report No. 1525010-119-R-Rev0 20
Scientific Name Common Name Provincial
Listing COSEWIC Rankinga
SARA Designationb
Nearby Occurancec
Falco peregrinus anatum Peregrine falcon, anatum subspecies
Red SC 1-SC Yes
Hirundo rustica Barn swallow Blue T No Designation Yes
Hydroprogne caspia Caspian tern Blue Not at Risk No Designation Yes
Phalacrocorax auratus Double-crested cormorant Blue Not at Risk No Designation Yes
Progne subis Purple martin Blue Not at Risk No Designation Yes
Fish
Acipenser medirostris Green sturgeon Red SC 1-SC No
Acipenser transmontanus pop.4
White sturgeon (lower Fraser River population)
Red T No Designation Yes
Oncorhynchus clarkii Cutthroat trout, clarkii subspecies
Blue No Ranking No Designation Yes
Salvelinus confluentus
coastal lineage
Bull trout South Coast Lineage
Blue SC No Designation No
Thaleichthys pacificus Eulachon Blue E No Designation No
Invertebrates
Galba dalli Dusky fossaria Blue No Ranking No Designation No
Physella virginea Sunset physa Blue No Ranking No Designation No
Sphaerium striatinum Striated fingernail clam Blue No Ranking No Designation No
Plants
AA29:F41nagallis minima
Chaffweed Blue No Ranking No Designation Yes
Bidens amplissima Vancouver Island beggarticks Blue SC 1-SC Yes
Carex feta Green-sheathed sedge Blue No Ranking No Designation No
Callitriche heterophylla var. heterophylla
Two-edged water-starwort Blue No Ranking No Designation Yes
Carex interrupta Green-fruited sedge Blue No Ranking No Designation No
Elatine rubella Three-flowered waterwort Blue No Ranking No Designation Yes
Juncus oxymeris Pointed rush Blue No Ranking No Designation Yes
Lilaea scilloides Flowering quillwort Blue No Ranking No Designation Yes
Lindernia dubia var. anagallidea
False-pimpernel Blue No Ranking No Designation Yes
Lindernia dubia var. dubia
Yellowseed false pimpernel Red No Ranking No Designation No
Lupinus rivularis Streambank lupine Red E 1-E Yes
Sidalcea hendersonii Henderson's checker-mallow Blue No Ranking No Designation Yes
Verbana hastata var. scabra
Blue vervain Blue No Ranking No Designation No
a – E= Endangered, T = Threatened, SC = Special concern, NAR = Not at Risk
b – 1-E1 = Endangered Schedule 1, 1-T = Threatened Schedule 1, 1-SC = Special concern Schedule 1.
c – Nearby occurrences indicate whether a species has been documented to occur within 2 km of the centreline of the Fraser River along the length of the Study Area
STAGE 2 ENVIRONMENTAL IMPACT STUDY
12 March 2018 Report No. 1525010-119-R-Rev0 21
2.4 Receiving Environment Uses and Relevant Water Quality Guidelines
A desktop review of online databases and websites was undertaken to search for information on known human
and environmental uses of the Fraser River relevant to the EIS. Information sources included:
Fisheries and Oceans Canada, Pacific Region website
ENV - Water Licences Query database
MV website
Recreation Sites and Trails BC website
BC Parks website
FREMP website
2.4.1 Protected Areas and Parks
Within the Study Area, Don Island (also known as Oikawa Island) and Lion Island (also known as Sato Island) are
designated by Metro Vancouver as regional parks. The shoreline on the north side and the downstream tip of
Annacis Island is designated as municipal parkland. The upstream tip of Tilbury Island is also designated a
municipal park (Metro Vancouver 2015). An inventory of regional and municipal parks located within the Study
Area is provided in Table 2-2.
Table 2-2: Parks Located in the Vicinity of the Study Area
Park Name Area
Regional Parks
Lion (Sato) Island Mid-stream Fraser River main channel
Don (Oikawa) Island Mid-stream Fraser River main channel
Municipal Parks
Annacis Channel Inlet on North East Side of Annacis Island Shoreline of Annacis Island
West Patrick Island Development North Shoreline of Annacis Island
Grosvenor Habitat Park South-Western Shoreline of Annacis Island
New Westminster Pier Park Northern shoreline of Fraser River main channel
Tilbury Island Municipal Park Space Northern tip of Tilbury Island
Downstream of the Study Area, closer to the mouth of the Fraser River, there are several provincial and federal
ecological reserves.
Two federal management zones, Alaksen NWA and George C. Reifel Migratory Bird Sanctuary, are protected
under the Migratory Birds Convention Act.
Three provincial wildlife management areas, South Arm Marshes WMA, Sturgeon Bank WMA, and Roberts
Bank WMA, are protected under the Ecological Reserve Act.
STAGE 2 ENVIRONMENTAL IMPACT STUDY
12 March 2018 Report No. 1525010-119-R-Rev0 22
These protected areas provide wetland habitat for waterfowl and other species and support scientific research and
education (IBA 2016). The value of the Fraser River Estuary area downstream of the Study Area that encompasses
Burns Bog, Sturgeon Bank, South Arm Marshes, and Boundary Bay is recognized through several international
designations. This area is designated a Hemispheric Site under the Western Hemisphere Shorebird Reserve
Network (WHSRN) and most of the area is a Ramsar Wetland of International Significance.
Several parks are present downstream of the Study Area, including Deas Island, a regional park, and a number of
municipal parks. A new regional greenway called the Delta-South Surrey Regional Greenway is also in
development, which will connect natural areas for both wildlife and people, from Annacis Island to Mud Bay.
2.4.2 Fisheries
Fraser River stocks support several Commercial, Recreational, and Aboriginal fisheries, and salmon in particular
continue to be important to First Nations for food, social, and ceremonial purposes (DFO 2015a). Along with
commercial activities, Tsawwassen First Nation, Musqueam Indian Band, and other Aboriginal group members
may be engaged in activities that have cultural importance in the Study Area.
Aboriginal fisheries are authorized by communal licences issued to individual First Nations organizations by
Fisheries and Oceans Canada (DFO) under the Aboriginal Communal Fishing Licences Regulations. First Nations
are licenced for Food, Social, and Ceremonial (FSC) fisheries and fisheries with a sales component, including
economic opportunity, demonstration, and harvest agreement fisheries. Communal commercial licences issued
annually for First Nations participation in the commercial fishery provide detail on fishing areas, methods,
allocation, and times (DFO 2013a,b).
Tsawwassen First Nation, Sechelt First Nation, Q'ul-Lhanumutsun Aquatic Resources Society, Tsleil-Waututh
Nation, Cowichan Tribes, Snuneymuxw First Nation, Tseycum First Nation, and Musqueam Indian Band hold
general commercial licences in Management Area E. As such, they are permitted to conduct salmon gillnetting
activities in a section of the lower Fraser River encompassing the Study Area: i.e., from the Port Mann Bridge to
the Strait of Georgia, a distance of about 35 km (DFO 2013b). The Tsawwassen First Nation and Musqueam First
Nation have the most active fisheries on the lower Fraser River (DFO 2014). The preferred location of commercial
fishing activity changes depending on seasonal trends and daily movements of salmon within the Fraser River;
therefore, specific information regarding fishing activity in the Study Area was not available for the approximately
15.6 km length of the Study Area within this fishing zone. A summary of total reported salmon numbers caught
and kept in the 20141 First Nations fisheries in the lower Fraser River below the Port Mann Bridge is provided in
Table 2-3.
There are no shellfish harvesting areas within the Study Area or in the South Arm of the river. Shellfish areas along
the outer estuary are currently closed to shellfish harvesting and closure is considered permanent (DFO 2016).
1 2014 is the most recent publically available series of catch reports for the Lower Fraser River at the time of publication.
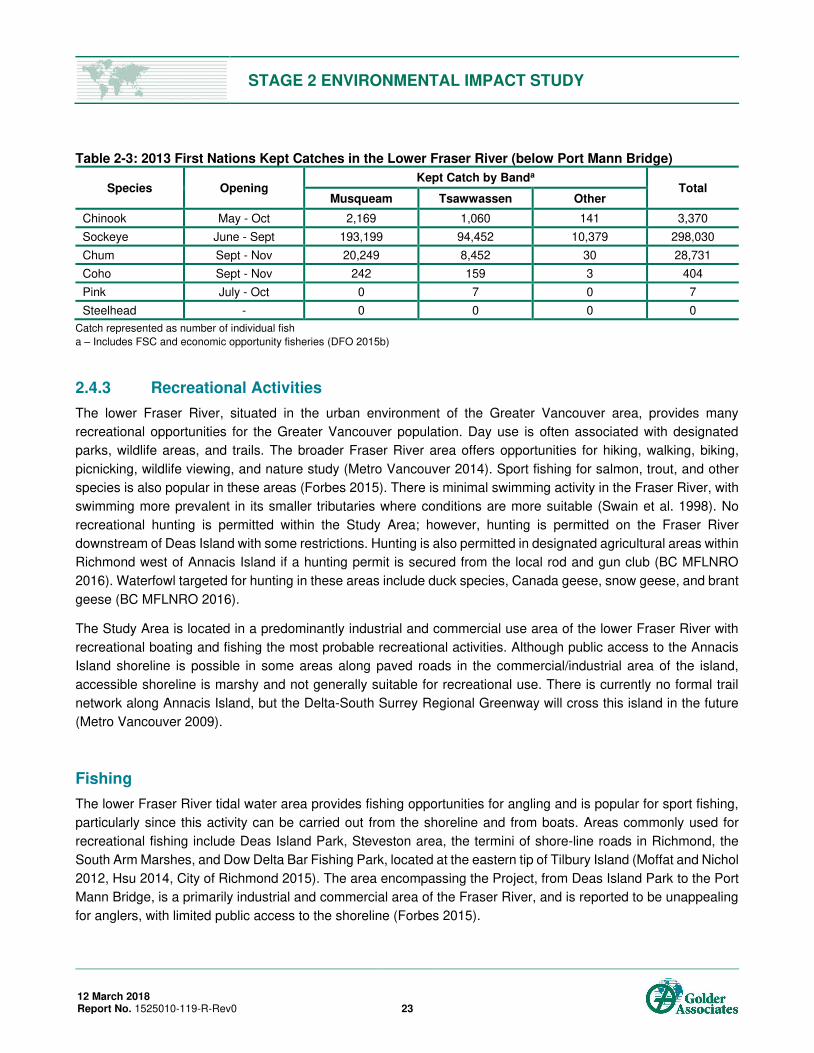
STAGE 2 ENVIRONMENTAL IMPACT STUDY
12 March 2018 Report No. 1525010-119-R-Rev0 23
Table 2-3: 2013 First Nations Kept Catches in the Lower Fraser River (below Port Mann Bridge)
Species Opening Kept Catch by Banda
Total Musqueam Tsawwassen Other
Chinook May - Oct 2,169 1,060 141 3,370
Sockeye June - Sept 193,199 94,452 10,379 298,030
Chum Sept - Nov 20,249 8,452 30 28,731
Coho Sept - Nov 242 159 3 404
Pink July - Oct 0 7 0 7
Steelhead - 0 0 0 0
Catch represented as number of individual fish
a – Includes FSC and economic opportunity fisheries (DFO 2015b)
2.4.3 Recreational Activities
The lower Fraser River, situated in the urban environment of the Greater Vancouver area, provides many
recreational opportunities for the Greater Vancouver population. Day use is often associated with designated
parks, wildlife areas, and trails. The broader Fraser River area offers opportunities for hiking, walking, biking,
picnicking, wildlife viewing, and nature study (Metro Vancouver 2014). Sport fishing for salmon, trout, and other
species is also popular in these areas (Forbes 2015). There is minimal swimming activity in the Fraser River, with
swimming more prevalent in its smaller tributaries where conditions are more suitable (Swain et al. 1998). No
recreational hunting is permitted within the Study Area; however, hunting is permitted on the Fraser River
downstream of Deas Island with some restrictions. Hunting is also permitted in designated agricultural areas within
Richmond west of Annacis Island if a hunting permit is secured from the local rod and gun club (BC MFLNRO
2016). Waterfowl targeted for hunting in these areas include duck species, Canada geese, snow geese, and brant
geese (BC MFLNRO 2016).
The Study Area is located in a predominantly industrial and commercial use area of the lower Fraser River with
recreational boating and fishing the most probable recreational activities. Although public access to the Annacis
Island shoreline is possible in some areas along paved roads in the commercial/industrial area of the island,
accessible shoreline is marshy and not generally suitable for recreational use. There is currently no formal trail
network along Annacis Island, but the Delta-South Surrey Regional Greenway will cross this island in the future
(Metro Vancouver 2009).
Fishing
The lower Fraser River tidal water area provides fishing opportunities for angling and is popular for sport fishing,
particularly since this activity can be carried out from the shoreline and from boats. Areas commonly used for
recreational fishing include Deas Island Park, Steveston area, the termini of shore-line roads in Richmond, the
South Arm Marshes, and Dow Delta Bar Fishing Park, located at the eastern tip of Tilbury Island (Moffat and Nichol
2012, Hsu 2014, City of Richmond 2015). The area encompassing the Project, from Deas Island Park to the Port
Mann Bridge, is a primarily industrial and commercial area of the Fraser River, and is reported to be unappealing
for anglers, with limited public access to the shoreline (Forbes 2015).

STAGE 2 ENVIRONMENTAL IMPACT STUDY
12 March 2018 Report No. 1525010-119-R-Rev0 24
Major recreational fish species include salmon, trout, and sturgeon. Sturgeon and wild trout are catch and release,
but the recreational fishery for these species is open year-round (DFO 2015c). Of the salmon species, sockeye
and coho are reported to be the most popular within the Fraser River, although chum fishing is reported to be
increasing. Peak fishing season is between July and early September, although fishing does occur year-round.
During odd-numbered years, the pink salmon fishery is active in September (Hsu 2014).
The federal government sets specific fishing regulations and catch quotas for Fraser River recreational fisheries.
Current recreational fishing restrictions in the project area (DFO sub-region 29-13) allow for the retention of a
specified number of chinook, chum, and coho of a specified size. Retention of wild coho, pink, and sockeye salmon
of any size is not permitted for recreational fishing witihin the project area.
Boating
Recreational boating occurs year-round, with highest levels of activity occurring between May and September and
lowest levels of activity occurring December to February. Recreational boaters generally exit and enter the Main
Arm near Steveston owing to general ease of navigation, but experienced recreational boaters may exit and enter
the Main Arm by Canoe Passage. Most recreational boaters limit their movements downstream of the Study Area
and remain outside of the main shipping channel, but crossings of the main shipping channel within the Study
Area and recreational boating activities do occur.
One marina and boat launch exists within the Study Area: Shelter Island Marina & Boatyard, located near the
southern tip of Annacis Island, can accommodate up to 300 vessels and provides additional boatyard and ancillary
services (Shelter Island Marina & Boatyard Inc. 2015). Additional marinas are located in Delta and Richmond
outside of the Study Area.
2.4.4 Other Uses
The lower Fraser River is used for industrial, commercial, and residential purposes. Seven fish processing plants,
a fleet of over 850 fishing boats, five deep sea port terminals, a ferry terminal, and over 250 industrial operations
are situated within the Fraser River estuary (FREMP 2003). The river provides an important means of
transportation for movement of raw materials, including logs, fish, and construction aggregates, as well as finished
products (FREMP 2003).
A summary of current and reasonably foreseeable projects or activities located on or near the lower Fraser River
within 17 km of the proposed AIWWTP new outfall was provided in the Stage 1 EIS (Golder 2016).
2.4.5 Withdrawals and Discharges
Withdrawals
A summary of licensed Fraser River water withdrawals located within the Study Area is presented in Table 2-4. In
comparison to average daily flow (average of 3,888,000 cubic metres per day (m3/day) at Hope for the duration of
monitoring efforts over a period of over 100 years) the maximum total withdrawals from within the Study Area
represent 3% of the total discharge of the Fraser River.
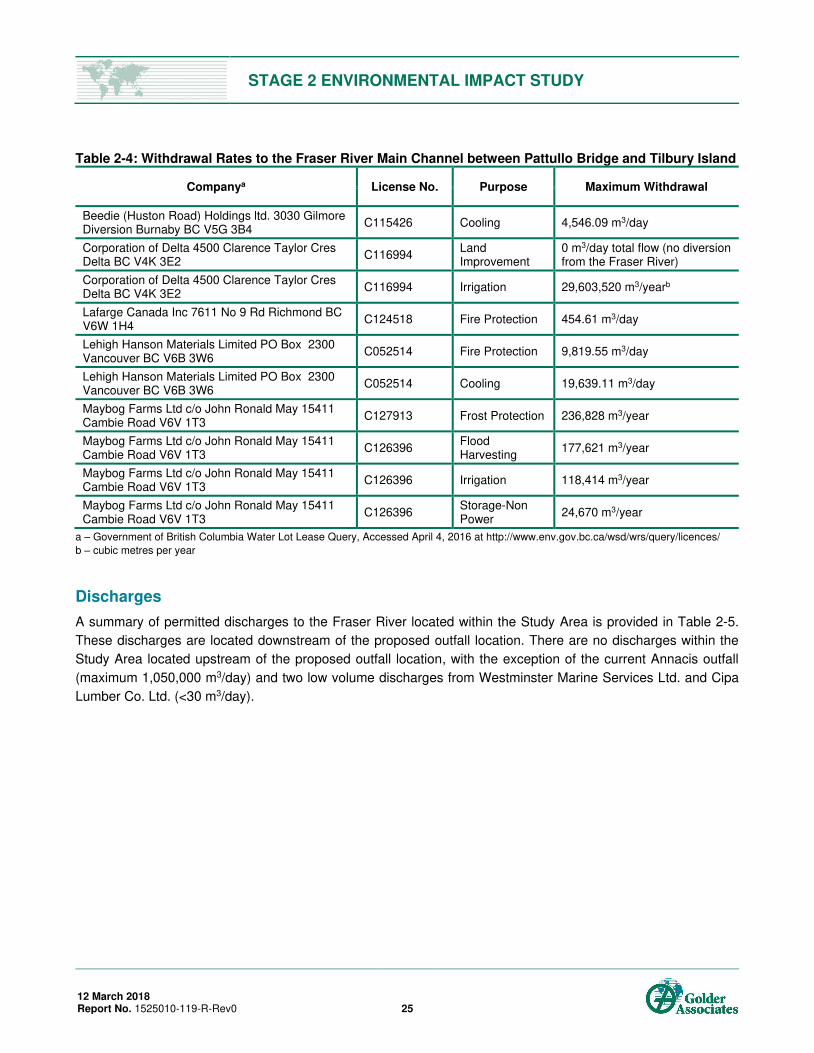
STAGE 2 ENVIRONMENTAL IMPACT STUDY
12 March 2018 Report No. 1525010-119-R-Rev0 25
Table 2-4: Withdrawal Rates to the Fraser River Main Channel between Pattullo Bridge and Tilbury Island
Companya License No. Purpose Maximum Withdrawal
Beedie (Huston Road) Holdings ltd. 3030 Gilmore Diversion Burnaby BC V5G 3B4
C115426 Cooling 4,546.09 m3/day
Corporation of Delta 4500 Clarence Taylor Cres Delta BC V4K 3E2
C116994 Land Improvement
0 m3/day total flow (no diversion from the Fraser River)
Corporation of Delta 4500 Clarence Taylor Cres Delta BC V4K 3E2
C116994 Irrigation 29,603,520 m3/yearb
Lafarge Canada Inc 7611 No 9 Rd Richmond BC V6W 1H4
C124518 Fire Protection 454.61 m3/day
Lehigh Hanson Materials Limited PO Box 2300 Vancouver BC V6B 3W6
C052514 Fire Protection 9,819.55 m3/day
Lehigh Hanson Materials Limited PO Box 2300 Vancouver BC V6B 3W6
C052514 Cooling 19,639.11 m3/day
Maybog Farms Ltd c/o John Ronald May 15411 Cambie Road V6V 1T3
C127913 Frost Protection 236,828 m3/year
Maybog Farms Ltd c/o John Ronald May 15411 Cambie Road V6V 1T3
C126396 Flood Harvesting
177,621 m3/year
Maybog Farms Ltd c/o John Ronald May 15411 Cambie Road V6V 1T3
C126396 Irrigation 118,414 m3/year
Maybog Farms Ltd c/o John Ronald May 15411 Cambie Road V6V 1T3
C126396 Storage-Non Power
24,670 m3/year
a – Government of British Columbia Water Lot Lease Query, Accessed April 4, 2016 at http://www.env.gov.bc.ca/wsd/wrs/query/licences/
b – cubic metres per year
Discharges
A summary of permitted discharges to the Fraser River located within the Study Area is provided in Table 2-5.
These discharges are located downstream of the proposed outfall location. There are no discharges within the
Study Area located upstream of the proposed outfall location, with the exception of the current Annacis outfall
(maximum 1,050,000 m3/day) and two low volume discharges from Westminster Marine Services Ltd. and Cipa
Lumber Co. Ltd. (<30 m3/day).

STAGE 2 ENVIRONMENTAL IMPACT STUDY
12 March 2018 Report No. 1525010-119-R-Rev0 26
Table 2-5: Discharge Rates to the Fraser River Main Channel between Pattullo Bridge and Tilbury Island
Company Namea Permit Number
Authorization Type
Volume of Discharge
m3/day (max)
Average Discharge (m3/day)
Monitoring Requirements
5-day BODb
(mg/Lc)
TSS (mg/L)
Grease and mineral oil
(mg/L)
Westminster Marine Services Ltd.
PE-3154 Permit - 1.14 45 60 -
Cipa Lumber Co. Ltd.
PE-00182 Permit 28 0.8 - - -
Greater Vancouver Sewerage and Drainage District
ME-00387 Operational Certificate
1,050,000 - 45 45 -
RMC Ready-mix Ltd.
PE-11217 Permit 15 5 - - -
Rempel Bros. Concrete Ltd.
PE-12181 Permit 35 - - - -
Lafarge Canada Inc.
PE-00042 Permit 6,050 1,500 - 75 10
Lafarge Concrete a Division of Lafarge Canada Inc.
PE-2439 Permit - 1.37 - 75 -
Armtec holdings limited
PE-02976 Permit 120 - 45 60 -
Shearer Fish Company Limited
PE-7785 Permit 4.6 - - - -
Lehigh northwest cement limited
PE-04513 Permit 18,200 - - - -
a – ENV Permit Search, Accessed April 4, 2016 at https://j200.gov.bc.ca/pub/ams/Default.aspx?PossePresentation=DocumentSearch
b- biological oxygen demand
c- milligrams per litre
“-“ not applicable
2.4.6 Applicable Water Quality Objectives and Guidelines
Water quality guidelines are typically intended to be protective of all situations and incorporate multiple
conservative assumptions such as safety factors and conservative exposure conditions. Therefore, comparison to
guidelines represents a conservative evaluation of the potential for predicted concentrations to result in adverse
effects (BC MoE 2013a). Water quality guidelines have been developed to be protective of different water uses in
both freshwater and marine/estuarine environments, including aquatic life, wildlife, drinking water sources,
recreational contact, and agriculture (livestock and irrigation). The following environmental uses were identified for
the AIWWTP receiving environment:
Commercial, recreational, and aboriginal (CRA) fisheries with the exclusion of shellfish harvesting
Recreational activities such as boating
Irrigation or livestock watering
Ecological resources, including fish and other aquatic life and wildlife
STAGE 2 ENVIRONMENTAL IMPACT STUDY
12 March 2018 Report No. 1525010-119-R-Rev0 27
To determine whether the receiving environment uses identified for the Project could potentially be impaired as a
result of the Project, predicted concentrations were compared to various screening values for the protection of
ecological and public health and agricultural use in Section7.0. A summary of those screening values is provided
below.
Ecological Health and Agriculture Use: Aquatic Life, Wildlife, Livestock and Irrigation
The following objectives and guidelines were considered in the evaluation of potential adverse effects on ecological
health and agricultural use:
FRWQOs applicable to the lower Fraser River from the New Westminster Trifurcation to the Banks (Swain et
al. 1998)
Approved BC WQGs for the most sensitive water use; working BC WQGs were used for constituents without
approved WQGs (BC MoE 2017)
Federal WQGs for the most sensitive water use (CCME 2016)
Federal Environmental Quality Guidelines for PBDEs (Environment Canada 2013)
Aquatic life WQGs were typically the most sensitive guidelines. These guidelines are conservative environmental
quality benchmarks with built-in safety factors that represent concentrations that will not result in adverse effects
on aquatic resources. Both freshwater and marine/estuarine aquatic life guidelines were considered because the
Study Area is within the Main Arm Meso-Tidal Channel and both freshwater and estuarine conditions may be
present depending on the location of the salt wedge (Appendix A). As such, the lowest of the freshwater and
estuarine/marine guidelines for the most sensitive water use was conservatively applied.
The guidelines protective of aquatic life are divided into short-term maximum guidelines and long-term average
guidelines as described below.
Short-term maximum guidelines are intended to protect against severe effects such as lethality to the most
sensitive species over a defined short-term exposure period in the receiving environment (e.g., up to 96 hours
[h]). For the purposes of the Stage 2 EIS, short-term exposure has been characterized as concentrations
over 24 h, which is shorter (more conservative) than the standard acute toxicity test durations for Daphnia
magna (48 h) and rainbow trout (96 h) and is consistent with short-term WQGs for turbidity (24 h) (BC MoE
2017a).
Long-term average guidelines reflective of a 30-d exposure are intended to be protective against sub-lethal
and lethal effects on the most sensitive species and life stage indefinitely (Meays 2012, BC MoE 2013a).
Predicted concentrations were compared against both short-term and long-term screening values.
STAGE 2 ENVIRONMENTAL IMPACT STUDY
12 March 2018 Report No. 1525010-119-R-Rev0 28
Public Health: Recreational Use
The following objectives and guidelines were considered in the evaluation of potential adverse effects on public
health:
Approved BC WQGs (BC MoE 2017a)
Guidelines for Canadian Drinking Water Quality (Health Canada 2017)
United States Environmental Protection Agency (US EPA) Regional Screening Levels (RSL) for tapwater
(US EPA 2017)
The approved BC WQGs for recreational use were selected as the primary screening criteria, when available. For
some constituents, the recreational guidelines have been categorized as either primary or secondary contact
guidelines. Primary contact includes swimming and other high contact activities whereas secondary contact
includes fishing and boating activities with a lower potential for direct contact. Secondary contact guidelines were
selected preferentially because primary contact activities do not occur in the Study Area.
Recreational guidelines were only available for a subset of constituents. Therefore, when a recreational guideline
was not available a conservative screening value was derived by multiplying the drinking water guideline by a
factor of 10 as recommended by the World Health Organization’s (WHO) Guidelines for Recreational Water
Environments (WHO 2003). The WHO (2003) adjustment of 10% of potable water intake is based on a swimming
scenario, and is therefore conservative for recreational secondary contact where the recreational user would not
be fully submerged in water. Drinking water guidelines were obtained from the approved BC WQGs and Health
Canada (2014) with preference given to the most conservative health-based value. Drinking water guidelines
based on aesthetic (non-health) considerations (e.g., colour, taste, odour) were not adjusted. When guidelines
were unavailable from these sources, they were obtained from the US EPA (2017) RSLs. The US EPA tapwater
RSLs are risk-based screening criteria that were derived based on an acceptable hazard quotient (HQ) of 1 for
non-carcinogens, and an acceptable incremental lifetime cancer risk (ILCR) of 10-6 for carcinogens. Health Canada
considers an HQ of 0.2 and ILCR of 10-5 to be acceptable thresholds for risk. Therefore, the US EPA RSLs were
adjusted (i.e., RSL multiplied by 0.2 for non-carcinogens and RSL multiplied by 10 for carcinogens) to reflect
acceptable target risk levels in Canada. US EPA RSLs were then further adjusted by a factor of 10 to convert
drinking water guidelines to recreational water use screening values.
STAGE 2 ENVIRONMENTAL IMPACT STUDY
12 March 2018 Report No. 1525010-119-R-Rev0 29
3.0 REGULATORY SETTING
For effluent discharges to aquatic receiving environments in BC, applicable legislation includes the federal
Fisheries Act that contains a general prohibition against the deposit of a deleterious substance into waters
frequented by fish (Section 36), and the provincial EMA that contains a general prohibition against causing
pollution. Under the general provisions of the Fisheries Act, what constitutes a deleterious substance is a matter
of expert opinion; however, for municipal discharges, what constitutes a deleterious substance and when it can be
discharged is specifically defined in the Federal Wastewater Systems Effluent Regulation (WSER; SOR/2012-
139). The definition of pollution under EMA is discussed below in Section 3.1.2.
To discharge effluent from the new outfall diffuser, MV requires an amendment of Operational Certificate ME-
00387 that authorizes MV to discharge effluent from the AIWWTP under the ILWRMP pursuant to EMA. As per
the MWR (also pursuant to EMA), an EIS of the effluent discharge is required to identify whether or not receiving
water uses could be impaired by the hydraulic upgrade. The EIS is used by the ENV in their permitting decisions
and is used by the discharger, in this case MV, as part of their due diligence to verify that they meet the
requirements of EMA and the ILWRMP.
3.1 Integrated Liquid Waste and Resource Management Plan
Within BC, Liquid Waste Management Plans (LWMPs) developed by local governments are authorization
mechanisms under EMA. In the absence of an LWMP approved by ENV, discharges to the environment within the
local jurisdiction may be authorized through other mechanisms that include the MWR (Metro Vancouver 2010).
The LWMP for the GVS&DD the Integrated Liquid Waste and Resource Management Plan (ILWRMP) authorizes
water, air, and land discharges associated with the management of liquid waste in Metro Vancouver. Discharges
are authorized according to discharge criteria specified in the site specific Operational Certificates for each facility,
including the AIWWTP (Metro Vancouver 2010). In May 2011, the integrated plan was approved by the Minister
of Environment subject to conditions under the provisions of EMA and has since guided liquid waste management
decisions at the AIWWTP.
MV has committed to meeting requirements of the Canada-wide Strategy for the Management of Municipal
Wastewater Effluent (CCME Strategy; CCME 2009) in its ILWRMP. The CCME Strategy requires that treated
municipal effluent discharged into the environment meets the National Performance Standards for wastewater
effluent (carbonaceous biochemical oxygen demand [CBOD] and TSS) and that ambient environmental conditions
of relevant receiving environments in the region be monitored. The CCME Strategy also requires risk assessment
of other wastewater discharge constituents to determine if environmental discharge objectives are required.
3.2 Environmental Management Act and the Municipal Wastewater Regulation
EMA is BC’s principal pollution control statute with regulations made pursuant to that Act for more specific regulatory purposes such as the discharge of municipal effluent. EMA prohibits causing pollution, and provides for
authorization mechanisms for discharge of waste into the environment. One such authorization mechanism for
municipal facilities that discharge treated effluent is an operational certificate. Other authorization mechanisms
under EMA may include regulations.
STAGE 2 ENVIRONMENTAL IMPACT STUDY
12 March 2018 Report No. 1525010-119-R-Rev0 30
The relevant subordinate regulation for the Project is the MWR that specifies requirements for the discharge of
municipal wastewater, including reclaimed water, to receiving environments within BC. The MWR superseded the
Municipal Sewage Regulation in 2012 (BC Reg 129/99; OC 507/99). However, as described in Section 3.1.1, BC
MoE allows local governments to develop LWMPs as part of local liquid waste discharge authorization through
EMA. As such, discharges within local jurisdictions are regulated though LWMPs and Operational Certificates for
each facility, not the province-wide MWR. In the case of the AIWWTP, the approved ILWRMP has been in place
since May 2011.
Under EMA, pollution is defined as “the presence in the environment of substances or contaminants that substantially alter or impair the usefulness of the environment”. Common expectations under EMA are two-fold:
Acutely lethal conditions should not exist within the IDZ or the effluent. The IDZ is the three-dimensional zone
around the point of discharge where mixing of the effluent and the receiving water occurs. For a large water
body, the IDZ is commonly defined as a cylindrical body of water around the outfall, with a lateral radius the
lesser of 100 m from the outfall or 25% the width of the body of water and extending upwards to the surface
of the water column.
Chronic sublethal effects should not occur outside of the IDZ. A lack of chronic sublethal effects is
(conservatively) predicted when the constituent of concern has a concentration lower than approved WQGs
(BC MoE 2017a).
3.3 Fisheries Act and the Federal Wastewater Systems Effluent Regulation
With respect to the Fisheries Act, a deleterious substance is a substance that, if added to water, would degrade
or alter or form part of a process of degradation and would likely be rendered deleterious to fish or fish habitat, or
the use by man of fish that frequent that water. The specific properties defining a substance as being deleterious
under the parent act are left to interpretation by experts, except where sector-specific regulations have been
developed, such as the federal WSER that came into effect July 2012. This works-specific regulation was written
under the authority of subsection 36(5) and paragraphs 43(g.1), (g,2), and (h) of the Fisheries Act.
Under the WSER, the following classes of substances are prescribed as deleterious substances and their
discharge into the environment is authorized in concentrations below the specified limits: CBOD, TSS, TRC (total
residual chlorine), and un-ionized ammonia. Discharge can also only occur if the effluent is shown not to be acutely
lethal to rainbow trout in accordance with specified standard test methods specified in the regulation.
3.4 Port of Vancouver Project Review Process
Under the Canada Marine Act, the Vancouver Fraser Port Authority (the Port) is responsible for the administration,
management, and control of land and water within its jurisdiction. The Port requires that developments meet
applicable standards and minimize environmental and community impacts. New developments are also expected
to support the Port’s land use objectives as described in the Port’s land use plan.
STAGE 2 ENVIRONMENTAL IMPACT STUDY
12 March 2018 Report No. 1525010-119-R-Rev0 31
The Port is a federal agency that is subject to Section 67 of the Canadian Environmental Assessment Act (CEAA)
with respect to projects on lands under their administration. The Port has established a review process to address
potential effects to environmental and Aboriginal resources as described in the CEAA. The review process is
based on a system of four project categories. In this system, Category A projects are simple, minor works that do
not require review by the Port and Category D projects are large complex undertakings that may require extensive
review and stakeholder consultation
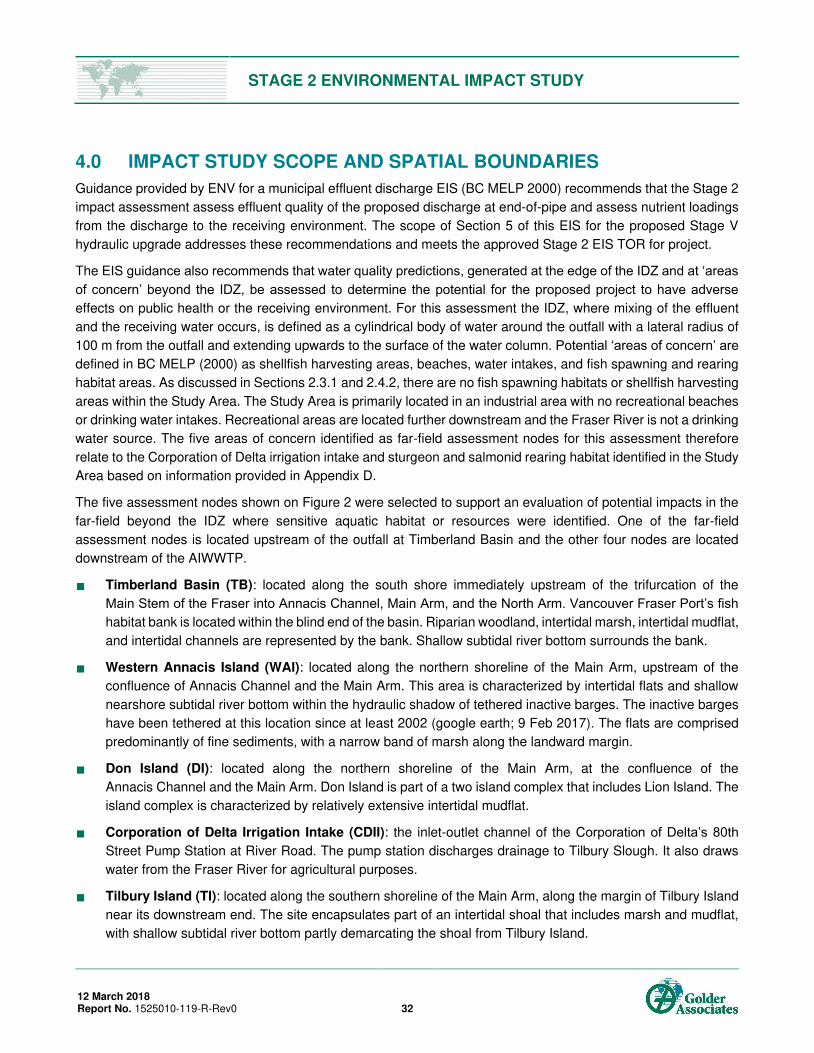
STAGE 2 ENVIRONMENTAL IMPACT STUDY
12 March 2018 Report No. 1525010-119-R-Rev0 32
4.0 IMPACT STUDY SCOPE AND SPATIAL BOUNDARIES
Guidance provided by ENV for a municipal effluent discharge EIS (BC MELP 2000) recommends that the Stage 2
impact assessment assess effluent quality of the proposed discharge at end-of-pipe and assess nutrient loadings
from the discharge to the receiving environment. The scope of Section 5 of this EIS for the proposed Stage V
hydraulic upgrade addresses these recommendations and meets the approved Stage 2 EIS TOR for project.
The EIS guidance also recommends that water quality predictions, generated at the edge of the IDZ and at ‘areas of concern’ beyond the IDZ, be assessed to determine the potential for the proposed project to have adverse effects on public health or the receiving environment. For this assessment the IDZ, where mixing of the effluent
and the receiving water occurs, is defined as a cylindrical body of water around the outfall with a lateral radius of
100 m from the outfall and extending upwards to the surface of the water column. Potential ‘areas of concern’ are defined in BC MELP (2000) as shellfish harvesting areas, beaches, water intakes, and fish spawning and rearing
habitat areas. As discussed in Sections 2.3.1 and 2.4.2, there are no fish spawning habitats or shellfish harvesting
areas within the Study Area. The Study Area is primarily located in an industrial area with no recreational beaches
or drinking water intakes. Recreational areas are located further downstream and the Fraser River is not a drinking
water source. The five areas of concern identified as far-field assessment nodes for this assessment therefore
relate to the Corporation of Delta irrigation intake and sturgeon and salmonid rearing habitat identified in the Study
Area based on information provided in Appendix D.
The five assessment nodes shown on Figure 2 were selected to support an evaluation of potential impacts in the
far-field beyond the IDZ where sensitive aquatic habitat or resources were identified. One of the far-field
assessment nodes is located upstream of the outfall at Timberland Basin and the other four nodes are located
downstream of the AIWWTP.
Timberland Basin (TB): located along the south shore immediately upstream of the trifurcation of the
Main Stem of the Fraser into Annacis Channel, Main Arm, and the North Arm. Vancouver Fraser Port’s fish habitat bank is located within the blind end of the basin. Riparian woodland, intertidal marsh, intertidal mudflat,
and intertidal channels are represented by the bank. Shallow subtidal river bottom surrounds the bank.
Western Annacis Island (WAI): located along the northern shoreline of the Main Arm, upstream of the
confluence of Annacis Channel and the Main Arm. This area is characterized by intertidal flats and shallow
nearshore subtidal river bottom within the hydraulic shadow of tethered inactive barges. The inactive barges
have been tethered at this location since at least 2002 (google earth; 9 Feb 2017). The flats are comprised
predominantly of fine sediments, with a narrow band of marsh along the landward margin.
Don Island (DI): located along the northern shoreline of the Main Arm, at the confluence of the
Annacis Channel and the Main Arm. Don Island is part of a two island complex that includes Lion Island. The
island complex is characterized by relatively extensive intertidal mudflat.
Corporation of Delta Irrigation Intake (CDII): the inlet-outlet channel of the Corporation of Delta’s 80th Street Pump Station at River Road. The pump station discharges drainage to Tilbury Slough. It also draws
water from the Fraser River for agricultural purposes.
Tilbury Island (TI): located along the southern shoreline of the Main Arm, along the margin of Tilbury Island
near its downstream end. The site encapsulates part of an intertidal shoal that includes marsh and mudflat,
with shallow subtidal river bottom partly demarcating the shoal from Tilbury Island.
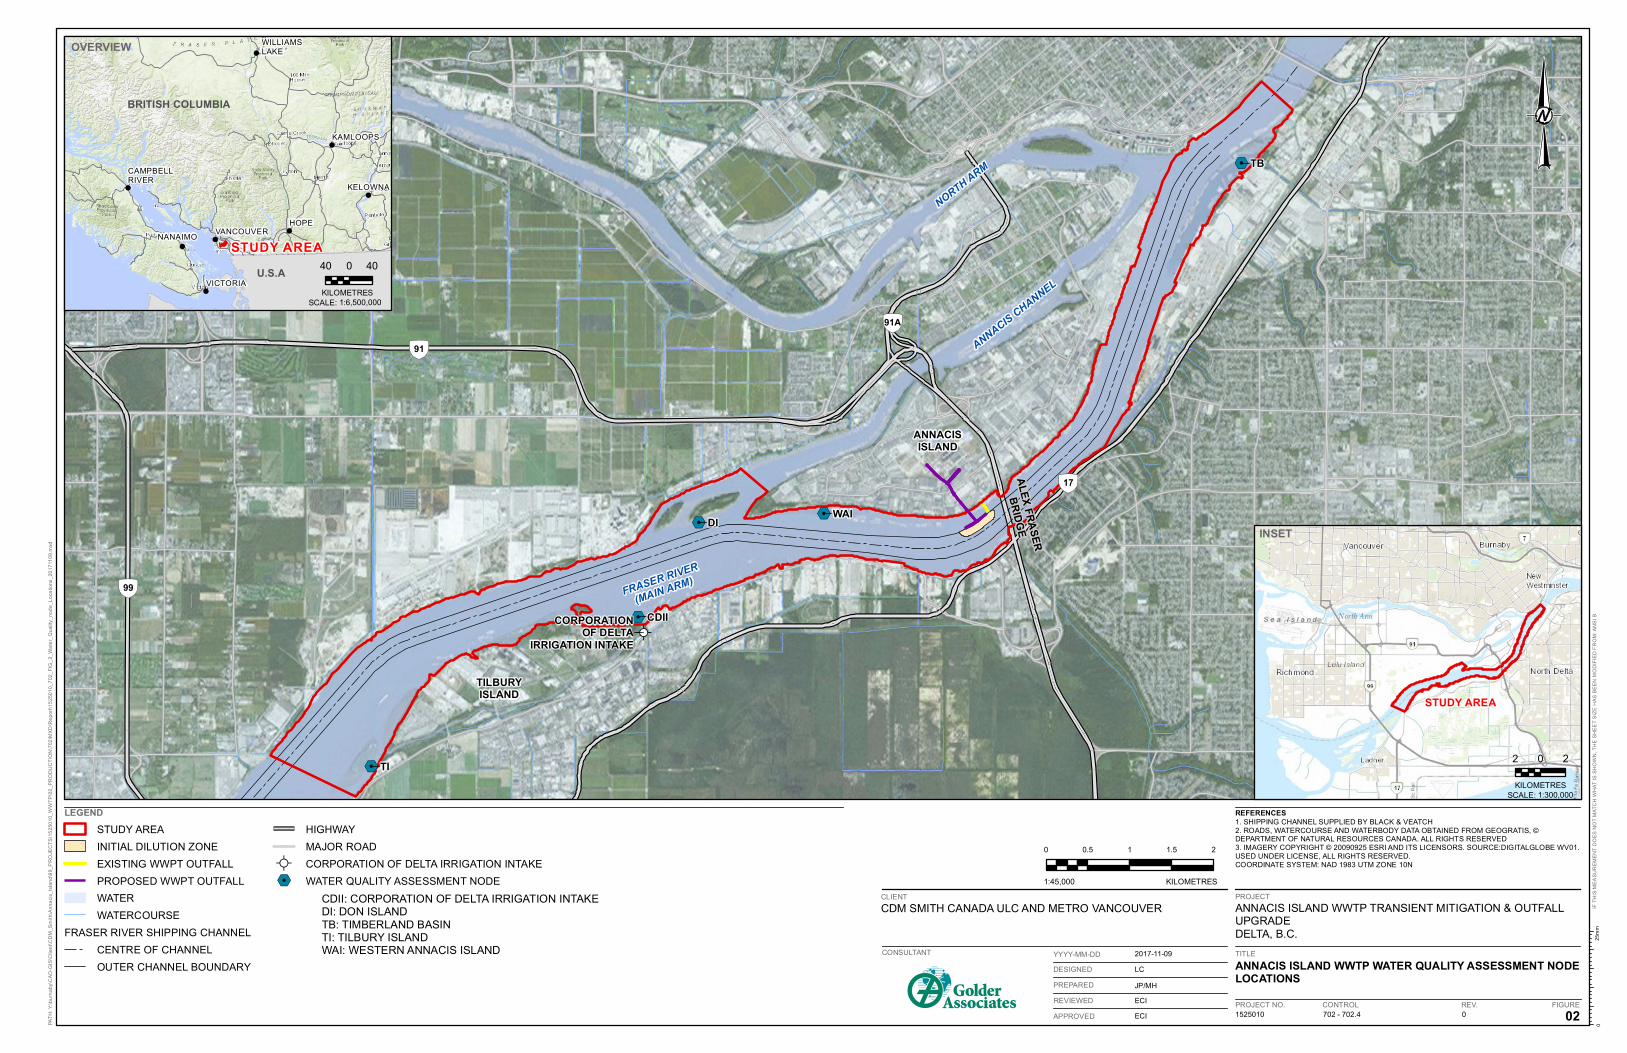
%2
%2
%2
!»
%2
%2
FRASER RIVER
(MAIN ARM)
AL
EX
FR
AS
ER
BR
IDG
E
ANNACIS
ISLAND
TILBURY
ISLAND
NORTH A
RM
ANNACIS C
HANNEL
ÄÆ
91A
ÄÆ
91
ÄÆ
99
ÄÆ
17
CDII
DI
TB
CORPORATION
OF DELTA
IRRIGATION INTAKE
WAI
TI
PA
TH
: Y
:\b
urn
ab
y\C
AD
-GIS
\Clie
nt\
CD
M_
Sm
ith
\An
na
cis
_Is
lan
d\9
9_
PR
OJE
CT
S\1
52
50
10
_W
WT
P\0
2_
PR
OD
UC
TIO
N\7
02
\MX
D\R
ep
ort
\15
25
01
0_
70
2_
FIG
_2
_W
ate
r_Q
ua
lity
_n
od
e_
Lo
ca
tio
ns
_2
01
711
09
.mxd
IF T
HIS
ME
AS
UR
EM
EN
T D
OE
S N
OT
MA
TC
H W
HA
T I
S S
HO
WN
, T
HE
SH
EE
T S
IZE
HA
S B
EE
N M
OD
IFIE
D F
RO
M: A
NS
I B
25
mm
0
0 0.5 1 1.5 2
1:45,000 KILOMETRES
CLIENT
CDM SMITH CANADA ULC AND METRO VANCOUVER
REFERENCES
1. SHIPPING CHANNEL SUPPLIED BY BLACK & VEATCH
2. ROADS, WATERCOURSE AND WATERBODY DATA OBTAINED FROM GEOGRATIS, ©DEPARTMENT OF NATURAL RESOURCES CANADA. ALL RIGHTS RESERVED
3. IMAGERY COPYRIGHT © 20090925 ESRI AND ITS LICENSORS. SOURCE:DIGITALGLOBE WV01.
USED UNDER LICENSE, ALL RIGHTS RESERVED.
COORDINATE SYSTEM: NAD 1983 UTM ZONE 10N
PROJECT
ANNACIS ISLAND WWTP TRANSIENT MITIGATION & OUTFALLUPGRADEDELTA, B.C.
TITLE
ANNACIS ISLAND WWTP WATER QUALITY ASSESSMENT NODE
LOCATIONS
1525010 702 - 702.4 0 02
2017-11-09
LC
JP/MH
ECI
ECI
CONSULTANT
PROJECT NO. CONTROL REV. FIGURE
YYYY-MM-DD
DESIGNED
PREPARED
REVIEWED
APPROVED
LEGEND
STUDY AREA
INITIAL DILUTION ZONE
EXISTING WWPT OUTFALL
PROPOSED WWPT OUTFALL
WATER
WATERCOURSE
FRASER RIVER SHIPPING CHANNEL
CENTRE OF CHANNEL
OUTER CHANNEL BOUNDARY
HIGHWAY
MAJOR ROAD
!» CORPORATION OF DELTA IRRIGATION INTAKE
%2 WATER QUALITY ASSESSMENT NODE
!
!
!
!
!
!
!
!
!
U.S.A
BRITISH COLUMBIA
VICTORIA
VANCOUVER
KAMLOOPS
KELOWNA
NANAIMO
CAMPBELLRIVER
HOPE
WILLIAMSLAKE
STUDY AREA
OVERVIEW
40 0 40
1:6,500,000
KILOMETRES
SCALE:
STUDY AREA
2 0 2
KILOMETRES
INSET
1:300,000SCALE:
CDII: CORPORATION OF DELTA IRRIGATION INTAKEDI: DON ISLANDTB: TIMBERLAND BASINTI: TILBURY ISLANDWAI: WESTERN ANNACIS ISLAND
STAGE 2 ENVIRONMENTAL IMPACT STUDY
12 March 2018 Report No. 1525010-119-R-Rev0 34
The receiving environment impact assessment presented in Section 7 evaluated water quality predictions at the
edge of the IDZ in the near-field and at far-field assessment nodes, as described in a synthesis of relevant
information from Appendix A in Section 6. This section also includes an assessment of persistent, bioaccumulative
and toxic constituents (PBTs) where PBT constituents were identified and evaluated to determine the potential for
adverse effects to people and wildlife consuming fish from the Fraser River. The conclusion of the EIS and an
assessment of uncertainties noted in Sections 5 through 7 are provided in Section 8.
Guidance provided by BC MELP (2000) indicates that following the Stage V upgrade and commencement of the
discharge, effluent and receiving environment monitoring results should to be evaluated to:
determine whether water quality guidelines are being met outside the IDZ
confirm that sediment biota, chemistry, and toxicity are not adversely affected
confirm previous modeling and predictive assessments findings
The potential need for refinement of monitoring currently being conducted for the existing discharge or additional
monitoring or confirmatory studies was considered during preparation of the impact assessment.
Recommendations to be considered for Stage V post-discharge monitoring and confirmatory studies are provided
in Section 10.

STAGE 2 ENVIRONMENTAL IMPACT STUDY
12 March 2018 Report No. 1525010-119-R-Rev0 35
5.0 EFFLUENT ASSESSMENT
The objectives of the effluent assessment were to characterize effluent quality assumed for the Stage V hydraulic
upgrade including comparison to relevant limits and standards, assess the potential for acute toxicity based on
toxicity testing results for the current discharge, and assess nutrient loadings to the Fraser River under Stage V
flows. This section also includes a summary of the selection procedure employed to compile a short-list of organic
constituents to be assessed in the receiving environment impact assessment provided in Section 7.
In summary, the Stage V effluent assessment includes the following:
A general overview of the main constituents regulated or of interest in municipal wastewater effluent
discharges (Section 5.1).
A summary of effluent criteria applicable to the AIWWTP (Section 5.2) and a summary of effluent chemistry
and toxicity testing results from 2012 to 2016 (Section 5.3.1).
Ammonia is further discussed in Section 5.3.2 with respect to the maximum allowable limit back-calculated
from the BC total ammonia WQG for the purpose of the impact assessment.
An assessment of the potential for Stage V effluent to be acutely lethal based on toxicity testing results for
the current discharge (Section 5.3.3).
An assessment of nutrient loadings to the receiving environment with reference to the assimilative capacity
of the lower Fraser River downstream of the AIWWTP (Section 5.4).
The process for selecting organic constituents to be assessed in the impact assessment is described in
Section 5.5.
The content of this section addresses relevant guidance provided by BC MELP (2000) for a Stage 2 EIS, relevant
requirements of the ILWRMP approved for the GVS&DD, and the WSER as described in Section 5.2.
5.1 Summary of Effluent Constituents
In Metro Vancouver, municipal wastewater is primarily comprised of domestic wastes and surface run-
off/stormwater but also includes industrial and commercial inputs. With respect to environmental significance,
municipal effluent may contain oxygen-depleting constituents, ammonia and other nutrients, pathogenic
microorganisms, metals, surfactants, organic compounds and other potentially harmful constituents, such as
endocrine disrupting compounds. Although municipal effluent is a complex mixture, there are certain constituents
and properties that have been associated with known adverse effects or conditions in aquatic environments.
Some of the key constituents found in municipal effluent and their potential environmental effects on organisms in
aquatic receiving environments are discussed below. Whether or not these potential impacts might occur will
depend on the specific characteristics of the effluent discharge and the receiving environment, in addition to
exposure conditions encountered by aquatic life in the Fraser River. An evaluation of potential environmental
impacts on aquatic life in the Fraser River is presented in Section 7.0 of this report.
STAGE 2 ENVIRONMENTAL IMPACT STUDY
12 March 2018 Report No. 1525010-119-R-Rev0 36
5.1.1 pH
pH is an environmental factor that affects physiological processes including enzyme activity, ionic regulation, and
the chemical speciation of constituents present in water. pH is an important exposure and toxicity modifying factor
affecting the bioavailability and toxicity of metals and nutrients. In freshwater systems, pH is typically in the range
of 6.5 to 9, and values outside this range can disrupt the processes of waste excretion and oxygen uptake across
fish gills (McKean and Nagpal 1991). Metals are typically more bioavailable to aquatic organisms under low pH
(acidic) conditions and less bioavailable under higher pH (alkaline) conditions.
5.1.2 Total Suspended Solids
There are several reviews on the effects of suspended sediments in freshwater ecosystems (e.g., Birtwell 1999,
Caux et al. 1997, EIFAC 1964, Newcombe and Jensen 1996, Newcombe and MacDonald 1991). Suspended
solids are not usually associated with lethal effects on fish except when the TSS concentration is very high. In
studies on the acutely lethal concentrations of TSS on juvenile salmon, it was found that 31,000 mg/L and
17,600 mg/L caused mortality to 50% of juvenile chinook and sockeye salmon respectively over a 96-h test period
(Servizi and Gordon 1990, Servizi and Martens 1987). These concentrations are not commonly encountered in
waterbodies except under rare circumstances. Suspended sediment also can cause changes in behaviour such
as avoidance (Bisson and Bilby 1982, Robertson et al. 2006) and physiological trauma such as gill damage, which
has been observed at TSS concentrations on the order of hundreds to thousands of mg/L (Birtwell 1999, Muck
2010, Servizi and Martens 1987).
5.1.3 Carbonaceous Biochemical Oxygen Demand (CBOD)
Municipal effluent contains constituents that can cause depletion of oxygen from surrounding water. Various types
of microorganisms degrade the constituents of the effluent, converting them into energy. This process requires
oxygen from the surrounding environment, thereby leading to reductions in oxygen available for aquatic organisms.
Oxygen can also be removed from the surrounding environment by direct chemical reaction with constituents in
the waste via a process known as chemical oxidation.
The oxygen-depleting potency of a municipal effluent is measured as CBOD over a 5-d period (i.e., CBOD5) in a
laboratory in which the contribution from nitrogenous bacteria has been suppressed. The extent to which oxygen
is removed from receiving waters depends on the dynamics of this process in relation to dispersion and re-
oxygenation of the receiving waters through contact with the atmosphere. Waters that are confined and stagnant
are more prone to oxygen depletion than waters that are unconfined and well flushed.
5.1.4 Ammonia
Ammonia is a waste product that is produced by fish and other aquatic organisms to dispose of nitrogenous
wastes. Nitrogenous wastes produced by humans and other mammals are excreted in the form of urea. Ammonia
can result from the breakdown of urea or the amine portion of amino acids, which make up proteins. Ammonia is
a naturally occurring constituent and its concentration in unpolluted waters is typically low and not of toxicological
concern. However, it can be introduced into the aquatic environment through the discharge of wastewaters at
concentrations that can potentially result in toxicity, depending on the specific characteristics of the discharge and
the receiving environment.
STAGE 2 ENVIRONMENTAL IMPACT STUDY
12 March 2018 Report No. 1525010-119-R-Rev0 37
Ammonia in water exists as two distinct chemical species, un-ionized ammonia (NH3) and ionized ammonia (NH4+,
also known as the ammonium ion), in an equilibrium that is influenced by pH, temperature, and in marine waters,
salinity (CCME 2010, US EPA 2013). As pH increases, the amount of the more toxic un-ionized form increases.
Increased water temperature and decreased salinity also favour increases of the un-ionized form. Water quality
guidelines in Canada are set on the basis of pH, temperature, and (for marine WQGs) salinity because of the
influence of these environmental factors on the toxicity of ammonia.
5.1.5 Nutrient Enrichment
In aquatic systems, plant productivity can respond to increases in nutrient concentrations (Environment Canada
2004). The associated increase in plant biomass can in turn potentially affect water quality and invertebrate and
fish communities. Aquatic biota initially respond to mild enrichment with an increase in productivity that may not
necessarily result in adverse effects on water quality or resident biota. However, beyond a certain point in nutrient
limited systems, increased productivity due to nutrient inputs can result in changes to water quality and aquatic
life through a process called eutrophication (Nordin 1985). Changes can include but are not limited to the following:
Increases in plant and animal biomass and/or productivity. Excessive nutrient enrichment can cause
increased phytoplankton production and result in an in an “algal bloom”. Algal blooms can influence water
quality and cause negative impacts to other aquatic organisms via production of toxins (i.e., from
cyanobacteria) or from depletion of dissolved oxygen following death and decomposition of algal cells, as
well as during diurnal respiration.
Decreases in biodiversity and changes in dominant biota, and/or declines in ecologically sensitive species
and increases in tolerant species.
Increases in turbidity and organic matter, leading to sedimentation, or potential detritus and/or algal build up
on substrates.
Algae take up mineral elements such as nitrogen, phosphorus, silicate, iron, and trace metals that they use to
convert light energy into organic material via the process of photosynthesis. Any one of these elements, if in short
supply, could potentially limit algal biomass. Conversely, an enrichment of nutrients that are limiting could result
in increased algal productivity. In freshwater systems phosphorus is typically the limiting nutrient but in marine
waters nitrogen forms generally limit algal growth (Nordin 1985, Environment Canada 2004).
5.1.6 Pathogens
Contact with domestic waste has long been recognized as a potential source of infectious disease-causing
organisms such as bacteria, viruses, and protozoans (Dadswell 1990). A group of bacteria known as fecal
coliforms are present in municipal effluent and are commonly used as an indicator of the presence of effluent and
the associated risk of pathogens. Enterococci bacteria are also used as an indicator of municipal effluent because
they survive longer in freshwater environments than fecal coliforms.
Human health risk from pathogens requires that there be contact with the source of pathogens and humans or
harvestable shellfish resources. As noted in Section 2.4, existing and proposed outfall areas are not located
adjacent to harvestable shellfish resources, and due to plume trapping the likelihood for significant contact
between the plume and human users is low.

STAGE 2 ENVIRONMENTAL IMPACT STUDY
12 March 2018 Report No. 1525010-119-R-Rev0 38
5.1.7 Metals
Metals occur naturally in the environment and may enter the aquatic environment from natural weathering
processes and anthropogenic sources, such as those related to fossil fuel combustion, industrial emissions,
discharge of municipal wastewaters, and stormwater runoff from paved surfaces. Certain metals are essential for
maintaining good health because of their importance as components of enzymes or proteins, and a shortage of
those metals can result in adverse effects. Excess concentrations of essential or non-essential metals can result
in toxicity (Chapman and Wang 2000, Campbell et al. 2006). The toxicity of metals to aquatic organisms ranges
widely from slight reductions in growth rates to mortality, and may be acute (after a short-term exposure) or chronic
(over a longer term). Metal accumulation and toxicity is dependent on metal bioavailability that is influenced by
exposure conditions and toxicity modifying factors, such as pH, water hardness, and dissolved organic carbon
(DOC), as well as physiological and biological characteristics of aquatic organisms.
5.1.8 Organics
Organic compounds range from simple molecules to long-chained, multi-ringed, halogenated structures that vary
in persistence and effects on aquatic organisms. The fate and transport of organic compounds in environmental
systems is controlled by partitioning between surface water, suspended particulates and sediment, associated
organic matter, and biota. The extent to which organic compounds are associated with organic matter is related to
a number of factors including molecular weight and the number and position of chlorine atoms in the case of
chlorinated compounds.
Organic compounds can have a wide range of effects on aquatic organisms, from reproductive impairment such
as reduced fecundity and viability of offspring, developmental impairment such as brain and skeletal deformations
and reduced growth, to acute mortality of both adults and juveniles. Of particular concern are persistent,
bioaccumulative, and toxic constituents that are hydrophobic and can accumulate in fatty tissues unless the
organism has a mechanism for metabolizing and excreting the compound. Organic compounds may be
biomagnified up the food chain, resulting in higher concentrations in higher trophic level organisms such as
carnivorous marine mammals. Examples of persistent organic compounds present in municipal effluents include
PAHs, PCBs, and PBDEs.
5.1.9 Endocrine Disrupting Compounds
Municipal wastewater contains constituents known or suspected to be endocrine disrupting compounds (EDCs),
which include some parameters in the following groups: surfactants, plasticizers, and pharmaceutical and personal
care products (PPCP) (Anderson 2005, Environment Canada 2007b). EDCs interfere with the endocrine
(hormonal) system of animals and may cause reproductive abnormalities.
The presence and ecological significance of EDCs is an area of emerging international science, with ongoing
research being conducted on the fate and behaviour of EDCs in the environment and the effectiveness of various
wastewater treatment methods (Anderson 2005). In Canada, the need for research and policy directions regarding
EDCs such as PPCPs has been recognized and priorities in the areas of effects research and risk management
for PPCPs have been identified (Environment Canada 2007b). Research includes the development of analytical
methods, assessment of the efficiency of treatment of various EDCs, and evaluation of the presence and effects
of EDCs in the aquatic environment (Environment Canada 2008b). One of the compounds that has received
attention is EE2, the synthetic hormone in the birth-control pill, and it is the only PPCP for which there is a BC
WQG.
STAGE 2 ENVIRONMENTAL IMPACT STUDY
12 March 2018 Report No. 1525010-119-R-Rev0 39
5.1.10 Sterols
Sterols are steroid derivatives found naturally in animals, plants and fungi. A number of sterols measured in the
aquatic environment originate from fecal matter such as coprostanol, while others such as cholestanol are formed
naturally by bacteria and do not have a fecal origin. Coprostanol is a reduced metabolite of cholesterol produced
in the gut of humans along with most other higher animals. Cholesterol can be transformed to coprostanol in
municipal effluents and sludges that contain elevated levels of fecal bacteria. Elevated concentrations of
coprostanol downstream of municipal wastewater treatment plants are therefore frequently used as a biomarker
or indicator for the presence of human fecal matter in the environment.
5.2 Effluent Criteria Applicable to the AIWWTP
Under the CCME Strategy (CCME 2009) and the WSER, the following National Performance Standards exist as
minimum performance requirements for effluent quality:
average concentration of CBOD5 does not exceed 25 mg/L
average concentration of TSS does not exceed 25 mg/L
average concentration of TRC does not exceed 0.02 mg/L if chlorine or one of its compounds is used in the
treatment process
maximum concentration of un-ionized ammonia is less than 1.25 mg/L as ammonia nitrogen (NH3-N) at
15 ± 1 degrees Celsius (°C)
As discussed in Section 3.1, the ILWRMP approved for the GVS&DD commits MV to meeting National
Performance Standards for CBOD and TSS in their wastewater effluents prior to discharge to the aquatic receiving
environment.
Compliance limits specified in the Operational Certificate - ME00387 (23 April 2004) for the AIWWTP effluent are:
maximum concentration of CBOD5 does not exceed 45 mg/L
maximum concentration of TSS does not exceed 45 mg/L
concentration of TRC to remain below 0.1 mg/L (the required minimum detection limit)
There is also a requirement under the WSER that effluent is not acutely lethal to rainbow trout (median lethal
concentration causing mortality in 50% of test organism, LC50 ≥100% volume by volume (v/v)), determined on a
monthly basis in accordance with Reference Method EPS 1/RM/13 or EPS 1/RM/50 (Environment Canada 2007a,
2008a).
The federal and provincial limits discussed above are minimal compliance requirements, and the assessment of
potential impacts carried out herein has been broader, as necessitated by the general provisions of provincial
legislation and the CCME strategy as indicated in the ILWRMP which is a provincial instrument.
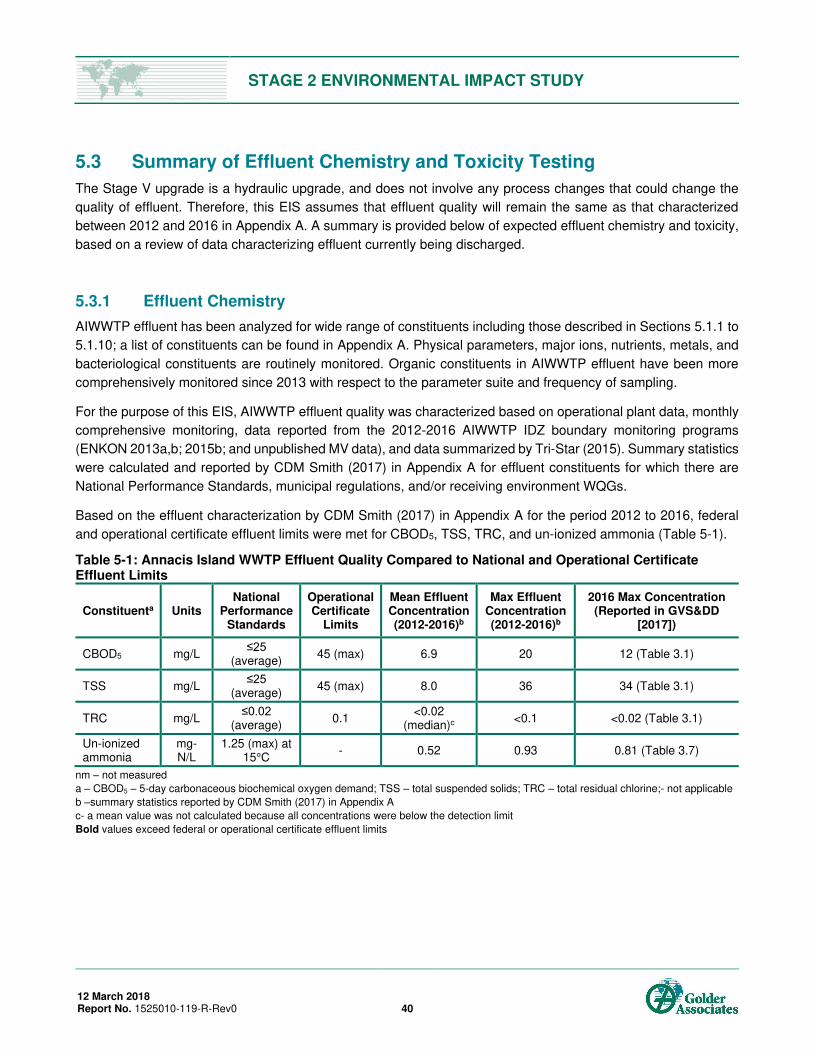
STAGE 2 ENVIRONMENTAL IMPACT STUDY
12 March 2018 Report No. 1525010-119-R-Rev0 40
5.3 Summary of Effluent Chemistry and Toxicity Testing
The Stage V upgrade is a hydraulic upgrade, and does not involve any process changes that could change the
quality of effluent. Therefore, this EIS assumes that effluent quality will remain the same as that characterized
between 2012 and 2016 in Appendix A. A summary is provided below of expected effluent chemistry and toxicity,
based on a review of data characterizing effluent currently being discharged.
5.3.1 Effluent Chemistry
AIWWTP effluent has been analyzed for wide range of constituents including those described in Sections 5.1.1 to
5.1.10; a list of constituents can be found in Appendix A. Physical parameters, major ions, nutrients, metals, and
bacteriological constituents are routinely monitored. Organic constituents in AIWWTP effluent have been more
comprehensively monitored since 2013 with respect to the parameter suite and frequency of sampling.
For the purpose of this EIS, AIWWTP effluent quality was characterized based on operational plant data, monthly
comprehensive monitoring, data reported from the 2012-2016 AIWWTP IDZ boundary monitoring programs
(ENKON 2013a,b; 2015b; and unpublished MV data), and data summarized by Tri-Star (2015). Summary statistics
were calculated and reported by CDM Smith (2017) in Appendix A for effluent constituents for which there are
National Performance Standards, municipal regulations, and/or receiving environment WQGs.
Based on the effluent characterization by CDM Smith (2017) in Appendix A for the period 2012 to 2016, federal
and operational certificate effluent limits were met for CBOD5, TSS, TRC, and un-ionized ammonia (Table 5-1).
Table 5-1: Annacis Island WWTP Effluent Quality Compared to National and Operational Certificate Effluent Limits
Constituenta Units National
Performance Standards
Operational Certificate
Limits
Mean Effluent Concentration (2012-2016)b
Max Effluent Concentration (2012-2016)b
2016 Max Concentration (Reported in GVS&DD
[2017])
CBOD5 mg/L ≤25
(average) 45 (max) 6.9 20 12 (Table 3.1)
TSS mg/L ≤25
(average) 45 (max) 8.0 36 34 (Table 3.1)
TRC mg/L ≤0.02
(average) 0.1
<0.02 (median)c
<0.1 <0.02 (Table 3.1)
Un-ionized ammonia
mg-N/L
1.25 (max) at 15°C
- 0.52 0.93 0.81 (Table 3.7)
nm – not measured
a – CBOD5 – 5-day carbonaceous biochemical oxygen demand; TSS – total suspended solids; TRC – total residual chlorine;- not applicable
b –summary statistics reported by CDM Smith (2017) in Appendix A
c- a mean value was not calculated because all concentrations were below the detection limit
Bold values exceed federal or operational certificate effluent limits
STAGE 2 ENVIRONMENTAL IMPACT STUDY
12 March 2018 Report No. 1525010-119-R-Rev0 41
Annual summaries of AIWWTP effluent quality and results from annual compliance assessments were
summarized in the 2011 to 2016 annual wastewater reports issued by GVS&DD (GVS&DD 2012-2017). In these
reports, compliance constituent effluent quality from 2012 to 2016 was characterized as follows:
Operational Certificate ME00387 limits for CBOD, TSS, and TRC were met each year.
Monthly average concentrations of CBOD5 and TSS met WSER limits each year (i.e., National Performance
Standards).
Monthly maximum concentrations of un-ionized ammonia met the WSER limit from 2013 to 2016; data were
not reported for 2011 and 2012.
Annual maximum concentrations of TRC in 2011 to 2013 were reported as <0.1 mg/L (the minimum method
detection limit of the operational certificate) that is above the WSER limit. However, as a result of an analytical
instrument change in 2014, a lower detection limit was achievable from 2014 onwards which meant that the
annual maximum concentration of TRC met the federal limit in 2014, 2015, and 2016.
The estimated concentration2 of fecal coliforms at the edge of the IDZ met the FRWQO, for each reported
month (May through October) of each year.
Based on the most recent characterization of effluent (i.e., 2016, GVS&DD 2017), the AIWWTP effluent met WSER
limits (as summarized above) and was not acutely toxic (Section 5.3.3). Thus, the AIWWTP effluent meets
conditions of Section 6(1) of WSER, and as such its deposit is authorized under Section 36(4) of the Fisheries Act.
Because the Stage V upgrade is a hydraulic upgrade and effluent quality is assumed to remain the same as that
characterized between 2012 and 2016, it is expected that effluent quality after the Stage V upgrade will meet the
requirements of the ILWRMP and WSER limits.
5.3.2 Ammonia
The AIWWTP is regulated under the ILWRMP and Operational Certificate ME-00387. The Operational Certificate
does not specify an effluent discharge limit for ammonia but the ILWRMP specifies that the National Performance
Standard for un-ionized ammonia in wastewater effluent be met (equivalent to the WSER limit: maximum of
1.25 milligrams of nitrogen per litre [mg-N/L] unionized ammonia at 15°C). An assessment of predicted
concentrations of total and unionized ammonia at the edge of the IDZ as a result of the Stage V hydraulic upgrade
is presented in Section 7.0.
As discussed in Section 3.0, this EIS has been prepared following the MWR and associated guidance from BC
MELP (2000). Both the MWR and BC MELP (2000) specify that a maximum allowable limit for total ammonia
should be calculated to meet the Environmental Quality Objective for total ammonia at the edge of the IDZ, which
is the BC WQG for total ammonia. A summary is provided in Section 6.3.5.2 of the procedure used to calculate
maximum allowable limits for total ammonia by month. Monthly maximum allowable limits calculated for this EIS
are presented in Table 6-4.
2 Maximum 30-day geometric mean value multiplied by a minimum dilution factor of 40:1 for the IDZ
STAGE 2 ENVIRONMENTAL IMPACT STUDY
12 March 2018 Report No. 1525010-119-R-Rev0 42
Total ammonia concentrations measured in AIWWTP effluent between 2012 and 2016 (Appendix A) are lower
than the calculated maximum allowable limits. The minimum calculated limit for August (37.61 mg-N/L) is similar
to the 2012-2016 effluent 95th percentile concentration (38.7 mg-N/L) and is higher than the 2012-2016 mean
concentration (31.4 mg-N/L). The maximum calculated limits range from 37.61 mg-N/L in August to 63.84 mg-N/L
in June (Table 6-4). These maximum allowable limits are intended to represent upper (maximum) concentrations
in the effluent that result in concentrations at the IDZ that meet the BC WQG for total ammonia. The allowable
limits are therefore intended to be protective of aquatic life and other water uses at the edge of the IDZ but are not
intended to represent effluent discharge limits.
As discussed in Section 5.1.4, ammonia toxicity is dependent on the proportion of total ammonia that exists in the
more toxic unionized form. The proportion of un-ionized ammonia is primarily determined by effluent pH and
temperature. Effluent discharged from AIWWTP between 2012 and 2016 was not acutely toxic to rainbow trout
and the maximum unionized ammonia effluent concentration was 0.93 mg-N/L, which is lower than the National
Performance Standard of 1.25 mg-N/L at 15°C. As per the ILWRMP and the WSER, ammonia in the AIWWTP
effluent will continue to be regulated by the National Performance Standard of 1.25 mg-N/L at 15°C. In addition to
monitoring ammonia in both effluent and the receiving environment and undertaking routine effluent toxicity testing,
MV has conducted ammonia spiking studies as summarized in AECOM (2015). In these studies, AIWWTP effluent
was spiked with ammonia to further evaluate the dose response relationship between acute toxicity in rainbow
trout to exposure of ammonia in the AIWWTP effluent. The findings of these studies have been considered in
ongoing evaluation of the AIWWTP ammonia removal system implemented through secondary effluent treatment
(AECOM 2015).
5.3.3 Effluent Toxicity
Annual summaries of AIWWTP effluent quality and results from annual compliance assessments were
summarized in the 2012 to 2016 annual wastewater reports issued by GVS&DD (GVS&DD 2013-2017). From
2012 to 2016, reported monthly acute toxicity tests with rainbow trout all passed (i.e., 96-h LC50 >100% v/v) and
met the National Performance Standard for toxicity testing. Standard acute toxicity testing of the effluent with
Daphnia magna during this time period also all passed (i.e., 48-h LC50 >100% v/v). Acute toxicity testing followed
ECCC’s standard test protocols3 and all conditions of the protocols were met. Because the Stage V upgrade is a
hydraulic upgrade and effluent quality will remain the same as that characterized between 2012 and 2016, it is
expected that effluent quality after the Stage V upgrade will meet the requirement that the effluent not be acutely
toxic to rainbow trout. This expectation will be confirmed by continuation of the acute toxicity testing program
currently implemented for the existing AIWWTP discharge following the Stage V upgrade.
MV has also undertaken chronic toxicity testing of the AIWWTP effluent with Ceriodaphnia dubia and fathead
minnow (Pimephales promelas) since 2008, consistent with the CCME Strategy to evaluate the potential for toxicity
in the receiving environment (GVS&DD 2017). Tests have been conducted using ECCC standard toxicity testing
protocols; i.e., 7-d Fathead Minnow Larval Survival and Growth Test Method: Reference Method EPS 1/RM/22
(Environment Canada 20111) and 7-d Ceriodaphnia dubia Survival and Reproduction Test Method: Reference
Method EPS 1/RM/21 (Environment Canada 2007c).
3 Reference Method EPS 1/RM/13 or EPS 1/RM/50 for rainbow trout (Environment Canada 2007a, 2008a) and EPS 1/RM/14 for D. magna (Environment Canada 2000).
STAGE 2 ENVIRONMENTAL IMPACT STUDY
12 March 2018 Report No. 1525010-119-R-Rev0 43
Tri-Star (2015) evaluated chronic toxicity test results from 2009 to 2012. They reported that exposure to the effluent
only rarely reduced C. dubia survival over 7 days but that fathead minnow survival tended to be lower when
exposed to effluent for 7 days. An evaluation of toxic units calculated from these data by Tri-Star (2015) indicated
that chronic toxicity based on IC25 concentrations only appeared to be a concern outside the IDZ on one occasion
from 2009 to 2012.
More recent data are generally consistent with these findings. The most recent annual wastewater report issued
by GVS&DD (2017) reported that test results for chronic toxicity testing with C. dubia and fathead minnow in 2016
varied with AIWWTP effluent quality, timing of sample collection, and test organism. Overall GVS&DD (2017)
concluded that ‘periodically some toxicity was observed at an effluent concentration that may predict it to persist
at the IDZ boundary, especially considering that some toxicity has also been observed in the Fraser River’. To address this finding GVS&DD (2017) committed to further investigation of the chronic toxicity test results.
5.4 Nutrient Loading Assessment
5.4.1 Factors Affecting Primary Productivity in the Lower Fraser River
Because the Fraser River is predominantly freshwater at Annacis Island (even though there is salt water intrusion
along the river bottom under low flow conditions), it is expected that phosphorus would be the limiting nutrient for
algal growth close to the AIWWTP (Environment Canada 2004). In general, the relationship between nutrient
concentrations and periphyton biomass is weaker in rivers and streams than in lakes (Dodds et al. 2002, Wetzel
2001). In rivers and streams, primary productivity is influenced to a greater degree by a number of factors other
than nutrient concentrations, that include but are not limited to light availability, flow velocities, stability and type of
substrate, length of the growing season, suspended sediment load, invertebrate grazing, flood and drought
frequencies, time since the last freshet, and water temperature (Allen 1995, Dodds et al. 2002, Tank and Dodds
2003, Lewis and McCutchan 2010, Wetzel 2001).
As discussed in Section 2.2.2, total phosphorus (TP) concentrations reported for the lower Fraser River, although
higher than the BC WQG derived to protect against eutrophication in lakes, have not resulted in substantial algal
growth (Nordin 1985, FRAP 1999a). Algal communities are not as well established in the lower Fraser River
compared to upper reaches due to the influence of sediment transport downstream through the estuary to the
Strait of Georgia (FRAP 1999a, Johannessen et al. 2015). Primary productivity is more likely limited by the turbid
conditions characteristic of the lower reaches that reduce light penetration through the water column, rather than
by nutrients (Sylvestor 1998). Benthic algal communities are further constrained by unstable, soft bottom, sandy
substrates characteristic of the lower reaches. River conditions are particularly turbid during the freshet season
from April to August that encompasses most of the growing season for algae in BC defined by Nordin (1985).
Outside of this growing season, algal growth continues to be limited by turbid and light-limiting conditions in the
river as well as colder temperatures.

STAGE 2 ENVIRONMENTAL IMPACT STUDY
12 March 2018 Report No. 1525010-119-R-Rev0 44
5.4.2 Predicted Nutrient Loadings under Stage V Flows
Although concentrations of phosphorus and nitrogen in effluent are not expected to change from those reported
for the current discharge, nutrient loadings would be expected to increase under Stage V flows. Predicted mean
nutrient loadings are shown in Table 5-2 along with current mean loading estimates. Both current and predicted
loadings were compared to ambient loadings in the Fraser River from upstream sources calculated for the period
September/early October based on AIWWTP REM data from 2012 to 2016. This time period represents the end
of the growing season in BC after freshet ends in August, when the river is less influenced by loads of terrestrial
phosphorus with surface run-off.
Table 5-2: Stage AIWWTP Upgrade: Predicted Phosphorus and Nitrogen Loadings to the Lower Fraser River Receiving Environment in Early Fall (September/Early October)1
Loading Scenario
Total Phosphorus Total Nitrogen
Mean Loading (kg/d)
Contribution of Effluent to Respective
Total Load (%)
Mean Loading
(kg/d)
Contribution of Effluent to Total
Load (%)
Ambient Fraser River Loading from Upstream Sources2
4,725 n/a 37,020 n/a
Current Effluent Loading 1,126 19% 14,926 29%
Current Total Fraser River Load downstream of the AIWWTP
5,851 n/a 51,946 n/a
Predicted Stage V Effluent Loading 3 1,522 24% 20,176 35%
Predicted Total Fraser River Load downstream of the AIWWTP
6,247 n/a 57,196 n/a
Predicted Absolute Incremental Change 396 5% increase 5,250 6% increase
Notes n/a = not applicable; kg/d = kilograms per day 1 – Provided by CDM Smith. Loading calculations were based on date paired river and effluent quality and flow data. 2 – Calculated from phosphorus and total nitrogen concentrations reported by the AIWWTP REM program in September/October (2012 to 2016)
3 – 2 times Average Dry Weather Flow (ADWF)
Total downstream loadings of phosphorus and nitrogen in the Fraser River were calculated for current and
predicted scenarios as the sum of the AIWWTP contribution and the ambient upstream load. Percent contributions
of the current or predicted effluent discharges to the respective total loads in the river downstream of the AIWWTP
were then calculated.
With the Stage V upgrade, loadings from the AIWWTP will represent 24% of the TP load in the Fraser River, which
is an increase of 5% (in absolute terms) relative to the current AIWWTP discharge contribution of 19% of the total
load. AIWWTP. Nutrient enrichment has not been documented downstream of the AIWWTP where the river is well
oxygenated and no excessive algal growth has been reported (ENKON 2016a). Consequently, a 5% incremental
increase in TP loads to the river is not expected to result in increased algal growth.
In the marine environment of the Strait of Georgia, primary productivity is expected to be limited by light availability
and nitrogen. In a recent study, Johannessen et al. (2015) estimated that wastewater from the upstream GVS&DD
municipal WWTPs, including the AIWWTP, contributed ≤1% of the nitrogen, organic carbon, and oxygen demand
in the Strait of Georgia. The authors concluded that the total contribution from the WWTPs was unlikely to cause
eutrophication in the Strait of Georgia. The total loading of all dissolved inorganic nitrogen (DIN) sources to the
STAGE 2 ENVIRONMENTAL IMPACT STUDY
12 March 2018 Report No. 1525010-119-R-Rev0 45
Strait was 721,000,000 kilograms per year (kg/y) and the estimated loadings from all five WWTPs was
8,580,000 kg/y, with the AIWWTP contributing 3,780,000 kg/y. Therefore, the predicted 6% (in absolute terms)
increase in nitrogen loading under Stage V flows is not expected to result in eutrophication in the Strait of Georgia.
5.5 Selection of Organic Constituents for the Receiving Impact Assessment
A variety of organic constituents in the effluent have been analyzed by MV between 2012 and 2016. The EIS
focused on assessing those constituents with the most potential to cause adverse effects on public health and the
receiving environment. Priority was therefore given to the selection of constituents that met the following criteria:
Constituents for which environmental water quality criteria were available.
Constituents for which 2012 to 2016 data reported by the Annacis REM program or the FRAMP water quality
component suggested that river concentrations might be showing increasing temporal trends within or
downstream of the Study Area.
Organic constituents selected for the impact assessment based on these selection criteria include select pesticides
(herbicides, insecticides, and fungicides), alkylphenols, PCBs, PBDEs, hormones and sterols, and most PAHs
(see Appendix E).
STAGE 2 ENVIRONMENTAL IMPACT STUDY
12 March 2018 Report No. 1525010-119-R-Rev0 46
6.0 RECEIVING WATER QUALITY PREDICTIONS
This section was authored by CDM Smith. This section describes the selected diffuser design concept
(Section 6.1) and the methodology (Sections 6.2 and 6.3) and results (Section 6.4) of predicted concentrations at
the edge of IDZ to support receiving water quality assessments for the Stage 2 EIS. Details of analyses to develop
the multiport diffuser design concept and assessment of its hydraulics and mixing characteristics in the Fraser
River are provided by CDM Smith (2017) in Appendix A and summarized below.
6.1 Multiport Diffuser Design Concept
The multiport diffuser design concept has the following features:
The ability to discharge Stage V flows (18.9 m3/s) at a river level of 103.18 m geodetic datum—the conditions
for which this EIS is being evaluated—by gravity without impacting the hydraulic gradeline of the treatment
plant. For flows above Stage V, an effluent pump station will be needed to discharge to future design flow
(Stage VIII) of 25.3 m3/s peak wet weather flow. The diffuser was designed to accommodate Stage VIII flows
by opening additional diffuser ports.
A 240-m long diffuser manifold located just outside the edge of the navigation channel just downstream of
the existing outfall (Figure 3). The manifold connects to the main vertical riser from the outfall tunnel at its
center.
The manifold has 24, 0.75-m diameter risers leading to 0.75-m diameter ports discharging horizontally via
variable orifice valves with an equivalent diameter of 0.525 m toward the center of the river. For Stage V
flows, 6 of the ports would be blocked off to aid in increasing dilution leaving 18 active ports. All 24 ports
would be open at Stage VIII when peak wet weather flow is 25.3 m3/s.
The Stage V ports are fitted with variable orifices (e.g., Tideflex® diffuser valves) to increase exit velocities at
low effluent flows. These valves also reduce sediment entering the diffuser system. The remaining ports are
capped until needed for increased Stage VIII flows.
The diffuser ports are surrounded by a concrete conical sleeve (diffuser protective structure) to protect them
from anchors, ship strikes, and submerged debris. The sleeve accommodates access to the port terminus to
permit maintenance of the variable orifices.
The ends of the manifold are fitted with bulkheads to facilitate internal access and/or cleaning.
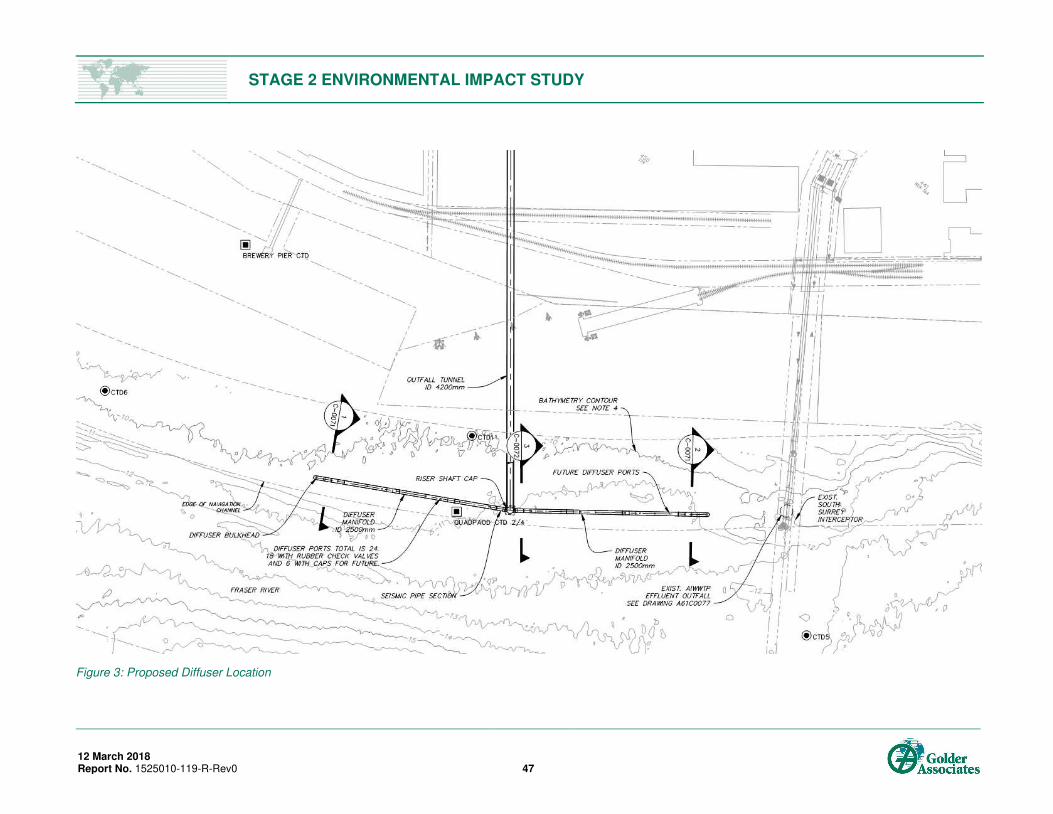
STAGE 2 ENVIRONMENTAL IMPACT STUDY
12 March 2018 Report No. 1525010-119-R-Rev0 47
Figure 3: Proposed Diffuser Location

STAGE 2 ENVIRONMENTAL IMPACT STUDY
12 March 2018 Report No. 1525010-119-R-Rev0 48
The proposed location for the diffuser manifold is in the deepest water available in the Study Area (outside of the
navigation channel), which improves initial dilution. The design of the diffuser in this location results in the top
elevation of the diffuser protective structures at 8.7 m water depth below Chart Datum. The MWR specifies that
the water depth at the shallowest port should be 10 m below Chart Datum. Thus, the proposed diffuser
configuration will require a variance of the MWR diffuser depth requirement.
The MWR allows for consideration of mixing with ambient waters in determining compliance with BC WQGs. The
MWR define an IDZ as described in Section 1.3. The IDZ boundaries for the proposed diffuser for the AIWWTP
are shown in Figure 4.
Figure 4: Conceptual IDZ
6.2 Input Data for the Analysis
The key input data for the prediction of concentrations at the edge of the IDZ are listed below; detailed information
is provided in Appendix A.
Effluent Flow—Daily maximum instantaneous flows from the AIWWTP from 2012-2016 were used as the
basis for estimating the future flow distribution; 2012-2016 flows range from 5.5 m3/s to 13.7 m3/s. During
periods of high flow into the plant, the influent flow is manually throttled and allowed to bypass the plant to
prevent the plant from reaching its design capacity of 12.6 m3/s. The distribution of flows was scaled from
present day to Stage V using a future minimum flow of 7.4 m3/s and a peak flow of 18.9 m3/s, while
maintaining the proportional shape of the distribution.
For determinations of compliance with WQGs, initial dilution predictions were only performed at the
compliance effluent flow of 14.75 m3/s, which is two times average dry weather flow (2xADWF). A
supplemental screening analysis was performed using future monthly average effluent flows as a sensitivity
test for comparison to long-term WQGs; these results are presented in Section 8.
STAGE 2 ENVIRONMENTAL IMPACT STUDY
12 March 2018 Report No. 1525010-119-R-Rev0 49
Effluent Concentrations—Effluent data were compiled from 2012-2016 records (along with samples
collected for selected constituent in 2017) and taken primarily from annual summaries of monthly operating
data and effluent samples collected during IDZ monitoring. Selected constituents (fecal coliform bacteria,
TRC, and CBOD5) were taken from daily plant operational records. Statistical summaries of the effluent data
are reported in Appendix A; these calculations used the full detection limit when constituents were flagged
as either less than a method detection limit or a maximum possible concentration.
Fraser River Flows—Due to the complexity of the Fraser River estuary, flows measured at the ECCC
monitoring station at Hope (BC08MF0001) were used to define five river ‘flow classifications’ that describe when the river has uni- or bidirectional currents, is freshwater, or has the possibility of various degrees of
salinity stratification at the Study Area. The five Fraser River flow classifications are Q >6,000 m3/s (high flow,
unidirectional); 6,000 m3/s > Q >2,000 m3/s (moderate flow, bidirectional); 2,000 m3/s > Q >1,500 m3/s (low
flow, bidirectional, weak salinity) 1,500 m3/s > Q >800 m3/s (lower flow, bidirectional, moderate salinity), and
Q <1,000 m3/s (lowest flow, bidirectional, highest salinity).
Fraser River Water Depth—Data from the tide gauge at New Westminster (#7654) were used to define
typical low and high water levels at the Study Area.
Fraser River Current—Current speed is a key input to the initial dilution models. Data on current speed were
taken from a year-long (representing 2013) simulation using the H3D hydrodynamic model of the proposed
diffuser discharging at the compliance flow of 14.75 m3/s (2xADWF) at a location in the center of the river
about 1 km downstream from the proposed diffuser.
Fraser River Salinity—River salinity data were taken from a variety of sources and used to define three river
flow conditions (described above under Fraser River flows) when notable salinity stratification can be present
at the Project Study Area. The shapes of the assumed vertical profile for low and high water levels are shown
in Appendix A. The characterization of salinity accounted for both the strength and vertical distribution of
salinity and also the likelihood of its being present.
River-Effluent Seasonal Temperature Differences—Contemporaneous Fraser River temperature data
from the Gravesend Reach buoy and effluent temperature were used to define average temperature
difference for the five river flow classifications.
Predictions for ammonia required characterization of two additional constituents in the effluent and Fraser River
ambient: pH and alkalinity.
pH—Fraser River pH values were taken from available data from the Gravesend Reach buoy from 2012-
2016; the data were screened to remove extreme outliers. Annacis effluent pH values were taken from the
grab samples of effluent from the 2012-2016 plant operational data reports.
Alkalinity—Fraser River alkalinity from the FRAMP or ECCC sampling program at Tilbury Island from 2012-
2016 was used to characterize ambient alkalinity, while effluent alkalinity from the same time period was
gathered from the AIWWTP operational data reports.
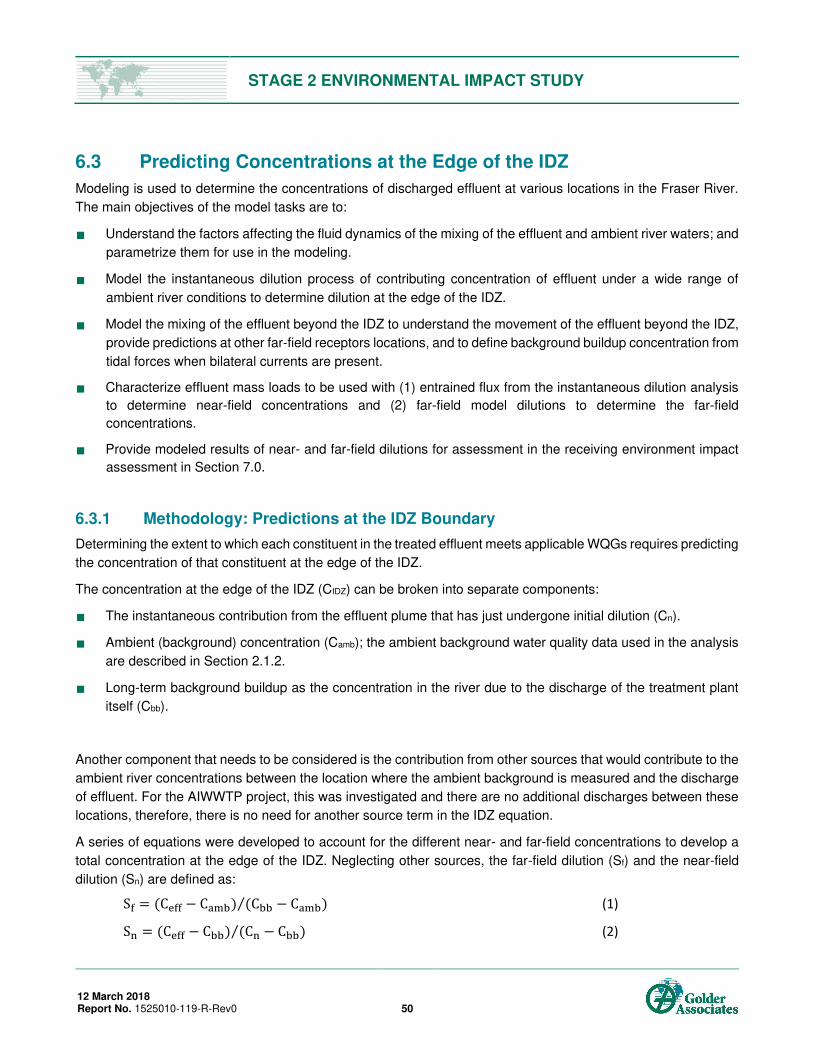
STAGE 2 ENVIRONMENTAL IMPACT STUDY
12 March 2018 Report No. 1525010-119-R-Rev0 50
6.3 Predicting Concentrations at the Edge of the IDZ
Modeling is used to determine the concentrations of discharged effluent at various locations in the Fraser River.
The main objectives of the model tasks are to:
Understand the factors affecting the fluid dynamics of the mixing of the effluent and ambient river waters; and
parametrize them for use in the modeling.
Model the instantaneous dilution process of contributing concentration of effluent under a wide range of
ambient river conditions to determine dilution at the edge of the IDZ.
Model the mixing of the effluent beyond the IDZ to understand the movement of the effluent beyond the IDZ,
provide predictions at other far-field receptors locations, and to define background buildup concentration from
tidal forces when bilateral currents are present.
Characterize effluent mass loads to be used with (1) entrained flux from the instantaneous dilution analysis
to determine near-field concentrations and (2) far-field model dilutions to determine the far-field
concentrations.
Provide modeled results of near- and far-field dilutions for assessment in the receiving environment impact
assessment in Section 7.0.
6.3.1 Methodology: Predictions at the IDZ Boundary
Determining the extent to which each constituent in the treated effluent meets applicable WQGs requires predicting
the concentration of that constituent at the edge of the IDZ.
The concentration at the edge of the IDZ (CIDZ) can be broken into separate components:
The instantaneous contribution from the effluent plume that has just undergone initial dilution (Cn).
Ambient (background) concentration (Camb); the ambient background water quality data used in the analysis
are described in Section 2.1.2.
Long-term background buildup as the concentration in the river due to the discharge of the treatment plant
itself (Cbb).
Another component that needs to be considered is the contribution from other sources that would contribute to the
ambient river concentrations between the location where the ambient background is measured and the discharge
of effluent. For the AIWWTP project, this was investigated and there are no additional discharges between these
locations, therefore, there is no need for another source term in the IDZ equation.
A series of equations were developed to account for the different near- and far-field concentrations to develop a
total concentration at the edge of the IDZ. Neglecting other sources, the far-field dilution (Sf) and the near-field
dilution (Sn) are defined as: S = C − C C − C⁄ (1) S = C − C C − C⁄ (2)
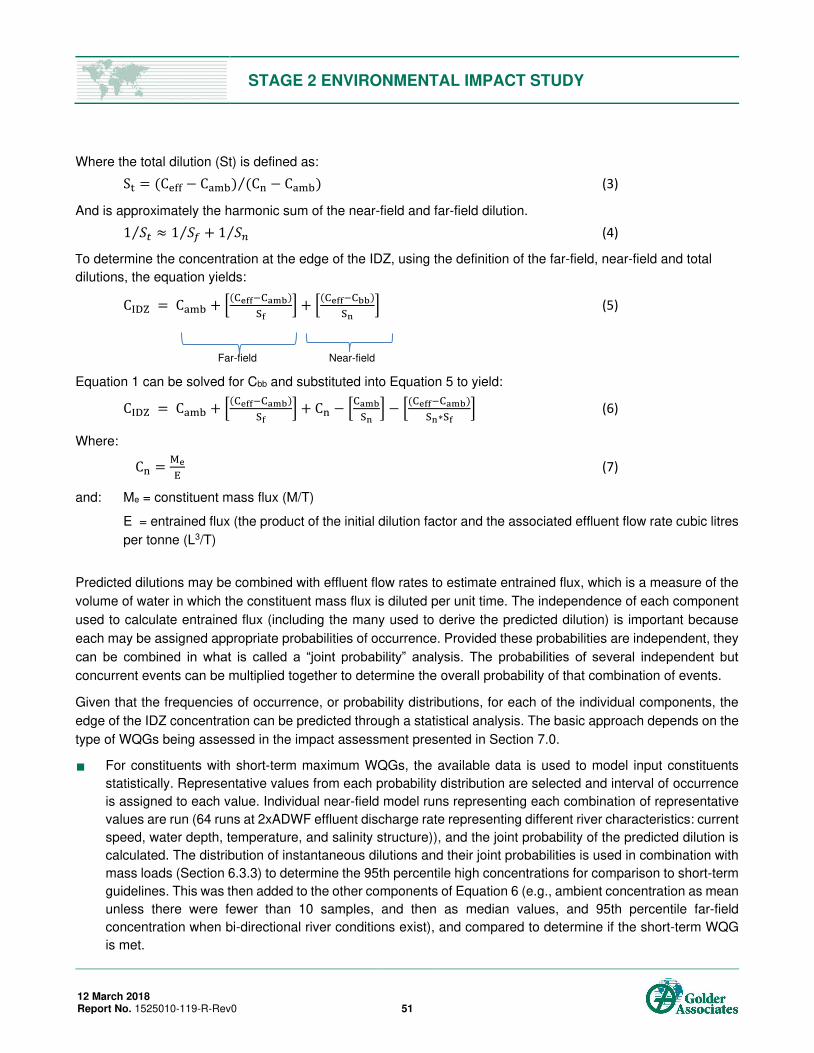
STAGE 2 ENVIRONMENTAL IMPACT STUDY
12 March 2018 Report No. 1525010-119-R-Rev0 51
Where the total dilution (St) is defined as: St = C − C C − C⁄ (3)
And is approximately the harmonic sum of the near-field and far-field dilution. 𝑆𝑡⁄ ≈ 𝑆𝑓⁄ + 𝑆𝑛⁄ (4)
To determine the concentration at the edge of the IDZ, using the definition of the far-field, near-field and total
dilutions, the equation yields: C Z = C + [ −S ] + [ −S ] (5)
Far-field Near-field
Equation 1 can be solved for Cbb and substituted into Equation 5 to yield: C Z = C + [ −S ] + C − [ S ] − [ −S ∗S ] (6)
Where: C = M (7)
and: Me = constituent mass flux (M/T)
E = entrained flux (the product of the initial dilution factor and the associated effluent flow rate cubic litres
per tonne (L3/T)
Predicted dilutions may be combined with effluent flow rates to estimate entrained flux, which is a measure of the
volume of water in which the constituent mass flux is diluted per unit time. The independence of each component
used to calculate entrained flux (including the many used to derive the predicted dilution) is important because
each may be assigned appropriate probabilities of occurrence. Provided these probabilities are independent, they
can be combined in what is called a “joint probability” analysis. The probabilities of several independent but concurrent events can be multiplied together to determine the overall probability of that combination of events.
Given that the frequencies of occurrence, or probability distributions, for each of the individual components, the
edge of the IDZ concentration can be predicted through a statistical analysis. The basic approach depends on the
type of WQGs being assessed in the impact assessment presented in Section 7.0.
For constituents with short-term maximum WQGs, the available data is used to model input constituents
statistically. Representative values from each probability distribution are selected and interval of occurrence
is assigned to each value. Individual near-field model runs representing each combination of representative
values are run (64 runs at 2xADWF effluent discharge rate representing different river characteristics: current
speed, water depth, temperature, and salinity structure)), and the joint probability of the predicted dilution is
calculated. The distribution of instantaneous dilutions and their joint probabilities is used in combination with
mass loads (Section 6.3.3) to determine the 95th percentile high concentrations for comparison to short-term
guidelines. This was then added to the other components of Equation 6 (e.g., ambient concentration as mean
unless there were fewer than 10 samples, and then as median values, and 95th percentile far-field
concentration when bi-directional river conditions exist), and compared to determine if the short-term WQG
is met.
STAGE 2 ENVIRONMENTAL IMPACT STUDY
12 March 2018 Report No. 1525010-119-R-Rev0 52
For constituents with long-term average (30-d) WQGs, the available data is used to develop monthly average
values for each ambient river model input constituent at the 2xADWF compliance flow of 14.75 m3/s to allow
calculation of dilution monthly. For months when salinity can be present, two simulations (stratified and
unstratified) are made and then are combined based on the probability of salinity being present. Then, the
monthly predicted dilution is applied to the average effluent loading and the compliance flow rate of 14.75
m3/s to determine the instantaneous concentration representing the near field. This is added to the monthly
average ambient background concentration and monthly average far-field concentration to determine the
monthly average predicted concentrations to compare to long-term average WQGs.
6.3.2 Far-field Dilution
TetraTech Canada Inc. was engaged to employ their existing hydrodynamic model H3D of the Lower Fraser River
to simulate far-field mixing of the AIWWTP effluent through the proposed diffuser to provide input into:
Background buildup concentrations that are part of the predictions of concentrations at the edge of the IDZ
where background buildup represents typical tidal return flow concentrations for evaluating compliance with
maximum (95th percentile), and 30-d average (calendar month average) WQGs and FRWQOs, and
Concentrations at other far-field assessment points.
6.3.2.1 H3D Model Structure and Inputs
The details of the model’s structure and setup for the AIWWTP application are described in Appendix A,
Attachment G. Some key features of the H3D implementation are described below:
Bathymetry – The model used bank-to-bank bathymetry from 2012.
Model grid – A nominal grid of 50 m longitudinally (upstream-downstream) and 20 m laterally (across stream)
was used. The model has nominal 1.5 m thick layers, resulting in 9-12 active layers in most locations in the
model depending on the tide.
Upstream boundary – River flow as recorded at Hope, augmented with Harrison River flows, was used as
the upstream boundary condition.
Downstream boundary – TetraTech’s 1-km resolution Strait of Georgia-Juan de Fuca Strait model was used
to establish the downstream boundary conditions using predictions for water level, temperature and salinity
at Sands Head.
Time step – A nominal 6-second timestep was used in the H3D model.
Near-field Inputs – The initial dilution model UM3 was used at each timestep to represent the location of the
end of the initial mixing for each of the 18 diffuser ports. The diffuser configuration is as shown in Figure 3.
The mass, temperature and salinity associated with the discharge at 2xADWF (the compliance flow of
14.75 m3/s, which was held constant through the year-long simulation) was then added to the appropriate
grid cell in H3D representing the end of individual mixing from each of the 18 ports of the diffuser.
Parameter type – Both a conservative and first-order decay parameter were simulated. The first-order decay
parameter used a US EPA algorithm represent the decay of bacteria in ambient waters.
STAGE 2 ENVIRONMENTAL IMPACT STUDY
12 March 2018 Report No. 1525010-119-R-Rev0 53
The near-field to far-field coupling described above has limitations. To date, no single hydrodynamic model has
been able to simultaneously represent the turbulence of the initial mixing process as well as the general, large-
scale circulation typifying the receiving environment. Consequently, various model approximations are required to
provide a practical estimate of the performance of a new diffuser. In this case, the near-field model, UM3, does
not function well when limited by the proximity to the bottom or water surface; that is its numerically-modelled
plume diameter expands faster than it would in the real world. In the real world, and if the plume were not restrained
by top and bottom boundaries, the plume diameter would grow at a rate governed by entrainment processes and
by the plume diameter, which determines the area available for entrainment. Since the UM3 implementation in
H3D does not adjust the amount of surface available for entrainment, allowing it to be overestimated, the plume
acquires the ambient velocity quicker that it would in the real world. Thus, the UM3 plume does not travel as far
before it releases its effluent to the H3D model as it would in reality, likely resulting in higher modelled
concentrations of effluent. For this reason, effluent momentum (Figure 4) may continue across the river farther
than UM3 simulates, particularly when ambient currents are low. The boundary issues in UM3 are implemented in
the H3D model coupling by only using UM3 to determine the location to insert mass into the three-dimensional
model and thus constraining the modelled plume expansion, as discussed above. The overestimate of effluent
concentration will be greatest when ambient velocities are small, such as at low flow, high tide slack conditions.
The UM3-H3D coupling provides reasonable results at distance from the diffuser (as one would expect from a far-
field model), but likely represents higher concentrations than are present at certain low velocity tidal conditions
both within the IDZ (where far-field models are not representative) and the region immediately adjacent to it.
6.3.2.2 H3D Results: Background Buildup
The background buildup concentration is associated with the presence of previously diluted effluent within the
Fraser River because of the tidal processes in the Fraser River. The background buildup concentration can be
considered as a steady-state average process wherein re-entrainment of previously discharge effluent occurs after
tidally reversing currents over many cycles. For the AIWWTP discharge, background buildup only needs to be
considered when the currents at the site are bidirectional.
The Annacis Island Wastewater Treatment Plant Pre-Discharge Monitoring Dilution/Dispersion Study (LWMP
Environmental Monitoring and Assessments Technical Committee, 1997) provides a description of the mixing
processes at the existing outfall based on analysis of a dye study conducted in the mid-1990s; the mixing
processes were found to vary with river velocity. When currents were moderate to high (e.g., flood/ebb periods of
tidal cycle), the effluent rapidly dispersed due to jet velocity and (temperature-driven only) buoyancy. Then vertical
diffusivity mixed the effluent field over the entire vertical section. When there was little current (e.g., slack tide
periods), the effluent field rose rapidly to the surface, where it spread slowly incorporating additional dilution
through gravitational spreading. Residual current (the net downstream flow when tides are removed) carried the
effluent field away from the discharge point. At the lower current velocities, the study concludes “there is little or no opportunity for previously discharged, diluted effluent to be re-entrained in the forming effluent field. The effect
of multiple dosing thus is not significant.” The study does not provide a conclusion about the effect of multiple dosings during moderate and high currents.
STAGE 2 ENVIRONMENTAL IMPACT STUDY
12 March 2018 Report No. 1525010-119-R-Rev0 54
Previous initial dilution studies of the AIWWTP discharge accounted for background buildup either through using
CORMIX’s tidal reversal conditions to account for transient recirculation and re-entrainment of the discharge plume
remaining from the previous tidal cycle (Seaconsult 1995) or using a far-field model (RMA) to obtain a 14-day
average of the background buildup (Black and Veatch 2015).
The present study includes consideration of background buildup for the following reasons.
Dye study data confirm that the effluent field can be found throughout the water column, which will be located
upriver of the outfall during flooding tides; thus, the return flow during ebbing tide has the potential to return
a portion of the effluent field in the entrainment water used for dilution during ebbing tides.
The diffuser design being evaluated discharges horizontally and not vertically, and this will result in altered
mixing dynamics versus that observed in the dye study; horizontally discharging ports improve instantaneous
dilution over vertical ports, and should minimize, if not avoid, the expression of the rising plume as boils on
the river’s surface. Further, the singular direction of the ports will push the plume to the middle of the river
and the river flow being entrained into newly discharging effluent will come from behind the diffuser.
The presence of background buildup in the Fraser River will reduce the available potential dilution at the edge of
the IDZ.
Using the results of the year-long simulation of the H3D model, a depth-averaged, year-long time history of dilution
is calculated for a conservative contaminant assuming a constant effluent flow of 14.75 m3/s. The dilution time-
series is based on an H3D model node located approximately in the center of the Fraser River and 1 km
downstream of the proposed diffuser location. Based on initial model test runs, this distance seemed adequate in
allowing for far-field processes to mix the plume without any direct impact of near-field processes from the coupling
location of the UM3-H3D near-field to far-field model, but was close enough to the proposed diffuser location that
the plume could wash back over itself near the diffuser during periods of reversing tidal conditions.
A cumulative frequency distribution (CFD) of the depth-averaged dilution was developed, and the 5% exceedance
value was selected to represent the risk of background buildup for maximum WQGs. The 5% exceedance
background buildup dilution is approximately 58:1. This background buildup dilution will be used for maximum
WQGs. Background buildup concentrations are only considered when bidirectional flow in the Fraser River flow
exists (i.e., when Qa < 6,000 m3/s).
For long-term average endpoints, a CFD was developed for each of the monthly instantaneous background buildup
dilutions at the same H3D model node, and the 50% exceedance value was used to develop estimates of
background buildup monthly and listed in Table 6-1. This background buildup dilution is used for WQGs with
long-term average endpoints.

STAGE 2 ENVIRONMENTAL IMPACT STUDY
12 March 2018 Report No. 1525010-119-R-Rev0 55
Table 6-1. Monthly Background Buildup Dilution for Use in Long-term Average Assessments
Month Monthly Average Background Buildup Dilution
January 160:1
February 137:1
March 158:1
April 317:1
May 772:1
June 932:1
July 726:1
August 354:1
September 277:1
October 244:1
November 191:1
December 175:1
6.3.2.3 H3D Results: Concentrations at Far-Field Assessment Nodes
The H3D model was used to predict concentrations of effluent COPCs at five far-field assessment node locations
in the project Study Area (Figure 2). From the year-long H3D simulation, time histories were developed at these
locations for every model layer at a 15-minute step. Using a unit concentration at the discharge point, to determine
short-term effects, a water column average, 24-h daily average time-series was developed for each node. The 5th
percentile dilution was calculated for a conservative and non-conservative pollutant. To determine long-term
effects, a water column average, calendar monthly average time-series was also developed for both types of
pollutants at each of the nodes of interest. This information is used in the Stage 2 EIS assessment in Section 7.
6.3.2.4 H3D Results: Behavior of the Effluent Plume in the Far Field
In addition to evaluating concentrations at far-field assessment nodes in the impact assessment (Section 7.0),
concentrations and corresponding dilutions at cross-river transects near the discharge location were created to
demonstrate transport of the effluent in the Fraser River throughout a year. Figure 5 depicts the transect locations
denoted by the row number in the H3D model where data in Figures 6-8 are displayed; the transects are located
relative to the ends of the diffuser 200 m upstream, 200 m downstream, 500 m downstream and 1,000 m
downstream.
The model data was processed for different timeframes: water column average hourly, running 24-h average, and
running 30-d average. The data was processed by taking the water column average concentration over either an
hour, 24-h, or 30-d for each model node (purple dots in Figure 5, which were spaced nominally at 20 m), and then
the maximum value along the transect was selected for data display. Figures 6 through 8 shows the maximum
value for the appropriate time averaging period (hourly, 24-h and 30-d, respectively), along with the Fraser River
flow at Hope for 2013, and the lines representing a 10:1 and 20:1 dilution of the effluent.
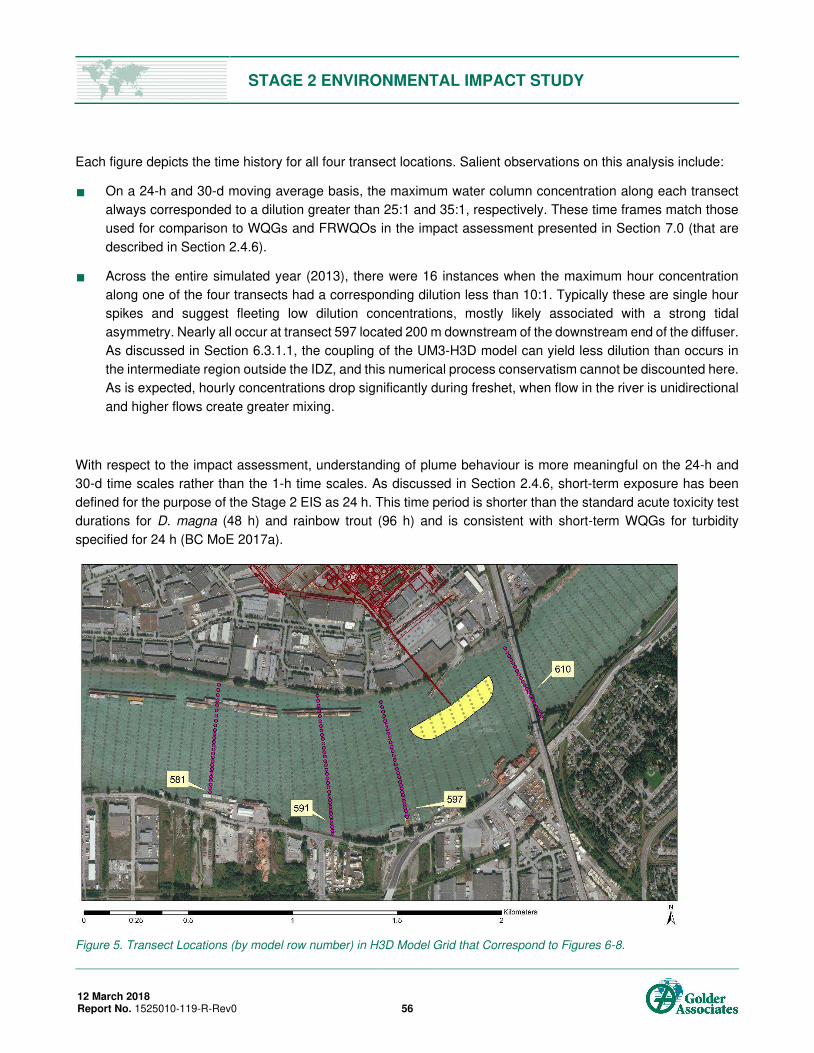
STAGE 2 ENVIRONMENTAL IMPACT STUDY
12 March 2018 Report No. 1525010-119-R-Rev0 56
Each figure depicts the time history for all four transect locations. Salient observations on this analysis include:
On a 24-h and 30-d moving average basis, the maximum water column concentration along each transect
always corresponded to a dilution greater than 25:1 and 35:1, respectively. These time frames match those
used for comparison to WQGs and FRWQOs in the impact assessment presented in Section 7.0 (that are
described in Section 2.4.6).
Across the entire simulated year (2013), there were 16 instances when the maximum hour concentration
along one of the four transects had a corresponding dilution less than 10:1. Typically these are single hour
spikes and suggest fleeting low dilution concentrations, mostly likely associated with a strong tidal
asymmetry. Nearly all occur at transect 597 located 200 m downstream of the downstream end of the diffuser.
As discussed in Section 6.3.1.1, the coupling of the UM3-H3D model can yield less dilution than occurs in
the intermediate region outside the IDZ, and this numerical process conservatism cannot be discounted here.
As is expected, hourly concentrations drop significantly during freshet, when flow in the river is unidirectional
and higher flows create greater mixing.
With respect to the impact assessment, understanding of plume behaviour is more meaningful on the 24-h and
30-d time scales rather than the 1-h time scales. As discussed in Section 2.4.6, short-term exposure has been
defined for the purpose of the Stage 2 EIS as 24 h. This time period is shorter than the standard acute toxicity test
durations for D. magna (48 h) and rainbow trout (96 h) and is consistent with short-term WQGs for turbidity
specified for 24 h (BC MoE 2017a).
Figure 5. Transect Locations (by model row number) in H3D Model Grid that Correspond to Figures 6-8.
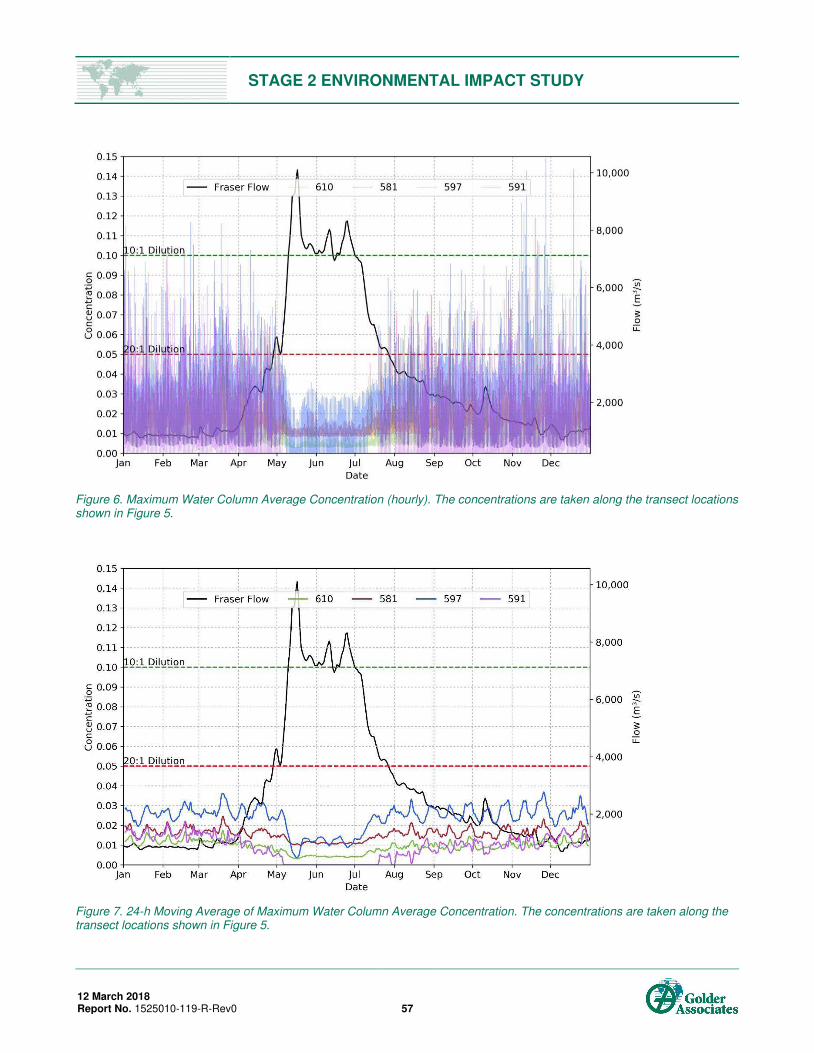
STAGE 2 ENVIRONMENTAL IMPACT STUDY
12 March 2018 Report No. 1525010-119-R-Rev0 57
Figure 6. Maximum Water Column Average Concentration (hourly). The concentrations are taken along the transect locations shown in Figure 5.
Figure 7. 24-h Moving Average of Maximum Water Column Average Concentration. The concentrations are taken along the transect locations shown in Figure 5.

STAGE 2 ENVIRONMENTAL IMPACT STUDY
12 March 2018 Report No. 1525010-119-R-Rev0 58
Figure 8. 30-d Moving Average of Maximum Water Column Average Concentration. The concentrations are taken along the transect locations shown in Figure 5.
6.3.3 Instantaneous Dilution in the Near-field
Instantaneous dilution at the edge of the IDZ was determined using either the revised Shrivastava-Adams equation
(Appendix A; Section 6.2.2) when river conditions were unstratified or the CORMIX2 program (Jirka et al. 1996)
for stratified conditions.
For constituents with short-term maximum WQGs, instantaneous dilution was determined for 64 individual model
runs using the effluent compliance flow of 14.75 m3/s (2xADWF) and a range of constituents for water depth,
effluent-ambient temperature difference, current speed, and presence/magnitude of stratification to represent the
spectrum of ambient river conditions as shown in Table 6-2.
Table 6-2: Number of Monthly Effluent and Ambient Model Input Parameters
Fraser River Flow Classification Water
Depths Effluent Flows
Current Speed
Temperature Difference
Density Profile
High flow: Current unidirectional Qa ≥6,000 m3/s 2 1 4 1 1
Moderate flow: Current bidirectional 6,000 m3/s > Qa ≥2,000 m3/s
2 1 4 1 1
Low flow: Current bidirectional 2,000 m3/s > Qa ≥1,500 m3/s
Weak stratification possible at high tide only 2 1 4 1 2
Lower flow: Current bidirectional 1,500 m3/s > Qa ≥800 m3/s
Moderate stratification possible at high tide only 2 1 4 1 2
Lowest flow: Current bidirectional; Qa <800 m3/s
Strong salinity possible at high tide, lesser strength at low tide
2 1 4 1 3
STAGE 2 ENVIRONMENTAL IMPACT STUDY
12 March 2018 Report No. 1525010-119-R-Rev0 59
Representative values for each parameter in Table 6-2 were selected and the percent of time the value occurs
was assigned (details of these values and percentages are described in Appendix A). The joint probability of the
predicted dilution was calculated from the probabilities of each parameter in Table 6-2. Section 6.3.4 presents the
method for calculating mass loads from effluent data, which were combined with the distribution of dilutions to
predict the instantaneous dilution component of the IDZ concentration.
For constituents with long-term average WQGs, the available data were used to develop monthly average values
for each model input parameter to permit calculation of dilution on a monthly basis. For months when salinity can
be present, two simulations (stratified and unstratified) were performed and then combined based on the
probability of salinity being present. The monthly predicted dilution was then applied to the average effluent mass
load to determine the instantaneous component of the concentration at the edge of the IDZ.
6.3.4 Calculating Mass Loads from Effluent Sampling Data
Near-field concentrations were calculated on a mass loading basis to preserve the independence of all constituents
used to calculate CIDZ. Mass loads were statistically developed and divided by entrained fluxes, developed from
the near-field model, to yield near-concentrations. The methodology and statistical rational used to develop the
mass loads and from them the near-field concentrations is discussed below.
Section 4.4 of Appendix A describes the available effluent quality data. Effluent daily mass loads were calculated
as the product of the sampling concentrations and the estimated Stage V average daily effluent flow rate on the
day of sampling. Stage V flows were determined using the actual flow on the day and translating them to Stage V
flows using the relationship presented in Section 6.2. The daily mass loads for each constituent were then fit to
one of three continuous statistical distributions:
Normal
Unbounded Johnson
Bounded Johnson
Johnson distributions were considered to account for observed skewness (a measure of a distribution’s asymmetry) and kurtosis (a measure of the weight of a distribution’s tails relative to the whole) in daily load datasets. Both the bounded and unbounded Johnson distributions are transformations of the normal distribution,
and can account for nearly any skewness and kurtosis.
Some constituents were deemed unsuitable for Johnson distribution fitting due to either low sample counts or a
high percent of non-detected values and were consequently assumed to be normally distributed. Because
algorithmically fitting loads to a Johnson distribution would account for some skewness and kurtosis in the data, it
is important to have a high level of confidence in those data characteristics. If, for example, a constituent is 100%
non-detect, there is typically no variation in the data since the only value measured is that of the detection limit
(some constituents have multiple detection limits). However, when the concentrations are converted to loads
based on the average daily effluent flow rate on the date of sampling, variation in the loads arises due to the
variation in those daily flow rates. Because such flow induced variation in loads cannot be confirmed as real, due
to the uncertainty of the concentrations, we cannot be confident in any skewness or kurtosis it may exhibit. If a
STAGE 2 ENVIRONMENTAL IMPACT STUDY
12 March 2018 Report No. 1525010-119-R-Rev0 60
constituent was greater than 50% non-detect values, its loads were fit to a normal distribution since we could only
be confident in less than 50% of the variation in the loads. Additionally, if a constituent had less than 10 samples
total, the loads were assumed to be normally distributed due to the limitations of Johnson distribution fitting
algorithms with small datasets.
Percentile mass loads were calculated for each constituent using the percent point function (ppf) of the selected
distribution with the best-fit constituents produced by the fitting algorithms.
M = ξ + [( + e− z− ⁄ )− ∗ ] Bounded Johnson Distribution ppf (8) M = ξ + [sinh z− ∗ ] Unbounded Johnson Distribution ppf (9) M = + z ∗ σ Normal Distribution ppf (10)
Where: ξ = Johnson location parameter
λ = Johnson scale parameter
δ = Johnson shape parameter
γ = Johnson shape parameter
μ = Arithmetic mean
σ = Standard deviation
z = Standard normal variable (z-score)
100 mass loads were calculated for each constituent each with an occurrence probability of 0.01. The mass loads
for constituents using a Johnson distribution were inspected to ensure the loads were reasonable and in agreement
with engineering judgment.
6.3.5 Temperature and Ammonia
6.3.5.1 Comparison of the Effect of Effluent Temperature on Ambient Water Temperature
A separate analysis was conducted to assess the BC WQG for temperature protective of aquatic life that limits the
temperature change to a +/- 1°C temperature variation at any time, location, or depth in marine and estuarine
waters. A conservative analysis was undertaken to evaluate this guideline using the minimum dilutions associated
with each Fraser River flow classification using contemporaneous 2011-2015 data on effluent temperature and
ambient river temperature measured at the Gravesend Reach buoy. The difference in temperature was then
divided by the 5th percentile (low) dilution.
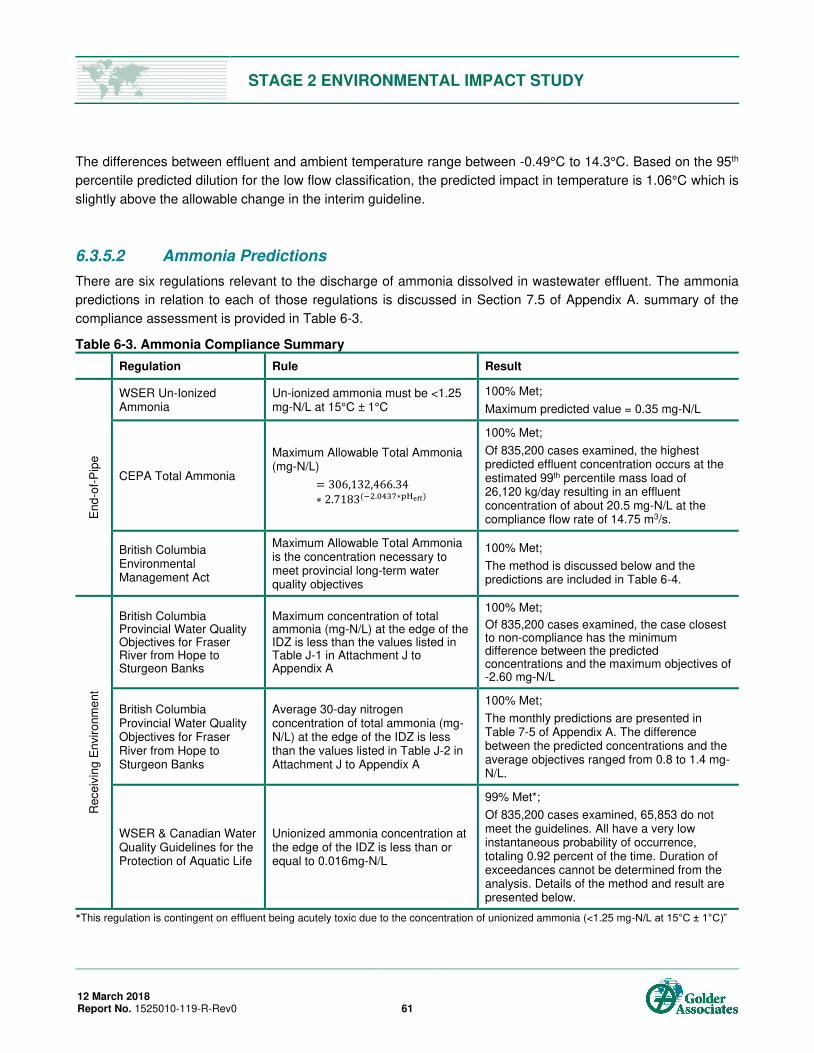
STAGE 2 ENVIRONMENTAL IMPACT STUDY
12 March 2018 Report No. 1525010-119-R-Rev0 61
The differences between effluent and ambient temperature range between -0.49°C to 14.3°C. Based on the 95th
percentile predicted dilution for the low flow classification, the predicted impact in temperature is 1.06°C which is
slightly above the allowable change in the interim guideline.
6.3.5.2 Ammonia Predictions
There are six regulations relevant to the discharge of ammonia dissolved in wastewater effluent. The ammonia
predictions in relation to each of those regulations is discussed in Section 7.5 of Appendix A. summary of the
compliance assessment is provided in Table 6-3.
Table 6-3. Ammonia Compliance Summary
Regulation Rule Result
End-o
f-P
ipe
WSER Un-Ionized Ammonia
Un-ionized ammonia must be <1.25 mg-N/L at 15°C ± 1°C
100% Met;
Maximum predicted value = 0.35 mg-N/L
CEPA Total Ammonia
Maximum Allowable Total Ammonia (mg-N/L) = , , .∗ . − . 7∗p
100% Met;
Of 835,200 cases examined, the highest predicted effluent concentration occurs at the estimated 99th percentile mass load of 26,120 kg/day resulting in an effluent concentration of about 20.5 mg-N/L at the compliance flow rate of 14.75 m3/s.
British Columbia Environmental Management Act
Maximum Allowable Total Ammonia is the concentration necessary to meet provincial long-term water quality objectives
100% Met;
The method is discussed below and the predictions are included in Table 6-4.
Receiv
ing E
nvir
onm
ent
British Columbia Provincial Water Quality Objectives for Fraser River from Hope to Sturgeon Banks
Maximum concentration of total ammonia (mg-N/L) at the edge of the IDZ is less than the values listed in Table J-1 in Attachment J to Appendix A
100% Met;
Of 835,200 cases examined, the case closest to non-compliance has the minimum difference between the predicted concentrations and the maximum objectives of -2.60 mg-N/L
British Columbia Provincial Water Quality Objectives for Fraser River from Hope to Sturgeon Banks
Average 30-day nitrogen concentration of total ammonia (mg-N/L) at the edge of the IDZ is less than the values listed in Table J-2 in Attachment J to Appendix A
100% Met;
The monthly predictions are presented in Table 7-5 of Appendix A. The difference between the predicted concentrations and the average objectives ranged from 0.8 to 1.4 mg-N/L.
WSER & Canadian Water Quality Guidelines for the Protection of Aquatic Life
Unionized ammonia concentration at the edge of the IDZ is less than or equal to 0.016mg-N/L
99% Met*;
Of 835,200 cases examined, 65,853 do not meet the guidelines. All have a very low instantaneous probability of occurrence, totaling 0.92 percent of the time. Duration of exceedances cannot be determined from the analysis. Details of the method and result are presented below.
*This regulation is contingent on effluent being acutely toxic due to the concentration of unionized ammonia (<1.25 mg-N/L at 15°C ± 1°C)”

STAGE 2 ENVIRONMENTAL IMPACT STUDY
12 March 2018 Report No. 1525010-119-R-Rev0 62
Back-Calculated Maximum Allowable Monthly Limits
As described in Section 5.3.2, this EIS has been prepared following the MWR and associated guidance from BC
MELP (2000). Both the MWR and BC MELP (2000) specify that a maximum allowable limit for total ammonia
should be calculated to meet the Environmental Quality Objective for total ammonia at the edge of the IDZ (i.e.,
the BC WQG for total ammonia). The following is a summary of the procedure used to calculate maximum
allowable limits for total ammonia (by month).
Because the MWR references the provincial long-term average WQGs, the back calculation was done on an
average monthly basis. For each month, the ammonia guideline was calculated using the blending pH and
temperature at the edge of the IDZ. The effluent concentration necessary to achieve each month’s guideline was calculated by solving the initial dilution equation (Section 6.3.1) for effluent concentration. Table 6-4 shows the
predicted monthly average effluent ammonia concentrations, the guideline at the edge of the IDZ, and the
corresponding maximum allowable effluent concentration. The maximum allowable effluent ammonia limit is
always well higher than the predicted effluent concentration. It should be noted that effluent concentrations are
low compared to historical data due to nature of a mass loading based analysis. Because the 2xADWF compliance
flow rate of 14.75 m3/s is in the 96th percentile of Stage V effluent flow (Figure 6-8 of Appendix A), ammonia mass
loads are diluted more than they would be for most other flow rates.
Table 6-4. Predicted Monthly Average Effluent Ammonia Concentrations
Month
Monthly Average
Near-Field Dilution
Monthly Average Blended
Temperature (C)
Monthly Average Blended
pH
Provincial Long-term Average Total
Ammonia Guideline at Edge-
of-IDZ (mg-N/L)
Future Predicted
Effluent Total Ammonia
Concentration (mg-N/L)
Back Calculated Maximum
Allowable Effluent Concentration
(mg-N/L)
January 28.4 3.45 7.45 1.99 15.50 46.65
February 30.0 4.02 7.51 1.97 16.15 47.15
March 31.4 5.27 7.57 1.94 15.98 49.55
April 32.2 7.37 7.62 1.90 16.43 54.20
May 36.8 10.51 7.62 1.85 16.37 63.23
June 37.7 13.28 7.69 1.81 15.94 63.84
July 35.3 16.82 7.63 1.56 14.90 51.03
August 32.5 19.28 7.67 1.31 14.35 37.61
September 31.8 16.65 7.62 1.58 14.83 43.79
October 32.0 11.94 7.60 1.82 15.12 50.16
November 31.7 7.20 7.43 1.90 15.44 50.24
December 30.0 4.24 7.42 1.97 15.64 49.04
WSER Receiving Water Unionized Ammonia
The WSER indicates that if “effluent deposited via its final discharge point is acutely lethal because of the concentration of unionized ammonia”, the discharger may apply to receive temporary authorization to continue discharging given that un-ionized ammonia “at any point that is 100 m from the point of entry where effluent is
deposited in that water via the final discharge point is less than or equal to 0.016 mg/L, expressed as nitrogen
(N)”. Compliance was assessed by calculating the effluent unionized ammonia concentration according to Section
14 of the WSER, which is summarized in the WSER end-of-pipe regulation in Table 1; if the effluent unionized
ammonia concentration is greater than 1.25 mg-N/L, effluent acute toxicity can be attributed to unionized ammonia
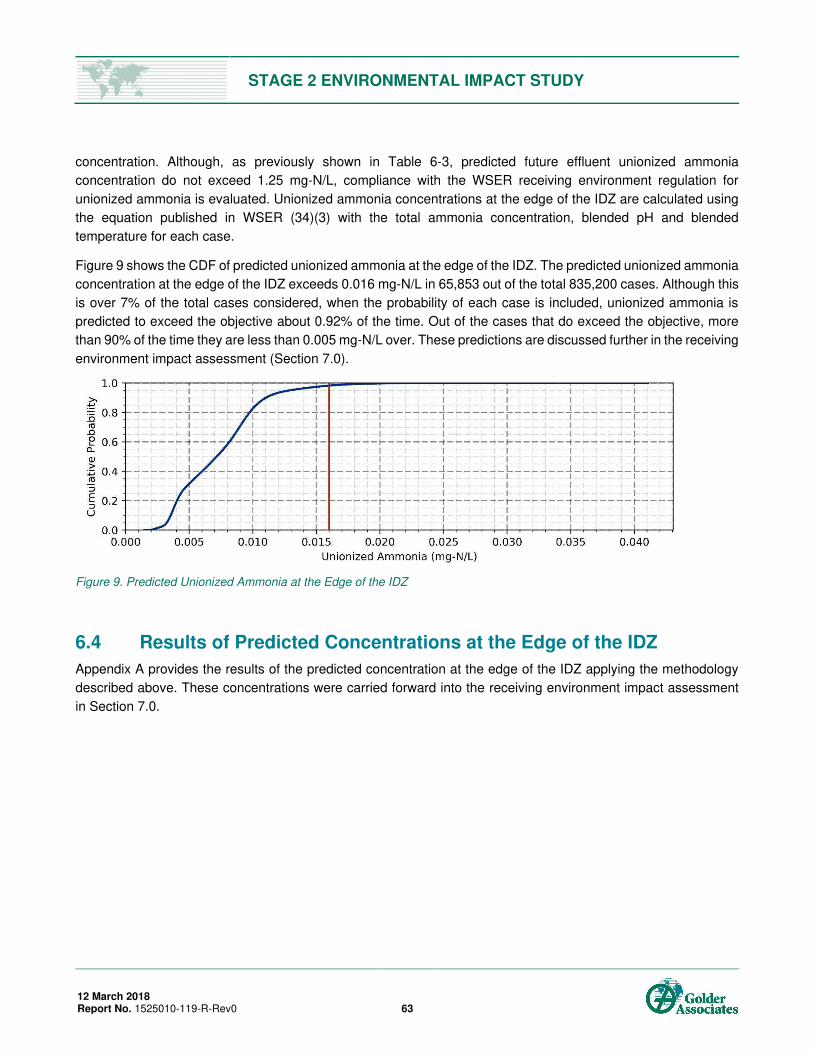
STAGE 2 ENVIRONMENTAL IMPACT STUDY
12 March 2018 Report No. 1525010-119-R-Rev0 63
concentration. Although, as previously shown in Table 6-3, predicted future effluent unionized ammonia
concentration do not exceed 1.25 mg-N/L, compliance with the WSER receiving environment regulation for
unionized ammonia is evaluated. Unionized ammonia concentrations at the edge of the IDZ are calculated using
the equation published in WSER (34)(3) with the total ammonia concentration, blended pH and blended
temperature for each case.
Figure 9 shows the CDF of predicted unionized ammonia at the edge of the IDZ. The predicted unionized ammonia
concentration at the edge of the IDZ exceeds 0.016 mg-N/L in 65,853 out of the total 835,200 cases. Although this
is over 7% of the total cases considered, when the probability of each case is included, unionized ammonia is
predicted to exceed the objective about 0.92% of the time. Out of the cases that do exceed the objective, more
than 90% of the time they are less than 0.005 mg-N/L over. These predictions are discussed further in the receiving
environment impact assessment (Section 7.0).
Figure 9. Predicted Unionized Ammonia at the Edge of the IDZ
6.4 Results of Predicted Concentrations at the Edge of the IDZ
Appendix A provides the results of the predicted concentration at the edge of the IDZ applying the methodology
described above. These concentrations were carried forward into the receiving environment impact assessment
in Section 7.0.
STAGE 2 ENVIRONMENTAL IMPACT STUDY
12 March 2018 Report No. 1525010-119-R-Rev0 64
7.0 RECEIVING ENVIRONMENT IMPACT ASSESSMENT
The receiving environment impact assessment considered water quality predictions at the edge of the IDZ (near-
field; Section 7.2) and at far-field nodes shown on Figure 2 (Section 4.0). The potential for adverse effects on
ecological and public health and agricultural uses as a result of the proposed effluent discharge was evaluated by
comparing predicted 95th percentile (or maximum) short-term (24-h average) and long-term (monthly average)
water quality against applicable FRWQOs and WQGs and ambient river concentrations as described in
Section 7.1.
Constituents that exceeded applicable screening criteria and ambient river concentrations at the edge of the IDZ
were identified as preliminary near-field COPCs. Preliminary near-field COPCs were further evaluated by
comparing predicted concentrations to measured concentrations at the edge of the IDZ for the currently approved
AIWWTP discharge. This comparison was undertaken to evaluate if there was an expected incremental increase
in IDZ concentrations due to the Stage V upgrade. Available toxicological information was also reviewed for
preliminary COPCs to evaluate the potential for adverse effects on ecological and public health from the predicted
Stage V IDZ concentrations. Concentrations of near-field COPCs were predicted at the far-field assessment nodes
and screened against applicable FRWQOs and WQGs and ambient river concentrations (Section 7.4). The
potential for nutrient enrichment in the Study Area was evaluated separately, taking into consideration receiving
environment characteristics and nutrient loadings to the receiving environment (Section 5.4).
The approach taken for this impact assessment addressed guidance provided in BC MELP (2000) and a
requirement of the MWR to evaluate whether the proposed hydraulic upgrade to the existing AIWWTP discharge
will result in adverse effects to public or ecological health (BC MELP 2000). Guidance provided by the CCME
Strategy (CCME 2008) further recommends that dilution should not be allowed for persistent, bioaccumulative and
toxic constituents (PBTs) and that conditions within a mixing zone should not result in the bioconcentration of
constituents to levels that are harmful to human health or ecological health. For this assessment, PBT constituents
were identified and evaluated to determine the potential for adverse effects to people and wildlife consuming fish
from the Fraser River (7.4).
7.1 Methods
7.1.1 Data Sources
The receiving environment impact assessment relied on measured and predicted water quality information from
the following sources:
Ambient, effluent, and IDZ concentrations previously measured as part of AIWWTP effluent monitoring by
MV, the REM program, the FRAMP water quality program, and the federal water quality monitoring program
(Section 2.2.2 and Appendices A and B).
Water quality statistics for the ambient river concentrations derived by Golder (Appendix B).
Water quality statistics for the effluent concentrations derived by CDM Smith (Appendix A).
Water quality statistics at the edge of the near-field IDZ for the currently approved AIWWTP discharge
calculated by Golder from measured concentrations (Appendix E).
STAGE 2 ENVIRONMENTAL IMPACT STUDY
12 March 2018 Report No. 1525010-119-R-Rev0 65
Predicted water quality at the edge of the near-field IDZ derived by CDM Smith for an effluent flow 2xADWF
(Appendix A).
Predicted water quality at far-field assessment nodes derived by CDM Smith (Appendix A).
7.1.2 Data Review
The impact assessment relied on the quality assurance and quality control (QA/QC) programs of the source
authors, which can be found in the original sources. Notwithstanding reliance on the original data sources, data
quality was reviewed for ambient, effluent, and IDZ concentrations of a subset of organic constituents that can be
challenging to measure in water. Constituents that received a supplemental review of data quality were total PCBs,
PBDE-47, PBDE-99, PBDE-100, alpha-endosulphan, hexachlorobenzene, hexachlorobutadiene, alpha-
chlordane, and EE2.
The following sources of data quality uncertainty were identified in that review.
Detected Concentrations in Method Blanks, Field Blanks, and Trip Blanks
Method blanks, field blanks, and trip blanks are used as indicators of sources of contamination that could interfere
with data interpretation, i.e.
Method blanks are indicators of laboratory contamination.
Trip blanks are indicators of shipping (volatiles only) and laboratory contamination.
Field blanks are indicators of ambient sources of contamination during sampling and shipping (volatiles only)
in addition to laboratory contamination (US EPA 2009).
Method blanks were available for each of the samples reviewed, whereas trip and field blanks were only available
for some of the samples reviewed.
Available method blanks, trip blanks, and field blanks were above the method detection limit for most of the PCB
and PBDE samples reviewed, indicating the presence of contamination. Given the ubiquitous nature of PCBs and
PBDEs in natural environments, it is not surprising that they were detected in blanks; however, the magnitude of
detected concentrations can indicate elevated uncertainty in reported sample concentrations. For example, the
method blanks associated with measurements of the BDE-47, BDE-99, and BDE-100 from Winter 2013 were 3 to
25 times greater than the ambient and IDZ measured concentrations. Several IDZ and reference samples for total
PCBs, BDE-47, BDE-99, and BDE-100 collected from Winter 2014 and Winter 2016 were within five times the
method blanks, trip blanks, and/or field blanks, indicating that these samples are not distinguishable from the blank
concentrations (BC MoE 2013b).
In consideration of the findings of the data review, a high level of uncertainty was associated with the PCB and
PBDE effluent and river water data that was used to generate water quality predictions to be assessed in the
impact assessment.
STAGE 2 ENVIRONMENTAL IMPACT STUDY
12 March 2018 Report No. 1525010-119-R-Rev0 66
Variable Method Detection Limits
Most organic constituents in the ambient dataset (Appendix B) were below the method detection limit (MDL) in
100% of the samples collected and approximately one third of the organic constituents in the effluent dataset
(Appendix A) were 100% below the MDL.
For constituents that were 100% below the MDL, the impact assessment conservatively assumed that the
concentration was equal to the full MDL. For organic constituents, the MDL is often sample dependent and
therefore there is a range of MDLs for a given constituent. The MDL range spanned up to one order of magnitude
for PCBs, PBDEs, pesticides, and hormones and sterols. For example, EE2 was not detected in any effluent or
ambient sample. The ambient dataset for EE2 (n = 30) ranged from <0.37 to <3.1 ng/L and the effluent dataset (n
= 32) ranged from <2.4 to <49.9 ng/L. Unusually high MDLs in these datasets were identified as values greater
than 1.5 times the interquartile range (i.e., analogous to outlier data). Removing these unusually high MDLs, the
ambient dataset ranged from <0.37 to <1.7 ng/L and the effluent dataset ranged from <2.4 to <35.5 ng/L. The
resulting ambient and effluent EE2 MDLs were used in IDZ predictions.
7.1.3 Screening of Near-Field and Far-Field Predictions
The short and long-term predictions were generated as described in Section 6.3 for approximately 140 consituents.
In brief, the short term concentrations represents the upper-bound (i.e. 95th percentile or maximum) concentration
for a 24-h period and the monthly concentrations represent the central tendency (i.e. average or median)
concentration for a given month.
A stepwise screening approach was used to identify COPCs in the near field at the edge of the IDZ and at the
five far-field nodes for the short term and monthly concentrations as shown in Figure 10 and described further
below.
Step 1: Compare short-term and monthly water quality predictions at the edge of the IDZ against applicable
screening criteria identified in Section 2.4.6. Constituents with predicted concentrations above a screening
criterion were further evaluated to assess whether predicted concentrations reflected a potential Project-
related change in environmental quality relative to current ambient river concentrations.
Step 2: For constituents with predicted concentrations above a screening criterion, compare against the
ambient river concentration plus 20%. In consideration of temporal variability and variability in sampling and
laboratory methods, a predicted increase of less than 20% above the ambient river concentration was
considered unlikely to reflect a measurable and ecologically meaningful Project-related change in
environmental quality. A predicted difference of less than or equal to 20% is within the limits of precision
associated with water quality modelling and water quality monitoring. This screening criterion is consistent
with guidance in BC MoE (2013b), where a relative percent difference less than 20% between two duplicate
water quality values is not considered to indicate a distinguishable difference between the two values.
Constituents with predicted concentrations above a screening criterion and the ambient river concentration
were identified as preliminary COPCs. These preliminary COPCs were further evaluated to determine if
predicted concentrations reflected a Project-related increase relative to current IDZ water quality conditions.
STAGE 2 ENVIRONMENTAL IMPACT STUDY
12 March 2018 Report No. 1525010-119-R-Rev0 67
Step 3: Compare preliminary COPCs against the current IDZ concentration. Constituents with predicted
concentrations above a water quality screening criterion and ambient and current IDZ river concentrations
were identified as near-field COPCs.
Step 4: COPCs identified in the near-field were carried through to the far-field assessment where predicted
concentrations at far field nodes were compared to relevant water quality screening criteria.
Step 5: As in the near-field assessment, constituents with predicted concentrations above water quality
screening criteria were further evaluated by comparison against ambient river concentrations. Constituents
with concentrations above a water quality screening criterion and the ambient river concentration at one or
more far-field nodes were identified as far-field COPCs.
Exceeding a screening criterion does not necessarily indicate a potential for unacceptable impairment of water
uses, but rather that the potential for adverse effects and water use impairment might be increased and should be
investigated further. Near-field and far-field COPCs identified by the screening methodology described above were
retained for further evaluation to assess the potential for adverse effects to identified receiving environment water
uses (Sections 7.2.1 and 7.3.1) and public health (Sections 7.2.2 and 7.3.2).
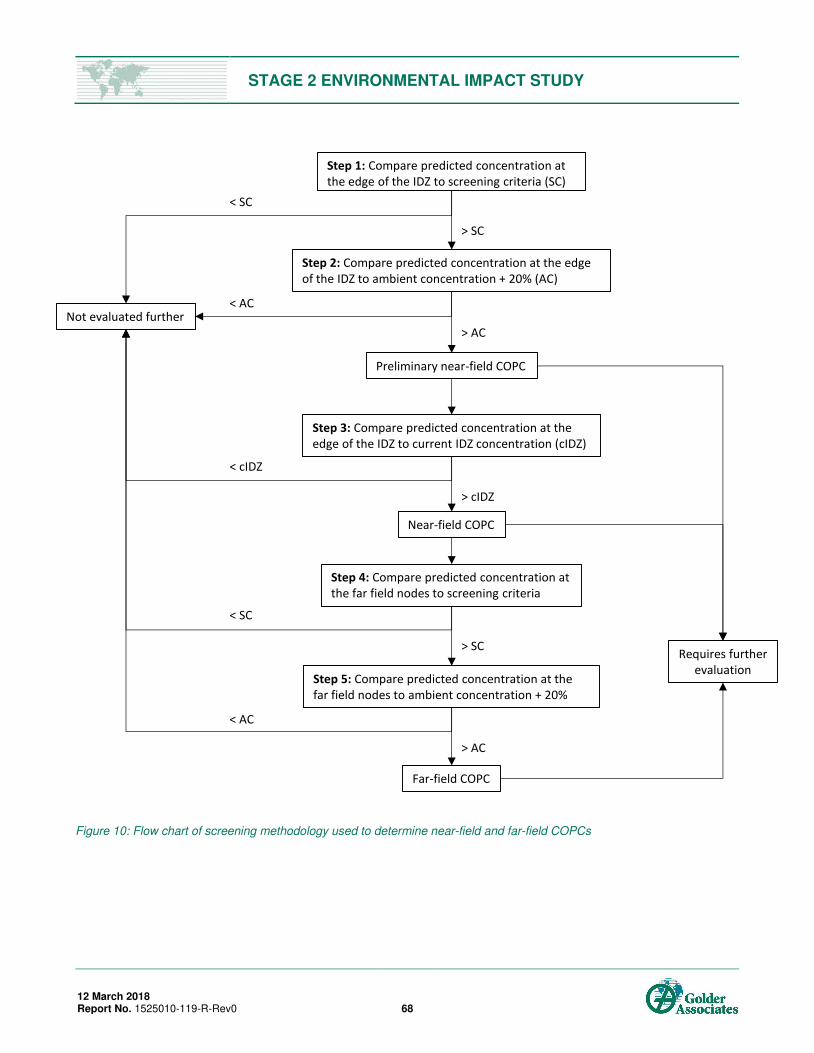
STAGE 2 ENVIRONMENTAL IMPACT STUDY
12 March 2018 Report No. 1525010-119-R-Rev0 68
Figure 10: Flow chart of screening methodology used to determine near-field and far-field COPCs
Step 2: Compare predicted concentration at the edge
of the IDZ to ambient concentration + 20% (AC)
Step 3: Compare predicted concentration at the
edge of the IDZ to current IDZ concentration (cIDZ)
Near-field COPC
Far-field COPC
Requires further
evaluation
Not evaluated further
Step 1: Compare predicted concentration at
the edge of the IDZ to screening criteria (SC)
> SC
< SC
> AC
< AC
> cIDZ
< cIDZ
Step 4: Compare predicted concentration at
the far field nodes to screening criteria
Step 5: Compare predicted concentration at the
far field nodes to ambient concentration + 20%
< SC
Preliminary near-field COPC
> SC
> AC
< AC
STAGE 2 ENVIRONMENTAL IMPACT STUDY
12 March 2018 Report No. 1525010-119-R-Rev0 69
7.1.4 Assessment of PBT Constituents
An evaluation of PBT constituents was undertaken to assess the potential for adverse effects on wildlife and people
consuming fish from the Fraser River in response to technical guidance provided by CCME (2008) for the CCME
Strategy. The PBT assessment included the following steps:
Identification of PBT constituents
Review of current and predicted future effluent concentrations
Assessment of the incremental change in water concentrations at the edge of the IDZ due to the Project by
comparing predicted IDZ water concentrations against current IDZ water concentrations
Review of uncertainty associated with analytical measurements of PBT constituents
7.2 Near-Field Assessment Results
Screening results of short-term and monthly concentrations predicted at the edge of the IDZ as described in
Section 6.0 are provided in Appendix E. The following subsections present screening of upper bound predicted
short-term and monthly average concentrations at the edge of the IDZ, to evaluate potential impacts on aquatic
life, wildlife, livestock and irrigation uses (Section 7.2.1) and public health (Section 7.2.2). The exception was
ammonia where a specific approach was taken in predicting total and un-ionized ammonia concentrations, as
described in Section 6.3.5.1, that considered blended pH and blended temperature for each of the 835,200
predicted cases. From this analysis, monthly total ammonia predictions were provided by CDM Smith (as
summarised in Appendix A) for inclusion in Appendix E Table E-3, however, short-term predicted concentrations
of total ammonia and the unionized ammonia predictions were directly referenced from the analysis of the 835,200
predicted cases by CDM Smith in Section 6.3.5.1 and Appendix A.
7.2.1 Aquatic Life, Wildlife, Livestock and Irrigation Uses
For most of the approximately 140 constituents, predicted short-term and monthly concentrations were below
applicable FRWQOs, BC WQGs, and CCME WQGs, and/or did not represent a measurable or ecologically
meaningful increment over ambient river concentrations (i.e., predicted concentrations were within 20% of current
upstream concentrations). Thus, for most of the constituents assessed in the EIS, the Project is not expected to
contribute to an incremental change in potential adverse effects to aquatic life or potential impairment of wildlife
and agriculture environmental uses (Appendix E, Tables E-1 to E-5). The relatively small number of constituents
that were identified as exceptions are discussed below. Inorganic constituents that do not have water quality
guidelines but are predicted to be greater than 20% over ambient river concentrations are also discussed below.
Constituents discussed below are: un-ionized ammonia; phosphorus; nitrogen; temperature; sodium; copper;
lithium; permethrin; total PCBs; EE2; and sterols. Predicted concentrations at the edge of the IDZ were compared
to current concentrations at the edge of the IDZ to characterize the predicted relative change in water quality due
to the Stage V upgrade. The current IDZ concentration represented water quality at the IDZ boundary under low
flow conditions because the characterization was based on data collected by the AIWWTP REM program that
sampled river water and effluent in late winter and late summer from 2012 to 2016.

STAGE 2 ENVIRONMENTAL IMPACT STUDY
12 March 2018 Report No. 1525010-119-R-Rev0 70
Nutrients and Conventional
Un-ionized Ammonia
The maximum un-ionized ammonia concentration at the edge of the IDZ of 0.041 mg-N/L predicted by CDM Smith
in Section 6.3.5.1, was above the CCME guideline of 0.016 mg-N/L by a factor of 2.5 and the current maximum
IDZ concentration of 0.025 mg-N/L by a factor of 1.6. The ammonia compliance summary undertaken by CDM
Smith in Appendix A and summarized in Table 6-3 indicates that exceedance of the CCME guideline was expected
to be infrequent, with predicted concentrations above the WQG occurring in less than 1% of the 835,200 modelled
cases.
Toxicity data summarized by Environment Canada (2001) and considered by CCME (2010) in the WQG derivation,
indicated that the maximum predicted un-ionized ammonia concentration of 0.041 mg-N/L would be associated
with potential chronic, sublethal effects (e.g., a 20% reduction in growth or reproduction) on the most sensitive 5%
of fish and invertebrate species. Due to the infrequent predicted occurrence of concentrations exceeding the
CCME short-term guideline (<1%), the relatively small percentage of fish and invertebrate species that would
potentially be affected (5%), and the associated low magnitude of potential effects (chronic, sublethal effects) it
was considered unlikely that maximum predicted concentrations of un-ionized ammonia would result in adverse
effects to aquatic life at the edge of the IDZ.
Total Phosphorus and Total Nitrogen
The BC nutrient WQG for rivers is an algal biomass-based BC WQG for streams of 100 mg/m2 chlorophyll a
(Nordin 1985). As discussed in Section 5.4.1, the unstable, soft bottom, sandy substrates characteristic of the
lower Fraser River are not suitable to support the establishment of benthic algal communities and thus no benthic
algal biomass data are available for these lower reaches. As a surrogate for screening purposes, predicted IDZ
concentrations were compared to the BC TP WQG that was derived to protect against eutrophication in lakes
(0.005-0.015 mg/L; Nordin 1985).
As discussed in Section 2.2.2, TP concentrations reported for the lower Fraser River were above the BC WQG
derived to protect against eutrophication in lakes, but these concentrations have not resulted in substantial algal
growth because of site-specific riverine conditions and the general lower sensitivity of rivers to phosphorus relative
to lakes (Nordin 1985, FRAP 1999a). Algal growth is primarily light limited in the lower Fraser River, particularly
during the growing season defined by Nordin (1985) that overlaps with high river flows and associated elevated
sediment transport downstream.
There is no total nitrogen (TN) WQG available in Canada. Monthly TN concentrations across all months were
lower than the mean TN concentration reported at the IDZ between 2012 and 2016. The same is true for predicted
TP concentrations during winter prior to the onset of early freshet in April and then after freshet in September. .
For the higher flow months from April to August it was more appropriate to compare to ambient concentrations
under higher flow conditions than to a low flow IDZ concentration. The mean predicted IDZ concentration was only
1.4 times the mean high flow phosphorus concentration measured upstream and approximately half the 95th
percentile upstream concentration. Given the variability in TP concentrations during freshet due to variability in
both aquatic and terrestrial inputs of particulate phosphorus during this time (Appendix B), the predicted IDZ
concentration was within the range of variability expected during freshet. As discussed in Section 5.4.1 -primary
productivity is primarily limited by the elevated sediment loadings in the river during freshet and reduced light
penetration through the water column.
STAGE 2 ENVIRONMENTAL IMPACT STUDY
12 March 2018 Report No. 1525010-119-R-Rev0 71
Monthly TN and TP predictions were the most relevant to the assessment of the potential for adverse effects on
aquatic life due to eutrophication because effects due to eutrophication are realized over longer time periods and
plant growth is influenced by conditions over the entire growing season (Environment Canada 2004). Actual effects
are likely best represented by the average concentration over the growing season from May to September however
for the purpose of this assessment, monthly predictions were assessed. Short-term flow-based predictions were
provided, but these are less relevant because they represent a time period of 24 hours instead of weeks or months.
Temperature
BC and CCME WQGs state that any change in water temperature should be within ±1°C from natural ambient
background in marine and estuarine waters (BC MoE 2017a, CCME 2016). These guidelines are intended to
maintain temperatures to which organisms have adapted through evolutionary processes (BC MoE 2017a).
Although many biological processes in marine and estuarine waters are sensitive to temperature changes, the
variability in exposure conditions experienced in these dynamic systems by biota means that a temperature
alteration of ±1°C is likely minor compared to overall variability in the system (CCME 1999). The exposure
environment in the lower Fraser River is similarly dynamic, influenced by tidal cycles, upstream intrusion of the
salt-wedge, and variable upstream freshwater flows.
At the edge of the IDZ, temperature was predicted to be within 1°C of the ambient background temperature for
199 out of 200 predicted cases (>99% of modelled cases) using matched effluent and ambient data from 2011 to
2016 (Section 6.3.5, Appendix A). For the one exception, a slight increase in temperature of 1.06°C was predicted
to occur in December. This temperature increase one day during the winter when temperatures were well below
the upper tolerance thresholds of resident fish species, was not expected to result in adverse effects to aquatic
life. For example, according to Levy (1992) and Oliver and Fidler (2001), the upper thermal tolerance (i.e., lethal
level) for juvenile and migrating adult salmonids was on the order of 21°C for the most sensitive species.
Sodium
There is no WQG for sodium in Canada. Maximum predicted concentrations of sodium were not distinguishable
from ambient concentrations with the exception of the short-term sodium concentration during high flows. Given
that sodium is a major ion incorporated into salinity and conductivity measurements, predicted concentrations of
these constituents were reviewed and salinity predictions were compared to the CCME WQG. There are no
exceedances of this guideline and predicted conductivity was within the range of concentrations found in the Fraser
River, which indicates negligible potential for adverse effects on aquatic life at the IDZ.
Metals
Predicted short-term concentrations of total and dissolved aluminum, iron, manganese, and nickel were above the
FRWQO or the lowest short-term WQG, but were not distinguishable from ambient river concentrations. Predicted
short-term concentrations of these constituents were therefore not evaluated further in the impact assessment.
Predicted monthly concentrations of dissolved and total aluminum, total chromium, copper, iron, and mercury were
greater than FRWQOs or the lowest long-term WQG but also were not distinguishable from ambient river
concentrations. Predicted monthly concentrations of these constituents were therefore not evaluated further in the
impact assessment.
STAGE 2 ENVIRONMENTAL IMPACT STUDY
12 March 2018 Report No. 1525010-119-R-Rev0 72
Predicted short-term and monthly lithium concentrations at the IDZ were greater than the ambient river
concentration, and no WQG is available for lithium in Canada. However, maximum predicted short-term and
monthly lithium concentrations were equal to or less than IDZ concentrations reported for the current discharge.
Therefore, no incremental change in concentrations at the IDZ or associated potential for adverse effects would
be predicted due to the Stage V upgrade and lithium was not evaluated further. An assessment of lithium would
also have been limited by paucity in toxicity information available for this metal.
Predicted short-term total copper concentrations were above the FRWQO under low flows and distinguishable
from the ambient concentration and current conditions at the IDZ. Therefore, predicted short-term total copper
concentrations were evaluated further.
Copper
The predicted short-term total copper concentration during low flow (3.4 µg/L) was 1.1 times the FRWQO and BC
WQG of 3 µg/L for estuarine/marine environments, but lower than the freshwater BC WQG for total copper of 12.7
µg/L that accounts for a predicted water hardness during low flow of 114 mg/L as CaCO3. Given that the AIWWTP
is located close to the upper extent of salt-water intrusion into the lower Fraser River, biota are only exposed
intermittently to estuarine conditions when the salt-wedge is present and are exposed to freshwater conditions
proportionally more of the time (Section 2.2, Appendix A). Therefore, the small exceedance of the estuarine/marine
WQG is not expected to reflect a potential for adverse effects to aquatic life in the Fraser River. As noted above,
predicted monthly copper concentrations at the IDZ were not distinguishable from ambient river conditions.
Notwithstanding this conclusion, total copper predictions were conservatively evaluated at the far-field nodes
(Section 7.3.1).
Organics
Predicted short-term concentrations of methoprene, deltamethrin, PCB 126, phenanthrene, pyrene, and aniline
were above the FRWQO or the lowest short-term WQG, but were not distinguishable from ambient river
concentrations and were not evaluated further. Maximum predicted monthly concentrations of endosulphan,
deltamethrin, phenanthrene, aniline, and EE2 were above the FRWQO or the lowest long-term WQG, but were
not distinguishable from ambient river concentrations and were not evaluated further.
Constituents identified for further evaluation were:
Permethrin. A short-term WQG is not available for permethrin. Predicted short-term permethrin
concentrations were above the long-term WQG and are more than 20% over ambient concentrations. Based
on this conservative screening, permethrin was evaluated further.
Total PCBs and EE2. Predicted total PCB concentrations were above the short-term BC WQG for all flows
but were not distinguishable from ambient river concentrations during moderate and high flows. Predicted
concentrations of total PCBs during low flows and EE2 during all flows were above the BC short-term WQG
and more than 20% over ambient water concentrations.
STAGE 2 ENVIRONMENTAL IMPACT STUDY
12 March 2018 Report No. 1525010-119-R-Rev0 73
Sterols. There are no WQGs for a number of sterols, including cholestanol, cholesterol, coprostanol,
desmosterol, and epicoprostanol; however, predicted short-term and monthly concentrations were above
ambient river concentrations. As mentioned in Section 5.1.10, a number of sterols originate from fecal matter
and are often associated with WWTPs. Given that FRAMP has reported an increase in sterols in the lower
Fraser River in recent years and EIS predictions were above ambient river concentrations, sterols were
carried forward for further evaluation.
Permethrin
Predicted short-term concentrations of permethrin ranged from 1.3 to 1.5 ng/L. Predicted short-term permethrin
concentrations were above the CCME long-term WQG of 1 ng/L, were more than 20% over ambient
concentrations, and were higher than the current IDZ concentration. However, the short-term predicted permethrin
concentrations were based on non-detect concentrations in effluent and the full detection limit was used in the
model; therefore, there is uncertainty in the predicted concentrations and they are likely an overestimate. The use
of the full detection limit in the model resulted in higher predicted IDZ concentrations compared to the current IDZ
concentration.
A summary of available acute toxicity data by CCME (2006) concluded that fish 96-h LC50 values ranged from
620 ng/L to 540,000 ng/L and invertebrate LC50 values ranged from 170 ng/L to 940,000 ng/L. The predicted short-
term concentrations of permethrin were below the lowest acute LC50 values for fish and invertebrates and so the
potential for adverse effects to aquatic life is considered to be negligible. Notwithstanding this conclusion,
permethrin was carried forward into the far-field assessment (Section 7.3.1).
Total PCBs
Predicted short-term concentrations of total PCBs ranged from 292 to 311 picograms per litre (pg/L), depending
on the flow scenario. Predicted total PCB concentrations were above the BC short-term WQG (100 pg/L) during
all flows but not distinguishable from ambient river concentrations during moderate and high flows. Total PCB
concentrations during low flows were above the BC short-term WQG and more than 20% over ambient water
concentrations, but below the current IDZ concentration of 377 pg/L. Therefore, no incremental change in
concentrations at the IDZ or associated potential for adverse effects would be predicted due to the Stage V
upgrade.
As mentioned in Section 7.1.2, there is high uncertainty in ambient, current IDZ, and predicted IDZ total PCB
concentrations due to concentrations detected in field and laboratory blank samples that indicated contamination
during sample collection and analysis. To address the noted uncertainty in the total PCB data, it is recommended
that consideration be given to the collection of additional effluent, ambient, and IDZ water sample data be collected
subject to a review of field sampling and laboratory analysis procedures.
STAGE 2 ENVIRONMENTAL IMPACT STUDY
12 March 2018 Report No. 1525010-119-R-Rev0 74
Hormones
17α-ethinyl-estradiol (EE2), a synthetic derivative of the natural hormone estradiol, is the only hormone for which
there is a regulatory guideline (BC WQG; BC MoE 2017a). Predicted short-term concentrations of EE2 ranged
from 2.3 to 2.4 ng/L. These values were above the short-term BC WQG (0.75 ng/L) and more than 20% over the
ambient river concentration (2.0 ng/L) but below the current IDZ concentration of 3.6 ng/L. Therefore, no
incremental change in concentrations at the IDZ or associated potential for adverse effects would be predicted
due to the Stage V upgrade.
Predicted EE2 concentrations also have elevated uncertainty because no detected concentrations of EE2
were available to inform predictions. EE2 predictions were based on non-detect values with a wide range of MDLs
(<2.4 to <35.5 ng/L in effluent; <0.37 to <1.7 ng/L in ambient data). Predicted short-term concentrations are
therefore expected to be overestimates of true concentrations. Using standard analytical methods for the EE2
analysis, commercial and government laboratories in Canada are not currently able to achieve MDLs lower than
the BC WQG. There are particular challenges for effluent samples with more complex matrices; M. Servos,
University of Waterloo, personal communication, 22 August 2016). Predicted short-term EE2 concentrations are
within the range of potential effects to aquatic life (Caldwell et al. 2008). However, it is not possible to evaluate the
potential for adverse effects of EE2 at this time due to the high uncertainty in the predicted concentrations.
Sterols
Predicted short-term concentrations of sterols (cholestanol, cholesterol, coprostanol, desmosterol, and
epicoprostanol), which do not have WQGs, were more than 20% over the ambient river concentrations but below
the current IDZ concentration. Therefore, no incremental change in concentrations at the IDZ or associated
potential for adverse effects would be predicted due to the Stage V upgrade.
7.2.2 Public Health
Predicted short-term and monthly concentrations at the edge of the IDZ were below the recreational screening
criterion or within 20% of ambient concentrations for most constituents, indicating that adverse effects of these
constituents on public health are not expected (Appendix E, Tables E-8 to E-10). The predicted short-term sodium
concentration during low flow was greater than the recreational screening criteria, but predicted concentrations
were not distinguishable from ambient river concentrations. Constituents that were above both the recreational
screening criterion and the ambient water concentration (where ambient water concentrations are available), or
inorganic constituents (i.e. conventional constituents, nutrients and metals) that do not have water quality
guidelines but were predicted to be greater than 20% over the ambient water concentration were considered to be
preliminary near-field COPCs. The preliminary near-field COPCs for public health include the following:
total residual chlorine
total nitrogen
TP
dissolved phosphorus (DP)
STAGE 2 ENVIRONMENTAL IMPACT STUDY
12 March 2018 Report No. 1525010-119-R-Rev0 75
EE2
cholestenol
cholesterol
coprostanol
desmosterol
epicoprostanol
Preliminary COPCs were carried forward for further evaluation and are discussed below. Predicted concentrations
at the edge of the IDZ were compared to current IDZ concentrations to characterize the expected change in water
quality due to the Project. Preliminary near-field COPCs with predicted water quality concentrations at the edge of
the IDZ that are greater than the current IDZ concentration were considered to be Project-related near-field
COPCs. Sterols were included as preliminary COPCs because they are increasing in the Fraser River, predictions
were above ambient river concentrations, and they are of particular interest to regulatory agencies.
Total Residual Chlorine
An active treatment system is in place to remove chlorine in the effluent prior to discharge such that the National
Performance Standard for TRC in municipal effluent is met (see Section 5.3.1). The effluent is also monitored and
the effluent database consists of 1100 TRC measurements that were all below the method detection limits of 0.02
to 0.1 mg/L. The short-term and monthly predicted TRC concentrations were based on non-detect concentrations
in this effluent database and the full detection limit was used in the model. As a result, there is uncertainty in the
predicted concentrations and they are likely an overestimate as they are based on method detection limits. Ambient
river and current IDZ data are not available for TRC.
Predicted short-term (0.0019 – 0.0028 mg/L) and monthly (November to March; 0.00062 – 0.00070 mg/L) IDZ
concentrations for TRC were above the selected recreational screening criterion (0.0006 mg/L; Table E-8). The
screening criterion for TRC is based on the US EPA RSLs for tap water. The US EPA tap water RSLs are risk-
based thresholds that are protective of ingestion of water, dermal contact, and inhalation of volatiles. As chlorine
is a volatile constituent, its RSL (0.6 µg/L after adjusting for an HQ of 0.2 and a factor of 10 for recreational use)
is largely driven by the inhalation pathway. However, the inhalation pathway considered for tap water is based on
exposure to chlorine vapour while showering. This pathway is not relevant for secondary contact recreational use
of the Fraser River which does not occur in an enclosed environment. The RSLs protective of ingestion of water
and dermal contact is more relevant to the site-specific scenario. The US EPA provides an RSL of 4 mg/L for
ingestion and 920 mg/L for dermal contact (after adjusting to HQ=0.2 and applying a factor of 10 for recreational
use).The maximum predicted concentration of TRC (0.0028 mg/L) is below the RSLs for both of these pathways.
In addition, Health Canada (1999) and the WHO (2006) guidance for safe swimming pool use have reported
acceptable levels of TRC in swimming pools in the 1 to 3 mg/L range, which indicates that the predicted TRC
concentrations are unlikely to be associated with adverse health effects. Therefore, short–term and monthly
predicted concentrations of TRC are not expected to pose a risk to human health in the near-field. Because there
were no ambient or current IDZ concentrations of TRC available, TRC was retained for evaluation in the far-field
assessment.
STAGE 2 ENVIRONMENTAL IMPACT STUDY
12 March 2018 Report No. 1525010-119-R-Rev0 76
Total Nitrogen
A recreational screening criterion for total nitrogen was not available; however, predicted short-term (1.3 – 2.0 mg-
N/L) and monthly concentrations (0.82 – 0.99 mg-N/L) were more than 20% over the ambient concentration. In
the absence of a screening criterion for TN, a surrogate screening values was selected. A health-based screening
criterion for ammonia was not available. In healthy individuals, ammonia is both produced and metabolized in the
body and levels in the human body typically exceed those found in drinking water (HC 2013). The Health Canada
drinking water guideline for ammonia is based on protection of the water supply against nitrification. The health-
based screening criterion for nitrate-nitrite is based on the protection of infants from methaemoglobinemia, a blood
disorder. Therefore, predicted short-term and monthly concentrations were compared against the recreational
screening criterion for nitrate as nitrate-nitrite. The predicted short-term and monthly concentrations are below the
nitrate (as nitrate-nitrite) screening criterion (10 mg-N/L). Current total nitrogen concentrations at the IDZ range
from 1.0 to 2.3 mg-N/L which are equal to or greater than the predicted total nitrogen concentrations that range
from 0.82 to 2.0 mg-N/L. Therefore, total nitrogen concentrations are remaining consistent or decreasing due to
the Project. Given that total nitrogen concentrations are predicted to be less than the nitrate (as nitrate-nitrite)
screening criterion and below the current IDZ concentrations, total nitrogen is not expected to pose a risk to human
health.
Total and Dissolved Phosphorus
Predicted short-term (during low and moderate flows) and monthly concentrations of TP were above the selected
recreational screening criterion (0.01 mg/L) and more than 20% over the ambient concentration. Predicted
concentrations of TP were also greater than the current IDZ concentration for the short-term moderate and high
flow scenarios and the monthly concentrations for April through August. Predicted short-term concentrations of TP
ranged from 0.18 to 0.42 milligrams of phosphorus per liter (mg-P/L) and monthly concentrations of TP ranged
from 0.075 to 0.14 mg-P/L.
A recreational screening criterion for DP is not available, therefore the screening criterion for TP was applied. The
predicted short-term and monthly concentrations of DP were above the TP screening criterion (0.01 mg/L) and
more than 20% over the ambient concentration. Current DP concentrations at the IDZ are not available. The
predicted short-term concentrations of DP ranged from 0.095 to 0.13 mg-P/L and monthly concentrations ranged
from 0.045 to 0.064 mg-P/L.
The recreational screening criterion for TP is based on an aesthetic objective specific to the protection of water
clarity in lakes (BC MoE 2001). There is no recreational screening criterion for TP for streams or rivers. The BC
WQG also provides a drinking water guideline for TP of 0.01 mg-P/L for lakes used as a source of drinking water.
The BC drinking water guideline is also an aesthetic objective which is intended to reduce taste and odour
associated with algae. Health-based screening criteria are not available. Excess phosphorus in lakes has been
shown to cause toxic algal blooms and therefore phosphorus is used as an indicator of potential algae problems.
However, no clear relationship between phosphorus and algal blooms exists for streams, therefore water quality
guidelines for phosphorus are not directly applicable to algae growth in streams and rivers. Direct measurements
of algae biomass are recommended for stream environments (BC MoE 2001). Given that the guideline for
phosphorus as an indicator of algae blooms is not applicable to streams (and therefore rivers) and there is no
health-based screening criteria for the effects of phosphorus, the predicted concentrations of total and dissolved
phosphorus are not expected to pose a risk to human health in the near-field. However, because predicted IDZ
concentrations of TP are higher than the current IDZ concentrations and there were no current IDZ concentrations
of DP, both total and dissolved phosphorus were retained for evaluation in the far-field assessment.
STAGE 2 ENVIRONMENTAL IMPACT STUDY
12 March 2018 Report No. 1525010-119-R-Rev0 77
Hormones
Recreational screening criteria are not available for EE2. Predicted short-term EE2 concentrations were more than
20% over the ambient concentration but less than current IDZ concentrations under all flow scenarios and seasons.
Therefore, no incremental change in concentrations at the IDZ would be predicted due to the Stage V upgrade.
Although screening criteria for EE2 are not available from the BC WQG, Health Canada, or US EPA, the Minnesota
Department of Health (MDH) recently released a health-based screening value of 0.5 ng/L for short-term exposure
and 0.2 ng/L for long-term exposure to EE2 in drinking water (MDH 2016). Drinking water values of 0.5 ng/l and
0.2 ng/L are equivalent to recreational screening value of 5.0 ng/L and 2.0 ng/L for short-term and long-term
exposure, respectively, after the factor of 10 adjustment (see Section 2.4.6; WHO 2006). Predicted short-term EE2
concentrations at the IDZ range from 2.3 to 2.4 ng/L which is less than the MDH-based short-term recreational
value of 5.0 ng/L. Predicted long-term EE2 concentrations at the IDZ range from 1.0 to 1.1 ng/L which is less than
the MDH-based long-term recreational value of 2.0 ng/L. Kolpin et al. (2002) measured hormones in 70 streams
in the US between 1999 and 2000. The maximum observed EE2 concentration was 831 ng/L with a median of
73 ng/L. The predicted EE2 concentrations at the IDZ are well below both the median and maximum
concentrations reported by Kolpin et al (2002). As discussed in Section 7.2.1, the IDZ predictions for EE2 are
expected to be overestimates of true concentrations given that they are based on variable non-detect values in
the effluent and ambient river data (i.e., <2.4 to <35.5 ng/L in the effluent; <0.37 to <1.7 ng/L in the ambient data).
Therefore, the predicted EE2 concentrations at the IDZ are likely overestimated but still below the MDH-based
recreational screening values as well as below the concentrations found in US streams. Given that predicted EE2
concentrations are decreasing due to the Stage V upgrade and are below available health-based screening values,
EE2 is not expected to pose a risk to human health.
Sterols
Recreational screening criteria are not available for sterols (i.e. cholestanol, cholesterol, coprostanol, desmosterol,
and epicoprostanol). Predicted short-term and monthly sterol concentrations were more than 20% over the
ambient concentration but less than current IDZ concentrations under all flow scenarios and seasons. Therefore,
no incremental change in concentrations at the IDZ would be predicted due to the Stage V upgrade.
Health-based screening values for the sterols are not available. The sterols are inter-related as they are all
products along the same reaction pathway. Desmosterol is an intermediate in the synthesis of cholesterol and
coprostanol, epicoprostanol and cholestenol are hydrogenation products of cholesterol. Limited human health
toxicity information is available for desmosterol, coprostanol, epicoprostanol and cholestenol. High blood
cholesterol is associated with increased risk of heart attacks and heart disease. The National Institute of Health
(NIH 2005) recommends a diet of less than 200 mg of cholesterol per day for an individual wishing to lower their
blood cholesterol levels. The predicted IDZ concentrations of cholesterol range from 939 to 2527 ng/L. Therefore,
a conservative exposure estimate for adults exposed to 0.15 L of water per day is 140 to 379 ng per day or less
than 0.0002% of the recommended daily dietary intake. Given that predicted sterol concentrations are decreasing
due to the Stage V upgrade and the low contribution of cholesterol to the total daily exposure of an adult, the
sterols are not expected to pose a risk to human health.

STAGE 2 ENVIRONMENTAL IMPACT STUDY
12 March 2018 Report No. 1525010-119-R-Rev0 78
7.3 Far-Field Assessment Results
Near-field COPCs were modelled at five far-field nodes extending from upstream of the AIWWTP to downstream
at Tilbury Island. These nodes are described further in Section 4.0. Screening of short-term and monthly
concentrations of near-field COPCs at far-field nodes are provided in Appendix E (Tables E-9 to E-11). The
following subsections present screening of predicted short-term and monthly concentrations at far-field nodes to
evaluate potential impacts on aquatic life, wildlife, livestock and irrigation uses (Section 7.3.1) and public health
(Section 7.3.2).
7.3.1 Aquatic Life, Wildlife, Livestock, and Agricultural Uses
Total and dissolved phosphorus, copper, and permethrin were identified as near-field COPCs and were evaluated
at the far-field nodes shown in Figure 2 (see Section 4.0). Screening results of predicted far-field concentrations
for these constituents are provided in Appendix E, Table E-9 and E-10.
Total and Dissolved Phosphorus
As discussed in the near-field assessment and Section 5.4, total phosphorus concentrations reported for the lower
Fraser River are above the BC WQG derived to protect against eutrophication in lakes, but these concentrations
have not resulted in substantial algal growth because of site-specific riverine conditions and the general lower
sensitivity of rivers to phosphorus relative to lakes (Nordin 1985, FRAP 1999a). Algal growth is primarily light
limited in the lower Fraser River, particularly during the growing season defined by Nordin (1985) that overlaps
with high river flows and associated elevated sediment transport downstream.
Total phosphorus monthly predictions from April to September are not distinguishable from ambient river
conditions during these higher flow months and so adverse effects on aquatic life due to the Stage V upgrade
would not be expected. From October to April, a period that does not encompass the growing season in BC,
monthly predictions were distinguishable from ambient river conditions for the five assessment nodes for some
months between November and March, depending on the assessment node. When the five nodes are considered,
predicted low flow concentrations were up to 1.4 (TP) or 1.5 (DP) times mean values calculated for the river
upstream of the AIWWTP (2012 to 2016; TP = 0.031 mg/L; DP = 0.019 mg/L; Appendix B). The maximum monthly
total and dissolved concentrations are predicted at Tilbury Island in February (i.e., TP = 0.044 mg/L; DP = 0.030).
These instances, where monthly concentrations at two of the five assessment nodes are predicted to be slightly
above ambient river concentrations, occur during the fall/winter months when conditions for algal growth is sub-
optimal in BC. Further, turbidity in the lower Fraser River continues to persist through these months resulting in
reduced light penetration through the water column. It is therefore unlikely that there would be an increase in algal
growth at the Western Annacis Island and Tilbury Island downstream assessment nodes as a result of the mean
monthly concentrations predicted in the far-field and adverse effects on aquatic life due to eutrophication are not
expected in this well oxygenated river.
Monthly phosphorus predictions are the most relevant to the assessment of the potential for adverse effects on
aquatic life due to eutrophication because effects due to eutrophication are realized over longer time periods and
plant growth is influenced by conditions over the entire growing season (Environment Canada 2004). Actual effects
are likely best represented by the average concentration over the growing season from May to September however
for the purpose of this assessment, monthly predictions have been assessed. Short-term flow-based predictions
have been provided but these are less relevant because they represent a time period of 24 hours instead of weeks
or months.
STAGE 2 ENVIRONMENTAL IMPACT STUDY
12 March 2018 Report No. 1525010-119-R-Rev0 79
Copper
Low flow short-term concentrations predicted at the far-field nodes were below the FRWQO. As described for
ambient conditions in Section 2.2.2, the lower Fraser River experiences turbid conditions year-round but to a
greater degree under moderate and high flows compared to low flows. Both ambient and predicted short-term total
copper concentrations under moderate and high flows were above the FRWQO, indicative of the increased
influence of downstream sediment transport under higher flows. The influence of resultant suspended sediment
levels under higher flows is reflected in the proportion of the predicted total copper concentration measured as
dissolved copper at these far-field nodes, under low (35-36%), moderate (25%), and high flows (15%). Flow based
short-term total copper concentrations predicted at the five far-field nodes are also not distinguishable from
ambient river conditions.
Monthly copper concentrations predicted at the five far-field nodes were also not distinguishable from ambient
river conditions consistent with the corresponding screening result for copper in the near-field IDZ assessment.
From September to March outside of the high flow season, predicted monthly concentrations were lower than the
FRWQO, but during and just after the freshet total copper concentrations increased to above the FRWQO, as was
shown for ambient concentrations.
Given that both total and dissolved copper concentrations predicted at the far-field nodes were within the range of
concentrations reported in the Fraser River under ambient conditions, the potential for adverse effects on aquatic
life at these locations was considered to be negligible.
Permethrin
Predicted short-term concentrations of permethrin at the far-field nodes ranged from 0.91 to 1.0 ng/L (Table E-9).
These values were below or equal to the conservatively applied CCME long-term WQG of 1 ng/L. Furthermore,
predicted short-term concentrations of permethrin at all far-field nodes were not distinguishable from ambient river
concentrations, and therefore concentrations were not predicted to increase due to the Project. Monthly permethrin
concentrations at far-field nodes were also lower than the CCME long-term WQG of 1 ng/L.
7.3.2 Public Health
Three near-field IDZ COPCs were identified for public health: TRC, TP, and DP. The short-term and monthly
predicted concentrations of these constituents were modelled at the five far-field nodes (Section 4.0). Screening
of the predicted concentrations are provided in Appendix E (Table E-11).
Total Residual Chlorine
Predicted short-term TRC concentrations ranged from 0.044 to 0.57 µg/L and monthly concentrations ranged from
0.017 to 0.18 µg/L. Predicted short-term and monthly concentrations of TRC were below the selected recreational
screening criterion (0.6 µg/L, or 0.0006 mg/L) at each of the five far-field nodes. Therefore, predicted
concentrations of TRC are not expected to pose a risk to public health.
STAGE 2 ENVIRONMENTAL IMPACT STUDY
12 March 2018 Report No. 1525010-119-R-Rev0 80
Total and Dissolved Phosphorus
Predicted short-term and monthly concentrations of TP were above the selected recreational screening criterion
(0.01 mg/L) at all far-field nodes. Predicted short-term concentrations were approximately 20% over the ambient
concentration during daily low flow scenarios at four of the five far-field nodes (Corporation of Delta Irrigation
Intake, Don Island, Tilbury Island, and Western Annacis Island). Predicted monthly concentrations of TP were
approximately 20% over the ambient concentration from January to March at the Corporation of Delta Irrigation
Intake, in January and February at Don Island, in February at Timberland Basin, and from October to March at
Tilbury Island and Western Annacis Island.
A recreational screening criterion for DP was not available; therefore, the screening criterion for TP was applied.
Predicted short-term and monthly concentrations of DP were above the selected recreational screening criterion
(0.01 mg/L) at all far-field nodes. Each of the five far-field nodes was approximately 20% over the ambient
concentration during low and moderate daily flows but not during high flows. The Corporation of Delta Irrigation
Intake, Don Island, and Timberland Basin were predicted to be approximately 20% over the ambient concentration
for most of the low flow season but not during the high flow season; whereas Tillbury Island and Western Annacis
Island were predicted to be approximately 20% over the ambient concentration for most of the year.
As discussed in Section 2.4.6, the recreational and drinking water screening criterion from BC MoE (2001) are
based an aesthetic objectives. Health-based screening criteria are not available. Phosphorus in lakes is used as
an indicator of potential algae problems, but, no clear relationship between phosphorus and algal blooms exists
for streams (BC MoE 2001). Given that the guideline for phosphorus as an indicator of algae blooms is not
applicable to streams (and therefore rivers) and there is no health-based screening criteria for the effects of
phosphorus, the predicted concentrations of total and dissolved phosphorus are not expected to pose a risk to
public health.
7.4 Assessment of PBT Constituents
7.4.1 Identification of PBT Constituents
The selection of constituents to be evaluated as PBT was intended to identify constituents that are known to
bioaccumulate in fish tissue, are persistent in the aquatic environment, and are of potential toxicological concern
in the Fraser River. Federal policy (i.e., the Toxic Substances Management Policy [TSMP]) and site-specific
monitoring programs (i.e., FRAMP) were consulted to identify PBT constituents of concern in the Fraser River.
In Canada, the TSMP (EC 1995) defines criteria for classifying which constituents are PBT. In order for a
constituent to be classified as PBT, the constituent must meet specific criteria for persistence, bioaccumulation,
and toxicity. If a constituent does not meet the criteria for all three characteristics, the constituent cannot be
classified as PBT. The TSMP criteria are:
A constituent is defined as persistent if any of the following criteria are met: half-life in air ≥ 2 days; half-life in
water ≥ 182 days; half-life in sediment ≥ 365 days; half-life in soil ≥ 182 days.
A constituent is defined as bioaccumulative if the bioaccumulation factor (BAF) ≥ 5000, or bioconcentration factor (BCF) ≥ 5000, or the log of the octanol-water partition coefficient (log KOW) ≥ 5.0, where BAFs are preferred over BCFs and log KOW is used in the absence of BAFs or BCFs.
STAGE 2 ENVIRONMENTAL IMPACT STUDY
12 March 2018 Report No. 1525010-119-R-Rev0 81
A constituent is considered toxic if it meets the Canadian Environmental Protection Act (CEPA) definition of
toxic (i.e., CEPA-toxic or CEPA toxic equivalent). CEPA (Government of Canada 1999a; Section 64) states
that “a substance is toxic if it is entering or may enter the environment in a quantity or concentration or under
conditions that (a) have or may have an immediate or long-term harmful effect on the environment or its
biological diversity; (b) constitute or may constitute a danger to the environment on which life depends; or (c)
constitute or may constitute a danger in Canada to human life or health”.
The TSMP classifies a substance as Track 1 if it meets the criteria for all three characteristics (i.e. persistent,
bioaccumulative, and toxic) and is predominantly anthropogenic. Track 1 constituents are targeted by the federal
government for virtual elimination from the environment. The PBT criteria identified above are consistent with
international approaches, including those of the Stockholm Convention (UNEP 2009) and the European Union
(ECHA 2017). For the purposes of identifying PBT constituents in the AIWWTP Stage 2 EIS, constituents that are
Track 1 constituents under the TSMP (EC 2017a,b) were considered PBT constituents.
The FRAMP monitoring program has analyzed fish tissue for organic constituents of concern in the Fraser River
due to either their potential to bioaccumulate in fish tissue or potential toxicological effects to fish and fish
consumers. Inclusion of constituents measured in the FRAMP fish tissue monitoring program was intended to
supplement the Canada-wide TSMP list with site-specific information.
A constituent was considered in the PBT assessment if:
The constituent is listed as a Track 1 substance under the TSMP (EC 2017a, b); and/or
The constituent is one of the organic or organometallic constituents measured in fish tissue as part of the
2012 FRAMP fish health survey (ENKON 2014).
Based on these criteria, the constituents listed in Table 7-1 were included in the PBT assessment in the Stage 2
EIS.
Table 7-1: Constituents considered in the PBT Assessment of the AIWWTP Stage 2 EIS
Aldrin
Chlordane
Dichlorodiphenyltrichloroethane (DDT)
Dieldrin
Endrin
Heptachlor
Hexachlorobenzene
Hexachlorobutadiene
Methyl mercury
Mirex
Polybrominated Diphenyl Ethers (PBDEs)
Polychlorinated Biphenyls (PCBs)
Polychlorinated Dibenzodioxins (PCDDs)
Polychlorinated Dibenzofurans (PCDFs)
Perflourooctane Sulfonic Acid (PFOS)
Polycyclic Aromatic Hydrocarbons (Benzo[a]pyrene only)
Toxaphene
STAGE 2 ENVIRONMENTAL IMPACT STUDY
12 March 2018 Report No. 1525010-119-R-Rev0 82
7.4.2 Evaluation of Near-field PBT Water Concentrations
The potential incremental effect of the Project on exposure of wildlife and people consuming fish from the Fraser
River to PBT constituents was evaluated in two steps. The first step was to evaluate potential effects of the Project
on conditions at the end-of-pipe by comparing current and Stage V effluent concentrations. The second step was
to evaluate potential effects of the Project on conditions at the IDZ by comparing IDZ water concentrations
predicted for Stage V flows to current water concentrations measured at the IDZ for the AIWWTP discharge.
The Stage V upgrade involves an expansion of the effluent discharge capacity of the plant from 12.6 m3/s to
18.9 m3/s. The upgrade is a hydraulic upgrade where the effluent discharge capacity is increased but the effluent
quality is expected to be the same. Given that the effluent concentrations are not expected to change, there is no
incremental effect of the Stage V upgrade on concentrations at the end of the pipe, and therefore no incremental
change in exposure of wildlife and people consuming fish from the Fraser River to PBT constituents. Therefore,
the Stage V upgrade is not expected to result in a change to the potential for adverse effects from PBT constituents
on aquatic and public health.
The potential of increased loadings of PBT constituents to result in adverse effects on wildlife and people
consuming fish from the Fraser River was assessed by comparing predicted maximum monthly average IDZ
concentrations against the currently measured average IDZ concentrations (Table E-12, Appendix E). Loadings
of PBT constituents to the receiving environment were considered in the generation of near-field predictions, as
described in Section 6.3 and Appendix A.
Predicted maximum monthly average concentrations at the edge of the IDZ are less than current average IDZ
concentrations for approximately half of the PBT constituents for which current IDZ concentrations were available
(Appendix E, Table E-12). Therefore, the Stage V upgrade is not expected to result in a change to the potential
for adverse effects from these PBT constituents on aquatic and public health. This conclusion applies to DDT,
dieldrin, hexachlorobenzene, PBDEs, and benzo[a]pyrene.
For the remaining PBT constituents for which current IDZ concentrations were available (i.e., PCBs, aldrin,
chlordane, endrin, heptachlor, and mirex), predicted concentrations were higher than current conditions. However,
predicted concentrations of these constituents are affected by additional sources of uncertainty. As discussed in
Section 7.1.2, there is high uncertainty in the effluent, ambient, and current IDZ concentrations of PCBs due to
elevated concentrations of the blanks. Aldrin, chlordane, endrin, heptachlor, and mirex were affected by elevated
detection limits where the MDL range difference between the minimum and maximum MDL ranged from a factor
of 14 to 160. Therefore, predicted concentrations are expected to be overestimates. Given that the effluent
concentration is not increasing, it is more likely that these constituents would show the same decrease at the IDZ
following the Stage V upgrade as the PBT constituents with relatively reliable predictions based on higher-quality
data. PCBs, aldrin, chlordane, endrin, heptachlor, and mirex are discussed in more detail below.
Current IDZ concentrations were not available for PCDD/Fs, hexachlorobutadiene, toxaphene, methyl mercury
and PFOS, and therefore a comparison with predicted IDZ concentrations could not be made. However, it is
expected that IDZ concentrations of these constituents would also decrease following the Stage V upgrade, as
shown for the PBT constituents with relatively reliable predictions based on higher-quality data.
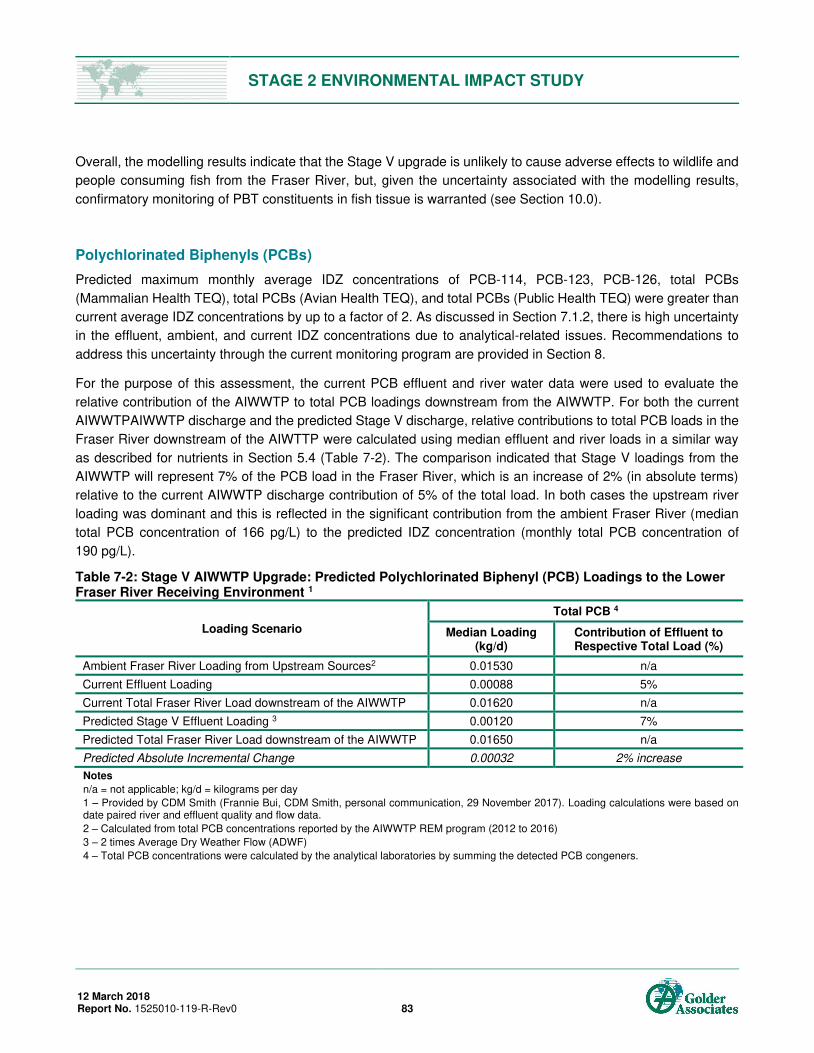
STAGE 2 ENVIRONMENTAL IMPACT STUDY
12 March 2018 Report No. 1525010-119-R-Rev0 83
Overall, the modelling results indicate that the Stage V upgrade is unlikely to cause adverse effects to wildlife and
people consuming fish from the Fraser River, but, given the uncertainty associated with the modelling results,
confirmatory monitoring of PBT constituents in fish tissue is warranted (see Section 10.0).
Polychlorinated Biphenyls (PCBs)
Predicted maximum monthly average IDZ concentrations of PCB-114, PCB-123, PCB-126, total PCBs
(Mammalian Health TEQ), total PCBs (Avian Health TEQ), and total PCBs (Public Health TEQ) were greater than
current average IDZ concentrations by up to a factor of 2. As discussed in Section 7.1.2, there is high uncertainty
in the effluent, ambient, and current IDZ concentrations due to analytical-related issues. Recommendations to
address this uncertainty through the current monitoring program are provided in Section 8.
For the purpose of this assessment, the current PCB effluent and river water data were used to evaluate the
relative contribution of the AIWWTP to total PCB loadings downstream from the AIWWTP. For both the current
AIWWTPAIWWTP discharge and the predicted Stage V discharge, relative contributions to total PCB loads in the
Fraser River downstream of the AIWTTP were calculated using median effluent and river loads in a similar way
as described for nutrients in Section 5.4 (Table 7-2). The comparison indicated that Stage V loadings from the
AIWWTP will represent 7% of the PCB load in the Fraser River, which is an increase of 2% (in absolute terms)
relative to the current AIWWTP discharge contribution of 5% of the total load. In both cases the upstream river
loading was dominant and this is reflected in the significant contribution from the ambient Fraser River (median
total PCB concentration of 166 pg/L) to the predicted IDZ concentration (monthly total PCB concentration of
190 pg/L).
Table 7-2: Stage V AIWWTP Upgrade: Predicted Polychlorinated Biphenyl (PCB) Loadings to the Lower Fraser River Receiving Environment 1
Loading Scenario
Total PCB 4
Median Loading (kg/d)
Contribution of Effluent to Respective Total Load (%)
Ambient Fraser River Loading from Upstream Sources2 0.01530 n/a
Current Effluent Loading 0.00088 5%
Current Total Fraser River Load downstream of the AIWWTP 0.01620 n/a
Predicted Stage V Effluent Loading 3 0.00120 7%
Predicted Total Fraser River Load downstream of the AIWWTP 0.01650 n/a
Predicted Absolute Incremental Change 0.00032 2% increase
Notes n/a = not applicable; kg/d = kilograms per day 1 – Provided by CDM Smith (Frannie Bui, CDM Smith, personal communication, 29 November 2017). Loading calculations were based on date paired river and effluent quality and flow data. 2 – Calculated from total PCB concentrations reported by the AIWWTP REM program (2012 to 2016)
3 – 2 times Average Dry Weather Flow (ADWF)
4 – Total PCB concentrations were calculated by the analytical laboratories by summing the detected PCB congeners.
STAGE 2 ENVIRONMENTAL IMPACT STUDY
12 March 2018 Report No. 1525010-119-R-Rev0 84
As PBT substances, PCBs are hydrophobic and are preferentially taken up from the water column by suspended
matter, sediments on the river bottom, and aquatic biota. It was therefore appropriate to consider current sediment
and fish tissue concentrations in the lower Fraser River in the evaluation of potential adverse effects from the
Stage V upgrade. When the following lines of evidence were considered, the relatively small contribution from the
AIWWTP to the overall PCB loading in the lower Fraser River and the 2% incremental increase in that contribution
from the Stage V upgrade suggests that the upgrade would not be expected to have the potential for adverse
effects to fish, fish consuming wildlife and public health.
PCB concentrations were below the FRSQO, BC lower SWQGs, and CCME ISQG values in mid-channel
sediments within the vicinity of the proposed outfall and in near-shore sediments located downstream of the
proposed outfall location (Section 2.2.2; Appendix C). Total PCB concentrations measured in sediments
downstream from the existing outfall were more than ten times lower than the total PCB FRSQO of
20,000 pg/g, with the exception of one near-shore location in the near-field where a concentration of
3,259 pg/g was reported and one far-field location where a concentration of 16,336 pg/g was reported.
PCBs bioaccumulate in fish tissue from water and food consumption so fish tissues represent the
environment to which they are exposed. As discussed in Section 2.3.2, tissue concentrations of PCBs
reported for the three study areas in 2012 including the Main Arm at Steveston met the PCB tissue FRO and
there appears to have been a decrease in both fish muscle and liver concentrations over time in sentinel fish
species. Salmon have been shown to accumulate a large proportion of their PCB body burden while at sea
and not during time spent in the lower Fraser River (Section 2.3.2).
To address uncertainty in the PCB water data and to confirm fish tissue PCB concentrations upstream and
downstream of the AIWWTP, a confirmatory monitoring study is recommended (see Section 10.0). Sediment
quality monitoring has also been recommended in Section 10 following the Stage V upgrade.
Aldrin
The predicted maximum monthly average IDZ concentration for aldrin (0.013 ng/L) was greater than the current
average IDZ concentration (<0.011 ng/L). However, both predicted and current values were derived from non-
detect values with variable MDLs, and do not reflect a comparison of actual concentrations. The current IDZ
concentration is based on a limited dataset of six measurements that were all below MDLs varying from <0.010 to
<0.023 ng/L. Predicted IDZ concentrations were based on seventeen measurements of the effluent that were all
below MDLs varying from <0.010 to <0.98 ng/L. The apparent predicted increase in Aldrin concentration simply
reflects a higher MDL in effluent data compared to ambient data.
Chlordane
The predicted maximum monthly average IDZ concentration for chlordane (0.031 ng/L) was greater than the
current average IDZ concentration (<0.011 ng/L). However, both predicted and current values were derived from
non-detect values with variable MDLs, and do not reflect a comparison of actual concentrations. The current
concentration is based on a limited dataset of twelve measurements that were all below MDLs varying from <0.010
to <0.094 ng/L. The predicted IDZ concentrations were based on a limited dataset of sixteen measurements of
effluent that were all below MDLs varying from <0.030 to <0.42 ng/L. The apparent predicted increase in chlordane
concentration simply reflects a higher MDL in effluent data compared to ambient data.

STAGE 2 ENVIRONMENTAL IMPACT STUDY
12 March 2018 Report No. 1525010-119-R-Rev0 85
Endrin
The predicted maximum monthly average IDZ concentration for endrin (0.027 ng/L) was greater than the current
average IDZ concentration (<0.023 ng/L). However, both predicted and current values were derived from
non-detect values with variable MDLs, and do not reflect a comparison of actual concentrations. The current
concentration is based on a limited dataset of six measurements that were all below MDLs varying from <0.012 to
<0.33 ng/L. The predicted IDZ concentrations were based on a limited dataset of seventeen measurements of
effluent with one value above the MDL (0.03 ng/L) and the remainder below MDLs varying from <0.010 to
<0.72 ng/L. The apparent predicted increase in endrin concentration simply reflects a higher MDL in effluent data
compared to ambient data.
Heptachlor
The predicted maximum monthly average IDZ concentration for heptachlor (0.011 ng/L) was marginally greater
than the current average IDZ concentration (<0.010 ng/L). However, both predicted and current values were
derived from non-detect values with variable MDLs, and do not reflect a comparison of actual concentrations. The
current concentration is based on a limited dataset of six measurements that were all below MDLs varying from
<0.010 to <0.044 ng/L. The predicted IDZ concentrations were based on a limited dataset of seventeen
measurements of effluent with only one sample above the MDL (0.03 ng/L) and the remainder below MDLs varying
from <0.010 to <0.72 ng/L. The apparent predicted increase in heptachlor concentration simply reflects a higher
MDL in effluent data compared to ambient data.
Mirex
The predicted maximum monthly average IDZ concentration for mirex (0.011 ng/L) was marginally greater than
the current average IDZ concentration (<0.010 ng/L). However, both predicted and current values were derived
from non-detect values with variable MDLs, and do not reflect a comparison of actual concentrations. The current
concentration is based on a limited dataset of six measurements that were all below MDLs varying from <0.010 to
<0.013 ng/L. The predicted IDZ concentrations were based on a limited dataset of seventeen measurements of
effluent with one sample above the MDL (0.066 ng/L) and the remainder below MDLs varying from <0.010 to
<0.30 ng/L. The apparent predicted increase in mirex concentration simply reflects a higher MDL in effluent data
compared to ambient data.
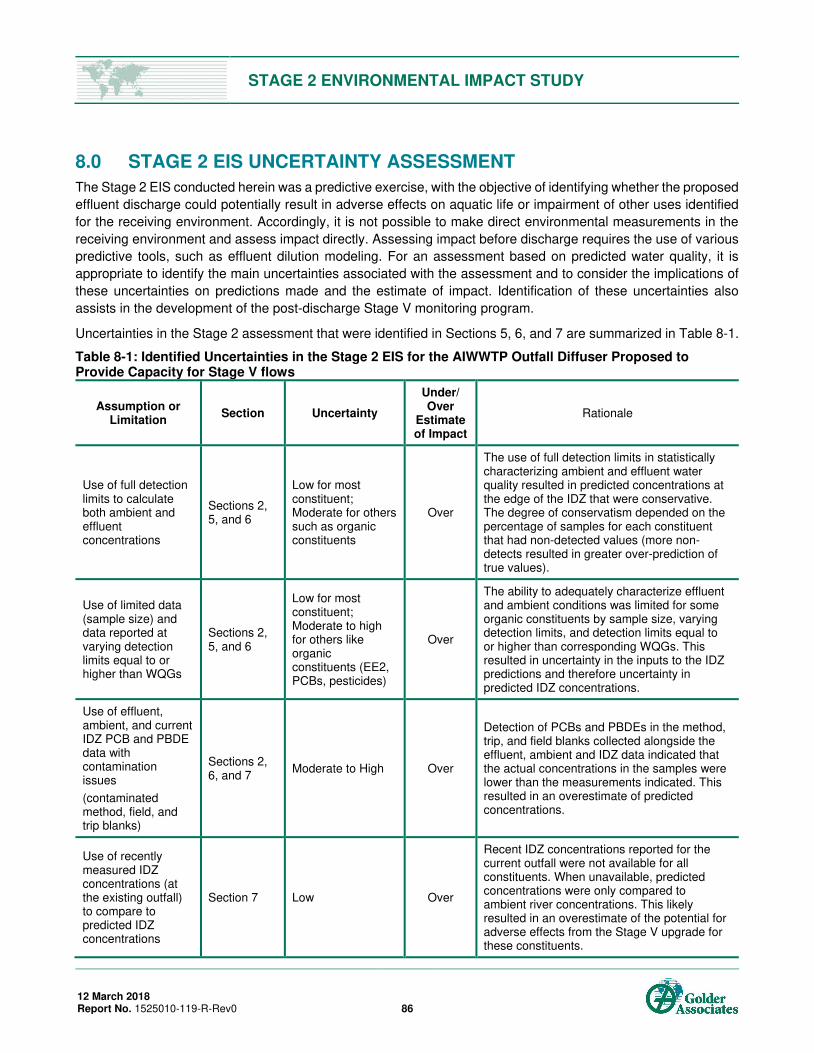
STAGE 2 ENVIRONMENTAL IMPACT STUDY
12 March 2018 Report No. 1525010-119-R-Rev0 86
8.0 STAGE 2 EIS UNCERTAINTY ASSESSMENT
The Stage 2 EIS conducted herein was a predictive exercise, with the objective of identifying whether the proposed
effluent discharge could potentially result in adverse effects on aquatic life or impairment of other uses identified
for the receiving environment. Accordingly, it is not possible to make direct environmental measurements in the
receiving environment and assess impact directly. Assessing impact before discharge requires the use of various
predictive tools, such as effluent dilution modeling. For an assessment based on predicted water quality, it is
appropriate to identify the main uncertainties associated with the assessment and to consider the implications of
these uncertainties on predictions made and the estimate of impact. Identification of these uncertainties also
assists in the development of the post-discharge Stage V monitoring program.
Uncertainties in the Stage 2 assessment that were identified in Sections 5, 6, and 7 are summarized in Table 8-1.
Table 8-1: Identified Uncertainties in the Stage 2 EIS for the AIWWTP Outfall Diffuser Proposed to Provide Capacity for Stage V flows
Assumption or Limitation
Section Uncertainty
Under/ Over
Estimate of Impact
Rationale
Use of full detection limits to calculate both ambient and effluent concentrations
Sections 2, 5, and 6
Low for most constituent; Moderate for others such as organic constituents
Over
The use of full detection limits in statistically characterizing ambient and effluent water quality resulted in predicted concentrations at the edge of the IDZ that were conservative. The degree of conservatism depended on the percentage of samples for each constituent that had non-detected values (more non-detects resulted in greater over-prediction of true values).
Use of limited data (sample size) and data reported at varying detection limits equal to or higher than WQGs
Sections 2, 5, and 6
Low for most constituent; Moderate to high for others like organic constituents (EE2, PCBs, pesticides)
Over
The ability to adequately characterize effluent and ambient conditions was limited for some organic constituents by sample size, varying detection limits, and detection limits equal to or higher than corresponding WQGs. This resulted in uncertainty in the inputs to the IDZ predictions and therefore uncertainty in predicted IDZ concentrations.
Use of effluent, ambient, and current IDZ PCB and PBDE data with contamination issues
(contaminated method, field, and trip blanks)
Sections 2, 6, and 7
Moderate to High Over
Detection of PCBs and PBDEs in the method, trip, and field blanks collected alongside the effluent, ambient and IDZ data indicated that the actual concentrations in the samples were lower than the measurements indicated. This resulted in an overestimate of predicted concentrations.
Use of recently measured IDZ concentrations (at the existing outfall) to compare to predicted IDZ concentrations
Section 7 Low Over
Recent IDZ concentrations reported for the current outfall were not available for all constituents. When unavailable, predicted concentrations were only compared to ambient river concentrations. This likely resulted in an overestimate of the potential for adverse effects from the Stage V upgrade for these constituents.
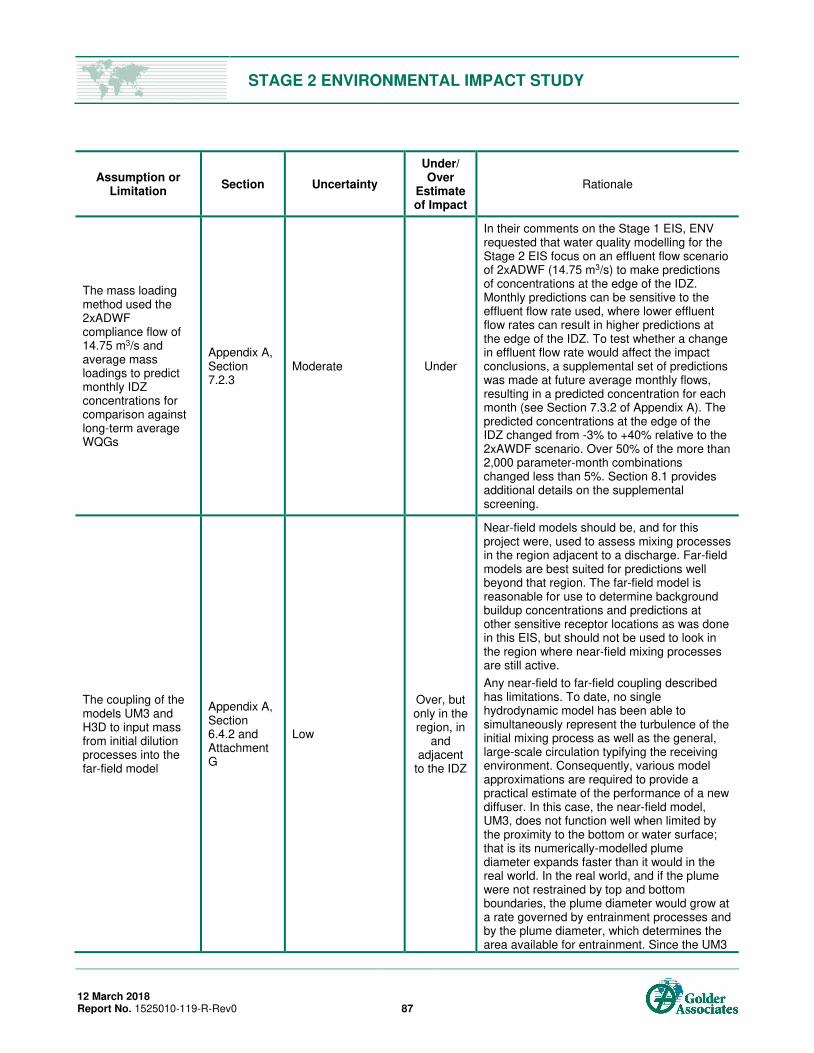
STAGE 2 ENVIRONMENTAL IMPACT STUDY
12 March 2018 Report No. 1525010-119-R-Rev0 87
Assumption or Limitation
Section Uncertainty
Under/ Over
Estimate of Impact
Rationale
The mass loading method used the 2xADWF compliance flow of 14.75 m3/s and average mass loadings to predict monthly IDZ concentrations for comparison against long-term average WQGs
Appendix A, Section 7.2.3
Moderate Under
In their comments on the Stage 1 EIS, ENV requested that water quality modelling for the Stage 2 EIS focus on an effluent flow scenario of 2xADWF (14.75 m3/s) to make predictions of concentrations at the edge of the IDZ. Monthly predictions can be sensitive to the effluent flow rate used, where lower effluent flow rates can result in higher predictions at the edge of the IDZ. To test whether a change in effluent flow rate would affect the impact conclusions, a supplemental set of predictions was made at future average monthly flows, resulting in a predicted concentration for each month (see Section 7.3.2 of Appendix A). The predicted concentrations at the edge of the IDZ changed from -3% to +40% relative to the 2xAWDF scenario. Over 50% of the more than 2,000 parameter-month combinations changed less than 5%. Section 8.1 provides additional details on the supplemental screening.
The coupling of the models UM3 and H3D to input mass from initial dilution processes into the far-field model
Appendix A, Section 6.4.2 and Attachment G
Low
Over, but only in the region, in
and adjacent
to the IDZ
Near-field models should be, and for this project were, used to assess mixing processes in the region adjacent to a discharge. Far-field models are best suited for predictions well beyond that region. The far-field model is reasonable for use to determine background buildup concentrations and predictions at other sensitive receptor locations as was done in this EIS, but should not be used to look in the region where near-field mixing processes are still active.
Any near-field to far-field coupling described has limitations. To date, no single hydrodynamic model has been able to simultaneously represent the turbulence of the initial mixing process as well as the general, large-scale circulation typifying the receiving environment. Consequently, various model approximations are required to provide a practical estimate of the performance of a new diffuser. In this case, the near-field model, UM3, does not function well when limited by the proximity to the bottom or water surface; that is its numerically-modelled plume diameter expands faster than it would in the real world. In the real world, and if the plume were not restrained by top and bottom boundaries, the plume diameter would grow at a rate governed by entrainment processes and by the plume diameter, which determines the area available for entrainment. Since the UM3
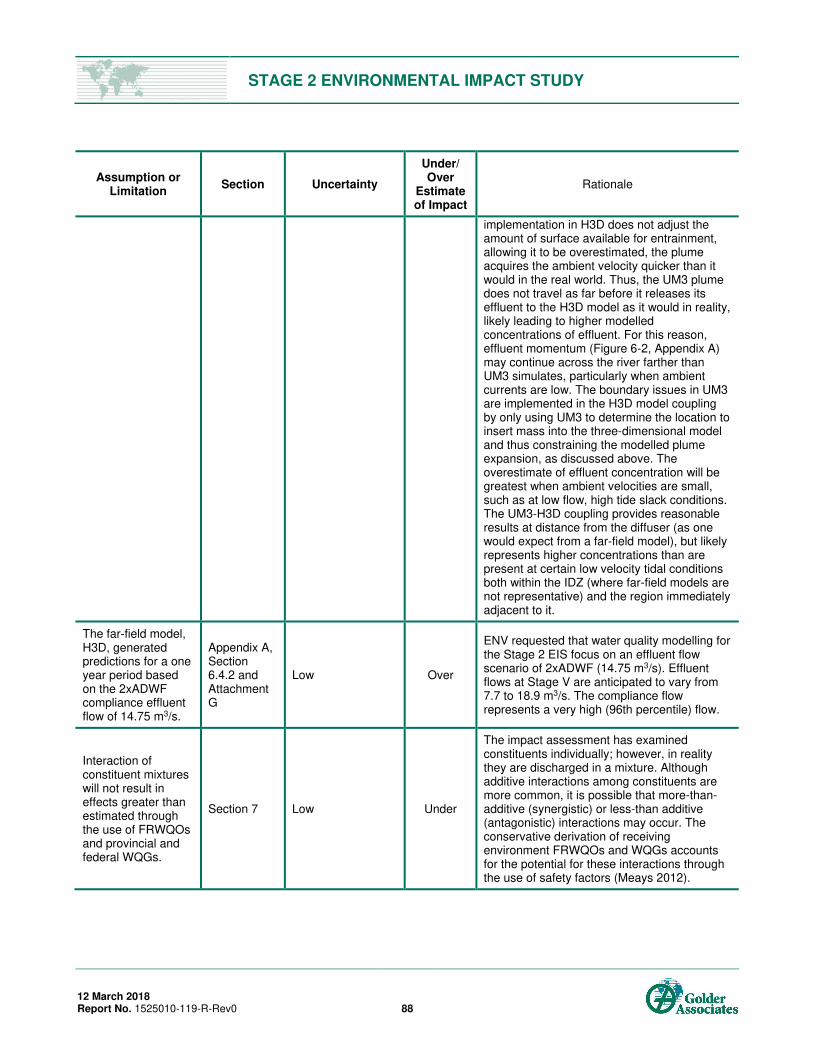
STAGE 2 ENVIRONMENTAL IMPACT STUDY
12 March 2018 Report No. 1525010-119-R-Rev0 88
Assumption or Limitation
Section Uncertainty
Under/ Over
Estimate of Impact
Rationale
implementation in H3D does not adjust the amount of surface available for entrainment, allowing it to be overestimated, the plume acquires the ambient velocity quicker than it would in the real world. Thus, the UM3 plume does not travel as far before it releases its effluent to the H3D model as it would in reality, likely leading to higher modelled concentrations of effluent. For this reason, effluent momentum (Figure 6-2, Appendix A) may continue across the river farther than UM3 simulates, particularly when ambient currents are low. The boundary issues in UM3 are implemented in the H3D model coupling by only using UM3 to determine the location to insert mass into the three-dimensional model and thus constraining the modelled plume expansion, as discussed above. The overestimate of effluent concentration will be greatest when ambient velocities are small, such as at low flow, high tide slack conditions. The UM3-H3D coupling provides reasonable results at distance from the diffuser (as one would expect from a far-field model), but likely represents higher concentrations than are present at certain low velocity tidal conditions both within the IDZ (where far-field models are not representative) and the region immediately adjacent to it.
The far-field model, H3D, generated predictions for a one year period based on the 2xADWF compliance effluent flow of 14.75 m3/s.
Appendix A, Section 6.4.2 and Attachment G
Low Over
ENV requested that water quality modelling for the Stage 2 EIS focus on an effluent flow scenario of 2xADWF (14.75 m3/s). Effluent flows at Stage V are anticipated to vary from 7.7 to 18.9 m3/s. The compliance flow represents a very high (96th percentile) flow.
Interaction of constituent mixtures will not result in effects greater than estimated through the use of FRWQOs and provincial and federal WQGs.
Section 7 Low Under
The impact assessment has examined constituents individually; however, in reality they are discharged in a mixture. Although additive interactions among constituents are more common, it is possible that more-than-additive (synergistic) or less-than additive (antagonistic) interactions may occur. The conservative derivation of receiving environment FRWQOs and WQGs accounts for the potential for these interactions through the use of safety factors (Meays 2012).

STAGE 2 ENVIRONMENTAL IMPACT STUDY
12 March 2018 Report No. 1525010-119-R-Rev0 89
Moderate or moderate-to-high uncertainty was identified in Table 8.1 in relation to the following assumptions or
data limitations:
Use of full detection limits to calculate both ambient and effluent concentrations. Moderate uncertainty may
have resulted in an over-estimation of predictions for organic constituents not detectable in effluent or ambient
river water. In many cases there was a wide range of detection limits considered for these organic
constituents that may have contributed to an over-estimation of predictions.
Use of limited data (sample size) and data reported at varying detection limits equal to or higher than WQGs.
Moderate to high uncertainty may have resulted in an over-estimation of predictions for some organic
constituents such as EE2, PCBs, pesticides. This limitation is discussed further in Section 10 with respect to
monitoring of the upgraded outfall.
Use of effluent, ambient, and current IDZ PCB and PBDE data with contamination issues (contaminated
method, field, and trip blanks). Moderate to high uncertainty may have resulted in an over-estimation of
predictions for these organic constituents. This limitation is discussed further in Section 10 with respect to
monitoring of the upgraded outfall.
The mass loading method used the 2xADWF compliance flow of 14.75 m3/s and average mass loadings to
predict IDZ concentrations for comparison against long-term average WQGs. Moderate uncertainty may have
resulted in an under-estimation of predicted monthly concentrations for some constituents at the edge of the
IDZ (but not in the far-field).
To address this uncertainty, a supplemental near-field assessment was undertaken in Appendix F to evaluate
whether the impact assessment of monthly IDZ concentrations for an effluent flow of 2xADWF might under-
estimate potential impact for a range of lower effluent flows. The focus of this sensitivity analysis was on long-
term monthly IDZ predictions because they were more sensitive to changes in effluent flow rate compared to
the short-term predictions that were considered to be more robust.
Evaluation of predicted monthly average COPC concentrations in the supplemental assessment supported
the same conclusion as the assessment in Section 7. Specifically, the supplemental assessment concluded
that for the Stage V monthly scenario, no adverse effects on aquatic life or impairment of other receiving
environment uses or public health would be expected at the edge of the IDZ. Therefore, the same impact
conclusion was reached for Stage V monthly average flows as for the 2xAWDF effluent flow scenario. With
respect to the study area as a whole, as documented in Table 8-1, there is conservatism in the far-field
assessment of potential impact that spans the entire study area upstream and downstream of the AIWWTP.
STAGE 2 ENVIRONMENTAL IMPACT STUDY
12 March 2018 Report No. 1525010-119-R-Rev0 90
9.0 IMPACT CONCLUSIONS
Overall, the Stage 2 impact assessment presented in Section 7 indicates that pollution as defined by EMA is
unlikely to occur as a result of the Stage V hydraulic upgrade to the AIWWTP. This conclusion is based on
assessment of receiving water quality predictions for approximately 140 constituents (Section 6) and in
consideration of the uncertainty assessment (Section 8); specifically:
Adverse effects are not expected on aquatic life or impairment of other receiving environment uses identified
for the Study Area or public health. This conclusion is based on assessment of predicted concentrations at
the edge of the IDZ made for an effluent flow rate of two times the average dry weather flow (2xAWDF) and
at lower effluent flow rates considered in the uncertainty assessment. This conclusion also applies to the
assessment of predicted concentrations at far-field nodes in the Fraser River.
No effect of the project is expected on risk of adverse effects to wildlife or people consuming fish from the
Fraser River because no change in effluent quality is anticipated and concentrations of PBT constituents at
the IDZ are not predicted to increase with the Stage V upgrade. Fish tissue monitoring is recommended to
confirm this conclusion.
Secondary treated whole effluent at the point of discharge is not expected to be acutely lethal to aquatic life
and conditions within the IDZ would likewise not be expected to be acutely lethal to aquatic life. When the
new effluent outfall is commissioned, acute toxicity testing will be carried out to confirm these predictions and
is expected to be a condition of the amended Operational Certificate.
The most recent characterization of effluent presented in the Stage 2 EIS (i.e., 2016) indicates that the AIWWTP
effluent meets National Performance Standards (i.e., WSER limits and it is not acutely toxic). Thus, the AIWWTP
effluent meets conditions of Section 6(1) of WSER, and as such its deposit is authorized under Section 36(4) of
the Fisheries Act.
STAGE 2 ENVIRONMENTAL IMPACT STUDY
12 March 2018 Report No. 1525010-119-R-Rev0 91
10.0 STAGE V POST-DISCHARGE MONITORING AND CONFIRMATORY MONITORING
The potential need for post-discharge monitoring was evaluated in consideration of provincial EIS guidance by BC
MELP (2000). This generic guidance indicates that following commencement of the discharge, effluent and
receiving environment monitoring results are to be evaluated: (1) to determine whether water quality guidelines
are being met outside the IDZ; (2) to confirm that sediment biota, chemistry, and toxicity are not adversely affected;
and, (3) to confirm previous modeling and predictive assessments findings.
Post-Stage V monitoring is intended to confirm and verify the findings of the Stage 2 EIS and address uncertainties
identified in the EIS. Long-term monitoring is already in place for the lower Fraser River and these programs are
currently under internal review. Recommendation from the review process are considered and discussed with the
Environmental Monitoring Committee (EMC) before being incorporated into ongoing programs as appropriate and
as opportunities arise. The EMC is a technical committee with representatives from member municipalities, Metro
Vancouver, senior governments, and the academic community. Thus, the following recommendations are intended
to inform review of the long-term monitoring program and recommend additional monitoring specifically to confirm
Stage 2 EIS findings and address uncertainties identified in the EIS.
10.1 Summary of Current Long-Term Monitoring Relevant to the Stage V Upgrade
The proposed project represents a hydraulic upgrade to an existing outfall already subject to annual monitoring of
the receiving environment at the edge of the initial dilution zone (REM program) and ambient conditions within the
wider Main Arm receiving environment (FRAMP). The term ‘ambient’ refers to water quality outside the direct influence of effluent discharges to the Fraser River. In undertaking both programs MV has endeavoured to use the
best commercially available analytical methods within BC, where possible. A synthesis of results from the REM
and FRAMP programs considered relevant to the Stage 2 EIS is provided in Section 2. These programs are briefly
described below:
The REM program is focussed on water quality monitoring of a wide range of water quality constituents at
the edge of IDZ, including conventional parameters, metals, nutrients, bacteriological parameters and organic
constituents such as pesticides (herbicides, insecticides, and fungicides), alkylphenols, PCBs, PBDEs,
hormones and sterols, and PAHs. Water samples taken at a reference location in the Fraser River Main Stem
downstream of the skytrain bridge and at the edge of the AIWWTP IDZ, are submitted to CALA certified
laboratories for analysis. The program currently incorporates the best analytical methods currently available
from commercial analytical laboratories within the region as determined by MV, particularly with respect to
organic parameters.
The REM program has been implemented by MV at the AIWWTP since 2004 and the design of the program
has evolved over time since the original design by Gartner Lee (2003). Currently water quality is monitored
up to two times per year and the data are subject to annual reporting and review by the EMC.
The FRAMP was designed in 2002 to meet a Liquid Waste Management Plan commitment to undertake
ambient monitoring of the lower Fraser River within Metro Vancouver (i.e., North Arm, Main Arm and Main
Stem up to and including Langley/Maple Ridge). The program has operated on a five year cycle since 2003
with water quality monitored once per year and sediment quality and fish health and tissue monitored about
every five years. To date, water quality has been monitored for fourteen consecutive years; three separate
sediment quality studies and three separate fish health and tissue studies have been conducted to date.
STAGE 2 ENVIRONMENTAL IMPACT STUDY
12 March 2018 Report No. 1525010-119-R-Rev0 92
Both the REM and FRAMP monitoring program designs are currently under review by MV and recommendations
will be considered and discussed with the EMC and incorporated into ongoing monitoring programs as appropriate
and opportunities arise, with the overall objective of monitoring the potential influence of discharges from MV
WWTPs to the lower Fraser River receiving environment.
10.2 AIWWTP Effluent Sampling Program and the REM Water Quality Program
The considerations outlined below are provided for Stage V post-discharge monitoring through the long term
AIWWTP effluent monitoring and receiving environment monitoring programs currently implemented by MV.
Constituents evaluated in the Stage 2 EIS impact assessment should be considered for inclusion in
monitoring of AIWWTP effluent and river water at the edge of the IDZ and upstream of the Annacis outfall, to
assess attainment of FRWQOs and applicable WQGs, and confirm the findings of the EIS. Where methods
are available to achieve MDLs below applicable guidelines and no uncertainties in the data were identified in
the Stage 2 EIS, monitoring of these constituents in effluent and river water should continue.
Consistent with the current approach for the REM program, organic constituents do not need to be routinely
monitored; however, over the longer-term, organic constituents evaluated in the Stage 2 EIS impact
assessment including PBT constituents should be characterized in effluent and river water as appropriate to
assess attainment of FRWQOs and applicable WQGs, and confirm the findings of the EIS.
Where methods are not commercially available to achieve MDLs below applicable guidelines for the AIWTTP
effluent and river water submitted for analysis, the monitoring program review should consider how
meaningful interpretation of these data could be conducted, given this constraint. With the continued
development of analytical technologies by research, government, and commercial laboratories, MDLs for
constituents such as EE2 are expected to improve over time; however, for now MDLs remain a constraint for
the assessment of several organic constituents in effluent and river water. As improved analytical methods
become available, supplementary sample collection and analysis is recommended for AIWWTP effluent, river
water for select constituents evaluated in the Stage 2 EIS impact assessment that have been subject to these
constraints.
For constituents where uncertainty in the current dataset that affected data interpretation was identified,
sampling and laboratory procedures should be reviewed as part of the overall monitoring program review,
with the objective of reducing uncertainty in the effluent and water quality data reported. For example, both
sampling and laboratory procedures should be reviewed for PCBs and PBDEs to address the noted issues
related to elevated concentrations in field and laboratory blank samples.
Continue to undertake acute 96-hour rainbow trout toxicity testing of the effluent as required by the ILWRMP,
amended Operational Certificate, and WSER.
The re-evaluation of the REM program will need to develop a revised monitoring strategy for use once the
new multiport diffuser operational. As the diffuser is oriented parallel to the river flow and discharges across
the main flow (which is the opposite of the existing diffuser), the location of the plume will change with
changing tide conditions. Thus, a revised monitoring strategy will need to be more robust and should consider
averaging strategies for sample collection (e.g., compositing samples along the IDZ boundary over all or a
portion of the tidal cycle, or depth composite sampling) to obtain representative samples of plume conditions
at the edge of the IDZ.
STAGE 2 ENVIRONMENTAL IMPACT STUDY
12 March 2018 Report No. 1525010-119-R-Rev0 93
10.3 Confirmatory Sampling
Sediment and fish tissue monitoring to confirm the findings of the EIS is proposed below. The proposed
confirmatory sampling is not necessarily intended for long-term inclusion in the programs currently implemented
by MV. Initially, sampling is intended to provide data to confirm whether the sediment quality is influenced by the
Stage V upgrade and to confirm the findings of the EIS assessment of PBT constituents. Sampling of sediment
quality and fish tissues is recommended prior to and following commissioning of the Stage V discharge, with future
recommendations to be made based on the findings of those studies.
Sediment sampling is recommended downstream and upstream of the proposed AIWWTP outfall prior to and
following commissioning of the Stage V discharge to determine if the Stage V upgrade has influenced
sediment quality. This sampling objective could potentially be achieved by conducting supplemental sampling
during the existing sediment quality program, providing that the frequency of sampling in the revised design
will address this sampling objective. The sediment monitoring program currently implemented by MV is
focussed on sampling near-shore sampling areas with slower flows and finer sediments. Preliminary sampling
of benthic invertebrate communities in 2016 and 2017 documented in Appendices C and D suggest that,
consistent with the findings of Gartner Lee (2003), there would be substantial challenges in being able to
detect meaningful change in benthic invertebrate communities located within the receiving environment
downstream of the AIWWTP due to the dynamic, unstable physical characteristics of the receiving
environment. Sampling of sediment quality would likely be a more effective way of assessing potential impact
to sediment dwelling biota.
Collection of fish tissues to be analyzed for PBT constituents is recommended to confirm the findings of the
EIS assessment of PBT constituents. Fish tissue collection should focus on small-bodied and sentinel species
with site-fidelity that could be used to evaluate the potential for risks to wildlife consumers of fish and used
as a surrogate for fish consumed by people (peamouth chub is a potential candidate species). MV currently
monitors both fish tissue and fish health in the lower Fraser River as part of the FRAMP. As part of the review
of this program, consideration should be given to incorporating suitable locations upstream and downstream
of the AIWWTP for sampling of fish tissue prior to and following commissioning of the Stage V discharge.
Provisionally target species could align with the current FRAMP design to allow for comparison to historical
data but the final selection of sentinel species should be evaluated further during the monitoring program
review.
As in existing programs, sediment and fish tissue samples should continue to be analyzed using the best
commercially available analytical methods with the objective of achieving MDLs below applicable sediment
and tissue FROs and guidelines.

STAGE 2 ENVIRONMENTAL IMPACT STUDY
12 March 2018 Report No. 1525010-119-R-Rev0 95
12.0 REFERENCES
12.1 Literature Cited
AECOM 2015. Discussion Paper: Rainbow Trout LC50 Toxicity Model. Technical Memorandum prepared for Metro
Vancouver. Burnaby, BC: AECOM. May 2015.
Allan JD. 1995. Stream Ecology: Structure and Function of Running Waters. London: Chapman and Hall. 388 p.
Anderson PD. 2005. Technical brief: endocrine disrupting compounds and implications for wastewater treatment.
Water Environment Research Foundation. Report 04-WEM-6.
BC MELP (British Columbia Ministry of Environment, Lands, and Parks). 2000. Environmental Impact Study
Guideline – A Companion Document to the Municipal Sewage Regulation. Ministry of Environment, Lands
and Parks, Pollution Prevention and Remediation Branch. December 2000.
BC MFLNRO (British Columbia Ministry of Forest, Lands and Natural Resource Operations). 2016. Fraser Valley
Special Area Hunting Licence – 2017/2018 Edition. Available at:
https://www2.gov.bc.ca/assets/gov/sports-recreation-arts-and-culture/outdoor-recreation/fishing-and-
hunting/hunting/regulations/2016-2018/fraser-valley-special-area-hunting-licence-2017-2018_4pg.pdf
BC MoE (British Columbia Ministry of Environment). 2001. Water Quality Criteria for Nutrients and Algae. Victoria
BC: British Columbia Ministry of Environment. August 2001. Available at:
https://www2.gov.bc.ca/assets/gov/environment/air-land-water/water/waterquality/wqgs-wqos/approved-
wqgs/nutrients-or.pdf
BC MoE. 2013a. Guidance for the Derivation and Application of Water Quality Objectives in British Columbia.
Water Protection and Sustainability Branch, Environmental Sustainability and Strategic Policy Division,
Ministry of Environment. April 2013.
BC MoE. 2013b. British Columbia Field Sampling Manual for Continuous Monitoring and the Collection of Air, Air
Emission, Water, Wastewater, Soil, Sediment, and Biological Sample. 2013 Edition. Water, Air and
Climate Change Branch, Ministry of Water, Land and Air Protection. January 2013.
BC MoE. 2017a. British Columbia Approved Water Quality Guidelines: Aquatic Life, Wildlife and Agriculture.
Victoria BC: British Columbia Ministry of Environment. January 2017. Available at:
http://www2.gov.bc.ca/assets/gov/environment/air-land-water/water/waterquality/wqgs-wqos/approved-
wqgs/wqg_summary_aquaticlife_wildlife_agri.pdf
BC MoE. 2017b. British Columbia Working Water Quality Guidelines: Aquatic Life, Wildlife and Agriculture. Victoria
BC: British Columbia Ministry of Environment. Available at:
http://www2.gov.bc.ca/assets/gov/environment/air-land-water/water/waterquality/wqgs-
wqos/bc_env_working_water_quality_guidelines.pdf
Bigg MA. 1985. Status of the Steller sea lion (Eumetopias jubatus) and California sea lion (Zalophus cahfornianus)
in British Columbia. Canadian Special Publication of Fisheries and Aquatic Sciences 77: 20 p.
Birtwell I. 1999. The Effects of Sediment on Fish and Their Habitat. West Vancouver BC: Marine Environment and
Habitat Sciences Division, Science Branch, Fisheries and Oceans Canada.

STAGE 2 ENVIRONMENTAL IMPACT STUDY
12 March 2018 Report No. 1525010-119-R-Rev0 96
Bisson P, Bilby R. 1982. Avoidance of Suspended Sediment by Coho Salmon. North American Journal of Fisheries
Management 4: 371–74.
Black and Veatch. 2015. Conceptual and Preliminary Design of Influent and Outfall Upgrades at AIWWTP,
Technical Memorandum 5: New Outfall Conceptual Design. Volume 1: Hydraulics. Prepared for Metro
Vancouver. Burnaby BC: Black and Veatch. 26 April 26 2015. 178 p.
Black & Veatch, 2015. Conceptual and Preliminary Design of Influent and Outfall Upgrades at AIWWTP, Technical
Memorandum 5: New Outfall Conceptual Design, Volume 1: Hydraulics. Prepared for Metro Vancouver.
Burnaby, BC: Black and Veatch, April 2015.
Bull J. 2004. Status of Water, Sediment, and Fish Quality in the Lower Fraser River (Hope to the Mouth), from
1971 to 2003. Ministry of Water, Land & Air Protection, March 2004. 78 p.
Caldwell DJ, Mastrocco F, Hutchinson TH, Lange R, Heijerick D, Janssen C, Anderson PD and Sumpter JP. 2008.
Derivation of an Aquatic Predicted No-Effect Concentration for the Synthetic Hormone, 17α- Ethinyl
Estradiol. Environ. Sci. Technol, 42 7046-7054.
Campbell PGC, Chapman PM, Hale B. 2006. Risk Assessment of Metals in the Environment. In: Hester RE and
Harrison RM, editors. Chemicals in the Environment: Assessing and Managing Risk. Cambridge UK:
Royal Society of Chemistry. p. 102–131.
Caux P-Y, Moore DRJ, MacDonald D. 1997. Ambient Water Quality Guidelines (Criteria) for Turbidity, Suspended
and Benthic Sediments: Technical Appendix. Prepared for BC Ministry of Environment, Lands and Parks.
Cadmus Group Inc. and MacDonald Environmental Sciences Ltd. April 1997. 146 p. Availabel at:
https://www2.gov.bc.ca/assets/gov/environment/air-land-water/water/waterquality/wqgs-wqos/approved-
wqgs/turbidity-tech.pdf
CCME (Canadian Council of Ministers of the Environment). 1999. Canadian Water Quality Guidelines for the
Protection of Aquatic Life: Polycyclic Aromatic Hydrocarbons. Winnipeg MB: Canadian Council of
Ministers of the Environment. Available at: http://ceqg-rcqe.ccme.ca/download/en/201
CCME. 2006. Permethrin - Canadian Water Quality Guidelines for the Protection of Aquatic Life. Canadian
Environmental Quality Guidelines, Canadian Council of Ministers of the Environment. Available at:
http://ceqg-rcqe.ccme.ca/download/en/202.
CCME. 2008. Technical Supplement 2. Canada-wide Strategy for the Management of Municipal Effluent.
Environmental Risk Management: Framework and Guidance. June 2008. Available at:
http://www.ccme.ca/files/Resources/municipal_wastewater_efflent/mwwe_techsuppl2_ermm_guidance_
e.pdf Accessed: 29 May
2017.http://www.ccme.ca/files/Resources/municipal_wastewater_efflent/mwwe_techsuppl2_ermm_guid
ance_e.pdf Accessed: 29 May 2017.
CCME. (Canadian Council of Minister of the Environment). 2008. Technical Supplement 2. Canada-wide Strategy
for the Management of Municipal Effluent. Environmental Risk Management: Framework and Guidance.
June 2008.
http://www.ccme.ca/files/Resources/municipal_wastewater_efflent/mwwe_techsuppl2_ermm_guidance_
e.pdf Accessed: 29 May 2017
STAGE 2 ENVIRONMENTAL IMPACT STUDY
12 March 2018 Report No. 1525010-119-R-Rev0 97
CCME. 2009. Canada-wide Strategy for the Management of Municipal Wastewater Effluent. Available at:
http://www.ccme.ca/files/Resources/municipal_wastewater_efflent/cda_wide_strategy_mwwe_final_e.pd
f
CCME. 2010. Canadian Environmental Water Quality Guidelines for the Protection of Aquatic Life for Ammonia.
Available at: http://ceqg-rcqe.ccme.ca/download/en/141
CCME. 2016. Canadian Environmental Water Quality Guidelines for the Protection of Aquatic Life. Available at:
http://st-ts.ccme.ca/en/index.html?chems=all&chapters=1
CDM Smith (CDM Smith Canada ULC). 2017. Multiport Diffuser Design and Initial Dilution Modeling Report,
Annacis Island WWTP Transient Mitigation and Outfall Project. Final draft. Prepared for Metro Vancouver.
Burnaby BC: CDM Smith Canada ULC. 24 July 2016. (Report included in Appendix A)
Chapman PM, Wang F, Janssen C, Persoone AH. 1998. Ecotoxicology of metals in aquatic sediments: Binding
and release, bioavailability, hazard, risk and remediation. Canadian Journal of Fisheries Aquatic Sciences
55: 2221-2243.
Chapman PM, Wang F. 2000. Issues in Ecological Risk Assessment of Inorganic Metals and Metalloids. Human
and Ecological Risk Assessment 6: 965–988.
City of Richmond. 2015. Fishing Piers & Boating. City of Richmond. Available at:
http://www.richmond.ca/parks/waterfront2/fishingpiers.htm
Cohen BI. 2012. Cohen Commission of Inquiry into the Decline of Sockeye Salmon in the Fraser River (Canada).
The Uncertain Future of Fraser River Sockeye. Volume 1: The Sockeye Fishery. Final Report - October
2012. Ottawa ON: Public Works and Government Services Canada. 722 p. Available at:
http://publications.gc.ca/site/eng/432516/publication.html
COSEWIC (Committee on the Status of Endangered Wildlife in Canada). 2003. Canadian Species at Risk.
November 2003. Available at: http://www.cosewic.gc.ca/htmlDocuments/sar_2003_11_e.htm
COSEWIC. 2013. COSEWIC assessment and status report on the Steller Sea Lion, Eumetopias jubatus, in
Canada. Ottawa ON: Committee on the Status of Endangered Wildlife in Canada. 65 p. Available at:
http://www.sararegistry.gc.ca/virtual_sara/files/cosewic/sr_Steller%20Sea%20Lion_2013_e.pdf.
Cullen DL, MB Yunker, C Alleyne, NJ Dangerfield, S O’Neill, MJ Whiticar and P Ross. 2009. Persistent organic pollutant in chinook salmon (Oncorhynchus tshawytscha): implications for resident killer whales of British
Columbia and adjacent waters. Environmental Toxicology and Chemistry 28:148–161.
Dadswell JV. 1990. Microbiological aspects of water quality and health. Water and Environment Journal 4: 515 -
519.
DFO (Department of Fisheries and Oceans Canada). 2013a. Communal Fishing Licences. Fisheries and Oceans
Canada. Available at: http://www.pac.dfo-mpo.gc.ca/abor-autoc/licences-permis-eng.html
DFO. 2013b. Fraser River Fisheries Information. Fisheries and Oceans Canada. Available at: http://www.pac.dfo-
mpo.gc.ca/fm-gp/fraser/abor-autoc-eng.html#Lower_Fraser_River
DFO. 2014. Small Craft Harbours. Fisheries and Oceans Canada. Available at: http://www.dfo-mpo.gc.ca/sch-
ppb/home-accueil-eng.htm
STAGE 2 ENVIRONMENTAL IMPACT STUDY
12 March 2018 Report No. 1525010-119-R-Rev0 98
DFO. 2015a. 2015/2016 Salmon Integrated Fisheries Management Plan Southern BC. Available at:
http://www.dfo-mpo.gc.ca/Library/358101.pdf
DFO. 2015b. Fraser River Fisheries Archived Reports - Lower Fraser River 2013 Salmon Catch Reports. Fisheries
and Oceans Canada. Available at: http://www.pac.dfo-mpo.gc.ca/fm-gp/fraser/archives-a-eng.html
DFO. 2015c. Finfish Species and Limits Table (Other than salmon). Available at: http://www.pac.dfo-mpo.gc.ca/fm-
gp/rec/species-especes/fintable-tableaupoisson-eng.html
DFO. 2016. Area 29 - Pacific Region Sanitary Closures. Available at: http://www.pac.dfo-mpo.gc.ca/fm-
gp/contamination/sani/area-secteur-29/area-secteur-29-eng.html.
Dodds WK, VH Smith and K Lohman. 2002. Nitrogen and phosphorus relationships to benthic algal biomass in
temperate streams. Canadian Journal of Fisheries and Aquatic Science 59: 865–874.
ECHA (European Chemicals Agency). 2017. Guidance on Information Requirements and Chemical Safety
Assessment. Chapter R.11: PBT/vPvB Assessment. Version 3.0. June 2017. Available at:
https://echa.europa.eu/documents/10162/13632/information_requirements_r11_en.pdf
EIFAC (European Inland Fisheries Advisory Commission). 1964. Water Quality Criteria for European Freshwater
Fish. Report on finely divided solids and inland fisheries. European Inland Fisheries Advisory Commission.
Food and Agriculture Organization of the United Nations. Rome. EIFAC/1. 21 p.
ENKON (ENKON Environmental Limited). 2009. Fraser River Ambient Monitoring Program: 2007 Fish Sampling.
Prepared for Metro Vancouver. Surrey BC: ENKON Environmental Limited.
ENKON. 2013a. Receiving environment monitoring program for Metro Vancouver’s Fraser River wastewater treatment plants: 2011 initial dilution zone boundary sampling. Prepared for Metro Vancouver. Surrey BC:
ENKON Environmental Limited. October 2013.
ENKON. 2013b. Receiving environment monitoring program for Metro Vancouver’s Fraser River wastewater treatment plants: 2012 initial dilution zone boundary sampling. Prepared for Metro Vancouver. Surrey BC:
ENKON Environmental Limited. November 2013.
ENKON. 2014. Fraser River Ambient Monitoring Program – 2012 Fish Sampling. Prepared for Metro Vancouver.
Surrey BC: ENKON Environmental Limited. July 2014.
ENKON. 2015a. Fraser River Ambient Monitoring Program 2014 Water Column Monitoring. Prepared for Metro
Vancouver. Surrey BC: ENKON Environmental Limited. May 2015.
ENKON. 2015b. Receiving environment monitoring program for Metro Vancouver’s Fraser River wastewater treatment plants: 2013 initial dilution zone boundary sampling. Prepared for Metro Vancouver. Surrey BC:
ENKON Environmental Limited. March 2015.
ENKON. 2016a. Fraser River Ambient Monitoring Program – 2016 Water Monitoring. Prepared for Metro
Vancouver. Surrey BC: ENKON Environmental Limited. November 2016
ENKON. 2016b. Fraser River Ambient Monitoring Program – 2016 Sediment Monitoring. Prepared for Metro
Vancouver Surrey BC: ENKON Environmental Limited. December 2016
Environment Canada. 1995. Toxic Substances Management Policy. Available at:
http://publications.gc.ca/collections/Collection/En40-499-1-1995E.pdf

STAGE 2 ENVIRONMENTAL IMPACT STUDY
12 March 2018 Report No. 1525010-119-R-Rev0 99
Environment Canada. 2000. Biological Test Method: Reference Method for Determining Acute Lethality of Effluent
to Daphnia magna. Second Edition. EPS 1/RM/14, December 2000. Environment Canada, Science and
Technology Branch, Ottawa, ON. 34 pp.
Environment Canada. 2001. Canadian Environmental Protection Act. Priority Substances List Assessment Report.
Ammonia in the Aquatic Environment. February 2001. Available at:
https://www.canada.ca/content/dam/hc-sc/migration/hc-sc/ewh-semt/alt_formats/hecs-
sesc/pdf/pubs/contaminants/psl2-lsp2/ammonia/ammonia-eng.pdf
Environment Canada. 2004. Canadian Guidance Framework for the Management of Phosphorus in Freshwater
Systems. Ecosystem Health: Science-based Solutions. National Guidelines and Standards, Report No. 1-
8. Ottawa ON: National Guidelines and Standards Office, Water Policy and Coordinate Directorate,
Environment Canada. February 2004. Available at: http://publications.gc.ca/collections/Collection/En1-34-
8-2004E.pdf
Environment Canada. 2007a. Biological Test Method: Reference Method for Determining Acute Lethality of
Effluents to Rainbow Trout. EPS 1/RM/13, Second edition. Ottawa ON: Method Development and
Application Section, Environmental Technology Centre, Environment Canada. 36 pp.
Environment Canada. 2007b. Pharmaceuticals and personal care products in the Canadian Environment:
Research and Policy Directions. Workshop Proceedings, 5-7 March 2017, Queen’s Landing Inn, Niagara-
on-the-lake, Ontario, Canada. NWRI Scientific Assessment Report Series No. 8. Available at:
http://publications.gc.ca/collections/collection_2008/ec/En13-2-8-2007E.pdf
Environment Canada. 2008a. Biological Test Method: Procedure for pH stabilization during the testing of acute
lethality of wastewater effluent to rainbow trout. EPS 1/RM/50, First edition. Ottawa ON: Method
Development and Application Section, Environmental Technology Centre.
Environment Canada. 2007c. Biological Test Method: Test of Reproduction and Survival using the Cladoceran
Ceriodaphnia dubia. Second Edition. EPS 1/RM/21, February 2007. Environment Canada, Science and
Technology Branch, Ottawa, ON. 100 pp.
Environment Canada. 2008a. Procedure for pH Stabilization During the Testing of Acute Lethality of Wastewater
Effluent to Rainbow Trout. EPS 1/RM/50. March 2008. Environment Canada, Science and Technology
Branch, Ottawa, ON. 36 pp.
Environment Canada. 2008b. CEPA Environmental Registry. Available at:
http://www.ec.gc.ca/CEPARegistry/SandT/Research.cfm. Accessed: December 18, 2008.
Environment Canada. 2011. Biological Test Method: Test of Larval Growth and Survival using Fathead Minnows.
Second Edition. EPS 1/RM/22, February 2011. Environment Canada, Science and Technology Branch,
Ottawa, ON. 100 pp.
Environment Canada. 2013. Canadian Environmental Protection Act, 1999. Federal Environmental Quality
Guidelines Polybrominated Diphenyl Ethers (PBDEs). Available at: https://www.ec.gc.ca/ese-
ees/05DF7A37-60FF-403F-BB37-0CC697DBD9A3/FEQG_PBDE_EN.pdf.
Environment Canada. 2016. National Wildlife Areas. Available at: https://ec.gc.ca/ap-
pa/default.asp?lang=En&n=2BD71B33-1.

STAGE 2 ENVIRONMENTAL IMPACT STUDY
12 March 2018 Report No. 1525010-119-R-Rev0 100
EVS (EVS Environment Consultants). 1996 Annacis Island WWTP Predischarge Monitoring Study:
Reconnaissance Water Quality and Biological Monitoring Results. Prepared for Greater Vancouver
Sewage and Drainage District and ABR Consultants. Vancouver BC: EVS Environment Consultants.
March 1996.
Forbes I. 2015. Fishing the Fraser River, BC. Sportfishing the Fraser River, British Columbia, Canada. Available
at: http://www.bcadventure.com/ianforbes/fraser/fraser.phtml
FRAP (Fraser River Action Plan). 1999a. Section 3.2 – Water Quality in the Fraser River Basin. Available at:
http://publications.gc.ca/collections/collection_2015/ec/En47-119-1999-5-eng.pdf.
FRAP. 1999b. Section 3.5 - Sediment Quality in the Fraser River Basin. Available at:
https://www.for.gov.bc.ca/hfd/library/ffip/brewer_r1999.pdf. Accessed July 2016
FRAP. 1999c. Section 3.8 – Fish Health Assessment. Available at:
http://publications.gc.ca/collections/collection_2015/ec/En47-119-1999-11-eng.pdf Accessed July 2016
FREMP (Fraser River Estuary Management Program). 1996. The Fraser River Estuary Environmental Quality
Report. Fraser River Estuary Management Program, Burnaby, B.C. Available at:
https://www.for.gov.bc.ca/hfd/library/ffip/brewer_r1999.pdf.
FREMP. 2003. Fraser River Estuary Management Plan: A Living Working River. Updated 2003.
FREMP. 2006. Environmental Management Strategy for Dredging in the Fraser River Estuary.
Gartner Lee Limited. 2003. Proposed Receiving Monitoring Programs for the Annacis Island, Lulu Island and
Northwest Langley Wastewater Treatment Plants. Prepared for the Greater Vancouver Regional District,
Burnaby, BC by Gartner Lee Ltd., Burnaby, in association with Seaconsult Research Ltd., Salt Spring
Island and Ecostat Research, North Saanich, BC.
Golder (Golder Associates Ltd.). 2016. Annacis Island Wastewater Treatment Plant Transient Mitigation and
Outfall Project, Stage 1 Environmental Impact Study. Prepared for Metro Vancouver. Vancouver BC:
Golder Associates Ltd. 26 August 2016.
Government of Canada. 1999. Canadian Environmental Protection Act, 1999. S.C. 1999, c. 33. Current to 02 June
2017. Ottawa ON: Minister of Justice. Available at: http://laws-lois.justice.gc.ca/eng/acts/c-15.31/page-
1.html
GVS&DD (Greater Vancouver Sewerage and Drainage District). 2012. Wastewater. The Greater Vancouver
Sewerage and Drainage District Quality Control Annual Report 2011. Environmental Management and
Quality Control Division of the Liquid Waste Services Department, Metro Vancouver.
GVS&DD. 2013. Wastewater. The Greater Vancouver Sewerage and Drainage District Quality Control Annual
Report 2012. Environmental Management and Quality Control Division of the Liquid Waste Services
Department, Metro Vancouver.
GVS&DD. 2014. Wastewater. The Greater Vancouver Sewerage and Drainage District Environmental
Management and Quality Control Annual Report 2013. Environmental Management and Quality Control
Division of the Liquid Waste Services Department, Metro Vancouver.
STAGE 2 ENVIRONMENTAL IMPACT STUDY
12 March 2018 Report No. 1525010-119-R-Rev0 101
GVS&DD. 2015. Wastewater. The Greater Vancouver Sewerage and Drainage District Environmental
Management and Quality Control Annual Report 2014. Environmental Management and Quality Control
Division of the Liquid Waste Services Department, Metro Vancouver.
GVS&DD. 2016. Wastewater. The Greater Vancouver Sewerage and Drainage District Environmental
Management and Quality Control Annual Report 2015. Environmental Management and Quality Control
Division of the Liquid Waste Services Department, Metro Vancouver.
GVS&DD. 2017. Wastewater. The Greater Vancouver Sewerage and Drainage District Environmental
Management and Quality Control Annual Report 2016. Environmental Management and Quality Control
Division of the Liquid Waste Services Department, Metro Vancouver.
Healey MC. 1991. Pacific Salmon Life Histories. Groot C, Margolis L, editors. Vancouver BC: University of British
Columbia Press.
Health Canada. 1999. Devices for use in Swimming Pools and Spas. Available at
http://publications.gc.ca/collections/Collection/H113-1-23-1999E.pdf.
Health Canada. 2017. Guidelines for Canadian Drinking Water Quality Summary Table. Available at:
https://www.canada.ca/content/dam/hc-sc/migration/hc-sc/ewh-semt/alt_formats/pdf/pubs/water-
eau/sum_guide-res_recom/sum_guide-res_recom-eng.pdf.
Hope B. 2012. Acquisition of Polychlorinated Biphenyls (PCBs) By Pacific Chinook Salmon: An Exploration of
Various Exposure Scenarios. Integrated Environmental Assessment and Management 8: 553–562
Hsu R. 2014. Dyke Road (between No. 4 & 5 Road), Richmond. Available at:
http://www.fishingwithrod.com/articles/region_two/dyke_road_richmond_2.html
IBA (Important Bird Area). 2016. Important Bird Areas in Canada. Available at: http://www.ibacanada.ca/.
IPCS (International Programme on Chemical Safety). 1997. Ethinylestradiol. Available at:
http://www.inchem.org/documents/pims/pharm/pim221.htm
Jirka GH, Doneker RL, Hinton SW. 1996. User’s Manual for CORMIX: A Hydrodynamic Mixing Zone Model and Decision Support System for Pollutant Discharges into Surface Waters. Prepared for the Office of Science
and Technology, United States Environmental Protection Agency. Ithaca NY: DeFrees Hydraulics
Laboratory, School of Civil and Environmental Engineering, Cornell University. Cooperative Agreement
No. CX824847-01-0. Available at: https://www.epa.gov/sites/production/files/2015-10/documents/cormix-
users_0.pdf
Johannessen S, Macdonald R, Burd B, van Roodselaar A, Bertold S. 2015. Local environmental conditions
determine the footprint of municipal effluent in coastal waters: A case study in the Strait of Georgia, British
Columbia. Science of the Total Environment, 508: 228-239.
Kelly BC, Ikonomou MG, Macpherson N, Sampson T, Patterson DA and Dubetz C. 2011. Tissue residue
concentrations of organohalogens and trace elements in adult pacific salmon returning to the Fraser River,
British Columbia, Canada. Environmental Toxicology and Chemistry, 30: 367–376.
Keystone (Keystone Environmental Ltd). 2011. Report of Findings Fraser River Ambient Monitoring Program 2011
Sediment Sampling. Prepared for Metro Vancouver. Vancouver BC: Keystone Environmental Ltd.
December 2011. p. 630
STAGE 2 ENVIRONMENTAL IMPACT STUDY
12 March 2018 Report No. 1525010-119-R-Rev0 102
Lewis WM Jr, McCutchan JH Jr. 2010. Ecological responses to nutrients in streams and rivers of the Colorado
mountains and foothills. Freshwater Biology, 55:1973-1983.
Levy DA. 1992. Potential impacts of global warming on salmon production in the Fraser River watershed. Canadian
Technical Report of Fisheries and Aquatic Science 1889.
Luoma SN, Rainbow PS. 2008. Metal Contamination in Aquatic Environments – Science and Lateral Management. Cambridge University Press, New York, NY, USA.
LWMP (Liquid Waste Management Plan) Environmental Monitoring and Assessments Technical Committee. 1997.
Annacis Island Wastewater Treatment Plant Pre-Discharge Monitoring Dilution/Dispersion Study. April
1997. 472p.
McDonald DD, Ikonomou MG, Rantalaine A-L, Rogers H, Sutherland D, Oostdam JV. 1997. Contaminants in White
Sturgeon (Acipenser tranmontanus) from the upper Fraser River, British Columbia, Canada.
Environmental Toxicology and Chemistry, 16: 479–490
McKean CJP, Nagpal NK.1991. Ambient Water Quality Criteria for pH – Technical Appendix. Victoria BC: Water
Quality Branch, Water Management Division, BC Ministry of Environment. June 1991.
McPhail JD. 2007. The freshwater fishes of British Columbia. Edmonton AB: The University of Alberta Press. 620
p.
Meays CL. 2012. Derivation of water quality criteria to protect aquatic life in British Columbia. Victoria BC: British
Columbia Ministry of Environment, Science & Information Branch. Available at:
http://www.env.gov.bc.ca/wat/wq/pdf/wq-derivation.pdf.
Metro Vancouver. 2009. Delta-South Surrey Regional Greenway. Available at:
http://www.metrovancouver.org/services/parks/parks-greenways-reserves/delta-south-surrey-regional-
greenway
Metro Vancouver. 2010. Integrated Liquid Waste and Resource Management. A Liquid Waste Management Plan
for the Greater Vancouver Sewerage & Drainage District and Member Municipalities. Metro Vancouver.
May 2010. Available at: http://www.metrovancouver.org/services/liquid-
waste/LiquidWastePublications/IntegratedLiquidWasteResourceManagementPlan.pdf
Metro Vancouver. 2014. 2013 Regional Parks Visitors Survey. Available at: http://
http://www.metrovancouver.org/services/parks/ParksPublications/VisitorSurveyReport-2014-07-10.pdf
Metro Vancouver. 2015. Regional Parks & Greenways, Municipal and Provincial Parks & Protected Areas Map –
Available at:
http://www.metrovancouver.org/services/parks/ParksPublications/Regional_Parks_Greenways_Municipa
l_Provincial_Parks_Protected_AreasMap-2015May11.pdf
Milliman JD. 1980. Sedimentation in the Fraser River and its estuary, Southwestern British Columbia (Canada).
Estuarine Coast. Mar. Sci. 10: 609 – 633.
Moffat and Nichol. 2012. Vancouver Airport Fuel Delivery Project - Chapter 6: Social and Economic Effects.
Available at: https://a100.gov.bc.ca/appsdata/epic/html/deploy/epic_document_346_33124.html
STAGE 2 ENVIRONMENTAL IMPACT STUDY
12 March 2018 Report No. 1525010-119-R-Rev0 103
Muck J. 2010. Biological Effects of Sediment on Bull Trout and Their Habitat - Guidance for Evaluating Effects.
Washington Fish and Wildlife Office, US Fish and Wildlife Service. 13 July 2010. 57 p. Available at:
https://www.fws.gov/wafwo/documents/2010FinalSedimentDoc.pdf
Nelson TC, Gazey WJ, English KK, Rosenau ML. 2004. Status of White Sturgeon in the Lower Fraser River.
Report on the Findings of the Lower Fraser River White Sturgeon Monitoring and Assessment Program
(1999-2004). Prepared for the Fraser River Sturgeon Conservation Society. LGL Environmental Research
Associates. December 2004. Available at:
http://www.frasersturgeon.com/media/2_StatusofWhiteSturgeonintheLowerFraserRiver1999-2004.pdf
Newcombe CP, MacDonald DD. 1991. Effects of Suspended Sediments on Aquatic Ecosystems. North American
Journal of Fisheries Management 11: 72–82.
Newcombe CP, Jensen JOT. 1996. Channel Suspended Sediment and Fisheries: a Synthesis for Quantitative
Assessment of Risk and Impact. North American Journal of Fisheries Management
16: 693–727.
Nordin RN. 1985. Water Quality Criteria for Nutrients and Algae: Technical Appendix. Victoria BC: Ministry of
Environment and Parks, British Columbia, Water Quality Unit, Resource Quality Section, Water
Management Branch.
Northcote TG, Johnston NT, Tsumura K. 1976. Trace Metal Concentrations in Lower Fraser River Fishes.
Technical Report No. 7. Wastewater Research Centre, University of BC, Vancouver, BC. 41 p.
Olesiuk PF, Bigg MA, Ellis GM. 1990. Recent trends in the abundance of harbour seals, Phoca vitulina, in British
Columbia. Canadian Journal of Fisheries and Aquatic Sciences 47:992–1003.
https://dr6j45jk9xcmk.cloudfront.net/documents/1006/3-6-12-protocol-for-analytical-methods-en.pdf
Oliver GG and LE Fidler. 2001 Towards a water quality guideline for temperature in the Province of British
Columbia. Ministry of Environment, Lands and Parks, Victoria, BC.
Ontario Ministry of the Environment (OMOE). 2011. Protocol for Analytical Methods Used in the Assessment of
Properties under Part XV.1 of the Environmental Protection Act. March 9, 2004, amended as of July 1,
2011. Laboratory Services Branch Ministry of the Environment. Available at:
https://dr6j45jk9xcmk.cloudfront.net/documents/1006/3-6-12-protocol-for-analytical-methods-en.pdf
Raymond BA, Shaw DP, Kim K, Nener J, Baldazzi C, Brewer R, Moyle G, Sekela M and Tuominen T. 1999.
Vancouver BC: Fraser River Action Plan Resident Fish Contaminant and Health Assessment. Aquatic and
Atmospheric Sciences Division, Environment Canada. DOE FRAP 1998-20.
Richardson JS, Lissimore TJ, Healey MC, Northcote TG. 2000. Fish Communities of the Lower Fraser River
(Canada) and a 21-Year Contrast. Environmental Biology of Fishes, 59(2): 125–40.
Robertson M, Scruton D, Gregory RS, Clarke KD. 2006. Effect of suspended sediment of freshwater fish and fish
habitat. Canadian Technical Report of Fisheries and Aquatic Sciences 2644: 42 p.
Rosenau ML, Angelo M. 2007. Saving the heart of the Fraser: Addressing human impacts to the aquatic ecosystem
of the Fraser River, Hope to Mission, British Columbia. Vancouver BC: Pacific Fisheries Resource
Conservation Council. 137 p.
STAGE 2 ENVIRONMENTAL IMPACT STUDY
12 March 2018 Report No. 1525010-119-R-Rev0 104
Salo EO. 1991. Pacific Salmon Life Histories. Edited by C. Groot and L. Margolis. Vancouver BC: University of
British Columbia Press.
Seaconsult Marine Research Ltd., 1995. Dispersion Analysis of Annacis Island Sewage Treatment Plant Effluent
in the Fraser River Estuary. March 1995. 126 p.
Seaconsult Marine Research Ltd., 1995. Dispersion Analysis of Annacis Island Sewage Treatment Plant Effluent
in the Fraser River Estuary. March 1995.
Servizi J, Martens D. 1987. Some Effects of Suspended Fraser River Sediments on Sockeye Salmon
(Oncorhynchus nerka). Canadian Special Publication of Fisheries and Aquatic Sciences 96: 254–64.
Servizi J, Gordon R. 1990. Acute Lethal Toxicity of Ammonia and Suspended Sediment Mixtures to Chinook
Salmon (Oncorhynchus tshawytscha). Bulletin of Environmental Contamination and Toxicology 44: 650–56.
Shelter Island Marina & Boatyard Inc. 2015. Shelter Island Marina and Boatyard. Available at:
http://www.shelterislandmarina.com/
Shrivastava I, Adams EE. Analysis of Mixing Performance of a Tee Diffuser in Flowing Ambient (unpublished
manuscript).
Swain LG, Walton DG, Phippen B, Lewis H, Brown S, Bamford G, Newsom D, Lundman I. 1998. Water Quality
Assessment and Objectives for the Fraser River from Hope to Sturgeon and Roberts Banks. First Update.
Victoria BC: Ministry of Environment, Lands and Parks.
Sylvestor S, Brewer R, Sekela M, Tuominen T, Moyle G. 1998. Survey of contaminants in suspended sediment
and water in the Fraser River Basin from McBride to Vancouver (1996). Aquatic and Atmospheric Sciences
Division, Environmental Conservation Branch, Pacific and Yukon Region, Environment Canada.
Sylvestor S, Brewer R, Sekela M, Tuominen T, Moyle G. 1998. Survey of contaminants in suspended sediment
and water in the Fraser River Basin from McBride to Vancouver (1996). Vancouver. Aquatic and
Atmospheric Sciences Division, Environmental Conservation Branch, Pacific and Yukon Region,
Environment Canada.
Tank JL, Dodds WL. 2003. Nutrient limitation of epilithic and epixylic biofilms in ten North American streams.
Freshwater Biology 48: 1031-1049.
Thomas GP. 2007. Receiving Environment Monitoring Program for the GVRD’s Fraser River Wastewater Treatment Plants: 2006 Sediment Quality Survey. Prepared for the Greater Vancouver Regional District.
Surrey BC: G3 Consulting Ltd.
Tri-Star (Tri-Star Environmental Consulting). 2015. Potential effluent discharge objectives for the Annacis Island
wastewater treatment plant. Prepared for Metro Vancouver. Burnaby BC: Tri-Star Environmental
Consulting. July 2015.
United Nations Environment Programme (UNEP). 2009. Stockholm Convention on Persistent Organic Pollutants
(POPs) as amended in 2009. Available at:
http://chm.pops.int/TheConvention/Overview/TextoftheConvention/tabid/2232/Default.aspx
STAGE 2 ENVIRONMENTAL IMPACT STUDY
12 March 2018 Report No. 1525010-119-R-Rev0 105
US EPA (United States Environmental Protection Agency). 2013. Aquatic Life Ambient Water Quality Criteria for
Ammonia Freshwater. Available at: https://www.epa.gov/wqc/aquatic-life-criteria-ammonia.
US EPA. 2017. Regional Screening Levels (RSLs): Screening levels for Resident Tapwater. Available at:
https://semspub.epa.gov/work/03/2245089.pdf.
Water and Land Use Committee. 2006. Environmental Management Strategy for Dredging in the Fraser River
Estuary. Burnaby BC: Fraser River Estuary Management Program. 47p.
Wetzel R. 2001. Limnology: Lake and River Ecosystems. 3rd Ed. Academic Press. San Diego, CA. 850 pp.
WHO (World Health Organization). 2003. Guidelines for safe recreational water environments. Volume 1, Coastal
and Fresh Waters. World Health Organization. Available at:
http://apps.who.int/iris/bitstream/10665/42591/1/9241545801.pdf. Accessed: July 2016.
WHO. 2006. Guidelines for safe recreational water environments. Volume 2, Swimming Pools and Similar
Environments. World Health Organization. Available at:
www.who.int/water_sanitation_health/bathing/srwe2full.pdf.
12.2 Personal Communication
BCCSN (British Columbia Cetacean Sighting Network). 2013. Marine Mammal Howe Sound Sighting Data 1990 -
2013. Letter from Vancouver Aquarium Marine Science Centre. Email to Katelyn Zottenberg, Marine
Biologist, Golder Associates Ltd. 1 March 2013
Bui F. 2017. CDM Smith, Boston, USA. Email to Lilly Cesh, Golder Associates Ltd. 29 November 2017.
Hamelin T. 2017. Environment Protection Officer, Authorizations- South, BC Ministry of Environment, Surrey, BC.
Email to Ken Masse, Metro Vancouver. 5 April 2017.
Servos M. 2016. Professor, Department of Biology, University of Waterloo, Waterloo ON. Email to Elaine Irving,
Golder Associates Ltd. 22 August 2016.