Embed Size (px)
Citation preview

Plaistow Commuter Rail Extension Study
Alternatives Analysis Report – March 2015
APPENDIX I. NOISE AND VIBRATION ASSESSMENT

Noise and Vibration Impact Assessment
Plaistow Commuter Rail Extension Study Haverhill, MA to Plaistow, NH
January 30, 2015

Table of Contents Executive Summary ................................................................................................................ 3
Introduction ............................................................................................................................ 4
Noise Concepts................................................................................................................... 4
Vibration Concepts .............................................................................................................. 5
Impact Assessment Approach ................................................................................................ 7
Noise Impact Assessment Approach ................................................................................... 7
Vibration Impact Assessment Approach .............................................................................10
Inventory of Receptors ..........................................................................................................13
Measurements of Existing Condition .....................................................................................13
Existing Noise Measurements ............................................................................................13
Existing Vibration Measurements .......................................................................................15
Impact Assessment ...............................................................................................................16
Noise Impact Assessment ..................................................................................................16
Vibration Impact Assessment .............................................................................................17
Mitigation ...............................................................................................................................18
Noise Mitigation .................................................................................................................18
Additional Station and Layover Noise Mitigation.................................................................21
Vibration Mitigation ............................................................................................................22
Construction ..........................................................................................................................22
Construction Noise .............................................................................................................23
Construction Vibration ........................................................................................................24
Conclusion ............................................................................................................................24
References ............................................................................................................................25
Appendix A: Noise Contours – Alternative 1 ..........................................................................26
Appendix B: Noise Contours – Alternative 2 ..........................................................................27
Appendix C: Noise Contours – Alternative 3 ..........................................................................28
Appendix D: Vibration Contours.............................................................................................29
Appendix E: Noise Mitigation .................................................................................................30
Appendix F: Additional Station and Layover Noise Mitigation ................................................31
Appendix G: Construction Contours ......................................................................................32
2

Executive Summary The Plaistow Commuter Rail Extension Study is examining a proposed extension of the Massachusetts Bay Transportation Authority (MBTA) Haverhill Line commuter rail. The Haverhill Line currently serves as far north as Haverhill, MA, but the proposed project would extend operations northward to Plaistow, NH along existing track. HDR has performed a noise and vibration impact assessment for this project on behalf of the New Hampshire Department of Transportation (NHDOT).
Following methods from the Federal Transit Administration’s (FTA’s) “Transit Noise and Vibration Impact Assessment”1 (FTA 2006), HDR performed general noise and vibration assessments to evaluate project operations and construction. The proposed project would add 26 train movements per day between Plaistow, NH and Haverhill, MA, which is a rail corridor currently used by Amtrak and freight trains. Construction would be limited to a new Plaistow station and layover facility and associated track work; HDR evaluated three station and layover alternatives.
HDR measured existing noise levels throughout the project area, and used the existing levels to identify the appropriate noise impact criteria. HDR estimated noise levels from the proposed locomotives, railcars, locomotive horns, crossing signals, track crossovers, locomotive idling at the Plaistow station and layover tracks, and automobiles using the Plaistow station parking lot. Moderate and severe impacts were predicted for residences throughout the project area. These impacts could be mitigated by constructing sound walls and improving the noise insulation of select residential buildings adjacent to the tracks.
HDR measured existing vibration levels from train pass-bys within the project area. HDR estimated project vibration levels using methods from the FTA manual, which included an adjustment based on the measured existing levels. No impacts were predicted from general train pass-by vibration or the increased vibration from trains passing over track crossovers.
HDR evaluated noise and vibration from the construction of the proposed Plaistow station and layover alternatives. Three residences are located at the site of the Alternative 2 station and layover tracks, but they would be acquired if Alternative 2 were constructed. Aside from these residences, two residences could be annoyed by vibration from the construction of Alternative 1. HDR recommends minimizing the use of loaded trucks and large bulldozers within 79 feet of these residences if Alternative 1 is pursued.
1 Transit Noise and Vibration Impact Assessment (FTA-VA-90-1003-06) May 2006
3

Introduction The New Hampshire Department of Transportation (NHDOT) is considering an extension of the existing Massachusetts Bay Transportation Authority (MBTA) commuter rail Haverhill Line. The Haverhill Line currently operates between North Station in Boston, MA and Haverhill Station in Haverhill, MA. The proposed project would extend MBTA operations northward to Plaistow, NH, and would increase railroad activity on the existing tracks between Haverhill, MA and Plaistow, NH.
On behalf of NHDOT, HDR Engineering, Inc. (HDR) performed general noise and vibration assessments following the Federal Transit Administration’s (FTA’s) “Transit Noise and Vibration Impact Assessment” (FTA 2006). The study area is the area surrounding the existing tracks between Haverhill Station where train operations will be increased and three proposed alternatives for a new Plaistow Station and layover facility.
Alternative 1 would place the layover facility east of the tracks and to the south of New Hampshire Route 121 in Haverhill, MA. The station for this alternative is southeast of the tracks and adjacent to an existing park and ride lot near Westville Road in Plaistow, NH. Under Alternative 2 the station and layover facility are located together northwest of the tracks in the area of Joanne Drive in Plaistow, NH. Under Alternative 3 the station and layover facility are together, northwest of the tracks and southwest of New Hampshire Route 121A in Plaistow, NH.
This noise and vibration report describes existing conditions, proposed conditions, and the impact assessments.
Noise Concepts Sound is made up of tiny fluctuations in air pressure. Sound is characterized by its amplitude (how loud it is), frequency (or pitch), and duration. Sound, within the range of human hearing, can vary in amplitude by over one million units. Therefore, a logarithmic scale, known as the decibel (dB) scale, is used to quantify sound intensity and to compress the scale to a more manageable range. Noise is simply defined as unwanted sound; the terms noise and sound are often used interchangeably.
The human ear does not hear all frequencies equally. In fact, the human hearing organs of the inner ear deemphasize very low and very high frequencies. The most common weighting scale used to reflect this selective sensitivity of human hearing is the A-weighted sound level (dBA). The range of human hearing extends from approximately 3 dBA to around 140 dBA (all sound levels in this report are relative to 20 micropascals). Figure 1 illustrates noise levels for common noise sources.
4

Figure 1. Typical Noise Levels
Source: FTA 2006
Because of the logarithmic scale, sound levels cannot be simply added or subtracted. If sound energy is doubled, the sound level only increases by 3 dBA. However, a doubling of sound energy is not perceived by humans as a doubling of loudness. A 3-dBA change is considered a just noticeable difference, a 5-dBA change is considered a noticeable difference, and a 10-dBA change is considered a doubling or halving of loudness.
Most sounds are made up of a wide range of frequencies, and are termed broadband sounds. Sounds that are focused to a particular frequency are tonal sounds. Sound sources can be constant or time-varying. Environmental sound levels are often expressed over periods of time, allowing time-varying signals to be represented by sound levels averaged over intervals (for example, an hour).
Vibration Concepts Vibration consists of rapidly fluctuating motions. Its amplitude can be characterized using peak particle velocity (PPV), which is the maximum instantaneous vibration velocity. However, human response to vibration is a function of the average motion over a fixed time period, such as one second. The root mean square (RMS) amplitude of a motion over a one-second period is commonly used to assess human response to vibration. For convenience, decibel notation is used to describe vibration relative to a reference quantity. The FTA has adopted the notation VdB (for vibration decibels), which is a decibel relative to a reference quantity of one microinch per second (10⁻⁶ in/s).
Ground-borne vibration (GBV) can be a serious concern for residents or at facilities that are vibration-sensitive, such as laboratories or recording studios. The effects of ground-borne
5

vibration include perceptible movement of building floors, interference with vibration sensitive instruments, rattling of windows, and the shaking of items on shelves or hanging on walls. Additionally, GBV can cause the vibration of room surfaces resulting in ground-borne noise (GBN). Ground-borne noise is typically perceived as a low-frequency rumbling sound.
In contrast to airborne noise, GBV is not an everyday experience for most people. The background vibration level in residential areas is usually 50 VdB or lower—well below the threshold of perception for humans, which is around 65 VdB. Levels at which vibration interferes with sensitive instrumentation, such as medical imaging equipment or extremely high-precision manufacturing, can be much lower than the threshold of human perception. Most perceptible indoor vibration is caused by sources within a building such as the operation of mechanical equipment, movement of people, or slamming of doors. Typical outdoor sources of perceptible ground-borne vibration are construction equipment, steel-wheeled trains, and traffic on rough roads, though in most soils GBV dissipates very rapidly. Figure 2 illustrates common vibration sources and the human and structural response to GBV.
Figure 2. Typical Vibration Levels
Source: FTA 2006
6

Impact Assessment Approach HDR evaluated project noise and vibration to assess the potential for impacts as defined by the FTA. Following the procedures of the FTA manual (FTA 2006), screening procedures were used to identify the need for general assessments. This section describes the methods and criteria for these assessments.
Noise Impact Assessment Approach The FTA identifies three categories of noise-sensitive land uses for use in transit-related noise assessments. Table 1 describes these three categories.
Table 1. Noise-Sensitive Land Use Categories
Land Use Category
Noise Metric, dBA Description
1 Leq(h) Quiet is an essential element (for example, outdoor amphitheaters, outdoor pavilions, outdoor historical landmarks, recording studios, and concert halls)
2 Ldn Residences and buildings where people sleep (for example, homes, hospitals, and hotels)
3 Leq(h) Institutional lands used primarily during the day and evening (for example, schools, libraries, theaters, and churches)
Source: FTA 2006
Land use categories 1 and 3 are evaluated using the peak hour equivalent average sound level (Leq). The Leq is the constant sound level that is an equivalent exposure level to the actual time-varying sound level over the hour. The peak hour is the noisiest hour of project-related activity during periods of noise sensitivity. For example, only noise occurring during the school day is considered at a school. Land use category 2 is evaluated using the day-night sound level (Ldn), which is a 24-hour equivalent average with a 10-dB penalty applied to nighttime hours (10:00 PM to 7:00 AM).
To determine the need for a general noise assessment, a screening procedure was used. Based on Table 4-1 of the FTA manual, a commuter rail mainline has an unobstructed screening distance of 750 feet and a commuter rail grade crossing with horn noise has an unobstructed screening distance of 1600 feet. HDR identified noise-sensitive receptors within these screening distances, and therefore performed a general noise assessment.
The FTA’s general noise assessment (FTA 2006) has criteria based on the existing noise exposure. There are separate criteria for moderate impacts (which are considered noticeable but not expected to produce strong, adverse reactions) and severe impacts (which are expected to highly annoy a significant percentage of people). Additionally, land use categories 1 and 2 are given different criteria than land use category 3. Figure 3 depicts the moderate and severe impact criteria curves.
7
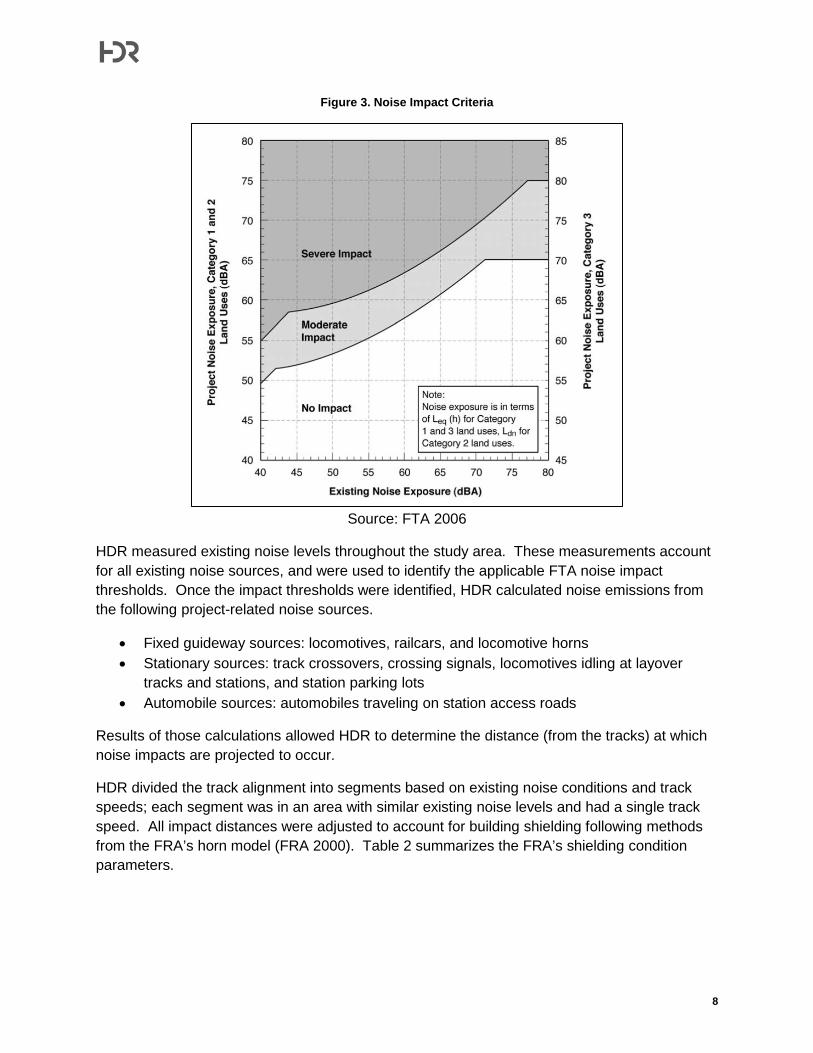
Figure 3. Noise Impact Criteria
Source: FTA 2006
HDR measured existing noise levels throughout the study area. These measurements account for all existing noise sources, and were used to identify the applicable FTA noise impact thresholds. Once the impact thresholds were identified, HDR calculated noise emissions from the following project-related noise sources.
• Fixed guideway sources: locomotives, railcars, and locomotive horns • Stationary sources: track crossovers, crossing signals, locomotives idling at layover
tracks and stations, and station parking lots • Automobile sources: automobiles traveling on station access roads
Results of those calculations allowed HDR to determine the distance (from the tracks) at which noise impacts are projected to occur.
HDR divided the track alignment into segments based on existing noise conditions and track speeds; each segment was in an area with similar existing noise levels and had a single track speed. All impact distances were adjusted to account for building shielding following methods from the FRA’s horn model (FRA 2000). Table 2 summarizes the FRA’s shielding condition parameters.
8

Table 2. Shielding Conditiona Parameters
Building Density Building Environment Dense Light Urban Suburban Rural
Shielding Value, dBA Shielding Distance, feet None None < 100 < 200 < 300 5.0 3.0 100 to 300 200 to 400 300 to 500 6.5 4.5 300 to 500 400 to 600 500 to 700 8.0 6.0 500 to 700 600 to 800 700 to 900 9.5 7.5 700 to 900 800 to 1,000 900 to 1,100 11.0 9.0 > 900 > 1,000 > 1,100
Note a: The shielding condition is selected based on the building density and land use in an area. There are five options: Dense Urban, Light Urban, Dense Suburban, Light Suburban, and Rural (only the Light building density is used for Rural).
Source: FRA 2000
HDR applied rural shielding to most of the corridor, primarily where land adjacent to the rail line is primarily undeveloped (the northern portion of the study area). HDR also applied light suburban shielding to an area where the density of development was greater than rural (from the area around Interstate 495 to the southern end of the study area).
The project would result in an increase in commuter rail activity between the new Plaistow Station and existing Haverhill Station. Plaistow Station would have 13 arrivals and 13 departures each day, with 19 of these movements occurring during daytime hours (7:00 AM to 10:00 PM) and 7 occurring during nighttime hours (10:00 PM to 7:00 AM). Based on the proposed train schedule, the peak hour was identified as 9:00 AM. This hour contains the maximum amount of three train movements and occurs during normal business and school day hours (when typical Category 1 and Category 3 land uses could be affected by noise).
Five trains would lay over at the proposed layover facility, which would support up to six trains. Each locomotive starts up 90 minutes prior to its scheduled departure, and relocates from the layover track to the station 30 minutes prior to its scheduled departure. The first locomotive is scheduled to start up at 3:25 AM to meet a 4:55 AM departure. Additional locomotive idling occurs at the station throughout the day as trains arrive and depart again, and at the end of the day each layover locomotive was assumed to idle for 10 minutes at the station and 20 minutes at the layover tracks to shut down. Table 3 summarizes the data used in the noise impact distance calculations.
9

Table 3. Noise Operations Input Data
Noise Source
Peak Hour Quantity
Daytime Quantity
Nighttime Quantity Speed Leq(h) at 50
feet, dBA Ldn at 50 feet, dBA
Locomotive 3 trains
with 1 loco each
19 trains with 1 loco
each
7 trains with 1 loco
each
40 mph 62 63
20 mph 65 66
Railcars 3 trains
with 9 cars each
19 trains with 9 cars
each
7 trains with 9 cars
each
40 mph 59 60
20 mph 53 54
Locomotive Horn 3 trains 19 trains 7 trains 40 mph 79 80
Crossovers 3 trains 19 trains 7 trains N/A 69 70
Crossing Signal
3 trains for 22 sec each
19 trains for 22 sec
each
7 trains for 22 sec each
N/A 56 57
Layover Train Idling N/A 1.00 hour
of idling 5.67 hours
of idling N/A N/A 77
Station Train Idling
0.33 hours of idling
2.15 hours of idling
2.67 hours of idling N/A 69 74
Station Parking Lot N/A 440
vehicles 200
vehicles N/A N/A 52
Station Access Road
N/A 440 vehicles
200 vehicles N/A N/A 49
Some sources have no Leq(h) presented in the table above; this indicates no Category 1 or Category 3 land uses were located near the noise source or the noise would occur at a time that would not affect the land uses (for example, the layover track idling would not occur during school day hours). The crossing signal and crossover exposure levels are at least 10 dB lower than the locomotive horn exposure levels, so the crossing signal and crossover sources were ignored on the segment where the locomotive horn was used (the logarithmic sum of 79 for the horn, 69 for a crossover, and 56 for the crossing signal equals 79). The station parking for Alternative 2 uses three separate lots, so the daytime and nighttime vehicle numbers were divided up based on the design capacity of each lot.
Vibration Impact Assessment Approach The FTA identifies four categories of vibration-sensitive land uses for use in transit-related vibration assessments. Table 4 describes these four categories.
10

Table 4. Vibration-Sensitive Land Use Categories
Land Use Category Description
1 Buildings where vibration would interfere with interior operations (e.g. research facilities, manufacturing facilities, and hospitals)
2 Residences and buildings where people sleep (e.g. homes, hospitals, and hotels)
3 Institutional land uses with primarily daytime use (e.g. schools, churches, and quiet offices)
Special Concert halls, TV studios, recording studios, auditoriums, and theaters Source: FTA 2006
HDR performed the FTA screening vibration assessment to determine the need for a general vibration assessment. Based on Table 9-2 of the FTA manual, a conventional commuter railroad has a Category 1 screening distance of 600 feet. HDR conservatively used 600 feet for all receptor types, and identified vibration-sensitive receptors within the screening distance. Therefore, HDR performed a general vibration assessment.
The FTA’s general vibration assessment has criteria based on land use category and frequency of vibration events. Table 5 contains the FTA’s vibration impact criteria.
Table 5. Vibration Impact Criteria
Land Use Category Impact Levels, VdB Frequent Events Occasional Events Infrequent Events
1 65 65 65 2 72 75 80 3 75 78 83
Special: concert halls and studios 65 65 65
Special: auditoriums and theaters 72 80 80
Frequent events: more than 70 vibration events of the same source per day Occasional events: between 30 and 70 vibration events of the same source per day Infrequent events: less than 30 vibration events of the same source per day
Source: FTA 2006
The proposed project includes 26 new train movements per day, so the “Infrequent Events” impact criteria apply.
The study area has existing Amtrak and freight train traffic, so existing vibration conditions must be considered. The existing trains account for more than 12 train movements per day, so the study area is considered a “heavily-used rail corridor” (FTA 2006). With 26 proposed train movements, the project would more than double the number of train movements per day. HDR measured vibration levels from existing train pass-bys and compared the measured levels to the FTA manual’s general vibration curves. Figure 4 illustrates these general vibration curves.
11

Figure 4. General Vibration Curves
Source: FTA 2006
The existing and proposed trains are locomotive-powered, so HDR used the top curve from the figure above. The curve is based on certain conditions, so adjustment factors are given in the FTA manual (FTA 2006). Table 6 summarizes the adjustment factors used by HDR.
Table 6. Vibration Adjustment Factors (VdB)
Land Use Category and Building Construction
Track Conditions
Coupling to Building
Foundation
Floor-to-Floor
Attenuation Floor
Amplification
1: 1-2 story masonry 0/+10 -7 0 0 2: Wood frame houses 0/+10 -5 -2 +6 3: 1-2 story masonry 0/+10 -7 0 0
Source: FTA 2006
No track adjustments were applied to the wayside vibration, but a 10-VdB increase was applied to the crossovers. Attenuation from building foundations and building structures was applied based on building types typical of the area. Category 1 and Category 3 buildings were assumed to be one to two story masonry structures on grade, so no floor-to-floor attenuation or floor amplification was applied. Category 2 residences were assumed to be wood frame houses with basements, so floor-to-floor attenuation was applied for one floor with floor amplification.
12

Note that the adjustment factors in the table above strictly relate to building adjustments and the increased vibration from track crossovers. HDR compared the measured vibration levels to the general vibration curve, and used the difference as an adjustment factor to account for the existing vehicle and geological conditions. HDR used the general vibration curve from Figure 4, the impact criteria from Table 6, and the adjustment factors to determine the distances at which existing vibration impacts are predicted to occur. Any receptors affected by existing vibration would experience additional vibration from the project because of the number of proposed trains.
Inventory of Receptors HDR identified noise- and vibration-sensitive receptors using the screening distance procedures from the FTA manual (FTA 2006). The majority of the receptors were residential, with some churches, cemeteries, and schools included. HDR identified no Category 1 noise receptors, but did identify one potential Category 1 vibration receptor. The potentially highly sensitive vibration receptor is a research and testing facility on Hale Street in Haverhill, MA. The exact sensitivity of this receptor is unknown, but it was assessed against the Category 1 impact criteria.
Measurements of Existing Condition HDR measured existing noise and vibration levels within the Project area from September 15 to 17, 2014. The selected monitoring locations represent existing conditions throughout the project study area. Existing sources of noise and vibration include freight and passenger trains, Interstate 495 and several state routes, and other sources typical of suburban areas.
Existing Noise Measurements HDR measured noise levels for 24-hour periods at six locations throughout the study area. The measurement locations were near and representative of noise-sensitive land uses. HDR selected the six locations to represent the various noise environments found within the study area so that the six measurements describe the existing noise condition for all project receptors. Figure 5 shows the noise measurement locations.
13

Figure 5. Map of Measurement Locations
14

HDR used digital sound level meters with 1/3 octave band filters to document the noise levels. The acoustic instrumentation and a handheld calibrator used by HDR meet Class 1/Type 1 precision requirements of ANSI and IEC standards. All instrumentation is calibrated on a regular basis by an independent accredited calibration laboratory using standards traceable to the National Institute of Standards and Technology. The instrumentation was adjusted to a reference level traceable to the National Institute of Standards and Technology prior to transportation to the measurement site. Calibration checks were performed in the field prior to and upon completion of each series of measurements. Following the guidance of ANSI/ASA S12.9-2013/Part 3 (ASA 2013), hours with precipitation or average wind speeds exceeding 11 miles per hour were excluded from all measured results
Table 7 summarizes the peak hour Leq and Ldn measured at each location.
Table 7. Measured Existing Noise Exposures
Monitoring Location Description Peak Hour
Leq, dBA Ldn, dBA
N1 Cashmans Field Playground, Haverhill 54 59 N2 Cul de sac at Eudora Street, Haverhill 55 60 N3 Holy Angels Kindergarten and Preschool, Plaistow 55 58 N4 Cul de sac at Bayberry Drive, Atkinson 43 50 N5 Park and ride lot on Westville Road, Plaistow 54 57 N6 Pollard Elementary School, Plaistow 49 62
The peak hour Leq was the measured level from the 9:00 AM hour; this hour contains the highest volume of project-related train traffic and occurs during normal business and school day hours. HDR used these measured noise levels to identify the appropriate impact criteria noise levels throughout the study area.
Existing Vibration Measurements HDR measured vibration levels from existing train pass-bys in the area of Cogswell Street and Bennington Street in Haverhill, MA. The location was 50 feet from the tracks, and was approximately at the same grade as the tracks. Figure 5 above shows the vibration measurement location.
HDR used data collection computer software to document the vibration levels. A stake was attached to an accelerometer and placed into the soil. The instrumentation was calibrated to a reference level traceable to the National Institute of Standards and Technology prior to and upon completion of the series of measurements.
Table 8 summarizes the measured vibration levels.
15

Table 8. Measured Existing Vibration Levels
Event Maximum Vibration Level at 50 feet, VdB Train pass-by 1 76 Train pass-by 2 75 Train pass-by 3 78
Maximum across pass-bys 78
The general locomotive-powered vibration curve from Figure 4 indicates a vibration level of approximately 85 VdB at 50 feet, which is 7 VdB higher than the maximum measured vibration level. Because of the existing vehicle, track, and geological conditions, existing vibration levels in the project area are lower than the levels predicted by the FTA’s general vibration curve. Therefore, an adjustment factor of -7 VdB was used to account for existing vehicle, track, and geological conditions (in addition to the adjustment factors in Table 6).
Impact Assessment HDR predicted noise and vibration impact distances for project operations using the methods and criteria discussed in this report.
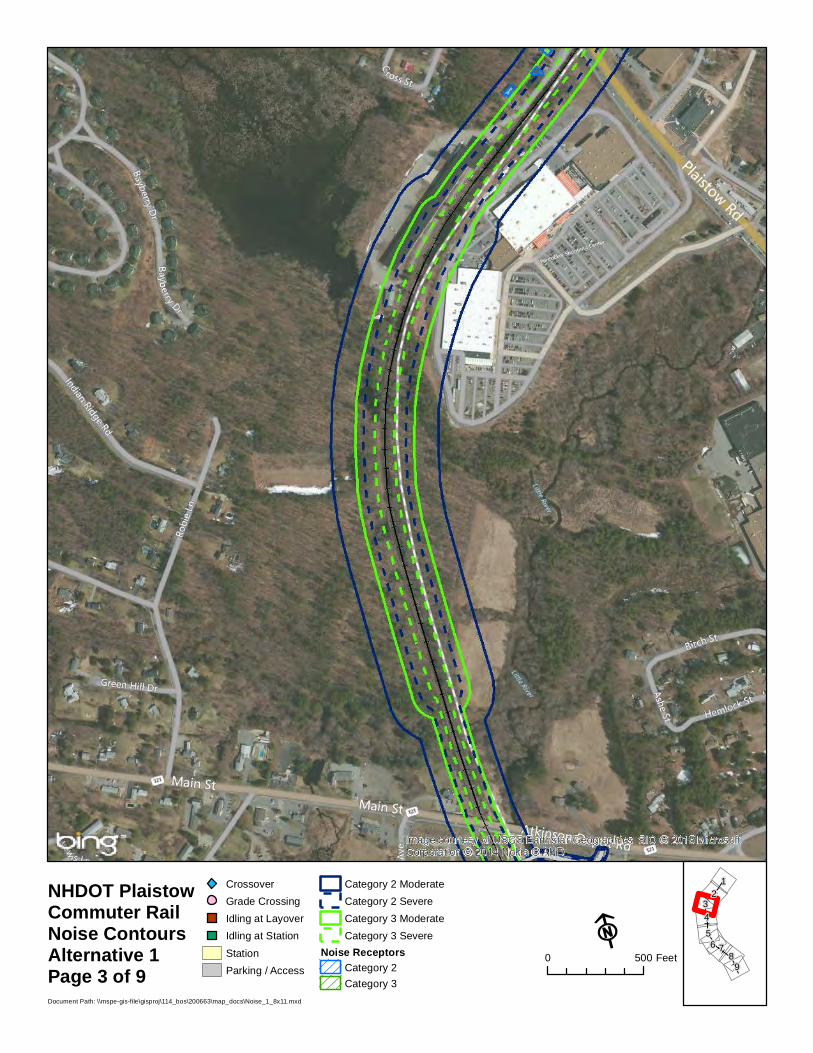
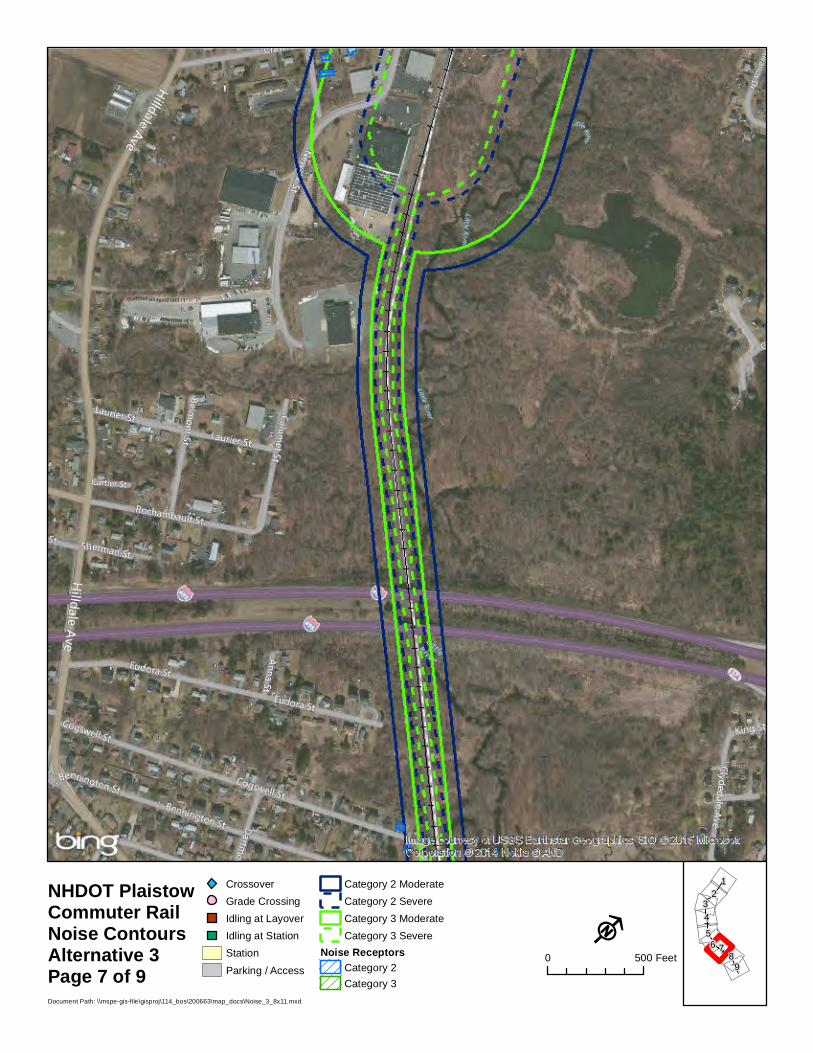
Noise Impact Assessment HDR produced noise impact contours for each alternative using the methods and measured data presented in this report. Any Category 2 buildings within the Category 2 contours could be impacted by project noise and the same for Category 3 (no Category 1 noise receptors were identified). Appendices A, B, and C contain noise impact contour figures for Alternatives 1, 2, and 3, respectively. Note that the noise contour impact distances change due to proximity to louder noise sources (like the locomotive horn used around Rosemont Street). Other changes in the impact distances are due to a change in operating speed, a change in existing noise levels (which can change the impact criteria), a change in shielding condition, or a mixture of these items. Also note that the Category 2 and Category 3 contours can differ because they are based on different metrics (Ldn for Category 2 and peak hour Leq for Category 3), different existing levels, and different impact criteria.
For example, some track crossovers caused the Category 3 contours to bubble out while the Category 2 contours show less influence from the crossovers. This indicates the crossovers affected the peak hour noise exposure, but were more dominated by the general train noise in terms of the 24-hour Ldn noise exposure. Alternatively, some of the station noise resulted in severe Category 2 contours beyond the moderate Category 3 contours. This indicates the station noise was more prominent over the 24-hour Ldn noise exposure, and was compounded by a higher existing peak hour Leq (which resulted in higher impact thresholds for Category 3).
Table 9 summarizes the predicted noise impacts from project operations.
16

Table 9. Summary of Operations Noise Impacts
Station and Layover Alternative
Land Use Category
Number of Moderate Noise
Impacts Number of Severe
Noise Impacts
Alternative 1 2 34 10 3 0 0
Totals 34 10
Alternative 2 2 35 11 3 0 0
Totals 35 11
Alternative 3 2 34 10 3 0 0
Totals 34 10
Noise impacts are due to both wheel-rail or wayside noise, and the locomotive horn at the Rosemont Street grade crossing. The three alternatives resulted in a similar number of noise impacts because there are few noise-sensitive receptors adjacent to the proposed station and layover sites (which are the primary differentiators between the alternatives). Alternative 2 resulted in the most moderate and severe impacts because of residences currently located at the proposed station and layover site; however, all three of the residences at the Alternative 2 site would need to be acquired as part of the project in order to facilitate construction of the station.
Vibration Impact Assessment HDR used the vibration impact criteria, the FTA’s general vibration curve, and the adjustment factors to determine the distances at which vibration impacts are projected to occur. Using those calculated distances, HDR produced vibration impact contours that represent the vibration from train pass-bys and also the vibration from trains passing over track crossovers. Appendix D contains the vibration impact contour figures, which account for track crossovers from all three station and layover alternatives. Only special track work contours are shown for Category 3 because the wayside vibration impact distance was only 5 feet. Table 10 summarizes the predicted vibration impacts from project operations.
Table 10. Summary of Operations Vibration Impacts
Land Use Category Number of Vibration Impacts due to Pass-bys
Number of Crossover Vibration Impacts
1 0 0 2 0 0 3 0 0
17

No vibration-sensitive land uses were identified within the vibration impact contours, so analysis results indicate that Alternatives 1, 2, and 3 are not projected to cause vibration impacts as defined by the FTA.
Mitigation The FTA expects mitigation for severe noise and vibration impacts and the consideration of mitigation for moderate impacts (FTA 2006). The following describes HDR’s noise mitigation recommendations.
Noise Mitigation Analysis results show the potential for project-related moderate and severe noise impacts as defined by the FTA. The following mitigation measures could be used to reduce noise levels at the impacted noise-sensitive receptors.
• Construct sound walls close to the tracks to reduce overall train noise by 6 to 15 dB. • Improve the building noise insulation of the impacted receptors. The performance of this
option is greatly dependent on the existing building construction, but can reduce noise levels by 5 to 20 dB.
Appendix E contains noise mitigation figures illustrating the location of the moderate and severe noise impacts from all three alternatives and proposed sound walls. Table 11 summarizes the noise level reductions needed to mitigate the noise impacts identified in this report.
Table 11. Mitigation of Severe Noise Impacts
Receptora Modeled
Project Ldn, dBA
Moderate Impact
Threshold, dBA
Severe Impact
Threshold, dBA
Reduction to Mitigate to Moderate
Impact, dBA
Reduction to Mitigate to No Impact,
dBA S01b 56 57 63 N/A N/A S02b 65 57 63 3 9 M01b 56 57 63 N/A N/A M02 57 57 63 N/A 1 M03 62 57 63 N/A 6 S03 64 57 63 2 8 M04 60 57 63 N/A 4 S04 72 59 65 8 14 S05 79 59 65 15 21 M05 63 59 65 N/A 5 S06 72 59 65 8 14 S07 65 59 65 1 7 M06 60 59 65 N/A 2 M07 64 59 65 N/A 6 M08 59 59 65 N/A 1 S08 65 59 65 1 7 M09 62 59 65 N/A 4 M10 64 59 65 N/A 6 M11 64 59 65 N/A 6
18

Receptora Modeled
Project Ldn, dBA
Moderate Impact
Threshold, dBA
Severe Impact
Threshold, dBA
Reduction to Mitigate to Moderate
Impact, dBA
Reduction to Mitigate to No Impact,
dBA M12 62 59 65 N/A 4 M13 60 59 65 N/A 2 S09 71 59 65 7 13 M14 62 59 65 N/A 4 M15 59 59 65 N/A 1 S10 65 59 65 1 7 M16 59 59 65 N/A 1 S11 65 59 65 1 7 M17 60 59 65 N/A 2 M18 63 59 65 N/A 5 M19 59 59 65 N/A 1 M20 63 59 65 N/A 5 M21 59 59 65 N/A 1 M22 63 59 65 N/A 5 M23 60 59 65 N/A 2 M24 60 59 65 N/A 2 M25 58 58 64 N/A 1 M26 59 58 64 N/A 2 M27 58 58 64 N/A 1 M28 58 58 64 N/A 1 M29 58 58 64 N/A 1 M30 61 58 64 N/A 4 M31 61 58 64 N/A 4 M32 58 58 64 N/A 1 M33 58 58 64 N/A 1 M34 60 58 64 N/A 3 M35 61 58 64 N/A 4
Note a: Receptors labeled with an “S” were predicted severe impacts and receptors labeled with an “M” were predicted moderate impacts. Note b: Receptors S01, S02, and M01 are within the project area for the Alternative 2 station and layover facility, and are therefore impacts under Alternative 2. Their modeled project levels and reductions only apply to Alternative 1 and Alternative 3 because it is assumed they would be acquired to construct Alternative 2.
As a rule of thumb, sound walls achieve reductions of approximately 5 dBA when they block the line of sight between noise source and receiver (FHWA 2011). Each additional meter of height increases the performance by 1.5 dBA. Sound walls must be sufficiently long to prevent noise from coming around the ends of the wall. On either side of a receiver, the wall should extend four times the distance between the receiver and the wall. Alternatively, the ends of the wall could angle back on the side of the receiver if possible.
Along the corridor there are five clusters of buildings where moderate and severe impacts are projected. They include:
19

• Joanne Drive, Plaistow • Blossom Road, Plaistow • Near Rosemont Street, Haverhill • Neighborhood north of Hilldale Cemetery, Haverhill • Neighborhood south of Hilldale Cemetery, Haverhill
Each location was assessed regarding the effectiveness of sound walls given the terrain, the right-of-way dimensions, and the configuration of the impacted buildings in relation to the path of the train. Because of sound wall length requirements for effective mitigation and limited railroad right-of-way (where the ends of the wall could angle back), the impacted receptors just to the north and south of the Hilldale Cemetery are likely the only receptors suitable for mitigation through the construction of sound walls. Additional information regarding the evaluation of sound walls is provided below.
JOANNE DRIVE, PLAISTOW Under Alternative 2, the three receptors with projected noise impacts would be acquired to facilitate construction of the station. Under Alternative 1 and Alternative 3, only the receptor nearest to the railroad right-of-way is projected to be impacted. A sound wall is an inefficient use of resources (i.e. not cost-effective) for mitigating a single receptor, so improving the building noise insulation is the recommended mitigation approach.
BLOSSOM ROAD, PLAISTOW Four receptors along Blossom Road are projected to experience noise impacts under the Build alternatives. Because these receptors (and the rail line) are aligned perpendicularly and adjacent to New Hampshire Route 125. Close proximity to New Hampshire Route 125 prevents constructing a sound wall capable of providing adequate noise reduction to these receivers; the wall would be partially ineffective. During Preliminary Engineering additional survey and analysis will be undertaken to assess the effectiveness of sound walls to mitigate the impacts along Blossom Road.
ROSEMENT STREET, HAVERHILL If sound walls were constructed at the Rosemont Street at-grade crossing their effectiveness would be compromised since the train horn, which is the primary source of noise, would be sounded at the crossing (the crossing itself would be a large gap in the wall). Such a large gap in a sound wall minimizes the effectiveness of the wall’s noise reduction capabilities.
HILLDALE CEMETERY AREA, HAVERHILL Five moderate impacts are projected north of Hilldale Cemetery, and they exceed the moderate impact threshold by 1 to 2 dBA. Noise levels have to change by 3-dBA to be noticed by the average human. Mitigation is not recommended for these moderate impact receptors because the margin of impact is less than 3-dBA. Six moderate impacts projected in the area south of Hilldale Cemetery could be mitigated using a variable height 10- to 13-foot sound wall which would be approximately 1200-feet long (shown in Appendix E). These projected noise impacts exceed the impact threshold by less than five dBA, which may or may not be perceivable to a person with average hearing. As the project progresses through the design phase a more detailed assessment of potential noise reductions will be performed.
20

Where sound walls are not recommended, the noise level reductions shown in Table 11 would be achieved by improving the building noise insulation. The building noise insulation refers to the ability of the exterior walls and roof (with all doors, windows, and other openings included) to “block” noise. The improvements needed for each building would have to be determined on a case by case basis because the existing wall, door, and window constructions will vary. Generally, doors and windows are the acoustic weak points of a building envelope, so they will likely be the first items to improve. For this option to be cost effective, the FTA calls for a minimum interior noise level reduction of 5 dBA and maximum interior noise levels of 70 dBA from horn noise and 65 dBA from all other project noise sources (FTA 2006).
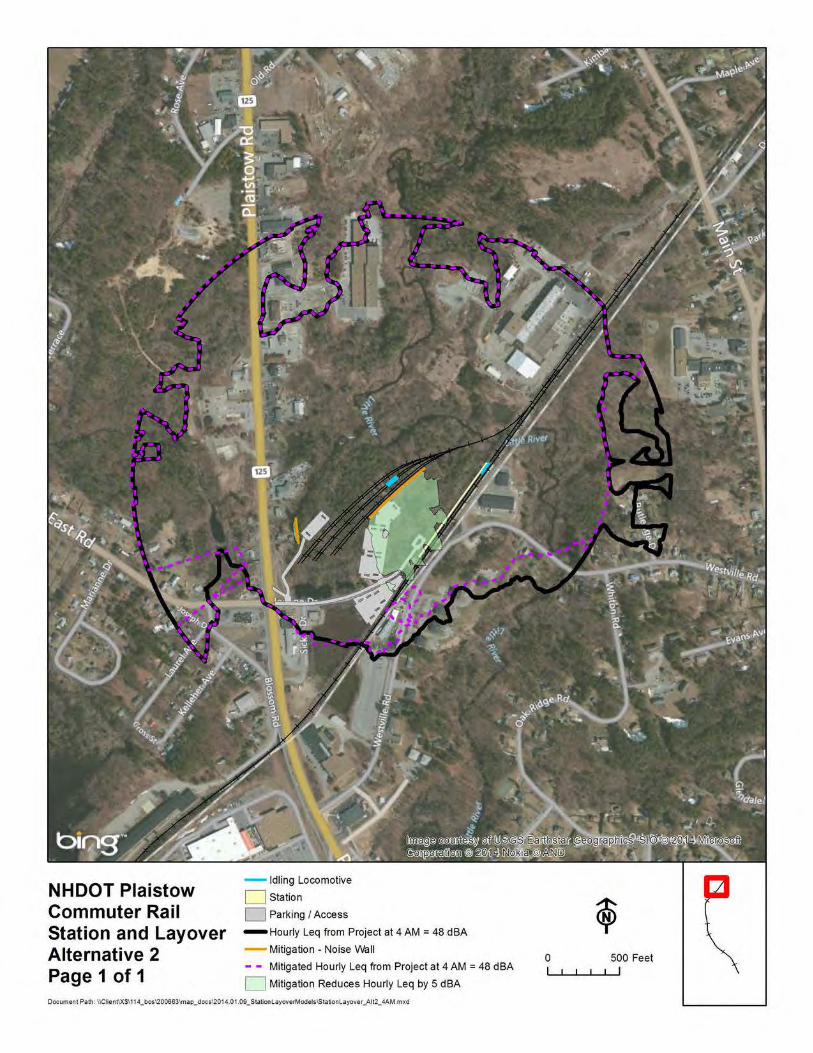
Additional Station and Layover Noise Mitigation Aside from the three receptors at the site of the proposed Alternative 2 station and layover, no other noise impacts were projected due to the station and layover alternatives. As defined by the FTA, a moderate noise impact occurs when the change in cumulative noise is noticeable, but not expected to “cause strong, adverse reactions from the community” (FTA 2006). Because nearby homes would be expected to hear project-related noise, the Project Advisory Committee requested an evaluation of noticeable changes in cumulative noise from the proposed station and layover locomotive idling. Sound walls were assessed as part of this evaluation.
This additional assessment goes above and beyond the requirements established by the FTA, so HDR modeled the station and layover noise using the three-dimensional environmental noise analysis program Cadna-A. Cadna-A is based on ISO 9613, “Attenuation of Noise during Propagation Outdoors,” and is capable of modeling terrain using elevation contours. Table 12 summarizes the noise model parameters.
Table 12. Station and Layover Noise Model Parameters
Parameter Model Approach
Noise Emissions Idling locomotive noise was modeled using measured octave band noise levels from a representative locomotive idling at Bradford Station.
Terrain Site-specific terrain data were modeled using publicly available elevation data.
Buildings Buildings were not modeled, resulting in conservative noise levels.
Ground Factor All ground was 60% absorptive to account for snow cover.
Meteorology A site-specific wind rose was not included, resulting in conservative downwind noise levels.
Temperature and Relative Humidity
The modeled temperature of 10 degrees Celsius and relative humidity of 70% matched annual average values for the area.
Under the proposed project, the most locomotive idling would occur during the 4:00 AM and 5:00 AM hours. Each morning, a locomotive idles for 60 minutes at the layover track and 30 minutes at the station prior to departure. HDR reviewed existing measured hourly Leq data from
21

the 4:00 AM and 5:00 AM hours, and identified the quietest hour for each alternative. HDR modeled cumulative locomotive idling noise during a single hour for each alternative, and produced contours illustrating where the modeled idling locomotive noise would equal existing noise in terms of the A-weighted hourly Leq. When two equivalent noise levels are summed (in this case the idling locomotive and existing noise), the result is a 3-dB increase in noise level. A 3-dB increase would result in a just noticeable increase in cumulative noise. However, spectral characteristics of the noise sources are not considered when comparing overall A-weighted noise levels. Low-frequency noise from the locomotives could stand out at a point where the A-weighted locomotive noise level equals the A-weighted existing noise level.
HDR modeled sound walls to attempt to reduce audible noise from the idling locomotives. Contours were produced for each alternative illustrating where the mitigated idling locomotive noise level would equal the existing hourly Leq. Sound walls are most effective close to the walls, so HDR produced shaded areas illustrating where the sound walls reduce the idling locomotive noise level by 5 dBA.
Appendix F contains the base contours and mitigated contours where idling locomotive noise equals the existing hourly level. Sound walls have diminishing return with increasing distance from the wall, so the difference between the base contours and mitigated contours are fairly modest. Additionally, the Alternative 3 sound wall design is inefficient due to limited space adjacent to the station and layover tracks. Separate sound walls were required to shield the north end and each side of the locomotives. The sound walls along the sides had to be extended to make up for the gaps created by separate sound walls. These sound walls would need to be absorptive to prevent reflections between the walls. No sound walls were modeled for the Alternative 1 layover facility because no residences were within the base contour.
Vibration Mitigation HDR predicted no vibration impacts, so no mitigation measures are needed.
Construction HDR assessed the potential for noise and vibration impacts during construction using methods from the FTA manual (FTA 2006). Construction would be limited to the station and layover facility as the new commuter train activity would occur on existing rail. Construction activity is assumed to only occur during the day for a 12-month period. Table 13 lists construction equipment expected to be used for the project with source noise and vibration levels.
Table 13. Construction Equipment Source Levels
Equipment Noise Level at 50 feet, dBA
Vibration Levels PPV at 25 feet, in/s Lv at 25 feet, VdB
Truck 88 0.076 86 Bulldozer 85 0.089 87 Excavator 85 N/A N/A
Loader 85 N/A N/A Crane 83 N/A N/A
Sources: FTA 2006 and FHWA 2006
22

Of the equipment expected to be used for project construction, only loaded trucks and bulldozers are considered significant sources of vibration.
HDR reviewed local regulations for Plaistow, NH and Haverhill, MA, which are the locations being considered for the proposed station and layover facility. The Plaistow Zoning Ordinance generally prohibits obnoxious noise and vibration, but does not provide noise or vibration level limits applicable to project construction (Plaistow 2010). The ordinance does limit construction activity to the hours from 7:00 AM to 7:00 PM. Chapter 182 from the Code of the City of Haverhill, MA also only allows construction between the hours of 7:00 AM and 7:00 PM (Haverhill 2006). Additionally, noise from construction activities cannot exceed 50 dBA “at the lot line of an abutting residential lot” between the hours of 6:00 PM and 7:00 AM. The Haverhill ordinance contains no mention of vibration. Project construction is expected to only occur during the day, so the project is expected to comply with Plaistow’s and Haverhill’s scheduling and noise regulations.
Construction Noise In lieu of daytime noise level limits from the local regulations, the FTA proposes criteria to assess adverse community reaction. Table 14 lists these criteria.
Table 14. Construction Noise Criteria
Land Use Daytime one-hour Leq, dBA Residential 90 Commercial 100
Industrial 100 Source: FTA 2006
The FTA manual suggests combining the source noise levels from the two noisiest pieces of construction equipment for comparison with these criteria. Assuming constant operation of the two noisiest pieces of equipment (a truck at 88 dBA and one of the sources at 85 dBA), the combined noise level is 90 dBA at 50 feet. The most stringent criterion is 90 dBA, so any noise-sensitive receptors within 50 feet of the construction areas would be impacted by construction. Appendix G contains figures illustrating the 90-dBA impact distance of 50 feet applied as a buffer around the construction areas for the proposed station and layover alternatives. Receptors within the 90-dBA contours could be impacted by noise from project construction. Table 15 summarizes the number of construction noise impacts.
Table 15. Summary of Construction Noise Impacts
Station and Layover Alternative Land Use Category Number of Construction
Noise Impacts Alternative 1 2 0 Alternative 2 2 3a Alternative 3 2 0
Note a: These three residences would be acquired to construct Alternative 2
23

The only impacted receptors are Category 2 receptors within the construction areas. These receptors would be acquired as part of the project, so they would no longer be noise-sensitive receptors; therefore, they would not be impacted by construction noise.
Construction Vibration Construction vibration is assessed in terms of building damage and human annoyance. According to the FTA manual, the vibration building damage criteria for non-engineered timber and masonry buildings is a PPV of 0.2 in/sec (FTA 2006). Based on the source PPV for a loaded truck and a large bulldozer, these pieces of equipment would have to operate within 15 feet of a building to induce a PPV of 0.2 in/sec on the structure.
Human annoyance from construction vibration is evaluated using the general vibration impact criteria shown in Table 5. During construction there could be many vibration events during a single day, so the “Frequent Events” criteria are applied. The nearest receptors to the construction areas are residential, so the Category 2 impact criteria of 72 VdB was used to calculate impact distances. Based on the source Lv of each vibration source, a loaded truck would produce an Lv of 72 VdB at 73 feet and a large bulldozer would produce an Lv of 72 VdB at 79 feet. Appendix G contains figures illustrating the 72-VdB impact distance of 79 feet applied as a buffer around the construction areas for the proposed station and layover alternatives. Receptors within the 72-VdB contours could be annoyed by vibration from project construction. Table 16 summarizes the number of construction vibration impacts.
Table 16. Summary of Construction Vibration Impacts
Station and Layover Alternative Land Use Category Number of Construction Vibration Impacts
Building Damage Human Annoyance Alternative 1 2 0 2 Alternative 2 2 3a 3a Alternative 3 2 0 0
Note a: These three residences would be acquired to construct Alternative 2
The three Alternative 2 impacted residences would be acquired to construct Alternative 2, so they would no longer be impacted receptors if construction occurred. Two residences across the street from the station parking lot for Alternative 1 could be annoyed by construction vibration depending upon the amount of construction work done at the existing park and ride lot. Construction would only occur during the daytime, and would be limited to a 12-month period. These two impacts could be mitigated be minimizing the use of loaded trucks and bulldozers within 73 and 79 feet of the receptors, respectively. HDR recommends communicating the times and durations of construction activities to these residences if Alternative 1 is pursued. For temporary activities like construction, upfront communication can help ease resident annoyance.
Conclusion HDR measured existing noise and vibration levels within the Plaistow Commuter Rail Extension Study area, and evaluated the potential for noise and vibration impacts using methods from the FTA’s “Transit Noise and Vibration Impact Assessment” (FTA 2006).
24

HDR identified moderate and severe Category 2 noise impacts from project operations. These impacts could be mitigated by constructing sound walls and improving the noise insulation of select residential buildings.
HDR evaluated project vibration using methods from the FTA manual and measurements of existing train pass-bys. No vibration impacts were predicted; therefore, no mitigation is required.
HDR predicted the only receptors that would be affected by project construction noise would have to be acquired to construct the Alternative 2 station and layover facility. These same receptors could be impacted by construction vibration building damage and human annoyance if Alternative 2 were constructed. Two additional residences adjacent to the Alternative 1 station parking lot could be impacted by construction vibration. These two impacts could be mitigated by limiting the use of loaded trucks and large bulldozers near the residences.
References Acoustical Society of America (ASA). 2013. Quantities and Procedures for Description and
Measurement of Environmental Sound – Part 3: Short-term Measurements with an Observer Present. ANSI/ASA S12.9-2013/Part 3.
City of Haverhill, MA (Haverhill). 2006. Code of the City of Haverhill, Chapter 182: Noise. Available: http://ecode360.com/6261188.
Federal Highway Administration (FHWA). 2011. Highway Traffic Noise – Noise Barrier Design. Office of Planning, Environment, and Realty. Available: https://www.fhwa.dot.gov/environment/noise/noise_barriers/design_construction/keepdo wn.cfm.
Federal Highway Administration (FHWA). 2006. FHWA Roadway Construction Noise Model User’s Guide. FHWA-HEP-05-054. U.S. Department of Transportation, Research and Innovative Technology Administration.
Federal Railroad Administration (FRA). 2000. Horn Noise MS Excel Spreadsheet Model. Available: http://www.fra.dot.gov/eLib/Details/L04091.
Federal Transit Administration (FTA). 2006. Transit Noise and Vibration Impact Assessment. FTA-VA-90-1003-06. Office of Planning and Environment.
Stone, B.D., Stone, J.R., and DiGiacomo-Cohen, M.L. 2006. Surficial Geologic Map of the Salem Depot-Newburyport East-Wilmington-Rockport 16-Quadrangle Area in Northeast Massachusetts, U.S. Geological Survey Open-File Report 2006-1260B.
Town of Plaistow New Hampshire (Plaistow). 2010. Zoning Ordinance. Available: http://www.plaistow.com/Pages/PlaistowNH_Planning/ZoningOrdinance.pdf.
25

Appendix A: Noise Contours – Alternative 1
26

CrossoverGrade CrossingIdling at LayoverIdling at Station
StationParking / Access
Category 2 ModerateCategory 2 SevereCategory 3 ModerateCategory 3 Severe
Noise ReceptorsCategory 2Category 3
F0 500 Feet
NHDOT PlaistowCommuter RailNoise ContoursAlternative 1Page 1 of 9 9
21
34
56 7
8
Document Path: \\mspe-gis-file\gisproj\114_bos\200663\map_docs\Noise_1_8x11.mxd

CrossoverGrade CrossingIdling at LayoverIdling at Station
StationParking / Access
Category 2 ModerateCategory 2 SevereCategory 3 ModerateCategory 3 Severe
Noise ReceptorsCategory 2Category 3
F0 500 Feet
NHDOT PlaistowCommuter RailNoise ContoursAlternative 1Page 2 of 9 9
21
34
56 7
8
Document Path: \\mspe-gis-file\gisproj\114_bos\200663\map_docs\Noise_1_8x11.mxd
CrossoverGrade CrossingIdling at LayoverIdling at Station
StationParking / Access
Category 2 ModerateCategory 2 SevereCategory 3 ModerateCategory 3 Severe
Noise ReceptorsCategory 2Category 3
F0 500 Feet
NHDOT PlaistowCommuter RailNoise ContoursAlternative 1Page 3 of 9 9
21
34
56 7
8
Document Path: \\mspe-gis-file\gisproj\114_bos\200663\map_docs\Noise_1_8x11.mxd

CrossoverGrade CrossingIdling at LayoverIdling at Station
StationParking / Access
Category 2 ModerateCategory 2 SevereCategory 3 ModerateCategory 3 Severe
Noise ReceptorsCategory 2Category 3
F0 500 Feet
NHDOT PlaistowCommuter RailNoise ContoursAlternative 1Page 4 of 9 9
21
34
56 7
8
Document Path: \\mspe-gis-file\gisproj\114_bos\200663\map_docs\Noise_1_8x11.mxd

CrossoverGrade CrossingIdling at LayoverIdling at Station
StationParking / Access
Category 2 ModerateCategory 2 SevereCategory 3 ModerateCategory 3 Severe
Noise ReceptorsCategory 2Category 3
F0 500 Feet
NHDOT PlaistowCommuter RailNoise ContoursAlternative 1Page 5 of 9 9
21
34
56 7
8
Document Path: \\mspe-gis-file\gisproj\114_bos\200663\map_docs\Noise_1_8x11.mxd

CrossoverGrade CrossingIdling at LayoverIdling at Station
StationParking / Access
Category 2 ModerateCategory 2 SevereCategory 3 ModerateCategory 3 Severe
Noise ReceptorsCategory 2Category 3
F0 500 Feet
NHDOT PlaistowCommuter RailNoise ContoursAlternative 1Page 6 of 9 9
21
34
56 7
8
Document Path: \\mspe-gis-file\gisproj\114_bos\200663\map_docs\Noise_1_8x11.mxd

CrossoverGrade CrossingIdling at LayoverIdling at Station
StationParking / Access
Category 2 ModerateCategory 2 SevereCategory 3 ModerateCategory 3 Severe
Noise ReceptorsCategory 2Category 3
F
0 500 Feet
NHDOT PlaistowCommuter RailNoise ContoursAlternative 1Page 7 of 9 9
21
34
56 7
8
Document Path: \\mspe-gis-file\gisproj\114_bos\200663\map_docs\Noise_1_8x11.mxd

CrossoverGrade CrossingIdling at LayoverIdling at Station
StationParking / Access
Category 2 ModerateCategory 2 SevereCategory 3 ModerateCategory 3 Severe
Noise ReceptorsCategory 2Category 3
F
0 500 Feet
NHDOT PlaistowCommuter RailNoise ContoursAlternative 1Page 8 of 9 9
21
34
56 7
8
Document Path: \\mspe-gis-file\gisproj\114_bos\200663\map_docs\Noise_1_8x11.mxd

CrossoverGrade CrossingIdling at LayoverIdling at Station
StationParking / Access
Category 2 ModerateCategory 2 SevereCategory 3 ModerateCategory 3 Severe
Noise ReceptorsCategory 2Category 3
F0 500 Feet
NHDOT PlaistowCommuter RailNoise ContoursAlternative 1Page 9 of 9 9
21
34
56 7
8
Document Path: \\mspe-gis-file\gisproj\114_bos\200663\map_docs\Noise_1_8x11.mxd

Appendix B: Noise Contours – Alternative 2
27

CrossoverGrade CrossingIdling at LayoverIdling at StationStationParking / Access
Category 2 ModerateCategory 2 SevereCategory 3 ModerateCategory 3 Severe
Noise ReceptorsCategory 2Category 3
F0 500 Feet
NHDOT PlaistowCommuter RailNoise ContoursAlternative 2Page 1 of 9 9
21
34
56 7
8
Document Path: \\mspe-gis-file\gisproj\114_bos\200663\map_docs\Noise_2_8x11.mxd

CrossoverGrade CrossingIdling at LayoverIdling at StationStationParking / Access
Category 2 ModerateCategory 2 SevereCategory 3 ModerateCategory 3 Severe
Noise ReceptorsCategory 2Category 3
F0 500 Feet
NHDOT PlaistowCommuter RailNoise ContoursAlternative 2Page 2 of 9 9
21
34
56 7
8
Document Path: \\mspe-gis-file\gisproj\114_bos\200663\map_docs\Noise_2_8x11.mxd

CrossoverGrade CrossingIdling at LayoverIdling at StationStationParking / Access
Category 2 ModerateCategory 2 SevereCategory 3 ModerateCategory 3 Severe
Noise ReceptorsCategory 2Category 3
F0 500 Feet
NHDOT PlaistowCommuter RailNoise ContoursAlternative 2Page 3 of 9 9
21
34
56 7
8
Document Path: \\mspe-gis-file\gisproj\114_bos\200663\map_docs\Noise_2_8x11.mxd

CrossoverGrade CrossingIdling at LayoverIdling at StationStationParking / Access
Category 2 ModerateCategory 2 SevereCategory 3 ModerateCategory 3 Severe
Noise ReceptorsCategory 2Category 3
F0 500 Feet
NHDOT PlaistowCommuter RailNoise ContoursAlternative 2Page 4 of 9 9
21
34
56 7
8
Document Path: \\mspe-gis-file\gisproj\114_bos\200663\map_docs\Noise_2_8x11.mxd

CrossoverGrade CrossingIdling at LayoverIdling at StationStationParking / Access
Category 2 ModerateCategory 2 SevereCategory 3 ModerateCategory 3 Severe
Noise ReceptorsCategory 2Category 3
F0 500 Feet
NHDOT PlaistowCommuter RailNoise ContoursAlternative 2Page 5 of 9 9
21
34
56 7
8
Document Path: \\mspe-gis-file\gisproj\114_bos\200663\map_docs\Noise_2_8x11.mxd

CrossoverGrade CrossingIdling at LayoverIdling at StationStationParking / Access
Category 2 ModerateCategory 2 SevereCategory 3 ModerateCategory 3 Severe
Noise ReceptorsCategory 2Category 3
F0 500 Feet
NHDOT PlaistowCommuter RailNoise ContoursAlternative 2Page 6 of 9 9
21
34
56 7
8
Document Path: \\mspe-gis-file\gisproj\114_bos\200663\map_docs\Noise_2_8x11.mxd

CrossoverGrade CrossingIdling at LayoverIdling at StationStationParking / Access
Category 2 ModerateCategory 2 SevereCategory 3 ModerateCategory 3 Severe
Noise ReceptorsCategory 2Category 3
F
0 500 Feet
NHDOT PlaistowCommuter RailNoise ContoursAlternative 2Page 7 of 9 9
21
34
56 7
8
Document Path: \\mspe-gis-file\gisproj\114_bos\200663\map_docs\Noise_2_8x11.mxd

CrossoverGrade CrossingIdling at LayoverIdling at StationStationParking / Access
Category 2 ModerateCategory 2 SevereCategory 3 ModerateCategory 3 Severe
Noise ReceptorsCategory 2Category 3
F
0 500 Feet
NHDOT PlaistowCommuter RailNoise ContoursAlternative 2Page 8 of 9 9
21
34
56 7
8
Document Path: \\mspe-gis-file\gisproj\114_bos\200663\map_docs\Noise_2_8x11.mxd

CrossoverGrade CrossingIdling at LayoverIdling at StationStationParking / Access
Category 2 ModerateCategory 2 SevereCategory 3 ModerateCategory 3 Severe
Noise ReceptorsCategory 2Category 3
F0 500 Feet
NHDOT PlaistowCommuter RailNoise ContoursAlternative 2Page 9 of 9 9
21
34
56 7
8
Document Path: \\mspe-gis-file\gisproj\114_bos\200663\map_docs\Noise_2_8x11.mxd

Appendix C: Noise Contours – Alternative 3
28

CrossoverGrade CrossingIdling at LayoverIdling at StationStation
Parking / Access
Category 2 ModerateCategory 2 SevereCategory 3 ModerateCategory 3 Severe
Noise ReceptorsCategory 2Category 3
F0 500 Feet
NHDOT PlaistowCommuter RailNoise ContoursAlternative 3Page 1 of 9 9
21
34
56 7
8
Document Path: \\mspe-gis-file\gisproj\114_bos\200663\map_docs\Noise_3_8x11.mxd

CrossoverGrade CrossingIdling at LayoverIdling at StationStation
Parking / Access
Category 2 ModerateCategory 2 SevereCategory 3 ModerateCategory 3 Severe
Noise ReceptorsCategory 2Category 3
F0 500 Feet
NHDOT PlaistowCommuter RailNoise ContoursAlternative 3Page 2 of 9 9
21
34
56 7
8
Document Path: \\mspe-gis-file\gisproj\114_bos\200663\map_docs\Noise_3_8x11.mxd

CrossoverGrade CrossingIdling at LayoverIdling at StationStation
Parking / Access
Category 2 ModerateCategory 2 SevereCategory 3 ModerateCategory 3 Severe
Noise ReceptorsCategory 2Category 3
F0 500 Feet
NHDOT PlaistowCommuter RailNoise ContoursAlternative 3Page 3 of 9 9
21
34
56 7
8
Document Path: \\mspe-gis-file\gisproj\114_bos\200663\map_docs\Noise_3_8x11.mxd

CrossoverGrade CrossingIdling at LayoverIdling at StationStation
Parking / Access
Category 2 ModerateCategory 2 SevereCategory 3 ModerateCategory 3 Severe
Noise ReceptorsCategory 2Category 3
F0 500 Feet
NHDOT PlaistowCommuter RailNoise ContoursAlternative 3Page 4 of 9 9
21
34
56 7
8
Document Path: \\mspe-gis-file\gisproj\114_bos\200663\map_docs\Noise_3_8x11.mxd

CrossoverGrade CrossingIdling at LayoverIdling at StationStation
Parking / Access
Category 2 ModerateCategory 2 SevereCategory 3 ModerateCategory 3 Severe
Noise ReceptorsCategory 2Category 3
F0 500 Feet
NHDOT PlaistowCommuter RailNoise ContoursAlternative 3Page 5 of 9 9
21
34
56 7
8
Document Path: \\mspe-gis-file\gisproj\114_bos\200663\map_docs\Noise_3_8x11.mxd

CrossoverGrade CrossingIdling at LayoverIdling at StationStation
Parking / Access
Category 2 ModerateCategory 2 SevereCategory 3 ModerateCategory 3 Severe
Noise ReceptorsCategory 2Category 3
F0 500 Feet
NHDOT PlaistowCommuter RailNoise ContoursAlternative 3Page 6 of 9 9
21
34
56 7
8
Document Path: \\mspe-gis-file\gisproj\114_bos\200663\map_docs\Noise_3_8x11.mxd
CrossoverGrade CrossingIdling at LayoverIdling at StationStation
Parking / Access
Category 2 ModerateCategory 2 SevereCategory 3 ModerateCategory 3 Severe
Noise ReceptorsCategory 2Category 3
F
0 500 Feet
NHDOT PlaistowCommuter RailNoise ContoursAlternative 3Page 7 of 9 9
21
34
56 7
8
Document Path: \\mspe-gis-file\gisproj\114_bos\200663\map_docs\Noise_3_8x11.mxd

CrossoverGrade CrossingIdling at LayoverIdling at StationStation
Parking / Access
Category 2 ModerateCategory 2 SevereCategory 3 ModerateCategory 3 Severe
Noise ReceptorsCategory 2Category 3
F
0 500 Feet
NHDOT PlaistowCommuter RailNoise ContoursAlternative 3Page 8 of 9 9
21
34
56 7
8
Document Path: \\mspe-gis-file\gisproj\114_bos\200663\map_docs\Noise_3_8x11.mxd

CrossoverGrade CrossingIdling at LayoverIdling at StationStation
Parking / Access
Category 2 ModerateCategory 2 SevereCategory 3 ModerateCategory 3 Severe
Noise ReceptorsCategory 2Category 3
F0 500 Feet
NHDOT PlaistowCommuter RailNoise ContoursAlternative 3Page 9 of 9 9
21
34
56 7
8
Document Path: \\mspe-gis-file\gisproj\114_bos\200663\map_docs\Noise_3_8x11.mxd

Appendix D: Vibration Contours
29

Crossover Category 1 ImpactCategory 2 Impact
Category 3 Impact
Vibration ReceptorsCategory 1Category 2Category 3 F
0 500 Feet
NHDOT PlaistowCommuter RailVibration ContoursPage 1 of 9 9
21
34
56 7
8
Document Path: \\Client\X$\114_bos\200663\map_docs\Vibration_8x11.mxd

Crossover Category 1 ImpactCategory 2 Impact
Category 3 Impact
Vibration ReceptorsCategory 1Category 2Category 3 F
0 500 Feet
NHDOT PlaistowCommuter RailVibration ContoursPage 2 of 9 9
21
34
56 7
8
Document Path: \\Client\X$\114_bos\200663\map_docs\Vibration_8x11.mxd

Crossover Category 1 ImpactCategory 2 Impact
Category 3 Impact
Vibration ReceptorsCategory 1Category 2Category 3 F
0 500 Feet
NHDOT PlaistowCommuter RailVibration ContoursPage 3 of 9 9
21
34
56 7
8
Document Path: \\Client\X$\114_bos\200663\map_docs\Vibration_8x11.mxd

Crossover Category 1 ImpactCategory 2 Impact
Category 3 Impact
Vibration ReceptorsCategory 1Category 2Category 3 F
0 500 Feet
NHDOT PlaistowCommuter RailVibration ContoursPage 4 of 9 9
21
34
56 7
8
Document Path: \\Client\X$\114_bos\200663\map_docs\Vibration_8x11.mxd

Crossover Category 1 ImpactCategory 2 Impact
Category 3 Impact
Vibration ReceptorsCategory 1Category 2Category 3 F
0 500 Feet
NHDOT PlaistowCommuter RailVibration ContoursPage 5 of 9 9
21
34
56 7
8
Document Path: \\Client\X$\114_bos\200663\map_docs\Vibration_8x11.mxd

Crossover Category 1 ImpactCategory 2 Impact
Category 3 Impact
Vibration ReceptorsCategory 1Category 2Category 3 F
0 500 Feet
NHDOT PlaistowCommuter RailVibration ContoursPage 6 of 9 9
21
34
56 7
8
Document Path: \\Client\X$\114_bos\200663\map_docs\Vibration_8x11.mxd

Crossover Category 1 ImpactCategory 2 Impact
Category 3 Impact
Vibration ReceptorsCategory 1Category 2Category 3 F
0 500 Feet
NHDOT PlaistowCommuter RailVibration ContoursPage 7 of 9 9
21
34
56 7
8
Document Path: \\Client\X$\114_bos\200663\map_docs\Vibration_8x11.mxd

Crossover Category 1 ImpactCategory 2 Impact
Category 3 Impact
Vibration ReceptorsCategory 1Category 2Category 3 F
0 500 Feet
NHDOT PlaistowCommuter RailVibration ContoursPage 8 of 9 9
21
34
56 7
8
Document Path: \\Client\X$\114_bos\200663\map_docs\Vibration_8x11.mxd

Crossover Category 1 ImpactCategory 2 Impact
Category 3 Impact
Vibration ReceptorsCategory 1Category 2Category 3 F
0 500 Feet
NHDOT PlaistowCommuter RailVibration ContoursPage 9 of 9 9
21
34
56 7
8
Document Path: \\Client\X$\114_bos\200663\map_docs\Vibration_8x11.mxd

Appendix E: Noise Mitigation
30

CrossoverGrade CrossingIdling at LayoverIdling at StationStation
Parking / Access
Impacted ReceptorsCategory 2 ModerateCategory 2 Severe
Proposed Noise Walls F0 500 Feet
NHDOT PlaistowCommuter RailNoise MitigationPage 1 of 9 9
21
34
56 7
8
Document Path: \\Client\X$\114_bos\200663\map_docs\Noise_M_atb_8x11.mxd

CrossoverGrade CrossingIdling at LayoverIdling at StationStation
Parking / Access
Impacted ReceptorsCategory 2 ModerateCategory 2 Severe
Proposed Noise Walls F0 500 Feet
NHDOT PlaistowCommuter RailNoise MitigationPage 2 of 9 9
21
34
56 7
8
Document Path: \\Client\X$\114_bos\200663\map_docs\Noise_M_atb_8x11.mxd

CrossoverGrade CrossingIdling at LayoverIdling at StationStation
Parking / Access
Impacted ReceptorsCategory 2 ModerateCategory 2 Severe
Proposed Noise Walls F0 500 Feet
NHDOT PlaistowCommuter RailNoise MitigationPage 3 of 9 9
21
34
56 7
8
Document Path: \\Client\X$\114_bos\200663\map_docs\Noise_M_atb_8x11.mxd

CrossoverGrade CrossingIdling at LayoverIdling at StationStation
Parking / Access
Impacted ReceptorsCategory 2 ModerateCategory 2 Severe
Proposed Noise Walls F0 500 Feet
NHDOT PlaistowCommuter RailNoise MitigationPage 4 of 9 9
21
34
56 7
8
Document Path: \\Client\X$\114_bos\200663\map_docs\Noise_M_atb_8x11.mxd

CrossoverGrade CrossingIdling at LayoverIdling at StationStation
Parking / Access
Impacted ReceptorsCategory 2 ModerateCategory 2 Severe
Proposed Noise Walls F0 500 Feet
NHDOT PlaistowCommuter RailNoise MitigationPage 5 of 9 9
21
34
56 7
8
Document Path: \\Client\X$\114_bos\200663\map_docs\Noise_M_atb_8x11.mxd

CrossoverGrade CrossingIdling at LayoverIdling at StationStation
Parking / Access
Impacted ReceptorsCategory 2 ModerateCategory 2 Severe
Proposed Noise WallsF
0 500 Feet
NHDOT PlaistowCommuter RailNoise MitigationPage 6 of 9 9
21
34
56 7
8
Document Path: \\Client\X$\114_bos\200663\map_docs\Noise_M_atb_8x11.mxd

CrossoverGrade CrossingIdling at LayoverIdling at StationStation
Parking / Access
Impacted ReceptorsCategory 2 ModerateCategory 2 Severe
Proposed Noise Walls
F
0 500 Feet
NHDOT PlaistowCommuter RailNoise MitigationPage 7 of 9 9
21
34
56 7
8
Document Path: \\Client\X$\114_bos\200663\map_docs\Noise_M_atb_8x11.mxd

CrossoverGrade CrossingIdling at LayoverIdling at StationStation
Parking / Access
Impacted ReceptorsCategory 2 ModerateCategory 2 Severe
Proposed Noise Walls
F
0 500 Feet
NHDOT PlaistowCommuter RailNoise MitigationPage 8 of 9 9
21
34
56 7
8
Document Path: \\Client\X$\114_bos\200663\map_docs\Noise_M_atb_8x11.mxd

CrossoverGrade CrossingIdling at LayoverIdling at StationStation
Parking / Access
Impacted ReceptorsCategory 2 ModerateCategory 2 Severe
Proposed Noise Walls F0 500 Feet
NHDOT PlaistowCommuter RailNoise MitigationPage 9 of 9 9
21
34
56 7
8
Document Path: \\Client\X$\114_bos\200663\map_docs\Noise_M_atb_8x11.mxd

Appendix F: Additional Station and Layover Noise Mitigation
31


Appendix G: Construction Contours
32
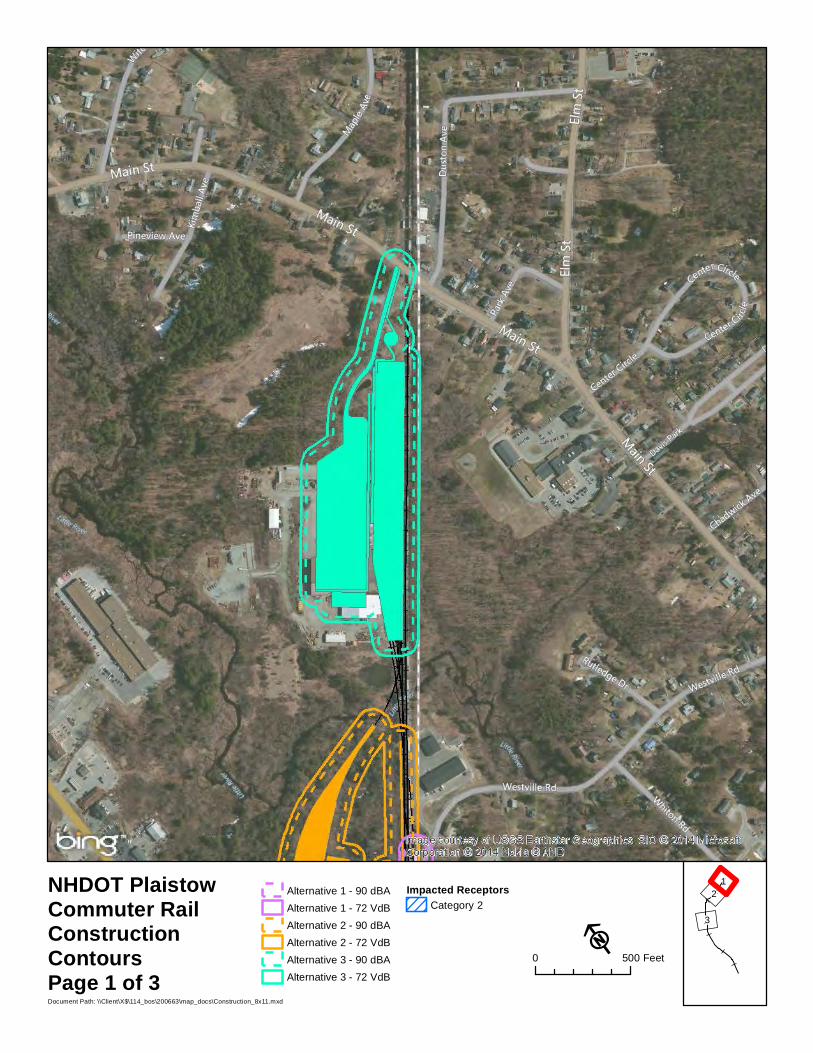
Alternative 1 - 90 dBAAlternative 1 - 72 VdBAlternative 2 - 90 dBAAlternative 2 - 72 VdBAlternative 3 - 90 dBAAlternative 3 - 72 VdB
Impacted ReceptorsCategory 2
F0 500 Feet
NHDOT PlaistowCommuter RailConstructionContoursPage 1 of 3
21
3
Document Path: \\Client\X$\114_bos\200663\map_docs\Construction_8x11.mxd

Alternative 1 - 90 dBAAlternative 1 - 72 VdBAlternative 2 - 90 dBAAlternative 2 - 72 VdBAlternative 3 - 90 dBAAlternative 3 - 72 VdB
Impacted ReceptorsCategory 2
F0 500 Feet
NHDOT PlaistowCommuter RailConstructionContoursPage 2 of 3
21
3
Document Path: \\Client\X$\114_bos\200663\map_docs\Construction_8x11.mxd

Alternative 1 - 90 dBAAlternative 1 - 72 VdBAlternative 2 - 90 dBAAlternative 2 - 72 VdBAlternative 3 - 90 dBAAlternative 3 - 72 VdB
Impacted ReceptorsCategory 2
F0 500 Feet
NHDOT PlaistowCommuter RailConstructionContoursPage 3 of 3
21
3
Document Path: \\Client\X$\114_bos\200663\map_docs\Construction_8x11.mxd

This page intentionally blank.