Embed Size (px)
Citation preview

Los Angeles Basin Study Task 5. Infrastructure and Operations Concepts Appendices
E-1
Appendix E: LACFCD Dam Hydrology and Cost Estimates
Page
Tables Table E-1. Big Tujunga Dam Structural Concept Results ............................................... E-3
Table E-2. Cogswell Dam Structural Concept Results ................................................... E-4
Table E-3. Devil’s Gate Dam Structural Concept Results .............................................. E-5
Table E-4. Eaton Wash Dam Structural Concept Results .............................................. E-6
Table E-5.Morris Dam Structural Concept Results ......................................................... E-7
Table E-6. Pacoima Dam Structural Concept Results .................................................... E-8
Table E-7. Puddingstone Diversion Dam Structural Concept Results ............................ E-9
Table E-8. San Dimas Dam Structural Concept Results .............................................. E-10
Table E-9. San Gabriel Dam Structural Concept Results ............................................. E-11
Table E-10. LACFCD Dams Non-Structural Concept Results – High 1 Scenario ........ E-12
Table E-11. LACFCD Dams Non-Structural Concept Results – Low 1 Scenario ......... E-13
Table E-12. LACFCD Dams Non-Structural Concept Results – Low 2 Scenario ......... E-14
Table E-13. LACFCD Dams Summary of Estimated Costs of Structural Concepts ..... E-15
Figures Figure E-1. Cost Estimate for Big Tujunga Dam Structural Concept ............................ E-17
Figure E-2. Cost Estimate for Cogswell Dam Structural Concept ................................ E-21
Figure E-3. Cost Estimate for Devils Gate Dam Structural Concept ............................ E-25
Figure E-4. Cost Estimate for Eaton Wash Dam Structural Concept ........................... E-29
Figure E-5. Cost Estimate for Morris Dam Structural Concept ..................................... E-33
Figure E-6. Cost Estimate for Pacoima Dam Structural Concept ................................. E-37
Figure E-7. Cost Estimate for Puddingstone Diversion Dam Structural Concept ......... E-41
Figure E-8. Cost Estimate for San Dimas Dam Structural Concept ............................. E-45
Figure E-9. Cost Estimate for San Gabriel Dam Structural Concept ............................ E-49
Supplemental Section E-1 STORAGE SOLUTIONS – LACFCD SANTA ANITA DAM ....................... E-53
E-1.1 STRUCTURAL CONCEPT.................................................................................. E-53 E-1.2 RESULTS ....................................................................................................... E-53 E-1.3 CAPITAL AND OPERATIONAL COSTS ................................................................ E-53 E-1.4 OTHER PROJECT CHARACTERISTICS AND BENEFITS ........................................ E-53
Table E-14. Santa Anita Dam Structural Concept Results ........................................... E-54
Figure E-10. Cost Estimate for Santa Anita Dam Structural Concept .......................... E-55

Los Angeles Basin Study Task 5. Infrastructure and Operations Concepts Appendices
E-2
This page intentionally left blank.
Los Angeles Basin Study Task 5. Infrastructure and Operations Concepts Appendices
E-3
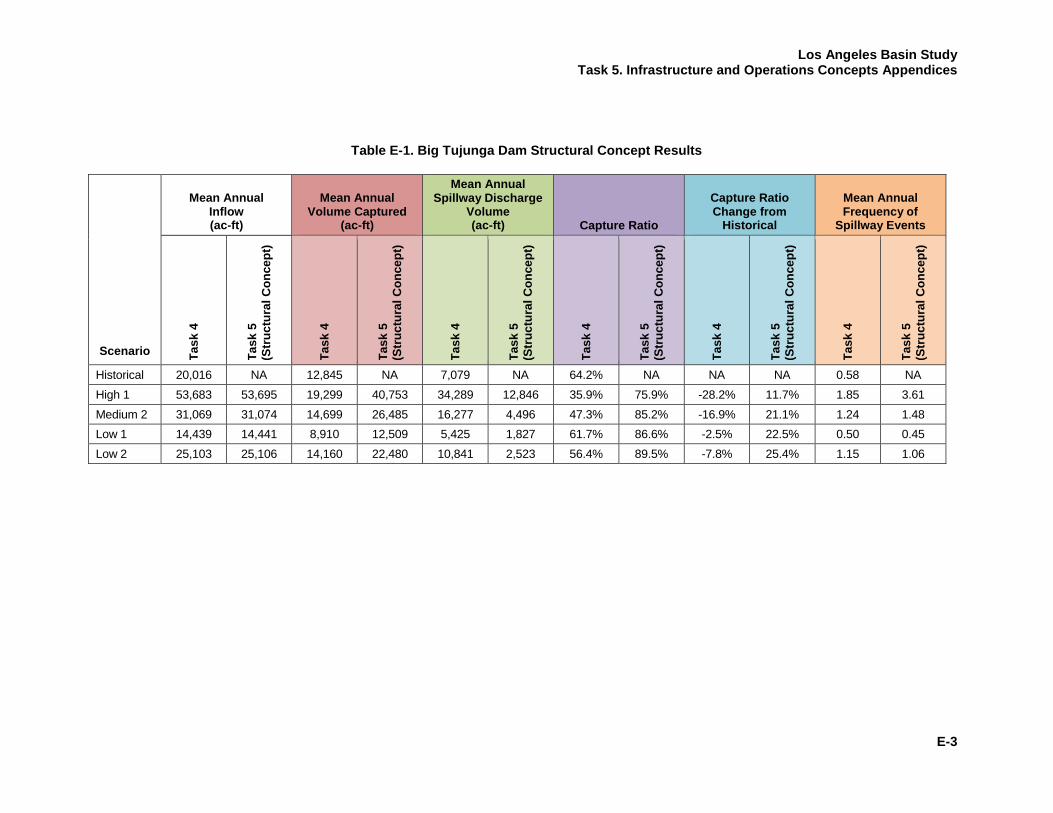
Table E-1. Big Tujunga Dam Structural Concept Results
Scenario
Mean Annual Inflow (ac-ft)
Mean Annual Volume Captured
(ac-ft)
Mean Annual Spillway Discharge
Volume (ac-ft) Capture Ratio
Capture Ratio Change from
Historical
Mean Annual Frequency of
Spillway Events
Task
4
Task
5
(Str
uctu
ral C
once
pt)
Task
4
Task
5
(Str
uctu
ral C
once
pt)
Task
4
Task
5
(Str
uctu
ral C
once
pt)
Task
4
Task
5
(Str
uctu
ral C
once
pt)
Task
4
Task
5
(Str
uctu
ral C
once
pt)
Task
4
Task
5
(Str
uctu
ral C
once
pt)
Historical 20,016 NA 12,845 NA 7,079 NA 64.2% NA NA NA 0.58 NA High 1 53,683 53,695 19,299 40,753 34,289 12,846 35.9% 75.9% -28.2% 11.7% 1.85 3.61 Medium 2 31,069 31,074 14,699 26,485 16,277 4,496 47.3% 85.2% -16.9% 21.1% 1.24 1.48 Low 1 14,439 14,441 8,910 12,509 5,425 1,827 61.7% 86.6% -2.5% 22.5% 0.50 0.45 Low 2 25,103 25,106 14,160 22,480 10,841 2,523 56.4% 89.5% -7.8% 25.4% 1.15 1.06

Los Angeles Basin Study Task 5. Infrastructure and Operations Concepts Appendices
E-4
Table E-2. Cogswell Dam Structural Concept Results
Scenario
Mean Annual Inflow (ac-ft)
Mean Annual Volume Captured
(ac-ft)
Mean Annual Spillway Discharge
Volume (ac-ft) Capture Ratio
Capture Ratio Change from
Historical
Mean Annual Frequency of
Spillway Events
Task
4
Task
5
(Str
uctu
ral C
once
pt)
Task
4
Task
5
(Str
uctu
ral C
once
pt)
Task
4
Task
5
(Str
uctu
ral C
once
pt)
Task
4
Task
5
(Str
uctu
ral C
once
pt)
Task
4
Task
5
(Str
uctu
ral C
once
pt)
Task
4
Task
5
(Str
uctu
ral C
once
pt)
Historical 25,524 NA 19,282 NA 6,208 NA 75.5% NA NA NA 0.44 NA High 1 53,339 53,353 27,397 51,680 25,898 1,624 51.4% 96.9% -24.2% 21.3% 1.82 0.36 Medium 2 34,701 34,708 22,187 33,949 12,477 721 63.9% 97.8% -11.6% 22.3% 1.06 0.18 Low 1 19,034 19,039 14,593 18,630 4,404 370 76.7% 97.9% 1.1% 22.3% 0.43 0.10 Low 2 29,393 29,398 21,199 29,000 8,158 359 72.1% 98.6% -3.4% 23.1% 0.90 0.11

Los Angeles Basin Study Task 5. Infrastructure and Operations Concepts Appendices
E-5
Table E-3. Devil’s Gate Dam Structural Concept Results
Scenario
Mean Annual Inflow (ac-ft)
Mean Annual Volume Captured
(ac-ft)
Mean Annual Spillway Discharge
Volume (ac-ft) Capture Ratio
Capture Ratio Change from
Historical
Mean Annual Frequency of
Spillway Events
Task
4
Task
5
(Str
uctu
ral C
once
pt)
Task
4
Task
5
(Str
uctu
ral C
once
pt)
Task
4
Task
5
(Str
uctu
ral C
once
pt)
Task
4
Task
5
(Str
uctu
ral C
once
pt)
Task
4
Task
5
(Str
uctu
ral C
once
pt)
Task
4
Task
5
(Str
uctu
ral C
once
pt)
Historical 14,295 NA 9,570 NA 4,725 NA 66.9% NA NA NA 1.56 NA High 1 32,202 32,204 12,925 32,204 19,277 0 40.1% 100.0% -26.8% 33.1% 2.94 0.00 Medium 2 20,098 20,099 10,324 20,071 9,774 28 51.4% 99.9% -15.6% 32.9% 2.04 0.02 Low 1 10,649 10,649 6,879 10,649 3,770 0 64.6% 100.0% -2.3% 33.1% 0.93 0.00 Low 2 16,229 16,230 10,103 16,230 6,127 0 62.2% 100.0% -4.7% 33.1% 1.85 0.00

Los Angeles Basin Study Task 5. Infrastructure and Operations Concepts Appendices
E-6
Table E-4. Eaton Wash Dam Structural Concept Results
Scenario
Mean Annual Inflow (ac-ft)
Mean Annual Volume Captured
(ac-ft)
Mean Annual Spillway Discharge
Volume (ac-ft) Capture Ratio
Capture Ratio Change from
Historical
Mean Annual Frequency of
Spillway Events
Task
4
Task
5
(Str
uctu
ral C
once
pt)
Task
4
Task
5
(Str
uctu
ral C
once
pt)
Task
4
Task
5
(Str
uctu
ral C
once
pt)
Task
4
Task
5
(Str
uctu
ral C
once
pt)
Task
4
Task
5
(Str
uctu
ral C
once
pt)
Task
4
Task
5
(Str
uctu
ral C
once
pt)
Historical 4,249 NA 3,681 NA 568 NA 86.6% NA NA NA 1.52 NA High 1 9,165 9,166 6,426 9,105 2,739 61 70.1% 99.3% -16.5% 12.7% 5.46 0.10 Medium 2 6,071 6,072 4,780 6,057 1,291 15 78.7% 99.8% -7.9% 13.1% 3.14 0.04 Low 1 3,366 3,367 2,867 3,351 500 15 85.2% 99.5% -1.5% 12.9% NA 0.02 Low 2 5,080 5,081 4,226 5,064 854 16 83.2% 99.7% -3.4% 13.0% 2.20 0.06

Los Angeles Basin Study Task 5. Infrastructure and Operations Concepts Appendices
E-7
Table E-5.Morris Dam Structural Concept Results
Scenario
Mean Annual Inflow (ac-ft)
Mean Annual Volume Captured
(ac-ft)
Mean Annual Spillway Discharge
Volume (ac-ft) Capture Ratio
Capture Ratio Change from
Historical
Mean Annual Frequency of
Spillway Events
Task
4
Task
5
(Str
uctu
ral C
once
pt)
Task
4
Task
5
(Str
uctu
ral C
once
pt)
Task
4
Task
5
(Str
uctu
ral C
once
pt)
Task
4
Task
5
(Str
uctu
ral C
once
pt)
Task
4
Task
5
(Str
uctu
ral C
once
pt)
Task
4
Task
5
(Str
uctu
ral C
once
pt)
Historical 113,078 NA 44,980 NA 68,045 NA 39.8% NA NA NA 0.64 NA High 1 242,483 242,576 53,120 156,526 189,341 86,017 21.9% 64.5% -17.9% 24.7% 0.96 1.49 Medium 2 156,519 156,567 46,560 118,413 109,910 38,094 29.7% 75.6% -10.0% 35.9% 0.76 0.83 Low 1 85,657 85,688 42,070 72,169 43,516 13,435 49.1% 84.2% 9.3% 44.4% 0.46 0.32 Low 2 130,601 130,631 46,067 109,524 84,465 21,026 35.3% 83.8% -4.5% 44.1% 0.76 0.56

Los Angeles Basin Study Task 5. Infrastructure and Operations Concepts Appendices
E-8
Table E-6. Pacoima Dam Structural Concept Results
Scenario
Mean Annual Inflow (ac-ft)
Mean Annual Volume Captured
(ac-ft)
Mean Annual Spillway Discharge
Volume (ac-ft) Capture Ratio
Capture Ratio Change from
Historical
Mean Annual Frequency of
Spillway Events
Task
4
Task
5
(Str
uctu
ral C
once
pt)
Task
4
Task
5
(Str
uctu
ral C
once
pt)
Task
4
Task
5
(Str
uctu
ral C
once
pt)
Task
4
Task
5
(Str
uctu
ral C
once
pt)
Task
4
Task
5
(Str
uctu
ral C
once
pt)
Task
4
Task
5
(Str
uctu
ral C
once
pt)
Historical 7,144 NA 6,219 NA 899 NA 87.0% NA NA NA 0.32 NA High 1 18,509 18,509 14,354 18,009 4,123 468 77.6% 97.3% -9.5% 10.3% 1.70 0.49 Medium 2 10,854 10,854 9,419 10,678 1,404 145 86.8% 98.4% -0.3% 11.3% 0.57 0.08 Low 1 5,034 5,034 4,387 4,977 613 23 87.1% 98.9% 0.1% 11.8% 0.20 0.01 Low 2 8,611 8,611 7,927 8,546 651 31 92.1% 99.3% 5.0% 12.2% 0.44 0.02

Los Angeles Basin Study Task 5. Infrastructure and Operations Concepts Appendices
E-9
Table E-7. Puddingstone Diversion Dam Structural Concept Results
Scenario
Mean Annual Inflow (ac-ft)
Mean Annual Volume Captured
(ac-ft)
Mean Annual Spillway Discharge
Volume (ac-ft) Capture Ratio
Capture Ratio Change from
Historical
Mean Annual Frequency of
Spillway Events
Task
4
Task
5
(Str
uctu
ral C
once
pt)
Task
4
Task
5
(Str
uctu
ral C
once
pt)
Task
4
Task
5
(Str
uctu
ral C
once
pt)
Task
4
Task
5
(Str
uctu
ral C
once
pt)
Task
4
Task
5
(Str
uctu
ral C
once
pt)
Task
4
Task
5
(Str
uctu
ral C
once
pt)
Historical 6,802 NA 6,452 NA 349 NA 94.9% NA NA NA 0.88 NA High 1 14,081 14,082 12,106 14,053 1,975 29 86.0% 99.8% -8.9% 4.9% 3.54 0.02 Medium 2 8,905 8,906 8,010 8,898 895 7 90.0% 99.9% -4.9% 5.1% 1.77 0.01 Low 1 4,694 4,694 4,323 4,686 371 8 92.1% 99.8% -2.8% 5.0% 0.62 0.01 Low 2 7,317 7,317 6,783 7,298 533 19 92.7% 99.7% -2.2% 4.9% 0.94 0.02

Los Angeles Basin Study Task 5. Infrastructure and Operations Concepts Appendices
E-10
Table E-8. San Dimas Dam Structural Concept Results
Scenario
Mean Annual Inflow (ac-ft)
Mean Annual Volume Captured
(ac-ft)
Mean Annual Spillway Discharge
Volume (ac-ft) Capture Ratio
Capture Ratio Change from
Historical
Mean Annual Frequency of
Spillway Events
Task
4
Task
5
(Str
uctu
ral C
once
pt)
Task
4
Task
5
(Str
uctu
ral C
once
pt)
Task
4
Task
5
(Str
uctu
ral C
once
pt)
Task
4
Task
5
(Str
uctu
ral C
once
pt)
Task
4
Task
5
(Str
uctu
ral C
once
pt)
Task
4
Task
5
(Str
uctu
ral C
once
pt)
Historical 5,451 NA 4,474 NA 957 NA 82.1% NA NA NA 0.72 NA High 1 10,884 10,884 6,798 10,771 4,066 93 62.5% 99.0% -19.6% 16.9% 2.00 0.15 Medium 2 6,937 6,937 4,823 6,864 2,094 53 69.5% 99.0% -12.6% 16.9% 1.45 0.08 Low 1 3,645 3,645 2,883 3,592 740 31 79.1% 98.5% -3.0% 16.4% 0.49 0.05 Low 2 5,636 5,636 4,471 5,564 1,144 50 79.3% 98.7% -2.8% 16.7% 0.94 0.08

Los Angeles Basin Study Task 5. Infrastructure and Operations Concepts Appendices
E-11
Table E-9. San Gabriel Dam Structural Concept Results
Scenario
Mean Annual Inflow (ac-ft)
Mean Annual Volume Captured
(ac-ft)
Mean Annual Spillway Discharge
Volume (ac-ft) Capture Ratio
Capture Ratio Change from
Historical
Mean Annual Frequency of
Spillway Events
Task
4
Task
5
(Str
uctu
ral C
once
pt)
Task
4
Task
5
(Str
uctu
ral C
once
pt)
Task
4
Task
5
(Str
uctu
ral C
once
pt)
Task
4
Task
5
(Str
uctu
ral C
once
pt)
Task
4
Task
5
(Str
uctu
ral C
once
pt)
Task
4
Task
5
(Str
uctu
ral C
once
pt)
Historical 110,658 NA 90,825 NA 19,825 NA 82.1% NA NA NA 0.52 NA High 1 235,551 235,608 140,764 224,166 94,785 11,438 59.8% 95.1% -22.3% 13.1% 1.89 0.88 Medium 2 152,736 152,760 108,576 147,980 44,151 4,770 71.1% 96.9% -11.0% 14.8% 1.18 0.25 Low 1 84,125 84,139 68,813 82,523 15,302 1,603 81.8% 98.1% -0.3% 16.0% 0.42 0.13 Low 2 127,561 127,575 102,910 125,292 24,640 2,270 80.7% 98.2% -1.4% 16.1% 0.88 0.15

Los Angeles Basin Study Task 5. Infrastructure and Operations Concepts Appendices
E-12
Table E-10. LACFCD Dams Non-Structural Concept Results – High 1 Scenario
Dam Name
Mean Annual Volume Captured (ac-ft)
Mean Annual Spillway Discharge
Volume (ac-ft) Capture Ratio
Capture Ratio Change from
Historical
Mean Annual Frequency of
Spillway Event H
isto
rical
Task
4
Task
5
(Str
uctu
ral C
once
pt)
Task
4
Task
5
(Str
uctu
ral C
once
pt)
His
toric
al
Task
4
Task
5
(Str
uctu
ral C
once
pt)
Task
4
Task
5
(Str
uctu
ral C
once
pt)
Task
4
Task
5
(Str
uctu
ral C
once
pt)
4 Devil's Gate 9,570 12,925 11,677 19,277 19,898 66.9% 40.1% 36.3% -26.8% -30.7% 2.94 4.14 5 Eaton Wash 3,681 6,426 3,183 2,739 5,284 86.6% 70.1% 34.7% -16.5% -51.9% 5.46 25.15 13 Santa Anita 3,312 6,775 6,412 1,862 2,176 92.9% 78.4% 74.2% -14.5% -18.7% 2.38 3.52 Totals 16,564 26,126 21,272 23,877 27,357 74.9% 52.2% 42.5% -22.7% -32.4% NA NA

Los Angeles Basin Study Task 5. Infrastructure and Operations Concepts Appendices
E-13
Table E-11. LACFCD Dams Non-Structural Concept Results – Low 1 Scenario
Dam Name
Mean Annual Volume Captured (ac-ft)
Mean Annual Spillway Discharge
Volume (ac-ft) Capture Ratio
Capture Ratio Change from
Historical
Mean Annual Frequency of
Spillway Event H
isto
rical
Task
4
Task
5
(Str
uctu
ral C
once
pt)
Task
4
Task
5
(Str
uctu
ral C
once
pt)
His
toric
al
Task
4
Task
5
(Str
uctu
ral C
once
pt)
Task
4
Task
5
(Str
uctu
ral C
once
pt)
Task
4
Task
5
(Str
uctu
ral C
once
pt)
4 Devil's Gate 9,570 6,879 6,131 3,770 4,090 66.9% 64.6% 57.6% -2.3% -9.4% 0.93 1.45 5 Eaton Wash 3,681 2,867 1,271 500 1,508 86.6% 85.2% 37.7% -1.5% -48.9% 1.12 9.52 13 Santa Anita 3,312 2,382 2,291 282 323 92.9% 89.2% 85.8% -3.6% -7.0% 0.49 0.63 Totals 16,564 12,127 9,693 4,552 5,922 74.9% 72.7% 58.1% -2.2% -16.8% NA NA

Los Angeles Basin Study Task 5. Infrastructure and Operations Concepts Appendices
E-14
Table E-12. LACFCD Dams Non-Structural Concept Results – Low 2 Scenario
Dam Name
Mean Annual Volume Captured (ac-ft)
Mean Annual Spillway Discharge
Volume (ac-ft) Capture Ratio
Capture Ratio Change from
Historical
Mean Annual Frequency of
Spillway Event H
isto
rical
Task
4
Task
5
(Str
uctu
ral C
once
pt)
Task
4
Task
5
(Str
uctu
ral C
once
pt)
His
toric
al
Task
4
Task
5
(Str
uctu
ral C
once
pt)
Task
4
Task
5
(Str
uctu
ral C
once
pt)
Task
4
Task
5
(Str
uctu
ral C
once
pt)
4 Devil's Gate 9,570 10,103 9,658 6,127 6,353 66.9% 62.2% 59.5% -4.7% -7.4% 1.85 2.24 5 Eaton Wash 3,681 4,226 2,030 854 2,432 86.6% 83.2% 40.0% -3.4% -46.7% 2.20 14.96 13 Santa Anita 3,312 3,919 3,800 382 472 92.9% 91.0% 88.3% -1.8% -4.6% 0.69 1.15 Totals 16,564 18,248 15,487 7,362 9,257 74.9% 71.2% 60.5% -3.7% -14.4% NA NA

Los Angeles Basin Study Task 5. Infrastructure and Operations Concepts Appendices
E-15
Table E-13. LACFCD Dams Summary of Estimated Costs of Structural Concepts
Dam Name Estimated Total
Annual Cost
Change of Mean Annual Volume Captured (ac-ft)
Estimated Annual Cost per Ac-Ft of Additional Volume Captured
High 1 Medium 2 Low 1 Low 2 High 1 Medium 2 Low 1 Low 2 Big Tajunga $1,099,474 21,454 11,786 3,599 8,320 $51 $93 $305 $132
Cogswell $1,145,670 24,283 11,762 4,036 7,801 $47 $97 $284 $147
Devil's Gate $4,634,504 19,279 9,747 3,770 6,127 $240 $475 $1,229 $756
Eaton Wash $1,351,402 2,679 1,277 485 838 $504 $1,059 $2,788 $1,613
Morris $3,798,384 103,406 71,853 30,099 63,457 $37 $53 $126 $60
Pacoima $3,029,836 3,655 1,259 591 619 $829 $2,407 $5,130 $4,892
Puddingstone Diversion $466,349 1,947 888 363 515 $239 $525 $1,286 $906
San Dimas $1,366,958 3,973 2,041 709 1,094 $344 $6703 $1,929 $1,250
San Gabriel $10,550,903 83,402 39,404 13,710 22,382 $127 $268 $770 $471
Totals $27,443,480 264,079 150,015 57,362 111,153 $104 $183 $478 $247

Los Angeles Basin Study Task 5. Infrastructure and Operations Concepts Appendices
E-16
This page intentionally left blank.

Los Angeles Basin Study Task 5. Infrastructure and Operations Concepts Appendices
E-17
Figure E-1. Cost Estimate for Big Tujunga Dam Structural Concept (Sheet 1 of 4)
Unit Cost $/Unit
RAISED SPILLWAY COSTS (GATES)
14 Foot Tall Pneumatically Actuated Gate 122 LF 12,600$ 1,537,200$ SUBTOTAL 1,537,200$
PROGRAMMABLE LOGIC CONTROLLER COSTS
PLC Controller (% of Gate Cost) 8% % 1,537,200$ 122,976$ SUBTOTAL 122,976$
INSTALLATION COSTS
14 Foot Tall Raised Spil lway 122 LF 15,120$ 1,844,640$ SUBTOTAL 1,844,640$
GENERAL CONDITIONS
SUBTOTAL 10% % 3,504,816$ 350,482$ Percentage of estimated construction costs
Pneumatic Gate Cost Estimates derived from market research (Obermeyer Hydro). Costs include clamping and anchoring, materials & equipment,
shipping charges, and installation supervision.
Programmable Logic Controller (PLC) cost derived from Hydrotech and Obermeyer Hydro. PLC Cost are estimated at 8% of Rubber Dam or
Pneumatically Actuated Gate (or Slide Gate) Costs.
Labor, equipment and installation costs for construction/installation of raised spil lway gates derived from market research (Hydrotech and
Obermeyer Hydro) and estimated at 60% of gate cost with multiplier of 2.0 to adjust for difficulty of site access and constricted spaces.
Quantity Units Estimated Cost NotesDescription

Los Angeles Basin Study Task 5. Infrastructure and Operations Concepts Appendices
E-18
Figure E-1. Cost Estimate for Big Tujunga Dam Structural Concept (Sheet 2 of 4)
Unit Cost $/Unit
NON-CONTRACT COSTS
Feasibil ity Studies, Surveys & Design Data 30% % 3,855,298$ 1,156,589$ Percentage of estimated construction costs (including General Conditions) with min./max. LS cost ($1.0M/$4.0M)
Designs & Specifications 15% % 3,855,298$ 578,295$ Percentage of estimated construction costs (including General Conditions) with min./max. LS cost ($0.5M/$2.0M)
Materials, Structural & Seismic Testing 5% % 3,855,298$ 192,765$ Percentage of estimated construction costs (including General Conditions)
Project Management 11% % 7,517,830$ 826,961$ Percentage of estimated construction costs & other non-contract costsLegal 5% % 3,855,298$ 192,765$ Percentage of estimated construction costs (including General Conditions)
Permitting 30% % 3,855,298$ 1,156,589$ Percentage of estimated construction costs (including General Conditions) with min./max. LS cost ($1.0M/$4.0M)
Construction Management 10% % 3,855,298$ 385,530$ Percentage of estimated construction costs (including General Conditions)
SUBTOTAL 4,489,494$
CONTINGENCIES
SUBTOTAL 30% % 8,344,792$ 2,503,437$ 15% to 40% of estimated construction costs & non-contract costs
TOTAL CONSTRUCTION COST
TOTAL 10,848,229$
Quantity Units Estimated Cost NotesDescription
Los Angeles Basin Study Task 5. Infrastructure and Operations Concepts Appendices
E-19
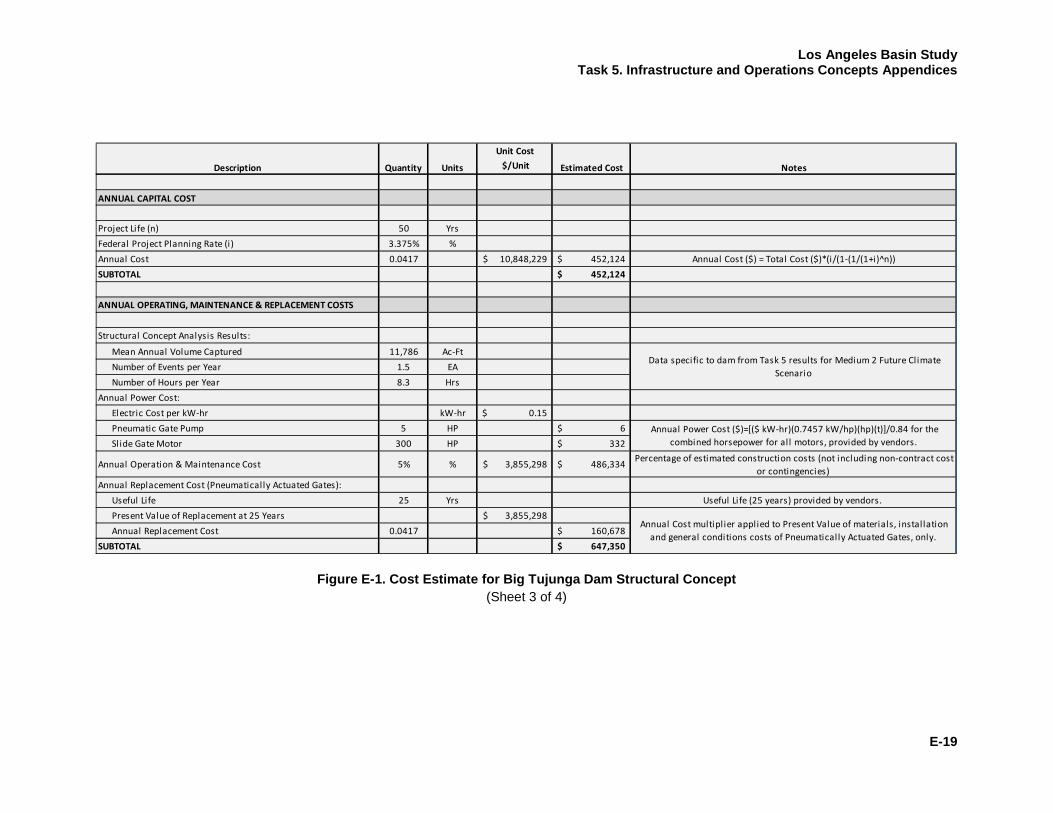
Figure E-1. Cost Estimate for Big Tujunga Dam Structural Concept (Sheet 3 of 4)
Unit Cost $/Unit
ANNUAL CAPITAL COST
Project Life (n) 50 YrsFederal Project Planning Rate (i) 3.375% %Annual Cost 0.0417 10,848,229$ 452,124$ Annual Cost ($) = Total Cost ($)*(i/(1-(1/(1+i)^n))SUBTOTAL 452,124$
ANNUAL OPERATING, MAINTENANCE & REPLACEMENT COSTS
Structural Concept Analysis Results:
Mean Annual Volume Captured 11,786 Ac-FtNumber of Events per Year 1.5 EANumber of Hours per Year 8.3 Hrs
Annual Power Cost:Electric Cost per kW-hr kW-hr 0.15$ Pneumatic Gate Pump 5 HP 6$ Sl ide Gate Motor 300 HP 332$
Annual Operation & Maintenance Cost 5% % 3,855,298$ 486,334$ Percentage of estimated construction costs (not including non-contract cost or contingencies)
Annual Replacement Cost (Pneumatically Actuated Gates):Useful Life 25 Yrs Useful Life (25 years) provided by vendors. Present Value of Replacement at 25 Years 3,855,298$ Annual Replacement Cost 0.0417 160,678$
SUBTOTAL 647,350$
Quantity Units Estimated Cost NotesDescription
Annual Power Cost ($)=[($ kW-hr)(0.7457 kW/hp)(hp)(t)]/0.84 for the combined horsepower for all motors, provided by vendors.
Data specific to dam from Task 5 results for Medium 2 Future Climate Scenario
Annual Cost multiplier applied to Present Value of materials, installation and general conditions costs of Pneumatically Actuated Gates, only.

Los Angeles Basin Study Task 5. Infrastructure and Operations Concepts Appendices
E-20
Figure E-1. Cost Estimate for Big Tujunga Dam Structural Concept (Sheet 4 of 4)
Unit Cost $/Unit
SUMMARY
TOTAL CONSTRUCTION COST 10,848,229$
ANNUAL CAPITAL COST 452,124$
ANNUAL OPERATING, MAINTENANCE & REPLACEMENT COSTS 647,350$
TOTAL ANNUAL COST 1,099,474$
TOTAL ANNUAL COST per Ac-Ft (Medium 2 Scenario) 11,786 Ac-Ft 93$
NOTES:
2 - All costs are presented in 2015 dollars.
IdentifierMaterial or Rating Quantity Units Estimated Cost NotesDescription
3 - Taxes & contractor OH&P are included in the unit prices.4 - Distributive Costs include but are not l imited to additional planning efforts, investigations, analysis, regulatory compliance, acquisition, contract administration, construction management, inspection, etc.5 - The RSMeans construction data was used to derive Feasibil ity, Design, Material Testing, Structural, and Seismic Testing percentages. The total materials and labor costs are used for the percent cost.
1 - This cost estimate is conceptual in nature and is appropriate for strategic planning, business development, project screening, alternative scheme analysis, confirmation of technical and/or economic feasibil ity, and preliminary approval to proceed. While these estimates are appropriate for the appraisal level analysis required for the purposes of this document, they are not appropriate for budget authorization, funding agreements, bid, or tender offers. Accuracy ranges are considered to be -15% to -30% on the low side and +20% to +50% on the high side.

Los Angeles Basin Study Task 5. Infrastructure and Operations Concepts Appendices
E-21
Figure E-2. Cost Estimate for Cogswell Dam Structural Concept (Sheet 1 of 4)
Unit Cost $/Unit
RAISED SPILLWAY COSTS (GATES)
13 Foot Tall Pneumatically Actuated Gate 145 LF 11,050.00$ 1,602,250$ SUBTOTAL 1,602,250$
PROGRAMMABLE LOGIC CONTROLLER COSTS
PLC Controller (% of Gate Cost) 8% % 1,602,250$ 128,180$ SUBTOTAL 128,180$
INSTALLATION COSTS
13 Foot Tall Raised Spil lway 145 LF 13,260$ 1,922,700$ SUBTOTAL 1,922,700$
GENERAL CONDITIONS
SUBTOTAL 10% % 3,653,130$ 365,313$ Percentage of estimated construction costs
Description Quantity Units Estimated Cost Notes
Pneumatic Gate Cost Estimates derived from market research (Obermeyer Hydro). Costs include clamping and anchoring, materials & equipment,
shipping charges, and installation supervision.
Programmable Logic Controller (PLC) cost derived from Hydrotech and Obermeyer Hydro. PLC Cost are estimated at 8% of Rubber Dam or
Pneumatically Actuated Gate (or Slide Gate) Costs.
Labor, equipment and installation costs for construction/installation of raised spil lway gates derived from market research (Hydrotech and
Obermeyer Hydro) and estimated at 60% of gate cost with multiplier of 2.0 to adjust for difficulty of site access and constricted spaces.

Los Angeles Basin Study Task 5. Infrastructure and Operations Concepts Appendices
E-22
Figure E-2. Cost Estimate for Cogswell Dam Structural Concept (Sheet 2 of 4)
Unit Cost $/Unit
NON-CONTRACT COSTS
Feasibil ity Studies, Surveys & Design Data 30% % 4,018,443$ 1,205,533$ Percentage of estimated construction costs (including General Conditions) with min./max. LS cost ($1.0M/$4.0M)
Designs & Specifications 15% % 4,018,443$ 602,766$ Percentage of estimated construction costs (including General Conditions) with min./max. LS cost ($0.5M/$2.0M)
Materials, Structural & Seismic Testing 5% % 4,018,443$ 200,922$ Percentage of estimated construction costs (including General Conditions)Project Management 11% % 7,835,964$ 861,956$ Percentage of estimated construction costs & other non-contract costsLegal 5% % 4,018,443$ 200,922$ Percentage of estimated construction costs (including General Conditions)
Permitting 30% % 4,018,443$ 1,205,533$ Percentage of estimated construction costs (including General Conditions) with min./max. LS cost ($1.0M/$4.0M)
Construction Management 10% % 4,018,443$ 401,844$ Percentage of estimated construction costs (including General Conditions)SUBTOTAL 4,679,477$
CONTINGENCIES
SUBTOTAL 30% % 8,697,920$ 2,609,376$ 15% to 40% of estimated construction costs & non-contract costs
TOTAL CONSTRUCTION COST
TOTAL 11,307,296$
Description Quantity Units Estimated Cost Notes

Los Angeles Basin Study Task 5. Infrastructure and Operations Concepts Appendices
E-23
Figure E-2. Cost Estimate for Cogswell Dam Structural Concept (Sheet 3 of 4)
Unit Cost $/Unit
ANNUAL CAPITAL COST
Project Life (n) 50 YrsFederal Project Planning Rate (i) 3.375% %Annual Cost 0.0417 11,307,296$ 471,257$ Annual Cost ($) = Total Cost ($)*(i/(1-(1/(1+i)^n))SUBTOTAL 471,257$
ANNUAL OPERATING, MAINTENANCE & REPLACEMENT COSTS
Structural Concept Analysis Results:
Mean Annual Volume Captured 11,762 Ac-FtNumber of Events per Year 0.2 EANumber of Hours per Year 0.5 Hrs
Annual Power Cost:Electric Cost per kW-hr kW-hr 0.15$ Pneumatic Gate Pump 5 HP 0$ Sl ide Gate Motor 300 HP 20$
Annual Operation & Maintenance Cost 5% % 4,018,443$ 506,915$ Percentage of estimated construction costs (not including non-contract cost or contingencies)
Annual Replacement Cost (Pneumatically Actuated Gates):Useful Life 25 Yrs Useful Life (25 years) provided by vendors. Present Value of Replacement at 25 Years 4,018,443$ Annual Replacement Cost 0.0417 167,478$
SUBTOTAL 674,413$
Description
Annual Power Cost ($)=[($ kW-hr)(0.7457 kW/hp)(hp)(t)]/0.84 for the combined horsepower for all motors, provided by vendors.
Quantity Units Estimated Cost Notes
Data specific to dam from Task 5 results for Medium 2 Future Climate Scenario
Annual Cost multiplier applied to Present Value of materials, installation and general conditions costs of Pneumatically Actuated Gates, only.

Los Angeles Basin Study Task 5. Infrastructure and Operations Concepts Appendices
E-24
Figure E-2. Cost Estimate for Cogswell Dam Structural Concept (Sheet 4 of 4)
Unit Cost $/Unit
SUMMARY
TOTAL CONSTRUCTION COST 11,307,296$
ANNUAL CAPITAL COST 471,257$
ANNUAL OPERATING, MAINTENANCE & REPLACEMENT COSTS 674,413$
TOTAL ANNUAL COST 1,145,670$
TOTAL ANNUAL COST per Ac-Ft (Medium 2 Scenario) 11,762 Ac-Ft 97$
NOTES:
2 - All costs are presented in 2015 dollars.
IdentifierMaterial or Rating Description Quantity Units Estimated Cost Notes
1 - This cost estimate is conceptual in nature and is appropriate for strategic planning, business development, project screening, alternative scheme analysis, confirmation of technical and/or economic feasibil ity, and preliminary approval to proceed. While these estimates are appropriate for the appraisal level analysis required for the purposes of this document, they are not appropriate for budget authorization, funding agreements, bid, or tender offers. Accuracy ranges are considered to be -15% to -30% on the low side and +20% to +50% on the high side.
3 - Taxes & contractor OH&P are included in the unit prices.4 - Distributive Costs include but are not l imited to additional planning efforts, investigations, analysis, regulatory compliance, acquisition, contract administration, construction management, inspection, etc.5 - The RSMeans construction data was used to derive Feasibil ity, Design, Material Testing, Structural, and Seismic Testing percentages. The total materials and labor costs are used for the percent cost.

Los Angeles Basin Study Task 5. Infrastructure and Operations Concepts Appendices
E-25
Figure E-3. Cost Estimate for Devils Gate Dam Structural Concept (Sheet 1 of 4)
Unit Cost $/Unit
RAISED SPILLWAY COSTS (GATES)
5 Foot Tall Pneumatically Actuated Gate 171 LF 2,250.00$ 384,750$ (W' X H') 12.75' X 4' Sl ide Gate 8 EA 562,100.00$ 4,496,800$ (W X H') 14' X 4' Sl ide Gate 3 EA 606,350.00$ 1,819,050$ SUBTOTAL 6,700,600$
PROGRAMMABLE LOGIC CONTROLLER COSTS
PLC Controller (% of Gate Cost) 8% % 6,700,600$ 536,048$ SUBTOTAL 536,048$
INSTALLATION COSTS
5 Foot Tall Raised Spil lway 171 LF 2,700$ 461,700$ 12.75' X 4' Sl ide Gate 8 EA 674,520$ 5,396,160$ 14' X 4' Sl ide Gate 3 EA 727,620$ 2,182,860$ SUBTOTAL 8,040,720$
GENERAL CONDITIONS
SUBTOTAL 10% % 15,277,368$ 1,527,737$ Percentage of estimated construction costs
Description Quantity Units Estimated Cost Notes
Programmable Logic Controller (PLC) cost derived from Hydrotech and Obermeyer Hydro. PLC Cost are estimated at 8% of Rubber Dam or
Pneumatically Actuated Gate (or Slide Gate) Costs.
Pneumatic Gate Cost Estimates derived from market research (Obermeyer Hydro). Costs include clamping and anchoring, materials & equipment,
shipping charges, and installation supervision.
Sl ide Gate Cost Estimates derived from USBR historical bids from the Expect Database Search at the Technical Service Center (TSC) in Denver.
Rectangular and square gates are measured width by height (W' X H').
Labor, equipment and installation costs for construction/installation of raised spil lway gates derived from market research (Hydrotech and
Obermeyer Hydro) and estimated at 60% of gate cost with multiplier of 2.0 to adjust for difficulty of site access and constricted spaces.

Los Angeles Basin Study Task 5. Infrastructure and Operations Concepts Appendices
E-26
Figure E-3. Cost Estimate for Devils Gate Dam Structural Concept (Sheet 2 of 4)
Unit Cost $/Unit
NON-CONTRACT COSTS
Feasibil ity Studies, Surveys & Design Data 1 LS 4,000,000$ Percentage of estimated construction costs (including General Conditions) with min./max. LS cost ($1.0M/$4.0M)
Designs & Specifications 1 LS 2,000,000$ Percentage of estimated construction costs (including General Conditions) with min./max. LS cost ($0.5M/$2.0M)
Materials, Structural & Seismic Testing 5% % 16,805,105$ 840,255$ Percentage of estimated construction costs (including General Conditions)Project Management 11% % 30,166,126$ 3,318,274$ Percentage of estimated construction costs & other non-contract costsLegal 5% % 16,805,105$ 840,255$ Percentage of estimated construction costs (including General Conditions)
Permitting 1 LS 4,000,000$ Percentage of estimated construction costs (including General Conditions) with min./max. LS cost ($1.0M/$4.0M)
Construction Management 10% % 16,805,105$ 1,680,510$ Percentage of estimated construction costs (including General Conditions)SUBTOTAL 16,679,295$
CONTINGENCIES
SUBTOTAL 30% % 33,484,400$ 10,045,320$ 15% to 40% of estimated construction costs & non-contract costs
TOTAL CONSTRUCTION COST
TOTAL 43,529,719$
ANNUAL CAPITAL COST
Project Life (n) 50 YrsFederal Project Planning Rate (i) 3.375% %Annual Cost 0.0417 43,529,719$ 1,814,199$ Annual Cost ($) = Total Cost ($)*(i/(1-(1/(1+i)^n))SUBTOTAL 1,814,199$
Description Quantity Units Estimated Cost Notes

Los Angeles Basin Study Task 5. Infrastructure and Operations Concepts Appendices
E-27
Figure E-3. Cost Estimate for Devils Gate Dam Structural Concept (Sheet 3 of 4)
Unit Cost $/Unit
ANNUAL CAPITAL COST
Project Life (n) 50 YrsFederal Project Planning Rate (i) 3.375% %Annual Cost 0.0417 43,529,719$ 1,814,199$ Annual Cost ($) = Total Cost ($)*(i/(1-(1/(1+i)^n))SUBTOTAL 1,814,199$
ANNUAL OPERATING, MAINTENANCE & REPLACEMENT COSTS
Structural Concept Analysis Results:
Mean Annual Volume Captured 9,747 Ac-FtNumber of Events per Year 0.0 EANumber of Hours per Year 0.0 Hrs
Annual Power Cost:Electric Cost per kW-hr kW-hr 0.15$ Pneumatic Gate Pump 5 HP -$ Sl ide Gate Motor 300 HP -$
Annual Operation & Maintenance Cost 5% % 16,805,105$ 2,119,914$ Percentage of estimated construction costs (not including non-contract cost or contingencies)
Annual Replacement Cost (Pneumatically Actuated Gates):Useful Life 25 Yrs Useful Life (25 years) provided by vendors. Present Value of Replacement at 25 Years 16,805,105$ Annual Replacement Cost 0.0417 700,391$
SUBTOTAL 2,820,305$
Description
Annual Power Cost ($)=[($ kW-hr)(0.7457 kW/hp)(hp)(t)]/0.84 for the combined horsepower for all motors, provided by vendors.
Quantity Units Estimated Cost Notes
Data specific to dam from Task 5 results for Medium 2 Future Climate Scenario
Annual Cost multiplier applied to Present Value of materials, installation and general conditions costs of Pneumatically Actuated Gates, only.

Los Angeles Basin Study Task 5. Infrastructure and Operations Concepts Appendices
E-28
Figure E-3. Cost Estimate for Devils Gate Dam Structural Concept (Sheet 4 of 4)
Unit Cost $/Unit
SUMMARY
TOTAL CONSTRUCTION COST 43,529,719$
ANNUAL CAPITAL COST 1,814,199$
ANNUAL OPERATING, MAINTENANCE & REPLACEMENT COSTS 2,820,305$
TOTAL ANNUAL COST 4,634,504$
TOTAL ANNUAL COST per Ac-Ft (Medium 2 Scenario) 9,747 Ac-Ft 475$
NOTES:
2 - All costs are presented in 2015 dollars.
IdentifierMaterial or Rating Description Quantity Units Estimated Cost Notes
1 - This cost estimate is conceptual in nature and is appropriate for strategic planning, business development, project screening, alternative scheme analysis, confirmation of technical and/or economic feasibil ity, and preliminary approval to proceed. While these estimates are appropriate for the appraisal level analysis required for the purposes of this document, they are not appropriate for budget authorization, funding agreements, bid, or tender offers. Accuracy ranges are considered to be -15% to -30% on the low side and +20% to +50% on the high side.
3 - Taxes & contractor OH&P are included in the unit prices.4 - Distributive Costs include but are not l imited to additional planning efforts, investigations, analysis, regulatory compliance, acquisition, contract administration, construction management, inspection, etc.5 - The RSMeans construction data was used to derive Feasibil ity, Design, Material Testing, Structural, and Seismic Testing percentages. The total materials and labor costs are used for the percent cost.

Los Angeles Basin Study Task 5. Infrastructure and Operations Concepts Appendices
E-29
Figure E-4. Cost Estimate for Eaton Wash Dam Structural Concept (Sheet 1 of 4)
Unit Cost $/Unit
RAISED SPILLWAY COSTS (GATES)
10 Foot Tall Pneumatically Actuated Gate 270 LF 7,000$ 1,890,000$ SUBTOTAL 1,890,000$
PROGRAMMABLE LOGIC CONTROLLER COSTS
PLC Controller (% of Gate Cost) 8% % 1,890,000$ 151,200$ SUBTOTAL 151,200$
INSTALLATION COSTS
10 Foot Tall Raised Spil lway 270 LF 8,400$ 2,268,000$ SUBTOTAL 2,268,000$
GENERAL CONDITIONS
SUBTOTAL 10% % 4,309,200$ 430,920$ Percentage of estimated construction costs
Description Quantity Units Estimated Cost Notes
Pneumatic Gate Cost Estimates derived from market research (Obermeyer Hydro). Costs include clamping and anchoring, materials & equipment,
shipping charges, and installation supervision.
Programmable Logic Controller (PLC) cost derived from Hydrotech and Obermeyer Hydro. PLC Cost are estimated at 8% of Rubber Dam or
Pneumatically Actuated Gate (or Slide Gate) Costs.
Labor, equipment and installation costs for construction/installation of raised spil lway gates derived from market research (Hydrotech and
Obermeyer Hydro) and estimated at 60% of gate cost with multiplier of 2.0 to adjust for difficulty of site access and constricted spaces.

Los Angeles Basin Study Task 5. Infrastructure and Operations Concepts Appendices
E-30
Figure E-4. Cost Estimate for Eaton Wash Dam Structural Concept (Sheet 2 of 4)
Unit Cost $/Unit
NON-CONTRACT COSTS
Feasibil ity Studies, Surveys & Design Data 30% % 4,740,120$ 1,422,036$ Percentage of estimated construction costs (including General Conditions) with min./max. LS cost ($1.0M/$4.0M)
Designs & Specifications 15% % 4,740,120$ 711,018$ Percentage of estimated construction costs (including General Conditions) with min./max. LS cost ($0.5M/$2.0M)
Materials, Structural & Seismic Testing 5% % 4,740,120$ 237,006$ Percentage of estimated construction costs (including General Conditions)Project Management 11% % 9,243,234$ 1,016,756$ Percentage of estimated construction costs & other non-contract costsLegal 5% % 4,740,120$ 237,006$ Percentage of estimated construction costs (including General Conditions)
Permitting 30% % 4,740,120$ 1,422,036$ Percentage of estimated construction costs (including General Conditions) with min./max. LS cost ($1.0M/$4.0M)
Construction Management 10% % 4,740,120$ 474,012$ Percentage of estimated construction costs (including General Conditions)SUBTOTAL 5,519,870$
CONTINGENCIES
SUBTOTAL 30% % 10,259,990$ 3,077,997$ 15% to 40% of estimated construction costs & non-contract costs
TOTAL CONSTRUCTION COST
TOTAL 13,337,987$
Description Quantity Units Estimated Cost Notes

Los Angeles Basin Study Task 5. Infrastructure and Operations Concepts Appendices
E-31
Figure E-4. Cost Estimate for Eaton Wash Dam Structural Concept (Sheet 3 of 4)
Unit Cost $/Unit
ANNUAL CAPITAL COST
Project Life (n) 50 YrsFederal Project Planning Rate (i) 3.375% %Annual Cost 0.0417 13,337,987$ 555,891$ Annual Cost ($) = Total Cost ($)*(i/(1-(1/(1+i)^n))SUBTOTAL 555,891$
ANNUAL OPERATING, MAINTENANCE & REPLACEMENT COSTS
Structural Concept Analysis Results:
Mean Annual Volume Captured 1,277 Ac-FtNumber of Events per Year 0.0 EANumber of Hours per Year 0.1 Hrs
Annual Power Cost:Electric Cost per kW-hr kW-hr 0.15$ Pneumatic Gate Pump 5 HP 0$ Sl ide Gate Motor 300 HP 4$
Annual Operation & Maintenance Cost 5% % 4,740,120$ 597,952$ Percentage of estimated construction costs (not including non-contract cost or contingencies)
Annual Replacement Cost (Pneumatically Actuated Gates):Useful Life 25 Yrs Useful Life (25 years) provided by vendors. Present Value of Replacement at 25 Years 4,740,120$ Annual Replacement Cost 0.0417 197,555$
SUBTOTAL 795,511$
Description
Annual Power Cost ($)=[($ kW-hr)(0.7457 kW/hp)(hp)(t)]/0.84 for the combined horsepower for all motors, provided by vendors.
Quantity Units Estimated Cost Notes
Data specific to dam from Task 5 results for Medium 2 Future Climate Scenario
Annual Cost multiplier applied to Present Value of materials, installation and general conditions costs of Pneumatically Actuated Gates, only.

Los Angeles Basin Study Task 5. Infrastructure and Operations Concepts Appendices
E-32
Figure E-4. Cost Estimate for Eaton Wash Dam Structural Concept (Sheet 4 of 4)
Unit Cost $/Unit
SUMMARY
TOTAL CONSTRUCTION COST 13,337,987$
ANNUAL CAPITAL COST 555,891$
ANNUAL OPERATING, MAINTENANCE & REPLACEMENT COSTS 795,511$
TOTAL ANNUAL COST 1,351,402$
TOTAL ANNUAL COST per Ac-Ft (Medium 2 Scenario) 1,277 Ac-Ft 1,058$
NOTES:
2 - All costs are presented in 2015 dollars.
IdentifierMaterial or Rating Description Quantity Units Estimated Cost Notes
1 - This cost estimate is conceptual in nature and is appropriate for strategic planning, business development, project screening, alternative scheme analysis, confirmation of technical and/or economic feasibil ity, and preliminary approval to proceed. While these estimates are appropriate for the appraisal level analysis required for the purposes of this document, they are not appropriate for budget authorization, funding agreements, bid, or tender offers. Accuracy ranges are considered to be -15% to -30% on the low side and +20% to +50% on the high side.
3 - Taxes & contractor OH&P are included in the unit prices.4 - Distributive Costs include but are not l imited to additional planning efforts, investigations, analysis, regulatory compliance, acquisition, contract administration, construction management, inspection, etc.5 - The RSMeans construction data was used to derive Feasibil ity, Design, Material Testing, Structural, and Seismic Testing percentages. The total materials and labor costs are used for the percent cost.

Los Angeles Basin Study Task 5. Infrastructure and Operations Concepts Appendices
E-33
Figure E-5. Cost Estimate for Morris Dam Structural Concept (Sheet 1 of 4)
Unit Cost $/Unit
RAISED SPILLWAY COSTS (GATES)
23 Foot Tall Pneumatically Actuated Gate 171 LF 31,050$ 5,309,550$ SUBTOTAL 5,309,550$
PROGRAMMABLE LOGIC CONTROLLER COSTS
PLC Controller (% of Gate Cost) 8% % 5,309,550$ 424,764$ SUBTOTAL 424,764$
INSTALLATION COSTS
23 Foot Tall Raised Spil lway 171 LF 37,260$ 6,371,460$ SUBTOTAL 6,371,460$
GENERAL CONDITIONS
SUBTOTAL 10% % 12,105,774$ 1,210,577$ Percentage of estimated construction costs
Description Quantity Units Estimated Cost Notes
Pneumatic Gate Cost Estimates derived from market research (Obermeyer Hydro). Costs include clamping and anchoring, materials & equipment,
shipping charges, and installation supervision.
Programmable Logic Controller (PLC) cost derived from Hydrotech and Obermeyer Hydro. PLC Cost are estimated at 8% of Rubber Dam or
Pneumatically Actuated Gate (or Slide Gate) Costs.
Labor, equipment and installation costs for construction/installation of raised spil lway gates derived from market research (Hydrotech and
Obermeyer Hydro) and estimated at 60% of gate cost with multiplier of 2.0 to adjust for difficulty of site access and constricted spaces.

Los Angeles Basin Study Task 5. Infrastructure and Operations Concepts Appendices
E-34
Figure E-5. Cost Estimate for Morris Dam Structural Concept (Sheet 2 of 4)
Unit Cost $/Unit
NON-CONTRACT COSTS
Feasibil ity Studies, Surveys & Design Data 30% % 13,316,351$ 3,994,905$ Percentage of estimated construction costs (including General Conditions) with min./max. LS cost ($1.0M/$4.0M)
Designs & Specifications 15% % 13,316,351$ 1,997,453$ Percentage of estimated construction costs (including General Conditions) with min./max. LS cost ($0.5M/$2.0M)
Materials, Structural & Seismic Testing 5% % 13,316,351$ 665,818$ Percentage of estimated construction costs (including General Conditions)Project Management 11% % 25,966,885$ 2,856,357$ Percentage of estimated construction costs & other non-contract costsLegal 5% % 13,316,351$ 665,818$ Percentage of estimated construction costs (including General Conditions)
Permitting 30% % 13,316,351$ 3,994,905$ Percentage of estimated construction costs (including General Conditions) with min./max. LS cost ($1.0M/$4.0M)
Construction Management 10% % 13,316,351$ 1,331,635$ Percentage of estimated construction costs (including General Conditions)SUBTOTAL 15,506,891$
CONTINGENCIES
SUBTOTAL 30% % 28,823,243$ 8,646,973$ 15% to 40% of estimated construction costs & non-contract costs
TOTAL CONSTRUCTION COST
TOTAL 37,470,215$
Description Quantity Units Estimated Cost Notes

Los Angeles Basin Study Task 5. Infrastructure and Operations Concepts Appendices
E-35
Figure E-5. Cost Estimate for Morris Dam Structural Concept (Sheet 3 of 4)
Unit Cost $/Unit
ANNUAL CAPITAL COST
Project Life (n) 50 YrsFederal Project Planning Rate (i) 3.375% %Annual Cost 0.0417 37,470,215$ 1,561,656$ Annual Cost ($) = Total Cost ($)*(i/(1-(1/(1+i)^n))SUBTOTAL 1,561,656$
ANNUAL OPERATING, MAINTENANCE & REPLACEMENT COSTS
Structural Concept Analysis Results:
Mean Annual Volume Captured 71,853 Ac-FtNumber of Events per Year 0.8 EANumber of Hours per Year 47.3 Hrs
Annual Power Cost:Electric Cost per kW-hr kW-hr 0.15$ Pneumatic Gate Pump 5 HP 31$ Sl ide Gate Motor 300 HP 1,890$
Annual Operation & Maintenance Cost 5% % 13,316,351$ 1,679,818$ Percentage of estimated construction costs (not including non-contract cost or contingencies)
Annual Replacement Cost (Pneumatically Actuated Gates):Useful Life 25 Yrs Useful Life (25 years) provided by vendors. Present Value of Replacement at 25 Years 13,316,351$ Annual Replacement Cost 0.0417 554,989$
SUBTOTAL 2,236,728$
Description
Annual Power Cost ($)=[($ kW-hr)(0.7457 kW/hp)(hp)(t)]/0.84 for the combined horsepower for all motors, provided by vendors.
Quantity Units Estimated Cost Notes
Data specific to dam from Task 5 results for Medium 2 Future Climate Scenario
Annual Cost multiplier applied to Present Value of materials, installation and general conditions costs of Pneumatically Actuated Gates, only.

Los Angeles Basin Study Task 5. Infrastructure and Operations Concepts Appendices
E-36
Figure E-5. Cost Estimate for Morris Dam Structural Concept (Sheet 4 of 4)
Unit Cost $/Unit
SUMMARY
TOTAL CONSTRUCTION COST 37,470,215$
ANNUAL CAPITAL COST 1,561,656$
ANNUAL OPERATING, MAINTENANCE & REPLACEMENT COSTS 2,236,728$
TOTAL ANNUAL COST 3,798,384$
TOTAL ANNUAL COST per Ac-Ft (Medium 2 Scenario) 71,853 Ac-Ft 53$
NOTES:
2 - All costs are presented in 2015 dollars.
IdentifierMaterial or Rating Description Quantity Units Estimated Cost Notes
1 - This cost estimate is conceptual in nature and is appropriate for strategic planning, business development, project screening, alternative scheme analysis, confirmation of technical and/or economic feasibil ity, and preliminary approval to proceed. While these estimates are appropriate for the appraisal level analysis required for the purposes of this document, they are not appropriate for budget authorization, funding agreements, bid, or tender offers. Accuracy ranges are considered to be -15% to -30% on the low side and +20% to +50% on the high side.
3 - Taxes & contractor OH&P are included in the unit prices.4 - Distributive Costs include but are not l imited to additional planning efforts, investigations, analysis, regulatory compliance, acquisition, contract administration, construction management, inspection, etc.5 - The RSMeans construction data was used to derive Feasibil ity, Design, Material Testing, Structural, and Seismic Testing percentages. The total materials and labor costs are used for the percent cost.

Los Angeles Basin Study Task 5. Infrastructure and Operations Concepts Appendices
E-37
Figure E-6. Cost Estimate for Pacoima Dam Structural Concept (Sheet 1 of 4)
Unit Cost $/Unit
RAISED SPILLWAY COSTS (GATES)
(W' X H') 14' X 14' Slide Gate 2 EA 2,118,680$ 4,237,360$ SUBTOTAL 4,237,360$
PROGRAMMABLE LOGIC CONTROLLER COSTS
PLC Controller (% of Gate Cost) 8% % 4,237,360$ 338,989$ SUBTOTAL 338,989$
INSTALLATION COSTS
14' X 14' Slide Gate 2 EA 2,542,416$ 5,084,832$ SUBTOTAL 5,084,832$
GENERAL CONDITIONS
SUBTOTAL 10% % 9,661,181$ 966,118$ Percentage of estimated construction costs
Description Quantity Units Estimated Cost Notes
Sl ide Gate Cost Estimates derived from USBR historical bids from the Expect Database Search at the Technical Service Center (TSC) in Denver.
Rectangular and square gates are measured width by height (W' X H').
Programmable Logic Controller (PLC) cost derived from Hydrotech and Obermeyer Hydro. PLC Cost are estimated at 8% of Rubber Dam or
Pneumatically Actuated Gate (or Slide Gate) Costs.
Labor, equipment and installation costs for construction/installation of raised spil lway gates derived from market research (Hydrotech and
Obermeyer Hydro) and estimated at 60% of gate cost with multiplier of 2.0 to adjust for difficulty of site access and constricted spaces.

Los Angeles Basin Study Task 5. Infrastructure and Operations Concepts Appendices
E-38
Figure E-6. Cost Estimate for Pacoima Dam Structural Concept (Sheet 2 of 4)
Unit Cost $/Unit
NON-CONTRACT COSTS
Feasibil ity Studies, Surveys & Design Data 30% % 10,627,299$ 3,188,190$ Percentage of estimated construction costs (including General Conditions) with min./max. LS cost ($1.0M/$4.0M)
Designs & Specifications 15% % 10,627,299$ 1,594,095$ Percentage of estimated construction costs (including General Conditions) with min./max. LS cost ($0.5M/$2.0M)
Materials, Structural & Seismic Testing 5% % 10,627,299$ 531,365$ Percentage of estimated construction costs (including General Conditions)Project Management 11% % 20,723,233$ 2,279,556$ Percentage of estimated construction costs & other non-contract costsLegal 5% % 10,627,299$ 531,365$ Percentage of estimated construction costs (including General Conditions)
Permitting 30% % 10,627,299$ 3,188,190$ Percentage of estimated construction costs (including General Conditions) with min./max. LS cost ($1.0M/$4.0M)
Construction Management 10% % 10,627,299$ 1,062,730$ Percentage of estimated construction costs (including General Conditions)SUBTOTAL 12,375,490$
CONTINGENCIES
SUBTOTAL 30% % 23,002,788$ 6,900,837$ 15% to 40% of estimated construction costs & non-contract costs
TOTAL CONSTRUCTION COST
TOTAL 29,903,625$
Description Quantity Units Estimated Cost Notes

Los Angeles Basin Study Task 5. Infrastructure and Operations Concepts Appendices
E-39
Figure E-6. Cost Estimate for Pacoima Dam Structural Concept (Sheet 3 of 4)
Unit Cost $/Unit
ANNUAL CAPITAL COST
Project Life (n) 50 YrsFederal Project Planning Rate (i) 3.375% %Annual Cost 0.0417 29,903,625$ 1,246,301$ Annual Cost ($) = Total Cost ($)*(i/(1-(1/(1+i)^n))SUBTOTAL 1,246,301$
ANNUAL OPERATING, MAINTENANCE & REPLACEMENT COSTS
Structural Concept Analysis Results:
Mean Annual Volume Captured 1,259 Ac-FtNumber of Events per Year 0.1 EANumber of Hours per Year 0.4 Hrs
Annual Power Cost:Electric Cost per kW-hr kW-hr 0.15$ Pneumatic Gate Pump 5 HP 0$ Sl ide Gate Motor 300 HP 16$
Annual Operation & Maintenance Cost 5% % 10,627,299$ 1,340,602$ Percentage of estimated construction costs (not including non-contract cost or contingencies)
Annual Replacement Cost (Pneumatically Actuated Gates):Useful Life 25 Yrs Useful Life (25 years) provided by vendors. Present Value of Replacement at 25 Years 10,627,299$ Annual Replacement Cost 0.0417 442,917$
SUBTOTAL 1,783,535$
Description
Annual Power Cost ($)=[($ kW-hr)(0.7457 kW/hp)(hp)(t)]/0.84 for the combined horsepower for all motors, provided by vendors.
Quantity Units Estimated Cost Notes
Data specific to dam from Task 5 results for Medium 2 Future Climate Scenario
Annual Cost multiplier applied to Present Value of materials, installation and general conditions costs of Pneumatically Actuated Gates, only.

Los Angeles Basin Study Task 5. Infrastructure and Operations Concepts Appendices
E-40
Figure E-6. Cost Estimate for Pacoima Dam Structural Concept (Sheet 4 of 4)
Unit Cost $/Unit
SUMMARY
TOTAL CONSTRUCTION COST 29,903,625$
ANNUAL CAPITAL COST 1,246,301$
ANNUAL OPERATING, MAINTENANCE & REPLACEMENT COSTS 1,783,535$
TOTAL ANNUAL COST 3,029,836$
TOTAL ANNUAL COST per Ac-Ft (Medium 2 Scenario) 1,259 Ac-Ft 2,407$
NOTES:
2 - All costs are presented in 2015 dollars.
IdentifierMaterial or Rating Description Quantity Units Estimated Cost Notes
1 - This cost estimate is conceptual in nature and is appropriate for strategic planning, business development, project screening, alternative scheme analysis, confirmation of technical and/or economic feasibil ity, and preliminary approval to proceed. While these estimates are appropriate for the appraisal level analysis required for the purposes of this document, they are not appropriate for budget authorization, funding agreements, bid, or tender offers. Accuracy ranges are considered to be -15% to -30% on the low side and +20% to +50% on the high side.
3 - Taxes & contractor OH&P are included in the unit prices.4 - Distributive Costs include but are not l imited to additional planning efforts, investigations, analysis, regulatory compliance, acquisition, contract administration, construction management, inspection, etc.5 - The RSMeans construction data was used to derive Feasibil ity, Design, Material Testing, Structural, and Seismic Testing percentages. The total materials and labor costs are used for the percent cost.

Los Angeles Basin Study Task 5. Infrastructure and Operations Concepts Appendices
E-41
Figure E-7. Cost Estimate for Puddingstone Diversion Dam Structural Concept (Sheet 1 of 4)
Unit Cost $/Unit
RAISED SPILLWAY COSTS (GATES)
6 Foot Tall Pneumatically Actuated Gate 175 LF 3,000$ 525,000$ SUBTOTAL 525,000$
PROGRAMMABLE LOGIC CONTROLLER COSTS
PLC Controller (% of Gate Cost) 8% % 525,000$ 42,000$ SUBTOTAL 42,000$
INSTALLATION COSTS
6 Foot Tall Raised Spil lway 175 LF 3,600$ 630,000$ SUBTOTAL 630,000$
GENERAL CONDITIONS
SUBTOTAL 10% % 1,197,000$ 119,700$ Percentage of estimated construction costs
Description Quantity Units Estimated Cost Notes
Pneumatic Gate Cost Estimates derived from market research (Obermeyer Hydro). Costs include clamping and anchoring, materials & equipment,
shipping charges, and installation supervision.
Programmable Logic Controller (PLC) cost derived from Hydrotech and Obermeyer Hydro. PLC Cost are estimated at 8% of Rubber Dam or
Pneumatically Actuated Gate (or Slide Gate) Costs.
Labor, equipment and installation costs for construction/installation of raised spil lway gates derived from market research (Hydrotech and
Obermeyer Hydro) and estimated at 60% of gate cost with multiplier of 2.0 to adjust for difficulty of site access and constricted spaces.

Los Angeles Basin Study Task 5. Infrastructure and Operations Concepts Appendices
E-42
Figure E-7. Cost Estimate for Puddingstone Diversion Dam Structural Concept (Sheet 2 of 4)
Unit Cost $/Unit
NON-CONTRACT COSTS
Feasibil ity Studies, Surveys & Design Data 1 LS 1,000,000$ Percentage of estimated construction costs (including General Conditions) with min./max. LS cost ($1.0M/$4.0M)
Designs & Specifications 1 LS 500,000$ Percentage of estimated construction costs (including General Conditions) with min./max. LS cost ($0.5M/$2.0M)
Materials, Structural & Seismic Testing 5% % 1,316,700$ 65,835$ Percentage of estimated construction costs (including General Conditions)Project Management 11% % 4,080,040$ 448,804$ Percentage of estimated construction costs & other non-contract costsLegal 5% % 1,316,700$ 65,835$ Percentage of estimated construction costs (including General Conditions)
Permitting 1 LS 1,000,000$ Percentage of estimated construction costs (including General Conditions) with min./max. LS cost ($1.0M/$4.0M)
Construction Management 10% % 1,316,700$ 131,670$ Percentage of estimated construction costs (including General Conditions)SUBTOTAL 3,212,144$
CONTINGENCIES
SUBTOTAL 30% % 4,528,844$ 1,358,653$ 15% to 40% of estimated construction costs & non-contract costs
TOTAL CONSTRUCTION COST
TOTAL 5,887,498$
Description Quantity Units Estimated Cost Notes

Los Angeles Basin Study Task 5. Infrastructure and Operations Concepts Appendices
E-43
Figure E-7. Cost Estimate for Puddingstone Diversion Dam Structural Concept (Sheet 3 of 4)
Unit Cost $/Unit
ANNUAL CAPITAL COST
Project Life (n) 50 YrsFederal Project Planning Rate (i) 3.375% %Annual Cost 0.0417 5,887,498$ 245,375$ Annual Cost ($) = Total Cost ($)*(i/(1-(1/(1+i)^n))SUBTOTAL 245,375$
ANNUAL OPERATING, MAINTENANCE & REPLACEMENT COSTS
Structural Concept Analysis Results:
Mean Annual Volume Captured 888 Ac-FtNumber of Events per Year 0.0 EANumber of Hours per Year 0.0 Hrs
Annual Power Cost:Electric Cost per kW-hr kW-hr 0.15$ Pneumatic Gate Pump 5 HP -$ Sl ide Gate Motor 300 HP -$
Annual Operation & Maintenance Cost 5% % 1,316,700$ 166,098$ Percentage of estimated construction costs (not including non-contract cost or contingencies)
Annual Replacement Cost (Pneumatically Actuated Gates):Useful Life 25 Yrs Useful Life (25 years) provided by vendors. Present Value of Replacement at 25 Years 1,316,700$ Annual Replacement Cost 0.0417 54,876$
SUBTOTAL 220,974$
Description
Annual Power Cost ($)=[($ kW-hr)(0.7457 kW/hp)(hp)(t)]/0.84 for the combined horsepower for all motors, provided by vendors.
Quantity Units Estimated Cost Notes
Data specific to dam from Task 5 results for Medium 2 Future Climate Scenario
Annual Cost multiplier applied to Present Value of materials, installation and general conditions costs of Pneumatically Actuated Gates, only.

Los Angeles Basin Study Task 5. Infrastructure and Operations Concepts Appendices
E-44
Figure E-7. Cost Estimate for Puddingstone Diversion Dam Structural Concept (Sheet 4 of 4)
Unit Cost $/Unit
SUMMARY
TOTAL CONSTRUCTION COST 5,887,498$
ANNUAL CAPITAL COST 245,375$
ANNUAL OPERATING, MAINTENANCE & REPLACEMENT COSTS 220,974$
TOTAL ANNUAL COST 466,349$
TOTAL ANNUAL COST per Ac-Ft (Medium 2 Scenario) 888 Ac-Ft 525$
NOTES:
2 - All costs are presented in 2015 dollars.
IdentifierMaterial or Rating Description Quantity Units Estimated Cost Notes
1 - This cost estimate is conceptual in nature and is appropriate for strategic planning, business development, project screening, alternative scheme analysis, confirmation of technical and/or economic feasibil ity, and preliminary approval to proceed. While these estimates are appropriate for the appraisal level analysis required for the purposes of this document, they are not appropriate for budget authorization, funding agreements, bid, or tender offers. Accuracy ranges are considered to be -15% to -30% on the low side and +20% to +50% on the high side.
3 - Taxes & contractor OH&P are included in the unit prices.4 - Distributive Costs include but are not l imited to additional planning efforts, investigations, analysis, regulatory compliance, acquisition, contract administration, construction management, inspection, etc.5 - The RSMeans construction data was used to derive Feasibil ity, Design, Material Testing, Structural, and Seismic Testing percentages. The total materials and labor costs are used for the percent cost.

Los Angeles Basin Study Task 5. Infrastructure and Operations Concepts Appendices
E-45
Figure E-8. Cost Estimate for San Dimas Dam Structural Concept (Sheet 1 of 4)
Unit Cost $/Unit
RAISED SPILLWAY COSTS (GATES)
11 Foot Tall Pneumatically Actuated Gate 135 LF 8,250$ 1,113,750$ 19 Foot Tall Pneumatically Actuated Gate 35 LF 22,800$ 798,000$ SUBTOTAL 1,911,750$
PROGRAMMABLE LOGIC CONTROLLER COSTS
PLC Controller (% of Gate Cost) 8% % 1,911,750$ 152,940$ SUBTOTAL 152,940$
INSTALLATION COSTS
11 Foot Tall Raised Spil lway 135 LF 9,900$ 1,336,500$ 19 Foot Tall Raised Spil lway 35 LF 27,360$ 957,600$ SUBTOTAL 2,294,100$
GENERAL CONDITIONS
SUBTOTAL 10% % 4,358,790$ 435,879$ Percentage of estimated construction costs
Description Quantity Units Estimated Cost Notes
Programmable Logic Controller (PLC) cost derived from Hydrotech and Obermeyer Hydro. PLC Cost are estimated at 8% of Rubber Dam or
Pneumatically Actuated Gate (or Slide Gate) Costs.
Labor, equipment and installation costs for construction/installation of raised spil lway gates derived from market research (Hydrotech and
Obermeyer Hydro) and estimated at 60% of gate cost with multiplier of 2.0 to adjust for difficulty of site access and constricted spaces.
Pneumatic Gate Cost Estimates derived from market research (Obermeyer Hydro). Costs include clamping and anchoring, materials & equipment,
shipping charges, and installation supervision.

Los Angeles Basin Study Task 5. Infrastructure and Operations Concepts Appendices
E-46
Figure E-8. Cost Estimate for San Dimas Dam Structural Concept (Sheet 2 of 4)
Unit Cost $/Unit
NON-CONTRACT COSTS
Feasibil ity Studies, Surveys & Design Data 30% % 4,794,669$ 1,438,401$ Percentage of estimated construction costs (including General Conditions) with min./max. LS cost ($1.0M/$4.0M)
Designs & Specifications 15% % 4,794,669$ 719,200$ Percentage of estimated construction costs (including General Conditions) with min./max. LS cost ($0.5M/$2.0M)
Materials, Structural & Seismic Testing 5% % 4,794,669$ 239,733$ Percentage of estimated construction costs (including General Conditions)Project Management 11% % 9,349,605$ 1,028,457$ Percentage of estimated construction costs & other non-contract costsLegal 5% % 4,794,669$ 239,733$ Percentage of estimated construction costs (including General Conditions)
Permitting 30% % 4,794,669$ 1,438,401$ Percentage of estimated construction costs (including General Conditions) with min./max. LS cost ($1.0M/$4.0M)
Construction Management 10% % 4,794,669$ 479,467$ Percentage of estimated construction costs (including General Conditions)SUBTOTAL 5,583,392$
CONTINGENCIES
SUBTOTAL 30% % 10,378,061$ 3,113,418$ 15% to 40% of estimated construction costs & non-contract costs
TOTAL CONSTRUCTION COST
TOTAL 13,491,479$
Description Quantity Units Estimated Cost Notes

Los Angeles Basin Study Task 5. Infrastructure and Operations Concepts Appendices
E-47
Figure E-8. Cost Estimate for San Dimas Dam Structural Concept (Sheet 3 of 4)
Unit Cost $/Unit
ANNUAL CAPITAL COST
Project Life (n) 50 YrsFederal Project Planning Rate (i) 3.375% %Annual Cost 0.0417 13,491,479$ 562,288$ Annual Cost ($) = Total Cost ($)*(i/(1-(1/(1+i)^n))SUBTOTAL 562,288$
ANNUAL OPERATING, MAINTENANCE & REPLACEMENT COSTS
Structural Concept Analysis Results:
Mean Annual Volume Captured 2,041 Ac-FtNumber of Events per Year 0.1 EANumber of Hours per Year 0.2 Hrs
Annual Power Cost:Electric Cost per kW-hr kW-hr 0.15$ Pneumatic Gate Pump 5 HP 0$ Sl ide Gate Motor 300 HP 8$
Annual Operation & Maintenance Cost 5% % 4,794,669$ 604,833$ Percentage of estimated construction costs (not including non-contract cost or contingencies)
Annual Replacement Cost (Pneumatically Actuated Gates):Useful Life 25 Yrs Useful Life (25 years) provided by vendors. Present Value of Replacement at 25 Years 4,794,669$ Annual Replacement Cost 0.0417 199,829$
SUBTOTAL 804,670$
Description
Annual Power Cost ($)=[($ kW-hr)(0.7457 kW/hp)(hp)(t)]/0.84 for the combined horsepower for all motors, provided by vendors.
Quantity Units Estimated Cost Notes
Data specific to dam from Task 5 results for Medium 2 Future Climate Scenario
Annual Cost multiplier applied to Present Value of materials, installation and general conditions costs of Pneumatically Actuated Gates, only.

Los Angeles Basin Study Task 5. Infrastructure and Operations Concepts Appendices
E-48
Figure E-8. Cost Estimate for San Dimas Dam Structural Concept (Sheet 4 of 4)
Unit Cost $/Unit
SUMMARY
TOTAL CONSTRUCTION COST 13,491,479$
ANNUAL CAPITAL COST 562,288$
ANNUAL OPERATING, MAINTENANCE & REPLACEMENT COSTS 804,670$
TOTAL ANNUAL COST 1,366,958$
TOTAL ANNUAL COST per Ac-Ft (Medium 2 Scenario) 2,041 Ac-Ft 670$
NOTES:
2 - All costs are presented in 2015 dollars.
IdentifierMaterial or Rating Description Quantity Units Estimated Cost Notes
1 - This cost estimate is conceptual in nature and is appropriate for strategic planning, business development, project screening, alternative scheme analysis, confirmation of technical and/or economic feasibil ity, and preliminary approval to proceed. While these estimates are appropriate for the appraisal level analysis required for the purposes of this document, they are not appropriate for budget authorization, funding agreements, bid, or tender offers. Accuracy ranges are considered to be -15% to -30% on the low side and +20% to +50% on the high side.
3 - Taxes & contractor OH&P are included in the unit prices.4 - Distributive Costs include but are not l imited to additional planning efforts, investigations, analysis, regulatory compliance, acquisition, contract administration, construction management, inspection, etc.5 - The RSMeans construction data was used to derive Feasibil ity, Design, Material Testing, Structural, and Seismic Testing percentages. The total materials and labor costs are used for the percent cost.

Los Angeles Basin Study Task 5. Infrastructure and Operations Concepts Appendices
E-49
Figure E-9. Cost Estimate for San Gabriel Dam Structural Concept (Sheet 1 of 4)
Unit Cost $/Unit
RAISED SPILLWAY COSTS (GATES)
25 Foot Tall Pneumatically Actuated Gate 456 LF 36,250$ 16,530,000$ SUBTOTAL 16,530,000$
PROGRAMMABLE LOGIC CONTROLLER COSTS
PLC Controller (% of Gate Cost) 8% % 16,530,000$ 1,322,400$ SUBTOTAL 1,322,400$
INSTALLATION COSTS
25 Foot Tall Raised Spil lway 456 LF 43,500$ 19,836,000$ SUBTOTAL 19,836,000$
GENERAL CONDITIONS
SUBTOTAL 10% % 37,688,400$ 3,768,840$ Percentage of estimated construction costs
Description Quantity Units Estimated Cost Notes
Pneumatic Gate Cost Estimates derived from market research (Obermeyer Hydro). Costs include clamping and anchoring, materials & equipment,
shipping charges, and installation supervision.
Programmable Logic Controller (PLC) cost derived from Hydrotech and Obermeyer Hydro. PLC Cost are estimated at 8% of Rubber Dam or
Pneumatically Actuated Gate (or Slide Gate) Costs.
Labor, equipment and installation costs for construction/installation of raised spil lway gates derived from market research (Hydrotech and
Obermeyer Hydro) and estimated at 60% of gate cost with multiplier of 2.0 to adjust for difficulty of site access and constricted spaces.

Los Angeles Basin Study Task 5. Infrastructure and Operations Concepts Appendices
E-50
Figure E-9. Cost Estimate for San Gabriel Dam Structural Concept (Sheet 2 of 4)
Unit Cost $/Unit
NON-CONTRACT COSTS
Feasibil ity Studies, Surveys & Design Data 1 LS 4,000,000$ Percentage of estimated construction costs (including General Conditions) with min./max. LS cost ($1.0M/$4.0M)
Designs & Specifications 1 LS 2,000,000$ Percentage of estimated construction costs (including General Conditions) with min./max. LS cost ($0.5M/$2.0M)
Materials, Structural & Seismic Testing 5% % 41,457,240$ 2,072,862$ Percentage of estimated construction costs (including General Conditions)Project Management 11% % 59,748,688$ 6,572,356$ Percentage of estimated construction costs & other non-contract costsLegal 5% % 41,457,240$ 2,072,862$ Percentage of estimated construction costs (including General Conditions)
Permitting 1 LS 4,000,000$ Percentage of estimated construction costs (including General Conditions) with min./max. LS cost ($1.0M/$4.0M)
Construction Management 10% % 41,457,240$ 4,145,724$ Percentage of estimated construction costs (including General Conditions)SUBTOTAL 24,863,804$
CONTINGENCIES
SUBTOTAL 30% % 66,321,044$ 19,896,313$ 15% to 40% of estimated construction costs & non-contract costs
TOTAL CONSTRUCTION COST
TOTAL 86,217,357$
Description Quantity Units Estimated Cost Notes

Los Angeles Basin Study Task 5. Infrastructure and Operations Concepts Appendices
E-51
Figure E-9. Cost Estimate for San Gabriel Dam Structural Concept (Sheet 3 of 4)
Unit Cost $/Unit
ANNUAL CAPITAL COST
Project Life (n) 50 YrsFederal Project Planning Rate (i) 3.375% %Annual Cost 0.0417 86,217,357$ 3,593,303$ Annual Cost ($) = Total Cost ($)*(i/(1-(1/(1+i)^n))SUBTOTAL 3,593,303$
ANNUAL OPERATING, MAINTENANCE & REPLACEMENT COSTS
Structural Concept Analysis Results:
Mean Annual Volume Captured 39,404 Ac-FtNumber of Events per Year 0.3 EANumber of Hours per Year 1.7 Hrs
Annual Power Cost:Electric Cost per kW-hr kW-hr 0.15$ Pneumatic Gate Pump 5 HP 1$ Sl ide Gate Motor 300 HP 68$
Annual Operation & Maintenance Cost 5% % 41,457,240$ 5,229,707$ Percentage of estimated construction costs (not including non-contract cost or contingencies)
Annual Replacement Cost (Pneumatically Actuated Gates):Useful Life 25 Yrs Useful Life (25 years) provided by vendors. Present Value of Replacement at 25 Years 41,457,240$ Annual Replacement Cost 0.0417 1,727,824$
SUBTOTAL 6,957,600$
Description
Annual Power Cost ($)=[($ kW-hr)(0.7457 kW/hp)(hp)(t)]/0.84 for the combined horsepower for all motors, provided by vendors.
Quantity Units Estimated Cost Notes
Data specific to dam from Task 5 results for Medium 2 Future Climate Scenario
Annual Cost multiplier applied to Present Value of materials, installation and general conditions costs of Pneumatically Actuated Gates, only.

Los Angeles Basin Study Task 5. Infrastructure and Operations Concepts Appendices
E-52
Figure E-9. Cost Estimate for San Gabriel Dam Structural Concept (Sheet 4 of 4)
Unit Cost $/Unit
SUMMARY
TOTAL CONSTRUCTION COST 86,217,357$
ANNUAL CAPITAL COST 3,593,303$
ANNUAL OPERATING, MAINTENANCE & REPLACEMENT COSTS 6,957,600$
TOTAL ANNUAL COST 10,550,903$
TOTAL ANNUAL COST per Ac-Ft (Medium 2 Scenario) 39,404 Ac-Ft 268$
NOTES:
2 - All costs are presented in 2015 dollars.
IdentifierMaterial or Rating Description Quantity Units Estimated Cost Notes
1 - This cost estimate is conceptual in nature and is appropriate for strategic planning, business development, project screening, alternative scheme analysis, confirmation of technical and/or economic feasibil ity, and preliminary approval to proceed. While these estimates are appropriate for the appraisal level analysis required for the purposes of this document, they are not appropriate for budget authorization, funding agreements, bid, or tender offers. Accuracy ranges are considered to be -15% to -30% on the low side and +20% to +50% on the high side.
3 - Taxes & contractor OH&P are included in the unit prices.4 - Distributive Costs include but are not l imited to additional planning efforts, investigations, analysis, regulatory compliance, acquisition, contract administration, construction management, inspection, etc.5 - The RSMeans construction data was used to derive Feasibil ity, Design, Material Testing, Structural, and Seismic Testing percentages. The total materials and labor costs are used for the percent cost.

Los Angeles Basin Study Task 5. Infrastructure and Operations Concepts Appendices
E-53
E-1 Storage Solutions – LACFCD Santa Anita Dam
E-1.1 Structural Concept As discussed in Section 2.4.3.1 of the report (Task 5 Infrastructure & Operations Concepts Report of the Los Angeles Basin Stormwater Conservation Study), Santa Anita Dam was recently modified to allow uncontrolled releases when reservoir elevation is above the seismically safe water elevation. A structural concept was developed for Santa Anita Dam that does not account for seismic constraints. Buttressing the dam would be necessary to address those seismic issues and allow the structural concept to be implemented. Therefore, the structural concept for Santa Anita Dam is excluded from subsequent discussions in the report of the nine other LACFCD dams for which structural concepts were developed.
The structural concept for Santa Anita Dam was developed using the same approach used for the nine other LACFCD dams described in Section 2.4.3.1 of the report; and the same modeling approach was used, as well. The structural concept includes pneumatic gate at a covered channel spillway and a slide gate on the outlet of a semi-circular weir outlet, to allow stormwater to be captured at elevations above the spillway crest.
E-1.2 Results A summary of the results for Santa Anita Dam for each of the four scenarios analyzed in Task 5 is presented in Table E-14 below. The Task 5 results for the key metrics are presented Santa Anita Dam alongside the corresponding Task 4 results for ease of comparison. Selected results are also provided for the Historical period for comparison.
E-1.3 Capital and Operational Costs A cost estimate was developed for the structural concept for Santa Anita Dam by identifying major characteristics of the spillway facilities, including spillway types, dimensions and operational controls.
E-1.4 Other Project Characteristics and Benefits Like the structural concepts for the other LACFCD dams, the structural concept for Santa Anita Dam is climate resilient. If (or when) buttressing the dam is implemented to remedy the seismic issues, the structural concept could be implemented to increase the capture and storage of stormwater. Like the structural concepts for the other LACFCD dams, this concept also offers an opportunity for increased flood risk management. These concepts may also provide a water quality benefit. However, the combined cost of buttressing Santa Anita Dam and implementation of the structural concept would be extraordinarily high in comparison with the costs of the structural concepts for other LACFCD dams, particularly in light of the relatively small volume of additional stormwater capture at this dam (431 AFY for the Mid 2 scenario).

Los Angeles Basin Study Task 5. Infrastructure and Operations Concepts Appendices
E-54
Table E-14. Santa Anita Dam Structural Concept Results
Scenario
Mean Annual Inflow (ac-ft)
Mean Annual Volume Captured
(ac-ft)
Mean Annual Spillway Discharge
Volume (ac-ft) Capture Ratio
Capture Ratio Change from
Historical
Mean Annual Frequency of
Spillway Events
Task
4
Task
5
(Str
uctu
ral C
once
pt)
Task
4
Task
5
(Str
uctu
ral C
once
pt)
Task
4
Task
5
(Str
uctu
ral C
once
pt)
Task
4
Task
5
(Str
uctu
ral C
once
pt)
Task
4
Task
5
(Str
uctu
ral C
once
pt)
Task
4
Task
5
(Str
uctu
ral C
once
pt)
Historical 3,566 NA 3,312 NA 250 NA 92.9% NA NA NA 0.40 NA High 1 8,641 8,641 6,775 7,897 1,862 740 78.4% 91.4% -14.5% -1.5% 2.38 1.45 Medium 2 5,238 5,238 4,589 5,020 644 213 87.6% 95.8% -5.3% 3.0% 1.15 0.52 Low 1 2,669 2,669 2,382 2,528 282 136 89.2% 94.7% -3.6% 1.8% 0.49 0.29 Low 2 4,306 4,306 3,919 4,164 382 137 91.0% 96.7% -1.8% 3.8% 0.69 0.31

Los Angeles Basin Study Task 5. Infrastructure and Operations Concepts Appendices
E-55
Figure E-10. Cost Estimate for Santa Anita Dam Structural Concept (Sheet 1 of 4)
Unit Cost $/Unit
RAISED SPILLWAY COSTS (GATES)
9 Foot Tall Pneumatically Actuated Gate 27 LF 5,850$ 157,950$ (W' X H') 8' X 8' Sl ide Gate 1 EA 691,820$ 691,820$ SUBTOTAL 849,770$
PROGRAMMABLE LOGIC CONTROLLER COSTS
PLC Controller (% of Gate Cost) 8% % 849,770$ 67,982$ SUBTOTAL 67,982$
INSTALLATION COSTS
9 Foot Tall Raised Spil lway 27 LF 7,020$ 189,540$ 8' X 8' Sl ide Gate 1 EA 830,184$ 830,184$ SUBTOTAL 1,019,724$
GENERAL CONDITIONS
SUBTOTAL 10% % 1,937,476$ 193,748$ Percentage of estimated construction costs
Description Quantity Units Estimated Cost Notes
Programmable Logic Controller (PLC) cost derived from Hydrotech and Obermeyer Hydro. PLC Cost are estimated at 8% of Rubber Dam or
Pneumatically Actuated Gate (or Slide Gate) Costs.
Labor, equipment and installation costs for construction/installation of raised spil lway gates derived from market research (Hydrotech and
Obermeyer Hydro) and estimated at 60% of gate cost with multiplier of 2.0 to adjust for difficulty of site access and constricted spaces.
Pneumatic Gate Cost Estimates derived from market research (Obermeyer Hydro). Costs include clamping and anchoring, materials & equipment,
shipping charges, and installation supervision.
Sl ide Gate Cost Estimates derived from USBR historical bids from the Expect Database Search at the Technical Service Center (TSC) in Denver.
Rectangular and square gates are measured width by height (W' X H').

Los Angeles Basin Study Task 5. Infrastructure and Operations Concepts Appendices
E-56
Figure E-10. Cost Estimate for Santa Anita Dam Structural Concept (Sheet 2 of 4)
Unit Cost $/Unit
NON-CONTRACT COSTS
Feasibil ity Studies, Surveys & Design Data 1 LS 1,000,000$ Percentage of estimated construction costs (including General Conditions) with min./max. LS cost ($1.0M/$4.0M)
Designs & Specifications 1 LS 500,000$ Percentage of estimated construction costs (including General Conditions) with min./max. LS cost ($0.5M/$2.0M)
Materials, Structural & Seismic Testing 5% % 2,131,223$ 106,561$ Percentage of estimated construction costs (including General Conditions)Project Management 11% % 5,057,468$ 556,321$ Percentage of estimated construction costs & other non-contract costsLegal 5% % 2,131,223$ 106,561$ Percentage of estimated construction costs (including General Conditions)
Permitting 1 LS 1,000,000$ Percentage of estimated construction costs (including General Conditions) with min./max. LS cost ($1.0M/$4.0M)
Construction Management 10% % 2,131,223$ 213,122$ Percentage of estimated construction costs (including General Conditions)SUBTOTAL 3,482,566$
CONTINGENCIES
SUBTOTAL 30% % 5,613,789$ 1,684,137$ 15% to 40% of estimated construction costs & non-contract costs
TOTAL CONSTRUCTION COST
TOTAL 7,297,926$
Description Quantity Units Estimated Cost Notes

Los Angeles Basin Study Task 5. Infrastructure and Operations Concepts Appendices
E-57
Figure E-10. Cost Estimate for Santa Anita Dam Structural Concept (Sheet 3 of 4)
Unit Cost $/Unit
ANNUAL CAPITAL COST
Project Life (n) 50 YrsFederal Project Planning Rate (i) 3.375% %Annual Cost 0.0417 7,297,926$ 304,158$ Annual Cost ($) = Total Cost ($)*(i/(1-(1/(1+i)^n))SUBTOTAL 304,158$
ANNUAL OPERATING, MAINTENANCE & REPLACEMENT COSTS
Structural Concept Analysis Results:
Mean Annual Volume Captured 431 Ac-FtNumber of Events per Year 0.5 EANumber of Hours per Year 0.9 Hrs
Annual Power Cost:Electric Cost per kW-hr kW-hr 0.15$ Pneumatic Gate Pump 5 HP 1$ Sl ide Gate Motor 300 HP 36$
Annual Operation & Maintenance Cost 5% % 2,131,223$ 268,847$ Percentage of estimated construction costs (not including non-contract cost or contingencies)
Annual Replacement Cost (Pneumatically Actuated Gates):Useful Life 25 Yrs Useful Life (25 years) provided by vendors. Present Value of Replacement at 25 Years 2,131,223$ Annual Replacement Cost 0.0417 88,824$
SUBTOTAL 357,708$
Description
Annual Power Cost ($)=[($ kW-hr)(0.7457 kW/hp)(hp)(t)]/0.84 for the combined horsepower for all motors, provided by vendors.
Quantity Units Estimated Cost Notes
Data specific to dam from Task 5 results for Medium 2 Future Climate Scenario
Annual Cost multiplier applied to Present Value of materials, installation and general conditions costs of Pneumatically Actuated Gates, only.
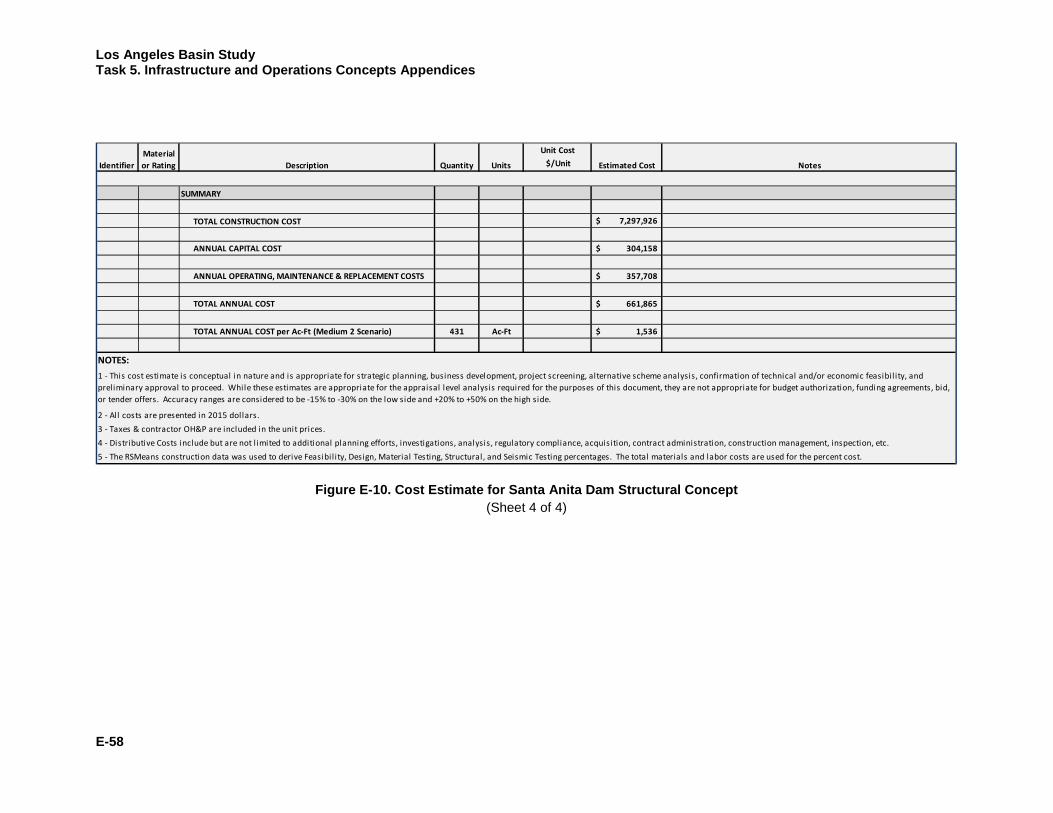
Los Angeles Basin Study Task 5. Infrastructure and Operations Concepts Appendices
E-58
Figure E-10. Cost Estimate for Santa Anita Dam Structural Concept (Sheet 4 of 4)
Unit Cost $/Unit
SUMMARY
TOTAL CONSTRUCTION COST 7,297,926$
ANNUAL CAPITAL COST 304,158$
ANNUAL OPERATING, MAINTENANCE & REPLACEMENT COSTS 357,708$
TOTAL ANNUAL COST 661,865$
TOTAL ANNUAL COST per Ac-Ft (Medium 2 Scenario) 431 Ac-Ft 1,536$
NOTES:
2 - All costs are presented in 2015 dollars.
5 - The RSMeans construction data was used to derive Feasibil ity, Design, Material Testing, Structural, and Seismic Testing percentages. The total materials and labor costs are used for the percent cost.4 - Distributive Costs include but are not l imited to additional planning efforts, investigations, analysis, regulatory compliance, acquisition, contract administration, construction management, inspection, etc.3 - Taxes & contractor OH&P are included in the unit prices.
1 - This cost estimate is conceptual in nature and is appropriate for strategic planning, business development, project screening, alternative scheme analysis, confirmation of technical and/or economic feasibil ity, and preliminary approval to proceed. While these estimates are appropriate for the appraisal level analysis required for the purposes of this document, they are not appropriate for budget authorization, funding agreements, bid, or tender offers. Accuracy ranges are considered to be -15% to -30% on the low side and +20% to +50% on the high side.
IdentifierMaterial or Rating Description Quantity Units Estimated Cost Notes


![[hydrology] groundwater hydrology - david k. todd (2005).pdf](https://img.dokumen.tips/doc/110x75/577c77961a28abe0548cb0b1/hydrology-groundwater-hydrology-david-k-todd-2005pdf.jpg)

![[Hydrology] groundwater hydrology david k. todd (2005)](https://img.dokumen.tips/doc/110x75/55a8e6001a28ab6c2f8b4687/hydrology-groundwater-hydrology-david-k-todd-2005-55b0d9a792c06.jpg)
![[Hydrology] Groundwater Hydrology - David K. Todd (2005)](https://img.dokumen.tips/doc/110x75/548ce7beb47959e2288b45f9/hydrology-groundwater-hydrology-david-k-todd-2005.jpg)


