Embed Size (px)
Citation preview

APPENDIX B
AVIATION DEMAND FORECAST

Index B1: Aviation Activity Forecasts Report B2: A Comparative Analysis of the NY/NJ/PHL Forecast and 2005 Actual Traffic

B.1
Aviation Activity Forecasts Report

NY/NJ/PHL Airspace Redesign EIS Aviation Activity Forecasts Report
Landrum & Brown Appendix B September, 2005
APPENDIX B
AVIATION ACTIVITY FORECASTS REPORT

NY/NJ/PHL Airspace Redesign EIS Aviation Activity Forecasts Report
Landrum & Brown Appendix B September, 2005 TOC B-1
Table of Contents I. Purpose and Context ........................................................................................................B-1
II. Key Assumptions .............................................................................................................B-3
III. Sources.............................................................................................................................B-5
IV. Passenger and Operations Forecast..................................................................................B-7
V. Forecast Results – IFR Operations ................................................................................B-14
VI. The Impact of the Events of September 11 on Forecast Task .......................................B-17
Tables Table 1 - Airports Included in Forecast Analysis .....................................................................B-1
Table 2 - Sample Add & Drop Matrix ......................................................................................B-6
Table 3 - Forecast Analysis – Airport Profiles .........................................................................B-9
Table 4 - Passenger Forecast Summary & TAF Comparison.................................................B-11
Table 5 - Forecast Summary – Study Area Annual IFR Flight Operations............................B-14
Table 6 - Generalized Fleet Mix Summary – Existing & Forecast.........................................B-16
Exhibits Exhibit 1 – Airports Within the Study Area ................................................................... After B-2
Exhibit 2 - General Forecasting Methodology..........................................................................B-8
Attachments
Attachment A – Study Area Airport Evaluation Summary ..................................................... A-1
Attachment B - Forecast Fleet Mix Data Tables ......................................................................B-1

NY/NJ/PHL Airspace Redesign EIS Aviation Activity Forecasts Report
Landrum & Brown Appendix B September, 2005 Page B-1
Aviation Activity Forecasts Report I. Purpose and Context As a part of the FAA’s ongoing National Airspace Redesign (NAR) effort, the NY/NJ/PHL Metropolitan Airspace Redesign study is investigating various alternative designs for the air traffic routes and airspace in the New York and Philadelphia Metropolitan and surrounding areas. In order to thoroughly evaluate these alternatives and meet NEPA requirements it is necessary to conduct both operational and environmental modeling of the future baseline conditions as well as each alternative. A key element in the development of accurate modeling for these conditions is the forecasting of future air traffic operational levels expected in the area and at the airports of interest. Although the FAA’s office of Aviation Policy and Plans (APO) develops and regularly updates the Terminal Area Forecasts (TAF) for some 3,400 airports throughout the country, these forecasts may not undergo a rigorous forecast update for several years for a given airport. Furthermore, the TAF forecasts generally do not provide sufficient detail (aircraft type, destination, etc.) for environmental modeling. Accordingly, it was determined that an independent forecasting effort be undertaken for each of the airports evaluated in this study.
The area of interest for this study is geographically designated as the Greater New York/New Jersey/Philadelphia Metropolitan region (the “Region”) including the City of New York, Long Island, New Jersey, Southern Connecticut, Eastern Pennsylvania, Philadelphia, and the northern portion of Delaware. Exhibit 1 presents a map of the Study Area identified for this project. Because there are a large number of public and private airports that are located within this area it was necessary to undertake an evaluation process to determine the airports that would require full environmental analysis and modeling. This effort is discussed in Section 1.6 of Chapter 1 of the EIS document. Attachment A, located at the end of this report, presents a listing of the airports evaluated along with some key statistics and a brief summary of the rational for inclusion or exclusion from the study analysis. The evaluation resulted in the identification of 21 airports to be included in the study modeling. In order to provide data for the operational and environmental impacts analysis, a forecast for IFR operations in 2006 and 2011 at each of these Study airports was developed for this project. The airports in this analysis are identified in Table 1.
The Region is among the most congested aeronautical sectors in the National Air Space System and is expected to grow throughout the next decade as both commercial and general aviation demands compete for more airport and airspace capacity (See Exhibit 1). Serving as primarily a business corridor, flight frequency as opposed to aircraft gauge expansion will be an issue affecting traffic levels in the region. The purpose of the IFR forecast is to provide data input into the operational and environmental impacts analysis for both existing conditions as well as the projected levels of operations over the next decade. It will also serve as a schedule for the Total Airport and Airspace Modeler (TAAM) simulation to be conducted for the 90th percentile schedule.

NY/NJ/PHL Airspace Redesign EIS Aviation Activity Forecasts Report
Landrum & Brown Appendix B September, 2005 Page B-2
The FAA sought an independent review of the FAA’s Terminal Area Forecasts (“TAFs”) for the Region’s airports. The Region’s airport forecasts from this study provide considerably more detail than TAFs including gauge and load factor assumptions of the air carriers’ arriving and departing flights for the forecast benchmark years. Considerable analytical attention was also applied to the general aviation sector. In particular, the corporate aviation market is expected to grow at a more robust rate than scheduled airline service given the success and growth profile of fractional ownership programs for corporate/high end leisure aircraft.1 The forecast for overflights or “en route” aircraft operations are also included in this document.
Table 1 Airports Included in Forecast Analysis
Airport Name Airport Code Type of Service
Allentown/Lehigh Valley International ABE Scheduled, GA, Mil, Cargo
Atlantic City International ACY Scheduled, GA, MiI, Cargo Bridgeport/Igor I. Sikorsky
Memorial BDR GA, Cargo Caldwell/Essex County CDW GA
Newark Liberty International EWR Scheduled, GA, Cargo Westhampton Beach/The
Francis S. Gabreski FOK GA Republic * FRG Scheduled, GA, Cargo
White Plains/Westchester County HPN Scheduled, GA
New Haven/Tweed-New Haven HVN Scheduled, GA
Wilmington/New Castle County * ILG GA, MiI, Cargo
Islip Long Island MacArthur ISP Scheduled, GA, Cargo John F. Kennedy International JFK Scheduled, GA, Cargo
Linden LDJ GA LaGuardia LGA Scheduled, GA
Morristown Municipal MMU GA, Cargo Philadelphia International PHL Scheduled, GA, Cargo
Northeast Philadelphia PNE GA Newburgh/Stewart
International SWF Scheduled, GA, MiI, Cargo Teterboro TEB Scheduled, GA, Cargo
Trenton/Mercer County TTN Scheduled, GA McGuire AFB WRI MiI
* Both Republic and New Castle have limited/occasional scheduled air service.
All forecasts are estimates of future activity based upon assumptions about the continuation of, or changes to past air service trends. The accuracy of forecasts depends upon the accuracy of these assumptions. While past activity is not a guarantee of the course of future events, the
1 2000 FAA Aerospace Forecast

E N V I R O N M E N T A L I M P A C T S T A T E M E N T
Exhibit1Airports within the Study Area
360350340
330
320
310
300
290
280
270
260
250
240
230
220
210
200 190 180 170160
150
140
130
120
110100
9080
7060
50
40
3020
10N
NNW
NWWNW
N
WSW
SW
SSWN
SSE
SE
ESEN
ENE
NE
NNE
Fairfield
New Haven
Middlesex
Hartford
Tolland
New London
Litchfield
Gloucester
Salem
New Castle Cumberland
Camden
Atlantic
Cape May
Burlington
Ocean
Monmouth
Middlesex
Mercer
Hunterdon Somerset
Morris
Union
Essex
Passaic
Bergen
Sussex
Warren
Sullivan
Otsego
Delaware
Schoharie
Albany
Greene Columbia
Ulster
Dutchess
Orange Putnam
Westchester
Rockland
Bronx
Queens Nassau
Suffolk
Chester
Berks
Lancaster
Schuylkill
Carbon
Lehigh
Montgomery
Bucks
Northampton
Monroe
Lackawanna
Wayne
Pike
Philadelphia
Delaware
NEW JERSEY
MARYLAND
PENNSYLVANIA
DE
LAW
AR
E
NEW YORK
PENNSYLVANIA
CONNECTICUT
ATLANTICOCEAN
LONG ISLAND SOUND
DELAWARE BAY
STUDY A
REA B
OUNDARY
STUDY AREA BOUNDARY
0 10 20 30 40 Statute Miles
0 10 20 30 40 Nautical Miles
MASSACHUSETTS
NE
W Y
OR
K
CO
NN
EC
TIC
UT
N E W Y O R K / N E W J E R S E Y / P H I L A D E L P H I A M E T R O P O L I T A N A I R S P A C E R E D E S I G N P R O J E C T
County intersected by
Study Area Boundary
Major Waterway
State Boundary
La Guardia
John F. Kennedy Intl.
Newark Liberty Intl.
Teterboro
Philadelphia Intl.
PHL
WRI
PNE
ACY
TTN
ABE
LDJ
MMU
CDW TEB
HPN
FRG ISP
FOK
HVNBDR
SWF
ACY
CDW
MMU
ILG
SWF
TEB
EWR
HPN
ABE
PHL
TTN
PNE
LDJ
WRI
ILG
TTN
PNE
FRG
FOK
FRG
ISP
ABE
ACY
BDR
CDW
HVN
SWF
LDJ
FOK
WRI
Northeast Philadelphia
Republic Airport
Trenton/Mercer County
Wilmington/New Castle County
Morristown Municipal
Islip/Long Island
White Plains/Westchester County
Allentown/Lehigh Valley Intl.
Atlantic City Intl
Bridgeport/Igor I. Sikorsky Memorial
Caldwell/Essex County
Westhampton Beach/The Francis S. Gabreski
Linden Airport
McGuire AFB
Newburgh/Stewart Intl.
New Haven/Tweed-New Haven
Hudson New York
Richmond Kings
JFK
LGA
HVN
BDR
LGA
JFKEWR
ILG

NY/NJ/PHL Airspace Redesign EIS Aviation Activity Forecasts Report
Landrum & Brown Appendix B September, 2005 Page B-3
application of reasonable trend extrapolations do add to the confidence level in the forecast results.
II. Key Assumptions Commercial passenger demand is projected to experience sustained growth throughout the forecast period (through 2011). International passenger activity is expected to continue to grow at a pace that exceeds the growth of U.S. Gross Domestic Product over the forecast period. Among the most pronounced changes in commercial passenger fleets in recent years has been the replacement of turboprop aircraft with regional jets. The growth in regional jet traffic has primarily been limited by the ability of the manufacturers to produce sufficient new aircraft to meet demand. The continued growth in regional jet use is expected to drive an increase in the average seating configuration of regional airline markets. A number of other general assumptions and factors affecting demand were also considered in the forecast exercise including, but not limited to, the following:
Aviation Security - Passenger confidence in enhanced aviation security will return.
U.S. Economy - The U.S. economy will recover beginning in the second half of 2002. Many economists believe that the recovery will be slower than from recent recessions.
Regional Airport Trends - The basic character of each of the study airports will not change during the forecast period. Airports with only general aviation activity will remain GA-only airports while major facilities such as JFK, LGA, EWR, and PHL will remain the dominant airports in the region.
Commercial Service - No new commercial service airports will be constructed in the region during the forecast period.
Airline Yield - Airline yield will continue to decline on a constant dollar basis as projected by the FAA. The latest FAA aviation forecast predicts a 0.9 percent annual decrease in real (inflation-adjusted) U.S. domestic airline yield between 2001 and 2013. Yield is the revenue per flight mile received by the airlines for carrying each passenger. Since deregulation, the decline in real yield has accelerated, so that by 2001 real yield fell to 13.94 cents, an average yearly decline of 2.1 percent from 1978.
New Aircraft - Only one new class of aircraft is assumed to be introduced throughout the forecast period. A widebody with an estimated capacity of 550 passengers is assumed to enter the international fleet in a very limited way before the end of the forecast period.
Adaptation of Air Carriers in a New Aviation Economy - U.S. airlines experienced strong profits in the late 1990’s, and 2000 was one of the airlines’ best years in history. In 2001 however, the U. S. major airlines collectively lost over $7 billion,

NY/NJ/PHL Airspace Redesign EIS Aviation Activity Forecasts Report
Landrum & Brown Appendix B September, 2005 Page B-4
even after a governmental infusion of about $4 billion. In 2002, the U.S. majors are expected to post losses of about $4 billion. Due to the combined affects of the current economic recession and the events of September 11, many in the industry see more than just the swings of a cyclical business. They believe a changing of the guard may have begun. Low-fare carriers now account for nearly 20 percent of domestic air capacity, up from 6 percent in the early 1990s. Southwest has surpassed Northwest, Continental, and US Airways in terms of revenue passenger miles flown domestically.
Fuel Costs - Fuel costs are a significant, yet variable, component of an airline’s operating expenses. Generally, there has been an overall decline in fuel costs since 1981, which has reduced the operating costs of airlines, and therefore, the cost of air travel. In the short-term, such factors as weather, demand for heating oil, shipping incidents, political conflicts and production difficulties caused by unusual circumstances may impact fuel costs. However, these events have had little long-term effect on the overall cost of air travel. This report makes the assumption that fuel will continue to be available in sufficient quantities, that only short-term shifts will occur in the cost of fuel and that the overall trend in fuel cost increases will be moderate during the forecast period. It is also assumed that the new fuel-efficient aircraft will moderate the impact of long-term fluctuations in fuel costs and that fuel costs will not significantly impact long-term average ticket prices. Therefore, it is assumed that air travel demand will not be adversely impacted by fuel costs or availability over the forecast period.
Long-term Economic Indicators - A basic assumption inherent in any forecast of aviation demand is the overall condition of the U.S. and world economies. Long-term, continued economic stability, reasonable consumer confidence, and growth of disposable personal income are foreseen by most economists. All are positive influences on future air travel growth.
Teleconferencing – Industry observers have considered the impacts of communications technology on air travel demand. No reliable empirical evidence has surfaced to date that quantifies the impact of technology on air travel demand. Therefore, it is assumed that air travel demand will not be adversely impacted by teleconferencing during the forecast period.
Hub-and-Spoke Effects - Airlines have always concentrated air service at a limited number of airports, usually in major cities. Since airline deregulation in 1978, there has been an even more pronounced emphasis on developing hub and spoke route systems centered on a limited number of airports. The hub and spoke route networks offer the most economically efficient system to move passengers and cargo throughout the country. For most international service, using hubs as gateways is almost the only way to provide the economies of scale sufficient to operate long-range, high capacity aircraft across the Atlantic, Pacific or to other distant international destinations. No significant change in the hub-and-spoke system is foreseen in the forecast period. However, new routes and new service points will

NY/NJ/PHL Airspace Redesign EIS Aviation Activity Forecasts Report
Landrum & Brown Appendix B September, 2005 Page B-5
continually be developed as markets expand and as new carriers appear, new marketing niches develop and other events affect the travel market.
Re-regulation of Air Carriers - Passenger airlines were first released from federal regulation in 1978 with regard to domestic route selection, fare levels, and certain other operating conditions. Air cargo carriers were also de-regulated in the same time period after aggressive lobbying by FedEx. Since 1978, numerous airline bankruptcies have resulted in carrier consolidation and the emergence of dominant market share situations at numerous airports, resulted in layoffs and other employment issues, and raised questions about safety that have been blamed on deregulation, creating some pressure in Washington to re-regulate the airline industry. Re-regulation of airlines is conceivable, but it is assumed in this forecast to be unlikely.
Hypersonic Aircraft - Like the new large aircraft, new hypersonic aircraft, capable of crossing the Pacific in only a few hours, are being discussed by both airlines and aircraft manufacturers. These could be updated, longer-range versions of the Concorde now operating across the Atlantic or an entirely new vehicle. For hypersonic aircraft to become a reality, technical, environmental and economic hurdles must be overcome. No aircraft manufacturer has yet committed to such an undertaking. However, it is doubtful a hypersonic aircraft could be designed, built and introduced to service until after the end of the forecast period. Consequently, the impact of hypersonic aircraft during the forecast period was not considered.
III. Sources The forecasting process requires thorough and detailed baseline data. The first task involved the assembly of all necessary data to develop the forecast model for the 21 airports. Data sources used for the regional passengers and operations forecasts included the following:
Official Airline Guide (“OAG”), October 31, 2000 – For scheduled airline service, historical aircraft, seat configurations, frequency, and city-pairs among other metrics were culled and analyzed. For each airport with scheduled airline service, a 10-year city-pair add-drop matrix was developed. An add-drop matrix illustrates how air carriers at a particular station provide a predictable pattern of air service depending on whether that station is a hub [i.e., Philadelphia International (“PHL”)] or a spoke [i.e., MacArthur-Islip (“ISP”)]. The add-drop matrix informs the analysts about future new city pairs and frequencies going forward. In addition, the OAG data provides key aircraft gauge (i.e., average aircraft size) trends, although it should be noted the AIR 21 reversed the aircraft gauge trends at LaGuardia (“LGA”). Although, aircraft gauge had been steadily increasing at LGA, AIR 21 (Congressional legislation passed in 1999) lifted the high density rule and allowed increased flight frequency at LGA. Carriers responded to AIR-21 by scheduling an increase in regional jet activity. Table 2 shows an example of an add-drop matrix for 6 markets indicating the year in which the market is dropped with a “-1” and the year in which a market is added with a “1”.

NY/NJ/PHL Airspace Redesign EIS Aviation Activity Forecasts Report
Landrum & Brown Appendix B September, 2005 Page B-6
Table 2 Sample Add & Drop Matrix
Destination 1995 1996 1997 1998 1999 2000 2001 Allentown, PA (ABE) -1 1 -1 1
Albuquerque, NM (ABQ) -1 1 Acapulco, MEX (ACA) 1 -1 Nantucket, MA (ACK) -1 1
Atlantic City, NJ (ACY) -1 1 Bader Field, NJ (AIY) 1 -1 1
U.S. Department of Transportation 10% Ticket Survey (O&D Data), 1990-2000 – Passenger Origin & Destination (“O&D”) data provide a wealth of airline specific data for all domestic markets served at the Region’s airports. The database examined average load factors and average yield. Again, these historical measures provide important clues into how air carriers may sustain, expand or reduce air service in select airport markets within the study area.
Terminal Area Forecasts (TAF), 2001-2015 – The most recent TAFs, published in December of 2001, were downloaded from the FAA website and modified in format for ease of analysis. In addition, the airline yield trends and projections necessary for demand forecasting were provided by the FAA. Yield is a key proxy variable for the price of air travel and a critical part of any aviation demand forecast equation.
J. P. Fleets, 2001-2002 – Projected airline aircraft orders and options were provided by J.P. Fleets, a vendor that specializes in providing this data. Fleet forecasts provide insight into gauge assumptions and aircraft engine types (a critical variable for noise analysis).
Woods & Poole, 1990-2015 – Socio-economic data including population, per capita income, employment and earnings were provided by Woods & Poole. Woods & Poole is an independent vendor and nationally recognized firm that provides expert economic and demographic analysis.
Airframe Manufacturers Forecast, 2000 – Boeing, Airbus and Bombarier all provide their own forecasts of aircraft, passengers and revenue passenger miles. These reports were examined for comparability purposes.
Enhanced Traffic Management System (ETMS), January/November 2000 – provides FAA radar data including aircraft, airlines, flight paths and flight times for air traffic that filed IFR flight plans only.

NY/NJ/PHL Airspace Redesign EIS Aviation Activity Forecasts Report
Landrum & Brown Appendix B September, 2005 Page B-7
Collection and Analysis of Terminal Records (CATERLOG), 2000 – provides similar data as ETMS for those airports operated by the Port Authority of NY & NJ including John F. Kennedy (“JFK”), Newark (“EWR”), and LGA airports for calendar year 2000.
Internet – A good deal of data was culled from various internet sights mostly relating to corporate aviation and fractional ownership companies.
Airport Statistics2 – Data were requested from selected airports on annual operations and passengers as well as connecting rates and other airline statistics.
Airport Staff Interviews – Select in-person or telephone interviews were conducted to query airport operators about current market conditions, airline strategies, demand trends and development plans. Among the airports interviewed were: JFK, LGA, EWR, Teterboro Airport (“TEB”), Stewart Airport (“SWF”), ISP and Westchester County Airport (“HPN”).
IV. Passenger and Operations Forecasts This section presents the approach, methodologies and results of the regional passenger and operations forecasts for the 21 airports. All forecasts were prepared for the future years of interest; 2006 and 2011. Exhibit 2 presents an overview of the forecasting methodology employed for this analysis in a flow chart form.
The forecasting effort culminated in the development of detailed operational schedules for each of the study airports for each future year. Because the operational modeling (airspace simulation) and the environmental modeling (noise modeling) focus on different issues, they require different operational scenarios for their analysis. In order to ensure that a given airspace/route design is sufficiently robust to accommodate a typical busy day of traffic, the airspace simulation effort analyzes the 90th-percentile (90-P) day, or 37th busiest day of traffic at the facility of interest. For the noise analysis, however; the FAA requires the evaluation to be based on the average annual day (AAD) of operations in the year of interest. This forecasting effort provides both an AAD and a 90-P schedule for each airport of interest in the study area.
Table 3 presents the forecast profile for each of the airports in the study resulting from the analysis. These profiles generally identify the expected role of the airport in the future and provide a summary of key issues affecting the expected future activity at each airport.
2 Source: Port Authority of New York & New Jersey

NY/NJ/PHL Airspace Redesign EIS Aviation Activity Forecasts Report
Landrum & Brown Appendix B September, 2005 Page B-8
Exhibit 2 General Forecasting Methodology

NY/NJ/PHL Airspace Redesign EIS Aviation Activity Forecasts Report
Landrum & Brown Appendix B September, 2005 Page B-9
Table 3 Forecast Analysis - Airport Profiles Class/Airport 2006 2011 Observations
Large Hub EWR Continental mega-hub; airfield constraints Continued hub maturation; increased gauge
JFK jetBlue sustains and expands operations, American completes terminal (+27 gates)
Delta expands domestic and international operations; incremental growth
LGA Congestion pricing/other solution implemented Increasing gauge/load factors PHL Remains a viable air carrier hub Remains a viable air carrier hub
Regional ABE Incremental spoke service growth, Some
upgauging of aircraft Incremental Spoke Service Growth, Some Upgauging of Aircraft, No low fare operator
May benefit in long term from metro sprawl; good eastern (NJ) access
ACY Low incremental spoke service growth, Some upgauging of aircraft
Low incremental spoke service growth, Some upgauging of aircraft
Largely surface mode destination Military maintains operations
HPN Low incremental spoke service growth, Robust GA activity
Low incremental spoke service growth, Limited upgauging of aircraft
Highly constrained facilities; local operating restrictions will remain in place
ISP Incremental spoke service growth, Limited expansion by WN
Incremental spoke service growth, Limited expansion by WN Facility constraints will remain in place
SWF Incremental spoke service growth, Some upgauging of aircraft and GA activity
Incremental spoke service growth, Introduction of WN spoke
New GE corporate aircraft base; ANG maintains operations; will benefit from metro sprawl
HVN Low incremental spoke service growth Low incremental spoke service growth
Reliever CDW Remains robust corporate facility Remains robust corporate facility
LDJ Remains GA reliever to EWR Remains GA reliever to EWR WRI Active AFB Active AFB
MMU Increased corporate activity Increased corporate activity Major GA reliever to EWR; Bizjet potential IGL Remains GA reliever to PHL Remains GA reliever to PHL Has not sustained scheduled air service PNE Remains GA reliever to PHL Remains GA reliever to PHL FRG Remains GA reliever to LGA/JFK Remains GA reliever to LGA/JFK Has not sustained scheduled air service BDR Remains GA reliever Remains GA reliever FOK GA field for eastern Long Island GA field for eastern Long Island ANG Search & Rescue units maintained TEB Remains robust corporate facility Remains robust corporate facility Bizjet and air charter restrictions intended TTN Limited regional service Limited regional service

NY/NJ/PHL Airspace Redesign EIS Aviation Activity Forecasts Report
Landrum & Brown Appendix B September, 2005 Page B-10
IV-A. Passenger Forecasts
Air transportation demand is derived from the demographic and economic profile of a region. Origin & Destination (O&D) passengers are those passengers who arrive at or depart from the airport of interest; they do not change aircraft at the subject airport. The total number of O&D passengers is a reflection of a region’s attractiveness as a place in which to live, visit, work, and conduct business. O&D passengers include both resident and non-resident air travelers.
The forecast employed regression analysis, a methodology that has been successfully used and accepted by most major airports and the FAA. A regression equation describes the mathematical relationship between two sets of variables referred to as the “dependent” and the “independent” variables. For example, in the case of aviation activity, the dependent variable is the annual number of passengers. The independent variable(s) are those economic and demographic drivers that generate passenger demand such as population, employment and airline ticket prices.
Historical O&D passenger data (the dependent variable) was paired against population, employment, per capita personal income, and domestic yield (the independent variables) to establish a statistical relationship between the demographic and economic variables and the demand for air travel among the 11 airports with commercial air service.
With this mathematical relationship (the regression equation) established, the forecasts of demographic variables were combined with airline yield data to project future levels of O&D passengers.
Following the O&D passenger projections, estimated connecting passenger activity was “layered” on to the O&D passenger volumes to derive total passenger volumes for each airport. In cases where airline-specific hub activity is expected to remain stable, industry analysts typically hold connecting passenger volumes constant as a result of long-term industry-wide historical trends. Consequently, the connecting passenger volumes at the major airports in this study were assumed to remain constant over the forecast horizon at or about current levels. Connecting passengers are present at only the large hub airports in the area, including JFK, EWR, LGA, and PHL. After developing the passenger forecasts for each airport in the study region using the bottom-up approach described above, the individual forecasts were compared to the FAA’s Terminal Area Forecast (TAF) as an order-of-magnitude check. Table 4 presents the enplanement forecasts for the 11 study area airports that have air carrier service.
Generally, the new passenger forecasts were well within 10 percent of the TAF levels. The weighted average variance for total operations and the aggregate TAFs passenger forecasts for 2006 is less than 1 percent. The weighted average variance in 2011 from the TAF is less than 2 percent. The FAA uses a 10 percent threshold as a rule-of-thumb for accepting non-FAA forecasts as the basis for planning and environmental studies. For SWF, the forecast included the introduction of new low-fare service (as previously noted) that was not anticipated in the TAF. The FAA’s 2000 TAF forecast for Trenton (TTN) overstated enplanement levels due to the mid-year withdrawal of service by Westwind Airlines. The FAA was briefed on this variance from the TAF and accepted the reasoning and results.

NY/NJ/PHL Airspace Redesign EIS Aviation Activity Forecasts Report
Landrum & Brown Appendix B September, 2005 Page B-11
Table 4 Passenger Forecast Summary & TAF Comparison 2000 Enplanements 2006 Enplanements 2011 Enplanements
Forecast FAA TAF % Diff Forecast FAA TAF % Diff Forecast FAA TAF % DiffABE 478,758 473,849 1.0% 545,912 535,219 2.0% 600,359 586,361 2.3%ACY 462,055 468,718 -1.4% 516,208 514,815 0.3% 565,408 553,229 2.2%EWR 17,542,172 17,273,978 1.5% 21,041,615 21,494,456 -2.2% 24,270,685 25,011,523 -3.1%HPN 551,810 536,774 2.7% 696,960 670,534 3.8% 807,476 781,999 3.2%HVN 45,325 46,487 -2.6% 56,758 56,243 0.9% 66,000 64,373 2.5%ISP 1,146,983 1,153,996 -0.6% 1,572,500 1,547,233 1.6% 1,920,710 1,874,391 2.4%JFK 16,658,684 16,225,758 2.6% 21,511,399 21,726,620 -1.0% 25,328,606 25,451,874 -0.5%LGA 12,335,092 12,198,016 1.1% 15,150,110 15,122,859 0.2% 16,930,178 16,360,924 3.4%PHL 12,566,838 12,270,835 2.4% 16,055,655 15,677,479 2.4% 18,603,018 18,516,348 0.5%SWF 307,562 317,020 -3.1% 357,211 360,669 -1.0% 754,119 397,044 47.3%TTN 32,412 67,000 -106.7% 50,239 76,130 -51.5% 81,293 83,739 -3.0%Total 62,127,690 61,032,431 1.8% 77,554,567 77,782,257 -0.3% 89,927,852 89,681,805 0.3%
Source: Landrum & Brown Analysis, 2001
IV-B. Operations Forecasts
After developing the passenger forecasts for the region, airport-specific operations forecasts were developed for airline, general aviation, freighter and military operations. Based on the annual operations forecast, two sets of operational schedules were developed for each airport: Average Annual Day (“AAD”) and 90th Percentile (“90P”) day schedules. The 90P schedule is essentially a representation of the 37th busiest day of the year for the study airports. This is reflective of a moderately busy day of air traffic that is often used for analysis of airport and air traffic systems. The AAD forecast is used for environmental planning purposes, while the 90P is more commonly used for operational planning purposes. For each airport, the AAD and 90P forecast schedules were developed for the baseline year of 2000 and the forecast years of 2006 and 2011. These forecast schedules included daily and annual operations for airline, general aviation, freighter and military IFR operations components.
The approach and methodology for each forecast component is outlined below.
Airline Operations Forecasts – For each airport with scheduled airline service, current average day airline schedules for Friday, October 13, 2000, were culled from the OAG. This baseline schedule was then calibrated by applying average historical load factors. These schedules were then annualized so that they reflected near actual annual volumes.

NY/NJ/PHL Airspace Redesign EIS Aviation Activity Forecasts Report
Landrum & Brown Appendix B September, 2005 Page B-12
1. Adding Frequencies – Insofar as air carriers add and drop city pairs and frequencies, analysts performed a similar exercise building from the baseline schedule. By analyzing air service trends, they added new flights to markets at the appropriate time of day where demand warranted. For example, in 2006 it can be expected that Southwest Airlines would have additional departures from ISP to its East Coast focus city at Baltimore/Washington International Airport (“BWI”). Therefore, the 2006 schedule would reflect this increased service at an average Southwest load factor. This exercise was repeated (and tested) for every airline and every airport with commercial air service. This “bottom-up” approach containing increased scheduled activity also enables analysts to provide considerable detail including aircraft and engine types for environmental analysis.
2. Dropping Frequencies – If the data, combined with industry trends, indicated that a particular city pair would not likely be sustainable by 2006 and 2011, that service would be dropped. There are several noticeable examples, including the unlikely sustainability of the Atlantic City (“ACY”)-PHL city pair served by a US Airways regional affiliate. Data has suggested that ACY is a market served mainly by passengers traveling in automobiles and buses, especially from locations within a radius of 250 miles.
3. Change of Gauge – A review of airline fleet mix and fleet orders/options indicated that certain city pairs served by specific carriers would potentially increase (or decrease) the size of deployed aircraft. For example, the Boeing 737-800 as a replacement aircraft for earlier models has considerably more seat capacity (depending on carrier and configuration). In addition, the new Airbus A380 [New Large Aircraft (“NLA”)] was assumed to serve JFK within the forecast horizon (i.e., included in 2011 JFK schedules).
4. New Entrants – Over the planning horizon, select airports and select new entrants were included. In addition to the likely introduction of a number of international carriers (primarily at JFK, PHL and EWR), the expansion in the region of two low-fare carriers, in particular, was modeled. The successful commencement of service and aggressive growth by jetBlue Airways at JFK was developed. The commencement and a modest expansion of service by Southwest at ISP were also modeled. Also, it was assumed that Southwest Airlines (or an equivalent low-fare operator) would commence service to SWF by 2011. The airport operator and analysts have sound reason to believe that such an event would occur in the forecast horizon.
Each arrival and departure flight was linked (matched) based on the applicable average ground time requirement for each city pair, the type of flight (domestic/international), type of equipment (widebody/narrowbody/regional), and particular carrier.

NY/NJ/PHL Airspace Redesign EIS Aviation Activity Forecasts Report
Landrum & Brown Appendix B September, 2005 Page B-13
General Aviation Operations Forecasts – For each airport, a general aviation (GA) IFR operations forecast was developed. The approach to GA included analysis and observations regarding the types of aircraft used based on the FAA categorization of GA aircraft including single engine piston, multi-engine piston, turbo prop, jet, helicopter and experimental aircraft types. Each of these aircraft types has different growth profiles. The FAA’s projected growth in each aircraft type was applied to the based-aircraft fleet at each airport. For example, the FAA and industry observers expect that the jet component in the GA market will grow at or about 4 percent per annum over the forecast horizon.3 If a particular airport has a large percentage of based and itinerant aircraft that are jets (i.e., HPN, TEB), the FAA jet growth rate was also applied to the single/multiple piston activity. It was further assumed that most single engine and multi-engine piston aircraft were VFR operations, and thus not part of the IFR operations forecast. If a particular airport exhibited historically a large percentage of local operations and was known to have flight schools, a much lower IFR rate was applied (e.g., FRG). All jet (corporate) operations at all airports were assumed to be IFR flight activity. Helicopter and experimental aircraft were assumed to be VFR-only operations, and were therefore excluded from the IFR projections.
Freighter Operations Forecasts – All cargo or freighter operations were examined on an airport-specific basis. Known hubs for express/integrator carriers like FedEx at Newark or UPS at PHL were individually evaluated for the forecast of operations and fleet mix. Other airports with limited freighter operations (i.e., check runners at TEB) were extrapolated by trend analysis. All freighter operations were assumed as IFR only.
Military Operations Forecasts– Many of the airports in the Region handle a combination of tactical, strategic and helicopter operations conducted by the military. Because future military operations projections are difficult to forecast, analysts relied on FAA military projections for each airport. It should be noted that all military helicopter operations were assumed as VFR while all military jet operations were assumed as IFR in nature.
Overflight Operations Forecast – Overflight operations were examined as congestion also occurs with aircraft bypassing this busy airspace on approach to other airports in the vicinity or “en route” to more distant destinations. For the purposes of this analysis this category of operations is defined as IFR flight planned traffic that neither traverses some portion of the study area, is below 14,000 feet MSL altitude, and neither originates ore is destined anywhere within the study area. Overflight projections were derived with the aid of the FAA En route forecast contained in the 2000 FAA Aerospace Forecast.
3 Source: 2000 FAA Aerospace Forecast
NY/NJ/PHL Airspace Redesign EIS Aviation Activity Forecasts Report
Landrum & Brown Appendix B September, 2005 Page B-14
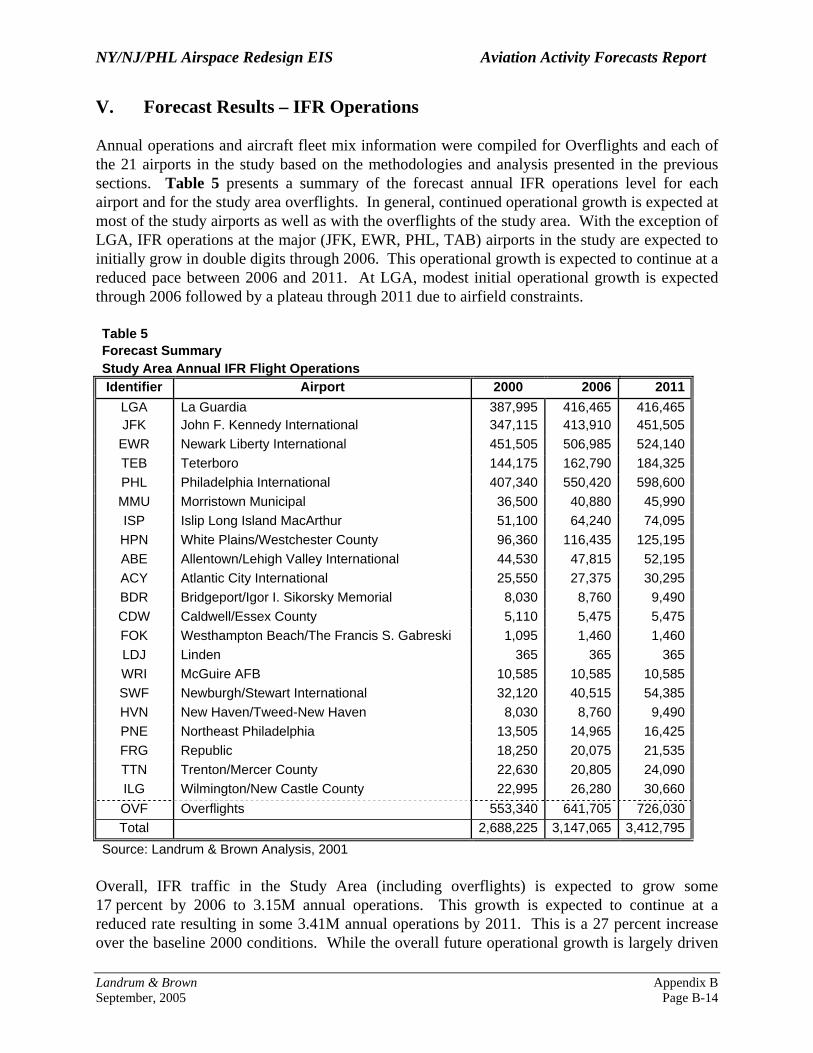
V. Forecast Results – IFR Operations Annual operations and aircraft fleet mix information were compiled for Overflights and each of the 21 airports in the study based on the methodologies and analysis presented in the previous sections. Table 5 presents a summary of the forecast annual IFR operations level for each airport and for the study area overflights. In general, continued operational growth is expected at most of the study airports as well as with the overflights of the study area. With the exception of LGA, IFR operations at the major (JFK, EWR, PHL, TAB) airports in the study are expected to initially grow in double digits through 2006. This operational growth is expected to continue at a reduced pace between 2006 and 2011. At LGA, modest initial operational growth is expected through 2006 followed by a plateau through 2011 due to airfield constraints.
Table 5 Forecast Summary Study Area Annual IFR Flight Operations Identifier Airport 2000 2006 2011
LGA La Guardia 387,995 416,465 416,465JFK John F. Kennedy International 347,115 413,910 451,505
EWR Newark Liberty International 451,505 506,985 524,140TEB Teterboro 144,175 162,790 184,325PHL Philadelphia International 407,340 550,420 598,600MMU Morristown Municipal 36,500 40,880 45,990ISP Islip Long Island MacArthur 51,100 64,240 74,095HPN White Plains/Westchester County 96,360 116,435 125,195ABE Allentown/Lehigh Valley International 44,530 47,815 52,195ACY Atlantic City International 25,550 27,375 30,295BDR Bridgeport/Igor I. Sikorsky Memorial 8,030 8,760 9,490CDW Caldwell/Essex County 5,110 5,475 5,475FOK Westhampton Beach/The Francis S. Gabreski 1,095 1,460 1,460LDJ Linden 365 365 365WRI McGuire AFB 10,585 10,585 10,585SWF Newburgh/Stewart International 32,120 40,515 54,385HVN New Haven/Tweed-New Haven 8,030 8,760 9,490PNE Northeast Philadelphia 13,505 14,965 16,425FRG Republic 18,250 20,075 21,535TTN Trenton/Mercer County 22,630 20,805 24,090ILG Wilmington/New Castle County 22,995 26,280 30,660OVF Overflights 553,340 641,705 726,030Total 2,688,225 3,147,065 3,412,795
Source: Landrum & Brown Analysis, 2001 Overall, IFR traffic in the Study Area (including overflights) is expected to grow some 17 percent by 2006 to 3.15M annual operations. This growth is expected to continue at a reduced rate resulting in some 3.41M annual operations by 2011. This is a 27 percent increase over the baseline 2000 conditions. While the overall future operational growth is largely driven

NY/NJ/PHL Airspace Redesign EIS Aviation Activity Forecasts Report
Landrum & Brown Appendix B September, 2005 Page B-15
by increased aviation demand in the form of passengers and corporate aviation, the operational numbers are intensified by changes in the future fleet mix. Among the most pronounced changes in commercial passenger fleets in the late 1990’s has been the replacement of turboprop aircraft with regional jets. This trend toward the use of regional jets has continued in recent years with many major airlines replacing narrow body aircraft with regional jets in search of more profitable operations. While this “down-gauging” of aircraft results higher efficiency and profits for the airlines, it takes more flights to serve the same number of passengers. Thus, operational levels increase while accommodating the same number of passengers as before.
Table 6 presents a generalized fleet mix summary for each forecast year by study airport. As the table indicates, the IFR operational fleet mix in the study area is expected to gradually transition to a higher proportion of jets throughout the planning horizon. Currently, just over 70 percent of the IFR operations in the study area are conducted by jet aircraft. This is expected to increase to 86 percent by 2006 and 92 percent by 2011. The percentage of operations conducted by piston engine aircraft operations is expected to stay relatively flat at the 2.5 to 3 percent that is currently seen. Thus, the majority of the shift to jet operations comes from the turbo-prop category. Detailed fleet mix tables for each airport in the study are presented in Attachment B at the end of this appendix.

NY/NJ/PHL Airspace Redesign EIS Aviation Activity Forecasts Report
Landrum & Brown Appendix B September, 2005 Page B-16
Table 6 Generalized Fleet Mix Summary- Existing & Forecast Percent Fleet Mix 2000 2006 2011 Identifier Airport Jets Turbo-
props Props Jets Turbo-
props Props Jets Turbo-
props Props
LGA La Guardia 80.9% 19.1% 0.0% 98.5% 1.2% 0.3% 99.4% 0.4% 0.2% JFK John F. Kennedy International 67.9% 32.1% 0.0% 89.6% 10.3% 0.2% 99.4% 0.6% 0.0% EWR Newark Liberty International 85.3% 14.6% 0.0% 96.0% 3.5% 0.5% 98.7% 0.9% 0.4% TEB Teterboro 82.0% 7.8% 10.1% 66.2% 21.6% 12.2% 69.9% 19.1% 11.0% PHL Philadelphia International 72.7% 26.4% 1.0% 87.1% 12.1% 0.8% 95.6% 3.7% 0.7% MMU Morristown Municipal 68.2% 12.2% 19.6% 67.0% 19.3% 13.8% 64.5% 21.8% 13.7% ISP Islip Long Island MacArthur 64.8% 34.6% 0.6% 74.3% 24.0% 1.7% 89.6% 8.9% 1.5% HPN White Plains/Westchester County 46.9% 52.9% 0.2% 70.7% 27.8% 1.6% 88.6% 10.0% 1.5% ABE Allentown/Lehigh Valley International 52.8% 45.2% 2.0% 73.3% 22.9% 3.8% 85.9% 11.3% 2.8% ACY Atlantic City International 50.8% 38.2% 11.0% 62.7% 32.0% 5.3% 62.7% 32.5% 4.8% BDR Bridgeport/Igor I. Sikorsky Memorial 46.0% 18.1% 35.8% 50.0% 29.2% 20.8% 50.0% 30.8% 19.2% CDW Caldwell/Essex County 2.9% 12.1% 85.0% 6.7% 66.7% 26.7% 6.7% 60.0% 33.3%
FOK Westhampton Beach/The Francis S. Gabreski 70.4% 14.8% 14.8% 75.0% 25.0% 0.0% 75.0% 25.0% 0.0%
LDJ Linden 0.0% 12.5% 87.5% 0.0% 100.0% 0.0% 0.0% 100.0% 0.0% WRI McGuire AFB 94.0% 5.3% 0.7% 79.3% 20.7% 0.0% 79.3% 20.7% 0.0% SWF Newburgh/Stewart International 71.6% 25.8% 2.6% 84.7% 11.7% 3.6% 89.9% 7.4% 2.7% HVN New Haven/Tweed-New Haven 20.4% 65.7% 13.9% 50.0% 45.8% 4.2% 80.8% 15.4% 3.8% PNE Northeast Philadelphia 41.0% 19.3% 39.7% 36.6% 34.1% 29.3% 40.0% 33.3% 26.7% FRG Republic 39.8% 19.2% 41.0% 51.8% 30.4% 17.9% 53.3% 30.0% 16.7% TTN Trenton/Mercer County 40.0% 45.2% 14.7% 43.9% 52.6% 3.5% 68.2% 28.8% 3.0% ILG Wilmington/New Castle County 62.5% 20.7% 16.8% 62.5% 23.6% 13.9% 61.9% 25.0% 13.1%
TOTAL 73.3% 23.9% 2.8% 85.9% 11.5% 2.6% 92.2% 5.7% 2.2% Source: 2/00, 4/00, 7/00 Radar data & Landrum & Brown Analysis - 2001

NY/NJ/PHL Airspace Redesign EIS Aviation Activity Forecasts Report
Landrum & Brown Appendix B September, 2005 Page B-17
VI The Impact of the Events of September 11 on Forecast Task The bulk of this forecast effort was conducted before the events of September 11, 2001. Given the relatively long forecast horizon, 2001-2011, any short-term suppression of aviation demand is expected to recover by the first benchmark year of 2006. Outlined below are some observations that support the position that aviation growth will rebound over the forecast horizon.
As the aviation industry struggles with reduced traffic and a shaken confidence in aviation security resulting from the events of September 11, most industry stakeholders are searching for some comparable system shock in an effort to estimate the short- and long-term impacts on aggregate aviation demand. In the post-September 11 world, industry stakeholders wonder whether aviation activity will return to the sustainable and even healthy levels to which airport operators had grown accustomed. There is no comparable event to what occurred on September 11. However, when analysts look back over the last 40 years and examine aviation traffic in light of an impressive listing of system shocks, reason for optimism is not unfounded. The 1960s led with the Cuban Missile Crisis, while the 1970s introduced aircraft highjackings and their effect on international aviation demand in particular. The 1980s opened with the PATCO strike, while the Persian Gulf War created temporary travel uncertainty in the early 1990s. The new millennium brings us a new war against worldwide terrorism that presents its unique set of uncertainties. If aviation history provides any guidance, this downturn will be offset by a pronounced recovery. As illustrated below, sharp recoils have been followed by discernable recoveries.

NY/NJ/PHL Airspace Redesign EIS Aviation Activity Forecasts Report
Landrum & Brown Appendix B September, 2005 Page B-18
It should be noted that every aforementioned decade-defining industry episode was adjoined by an economic recession. The rash of highjackings in the mid-1970s was concurrent with OPEC actions and economic hardship in the United States and abroad. Months before the Reagan Administration replaced civilian air traffic controllers with military controllers; the nation was well into a deep and debilitating recession. The Persian Gulf War was prosecuted as economic malaise gripped the nation. An economic recession was also well underway before the events of September 11. Economic recessions have always been the industry’s single greatest threat to profitability, competition and traffic volumes. Provided that confidence in aviation security returns, an industry rebound will likely occur as previously observed.
The industry’s capacity and congestion debate has been temporarily sidelined as air carriers have slashed their schedules by as much as 20 percent or more in some markets. However, capacity and congestion relief is believed to be temporary. Those same forces of supply and demand that threatened the efficiency of the nation’s air transportation system prior to September 11 will re-emerge at severely constrained airports including two subject airports – Newark and LaGuardia.
Therefore, for the purposes of this forecast task, both the events of September 11 and the current economic conditions are considered short-term and are not expected to affect long-term demand at the subject airports.

NY/NJ/PHL Airspace Redesign EIS Aviation Activity Forecasts Report
Landrum & Brown Appendix B September, 2005 Attachment A-1
Attachment A
STUDY AREA AIRPORT EVALUATION SUMMARY

NY/NJ/PHL Airspace Redesign EIS Aviation Activity Forecasts Report
Landrum & Brown Appendix B September, 2005 Attachment A-2
Study Area Airport Evaluation Summary Operation Counts and Rationale for Inclusion or Exclusion
3letterID Name StatePublished Approach?
avg daily total ops
avg daily jet ops
avg daily %jet
Include: Yes/No
Rationale for Inclusion or Exclusion
EWR Newark International Airport NJ Yes 1243 1085 87% Yes Primary Affected Airports HPN Westchester County Airport NY Yes 319 188 59% Yes Primary Affected Airports ISP Long Island Mac Arthur Airport NY Yes 145 83 57% Yes Primary Affected Airports JFK John F. Kennedy International Airport NY Yes 926 702 76% Yes Primary Affected Airports LGA La Guardia Airport NY Yes 1102 899 82% Yes Primary Affected Airports MMU Morristown Municipal Airport NJ Yes 88 57 64% Yes Primary Affected Airports PHL Philadelphia International Airport PA Yes 1243 927 75% Yes Primary Affected Airports TEB Teterboro Airport NJ Yes 378 269 71% Yes Primary Affected Airports ABE Lehigh Valley (Allentown) International Airport PA Yes 137 69 51% Yes Potential Change ACY Atlantic City International Airport NJ Yes 90 48 53% Yes Potential Change SWF Stewart International Airport NY Yes 74 47 63% Yes Ops > 20 BDR Igor I Sikorsky Memorial Airport CT Yes 28 12 43% Yes Ops > 20 FRG Republic Airport NY Yes 62 26 42% Yes Ops > 20 ILG New Castle County (Wilmington) Airport DE Yes 62 34 54% Yes Ops > 20 PNE North Philadelphia Airport PA Yes 40 13 33% Yes Ops > 20 TTN Trenton Mercer Airport NJ Yes 65 24 37% Yes Ops > 20 CDW Essex County Airport NJ Yes 17 1 4% Yes IFR Traffic Mix FOK Suffolk (JETS) NY Yes 20 13 66% Yes Ops=20; mainly jets HVN Tweed-New Haven Airport (United 737's) CT Yes 27 5 20% Yes Ops > 20 WRI McGuire AFB NJ No 29 23 80% Yes Special Interest LDJ Linden Airport NJ No 3 0 8% Yes IFR Traffic Mix 39N Princeton Airport NJ Yes 3 0 0% No Ops < 20 BLM Allaire Airport NJ Yes 17 8 46% No Ops < 20 N51 Solberg-Hunterdon NJ Yes 2 0 0% No Ops < 20 17N Cross Keys Airport NJ Yes 1 0 0% No Ops < 20 1N9 Allentown Queen City Municipal Airport PA Yes 3 0 0% No Ops < 20 44N Sky Acres Airport NY Yes 1 0 10% No Ops < 20 BDL Bradley International Airport CT Yes 391 290 74% No Exclude since outside boundary DXR Danbury Municipal Airport CT Yes 15 2 14% No Ops < 20 DYL Doylestown Airport PA Yes 4 0 5% No Ops < 20 GON Groton-New London Airport CT Yes 26 7 27% No Excluded since controlled by
Boston Center, no changes proposed

NY/NJ/PHL Airspace Redesign EIS Aviation Activity Forecasts Report
Landrum & Brown Appendix B September, 2005 Attachment A-3
3letterID Name StatePublished Approach?
avg daily total ops
avg daily jet ops
avg daily %jet
Include: Yes/No
Rationale for Inclusion or Exclusion
HTO East Hampton NY Yes 18 7 36% No Ops < 20 MGJ Orange County Airport NY Yes 4 0 5% No Ops < 20 MJX Robert J. Miller Airpark Airport PA Yes 3 1 27% No Ops < 20 N43 Braden Airpark Airport (Easton) PA Yes 1 0 0% No Ops < 20 N82 Wurtsboro-Sullivan County Airport NY Yes 0 0 0% No Ops < 20 N99 Brandywine Airport PA Yes 5 0 4% No Ops < 20 OXC Waterbury-Oxford CT Yes 16 10 61% No Ops < 20 POU Dutches County NY Yes 17 3 18% No Ops < 20 PVD Theodore Francis Green State Airport RI Yes 246 183 74% No Exclude since outside boundary SMQ Somerset Airport NJ Yes 4 0 0% No Ops < 20 VAY South Jersey Regional Airport NJ Yes 3 0 0% No Ops < 20 RDG Reading Regional/Carl A Spaatz Field PA Yes 49 9 18% No Exclude since outside boundary 12N Aeroflex-Andover NJ Yes 0 0 0% No Ops < 20 N85 Alexandria NJ Yes 1 0 0% No Ops < 20 47N Central Jersey Regional (Kupper) NJ Yes 2 0 0% No Ops < 20 N87 Trenton-Robbinsville NJ Yes 1 0 0% No Ops < 20 N37 Monticello NY Yes 0 0 0% No Ops < 20 06N Randall NY Yes 0 0 0% No Ops < 20 40N Chester County G O Carlson PA Yes 11 5 47% No Ops < 20 N57 New Garden PA Yes 1 0 0% No Ops < 20 PTW Pottstown Limerick PA Yes 15 1 7% No Ops < 20 3B9 Chester CT Yes 2 0 0% No Ops < 20 MMK Meriden Markham Muni CT Yes 1 0 0% No Ops < 20 1N7 Blairstown NJ Yes 1 0 0% No Ops < 20 N81 Hammonton Muni NJ Yes 1 0 0% No Ops < 20 MIV Millville Muni NJ Yes 4 1 23% No Ops < 20 3N6 Old Bridge NJ Yes 1 0 0% No Ops < 20 N40 Sky Manor NJ Yes 1 0 0% No Ops < 20 1N4 Woodbine Muni NJ Yes 1 0 0% No Ops < 20 MTP Montauk NY Yes 1 0 0% No Ops < 20 46N Sky Park NY Yes 1 0 0% No Ops < 20 MSV Sullivan County International NY Yes 2 1 30% No Ops < 20 22N Jake Arner Memorial PA Yes 1 0 0% No Ops < 20 N10 Perkiomen Valley PA Yes 1 0 0% No Ops < 20

NY/NJ/PHL Airspace Redesign EIS Aviation Activity Forecasts Report
Landrum & Brown Appendix B September, 2005 Attachment A-4
3letterID Name StatePublished Approach?
avg daily total ops
avg daily jet ops
avg daily %jet
Include: Yes/No
Rationale for Inclusion or Exclusion
MPO Pocono Mountains Muni PA Yes 3 0 13% No Ops < 20 UKT Quakertown PA Yes 1 0 0% No Ops < 20 N67 Wings Field PA Yes 6 0 0% No Ops < 20 NEL Lakehurst NAEC NJ No No No Instrument Approach HFD Hartford-Brainard Airport CT No No No Instrument Approach HWV Brookhaven Airport NY No No No Instrument Approach N70 Pennridge Airport PA No No No Instrument Approach 11N Candlelight Farms CT No No No Instrument Approach 42B Goodspeed CT No No No Instrument Approach 22B Mountain Meadow Airstrip CT No No No Instrument Approach 4B8 Robertson Field CT No No No Instrument Approach 9B8 Salmon River Airfield CT No No No Instrument Approach N41 Waterbury CT No No No Instrument Approach 00N Bucks NJ No No No Instrument Approach 31E Eagles Nest NJ No No No Instrument Approach N05 Hackettstown NJ No No No Instrument Approach 29N Kroelinger NJ No No No Instrument Approach N50 Li Calzi NJ No No No Instrument Approach N07 Lincoln Park NJ No No No Instrument Approach 3N5 Newton NJ No No No Instrument Approach 3N7 Pemberton NJ No No No Instrument Approach N75 Twin Pine NJ No No No Instrument Approach 2N6 Redwing NJ No No No Instrument Approach 25N Rudys NJ No No No Instrument Approach 7N7 Spitfire Aerodrome (Old Mans) NJ No No No Instrument Approach 13N Trinca NJ No No No Instrument Approach 28N Vineland-Downstown NJ No No No Instrument Approach 09N Airhaven NY No No No Instrument Approach K23 Cooperstown-Westville NY No No No Instrument Approach 1I5 Freehold NY No No No Instrument Approach 1A1 Green Acres NY No No No Instrument Approach N89 Joseph Y. Resnick NY No No No Instrument Approach N45 Kobelt NY No No No Instrument Approach O00 Lufker NY No No No Instrument Approach

NY/NJ/PHL Airspace Redesign EIS Aviation Activity Forecasts Report
Landrum & Brown Appendix B September, 2005 Attachment A-5
3letterID Name StatePublished Approach?
avg daily total ops
avg daily jet ops
avg daily %jet
Include: Yes/No
Rationale for Inclusion or Exclusion
1N2 Spadaro NY No No No Instrument Approach N69 Stormville NY No No No Instrument Approach 7N8 Butter Valley Golf Port PA No No No Instrument Approach 14N Beltzville PA No No No Instrument Approach 8N4 Flying Dollar PA No No No Instrument Approach P91 Flying M Aerodrome PA No No No Instrument Approach O03 Morgantown PA No No No Instrument Approach 69N Slatington PA No No No Instrument Approach 70N Spring Hill PA No No No Instrument Approach 9N1 Vansant PA No No No Instrument Approach N04 Griswold CT No No No Instrument Approach AIY Atlantic City Muni/Bader Field NJ No No No Instrument Approach 19N Camden County NJ No No No Instrument Approach
WWD Cape May County NJ No No No Instrument Approach N14 Flying W NJ No No No Instrument Approach 4N1 Greenwood Lake NJ No No No Instrument Approach N12 Lakewood NJ No No No Instrument Approach 26N Ocean City Muni NJ No No No Instrument Approach N73 Red Lion NJ No No No Instrument Approach FWN Sussex NJ No No No Instrument Approach 23N Bayport Aerodrome NY No No No Instrument Approach 0B8 Elizabeth Field NY No No No Instrument Approach 20N Kingston-Ulster NY No No No Instrument Approach N00 Maben NY No No No Instrument Approach 21N Mattituck NY No No No Instrument Approach N72 Warwick Muni NY No No No Instrument Approach N30 Cherry Ridge PA No No No Instrument Approach N47 Pottstown Muni PA No No No Instrument Approach N53 Stroudsburg-Pocono PA No No No Instrument Approach C01 Southern Cross NJ No No No Instrument Approach N31 Kutztown Airport PA No No No Instrument Approach

NY/NJ/PHL Airspace Redesign EIS Aviation Activity Forecasts Report
Landrum & Brown Appendix B September, 2005 Attachment B-1
Attachment B
FORECAST FLEET MIX DATA TABLES

NY/NJ/PHL Airspace Redesign EIS Aviation Activity Forecasts Report
Landrum & Brown Appendix B September, 2005 Attachment B-2
EWR Current & Future Fleet Mix Aircraft
Category AC Type 2000 2006 2011 H 747400 0.7% 0.7% 0.8% 767300 2.5% 3.2% 4.2% 777200 0.9% 1.7% 2.0% 74710Q 0.2% 0.7% 0.1% 74720B 0.0% 0.1% 0.1% 767CF6 0.0% 0.3% 1.2% A300 0.8% 0.7% 0.8% A310 0.8% 0.9% 1.0% A330 0.2% 0.3% 0.3% A340 0.2% 0.4% 0.5% DC1030 3.5% 1.1% 1.0% DC1040 0.2% 0.3% 0.2% DC870 0.7% 1.0% 1.0% MD11GE 0.2% 0.1% 0.2% L1011 0.0% 0.0% 0.0%
H Total 11.1% 11.5% 13.6% M 737300 7.9% 9.4% 6.6% 737400 0.7% 0.0% 0.0% 737500 9.7% 2.7% 0.4% 737700 8.9% 30.6% 39.0% 727EM2 4.1% 1.1% 0.0% 737N17 2.3% 0.0% 0.0% 757PW 9.9% 9.5% 7.8% A319 0.4% 2.5% 2.4% A320 1.6% 2.8% 2.7% DC93LW 1.3% 0.1% 0.1% DC95HW 2.6% 0.0% 0.0% F10065 0.3% 0.5% 0.5% MD83 14.9% 3.4% 1.2% MD9025 0.3% 2.3% 2.5% 717200 0.3% 0.0% 0.0%
M Total 65.2% 64.8% 63.2%
Aircraft Category AC Type 2000 2006 2011 L CL600 0.0% 2.1% 2.1% CL601 1.5% 3.5% 3.3% GIV 0.0% 0.4% 0.4% LEAR35 0.0% 0.3% 0.3% MU3001 0.0% 0.5% 0.4% FAL20 0.0% 0.0% 0.0%
L Total 1.6% 6.7% 6.6% R EMB145 7.4% 12.9% 15.2%
R Total 7.4% 12.9% 15.2% K LEAR25 0.1% 0.1% 0.1% GIIB 0.0% 0.0% 0.0%
K Total 0.1% 0.1% 0.1% T CNA441 0.0% 0.0% 0.0% DHC6 2.0% 0.1% 0.1% DHC8 8.4% 3.0% 0.5% GASEPF 0.4% 0.3% 0.3% HS748A 1.2% 0.0% 0.0% SF340 2.6% 0.1% 0.1% CVR580 0.0% 0.0% 0.0%
T Total 14.7% 3.5% 0.9% P BEC58P 0.0% 0.1% 0.1% GASEPV 0.0% 0.4% 0.3%
P Total 0.0% 0.5% 0.4% Grand Total 100.0% 100.0% 100.0%Source: Landrum & Brown, 2005
NY/NJ/PHL Airspace Redesign EIS Aviation Activity Forecasts Report
Landrum & Brown Appendix B September, 2005 Attachment B-3
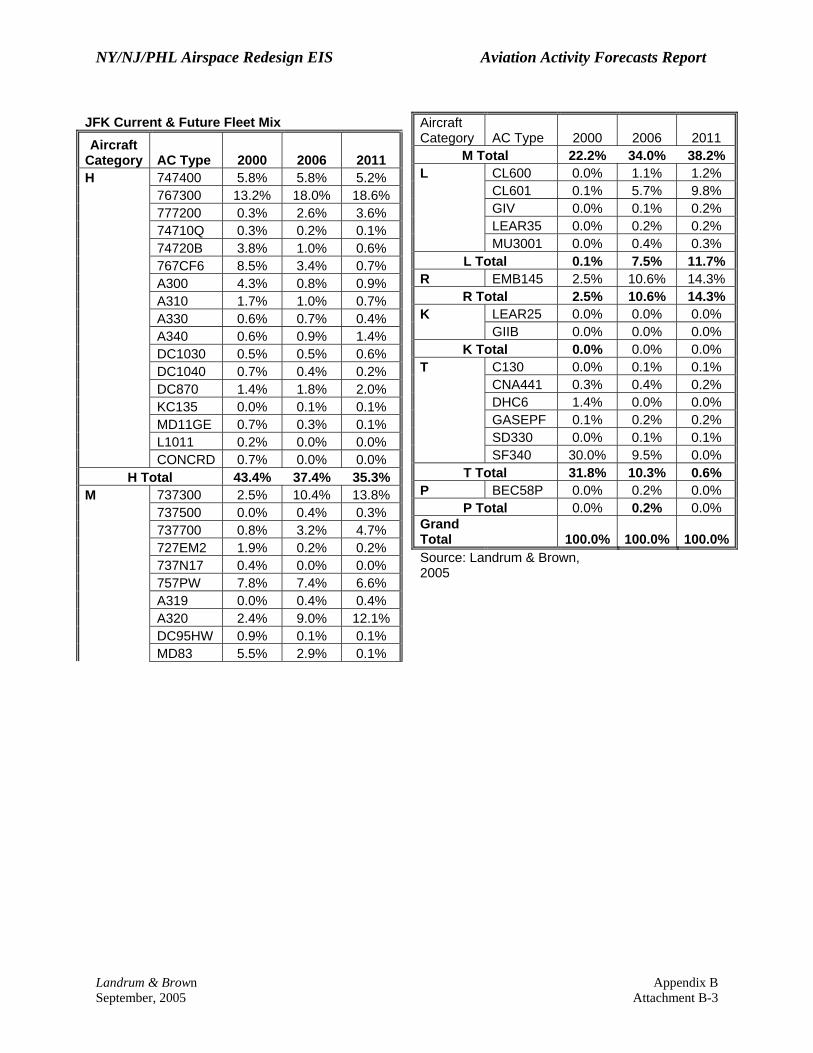
JFK Current & Future Fleet Mix Aircraft
Category AC Type 2000 2006 2011 H 747400 5.8% 5.8% 5.2% 767300 13.2% 18.0% 18.6% 777200 0.3% 2.6% 3.6% 74710Q 0.3% 0.2% 0.1% 74720B 3.8% 1.0% 0.6% 767CF6 8.5% 3.4% 0.7% A300 4.3% 0.8% 0.9% A310 1.7% 1.0% 0.7% A330 0.6% 0.7% 0.4% A340 0.6% 0.9% 1.4% DC1030 0.5% 0.5% 0.6% DC1040 0.7% 0.4% 0.2% DC870 1.4% 1.8% 2.0% KC135 0.0% 0.1% 0.1% MD11GE 0.7% 0.3% 0.1% L1011 0.2% 0.0% 0.0% CONCRD 0.7% 0.0% 0.0%
H Total 43.4% 37.4% 35.3% M 737300 2.5% 10.4% 13.8% 737500 0.0% 0.4% 0.3% 737700 0.8% 3.2% 4.7% 727EM2 1.9% 0.2% 0.2% 737N17 0.4% 0.0% 0.0% 757PW 7.8% 7.4% 6.6% A319 0.0% 0.4% 0.4% A320 2.4% 9.0% 12.1% DC95HW 0.9% 0.1% 0.1% MD83 5.5% 2.9% 0.1%
Aircraft Category AC Type 2000 2006 2011
M Total 22.2% 34.0% 38.2% L CL600 0.0% 1.1% 1.2% CL601 0.1% 5.7% 9.8% GIV 0.0% 0.1% 0.2% LEAR35 0.0% 0.2% 0.2% MU3001 0.0% 0.4% 0.3%
L Total 0.1% 7.5% 11.7% R EMB145 2.5% 10.6% 14.3%
R Total 2.5% 10.6% 14.3% K LEAR25 0.0% 0.0% 0.0% GIIB 0.0% 0.0% 0.0%
K Total 0.0% 0.0% 0.0% T C130 0.0% 0.1% 0.1% CNA441 0.3% 0.4% 0.2% DHC6 1.4% 0.0% 0.0% GASEPF 0.1% 0.2% 0.2% SD330 0.0% 0.1% 0.1% SF340 30.0% 9.5% 0.0%
T Total 31.8% 10.3% 0.6% P BEC58P 0.0% 0.2% 0.0%
P Total 0.0% 0.2% 0.0% Grand Total 100.0% 100.0% 100.0%Source: Landrum & Brown, 2005

NY/NJ/PHL Airspace Redesign EIS Aviation Activity Forecasts Report
Landrum & Brown Appendix B September, 2005 Attachment B-4
LGA Current & Future Fleet Mix
Aircraft Category AC Type 2000 2006 2011
H 767300 0.8% 1.0% 1.7% 767CF6 0.7% 0.1% 0.0%
H Total 1.5% 1.1% 1.7% M 737300 12.0% 13.4% 12.4% 737400 2.4% 1.4% 0.5% 737500 0.5% 0.0% 0.0% 737700 2.5% 17.9% 11.9% 727EM2 11.4% 0.0% 0.0% 737N17 1.6% 0.7% 0.0% 757PW 7.8% 12.2% 19.9% A319 1.2% 1.4% 0.0% A320 4.0% 8.3% 12.4% DC93LW 2.5% 0.7% 0.0% DC95HW 3.9% 0.0% 0.0% F10065 0.3% 1.0% 0.0% MD83 16.9% 2.6% 2.6% MD9025 0.0% 2.5% 2.2% 717200 0.1% 0.0% 0.0% 7373B2 0.1% 0.0% 0.0%
M Total 67.4% 62.2% 62.0% L CL600 0.2% 1.8% 1.9% CL601 7.1% 12.4% 14.1% GIV 0.0% 0.6% 0.7% LEAR35 0.0% 0.4% 0.5% MU3001 0.0% 0.4% 0.3% FAL20 0.0% 0.0% 0.0%
L Total 7.4% 15.6% 17.6% R EMB145 4.6% 19.6% 18.2%
R Total 4.6% 19.6% 18.2% K GIIB 0.0% 0.0% 0.0%
K Total 0.0% 0.0% 0.0% T CNA441 0.0% 0.3% 0.2% DHC6 1.2% 0.0% 0.0% DHC8 11.9% 0.7% 0.0% GASEPF 0.0% 0.3% 0.3% SF340 6.0% 0.0% 0.0%
T Total 19.2% 1.2% 0.4% P BEC58P 0.0% 0.2% 0.1% GASEPV 0.0% 0.1% 0.1%
P Total 0.0% 0.3% 0.2% Grand Total 100.0% 100.0% 100.0% Source: Landrum & Brown, 2005

NY/NJ/PHL Airspace Redesign EIS Aviation Activity Forecasts Report
Landrum & Brown Appendix B September, 2005 Attachment B-5
PHL Current & Future Fleet Mix Aircraft
Category AC Type 2000 2006 2011 H 747400 0.0% 0.3% 0.3% 767300 0.7% 0.7% 0.6% 777200 0.0% 0.1% 0.2% 74710Q 0.3% 0.0% 0.0% 74720B 0.0% 0.1% 0.1% 767CF6 0.2% 0.1% 0.1% A300 0.2% 0.1% 0.1% A310 0.1% 0.9% 1.0% A330 0.0% 0.9% 0.9% A340 0.0% 0.1% 0.1% DC870 1.0% 1.1% 1.0% KC135 0.0% 0.1% 0.1%
H Total 2.6% 4.4% 4.3% M 737300 13.0% 10.7% 8.5% 737400 7.4% 1.8% 0.1% 737500 1.4% 1.6% 0.2% 737700 3.6% 13.4% 18.8% 727EM2 5.0% 1.1% 0.0% 737N17 1.9% 0.0% 0.0% 757PW 5.6% 8.2% 9.8% A319 2.7% 10.2% 11.5% A320 1.7% 6.6% 8.2% DC93LW 1.5% 0.0% 0.0% DC95HW 7.4% 0.1% 0.1% F10065 4.4% 0.1% 0.1% MD83 6.6% 3.6% 0.9% MD9025 0.0% 2.5% 2.9% 717200 0.3% 0.0% 0.0%
Aircraft Category AC Type 2000 2006 2011
M Total 62.3% 59.9% 61.2% L CL600 0.4% 2.5% 2.7% CL601 3.5% 7.8% 6.6% GIV 0.0% 0.9% 1.3% LEAR35 1.4% 1.3% 1.3% MU3001 0.1% 0.7% 0.5% FAL20 0.0% 0.0% 0.0%
L Total 5.5% 13.0% 12.4% R EMB145 2.1% 9.7% 17.7%
R Total 2.1% 9.7% 17.7% K LEAR25 0.1% 0.1% 0.0% GIIB 0.0% 0.0% 0.0%
K Total 0.2% 0.1% 0.0% T CNA441 1.2% 1.0% 0.9% DHC6 4.5% 1.9% 0.0% DHC8 17.2% 6.3% 0.7% GASEPF 0.0% 0.2% 0.2% HS748A 0.6% 2.3% 1.9% SF340 2.8% 0.5% 0.0%
T Total 26.3% 12.1% 3.7% P BEC58P 1.0% 0.6% 0.5% GASEPV 0.0% 0.2% 0.2%
P Total 1.0% 0.8% 0.7% Grand Total 100.0% 100.0% 100.0%Source: Landrum & Brown, 2005

NY/NJ/PHL Airspace Redesign EIS Aviation Activity Forecasts Report
Landrum & Brown Appendix B September, 2005 Attachment B-6
ABE Current & Future Fleet Mix
Aircraft Category AC Type 2000 2006 2011
M 737300 11.8% 15.4% 2.8% 737400 0.6% 0.0% 0.0% 737500 0.8% 1.5% 0.0% 737700 2.0% 2.3% 11.3% 727EM2 4.0% 0.0% 0.0% 737N17 4.6% 0.0% 0.0% 757PW 0.0% 13.8% 14.8% A319 0.0% 2.3% 5.6% A320 0.0% 1.5% 1.4% DC93LW 0.1% 0.0% 0.0% DC95HW 11.7% 0.0% 0.0% F10065 2.2% 0.0% 0.0% MD83 3.5% 0.0% 0.0%
M Total 41.3% 36.9% 35.9% L CL600 0.1% 6.2% 8.5% CL601 9.1% 21.5% 21.1% GIV 0.1% 0.8% 0.7% LEAR35 0.2% 0.0% 0.0% MU3001 0.0% 3.1% 2.8% FAL20 0.1% 0.0% 0.0%
L Total 9.6% 31.5% 33.1% R EMB145 0.0% 5.4% 16.9% BAE146 2.1% 0.0% 0.0%
R Total 2.1% 5.4% 16.9% K GIIB 0.0% 0.0% 0.0%
K Total 0.0% 0.0% 0.0% T C130 0.9% 0.8% 0.7% CNA441 0.1% 5.4% 7.7% DHC6 17.7% 0.0% 0.0% DHC8 23.3% 13.8% 0.0% GASEPF 1.3% 3.1% 2.8% SF340 2.2% 0.0% 0.0%
T Total 45.5% 23.1% 11.3% P BEC58P 0.1% 2.3% 2.1% GASEPV 1.4% 0.8% 0.7%
P Total 1.4% 3.1% 2.8% Grand Total 100.0% 100.0% 100.0% Source: Landrum & Brown, 2005

NY/NJ/PHL Airspace Redesign EIS Aviation Activity Forecasts Report
Landrum & Brown Appendix B September, 2005 Attachment B-7
HPN Current & Future Fleet Mix
Aircraft Category AC Type 2000 2006 2011
M 737300 0.4% 0.0% 0.0% 737500 6.2% 3.8% 0.0% 737700 0.0% 0.0% 2.3% A319 0.0% 0.0% 2.3% DC95HW 2.8% 0.0% 0.0% F10065 5.1% 4.4% 0.0% MD9025 0.0% 0.0% 4.1%
M Total 14.6% 8.2% 8.8% L CL600 9.8% 26.2% 28.2% CL601 6.1% 10.4% 9.7% GIV 1.1% 6.0% 5.6% LEAR35 0.6% 0.0% 0.0% MU3001 1.6% 7.6% 6.7% FAL20 0.2% 0.0% 0.0%
L Total 19.4% 50.2% 50.1% R EMB145 4.7% 12.3% 29.6% BAE146 8.5% 0.0% 0.0%
R Total 13.2% 12.3% 29.6% K LEAR25 0.0% 0.0% 0.0% GIIB 0.2% 0.0% 0.0%
K Total 0.2% 0.0% 0.0% T CNA441 0.2% 6.6% 7.9% DHC6 22.2% 0.0% 0.0% DHC8 19.8% 3.2% 0.0% GASEPF 0.0% 2.2% 2.1% HS748A 0.0% 12.0% 0.0% SF340 10.1% 3.8% 0.0%
T Total 52.5% 27.8% 10.0% P BEC58P 0.1% 1.6% 1.5% GASEPV 0.0% 0.0% 0.0%
P Total 0.2% 1.6% 1.5% Grand Total 100.0% 100.0% 100.0% Source: Landrum & Brown, 2005

NY/NJ/PHL Airspace Redesign EIS Aviation Activity Forecasts Report
Landrum & Brown Appendix B September, 2005 Attachment B-8
ISP Current & Future Fleet Mix
Aircraft Category AC Type 2000 2006 2011
M 737300 3.5% 11.4% 12.9% 737500 0.0% 3.4% 3.0% 737700 22.1% 29.7% 30.7% 737N17 11.8% 0.0% 0.0% 757PW 0.0% 1.1% 1.5% DC93LW 3.6% 0.0% 0.0% DC95HW 1.2% 0.0% 0.0% MD83 7.1% 0.0% 0.0%
M Total 49.3% 45.7% 48.0% L CL600 0.7% 5.7% 6.4% CL601 10.3% 10.9% 11.9% GIV 0.2% 1.7% 1.5% LEAR35 0.3% 0.0% 0.0% MU3001 0.3% 2.3% 2.0%
L Total 11.8% 20.6% 21.8% R EMB145 3.3% 8.0% 19.8%
R Total 3.3% 8.0% 19.8% K GIIB 0.3% 0.0% 0.0%
K Total 0.3% 0.0% 0.0% T C130 0.0% 0.6% 0.5% CNA441 0.1% 4.6% 5.0% DHC6 8.8% 0.0% 0.0% DHC8 11.4% 10.3% 0.0% GASEPF 0.1% 4.0% 3.5% SF340 14.2% 4.6% 0.0%
T Total 34.6% 24.0% 8.9% P BEC58P 0.1% 1.7% 1.5% GASEPV 0.6% 0.0% 0.0%
P Total 0.7% 1.7% 1.5% Grand Total 100.0% 100.0% 100.0% Source: Landrum & Brown, 2005

NY/NJ/PHL Airspace Redesign EIS Aviation Activity Forecasts Report
Landrum & Brown Appendix B September, 2005 Attachment B-9
TEB Current & Future Fleet Mix
Aircraft Category AC Type 2000 2006 2011
M 737300 0.0% 0.0% 0.0% 737400 0.0% 0.0% 0.0% 737700 0.0% 0.0% 0.0% 737N17 0.0% 0.0% 0.0% DC93LW 0.0% 0.0% 0.0% DC95HW 0.0% 0.0% 0.0% BAC111 0.0% 0.0% 0.0%
M Total 0.1% 0.0% 0.0% L CL600 35.4% 36.9% 38.5% GIV 7.2% 8.9% 8.8% LEAR35 10.7% 10.9% 14.1% MU3001 14.9% 9.6% 8.4% FAL20 6.4% 0.0% 0.0%
L Total 74.6% 66.2% 69.9% R BAE146 0.0% 0.0% 0.0%
R Total 0.0% 0.0% 0.0% K LEAR25 0.8% 0.0% 0.0% GIIB 6.0% 0.0% 0.0%
K Total 6.9% 0.0% 0.0% T CNA441 7.1% 6.9% 6.1% DHC6 0.1% 0.2% 0.2% GASEPF 0.9% 14.4% 12.8%
T Total 8.0% 21.6% 19.1% P BEC58P 8.6% 10.4% 9.4% GASEPV 1.7% 1.8% 1.6%
P Total 10.3% 12.2% 11.0% Grand Total 100.0% 100.0% 100.0% Source: Landrum & Brown, 2005

NY/NJ/PHL Airspace Redesign EIS Aviation Activity Forecasts Report
Landrum & Brown Appendix B September, 2005 Attachment B-10
ACY Current & Future Fleet Mix Aircraft
Category AC Type 2000 2006 2011 H 74720B 0.0% 0.0% 0.0% A300 0.0% 0.0% 0.0% A310 0.1% 0.0% 0.0% A330 0.0% 0.0% 0.0% DC1030 0.2% 0.0% 0.0% KC135R 0.0% 0.0% 0.0%
H Total 0.4% 0.0% 0.0% M 737300 0.0% 0.0% 0.0% 737400 0.0% 0.0% 0.0% 737700 0.1% 0.0% 0.0% 727EM2 0.5% 0.0% 0.0% 737N17 6.1% 0.0% 0.0% 757PW 0.3% 16.0% 16.9% DC93LW 22.1% 0.0% 0.0% F10065 0.0% 0.0% 0.0% MD83 7.3% 24.0% 22.9%
M Total 36.4% 40.0% 39.8% L CL600 4.5% 8.0% 9.6% CL601 0.3% 10.7% 9.6% GIV 0.6% 0.0% 0.0% LEAR35 3.3% 0.0% 0.0% MU3001 3.6% 4.0% 3.6% FAL20 0.4% 0.0% 0.0% A7D 1.1% 0.0% 0.0% IA1125 0.0% 0.0% 0.0%
L Total 13.8% 22.7% 22.9%
Aircraft Category AC Type 2000 2006 2011 R EMB145 0.0% 0.0% 0.0%
R Total 0.0% 0.0% 0.0% K LEAR25 1.7% 0.0% 0.0% GIIB 0.6% 0.0% 0.0%
K Total 2.3% 0.0% 0.0% T C130 1.7% 8.0% 7.2% CNA441 10.3% 12.0% 14.5% DHC6 23.1% 0.0% 0.0% DHC8 0.2% 0.0% 0.0% GASEPF 0.0% 4.0% 3.6% HS748A 0.2% 8.0% 7.2% SD330 0.6% 0.0% 0.0% SF340 0.6% 0.0% 0.0% CVR580 0.0% 0.0% 0.0%
T Total 36.7% 32.0% 32.5% P BEC58P 4.4% 5.3% 4.8% GASEPV 6.0% 0.0% 0.0%
P Total 10.4% 5.3% 4.8% Grand Total 100.0% 100.0% 100.0%Source: Landrum & Brown, 2005

NY/NJ/PHL Airspace Redesign EIS Aviation Activity Forecasts Report
Landrum & Brown Appendix B September, 2005 Attachment B-11
BDR Current & Future Fleet Mix
Aircraft Category AC Type 2000 2006 2011
M DC93LW 0.1% 0.0% 0.0% M Total 0.1% 0.0% 0.0%
L CL600 20.3% 29.2% 30.8% GIV 3.5% 4.2% 3.8% LEAR35 4.1% 0.0% 0.0% MU3001 12.9% 16.7% 15.4% FAL20 1.4% 0.0% 0.0% IA1125 0.1% 0.0% 0.0%
L Total 42.3% 50.0% 50.0% R BAE146 0.1% 0.0% 0.0%
R Total 0.1% 0.0% 0.0% K LEAR25 1.2% 0.0% 0.0% GIIB 2.5% 0.0% 0.0%
K Total 3.7% 0.0% 0.0% T CNA441 13.4% 16.7% 19.2% DHC6 0.6% 0.0% 0.0% DHC8 0.1% 0.0% 0.0% GASEPF 3.9% 12.5% 11.5% HS748A 0.2% 0.0% 0.0% SF340 0.1% 0.0% 0.0%
T Total 18.2% 29.2% 30.8% P BEC58P 11.5% 16.7% 15.4% GASEPV 24.2% 4.2% 3.8%
P Total 35.6% 20.8% 19.2% Grand Total 100.0% 100.0% 100.0% Source: Landrum & Brown, 2005

NY/NJ/PHL Airspace Redesign EIS Aviation Activity Forecasts Report
Landrum & Brown Appendix B September, 2005 Attachment B-12
CDW Current & Future Fleet Mix
Aircraft Category AC Type 2000 2006 2011
L LEAR35 0.2% 0.0% 0.0% MU3001 2.5% 6.7% 6.7%
L Total 2.7% 6.7% 6.7% K LEAR25 0.2% 0.0% 0.0%
K Total 0.2% 0.0% 0.0% T CNA441 10.6% 20.0% 20.0% DHC6 0.4% 0.0% 0.0% GASEPF 1.3% 46.7% 40.0%
T Total 12.3% 66.7% 60.0% P BEC58P 35.2% 26.7% 26.7% GASEPV 49.6% 0.0% 6.7%
P Total 84.8% 26.7% 33.3% Grand Total 100.0% 100.0% 100.0% Source: Landrum & Brown, 2005

NY/NJ/PHL Airspace Redesign EIS Aviation Activity Forecasts Report
Landrum & Brown Appendix B September, 2005 Attachment B-13
FOK Current & Future Fleet Mix
Aircraft Category AC Type 2000 2006 2011
M 727EM2 0.3% 0.0% 0.0% M Total 0.3% 0.0% 0.0%
L CL600 30.5% 75.0% 75.0% CL601 0.1% 0.0% 0.0% GIV 8.1% 0.0% 0.0% LEAR35 5.5% 0.0% 0.0% MU3001 14.0% 0.0% 0.0% FAL20 2.7% 0.0% 0.0% A7D 0.1% 0.0% 0.0%
L Total 60.9% 75.0% 75.0% K LEAR25 1.0% 0.0% 0.0% GIIB 5.5% 0.0% 0.0%
K Total 6.5% 0.0% 0.0% T C130 4.9% 25.0% 25.0% CNA441 7.6% 0.0% 0.0% DHC6 3.2% 0.0% 0.0% GASEPF 1.1% 0.0% 0.0%
T Total 16.9% 25.0% 25.0% P BEC58P 7.8% 0.0% 0.0% GASEPV 7.6% 0.0% 0.0%
P Total 15.4% 0.0% 0.0% Grand Total 100.0% 100.0% 100.0% Source: Landrum & Brown, 2005

NY/NJ/PHL Airspace Redesign EIS Aviation Activity Forecasts Report
Landrum & Brown Appendix B September, 2005 Attachment B-14
FRG Current & Future Fleet Mix
Aircraft Category AC Type 2000 2006 2011
M 737300 0.1% 0.0% 0.0% 737400 0.1% 0.0% 0.0% 737700 0.0% 0.0% 0.0% 727EM2 0.2% 0.0% 0.0% 737N17 0.1% 0.0% 0.0% A320 0.0% 0.0% 0.0% DC93LW 0.1% 0.0% 0.0% DC95HW 0.2% 0.0% 0.0%
M Total 0.7% 0.0% 0.0% L CL600 14.1% 33.9% 35.0% GIV 4.1% 5.4% 5.0% LEAR35 5.4% 0.0% 0.0% MU3001 8.2% 12.5% 13.3% FAL20 3.2% 0.0% 0.0% CNA500 0.0% 0.0% 0.0%
L Total 35.1% 51.8% 53.3% K LEAR25 3.6% 0.0% 0.0% GIIB 3.0% 0.0% 0.0%
K Total 6.6% 0.0% 0.0% T CNA441 9.2% 16.1% 16.7% DHC6 5.7% 0.0% 0.0% DHC8 0.0% 0.0% 0.0% GASEPF 0.7% 14.3% 13.3% HS748A 0.0% 0.0% 0.0% SD330 0.4% 0.0% 0.0% SF340 0.0% 0.0% 0.0%
T Total 16.0% 30.4% 30.0% P BEC58P 23.5% 17.9% 16.7% GASEPV 18.1% 0.0% 0.0%
P Total 41.6% 17.9% 16.7% Grand Total 100.0% 100.0% 100.0% Source: Landrum & Brown, 2005

NY/NJ/PHL Airspace Redesign EIS Aviation Activity Forecasts Report
Landrum & Brown Appendix B September, 2005 Attachment B-15
HVN Current & Future Fleet Mix
Aircraft Category AC Type 2000 2006 2011
M DC93LW 0.1% 0.0% 0.0% M Total 0.1% 0.0% 0.0%
L CL600 7.2% 16.7% 15.4% GIV 0.3% 0.0% 0.0% LEAR35 2.8% 0.0% 0.0% MU3001 6.7% 4.2% 3.8% FAL20 2.0% 0.0% 0.0%
L Total 19.0% 20.8% 19.2% R EMB145 0.0% 29.2% 61.5%
R Total 0.0% 29.2% 61.5% K LEAR25 0.5% 0.0% 0.0% GIIB 0.9% 0.0% 0.0%
K Total 1.4% 0.0% 0.0% T CNA441 5.9% 4.2% 3.8% DHC6 0.3% 0.0% 0.0% DHC8 58.6% 29.2% 0.0% GASEPF 0.7% 12.5% 11.5%
T Total 65.4% 45.8% 15.4% P BEC58P 6.5% 4.2% 3.8% GASEPV 7.7% 0.0% 0.0%
P Total 14.2% 4.2% 3.8% Grand Total 100.0% 100.0% 100.0% Source: Landrum & Brown, 2005

NY/NJ/PHL Airspace Redesign EIS Aviation Activity Forecasts Report
Landrum & Brown Appendix B September, 2005 Attachment B-16
ILG Current & Future Fleet Mix
Aircraft Category AC Type 2000 2006 2011
H DC870 0.1% 0.0% 0.0% H Total 0.1% 0.0% 0.0%
M 727EM2 0.1% 0.0% 0.0% DC93LW 0.1% 0.0% 0.0%
M Total 0.2% 0.0% 0.0% L CL600 25.2% 43.1% 45.2% CL601 0.0% 0.0% 0.0% GIV 5.0% 4.2% 3.6% LEAR35 8.9% 6.9% 6.0% MU3001 5.7% 8.3% 7.1% FAL20 6.4% 0.0% 0.0% IA1125 0.1% 0.0% 0.0%
L Total 51.4% 62.5% 61.9% K LEAR25 3.2% 0.0% 0.0% GIIB 7.7% 0.0% 0.0%
K Total 11.0% 0.0% 0.0% T C130 2.6% 4.2% 3.6% CNA441 11.0% 12.5% 15.5% DHC6 0.7% 0.0% 0.0% DHC8 3.0% 0.0% 0.0% GASEPF 2.7% 6.9% 6.0% HS748A 0.1% 0.0% 0.0% CVR580 0.4% 0.0% 0.0% L188 0.1% 0.0% 0.0%
T Total 20.6% 23.6% 25.0% P BEC58P 6.8% 11.1% 10.7% GASEPV 10.1% 2.8% 2.4%
P Total 16.8% 13.9% 13.1% Grand Total 100.0% 100.0% 100.0% Source: Landrum & Brown, 2005

NY/NJ/PHL Airspace Redesign EIS Aviation Activity Forecasts Report
Landrum & Brown Appendix B September, 2005 Attachment B-17
LDJ Current & Future Fleet Mix
Aircraft Category AC Type 2000 2006 2011
L CL600 1.5% 0.0% 0.0% MU3001 3.1% 0.0% 0.0%
L Total 4.6% 0.0% 0.0% T CNA441 11.7% 0.0% 0.0% DHC6 1.5% 0.0% 0.0% GASEPF 0.7% 100.0% 100.0%
T Total 14.0% 100.0% 100.0% P BEC58P 32.2% 0.0% 0.0% GASEPV 49.1% 0.0% 0.0%
P Total 81.4% 0.0% 0.0% Grand Total 100.0% 100.0% 100.0% Source: Landrum & Brown, 2005

NY/NJ/PHL Airspace Redesign EIS Aviation Activity Forecasts Report
Landrum & Brown Appendix B September, 2005 Attachment B-18
MMU Current & Future Fleet Mix
Aircraft Category AC Type 2000 2006 2011
M 737N17 0.0% 0.0% 0.0% M Total 0.0% 0.0% 0.0%
L CL600 30.0% 43.6% 44.4% CL601 0.0% 0.0% 0.0% GIV 10.1% 9.1% 8.1% LEAR35 7.5% 0.0% 0.0% MU3001 12.5% 13.6% 12.1% FAL20 4.1% 0.0% 0.0% IA1125 0.0% 0.0% 0.0%
L Total 64.1% 66.4% 64.5% K LEAR25 0.9% 0.0% 0.0% GIIB 3.2% 0.0% 0.0%
K Total 4.1% 0.0% 0.0% T CNA441 8.5% 12.7% 16.1% DHC6 0.4% 0.0% 0.0% GASEPF 0.3% 6.4% 5.6% HS748A 0.3% 0.0% 0.0% SF340 2.8% 0.0% 0.0%
T Total 12.3% 19.1% 21.8% P BEC58P 8.6% 14.5% 13.7% GASEPV 10.9% 0.0% 0.0%
P Total 19.4% 14.5% 13.7% Grand Total 100.0% 100.0% 100.0% Source: Landrum & Brown, 2005

NY/NJ/PHL Airspace Redesign EIS Aviation Activity Forecasts Report
Landrum & Brown Appendix B September, 2005 Attachment B-19
PNE Current & Future Fleet Mix
Aircraft Category AC Type 2000 2006 2011
L CL600 13.7% 22.0% 26.7% GIV 3.0% 2.4% 2.2% LEAR35 8.0% 0.0% 0.0% MU3001 11.6% 12.2% 11.1% FAL20 2.1% 0.0% 0.0%
L Total 38.5% 36.6% 40.0% K LEAR25 1.6% 0.0% 0.0% GIIB 0.5% 0.0% 0.0%
K Total 2.1% 0.0% 0.0% T CNA441 17.6% 22.0% 22.2% DHC6 0.8% 0.0% 0.0% GASEPF 0.4% 12.2% 11.1% HS748A 0.3% 0.0% 0.0%
T Total 19.1% 34.1% 33.3% P BEC58P 21.2% 29.3% 26.7% GASEPV 19.0% 0.0% 0.0%
P Total 40.2% 29.3% 26.7% Grand Total 100.0% 100.0% 100.0% Source: Landrum & Brown, 2005

NY/NJ/PHL Airspace Redesign EIS Aviation Activity Forecasts Report
Landrum & Brown Appendix B September, 2005 Attachment B-20
SWF Current & Future Fleet Mix
Aircraft Category AC Type 2000 2006 2011
H 74720B 0.7% 0.0% 0.0% DC870 4.0% 5.4% 4.0% KC135 0.0% 2.7% 2.7% 707QN 0.4% 0.0% 0.0%
H Total 5.1% 8.1% 6.7% M 737700 0.0% 0.0% 17.4% 727EM2 2.6% 1.8% 1.3% 757PW 0.9% 14.4% 14.1% DC93LW 0.1% 0.0% 0.0% DC95HW 4.3% 2.7% 2.0% F10065 12.1% 3.6% 0.0% MD9025 0.0% 7.2% 8.1%
M Total 20.0% 29.7% 43.0% L CL600 1.1% 7.2% 8.1% CL601 42.6% 32.4% 26.8% GIV 1.5% 2.7% 2.0% LEAR35 0.0% 0.0% 0.0% MU3001 1.1% 4.5% 3.4% FAL20 0.0% 0.0% 0.0%
L Total 46.4% 46.8% 40.3% K LEAR25 0.1% 0.0% 0.0% GIIB 0.0% 0.0% 0.0%
K Total 0.1% 0.0% 0.0% T C130 0.2% 0.0% 0.0% CNA441 0.2% 5.4% 5.4% DHC6 9.3% 0.0% 0.0% DHC8 8.2% 0.0% 0.0% GASEPF 0.0% 2.7% 2.0% SF340 7.8% 3.6% 0.0%
T Total 25.7% 11.7% 7.4% P BEC58P 2.0% 3.6% 2.7% GASEPV 0.8% 0.0% 0.0%
P Total 2.8% 3.6% 2.7% Grand Total 100.0% 100.0% 100.0% Source: Landrum & Brown, 2005
NY/NJ/PHL Airspace Redesign EIS Aviation Activity Forecasts Report
Landrum & Brown Appendix B September, 2005 Attachment B-21
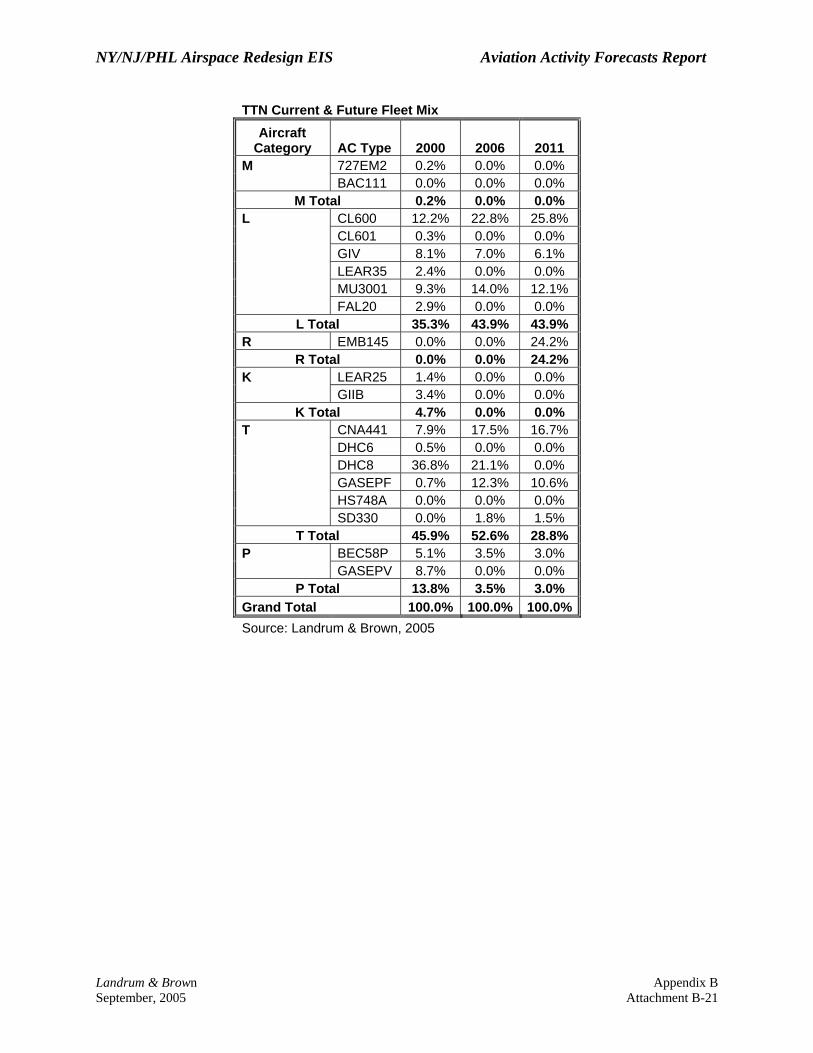
TTN Current & Future Fleet Mix
Aircraft Category AC Type 2000 2006 2011
M 727EM2 0.2% 0.0% 0.0% BAC111 0.0% 0.0% 0.0%
M Total 0.2% 0.0% 0.0% L CL600 12.2% 22.8% 25.8% CL601 0.3% 0.0% 0.0% GIV 8.1% 7.0% 6.1% LEAR35 2.4% 0.0% 0.0% MU3001 9.3% 14.0% 12.1% FAL20 2.9% 0.0% 0.0%
L Total 35.3% 43.9% 43.9% R EMB145 0.0% 0.0% 24.2%
R Total 0.0% 0.0% 24.2% K LEAR25 1.4% 0.0% 0.0% GIIB 3.4% 0.0% 0.0%
K Total 4.7% 0.0% 0.0% T CNA441 7.9% 17.5% 16.7% DHC6 0.5% 0.0% 0.0% DHC8 36.8% 21.1% 0.0% GASEPF 0.7% 12.3% 10.6% HS748A 0.0% 0.0% 0.0% SD330 0.0% 1.8% 1.5%
T Total 45.9% 52.6% 28.8% P BEC58P 5.1% 3.5% 3.0% GASEPV 8.7% 0.0% 0.0%
P Total 13.8% 3.5% 3.0% Grand Total 100.0% 100.0% 100.0% Source: Landrum & Brown, 2005

B.2
A Comparative Analysis of the NY/NJ/PHL Forecast and 2005 Actual Traffic

MP 06W0000086
MITRE PRODUCT
A Comparative Analysis of the NY/NJ/PHL Forecast and 2005 Actual Traffic
April 2006
Arlene M. Cooper Heather L. Danner Dr. Jonathan H. Hoffman
Sponsor: Federal Aviation Administration Contract No.: DTFA01-01-C-00001 Dept. No.: F063 Project No.: 0206F806-N1 The views, opinions and/or findings contained in this report are those of The MITRE Corporation and should not be construed as an official Government position, policy, or decision, unless designated by other documentation.
This document was prepared for authorized distribution only. It has not been approved for public release.
2006 The MITRE Corporation. All Rights Reserved.
Center for Advanced Aviation System Development McLean, Virginia
2007 The MITRE Corporation. All rights reserved.

iii
Abstract The air traffic demand used for the New York/New Jersey/ Philadelphia (NY/NJ/PHL) Metropolitan Area Airspace Redesign operational analysis is a forecast of air traffic in 2006 and 2011 extrapolated from observed operations in 2000. Since that year, unanticipated changes in airline schedules and fleet mix have occurred as the airline industry struggles to maintain profitability in a chaotic economy. Due to the potential changes in the NY/NJ/PHL schedule and fleet mix from 2000, it is necessary to investigate the implications of these changes on the forecast traffic and the associated impact these changes may have on the conclusions of the operational analysis. This paper describes a comparative analysis of the forecast traffic based on 2000 traffic data with more recent traffic (either current traffic or a more recent forecast). Based on the analysis, the forecasts used in the NJ/NY/PHL Metropolitan Area Airspace Redesign are accurate in that any differences found with the more recent traffic data would not change the conclusions of the operational analysis.
Keywords: Airspace, Airspace Redesign, Fleet Mix, Forecast, Traffic
2007 The MITRE Corporation. All rights reserved.

iii
Acknowledgments The authors would like to thank Carol Branscome, John Kuchenbrod, and Brian Simmons for their detailed reviews of this document. Special thanks also to Angela Signore for her editing and preparation of the document for final publication.
2007 The MITRE Corporation. All rights reserved.

2007 The MITRE Corporation. All rights reserved.

v
Table of Contents 1 Introduction 1
2 Results 3 Observed Annual Average Day 2005 vs. Forecast 3
Traffic Counts Comparison 3
Hourly Throughput Comparison 3
Origin-Destination Comparison 13
Overflights 24
90th Percentile Day 2005 vs. Forecast 26
Origin-Destination Comparison 36
Fleet Mix Comparison 40
Overflights 48
PHL Annual Average Day 2012 vs. 2011 Forecast 49
Traffic Counts Comparison 49
Hourly Throughput Comparison 49
Origin-Destination Comparison 51
Fleet Mix Comparison 54
3 Discussion 56 Features of the Forecast that are Essentially Correct 56
Trends Leading to Inaccuracies in the Forecast 56
PHL 2011 Comparison with the CEP Forecast 57
Conclusions 57
Glossary 56
2007 The MITRE Corporation. All rights reserved.

vi
List of Figures 1. Observed 2005 vs. Forecast Annual Average Day Total Traffic Counts by Airport 3
2. EWR AAD Arrivals by Hour 4
3. EWR AAD Departures by Hour 4
4. JFK AAD Arrivals by Hour 5
5. JFK AAD Departures by Hour 5
6. LGA AAD Arrivals by Hour 6
7. LGA AAD Departures by Hours 6
8. PHL AAD Arrivals by Hour 7
9. PHL AAD Departures by Hour 7
10. PHL OAG Arrival Data 8
11. PHL OAG Departure Data 8
12. TEB AAD Arrivals by Hour 9
13. TEB AAD Departures by Hour 9
14. HPN AAD Arrivals by Hour 10
15. HPN AAD Departures by Hour 10
16. ISP AAD Arrivals by Hour 11
17. ISP AAD Departures by Hour 11
18. MMU AAD Arrivals by Hour 12
19. MMU AAD Departures by Hour 12
20. O-D, OEP Major Airport AAD Arrivals to NY 13
21. O-D, AAD Arrivals to NY (Non-OEP 35) 14
22. O-D, OEP Major Airport AAD Departures from NY 15
23. O-D, AAD Departures from NY 16
24. EWR AAD Fleet Mix Distribution 17
25. JFK AAD Fleet Mix Distribution 18
26. LGA AAD Fleet Mix Distribution 19
27. PHL AAD Fleet Mix Distribution 20
2007 The MITRE Corporation. All rights reserved.

vii
28. TEB AAD Fleet Mix Distribution 21
29. HPN AAD Fleet Mix Distribution 22
30. ISP AAD Fleet Mix Distribution 23
31. MMU AAD Fleet Mix Distribution 24
32. ZNY Jet Airways 25
33. AAD 2005 and Forecast ZNY Overflights 26
34. 2005 vs. Forecast 90th Percentile Day total Traffic Counts by Airport 27
35. EWR 90th Percentile Day Arrivals by Hour 28
36. EWR 90th Percentile Day Departures by Hour 28
37. JFK 90th Percentile Day Arrivals by Hour 29
38. JFK 90th Percentile Day Departures by Hour 29
39. LGA 90th Percentile Day Arrivals by Hour 30
40. LGA 90th Percentile Day Departures by Hour 30
41. PHL 90th Percentile Day Arrivals by Hour 31
42. PHL 90th Percentile Day Departures by Hour 31
43. TEB 90th Percentile Day Arrivals by Hour 32
44. TEB 90th Percentile Day Departures by Hour 32
45. HPN 90th Percentile Day Arrivals by Hour 33
46. HPN 90th Percentile Day Departures by Hour 33
47. ISP 90th Percentile Day Arrivals by Hour 34
48. ISP 90th Percentile Day Departures by Hour 34
49. MMU 90th Percentile Day Arrivals by Hour 35
50. MMU 90th Percentile Day Departures by Hour 35
51. O-D, OEP Major Airport 90th Percentile Day Arrivals to NY 37
52. O-D, 90th Percentile Day Arrivals to NY (Non-OEP 35) 38
53. O-D, OEP Major Airport 90th Percentile Day Departures from NY 39
54. O-D, 90th Percentile Day Departures from NY (Non-OEP 35) 40
55. EWR 90th Percentile Day Fleet Mix Distribution 41
56. JFK 90th Percentile Day Fleet Mix Distribution 42
2007 The MITRE Corporation. All rights reserved.

viii
57. LGA 90th Percentile Day Fleet Mix Distribution 43
58. PHL 90th Percentile Day Fleet Mix Distribution 44
59. TEB 90th Percentile Day Fleet Mix Distribution 45
60. HPN 90th Percentile Day Fleet Mix Distribution 46
61. ISP 90th Percentile Day Fleet Mix Distribution 47
62. MMU 90th Percentile Day Fleet Mix Distribution 48
63. 90th Percentile Day 2005 and Forecast ZNY Overflights 49
64. PHL 2011 vs. 2012 AAD Arrivals by Hour 50
65. PHL 2011 vs. 2012 AAD Departures by Hour 50
66. O-D, OEP Major Airport AAD Arrivals to PHL 51
67. O-D, AAD Arrivals to PHL (Non-OEP 35) 52
68. O-D, OEP Major Airport AAD Departures from PHL 53
69. O-D, AAD Departures from PHL (Non-OEP 35) 54
70. PHL 2011 vs. 2012 AAD Fleet Mix Distribution 55
2007 The MITRE Corporation. All rights reserved.

1
1 Introduction Background The air traffic demand used for the New York/New Jersey/ Philadelphia (NY/NJ/PHL) Metropolitan Area Airspace Redesign operational analysis1 is a forecast of air traffic in 2006 and 2011 extrapolated from observed operations in 2000. Since 2000, unanticipated changes in airline schedules and fleet mix have occurred. These changes could affect the composition of the traffic in terms of traffic levels, schedule, and fleet mix and potentially impact the results of the operational analysis.
The ongoing restructuring in the airline industry has led to changes in schedule and fleet mix used on many routes. In some cases, airline schedules have changed to allow for a more constant flow of traffic throughout the day rather than a clustering of flights during certain times of the day. The need to reduce operating costs has resulted in the retirement of older, less efficient aircraft. Customer demand for increased frequency of service, combined with the retirement of older aircraft, has led to the replacement of many large narrowbody and widebody jets with regional jets (RJs).
Due to the potential changes in the NY/NJ/PHL schedule and fleet mix from 2000, it is necessary to investigate the implications of these changes on the forecast traffic and the associated impact these changes may have on the conclusions of the operational analysis. This paper describes a comparative analysis of the forecast traffic based on 2000 traffic data with more recent traffic (either current traffic or a more recent forecast) for the eight airports included in the NY/NJ/PHL Metropolitan Area Airspace Redesign: Newark Liberty International (EWR), John F. Kennedy International (JFK), LaGuardia (LGA), Philadelphia International (PHL), Teterboro (TEB), Westchester County (HPN), Long Island MacArthur (ISP), and Morristown Municipal (MMU). It includes a comparison of:
• The 2006 annual average day (AAD) forecast and an observed AAD in 2005,
• The 2006 90th percentile day forecast and the observed 90th percentile day in 2005, and
• The PHL 2011 AAD forecast and the 2012 AAD forecast used for the Capacity Enhancement Plan (CEP)
The analysis compares the following metrics:
• Traffic counts by each of the eight airports included in the NY/NJ/PHL Metropolitan Area Airspace Redesign
• Hourly arrivals and departures
1 Boan, et al., 2005, NY/NJ/PHL Metropolitan Area Airspace Redesign, MP050000090.
2007 The MITRE Corporation. All rights reserved.

2
• Origin-Destination (O-D) distribution for each of the eight airports
• Fleet mix
A previous analysis2 investigated the distribution of RJs and jumbo jets in the 2006 and 2011 forecast traffic, comparing them to 2004 Official Airline Guide (OAG) data. This study updates and augments the previous study by using more recent actual data, including a more in-depth analysis of the fleet mix, and covering more metrics including traffic counts, hourly throughput, O-D data, and overflights.
Approach The approach used to compare the forecast traffic with current air traffic includes the following steps:
1. Identify the annual average and 90th percentile days for each airport in 2005 to be compared to the AAD and 90th percentile forecast traffic, respectively. The Operational Network (OPSNET) Instrument Operations data for each airport for 2005 was used for this purpose.
2. Obtain Enhanced Traffic Management System (ETMS) flight data for the AAD and 90th percentile days identified for each of the eight airports.
3. Analyze and compare the ETMS data to the equivalent forecast traffic in terms of the traffic counts, hourly arrivals and departures, origin-destination, and fleet mix.
Initially, it was assumed that the dates for the AAD and 90th percentile days for 2005 would be the same for the eight airports. Upon further analysis of the data, this was not the case. What appeared to be the AAD and the 90th percentile day for the sum of the flight counts for the eight airports did not show the same relationship on an airport-by-airport basis. In other words, there were cases where what was selected as the AAD and 90th percentile days for 2005 for the eight airports combined, resulted in the AAD for a specific airport having higher counts than the 90th percentile day for that same airport. Though this situation was unexpected, it did not affect nor detract from the results of this analysis.
2 Ibid., Appendix B: Traffic Sensitivity Analysis.
2007 The MITRE Corporation. All rights reserved.

3
2 Results Observed Annual Average Day 2005 vs. Forecast
Traffic Counts Comparison The annual average day traffic count comparison for each airport is provided in Figure 1.
0
200
400
600
800
1000
1200
1400
1600
EWR JFK LGA PHL HPN ISP TEB MMU
2005 Total Forecast Total Figure 1. Observed 2005 vs. Forecast Annual Average Day Total
Traffic Counts by Airport The forecast traffic counts are higher than the actual 2005 traffic for EWR (+14%), JFK (+17%), PHL (+13%), and ISP (+39%); while they are lower for LGA (-4%), HPN (-24%), and TEB (-13%). The MMU forecast traffic counts are about the same as the actual 2005 traffic counts. Overall, the forecast has approximately 6% more flights than the 2005 traffic.
Hourly Throughput Comparison A comparison of the hourly arrival and departure throughput for each airport is found in Figures 2 through 19.
2007 The MITRE Corporation. All rights reserved.

4
0
10
20
30
40
50
60
0 1 2 3 4 5 6 7 8 9 10 11 12 13 14 15 16 17 18 19 20 21 22 23
Hour
Num
ber o
f Flig
hts
EWR Arr AAD 2005 EWR Arr AAD Forecast Figure 2. EWR AAD Arrivals by Hour
0
10
20
30
40
50
60
0 1 2 3 4 5 6 7 8 9 10 11 12 13 14 15 16 17 18 19 20 21 22 23
Hour
Num
ber o
f Flig
hts
EWR Dep AAD 2005 EWR Dep AAD Forecast Figure 3. EWR AAD Departures by Hour
2007 The MITRE Corporation. All rights reserved.

5
The EWR throughput curves show similar hourly trends with the differences between the 2005 traffic and the forecast being due to the previously discussed difference in the traffic counts.
0
10
20
30
40
50
60
0 1 2 3 4 5 6 7 8 9 10 11 12 13 14 15 16 17 18 19 20 21 22 23
Hour
Num
ber o
f Flig
hts
JFK Arr AAD 2005 JFK Arr AAD Forecast Figure 4. JFK AAD Arrivals by Hour
0
10
20
30
40
50
60
0 1 2 3 4 5 6 7 8 9 10 11 12 13 14 15 16 17 18 19 20 21 22 23
Hour
Num
ber o
f Flig
hts
JFK Dep AAD 2005 JFK Dep AAD Forecast Figure 5. JFK AAD Departures by Hour
The JFK throughput curves show similar hourly trends with the differences between the 2005 traffic and the forecast being due to the previously discussed difference in the traffic counts.
2007 The MITRE Corporation. All rights reserved.

6
0
10
20
30
40
50
0 1 2 3 4 5 6 7 8 9 10 11 12 13 14 15 16 17 18 19 20 21 22 23
Hour
Num
ber o
f Flig
hts
LGA Arr AAD 2005 LGA Arr AAD Forecast Figure 6. LGA AAD Arrivals by Hour
0
10
20
30
40
50
0 1 2 3 4 5 6 7 8 9 10 11 12 13 14 15 16 17 18 19 20 21 22 23
Hour
Num
ber o
f Flig
hts
LGA Dep AAD 2005 LGA Dep AAD Forecast Figure 7. LGA AAD Departures by Hours
The LGA throughput curves show similar hourly trends with some differences seen in the arrival and departure peaks at the end of the day for the forecast traffic.
2007 The MITRE Corporation. All rights reserved.
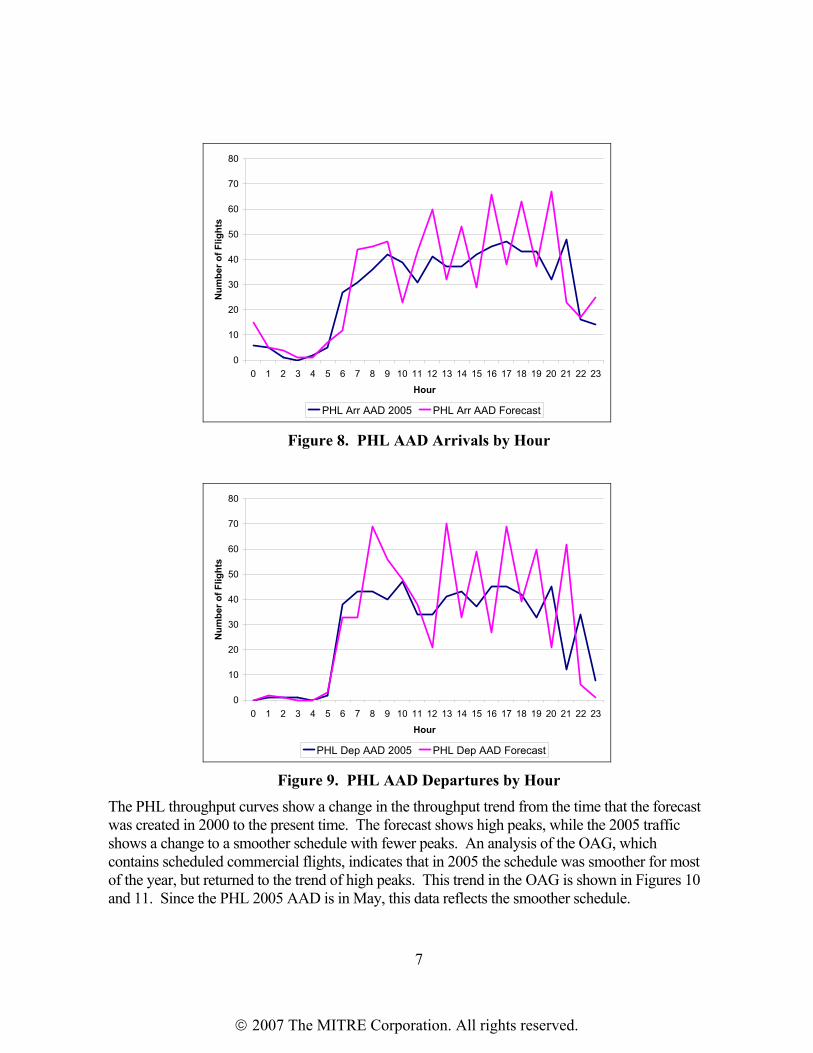
7
0
10
20
30
40
50
60
70
80
0 1 2 3 4 5 6 7 8 9 10 11 12 13 14 15 16 17 18 19 20 21 22 23
Hour
Num
ber o
f Flig
hts
PHL Arr AAD 2005 PHL Arr AAD Forecast Figure 8. PHL AAD Arrivals by Hour
0
10
20
30
40
50
60
70
80
0 1 2 3 4 5 6 7 8 9 10 11 12 13 14 15 16 17 18 19 20 21 22 23
Hour
Num
ber o
f Flig
hts
PHL Dep AAD 2005 PHL Dep AAD Forecast Figure 9. PHL AAD Departures by Hour
The PHL throughput curves show a change in the throughput trend from the time that the forecast was created in 2000 to the present time. The forecast shows high peaks, while the 2005 traffic shows a change to a smoother schedule with fewer peaks. An analysis of the OAG, which contains scheduled commercial flights, indicates that in 2005 the schedule was smoother for most of the year, but returned to the trend of high peaks. This trend in the OAG is shown in Figures 10 and 11. Since the PHL 2005 AAD is in May, this data reflects the smoother schedule.
2007 The MITRE Corporation. All rights reserved.

8
0
10
20
30
40
50
60
70
0 1 2 3 4 5 6 7 8 9 10 11 12 13 14 15 16 17 18 19 20 21 22 23
Hour
Num
ber o
f Flig
hts
PHL OAG Arr (May 2005) PHL OAG Arr (Dec 2005) Figure 10. PHL OAG Arrival Data
0
10
20
30
40
50
60
70
0 1 2 3 4 5 6 7 8 9 10 11 12 13 14 15 16 17 18 19 20 21 22 23
Hour
Num
ber o
f Flig
hts
PHL OAG Dep (May 2005) PHL OAG Dep (Dec 2005) Figure 11. PHL OAG Departure Data
2007 The MITRE Corporation. All rights reserved.

9
0
5
10
15
20
25
30
35
0 1 2 3 4 5 6 7 8 9 10 11 12 13 14 15 16 17 18 19 20 21 22 23
Hour
Num
ber o
f Flig
hts
TEB Arr AAD 2005 TEB Arr AAD Forecast Figure 12. TEB AAD Arrivals by Hour
0
5
10
15
20
25
30
35
0 1 2 3 4 5 6 7 8 9 10 11 12 13 14 15 16 17 18 19 20 21 22 23
Hour
Num
ber o
f Flig
hts
TEB Dep AAD 2005 TEB Dep AAD Forecast Figure 13. TEB AAD Departures by Hour
The TEB throughput curves show some variation in peak times and traffic counts between the 2005 traffic and the forecast. The main difference for arrivals occurs between the hours of 10 and 13, while the departures show more variation throughout the day.
2007 The MITRE Corporation. All rights reserved.

10
0
5
10
15
20
25
0 1 2 3 4 5 6 7 8 9 10 11 12 13 14 15 16 17 18 19 20 21 22 23
Hour
Num
ber o
f Flig
hts
HPN Arr AAD 2005 HPN Arr AAD Forecast Figure 14. HPN AAD Arrivals by Hour
0
5
10
15
20
25
0 1 2 3 4 5 6 7 8 9 10 11 12 13 14 15 16 17 18 19 20 21 22 23
Hour
Num
ber o
f Flig
hts
HPN Dep AAD 2005 HPN Dep AAD Forecast Figure 15. HPN AAD Departures by Hour
The HPN throughput curves show similar hourly trends with the differences between the 2005 traffic and the forecast being due to the difference in the total traffic counts. The shortfall in the forecast is particularly obvious for departures in the morning hours.
2007 The MITRE Corporation. All rights reserved.

11
0
2
4
6
8
10
12
14
0 1 2 3 4 5 6 7 8 9 10 11 12 13 14 15 16 17 18 19 20 21 22 23
Hour
Num
ber o
f Flig
hts
ISP Arr AAD 2005 ISP Arr AAD Forecast Figure 16. ISP AAD Arrivals by Hour
0
2
4
6
8
10
12
14
0 1 2 3 4 5 6 7 8 9 10 11 12 13 14 15 16 17 18 19 20 21 22 23
Hour
Num
ber o
f Flig
hts
ISP Dep AAD 2005 ISP Dep AAD Forecast Figure 17. ISP AAD Departures by Hour
The ISP arrival curves show hour-by-hour differences in peak times. The ISP departure curves show similar trends with the difference between the 2005 traffic and the forecast being due to the difference in the traffic counts and some variation in peak times. The forecast departures show the peak at hour 14, which is not seen in the 2005 traffic, though the difference at this peak is 7 flights.
2007 The MITRE Corporation. All rights reserved.

12
0
2
4
6
8
10
12
0 1 2 3 4 5 6 7 8 9 10 11 12 13 14 15 16 17 18 19 20 21 22 23
Hour
Num
ber o
f Flig
hts
MMU Arr AAD 2005 MMU Arr AAD Forecast Figure 18. MMU AAD Arrivals by Hour
0
2
4
6
8
10
12
0 1 2 3 4 5 6 7 8 9 10 11 12 13 14 15 16 17 18 19 20 21 22 23
Hour
Num
ber o
f Flig
hts
MMU Dep AAD 2005 MMU Dep AAD Forecast Figure 19. MMU AAD Departures by Hour
The MMU throughput curves show variation in hourly trends with differences in peak times between the 2005 and forecast traffic. The MMU forecast shows peak departures in hour 19, while the 2005 traffic experiences peak departures in hour 7, both with a peak of 9 departures.
2007 The MITRE Corporation. All rights reserved.

13
Origin-Destination Comparison The forecast traffic and the 2005 actual traffic were also compared in terms of the number of flights departing to or coming from other airports. The differences between the two traffic files were calculated for each O-D pair as the forecast O-D pair number of flights minus the 2005 actual O-D pair number of flights. For example, if the NY forecast traffic has 38 departures to Miami while the NY 2005 actual traffic has 34 departures to Miami, then the difference would be four flights. Overall, a majority of the differences are in the -3 to +3 range.
Operational Evolution Plan (OEP) Major Airports to/from NY
A comparison of the O-D pairs of some of the major OEP airports arriving at the NY airports is found in Figure 20. The map shows the difference of the forecast number of flights minus the 2005 number of flights. The highest differences are:
• BOS-NY (50 more flights in the forecast traffic than in 2005),
• DCA-NY (35 more flights in the forecast traffic than in 2005),
• ORD-NY (25 more flights in the forecast traffic than in 2005),
• PIT-NY, SFO-NY (18 more flight in the forecast traffic than in 2005 for each),
• MEM-NY (16 more flights in the forecast traffic than in 2005).
Figure 20. O-D, OEP Major Airport AAD Arrivals to NY
(Forecast Traffic Minus 2005 Traffic)
2007 The MITRE Corporation. All rights reserved.

14
A comparison of the O-D pairs of the non-OEP 35 airports arriving at the NY airports is found in Figure 21. The map shows the difference of the forecast number of flights minus the 2005 number of flights. A majority of the differences are in the -3 to +3 range. The highest differences are:
• ROC-NY (20 more flights in the forecast traffic than in 2005),
• PVD-NY (18 more flights in the forecast traffic than in 2005),
• RDU-NY (18 fewer flights in the forecast traffic than in 2005),
• SYR-NY (17 more flights in the forecast traffic than in 2005).
Figure 21. O-D, AAD Arrivals to NY (Non-OEP 35)
(Forecast Traffic Minus 2005 Traffic) A comparison of the O-D pairs of some of the major OEP airports departing from the NY airports is found in Figure 22. The map shows the difference of the forecast number of flights minus the 2005 number of flights. The highest differences are:
• NY-BOS (56 more flights in the forecast traffic than in 2005),
• NY-DCA (40 more flights in the forecast traffic than in 2005),
• NY-IAD (25 more flights in the forecast traffic than in 2005),
• NY-ORD (20 more flight in the forecast traffic than in 2005 for each),
2007 The MITRE Corporation. All rights reserved.
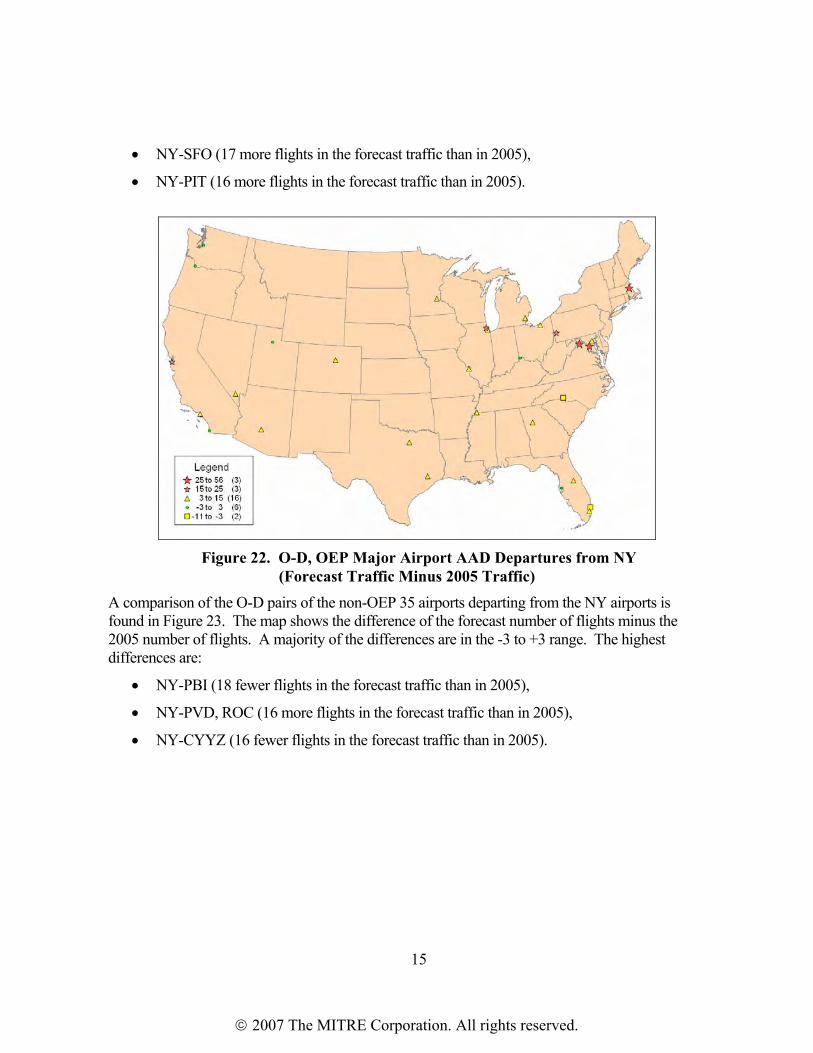
15
• NY-SFO (17 more flights in the forecast traffic than in 2005),
• NY-PIT (16 more flights in the forecast traffic than in 2005).
Figure 22. O-D, OEP Major Airport AAD Departures from NY
(Forecast Traffic Minus 2005 Traffic) A comparison of the O-D pairs of the non-OEP 35 airports departing from the NY airports is found in Figure 23. The map shows the difference of the forecast number of flights minus the 2005 number of flights. A majority of the differences are in the -3 to +3 range. The highest differences are:
• NY-PBI (18 fewer flights in the forecast traffic than in 2005),
• NY-PVD, ROC (16 more flights in the forecast traffic than in 2005),
• NY-CYYZ (16 fewer flights in the forecast traffic than in 2005).
2007 The MITRE Corporation. All rights reserved.

16
Figure 23. O-D, AAD Departures from NY (Non-OEP 35)
(Forecast Traffic Minus 2005 Traffic) A comparison of the 2005 fleet mix and the forecast fleet mix for each airport is shown in Figures 24 through 31)
2007 The MITRE Corporation. All rights reserved.

17
2005 Forecast
B75710% bizjet
3%
piston0%
rj38%
tprop1%
widebody7%
jumbo1%
narrowbody40%
B75710%
bizjet3%
jumbo2%
narrowbody55%
piston1%
rj17%
tprop3%
widebody9%
Figure 24. EWR AAD Fleet Mix Distribution
For EWR, the most noticeable difference is the significant increase in the use of RJs and the associated decrease in narrowbody jets, along with a slight decrease in turboprops, widebody and jumbo jets in the 2005 data over what was predicted for the forecast traffic. This increase in the use of RJs was also documented in Appendix B of The NY/NJ/PHL Metropolitan Area Airspace Redesign operational analysis.3 The results of this analysis indicated that the relative ranking of the NY operational alternatives was not affected by the increased use of RJs.
3 Ibid.
2007 The MITRE Corporation. All rights reserved.

18
2005 Forecast
B75714%
bizjet2%
jumbo8%
narrowbody26%
piston0%
rj21%
tprop1%
widebody28%
bizjet2%
jumbo6%
narrowbody28%
piston0%
rj16%
tprop10%
widebody31%
B7577%
Figure 25. JFK AAD Fleet Mix Distribution
The JFK fleet mix shows a similar, though less significant increase in the use of RJs in the 2005 traffic over the forecast traffic. The JFK fleet mix has significantly fewer turboprops than was forecast. There were twice as many B757s in 2005 than was forecast.
2007 The MITRE Corporation. All rights reserved.

19
2005 Forecast
B7577% bizjet
3%
narrowbody44%
piston0%
rj33%
tprop12%
widebody1%
jumbo0%
B75712% bizjet
3%
jumbo0%
narrowbody50%
piston0%
rj33%
tprop1%
widebody1%
Figure 26. LGA AAD Fleet Mix Distribution
For LGA, the distribution of turboprops in 2005 was much higher than was forecast, while there were fewer B757s and narrowbody jets than was forecast. Unlike EWR and JFK, the distribution of RJs in 2005 is the same as was forecast.
2007 The MITRE Corporation. All rights reserved.

20
2005 Forecast
B7574%
bizjet5%
narrowbody45%
piston1%
rj30%
widebody3% jumbo
0%
tprop12%
B7578%
bizjet5%
jumbo0%
narrowbody53%
piston1%
rj18%
tprop12%
widebody3%
Figure 27. PHL AAD Fleet Mix Distribution
PHL had a significantly higher percentage of RJs than was forecast, along with a lower percentage of narrowbody jets and B757s.
2007 The MITRE Corporation. All rights reserved.

21
2005 Forecast
bizjet78%
rj3%
tprop5%
B7570%
widebody0%
jumbo0%
narrowbody0%
piston14%
bizjet67%
narrowbody0%
piston12%
rj0%
tprop21%
widebody0%
jumbo0%
B7570%
Figure 28. TEB AAD Fleet Mix Distribution
The 2005 fleet mix at TEB shows a higher percentage of business jets (bizjets), along with a much lower percentage of turboprops than was forecast. There was also a small percentage of RJs in 2005 that were not forecast.
2007 The MITRE Corporation. All rights reserved.

22
2005 Forecast
bizjet48%
piston14%
rj17%
tprop21%
widebody0%
narrowbody0%
jumbo0%
B7570%
bizjet39%
rj27%
tprop28%
piston2%
narrowbody4%
jumbo0%
B7570%
widebody0%
Figure 29. HPN AAD Fleet Mix Distribution
The HPN 2005 traffic has a higher percentage of bizjets and pistons and a lower percentage of RJs and turboprops than the forecast traffic.
2007 The MITRE Corporation. All rights reserved.

23
2005 Forecast
bizjet20%
jumbo0%
narrowbody39%
piston5%
rj6%
tprop30%
B7570%
widebody0%
bizjet10%
jumbo0%
narrowbody44%
piston2%
rj19%
tprop24%
B7571%widebody
0%
Figure 30. ISP AAD Fleet Mix Distribution
ISP shows a different trend for the 2005 traffic compared to the forecast in that the forecast includes a much higher percentage of RJs than the 2005 traffic. The 2005 traffic also has a higher percentage of turboprops and bizjets, along with a smaller percentage of narrowbody jets than the forecast.
2007 The MITRE Corporation. All rights reserved.
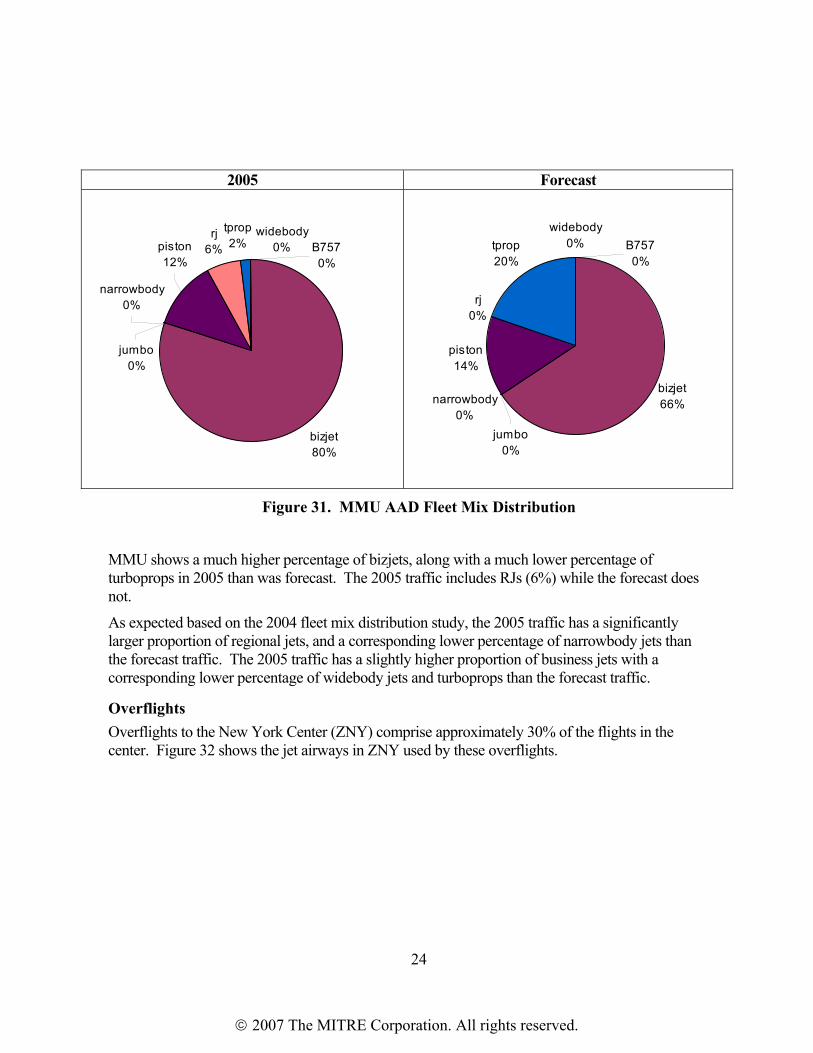
24
2005 Forecast
bizjet80%
rj6%
narrowbody0%
jumbo0%
piston12%
tprop2%
widebody0% B757
0%
bizjet66%narrowbody
0%
piston14%
rj0%
tprop20%
widebody0%
jumbo0%
B7570%
Figure 31. MMU AAD Fleet Mix Distribution
MMU shows a much higher percentage of bizjets, along with a much lower percentage of turboprops in 2005 than was forecast. The 2005 traffic includes RJs (6%) while the forecast does not.
As expected based on the 2004 fleet mix distribution study, the 2005 traffic has a significantly larger proportion of regional jets, and a corresponding lower percentage of narrowbody jets than the forecast traffic. The 2005 traffic has a slightly higher proportion of business jets with a corresponding lower percentage of widebody jets and turboprops than the forecast traffic.
Overflights Overflights to the New York Center (ZNY) comprise approximately 30% of the flights in the center. Figure 32 shows the jet airways in ZNY used by these overflights.
2007 The MITRE Corporation. All rights reserved.

25
Figure 32. ZNY Jet Airways
Demand for jet airways is harder to forecast than demand for airports. Winds, weather, and congestion frequently cause airspace users to change their preferred route of flight. The operational analysis was conducted under the simplifying assumption that all flights between a given pair of airports flew the same route, after which route demand was balanced by moving flows as a block. This comparison is therefore testing both the forecast and the modeling assumption.
Figure 33 shows a visual comparison between the forecast overflight demand and the actual radar tracks flown on the AAD in 2005. The forecast tracks are dotted lines. Where the line appears solid is an indication that it is a high-demand airway on which many aircraft are superimposed. The figure shows that the major flows match. The primary demand, on the east side of ZNY, is between the Northeast and Southwest. On the west side of the map, the scattering of many lightly-traveled routes is consistent with the observed tracks. The biggest difference is the bundle of 2005 radar tracks that form an important flow on J220. The corresponding route in the forecast is not dominant in that area.
2007 The MITRE Corporation. All rights reserved.

26
Forecast
2005
LegendForecast
2005
LegendForecast
2005
Legend
Figure 33. AAD 2005 and Forecast ZNY Overflights
The forecast overestimates traffic on airways overflying ZNY, just as it overestimates traffic at the New York airports. However, the ranking of airways by total traffic is roughly consistent: J42/J222 near the JFK VOR is the busiest single airway for overflights; J75 and J6 on the south side of ZNY are second and third, respectively.
J75 (#2 in traffic) and J48 (#5 or 6) are an adjacent pair of airways on the south side of ZNY. The forecast overestimates traffic on J75 and underestimates traffic on J48, but the sum of the two is within 4% of the observed count. The demand is correct within a reallocation of destination airports.
The forecast’s under-representation of J220, on the western boundary of ZNY, is due to the presence of Independence Air (IDE) in the 2005 traffic. IDE ran frequent service out of Washington Dulles with small jets to small airports in Upstate New York and New England. This caused increased traffic on J220, not just because of IDE flights themselves, but because the congestion on the routes to IAD on the Northeast side became great enough that the alternate route to the west became more attractive to other airlines.
J60 and J64 are under-represented in the forecast. This is another consequence of the underestimation of traffic at smaller airports in the vicinity of New York and Philadelphia.
90th Percentile Day 2005 vs. Forecast The 90th percentile day traffic count comparison for each airport is provided in Figure 34.
2007 The MITRE Corporation. All rights reserved.

27
0
200
400
600
800
1000
1200
1400
1600
1800
2000
EWR JFK LGA PHL HPN ISP TEB MMU
2005 Total Forecast Total Figure 34. 2005 vs. Forecast 90th Percentile Day total Traffic Counts by Airport
The forecast traffic counts for all airports except HPN and MMU are higher than the actual 2005 traffic. Overall, the forecast traffic has approximately 8% more flights than the 2005 traffic.
A comparison of the hourly arrival and departure throughput for each airport is found in Figures 35 through 50.
2007 The MITRE Corporation. All rights reserved.

28
0
10
20
30
40
50
60
70
80
0 1 2 3 4 5 6 7 8 9 10 11 12 13 14 15 16 17 18 19 20 21 22 23
Hour
Num
ber o
f Flig
hts
EWR Arr 90th 2005 EWR Arr 90th Forecast Figure 35. EWR 90th Percentile Day Arrivals by Hour
0
10
20
30
40
50
60
0 1 2 3 4 5 6 7 8 9 10 11 12 13 14 15 16 17 18 19 20 21 22 23
Hour
Num
ber o
f Flig
hts
EWR Dep 90th 2005 EWR Dep 90th Forecast Figure 36. EWR 90th Percentile Day Departures by Hour
The EWR throughput curves show similar hourly trends with the differences between the 2005 traffic and the forecast being due to the difference in the traffic counts, particularly with the forecast arrival peak in the afternoon.
2007 The MITRE Corporation. All rights reserved.

29
0
10
20
30
40
50
60
70
0 1 2 3 4 5 6 7 8 9 10 11 12 13 14 15 16 17 18 19 20 21 22 23
Hour
Num
ber o
f Flig
hts
JFK Arr 90th 2005 JFK Arr 90th Forecast Figure 37. JFK 90th Percentile Day Arrivals by Hour
0
10
20
30
40
50
60
70
0 1 2 3 4 5 6 7 8 9 10 11 12 13 14 15 16 17 18 19 20 21 22 23
Hour
Num
ber o
f Flig
hts
JFK Dep 90th 2005 JFK Dep 90th Forecast Figure 38. JFK 90th Percentile Day Departures by Hour
The JFK throughput curves show similar hourly trends with the differences between the 2005 traffic and the forecast being due to the differences in the traffic counts, particularly with the forecast arrival peaks in the morning and at night.
2007 The MITRE Corporation. All rights reserved.

30
0
10
20
30
40
50
60
70
0 1 2 3 4 5 6 7 8 9 10 11 12 13 14 15 16 17 18 19 20 21 22 23
Hour
Num
ber o
f Flig
hts
LGA Arr 90th 2005 LGA Arr 90th Forecast Figure 39. LGA 90th Percentile Day Arrivals by Hour
0
10
20
30
40
50
60
70
0 1 2 3 4 5 6 7 8 9 10 11 12 13 14 15 16 17 18 19 20 21 22 23
Hour
Num
ber o
f Flig
hts
LGA Dep 90th 2005 LGA Dep 90th Forecast Figure 40. LGA 90th Percentile Day Departures by Hour
The LGA throughput curves show similar hourly trends with the differences between the 2005 traffic and the forecast being due to the difference in the traffic counts as seen in the arrival and departure peaks at the end of the day for the forecast traffic.
2007 The MITRE Corporation. All rights reserved.

31
0
10
20
30
40
50
60
70
80
90
0 1 2 3 4 5 6 7 8 9 10 11 12 13 14 15 16 17 18 19 20 21 22 23
Hour
Num
ber o
f Flig
hts
PHL Arr 90th 2005 PHL Arr 90th Forecast Figure 41. PHL 90th Percentile Day Arrivals by Hour
0
10
20
30
40
50
60
70
80
90
0 1 2 3 4 5 6 7 8 9 10 11 12 13 14 15 16 17 18 19 20 21 22 23
Hour
Num
ber o
f Flig
hts
PHL Dep 90th 2005 PHL Dep 90th Forecast Figure 42. PHL 90th Percentile Day Departures by Hour
The PHL throughput curves reflect the change in schedule from the time that the forecast traffic was created in 2000 to the present time. The forecast traffic hourly trend shows high peaks. With the higher traffic at the 90th percentile level, the 2005 traffic has more peaks than the 2005 AAD traffic, though it is not as pronounced as the forecast traffic. An analysis of OAG data for the 90th percentile day shows the same trend as the 2005 90th percentile day traffic.
2007 The MITRE Corporation. All rights reserved.

32
0
5
10
15
20
25
30
35
40
45
0 1 2 3 4 5 6 7 8 9 10 11 12 13 14 15 16 17 18 19 20 21 22 23
Hour
Num
ber o
f Flig
hts
TEB Arr 90th 2005 TEB Arr 90th Forecast Figure 43. TEB 90th Percentile Day Arrivals by Hour
0
5
10
15
20
25
30
35
40
45
0 1 2 3 4 5 6 7 8 9 10 11 12 13 14 15 16 17 18 19 20 21 22 23
Hour
Num
ber o
f Flig
hts
TEB Dep 90th 2005 TEB Dep 90th Forecast Figure 44. TEB 90th Percentile Day Departures by Hour
The TEB throughput curves show similar hourly trends with the difference between the 2005 traffic and the forecast being due to the difference in the traffic counts.
2007 The MITRE Corporation. All rights reserved.
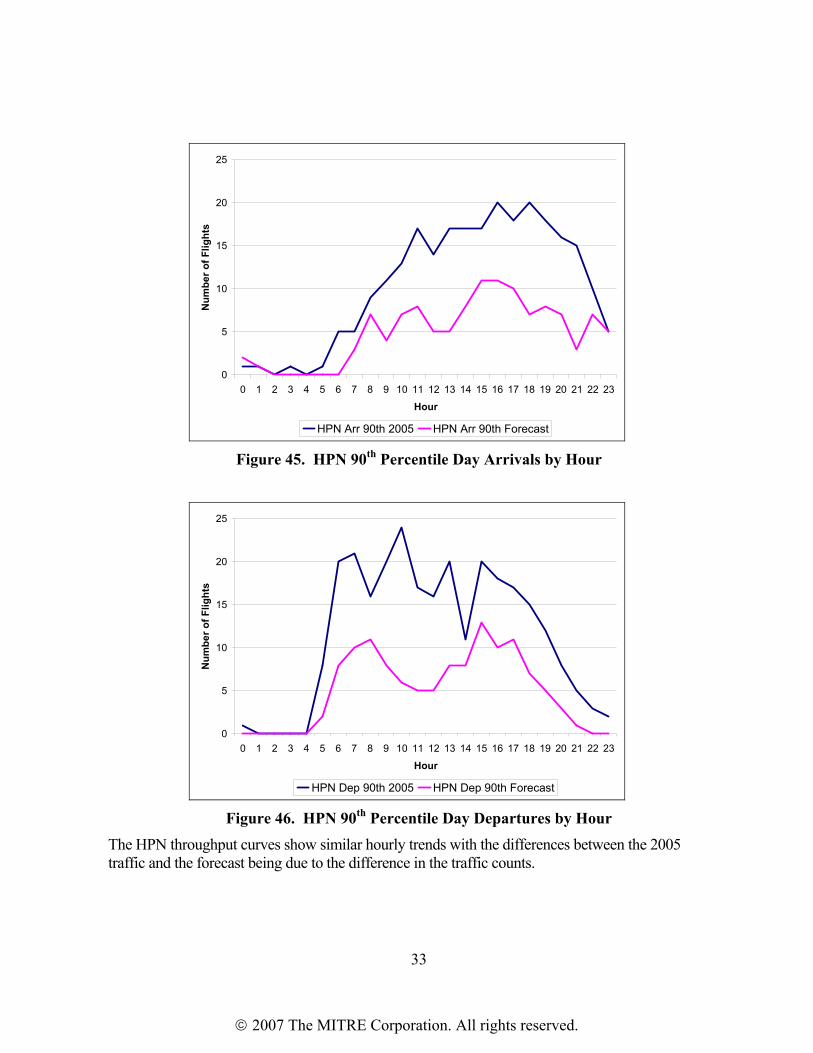
33
0
5
10
15
20
25
0 1 2 3 4 5 6 7 8 9 10 11 12 13 14 15 16 17 18 19 20 21 22 23
Hour
Num
ber o
f Flig
hts
HPN Arr 90th 2005 HPN Arr 90th Forecast Figure 45. HPN 90th Percentile Day Arrivals by Hour
0
5
10
15
20
25
0 1 2 3 4 5 6 7 8 9 10 11 12 13 14 15 16 17 18 19 20 21 22 23
Hour
Num
ber o
f Flig
hts
HPN Dep 90th 2005 HPN Dep 90th Forecast Figure 46. HPN 90th Percentile Day Departures by Hour
The HPN throughput curves show similar hourly trends with the differences between the 2005 traffic and the forecast being due to the difference in the traffic counts.
2007 The MITRE Corporation. All rights reserved.

34
0
2
4
6
8
10
12
14
0 1 2 3 4 5 6 7 8 9 10 11 12 13 14 15 16 17 18 19 20 21 22 23
Hour
Num
ber o
f Flig
hts
ISP Arr 90th 2005 ISP Arr 90th Forecast Figure 47. ISP 90th Percentile Day Arrivals by Hour
0
2
4
6
8
10
12
14
0 1 2 3 4 5 6 7 8 9 10 11 12 13 14 15 16 17 18 19 20 21 22 23
Hour
Num
ber o
f Flig
hts
ISP Dep 90th 2005 ISP Dep 90th Forecast Figure 48. ISP 90th Percentile Day Departures by Hour
The ISP throughput curves show similar hourly trends with the difference between the 2005 traffic and the forecast being due to the difference in the traffic counts and some variation in peak times.
2007 The MITRE Corporation. All rights reserved.
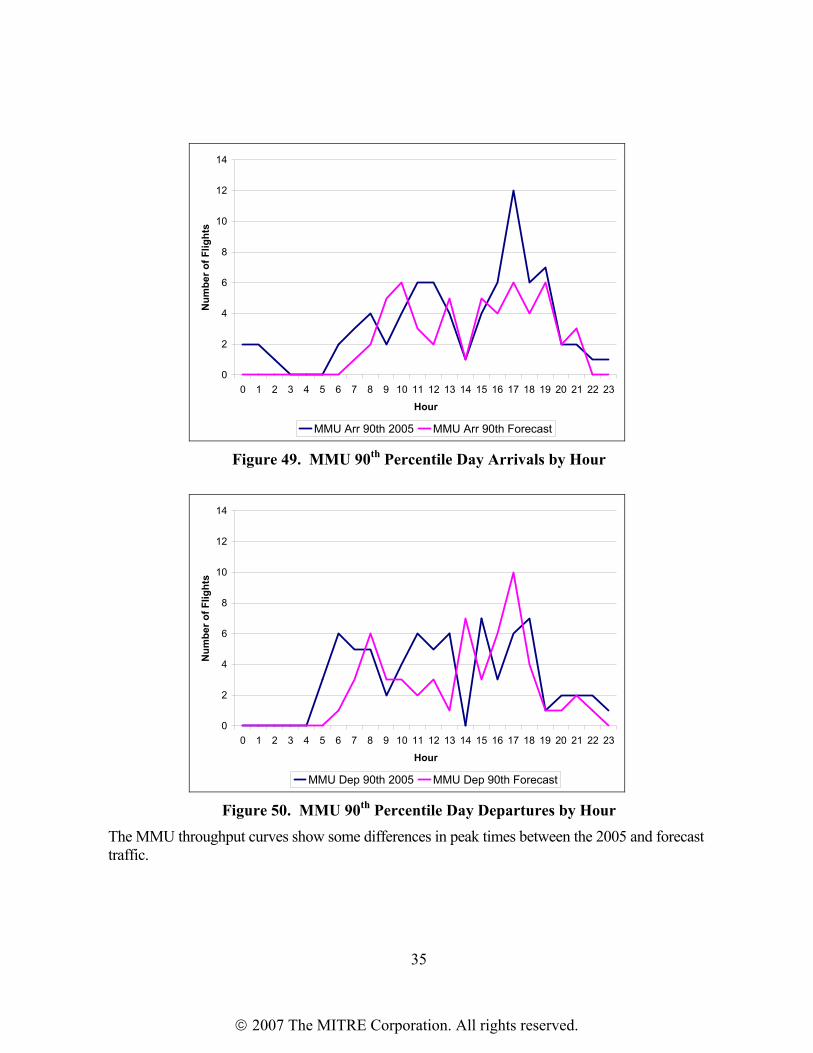
35
0
2
4
6
8
10
12
14
0 1 2 3 4 5 6 7 8 9 10 11 12 13 14 15 16 17 18 19 20 21 22 23
Hour
Num
ber o
f Flig
hts
MMU Arr 90th 2005 MMU Arr 90th Forecast Figure 49. MMU 90th Percentile Day Arrivals by Hour
0
2
4
6
8
10
12
14
0 1 2 3 4 5 6 7 8 9 10 11 12 13 14 15 16 17 18 19 20 21 22 23
Hour
Num
ber o
f Flig
hts
MMU Dep 90th 2005 MMU Dep 90th Forecast Figure 50. MMU 90th Percentile Day Departures by Hour
The MMU throughput curves show some differences in peak times between the 2005 and forecast traffic.
2007 The MITRE Corporation. All rights reserved.

36
Origin-Destination Comparison The forecast traffic and the 2005 actual traffic were also compared in terms of the number of flights departing to or coming from other airports. The differences between the two traffic files were calculated for each O-D pair as the forecast O-D pair number of flights minus the 2005 actual O-D pair number of flights. A majority of the O-D pair differences are in the -3 to +3 range.
OEP Major Airports to/from NY
A comparison of the O-D pairs of some of the major OEP airports arriving at the NY airports is found in Figure 51. The map shows the difference of the forecast number of flights minus the 2005 number of flights. The highest differences are:
• BOS-NY (57 more flights in the forecast traffic than in 2005),
• ORD-NY (47 more flights in the forecast traffic than in 2005),
• DCA-NY (41 more flights in the forecast traffic than in 2005),
• BWI-NY (24 more flights in the forecast traffic than in 2005),
• MCO-NY (21 more flight in the forecast traffic than in 2005 for each),
• LAX-NY, SFO-NY (20 more flights in the forecast traffic than in 2005),
• MIA-NY (19 more flights in the forecast traffic than in 2005),
• ATL-NY, DFW-NY (18 more flights in the forecast traffic than in 2005),
• CLE-NY (17 more flights in the forecast traffic than in 2005),
• PIT-NY (16 more flights in the forecast traffic than in 2005).
2007 The MITRE Corporation. All rights reserved.
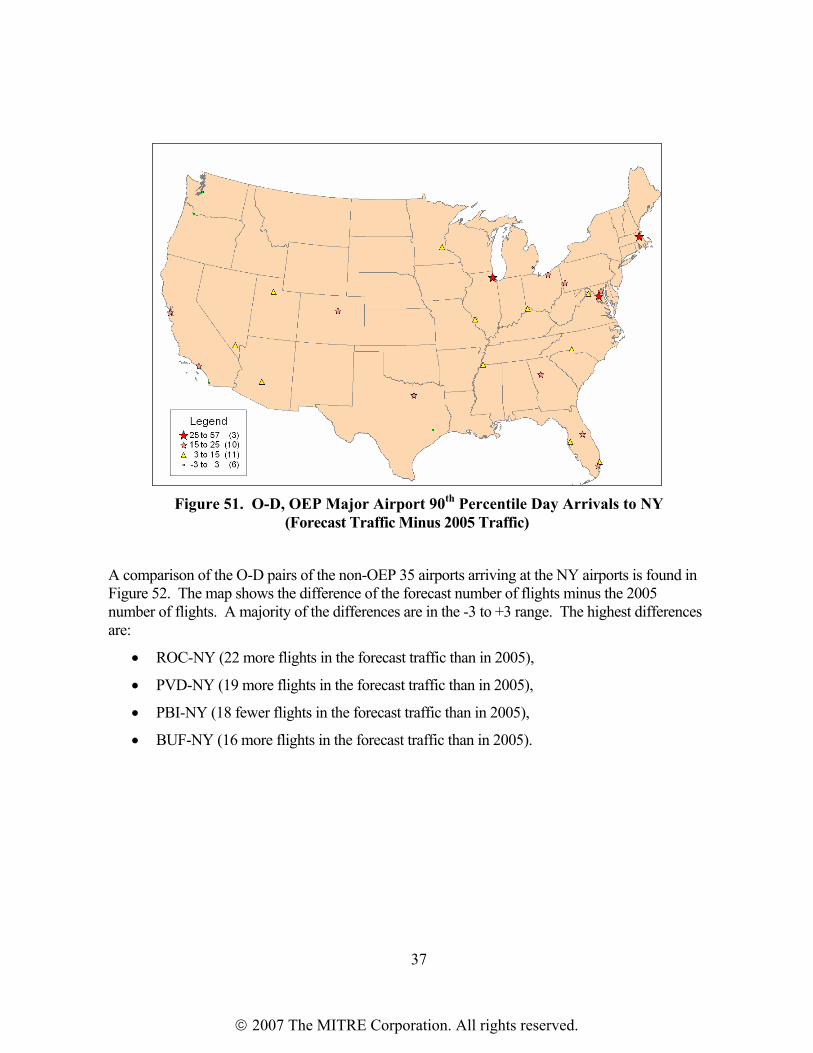
37
Figure 51. O-D, OEP Major Airport 90th Percentile Day Arrivals to NY
(Forecast Traffic Minus 2005 Traffic)
A comparison of the O-D pairs of the non-OEP 35 airports arriving at the NY airports is found in Figure 52. The map shows the difference of the forecast number of flights minus the 2005 number of flights. A majority of the differences are in the -3 to +3 range. The highest differences are:
• ROC-NY (22 more flights in the forecast traffic than in 2005),
• PVD-NY (19 more flights in the forecast traffic than in 2005),
• PBI-NY (18 fewer flights in the forecast traffic than in 2005),
• BUF-NY (16 more flights in the forecast traffic than in 2005).
2007 The MITRE Corporation. All rights reserved.

38
Figure 52. O-D, 90th Percentile Day Arrivals to NY (Non-OEP 35)
(Forecast Traffic Minus 2005 Traffic)
A comparison of the O-D pairs of some of the major OEP airports departing from the NY airports is found in Figure 53. The map shows the difference of the forecast number of flights minus the 2005 number of flights. The highest differences are:
• NY-BOS (84 more flights in the forecast traffic than in 2005),
• NY-DCA, NY-ORD (45 more flights in the forecast traffic than in 2005),
• NY-BWI, NY-SFO (24 more flights in the forecast traffic than in 2005),
• NY-ATL, NY-DFW (21 more flight in the forecast traffic than in 2005 for each),
• NY-MCO (17 more flights in the forecast traffic than in 2005).
2007 The MITRE Corporation. All rights reserved.

39
Figure 53. O-D, OEP Major Airport 90th Percentile Day Departures from NY
(Forecast Traffic Minus 2005 Traffic)
A comparison of the O-D pairs of the non-OEP 35 airports departing from the NY airports is found in Figure 54. The map shows the difference of the forecast number of flights minus the 2005 number of flights. A majority of the differences are in the -3 to +3 range. The highest differences are:
• NY-ROC (22 more flights in the forecast traffic than in 2005),
• NY-SYR (21 more flights in the forecast traffic than in 2005),
• NY-BDL (21 fewer flights in the forecast traffic than in 2005),
• NY-BUF (20 more flights in the forecast traffic than in 2005),
• NY-ALB (17 more flights in the forecast traffic than in 2005),
• NY-TEB (17 fewer flights in the forecast traffic than in 2005),
• NY-PVD (16 more flights in the forecast traffic than in 2005).
2007 The MITRE Corporation. All rights reserved.

40
Figure 54. O-D, 90th Percentile Day Departures from NY (Non-OEP 35)
(Forecast Traffic Minus 2005 Traffic)
Fleet Mix Comparison A comparison of the 2005 fleet mix and the forecast fleet mix for each airport is shown in Figures 55 through 62.
2007 The MITRE Corporation. All rights reserved.

41
2005 Forecast
narrowbody37%
piston1%
rj37%
tprop3%
widebody10% bizjet
2%
B7579%
jumbo1%
narrowbody55%
piston1%
rj15%
tprop3%
widebody12% bizjet
3%jumbo
1%
B75710%
Figure 55. EWR 90th Percentile Day Fleet Mix Distribution
For EWR, the main difference is the significant increase in the use of RJs and the associated decrease in narrowbody jets, with a slight decrease in the proportion of widebody jets in the 2005 data as compared to the forecast traffic.
2007 The MITRE Corporation. All rights reserved.

42
2005 Forecast
B75714%
bizjet2%
jumbo7%
narrowbody29%
piston0%
rj19%
tprop1%
widebody28%
narrowbody32%
piston0%
rj16%
tprop9%
widebody29%
B7577% bizjet
1% jumbo6%
Figure 56. JFK 90th Percentile Day Fleet Mix Distribution
The JFK fleet mix has a significantly smaller proportion of turboprops than was forecast. The proportion of B757s is twice as much in 2005 than was forecast. There is a slight increase in the proportion of RJs and associated decrease in narrowbody jets in the 2005 traffic compared to the forecast traffic.
2007 The MITRE Corporation. All rights reserved.

43
2005 Forecast
B7576% bizjet
5%
narrowbody43%
piston0%
rj33%
widebody0%tprop
13% jumbo0%
narrowbody48%
piston0%
rj36%
B75712%
bizjet2%
jumbo0%
widebody1%tprop
1%
Figure 57. LGA 90th Percentile Day Fleet Mix Distribution
For LGA, the distribution of turboprops in 2005 is much higher than was forecast, while there are fewer B757s and narrowbody jets than was forecast. Unlike EWR and JFK, the distribution of RJs in 2005 is slightly lower than was forecast. The forecast traffic has a smaller percentage of bizjets than there was in 2005.
2007 The MITRE Corporation. All rights reserved.

44
2005 Forecast
B7575%
bizjet8%
jumbo0%
narrowbody36%
piston2%
rj29%
tprop15%
widebody5%
B7576%
bizjet7%
jumbo0%
narrowbody53%
piston2%
rj17%
tprop12%
widebody3%
Figure 58. PHL 90th Percentile Day Fleet Mix Distribution
For 2005, PHL had a significantly higher percentage of RJs than was forecast, along with a lower percentage of narrowbody jets. In 2005, the proportion of turboprops and widebody jets is slightly higher than was forecast.
2007 The MITRE Corporation. All rights reserved.

45
2005 Forecast
bizjet75%
narrowbody0%
piston14%
rj3%
tprop8%
jumbo0%
widebody0% B757
0%
bizjet86%
tprop7%rj
0%piston7%
jumbo0%
widebody0% B757
0%
narrowbody0%
Figure 59. TEB 90th Percentile Day Fleet Mix Distribution
The fleet mix at TEB for 2005 shows a lower percentage of bizjets and a higher percentage of pistons than was forecast. There is also a small percentage of RJs in 2005 that was not in the forecast.
2007 The MITRE Corporation. All rights reserved.

46
2005 Forecast
bizjet66%
rj15%
tprop10%
piston8%
narrowbody1%
jumbo0%
widebody0% B757
0%
rj
42%
tprop30%
jumbo0%
narrowbody5%
piston1%
bizjet22%
B7570%
widebody0%
Figure 60. HPN 90th Percentile Day Fleet Mix Distribution
Unlike most airports, the HPN 2005 traffic has a much lower percentage of RJs than was forecast. The 2005 traffic also has a much higher percentage of bizjets and a somewhat higher percentage of pistons; along with a much lower percentage of turboprops and narrowbody jets than was forecast.
2007 The MITRE Corporation. All rights reserved.

47
2005 Forecast
bizjet22%
jumbo0%
narrowbody38%
piston10%
rj10%
tprop20%
B7570%
widebody0%
bizjet7%
narrowbody50%
piston0%
rj22%
tprop19%
B7572%widebody
0%jumbo
0%
Figure 61. ISP 90th Percentile Day Fleet Mix Distribution
Similarly to HPN, the ISP fleet mix in 2005 has a much lower percentage of RJs than was forecast. The ISP 2005 fleet mix also has a much lower percentage of narrowbody jets and a higher percentage of bizjets and pistons than was forecast.
2007 The MITRE Corporation. All rights reserved.

48
2005 Forecast
bizjet65%
narrowbody0%
piston15%
rj7%
tprop13%
widebody0%
jumbo0%
B7570%
bizjet75%
piston7%
rj0%
tprop18%
widebody0%
narrowbody0%
jumbo0%
B7570%
Figure 62. MMU 90th Percentile Day Fleet Mix Distribution
MMU shows a higher percentage of pistons, along with a lower percentage of bizjets and turboprops in 2005 than was forecast. The 2005 traffic includes RJs (7%) while the forecast does not.
Overall, the 2005 fleet mix has a larger proportion of RJs and bizjets, with a decreased proportion of narrowbody jets compared to the forecast traffic.
Overflights Figure 63 shows a visual comparison between the forecast overflight demand and the actual radar tracks flown on the 90th percentile day in 2005. The forecast tracks are dotted lines. Where the line appears solid is an indication that it is a high-demand airway on which many aircraft are superimposed. The figure for the 90th percentile day shows similar trends to that of the annual average day, though more pronounced. The forecast overestimates traffic on airways overflying ZNY. The ranking of airways by total traffic is roughly consistent.
2007 The MITRE Corporation. All rights reserved.

49
Forecast
2005
Legend
Forecast
2005
Legend
Forecast
2005
Legend
Figure 63. 90th Percentile Day 2005 and Forecast ZNY Overflights
PHL Annual Average Day 2012 vs. 2011 Forecast The PHL CEP4 was initiated to enhance the airport capacity to accommodate current and
future growth. An analysis of the alternatives under consideration required the use of a forecast of future traffic. A forecast of 2012 PHL traffic was developed for this purpose. Since this traffic forecast was based on more recent data than the 2011 forecast, the 2012 PHL CEP forecast is compared to the 2011 traffic forecast.
Traffic Counts Comparison The PHL 2011 forecast traffic counts are within 1% of the 2012 forecast traffic. The 2011 forecast has 1640 flights, and the 2012 forecast traffic has 1618 flights.
Hourly Throughput Comparison A comparison of the hourly arrival and departure throughput for PHL is found in Figures 64 and 65, respectively.
4 http://www.phl-cep-eis.com/
2007 The MITRE Corporation. All rights reserved.

50
0
10
20
30
40
50
60
70
80
0 1 2 3 4 5 6 7 8 9 10 11 12 13 14 15 16 17 18 19 20 21 22 23
Hour
Num
ber o
f Flig
hts
PHL Arr AAD 2011 PHL Arr AAD 2012 Figure 64. PHL 2011 vs. 2012 AAD Arrivals by Hour
0
10
20
30
40
50
60
70
80
0 1 2 3 4 5 6 7 8 9 10 11 12 13 14 15 16 17 18 19 20 21 22 23
Hour
Num
ber o
f Flig
hts
PHL Dep AAD 2011 PHL Dep AAD 2012 Figure 65. PHL 2011 vs. 2012 AAD Departures by Hour
The 2012 forecast shows the peaks seen in the more recent PHL schedule. The arrival throughput comparison is similar with the exception of the peak arrivals in the 2011 forecast occurring in hour 20 with 80 arrivals, while the 2012 forecast shows a very low throughput at that same time with 34 arrivals. The PHL departure throughput is similar in the early hours; the 2012 forecast shows peaks from hours 13 through the end of the day, where the 2011 traffic shows a somewhat smoother flow from hour 15 through the end of the day. These differences can be explained by the changes in the PHL schedule that has occurred over time.
2007 The MITRE Corporation. All rights reserved.

51
Origin-Destination Comparison The PHL 2012 forecast traffic and the 2011 forecast traffic were also compared in terms of the number of flights departing to/coming from other airports.
OEP Major Airports to/from PHL
A comparison of the O-D pairs of some of the major OEP airports arriving at PHL is found in Figure 66. The map shows the difference of the 2012 forecast number of flights minus the 2011 forecast number of flights. The highest differences are:
• MCO-PHL (15 more flights in the 2012 forecast than in the 2011 forecast),
• BOS, MEM, ORD-PHL (8 fewer flights in the 2012 forecast than in the 2011 forecast).
Figure 66. O-D, OEP Major Airport AAD Arrivals to PHL
(2012 AAD Forecast Minus 2011 AAD Forecast)
A comparison of the O-D pairs of the non-OEP 35 airports arriving at PHL is found in Figure 67. The map shows the difference of the 2012 forecast number of flights minus the 2011 forecast number of flights. A majority of the differences are in the -3 to +3 range. The highest differences are:
• MHT-PHL (10 more flights in the 2012 forecast than in the 2011 forecast),
2007 The MITRE Corporation. All rights reserved.

52
• JFK-PHL (9 fewer flights in the 2012 forecast than in the 2011 forecast),
• MDPC-PHL (8 more flights in the 2012 forecast than in the 2011 forecast),
• ORH-PHL (8 fewer flights in the 2012 forecast than in the 2011 forecast).
Figure 67. O-D, AAD Arrivals to PHL (Non-OEP 35) (2012 AAD Forecast Minus 2011 AAD Forecast)
A comparison of the O-D pairs of some of the major OEP airports departing from PHL is found in Figure 68. The map shows the difference of the 2012 forecast number of flights minus the 2011 forecast number of flights. The highest differences are:
• PHL-BOS (12 fewer flights in the 2012 forecast than in the 2011 forecast),
• PHL-MCO (11 more flights in the 2012 forecast than in the 2011 forecast),
• PHL-DTW (10 more flights in the 2012 forecast than in the 2011 forecast),
• PHL-DFW (8 fewer flights in the 2012 forecast than in the 2011 forecast).
2007 The MITRE Corporation. All rights reserved.

53
Figure 68. O-D, OEP Major Airport AAD Departures from PHL
(2012 AAD Forecast Minus 2011 AAD Forecast) A comparison of the O-D pairs of the non-OEP 35 airports departing from PHL is found in Figure 69. The map shows the difference of the 2012 forecast number of flights minus the 2011 forecast number of flights. A majority of the differences are in the -3 to +3 range. Longer-haul traffic is better forecast than regional traffic. The highest differences are:
• PHL-EWR (13 more flights in the 2012 forecast than the 2011 forecast),
• PHL-EEN (10 more flights in the 2012 forecast than the 2011 forecast),
• PHL-TTN (9 more flights in the 2012 forecast than the 2011 forecast),
• PHL-LGA (8 more flights in the 2012 forecast than the 2011 forecast).
2007 The MITRE Corporation. All rights reserved.
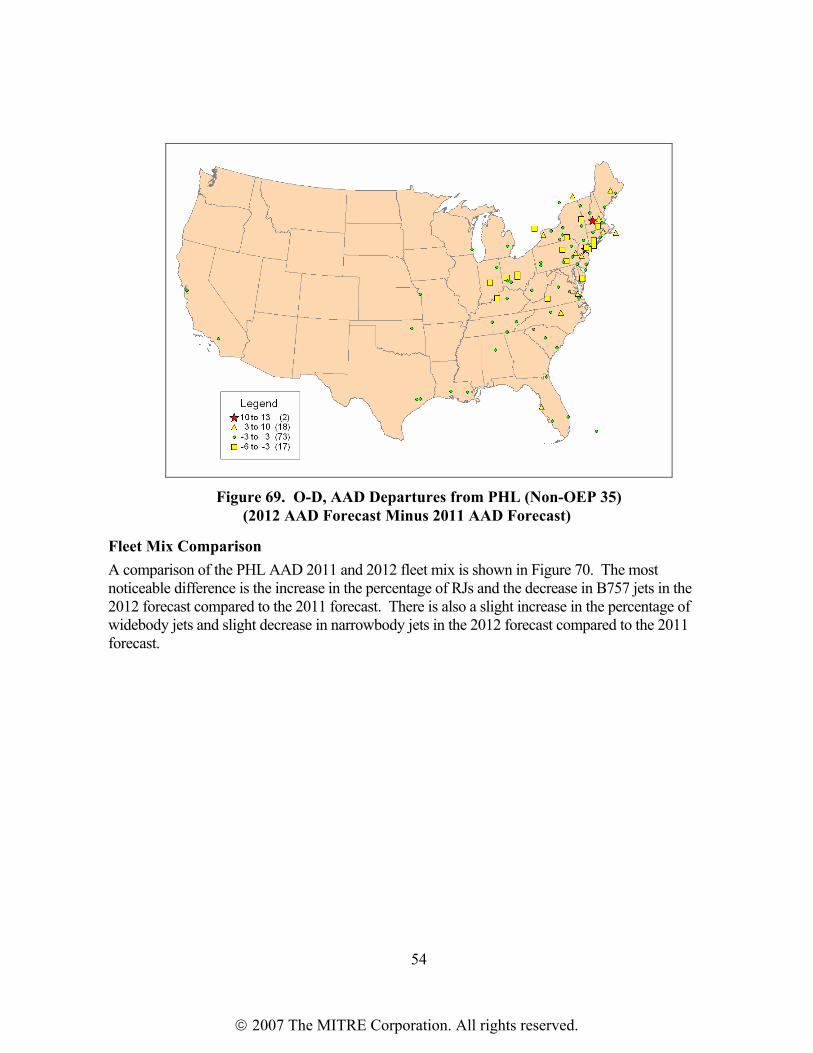
54
Figure 69. O-D, AAD Departures from PHL (Non-OEP 35)
(2012 AAD Forecast Minus 2011 AAD Forecast)
Fleet Mix Comparison A comparison of the PHL AAD 2011 and 2012 fleet mix is shown in Figure 70. The most noticeable difference is the increase in the percentage of RJs and the decrease in B757 jets in the 2012 forecast compared to the 2011 forecast. There is also a slight increase in the percentage of widebody jets and slight decrease in narrowbody jets in the 2012 forecast compared to the 2011 forecast.
2007 The MITRE Corporation. All rights reserved.

55
2011 Forecast 2012 Forecast
B75710%
bizjet6%
narrowbody51%
piston1%
rj25%
widebody3%
jumbo0%
tprop4%
B7571% jumbo
0%
narrowbod47%
piston1%
rj34%
bizjet7%
widebody6%tprop
4%
Figure 70. PHL 2011 vs. 2012 AAD Fleet Mix Distribution
2007 The MITRE Corporation. All rights reserved.

56
3 Discussion Traffic forecasting is an economic exercise, relying on the accuracy of predictive economic indicators. Economic indicators, while useful for discerning broad trends, invariably miss important details. In many of those details, the economic outlook from the year 2000 is far removed from today’s reality. The last five years have seen an aviation industry changing, struggling to maintain profitability in a chaotic economy. Those changes led to discrepancies between the forecast traffic and the actual traffic. Although the majority of the traffic forecast matches patterns in today’s air traffic, some parts do not. War, terrorism, Severe Acute Respiratory Syndrome (SARS), and bankruptcy would have been nearly impossible for any analyst to predict.
Features of the Forecast that are Essentially Correct The overall forecast of traffic counts for 2006 was 6-8% above the observed levels in 2005 at the major airports in New York and Philadelphia metropolitan areas.
Of the airports modeled in detail for the operational analysis, LGA and EWR are qualitatively correct. Schedules at both airports are flow operations instead of hub-and-spoke operations, as predicted. JFK is reasonably correct in that the demand is dominated by the international peaks. At PHL, the de-peaking of the schedule was not foreseen.
At the smaller airports on the annual average day, there are large differences between the forecast and the actual traffic, but the differences lie within the natural variation that result when unscheduled operations dominate the traffic at an airport. On the 90th percentile day, the differences can be very large. Traffic at HPN is particularly underestimated, possibly due to the recent large increases in air taxi traffic. Air taxi traffic is notably absent from older data sources such as the ETMS version used to generate the baseline for these forecasts.
One example of how general economic trends led to correct predictions of the 2006 market is JetBlue. JetBlue began using JFK as a base hub in the year 2000. Population growth trends visible in 2000 led the forecasters to anticipate that JetBlue would expand its operations to the east, specifically to Boston; to the west; and to the Florida market. The patterns and magnitudes of traffic are well represented in the forecasted traffic.
Another example of a correct forecast is IDE. The market that IDE tried to exploit was not visible in 2000, so no such carrier was included in the 2006 forecast. As of February 2006, IDE does not use the airspace.
Trends Leading to Inaccuracies in the Forecast Over the last five years, major carriers have changed the way they conduct business. USAir went through two bankruptcies before it consolidated with America West. United, Delta, and Northwest Airlines each went through a bankruptcy. These carriers, which maintain a major presence along the eastern corridor, have significantly changed their route services, impacting the New York
2007 The MITRE Corporation. All rights reserved.

57
markets, Philadelphia, and Pittsburgh. As a result, hub-to-hub service for Boston (BOS), Atlanta (ATL), and Chicago (ORD) were all overestimated in the traffic forecast by up to a factor of two.
A variety of cost factors contribute to making the traditional hub-and-spoke system expensive. As the airlines adapt their business policies to minimize this expense, the demand is affected in three ways. First, airlines may schedule flights during non-peak hours, resulting in a shift from a peaked demand at a given airport to a flow operation. The behavior of traffic at PHL for 2005 revealed a schedule shifting from peaked to flattened, which was not foreseen in the traffic forecast. This can be explained by the entry of Southwest Airlines into PHL.
The second effect on demand is in the mix of aircraft types. In the year 2000, it was expected that the airlines would replace their turboprops with RJs. However, as the airlines reacted to market competition and escalating fuel prices, they began to serve the same number of passengers with a fully loaded RJ rather than a partially loaded narrowbody jet, resulting in lower operating costs. The forecast included the effects of the replacement of turboprops, but underestimated the replacement of narrowbodies.
The third way demand is affected is by the growth of regional airlines at the expense of major hub-and-spoke carriers. In many cases, this does not affect the operational modeling of the airspace, since one jet is much like another to air traffic control. In one way, however, there is a difference. Second-tier airports are more important to regional carriers, so the forecast underestimated the traffic at many of those airports.
One final example of an economic change that is not accessible to macroeconomic analysis is the entry and subsequent exit of IDE from the aviation market. IDE was a type of hub-and-spoke operation out of Washington Dulles with small jets serving smaller airports across New York and New England. Traffic from an airline like this appears as overflights in the traffic forecast. This increase in RJ overflights is not included in the overflight traffic forecast and leads to a mismatch with the 2005 comparison year. This mismatch has no implications for the accuracy of the operational analysis of the airspace redesign, because IDE-type operations are not expected in the actual 2006 traffic.
PHL 2011 Comparison with the CEP Forecast The NY/NJ/PHL airspace redesign forecast of PHL traffic for 2011 matches very well with the CEP forecast for 2012. The currently-observed hub-and-spoke pattern is visible in both demand profiles.
Conclusions A forecast is accurate if it meets two criteria. First, it must support planning decisions. A forecast is not required to be exact in details, but to capture the general flow and magnitude of the traffic in a way that can show differences among the proposed alternatives. Second, it must be consistent with other forecasts that other bodies use to make their own decisions in their common area of interest. By that standard, the forecasts used in the NY/NJ/PHL Metropolitan Area Airspace Redesign are accurate.
2007 The MITRE Corporation. All rights reserved.

58
The critical features of the traffic for the operational efficiency analysis are:
• Times of departure pushes,
• Usage of jet airways and departure fixes,
• Total demand,
• Mix of wake turbulence and engine type.
The forecast is an acceptable match on all counts. Its weakest feature is the structuring of departure banks out of PHL and the overall traffic counts at the minor airports. The tight departure banks at PHL will not appear in practice, because of the limitations of airport capacity. Though the demand for runways is in sharp spikes, the demand for the airspace will be smoothed out to a pattern that matches the observed traffic much better. As a result, the estimates of delay at PHL will be higher than actually observed, but the relative ranking of the alternatives will not be affected.
Another weakness of the forecast is in the traffic at minor airports, especially on the 90th percentile day. Fortunately, minor airports are underestimated, where the major airports are overestimated. The net demand at the departure fixes is acceptable.
The biggest difference in aircraft type between the forecast and the actual traffic is the unforeseen replacement of narrowbody jets by regional jets. This effect on the operational results has been addressed in Appendix B of the operational analysis;5 the alternatives are all affected in the same way, so the relative ranking of the alternatives is unaffected.
The critical features of the traffic for the environmental analysis are:
• Usage of arrival and departure procedures,
• Total arrival and departure demand on the AAD,
• Day-night balance of traffic,
• Mix of engines.
The salient difference between the forecast and the actual traffic is in the change of demand from major airports to minor airports. These minor airports far from New York and Philadelphia would use the same airways, so the arrival and departure procedures at the hub airports are correctly used. The traffic counts of the AAD forecast are much closer to the 2005 actual AAD traffic than the 90th percentile day forecast is to the 2005 actual 90th percentile day traffic. The day-night balance is roughly correct, and the biggest unforeseen change in aircraft type was from narrowbody jets to regional jets, which is a minor change in noise and emissions characteristics.
5 Ibid.
2007 The MITRE Corporation. All rights reserved.

59
Glossary AAD Annual Average Day ALB Albany County Airport ATL William B. Hartsfield Atlanta International Airport BDL Bradley International Airport Bizjet Business Jet BOS General Edward Lawrence Logan International Airport BUF Greater Buffalo International Airport BWI Baltimore-Washington International Airport CEP Capacity Enhancement Plan CYYZ Toronto/Pearson International Airport DCA Ronald Reagan Washington National Airport DFW Dallas/Fort Worth International Airport DTW Detroit Metropolitan Wayne County Airport EEN Dillant-Hopkins Airport ETMS Enhanced Traffic Management System EWR Newark Liberty International Airport HPN Westchester County Airport IAD Washington Dulles International Airport IDE Independence Air ISP Long Island MacArthur Airport JFK John F. Kennedy International Airport LGA LaGuardia Airport MCO Orlando International Airport MDPC Punta Cana International Airport MEM Memphis International Airport MHT Manchester Airport MMU Morristown Municipal Airport OAG Official Airline Guide O-D Origin-Destination
2007 The MITRE Corporation. All rights reserved.

60
OEP Operational Evolution Plan OPSNET Operational Network ORD Chicago O’Hare International Airport ORH Worcester Regional Airport PBI Palm Beach International Airport PHL Philadelphia International Airport PIT Pittsburgh International Airport PVD Theodore Francis Green State Airport RDU Raleigh-Durham International Airport RJ Regional Jet ROC Greater Rochester International Airport SARS Severe Acute Respiratory Syndrome SFO San Francisco International Airport SYR Syracuse Hancock International Airport TEB Teterboro Airport TTN Mercer County Airport ZNY New York Center
2007 The MITRE Corporation. All rights reserved.