Embed Size (px)
Citation preview

Appendix A
Benthic MacroinvertebrateSampling


A-1
Division of Water QualityBiological Assessment Unit
April 22, 2002
Memorandum
To: Jim Blose, Trish MacPhersonFrom: Niki FlintSubject: WARP macroinvertebrate sampling of Clark Creek, Catawba/Lincoln counties,2000-01.
Clark Creek is a piedmont stream located in Catawba and Lincoln counties. The portionof Clark Creek studied in the Watershed Assessment and Restoration Project (WARP) isa 39 square mile watershed originating in the town of Hickory. At the beginning of theproject, the headwaters of Clark Creek were surrounded by a bare-dirt construction site.This is a fine example of the kind of stress that the stream has endured and the changes ithas been forced to undergo. The stream progresses from urban and high-densityresidential areas through a number of subdivisions, a suburban golf course, and lowerdensity residential areas before reaching a relatively rural setting of farmlands with activelivestock pastures, cropland, fallow fields, and patches of forest. The portion of ClarkCreek affected by sedimentation and the effects of urban expansion extending fromHickory, downstream beyond Newton to the confluence of Maiden Creek was the focusof the WARP sampling efforts.
Clark Creek has shown ongoing degradation in water quality. One source of impact onthe stream has been point-source discharges, especially the City of Newton wastewatertreatment plant (WWTP). In 1984, the Biological Assessment Unit (BAU) surveyed themacroinvertebrate community in hopes of concluding that recent upgrades in thetreatment plant would allow Clark Creek the opportunity to recover. After the upgrades,the water quality did improve and allowed an increase in the taxa richness in themacroinvertebrate communities downstream. It was suspected the macroinvertebrateswere able to improve at the downstream site due to larger stream size, as well as theimproved water quality. (“Clark Creek Survey”, NCDEM WQ Section, 1985.) Problemsremained throughout the watershed however, even after this particular water quality issuewas addressed. No marked improvements in bioclassification have been evident sincethe 1984 survey. Though the presence of small point-source dischargers in the urbanizedheadwaters of Clark Creek remain troublesome, the primary concern in the upper portionof Clark Creek is nonpoint sources of water quality impairment associated with urbanrunoff.
Habitat degradation and heavy sedimentation due to erosion are also a concern, especiallyin the lower portions of Clark Creek. Channelization efforts begun in the early 1900sbasically turned the stream into a maintained ditch to benefit farming and flood controlefforts even before urbanization impacts affected the stream. Sedimentation has

A-2
apparently been a problem for some time, as the stream was dredged in these early yearsin order to remove agricultural sediment. This maintenance is evident today in the steepvertical banks and sand-dominated bottom substrate. Understanding this combination ofwater quality impairment due to urbanization and the continuation of habitat degradation(as both direct and indirect result of this maintenance) is paramount in assessing thestatus of Clark Creek.
Methods (For a more detailed explanation of methods, please consult Standard OperatingProcedures For Benthic Macroinvertebrates, Biological Assessment Unit, April 2001)
Sampling MethodsBenthic macroinvertebrates were collected using the Division of Water Quality’sstandard qualitative sampling procedure (NCDENR 2001). This method includes 10composite samples: two kick net samples, three bank sweeps, two rock or log washes,one sand sample, one leaf pack sample, and visual collections from large rocks and logs.For sites having a width of less than four meters at the time of sampling, an abbreviated“Qual 4” method was used. In this method, four composites were collected: one kicksample, one bank sweep sample, one leaf pack sample, and visual collections. As thestudy progressed, it became apparent that an additional modification to samplingprocedure was needed that also collected a representative sample of the chironomidpopulation, and a rock/log wash was added. This modification to the “Qual 4” is calledthe “Qual 5”.
The purpose of these collections was to inventory the aquatic fauna and produce anindication of the relative abundance for each taxon. Organisms were classified as Rare(1-2 specimens), Common (3-9 specimens), or Abundant (>10 specimens).
Data InterpretationSeveral data-analysis summaries (metrics) can be produced from standard qualitativesamples to detect water quality problems. These metrics are based on the idea thatunstressed streams and rivers have many invertebrate taxa and are dominated byintolerant species. Conversely, polluted streams have fewer numbers of invertebrate taxaand are dominated by tolerant species. The diversity of the invertebrate fauna isevaluated using taxa richness counts; the tolerance of the stream community is evaluatedusing a biotic index.
EPT taxa richness (EPT S) is used with DWQ criteria to assign water quality ratings(bioclassifications). “EPT” is an abbreviation for Ephemeroptera + Plecoptera +Trichoptera, insect groups that are generally intolerant of many kinds of pollution.Higher EPT taxa richness values usually indicate better water quality. Water qualityratings are also based on the relative tolerance of the macroinvertebrate community assummarized by the North Carolina Biotic Index (NCBI). Both tolerance values forindividual species and the final biotic index values have a range of 0-10, with highernumbers indicating more tolerant species or more polluted conditions. Water qualityratings assigned with the biotic index numbers were combined with EPT taxa richness

A-3
ratings to produce a final bioclassification, using criteria for mountain streams. Theappropriate seasonal corrections were made as needed.
Small streams (less than four meters wide) not in undisturbed watersheds where the Qual4 method was used were considered Not Impaired if they would receive abioclassification of Good-Fair or better using DWQ criteria for larger streams. Smallstreams that received a bioclassification of Fair or Poor continued to be Not Rated. Atpresent, bioclassifications cannot be assigned to samples collected from small streamswhere the Qual 4 method is used unless it is a high quality mountain stream, and thensmall high quality mountain stream correction factors were used. Currently, the Qual 5method is not rated.
EPT abundance (EPT N) and total taxa richness calculations also are used to helpexamine between-site differences in water quality. When the EPT taxa richness ratingand the biotic index differ by one bioclassification, the EPT abundance value was used toproduce the final site rating.
Habitat EvaluationHabitat evaluations were made using the Biological Assessment Unit’s HabitatAssessment Field Data Sheet- Mountain/Piedmont Streams Revs. 4 and 5. Thisassessment assigns a numerical score from 0-100 for the 100m reach of stream sampledbased on channel modification, instream habitat, bottom substrate, pool variety, rifflehabitats, bank stability and vegetation, light penetration, and riparian vegetative zonewidth.
Midge Deformity AnalysisThe use of Chironomus mentum deformities is a good tool for toxicity screening (Lenat1993). At least 20-25 Chironomus are evaluated for deformities and a “toxic score” iscomputed for each site.
BAU data has shown the percent deformities for sites rated Excellent, Good, and Good-Fair averaged about 5%, with a mean toxic score of about 7. Sites with Fair and Poorbioclassifications with stressors considered nontoxic are combined into apolluted/nontoxic group, with a deformity rate of 12% and a mean toxic score of 18."Nontoxic" conditions for this group includes solely organic dischargers (animal wastes)and natural organic loading (swamps). Finally, sites affected by a toxic stressor hadhigher deformity rates. A Fair/Toxic group had a 25% deformity rate and a mean toxicscore of 52. A further significant increase was seen for the Poor/Toxic group: meandeformity rate = 45%, mean toxic score = 100.
Study Sites
A total of eleven samples from the Clark Creek watershed were evaluated during 2000-2001 for this study. Five sites were located on the main stem of Clark Creek(two ofwhich were sampled twice). Two tributaries (Cline Creek and Town Creek) and two

A-4
reference sites (Carpenter Creek and Pinch Gut Creek) also were sampled and served ascontrols for comparison to the main stem sites. (Figure 1.) Standard qualitative samplingwas performed at the three downstream Clark Creek sites, on Town Creek, and on PinchGut Creek. Abbreviated sampling methods were performed on the smaller upstreamClark Creek sites, Cline Creek, and Carpenter Creek. Habitat throughout the watershedwas relatively poor, as heavy sedimentation was suggested by the high percentages ofsand and silt at most sites. Land use contributions to impairment of the stream includethe lack of substantial buffers and the ubiquitous presence of impervious surfaces in thewatershed.

A-5
Figure 1. Overview of sites sampled in the Clark Creek Watershed. WARP sites aredesignated by triangles, rectangles and triangles denote sites also historically sampled,and the reference sites appear as circles.
Clark Cr at 16th St SE
Clark Cr at Sweetwater Rd
Cline Cr at SR 1164
Clark Cr near 20th Ave SE
Clark Cr at SR 1149
Smyre Cr at US 321
Pinch Gut Cr at SR 2007
Clark Cr at SR 2012
Carpenter Cr at US 321

A-6
Clark Creek at Sixteenth StreetThis site is located above a large quarryoperation and was selected in order tobetter determine the effects of the quarryon the Sweetwater Road (nextdownstream) site. Of the main stem andtributary sites sampled, this location hasthe best habitat overall. Though situated inthe urbanized area of the watershed(approximately a quarter of a mile from thebare dirt construction site at the source),this furthest upstream site is surrounded byforest with lower-density residential areas extending beyond sizable intact riparian zones.The low banks have moderate erosion. Gravel and cobble are abundant throughout thiswell-defined riffle-run system, but riffles are highly embedded. Sand comprises 40percent of the substrate, even this far upstream in the watershed. Flow conditions werelow to normal at the time of sampling, exposing roots mats above the water line. Thewater was clear, though periphyton was found in abundance.
Clark Creek at Sweetwater RoadThis site was sampled twice. The first sampling was performed in July of 2000, using theabbreviated Qual 4 method. A Qual 5 sample was taken on the return visit in April of2001 to further examine the choronomid population. The riparian zone is basicallynonexistent at this site, with Interstate 40 less than six meters from the right bank, and atwo-track path and a parking lot (for a wood finishing shop) less than twelve meters fromthe left bank. The stream appears to be channelized and filled in with sediment, withactive bar development occurring. The upstream boundary of the sampling reach is a“bridge” of pavement laid over three concrete culverts. These culverts went from abouthalf-full to completely full of sediment in the nine months between visits. Water istherefore forced to flow over the bridge rather than through the culverts. During periodsof low flow, it is possible that the plugged culverts act as a dam impeding flow. The onlyrocks found instream near the site are just below these culverts, and may have fallen fromthe banks where they were placed for stabilization purposes. This riprap has successfully

A-7
anchored large trees, shrubs, and grasses on the banks (which allows for a more woodedappearance in the photos below). The banks are about four meters high and relativelysteep. Instream habitat is sparse. Cobble and gravel are in the upper half of the reach,but the lower half is mostly unstable sand and (to a somewhat lesser extent) silt. Thelower portion of the reach provides undercut banks and root mats and a few sticks andleaf packs for colonization. Podostemum was present at the time of the July sampling,but was absent in April.
Clark Creek near Twentieth AvenueSoutheastThis site is in an area of Hickory changingfrom industrial urban to more ruralactivities. It is located near an online pumpstation and an active composting facility.This segment of stream is adjacent to acow pasture on the left bank and amaintained sewer line right of way thatborders forest on the right bank, but theriparian zone itself is less than six meterswide. The stream appears deeply incisedand channelized, with very steep unstable banks vegetated with grasses, shrubs, and a fewlarge trees. The bottom substrate is nearly all sand, and significant bar development isevident. Low flow conditions were observed at the time of sampling. Undercut banksand root mats were abundant, and rocks, sticks, leaf packs, snags and logs werecommonly found.
Clark Creek at SR 1149This site was sampled twice, in July of 2000 and again in April of 2001. The surroundingland use at this point is primarily low-density residential and agriculture (active crops orfallow fields, according to season, and active pasture), and includes a small portion offorested area as well. The channel is straight and deeply incised, with steep severelyeroding banks vegetated with annual grasses and few large trees. The riparian zone o fgrasses and shrubs was considered intact on the left bank, and was greater than eighteenmeters wide. The wooded riparian zone on the right bank was less than six meters wide.

A-8
In July, a debris jam served as the upstream boundary. The downstream boundary of thereach is a cement covered sewer pipe just upstream of the SR 1140 bridge. The bottomsubstrate is mostly sand and active bar development is obvious. Riffles are basicallyabsent in this filled- in run system. Flow conditions were low in the July sampling andmoderate in the April sampling. In July, habitat for colonization included sticks, leafpacks, snags, logs, undercut banks, and root mats. In April, undercut banks and root matswere abundant, and snags, logs, sticks and leaf packs were rare.
Clark Creek at SR 2012In this portion of the watershed, Clark Creek is in a rural setting. Visible land useincludes active cow pastures and a sod farm. Sand dipping operations are located aboveand below this site. Newton’s wastewater treatment plant discharge is upstream of thesite. The riparian zone was dominated by shrubs and grasses and was less than six meterson both banks, with breaks occurring frequently, usually in the form of cow paths to thestream. The channel is straight and filled in with sediment. Active bar development isobvious in this run system. Though they are vegetated with trees, shrubs, and annualgrasses, the banks are steep, deeply incised, unstable, and severely eroding. There are noreal riffles. Rather, gravel runs were sampled. Instream habitat includes sticks, leafpacks, snags, logs, undercut banks and root mats. Flow conditions were low at the timeof sampling.
Cline Creek at SR 1164Cline Creek enters Clark Creek between the Twentieth Avenue and SR 1149 sites. Thistributary is also potentially impacted by urban runoff. Visible land use includesresidential, commercial, and industrial. The riparian zone is approximately six to twelvemeters wide with occasional breaks. The upstream portion of the reach includeshardwoods and shrubs, but the downstream portion near the culvert is an open area ofmostly grasses. The downstream boundary of the sampled reach is the cement culvertunder SR 1164. Sedimentation is obvious at the culvert as one of the three partitions inthe culvert acts as a trap and has filled in. The channel appears to be natural withfrequent bends, but the stream is deeply incised. Banks exhibit severe erosion as they areprimarily vegetated with grasses and a few shrubs. The bottom substrate is nearly allsand at this site, though some gravel and cobble is present. Instream habitat includes

A-9
sticks, leaf packs, snags, logs, undercut banks root mats and some rocks. Flow conditionswere low at the time of sampling.
Town Creek at US 321The confluence of Town Creek with Clark Creek is between the SR 1149 and SR 2012sites. The sampling area is below the Town Creek and Town Creek confluence, so thewaters that eventually enter Clark Creek originate in the urban areas of Newton (TownCreek), as well as the less densely populated outskirts (Town Creek). The stream appearsto have been channelized in the past. The land adjacent to the stream includes activepastures and the National Guard Armory. Estimated watershed use is divided betweenagriculture and urban. The riparian zone is less than six meters on both banks, withbreaks common on the right bank, but rare in the left. A paved walking path parallels theleft bank, and a storm drain is on the left bank at the upstream portion of the reach. Thistributary is deeply entrenched and exhibits the familiar steep straight banks, abundance ofsand and sediment deposition, andmidstream bar formation seen in ClarkCreek. Banks have areas of moderateerosion as bank vegetation is a sparse mix.Riprap and asphalt are present on the banksin areas, but not found extensivelythroughout the reach. The bottom substrateis mostly sand, but there also is asubstantial amount of cobble and a numberof riffles. Rocks, sticks, leaf packs, snags,logs, undercut banks and root mats arecommon. The current was moderate at thetime of sampling.
Carpenter Creek at US 321Carpenter Creek was selected in hopes of serving as a control to compare results from thesmaller upstream Clark Creek sites at 16th Street and at Sweetwater Road. Visible landuse at this site includes forest and fallow fields in equal amounts, with residentialactivities occurring to a lesser extent. Watershed land use is estimated to be mostlyforest, with some residential and agriculture land use. There are narrow strips of wooded

A-10
area adjacent to Carpenter Creek in the extreme downstream and upstream areas.Transecting the stream at the middle of the reach appears to be cleared right-of-way.Patches of cleared areas and fallow fields are interspersed amongst forested areas on theleft bank. A tributary that appears to be a maintained ditch (but still has cobble) flowsthrough a fallow field behind a house on the right bank, and enters Carpenter Creek in theupstream portion of the reach. The riparian zone on this side is less than six meters.Upstream of the sampled area, a steep-banked dirt road makes its way down a large(thinned) wooded hill. Large concrete bases have been placed at the stream banks, andthe dirt road continues on its course on the right bank. It appears that a bridge willeventually allow this road to continue across the stream. Though it does exist, bankerosion at the site is less severe than most of the Clark Creek sites, as the banks are not ashigh and have a gentler slope. The banks are vegetated with generally healthy trees andshrubs, but bank vegetative cover and overall shading are less substantial here than at anumber of the Clark Creek sites. Riffles are frequent, as rocks are abundant in thestream. The middle of the reach (in the right of way area) is a continuous cobble riffle.Rocks are present upstream and downstream of this area, but not to as great an extent.Because the stream is sandier above and below the riffle area, embeddedness is about40%. Barring the right of way difference, bottom substrate at this site is similar to theSixteenth Street site. There is much more cobble and gravel at these two sites than at thesand-dominant Sweetwater site. A greater percentage of rocks, sticks, leaf packs,undercut banks, and root mats are available for colonization in Carpenter Creek than theupper Clark Creek sites. Low flow was noted at the time of sampling, as was excessiveperiphyton growth.
Pinch Gut Creek at SR 2007Pinch Gut Creek was sampled as a reference for the larger downstream Clark Creek sites.Similar to the lower portion of Clark Creek, adjacent land use appears to be primarilyagriculture and forest. Land use adjacent to the stream is mostly fallow fields, but somelow-density residential and forested areas are present as well. The site was located at theend of a cul-de-sac. At one time, the road crossed the stream at our sampling site, buthad apparently been rerouted downstream as an old bridge rise and fallow fields leave anopen swatch through the middle of the sampling area. Wooded areas are adjacent to thestream above and below this open area. A tributary enters the stream in the woods on theright bank in the upstream portion of the reach. The channel appears to be natural, with
A-11
frequent bends. The reach can be described as having two distinct types of habitat. Inthe middle, at the remains of the bridge rise, the banks are steep and straight, vegetationis mostly grasses, and severe erosion areas are obvious. Within this middle area, thesubstrate is mostly cobble. Riffles are considered infrequent because this is the only arearocks are found in abundance. Above and below the open area, a mix of a large trees andshrubs provides optimal shading and holds the banks together better. Some areas oferosion are still present, though to a lesser extent than the Clark Creek sites. Within theseareas, the bottom substrate is nearly all sand. These areas are also major contributors ofsnags and logs, undercut banks and root mats, and (to a lesser extent) sticks and leafpacks. These, in conjunction with the rocks found in the open middle area, amounted toabout 50-70% of reach favorable for macroinvertebrate colonization. Temperature,dissolved oxygen, and pH were similar to the Clark Creek site sampled at the same timeof year, but conductivity was significantly lower in Pinch Gut Creek. Conductivity wasalmost 60% lower than the lowest Clark Creek reading, and almost 120% lower than thehighest reading on Clark Creek.

A-12
Results
Table 1. Summary of WARP sampling results of Clark Creek. EPT richness is denotedas EPT S and represents the number of EPT taxa. EPT N corresponds to the number ofindividual organisms within the orders of Ephemeroptera, Plecoptera, and Trichoptera; orEPT abundance.
Clark Clark Clark Clark Clark Clark Clark16th St Sweet-
water RdSweet-
water Rd20th Ave
SESR 1149 SR 1149 SR 2012
4/17/01 7/18/00 4/17/01 8/14/00 7/26/00 4/17/01 7/26/00Total Taxa Richness 28 22 19 42 37 49 38EPT N 18 43 5 50 50 71 55EPT S 9 8 3 10 13 20 13 SeasonalCorrection
7 N/A 2 N/A N/A 15 N/A
Biotic Index 7.21 6.62 7.61 6.58 6.16 5.68 6.09 SeasonalCorrection
7.41 7.81 N/A N/A 5.88 N/A
EPT BI 5.70 6.49 6.58 6.02 5.59 4.61 5.64Bioclassification Not
RatedNot
RatedNot
RatedFair Fair Good-
FairFair
Habitat Score 70 40 44 52 54 39 40Drainage Area (mi2) ~1.2 3.7 3.7 ~8 ~15 ~15 ~32Sample Type Qual 4 Qual 4 Qual 5 Full Scale Full Scale Full Scale Full Scale
Table 2. Summary of WARP sampling results of Clark Creek tributaries and referencestreams.
Cline Cr Town Cr Carpenter Cr Pinch Gut CrSR 1164 US 321 Bus US 321 Bus SR 20077/26/00 8/14/00 4/17/01 4/17/01
Total Taxa Richness 37 49 57 76EPT N 60 58 72 94EPT S 16 14 27 29 Seasonal Correction N/A N/A 20 22Biotic Index 5.57 5.65 4.66 5.31 Seasonal Correction N/A N/A 4.86 5.51EPT BI 5.22 5.41 4.44 4.31Bioclassification Not Impaired
(at least Good-Fair)Good-Fair Not Rated Good
Habitat Score 53 58 72 56Drainage Area (~mi2) ~4.3 7.5 ~2.8 ~20Sample Type Qual 4 Full Scale Qual 5 Full Scale
Historically, Clark Creek was dominated by species tolerant of organic enrichment andtoxins. Once the major point source problems were minimized, it became clear that
A-13
dischargers were not wholly responsible for the impact on the benthic community ofClark Creek. Impacts from nonpoint source issues, especially the degradation of habitat,sediment loading, and urban runoff problems are still present.
During the 2000-2001 WARP sampling, sedimentation was confirmed as a seriousproblem. All sites received low habitat evaluations, and sand was the dominant substrateof the deeply incised channelized stream. Generally speaking, values for pH, DO andconductivity did not vary greatly across locations on Clark Creek. Conductivity on ClarkCreek was much higher than both reference sites, however, potentially implicating waterchemistry problems associated with urban runoff. There were two exceptions, to thisconsistently elevated conductivity. The Sixteenth Street site had marginally lowerconductivity and better habitat. The site at SR 2012, on the other hand, had unusuallyhigh conductivity compared to the rest of the stream. This site was below the NewtonWWTP, and has consistently had high conductivity readings. This is especially true atlow water periods, when the majority of the creek consists of treated water from theplant. Benthos in both these instances did not necessarily reflect a significant effect in thecommunity composition in response to the high or low conductivity, however.
In general, there were subtle indications of downstream improvement in taxa richness onClark Creek, though all sites were still impacted. EPT abundance exhibited a verynarrow range throughout, and very few indicator species were found. Though return tripswere made specifically in search of Chironomus for toxics evaluations, chironomids andColeoptera were sparse. Tributary sites all fared better than Clark Creek sites, thoughthey, too, were well-developed. Evidence of urban development stress is recognized inan overabundance of sand in these tributaries as well. Reference streams were far lessimpacted. Carpenter Creek, however, appeared to have similarly declined since it waslast sampled.
Clark Creek at Sixteenth StreetDespite the fact that habitat appears more favorable, benthos are sparse at the SixteenthStreet site. The stream is too small to rate at this site, but is clearly impacted. Stenonemamodestum, Baetis spp., Conchapelopia group, and Cheumatopsyche, fairly tolerantorganisms that are commonly found in impacted conditions, were absent here thoughthey were found at all other downstream sites. Cricotopus varipes group and Cricotopusinfuscatus (C/O sp. 5 and 6) are highly tolerant toxicity-indicating chironomids that wereplentiful at this site. The impacted benthic community at this site is indicative of poorwater quality associated with urban runoff from the upper portion of the watershed.Habitat may be the one thing that is keeping this site from being as severely impacted asthe site immediately downstream. Implications of water quality effects by toxic inputswould logically carry on to the sites downstream of this headwater site.
Clark Creek at Sweetwater RoadThe stream is too small at this site to rate using conventional methods. The benthiccommunity is clearly impacted, however. Taxa richness was lower at this site than anyother site in the watershed. Cricotopus infuscatus group: C/O sp. 5 was common,indicating that toxicity problems present at the upstream site are also a problem at this
A-14
site. EPT taxa were all but nonexistent, and the organisms that were present weretolerant taxa. Even tolerant odonates and Stenonema modestum were reduced. Thesecond time the site was visited, the community was even more impacted. Water qualityaffected by the toxic inputs remain a viable concern at this site. Stenonema modestum,Allocapnia spp., and Isoperla holochlora were found in April at the reference site only.Stenonema were present at the Sweetwater site as well, but only in July. The organismswere present when flow was low in the impacted stream, and when flow was normal inthe reference stream, but not at normal flows (following rain events) in the impactedstream. One would anticipate normal flow conditions to be favorable over droughtconditions, unless rains providing higher flows were also delivering toxicants to thestream along with the water. The reference stream, unlike Clark Creek, was not locatedin an urban center where runoff problems could have been the source of impact on thestream. Runoff, therefore, was most likely providing the stress resulting in the impactedbenthic community in Clark Creek at Sweetwater Road. Results at this site were alsoworse than those for the Sixteenth Street site sampled on the same day in April,indicating that poor habitat further confounds problems at the Sweetwater Road site. Anyrelief that the Sixteenth Street site is afforded through favorable habitat is not available atthe Sweetwater Road site. Between the two sites, the stream flows past an (activelyeroding and unstable) quarry, heavily urbanized areas, and numerous commercialconstruction sites before winding back and forth beneath Interstate 40. As a result, severesedimentation problems are also obvious. There is a single riffle (formed as a result ofmanmade bank stabilization attempts), but it is insignificant in providing any positiveimpact to the benthic community.
Clark Creek near Twentieth Avenue SoutheastThe Twentieth Avenue site fared a little better than the most upstream sites. Though thissite received a “Fair” rating, taxa richness was more than double and EPT abundance wassignificantly greater than the Sweetwater samples. This was due to an increase in Baetisspp., Stenonema modestum, and Hydropsyche betteni. Though they allowed for a lowerBI than the upstream sites, these are all tolerant taxa. No indicators of major recoverywere found at this site.
Clark Creek at SR 1149The first real signs of any sort of recovery on Clark Creek were at SR 1149. The July2000 sampling produced a “Fair” rating, and the return trip in April 2001 resulted in a“Good-Fair “ rating. The appearance of EPTs such as Isonychia, Centroptilum, Leuctra,Diploperla duplicata, Eccoptura xanthenes, Acroneuria lycorias, Amphinemura spp.,Ironoquia punctatissima, Lepidostoma spp., Lype diversa, Nectopsyche exquisita, andPycnopsyche spp. occurred at this site. An increase in Cheumatopsyche was also evident.None of these were especially intolerant species and were usually only found one or twoat a time, however. Between the 20th Avenue site and this location, stream size increases(due to the addition of Cline Creek) and the stream enters a more rural setting. Thisapparently has a positive (albeit meager) effect. Somewhat better results were seen inApril 2001 than in July 2000. Slight increases in EPT taxa richness and abundanceallowed for an increase bioclassification. Perhaps the rains that brought the area out ofdrought conditions allowed for more favorable flow conditions for colonization.
A-15
Clark Creek at SR 2012This site also received a “Fair” classification. At this point, indicators of larger streamssuch as Hydropsyche venularis appeared. Oecetis persimillis, Macronychus glabratus,Macromia, and Physella also appeared for the first time, and Triaenodes ignitus wasabundant at the site. Though the appearance of these organisms (especially theTrichoptera) was a positive turn (as opposed to lacking benthos entirely), the new specieswere more tolerant ones. Overall, results were very similar to the SR1149 site.Conductivity was 527 ����������������������� ������������������� ����������������at low flows had been known to contribute a majority of the volume of the stream.
Cline Creek at SR 1164Both tributary sites appeared to be less impacted than Clark Creek. Cline was found tobe “Not Impaired (at least Good- Fair)”. Though still in a suburban transition area (butstill less developed than Clark Creek), it proved to have a greater diversity of EPTs thanits mainstem counterparts. Intolerant Glossosoma, and Neophylax oligius were presenthere but not at any Clark Creek sites. The moderately high EPT abundance and richnesscombined with a noticeably lower chironomid count allowed for a lower BI at this sitethan any Clark Creek site.
Town Creek at US 321Town Creek received a “Good-Fair” classification. Though no notably intolerant specieswere found in any abundance in at this site, a relatively diverse benthic community (withrelatively high EPT richness and abundance values and a moderate midge assemblage)allowed for a relatively low BI. Instream habitat scores do not reflect significantimprovements, and though boulder, rubble, and gravel are present to some extent, sand isstill the dominant substrate type. Stream size and less urban land use may be the keyfactors that allowed this stream to escape the heavier impacts of urban water qualityproblems that Clark Creek has incurred.
Carpenter Creek at US 321Carpenter Creek fared well in comparison to Clark Creek upstream sites. This streamcould not be rated due to the use of the Qual 5 sampling method, but exhibited a thrivingdiverse benthic community. Taxa present only at the reference site were intolerant(Diplectrona modesta, Neophylax oligius, and Optioservus spp.) and relatively intolerant(Pycnopsyche spp. and Dicranota spp.) clean stream indicators. Fortunately, both theSixteenth Street and the Sweetwater sites were sampled at the same time this referencestream was sampled, therefore seasonality and weather differences were able to befactored out when comparing the streams. As anticipated, results for the most upstreamimpaired site more closely resembled the reference than the more downstreamSweetwater site. Normal clean stream species (Parametriocnemus lundbeckii) and arelatively toxic-tolerant normal sandy stream family (Lumbriculidae) indicated moderatestress at both the Sixteenth Street and Carpenter Creek sites. Nais sp., an indicator ofenrichment, was found in Carpenter Creek, but was in greater abundance at SixteenthStreet.

A-16
Pinch Gut Creek at SR 2007Overall, EPT richness and abundance were much greater for this reference stream,allowing for a “Good” bioclassification rating at this site. ( It should be noted whendrawing comparisons between the impaired and reference sites that the luxury of havingsampled all the sites being scrutinized in the same season was, unfortunately, not the casewhen addressing the downstream sites.) Pinch Gut Creek had at least twice the numberof Ephemeroptera (including Baetisca carolina, Dannella simplex, and Hexagenia spp.)than the summer Clark Creek sites, and almost twice the number of the SR 1149 site inthe same season. There was also a greater number of Plecoptera (Paragnetina fumosa,Perlesta spp., and the intolerant Isoperla spp.) and Trichoptera (Lepidostoma spp.,Polycentropus spp., and intolerant Neophylax oligius) than all the Clark Creek samplings,though the differences between the two streams were not as great for these orders. Therelatively intolerant Parametriocnemus lundbeckii is a clean stream moderate stressindicator and was abundant in the reference site, and only rarely found in Clark Creekduring the April SR 1149 sampling. Elimia sp was also in abundance in the referencestream, but not found in the impacted stream. This gastropod is immobile, long-lived andgenerally intolerant. While an abundance of Baetis spp (especially the abundance ofBaetis flavistriga at SR 1149 in April) indicated enrichment in Clark Creek, there was alack of these organisms in Pinch Gut Creek. The recovery seen in the furtherdownstream samples of the impacted stream did bring the Clark Creek results closer tothe reference stream results in some cases, however. Facultative Polypedilum spp. andStenonema modestum were found throughout the downstream portion of Clark Creek aswell as in Pinch Gut Creek. The return of these benthic organisms may indicate a degreeof downstream recovery in Clark Creek.
DiscussionIn assessing potential sources of impact to Clark Creek, as with many urban streams,attention is drawn to effects of urban runoff and habitat degradation. The headwaters ofClark Creek are heavily influenced by urban/suburban runoff in addition to anoverabundance of sedimentation, while downstream recovery continues to be hamperedby sedimentation and general lack of favorable habitat. Most of the Clark Creek sitesreceived “Fair” or “Good-Fair” ratings for 2000-2001 WARP sampling. Slightimprovements in EPT richness and biotic index values are apparent downstream, thoughdifferences in the benthic community are not significant. The community compositionchanges from highly tolerant species upstream to facultative species downstream. Bothtributaries fared better than Clark Creek, suggesting that reasonable targets forremediation for Clark Creek lay within the watershed itself. The difference betweenClark Creek and its tributaries may be density of urbanization.
After the first round of WARP sampling, an apparent lack of chironomids in the upstreamsites necessitated a return visit in hopes of evaluating toxicity impacts. Deformitycomparisons could not be drawn however, as Chironomus were lacking on the return trip.Possible explanations for the lack of benthos seem related to flow. Because low waterconditions prevailed for the majority of 2000 and into 2001, stream permanence wasscrutinized. Flow was low but sufficient at the time of sampling, however, and impacts

A-17
to benthos were still evident. Hydropsyche betteni, a flow dependent organism, was stillfound at the suspect sites, so it is reasonable to argue that the stream must have hadsufficient water for it to have remained.
Another possible source of impairment to the upper portion of the stream was thedelivery of toxins to the stream during rain events. In this case, higher flows were moreof a detriment to the benthic community. This contention was best demonstrated bycomparing reference and upstream Clark Creek sites. Habitat was similar between theCarpenter Creek reference site and the Sixteenth Street site, the uppermost Clark Creeksite. The Sweetwater Road site, the next downstream site on Clark Creek, had lessfavorable habitat than either the upstream Clark Creek site or the reference site. Resultsof the benthic surveys, however, were similar between the two Clark Creek sites, whileCarpenter Creek’s benthic community was much less impacted. The water quality ratherthan the instream habitat must have been responsible for the decline. After comparingthe July 2000 low flow sampling of the Sweetwater Road site to the April 2001 sampling(which followed significant rains), it became obvious that with an increase of flow camea decline in benthos- the opposite of what would normally be expected. With moderateflow, in this case, came the expense of toxic urban runoff.
Effects of runoff decreased downstream. Stream size increases and urban pressureslessen as the stream flows through a more rural setting with less impervious cover.Instream habitat throughout the watershed is generally quite poor, however, as sand is theprevalent substrate. Though the lower portion of the watershed is allowed a certaindegree of relief from the impacts of runoff, the effects of sedimentation inhibit anysubstantial recovery in benthos.
Channelization activities took place in the early 1900s on Clark Creek. In order to aidfarmers in growing corn, the stream was dredged to nine feet deep and sixteen feet wideto better drain the bottomland. Channelization took place beginning just downstream ofthe Sweetwater site, and included the 20th Avenue, SR 1149, and SR 2012 sites. It isuncertain whether Cline and Town creeks were included in these efforts, but it issuspected that at least the areas adjacent to the confluence with Clark Creek wereimpacted. At the very least, it is certain that the impacts from these activities were seenin the stream’s substrate composition as well as the channel and bank characteristics.Channelization activities were carried out as late as 1920, but further research is beingdone to determine more specifically what was done, to what extent, and how recently, inorder to better assess the effects exhibited today.
Benthic community composition results did not reveal any indication of low DO ororganic loading at the time of WARP sampling. Conductivity was elevated (above 500)at SR 2012, the site below the Newton WWTP, however. At the time the site wassampled, negative impacts from the plant were not evident in biotic index values, though.It was also noted that the treatment plant could contribute half of the flow of Clark Creekat certain times of the year. Though there were no significant differences in the samplesjust up- and downstream of this site at the time it was sampled, further investigationmight be necessary to more fully evaluate effects of toxicity.

A-18
AppendicesThe following tables represent historical and WARP station summary data for the ClarkCreek Watershed. Historical samples are shaded; WARP samples are not.
Appendix 1: Station Summary DataBlank cells represent data that is not available. Bioclassification ratings could not beassigned to samples collected by the Qual 5 method.
Appendix 2: Taxa ListData is reported as “R” (rare, 1-2 specimens), “C” (common, 3-9 specimens), or “A”(abundant, >10 specimens).
NOTE: These appendices are available from DWQ uponrequest.

Appendix B
Water Quality Conditions


B-1
Appendix BWater Quality Conditions
A wide range of chemical, physical and toxicological analyses were conducted in the ClarkCreek watershed over the course of this study. This appendix describes the general approach andmethods used and summarizes monitoring results. Specific sampling methods are documented inthe project’s Standard Operating Procedures for Chemical/Physical Toxicity Monitoring(NCDWQ, 2001a) and are not described here.
Section 1 Approach and Methodology
Chemical-physical and toxicity monitoring conducted during the study had two broad goals:1. General water quality characterization. This goal involved developing a synoptic picture of
the chemical and physical water quality characteristics of the study area, using a standard setof parameters.
2. Stressor-source area identification. Identifying the causes of biological impairment and thesources of these causal factors was a primary goal of the project and the major focus of themonitoring effort. As it relates to chemical-physical and toxicity monitoring, this goalinvolved:• identifying the major chemical/physical stressors to which aquatic biota (benthos in
particular) in a stream are exposed;• providing information on the nature of exposure to these stressors (e.g. concentration,
timing);• evaluating the toxicity of waters of concern and determining the pollutants causing any
toxicity identified; and• determining major sources or source areas.
The nature of stressor-source identification demands a monitoring approach that is dynamic andflexible, changing over time as new information regarding biological condition, streamchemistry, and watershed activities becomes available.
1.1 General Water Quality Characterization
Routine sampling was conducted at two integrator stations located on the mainstem of ClarkCreek toward the downstream end of each subwatershed study area. The upper integrator station(CLCL01) was located in Southside Park near Newton west of US 321. The lower integratorstation (CLCL02) was located 30 meters upstream of Maiden Road (SR 2007). Surface grabsamples (depth of 0.15 meters, or approximately 6 inches) were collected during both baseflowand storm conditions. Baseflow periods were defined as those in which no measurable rain fellin the watershed during the 48 hour period preceding sampling, based on staff judgment utilizingavailable information. A standard set of parameters similar to the parameters used by DWQ atambient stations was utilized (Table B.1).

B-2
Baseflow samples were collected on roughly a monthly basis. Project staff attempted to collectat least one storm sample during each season, although this was not feasible due to logisticalconstraints and a lack of rain in the fall of 2001. Fecal coliform samples were collected on fiveoccasions under baseflow conditions during August and September 2000.
Table B.1 Parameters for Water Quality Characterization,Clark Creek at Southside Park and Maiden Road
Field Parameters Laboratory ParametersDissolved Oxygen Turbidity Metals:Air Temperature Total Dissolved Solids AluminumWater Temperature Total Suspended Solids ArsenicSpecific Conductance Hardness CadmiumpH Fecal Coliform Chromium
Total Phosphorus CopperAmmonia-N IronNitrate/nitrite-N Lead
Total Kjeldahl Nitrogen ManganeseCalcium MercuryMagnesium NickelPotassium SilverSodium Zinc
1.2 Stressor-Source Identification
1.21 Chemical/Physical Monitoring.
Several types of water column sampling were conducted, reflecting the needs for both stressoridentification and the determination of sources. Stressor identification sites were selected toidentify chemical stressors present in study waters and to provide information for evaluatingwhether those stressors contribute to biological impairment. Source identification sites werechosen to identify or evaluate source areas or individual pollutant sources. While stressor andsource identification can be separated conceptually, in practice stressor and source determinationwere often carried out jointly.
The sampling effort was intended to provide information relevant to the evaluation of causalrelationships by tying selection of sampling sites, parameters and timing of sampling to availableinformation on stressors and sources, e.g. biological information and watershed activities. Thisapproach differed from many commonly used sampling frameworks because the goal was not tocharacterize typical conditions or to estimate pollutant loads, but to provide information to helpevaluate whether particular stressors are likely contributors to biological impairment. The timingand location of sampling were selected to identify critical conditions such as periods of lowdissolved oxygen or exposure to high levels of toxicants.
Station location. The number and location of sites was determined based upon the size of thewatershed, the location and degree of biological impairment, the nature and spatial distribution

B-3
of watershed activities, and existing chemical data. Station locations for stressor identificationpurposes were generally linked closely to areas of known biological impairment (benthicmacroinvertebrate sampling stations) and to specific watershed activities believed to representpotential sources of impairment. Sampling stations in the Clark Creek study area were listed inSection 5 of the text.
Parameter selection. Monitoring focused primarily on candidate stressors initially identifiedbased upon watershed reconnaissance and a review of existing information. Additionalparameters were added as necessary. Given the complex nature of land use in the Clark Creekwatershed, and the inability to rule out many parameters from consideration in the initial stagesof the sampling effort, the number of candidate parameters in streams draining developed areaswas significant. The approach was also shaped by a tension between the need to use projectlaboratory resources efficiently and the limited time frame available for identification of thecauses of impairment. Parameter selection was subject to review on an ongoing basis. Totalconcentration was measured for all analytes. The dissolved fraction was not analyzed.
For purposes of toxicity assessment, the following analytes and parameter groups were routinelysampled during storm events:• metals;• chlorinated pesticides and PCBs (polychlorinated biphenyls; EPA 608);• selected current use pesticides (GC/MS—gas chromatography/mass spectroscopy);• PAHs (polycyclic aromatic hydrocarbons; EPA 610);• phenols (EPA 604);• semi-volatile organics (EPA 625);• MBAS (methylene blue active substances, an indicator of anionic surfactants); and• MTBE (methyl tert-butyl ether).
Type and number of samples. Manual grab sampling was used for nonstorm sampling. Manualgrab samples were collected at the surface (depth of 0.15 meters, or approximately 6 inches).Storm samples were generally collected as grab samples during the rising limb, using eithermanual collection or automatic samplers. The use of automatic sampling equipment was limitedby budgetary constraints.
The number of samples collected was variable, depending on analytical results to date, theoccurrence of appropriate conditions for sampling (e.g. rainfall or rain free periods) and theoutcome of other components of the study. Where sampling was not tied to very specificwatershed activities but targeted at more general source areas, staff generally attempted tocollect repeated samples (at least 3-4) under the relevant conditions (e.g. baseflow or stormflow,seasonal).
Timing of sampling. Whenever feasible the timing of sampling was based upon availableinformation on likely pollutants, the timing of source activities in the watershed, and knowledgeof watershed hydrology. Baseflow, storm event or other samples were collected as appropriateto the particular stressors and sources. Such linkage is difficult in large watersheds or in urbanareas where the timing of multiple activities in a given drainage is difficult to discern. Thesuspected seasonality of inputs was also considered.

B-4
Multiparameter data loggers. Hydrolab data sondes (multiparameter probes with a data loggingcapability) were deployed for one 4-day deployment in August 2001. Dissolved oxygen (DO),pH, water temperature, and specific conductance were recorded on a quarter-hourly basis. Themultiprobes were deployed simultaneously above and below the Netwon WWTP discharge andat two other upper watershed mainstem locations (20th Ave. SE and Sweetwater Rd.) in order toevaluate daily parameter patterns.
1.22 Toxicity Assessment
Toxicity analyses were conducted at or near benthic sampling locations at which toxicity was asuspected cause of biological impairment. Laboratory bioassays provide a method of assessingthe presence of toxicity from either single or multiple pollutants and can be useful for assessingthe synergistic and cumulative effect of multiple chemical stressors. Acute tests were conductedon storm samples, while chronic tests were conducted on samples collected during baseflowperiods. Multiple tests were conducted at each site at which toxicity was evaluated. The numberof samples varied with specific concerns and resource constraints The following specific testswere used: ambient tests for acute toxicity using protocols defined as definitive in USEPAdocument EPA/600/4-90/027F (USEPA 1993) using Ceriodaphnia dubia with a 48-hourexposure; ambient tests for chronic toxicity using the North Carolina Ceriodaphnia ChronicEffluent Toxicity Procedure (NC Division of Water Quality, 1998).
1.3 Suspended Sediment
Samples were collected for suspended sediment concentration (SSC) analyses (Guy, 1969) usingsingle stage U59B samplers (Inter-Agency Committee on Water Resources, 1961). U59Bs arepassive samplers that collect a single surface grab sample when stage rises to the level at whichthe sampler is installed. Concentrations based on analysis of samples collected by U59Bs arelikely to underestimate actual SSC levels, but can be used for general comparisons.
Groups of samplers were installed at each of five locations to collect samples at multiple stages:CLCL07 (Clark Creek at Sweetwater Road) the most upstream station; CLCL06 (Clark Creek at20th Ave. SE.); CLCL02 (Clark Creek at Southside Park), the most downstream station;CLCN01 (Cline Creek at SR 1164); and CLTS01 (Town Creek at US 321). Stream flow datawere not collected.
1.4 Toxicity Benchmarks
When performing ecological risk assessments and water quality evaluations, contaminants areoften compared to screening benchmarks to determine if the reported concentrations of thosecontaminants are high enough to warrant further consideration. In this study, toxicologicalbenchmarks derived for the protection of aquatic life were used to screen observed contaminantconcentrations for potential aquatic ecological effects. Laboratory detection limits were alsocompared to benchmark values.

B-5
Benchmark screening values denote thresholds of elevated risk, but do not predict actual impactsin particular situations. Actual site-specific and event-specific impacts depend upon theinteraction of numerous factors, including the level, timing and duration of exposure; the formand bioavailability of the particular chemicals (often dependent on pH or other variables); andsimultaneous exposure to other stressors.
Many different sources of screening benchmarks exist, with differing levels of conservatism. Adetailed discussion of these can be found in Suter and Tsao (1996). The primary screeningbenchmarks used in the Clark Creek watershed assessment were 1) EPA’s acute and chronicNational Ambient Water Quality Criteria (NAWQC) for freshwater (USEPA, 1999) and 2)EPA’s Tier II values (USEPA, 1995). The acute NAWQC were established by EPA tocorrespond to concentrations that would cause less than 50% mortality in 5% of the exposedpopulations in a brief exposure. The chronic NAWQC are the acute values divided by thegeometric mean of at least three median lethal concentrations (LC50). Tier II values weredeveloped by EPA as part of the Great Lakes Program (USEPA, 1995) for use with chemicalsfor which NAWQC are not available. They are based on fewer data than are required toestablish NAWQC.
In this study NAWQC for priority pollutants were taken from EPA’s online Water QualityStandards Database (http://www.epa.gov/wqsdatabase/). NAWQC for nonpriority pollutants,which are not included in the online database, were taken from USEPA (1999). Tier II valuesand other benchmarks were obtained from the ecological benchmark listing available through theRisk Assessment Information System operated by the Oak Ridge National Laboratory(http://risk.lsd.ornl.gov/homepage/eco_tool.shtml).
Where no benchmarks were available, a search of the toxicological literature was performedusing EPA’s online ecotoxicology database, ECOTOX (http://www.epa.gov/ecotox/). Observedconcentrations were compared to effects level values for freshwater aquatic animals.
NAWQC for many metals (cadmium, chromium III, copper, lead, nickel, silver and zinc) are afunction of water hardness. NAWQC are reported by EPA for a hardness of 100 mg/L and mustbe adjusted for site specific hardness levels. In this study benchmarks for all of the above metalsexcept chromium were adjusted for hardness using the formulas recommended in USEPA(1999). The NAWQC for chromium VI (which does not require hardness adjustment) was usedinstead of chromium III, since the former provides a more conservative screening level.
NAWQC for many metals (arsenic, cadmium, chromium, copper, lead, mercury, nickel, silverand zinc) are calculated as the concentration of dissolved metals in the water column.Comparison of the ambient total metals concentrations measured in this study to dissolvedmetals criteria is a conservative approach in that less than 100% of a metal in any particularambient sample may be in dissolved form. This approach is appropriate for initial screeningpurposes. Final evaluation of the likely potential for metals, and other analytes, to negativelyimpact aquatic biota considered all lines of evidence available, including toxicity bioassays andbenthic macroinvertebrate data, in addition to data on analyte concentrations.

B-6
Observed pollutant concentrations can also be compared to the North Carolina’s Water QualityStandards (NCWQS) for freshwater aquatic life, which serve as important regulatorybenchmarks. The present study, however, is concerned not with regulatory compliance but withassessing the risks of site-specific, and sometimes event-specific impacts. The NAWQC aremore appropriate for this purpose. NAWQC were based solely on data and scientific judgmentson the relationship between pollutant concentrations and environmental and human healtheffects, and do not reflect considerations of technological feasibility or economic impact(USEPA, 1999). They allow for the specific evaluation of either chronic or acute concerns andfor the consideration of site specific conditions (e.g. by adjusting metals criteria for localhardness levels).
NAWQC and other benchmarks are not available for metalochlor (CAS 51218452). Based on asearch of EPA’s ECOTOX data base, a number of studies of the effect of metalochlor onfreshwater fish and macroinvertebrates were identified, including Mayer and Ellersieck (1986)and Ort et al (1994), among others. The lowest LC50 reported in these studies was 3200 µg/L,more than 3 orders of magnitude above the highest concentration observed in the Clark Creekwatershed. The lowest effects levels (EC50) for non lethal impacts exceeded 2000 µg/L.
1.5 Laboratories
The study utilized a number of laboratories in order to obtain services for the necessary range ofchemical, physical and biological analyses.• Environmental Chemists (Wilmington, NC)--chemical/physical analysis;• Paradigm Analytical Laboratory (Wilmington, NC)--chemical analysis;• Southern Testing (Rocky Mount, NC)--chemical analysis;• Division of Water Quality Laboratory (Raleigh, NC)--chemical and biological analysis;• NCSU Department of Environmental and Molecular Toxicology (Raleigh, NC)—pesticides;• USGS Kentucky District Sediment Laboratory (Louisville, KY)--suspended sediment
concentration; and• Simalabs International (Burlington, NC)--toxicity bioassay.
Consult the project standard operating procedures document for additional details (NCDWQ,2001a).
Section 2 Results
Key chemical, physical and toxicity monitoring results were discussed in Section 5 of the text.Here we present supplemental information on selected issues, followed by a summary ofanalytical results for all sampling stations.

B-7
2.1 Data Sonde Deployments
To evaluate dissolved oxygen, specific conductance, water temperature and pH, data loggingmultiparameter probes (data sondes) were deployed simultaneously in Clark Creek at fourdifferent mainstem locations: 1) CLCL03 (at SR 2012, 1 mile below Newton’s discharge); 2)CLCL02 (at Southside Park); 3) CLCL06 (at 20th Ave SE ); 4) at CLCL07 (Sweetwater Ave.).Data sondes were deployed for 96 hours and were programmed to take readings at 15 minuteintervals from August 15, 2001 (Wednesday) at 5:00 PM to August 19 (Sunday) at 5:00 PM.Temperatures were typically 21 to 25 degrees C at most locations. The highest temperature(26.8) was recorded at CLCL07.
Low dissolved oxygen concentrations were not observed. At the most upstream and downstreamlocations, CLCL03 and CLCL07, dissolved oxygen and percent saturation levels remained above6 mg/L and 70% respectively. At the Southside Park location, bedload sand surrounded the DOprobe toward the end of the deployment, rendering it inoperative. At the 20th Ave SE location,the DO membrane was damaged soon after deployment.
Specific conductance was relatively constant upstream of the Newton WWTP discharge butfluctuated significantly downstream at CLCL03 (Figure B.1). Such variability was expectedgiven daily fluctuations in the volume of wasteflow. Expectedly, specific conductance was alsomuch higher below the discharge than upstream. This is consistent with total dissolved solids(TDS) levels. Median TDS was 85 mg/L at Southside Park, but 217 mg/L at SR 2007, severalmiles below the discharge.
Figure B.1 Specific Conductance Over 48 Hours Above and Below the Newton WWTP,August 2001
0
100
200
300
400
500
600
700
800
0
600
1200
1800 0
600
1200
1800
Time
Sp
ecif
ic C
ond
uct
ance
(u
S/c
m)
CLCL02
CLCL03
SITE CODE
B-8
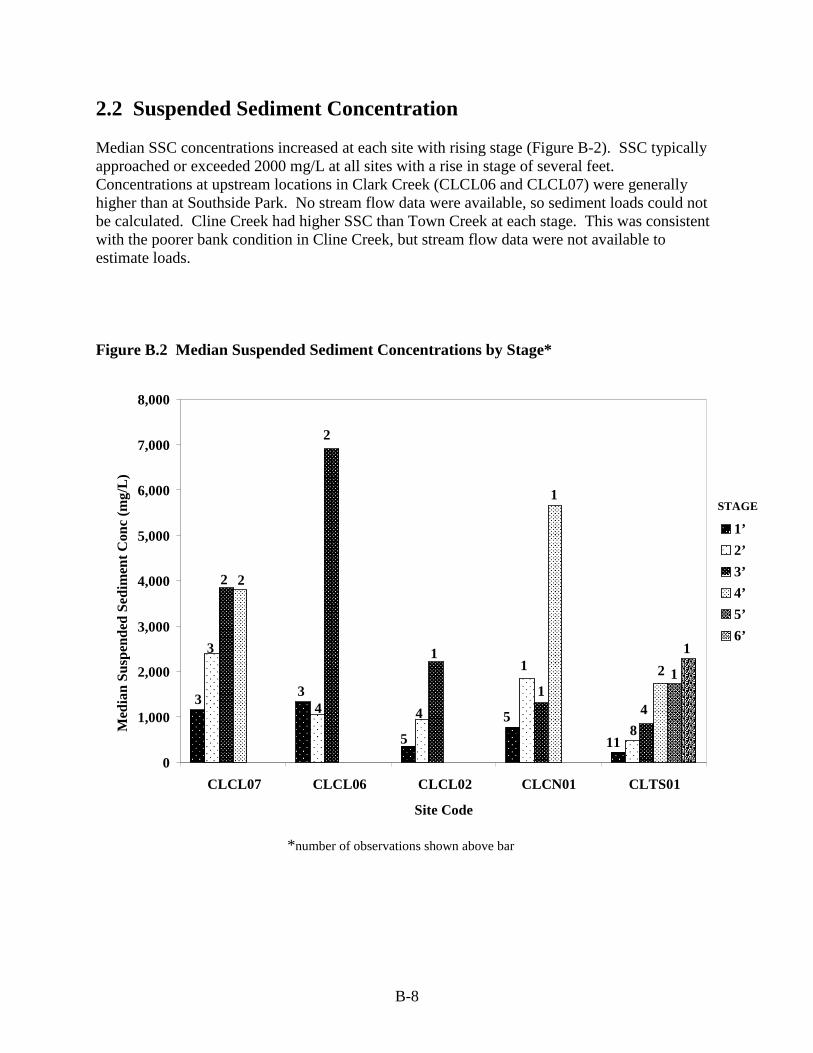
2.2 Suspended Sediment Concentration
Median SSC concentrations increased at each site with rising stage (Figure B-2). SSC typicallyapproached or exceeded 2000 mg/L at all sites with a rise in stage of several feet.Concentrations at upstream locations in Clark Creek (CLCL06 and CLCL07) were generallyhigher than at Southside Park. No stream flow data were available, so sediment loads could notbe calculated. Cline Creek had higher SSC than Town Creek at each stage. This was consistentwith the poorer bank condition in Cline Creek, but stream flow data were not available toestimate loads.
Figure B.2 Median Suspended Sediment Concentrations by Stage*
*number of observations shown above bar
3 3
5
5
11
3
4 4
1
8
2
2
1
14
2
1
2 1
1
0
1,000
2,000
3,000
4,000
5,000
6,000
7,000
8,000
CLCL07 CLCL06 CLCL02 CLCN01 CLTS01
Site Code
Med
ian
Susp
ende
d Se
dim
ent C
onc
(mg/
L)
1’
2’
3’
4’
5’
6’
STAGE

B-9
2.3 Toxicity Bioassay Results
Results of the 11 chronic bioassays and 4 acute bioassays conducted are shown in Table B.2. Alltests passed. Some mortality occurred during the acute tests conducted on June 27, but levelswere low and not indicative of likely toxic impacts.
TABLE B.2 Chronic and Acute Bioassay Results for Clark CreekAcute Bioassays
Site Sample Date LC50 CommentsCLCL01 March 21, 2001 >100%CLCL02 March 21, 2001 >100%CLCL01 June 27, 2001 >100% 10% mortality @ 12.5% test concentrationCLCL02 June 27, 2001 >100% 10% mortality @ 75% and 100% test concentrations
Chronic BioassaysSite Sample Date Pass/Fail Summary Data
Mean SampleReproduction
Mean ControlReproduction
Control Coefficientof Variation
CLCL01 April 17, 2001 Pass 30.8 31.3 9.7CLCL02 April 17, 2001 Pass 33.0 34.5 11.7CLCL01 May 17, 2001* Pass 24.1 21.8 11.9CLCL02 May 17, 2001* Pass 23.0 20.0 18.7CLCL03 May 17, 2001* Pass 23.3 20.9 17.8CLCL01 June 15, 2001 Pass 29.8 27.6 11.3CLCL02 June 15, 2001 Pass 25.2 22.8 16.7CLCL03 June 15, 2001 Pass 22.8 25.3 11.1CLCL01 October 9, 2001 Pass 22.7 20.1 32.5CLCL02 October 9, 2001 Pass 28.8 23.5 16.7CLCL03 October 9, 2001 Pass 26.2 15.8 38.7
* Tests conducted without stream renewal sample due to rain between initial sampling and renewal. Failure toemploy a second sample for test renewal may reduce the ability of the test to identify toxic effects.
2.4 Summary of Chemical/Physical Data
Tables B.3 to B.12, which follow the references, summarize the physical and chemical datacollected at the primary sampling locations described in Section 5 of the main text. Columnheadings for these tables are given below:
N number of samples or measurements#Det number of samples at or above the minimum analytical reporting levelMax maximum valueMin minimum valueMed medianMean mean (geometric mean, in the case of fecal coliform)

B-10
Min values below the minimum analytical reporting limit are shown in the table as a minimumvalue (Min) less than the specified reporting limit (e.g. “<5.0”). If the reporting limits for aparameter varied, the Min value is reported as a range (e.g. “<5.0-10”).
In calculating means, values below detection limits were assigned a value of ½ the detectionlimit.
Where all samples for a parameter were below the reporting limit for a parameter, the maximum,median and mean values were not calculated. The minimum value is shown as < reporting limit.
When only a single sample was analyzed and the value exceeded the reporting limit, the value isreported in the Max column. Median and mean values were not calculated.
Section 3 References
Guy, H.P. 1969. Laboratory Theory and Methods for Sediment Analysis. US Geological SurveyTechniques of Water-Resources Investigations, Book 5 Chapter C1.
Inter-Agency Committee on Water Resources. 1961. The Single Stage Sampler for Suspended Sediment.Report No. 13. [Available from Federal Interagency Sedimentation Project, WaterwaysExperiment Station, Vicksburg, MS].
Mayer, F.L.J. and M.R. Ellersieck. 1986. Manual of Acute Toxicity: Interpretation and Data Base for 410Chemicals and 66 Species of Freshwater Animals. Resource Publication No. 160. USDepartment of the Interior. Fish and Wildlife Service. Washington, DC.
NCDWQ. 2001a. Standard Operating Procedures for Chemical/Physical Toxicity Monitoring.Watershed Assessment and Restoration Project. NC Division of Water Quality.
NCDWQ. 1998. North Carolina Ceriodaphnia Chronic Effluent Toxicity Procedure. December 1985,Revised February 1998. NC Division of Water Quality.
Ort, M.P., J.F. Fairchild and S.E. Finger. 1994. Acute and Chronic Effects of Four CommercialHerbicide Formulations on Ceriodapphnia Dubia. Arch. Environ. Contam. Toxicol. 27:103-106.
Suter, G.W. and C.L. Tsao. 1996. Toxicological Benchmarks for Screening of Potential Contaminants ofConcern for Effects on Aquatic Biota: 1996 Revision. Report ES/ER/TM-96/R2. US Dept ofEnergy. Oak Ridge National Laboratory, Oak Ridge, TN.
USEPA. 1993. Methods for Measuring the Acute Toxicity of Effluents to Freshwater and MarineOrganisms. Fourth Edition. EPA/600/4-90/027F.
USEPA. 1995. Final Water Quality Guidance for the Great Lakes System. 40 CFR Parts 9, 122, 123,131, 132. Federal Register. 60:56:15365-15425. March 23.
USEPA. 1999. National Recommended Water Quality Criteria--Correction. EPA 822-Z-99-001.

B-11
TABLE B.3 Water Quality Summary for Clark Creek at Maiden Road (Site CLCL01)
N #DET MAX MIN MED MEAN N #DET MAX MIN MED MEAN
Field ParametersAir Temperature (oC) 9 N/A 29 10 20 20 2 N/A 29 8 19 19Water Temperature (oC) 17 N/A 24.3 5.1 17.3 16.5 2 N/A 21.5 7.8 14.7 14.7Specific Cond (µS/cm) 23 N/A 660 126 307 317 2 N/A 223 68 146 146DO (mg/L) 17 N/A 10.3 5.8 7.6 8.0 2 N/A 7.8 7.5 7.7 7.7DO (% saturation) 12 N/A 91.0 73.0 87.5 85.1 2 N/A 85.0 66.0 75.5 75.5pH (Standard Units) 9 N/A 7.7 7.1 7.3 7.4 2 N/A 7.1 7.0 7.1 7.1
Nutrients (mg/L)Ammonia Nitrogen 5 5 0.2 0.1 0.2 0.2 2 2 0.1 0.1 0.1 0.1Total Kjeldahl Nitrogen 5 5 1.8 0.7 0.8 1.0 2 2 1.9 0.9 1.4 1.4Nitrate+Nitrite Nitrogen 5 5 2.14 1.17 1.79 1.78 2 2 2.18 0.13 1.16 1.15Total Phosphorus 5 5 0.70 0.08 0.32 0.33 2 2 0.21 0.04 0.13 0.13
Miscellaneous Inorganics (mg/L)Hardness, Total 5 5 69.5 59.0 66.0 65.5 2 2 47.5 34.0 40.8 40.8Residue, T. Suspended 5 5 26.0 7.3 16.0 14.6 2 2 316.0 65.0 190.5 190.5Total Dissolved Solids 5 5 263 94 217 194 2 2 156 87 122 122
Turbidity (NTU) 5 5 25.0 7.0 13.9 14.9 2 2 372.0 79.6 225.8 225.8
MTBE (µg/L) 5 0 < 1.0 1 0 < 1.0
Phenols via EPA Method 604 (µg/L)4-Chloro-3-methylphenol 0 2 0 < 5.02-Chlorophenol 0 2 0 < 5.02,4-Dichlorophenol 0 2 0 < 5.02,4-Dimethylphenol 0 2 0 < 5.02,4-Dinitrophenol 0 2 0 < 5.02-Methyl-4,6-dinitrophenol 0 2 0 < 5.02-Nitrophenol 0 2 0 < 5.04-Nitrophenol 0 2 0 < 5.0Pentachlorophenol 0 2 0 < 5.0Phenol 0 2 0 < 5.02,4,6-Trichlorophenol 0 2 0 < 5.0
Chlorinated Pesticides & PCB’s via EPA Method 608 (µg/L)Alachlor 1 0 < 0.08 0Aldrin 1 0 < 0.01 1 0 < 0.2Atrazine 1 0 < 1.50 0BHC-Alpha 1 0 < 0.01 1 0 < 0.2BHC-Beta 1 0 < 0.01 1 0 < 0.2BHC-Delta 1 0 < 0.01 1 0 < 0.2BHC-Gamma 1 0 < 0.01 1 0 < 0.2Chlordane, Technical 1 0 < 0.30 0Chlordane-Alpha 1 0 < 0.01 0Chlordane-Gamma 1 0 < 0.02 0Chlordane 1 0 < 0.01 1 0 < 1.0Chlorneb 1 0 < 0.10 0Chlorobenzilate 1 0 < 0.30 0Chlorpyrifos 1 0 < 0.03 0
PARAMETERBASEFLOW STORMFLOW

B-12
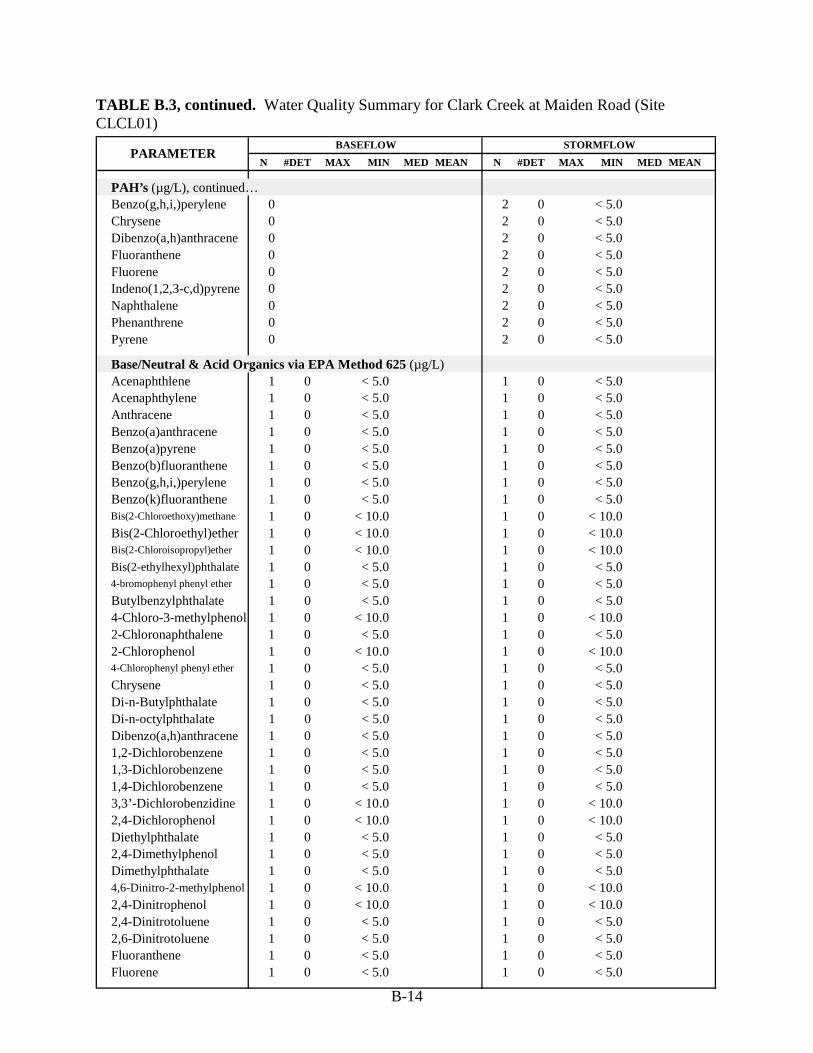
TABLE B.3, continued. Water Quality Summary for Clark Creek at Maiden Road (SiteCLCL01)
N #DET MAX MIN MED MEAN N #DET MAX MIN MED MEAN
Chlorinated Pesticides & PCB’s (µg/L), continued...Chlorothalonil 1 0 < 0.01 0DCPA 1 0 < 0.01 0DDD, OP 1 0 < 0.03 0 0 < 0.2DDD, PP 1 0 < 0.01 0DDE, OP 1 0 < 0.02 0DDE, PP 1 0 < 0.01 1 0 < 0.2DDT, OP 1 0 < 0.02 0DDT, PP 1 0 < 0.01 1 0 < 0.2Dieldrin 1 0 < 0.01 1 0 < 0.2Endosulfan I 1 0 < 0.01 1 0 < 0.2Endosulfan II 1 0 < 0.01 1 0 < 0.2Endosulfan Sulfate 1 0 < 0.01 1 0 < 0.2Endrin 1 0 < 0.01 1 0 < 0.2Endrin Aldehyde 1 0 < 0.01 1 0 < 0.2Endrin Ketone 1 0 < 0.02 1 0 < 0.2Ethazole 1 0 < 0.03 0Heptachlor 1 0 < 0.01 1 0 < 0.2Heptachlor Epoxide 1 0 < 0.01 1 0 < 0.2Hexachlorobenzene 1 0 < 0.01 0Malathion 1 0 < 0.10 0Methoxychlor, Pp 1 0 < 0.05 1 0 < 0.2Mirex 1 0 < 0.02 0Trans-Nonachlor 1 0 < 0.01 0Oxychlordane 1 0 < 0.03 0Mixed-Permethrin 1 0 < 0.60 0Propachlor 1 0 < 0.15 0Tecnazene 1 0 < 0.01 0Toxaphene 1 0 < 1.50 1 0 < 1.0Trifluralin 1 0 < 0.02 0Aroclor 1016 1 0 < 0.50 1 0 < 1.0Aroclor 1221 1 0 < 0.50 1 0 < 1.0Aroclor 1232 1 0 < 0.50 1 0 < 1.0Aroclor 1242 1 0 < 0.50 1 0 < 1.0Aroclor 1248 1 0 < 0.50 1 0 < 1.0Aroclor 1254 1 0 < 0.50 1 0 < 1.0Aroclor 1260 1 0 < 0.50 1 0 < 1.0Aroclor 1262 1 0 < 0.50 0
Current-Use Pesticides via Gas Chromatography / Mass Spectrometry (µg/L)2,6-Diethylanaline 0 2 0 < 0.005Alachlor 0 2 0 < 0.005Atrazine 0 2 0 < 0.005Benfluralin 0 2 0 < 0.005Butylate 0 2 0 < 0.005Carbaryl 0 2 0 < 0.005Carbofuran 0 2 0 < 0.005Chlorothalonil 0 2 0 < 0.005
PARAMETERBASEFLOW STORMFLOW

B-13
TABLE B.3, continued. Water Quality Summary for Clark Creek at Maiden Road (SiteCLCL01)
N #DET MAX MIN MED MEAN N #DET MAX MIN MED MEAN
Current-Use Pesticides (µg/L), continued…2,6-Diethylanaline 0 2 0 < 0.005Alachlor 0 2 0 < 0.005Atrazine 0 2 0 < 0.005Benfluralin 0 2 0 < 0.005Butylate 0 2 0 < 0.005Carbaryl 0 2 0 < 0.005Carbofuran 0 2 0 < 0.005Chlorothalonil 0 2 0 < 0.005Chlorpyrifos 0 2 0 < 0.005Cyanazine 0 2 0 < 0.005Dacthal 0 2 0 < 0.005Deethylatrazine 0 2 0 < 0.005Deisopropylatrazine 0 2 0 < 0.005Diazinon 0 2 0 < 0.005Dimethoate 0 2 0 < 0.005Disulfoton 0 2 0 < 0.005EPTC 0 2 0 < 0.005Ethalfluralin 0 2 0 < 0.005Ethoprop 0 2 0 < 0.005Fenamiphos 0 2 0 < 0.005Flumetralin 0 2 0 < 0.005Fonofos 0 2 0 < 0.005Malathion 0 2 0 < 0.005Methyl Parathion 0 2 0 < 0.005Metolachlor 0 2 1 >0.0051
Metribuzin 0 2 0 < 0.005Molinate 0 2 0 < 0.005Napropamide 0 2 0 < 0.005Pebulate 0 2 0 < 0.005Pendimethalin 0 2 0 < 0.005Permethrin 0 2 0 < 0.005Prometon 0 2 0 < 0.005Prometryn 0 2 0 < 0.005Simazine 0 2 0 < 0.005Tebuthiuron 0 2 0 < 0.005Terbufos 0 2 0 < 0.005Trifluralin 0 2 0 < 0.005
PAH’s via EPA Method 610 (µg/L)Acenaphthene 0 2 0 < 5.0Acenaphthylene 0 2 0 < 5.0Anthracene 0 2 0 < 5.0Benzo(a)anthracene 0 2 0 < 5.0Benzo(a)pyrene 0 2 0 < 5.0Benzo(b)fluoranthene 0 2 0 < 5.0Benzo(k)fluoranthene 0 2 0 < 5.0
1 Quantification unavailable.
PARAMETERBASEFLOW STORMFLOW
B-14
TABLE B.3, continued. Water Quality Summary for Clark Creek at Maiden Road (SiteCLCL01)
N #DET MAX MIN MED MEAN N #DET MAX MIN MED MEAN
PAH’s (µg/L), continued…Benzo(g,h,i,)perylene 0 2 0 < 5.0Chrysene 0 2 0 < 5.0Dibenzo(a,h)anthracene 0 2 0 < 5.0Fluoranthene 0 2 0 < 5.0Fluorene 0 2 0 < 5.0Indeno(1,2,3-c,d)pyrene 0 2 0 < 5.0Naphthalene 0 2 0 < 5.0Phenanthrene 0 2 0 < 5.0Pyrene 0 2 0 < 5.0
Base/Neutral & Acid Organics via EPA Method 625 (µg/L)Acenaphthlene 1 0 < 5.0 1 0 < 5.0Acenaphthylene 1 0 < 5.0 1 0 < 5.0Anthracene 1 0 < 5.0 1 0 < 5.0Benzo(a)anthracene 1 0 < 5.0 1 0 < 5.0Benzo(a)pyrene 1 0 < 5.0 1 0 < 5.0Benzo(b)fluoranthene 1 0 < 5.0 1 0 < 5.0Benzo(g,h,i,)perylene 1 0 < 5.0 1 0 < 5.0Benzo(k)fluoranthene 1 0 < 5.0 1 0 < 5.0Bis(2-Chloroethoxy)methane 1 0 < 10.0 1 0 < 10.0Bis(2-Chloroethyl)ether 1 0 < 10.0 1 0 < 10.0Bis(2-Chloroisopropyl)ether 1 0 < 10.0 1 0 < 10.0Bis(2-ethylhexyl)phthalate 1 0 < 5.0 1 0 < 5.04-bromophenyl phenyl ether 1 0 < 5.0 1 0 < 5.0Butylbenzylphthalate 1 0 < 5.0 1 0 < 5.04-Chloro-3-methylphenol 1 0 < 10.0 1 0 < 10.02-Chloronaphthalene 1 0 < 5.0 1 0 < 5.02-Chlorophenol 1 0 < 10.0 1 0 < 10.04-Chlorophenyl phenyl ether 1 0 < 5.0 1 0 < 5.0Chrysene 1 0 < 5.0 1 0 < 5.0Di-n-Butylphthalate 1 0 < 5.0 1 0 < 5.0Di-n-octylphthalate 1 0 < 5.0 1 0 < 5.0Dibenzo(a,h)anthracene 1 0 < 5.0 1 0 < 5.01,2-Dichlorobenzene 1 0 < 5.0 1 0 < 5.01,3-Dichlorobenzene 1 0 < 5.0 1 0 < 5.01,4-Dichlorobenzene 1 0 < 5.0 1 0 < 5.03,3’-Dichlorobenzidine 1 0 < 10.0 1 0 < 10.02,4-Dichlorophenol 1 0 < 10.0 1 0 < 10.0Diethylphthalate 1 0 < 5.0 1 0 < 5.02,4-Dimethylphenol 1 0 < 5.0 1 0 < 5.0Dimethylphthalate 1 0 < 5.0 1 0 < 5.04,6-Dinitro-2-methylphenol 1 0 < 10.0 1 0 < 10.02,4-Dinitrophenol 1 0 < 10.0 1 0 < 10.02,4-Dinitrotoluene 1 0 < 5.0 1 0 < 5.02,6-Dinitrotoluene 1 0 < 5.0 1 0 < 5.0Fluoranthene 1 0 < 5.0 1 0 < 5.0Fluorene 1 0 < 5.0 1 0 < 5.0
PARAMETERBASEFLOW STORMFLOW

B-15
TABLE B.3, continued. Water Quality Summary for Clark Creek at Maiden Road (SiteCLCL01)
N #DET MAX MIN MED MEAN N #DET MAX MIN MED MEAN
Base/Neutral & Acid Organics (µg/L), continued…Hexachlorobenzene 1 0 < 5.0 1 0 < 5.0Hexachlorobutadiene 1 0 < 5.0 1 0 < 5.0Hexachlorocyclopentadiene 1 0 < 5.0 1 0 < 5.0Hexachloroethane 1 0 < 5.0 1 0 < 5.0Indeno(1,2,3-c,d)pyrene 1 0 < 5.0 1 0 < 5.0Isophorone 1 0 < 5.0 1 0 < 5.0N-nitrosodi-n-propylamine 1 0 < 10.0 1 0 < 10.0N-Nitrosodiphenylamine 1 0 < 5.0 1 0 < 5.0Naphthalene 1 0 < 5.0 1 0 < 5.0Nitrobenzene 1 0 < 10.0 1 0 < 10.02-Nitrophenol 1 0 < 10.0 1 0 < 10.04-Nitrophenol 1 0 < 10.0 1 0 < 10.0Pentachlorophenol 1 0 < 10.0 1 0 < 10.0Phenanthrene 1 0 < 5.0 1 0 < 5.0Phenol 1 0 < 10.0 1 0 < 10.0Pyrene 1 0 < 5.0 1 0 < 5.01,2,4-Trichlorobenzene 1 0 < 5.0 1 0 < 5.02,4,6-Trichlorophenol 1 0 < 10.0 1 0 < 10.0
Volatile Organics via EPA Method 624 (µg/L)Benzene 3 0 < 1.0 0Bromodichloromethane 3 0 < 1.0 0Bromoform 3 0 < 1.0 0Bromomethane 3 0 < 1.0 0Carbon Tetrachloride 3 0 < 1.0 0Chlorobenzene 3 0 < 1.0 0Chloroethane 3 0 < 1.0 02-Chloroethylvinyl ether 3 0 < 1.0 0Chloroform 3 0 < 1.0 0Chloromethane 3 0 < 1.0 0Dibromochloromethane 3 0 < 1.0 01,2-Dichlorobenzene 3 0 < 1.0 01,3-Dichlorobenzene 3 0 < 1.0 01,4-Dichlorobenzene 3 0 < 1.0 01,1-Dichloroethane 3 0 < 1.0 01,2-Dichlroroethane 3 0 < 1.0 01,1-Dichlororethene 3 0 < 1.0 0trans-1,2-Dichloroethene 3 0 < 1.0 01,2-Dichloropropane 3 0 < 1.0 0Cis-1,3-Dichloropropene 3 0 < 1.0 0trans-1,3-Dichloropropene 3 0 < 1.0 0Ethyl benzene 3 0 < 1.0 0Methylene Chloride 3 0 < 1.0 01,1,2,2-Tetrachloroethane 3 0 < 1.0 0Tetrachloroethene 3 0 < 1.0 0Toluene 3 0 < 1.0 01,1,1-Trichloroethene 3 0 < 1.0 01,1,2-Trichloroethene 3 0 < 1.0 0
PARAMETERBASEFLOW STORMFLOW

B-16
TABLE B.3, continued. Water Quality Summary for Clark Creek at Maiden Road (SiteCLCL01)
N #DET MAX MIN MED MEAN N #DET MAX MIN MED MEAN
Volatile Organics (µg/L), continued…Trichloroethane 3 0 < 1.0 0Trichlorofluoromethane 3 0 < 1.0 0Vinyl Chloride 3 0 < 1.0 0M + P Xylene 1 0 < 2.0 0O - Xylene 1 0 < 1.0 0
TPH via CA Method (mg/L)Gasoline 4 0 < 0.24 1 0 < 0.24Diesel 4 0 < 0.10 1 0 < 0.10
Metals (µg/L)Aluminum 5 5 369 157 250 250 2 2 972 407 690 690Arsenic 5 0 < 5 2 1 5.0Cadmium 5 2 1.5 0.1 0.1 0.6 2 1 0.8Chromium 5 0 < 1 2 1 6.0Copper 5 5 4 1 2 3 2 2 11 5 8 8Iron 5 5 814 340 593 603 2 2 3870 3330 3600 3600Lead 5 1 1 2 2 12 4 8 8Manganese 5 5 109 56 72 75 2 2 350 101 226 226Mercury 5 0 < 0.1 2 1 0.2Nickel 5 1 2 2 1 4Silver 5 0 < 0.5 2 0 < 0.5Zinc 5 5 9 2 5 6 2 2 50 8 29 29
MBAS (mg/L) 3 3 0.280 0.040 0.260 0.190 1 0 < 0.025
Ions (mg/L)Calcium 5 5 22.5 13.7 20.3 18.6 2 2 13.6 6.5 10.5 10.0Magnesium 5 5 3.7 3.2 3.3 3.4 2 2 3.2 2.6 2.9 2.9Potassium 5 5 5.9 3.1 5.6 4.8 2 2 4.7 4.6 4.7 4.7Sodium 5 5 49.2 11.5 35.7 32.4 2 2 22.6 5.8 14.2 14.2
Acid Herbicides via EPA Method 615 (µg/L) Acifluorfen 1 0 < 0.10 0Bentazon 1 0 < 0.80 0Chloramben 1 0 < 0.20 02,4-D 1 0 < 0.40 02,4-DB 1 0 < 0.80 0DCPA 1 0 < 0.10 0Dicamba 1 0 < 0.10 03,5-Dichlorobenzoic Acid 1 0 < 0.60 0Dichlorprop 1 0 < 0.60 0Dinoseb 1 0 < 0.20 05-Hydroxydicamba 1 0 < 0.10 04-Nitrophenol 1 0 < 3.20 0Pentachlorophenol 1 0 < 0.05 0Picloram 1 0 < 0.20 02,4,5- T 1 0 < 0.10 02,4,5-TP 1 0 < 0.10 0
PARAMETERBASEFLOW STORMFLOW

B-17
TABLE B.3, continued. Water Quality Summary for Clark Creek at Maiden Road (SiteCLCL01)
N #DET MAX MIN MED MEAN N #DET MAX MIN MED MEAN
Organophosphorous Pesticides via EPA Method 614 / 622 (µg/L)Carbophenothion 1 0 < 0.8 0Chlorpyrifos 1 0 < 0.4 0Def 1 0 < 0.4 0Demeton 1 0 < 0.8 0Diazinon 1 0 < 0.4 0Dichlorvos 1 0 < 0.4 0Dimethoate 1 0 < 0.4 0Disulfoton 1 0 < 0.8 0Disulfoton Sulfone 1 0 < 1.0 0Disulfoton Sulfoxide 1 0 NE1 0EPN 1 0 < 0.4 0Ethion 1 0 < 0.4 0Ethoprop 1 0 < 0.4 0Fenthion 1 0 < 0.4 0Fensulfothion 1 0 < 4.8 0Folex 1 0 < 20.0 0Mevinphos 1 0 < 0.4 0Monocrotophos 1 0 < 0.8 0Naled 1 0 < 0.8 0Ethyl Parathion 1 0 < 0.4 0Methyl Parathion 1 0 < 0.4 0Phorate 1 0 < 0.4 0Ronnel 1 0 < 0.4 0Sulfotepp 1 0 < 0.4 0Terbufos 1 0 < 0.4 0
Fecal Coliform BacteriaColonies per 100 mL 5 5 1200 520 635 704 0
1 No established target quantitation limit
PARAMETERBASEFLOW STORMFLOW

B-18
TABLE B.4 Water Quality Summary for Clark Creek at Southside Park (Site CLCL02)
N #DET MAX MIN MED MEAN N #DET MAX MIN MED MEAN
Field ParametersAir Temperature (oC) 9 N/A 30 12 20 21 2 2 29 8 19 19Water Temperature (oC) 24 N/A 24.0 3.1 13.2 14.0 2 2 20.7 7.5 14.1 14.1Specific Cond (µS/cm) 25 N/A 129 88 109 109 2 2 82 70 76 76DO (mg/L) 24 N/A 11.0 6.1 8.3 8.4 2 2 8.5 7.5 8.0 8.0DO (% saturation) 11 N/A 98.0 74.4 89.0 87.8 2 2 84.0 71.4 77.7 77.7pH (Standard Units) 19 N/A 7.8 6.6 7.3 7.2 2 2 6.7 6.6 6.7 6.7
Nutrients (mg/L)Ammonia Nitrogen 5 3 0.2 0.1 0.1 0.1 2 2 0.7 0.2 0.5 0.5Total Kjeldahl Nitrogen 5 5 0.7 0.3 0.6 0.6 2 2 1.8 0.5 1.2 1.2Nitrate+Nitrite Nitrogen 5 5 0.65 0.39 0.54 0.52 2 2 0.70 0.37 0.54 0.54Total Phosphorus 5 5 0.43 0.02 0.04 0.11 2 2 0.06 0.04 0.05 0.05
Miscellaneous Inorganics (mg/L)Hardness, Total 5 5 48.5 40.0 41.0 42.3 2 2 32.0 24.0 28.0 28.0Residue, T. Suspended 5 5 15.0 1.4 5.3 6.7 2 2 218.0 29.0 123.5 123.5Total Dissolved Solids 5 5 92 81 85 86 2 2 133 69 101 101
Turbidity (NTU) 5 5 17.0 3.0 5.9 7.6 2 2 267.0 39.6 153.3 153.3
MTBE (µg/L) 5 0 < 1.0 1 0 < 1.0
Phenols via EPA Method 604 (µg/L)4-Chloro-3-methylphenol 0 2 0 < 5.02-Chlorophenol 0 2 0 < 5.02,4-Dichlorophenol 0 2 0 < 5.02,4-Dimethylphenol 0 2 0 < 5.02,4-Dinitrophenol 0 2 0 < 5.02-Methyl-4,6-dinitrophenol 0 2 0 < 5.02-Nitrophenol 0 2 0 < 5.04-Nitrophenol 0 2 0 < 5.0Pentachlorophenol 0 2 0 < 5.0Phenol 0 2 0 < 5.02,4,6-Trichlorophenol 0 2 0 < 5.0
Chlorinated Pesticides & PCB’s via EPA Method 608 (µg/L)Alachlor 1 0 < 0.08 0Aldrin 1 0 < 0.01 1 0 < 0.2Atrazine 1 0 < 1.50 0BHC-Alpha 1 0 < 0.01 1 0 < 0.2BHC-Beta 1 0 < 0.01 1 0 < 0.2BHC-Delta 1 0 < 0.01 1 0 < 0.2BHC-Gamma 1 0 < 0.01 1 0 < 0.2Chlordane, Technical 1 0 < 0.30 0Chlordane-Alpha 1 0 < 0.01 0Chlordane-Gamma 1 0 < 0.02 0Chlordane 1 0 < 0.01 1 0 < 1.0Chlorneb 1 0 < 0.10 0Chlorobenzilate 1 0 < 0.30 0Chlorpyrifos 1 0 < 0.03 0
PARAMETERBASEFLOW STORMFLOW

B-19
TABLE B.4, continued. Water Quality Summary for Clark Creek at Southside Park (SiteCLCL02)
N #DET MAX MIN MED MEAN N #DET MAX MIN MED MEAN
Chlorinated Pesticides & PCB’s (µg/L), continued…Chlorothalonil 1 0 < 0.01 0DCPA 1 0 < 0.01 0DDD, OP 1 0 < 0.03 1 0 < 0.2DDD, PP 1 0 < 0.01 0DDE, OP 1 0 < 0.02 0DDE, PP 1 0 < 0.01 1 0 < 0.2DDT, OP 1 0 < 0.02 0DDT, PP 1 0 < 0.01 1 0 < 0.2Dieldrin 1 0 < 0.01 1 0 < 0.2Endosulfan I 1 0 < 0.01 1 0 < 0.2Endosulfan II 1 0 < 0.01 1 0 < 0.2Endosulfan Sulfate 1 0 < 0.01 1 0 < 0.2Endrin 1 0 < 0.01 1 0 < 0.2Endrin Aldehyde 1 0 < 0.01 1 0 < 0.2Endrin Ketone 1 0 < 0.02 1 0 < 0.2Ethazole 1 0 < 0.03 0Heptachlor 1 0 < 0.01 1 0 < 0.2Heptachlor Epoxide 1 0 < 0.01 1 0 < 0.2Hexachlorobenzene 1 0 < 0.01 0Malathion 1 0 < 0.10 0Methoxychlor, PP 1 0 < 0.05 1 0 < 0.2Mirex 1 0 < 0.02 0Trans-Nonachlor 1 0 < 0.01 0Oxychlordane 1 0 < 0.03 0Mixed-Permethrin 1 0 < 0.60 0Propachlor 1 0 < 0.15 0Tecnazene 1 0 < 0.01 0Toxaphene 1 0 < 1.50 1 0 < 1.0Trifluralin 1 0 < 0.02 0Aroclor 1016 1 0 < 0.50 1 0 < 1.0Aroclor 1221 1 0 < 0.50 1 0 < 1.0Aroclor 1232 1 0 < 0.50 1 0 < 1.0Aroclor 1242 1 0 < 0.50 1 0 < 1.0Aroclor 1248 1 0 < 0.50 1 0 < 1.0Aroclor 1254 1 0 < 0.50 1 0 < 1.0Aroclor 1260 1 0 < 0.50 1 0 < 1.0Aroclor 1262 1 0 < 0.50 0
Current-Use Pesticides via Gas Chromatography / Mass Spectrometry (µg/L)2,6-Diethylanaline 0 2 0 < 0.005Alachlor 0 2 0 < 0.005Atrazine 0 2 0 < 0.005Benfluralin 0 2 0 < 0.005Butylate 0 2 0 < 0.005Carbaryl 0 2 0 < 0.005Carbofuran 0 2 0 < 0.005Chlorothalonil 0 2 0 < 0.005
PARAMETERBASEFLOW STORMFLOW

B-20
TABLE B.4, continued. Water Quality Summary for Clark Creek at Southside Park (SiteCLCL02)
N #DET MAX MIN MED MEAN N #DET MAX MIN MED MEAN
Current-Use Pesticides (µg/L), continued...Chlorpyrifos 0 2 0 < 0.005Cyanazine 0 2 0 < 0.005Dacthal 0 2 0 < 0.005Deethylatrazine 0 2 0 < 0.005Deisopropylatrazine 0 2 0 < 0.005Diazinon 0 2 0 < 0.005Dimethoate 0 2 0 < 0.005Disulfoton 0 2 0 < 0.005EPTC 0 2 0 < 0.005Ethalfluralin 0 2 0 < 0.005Ethoprop 0 2 0 < 0.005Fenamiphos 0 2 0 < 0.005Flumetralin 0 2 0 < 0.005Fonofos 0 2 0 < 0.005Malathion 0 2 0 < 0.005Methyl Parathion 0 2 0 < 0.005Metolachlor 0 2 1 >0.0051
Metribuzin 0 2 0 < 0.005Molinate 0 2 0 < 0.005Napropamide 0 2 0 < 0.005Pebulate 0 2 0 < 0.005Pendimethalin 0 2 0 < 0.005Permethrin 0 2 0 < 0.005Prometon 0 2 0 < 0.005Prometryn 0 2 0 < 0.005Simazine 0 2 0 < 0.005Tebuthiuron 0 2 0 < 0.005Terbufos 0 2 0 < 0.005Trifluralin 0 2 0 < 0.005
PAH’s via EPA Method 610 (µg/L)Acenaphthene 0 2 0 < 5.0Acenaphthylene 0 2 0 < 5.0Anthracene 0 2 0 < 5.0Benzo(a)anthracene 0 2 0 < 5.0Benzo(a)pyrene 0 2 0 < 5.0Benzo(b)fluoranthene 0 2 0 < 5.0Benzo(k)fluoranthene 0 2 0 < 5.0Benzo(g,h,i,)perylene 0 2 0 < 5.0Chrysene 0 2 0 < 5.0Dibenzo(a,h)anthracene 0 2 0 < 5.0Fluoranthene 0 2 0 < 5.0Fluorene 0 2 0 < 5.0Indeno(1,2,3-c,d)pyrene 0 2 0 < 5.0Naphthalene 0 2 0 < 5.0Phenanthrene 0 2 0 < 5.0Pyrene 0 2 0 < 5.0
1 Quantification unavailable.
PARAMETERBASEFLOW STORMFLOW

B-21
TABLE B.4, continued. Water Quality Summary for Clark Creek at Southside Park (SiteCLCL02)
N #DET MAX MIN MED MEAN N #DET MAX MIN MED MEAN
Base/Neutral & Acid Organics via EPA Method 625 (µg/L)Acenaphthlene 1 0 < 5.0 1 0 < 5.0Acenaphthylene 1 0 < 5.0 1 0 < 5.0Anthracene 1 0 < 5.0 1 0 < 5.0Benzo(a)anthracene 1 0 < 5.0 1 0 < 5.0Benzo(a)pyrene 1 0 < 5.0 1 0 < 5.0Benzo(b)fluoranthene 1 0 < 5.0 1 0 < 5.0Benzo(g,h,i,)perylene 1 0 < 5.0 1 0 < 5.0Benzo(k)fluoranthene 1 0 < 5.0 1 0 < 5.0Bis(2-Chloroethoxy)methane 1 0 < 10.0 1 0 < 10.0Bis(2-Chloroethyl)ether 1 0 < 10.0 1 0 < 10.0Bis(2-Chloroisopropyl)ether 1 0 < 10.0 1 0 < 10.0Bis(2-ethylhexyl)phthalate 1 0 < 5.0 1 0 < 5.04-bromophenyl phenyl ether 1 0 < 5.0 1 0 < 5.0Butylbenzylphthalate 1 0 < 5.0 1 0 < 5.04-Chloro-3-methylphenol 1 0 < 10.0 1 0 < 10.02-Chloronaphthalene 1 0 < 5.0 1 0 < 5.02-Chlorophenol 1 0 < 10.0 1 0 < 10.04-Chlorophenyl phenyl ether 1 0 < 5.0 1 0 < 5.0Chrysene 1 0 < 5.0 1 0 < 5.0Di-n-Butylphthalate 1 0 < 5.0 1 0 < 5.0Di-n-octylphthalate 1 0 < 5.0 1 0 < 5.0Dibenzo(a,h)anthracene 1 0 < 5.0 1 0 < 5.01,2-Dichlorobenzene 1 0 < 5.0 1 0 < 5.01,3-Dichlorobenzene 1 0 < 5.0 1 0 < 5.01,4-Dichlorobenzene 1 0 < 5.0 1 0 < 5.03,3’-Dichlorobenzidine 1 0 < 10.0 1 0 < 10.02,4-Dichlorophenol 1 0 < 10.0 1 0 < 10.0Diethylphthalate 1 0 < 5.0 1 0 < 5.02,4-Dimethylphenol 1 0 < 5.0 1 0 < 5.0Dimethylphthalate 1 0 < 5.0 1 0 < 5.04,6-Dinitro-2-methylphenol 1 0 < 10.0 1 0 < 10.02,4-Dinitrophenol 1 0 < 10.0 1 0 < 10.02,4-Dinitrotoluene 1 0 < 5.0 1 0 < 5.02,6-Dinitrotoluene 1 0 < 5.0 1 0 < 5.0Fluoranthene 1 0 < 5.0 1 0 < 5.0Fluorene 1 0 < 5.0 1 0 < 5.0Hexachlorobenzene 1 0 < 5.0 1 0 < 5.0Hexachlorobutadiene 1 0 < 5.0 1 0 < 5.0Hexachlorocyclopentadiene 1 0 < 5.0 1 0 < 5.0Hexachloroethane 1 0 < 5.0 1 0 < 5.0Indeno(1,2,3-c,d)pyrene 1 0 < 5.0 1 0 < 5.0Isophorone 1 0 < 5.0 1 0 < 5.0N-nitrosodi-n-propylamine 1 0 < 10.0 1 0 < 10.0N-Nitrosodiphenylamine 1 0 < 5.0 1 0 < 5.0Naphthalene 1 0 < 5.0 1 0 < 5.0Nitrobenzene 1 0 < 10.0 1 0 < 10.0
BASEFLOW STORMFLOWPARAMETER

B-22
TABLE B.4, continued. Water Quality Summary for Clark Creek at Southside Park (SiteCLCL02)
N #DET MAX MIN MED MEAN N #DET MAX MIN MED MEAN
Base/Neutral & Acid Organics (µg/L), continued…2-Nitrophenol 1 0 < 10.0 1 0 < 10.04-Nitrophenol 1 0 < 10.0 1 1 < 10.0Pentachlorophenol 1 0 < 10.0 1 1 < 10.0Phenanthrene 1 0 < 5.0 1 0 < 5.0Phenol 1 0 < 10.0 1 0 < 10.0Pyrene 1 0 < 5.0 1 0 < 5.01,2,4-Trichlorobenzene 1 0 < 5.0 1 0 < 5.02,4,6-Trichlorophenol 1 0 < 10.0 1 0 < 10.0
Volatile Organics via EPA Method 624 (µg/L)Benzene 3 0 < 1.0 0Bromodichloromethane 3 0 < 1.0 0Bromoform 3 0 < 1.0 0Bromomethane 3 0 < 1.0 0Carbon Tetrachloride 3 0 < 1.0 0Chlorobenzene 3 0 < 1.0 0Chloroethane 3 0 < 1.0 02-Chloroethylvinyl ether 3 0 < 1.0 0Chloroform 3 0 < 1.0 0Chloromethane 3 0 < 1.0 0Dibromochloromethane 3 0 < 1.0 01,2-Dichlorobenzene 3 0 < 1.0 01,3-Dichlorobenzene 3 0 < 1.0 01,4-Dichlorobenzene 3 0 < 1.0 01,1-Dichloroethane 3 0 < 1.0 01,2-Dichlroroethane 3 0 < 1.0 01,1-Dichlororethene 3 0 < 1.0 0Trans-1,2-Dichloroethene 3 0 < 1.0 01,2-Dichloropropane 3 0 < 1.0 0Cis-1,3-Dichloropropene 3 0 < 1.0 0Trans-1,3-Dichloropropene 3 0 < 1.0 0Ethyl benzene 3 0 < 1.0 0Methylene Chloride 3 0 < 1.0 01,1,2,2-Tetrachloroethane 3 0 < 1.0 0Tetrachloroethene 3 0 < 1.0 0Toluene 3 0 < 1.0 01,1,1-Trichloroethene 3 0 < 1.0 01,1,2-Trichloroethene 3 0 < 1.0 0Trichloroethane 3 0 < 1.0 0Trichlorofluoromethane 3 0 < 1.0 0Vinyl Chloride 3 0 < 1.0 0M + P Xylene 1 0 < 2.0 0O - Xylene 1 0 < 1.0 0
TPH (mg/L)Gasoline 4 0 < 0.24 1 0 < 0.24Diesel 4 0 < 0.10 1 0 < 0.10
PARAMETERBASEFLOW STORMFLOW

B-23
TABLE B.4, continued. Water Quality Summary for Clark Creek at Southside Park (SiteCLCL02)
N #DET MAX MIN MED MEAN N #DET MAX MIN MED MEAN
Metals (µg/L)Aluminum 5 5 251 88 107 139 2 2 926 849 888 888Arsenic 5 0 < 5 2 0 < 5Cadmium 5 0 < 0.1 2 1 0.5Chromium 5 1 1 2 2 4 2 3 3Copper 5 0 < 1 2 2 9 4 6.5 6.5Iron 5 5 859 245 423 470 2 2 2380 754 1567 1567Lead 5 1 1 2 2 10 3 7 7Manganese 5 5 109 49 68 72 2 2 260 60 160 160Mercury 5 0 < 0.2 2 1 0.2Nickel 5 0 < 1 2 2 3 1 2 2Silver 5 1 1.1 2 0 < 0.5Zinc 5 4 8.9 0.1 3.2 3.5 2 2 47.2 14.0 30.6 30.6
MBAS (mg/L) 3 2 0.029 0.013 0.021 0.020 1 0 < 0.025
Ions (mg/L)Calcium 4 4 10.4 10.2 10.3 10.3 2 2 6.8 5.3 6.1 6.1Magnesium 4 4 3.4 3.3 3.4 3.4 2 2 2.8 2.2 2.5 2.5Potassium 4 4 2.8 1.1 2.1 2.0 2 2 3.7 2.6 3.1 3.1Sodium 4 4 7.7 5.1 5.8 6.1 2 2 4.3 2.4 3.4 3.4
Acid Herbicides via EPA Method 615 (µg/L) Acifluorfen 1 0 < 0.10 0Bentazon 1 0 < 0.80 0Chloramben 1 0 < 0.20 02,4-D 1 0 < 0.40 02,4-DB 1 0 < 0.80 0DCPA 1 0 < 0.10 0Dicamba 1 0 < 0.10 03,5 Dichlorobenzoic Acid 1 0 < 0.60 0Dichlorprop 1 0 < 0.60 0Dinoseb 1 0 < 0.20 05-Hydroxydicamba 1 0 < 0.10 04-Nitrophenol 1 1 < 3.201 0Pentachlorophenol 1 1 < 0.051 0Picloram 1 0 < 0.20 02,4,5-T 1 0 < 0.10 02,4,5-TP 1 0 < 0.10 0
Organophosphorous Pesticides via EPA Method 614 / 622 (µg/L) Carbophenothion 1 0 < 0.8 0Chlorpyrifos 1 0 < 0.4 0Def 1 0 < 0.4 0Demeton 1 0 < 0.8 0Diazinon 1 0 < 0.4 0Dichlorvos 1 0 < 0.4 0Dimethoate 1 0 < 0.4 0Disulfoton 1 0 < 0.8 0
1 Analyte detected but lab was unable to quantify.
BASEFLOW STORMFLOWPARAMETER

B-24
TABLE B.4, continued. Water Quality Summary for Clark Creek at Southside Park (SiteCLCL02)
TABLE B.5 Water Quality Summary for Clark Creek at Rome Jones Road (Site CLCL03)
N #DET MAX MIN MED MEAN
Field ParametersAir Temperature (oC) 6 N/A 29.4 20.0 24.0 24.2Water Temperature (oC) 15 N/A 24.5 5.5 19.3 18.2Specific Cond (µS/cm) 17 N/A 662 147 360 399DO (mg/L) 15 N/A 9.9 6.0 7.6 7.7DO (% saturation) 10 N/A 96.0 80.0 85.5 85.2pH (Standard Units) 6 N/A 7.8 7.2 7.5 7.5
PARAMETERBASEFLOW
N #DET MAX MIN MED MEAN N #DET MAX MIN MED MEAN
Organophosphorous Pesticides (µg/L), continued…Disulfoton Sulfone 1 0 < 1.0 0Disulfoton Sulfoxide 1 0 NE1 0EPN 1 0 < 0.4 0Ethion 1 0 < 0.4 0Ethoprop 1 0 < 0.4 0Fenthion 1 0 < 0.4 0Fensulfothion 1 0 < 4.8 0Folex 1 0 < 20.0 0Mevinphos 1 0 < 0.4 0Monocrotophos 1 0 < 0.8 0Naled 1 0 < 0.8 0Ethyl Parathion 1 0 < 0.4 0Methyl Parathion 1 0 < 0.4 0Phorate 1 0 < 0.4 0Ronnel 1 0 < 0.4 0Sulfotepp 1 0 < 0.4 0Terbufos 1 0 < 0.4 0
Fecal Coliform BacteriaColonies per 100 mL 5 5 860 490 560 596 0
1 No established target quantitation limit.
PARAMETERBASEFLOW STORMFLOW

B-25
TABLE B.6 Water Quality Summary for Clark Creek at 20th Avenue SE (Site CLCL06)
N #DET MAX MIN MED MEAN
Field ParametersAir Temperature (oC) 2 N/A 28 23 26 26Water Temperature (oC) 14 N/A 23.1 3.9 13.2 13.4Specific Cond (µS/cm) 16 N/A 140 89 124 119DO (mg/L) 14 N/A 10.0 6.7 8.2 8.0DO (% saturation) 1 N/A 95.0pH (Standard Units) 12 N/A 7.7 6.6 7.0 7.1
Metals (µg/L)Aluminum 1 1 70Arsenic 1 0 < 5Cadmium 1 0 < 0.1Chromium 1 0 < 1Copper 1 1 2Iron 1 1 306Lead 1 0 < 1Manganese 1 1 74Mercury 1 0 < 0.2Nickel 1 0 < 1Silver 1 0 < 0.5Zinc 1 1 3
Volatile Organics via EPA Method 624 (µg/L)1,1,1,2-Tetrachloroethane 1 0 < 0.251,1,1-Trichloroethane 1 0 < 0.251,1,2,2-Tetrachloroethane 1 0 < 0.251,1,2-Trichloroethane 1 0 < 0.251,1-Dichloroethane 1 0 < 0.251,1-Dichloropropene 1 0 < 0.251,1-Dichlororethene 1 0 < 0.501,2 Dibromoethane 1 0 < 0.501,2,3-Trichlorobenzene 1 0 < 0.501,2,3-Trichloropropane 1 0 < 0.251,2,4-Trichlorobenzene 1 0 < 0.251,2,4-Trimethylbenzene 1 0 < 11,2-Dibromo-3-Chloropropane 1 0 < 0.501,2-Dichlorobenzene 1 0 < 0.251,2-Dichloropropane 1 0 < 0.251,2-Dichlroroethane 1 0 < 0.251,3,5-Trimethylbenzene 1 0 < 11,3-Dichlorobenzene 1 0 < 0.251,3-Dichloropropane 1 0 < 0.251,4-Dichlorobenzene 1 0 < 0.252,2-Dichloropropane 1 0 < 0.252-Chlorotoluene 1 0 < 0.254-Chlorotoluene 1 0 < 0.25Benzene 1 0 < 1Bromobenzene 1 0 < 0.50
PARAMETERBASEFLOW

B-26
TABLE B.6, continued. Water Quality Summary for Clark Creek at 20th Avenue SE (SiteCLCL06)
N #DET MAX MIN MED MEAN
Volatile Organics (µg/L), continuedBromochloromethane 1 0 < 0.50Bromodichloromethane 1 0 < 0.25Bromoform 1 0 < 0.50Carbon Tetrachloride 1 0 < 0.50Chlorobenzene 1 0 < 0.25Chloroform 1 0 < 0.25cis-1,2-Dichloroethene 1 0 < 0.25Cis-1,3-Dichloropropene 1 0 < 0.25Dibromomethane 1 0 < 0.50Dibromochloromethane 1 0 < 0.50Ethyl benzene 1 0 < 1Hexachlorobutadiene 1 0 < 0.25Isopropylbenzene 1 0 < 1M + P Xylene 1 0 < 2Methylene Chloride 1 0 < 10Methyl-tert-butyl ether 1 0 < 5Naphthalene 1 0 < 1n-Butylbenzene 1 0 < 1n-Propylbenzene 1 0 < 1O - Xylene 1 0 < 1p-isopropyltoluene 1 0 < 1sec-Butylbenzene 1 0 < 1Styrene 1 0 < 1tert-Butylbenzene 1 0 < 1Tetrachloroethene 1 0 < 0.25Toluene 1 0 < 1Trans-1,2-Dichloroethene 1 0 < 0.50Trans-1,3-Dichloropropene 1 0 < 0.25Trichloroethene 1 0 < 0.25
Base/Neutral & Acid Organics via EPA Method 625 (µg/L)Acenaphthlene 1 0 < 10Acenaphthylene 1 0 < 10Aniline 1 0 < 10Anthracene 1 0 < 10Benzo(a)anthracene 1 0 < 10Benzo(a)pyrene 1 0 < 10Benzo(b)fluoranthene 1 0 < 10Benzo(g,h,i,)perylene 1 0 < 10Benzo(k)fluoranthene 1 0 < 10Benzoic Acid 1 0 < 50Benzyl Alcohol 1 0 < 20Bis(2-Chloroethoxy)methane 1 0 < 10Bis(2-Chloroethyl)ether 1 0 < 10Bis(2-Chloroisopropyl)ether 1 0 < 10Bis(2-ethylhexyl)phthalate 1 0 < 104-bromophenyl phenyl ether 1 0 < 10
PARAMETERBASEFLOW

B-27
TABLE B.6, continued. Water Quality Summary for Clark Creek at 20th Avenue SE (SiteCLCL06)
N #DET MAX MIN MED MEAN
Base/Neutral & Acid Organics (µg/L), continued…Butylbenzylphthalate 1 0 < 104-Chloroaniline 1 0 < 204-Chloro-3-methylphenol 1 0 < 202-Chloronaphthalene 1 0 < 102-Chlorophenol 1 0 < 104-Chlorophenyl phenyl ether 1 0 < 10Chrysene 1 0 < 10Di-n-Butylphthalate 1 0 < 10Di-n-octylphthalate 1 0 < 10Dibenzo(a,h)anthracene 1 0 < 10Dibenzofuran 1 0 < 101,2-Dichlorobenzene 1 0 < 101,3-Dichlorobenzene 1 0 < 101,4-Dichlorobenzene 1 0 < 103,3’-Dichlorobenzidine 1 0 < 202,4-Dichlorophenol 1 0 < 10Diethylphthalate 1 0 < 102,4-Dimethylphenol 1 0 < 10Dimethylphthalate 1 0 < 104,6-Dinitro-2-methylphenol 1 0 < 502,4-Dinitrophenol 1 0 < 502,4-Dinitrotoluene 1 0 < 102,6-Dinitrotoluene 1 0 < 10Fluoranthene 1 0 < 10Fluorene 1 0 < 10Hexachlorobenzene 1 0 < 10Hexachlorobutadiene 1 0 < 10Hexachlorocyclopentadiene 1 0 < 10Hexachloroethane 1 0 < 10Indeno(1,2,3-c,d)pyrene 1 0 < 10Isophorone 1 0 < 102-Methylnaphthalene 1 0 < 102-Methylphenol 1 0 < 104-Methylphenol 1 0 < 10N-nitrosodi-n-propylamine 1 0 < 10N-Nitrosodiphenylamine 1 0 < 10Naphthalene 1 0 < 102-Nitroaniline 1 0 < 503-Nitroaniline 1 0 < 504-Nitroaniline 1 0 < 50Nitrobenzene 1 0 < 102-Nitrophenol 1 0 < 104-Nitrophenol 1 0 < 50Pentachlorophenol 1 0 < 50Phenanthrene 1 0 < 10Phenol 1 0 < 10
PARAMETERBASEFLOW

B-28
TABLE B.6, continued. Water Quality Summary for Clark Creek at 20th Avenue SE (SiteCLCL06)
N #DET MAX MIN MED MEAN
Base/Neutral & Acid Organics (µg/L), continued…Pyrene 1 0 < 101,2,4-Trichlorobenzene 1 0 < 102,4,5-Trichlorophenol 1 0 < 102,4,6-Trichlorophenol 1 0 < 10
Chlorinated Pesticides via EPA Method 608 (µg/L)Alachlor 1 0 < 0.08Aldrin 1 0 < 0.01Atrazine 1 0 < 1.50BHC-Alpha 1 0 < 0.01BHC-Beta 1 0 < 0.01BHC-Delta 1 0 < 0.01BHC-Gamma 1 0 < 0.01Chlordane, Technical 1 0 < 0.30Chlordane-Alpha 1 0 < 0.01Chlordane-Gamma 1 0 < 0.02Chlordane 1 0 < 0.01Chlorneb 1 0 < 0.10Chlorobenzilate 1 0 < 0.30Chlorpyrifos 1 0 < 0.03Chlorothalonil 1 0 < 0.01DCPA 1 0 < 0.01DDD, OP 1 0 < 0.03DDD, PP 1 0 < 0.01DDE, OP 1 0 < 0.02DDE, PP 1 0 < 0.01DDT, OP 1 0 < 0.02DDT, PP 1 0 < 0.01Dieldrin 1 0 < 0.01Endosulfan I 1 0 < 0.01Endosulfan II 1 0 < 0.01Endosulfan Sulfate 1 0 < 0.01Endrin 1 0 < 0.01Endrin Andehyde 1 0 < 0.01Endrin Ketone 1 0 < 0.02Ethazole 1 0 < 0.03Heptachlor 1 0 < 0.01Heptachlor Epoxide 1 0 < 0.01Hexachlorobenzene 1 0 < 0.01Malathion 1 0 < 0.10Methoxychlor, Pp 1 0 < 0.05Mirex 1 0 < 0.02Trans-Nonachlor 1 0 < 0.01Oxychlordane 1 0 < 0.03Mixed-Permethrin 1 0 < 0.60Propachlor 1 0 < 0.15Tecnazene 1 0 < 0.01
PARAMETERBASEFLOW

B-29
TABLE B.6, continued. Water Quality Summary for Clark Creek at 20th Avenue SE (SiteCLCL06)
N #DET MAX MIN MED MEAN
Chlorinated Pesticides (µg/L), continued…Toxaphene 1 0 < 1.50Trifluralin 1 0 < 0.02Aroclor 1016 1 0 < 0.50Aroclor 1221 1 0 < 0.50Aroclor 1232 1 0 < 0.50Aroclor 1242 1 0 < 0.50Aroclor 1248 1 0 < 0.50Aroclor 1254 1 0 < 0.50Aroclor 1260 1 0 < 0.50Aroclor 1262 1 0 < 0.50
Acid Herbicides via EPA Method 615 (µg/L)Acifluorfen 1 0 < 0.10Bentazon 1 0 < 0.80Chloramben 1 0 < 0.202,4-D 1 0 < 0.402,4-DB 1 0 < 0.80DCPA 1 0 < 0.10Dicamba 1 0 < 0.103,5 Dichlorobenzoic Acid 1 0 < 0.60Dichlorprop 1 0 < 0.60Dinoseb 1 0 < 0.205-Hydroxydicamba 1 0 < 0.104-Nitrophenol 1 0 < 3.20Pentachlorophenol 1 0 < 0.05Picloram 1 0 < 0.202,4,5-T 1 0 < 0.102,4,5-TP 1 0 < 0.10
Organophosphorous Pesticides via EPA Method 614 / 622 (µg/L)Carbophenothion 1 0 < 0.8Chlorpyrifos 1 0 < 0.4Def 1 0 < 0.4Demeton 1 0 < 0.8Diazinon 1 0 < 0.4Dichlorvos 1 0 < 0.4Dimethoate 1 0 < 0.4Disulfoton 1 0 < 0.8Disulfoton Sulfone 1 0 < 1.0Disulfoton Sulfoxide 1 0 NE1
EPN 1 0 < 0.4Ethion 1 0 < 0.4Ethoprop 1 0 < 0.4Fenthion 1 0 < 0.4Fensulfothion 1 0 < 4.8Folex 1 0 < 20.0
1 No established target quantitation limit
PARAMETERBASEFLOW

B-30
TABLE B-6, continued. Water Quality Summary for Clark Creek at 20th Avenue SE (SiteCLCL06)
N #DET MAX MIN MED MEAN
Organophosphorous Pesticides (µg/L),continued…Mevinphos 1 0 < 0.4Monocrotophos 1 0 < 0.8Naled 1 0 < 0.8Ethyl Parathion 1 0 < 0.4Methyl Parathion 1 0 < 0.4Phorate 1 0 < 0.4Ronnel 1 0 < 0.4Sulfotepp 1 0 < 0.4Terbufos 1 0 < 0.4
Nitrogen Pesticides via EPA Method 619 / 630 (µg/L)Alachlor 1 0 < 5.0Ametryn 1 0 < 1.5Atrazine 1 0 < 1.5Bromacil 1 0 < 10Butachlor 1 0 < 10Butylate 1 0 < 1.5Carboxin 1 0 < 10Chlorpropham 1 0 < 5.0Chlorpyrifos 1 0 < 0.5Cyanazine 1 0 < 2.5Cycloate 1 0 < 1.5Diazinon 1 0 < 0.5Diphenamid 1 0 < 5.0EPTC 1 0 < 1.5Fenamiphos 1 0 < 5.0Hexazinone 1 0 < 5.0Metolachlor 1 0 < 5.0Metribuzin 1 0 < 5.0MGK 264 1 0 < 20.0Molinate 1 0 < 1.5Napropamide 1 0 < 10.0Norflurazon 1 0 < 5.0Pebulate 1 0 < 1.5Prometon 1 0 < 1.5Prometryn 1 0 < 1.5Pronamide 1 0 < 5.0Propazine 1 0 < 1.5Simazine 1 0 < 1.5Simetryn 1 0 < 1.5Tebuthiuron 1 0 < 5.0Terbacil 1 0 < 20.0Terbufos 1 0 < 0.5Terbutryn 1 0 < 1.5Vernolate 1 0 < 1.5
PARAMETERBASEFLOW

B-31
TABLE B.7 Water Quality Summary for Clark Creek at Sweetwater Road (Site CLCL07)
N #DET MAX MIN MED MEAN
Field Parameters
Water Temperature (oC) 12 N/A 23.8 2.7 19.4 16.9
Specific Cond (µS/cm) 12 N/A 166 82 145 136DO (mg/L) 12 N/A 9.6 6.8 8.0 8.0DO (% saturation) 7 N/A 97.0 75.0 87.0 87.2pH (Standard Units) 10 N/A 7.6 6.6 7.2 7.1
PARAMETERBASEFLOW

B-32
TABLE B.8 Water Quality Summary for Clark Creek at Exit 126 I-40 (Site CLCL08)
N #DET MAX MIN MED MEAN
Field ParametersAir Temperature (oC) 2 N/A 17 16 17 17Water Temperature (oC) 2 N/A 18.8 11.8 15.3 15.3Specific Cond (µS/cm) 2 N/A 209 201 205 205DO (mg/L) 2 N/A 7.6 7.4 7.5 7.5DO (% saturation) 2 N/A 80.0 71.3 75.7 75.7pH (Standard Units) 2 N/A 7.2 7.0 7.1 7.1
Nutrients (mg/L)Ammonia Nitrogen 2 1 0.1Total Kjeldahl Nitrogen 2 2 3.9 1.0 2.5 2.5Nitrate+Nitrite Nitrogen 2 2 1.53 0.49 1.01 1.01Total Phosphorus 2 2 0.42 0.03 0.23 0.23
Miscellaneous Inorganics (mg/L)Hardness, Total 2 2 77.0 64.0 70.5 70.5Residue, T. Suspended 2 2 13.6 11.0 12.3 12.3Total Dissolved Solids 2 2 142 69 106 106
Turbidity (NTU) 2 2 20.0 11.7 15.9 15.9
Metals (µg/L)Aluminum 2 2 470 290 380 380Arsenic 2 0 < 5Cadmium 2 0 < 0.1Chromium 2 0 < 1Copper 2 0 < 1Iron 2 2 617 609 613 613Lead 2 0 < 1Manganese 2 2 177 139 158 158Mercury 2 0 < 0.2Nickel 2 0 < 1Silver 2 0 < 0.5Zinc 2 2 8 2 5 5
Ions (mg/L)Calcium 2 2 22.2 19.1 20.7 20.7Magnesium 2 2 4.1 3.4 3.8 3.8Potassium 2 2 8.3 7.3 7.8 7.8Sodium 2 2 8.4 8.2 8.3 8.3Bromide 2 2 < 0.05Chloride 2 2 6.71 6.08 6.40 6.40Fluoride 2 2 0.763 0.584 0.674 0.674Orthophosphate 2 0 < 0.01Nitrite 2 2 0.084 0.020 0.052 0.052Nitrate 2 2 1.280 0.463 0.872 0.872Sulfate 2 2 32.9 27.2 30.1 30.1
PARAMETERBASEFLOW

B-33
TABLE B.9 Water Quality Summary for Clark Creek at 16th Street (Site CLCL09)
N #DET MAX MIN MED MEAN
Field ParametersAir Temperature (oC) 2 N/A 20 15 18 18Water Temperature (oC) 12 N/A 23.7 2.2 15.8 15.3Specific Cond (µS/cm) 13 N/A 104 78 93 93DO (mg/L) 12 N/A 8.4 7.4 8.5 8.4DO (% saturation) 7 N/A 99.0 62.0 90.5 87.8pH (Standard Units) 11 N/A 7.0 6.6 7.0 7.0
Nutrients (mg/L)Ammonia Nitrogen 2 0 < 0.1Total Kjeldahl Nitrogen 2 2 1.4 0.8 1.1 1.1Nitrate+Nitrite Nitrogen 2 2 1.07 0.99 1.03 1.03Total Phosphorus 2 2 0.46 0.04 0.25 0.25
Miscellaneous Inorganics (mg/L)Hardness, Total 2 2 34.0 32.0 33.0 33.0Residue, T. Suspended 2 2 2.7 1.7 2.2 2.2Total Dissolved Solids 2 2 127 82 105 105
Turbidity (NTU) 2 2 6.7 3.0 4.9 4.9
Metals (µg/L)Aluminum 2 2 169 48 109 109Arsenic 2 0 < 5Cadmium 2 0 < 0.1Chromium 2 0 < 1Copper 2 0 < 1Iron 2 2 396 305 351 351Lead 2 0 < 1Manganese 2 2 39 21 30 30Mercury 2 0 < 0.2Nickel 2 0 < 1Silver 2 0 < 0.5Zinc 2 2 17 14 16 16
Ions (mg/L)Calcium 2 2 9.8 7.6 8.7 8.7Magnesium 2 2 4.0 2.6 3.3 3.3Potassium 2 2 9.4 3.0 6.2 6.2Sodium 2 2 27.5 5.6 16.6 16.6Bromide 2 1 0.52Chloride 2 2 8.28 8.14 8.21 8.21Fluoride 2 2 0.72 0.61 0.66 0.66Orthophosphate 2 0 < 0.01Nitrite 2 1 0.02Nitrate 2 2 0.92 0.89 0.90 0.90Sulfate 2 2 6.45 4.35 5.40 5.40
PARAMETERBASEFLOW
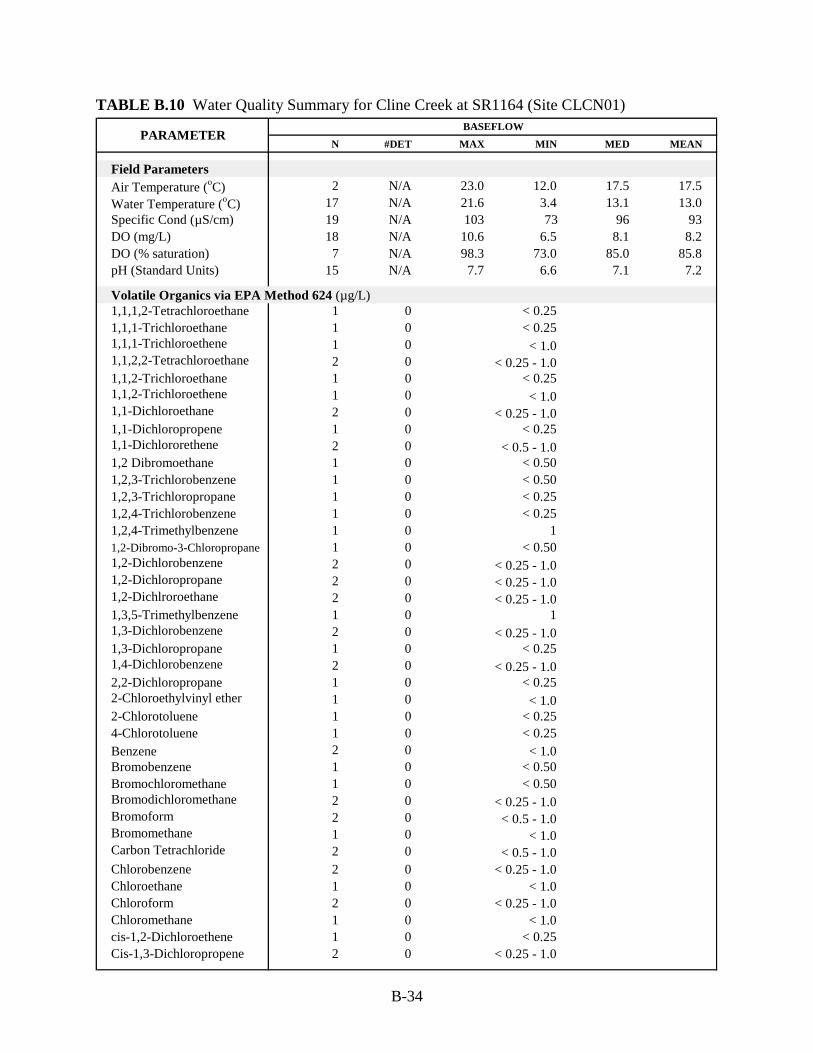
B-34
TABLE B.10 Water Quality Summary for Cline Creek at SR1164 (Site CLCN01)
N #DET MAX MIN MED MEAN
Field ParametersAir Temperature (oC) 2 N/A 23.0 12.0 17.5 17.5Water Temperature (oC) 17 N/A 21.6 3.4 13.1 13.0Specific Cond (µS/cm) 19 N/A 103 73 96 93DO (mg/L) 18 N/A 10.6 6.5 8.1 8.2DO (% saturation) 7 N/A 98.3 73.0 85.0 85.8pH (Standard Units) 15 N/A 7.7 6.6 7.1 7.2
Volatile Organics via EPA Method 624 (µg/L)1,1,1,2-Tetrachloroethane 1 0 < 0.251,1,1-Trichloroethane 1 0 < 0.251,1,1-Trichloroethene 1 0 < 1.01,1,2,2-Tetrachloroethane 2 0 < 0.25 - 1.01,1,2-Trichloroethane 1 0 < 0.251,1,2-Trichloroethene 1 0 < 1.01,1-Dichloroethane 2 0 < 0.25 - 1.01,1-Dichloropropene 1 0 < 0.251,1-Dichlororethene 2 0 < 0.5 - 1.01,2 Dibromoethane 1 0 < 0.501,2,3-Trichlorobenzene 1 0 < 0.501,2,3-Trichloropropane 1 0 < 0.251,2,4-Trichlorobenzene 1 0 < 0.251,2,4-Trimethylbenzene 1 0 11,2-Dibromo-3-Chloropropane 1 0 < 0.501,2-Dichlorobenzene 2 0 < 0.25 - 1.01,2-Dichloropropane 2 0 < 0.25 - 1.01,2-Dichlroroethane 2 0 < 0.25 - 1.01,3,5-Trimethylbenzene 1 0 11,3-Dichlorobenzene 2 0 < 0.25 - 1.01,3-Dichloropropane 1 0 < 0.251,4-Dichlorobenzene 2 0 < 0.25 - 1.02,2-Dichloropropane 1 0 < 0.252-Chloroethylvinyl ether 1 0 < 1.02-Chlorotoluene 1 0 < 0.254-Chlorotoluene 1 0 < 0.25Benzene 2 0 < 1.0Bromobenzene 1 0 < 0.50Bromochloromethane 1 0 < 0.50Bromodichloromethane 2 0 < 0.25 - 1.0Bromoform 2 0 < 0.5 - 1.0Bromomethane 1 0 < 1.0Carbon Tetrachloride 2 0 < 0.5 - 1.0Chlorobenzene 2 0 < 0.25 - 1.0Chloroethane 1 0 < 1.0Chloroform 2 0 < 0.25 - 1.0Chloromethane 1 0 < 1.0cis-1,2-Dichloroethene 1 0 < 0.25Cis-1,3-Dichloropropene 2 0 < 0.25 - 1.0
PARAMETERBASEFLOW

B-35
TABLE B.10, continued. Water Quality Summary for Cline Creek at SR1164 (Site CLCN01)
N #DET MAX MIN MED MEAN
Volatile Organics (µg/L), continued…Dibromemethane 1 0 < 0.50Dibromochloromethane 2 0 < 0.5 - 1.0Ethyl benzene 2 0 < 1.0Hexachlorobutadiene 1 0 < 0.25Isopropylbenzene 1 0 1M + P Xylene 2 0 < 2.0Methylene Chloride 2 0 < 1.0 - 10Methyl-tert-butyl ether 1 0 5Naphthalene 1 0 1n-Butylbenzene 1 0 1n-Propylbenzene 1 0 1O - Xylene 2 0 < 1.0p-isopropyltoluene 1 0 1sec-Butylbenzene 1 0 1Styrene 1 0 1tert-Butylbenzene 1 0 1Tetrachloroethene 2 0 < 0.25 - 1.0Toluene 2 0 < 1.0Trans-1,2-Dichloroethene 2 0 < 0.5 - 1.0Trans-1,3-Dichloropropene 2 0 < 0.25 - 1.0Trichloroethane 1 0 < 1.0Trichloroethene 1 0 < 0.25Trichlorofluoromethane 1 0 < 1.0Vinyl Chloride 1 0 < 1.0
Base/Neutral & Acid Organics via EPA Method 625 (µg/L)Acenaphthlene 1 0 < 10Acenaphthylene 1 0 < 10Aniline 1 0 < 10Anthracene 1 0 < 10Benzo(a)anthracene 1 0 < 10Benzo(a)pyrene 1 0 < 10Benzo(b)fluoranthene 1 0 < 10Benzo(g,h,i,)perylene 1 0 < 10Benzo(k)fluoranthene 1 0 < 10Benzoic Acid 1 0 < 50Benzyl Alcohol 1 0 < 20Bis(2-Chloroethoxy)methane 1 0 < 10Bis(2-Chloroethyl)ether 1 0 < 10Bis(2-Chloroisopropyl)ether 1 0 < 10Bis(2-ethylhexyl)phthalate 1 0 < 104-bromophenyl phenyl ether 1 0 < 10Butylbenzylphthalate 1 0 < 104-Chloroaniline 1 0 < 204-Chloro-3-methylphenol 1 0 < 202-Chloronaphthalene 1 0 < 102-Chlorophenol 1 0 < 10
PARAMETERBASEFLOW

B-36
TABLE B.10, continued. Water Quality Summary for Cline Creek at SR1164 (Site CLCN01)
N #DET MAX MIN MED MEAN
Base/Neutral & Acid Organics (µg/L), continued…4-Chlorophenyl phenyl ether 1 0 < 10Chrysene 1 0 < 10Di-n-Butylphthalate 1 0 < 10Di-n-octylphthalate 1 0 < 10Dibenzo(a,h)anthracene 1 0 < 10Dibenzofuran 1 0 < 101,2-Dichlorobenzene 1 0 < 101,3-Dichlorobenzene 1 0 < 101,4-Dichlorobenzene 1 0 < 103,3’-Dichlorobenzidine 1 0 < 202,4-Dichlorophenol 1 0 < 10Diethylphthalate 1 0 < 102,4-Dimethylphenol 1 0 < 10Dimethylphthalate 1 0 < 104,6-Dinitro-2-methylphenol 1 0 < 502,4-Dinitrophenol 1 0 < 502,4-Dinitrotoluene 1 0 < 102,6-Dinitrotoluene 1 0 < 10Fluoranthene 1 0 < 10Fluorene 1 0 < 10Hexachlorobenzene 1 0 < 10Hexachlorobutadiene 1 0 < 10Hexachlorocyclopentadiene 1 0 < 10Hexachloroethane 1 0 < 10Indeno(1,2,3-c,d)pyrene 1 0 < 10Isophorone 1 0 < 102-Methylnaphthalene 1 0 < 102-Methylphenol 1 0 < 104-Methylphenol 1 0 < 10N-nitrosodi-n-propylamine 1 0 < 10N-Nitrosodiphenylamine 1 0 < 10Naphthalene 1 0 < 102-Nitroaniline 1 0 < 503-Nitroaniline 1 0 < 504-Nitroaniline 1 0 < 50Nitrobenzene 1 0 < 102-Nitrophenol 1 0 < 104-Nitrophenol 1 0 < 50Pentachlorophenol 1 0 < 50Phenanthrene 1 0 < 10Phenol 1 0 < 10Pyrene 1 0 < 101,2,4-Trichlorobenzene 1 0 < 102,4,5-Trichlorophenol 1 0 < 102,4,6-Trichlorophenol 1 0 < 10
PARAMETERBASEFLOW

B-37
TABLE B.10, continued. Water Quality Summary for Cline Creek at SR1164 (Site CLCN01)
N #DET MAX MIN MED MEAN
Chlorinated Pesticides & PCB’s via EPA Method 608 (µg/L)Alachlor 1 0 < 0.08Aldrin 1 0 < 0.01Atrazine 1 0 < 1.50BHC-Alpha 1 0 < 0.01BHC-Beta 1 0 < 0.01BHC-Delta 1 0 < 0.01BHC-Gamma 1 0 < 0.01Chlordane, Technical 1 0 < 0.30Chlordane-Alpha 1 0 < 0.01Chlordane-Gamma 1 0 < 0.02Chlordene 1 0 < 0.01Chlorneb 1 0 < 0.10Chlorobenzilate 1 0 < 0.30Chlorpyrifos 1 0 < 0.03Chlorothalonil 1 0 < 0.01DCPA 1 0 < 0.01DDD, OP 1 0 < 0.03DDD, PP 1 0 < 0.01DDE, OP 1 0 < 0.02DDE, PP 1 0 < 0.01DDT, OP 1 0 < 0.02DDT, PP 1 0 < 0.01Dieldrin 1 0 < 0.01Endosulfan I 1 0 < 0.01Endosulfan II 1 0 < 0.01Endosulfan Sulfate 1 0 < 0.01Endrin 1 0 < 0.01Endrin Andehyde 1 0 < 0.01Endrin Ketone 1 0 < 0.02Ethazole 1 0 < 0.03Heptachlor 1 0 < 0.01Heptachlor Epoxide 1 0 < 0.01Hexachlorobenzene 1 0 < 0.01Malathion 1 0 < 0.10Methoxychlor, PP 1 0 < 0.05Mirex 1 0 < 0.02Trans-Nonachlor 1 0 < 0.01Oxychlordane 1 0 < 0.03Mixed-Permethrin 1 0 < 0.60Propachlor 1 0 < 0.15Tecnazene 1 0 < 0.01Trifluralin 1 0 < 0.02Aroclor 1016 1 0 < 0.50Aroclor 1221 1 0 < 0.50Aroclor 1232 1 0 < 0.50Aroclor 1242 1 0 < 0.50
PARAMETERBASEFLOW

B-38
TABLE B.10, continued. Water Quality Summary for Cline Creek at SR1164 (Site CLCN01)
N #DET MAX MIN MED MEAN
Chlorinated Pesticides & PCB’s (µg/L), continued…Aroclor 1248 1 0 < 0.50Aroclor 1254 1 0 < 0.50Aroclor 1260 1 0 < 0.50Aroclor 1262 1 0 < 0.50Toxaphene 1 0 < 1.50
Acid Herbicides via EPA Method 615 (µg/L)Acifluorfen 1 0 < 0.10Bentazon 1 0 < 0.80Chloramben 1 0 < 0.202,4-D 1 0 < 0.402,4-DB 1 0 < 0.80DCPA 1 0 < 0.10Dicamba 1 0 < 0.103,5 Dichlorobenzoic Acid 1 0 < 0.60Dichlorprop 1 0 < 0.60Dinoseb 1 0 < 0.205-Hydroxydicamba 1 0 < 0.104-Nitrophenol 1 0 < 3.20Pentachlorophenol 1 0 < 0.05Picloram 1 0 < 0.202,4,5-T 1 0 < 0.102,4,5-TP 1 0 < 0.10
Organophosphorous Pesticides via EPA Method 614 / 622 (µg/L)
Carbophenothion 1 0 < 0.8Chlorpyrifos 1 0 < 0.4Def 1 0 < 0.4Demeton 1 0 < 0.8Diazinon 1 0 < 0.4Dichlorvos 1 0 < 0.4Dimethoate 1 0 < 0.4Disulfoton 1 0 < 0.8Disulfoton Sulfone 1 0 < 1.0Disulfoton Sulfoxide 1 0 NE1
EPN 1 0 < 0.4Ethion 1 0 < 0.4Ethoprop 1 0 < 0.4Fenthion 1 0 < 0.4Fensulfothion 1 0 < 4.8Folex 1 0 < 20.0Mevinphos 1 0 < 0.4Monocrotophos 1 0 < 0.8Naled 1 0 < 0.8Ethyl Parathion 1 0 < 0.4Methyl Parathion 1 0 < 0.4
1 No established target quantitation limit
PARAMETERBASEFLOW

B-39
TABLE B.10, continued. Water Quality Summary for Cline Creek at SR1164 (Site CLCN01)
N #DET MAX MIN MED MEAN
Organophosphorous Pesticides (µg/L), continued…Phorate 1 0 < 0.4Ronnel 1 0 < 0.4Sulfotepp 1 0 < 0.4Terbufos 1 0 < 0.4
Nitrogen Pesticides via EPA Method 619 / 630 (µg/L)Alachlor 1 0 < 5.0Ametryn 1 0 < 1.5Atrazine 1 0 < 1.5Bromacil 1 0 < 10Butachlor 1 0 < 10Butylate 1 0 < 1.5Carboxin 1 0 < 10Chlorpropham 1 0 < 5.0Chlorpyrifos 1 0 < 0.5Cyanazine 1 0 < 2.5Cycloate 1 0 < 1.5Diazinon 1 0 < 0.5Diphenamid 1 0 < 5.0EPTC 1 0 < 1.5Fenamiphos 1 0 < 5.0Hexazinone 1 0 < 5.0Metolachlor 1 0 < 5.0Metribuzin 1 0 < 5.0MGK 264 1 0 < 20.0Molinate 1 0 < 1.5Napropamide 1 0 < 10.0Norflurazon 1 0 < 5.0Pebulate 1 0 < 1.5Prometon 1 0 < 1.5Prometryn 1 0 < 1.5Pronamide 1 0 < 5.0Propazine 1 0 < 1.5Simazine 1 0 < 1.5Simetryn 1 0 < 1.5Tebuthiuron 1 0 < 5.0Terbacil 1 0 < 20.0Terbufos 1 0 < 0.5Terbutryn 1 0 < 1.5Vernolate 1 0 < 1.5
PARAMETERBASEFLOW

B-40
TABLE B.11 Water Quality Summary for Town Creek at US 321 (Site CLTS01)
N #DET MAX MIN MED MEAN N #DET MAX MIN MED MEAN
Field ParametersWater Temperature (oC) 19 N/A 22.9 3.7 13.2 13.7 1 N/A 20.5 20.5 20.5 20.5Specific Cond (µS/cm) 19 N/A 114 92 106 105 1 N/A 103 103 103 103DO (mg/L) 19 N/A 11.4 6.6 8.2 8.5 1 N/A 7.8 7.8 7.8 7.8DO (% saturation) 7 N/A 110.0 83.0 85.0 90.0 1 N/A 86.0 86.0 86.0 86.0pH (Standard Units) 15 N/A 7.8 6.6 7.2 7.2 1 N/A 6.8 6.8 6.8 6.8
Chlorinated Pesticides & PCB’s via EPA Method 608 (µg/L)alpha-BHC 0 1 0 < 0.2beta-BHC 0 1 0 < 0.2delta-BHC 0 1 0 < 0.2gamma-BHC 0 1 0 < 0.2Heptachlor 0 1 0 < 0.2Aldrin 0 1 0 < 0.2Heptachlor epoxide 0 1 0 < 0.2Endosulfan I 0 1 0 < 0.2Dieldrin 0 1 0 < 0.24,4'-DDE 0 1 0 < 0.2Endrin 0 1 0 < 0.2DDD 0 1 0 < 0.2Endosulfan II 0 1 0 < 0.24,4'-DDT 0 1 0 < 0.2Methoxychlor 0 1 0 < 0.2Endrin aldehyde 0 1 0 < 0.2Endosulfan sulfate 0 1 0 < 0.2Endrin ketone 0 1 0 < 0.2Toxaphene 0 1 0 < 1.0Chlordane 0 1 0 < 1.0Arochlor-1016 0 1 0 < 1.0Arochlor-1221 0 1 0 < 1.0Arochlor-1232 0 1 0 < 1.0Arochlor-1242 0 1 0 < 1.0Arochlor-1248 0 1 0 < 1.0Arochlor-1254 0 1 0 < 1.0Arochlor-1260 0 1 0 < 1.0
Current-Use Pesticides via Gas Chromatography / Mass Spectrometry (µg/L)2,6-Diethylanaline 0 1 0 < 0.005Alachlor 0 1 0 < 0.005Atrazine 0 1 0 < 0.005Benfluralin 0 1 0 < 0.005Butylate 0 1 0 < 0.005Carbaryl 0 1 0 < 0.005Carbofuran 0 1 0 < 0.005Chlorothalonil 0 1 0 < 0.005Chlorpyrifos 0 1 0 < 0.005Cyanazine 0 1 0 < 0.005Dacthal 0 1 0 < 0.005
PARAMETERBASEFLOW STORMFLOW
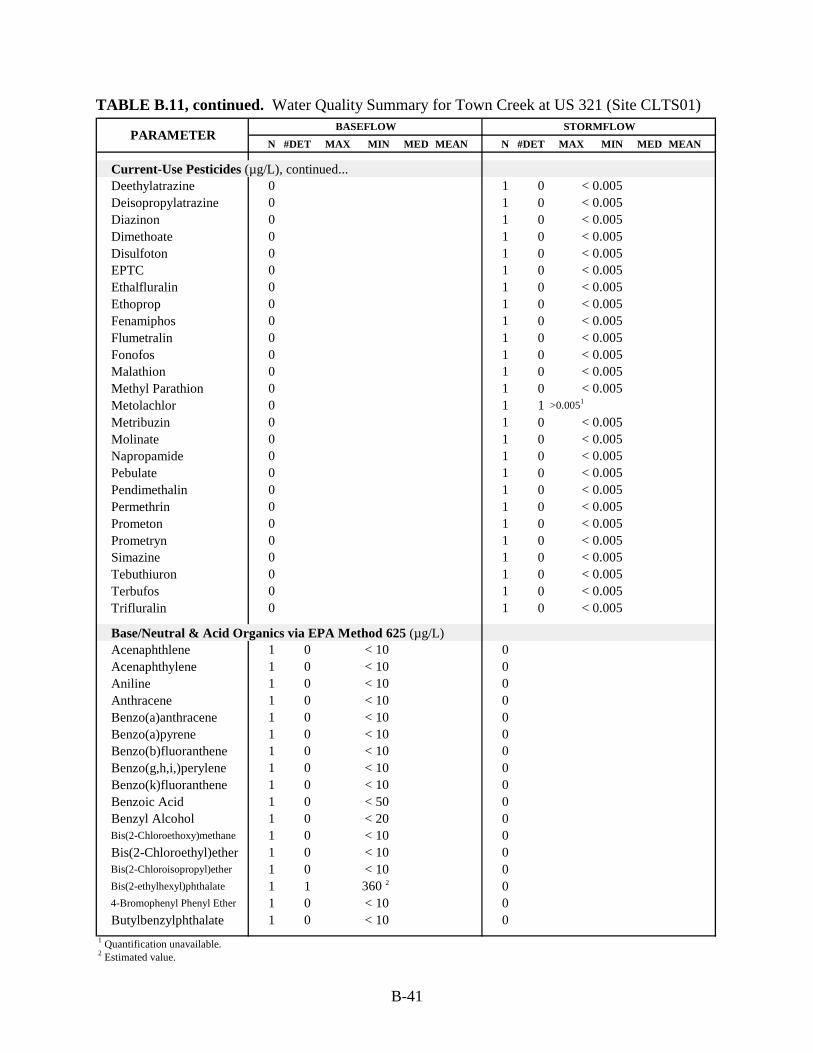
B-41
TABLE B.11, continued. Water Quality Summary for Town Creek at US 321 (Site CLTS01)
N #DET MAX MIN MED MEAN N #DET MAX MIN MED MEAN
Current-Use Pesticides (µg/L), continued...Deethylatrazine 0 1 0 < 0.005Deisopropylatrazine 0 1 0 < 0.005Diazinon 0 1 0 < 0.005Dimethoate 0 1 0 < 0.005Disulfoton 0 1 0 < 0.005EPTC 0 1 0 < 0.005Ethalfluralin 0 1 0 < 0.005Ethoprop 0 1 0 < 0.005Fenamiphos 0 1 0 < 0.005Flumetralin 0 1 0 < 0.005Fonofos 0 1 0 < 0.005Malathion 0 1 0 < 0.005Methyl Parathion 0 1 0 < 0.005Metolachlor 0 1 1 >0.0051
Metribuzin 0 1 0 < 0.005Molinate 0 1 0 < 0.005Napropamide 0 1 0 < 0.005Pebulate 0 1 0 < 0.005Pendimethalin 0 1 0 < 0.005Permethrin 0 1 0 < 0.005Prometon 0 1 0 < 0.005Prometryn 0 1 0 < 0.005Simazine 0 1 0 < 0.005Tebuthiuron 0 1 0 < 0.005Terbufos 0 1 0 < 0.005Trifluralin 0 1 0 < 0.005
Base/Neutral & Acid Organics via EPA Method 625 (µg/L)Acenaphthlene 1 0 < 10 0Acenaphthylene 1 0 < 10 0Aniline 1 0 < 10 0Anthracene 1 0 < 10 0Benzo(a)anthracene 1 0 < 10 0Benzo(a)pyrene 1 0 < 10 0Benzo(b)fluoranthene 1 0 < 10 0Benzo(g,h,i,)perylene 1 0 < 10 0Benzo(k)fluoranthene 1 0 < 10 0Benzoic Acid 1 0 < 50 0Benzyl Alcohol 1 0 < 20 0Bis(2-Chloroethoxy)methane 1 0 < 10 0Bis(2-Chloroethyl)ether 1 0 < 10 0Bis(2-Chloroisopropyl)ether 1 0 < 10 0Bis(2-ethylhexyl)phthalate 1 1 360 2 04-Bromophenyl Phenyl Ether 1 0 < 10 0Butylbenzylphthalate 1 0 < 10 0
1 Quantification unavailable.2 Estimated value.
PARAMETERBASEFLOW STORMFLOW

B-42
TABLE B.11, continued. Water Quality Summary for Town Creek at US 321 (Site CLTS01)
N #DET MAX MIN MED MEAN N #DET MAX MIN MED MEAN
Base/Neutral & Acid Organics (µg/L), continued…4-Chloroaniline 1 0 < 20 04-Chloro-3-methylphenol 1 0 < 20 02-Chloronaphthalene 1 0 < 10 02-Chlorophenol 1 0 < 10 04-Chlorophenyl phenyl ether 1 0 < 10 0Chrysene 1 0 < 10 0Di-n-Butylphthalate 1 0 < 10 0Di-n-octylphthalate 1 0 < 10 0Dibenzo(a,h)anthracene 1 0 < 10 0Dibenzofuran 1 0 < 10 01,2-Dichlorobenzene 1 0 < 10 01,3-Dichlorobenzene 1 0 < 10 01,4-Dichlorobenzene 1 0 < 10 03,3’-Dichlorobenzidine 1 0 < 20 02,4-Dichlorophenol 1 0 < 10 0Diethylphthalate 1 0 < 10 02,4-Dimethylphenol 1 0 < 10 0Dimethylphthalate 1 0 < 10 04,6-Dinitro-2-methylphenol 1 0 < 50 02,4-Dinitrophenol 1 0 < 50 02,4-Dinitrotoluene 1 0 < 10 02,6-Dinitrotoluene 1 0 < 10 0Fluoranthene 1 0 < 10 0Fluorene 1 0 < 10 0Hexachlorobenzene 1 0 < 10 0Hexachlorobutadiene 1 0 < 10 0Hexachlorocyclopentadiene 1 0 < 10 0Hexachloroethane 1 0 < 10 0Indeno(1,2,3-c,d)pyrene 1 0 < 10 0Isophorone 1 0 < 10 02-Methylnaphthalene 1 0 < 10 02-Methylphenol 1 0 < 10 04-Methylphenol 1 0 < 10 0N-nitrosodi-n-propylamine 1 0 < 10 0N-Nitrosodiphenylamine 1 0 < 10 0Naphthalene 1 0 < 10 02-Nitroaniline 1 0 < 50 03-Nitroaniline 1 0 < 50 04-Nitroaniline 1 0 < 50 0Nitrobenzene 1 0 < 10 02-Nitrophenol 1 0 < 10 04-Nitrophenol 1 0 < 50 0Pentachlorophenol 1 0 < 50 0Phenanthrene 1 0 < 10 0Phenol 1 0 < 10 0Pyrene 1 0 < 10 01,2,4-Trichlorobenzene 1 0 < 10 02,4,5-Trichlorophenol 1 0 < 10 02,4,6-Trichlorophenol 1 0 < 10 0
PARAMETERBASEFLOW STORMFLOW

B-43
TABLE B.12 Water Quality Summary for Hildebran Creek at NC 10 (Site CLHB01)
N #DET MAX MIN MED MEAN
Field ParametersAir Temperature (oC) 1 N/A 23 23 23 23Water Temperature (oC) 4 N/A 19.5 6.4 15.8 14.4Specific Cond (µS/cm) 6 N/A 108 90 105 103DO (mg/L) 4 N/A 9.3 6.7 7.8 7.9DO (% saturation) 1 N/A 81.0 81.0 81.0 81.0pH (Standard Units) 2 N/A 7.8 7.4 7.6 7.6
Chlorinated Pesticides & PCB’s via EPA Method 608 (µg/L)Alachlor 1 0 < 0.08Aldrin 1 0 < 0.01Atrazine 1 0 < 1.50BHC-Alpha 1 0 < 0.01BHC-Beta 1 0 < 0.01BHC-Delta 1 0 < 0.01BHC-Gamma 1 0 < 0.01Chlordane, Technical 1 0 < 0.30Chlordane-Alpha 1 0 < 0.01Chlordane-Gamma 1 0 < 0.02Chlordane 1 0 < 0.01Chlorneb 1 0 < 0.10Chlorobenzilate 1 0 < 0.30Chlorpyrifos 1 0 < 0.03Chlorothalonil 1 0 < 0.01DCPA 1 0 < 0.01DDD, OP 1 0 < 0.03DDD, PP 1 0 < 0.01DDE, OP 1 0 < 0.02DDE, PP 1 0 < 0.01DDT, OP 1 0 < 0.02DDT, PP 1 0 < 0.01Dieldrin 1 0 < 0.01Endosulfan I 1 0 < 0.01Endosulfan II 1 0 < 0.01Endosulfan Sulfate 1 0 < 0.01Endrin 1 0 < 0.01Endrin Andehyde 1 0 < 0.01Endrin Ketone 1 0 < 0.02Ethazole 1 0 < 0.03Heptachlor 1 0 < 0.01Heptachlor Epoxide 1 0 < 0.01Hexachlorobenzene 1 0 < 0.01Malathion 1 0 < 0.10Methoxychlor, PP 1 0 < 0.05Mirex 1 0 < 0.02Trans-Nonachlor 1 0 < 0.01Oxychlordane 1 0 < 0.03Mixed-Permethrin 1 0 < 0.60
PARAMETERBASEFLOW

B-44
TABLE B.12, continued. Water Quality Summary for Hildebran Creek at NC 10 (SiteCLHB01)
N #DET MAX MIN MED MEAN
Chlorinated Pesticides & PCB’s (µg/L), continued…Propachlor 1 0 < 0.15Tecnazene 1 0 < 0.01Toxaphene 1 0 < 1.50Trifluralin 1 0 < 0.02Aroclor 1016 1 0 < 0.50Aroclor 1221 1 0 < 0.50Aroclor 1232 1 0 < 0.50Aroclor 1242 1 0 < 0.50Aroclor 1248 1 0 < 0.50Aroclor 1254 1 0 < 0.50Aroclor 1260 1 0 < 0.50Aroclor 1262 1 0 < 0.50
Acid Herbicides via EPA Method 615 (µg/L)Acifluorfen 1 0 < 0.10Bentazon 1 0 < 0.80Chloramben 1 0 < 0.202,4-D 1 0 < 0.402,4-DB 1 0 < 0.80DCPA 1 0 < 0.10Dicamba 1 0 < 0.103,5 Dichlorobenzoic Acid 1 0 < 0.60Dichlorprop 1 0 < 0.60Dinoseb 1 0 < 0.205-Hydroxydicamba 1 0 < 0.104-Nitrophenol 1 0 < 3.20Pentachlorophenol 1 0 < 0.05Picloram 1 0 < 0.202,4,5-T 1 0 < 0.102,4,5-TP 1 0 < 0.10
Organophosphorous Pesticides via EPA Method 614 / 622 (µg/L)Carbophenothion 1 0 < 0.8Chlorpyrifos 1 0 < 0.4Def 1 0 < 0.4Demeton 1 0 < 0.8Diazinon 1 0 < 0.4Dichlorvos 1 0 < 0.4Dimethoate 1 0 < 0.4Disulfoton 1 0 < 0.8Disulfoton Sulfone 1 0 < 1.0Disulfoton Sulfoxide 1 0 NE1
EPN 1 0 < 0.4Ethion 1 0 < 0.4Ethoprop 1 0 < 0.4Fenthion 1 0 < 0.4
1 No established target quantitation limit.
PARAMETERBASEFLOW

B-45
TABLE B.12, continued. Water Quality Summary for Hildebran Creek at NC 10 (SiteCLHB01)
N #DET MAX MIN MED MEAN
Organophosphorous Pesticides (µg/L), continued…Fensulfothion 1 0 < 4.8Folex 1 0 < 20.0Mevinphos 1 0 < 0.4Monocrotophos 1 0 < 0.8Naled 1 0 < 0.8Ethyl Parathion 1 0 < 0.4Methyl Parathion 1 0 < 0.4Phorate 1 0 < 0.4Ronnel 1 0 < 0.4Sulfotepp 1 0 < 0.4Terbufos 1 0 < 0.4
Nitrogen Pesticides via EPA Method 619 / 630 (µg/L)Alachlor 1 0 < 5.0Ametryn 1 0 < 1.5Atrazine 1 0 < 1.5Bromacil 1 0 < 10Butachlor 1 0 < 10Butylate 1 0 < 1.5Carboxin 1 0 < 10Chlorpropham 1 0 < 5.0Chlorpyrifos 1 0 < 0.5Cyanazine 1 0 < 2.5Cycloate 1 0 < 1.5Diazinon 1 0 < 0.5Diphenamid 1 0 < 5.0EPTC 1 0 < 1.5Fenamiphos 1 0 < 5.0Hexazinone 1 0 < 5.0Metolachlor 1 0 < 5.0Metribuzin 1 0 < 5.0MGK 264 1 0 < 20.0Molinate 1 0 < 1.5Napropamide 1 0 < 10.0Norflurazon 1 0 < 5.0Pebulate 1 0 < 1.5Prometon 1 0 < 1.5Prometryn 1 0 < 1.5Pronamide 1 0 < 5.0Propazine 1 0 < 1.5Simazine 1 0 < 1.5Simetryn 1 0 < 1.5Tebuthiuron 1 0 < 5.0Terbacil 1 0 < 20.0Terbufos 1 0 < 0.5Terbutryn 1 0 < 1.5Vernolate 1 0 < 1.5
PARAMETERBASEFLOW

C-1
Appendix CLand Use Data
The land use data set used in this study was developed by Catawba County based oninterpretation of March 1998 orthophotography. The data set covers the entire county at aresolution of 2.5 feet. The classes included in the data set are a mix of land use and land covercategories (Table C.1). Interpretive notes on particular classes are provided below.
The extent of impervious area is not included in the data set but was estimated by applying animpervious cover percentage to the area in each land use/land cover classification. Thepercentages used (Table C.1) are based upon typical values for each land use (as reported bySCS, 1986; and Cappiella and Brown, 2001), recent North Carolina experience (CH2M HILL,2000) and professional judgment. The estimated impervious area percentages reported inSection 2 of the report should be considered approximations.
• Class 2 includes roads, but not driveways (whether residential or commercial/industrial) orparking lots. Some pervious areas, such as interstate medians and grassed portions ofinterchanges, are included.
• Classes 3 and 4 include both the pervious and impervious portions of commercial andindustrial sites. An impervious percentage of 38% was used. This figure was based uponGIS analysis of a separate commercial/industrial impervious surface (CIIS) dataset. Thisdata set, digitized by Catawba County using the same aerial photography used to develop theland use data, was intended to include the impervious portions of commercial and industrialsites. The 38% figure is considerably below literature values for commercial and industrialareas, which can be twice this amount (SCS, 1986). Literature estimates often include publicroads associated with industrial/commercial areas, which are accounted for elsewhere in theCatawba County data. On the other hand, field checks by DWQ staff indicated that manydrives and onsite roadways were not included in the CIIS data set. The 38% figure is likelyan underestimate.
• Classes 5-8 (residential) include both pervious (grass and wooded) and impervious(buildings, patios, driveways) portions of residential property but does not include publicroads. Since residential streets are generally included in literature values for imperviouscover in residential areas, the impervious % associated with classes 5-8 can be expected to beless than most values reported in the literature. How much less is not clear. Values slightlylower than those reported by Cappiella and Brown (2001) were used here, rather thanestimates based on the higher values for residential areas reported by SCS (1986).Nonetheless, the impervious % values used likely overestimate the imperviousnessassociated associated with residential areas, exclusive of public roads.
• Class 9 includes bare agricultural land, construction sites and other base soil areas such as theMartin Marietta quarry.
• Class 11 includes pasture, as well as other grassy areas such as parks and golf courses.
The following classes were combined for mapping purposes only:2 and 13 (roads and railroad rights of way);

C-2
5 and 6 (high density residential); and7 and 8 (low density residential).
Table C.1 Land Use/Cover Classes and Impervious Cover PercentClass Land Use Impervious
Cover Percent1 Water 0%2 Impervious (paved, rock) 92%3 Commercial 38%4 Industrial 38%5 Residential ¼ acre 27%6 Residential ½ acre 21%7 Residential 1 acre 14%8 Residential 2 acre 10%9 Agriculture; fallow field; Bare Soil Land 1%10 Agriculture: active field 1%11 Agriculture: pasture; Meadow; Open Grass Land 2%12 Forest and Wooded Land 1%13 Railroad right of way 50%
References
Cappiella, K. and K. Brown. 2001. Land Use and Impervious Cover in the Chesapeake BayRegion. Watershed Protection Techniques. 3:4: 835-840. December.
CH2M HILL. 2000. Urban Stormwater Pollutant Assessment. Technical Memorandum 1.Report submitted to the North Carolina Dept. of Environment and Natural Resources,Division of Water Quality. August.
SCS. 1986. Urban Hydrology for Small Watersheds. Technical Release 55. US Department ofAgriculture Soil Conservation Service. June.
D-1
Appendix DChannel and Riparian Conditions
Section 1 General Approach
During the course of this study, project staff walked approximately 12 miles of the mainstem andtributaries of Clark Creek. On the mainstem, areas walked included:• From 0.25 miles above Tate Boulevard in Hickory, down to the upper edge of the Martin-
Marietta quarry;• From the lower edge of the quarry, down to I-40, exit 126;• From 0.5 miles above Sweetwater Rd., down to 20th Ave. SE (Hickory compost facility);• From NC 10, down to the Newton WWTP below McKay Rd.; and• from SR 2007 west of Maiden 0.6 miles, upstream to below Betts Branch.
Tributary sections walked included:• Miller Branch 1 miles up from 12th Ave. SE;• Cline Creek 1.5 miles up from Clark Creek; and• Smyre Creek 1.5 miles up from Clark Creek.
Reconnaissance activities were conducted at numerous other mainstem and tributary locations.
Project staff walked the identified sections of channel while carrying out the following tasks:• Observing overall channel stability, noting specific areas of sediment deposition, severe bank
erosion, evidence of channelization and similar attributes;• Observing overall riparian area condition and the nature of surrounding land use;• Identifying wastewater discharge pipes, stormwater outfalls, other piped inputs or
withdrawals, and tributary inflows;• Observing visual water quality conditions (odors, surface films, etc);• Noting specific areas where pollutants are or may be entering the stream (livestock access
areas, dump sites, land clearing adjacent to the stream, etc);• Identifying specific areas that may be candidates for channel restoration or BMPs (best
management practices);• Providing digital photo documentation of key features; and• Conducting formal habitat assessments at representative reaches, as appropriate.
Section 2 Existing Conditions
As noted in Section 2, in the early 20th Century Clark Creek was channelized from itsconfluence with Miller Branch, in the headwaters area, to its mouth. Because of the direct andindirect impacts of this channelization, much of Clark Creek retains a remarkably uniformappearance today. We therefore begin this section by describing the current conditions in the

D-2
historically channelized section of Clark Creek, a description that applies generally from MillerBranch to the downstream end of the study area. Following this, we provide specificinformation about individual stream sections. For the unchannelized sections above MillerBranch, this includes a discussion of morphology and habitat. For the channelized areas (belowMiller Branch), this discussion is confined to riparian areas, land use and pollutant sourceinformation.
2.1 Clark Creek Channelization
The present path of Clark Creek, its channel shape, bottom type and bank erosion are stronglyinfluenced by its channelization, which began in 1909. This project, described in Section 2.2 ofthis report, started at the confluence of Miller Branch, north of I-40, and proceeded downstream,ending at the confluence with the South Fork Catawba River in Lincolnton. The followingdescription of the stream channel shape, bottom type and bank erosion applies to the mainstem ofClark Creek from Miller Branch to the end of the study area at SR 2007 west of Maiden. Thelower reaches (0.5 to 1.0 mile of each of the main tributaries of Clark Creek) were alsochannelized, so the following descriptions apply to those tributary reaches as well.
The channel shape originally targeted for the channelization project was 20 feet wide and eightfeet deep, and widening as it proceeded downstream. This general shape was indeed producedby use of a steam shovel floating on a wooden barge, supplemented by blasting where bedrockwas encountered. The channel today retains this basic rectangular cross section. The banks arealmost uniformly steep and typically eight to ten feet high. The channel is largely straight,though the creek has developed some bends in the decades since channelization was completed.Undercutting of streamside tree roots is common, especially on the outsides of bends (ExhibitD.1). These tree roots help protect the banks from washing away during high flows, but the treeseventually topple into the stream after a period of years. There are no real riffles in the stream,and sections of channel without fallen trees are uniformly shallow, usually covering the entirechannel bottom with a few inches of water. Tree trunks and root balls in the channel produceturbulence, which scours away enough sand to produce pools. These pools, and the structure andsubstrate offered by the trees themselves, afford the best fish and macroinvertebrate habitat in thestream.
Exhibit D.1 Bank erosion in Clark Creek

D-3
Bottom substrate is uniformly medium to coarse sand, often several feet deep, (Exhibit D.2)which moves downstream during both baseflow and storm flows. Sandbars shift from bank tobank during storm events, creating a very unstable environment for aquatic organisms. Duringbaseflow, sand can be seen moving downstream in small dunes; by this mechanism small pools--which were created by turbulence during high water--are filled with sand.
Bank erosion along the entire length of the channelized mainstem ranges from moderate tosevere. Slumping and healing has occurred in some areas but erosion is widespread and massfailure is not uncommon. It is likely that these eroding banks, rather than runoff fromconstruction sites or other land disturbing activities, is the primary source of the abundant sand inthe streambed. Due to the height of the banks, the stream rarely floods over its banks. Theenergy of stormflows must therefore be absorbed by the stream banks, instead of being able tospread out over a flood plain at reduced velocity. The confining nature of the high verticalbanks, combined with the effect of large impervious areas in the upper watershed, exacerbatesthe bank erosion problem.
Exhibit D.2 Sand Deposits > 4 feet deep in Cline Creek. Note staff inserted into stream bed.
2.2 Clark Creek Mainstem
Clark Creek Above Tate Boulevard. From its source near Highland Avenue to Tate Boulevard,the small stream flows through an area of primarily light industry and warehouses. The streamslope is fairly high in most places, with periodic bedrock substrate alternating with small sandypools and occasional riffles. The reach immediately upstream of Tate Boulevard is very sandyand overgrown with kudzu (Exhibit D.3). Bank heights are generally 2-4 feet, and bank erosionis moderate to severe.
Clark Creek From Tate Boulevard to Quarry. The upper part of this reach flows primarilythrough residential areas and has high (6-10 ft.) steep banks. It is dominated by pools and runswith sandy bottoms and has a relatively low gradient. Bank erosion is severe in many areas andman-made debris is commonly observed in the stream. The riparian area is well wooded on thewest side. Only a thin line of trees borders most of the east side, with parking lots, utility rights-of-way and a baseball field beyond the tree line.

D-4
From the 16th Street sewage pump station to the quarry, the immediate riparian area isundeveloped and has good forest cover for several hundred yards on both sides. The gradientincreases, the banks are lower and more gradually sloped, and the substrate is mostly boulder,cobble and gravel, with occasional sandbars (Exhibit D.4). Bank erosion is minor; man-madedebris is still abundant. At the upper edge of the active quarry operations, the stream is divertedto the east of the quarry for about 0.5 miles.
Exhibit D.3 Clark Creek above Tate Blvd. Exhibit D.4 Clark Creek below Tate Boulevard, above Quarry
Clark Creek From Quarry to I-40, Exit 126. The stream exits the quarry property at a 15 footwaterfall. This is a saprolite knickpoint that marks the downstream terminus of the bypasschannel constructed around the quarry. Below the knickpoint Clark Creek flows through a steep-sided gully, approximately 250 yards long with walls upward of 30 feet high on both sides(Exhibit D.5). The origins of this canyon-like area are not clear, though portions of it may havebeen excavated at some point. The stream gradient is moderately high. The substrate is bedrock,very large quarry boulders, gravel and sand. The east bank is severely eroding, with widespreadevidence of mass failure. The west bank is armored with boulders. As noted in Section 6, ageomorphic evaluation and restoration feasibility assessment for this reach was carried out by theNCSU Stream Restoration Institute as a part of this study (NCSU, 2002a).
After emerging from the canyon, the stream has vertical banks of 8 to 12 feet, a moderategradient, and sandy pool and run habitat with occasional cobble and gravel riffles. Stream sidevegetation is primarily mixed hardwood forest. The channel parallels the interstate for the last200 yards before it enters a 1000+ feet long culvert under I-40. It is largely straight, but with agood mixture of riffles and pools, low bank heights and minimal bank erosion. Substrate is amix of boulder, cobble, gravel and sand. Stream bank vegetation is very early succession,recovering from highway construction activities.
Clark Creek From above Sweetwater Road. to confluence with Miller Branch. AboveSweetwater Road, the stream flows along the south side of I-40 for about 0.5 mi., then passesunder I-40 and Sweetwater Road to the north side of I-40 for about 0.5 mi., joining MillerBranch (1.9 sq. mi., 21% impervious) downstream of the Catawba County Human Resources
D-5
Center. This area along I-40 has several large commercial construction projects underway,adding to the already extensive impervious areas associated with the rooftops and parking lots ofshopping centers, restaurants and other commercial areas. Impervious area for the Clark Creekheadwaters above Miller Branch was estimated at 29%, the highest in the study area, based on1998 aerial photography (see Section 2).
The stream gradient in this reach is moderate to low, with few riffles; the substrate is largelysand, with occasional boulders and gravel areas. Banks are generally steep and high, withmoderate to severe erosion evident.
Clark Creek From Miller Branch to 20th Ave. SE. Clark Creek flows south with a golf coursealong the west side, flows under US 70/321, and passes a cemetery and the Hickory MotorSpeedway. The US 70/321 corridor, which predated I-40, has many commercial developmentswith large areas of impervious cover.
Clark Creek From NC 10 to Newton WWTP. The stream in this section flows through areas thatare primarily low density residential, pasture, and forestland with the usual sewer line crossingsand manholes paralleling the stream. Southside Park lies along the Creek near the lower end ofthis section. Hildebran Creek (3.5 sq. mi., 25% impervious area) joins Clark Creek about 0.25mi. downstream of NC 10. It drains western Newton, west of Business US 321. Town Creek(7.5 sq. mi., 14% impervious area) joins Clark at the lower end of Southside Park. Town Creekdrains eastern Newton, while its tributary, Smyre Creek, drains a mostly suburban and rural area.Just downstream of McKay Rd. (SR 2014), the City of Newton’s Clark Creek WastewaterTreatment Plant (5.0 MGD) lies on the west bank of the stream (see Section 2.6 of the maintext).
As a part of the current study, the DWQ contracted with the Stream Restoration Institute at NorthCarolina State University to conduct a morphological evaluation and restoration feasibilityassessment of a 1000 foot reach of Clark Creek adjacent to Southside Park. This reach is typicalof much of Clark Creek. The NCSU evaluation (NCSU, 2001) classified this reach as an E5 typechannel (Rosgen, 1996) with a width/depth ratio of 6 (see Section 6). The report noted that thechannel was laterally unstable due to the considerable bank erosion that was evident.
Clark Creek From SR 2007, upstream 0.6 mi. Starting about 300 yards upstream of the SR 2007bridge, a dragline sand dredge operates, removing sand from about 150 yards of the stream bedfor use in concrete pipe manufacture. The sand is piled on the east bank and allowed to dewaterbefore it is loaded into trucks and delivered to the manufacturing plant. The dredging takes placeintermittently, with gaps of several months during dry weather, as sufficient sand accumulates inthe deepened stream channel. Baseflows deliver a low, but constant supply of sand fromupstream, but the bulk arrives with storm flows. This operation and a similar one below RomeJones Road (about 1.25 mi. upstream) indicate the high mass of sand that is transported by ClarkCreek.
Above the dredging area, the channel fits the description of the rest of the channelized creek.The riparian area is fully wooded on both sides of the stream, with pasture areas beyond. The

D-6
banks, on the west in particular, had old cow trails cutting more gradual slopes into the otherwisenear-vertical banks (Exhibit D.6). Deer trails crossing the stream were common.
Exhibit D.5 Clark Creek—gully below waterfall Exhibit D.6 Old cow trails above SR 2007
2.3 Tributaries
Miller Branch. Miller Branch (1.9 sq. mi.) starts just south of Highland Avenue in Hickory, thenpasses under Tate Boulevard., which was recently widened to four lanes. Other commercialconstruction projects are also underway along Tate Boulevard. The stream then flows throughan undeveloped area with tree-lined banks until emerging near the Catawba County HumanResources Center, which is also undergoing an expansion. Miller Branch then flows under 12th
Ave. SE, passes high density residential areas, and finally joins Clark Creek just north of I-40.Impervious area was estimated as 21%, based on 1998 aerial photography (see Section 2).
As noted above, Miller Branch is exposed to the effects of several large construction projectsalong its short length, and these effects are apparent in the volumes of sand that fill its banks.The stream banks are not as severely eroded, especially in the lower reaches, compared to mostother tributaries and the mainstem, and inputs from land-disturbing activities in the drainage areaappear to be a major source of sediment to the stream. Banks are steep and generally range from4-8 feet in height. The riparian area is largely wooded, providing adequate shading along mostof the stream reach. Periodic bedrock outcrops in the lower reaches of the creek provide gradecontrol.
A small unnamed tributary entering Miller Branch at the edge of the Human Resources Centerparking lot has recently incised and its stream banks have many areas of serious erosion.Channel widening is imminent. Stormwater from the Catawba Valley Medical Center propertyprovides a major portion of the drainage to this stream (Exhibit D.7).
Cline Creek. Cline Creek has a total drainage area of 5.1 square miles. The reach below Old St.Paul’s Church Road (SR 1164) was apparently one of the areas included in the channelizationproject discussed above. The following description applies to the stream upstream of Old St.Paul’s Church Road to US 70/321, a distance of about one mile. Land use in this area is a

D-7
mixture of low density residential and light industrial development, with sewer and electricutility line crossings of the stream as well. The stream gradient is moderate, with occasionalriffles, but mostly pools and runs. The substrate is mostly sand, except at riffle areas and a fewareas with exposed clay banks. The banks are steep in most areas and typically 4-8 feet inheight. Bank erosion is moderate to severe, a symptom of the large areas of impervious surfaces(21%) upstream. The stream exhibits a somewhat sinuous path, instead of the straight patterntypical of channelized stream reaches. The immediate riparian areas were well vegetated withmixed trees and herbaceous vegetation. As noted in Section 6, a geomorphic evaluation andrestoration feasibility assessment for this reach upstream of Old St. Pauls Church Road wascarried out by the NCSU Stream Restoration Institute as a part of this study (NCSU, 2002b).
Smyre Creek. Smyre Creek was surveyed from St. James Church Road down to the confluencewith Town Creek above Southside Park in Newton, a distance of about 1.3 miles. How much ofSmyre Creek was channelized is unclear. The stream is similar in general appearance to theother stream reaches surveyed. Banks are generally steep and generally 4-8 ft. high. Substrate ismostly sand, but with occasional riffles of cobble and gravel. Runs and pools are more prevalentthan riffles, with some appreciable depth to the pools compared to the Clark mainstem. Bankerosion is somewhat less severe than other streams surveyed, perhaps due to the lowerimperviousness of this rural and suburban drainage. Riparian vegetation was primarily mixedhardwood trees, providing adequate shading; in several areas, only a thin line of trees separatedthe stream from a fenced pasture area. No recent evidence of livestock in the stream wasobserved, although some areas appear to be recovering from past livestock access.
Exhibit D.7 Storm drainage to Miller Branch tributaryfrom Catawba Valley Medical Center

D-8
Section 3 References
NCSU. 2001. Morphological Evaluation and Restoration Feasibility Assessment: Clark Creek in Newton,NC. North Carolina State University. Stream Restoration Institute. Raleigh. November.
NCSU. 2002a. Morphological Evaluation and Restoration Feasibility Assessment: Clark Creek at theMartin Marietta Quarry in Hickory, NC. North Carolina State University. Stream RestorationInstitute. Raleigh. January.
NCSU. 2002b. Morphological Evaluation and Restoration Feasibility Assessment: Cline Creek aboveOld St. Pauls Church Road (SR 1164), in Newton, NC. North Carolina State University. StreamRestoration Institute. Raleigh. February