Embed Size (px)
Citation preview
National Park Service U.S. Department of the Interior Appalachian National Scenic Trail Roanoke, Virginia
February 2021
Catawba Mountain, Appalachian Trail, VA (Photo courtesy of Roanoke Appalachian Trail Club)
Appalachian National Scenic Trail, Triple Crown Area Transit Feasibility Study Final Report
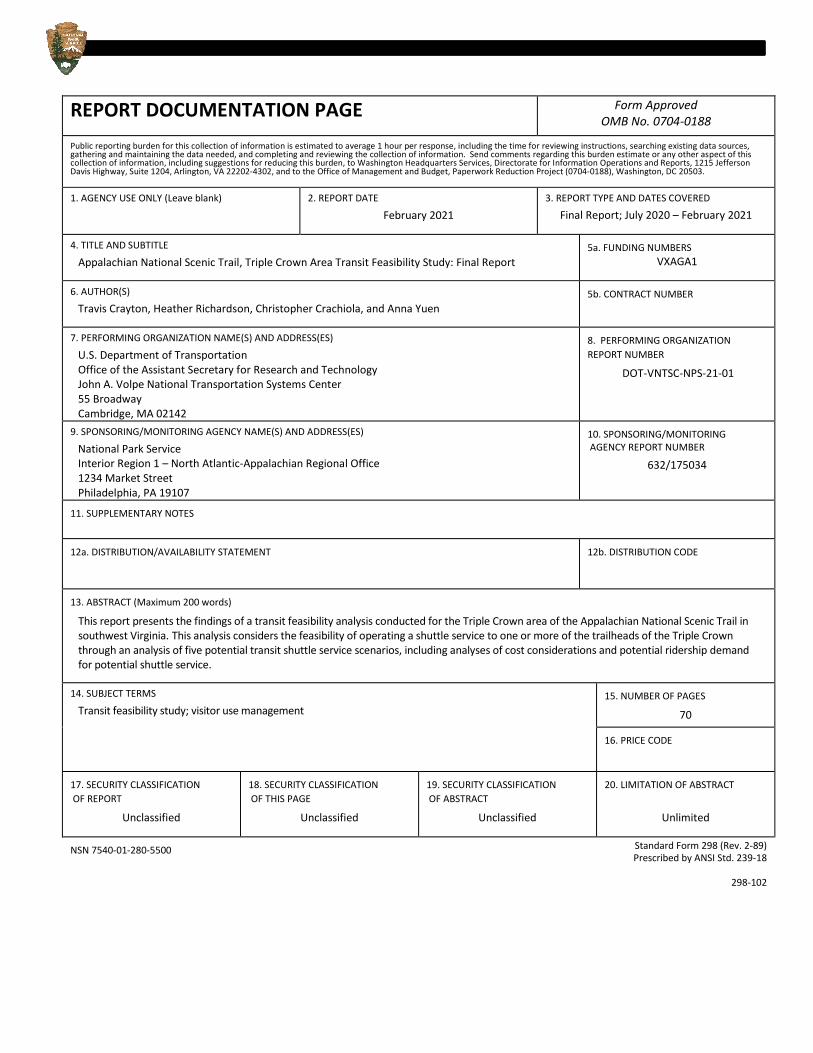
REPORT DOCUMENTATION PAGE Form Approved OMB No. 0704-0188
Public reporting burden for this collection of information is estimated to average 1 hour per response, including the time for reviewing instructions, searching existing data sources, gathering and maintaining the data needed, and completing and reviewing the collection of information. Send comments regarding this burden estimate or any other aspect of this collection of information, including suggestions for reducing this burden, to Washington Headquarters Services, Directorate for Information Operations and Reports, 1215 Jefferson Davis Highway, Suite 1204, Arlington, VA 22202-4302, and to the Office of Management and Budget, Paperwork Reduction Project (0704-0188), Washington, DC 20503.
1. AGENCY USE ONLY (Leave blank)
2. REPORT DATE
February 2021 3. REPORT TYPE AND DATES COVERED
Final Report; July 2020 – February 2021
4. TITLE AND SUBTITLE
Appalachian National Scenic Trail, Triple Crown Area Transit Feasibility Study: Final Report 5a. FUNDING NUMBERS
VXAGA1
6. AUTHOR(S)
Travis Crayton, Heather Richardson, Christopher Crachiola, and Anna Yuen 5b. CONTRACT NUMBER
7. PERFORMING ORGANIZATION NAME(S) AND ADDRESS(ES)
U.S. Department of Transportation Office of the Assistant Secretary for Research and Technology John A. Volpe National Transportation Systems Center 55 Broadway Cambridge, MA 02142
8. PERFORMING ORGANIZATION REPORT NUMBER
DOT-VNTSC-NPS-21-01
9. SPONSORING/MONITORING AGENCY NAME(S) AND ADDRESS(ES)
National Park Service Interior Region 1 – North Atlantic-Appalachian Regional Office 1234 Market Street Philadelphia, PA 19107
10. SPONSORING/MONITORING AGENCY REPORT NUMBER
632/175034
11. SUPPLEMENTARY NOTES
12a. DISTRIBUTION/AVAILABILITY STATEMENT
12b. DISTRIBUTION CODE
13. ABSTRACT (Maximum 200 words)
This report presents the findings of a transit feasibility analysis conducted for the Triple Crown area of the Appalachian National Scenic Trail in southwest Virginia. This analysis considers the feasibility of operating a shuttle service to one or more of the trailheads of the Triple Crown through an analysis of five potential transit shuttle service scenarios, including analyses of cost considerations and potential ridership demand for potential shuttle service.
14. SUBJECT TERMS
Transit feasibility study; visitor use management 15. NUMBER OF PAGES
70
16. PRICE CODE
17. SECURITY CLASSIFICATION OF REPORT
Unclassified
18. SECURITY CLASSIFICATION OF THIS PAGE
Unclassified
19. SECURITY CLASSIFICATION OF ABSTRACT
Unclassified
20. LIMITATION OF ABSTRACT
Unlimited
NSN 7540-01-280-5500 Standard Form 298 (Rev. 2-89) Prescribed by ANSI Std. 239-18
298-102
i | Appalachian National Scenic Trail, Triple Crown Area – Transit Feasibility Study
Table of Contents
Acknowledgments .............................................................................................. iii
Definitions ........................................................................................................... iii
Introduction and Background .............................................................................1 Project Purpose ................................................................................................................ 1 Project Area ..................................................................................................................... 2 Methodology ................................................................................................................... 4
Shuttle Service Scenarios ....................................................................................6 Baseline Service: Exit 140 Park-and-Ride Lot to McAfee Knob ............................................ 8 Scenario #1: Exit 140 Park-and-Ride Lot to Dragon’s Tooth .............................................. 11 Scenario #2: Downtown Salem/Roanoke College to McAfee Knob ................................... 14 Scenario #3: Downtown Salem/Roanoke College to Dragon’s Tooth ................................ 17 Scenario #4: Loop Service ............................................................................................... 20
Business Models................................................................................................. 23
Analysis .............................................................................................................. 24 McAfee Knob Pedestrian Bridge Construction Impacts ..................................................... 24 Comparison of Shuttle Service Scenarios ......................................................................... 28
Key Findings and Recommendations ............................................................... 31
Conclusion .......................................................................................................... 32
Appendix 1: Summary of Available Data ......................................................... 34
Appendix 2: Existing Conditions ...................................................................... 41
Appendix 3: Stakeholder Outreach .................................................................. 62
February 2021 | ii
Table of Figures Figure 1: Triple Crown Area of the Appalachian National Scenic Trail .............................................................2 Figure 2: Triple Crown Area of the Appalachian National Scenic Trail Map Inset ...........................................3 Figure 3: Triple Crown Area Shuttle Service Scenario Segments .........................................................................7 Figure 4: Baseline Service Scenario Map .................................................................................................................8 Figure 5: Assessment of Goal Alignment for Baseline Service Scenario ..............................................................9 Figure 6: Scenario #1 Service Map ........................................................................................................................ 11 Figure 7. Assessment of Goal Alignment for Scenario #1 .................................................................................. 12 Figure 8: Scenario #2 Service Map ........................................................................................................................ 14 Figure 9: Assessment of Goal Alignment for Scenario #2 .................................................................................. 15 Figure 10: Scenario #3 Service Map ...................................................................................................................... 17 Figure 11: Assessment of Goal Alignment for Scenario #3 ................................................................................ 18 Figure 12: Scenario #4 Service Map ...................................................................................................................... 20 Figure 13: Assessment of Goal Alignment for Scenario #4 ................................................................................ 21 Figure 14: Average Number of Cars Parked at McAfee Knob on a Typical Busy Day by Time of Day (2017-2019) .......................................................................................................................................................................... 25 Figure 15: Average Number of Cars Arriving at McAfee Knob and Displaced by Parking Lot Capacity Reduction on a Typical Busy Day, by Hour ......................................................................................................... 26 Figure 16: Estimated Average Number of Visitors Displaced by Parking Capacity Reduction on a Typical Busy Day at McAfee Knob...................................................................................................................................... 27
Table of Tables Table 1: Baseline Service Scenario Detail ................................................................................................................9 Table 2: Baseline Service Ridership and Cost Estimates .................................................................................... 10 Table 3: Scenario #1 Service Detail ....................................................................................................................... 12 Table 4: Scenario #1 Service Ridership and Cost Estimates .............................................................................. 13 Table 5: Scenario #2 Service Detail ....................................................................................................................... 15 Table 6: Scenario #2 Service Ridership and Cost Estimates .............................................................................. 16 Table 7: Scenario #3 Service Detail ....................................................................................................................... 18 Table 8: Scenario #3 Service Ridership and Cost Estimates .............................................................................. 19 Table 9: Scenario #4 Loop Service Detail ............................................................................................................. 21 Table 10: Scenario #4 Service Ridership and Cost Estimates ............................................................................ 22 Table 11: Special Use Permit Features .................................................................................................................. 23 Table 12: Goal Alignment Comparison across Scenarios .................................................................................. 28 Table 13: Passenger Ridership Estimation for All Scenarios ............................................................................. 29 Table 14: Cost Estimate Comparison across Scenarios – Low-Ridership Projection .................................... 30 Table 15: Cost Estimate Comparison across Scenarios – High-Ridership Projection ................................... 30
iii | Appalachian National Scenic Trail, Triple Crown Area – Transit Feasibility Study
Acknowledgments The authors wish to thank the numerous organizations and individuals, who graciously provided their time, knowledge and guidance in the development of this report, including: National Park Service Appalachian National Scenic Trail Wendy Janssen, Superintendent Keith Stegall, Facilities Manager Brian Wilson, Visitor and Resource Protection Ranger Kurt Speers, Acting Chief Ranger National Park Service Region 1 Office Amanda Jones, Alternative Transportation Program Manager Michael Slobodian, Permits Manager National Park Service Denver Service Center Kim Shafer, Landscape Architect & Project Manager Rachel Collins, Visitor Use & Outdoor Recreation Planner Emily Tristant, Visitor Use Management Specialist Appalachian Trail Conservancy Andrew Downs, Senior Regional Director Kathryn Herndon-Powell, Education & Outreach Coordinator Roanoke Appalachian Trail Club Jim Beeson, President Bill Neilan, Vice President Susan Terwilliger, Secretary Diana Christopulos, Archivist and Past President United States Forest Service, George Washington & Jefferson National Forests Beth Christensen, District Ranger Matthew Helt, Dispersed Recreation Program Manager
Definitions The following terms are used in this report: A.T. Appalachian National Scenic Trail ATC Appalachian Trail Conservancy CSC Catawba Sustainability Center DSC Denver Service Center NPS National Park Service RATC Roanoke Appalachian Trail Club RVARC Roanoke Valley-Alleghany Regional Commission SUP Special Use Permit USDOT United States Department of Transportation VDOT Virginia Department of Transportation VUM Visitor Use Management
1 | Appalachian National Scenic Trail, Triple Crown Area – Transit Feasibility Study
Introduction and Background This memorandum presents the findings of the U.S. Department of Transportation’s (USDOT) Volpe Center’s transit feasibility analysis for the Triple Crown area of the Appalachian National Scenic Trail (A.T.) in southwest Virginia. This memorandum is the conclusion of a project conducted by the Volpe Center’s project team for the National Park Service (NPS) to assess the feasibility of a possible shuttle service for the Triple Crown’s trailheads, as described in more detail below. To date, three other memos have explained in detail (1) available visitation data, (2) existing conditions of transportation infrastructure at the trailheads, and (3) key takeaways from interviews with project stakeholders. The analysis presented in this memo and the preceding memos is designed to inform decision-making on future visitor use management strategies and transportation investments related to the McAfee Knob, Dragon’s Tooth, and Tinker Cliffs trailheads.
Project Purpose The purpose of this project is to examine the feasibility of operating a shuttle service to one or more of the trailheads that make up the Triple Crown of the A.T. in Virginia. This project is being done to inform a Visitor Use Management (VUM) Plan being developed by the NPS Denver Service Center (DSC) Planning Division.
Safety has been a major factor in guiding this study. At present, when the trailhead parking lots overflow, visitors park along adjacent roads, which creates numerous safety concerns. Overflow parking has long been an issue at all three trailheads. Hikers at McAfee Knob cross a state highway to access the trailhead and trail fire road from the parking area. The construction of a pedestrian bridge at the McAfee Knob parking lot, estimated to begin in fall 2024, with a completion date of fall 2025, will eliminate such vehicular interactions with trail users. In the short term, construction will necessitate closure of half of the McAfee Knob parking lot. As visitation continues to rise and with reduced parking capacity during bridge construction, there is increasing demand for solutions to alleviate parking lot congestion and address safety issues.
The construction of the pedestrian bridge at the McAfee Knob parking lot provides a unique opportunity to pilot shuttle service to address visitation demand and issues related to parking congestion. This project examines the extent to which shuttle service could improve parking lot capacity challenges, and improve safety for trail users. The information presented in this memorandum will be used in analyses of possible shuttle service scenarios and evaluation of potential long-term shuttle service as a part of the VUM Plan.
February 2021 | 2
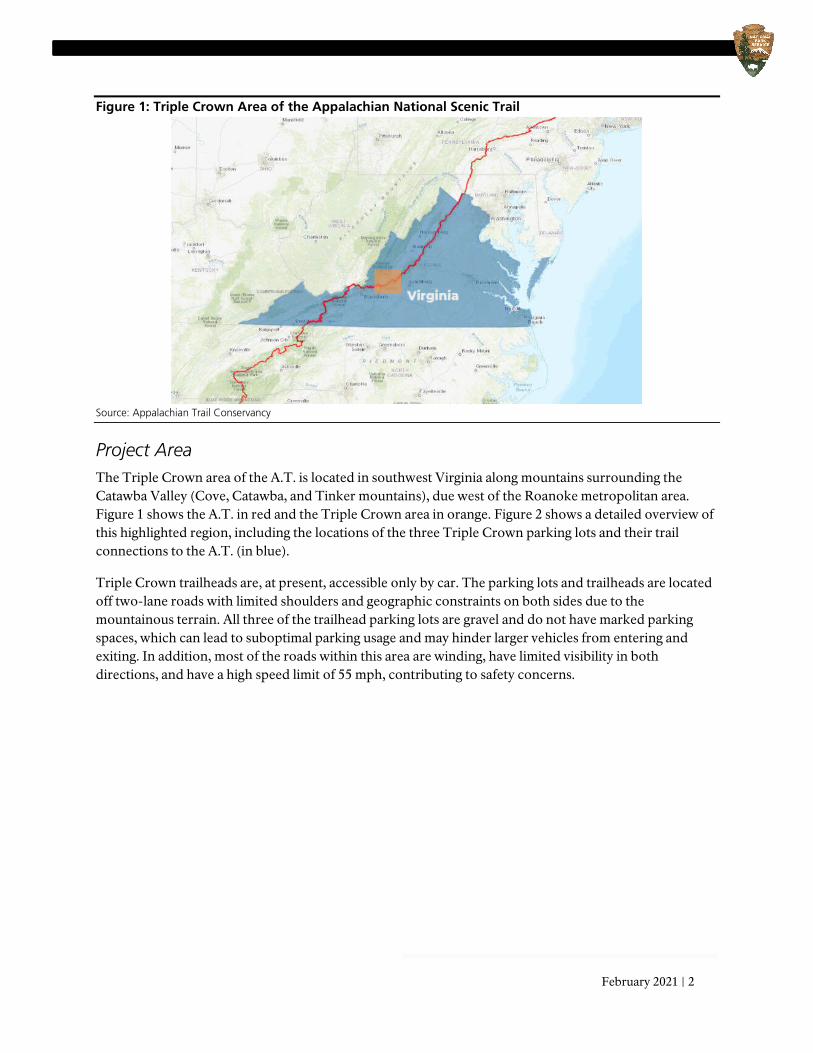
Figure 1: Triple Crown Area of the Appalachian National Scenic Trail
Source: Appalachian Trail Conservancy
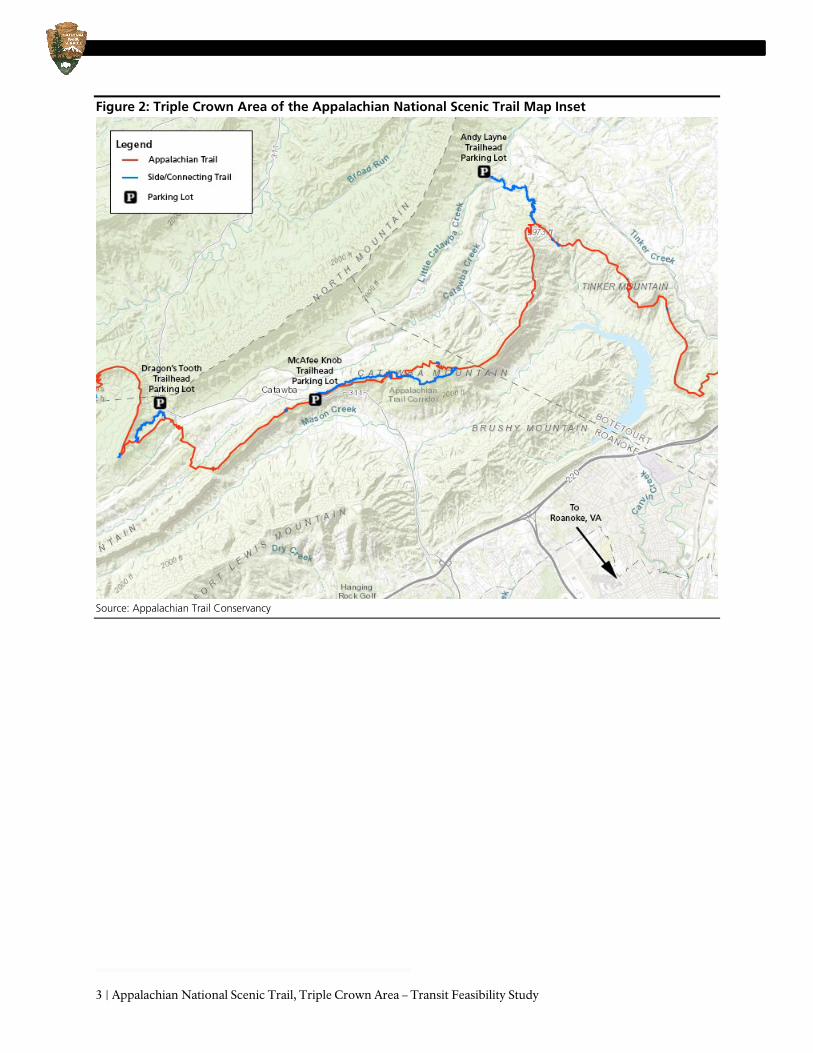
Project Area The Triple Crown area of the A.T. is located in southwest Virginia along mountains surrounding the Catawba Valley (Cove, Catawba, and Tinker mountains), due west of the Roanoke metropolitan area. Figure 1 shows the A.T. in red and the Triple Crown area in orange. Figure 2 shows a detailed overview of this highlighted region, including the locations of the three Triple Crown parking lots and their trail connections to the A.T. (in blue).
Triple Crown trailheads are, at present, accessible only by car. The parking lots and trailheads are located off two-lane roads with limited shoulders and geographic constraints on both sides due to the mountainous terrain. All three of the trailhead parking lots are gravel and do not have marked parking spaces, which can lead to suboptimal parking usage and may hinder larger vehicles from entering and exiting. In addition, most of the roads within this area are winding, have limited visibility in both directions, and have a high speed limit of 55 mph, contributing to safety concerns.
3 | Appalachian National Scenic Trail, Triple Crown Area – Transit Feasibility Study
Figure 2: Triple Crown Area of the Appalachian National Scenic Trail Map Inset
Source: Appalachian Trail Conservancy
February 2021 | 4
Methodology The project team analyzed parking lot and visitation data, existing infrastructure conditions at the trailhead parking lots, and incorporated input collected from stakeholder interviews to generate five shuttle service scenarios. For each scenario, the project team applied the methodology and assumptions outlined in this section to develop passenger ridership projections, ridership demand estimates, cost estimates, and an assessment of how well each scenario aligns with stakeholder goals.
Shuttle Scenario Development
To develop the shuttle service scenarios, the project team interviewed project stakeholders and engaged NPS and project partners to develop a list of goals for a potential shuttle service to achieve. Based on these interviews and discussions, the following goals were identified. The goals are not listed in any particular order and are intended to be used as an analytical tool to assess potential shuttle service scenarios.
• Goal 1: Address acute parking demand and congestion challenges at McAfee Knob • Goal 2: Disperse use across trailheads to improve visitor experience, visitor safety, and resource
conditions along the Triple Crown trail segments • Goal 3: Connect to other destinations in the region to provide easily accessible service to a greater
number of people • Goal 4: Provide a simple, easy-to-understand, and consistent service design for the public
Recognizing that these goals represent a broad array of interests and that some goals are in tension with one another, the project team developed five total scenarios, each of which aligns with different aspects of these goals. The project team refined the shuttle scenarios through an iterative process with NPS and project partners. This process involved an online workshop with project partners, at which consensus was achieved on the range of route options and specific stops to prioritize in shuttle service scenarios.
The project team calculated route times and developed preliminary service schedules using several agreed-upon assumptions established through discussions with NPS and project partners. Both 20-minute and 30-minute service headways are evaluated for all shuttle service scenarios analyzed in this report. NPS and project partners consistently identified a preference for 20-minute headways to meet visitor expectations. A 30-minute headway is included in analysis for cost comparison purposes. A two-minute dwell time is assumed for each stop location.
Based on visitation analysis results in an earlier memo completed for this project,1 the scenario analysis assumes that shuttles would operate 12 hours per day, on Fridays, Saturdays, and Sundays, between April and October (seven months). A 12-hour operating day is assumed for this analysis because lower levels of service would not sufficiently align with (1) visitation duration patterns and (2) limited shuttle capacity (see Passenger Ridership Projections and Ridership Demand Estimation below). Specifically, NPS staff and project partners indicated that the majority of visitors (85 percent) are day hikers, who take between six and eight hours to complete their hikes. Therefore, a shuttle service with fewer than 12 hours of service would not provide sufficient time to allow visitors to take the shuttle and complete their hikes in time to catch a return shuttle. While visitation to the Triple Crown area is slightly lower in July and
1 U.S. DOT Volpe Center, Appalachian National Scenic Trail, Triple Crown Area, Technical Memo 2: Existing Conditions, September 2020.
5 | Appalachian National Scenic Trail, Triple Crown Area – Transit Feasibility Study
August, a seven-month season of operation aligns with the primary peak visitation season and provides potential economies of scale for more cost-effective shuttle operations.
A common metric for bus transit service is the total person capacity of a transit bus, which is generally defined as the total number of passengers able to be on a bus at a given time for a bus to safely operate. For this analysis, the total person capacity of the vehicle is the number of seats on the vehicle, as it would not be safe to have standing passengers on mountainous highway routes. A high rate of passenger turnover (i.e., passengers only go one stop and get off) means the bus can carry more passengers over the course of the route. For this analysis, we assume that bus trips will not have high rates of turnover in the peak direction of travel.2 Passengers will stay on the bus until they reach their desired trailhead, which in most cases will be McAfee Knob. Therefore, passenger capacity is the same for all scenarios, even with additional stops served.
Passenger Ridership Projections and Ridership Demand Estimation
The analysis does not have the benefit of ridership data from an existing service. Instead, the estimated demand for a Triple Crown shuttle is based on existing visitation data, experience from peer shuttle services in the NPS, and several agreed-upon assumptions established through discussions with NPS and project partners.
First, the analysis presented in this memo assumes no changes to current trailhead parking lot design and geometry at the Dragon’s Tooth parking lot and the Andy Layne trailhead parking lot (used to access Tinker Cliffs). Buses and large shuttle vehicles cannot enter and exit these trailhead parking lots, and there is not adequate shoulder space for roadside boarding and alighting. As a result, the shuttle capacity assumption used throughout this analysis is 12 passengers. While design changes to the parking lots may be implemented in the future, it is beyond the scope of this memo to analyze these possibilities.
Second, passenger ridership projection calculations assume that every passenger will board the shuttle twice – once outbound to the trail and once back inbound to their point of origin (e.g., their car). As a result, the total number of riders is estimated to be half the total number of boardings. Because the shuttle service would represent new service, the project team did not have data upon which to predict rider behavior. To account for this, the analysis presents two possible ridership projections: a low-ridership projection and a high-ridership projection. The low-ridership projection assumes that every shuttle roundtrip departs in the peak direction with seven passengers (at 60 percent capacity). The high-ridership projection assumes that every shuttle roundtrip departs in the peak direction with 12 passengers (at 100 percent capacity).
Third, ridership demand calculations associated with the McAfee Knob pedestrian bridge construction project are built upon prior analysis of observational parking lot count data. This data and analysis is explained in detail in an earlier memo developed for this project.3 The ridership demand analysis for McAfee Knob assumes that half of the parking lot spaces will be unavailable during pedestrian bridge construction; reducing the 75 available parking spaces to 37 spaces during construction. Consistent with
2 The peak direction of travel refers to the direction of travel when ridership is highest by the time of day. The morning peak direction of travel for the Triple Crown area is outbound toward the trailheads. The peak direction switches to inbound in the afternoon as hikers return to the origin of their trip (e.g., their car). 3 U.S. DOT Volpe Center, Appalachian National Scenic Trail, Triple Crown Area, Technical Memo 2: Existing Conditions, September 2020.
February 2021 | 6
NPS data, it is estimated that each vehicle visiting the A.T. via a Triple Crown trailhead parking lot carries 2.8 people.4 While it is possible that changes to the McAfee Knob parking lot could impact these assumptions, it is beyond the scope of this memo to analyze these possibilities.
Cost Estimation
The project team used a cost estimate range based on service hours to develop cost estimates for the shuttle service scenarios. The cost per hour range estimates were based on stakeholder interviews conducted for this project and comparison of similar NPS transit service costs. These cost per service hour estimates assume a cost of $80 per hour on the lower end of the range to $100 per hour on the higher end, and that every rider who takes the shuttle in one direction will complete a return trip. Cost per trip and cost per rider estimates are shown for both the low-ridership and high-ridership projections, 60 percent capacity and 100 percent capacity, respectively.
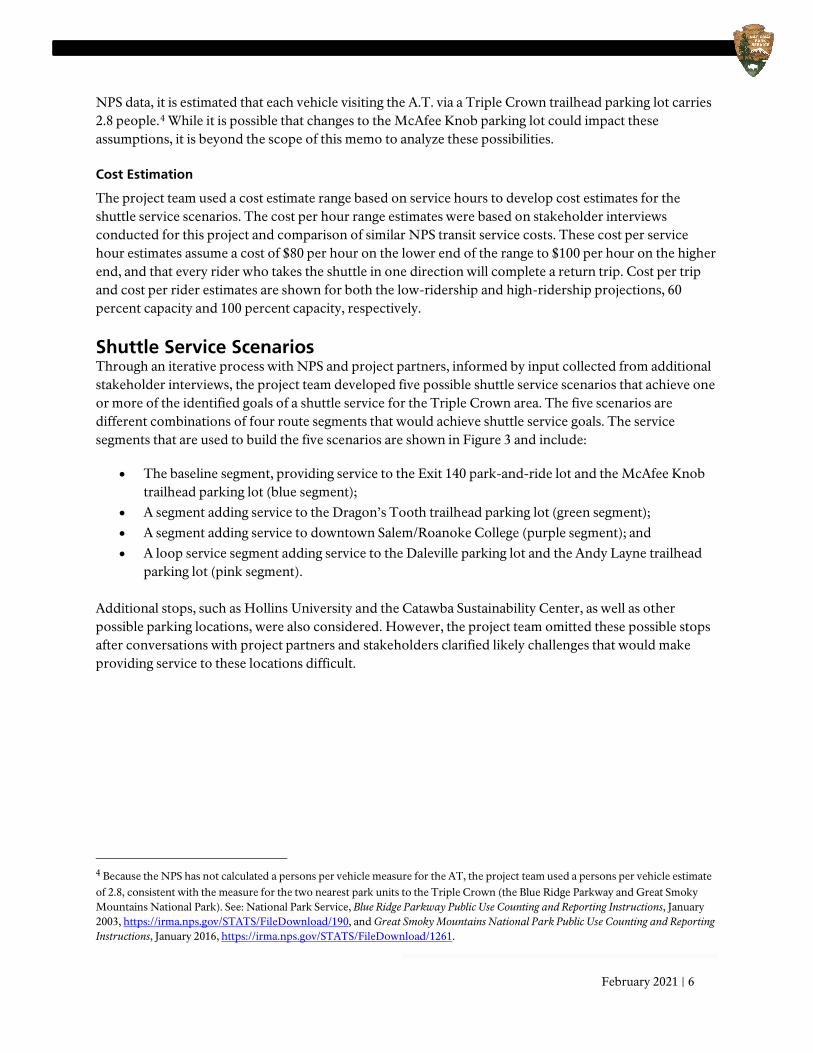
Shuttle Service Scenarios Through an iterative process with NPS and project partners, informed by input collected from additional stakeholder interviews, the project team developed five possible shuttle service scenarios that achieve one or more of the identified goals of a shuttle service for the Triple Crown area. The five scenarios are different combinations of four route segments that would achieve shuttle service goals. The service segments that are used to build the five scenarios are shown in Figure 3 and include:
• The baseline segment, providing service to the Exit 140 park-and-ride lot and the McAfee Knob trailhead parking lot (blue segment);
• A segment adding service to the Dragon’s Tooth trailhead parking lot (green segment); • A segment adding service to downtown Salem/Roanoke College (purple segment); and • A loop service segment adding service to the Daleville parking lot and the Andy Layne trailhead
parking lot (pink segment). Additional stops, such as Hollins University and the Catawba Sustainability Center, as well as other possible parking locations, were also considered. However, the project team omitted these possible stops after conversations with project partners and stakeholders clarified likely challenges that would make providing service to these locations difficult.
4 Because the NPS has not calculated a persons per vehicle measure for the AT, the project team used a persons per vehicle estimate of 2.8, consistent with the measure for the two nearest park units to the Triple Crown (the Blue Ridge Parkway and Great Smoky Mountains National Park). See: National Park Service, Blue Ridge Parkway Public Use Counting and Reporting Instructions, January 2003, https://irma.nps.gov/STATS/FileDownload/190, and Great Smoky Mountains National Park Public Use Counting and Reporting Instructions, January 2016, https://irma.nps.gov/STATS/FileDownload/1261.
7 | Appalachian National Scenic Trail, Triple Crown Area – Transit Feasibility Study
Figure 3: Triple Crown Area Shuttle Service Scenario Segments
Source: Volpe Center / Google Maps
Passenger Ridership Estimations
Under the low-ridership projection for all shuttle scenarios, the shuttle would serve 14 to 21 passengers per hour and between 88 and 130 passengers per day while in service. Under the high-ridership projection for all shuttle service scenarios, the shuttle would serve 24 to 36 passengers per hour and between 150 and 220 per day while in service. Based on seven months of service (four weeks per month), three days per week, the annual total ridership estimation under the low-ridership projection would be approximately 7,392 to 10,920 riders per year. Under the high-ridership projection, the annual total ridership estimation would be approximately 12,600 to 18,650 riders per year. These estimates are summarized in the service ridership and cost estimate tables in each scenario description.
February 2021 | 8
Baseline Service: Exit 140 Park-and-Ride Lot to McAfee Knob
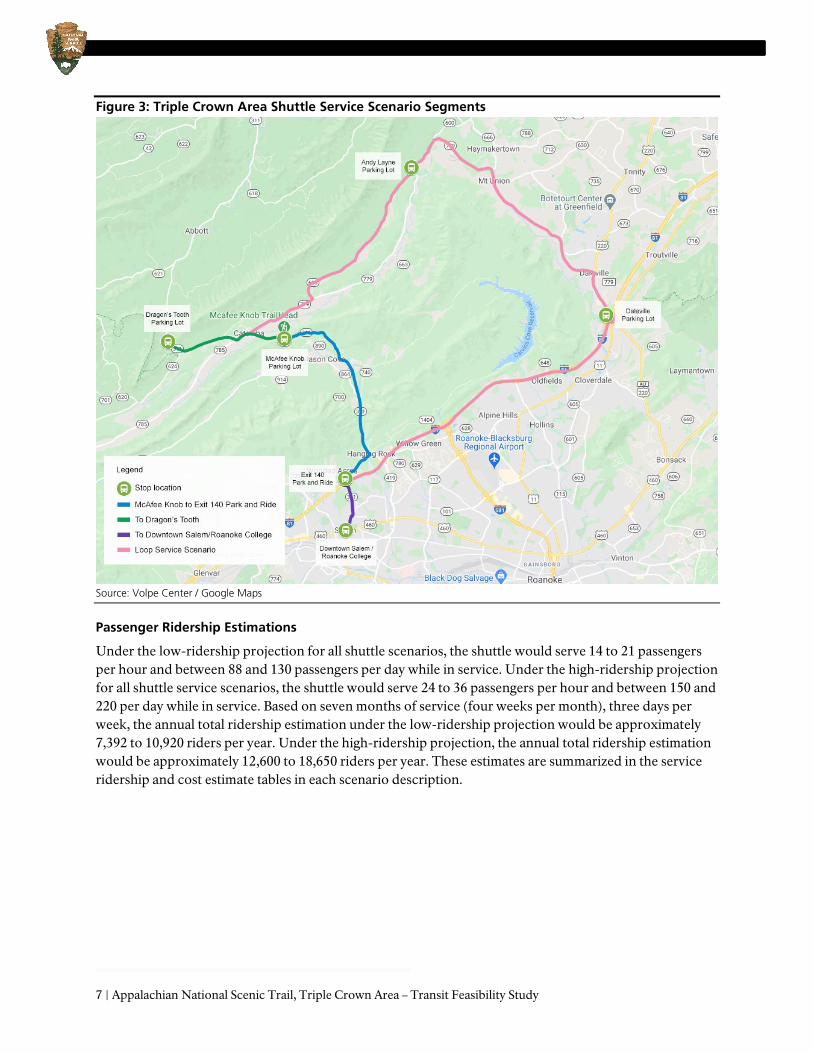
Figure 4: Baseline Service Scenario Map
Source: Volpe Center / Google Maps
Service Design
The baseline service scenario provides direct service from the Exit 140 park-and-ride lot to the McAfee Knob trailhead parking lot. NPS and project stakeholders identified this baseline service as the most critical segment for a possible shuttle service given the high visitation demand experienced at McAfee Knob and the pending closure of half of the parking lot. A map of this service scenario is shown in Figure 4.
The baseline service scenario would provide service from the Exit 140 park-and-ride lot on Edgebrook Road. The shuttle would turn right out of the lot and travel north on Edgebrook Road. It would then turn right onto Mountain Heights Drive before turning left onto VA-311 (Thompson Memorial Drive), which is an unsignalized intersection. The shuttle would continue on VA-311, turning left at its junction with Route 419 onto Catawba Valley Drive. The shuttle would turn left into the McAfee Knob parking lot to drop off passengers. The return route would follow the same path in reverse. A specific shuttle stop location would need to be designated in the McAfee Knob parking lot. The stop should be placed where the shuttle can safely let off passengers and be able to turn around without excessive maneuvers. Parking in the shuttle stop and turnaround path must be prohibited and enforced to ensure the shuttle can
9 | Appalachian National Scenic Trail, Triple Crown Area – Transit Feasibility Study
successfully navigate the parking area and complete a turnaround. Unauthorized parking that blocks the shuttles path can result in schedule delays and potentially unsafe conditions for passengers to get on or off the vehicle.
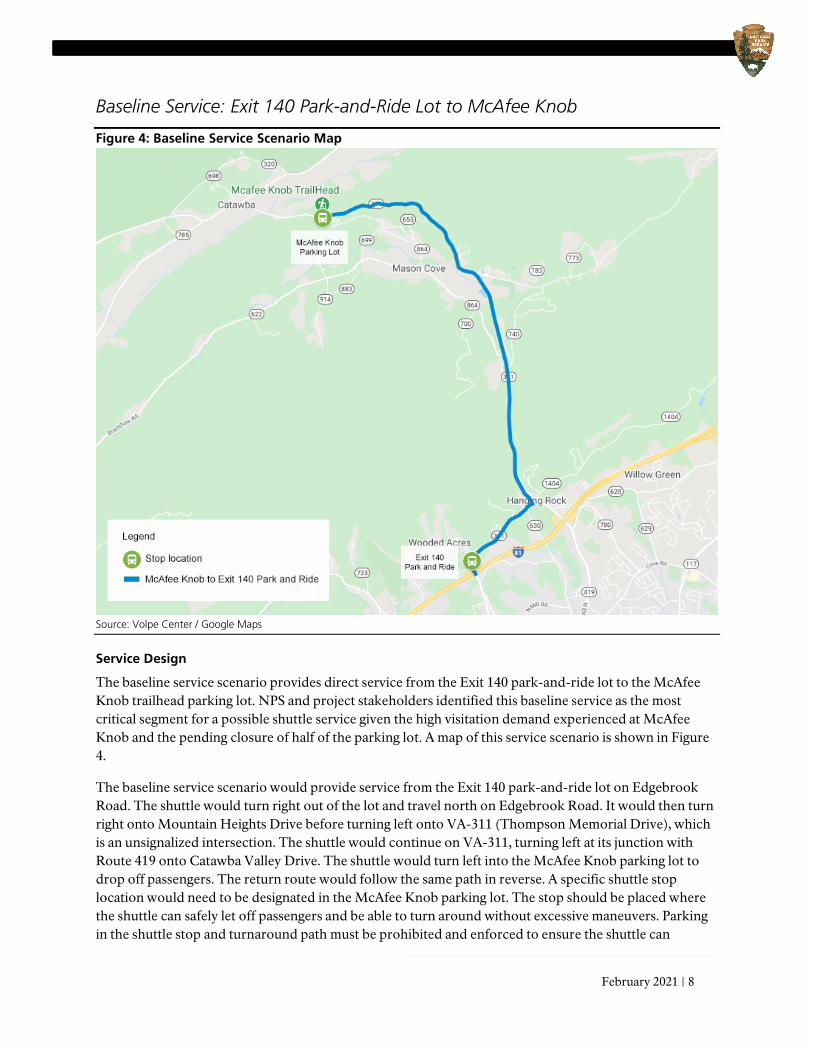
A one-way trip under this shuttle service scenario would take approximately 12 minutes. Assuming a two-minute dwell time at each stop, a complete roundtrip would take approximately 24 minutes. Scenario service details are summarized in Table 1.
Table 1: Baseline Service Scenario Detail Characteristic Measure Shuttle stop count 2 stops
One-way total time and mileage 12 minutes, 7 miles Round trip total time and mileage 24 minutes, 14 miles
Dwell time per stop 2 minutes Source: Volpe Center
Goal Alignment
This scenario provides service to one trailhead parking lot, serves two stops, and has a roundtrip total time of 24 minutes. Based on these service characteristics, this scenario achieves goals one and four and does not achieve goals two and three. The alignment of this scenario with shuttle service goals is shown in Figure 5.
Figure 5: Assessment of Goal Alignment for Baseline Service Scenario
GOAL 1: Address acute parking demand and congestion challenges at McAfee Knob
GOAL 2: Disperse use across trailheads to improve visitor experience, visitor safety, and resource conditions along the Triple Crown trail segments
GOAL 3: Connect to other destinations in the region to provide easily accessible service to a greater number of people
GOAL 4: Provide a simple, easy-to-understand, and consistent service design for the public
Legend: Achieves goal Somewhat achieves goal Does not achieve goal
Cost Estimation
Under this shuttle service scenario, costs are estimated to be between $161,280 and $201,600 annually for a service with 20-minute headways, and between $80,640 and $100,800 annually for a service with 30-minute headways. These estimates are summarized in Table 2.
February 2021 | 10
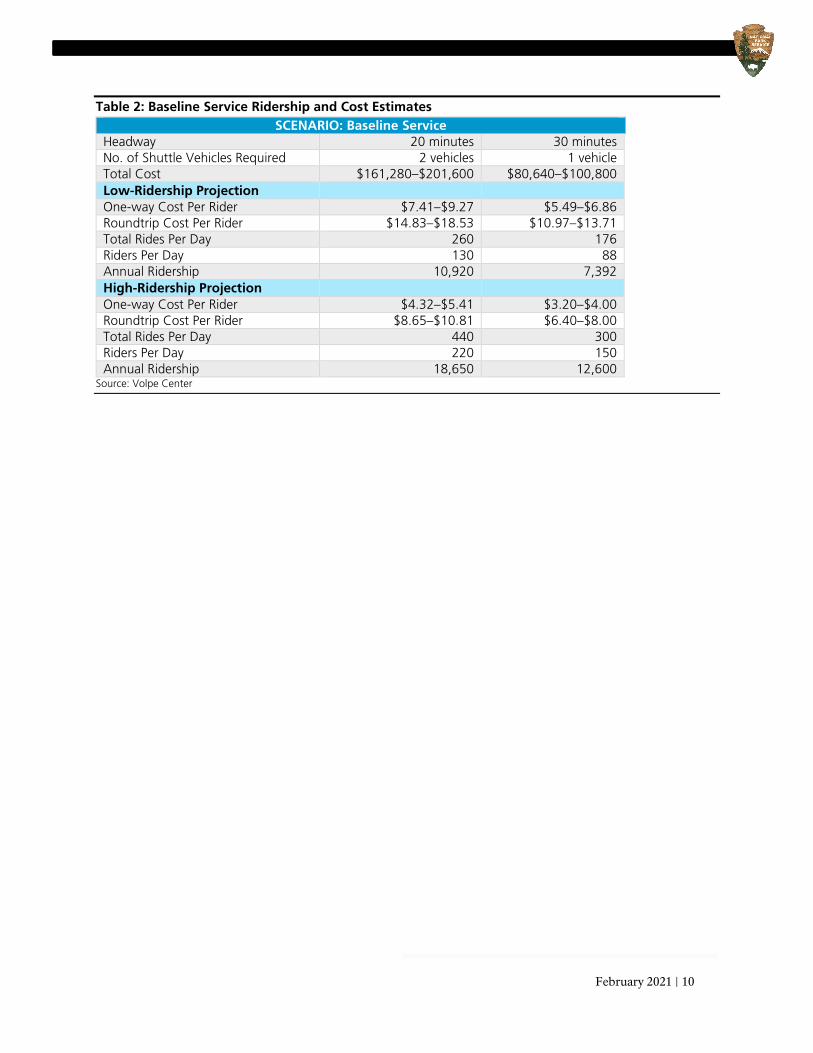
Table 2: Baseline Service Ridership and Cost Estimates SCENARIO: Baseline Service
Headway 20 minutes 30 minutes No. of Shuttle Vehicles Required 2 vehicles 1 vehicle Total Cost $161,280–$201,600 $80,640–$100,800 Low-Ridership Projection One-way Cost Per Rider $7.41–$9.27 $5.49–$6.86 Roundtrip Cost Per Rider $14.83–$18.53 $10.97–$13.71 Total Rides Per Day 260 176 Riders Per Day 130 88 Annual Ridership 10,920 7,392 High-Ridership Projection One-way Cost Per Rider $4.32–$5.41 $3.20–$4.00 Roundtrip Cost Per Rider $8.65–$10.81 $6.40–$8.00 Total Rides Per Day 440 300 Riders Per Day 220 150 Annual Ridership 18,650 12,600
Source: Volpe Center
11 | Appalachian National Scenic Trail, Triple Crown Area – Transit Feasibility Study
Scenario #1: Exit 140 Park-and-Ride Lot to Dragon’s Tooth
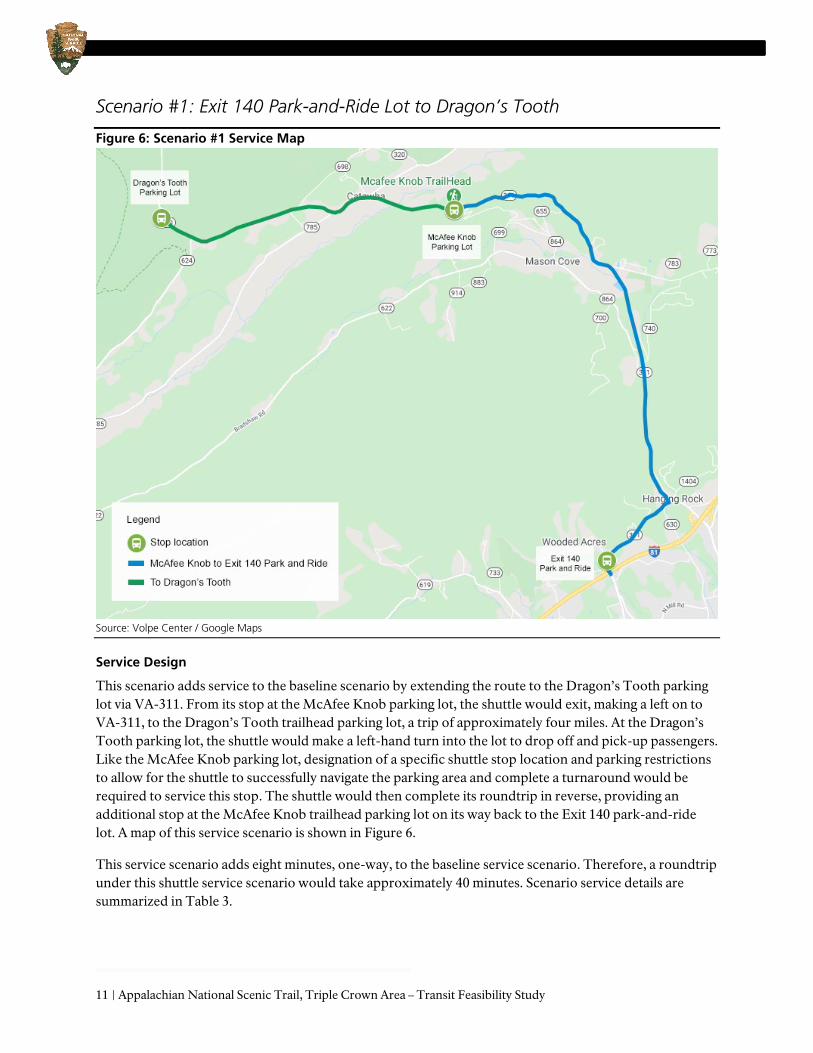
Figure 6: Scenario #1 Service Map
Source: Volpe Center / Google Maps
Service Design
This scenario adds service to the baseline scenario by extending the route to the Dragon’s Tooth parking lot via VA-311. From its stop at the McAfee Knob parking lot, the shuttle would exit, making a left on to VA-311, to the Dragon’s Tooth trailhead parking lot, a trip of approximately four miles. At the Dragon’s Tooth parking lot, the shuttle would make a left-hand turn into the lot to drop off and pick-up passengers. Like the McAfee Knob parking lot, designation of a specific shuttle stop location and parking restrictions to allow for the shuttle to successfully navigate the parking area and complete a turnaround would be required to service this stop. The shuttle would then complete its roundtrip in reverse, providing an additional stop at the McAfee Knob trailhead parking lot on its way back to the Exit 140 park-and-ride lot. A map of this service scenario is shown in Figure 6.
This service scenario adds eight minutes, one-way, to the baseline service scenario. Therefore, a roundtrip under this shuttle service scenario would take approximately 40 minutes. Scenario service details are summarized in Table 3.
February 2021 | 12
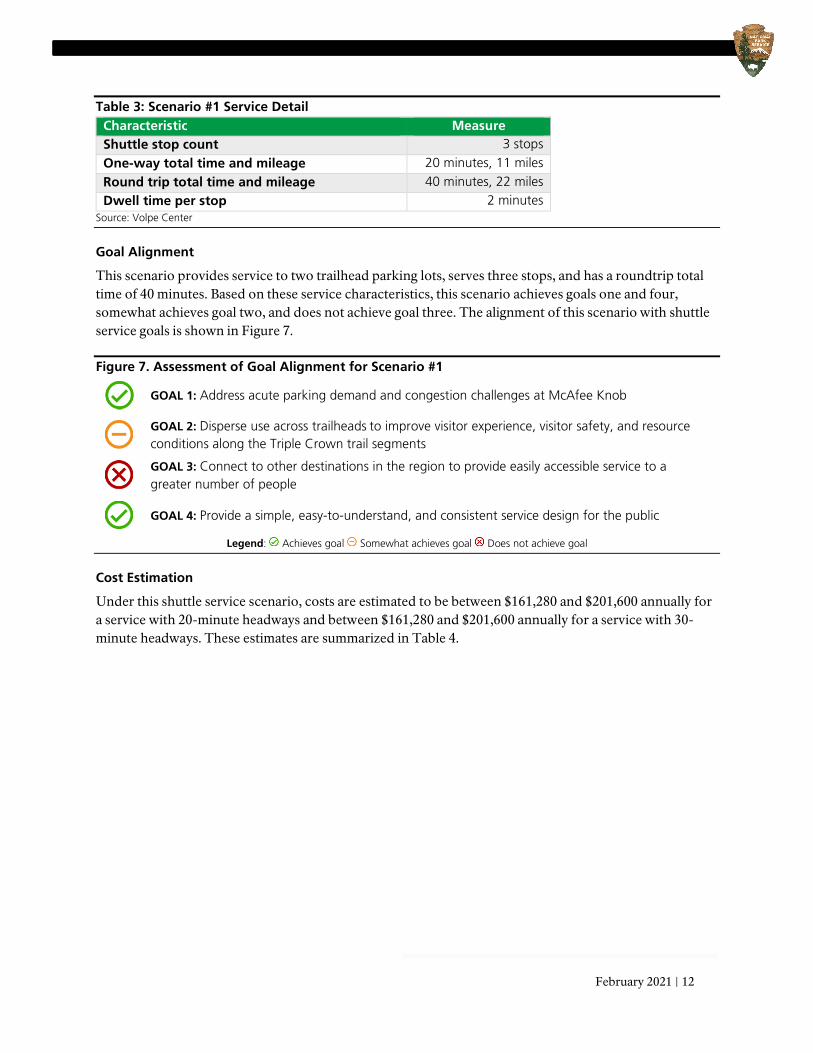
Table 3: Scenario #1 Service Detail Characteristic Measure Shuttle stop count 3 stops
One-way total time and mileage 20 minutes, 11 miles
Round trip total time and mileage 40 minutes, 22 miles Dwell time per stop 2 minutes
Source: Volpe Center
Goal Alignment
This scenario provides service to two trailhead parking lots, serves three stops, and has a roundtrip total time of 40 minutes. Based on these service characteristics, this scenario achieves goals one and four, somewhat achieves goal two, and does not achieve goal three. The alignment of this scenario with shuttle service goals is shown in Figure 7.
Figure 7. Assessment of Goal Alignment for Scenario #1
GOAL 1: Address acute parking demand and congestion challenges at McAfee Knob
GOAL 2: Disperse use across trailheads to improve visitor experience, visitor safety, and resource conditions along the Triple Crown trail segments
GOAL 3: Connect to other destinations in the region to provide easily accessible service to a greater number of people
GOAL 4: Provide a simple, easy-to-understand, and consistent service design for the public
Legend: Achieves goal Somewhat achieves goal Does not achieve goal
Cost Estimation
Under this shuttle service scenario, costs are estimated to be between $161,280 and $201,600 annually for a service with 20-minute headways and between $161,280 and $201,600 annually for a service with 30-minute headways. These estimates are summarized in Table 4.
13 | Appalachian National Scenic Trail, Triple Crown Area – Transit Feasibility Study
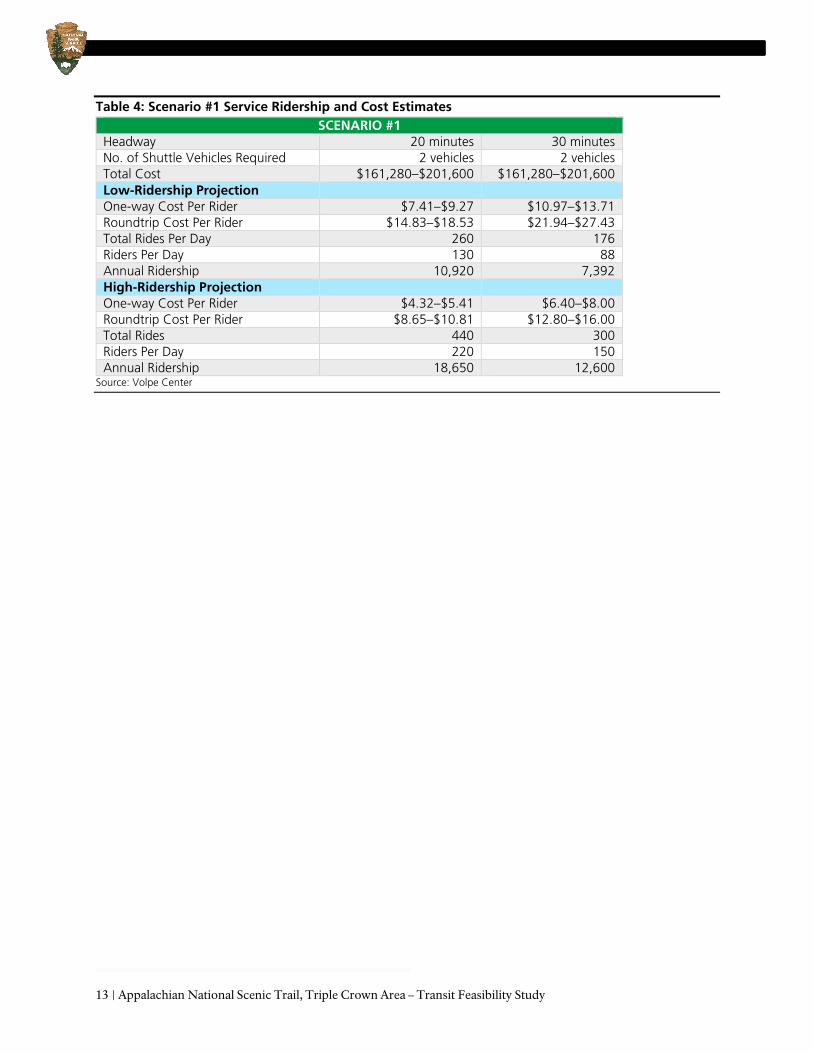
Table 4: Scenario #1 Service Ridership and Cost Estimates SCENARIO #1
Headway 20 minutes 30 minutes No. of Shuttle Vehicles Required 2 vehicles 2 vehicles Total Cost $161,280–$201,600 $161,280–$201,600 Low-Ridership Projection One-way Cost Per Rider $7.41–$9.27 $10.97–$13.71 Roundtrip Cost Per Rider $14.83–$18.53 $21.94–$27.43 Total Rides Per Day 260 176 Riders Per Day 130 88 Annual Ridership 10,920 7,392 High-Ridership Projection One-way Cost Per Rider $4.32–$5.41 $6.40–$8.00 Roundtrip Cost Per Rider $8.65–$10.81 $12.80–$16.00 Total Rides 440 300 Riders Per Day 220 150 Annual Ridership 18,650 12,600
Source: Volpe Center
February 2021 | 14
Scenario #2: Downtown Salem/Roanoke College to McAfee Knob
Figure 8: Scenario #2 Service Map
Source: Volpe Center / Google Maps
Service Design
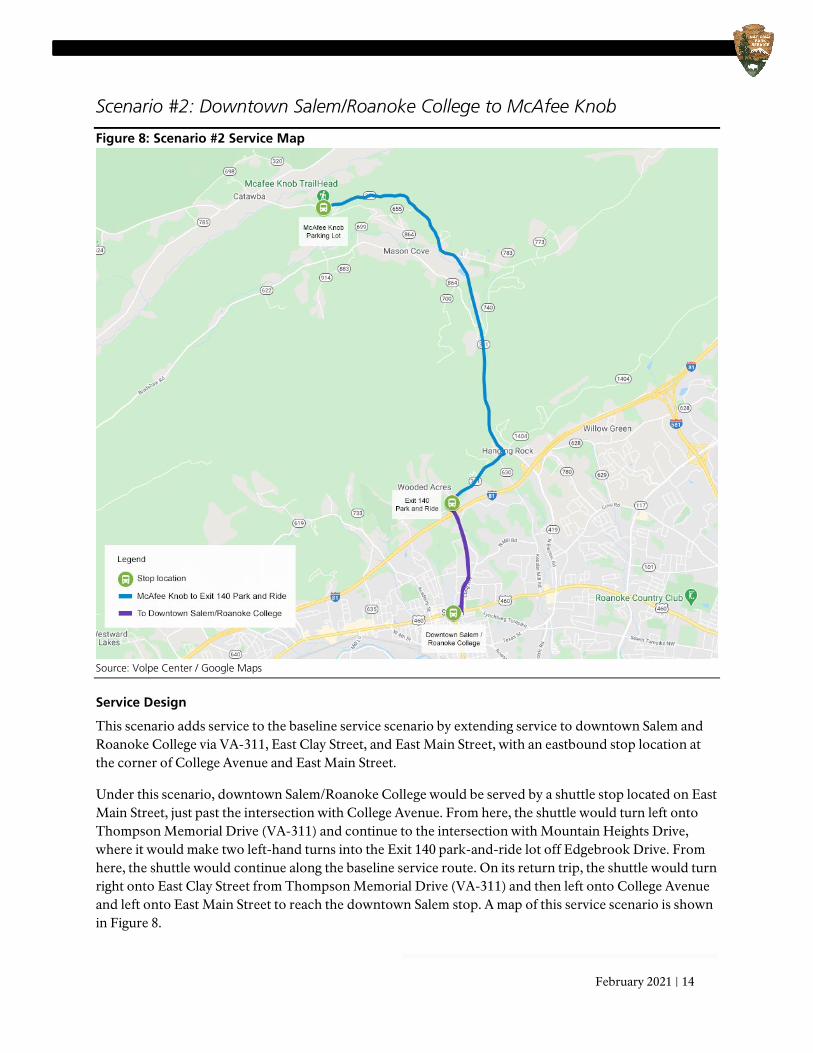
This scenario adds service to the baseline service scenario by extending service to downtown Salem and Roanoke College via VA-311, East Clay Street, and East Main Street, with an eastbound stop location at the corner of College Avenue and East Main Street.
Under this scenario, downtown Salem/Roanoke College would be served by a shuttle stop located on East Main Street, just past the intersection with College Avenue. From here, the shuttle would turn left onto Thompson Memorial Drive (VA-311) and continue to the intersection with Mountain Heights Drive, where it would make two left-hand turns into the Exit 140 park-and-ride lot off Edgebrook Drive. From here, the shuttle would continue along the baseline service route. On its return trip, the shuttle would turn right onto East Clay Street from Thompson Memorial Drive (VA-311) and then left onto College Avenue and left onto East Main Street to reach the downtown Salem stop. A map of this service scenario is shown in Figure 8.
15 | Appalachian National Scenic Trail, Triple Crown Area – Transit Feasibility Study
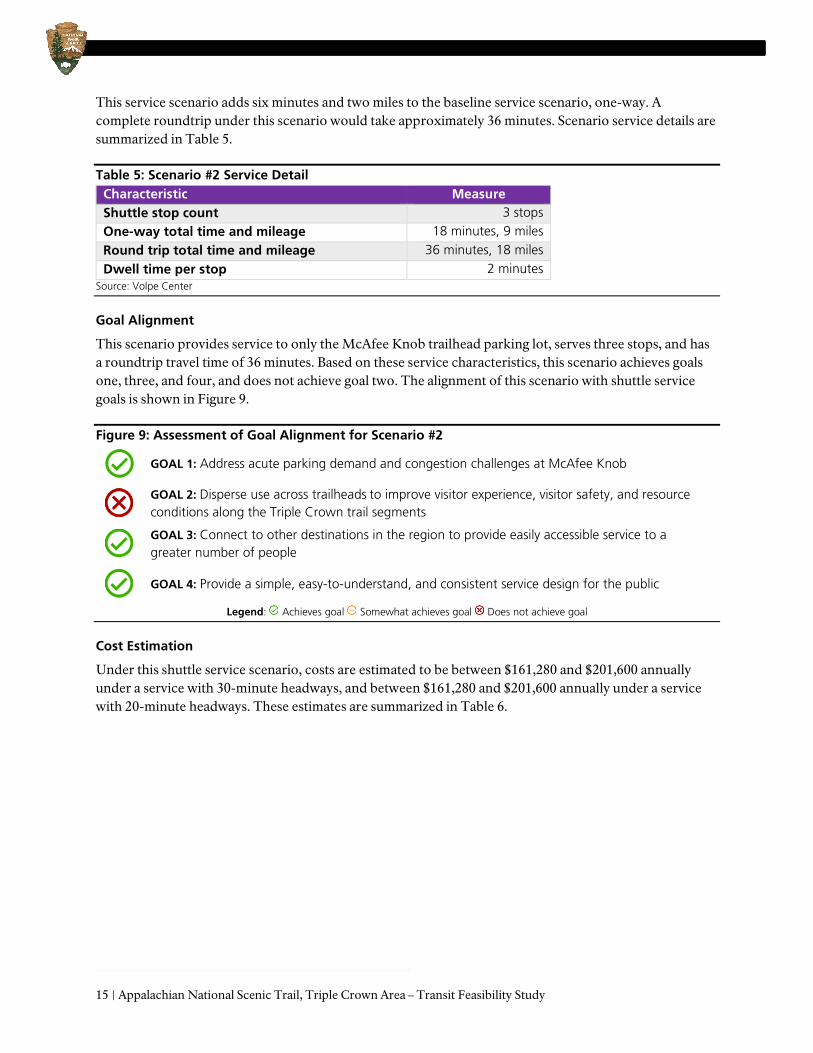
This service scenario adds six minutes and two miles to the baseline service scenario, one-way. A complete roundtrip under this scenario would take approximately 36 minutes. Scenario service details are summarized in Table 5.
Table 5: Scenario #2 Service Detail Characteristic Measure Shuttle stop count 3 stops One-way total time and mileage 18 minutes, 9 miles
Round trip total time and mileage 36 minutes, 18 miles
Dwell time per stop 2 minutes Source: Volpe Center
Goal Alignment
This scenario provides service to only the McAfee Knob trailhead parking lot, serves three stops, and has a roundtrip travel time of 36 minutes. Based on these service characteristics, this scenario achieves goals one, three, and four, and does not achieve goal two. The alignment of this scenario with shuttle service goals is shown in Figure 9.
Figure 9: Assessment of Goal Alignment for Scenario #2
GOAL 1: Address acute parking demand and congestion challenges at McAfee Knob
GOAL 2: Disperse use across trailheads to improve visitor experience, visitor safety, and resource conditions along the Triple Crown trail segments
GOAL 3: Connect to other destinations in the region to provide easily accessible service to a greater number of people
GOAL 4: Provide a simple, easy-to-understand, and consistent service design for the public
Legend: Achieves goal Somewhat achieves goal Does not achieve goal
Cost Estimation
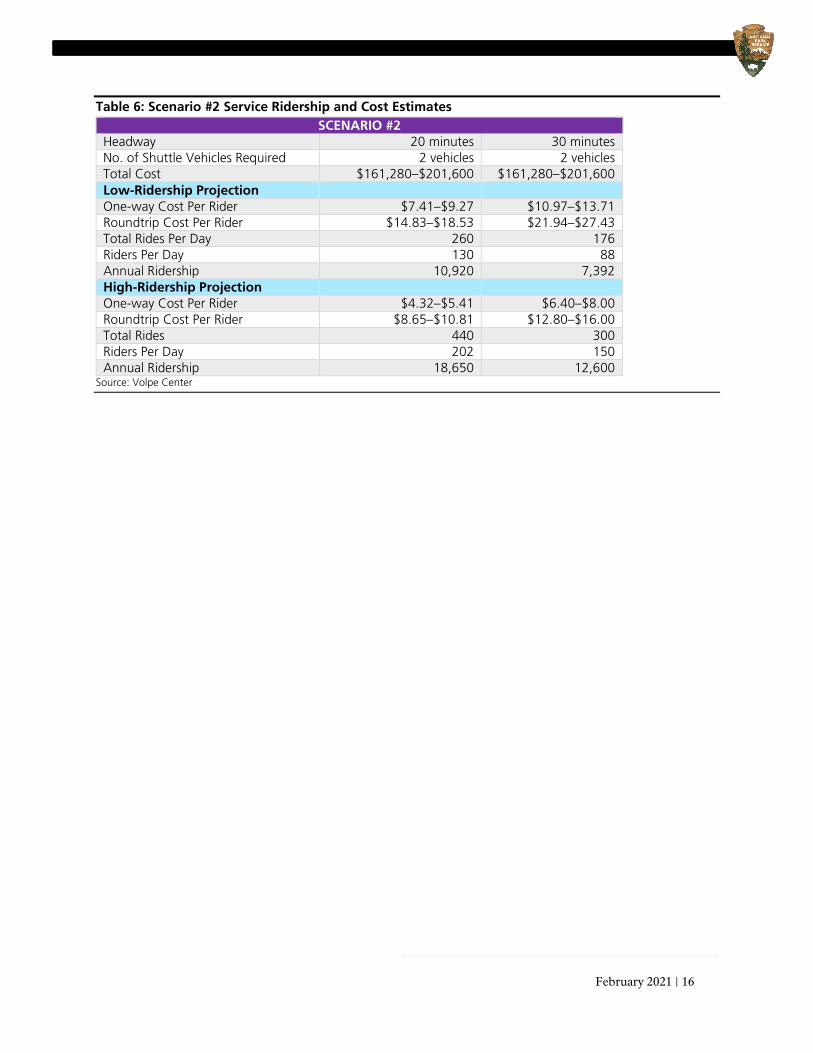
Under this shuttle service scenario, costs are estimated to be between $161,280 and $201,600 annually under a service with 30-minute headways, and between $161,280 and $201,600 annually under a service with 20-minute headways. These estimates are summarized in Table 6.
February 2021 | 16
Table 6: Scenario #2 Service Ridership and Cost Estimates SCENARIO #2
Headway 20 minutes 30 minutes No. of Shuttle Vehicles Required 2 vehicles 2 vehicles Total Cost $161,280–$201,600 $161,280–$201,600 Low-Ridership Projection One-way Cost Per Rider $7.41–$9.27 $10.97–$13.71 Roundtrip Cost Per Rider $14.83–$18.53 $21.94–$27.43 Total Rides Per Day 260 176 Riders Per Day 130 88 Annual Ridership 10,920 7,392 High-Ridership Projection One-way Cost Per Rider $4.32–$5.41 $6.40–$8.00 Roundtrip Cost Per Rider $8.65–$10.81 $12.80–$16.00 Total Rides 440 300 Riders Per Day 202 150 Annual Ridership 18,650 12,600
Source: Volpe Center
17 | Appalachian National Scenic Trail, Triple Crown Area – Transit Feasibility Study
Scenario #3: Downtown Salem/Roanoke College to Dragon’s Tooth
Figure 10: Scenario #3 Service Map
Source: Volpe Center / Google Maps
Service Design
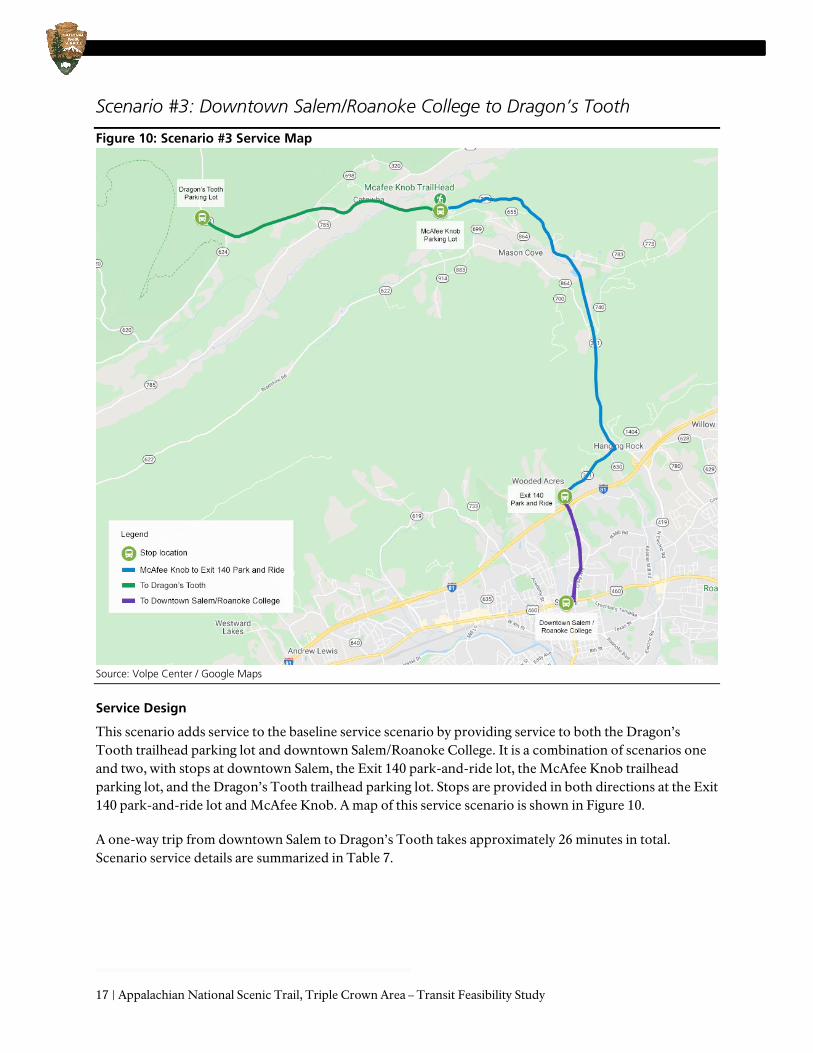
This scenario adds service to the baseline service scenario by providing service to both the Dragon’s Tooth trailhead parking lot and downtown Salem/Roanoke College. It is a combination of scenarios one and two, with stops at downtown Salem, the Exit 140 park-and-ride lot, the McAfee Knob trailhead parking lot, and the Dragon’s Tooth trailhead parking lot. Stops are provided in both directions at the Exit 140 park-and-ride lot and McAfee Knob. A map of this service scenario is shown in Figure 10.
A one-way trip from downtown Salem to Dragon’s Tooth takes approximately 26 minutes in total. Scenario service details are summarized in Table 7.
February 2021 | 18
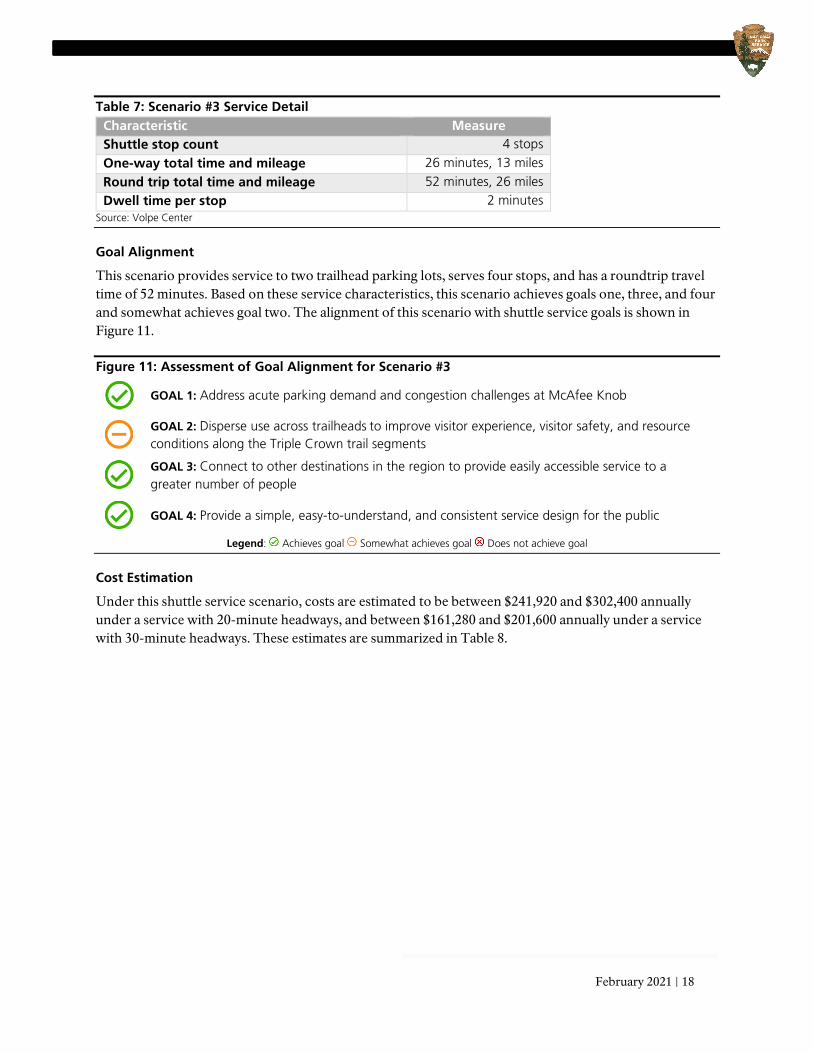
Table 7: Scenario #3 Service Detail Characteristic Measure Shuttle stop count 4 stops
One-way total time and mileage 26 minutes, 13 miles
Round trip total time and mileage 52 minutes, 26 miles Dwell time per stop 2 minutes
Source: Volpe Center
Goal Alignment
This scenario provides service to two trailhead parking lots, serves four stops, and has a roundtrip travel time of 52 minutes. Based on these service characteristics, this scenario achieves goals one, three, and four and somewhat achieves goal two. The alignment of this scenario with shuttle service goals is shown in Figure 11.
Figure 11: Assessment of Goal Alignment for Scenario #3
GOAL 1: Address acute parking demand and congestion challenges at McAfee Knob
GOAL 2: Disperse use across trailheads to improve visitor experience, visitor safety, and resource conditions along the Triple Crown trail segments
GOAL 3: Connect to other destinations in the region to provide easily accessible service to a greater number of people
GOAL 4: Provide a simple, easy-to-understand, and consistent service design for the public
Legend: Achieves goal Somewhat achieves goal Does not achieve goal
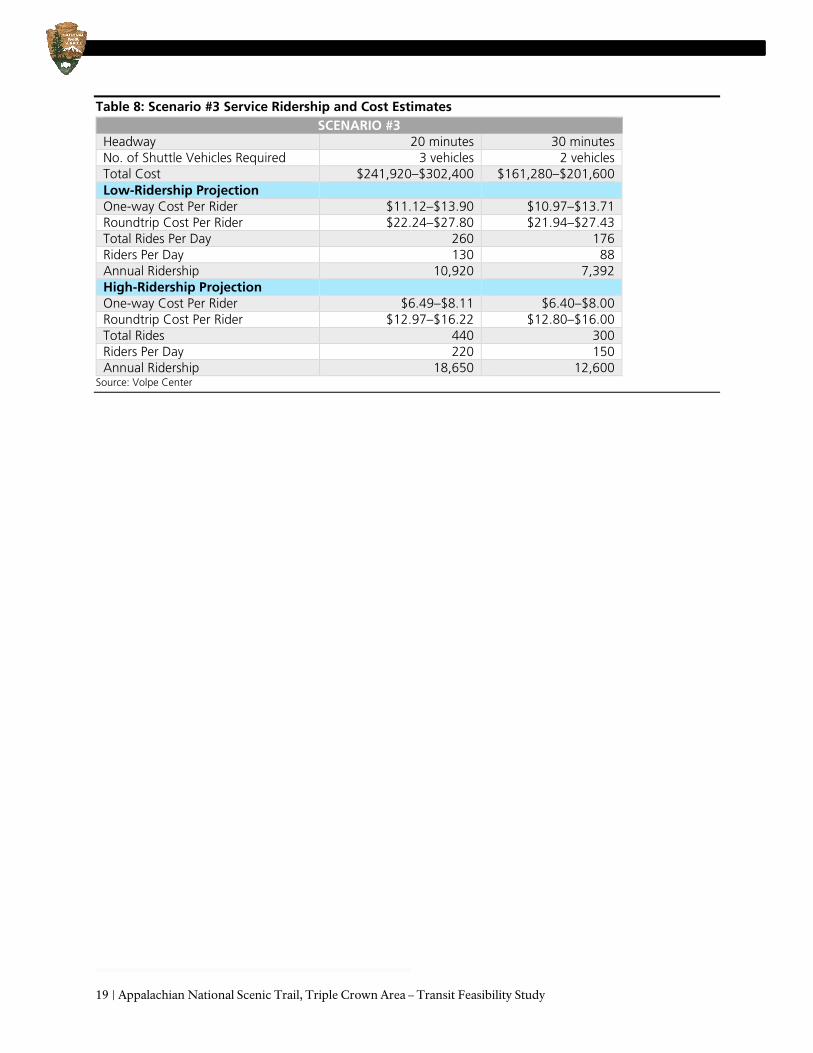
Cost Estimation
Under this shuttle service scenario, costs are estimated to be between $241,920 and $302,400 annually under a service with 20-minute headways, and between $161,280 and $201,600 annually under a service with 30-minute headways. These estimates are summarized in Table 8.
19 | Appalachian National Scenic Trail, Triple Crown Area – Transit Feasibility Study
Table 8: Scenario #3 Service Ridership and Cost Estimates SCENARIO #3
Headway 20 minutes 30 minutes No. of Shuttle Vehicles Required 3 vehicles 2 vehicles Total Cost $241,920–$302,400 $161,280–$201,600 Low-Ridership Projection One-way Cost Per Rider $11.12–$13.90 $10.97–$13.71 Roundtrip Cost Per Rider $22.24–$27.80 $21.94–$27.43 Total Rides Per Day 260 176 Riders Per Day 130 88 Annual Ridership 10,920 7,392 High-Ridership Projection One-way Cost Per Rider $6.49–$8.11 $6.40–$8.00 Roundtrip Cost Per Rider $12.97–$16.22 $12.80–$16.00 Total Rides 440 300 Riders Per Day 220 150 Annual Ridership 18,650 12,600
Source: Volpe Center
February 2021 | 20
Scenario #4: Loop Service
Figure 12: Scenario #4 Service Map
Source: Volpe Center / Google Maps
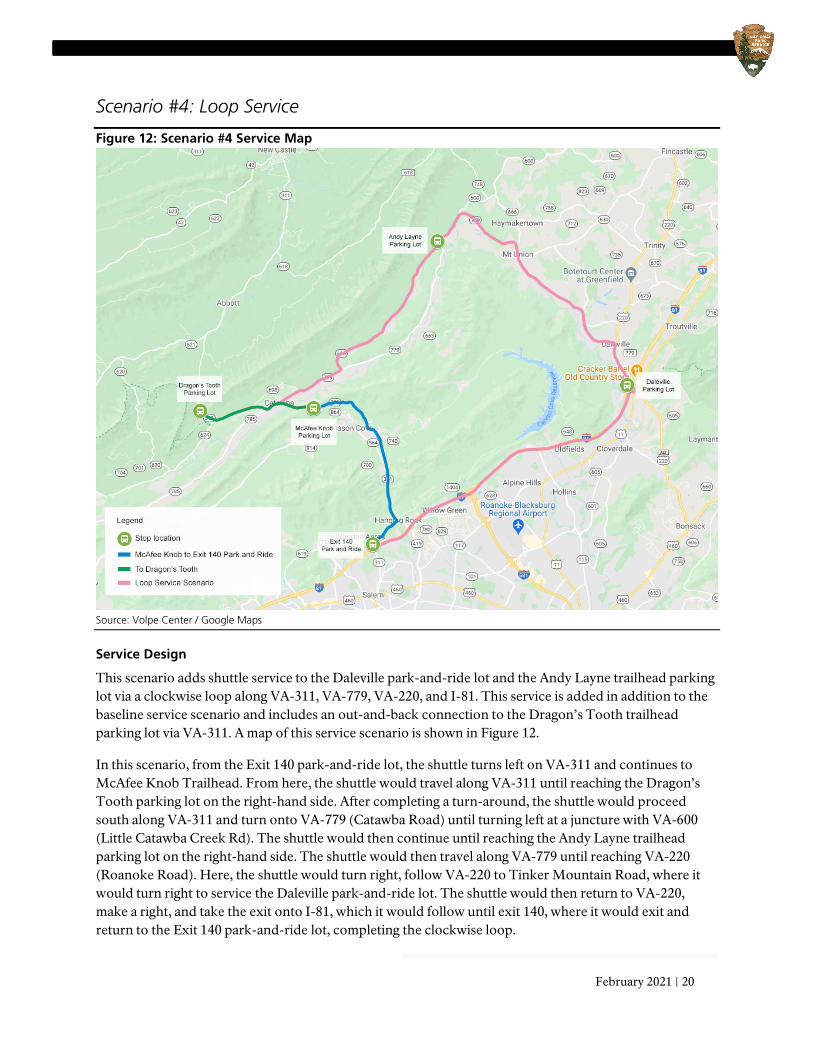
Service Design
This scenario adds shuttle service to the Daleville park-and-ride lot and the Andy Layne trailhead parking lot via a clockwise loop along VA-311, VA-779, VA-220, and I-81. This service is added in addition to the baseline service scenario and includes an out-and-back connection to the Dragon’s Tooth trailhead parking lot via VA-311. A map of this service scenario is shown in Figure 12.
In this scenario, from the Exit 140 park-and-ride lot, the shuttle turns left on VA-311 and continues to McAfee Knob Trailhead. From here, the shuttle would travel along VA-311 until reaching the Dragon’s Tooth parking lot on the right-hand side. After completing a turn-around, the shuttle would proceed south along VA-311 and turn onto VA-779 (Catawba Road) until turning left at a juncture with VA-600 (Little Catawba Creek Rd). The shuttle would then continue until reaching the Andy Layne trailhead parking lot on the right-hand side. The shuttle would then travel along VA-779 until reaching VA-220 (Roanoke Road). Here, the shuttle would turn right, follow VA-220 to Tinker Mountain Road, where it would turn right to service the Daleville park-and-ride lot. The shuttle would then return to VA-220, make a right, and take the exit onto I-81, which it would follow until exit 140, where it would exit and return to the Exit 140 park-and-ride lot, completing the clockwise loop.
21 | Appalachian National Scenic Trail, Triple Crown Area – Transit Feasibility Study
Similar to the McAfee Knob and Dragon’s Tooth parking lots, the Andy Layne trailhead parking lot will likely require additional parking restrictions to allow for the shuttle to enter, complete a stop, and exit back onto VA-779. Further design changes to this parking lot, while beyond the scope of this study, may be beneficial to shuttle service.
Under this scenario, a roundtrip loop service would take approximately 74 minutes to complete, with service to five stops. Scenario service details are summarized in Table 9.
Table 9: Scenario #4 Loop Service Detail Characteristic Measure Shuttle stop count 5 stops
One-way total time and mileage* 74 minutes, 44 miles Round trip total time and mileage* 74 minutes, 44 miles
Dwell time per stop 2 minutes Source: Volpe Center * One-way and roundtrip travel time and mileage are the same for this scenario, as the service operates in a loop.
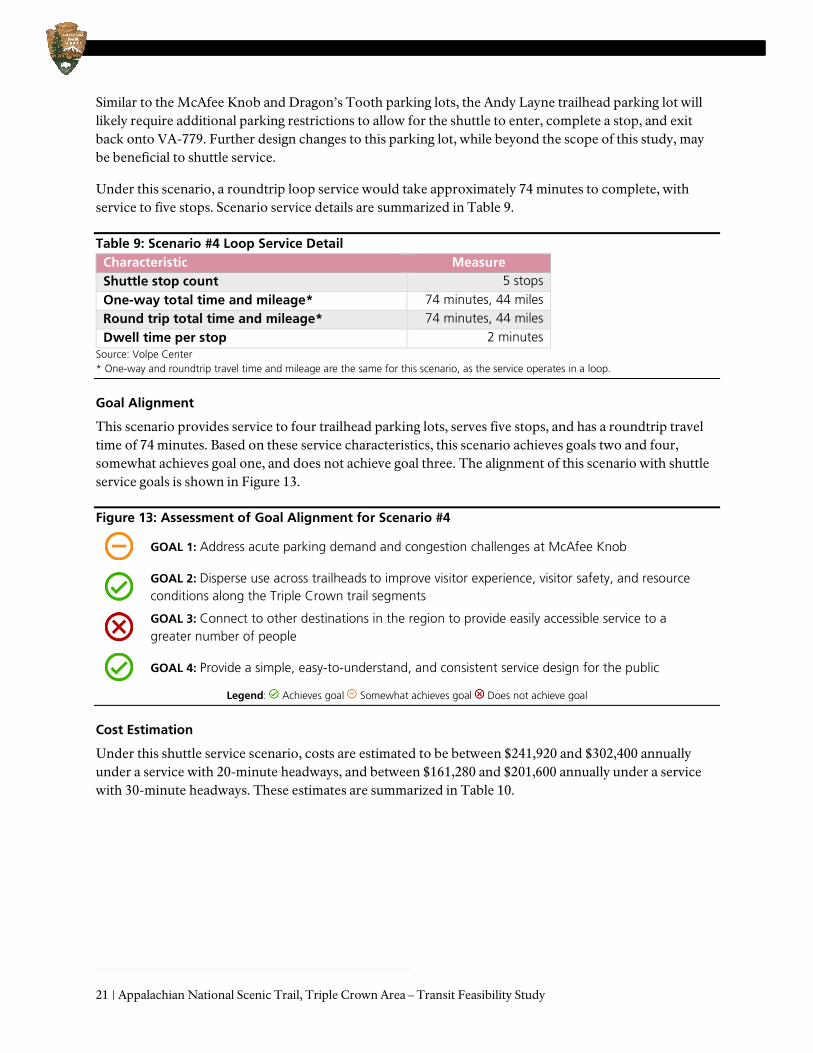
Goal Alignment
This scenario provides service to four trailhead parking lots, serves five stops, and has a roundtrip travel time of 74 minutes. Based on these service characteristics, this scenario achieves goals two and four, somewhat achieves goal one, and does not achieve goal three. The alignment of this scenario with shuttle service goals is shown in Figure 13.
Figure 13: Assessment of Goal Alignment for Scenario #4
GOAL 1: Address acute parking demand and congestion challenges at McAfee Knob
GOAL 2: Disperse use across trailheads to improve visitor experience, visitor safety, and resource conditions along the Triple Crown trail segments
GOAL 3: Connect to other destinations in the region to provide easily accessible service to a greater number of people
GOAL 4: Provide a simple, easy-to-understand, and consistent service design for the public
Legend: Achieves goal Somewhat achieves goal Does not achieve goal
Cost Estimation
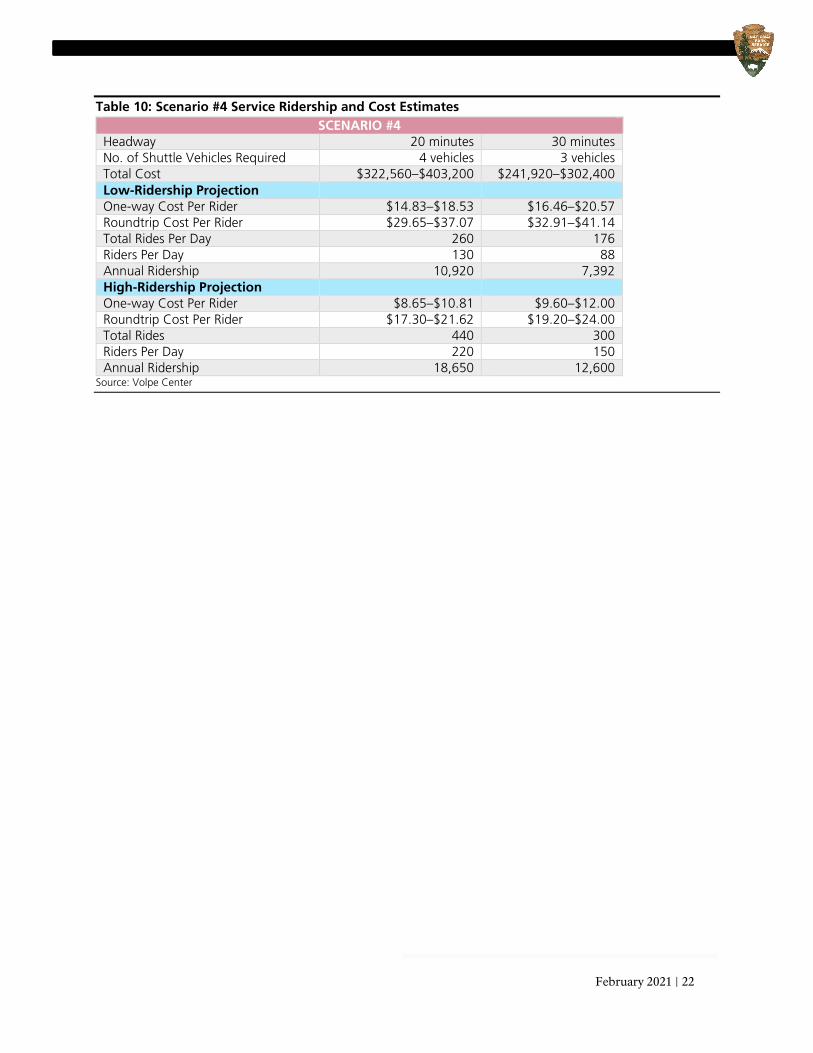
Under this shuttle service scenario, costs are estimated to be between $241,920 and $302,400 annually under a service with 20-minute headways, and between $161,280 and $201,600 annually under a service with 30-minute headways. These estimates are summarized in Table 10.
February 2021 | 22
Table 10: Scenario #4 Service Ridership and Cost Estimates SCENARIO #4
Headway 20 minutes 30 minutes No. of Shuttle Vehicles Required 4 vehicles 3 vehicles Total Cost $322,560–$403,200 $241,920–$302,400 Low-Ridership Projection One-way Cost Per Rider $14.83–$18.53 $16.46–$20.57 Roundtrip Cost Per Rider $29.65–$37.07 $32.91–$41.14 Total Rides Per Day 260 176 Riders Per Day 130 88 Annual Ridership 10,920 7,392 High-Ridership Projection One-way Cost Per Rider $8.65–$10.81 $9.60–$12.00 Roundtrip Cost Per Rider $17.30–$21.62 $19.20–$24.00 Total Rides 440 300 Riders Per Day 220 150 Annual Ridership 18,650 12,600
Source: Volpe Center
23 | Appalachian National Scenic Trail, Triple Crown Area – Transit Feasibility Study
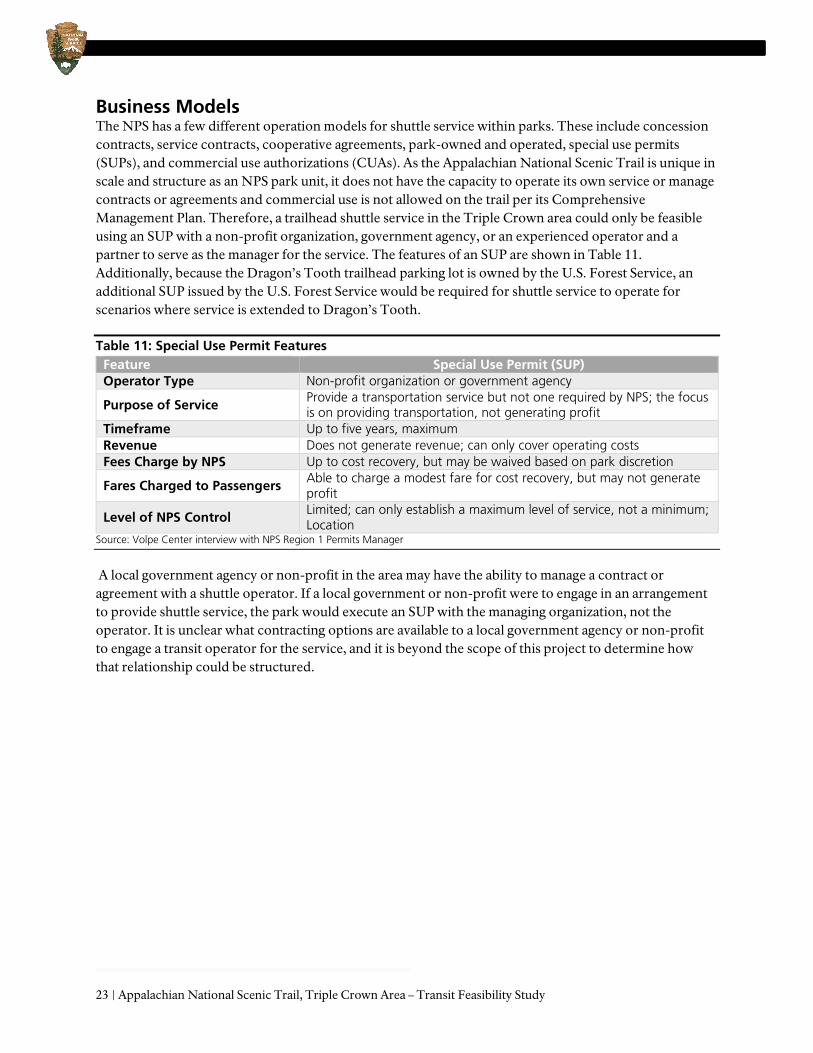
Business Models The NPS has a few different operation models for shuttle service within parks. These include concession contracts, service contracts, cooperative agreements, park-owned and operated, special use permits (SUPs), and commercial use authorizations (CUAs). As the Appalachian National Scenic Trail is unique in scale and structure as an NPS park unit, it does not have the capacity to operate its own service or manage contracts or agreements and commercial use is not allowed on the trail per its Comprehensive Management Plan. Therefore, a trailhead shuttle service in the Triple Crown area could only be feasible using an SUP with a non-profit organization, government agency, or an experienced operator and a partner to serve as the manager for the service. The features of an SUP are shown in Table 11. Additionally, because the Dragon’s Tooth trailhead parking lot is owned by the U.S. Forest Service, an additional SUP issued by the U.S. Forest Service would be required for shuttle service to operate for scenarios where service is extended to Dragon’s Tooth.
Table 11: Special Use Permit Features Feature Special Use Permit (SUP) Operator Type Non-profit organization or government agency
Purpose of Service Provide a transportation service but not one required by NPS; the focus is on providing transportation, not generating profit
Timeframe Up to five years, maximum Revenue Does not generate revenue; can only cover operating costs Fees Charge by NPS Up to cost recovery, but may be waived based on park discretion
Fares Charged to Passengers Able to charge a modest fare for cost recovery, but may not generate profit
Level of NPS Control Limited; can only establish a maximum level of service, not a minimum; Location
Source: Volpe Center interview with NPS Region 1 Permits Manager
A local government agency or non-profit in the area may have the ability to manage a contract or agreement with a shuttle operator. If a local government or non-profit were to engage in an arrangement to provide shuttle service, the park would execute an SUP with the managing organization, not the operator. It is unclear what contracting options are available to a local government agency or non-profit to engage a transit operator for the service, and it is beyond the scope of this project to determine how that relationship could be structured.
February 2021 | 24
Analysis
McAfee Knob Pedestrian Bridge Construction Impacts As noted in the Project Purpose section of this report, the construction of the pedestrian bridge at the McAfee Knob parking lot provides a unique opportunity to pilot shuttle service as a way to address visitation demand and issues related to parking congestion. Because the pedestrian bridge construction will involve the closure of half of the McAfee Knob parking lot, visitors who would typically park in the lot but will be unable to due to the parking capacity reduction represent a potential source of shuttle ridership demand. This section uses available data to estimate the level of demand that visitors displaced by the partial parking lot closure represent among potential shuttle riders.
It is important to note that these displaced visitors represent only one source of potential ridership demand, especially for shuttle service scenarios involving shuttle service to multiple trailheads. The analysis presented here is designed to illustrate how well a potential shuttle service would meet a minimal level of demand, represented by visitors displaced by the partial parking lot closure at McAfee Knob.
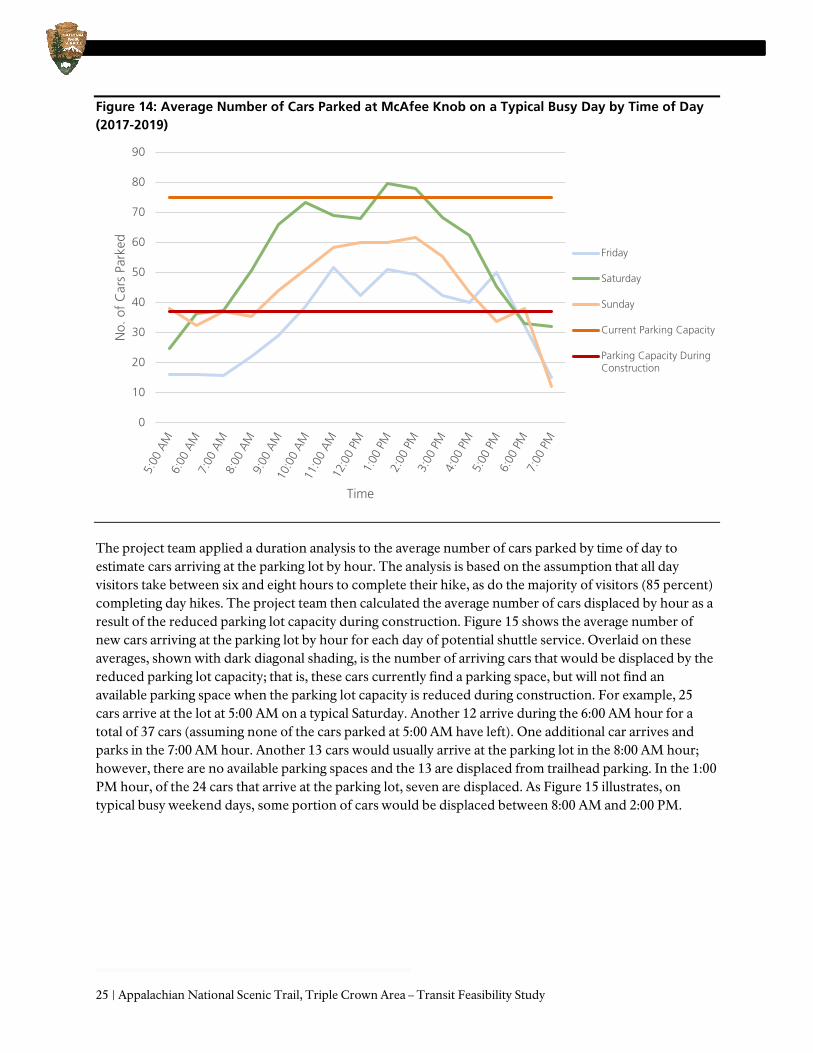
The project team identified the 85th percentile of parking lot usage in Ridgerunner data from 2017 through 2019. The 85th percentile day represents a typical busy day and is a methodology used commonly used in visitor use management analysis.5 Using this data, the project team calculated the average number of cars observed in the McAfee Knob parking lot on a typical busy day by hour, for each day of proposed shuttle service (Friday, Saturday, and Sunday). Figure 14 shows these averages, compared with the current parking lot capacity (75 cars, indicated by an orange line) and the reduced parking lot capacity during construction (37 cars, or half of the current capacity, indicated by a red line). Notably, the average number of cars observed in the parking lot exceeds the construction reduced capacity for the majority of daytime hours for all three days – between 10:00 AM and 5:00 PM on Fridays, 7:00 AM and 5:00 PM on Saturdays, and 10:00 AM and 4:00 PM on Sundays.
5 The 85th percentile methodology used here, as well as additional information about the Ridgerunner data used for this analysis, is described in detail in an earlier memo written as a part of this project. See: U.S. DOT Volpe Center, Appalachian National Scenic Trail, Triple Crown Area, Technical Memo 2: Existing Conditions, September 2020.
25 | Appalachian National Scenic Trail, Triple Crown Area – Transit Feasibility Study
Figure 14: Average Number of Cars Parked at McAfee Knob on a Typical Busy Day by Time of Day (2017-2019)
The project team applied a duration analysis to the average number of cars parked by time of day to estimate cars arriving at the parking lot by hour. The analysis is based on the assumption that all day visitors take between six and eight hours to complete their hike, as do the majority of visitors (85 percent) completing day hikes. The project team then calculated the average number of cars displaced by hour as a result of the reduced parking lot capacity during construction. Figure 15 shows the average number of new cars arriving at the parking lot by hour for each day of potential shuttle service. Overlaid on these averages, shown with dark diagonal shading, is the number of arriving cars that would be displaced by the reduced parking lot capacity; that is, these cars currently find a parking space, but will not find an available parking space when the parking lot capacity is reduced during construction. For example, 25 cars arrive at the lot at 5:00 AM on a typical Saturday. Another 12 arrive during the 6:00 AM hour for a total of 37 cars (assuming none of the cars parked at 5:00 AM have left). One additional car arrives and parks in the 7:00 AM hour. Another 13 cars would usually arrive at the parking lot in the 8:00 AM hour; however, there are no available parking spaces and the 13 are displaced from trailhead parking. In the 1:00 PM hour, of the 24 cars that arrive at the parking lot, seven are displaced. As Figure 15 illustrates, on typical busy weekend days, some portion of cars would be displaced between 8:00 AM and 2:00 PM.
0
10
20
30
40
50
60
70
80
90
No.
of
Car
s Pa
rked
Time
Friday
Saturday
Sunday
Current Parking Capacity
Parking Capacity DuringConstruction

February 2021 | 26
Figure 15: Average Number of Cars Arriving at McAfee Knob and Displaced by Parking Lot Capacity Reduction on a Typical Busy Day, by Hour
Notes: Columns are not shown when the average number of cars arriving during an hour is zero. Averages for 5:00 PM through 7:00 PM are not shown, as the average number of cars arriving for all days during these hours is zero.
With the average number of cars displaced identified, the project team calculated the average number of visitors displaced from arriving by car to McAfee Knob using the persons per vehicle multiplier of 2.8.6 This represents the visitors that would make up one source of potential ridership demand for a shuttle service. Figure 16 shows the estimated number of displaced visitors by hour and day, compared to the maximum number of seats available on shuttle service to McAfee Knob from the Exit 140 park-and-ride lot. The dashed orange and red lines across the chart represent total available shuttle seating at 20- and 30-minute service headways, respectively. As this figure illustrates, ridership demand from displaced visitors to McAfee Knob alone exceeds available seats over the entire hour on a typical busy Saturday at 8:00 AM and 9:00 AM under both 20- and 30-minute headways, and ridership demand on a typical busy Friday at 11:00 AM exceeds available seats under a 30-minute headway scenario.
6 Because the NPS has not calculated a persons per vehicle measure for the AT, the project team used a persons per vehicle estimate of 2.8, consistent with the measure for the two nearest park units to the Triple Crown (the Blue Ridge Parkway and Great Smoky Mountains National Park). See: National Park Service, Blue Ridge Parkway Public Use Counting and Reporting Instructions, January 2003, https://irma.nps.gov/STATS/FileDownload/190, and Great Smoky Mountains National Park Public Use Counting and Reporting Instructions, January 2016, https://irma.nps.gov/STATS/FileDownload/1261.
16
6 710
18
10
3
25
12
1
1315
8
4
11
24
7 6
38
6 7
20
1413
22
131315
8 7
3 066 7
9
2 20
5
10
15
20
25
30
35
40
No.
o C
ars
Time
Friday
Saturday
Sunday
Friday - Displaced Cars
Saturday - Displaced Cars
Sunday - Displaced Cars

27 | Appalachian National Scenic Trail, Triple Crown Area – Transit Feasibility Study
Figure 16: Estimated Average Number of Visitors Displaced by Parking Capacity Reduction on a Typical Busy Day at McAfee Knob
Notes: Columns are not shown when the estimated average number of visitors displaced during an hour is zero. Estimated averages for 5:00 AM through 7:00 AM and 5:00 PM through 7:00 PM are not shown, as the estimated average number of visitors displaced for all days during these hours is zero.
This analysis has limitations. It is based upon observational data collected between 2017 and 2019, is based upon the average busiest days, only analyzes McAfee Knob visits, does not account for potential changes to visitation patterns, and does not account for return shuttle trips. However, even accounting for these limitations, this analysis shows that providing sufficient service to meet even estimated minimal demand on typical busy days will be challenging due to the small shuttle capacities required as a result of the challenging geometry of trailhead parking lots.
6
35
1
37
43
21 19
7
171719
24
4 5
0
5
10
15
20
25
30
35
40
45
50
No.
of
Peop
le
Time
FridaySaturdaySundayAvailable shuttle seats to McAfee Knob (20-minute headway)Available shuttle seats to McAfee Knob (30-minute headway)
February 2021 | 28
Comparison of Shuttle Service Scenarios To assess the feasibility of the shuttle service scenarios outlined in this report, this section summarizes and compares the key metrics across scenarios. The key metrics summarized and analyzed here are designed to provide the NPS and its partners with available estimates upon which decisions about future potential shuttle service can be made.
Goal Alignment Comparison
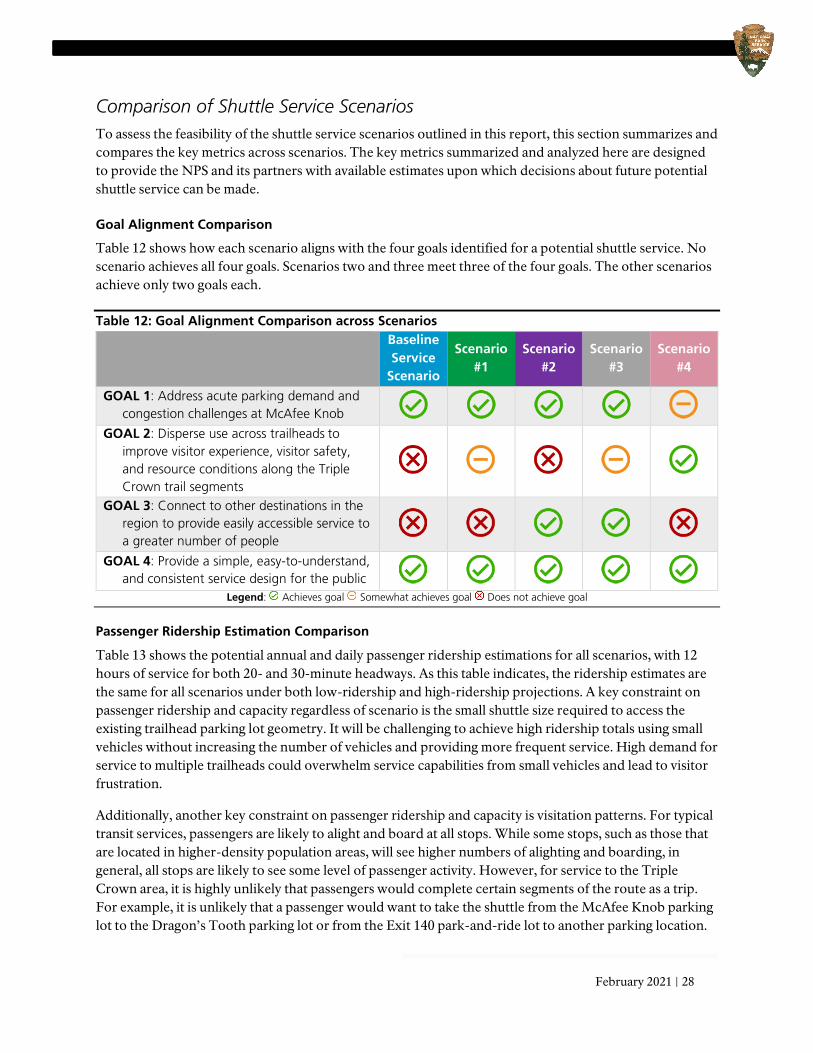
Table 12 shows how each scenario aligns with the four goals identified for a potential shuttle service. No scenario achieves all four goals. Scenarios two and three meet three of the four goals. The other scenarios achieve only two goals each.
Table 12: Goal Alignment Comparison across Scenarios Baseline
Service Scenario
Scenario #1
Scenario #2
Scenario #3
Scenario #4
GOAL 1: Address acute parking demand and congestion challenges at McAfee Knob
GOAL 2: Disperse use across trailheads to improve visitor experience, visitor safety, and resource conditions along the Triple Crown trail segments
GOAL 3: Connect to other destinations in the region to provide easily accessible service to a greater number of people
GOAL 4: Provide a simple, easy-to-understand, and consistent service design for the public
Legend: Achieves goal Somewhat achieves goal Does not achieve goal
Passenger Ridership Estimation Comparison
Table 13 shows the potential annual and daily passenger ridership estimations for all scenarios, with 12 hours of service for both 20- and 30-minute headways. As this table indicates, the ridership estimates are the same for all scenarios under both low-ridership and high-ridership projections. A key constraint on passenger ridership and capacity regardless of scenario is the small shuttle size required to access the existing trailhead parking lot geometry. It will be challenging to achieve high ridership totals using small vehicles without increasing the number of vehicles and providing more frequent service. High demand for service to multiple trailheads could overwhelm service capabilities from small vehicles and lead to visitor frustration.
Additionally, another key constraint on passenger ridership and capacity is visitation patterns. For typical transit services, passengers are likely to alight and board at all stops. While some stops, such as those that are located in higher-density population areas, will see higher numbers of alighting and boarding, in general, all stops are likely to see some level of passenger activity. However, for service to the Triple Crown area, it is highly unlikely that passengers would complete certain segments of the route as a trip. For example, it is unlikely that a passenger would want to take the shuttle from the McAfee Knob parking lot to the Dragon’s Tooth parking lot or from the Exit 140 park-and-ride lot to another parking location.

29 | Appalachian National Scenic Trail, Triple Crown Area – Transit Feasibility Study
Rather, visitation patterns suggest that passengers would be exclusively interested in taking the shuttle from a parking lot to a trailhead in order to complete a hike and vice-versa to return to their vehicle. As a result, scenarios serving more stops do not see higher levels of potential passenger capacity, as there is a low turnover among riders at all stops. Combined with the small shuttle capacity required to service the trailheads, this means that shuttle scenarios serving more stops incur a higher service cost without increasing the potential number of passengers served.
Table 13: Passenger Ridership Estimation for All Scenarios Measure Passenger Ridership Estimation Low-Ridership Projection High-Ridership Projection Annual ridership, 20-minute headway 10,920 18,650 Annual ridership, 30-minute headway 7,392 12,600
Daily ridership, 20-minute headway 130 220 Daily ridership, 30-minute headway 88 150
Cost Estimation Comparison
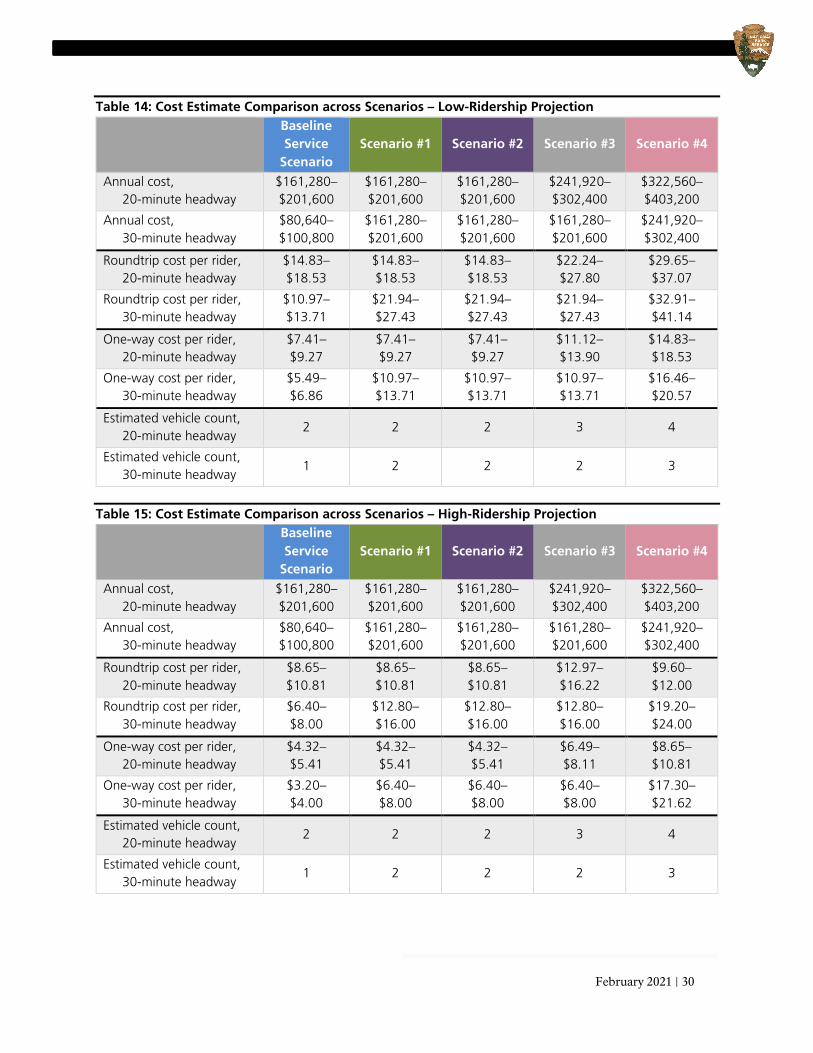
Table 14 and Table 15 show the estimated annual cost, roundtrip cost per passenger, and one-way cost per passenger for each scenario for both 20- and 30-minute headways, for low-ridership and high-ridership projections, respectively. Some scenarios have the same cost estimates because the analysis used a flat hourly rate per shuttle and the number of shuttles required in those scenarios are the same. The actual operating costs will depend upon the service provider’s specific rates and conditions.
A key metric shown in these two tables is the cost per rider, which for some scenarios could be as high as $41 (Scenario 4, low ridership projection). A 2019 survey of 484 potential Triple Crown visitors, administered by the Virginia Department of Transportation (VDOT) and the Roanoke Valley-Allegheny Regional Commission (RVARC), found that, on average, potential visitors would be willing to pay up to $5.68 to use a shuttle service, though willingness to pay responses ranged from $0 (N = 66) to $25 (N = 5).7 Charging a fee to use the shuttle would likely reduce ridership. Visitors do not currently pay a fee to park at the trailheads, and therefore, visitors are likely to continue to opt for the free option when given a choice. A shuttle service without a user fee or fare would require significant subsidy for the NPS and its partners to absorb.
Notably, as discussed in the previous section, the cost per passenger increases for scenarios with longer service routes and more stops served because the visitation patterns at Triple Crown trailheads suggest that certain shuttle route segments would have few to no passengers and that many stops would see little passenger turnover. The longer routes require additional vehicles to maintain headways of 20- and 30-minutes. These, combined with the limited passenger capacity of shuttles required to service the trailhead parking lots, mean that scenarios with longer routes and more stops increase the overall cost of providing the service without increasing the potential number of passengers served.
7 Virginia Department of Transportation and Roanoke Valley-Allegheny Regional Commission, McAfee Knob Shuttle Service
Executive Summary, 2020, and Virginia Department of Transportation and Roanoke Valley-Allegheny Regional Commission, 311 Shuttle Survey Responses, 2020.
February 2021 | 30
Table 14: Cost Estimate Comparison across Scenarios – Low-Ridership Projection Baseline
Service Scenario
Scenario #1 Scenario #2 Scenario #3 Scenario #4
Annual cost, 20-minute headway
$161,280–$201,600
$161,280–$201,600
$161,280–$201,600
$241,920–$302,400
$322,560–$403,200
Annual cost, 30-minute headway
$80,640–$100,800
$161,280–$201,600
$161,280–$201,600
$161,280–$201,600
$241,920–$302,400
Roundtrip cost per rider, 20-minute headway
$14.83–$18.53
$14.83–$18.53
$14.83–$18.53
$22.24–$27.80
$29.65–$37.07
Roundtrip cost per rider, 30-minute headway
$10.97–$13.71
$21.94–$27.43
$21.94–$27.43
$21.94–$27.43
$32.91–$41.14
One-way cost per rider, 20-minute headway
$7.41–$9.27
$7.41– $9.27
$7.41– $9.27
$11.12–$13.90
$14.83–$18.53
One-way cost per rider, 30-minute headway
$5.49–$6.86
$10.97–$13.71
$10.97–$13.71
$10.97–$13.71
$16.46–$20.57
Estimated vehicle count, 20-minute headway
2 2 2 3 4
Estimated vehicle count, 30-minute headway
1 2 2 2 3
Table 15: Cost Estimate Comparison across Scenarios – High-Ridership Projection
Baseline Service
Scenario Scenario #1 Scenario #2 Scenario #3 Scenario #4
Annual cost, 20-minute headway
$161,280–$201,600
$161,280–$201,600
$161,280–$201,600
$241,920–$302,400
$322,560–$403,200
Annual cost, 30-minute headway
$80,640–$100,800
$161,280–$201,600
$161,280–$201,600
$161,280–$201,600
$241,920–$302,400
Roundtrip cost per rider, 20-minute headway
$8.65–$10.81
$8.65–$10.81
$8.65–$10.81
$12.97–$16.22
$9.60–$12.00
Roundtrip cost per rider, 30-minute headway
$6.40– $8.00
$12.80–$16.00
$12.80–$16.00
$12.80–$16.00
$19.20–$24.00
One-way cost per rider, 20-minute headway
$4.32– $5.41
$4.32– $5.41
$4.32– $5.41
$6.49– $8.11
$8.65–$10.81
One-way cost per rider, 30-minute headway
$3.20– $4.00
$6.40– $8.00
$6.40– $8.00
$6.40– $8.00
$17.30–$21.62
Estimated vehicle count, 20-minute headway
2 2 2 3 4
Estimated vehicle count, 30-minute headway
1 2 2 2 3

31 | Appalachian National Scenic Trail, Triple Crown Area – Transit Feasibility Study
Key Findings and Recommendations Based upon the analysis presented in this memo and the preceding memos associated with this feasibility assessment, the project team identified the following key findings and recommendations.
Due to trailhead parking lot geometry constraints and the area’s geography, a shuttle service is not well-suited to dispersing use across trailheads or providing connections to other tourist destinations in the region.
Of the four goals identified by NPS staff and project partners for a potential shuttle service to achieve, goals two and three (see below) are unlikely to be achieved by a shuttle service. The four goals identified by NPS staff and project partners are:
• Goal 1: Address acute parking demand and congestion challenges at McAfee Knob • Goal 2: Disperse use across trailheads to improve visitor experience, visitor safety, and resource
conditions along the Triple Crown trail segments • Goal 3: Connect to other destinations in the region to provide easily accessible service to a greater
number of people • Goal 4: Provide a simple, easy-to-understand, and consistent service design for the public
Goals two and three are not well-aligned with a shuttle service for several reasons. First, the small shuttle capacity required to service the existing parking lots’ geometry greatly limits the ability to move visitors from a centralized parking lot to multiple trailhead destinations. Second, the area’s geography—with potential parking locations centralized near the more urban areas of the region and the destinations centralized in the mountains—does not provide for a high-level of passenger turnover across stops. Combined, these realities greatly limit the ability of a shuttle service to achieve goals two and three. However, goals one and four are met by all options examined in this report, with the exception of the loop service of scenario four.
Longer shuttle service scenarios with more stops increase costs without increasing the potential number of passengers served.
Because of the expected visitation patterns of Triple Crown area visitors using a shuttle—that is, the pattern of parking at a remote lot, taking a shuttle to a trailhead, completing an out-and-back hike, and taking a shuttle back to the parking lot—running longer shuttle service routes and serving more stops does not increase the potential number of passengers served. This is due to the fact that visitors are unlikely to complete certain segments as trips along a route. For example, visitors have little reason to travel between trailheads, even though these trip segments would be necessary to connect visitors to multiple trailhead destinations on a single shuttle route. Given that McAfee Knob has the highest visitation demand currently, the majority of visitors parking at the Exit 140 park-and-ride lot to board a shuttle are expected to alight at McAfee Knob, leaving little capacity to serve passengers to other trailhead stops. The result of these combined limitations is that the cost of the service increases with more stops and longer routes, but does not increase access due to the limited passenger capacity and visitation patterns. Therefore, the project team does not recommend implementing scenarios two, three, or four.
February 2021 | 32
Piloting a shuttle service between the Exit 140 park-and-ride lot and McAfee Knob parking lot could fill data gaps for future analysis.
The partial closure of the McAfee Knob parking lot due to the pedestrian bridge construction presents a unique opportunity to pilot a shuttle service and to collect much-needed data to fill information gaps and allow for further analysis. This project was limited by the lack of data on visitation patterns (e.g., use of the Dragon’s Tooth and Andy Layne parking lots; arrival, departure, and duration data at the parking lots) and ridership given that no current transit service exists for the Triple Crown area. Collecting data on a pilot service to fill these gaps could aid in completing further and more complex analyses of shuttle service options for the Triple Crown area. The project team would recommend implementing the baseline service scenario for a pilot given its simplicity and low cost relative to the other scenarios evaluated in this report.
Conclusion This report documents the analysis of five possible shuttle service scenarios for the Triple Crown area of the A.T. through the development of preliminary shuttle service schedules, passenger capacity and ridership demand estimates, and cost estimates to help determine whether a shuttle service is feasible. The potential for shuttle service is primarily restricted by the existing parking lot geometries at the trailhead locations and the associated small shuttle capacity required in order to service these locations.
The long duration of stay for approximately 85 percent of day visitors also influences shuttle service operations. Shuttles need to operate long service hours daily so that visitors using the service to access trailheads are able to return to their cars. Visitors will avoid using the shuttle if they feel they do not have a reliable way to return from the trail. This long minimum service duration increases operating costs. The least expensive scenario is the baseline service option, which will cost a minimum of about $80,000 per year and does not meet two of the four service goals.
Enforcement of parking restrictions at the trailhead lots is critical to the success of the shuttle. If a shuttle is blocked from accessing the designated stop by parked cars, the passengers cannot safely get on or off of the bus. Adequate enforcement will be needed at all shuttle stops to ensure the vehicle can pull up to its designated space, at least for the immediate rollout and some time period after. At the time of this analysis, NPS and USFS resources for enforcement was limited and sometimes required support from RATC volunteers and local law enforcement to manage parking and prevent lots from excessive parking. More enforcement will require additional resources, such as funding, staff, and volunteers.
Since there is not currently a shuttle system to access the Triple Crown area, public awareness and education about the service is also essential. The ATC and RATC have substantial local networks to facilitate distributing information. Roadside signage would help direct visitors to the park-and-ride lots to get on the shuttle and would also represent an additional cost to support the shuttle service. Increased outreach on social media and the park’s and partners’ websites will help inform the public about the shuttle service.
The purpose of this analysis was to examine the feasibility of operating a shuttle service to one or more of the trailheads that make up the Triple Crown of the A.T. in Virginia. The analysis informs an ongoing VUM Plan being developed by the NPS DSC Planning Division.
Based on the results of this analysis, the feasibility of a shuttle service for the Triple Crown area is mixed. Shuttle service between the Exit 140 park-and-ride lot and McAfee Knob in response to reduced parking

33 | Appalachian National Scenic Trail, Triple Crown Area – Transit Feasibility Study
capacity from the pedestrian bridge project has the lowest cost per passenger at 30-minute headways, the simplest structure, and the fewest infrastructure challenges. The other scenarios have substantially higher costs than the baseline service scenario and do not appear feasible at this time given the constraints identified in this analysis.
Going forward, the park and its partners would likely benefit from focusing on data collection and analysis of a pilot baseline service scenario operation. As the broader VUM effort for the area advances, it may identify the potential for new and different visitation patterns that would increase the demand for a shuttle service, such as one-way hikes. If such visitation patterns are identified and additional information and data are collected from a baseline service scenario pilot, expanding service to include the Dragon’s Tooth parking lot (as in scenario one), could be an additional next step for further data collection and analysis, with particular focus on the prevalence of new and different visitation patterns. For a larger and longer-term shuttle service to the Dragon’s Tooth trailhead parking lot and to the Andy Layne trailhead parking lot that serves Tinker Cliffs to be feasible in terms of cost-efficiency and sufficient ridership, consideration of modifications to the parking areas at these locations would be required in order to increase the potential passenger capacity of a shuttle service.
National Park Service U.S. Department of the Interior Appalachian National Scenic Trail Roanoke, VA
August 2020
Appalachian National Scenic Trail, Triple Crown Area Appendix 1: Summary of Available Data
35 | Appendix 1: Summary of Available Data
Table of Contents
Introduction ....................................................................................................... 36
Methodology ..................................................................................................... 36
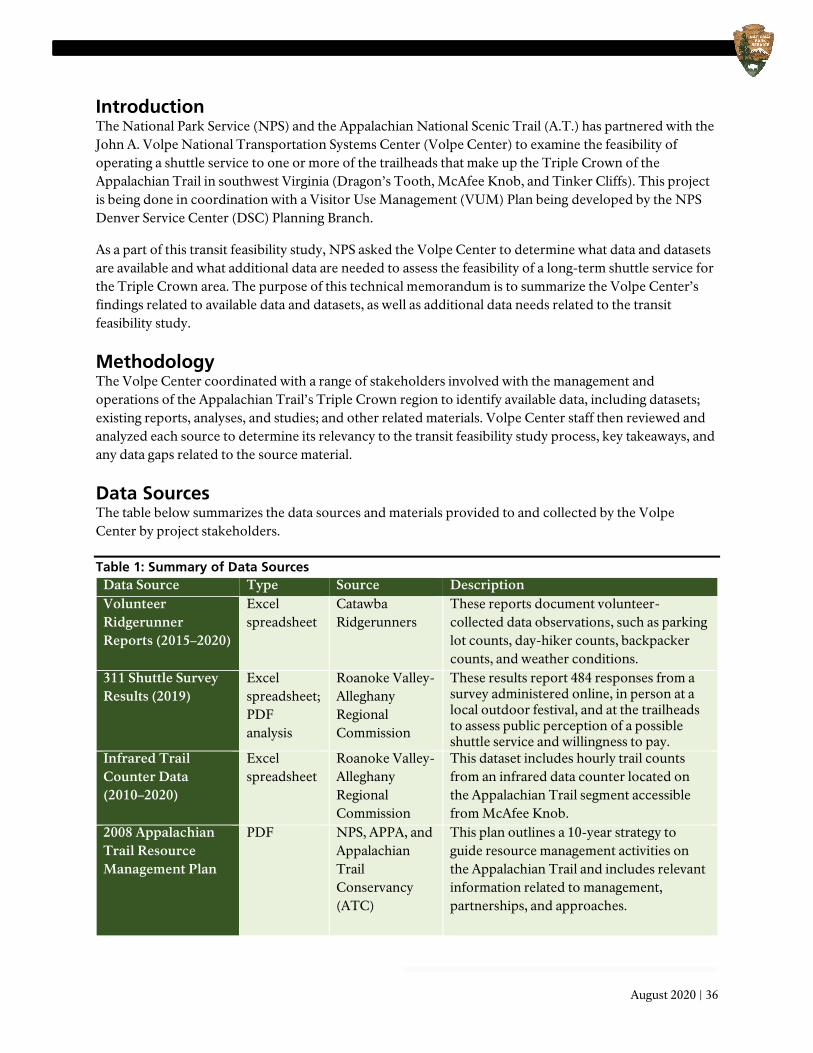
Data Sources ...................................................................................................... 36
Analysis .............................................................................................................. 37 Volunteer Ridgerunner Reports ....................................................................................... 37 311 Shuttle Survey Responses ......................................................................................... 38 Infrared Trail Counter Data ............................................................................................. 38 Additional Data Sources ................................................................................................. 39
Identified Data Gaps .......................................................................................... 39
Conclusion .......................................................................................................... 40
Table of Tables Table 1: Summary of Data Sources ........................................................................................................................ 36 Table 2: Data Points by Days of the Week ............................................................................................................ 38 Table 3: Data Points by Month .............................................................................................................................. 38
August 2020 | 36
Introduction The National Park Service (NPS) and the Appalachian National Scenic Trail (A.T.) has partnered with the John A. Volpe National Transportation Systems Center (Volpe Center) to examine the feasibility of operating a shuttle service to one or more of the trailheads that make up the Triple Crown of the Appalachian Trail in southwest Virginia (Dragon’s Tooth, McAfee Knob, and Tinker Cliffs). This project is being done in coordination with a Visitor Use Management (VUM) Plan being developed by the NPS Denver Service Center (DSC) Planning Branch.
As a part of this transit feasibility study, NPS asked the Volpe Center to determine what data and datasets are available and what additional data are needed to assess the feasibility of a long-term shuttle service for the Triple Crown area. The purpose of this technical memorandum is to summarize the Volpe Center’s findings related to available data and datasets, as well as additional data needs related to the transit feasibility study.
Methodology The Volpe Center coordinated with a range of stakeholders involved with the management and operations of the Appalachian Trail’s Triple Crown region to identify available data, including datasets; existing reports, analyses, and studies; and other related materials. Volpe Center staff then reviewed and analyzed each source to determine its relevancy to the transit feasibility study process, key takeaways, and any data gaps related to the source material.
Data Sources The table below summarizes the data sources and materials provided to and collected by the Volpe Center by project stakeholders.
Table 1: Summary of Data Sources Data Source Type Source Description Volunteer Ridgerunner Reports (2015–2020)
Excel spreadsheet
Catawba Ridgerunners
These reports document volunteer-collected data observations, such as parking lot counts, day-hiker counts, backpacker counts, and weather conditions.
311 Shuttle Survey Results (2019)
Excel spreadsheet; PDF analysis
Roanoke Valley-Alleghany Regional Commission
These results report 484 responses from a survey administered online, in person at a local outdoor festival, and at the trailheads to assess public perception of a possible shuttle service and willingness to pay.
Infrared Trail Counter Data (2010–2020)
Excel spreadsheet
Roanoke Valley-Alleghany Regional Commission
This dataset includes hourly trail counts from an infrared data counter located on the Appalachian Trail segment accessible from McAfee Knob.
2008 Appalachian Trail Resource Management Plan
PDF NPS, APPA, and Appalachian Trail Conservancy (ATC)
This plan outlines a 10-year strategy to guide resource management activities on the Appalachian Trail and includes relevant information related to management, partnerships, and approaches.
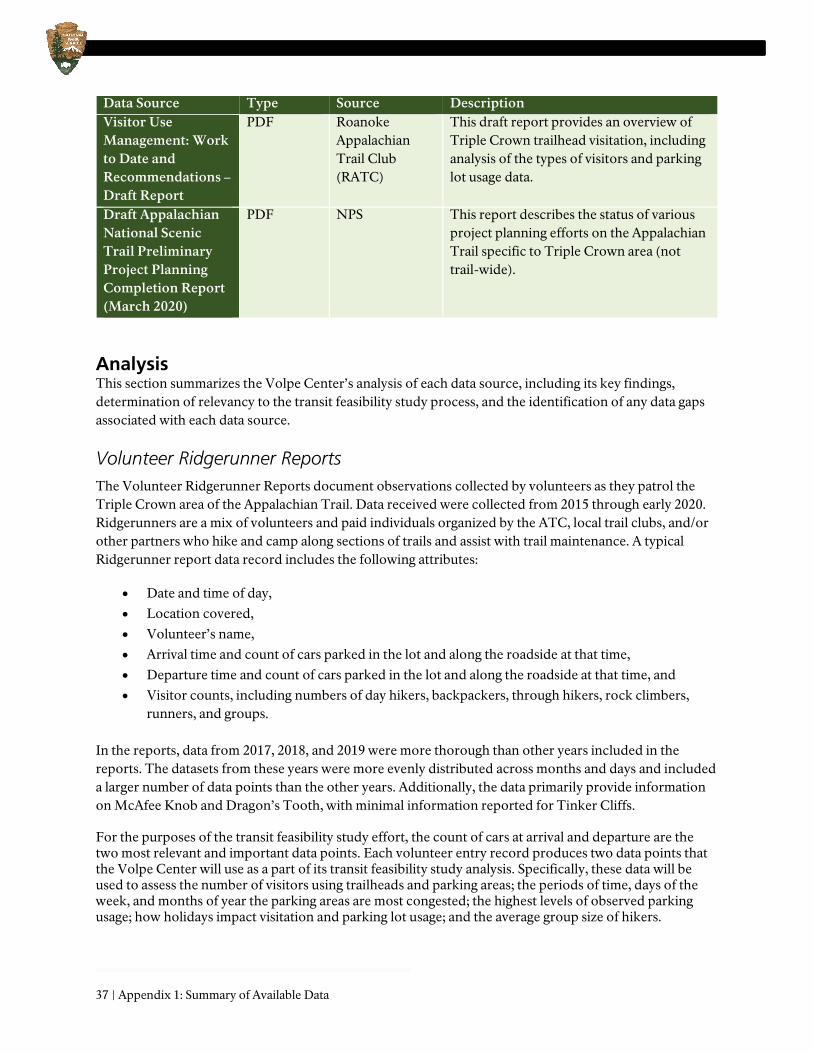
37 | Appendix 1: Summary of Available Data
Data Source Type Source Description Visitor Use Management: Work to Date and Recommendations – Draft Report
PDF Roanoke Appalachian Trail Club (RATC)
This draft report provides an overview of Triple Crown trailhead visitation, including analysis of the types of visitors and parking lot usage data.
Draft Appalachian National Scenic Trail Preliminary Project Planning Completion Report (March 2020)
PDF NPS This report describes the status of various project planning efforts on the Appalachian Trail specific to Triple Crown area (not trail-wide).
Analysis This section summarizes the Volpe Center’s analysis of each data source, including its key findings, determination of relevancy to the transit feasibility study process, and the identification of any data gaps associated with each data source.
Volunteer Ridgerunner Reports The Volunteer Ridgerunner Reports document observations collected by volunteers as they patrol the Triple Crown area of the Appalachian Trail. Data received were collected from 2015 through early 2020. Ridgerunners are a mix of volunteers and paid individuals organized by the ATC, local trail clubs, and/or other partners who hike and camp along sections of trails and assist with trail maintenance. A typical Ridgerunner report data record includes the following attributes:
• Date and time of day, • Location covered, • Volunteer’s name, • Arrival time and count of cars parked in the lot and along the roadside at that time, • Departure time and count of cars parked in the lot and along the roadside at that time, and • Visitor counts, including numbers of day hikers, backpackers, through hikers, rock climbers,
runners, and groups.
In the reports, data from 2017, 2018, and 2019 were more thorough than other years included in the reports. The datasets from these years were more evenly distributed across months and days and included a larger number of data points than the other years. Additionally, the data primarily provide information on McAfee Knob and Dragon’s Tooth, with minimal information reported for Tinker Cliffs.
For the purposes of the transit feasibility study effort, the count of cars at arrival and departure are the two most relevant and important data points. Each volunteer entry record produces two data points that the Volpe Center will use as a part of its transit feasibility study analysis. Specifically, these data will be used to assess the number of visitors using trailheads and parking areas; the periods of time, days of the week, and months of year the parking areas are most congested; the highest levels of observed parking usage; how holidays impact visitation and parking lot usage; and the average group size of hikers.

August 2020 | 38
Table 2 and Table 3 above show the number of data points for each day of the week and for months of the year from 2016-2020. Each volunteer recorded the number of cars in the parking lots twice, once at the beginning and again at the end of their shift. As a result, one single volunteer observation creates two data points in the tables above. As shown in Table 2, Fridays, Saturdays, and Sundays have significantly more data points than other days of the week. In Table 3, there is a more even distribution of data points among all months except January, February, March, and December, which have significantly fewer data points. For the purposes of the Volpe Center’s analysis, April through November and Friday through Sunday will be a focus, as these days and months present the most robust data to analyze and are the time periods identified by stakeholders to be most suitable for shuttle service.
311 Shuttle Survey Responses The 311 shuttle survey responses from January 2020 report the results of a survey administered online, at the Triple Crown trailheads in fall 2019, and in person at an outdoor festival. The survey included questions concerning the distance traveled to reach the trailheads, how visitors learned about the trails, the willingness of visitors to use a possible shuttle service, and the willingness to pay for shuttle service. The survey results showed that over 80 percent of visitors live within an hour’s drive of McAfee Knob and that visitors are primarily local Virginians. Approximately one-third (35 percent) of visitors said a lack of parking has prevented them from hiking at McAfee Knob. Nearly three-fourths (73 percent) of respondents said they would use a shuttle to reach the trailhead if available. When asked about the highest price they would be willing to pay for shuttle service, respondents indicated a willingness to pay an average price of $5.50.
Infrared Trail Counter Data The Volpe Center received infrared trail counter data from July 2010 through December 2020. However, the data includes some gaps where the trail counter was not being monitored and thus data were not
Table 2: Data Points by Days of the Week
Day Number of Data Points Monday 68 Tuesday 30 Wednesday 22 Thursday 21 Friday 563 Saturday 407 Sunday 210
Table 3: Data Points by Month
Months Number of Data Points January 10
February 12 March 55 April 184 May 171 June 189 July 208 August 175 September 188
October 205 November 104
December 20
39 | Appendix 1: Summary of Available Data
collected. Additionally, the trail counter malfunctioned in 2016 and 2017, resulting in unreliable data counts. The Roanoke Valley-Alleghany Regional Commission, which maintains the counter with the support of Ridgerunners and provided the data, advised the Volpe Center to focus on 2018 and 2019 data, which has been more systematically collected and monitored for quality assurance.
Unlike the Ridgerunner data, the infrared counter data provides actual trail counts on an hourly basis. Combined with the Ridgerunner data, the Volpe Center anticipates being able to assess the reliability of the Ridgerunner counts and assess the relationship between trail usage and parking lot usage to inform the shuttle feasibility study.
Additional Data Sources In addition to the data sources above, the Volpe Center also received two relevant reports with key relevant observations: a draft report of Visitor Use Management: Work to Date and Recommendations and the Appalachian National Scenic Trail Preliminary Project Planning Completion Report. These reports provided a general overview of trail use in the Triple Crown area, as well as information about visitor behavior. These reports include the following relevant key observations:
• Over 50,000 people visit McAfee Knob each year while another 20,000-30,000 visit Dragon’s Tooth.
• Day hikers are approximately 85 percent of visitors. Backpackers make up the remaining approximately 15 percent. Through hikers are a very small portion of overall hiker visitation (except during May, when full-trail hikers typically arrive in the Triple Crown area).
• Saturday is by far the busiest day of the week for hiking activity. There are also many Saturday night campers.
• The VA 311 parking lot is officially meant for 36 cars, but 70-80 cars park there routinely, with an overflow of 40 or more cars to County Road 864 possible at busy times.
o Stakeholders have also shared that the capacity of this parking lot is anticipated to be reduced by approximately 50 percent during the construction of a pedestrian bridge. This reduction is expected to occur in 2023, but may occur earlier. This expected parking reduction has been a factor in exploring possible shuttle service to the trailheads.
Additionally, the Volpe Center also received the 2008 Appalachian Trail Resource Management Plan. This plan includes an overview of maintenance priorities for the management of the Appalachian Trail, including the following areas: air quality, scenic vistas, conservation of water and land resources, conservation of scenery and the natural and historic objects and the wildlife of the trails, and preserving the historic identity of trails. While this plan covers the entirety of the Appalachian Trail, it provided valuable background information related to trail management to inform the transit feasibility study.
Identified Data Gaps The Ridgerunner report data provide the Volpe Center with information that can be used to assess the number of visitors using trailheads and parking areas, among other details. The data does not directly count when visitors arrive at the trailhead parking, how many people arrived in a single car, or how long visitors stay. There is also no data that present the types of vehicles, or vehicle size (i.e., RVs, tour buses, etc.) in the lots. However, with the Ridgerunner data and qualitative data from park staff and volunteers, the Volpe Center staff will be able to estimate duration of parking space occupancy and turnover.
Regarding parking lot usage, the Volpe Center has only obtained information for the McAfee Knob trailhead parking lot, but has not received comparable information for Dragon’s Tooth and Tinker Cliffs.
August 2020 | 40
Information is requested to determine the capacities of these trailhead parking lots, as well as any assessment of overflow regions in the event of overcapacity. As additional analysis is undertaken, particularly concerning possible shuttle scenarios, information about parking lot capacity at potential park-and-ride lots, such as at the Catawba Sustainability Center and the I-81 park-and-ride lot located at exit 140, is also requested.
To assess the intended length of stay of visitors, the Volpe Center needs to confirm if there are usage differences between one-way hikers and hikers that may complete looped, out-and-back hikes. Confirmation is requested to determine if loop hikes are feasible on these trails, and thus a variable in analysis.
Additional information regarding both pre-existing, and potential shuttle services in the region would improve the study. This includes an overview of the local transit service providers that exist in the region. Of these providers, if any, it is beneficial to assess characteristics such as the ridership of these transit service options, the fares of these services, as well as any park-and-ride transit services in the region.
The 311 shuttle survey responses have provided insight into the interest in shuttle service to trailheads, however the data does not indicate what percentage of Triple Crown visitors would use a transit service for one-way hikes (e.g., a drop-off or pick-up service to/from one of the trailheads). This information would assist in planning for effective shuttle service routes.
Conclusion Supplementary discussions with stakeholders will be held to collect further background information regarding Triple Crown visitor behavior. This includes the percentage of Triple Crown visitors that support services originating from local colleges and universities and other relevant local locations. These discussions will also provide insights into the types of hikes of visitors using trailheads and parking areas, as well as which of the peaks (if any) best facilitate one-way hikes.
National Park Service U.S. Department of the Interior Appalachian National Scenic Trail Roanoke, Virginia
September 2020
Appalachian National Scenic Trail, Triple Crown Area Appendix 2: Existing Conditions

September 2020 | 42
Table of Contents
Introduction ....................................................................................................... 43 Project Purpose .............................................................................................................. 43 Project Area ................................................................................................................... 44 Methodology ................................................................................................................. 45
Existing Conditions ............................................................................................ 45 Key Considerations ......................................................................................................... 46 Access ........................................................................................................................... 50 Parking .......................................................................................................................... 51 Visitation........................................................................................................................ 59
Conclusion .......................................................................................................... 61
Table of Figures Figure 1: Triple Crown Area of the Appalachian Trail ....................................................................................... 43 Figure 2: Triple Crown Area of the Appalachian Trail Map Inset .................................................................... 44 Figure 3. Satellite View of McAfee Knob Parking Lot, VA-311, and the A.T. ................................................. 47 Figure 4. Location of McAfee Knob Parking Lot (On Left) and Northbound A.T. Connection (On Right) .................................................................................................................................................................................... 48 Figure 5: VA-311 Roadway Conditions between A.T. Connection (Left, Around Curve) and Parking Lot (Right) ....................................................................................................................................................................... 49 Figure 6: Catawba Sustainability Center and Exit 140 Park-and-Ride Lot Locations ................................... 50 Figure 7: McAfee Knob Trailhead Parking Lot ................................................................................................... 52 Figure 8: Dragon's Tooth Trailhead Parking Lot ................................................................................................ 52 Figure 9: Andy Layne Trailhead Parking Lot ....................................................................................................... 53 Figure 10: Average Number of Cars by Time of Day on Weekend Days ......................................................... 54 Figure 11: McAfee Knob 85th Percentile Parking Lot Usage on Weekend Days by Time of Day by Month .................................................................................................................................................................................... 55 Figure 12: Dragon's Tooth 85th Percentile Parking Lot Usage on Weekend Days by Time of Day by Month........................................................................................................................................................................ 56 Figure 13: Comparative Average Number of Cars in Lots on Federal Holidays vs. Non-Holidays ............. 57 Figure 14: McAfee Knob Parking Lot, Labor Day 2020 ..................................................................................... 58 Figure 15: Average Infrared Trail Counter Counts by Time of Day (2018-2019) ........................................... 60 Figure 16: Average Ridgerunner Parking Lot Usage Counts by Time of Day (2017-2019) ........................... 60
Table of Tables Table 1: Triple Crown Parking Lot Sizes .............................................................................................................. 52
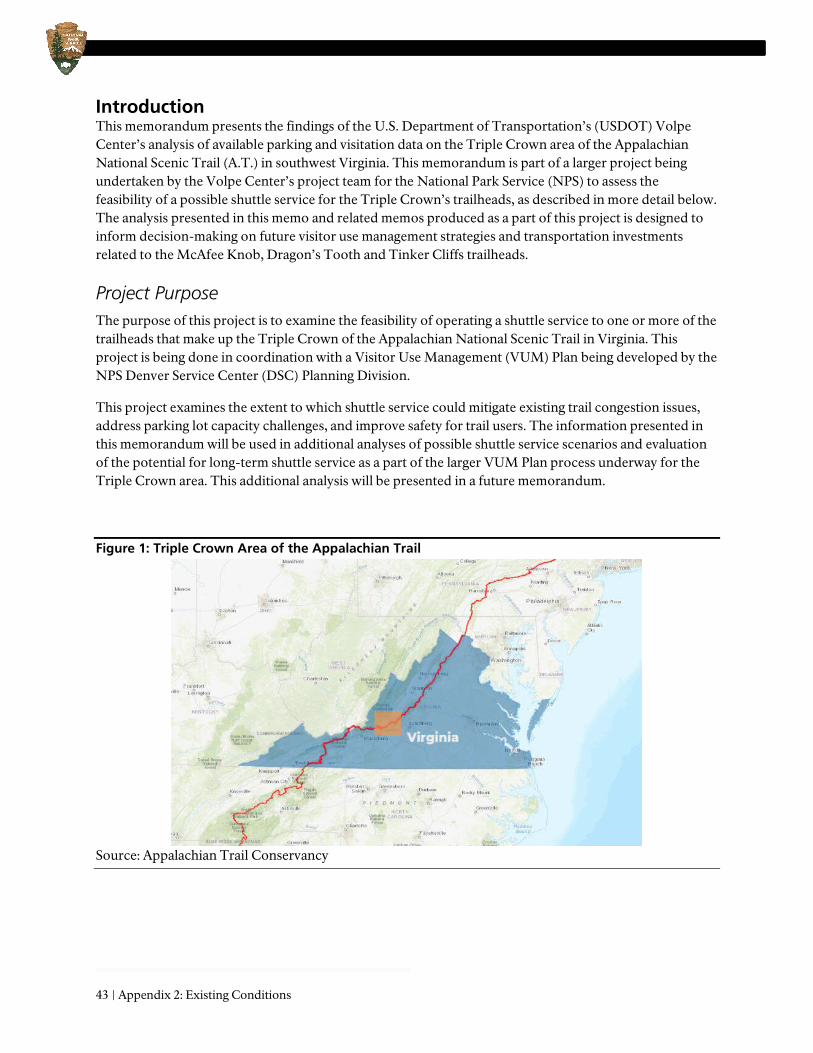
43 | Appendix 2: Existing Conditions
Introduction This memorandum presents the findings of the U.S. Department of Transportation’s (USDOT) Volpe Center’s analysis of available parking and visitation data on the Triple Crown area of the Appalachian National Scenic Trail (A.T.) in southwest Virginia. This memorandum is part of a larger project being undertaken by the Volpe Center’s project team for the National Park Service (NPS) to assess the feasibility of a possible shuttle service for the Triple Crown’s trailheads, as described in more detail below. The analysis presented in this memo and related memos produced as a part of this project is designed to inform decision-making on future visitor use management strategies and transportation investments related to the McAfee Knob, Dragon’s Tooth and Tinker Cliffs trailheads.
Project Purpose The purpose of this project is to examine the feasibility of operating a shuttle service to one or more of the trailheads that make up the Triple Crown of the Appalachian National Scenic Trail in Virginia. This project is being done in coordination with a Visitor Use Management (VUM) Plan being developed by the NPS Denver Service Center (DSC) Planning Division.
This project examines the extent to which shuttle service could mitigate existing trail congestion issues, address parking lot capacity challenges, and improve safety for trail users. The information presented in this memorandum will be used in additional analyses of possible shuttle service scenarios and evaluation of the potential for long-term shuttle service as a part of the larger VUM Plan process underway for the Triple Crown area. This additional analysis will be presented in a future memorandum.
Figure 1: Triple Crown Area of the Appalachian Trail
Source: Appalachian Trail Conservancy
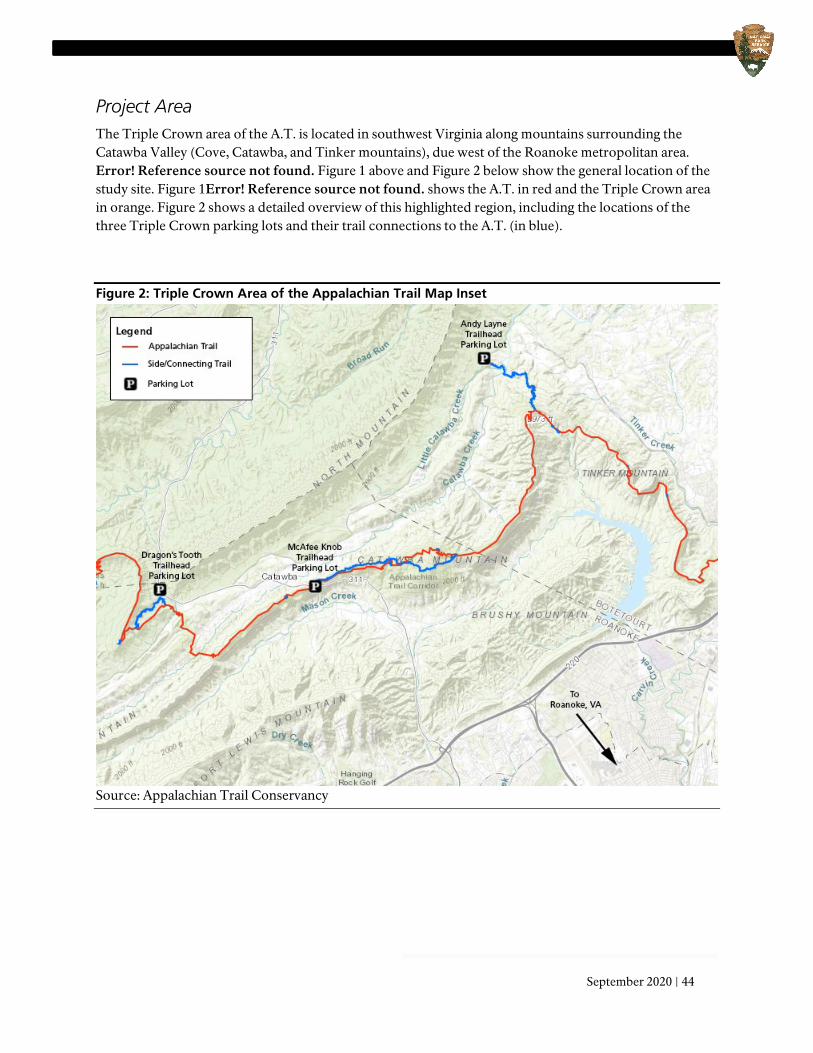
September 2020 | 44
Project Area The Triple Crown area of the A.T. is located in southwest Virginia along mountains surrounding the Catawba Valley (Cove, Catawba, and Tinker mountains), due west of the Roanoke metropolitan area. Error! Reference source not found. Figure 1 above and Figure 2 below show the general location of the study site. Figure 1Error! Reference source not found. shows the A.T. in red and the Triple Crown area in orange. Figure 2 shows a detailed overview of this highlighted region, including the locations of the three Triple Crown parking lots and their trail connections to the A.T. (in blue).
Figure 2: Triple Crown Area of the Appalachian Trail Map Inset
Source: Appalachian Trail Conservancy

45 | Appendix 2: Existing Conditions
Methodology The existing conditions analysis presented in this memorandum is based upon (1) review of background information and prior studies of the Triple Crown area and (2) an analysis of Triple Crown area trail and parking visitation data. The data sources used for this analysis were documented in an earlier memo completed for this project.1 Key data sources are also summarized below.
Background information about road conditions, access points, parking lot conditions and capacities, and visitation patterns was identified through a review of key documents and prior studies, including the Roanoke Appalachian Trail Club’s (RATC’s) draft visitor use management report and the NPS’s draft A.T. preliminary project planning (P3) workshop outcomes report.
Data analysis presented in this memo is based upon two data sources: volunteer Ridgerunner reports and infrared counter data. Ridgerunner reports are observation-based data collected by members of the RATC. These reports include a number of variables about trailhead conditions as observed by the individual completing the report. The project team received Ridgerunner report data for the years 2015 through early 2020. The project team used two key variables from these reports for its analysis: the number of cars present in a trailhead parking lot at arrival and the number of cars present at the parking lot upon departure. These variables were combined with reported arrival and departure dates and times to allow for a time-based analysis. As agreed-upon by project stakeholders, qualitative data indicating a “full lot” was interpreted as 75 cars for the purposes of the quantitative analysis.
The infrared counter data used for this analysis was provided by the Roanoke Valley-Alleghany Regional Commission (RVARC), which maintains the counter with the support of the RATC. Data suitable for analysis included the years 2018 and 2019. The infrared counter data consists of hourly trail counts captured by the automated trail counter located along the A.T. near the McAfee Knob trailhead.
Due to travel restrictions associated with the COVID-19 pandemic, no in-person site visits were conducted for this study. All data and information used for this analysis was provided by the NPS or stakeholder groups.
Existing Conditions This section is organized into four subsections, each of which describe key elements of current conditions in the Triple Crown area that will directly inform the transit feasibility study and the potential shuttle service scenarios that the project team will develop and assess in a subsequent memo. The subsections that follow include the following:
• Key Considerations: This subsection identifies ongoing activities, critical facts, and related information identified from prior studies and documents that will directly inform the potential shuttle service scenarios to be assessed.
• Access: This subsection describes current access points to the Triple Crown trailheads and existing conditions associated with roadways and traffic.
• Parking: This subsection presents the project team’s quantitative analysis of available parking data and describes the parking lots at each trailhead, their current conditions, and their usage.
1 USDOT Volpe Center, Appalachian National Scenic Trail, Triple Crown Area: Technical Memo 1: Summary of Available Data, August 2020.
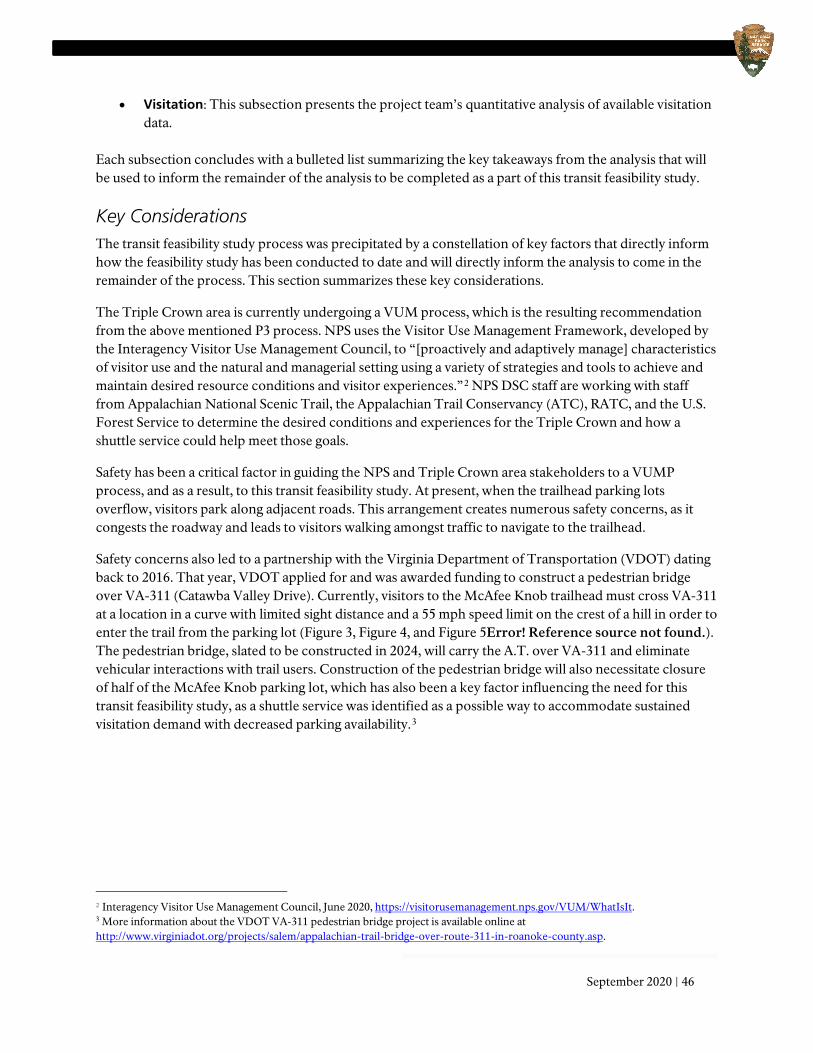
September 2020 | 46
• Visitation: This subsection presents the project team’s quantitative analysis of available visitation data.
Each subsection concludes with a bulleted list summarizing the key takeaways from the analysis that will be used to inform the remainder of the analysis to be completed as a part of this transit feasibility study.
Key Considerations The transit feasibility study process was precipitated by a constellation of key factors that directly inform how the feasibility study has been conducted to date and will directly inform the analysis to come in the remainder of the process. This section summarizes these key considerations.
The Triple Crown area is currently undergoing a VUM process, which is the resulting recommendation from the above mentioned P3 process. NPS uses the Visitor Use Management Framework, developed by the Interagency Visitor Use Management Council, to “[proactively and adaptively manage] characteristics of visitor use and the natural and managerial setting using a variety of strategies and tools to achieve and maintain desired resource conditions and visitor experiences.”2 NPS DSC staff are working with staff from Appalachian National Scenic Trail, the Appalachian Trail Conservancy (ATC), RATC, and the U.S. Forest Service to determine the desired conditions and experiences for the Triple Crown and how a shuttle service could help meet those goals.
Safety has been a critical factor in guiding the NPS and Triple Crown area stakeholders to a VUMP process, and as a result, to this transit feasibility study. At present, when the trailhead parking lots overflow, visitors park along adjacent roads. This arrangement creates numerous safety concerns, as it congests the roadway and leads to visitors walking amongst traffic to navigate to the trailhead.
Safety concerns also led to a partnership with the Virginia Department of Transportation (VDOT) dating back to 2016. That year, VDOT applied for and was awarded funding to construct a pedestrian bridge over VA-311 (Catawba Valley Drive). Currently, visitors to the McAfee Knob trailhead must cross VA-311 at a location in a curve with limited sight distance and a 55 mph speed limit on the crest of a hill in order to enter the trail from the parking lot (Figure 3, Figure 4, and Figure 5Error! Reference source not found.). The pedestrian bridge, slated to be constructed in 2024, will carry the A.T. over VA-311 and eliminate vehicular interactions with trail users. Construction of the pedestrian bridge will also necessitate closure of half of the McAfee Knob parking lot, which has also been a key factor influencing the need for this transit feasibility study, as a shuttle service was identified as a possible way to accommodate sustained visitation demand with decreased parking availability.3
2 Interagency Visitor Use Management Council, June 2020, https://visitorusemanagement.nps.gov/VUM/WhatIsIt. 3 More information about the VDOT VA-311 pedestrian bridge project is available online at http://www.virginiadot.org/projects/salem/appalachian-trail-bridge-over-route-311-in-roanoke-county.asp.
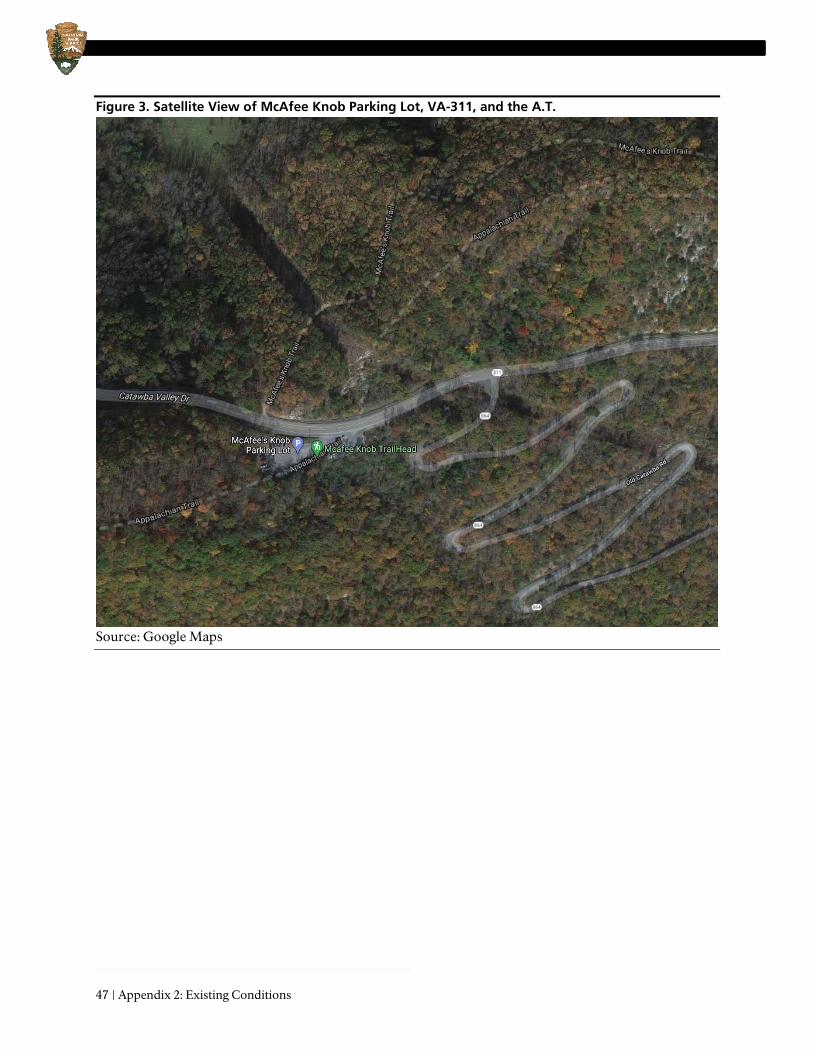
47 | Appendix 2: Existing Conditions
Figure 3. Satellite View of McAfee Knob Parking Lot, VA-311, and the A.T.
Source: Google Maps
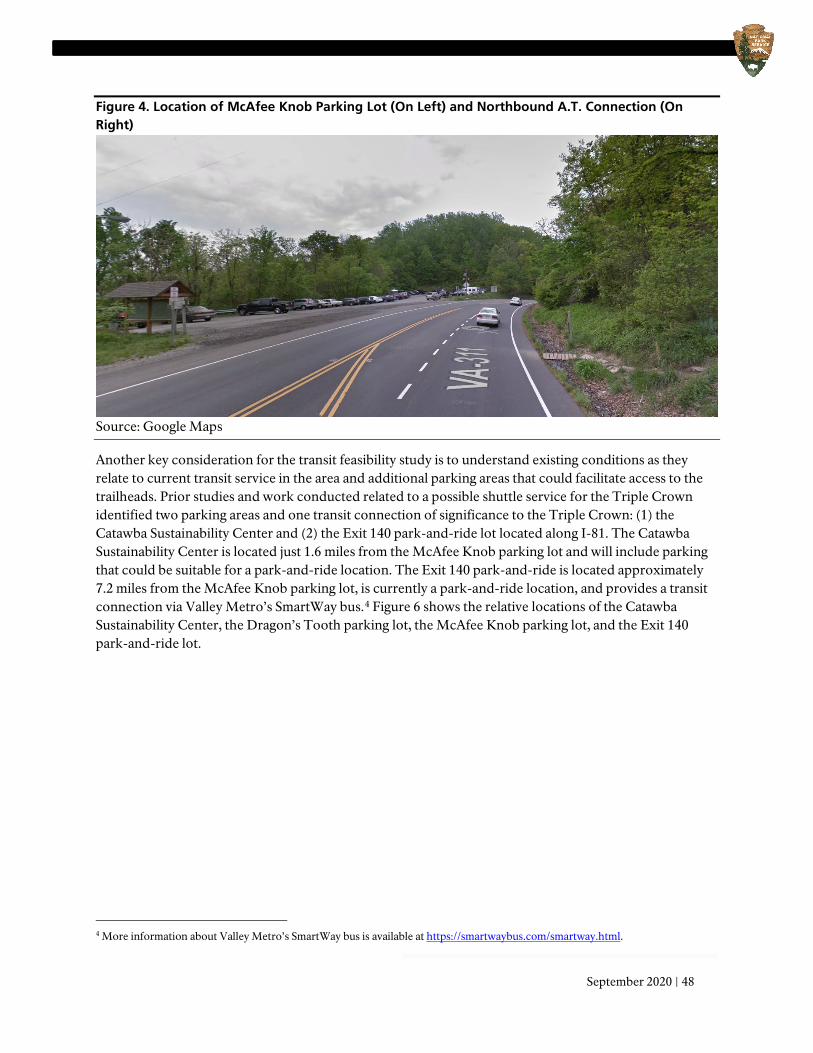
September 2020 | 48
Figure 4. Location of McAfee Knob Parking Lot (On Left) and Northbound A.T. Connection (On Right)
Source: Google Maps
Another key consideration for the transit feasibility study is to understand existing conditions as they relate to current transit service in the area and additional parking areas that could facilitate access to the trailheads. Prior studies and work conducted related to a possible shuttle service for the Triple Crown identified two parking areas and one transit connection of significance to the Triple Crown: (1) the Catawba Sustainability Center and (2) the Exit 140 park-and-ride lot located along I-81. The Catawba Sustainability Center is located just 1.6 miles from the McAfee Knob parking lot and will include parking that could be suitable for a park-and-ride location. The Exit 140 park-and-ride is located approximately 7.2 miles from the McAfee Knob parking lot, is currently a park-and-ride location, and provides a transit connection via Valley Metro’s SmartWay bus.4 Figure 6 shows the relative locations of the Catawba Sustainability Center, the Dragon’s Tooth parking lot, the McAfee Knob parking lot, and the Exit 140 park-and-ride lot.
4 More information about Valley Metro’s SmartWay bus is available at https://smartwaybus.com/smartway.html.

49 | Appendix 2: Existing Conditions
Figure 5: VA-311 Roadway Conditions between A.T. Connection (Left, Around Curve) and Parking Lot (Right)
Source: National Park Service
Takeaways for the Transit Feasibility Study
• The final report and analysis from the study should be designed to support future work to be carried out in the VUM planning process.
• Improving safety for visitors at the trailheads should be a key criterion by which possible shuttle service scenarios are evaluated.
• The shuttle service scenarios should build off of prior work already completed by project stakeholders, including the incorporation of park-and-ride locations at the Catawba Sustainability Center and Exit 140 park-and-ride lot.
September 2020 | 50
Figure 6: Catawba Sustainability Center and Exit 140 Park-and-Ride Lot Locations
Source: Google Maps
Access Triple Crown trailheads are, at present, accessible only by car. The parking lots and trailheads are located off two-lane roads with limited shoulders and geographic constraints on both sides due to the mountainous terrain. Specific details of access to each trailhead are outlined below.
McAfee Knob
The northbound A.T., heading toward McAfee Knob, is located on the north side of VA-311 (Catawba Valley Drive). The parking lot (Figure 7) is located along the south side of the highway. To access the trailhead, visitors park in the lot and are required to cross the highway with limited visibility in both directions and a 55 mph speed limit. The proposed pedestrian bridge will carry the A.T. over VA-311 in Roanoke County. The trailhead parking lot is located directly along VA-311 with no entrance road nor clearly defined entry or exit points; as a result, limited space of the lot renders any potential shuttle drop off or turn-around along the highway to be a safety concern. The ATC is in the process of acquiring multiple parcels of land adjacent to the parking lot. These parcels are located on both VA-311 and VA-864 and have the potential to allow for better access and turnaround options for a shuttle. Acquisition of these parcels is anticipated before the end of 2020.
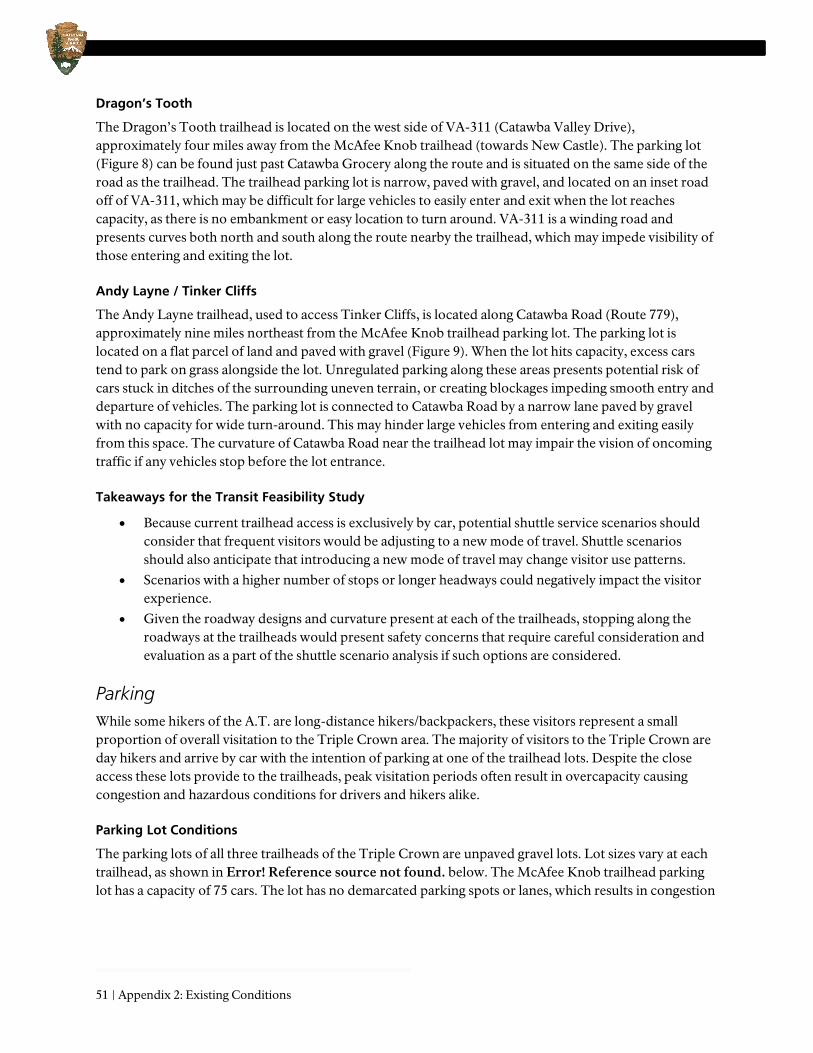
51 | Appendix 2: Existing Conditions
Dragon’s Tooth
The Dragon’s Tooth trailhead is located on the west side of VA-311 (Catawba Valley Drive), approximately four miles away from the McAfee Knob trailhead (towards New Castle). The parking lot (Figure 8) can be found just past Catawba Grocery along the route and is situated on the same side of the road as the trailhead. The trailhead parking lot is narrow, paved with gravel, and located on an inset road off of VA-311, which may be difficult for large vehicles to easily enter and exit when the lot reaches capacity, as there is no embankment or easy location to turn around. VA-311 is a winding road and presents curves both north and south along the route nearby the trailhead, which may impede visibility of those entering and exiting the lot.
Andy Layne / Tinker Cliffs
The Andy Layne trailhead, used to access Tinker Cliffs, is located along Catawba Road (Route 779), approximately nine miles northeast from the McAfee Knob trailhead parking lot. The parking lot is located on a flat parcel of land and paved with gravel (Figure 9). When the lot hits capacity, excess cars tend to park on grass alongside the lot. Unregulated parking along these areas presents potential risk of cars stuck in ditches of the surrounding uneven terrain, or creating blockages impeding smooth entry and departure of vehicles. The parking lot is connected to Catawba Road by a narrow lane paved by gravel with no capacity for wide turn-around. This may hinder large vehicles from entering and exiting easily from this space. The curvature of Catawba Road near the trailhead lot may impair the vision of oncoming traffic if any vehicles stop before the lot entrance.
Takeaways for the Transit Feasibility Study
• Because current trailhead access is exclusively by car, potential shuttle service scenarios should consider that frequent visitors would be adjusting to a new mode of travel. Shuttle scenarios should also anticipate that introducing a new mode of travel may change visitor use patterns.
• Scenarios with a higher number of stops or longer headways could negatively impact the visitor experience.
• Given the roadway designs and curvature present at each of the trailheads, stopping along the roadways at the trailheads would present safety concerns that require careful consideration and evaluation as a part of the shuttle scenario analysis if such options are considered.
Parking While some hikers of the A.T. are long-distance hikers/backpackers, these visitors represent a small proportion of overall visitation to the Triple Crown area. The majority of visitors to the Triple Crown are day hikers and arrive by car with the intention of parking at one of the trailhead lots. Despite the close access these lots provide to the trailheads, peak visitation periods often result in overcapacity causing congestion and hazardous conditions for drivers and hikers alike.
Parking Lot Conditions
The parking lots of all three trailheads of the Triple Crown are unpaved gravel lots. Lot sizes vary at each trailhead, as shown in Error! Reference source not found. below. The McAfee Knob trailhead parking lot has a capacity of 75 cars. The lot has no demarcated parking spots or lanes, which results in congestion
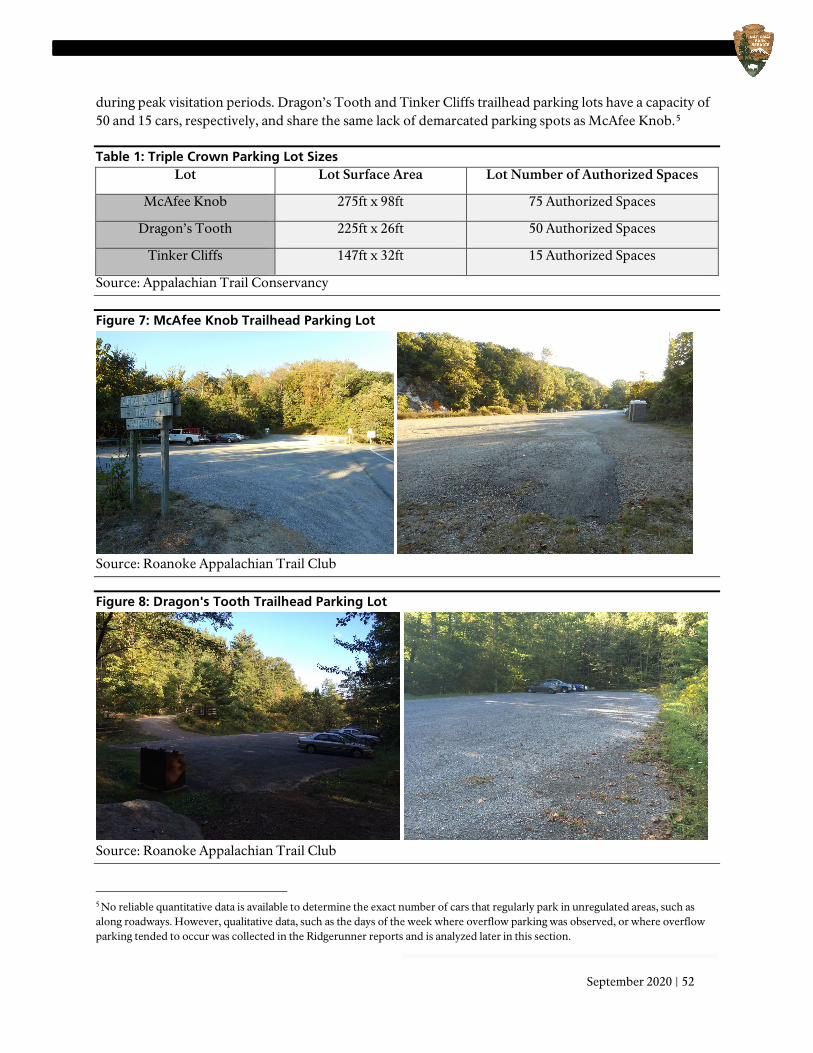
September 2020 | 52
during peak visitation periods. Dragon’s Tooth and Tinker Cliffs trailhead parking lots have a capacity of 50 and 15 cars, respectively, and share the same lack of demarcated parking spots as McAfee Knob.5
Table 1: Triple Crown Parking Lot Sizes Lot Lot Surface Area Lot Number of Authorized Spaces
McAfee Knob 275ft x 98ft 75 Authorized Spaces
Dragon’s Tooth 225ft x 26ft 50 Authorized Spaces
Tinker Cliffs 147ft x 32ft 15 Authorized Spaces
Source: Appalachian Trail Conservancy
Figure 7: McAfee Knob Trailhead Parking Lot
Source: Roanoke Appalachian Trail Club
Figure 8: Dragon's Tooth Trailhead Parking Lot
Source: Roanoke Appalachian Trail Club
5 No reliable quantitative data is available to determine the exact number of cars that regularly park in unregulated areas, such as along roadways. However, qualitative data, such as the days of the week where overflow parking was observed, or where overflow parking tended to occur was collected in the Ridgerunner reports and is analyzed later in this section.

53 | Appendix 2: Existing Conditions
Figure 9: Andy Layne Trailhead Parking Lot
Source: Roanoke Appalachian Trail Club
Parking Lot Usage
Ridgerunner report data provided to the project team from the RATC included data from 2015 through early 2020. In total, the project team extracted 1,521 parking count data points from the Ridgerunner reports.6 These parking count data points include data for McAfee Knob and Dragon’s Tooth trailheads only; therefore, the analysis presented here focuses only on these two trailheads. Using the extracted data points, the project team analyzed the dataset by time of day, day of the week, and day characteristics (i.e., holiday vs. non-holiday) to assess parking lot usage trends. The purpose of this analysis was to identify trends in parking lot usage to best identify when a possible shuttle service would be viable and best-suited based on visitor demand.
Based on analysis of the Ridgerunner parking data, the busiest days across all three Triple Crown trailheads are Saturdays and Sundays.7 Monday holidays also stood out as busy days in the analysis. The McAfee Knob parking lot was overwhelmingly the busiest, according to the available data in the Ridgerunner dataset. The data also varied by season, with the greatest activity observed in spring (April and May), summer (June and July), and fall (September and October). Because data points in August were limited compared to July and September, August data are not shown in the analysis below.
Figure 10 shows the average number of cars parked at Dragon’s Tooth and McAfee Knob on Saturdays and Sundays, divided into three time periods: morning (12:00 AM to 11:59 AM), afternoon (12:00 PM to 3:59 PM), and evening (4:00 PM to 11:59 PM).8 Dragon’s Tooth experiences an average of approximately 20 cars in its lot on Saturday and Sunday mornings, which double to 40 vehicles on average on Saturday afternoons and evenings, with slightly lower numbers observed on Sunday afternoons and evenings.
6 Each Ridgerunner observation includes two parking lot counts: one recorded at arrival and one recorded at departure. Therefore, each individual observation produces two data points for analysis. 7 While Fridays were not identified as among the busiest days in the available data, project stakeholders have consistently identified Fridays as days with high visitation based upon their observations. 8 While early morning (before 7:00 AM) and late evening (after 8:00 PM) hours were technically included in the timeframes used for analysis, no data points exist for these early or late hours, so the averages shown are not impacted by outliers from these hours.
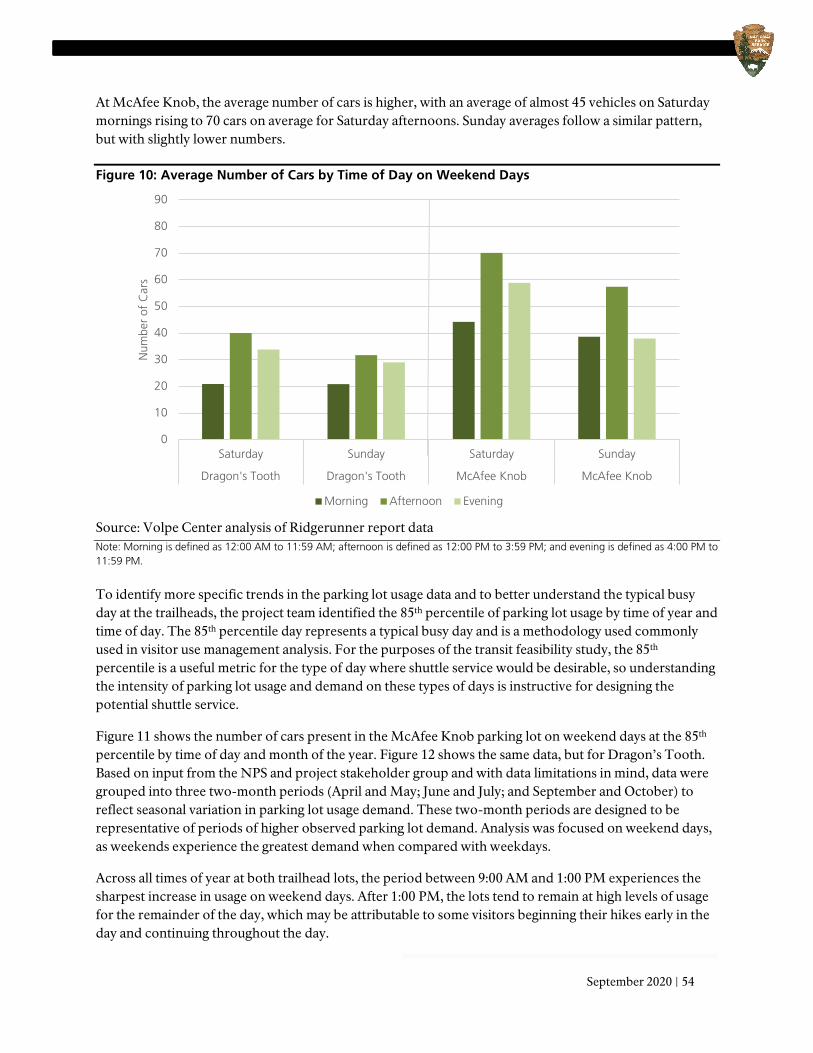
September 2020 | 54
At McAfee Knob, the average number of cars is higher, with an average of almost 45 vehicles on Saturday mornings rising to 70 cars on average for Saturday afternoons. Sunday averages follow a similar pattern, but with slightly lower numbers.
Figure 10: Average Number of Cars by Time of Day on Weekend Days
Source: Volpe Center analysis of Ridgerunner report data Note: Morning is defined as 12:00 AM to 11:59 AM; afternoon is defined as 12:00 PM to 3:59 PM; and evening is defined as 4:00 PM to 11:59 PM.
To identify more specific trends in the parking lot usage data and to better understand the typical busy day at the trailheads, the project team identified the 85th percentile of parking lot usage by time of year and time of day. The 85th percentile day represents a typical busy day and is a methodology used commonly used in visitor use management analysis. For the purposes of the transit feasibility study, the 85th percentile is a useful metric for the type of day where shuttle service would be desirable, so understanding the intensity of parking lot usage and demand on these types of days is instructive for designing the potential shuttle service.
Figure 11 shows the number of cars present in the McAfee Knob parking lot on weekend days at the 85th percentile by time of day and month of the year. Figure 12 shows the same data, but for Dragon’s Tooth. Based on input from the NPS and project stakeholder group and with data limitations in mind, data were grouped into three two-month periods (April and May; June and July; and September and October) to reflect seasonal variation in parking lot usage demand. These two-month periods are designed to be representative of periods of higher observed parking lot demand. Analysis was focused on weekend days, as weekends experience the greatest demand when compared with weekdays.
Across all times of year at both trailhead lots, the period between 9:00 AM and 1:00 PM experiences the sharpest increase in usage on weekend days. After 1:00 PM, the lots tend to remain at high levels of usage for the remainder of the day, which may be attributable to some visitors beginning their hikes early in the day and continuing throughout the day.
0
10
20
30
40
50
60
70
80
90
Saturday Sunday Saturday Sunday
Dragon's Tooth Dragon's Tooth McAfee Knob McAfee Knob
Num
ber
of C
ars
Morning Afternoon Evening
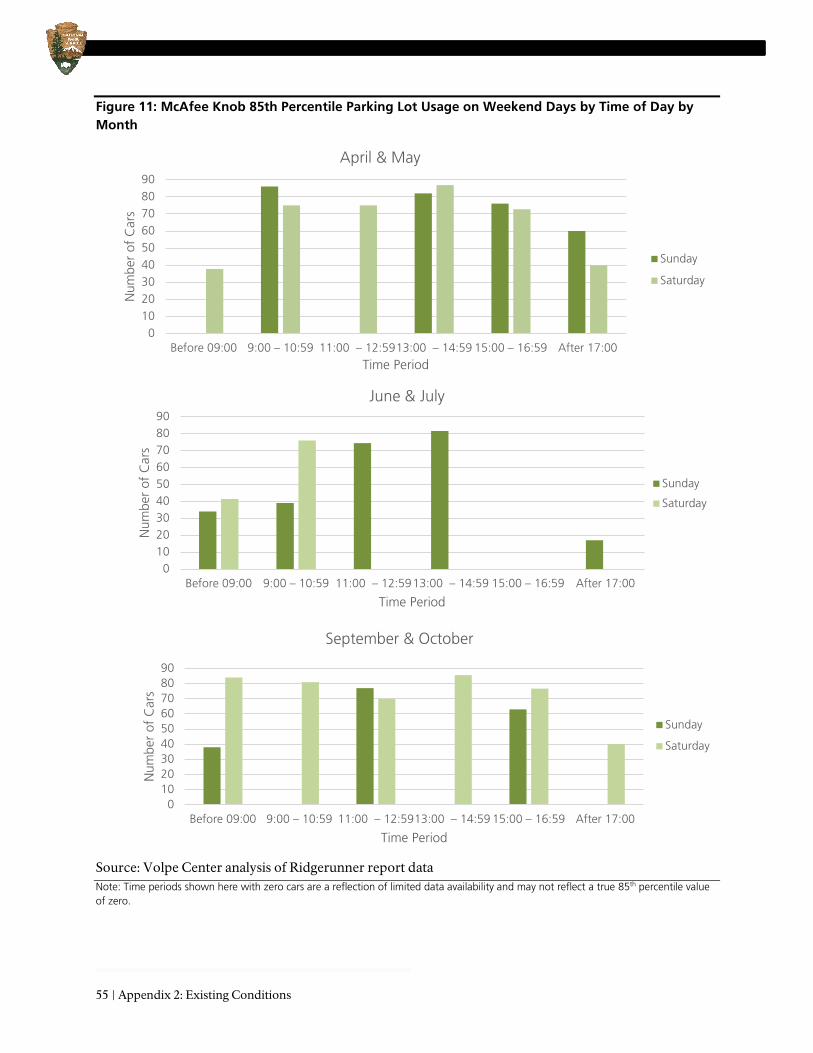
55 | Appendix 2: Existing Conditions
Figure 11: McAfee Knob 85th Percentile Parking Lot Usage on Weekend Days by Time of Day by Month
Source: Volpe Center analysis of Ridgerunner report data Note: Time periods shown here with zero cars are a reflection of limited data availability and may not reflect a true 85th percentile value of zero.
0102030405060708090
Before 09:00 9:00 – 10:59 11:00 – 12:5913:00 – 14:59 15:00 – 16:59 After 17:00
Num
ber
of C
ars
Time Period
April & May
Sunday
Saturday
0102030405060708090
Before 09:00 9:00 – 10:59 11:00 – 12:5913:00 – 14:59 15:00 – 16:59 After 17:00
Num
ber
of C
ars
Time Period
June & July
Sunday
Saturday
0102030405060708090
Before 09:00 9:00 – 10:59 11:00 – 12:5913:00 – 14:59 15:00 – 16:59 After 17:00
Num
ber
of C
ars
Time Period
September & October
Sunday
Saturday

September 2020 | 56
Figure 12: Dragon's Tooth 85th Percentile Parking Lot Usage on Weekend Days by Time of Day by Month
Source: Volpe Center analysis of Ridgerunner report data Note: Time periods shown here with zero cars are a reflection of limited data availability and may not reflect a true 85th percentile value of zero.
0102030405060708090
Before 09:00 9:00 – 10:59 11:00 – 12:59 13:00 – 14:59 15:00 – 16:59 After 17:00
Num
ber
of C
ars
Time Period
April & May
Sunday
Saturday
0102030405060708090
Before 09:00 9:00 – 10:59 11:00 – 12:59 13:00 – 14:59 15:00 – 16:59 After 17:00
Num
ber
of C
ars
Time Period
June & July
Sunday
Saturday
0102030405060708090
Before 09:00 9:00 – 10:59 11:00 – 12:59 13:00 – 14:59 15:00 – 16:59 After 17:00
Num
ber
of C
ars
Time Period
September & October
Sunday
Saturday
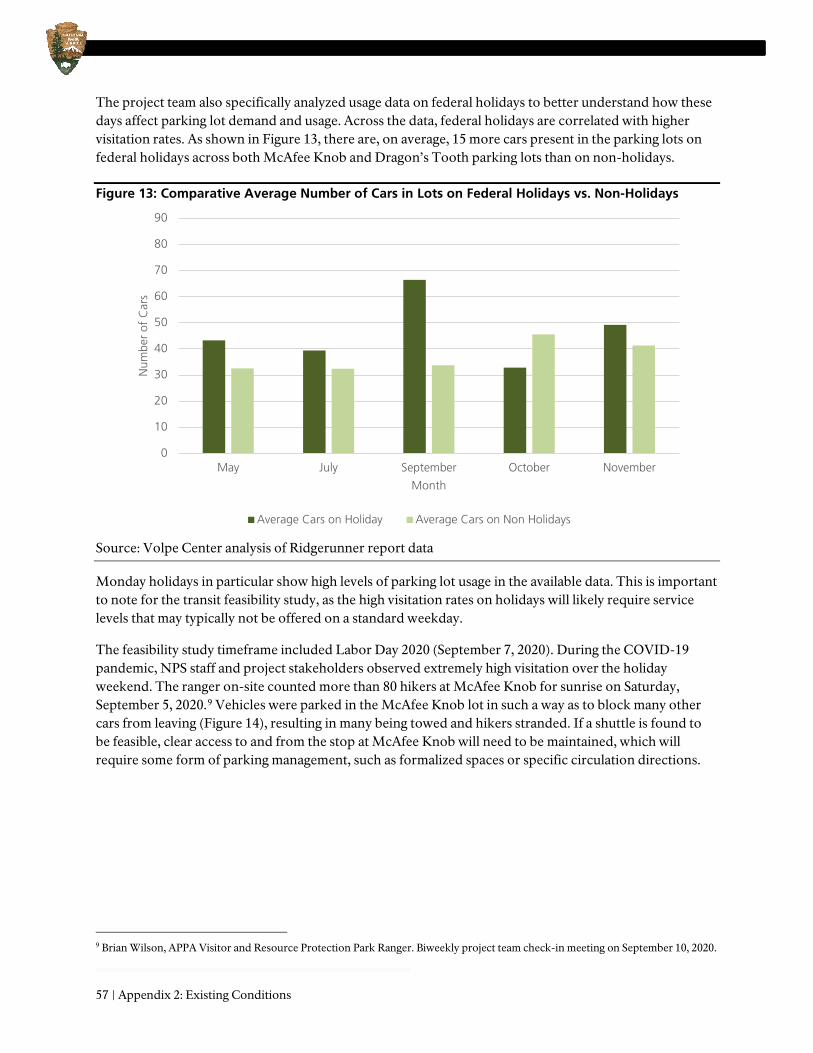
57 | Appendix 2: Existing Conditions
The project team also specifically analyzed usage data on federal holidays to better understand how these days affect parking lot demand and usage. Across the data, federal holidays are correlated with higher visitation rates. As shown in Figure 13, there are, on average, 15 more cars present in the parking lots on federal holidays across both McAfee Knob and Dragon’s Tooth parking lots than on non-holidays.
Figure 13: Comparative Average Number of Cars in Lots on Federal Holidays vs. Non-Holidays
Source: Volpe Center analysis of Ridgerunner report data
Monday holidays in particular show high levels of parking lot usage in the available data. This is important to note for the transit feasibility study, as the high visitation rates on holidays will likely require service levels that may typically not be offered on a standard weekday.
The feasibility study timeframe included Labor Day 2020 (September 7, 2020). During the COVID-19 pandemic, NPS staff and project stakeholders observed extremely high visitation over the holiday weekend. The ranger on-site counted more than 80 hikers at McAfee Knob for sunrise on Saturday, September 5, 2020.9 Vehicles were parked in the McAfee Knob lot in such a way as to block many other cars from leaving (Figure 14), resulting in many being towed and hikers stranded. If a shuttle is found to be feasible, clear access to and from the stop at McAfee Knob will need to be maintained, which will require some form of parking management, such as formalized spaces or specific circulation directions.
9 Brian Wilson, APPA Visitor and Resource Protection Park Ranger. Biweekly project team check-in meeting on September 10, 2020.
0
10
20
30
40
50
60
70
80
90
May July September October November
Num
ber
of C
ars
Month
Average Cars on Holiday Average Cars on Non Holidays
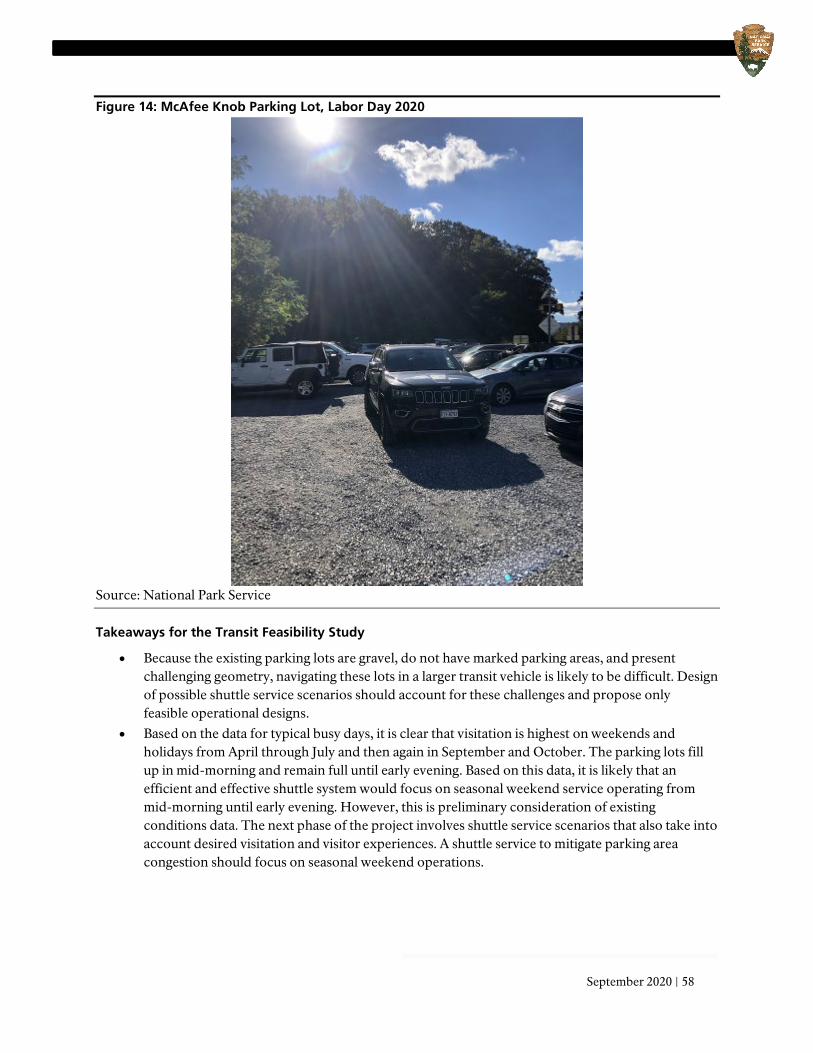
September 2020 | 58
Figure 14: McAfee Knob Parking Lot, Labor Day 2020
Source: National Park Service
Takeaways for the Transit Feasibility Study
• Because the existing parking lots are gravel, do not have marked parking areas, and present challenging geometry, navigating these lots in a larger transit vehicle is likely to be difficult. Design of possible shuttle service scenarios should account for these challenges and propose only feasible operational designs.
• Based on the data for typical busy days, it is clear that visitation is highest on weekends and holidays from April through July and then again in September and October. The parking lots fill up in mid-morning and remain full until early evening. Based on this data, it is likely that an efficient and effective shuttle system would focus on seasonal weekend service operating from mid-morning until early evening. However, this is preliminary consideration of existing conditions data. The next phase of the project involves shuttle service scenarios that also take into account desired visitation and visitor experiences. A shuttle service to mitigate parking area congestion should focus on seasonal weekend operations.
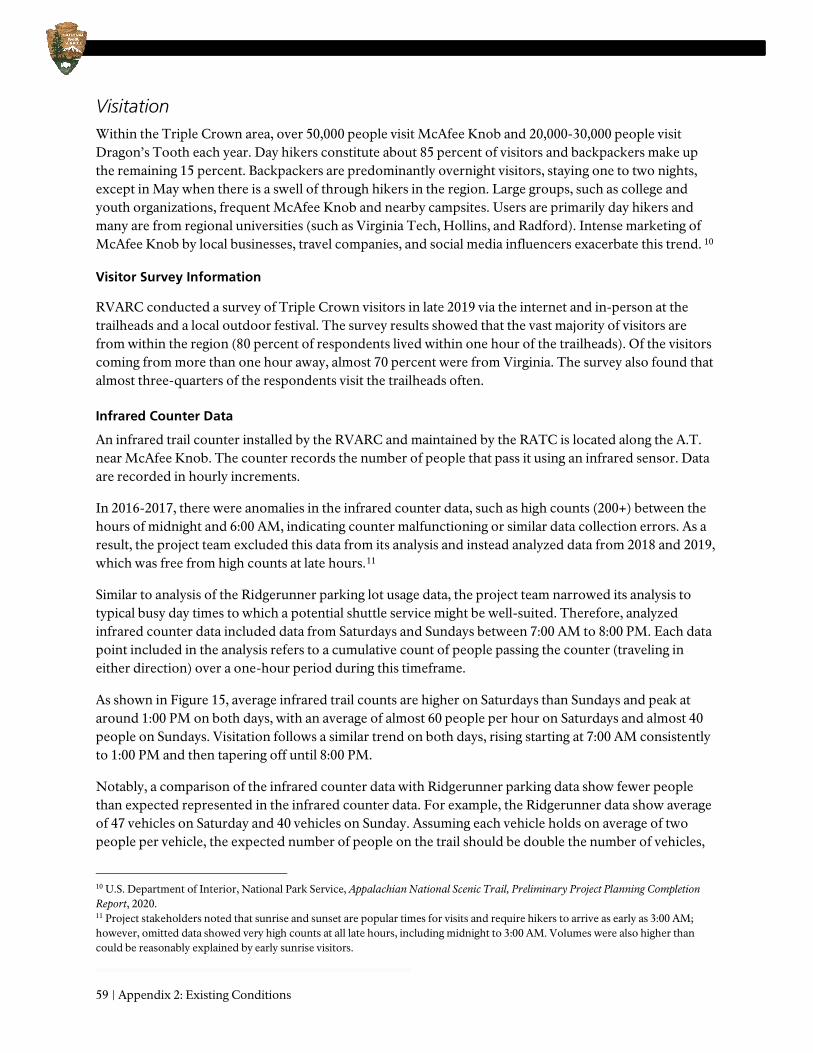
59 | Appendix 2: Existing Conditions
Visitation Within the Triple Crown area, over 50,000 people visit McAfee Knob and 20,000-30,000 people visit Dragon’s Tooth each year. Day hikers constitute about 85 percent of visitors and backpackers make up the remaining 15 percent. Backpackers are predominantly overnight visitors, staying one to two nights, except in May when there is a swell of through hikers in the region. Large groups, such as college and youth organizations, frequent McAfee Knob and nearby campsites. Users are primarily day hikers and many are from regional universities (such as Virginia Tech, Hollins, and Radford). Intense marketing of McAfee Knob by local businesses, travel companies, and social media influencers exacerbate this trend. 10
Visitor Survey Information
RVARC conducted a survey of Triple Crown visitors in late 2019 via the internet and in-person at the trailheads and a local outdoor festival. The survey results showed that the vast majority of visitors are from within the region (80 percent of respondents lived within one hour of the trailheads). Of the visitors coming from more than one hour away, almost 70 percent were from Virginia. The survey also found that almost three-quarters of the respondents visit the trailheads often.
Infrared Counter Data
An infrared trail counter installed by the RVARC and maintained by the RATC is located along the A.T. near McAfee Knob. The counter records the number of people that pass it using an infrared sensor. Data are recorded in hourly increments.
In 2016-2017, there were anomalies in the infrared counter data, such as high counts (200+) between the hours of midnight and 6:00 AM, indicating counter malfunctioning or similar data collection errors. As a result, the project team excluded this data from its analysis and instead analyzed data from 2018 and 2019, which was free from high counts at late hours.11
Similar to analysis of the Ridgerunner parking lot usage data, the project team narrowed its analysis to typical busy day times to which a potential shuttle service might be well-suited. Therefore, analyzed infrared counter data included data from Saturdays and Sundays between 7:00 AM to 8:00 PM. Each data point included in the analysis refers to a cumulative count of people passing the counter (traveling in either direction) over a one-hour period during this timeframe.
As shown in Figure 15, average infrared trail counts are higher on Saturdays than Sundays and peak at around 1:00 PM on both days, with an average of almost 60 people per hour on Saturdays and almost 40 people on Sundays. Visitation follows a similar trend on both days, rising starting at 7:00 AM consistently to 1:00 PM and then tapering off until 8:00 PM.
Notably, a comparison of the infrared counter data with Ridgerunner parking data show fewer people than expected represented in the infrared counter data. For example, the Ridgerunner data show average of 47 vehicles on Saturday and 40 vehicles on Sunday. Assuming each vehicle holds on average of two people per vehicle, the expected number of people on the trail should be double the number of vehicles,
10 U.S. Department of Interior, National Park Service, Appalachian National Scenic Trail, Preliminary Project Planning Completion Report, 2020. 11 Project stakeholders noted that sunrise and sunset are popular times for visits and require hikers to arrive as early as 3:00 AM; however, omitted data showed very high counts at all late hours, including midnight to 3:00 AM. Volumes were also higher than could be reasonably explained by early sunrise visitors.
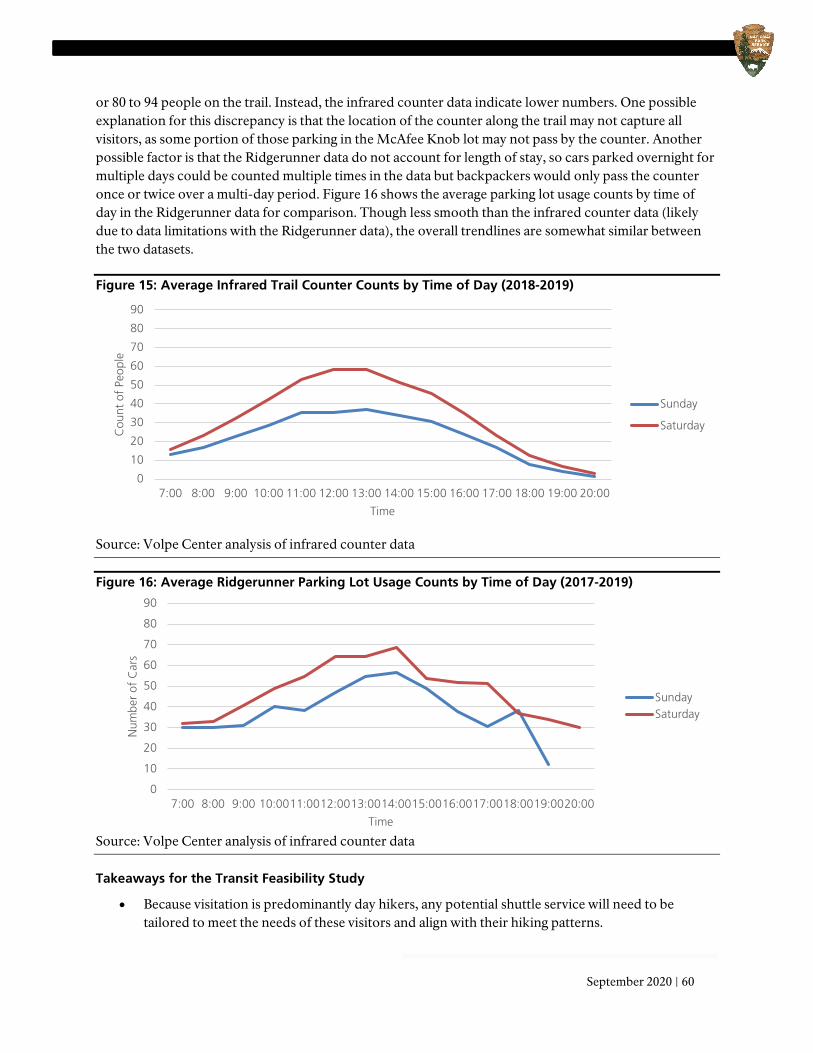
September 2020 | 60
or 80 to 94 people on the trail. Instead, the infrared counter data indicate lower numbers. One possible explanation for this discrepancy is that the location of the counter along the trail may not capture all visitors, as some portion of those parking in the McAfee Knob lot may not pass by the counter. Another possible factor is that the Ridgerunner data do not account for length of stay, so cars parked overnight for multiple days could be counted multiple times in the data but backpackers would only pass the counter once or twice over a multi-day period. Figure 16 shows the average parking lot usage counts by time of day in the Ridgerunner data for comparison. Though less smooth than the infrared counter data (likely due to data limitations with the Ridgerunner data), the overall trendlines are somewhat similar between the two datasets.
Figure 15: Average Infrared Trail Counter Counts by Time of Day (2018-2019)
Source: Volpe Center analysis of infrared counter data
Figure 16: Average Ridgerunner Parking Lot Usage Counts by Time of Day (2017-2019)
Source: Volpe Center analysis of infrared counter data
Takeaways for the Transit Feasibility Study
• Because visitation is predominantly day hikers, any potential shuttle service will need to be tailored to meet the needs of these visitors and align with their hiking patterns.
0
10
20
30
40
50
60
70
80
90
7:00 8:00 9:00 10:00 11:00 12:00 13:00 14:00 15:00 16:00 17:00 18:00 19:00 20:00
Cou
nt o
f Pe
ople
Time
Sunday
Saturday
0
10
20
30
40
50
60
70
80
90
7:00 8:00 9:00 10:0011:0012:0013:0014:0015:0016:0017:0018:0019:0020:00
Num
ber
of C
ars
Time
SundaySaturday
61 | Appendix 2: Existing Conditions
• The vast majority of visitors are local and hike in the area often. Identifying bus stops convenient for visitors within the region can help draw them to the service; making the experience pleasant can help them become consistent riders. Local marketing and communications will be vital to attracting local hikers.
• The seasonality of visitation and heavy use on weekends (including Fridays) indicates that shuttle service may be limited to these days of week and times of year to keep operating cost low.
Conclusion The Triple Crown trailheads of McAfee Knob, Dragon’s Tooth, and Tinker Cliffs draw tens of thousands of visitors annually. Visitation continues to rise, increasing demand for parking and creating roadway and parking lot congestion and safety issues. From 2017 to 2019, the McAfee Knob parking lot was documented to be at or over capacity nearly 10 percent of the time observations occurred. Dragon’s Tooth exceeded capacity about 6 percent of time observations occurred in the same period. It is clear from the existing conditions data that the parking congestion at the Triple Crown trailheads at current visitation levels reduces the quality of the visitor experience, impacts staff resources (e.g., ticketing and towing errant vehicles), and creates safety issues. The construction of the pedestrian bridge at the McAfee Knob trailhead provides a good opportunity to pilot shuttle service. The analysis presented here will be used to inform the development of potential shuttle service scenarios in the next phase of this transit feasibility study process.
National Park Service U.S. Department of the Interior Appalachian National Scenic Trail Roanoke, Virginia
October 2020
Appalachian National Scenic Trail, Triple Crown Area Appendix 3: Stakeholder Outreach
63 | Appendix 3: Stakeholder Outreach
Table of Contents
Introduction ....................................................................................................... 64 Project Purpose .............................................................................................................. 64
Methodology ..................................................................................................... 64
Themes from Stakeholder Outreach ................................................................ 65 Expectations of the Visitor Experience ............................................................................. 65 Trailhead Parking Constraints .......................................................................................... 65 Route Design Opportunities and Challenges .................................................................... 65 Service Design Opportunities and Challenges .................................................................. 66 Visitor Information ......................................................................................................... 66
Risks and Barriers for Transit Feasibility .......................................................... 67
Key Takeaways for the Transit Feasibility Study ............................................ 68
Conclusion .......................................................................................................... 68
List of Stakeholders Interviewed ...................................................................... 69
October 2020 | 64
Introduction This memorandum presents the findings of the U.S. Department of Transportation’s (USDOT) Volpe Center’s analysis of available parking and visitation data on the Triple Crown area of the Appalachian National Scenic Trail (A.T.) in southwest Virginia. This memorandum is part of a larger project being undertaken by the Volpe Center’s project team for the National Park Service (NPS) to assess the feasibility of a possible shuttle service for the Triple Crown’s trailheads, as described in more detail below. The analysis presented in this memo and related memos produced as a part of this project is designed to inform decision-making on future visitor use management strategies and transportation investments related to the McAfee Knob, Dragon’s Tooth and Tinker Cliffs trailheads.
Project Purpose The purpose of this project is to examine the feasibility of operating a shuttle service to one or more of the trailheads that make up the Triple Crown of the Appalachian National Scenic Trail in Virginia. This project is being done in coordination with a Visitor Use Management (VUM) Plan being developed by the NPS Denver Service Center (DSC) Planning Division.
This project examines the extent to which shuttle service could address parking lot capacity challenges, help mitigate existing trail congestion issues, and improve safety for trail users. The information presented in this memorandum will be used in analyses of possible shuttle service scenarios and evaluation of potential long-term shuttle service as a part of the larger VUM Plan. This additional analysis will be presented in a future memorandum. This memorandum on stakeholder outreach is the third in a series building to the transit feasibility final report.
Methodology Stakeholders were identified based upon conversations with NPS staff and project partners. Individual contacts were identified through conversations with the Roanoke-Allegheny Valley Regional Commission (RVARC), which had previously been convening stakeholders as part of a shuttle subcommittee related to the construction of the VA-311 pedestrian bridge.
Due to the COVID-19 pandemic, stakeholder outreach calls were conducted virtually using videoconference software or via conference call. To facilitate dialogue, identified stakeholders were grouped into the following topic areas so the project team could gather information related to each topic efficiently:
• Public transit service providers, • Private transit service providers, • Local government partners, • Regional transportation demand management, • Economic development/tourism, • State government partners, and • Local colleges and universities.
Using these groupings, the project team held seven stakeholder calls between September 15, 2020, and September 21, 2020. Prior to the stakeholder calls, the project team drafted tailored discussion questions for each topic area, which were reviewed and approved by the NPS and project partners prior to the
65 | Appendix 3: Stakeholder Outreach
stakeholder calls. A full list of the stakeholders interviewed for this effort are included at the end of this memo.
Themes from Stakeholder Outreach This section identifies broad themes identified through the seven stakeholder calls. These themes were synthesized by the project team through an analysis of call notes and internal discussions. The themes discussed in this section are applicable to the design of potential shuttle service scenarios. The project team will incorporate them into the shuttle service scenarios to be discussed in the final report for this project.
Expectations of the Visitor Experience Stakeholders identified that regional visitors and frequent hikers in the region have expectations related to the visitor experience that may be challenging to meet with shuttle service. In general, the region has relatively low traffic congestion and residents do not often encounter travel delays. As a result, residents and visitors alike are accustomed to relying on car trips to meet their needs and transit usage is low regionally. Additionally, the convenience of car trips, free parking, and the ability to start and end trips without relying on external schedules were all cited as visitor expectations that may present challenges to a shuttle service. Some stakeholders expressed doubt that visitors would park at a park-and-ride lot to catch a shuttle and would instead drive directly to the trailhead if the trailhead parking lot remained open. At the same time, the visitor experience is negatively impacted when the parking areas are full and vehicles are towed, which is fairly common. Even on days where parking congestion was not a primary problem, stakeholders cited complaints that parking was not uniform and orderly due to a lack pavement markings or signage to guide drivers, which negatively affected visitor experience. VDOT also identified that the vast majority of public comments received on the VA-311 pedestrian bridge project expressed concern that the bridge does not address the parking congestion issues present at the McAfee Knob parking lot.
Trailhead Parking Constraints Stakeholders expressed concerns about trailhead conditions and the ability of the existing trailhead parking lots to support a shuttle service. Stakeholders stated clearly that they did not believe a full-size bus would feasibly be able to successfully turn around in the existing trailhead parking lots. They also cited safety concerns related to larger vehicles safely entering and exiting the McAfee Knob trailhead parking lot given its location off of a curve along VA-311, which has a 55 mph speed limit. Some stakeholders also wondered if parking spaces would have to be eliminated to facilitate vehicle turnaround, even for a smaller shuttle bus. Some stakeholders also expressed concerns that a shuttle service would increase visitation to the trailheads, further exacerbating high usage trends and resource degradation.
Route Design Opportunities and Challenges Stakeholders identified a range of considerations—both in terms of opportunities and barriers—to incorporate into the design of a potential shuttle service route (e.g., roads traveled and bus stop locations). For example, stakeholders identified possible stop locations for a shuttle route, including the Orange Market park-and-ride lot at the junction of Routes 311 and 419, downtown Salem, and nearby breweries and restaurants. The Catawba Sustainability Center, the Catawba Center and the Catawba United Methodist Church located along VA-779 were also identified as potential park-and-ride locations, depending upon the willingness of these sites to allow parking and shuttle operations. Stakeholders from VDOT confirmed the park-and-ride lots at Exit 140 of I-81 and the junction of Routes 311 and 419 are

October 2020 | 66
good options because the high use periods for commuters are generally opposite of recreational uses. At the same time, establishing many shuttle stops increases the travel time of the bus, which visitors may not like. The route design needs to balance high coverage/many stops with travel time efficiency.
Stakeholders also identified that some funding opportunities, such as Virginia Department of Rail and Public Transportation (DRPT) funding, would require the shuttle to provide connections to non-recreation destinations in order to be eligible. Some stakeholders also expressed concern that the Tinker Cliffs trailhead is too far away to make a successful shuttle route due to the time it would add to a roundtrip loop.
Service Design Opportunities and Challenges Stakeholders also identified a range of considerations related to shuttle service design (e.g., how frequently the bus comes and how many buses operate on the route at any given time). Some stakeholders expressed concern that a shuttle service that targeted busy periods and was not consistent and easy to understand would create a marketing challenge and be difficult for visitors to understand. However, running at a high level of service during low demand would be expensive without much benefit. To reduce congestion on days with anticipated high visitation, such as weekends or public holidays, some stakeholders suggested a policy to fully close off the parking lots and rely exclusively on shuttle service. Stakeholders also expressed that shuttle headways would need to be minimized for visitor convenience. This is due to the lack of restroom facilities at trailheads, as well as the observation of some stakeholders that local riders may not be accustomed to waiting for public transit for periods that may be 20 minutes or more. Some stakeholders also expressed interest in the shuttle service being able to meet specific hiking needs, such as popular sunrise hikes or hikers who bring their dogs.
Visitor Information Stakeholders expressed that reliable visitor information and clear, consistent messaging to visitors would be necessary to facilitate use of a shuttle service. In particular, stakeholders expressed that the use of variable message signs (VMS),1 geolocation services, and visitor information websites would be critical for the following reasons:
• Educate visitors about the shuttle service, • Set visitor expectations, • Provide visitors with an overview of options for alternative hikes to distribute hiking demand, • Check parking lot occupancy before arrival, and • Provide a quality visitor experience.
VDOT stakeholders confirmed the agency can permit the use of VMS signs on a temporary, event-based basis. Placement of the signs is vital to inform drivers of the park-and-ride option before they get to the trailhead lots. However, the mountainous terrain leading to the trailhead lots may make it difficult to place the signs. Additionally, the criteria for placing VMS along the Interstate are more stringent than criteria for having them along state routes, limiting their use on the highest volume road near the trailheads.
1 Also referred to as portable changeable message signs (PCMS).
67 | Appendix 3: Stakeholder Outreach
Risks and Barriers for Transit Feasibility In addition to the themes identified from the stakeholder interviews, stakeholders also identified a number of risks and barriers applicable to the success of a potential Triple Crown shuttle service. These risks and barriers are identified here for consideration by the NPS and project partners as a part of the broader VUM planning process. Identified risks and barriers include the following:
• Many stakeholders expressed concern with identifying an operator for the potential shuttle service. Because the COVID-19 pandemic has severely impacted public sector transit agency budgets, it is unlikely that a public transit agency would be well-positioned to operate the service. Additionally, the likelihood that the shuttle service will require smaller-size vehicles due to constraints associated with the trailhead parking lots further suggests a public agency with a fleet of larger vehicles would not be well-suited to the service. While private sector or nonprofit operator options may exist, further discussions and negotiations would be required to determine if such an option is feasible.
• Funding for the shuttle is also a central concern among stakeholders. Discussion of funding included both the initial costs of procuring shuttle vehicles and establishing a shuttle route (including stop infrastructure), as well as ongoing vehicle maintenance and operational costs, both of which present specific challenges. While several stakeholder groups expressed a willingness to continue discussions among many partners about possible funding arrangements, the COVID-19 pandemic presents additional financial challenges for many stakeholders and further negotiations would be required to reach an agreement among the many potential funding partners.
• Catawba Sustainability Center (CSC) staff expressed concerns that placement of a shuttle stop at their parking lot could potentially disrupt the center’s daily operations. As a working farm with livestock, frequent shuttle service could create additional disturbances to the animals and farming needs could disrupt the route at times.2
• Additional locations identified as possible park-and-ride or shuttle stop locations may require special negotiations for parking lot usage or shuttle stop placement. These locations include Catawba Methodist Church, the Catawba Community Center, and private businesses, such as breweries and restaurants, as well as downtown Salem.
• Several stakeholders highlighted the fact that the Roanoke metropolitan area is heavily car-dependent. Due to this fact, public acceptance of a shuttle service may initially be limited. Additional measures that directly target parking lot congestion issues, such as limiting access to parking lots as a means to encourage shuttle usage, may not be well understood or well received by the general public; however, some stakeholders expressed that such measures would possibly be necessary to encourage behavior change among visitors.
• The repercussions of the COVID-19 pandemic will continue to influence travel behavior and expectations in the region. In the near-term, this will likely impact the general public’s willingness to use public transit. In the medium- to long-term, there may expectations that shared vehicles (such as shuttles and buses) provide more personal space, effective ventilation systems, and windows that facilitate air circulation.
2 A new trail connection is planned to connect the CSC parking lot with the McAfee Knob trail and the A.T. As a result, shuttle service may not be required at the CSC parking lot.
October 2020 | 68
Key Takeaways for the Transit Feasibility Study In consultation with NPS staff and project partners, the project team will apply the following key takeaways to develop a set of up to three shuttle service scenarios to evaluate in the final report for this project. These key takeaways will require evaluation by NPS staff and project partners in order to provide the project team with the priorities required to develop practical and useful service scenarios for further consideration.
• All shuttle service scenarios will need to reflect the identified constraints associated with the trailhead parking lots. Specifically, the scenarios will need to reflect that a smaller shuttle bus rather than a larger transit vehicle is likely the only feasible vehicle for the potential shuttle services.
• Additional discussions with and input from NPS staff and project partners must inform the priorities of route design and service design. The interviewed stakeholders presented a range of possibilities from narrowly-tailored service exclusively from parking locations to the trailhead parking lots to more expansive service options including service to local destinations, such as local businesses; however, the project team is scoped to develop a maximum of three shuttle scenarios. .
• Assumptions related to the visitor experience will need to be clearly articulated and agreed upon among NPS staff and project partners for each shuttle service scenario. For example, the project team needs to know what parking conditions will be assumed under each scenario, and what education and enforcement measures should be assumed to encourage and facilitate shuttle usage.
• To the extent possible costs can be evaluated as a part of the transit feasibility study (given limited data and information) and business models can be assessed, the scenarios should account for the likelihood that the operator will be a private vendor and not a public transit agency.
Conclusion Stakeholder outreach conducted as part of this transit feasibility study identified five key themes for the project team to carry forward into the development of the shuttle service scenarios. The project team will engage with NPS staff and project partners to incorporate these themes into up to three shuttle service scenarios that will be evaluated and documented in a final memorandum for this project.

69 | Appendix 3: Stakeholder Outreach
List of Stakeholders Interviewed The table below lists the organizations and stakeholders interviewed as a part of the outreach effort.
Table 1: List of Stakeholders Interviewed Organization Contact Topic Area
RideSource Bryan Johnson Private transit service provider
Roanoke College – Campus Recreation Patricia Lynn Local colleges and universities
Roanoke County Community Development Megan Cronise Local government partner
Roanoke County Parks & Recreation Lindsay Webb Local government partner
Roanoke Outside Pete Eshelman Economic development/tourism
Roanoke Regional Chamber of Commerce Joyce Waugh Economic development/tourism
RVARC – RIDE Solutions Program Jeremy Holmes Regional transportation demand management
Valley Metro Dorian Allen Public transit service provider
VDOT Traffic Engineering Brett Randolph State government partner
VDOT Transportation Planning Michael Gray State government partner
Virginia Tech – Catawba Sustainability Center Adam Taylor Local colleges and universities
Virginia Tech – Venture Out Ken Gates Local colleges and universities
Virginia Tourism Corporation Kathryn Connor Economic development/tourism
Visit Virginia's Blue Ridge Catherine Fox Economic development/tourism

As the nation’s principal conservation agency, the Department of the Interior has the responsibility for most of our nationally owned public lands and natural resources. This includes fostering sound use of our land and water resources; protecting our fish, wildlife, and biological diversity; preserving the environmental and cultural values of our parks and historic places; and providing for the enjoyment of life through outdoor recreation. The department assesses our energy and mineral resources and works to ensure that their development is in the best interests of all our people by encouraging stewardship and citizen participation in their care. The department also has a major responsibility for American Indian reservation communities and for people who live in island territories under U.S. administration.
NPS Report # 632/175034/February 2021