Embed Size (px)
Citation preview
The 0.5-2.22µm Scattered Light Spectrum of the Disk Around
TW Hya: Detection of a Partially Filled Disk Gap at 80 AU1
John H.Debes1, Hannah Jang-Condell2,Alycia J. Weinberger3, Aki Roberge4, Glenn
Schneider5
ABSTRACT
We present a 0.5-2.2 µm scattered light spectrum of the circumstellar disk
around TW Hya from a combination of spatially resolved HST STIS spectroscopy
and NICMOS coronagraphic images of the disk. We investigate the morphology
of the disk at distances > 40 AU over this wide range of wavelengths, and identify
the presence of a depression in surface brightness at ∼80 AU that could be caused
by a gap in the disk. Additionally, we quantify the surface brightness, azimuthal
symmetry, and spectral character of the disk as a function of radius. Our analysis
shows that the scattering efficiency of the dust is largely neutral to blue over the
observed wavelengths. We model the disk as a steady α-disk with an ad hoc
gap structure. The thermal properties of the disk are self-consistently calculated
using a three-dimensional radiative transfer code that uses ray-tracing to model
the heating of the disk interior and scattered light images. We find a good
fit to the data over a wide range of distances from the star if we use a model
disk with a partially filled gap of 30% depth at 80 AU and with a self-similar
truncation knee at 100 AU. The origin of the gap is unclear, but it could arise
from a transition in the nature of the disk’s dust composition or the presence of
a planetary companion. Based on scalings to previous hydrodynamic simulations
of gap opening criteria for embedded proto-planets, we estimate that a planetary
companion forming the gap could have a mass between 6-28 M⊕.
Subject headings: Stars:individual (TW Hya) — Protoplanetary Disks — Planet-
disk interactions — Radiative transfer
1Space Telescope Science Institute, Baltimore, MD 21218
2University of Wyoming, Laramie, WY 82071
3Department of Terrestrial Magnetism, Carnegie Institution of Washington, Washington, D.C. 20015
4Goddard Space Flight Center, Greenbelt, MD 20771
5Steward Observatory, The University of Arizona, Tuscon, AZ 85721
– 2 –
1. Introduction
TW Hya is the closest example of a star with a young, gas-rich protoplanetary disk. As
such, it is an ideal target to study how disk evolution is coupled to planet formation because
the disk can be observed at high spatial resolution and with great sensitivity. First detected
from its infrared excess (Rucinski & Krautter 1983), the disk emits strongly at wavelengths
longer than 3 µm with a peak in its spectral energy distribution between 10 and 100 µm
(Weinberger et al. 2002).
TW Hya may not be typical for its age. It is part of the eponymously named TW
Hydrae Association, a collection of about two dozen stars, amongst which it sports the most
massive, gas-rich disk of the group. TW Hya is 54 ± 6 pc away from Earth in the new
van Leeuwen (2007) Hipparcos catalog. The age of the TW Hya association is found from
a variety of studies of the ensemble of stars, including measurements of the dynamics (8.3
± 0.3 Myr) (de la Reza et al. 2006), lithium depletion boundary (12 ± 8 Myr) (Mentuch
et al. 2008), and these in combination with pre-main sequence tracks (10+10−7 Myr) (Navascues
2006). The TW Hya stars may not be coeval, and TW Hya could even be at the young end
of their age distribution (Weinberger et al. 2013). Associations just a bit older than TW
Hya, such as β Pic, have no optically thick, massive protoplanetary disks.
Despite reservations about its representativeness, intensive studies at nearly every wave-
length and spectral resolution have been used to try to understand the TW Hya disk’s struc-
ture and composition. We summarize some of the main findings here. Resolved emission at
7mm indicated the central disk is mostly clear inside of 4 AU (Hughes et al. 2007). However,
2 µm emission resolved by the Keck Interferometer show that an optically thin dust disk
comprised of small grains comes to within 0.06 AU of the star (Akeson et al. 2011). The
spectral energy distribution, particularly the large amount of emission at submm through
cm wavelengths (Weintraub et al. 1989; Wilner et al. 2000; Weinberger et al. 2002; Wilner
et al. 2005; Andrews et al. 2012a) indicates substantial grain growth to at least cm sizes.
Resolved CO line maps show the disk in Keplerian rotation with an inclination of 7 ± 1
beyond 50 AU (Qi et al. 2004; Andrews et al. 2012a; Hughes et al. 2011a).
The disk has been spatially resolved in scattered light in the visible and near-infrared
(Krist et al. 2000; Weinberger et al. 2002; Apai et al. 2004; Roberge et al. 2005). These show
that the optically thick disk extends to at least 280 AU. They also show asymmetries and
1Based on observations made with the NASA/ESA Hubble Space Telescope, obtained at the Space
Telescope Science Institute, which is operated by the Association of Universities for Research in Astronomy,
Inc., under NASA contract NAS 5-26555. These observations are associated with program #’s 10167, 8624,
7226, and 7233.
– 3 –
changes in surface brightness of the disk in the inner 150 AU. The presence of both small
and large grains throughout the 4 AU - 200 AU disk and the presence of small grains in
a region where they should quickly be removed, suggests that they are being regenerated
through collisions at multiple locations.
The disk chemistry has also been probed in a spatially resolved manner in submm
lines (Qi et al. 2006; Qi et al. 2008). For example, there appears to be ongoing deuterium
fractionation in the outer disk, and that suggests pristine nebular material is not preserved,
as is often assumed for comets.
We have undertaken a multiwavelength visible to near-infrared study of scattered light
from the disk in order to address the structure and composition of the TW Hya disk. Ob-
servations in the visible to near-infrared can detect ices and silicates due to their broad
absorption features and organics due to their red slopes. These types of observations are
routinely applied to comets and Kuiper Belt objects, which are thought to be the planetes-
imal remnants of circumstellar disks. In addition, the spectral scattering efficiency of disk
dust grains can constrain their grain sizes at the disk surface. The mixture of dust grains
should reflect a combination of vertical mixing from the midplane (where large grains are
presumably formed), radial transport, and collisions. Finally but by no means least, we wish
to understand the vertical structure of the disk and whether it shows evidence for forming
planets.
2. Observations
We took coronagraphic images with the F171M, F180M, F204M, and F222M filters
(central λ=1.71, 1.80, 2.04, and 2.22 µm respectively) on 09 May 2005 with the NICMOS
camera 2 for TW Hya and the PSF reference star, CD-432742 as part of Program GO 10167.
The observations include direct images of both stars outside the coronagraphic hole with
short exposures for point source photometry, as well as longer exposures for coronagraphic
high contrast imaging. The instrumentally calibrated and reduced images discussed in this
paper were created from the raw NICMOS multiaccum exposures following the processing
methodolgy described by §3 of Schneider et al. (2005) and references therein.
For photometric analysis, each calibrated direct image was used to determine the total
photometry of the star and empirically determine the scaling ratios between TW Hya and the
PSF reference in each filter band. The three images for each star in each filter were located
at different positions on the detector. We used a median combination of the three dither
points to create a final image of each star to derive a ratio for scaling and for photometry of
– 4 –
TW Hya. We used a 16.5 pixel radius circular aperture to determine the photometry. The
background in the images is zero, so no background annulus was used. The individual dither
points were used to get a rough estimate of the uncertainty in the ratios and photometry.
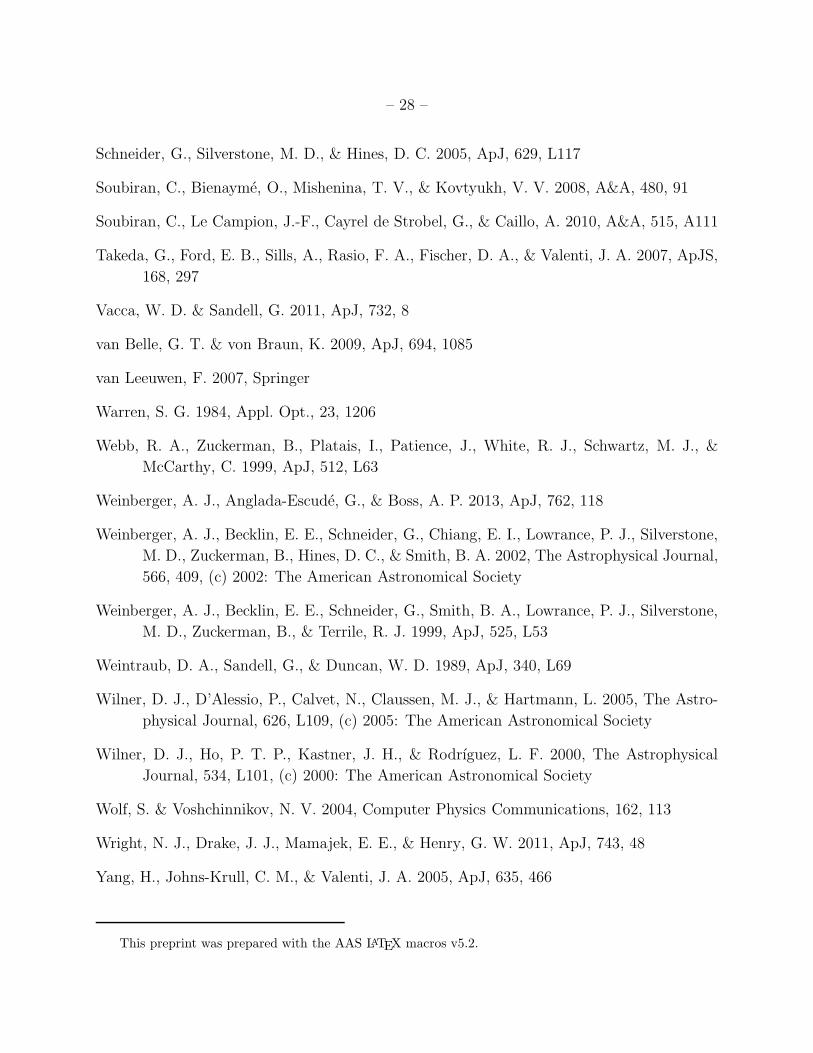
Table 1 lists the photometry of TW Hya in each band with uncertainties and the scaling
ratios for each filter.
In order to determine the best subtraction we minimized a chi-squared metric on a
region of the target image dominated by the star’s diffraction spikes. We assumed that
good subtraction of the diffraction spikes corresponded to the best subtraction of the PSF
within the region of interest (Schneider et al. 2001). We iteratively created subtractions for
combinations of scaling and pixel offsets until we found an image that produced the lowest
chi-squared measure. We searched within 1-σ of the scaling ratios as determined by Table 1
and within ±1 pixel to find the best x and y pixel offsets.
To quantify the systematic effects on the photometry, we repeated the subtractions
varying the PSF scalings and offsets by ±1 σ from the minimum chi-square solution found
above. Using a circular photometric aperture matched to the size of the disk and avoiding
masked areas due to diffraction spikes, we found the standard deviation in the disk flux
densities from this suite of subtractions. We then propagated this uncertainty into the total
uncertainty in the flux density of the disk per pixel.
We observed TW Hya in each medium band filter at two distinct spacecraft orientations
or roll angles separated by 28. This is essentially an azimuthal dither that allows true objects
within the field of view to be distinguished with instrumental artifacts that do not rotate
with a change in orientation. The reference star, CD-432742, was subtracted from both
roll-angle images to create two separate subtraction images for each filter. The images were
then geometrically corrected for the slight optical distortion of the NICMOS camera 2 at the
coronagraphic focus. We used the x-direction pixel scale of 0.′′07595/pixel and the y-direction
pixel scale of 0.′′07542/pixel to create an image with pixels that have the y-direction plate
scale in both directions. The geometrically corrected images were rotated to a common
celestial orientation using the rotation centers given by the flight software in the raw data
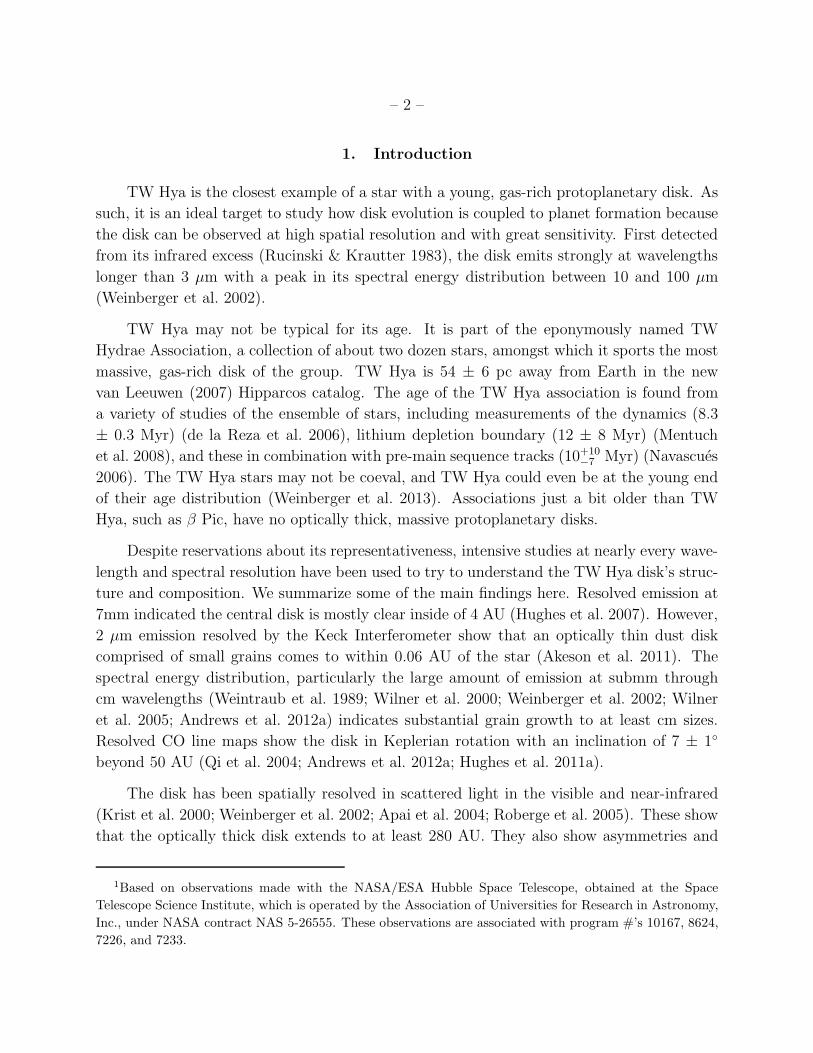
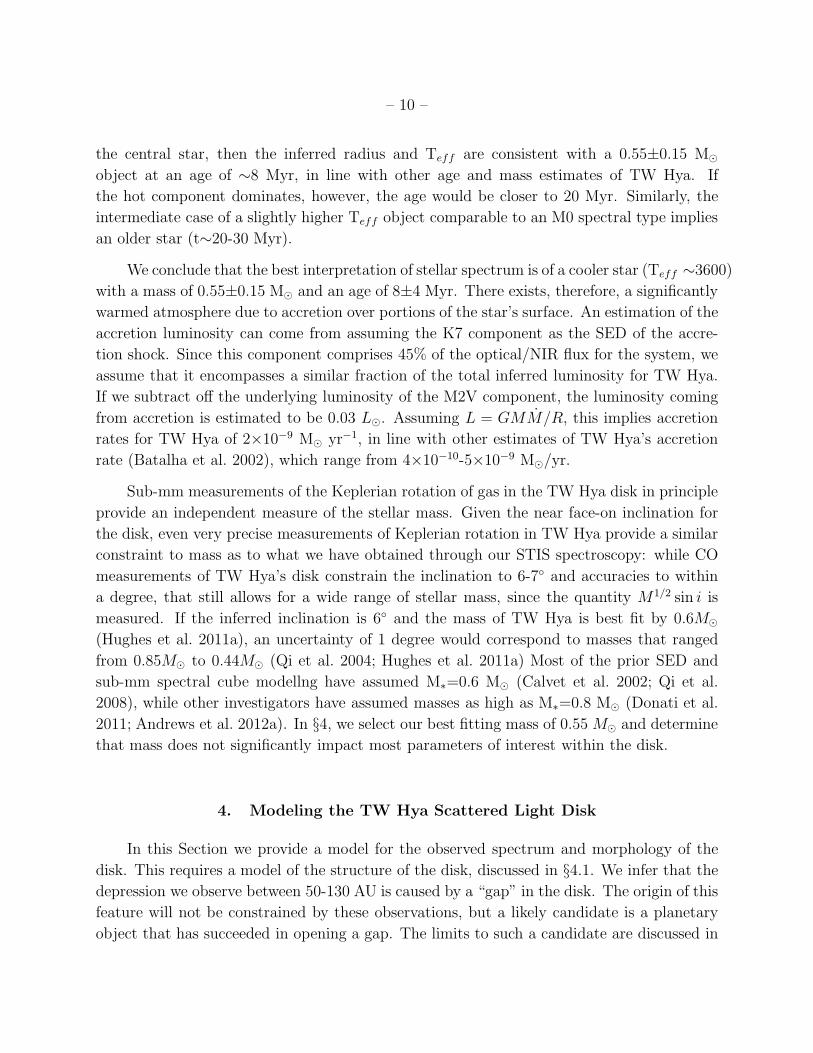
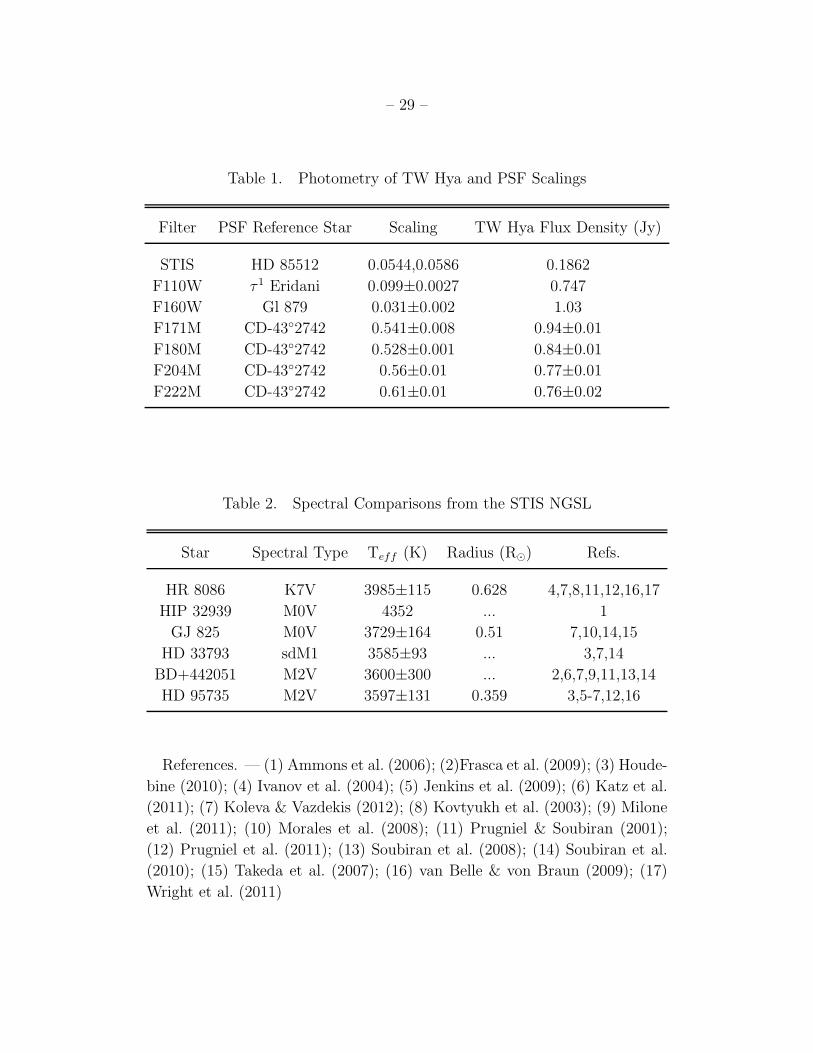
file headers and artifacts such as diffraction spikes were masked. Figure 1 shows the resulting
PSF subtracted and roll-combined images of the TW Hya disk taken in the medium band
filters.
Additional observations of TW Hya with NICMOS were performed as a part of GTO
programs 7226 and 7223 with HST (Weinberger et al. 2002). The observations in F110W
and F160W were recovered from the archive, reduced in the same manner as the medium
band data, and median combined. Archival PSF reference stars for the images were sub-
tracted from the target observations. The F110W reference was τ 1 Eridani, while the F160W
– 5 –
reference was Gl 879. We followed the procedure of Weinberger et al. (2002) for scaling the
PSFs, but followed the above procedure for subtraction.
TW Hya has been observed with STIS using a combination of wedge coronagraphic
images as well as spatially resolved coronagraphic spectroscopy in the visible, including point
source spectroscopy of TW Hya using the G750L grating and the 52×0.2 slit. Additional
STIS spectroscopy was also obtained for the PSF reference HIP 32939. The reduction for
the data is detailed in Roberge et al. (2005).
3. Results
Multi-wavelength, spatially-resolved, scattered-light observations provide a powerful
look into both the TW Hya disk’s morphology and the wavelength and stellocentric-distance
dependent scattering efficiency of its grains. The spectroscopy of TW Hya additionally places
some constraints on its spectral type. In this Section we measure the surface brightness pro-
files, azimuthal asymmetries, and the scattering efficiency of the dust in the TW Hya disk.
We also determine TW Hya’s stellar spectral type using its STIS optical/NIR spectrum.
3.1. Radial Surface Brightness Profiles in the Medium Band Filters
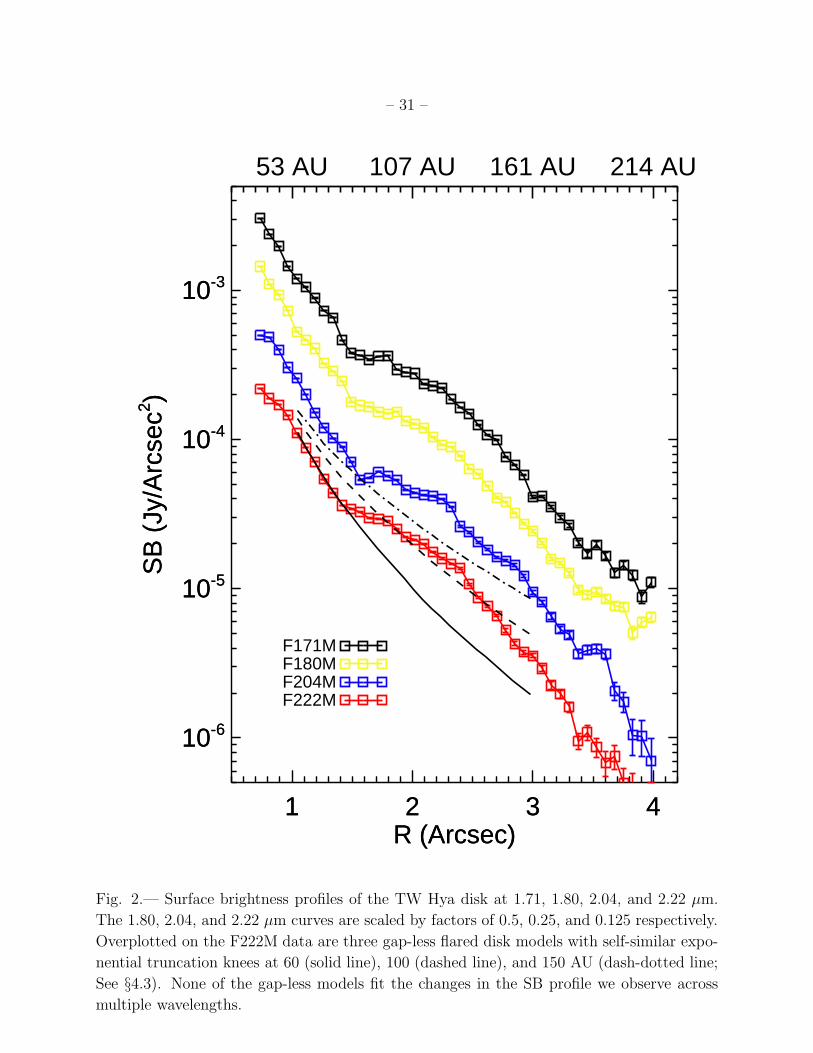
The surface brightness profiles of TW Hya belie its apparent smooth decrease in surface
brightness as a function of radial distance. In fact TW Hya’s disk has radial structure that
deviates from what one would expect from a simple flared disk. We investigate the radial
surface brightness profiles in our medium band NICMOS data and compare the behavior in
these wavelengths to that seen in the shorter wavelength data.
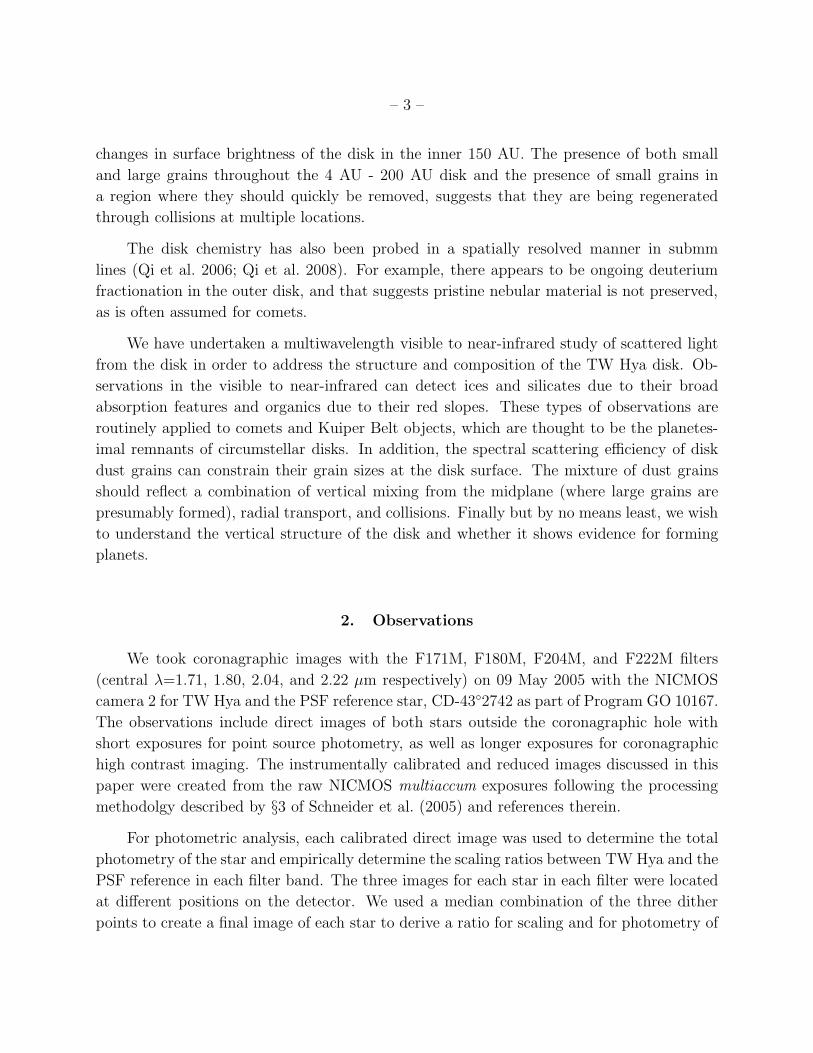
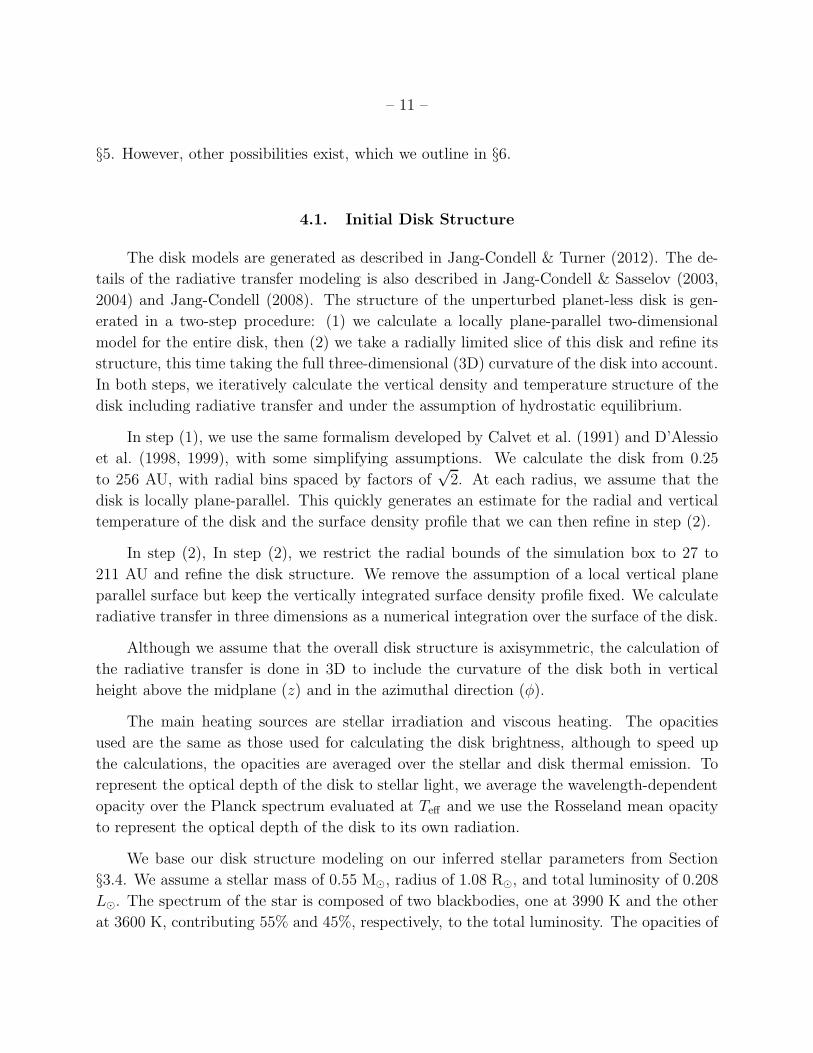
Figure 2 shows the F171M through F222M azimuthally averaged surface brightness
profiles. In all of them we see the characteristic shift in behavior between ∼80-130 AU
that is seen in the visible, 1.1, and 1.6µm, namely a change in the slope of the surface
brightness. This feature is now seen in all the wavelengths of light in which TW Hya is
observed, indicating that this is a feature caused by some change in morphology rather than
a compositional feature localized in wavelength. We overplot simple flared disk model surface
brightness profiles consistent with those used to describe the TW Hya disk in the sub-mm
(Andrews et al. 2012a), which clearly do not match the behavior of the surface brightness
profiles for TW Hya.
To highlight the structure in the disk, we scaled each pixel of the disk images by R2,
where R is the distance from the central star. Figure 3 shows the STIS, F160W, F171M,
– 6 –
and F222M scaled images, which clearly shows a depression in the disk structure at about
80 AU, coincident with the slope changes in the surface brightness profiles. The structure is
most pronounced in the higher spatial resolution STIS images, but is still visible at longer
wavelengths. Additionally, the STIS image shows a possible arc structure exterior to the gap
at a PA of ∼270.
The depression, or deficit of surface brightness relative to the surrounding disk material
can be caused by several factors, including a drastic change in dust opacity at ∼80 AU, a
sudden change in turbulence of the disk, shadowing due to structure just interior to 80 AU,
or the presence of non-axisymmetric structures like spiral arms (Weinberger et al. 1999;
Clampin et al. 2003; Fukagawa et al. 2004). It could also be caused by a protoplanet accreting
material and opening a gap structure within the disk (Bate et al. 2003; Bryden et al. 1999).
Current planet formation models have difficulty forming large planets far from the central
star. However examples of such systems, like HR 8799 (Marois et al. 2008), suggest that
large bodies can form around stars at distances of several tens of AU.
In §4.3 we investigate how a physical gap in material might change the observed surface
profiles and use models to determine limits on the depth of the gap as constrained from
our surface brightness profiles as a function of wavelength. From these limits we make a
preliminary estimate to the limiting mass of a protoplanet capable of opening such a gap in
the TW Hya disk.
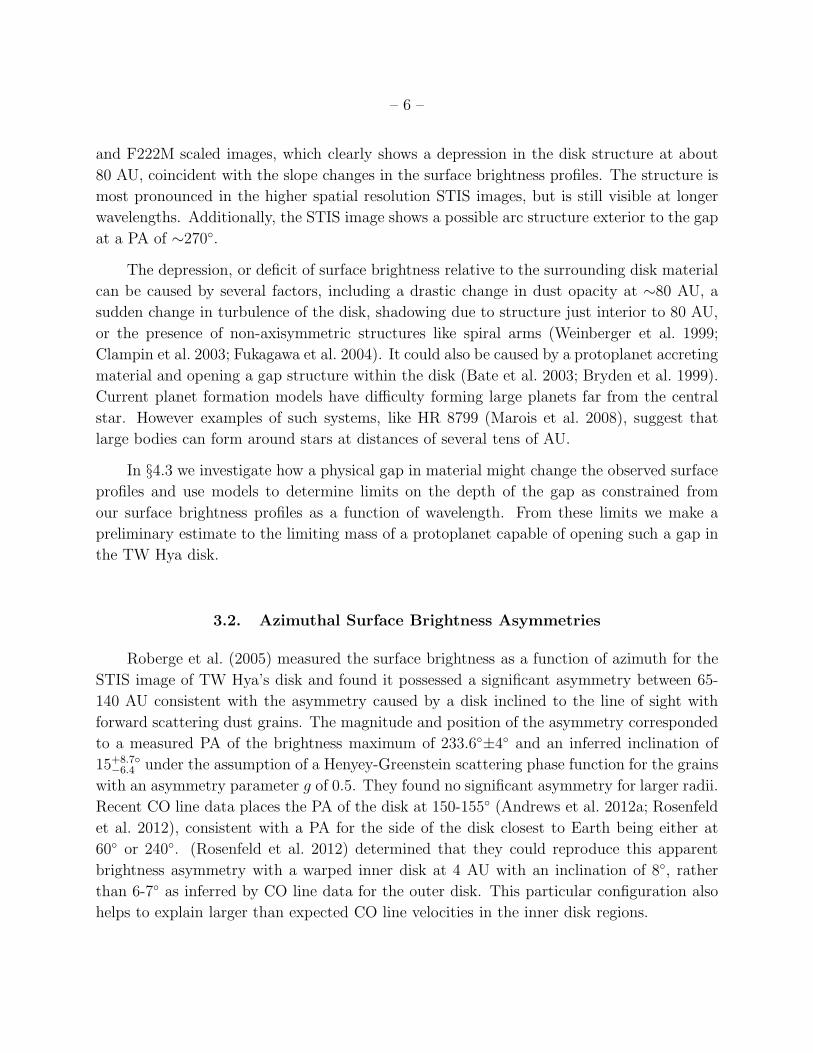
3.2. Azimuthal Surface Brightness Asymmetries
Roberge et al. (2005) measured the surface brightness as a function of azimuth for the
STIS image of TW Hya’s disk and found it possessed a significant asymmetry between 65-
140 AU consistent with the asymmetry caused by a disk inclined to the line of sight with
forward scattering dust grains. The magnitude and position of the asymmetry corresponded
to a measured PA of the brightness maximum of 233.6±4 and an inferred inclination of
15+8.7−6.4 under the assumption of a Henyey-Greenstein scattering phase function for the grains
with an asymmetry parameter g of 0.5. They found no significant asymmetry for larger radii.
Recent CO line data places the PA of the disk at 150-155 (Andrews et al. 2012a; Rosenfeld
et al. 2012), consistent with a PA for the side of the disk closest to Earth being either at
60 or 240. (Rosenfeld et al. 2012) determined that they could reproduce this apparent
brightness asymmetry with a warped inner disk at 4 AU with an inclination of 8, rather
than 6-7 as inferred by CO line data for the outer disk. This particular configuration also
helps to explain larger than expected CO line velocities in the inner disk regions.
– 7 –
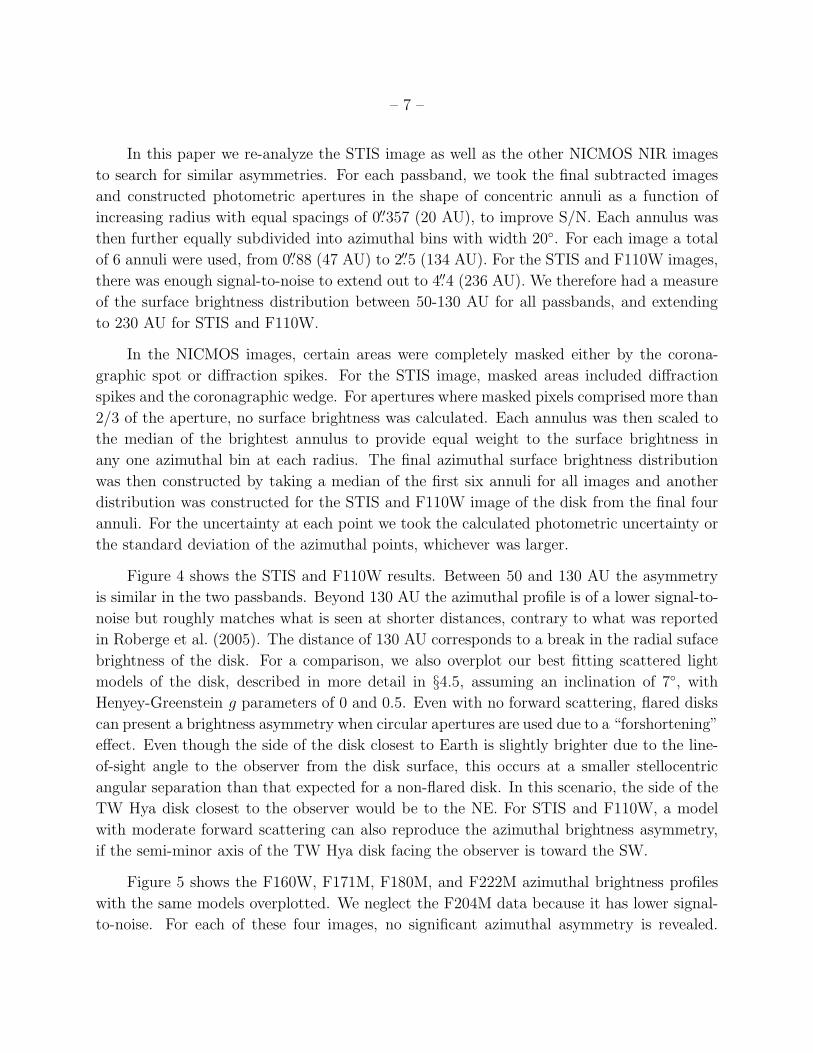
In this paper we re-analyze the STIS image as well as the other NICMOS NIR images
to search for similar asymmetries. For each passband, we took the final subtracted images
and constructed photometric apertures in the shape of concentric annuli as a function of
increasing radius with equal spacings of 0.′′357 (20 AU), to improve S/N. Each annulus was
then further equally subdivided into azimuthal bins with width 20. For each image a total
of 6 annuli were used, from 0.′′88 (47 AU) to 2.′′5 (134 AU). For the STIS and F110W images,
there was enough signal-to-noise to extend out to 4.′′4 (236 AU). We therefore had a measure
of the surface brightness distribution between 50-130 AU for all passbands, and extending
to 230 AU for STIS and F110W.
In the NICMOS images, certain areas were completely masked either by the corona-
graphic spot or diffraction spikes. For the STIS image, masked areas included diffraction
spikes and the coronagraphic wedge. For apertures where masked pixels comprised more than
2/3 of the aperture, no surface brightness was calculated. Each annulus was then scaled to
the median of the brightest annulus to provide equal weight to the surface brightness in
any one azimuthal bin at each radius. The final azimuthal surface brightness distribution
was then constructed by taking a median of the first six annuli for all images and another
distribution was constructed for the STIS and F110W image of the disk from the final four
annuli. For the uncertainty at each point we took the calculated photometric uncertainty or
the standard deviation of the azimuthal points, whichever was larger.
Figure 4 shows the STIS and F110W results. Between 50 and 130 AU the asymmetry
is similar in the two passbands. Beyond 130 AU the azimuthal profile is of a lower signal-to-
noise but roughly matches what is seen at shorter distances, contrary to what was reported
in Roberge et al. (2005). The distance of 130 AU corresponds to a break in the radial suface
brightness of the disk. For a comparison, we also overplot our best fitting scattered light
models of the disk, described in more detail in §4.5, assuming an inclination of 7, with
Henyey-Greenstein g parameters of 0 and 0.5. Even with no forward scattering, flared disks
can present a brightness asymmetry when circular apertures are used due to a “forshortening”
effect. Even though the side of the disk closest to Earth is slightly brighter due to the line-
of-sight angle to the observer from the disk surface, this occurs at a smaller stellocentric
angular separation than that expected for a non-flared disk. In this scenario, the side of the
TW Hya disk closest to the observer would be to the NE. For STIS and F110W, a model
with moderate forward scattering can also reproduce the azimuthal brightness asymmetry,
if the semi-minor axis of the TW Hya disk facing the observer is toward the SW.
Figure 5 shows the F160W, F171M, F180M, and F222M azimuthal brightness profiles
with the same models overplotted. We neglect the F204M data because it has lower signal-
to-noise. For each of these four images, no significant azimuthal asymmetry is revealed.
– 8 –
Whatever is the cause of the asymmetry at shorter wavelengths, it is not detected with
significance in the longer wavelength observations. We discuss the potential causes of this
in Sections 4.5 and 6.
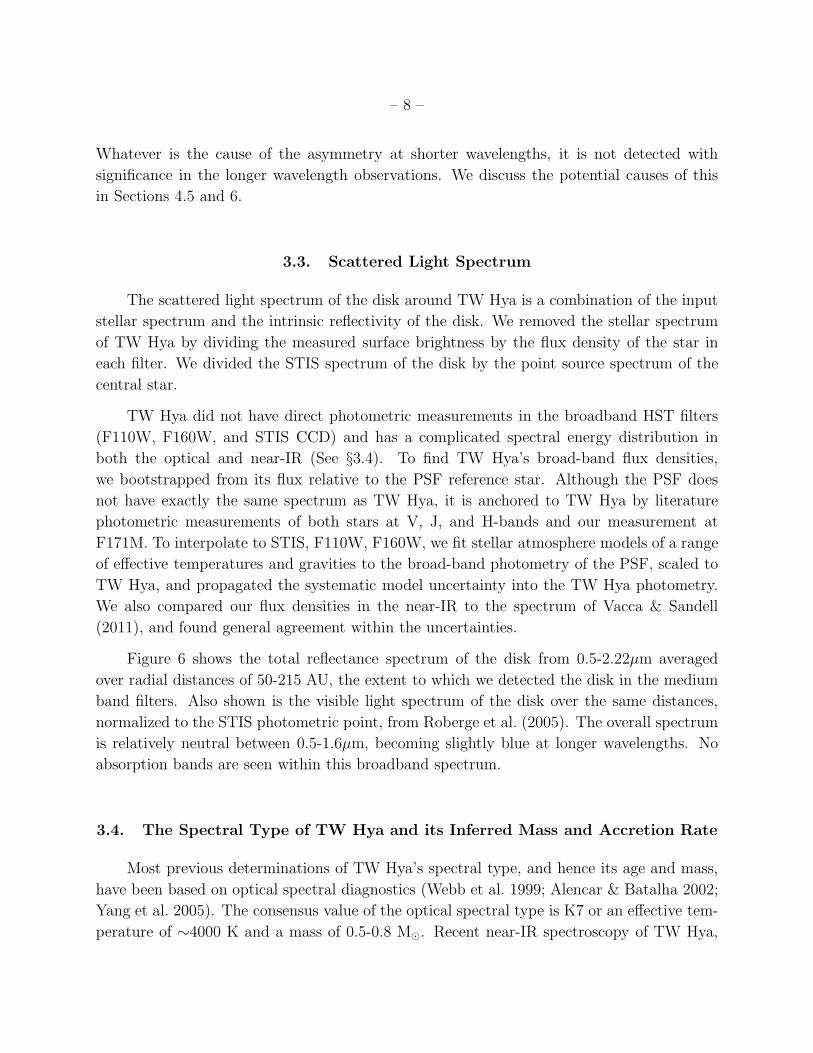
3.3. Scattered Light Spectrum
The scattered light spectrum of the disk around TW Hya is a combination of the input
stellar spectrum and the intrinsic reflectivity of the disk. We removed the stellar spectrum
of TW Hya by dividing the measured surface brightness by the flux density of the star in
each filter. We divided the STIS spectrum of the disk by the point source spectrum of the
central star.
TW Hya did not have direct photometric measurements in the broadband HST filters
(F110W, F160W, and STIS CCD) and has a complicated spectral energy distribution in
both the optical and near-IR (See §3.4). To find TW Hya’s broad-band flux densities,
we bootstrapped from its flux relative to the PSF reference star. Although the PSF does
not have exactly the same spectrum as TW Hya, it is anchored to TW Hya by literature
photometric measurements of both stars at V, J, and H-bands and our measurement at
F171M. To interpolate to STIS, F110W, F160W, we fit stellar atmosphere models of a range
of effective temperatures and gravities to the broad-band photometry of the PSF, scaled to
TW Hya, and propagated the systematic model uncertainty into the TW Hya photometry.
We also compared our flux densities in the near-IR to the spectrum of Vacca & Sandell
(2011), and found general agreement within the uncertainties.
Figure 6 shows the total reflectance spectrum of the disk from 0.5-2.22µm averaged
over radial distances of 50-215 AU, the extent to which we detected the disk in the medium
band filters. Also shown is the visible light spectrum of the disk over the same distances,
normalized to the STIS photometric point, from Roberge et al. (2005). The overall spectrum
is relatively neutral between 0.5-1.6µm, becoming slightly blue at longer wavelengths. No
absorption bands are seen within this broadband spectrum.
3.4. The Spectral Type of TW Hya and its Inferred Mass and Accretion Rate
Most previous determinations of TW Hya’s spectral type, and hence its age and mass,
have been based on optical spectral diagnostics (Webb et al. 1999; Alencar & Batalha 2002;
Yang et al. 2005). The consensus value of the optical spectral type is K7 or an effective tem-
perature of ∼4000 K and a mass of 0.5-0.8 M⊙. Recent near-IR spectroscopy of TW Hya,
– 9 –
however, implied a much later spectral type of M2.5 (Vacca & Sandell 2011), which corre-
sponds to a lower mass and younger age.
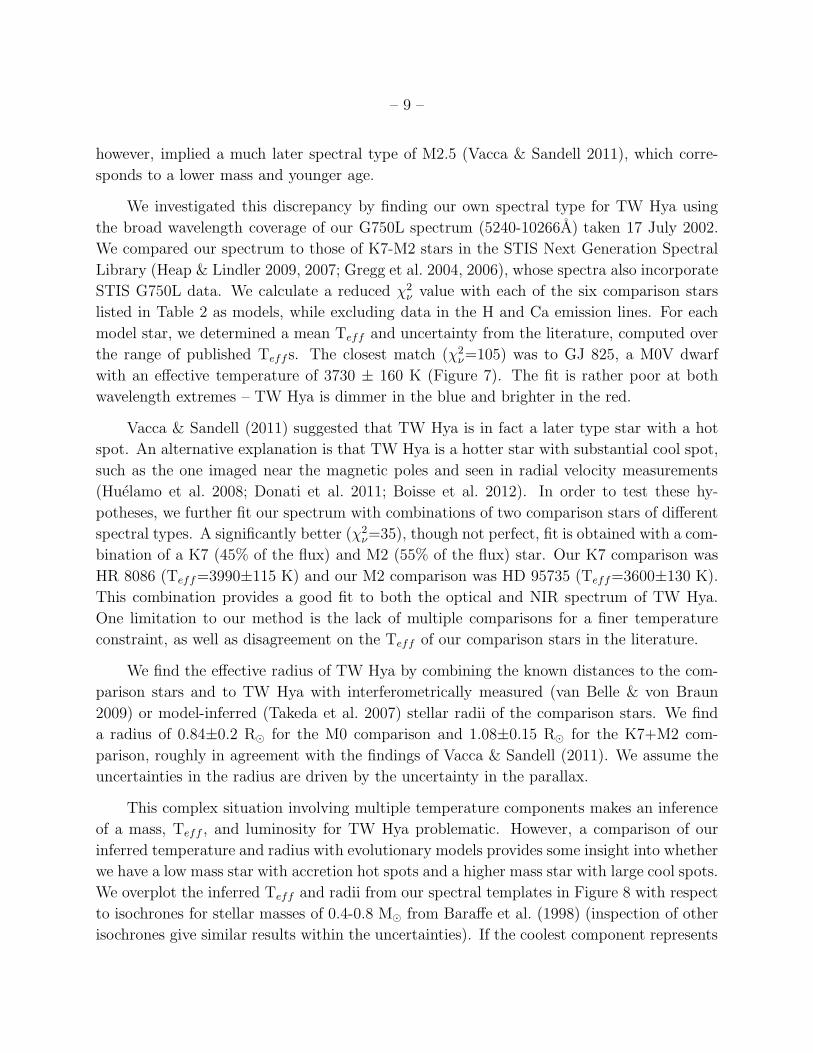
We investigated this discrepancy by finding our own spectral type for TW Hya using
the broad wavelength coverage of our G750L spectrum (5240-10266A) taken 17 July 2002.
We compared our spectrum to those of K7-M2 stars in the STIS Next Generation Spectral
Library (Heap & Lindler 2009, 2007; Gregg et al. 2004, 2006), whose spectra also incorporate
STIS G750L data. We calculate a reduced χ2ν value with each of the six comparison stars
listed in Table 2 as models, while excluding data in the H and Ca emission lines. For each
model star, we determined a mean Teff and uncertainty from the literature, computed over
the range of published Teff s. The closest match (χ2ν=105) was to GJ 825, a M0V dwarf
with an effective temperature of 3730 ± 160 K (Figure 7). The fit is rather poor at both
wavelength extremes – TW Hya is dimmer in the blue and brighter in the red.
Vacca & Sandell (2011) suggested that TW Hya is in fact a later type star with a hot
spot. An alternative explanation is that TW Hya is a hotter star with substantial cool spot,
such as the one imaged near the magnetic poles and seen in radial velocity measurements
(Huelamo et al. 2008; Donati et al. 2011; Boisse et al. 2012). In order to test these hy-
potheses, we further fit our spectrum with combinations of two comparison stars of different
spectral types. A significantly better (χ2ν=35), though not perfect, fit is obtained with a com-
bination of a K7 (45% of the flux) and M2 (55% of the flux) star. Our K7 comparison was
HR 8086 (Teff=3990±115 K) and our M2 comparison was HD 95735 (Teff=3600±130 K).
This combination provides a good fit to both the optical and NIR spectrum of TW Hya.
One limitation to our method is the lack of multiple comparisons for a finer temperature
constraint, as well as disagreement on the Teff of our comparison stars in the literature.
We find the effective radius of TW Hya by combining the known distances to the com-
parison stars and to TW Hya with interferometrically measured (van Belle & von Braun
2009) or model-inferred (Takeda et al. 2007) stellar radii of the comparison stars. We find
a radius of 0.84±0.2 R⊙ for the M0 comparison and 1.08±0.15 R⊙ for the K7+M2 com-
parison, roughly in agreement with the findings of Vacca & Sandell (2011). We assume the
uncertainties in the radius are driven by the uncertainty in the parallax.
This complex situation involving multiple temperature components makes an inference
of a mass, Teff , and luminosity for TW Hya problematic. However, a comparison of our
inferred temperature and radius with evolutionary models provides some insight into whether
we have a low mass star with accretion hot spots and a higher mass star with large cool spots.
We overplot the inferred Teff and radii from our spectral templates in Figure 8 with respect
to isochrones for stellar masses of 0.4-0.8 M⊙ from Baraffe et al. (1998) (inspection of other
isochrones give similar results within the uncertainties). If the coolest component represents
– 10 –
the central star, then the inferred radius and Teff are consistent with a 0.55±0.15 M⊙
object at an age of ∼8 Myr, in line with other age and mass estimates of TW Hya. If
the hot component dominates, however, the age would be closer to 20 Myr. Similarly, the
intermediate case of a slightly higher Teff object comparable to an M0 spectral type implies
an older star (t∼20-30 Myr).
We conclude that the best interpretation of stellar spectrum is of a cooler star (Teff ∼3600)
with a mass of 0.55±0.15 M⊙ and an age of 8±4 Myr. There exists, therefore, a significantly
warmed atmosphere due to accretion over portions of the star’s surface. An estimation of the
accretion luminosity can come from assuming the K7 component as the SED of the accre-
tion shock. Since this component comprises 45% of the optical/NIR flux for the system, we
assume that it encompasses a similar fraction of the total inferred luminosity for TW Hya.
If we subtract off the underlying luminosity of the M2V component, the luminosity coming
from accretion is estimated to be 0.03 L⊙. Assuming L = GMM/R, this implies accretion
rates for TW Hya of 2×10⁻⁹ M⊙ yr−1, in line with other estimates of TW Hya’s accretion
rate (Batalha et al. 2002), which range from 4×10⁻¹⁰-5×10⁻⁹ M⊙/yr.
Sub-mm measurements of the Keplerian rotation of gas in the TW Hya disk in principle
provide an independent measure of the stellar mass. Given the near face-on inclination for
the disk, even very precise measurements of Keplerian rotation in TW Hya provide a similar
constraint to mass as to what we have obtained through our STIS spectroscopy: while CO
measurements of TW Hya’s disk constrain the inclination to 6-7 and accuracies to within
a degree, that still allows for a wide range of stellar mass, since the quantity M1/2 sin i is
measured. If the inferred inclination is 6 and the mass of TW Hya is best fit by 0.6M⊙
(Hughes et al. 2011a), an uncertainty of 1 degree would correspond to masses that ranged
from 0.85M⊙ to 0.44M⊙ (Qi et al. 2004; Hughes et al. 2011a) Most of the prior SED and
sub-mm spectral cube modellng have assumed M∗=0.6 M⊙ (Calvet et al. 2002; Qi et al.
2008), while other investigators have assumed masses as high as M∗=0.8 M⊙ (Donati et al.
2011; Andrews et al. 2012a). In §4, we select our best fitting mass of 0.55 M⊙ and determine
that mass does not significantly impact most parameters of interest within the disk.
4. Modeling the TW Hya Scattered Light Disk
In this Section we provide a model for the observed spectrum and morphology of the
disk. This requires a model of the structure of the disk, discussed in §4.1. We infer that the
depression we observe between 50-130 AU is caused by a “gap” in the disk. The origin of this
feature will not be constrained by these observations, but a likely candidate is a planetary
object that has succeeded in opening a gap. The limits to such a candidate are discussed in
– 11 –
§5. However, other possibilities exist, which we outline in §6.
4.1. Initial Disk Structure
The disk models are generated as described in Jang-Condell & Turner (2012). The de-
tails of the radiative transfer modeling is also described in Jang-Condell & Sasselov (2003,
2004) and Jang-Condell (2008). The structure of the unperturbed planet-less disk is gen-
erated in a two-step procedure: (1) we calculate a locally plane-parallel two-dimensional
model for the entire disk, then (2) we take a radially limited slice of this disk and refine its
structure, this time taking the full three-dimensional (3D) curvature of the disk into account.
In both steps, we iteratively calculate the vertical density and temperature structure of the
disk including radiative transfer and under the assumption of hydrostatic equilibrium.
In step (1), we use the same formalism developed by Calvet et al. (1991) and D’Alessio
et al. (1998, 1999), with some simplifying assumptions. We calculate the disk from 0.25
to 256 AU, with radial bins spaced by factors of√2. At each radius, we assume that the
disk is locally plane-parallel. This quickly generates an estimate for the radial and vertical
temperature of the disk and the surface density profile that we can then refine in step (2).
In step (2), In step (2), we restrict the radial bounds of the simulation box to 27 to
211 AU and refine the disk structure. We remove the assumption of a local vertical plane
parallel surface but keep the vertically integrated surface density profile fixed. We calculate
radiative transfer in three dimensions as a numerical integration over the surface of the disk.
Although we assume that the overall disk structure is axisymmetric, the calculation of
the radiative transfer is done in 3D to include the curvature of the disk both in vertical
height above the midplane (z) and in the azimuthal direction (φ).
The main heating sources are stellar irradiation and viscous heating. The opacities
used are the same as those used for calculating the disk brightness, although to speed up
the calculations, the opacities are averaged over the stellar and disk thermal emission. To
represent the optical depth of the disk to stellar light, we average the wavelength-dependent
opacity over the Planck spectrum evaluated at Teff and we use the Rosseland mean opacity
to represent the optical depth of the disk to its own radiation.
We base our disk structure modeling on our inferred stellar parameters from Section
§3.4. We assume a stellar mass of 0.55 M⊙, radius of 1.08 R⊙, and total luminosity of 0.208
L⊙. The spectrum of the star is composed of two blackbodies, one at 3990 K and the other
at 3600 K, contributing 55% and 45%, respectively, to the total luminosity. The opacities of
– 12 –
the dust to stellar irradiation are calculated using this spectrum.
Given the uncertainties in mass and Teff described in 3.4, we consider their impact on
our models. Decreasing the stellar mass while keeping the total luminosity of the star fixed
has the effect of making the disk puffier, due to the lower gravity. The disk is then able to
intercept more light, making it appear brighter. Disk models differing only by the stellar
parameters have the same basic shape and spectral behavior but change overall brightness
by 5-10%. Changing the stellar parameters also mainly impacts the inferred radial width of
the gap, but not the depth.
The disk parameters are those derived by (Calvet et al. 2002) from the SED of TW Hya.
For the accretion rate, we assume a value of 1 × 10⁻⁹M⊙yr−1 (see §3.4). We assume that
the dust is well-mixed with the gas and constant throughout the disk, with a dust-to-gas
ratio of 0.0138 and a grain-size distribution of n(a) ∝ a−3.5. Calvet et al. (2002) and Wilner
et al. (2005) found that large maximum grain sizes (amax) give good fits to the SED of TW
Hya at long wavelengths (λ & 1 cm), but there is a degeneracy between maximum grain
size and viscosity parameter (α) in their models, where the viscosity is given by ν = αc2s/Ωφ
where cs is the thermal sound speed, and Ωφ is the Keplerian orbital angular velocity. Good
fits to the SED of TW Hya are obtained with amax = 1mm, 1 cm, or 10 cm. This is because
large grains are effectively invisible to optical and infrared wavelengths. The α parameter
must be adjusted as the maximum grain size changes, because the overall mass of the disk
increases with increasing grain size, assuming a fixed gas-to-dust ratio; however, the stellar
mass accretion rate must be kept fixed.
Given that amax, α, and M all have the primary effect of scaling the disk mass up
or down and that the degeneracies inherently give limited constraints on these parameters,
we assume for simplicity in all our disk models that M = 10−9M⊙yr−1, amax = 1 cm, and
α = 5×10⁻⁴. The effect of increasing the accretion rate would be to increase the total surface
density of the disk, which could be offset by adjusting the viscosity parameter α downward.
Our assumed parameters give a total disk mass within the simulation boundaries between
27 and 211 AU of 0.074 M⊙. This assumed disk mass is comparable to estimates of the disk
mass from Herschel HD observations (Bergin et al. 2013).
The wavelength dependent opacities are calculated using a Mie scattering code, miex,
that includes distributions of particle sizes and can account for large dust particles (Wolf
& Voshchinnikov 2004). The disk models rely on mean opacities calculated from these
wavelength-dependent opacities. The Rosseland mean opacity evaluated at 100 K is used
to represent the overall disk opacity to its own emission and the Planck averaged opacity
evaluated at 100 K is used for calculating the thermal emission from the disk. The Planck
averaged opacity evaluated over the stellar spectrum is used to represent the opacity of
– 13 –
the disk to stellar irradiation. We model the star as a two-temperature blackbody, with
55% of the luminosity from a 3990 K component, and 45% of the luminosity from a 3600
K component. For a model with a given minimum grain size, we calculate the entire disk
model from the initial conditions in order to be completely self-consistent.
4.2. Scattered Light
The scattered light image of a disk is modeled as in Jang-Condell (2009) and Jang-
Condell & Turner (2012). The scattering surface of the disk is defined to be where the
optical depth from the star at a given frequency ν is τν = 2/3. The brightness at the
scattering surface of the disk, including multiple scattering, is
Iscattν =ωνµR
2∗Bν(T∗)
4r2(µ+ cos η)
1 +ων
1− g2µ2
[
(2 + 3µ)(µ+ cos η)
(1 + 2g/3)(1 + g cos η)− 3µ2
]
. (1)
where ων is the albedo, g =√
3(1− ων), µ is the cosine of the angle of incidence to the
scattering surface, Bν is the stellar brightness, r is the total distance to the star, and η is
the angle between the line of sight to the observer and the normal to the scattering surface.
The observed brightness of a star at distance from the observer d is
Fν,obs = πBν
(
R∗
d
)2
(2)
so we can express the surface brightness in scattered light in units of the apparent brightness
of the star per square arcsecond:
Iscattν =ωνµ(1 + fmult)
4π(µ+ cos η)
(
d
pc
)2(
r2 + z2sAU2
)−1(
Fν,obs
asec2
)
(3)
where
fmult =ων
1− g2µ2
[
(2 + 3µ)(µ+ cos η)
(1 + 2g/3)(1 + g cos η)− 3µ2
]
(4)
represents the fractional increase in brightness caused by multiple scattering.
Finally, we need to choose a composition and size distribution (especially minimum
grain size) of the dust to calculate the final scattered light that is emitted from the disk. We
use the wavelength-dependent opacities calculated using Mie theory, as described above, to
determine the scattered brightness. Many compositions and possible grain sizes are available,
and it is not immediately clear whether a single composition is preferred for optically thick
disks, or whether each individual disk has its own properties. The neutral color of TW Hya
in the optical compared to the quite red colors of HD 100546, suggest that a range of
compositions and size distributions exist amongst disks.
– 14 –
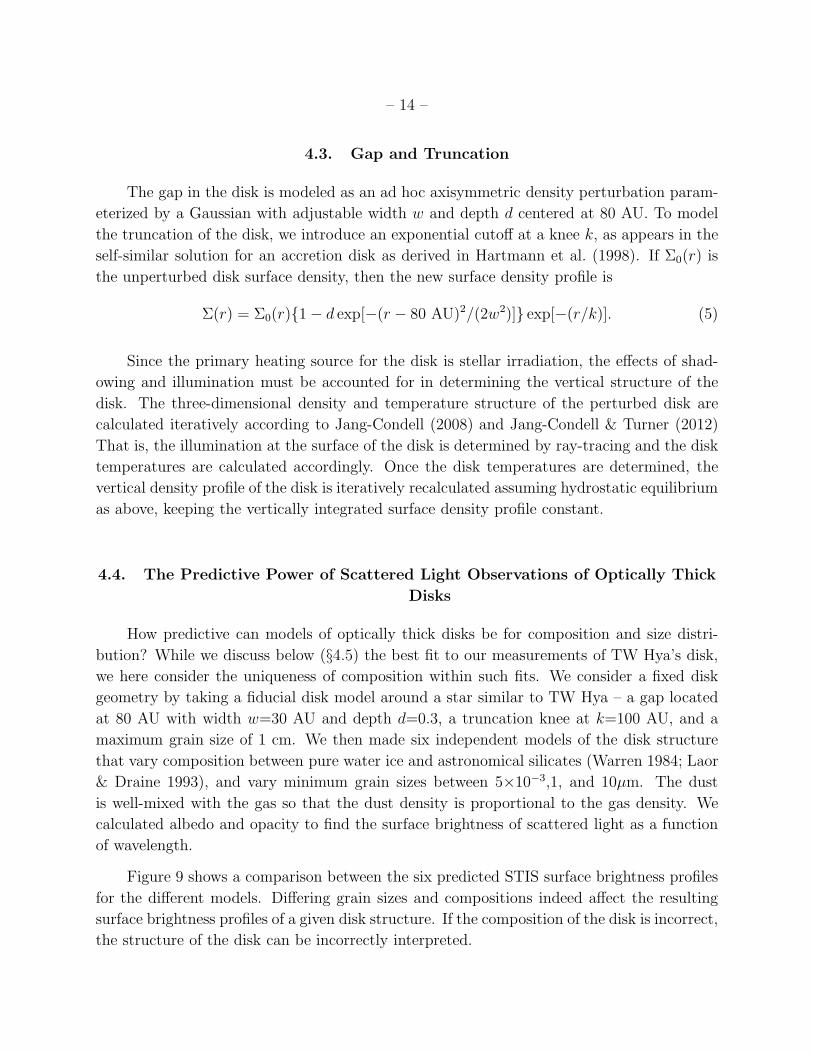
4.3. Gap and Truncation
The gap in the disk is modeled as an ad hoc axisymmetric density perturbation param-
eterized by a Gaussian with adjustable width w and depth d centered at 80 AU. To model
the truncation of the disk, we introduce an exponential cutoff at a knee k, as appears in the
self-similar solution for an accretion disk as derived in Hartmann et al. (1998). If Σ0(r) is
the unperturbed disk surface density, then the new surface density profile is
Σ(r) = Σ0(r)1− d exp[−(r − 80 AU)2/(2w2)] exp[−(r/k)]. (5)
Since the primary heating source for the disk is stellar irradiation, the effects of shad-
owing and illumination must be accounted for in determining the vertical structure of the
disk. The three-dimensional density and temperature structure of the perturbed disk are
calculated iteratively according to Jang-Condell (2008) and Jang-Condell & Turner (2012)
That is, the illumination at the surface of the disk is determined by ray-tracing and the disk
temperatures are calculated accordingly. Once the disk temperatures are determined, the
vertical density profile of the disk is iteratively recalculated assuming hydrostatic equilibrium
as above, keeping the vertically integrated surface density profile constant.
4.4. The Predictive Power of Scattered Light Observations of Optically Thick
Disks
How predictive can models of optically thick disks be for composition and size distri-
bution? While we discuss below (§4.5) the best fit to our measurements of TW Hya’s disk,
we here consider the uniqueness of composition within such fits. We consider a fixed disk
geometry by taking a fiducial disk model around a star similar to TW Hya – a gap located
at 80 AU with width w=30 AU and depth d=0.3, a truncation knee at k=100 AU, and a
maximum grain size of 1 cm. We then made six independent models of the disk structure
that vary composition between pure water ice and astronomical silicates (Warren 1984; Laor
& Draine 1993), and vary minimum grain sizes between 5×10−3,1, and 10µm. The dust
is well-mixed with the gas so that the dust density is proportional to the gas density. We
calculated albedo and opacity to find the surface brightness of scattered light as a function
of wavelength.
Figure 9 shows a comparison between the six predicted STIS surface brightness profiles
for the different models. Differing grain sizes and compositions indeed affect the resulting
surface brightness profiles of a given disk structure. If the composition of the disk is incorrect,
the structure of the disk can be incorrectly interpreted.
– 15 –
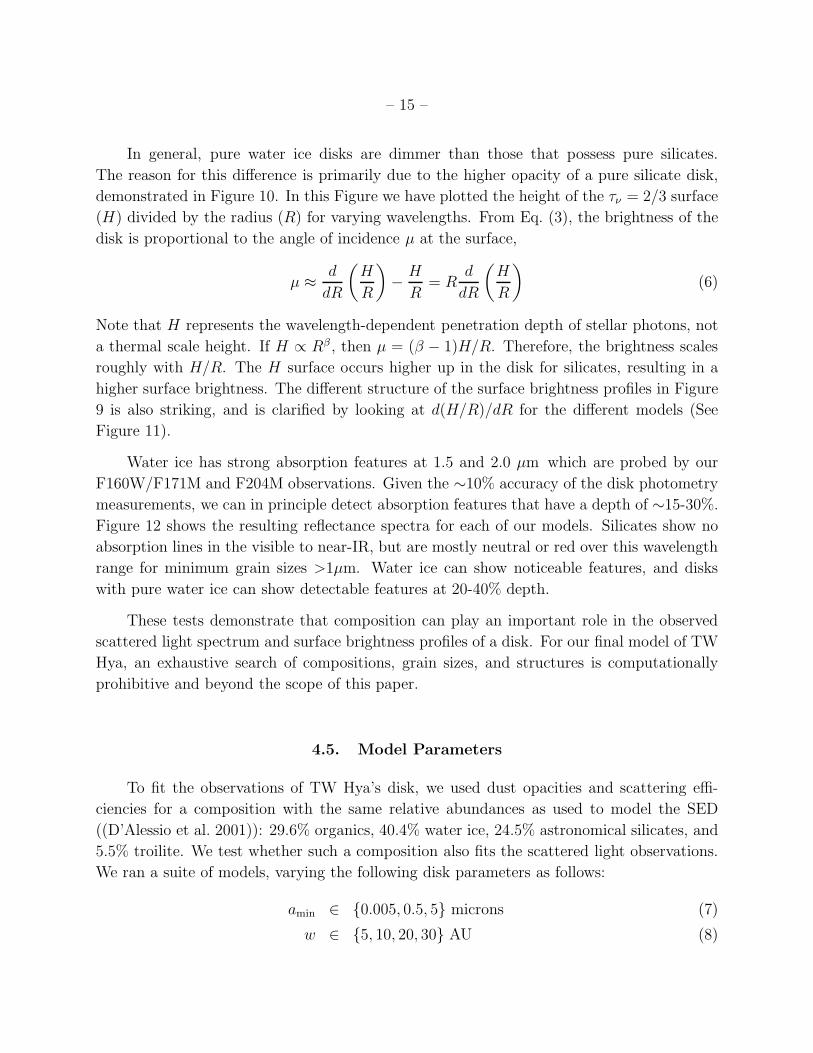
In general, pure water ice disks are dimmer than those that possess pure silicates.
The reason for this difference is primarily due to the higher opacity of a pure silicate disk,
demonstrated in Figure 10. In this Figure we have plotted the height of the τν = 2/3 surface
(H) divided by the radius (R) for varying wavelengths. From Eq. (3), the brightness of the
disk is proportional to the angle of incidence µ at the surface,
µ ≈ d
dR
(
H
R
)
− H
R= R
d
dR
(
H
R
)
(6)
Note that H represents the wavelength-dependent penetration depth of stellar photons, not
a thermal scale height. If H ∝ Rβ , then µ = (β − 1)H/R. Therefore, the brightness scales
roughly with H/R. The H surface occurs higher up in the disk for silicates, resulting in a
higher surface brightness. The different structure of the surface brightness profiles in Figure
9 is also striking, and is clarified by looking at d(H/R)/dR for the different models (See
Figure 11).
Water ice has strong absorption features at 1.5 and 2.0 µm which are probed by our
F160W/F171M and F204M observations. Given the ∼10% accuracy of the disk photometry
measurements, we can in principle detect absorption features that have a depth of ∼15-30%.
Figure 12 shows the resulting reflectance spectra for each of our models. Silicates show no
absorption lines in the visible to near-IR, but are mostly neutral or red over this wavelength
range for minimum grain sizes >1µm. Water ice can show noticeable features, and disks
with pure water ice can show detectable features at 20-40% depth.
These tests demonstrate that composition can play an important role in the observed
scattered light spectrum and surface brightness profiles of a disk. For our final model of TW
Hya, an exhaustive search of compositions, grain sizes, and structures is computationally
prohibitive and beyond the scope of this paper.
4.5. Model Parameters
To fit the observations of TW Hya’s disk, we used dust opacities and scattering effi-
ciencies for a composition with the same relative abundances as used to model the SED
((D’Alessio et al. 2001)): 29.6% organics, 40.4% water ice, 24.5% astronomical silicates, and
5.5% troilite. We test whether such a composition also fits the scattered light observations.
We ran a suite of models, varying the following disk parameters as follows:
amin ∈ 0.005, 0.5, 5 microns (7)
w ∈ 5, 10, 20, 30 AU (8)
– 16 –
d ∈ 0.0, 0.3, 0.5 (9)
k ∈ 60, 80, 100, 120, 150 AU (10)
The surface brightness profiles are fit simultaneously spatially and across the 7 wave-
lengths for which we have photometric data. To account for uncertainties in the overall
normalization such as might arise from uncertainty in our chosen parameters, we allow the
overall brightness to vary by a constant factor and calculate the reduced χ2 value for each
model with respect to the data from 56 to 160 AU. The center of the gap is fixed at 80 AU.
The parameters for the best fits as measured by the minimum reduced χ2ν are tabulated
in Table 3. We found that we could fit the observed brightness of the disk only with small
amin (0.005µm), but if we were willing to scale the overall brightness, we could equally well
fit (similar χ2) the disk with amin=0.5µm. However, larger grain sizes failed to reproduce the
neutral-to-blue color observed over large portions of the disk, resulting instead in a redder
color. Since the overall flux density of the disk is an observed quantity, we favor those models
that naturally reproduced the observed surface brightness.
A few of our assumptions could impact the expected brightness of the disk. For example,
the luminosity of the star would differ by ∼20% if we instead used the luminosity determined
by Vacca & Sandell (2011), rather than that by Webb et al. (1999) or our own determination.
Since the surface brightness of TW Hya’s disk due to scattered light depends on the square
of the distance, uncertainties of up to 23% are possible, given the uncertainties in TW Hya’s
parallax. A different distance would also imply revised stellar parameters. A higher or lower
mass of the central star will result in a puffier (brighter) or more vertically compact (dimmer)
disk, respectively.
We have also assumed that the dust isotropically scatters light. If the dust were instead
forward scattering by a moderate degree, such as with a Henyey-Greenstein asymmetry
parameter of 0.5, the approximate scattering angle of TW Hya would result in a dimming of
the disk of ≈25%, based on our modeling. Due to flaring in the disk, our isotropic models
predict a decrease in flux along the semi-minor axis of the disk pointing to the observer.
Conversely, forward scattering dust, even in a flared disk, will produce a brightness peak
along the semi-minor axis of the disk tilted toward the observer. The true orientation of
the disk is degenerate between these two possibilities, so we orient our models such that the
brightness maximum is aligned with the observed P.A. in the STIS and F110W data.
Closer to the star, the models with isotropic scattering do not completely reproduce
the azimuthal brightness distribution, while the forward scattering model is more consistent.
Our models suggest an inclination of ∼7 and forward scattering dust for the disk. Forward
scattering grains in the outer disk are marginally favored as both the STIS and F110W
– 17 –
data still show a trough and peak structure in the azimuthal surface brightness profile–
while the S/N is lower, the expectation from our models is a larger brightness asymmetry at
larger distances, which is not favored by the data. This is either indicative of a decrease in
propensity to forward scatter or lack of forward scattering grains in the outer disk.
Figures 13 and 14 show the radial data compared to the best fit model for all of the
observations and radial spectral cuts of the disk. In general the model fits the observed
spectrum quite well, with the exception of the region around 80 AU, the position of the gap.
This is also where the model fails to reproduce the observed surface brightness profile in
some of the wavelengths observed.
In comparison, models with no gap provide poor fits to the data. In figure 2 we show
brightness profiles of disk models without a gap at 80 AU in comparison to the data at
the F222M waveband. The disk models include truncation at k = 60, 100, and 150 AU
and have been scaled by 1.05, 0.73, and 0.57, respectively, in order to fit the data across
all wavelengths. The reduced χ2ν for the models are 20.8, 8.18, and 4.31, respectively. The
model with truncation at 150 AU is the best fit, but still does not provide as good a fit as
compared to the model with a 30% gap.
5. Mass of a Gap-Opening Planet
The best model for the TW Hya disk is one where an axisymmetric 30% partial gap is
opened at 80 AU in the disk. A possible mechanism for opening such a gap is an embedded
planet. The model we have used to fit to the TW Hya disk does not include hydrodynamics,
but rather the gap is imposed in an ad hoc manner on the disk structure.
Numerical hydrodynamic simulations of planets embedded in gas-dominated protoplan-
etary disks by Bate et al. (2003) and Bryden et al. (1999) indicate that tidal torques between
the planet and disk can clear axisymmetric partial gaps. As described in Jang-Condell &
Turner (2012), the gap size can be correlated to planet mass according to the following ar-
guments. The mass at which a planet can open a gap depends upon both the scale height
of the disk and its viscosity. The thermal scale height of the disk is
h =csvφ
a (11)
where cs =√
kT/µ is the thermal sound speed measured at the midplane, k is the Boltzmann
constant, T is the local disk temperature, µ is the mean molecular weight, vφ =√
GM∗/a
is the orbital speed of the planet, and G is the gravitational constant. For a composition
dominated by molecular hydrogen, µ = 2mH . For a viscous protoplanetary disk, the criterion
– 18 –
for gap-opening can be expressed as
3
4
h
rHill
+50
qR . 1 (12)
(Crida et al. 2006), where the Hill radius of the planet is rHill =(
mp
3M∗
)1/3
a, q = mp/M∗ and
R ≡ r2ΩP /νv is the Reynolds number, and νv is the viscosity, given by νv = αcsh for an
α-disk model.
Bate et al. (2003) adopt disk parameters of h/r = 0.05 andR = 105 for their simulations,
giving a gap-opening threshold of q = 1.06 × 10⁻³ using Eq. (12), or slightly more than 1
MJ . For comparison, the inviscid gap-opening threshold would be 0.4 MJ . They find that
planets with q = 3×10⁻⁴ and 1×10⁻⁴ clear gaps of 90% and 50%, respectively, and a planet
with q = 3 × 10⁻⁵ creates a nearly negligible gap. Thus, a planet that clears a gap of 30%
would be between 0.03 and 0.1 of the viscous gap-opening threshold.
For TW Hya, our best-fit disk model has h/r = 0.081 and α = 5 × 10⁻⁴, giving R =
3.1 × 10⁵ and a viscous gap opening threshold of q = 1.1 × 10⁻³. If M∗ = 0.55M⊙, this is
197 M⊕. This implies that if an embedded planet is the cause of the gap we have modeled,
it must be between 6 − 20M⊕. However, there is some degeneracy with regard to α, as
discussed in §4.1. A larger value of α gives a lower Reynolds number, requiring a more
massive planet to open a gap and allowing a larger planet to hide in the disk. If we adopt
α = 1 × 10⁻³, corresponding to a maximum grain size of 1 mm, we find a gap opening
threshold of q = 1.5 × 10⁻³. Thus, a more conservative upper limit on the mass of a planet
at 80 AU in the TW Hya disk is 28 M⊕.
Crida et al. (2006) estimate the half-width of the gap to be ∼ 2rHill, based on the region
where gas streamlines form horseshoe orbits. If we take q = 10−4 and a = 80 AU, then the
gap width would be 5.1 AU. However, this width does not correspond to the widths of the
Gaussian-shaped gaps modeled in this work, since the gap shapes modeled in (Crida et al.
2006) are flat-bottomed. A Gaussian fitted to these gap shapes would have widths larger
than 2rHill. Thus a ∼ 20 AU gap width, as inferred by our models, is only slightly higher
than one might expect for a planet opening a gap.
6. Discussion
We have combined several resolved images of the TW Hya disk in scattered light with
spatially resolved spectroscopy of the disk. The spectrum of the disk in the visible and
near-IR is featureless, with a broad neutral to blue trend, indicative of sub-micron grains.
– 19 –
Based on our scattering models, disk grains composed of organics, water ice and silicates
that fit the SED also fit the scattered light, if they are as small as 0.005µm. We have chosen
a composition based on what is most likely present in the TW Hya disk, but we have not
exhaustively explored other materials. Any material that scatters neutrally in the visible to
near-IR could be suitable to explain the spectral shape we observe, but would also have to
be tested against the SED.
One implication of our work is that scattered light measurements can effectively con-
strain minimum grain size since the smallest dust typically has the largest available surface
area for scattering. TW Hya’s disk is very bright and thus requires the presence of small
grains. By the absence of any strong water ice absorption features, we can also directly
constrain the abundance of water ice on large grains; small grains show absorption features
at <10% the disk scattering continuum for the compositions we considered (see Figure 12),
below the level of our disk photometric uncertainties. A lack of absorption accords with
the expectation that large grains settle below the optical depth probed by scattered light
observations.
For our chosen composition, we can compare our water ice mass abundance to that of
Hogerheijde et al. (2011), whose mass is derived from their Herschel detection of water vapor
caused by UV dissociation at 100-150 AU. They interpreted the deficit of water vapor to
that predicted by their models as evidence for dust settling of large icy grains to the disk
midplane and calculated that there needed to be > 9× 1027 g of water ice in the disk. Our
scattered light images probe deeper in disk scale height than UV and are also consistent with
the idea that the bulk of the ice is on large grains that have settled toward the midplane.
If we take a disk mass in gas of 1.9×10⁻² M⊙, as assumed by Hogerheijde et al. (2011),
then we would predict a total ice mass in the disk from our models of 2×1029 g, based on
our mass abundance of 40% water ice in dust and a dust-to-gas ratio of 0.0138. The mass
increases by a factor of three if we use the inferred disk masses from our best fitting model,
which has an inferred disk mass closer to 0.07 M⊙. Assuming that we probe the local mass
abundance of water ice relative to gas at our τ = 2/3 surface at the disk, this would imply a
relative abundance of 5.6×10⁻³ at 30 AU above the midplane at 100 AU and 46 AU above
the midplane at 150 AU.
Our models must include a 30% cleared gap at 80 AU and a disk truncation exterior to
100 AU to match the observed surface brightness profiles. We place an upper limit on the
mass of a planetary companion that could be clearing the gap of 6–28 M⊕. In the following
we discuss potential remaining uncertainties.
– 20 –
6.1. Remaining Uncertainties
While our model successfully reproduces the observed properties of the TW Hya disk
over our wavelength range, there remain some uncertainties that will require follow-up study.
In particular, we further discuss the nature of the observed brightness asymmetry for the
disk seen at short wavelengths, the more spatially extended nature of small dust grains in
optical light compared to continuum sub-mm and mm observations, and alternative origins
for the observed gap at 80 AU.
The brightness asymmetry first reported by Roberge et al. (2005) and further character-
ized in §3.2 is strange given the asymmetry is only apparent at wavelengths ≤1.1µm, whereas
our models at any disk inclination would predict asymmetry at wavelengths >1µm also. A
warped inner disk, as suggested by Roberge et al. (2005) and Rosenfeld et al. (2012) also
seems unlikely, as that would also be expected to produce asymmetry at long wavelengths
as well. What could cause a wavelength dependence to the asymmetry?
For an inclined, optically thick disk with isotropically scattering grains, the near side of
the disk appears slightly brighter because of the lower opacity along the line of sight. How-
ever, the near side also appears foreshortened. Our azimuthal profiles were taken assuming
a circular disk, which would artificially decrease the surface brightness for position angles
corresponding to the side of the disk pointing towards the observer. Therefore, our models
do not uniquely predict the brightness asymmetry.
Forward scattering grains cancel the foreshortening effect by brightening the near side. If
the disk grains are substantially more forward scattering at short wavelengths, the apparent
brightness asymmetry could change with wavelength. However, forward scattering grains
would also make the whole disk look dimmer than observed, since we image it nearly face-
on.
TW Hya is known to have variable accretion (e.g. Dupree et al. 2012) and this could
drive changes in the scale height of the inner disk. Variability in the inner disk structure
is unlikely as the source of the changing asymmetry. Although the inner disk could change
scale height due to variable accretion, the F110W, STIS images and STIS spectroscopy show
the same asymmetry but were taken two, and then two more, years apart, respectively, while
the F160W image does not show asymmetry and was taken only three months before the
F110W image.
If portions of the outer disk were shadowed from direct starlight by a non-axisymmetric
bump or warp in the inner disk, that might be able to produce asymmetry in the observed
scattered light (Rosenfeld et al. 2012). The structure would become more optically thin at
longer wavelengths. The problem is that the visible-near-infrared extinction would have to
– 21 –
be nearly gray to match the observed photometry of the disk. That only happens from very
large grains, whereas we determine that very small grains are plentiful in the outer disk.
Alternatively, the lack of asymmetry at longer wavelengths could be the result of a
changing disk structure or grain population with depth, as longer wavelengths probe deeper
in the disk. The forward scattering grains seen at wavelengths shortwards of 1.1µm could
no longer be present deeper in the disk to be replaced by a different (perhaps larger) grain
population. Our models predict where the change-over in grain properties occurs as defined
by the scattering surface between F110W and F160W. At 80 AU the scattering surface of
the disk is at 19.9 AU above the midplane for 1.1µm while it is at 19.3 AU for 1.6µm. If
such a vertical transition exists, it would be within a very narrow layer of the disk. If any
upper layer structure is the cause for the azimuthal asymmetries, they must reside only in
layers >19.3 AU above the midplane. Such an abrupt change seems unlikely.
A more detailed examination of the effect of forward-scattering grains, coupled with
realistic models of forward scattering from aggregate grains will be needed to make progress
on interpreting the asymmetry.
We next discuss the overall size of the disk. As has been seen in CO and dust continuum
data at sub-mm and mm wavelengths, the gas in the disk of TW Hya extends much further
than sub-mm dust emission (Andrews et al. 2012a). This dichotomy apparently does not
extend to smaller grain-sizes as the scattered light disk is nearly co-spatial with the extent
of the CO gas.
We find that the best fit model for the scattered light has a large truncation knee, at
100 AU, although we explored values down to 60 AU. Smaller values of k produce steep
surface brightness profiles not warranted by our data (See Figure 2). In comparison, radio
interferometric observations find a much smaller truncation radii for similar models. Using
the similarity solution (Lynden-Bell & Pringle 1974):
Σ(R) =c1Rγ
exp
[
−(
R
k
)2−γ]
. (13)
Andrews et al. (2012b) find k=35-45 AU for values of γ between −1 and 1 fit SMA
observations at 870 µm continuum and the CO J3-2 line; Hughes et al. (2008) find k = 30
AU and γ = 0.7 for SMA observations at 1.3 mm and 870 µm (345 and 230 GHz) continuum,
although Hughes et al. (2011b) find k = 50 AU and γ = 1 is the best fit to the CO J(3-2);
and Isella et al. (2009) find k = 17.5 AU and γ = −0.3 for CARMA observations at 1.3 mm
continuum. Models by Gorti et al. (2011) find that a truncation knee of 35 AU and γ = 0.7
provide good fits to observations of gas emission lines in TW Hya.
– 22 –
The model fits to radio observations cited above predict that the disk density beyond
∼ 50 AU should be sharply cut off. As k and γ decrease, the more sharply the disk will
be truncated. However, the scattered light observations clearly indicate the presence of disk
material beyond 200 AU, so we do not expect to find a small truncation knee. The scattered
light brightness profile of the TW Hya disk suggests that the disk truncation is at a larger
radius than the radio observations imply. Since scattered light probes only the diffuse surface
layer of the disk while radio observations probe the deeper interior structure of the disk, the
difference in truncation radii may be attributable to layered disk structure, where the vertical
profile of the disk varies with distance in a way not adequately modeled simply by vertically
integrated surface density profiles. Conversely, there could be an overall lack of large grains
beyond ∼60-80 AU, indicative of grain growth frustration beyond this radial distance in the
disk.
Finally, we investigate other possibilities for the presence of the gap. It is interesting
to note in Figure 14 that at 80 AU, the center of the gap, the spectral character of the
disk is different than that seen in other portions of the disk. If this is real, then a different
composition in this annulus may be causing the overall structure of the disk to change, or
vice versa. Gaps in disks tend to receive larger amounts of UV photons due to isotropic
scattering of Lyman-α photons from higher layers of the disk (Bethell & Bergin 2011). The
excess UV photons can accelerate photo-desorption of ices, which could in turn change the
spectral character of the disk within the gap (Bergin et al. 2010; Hogerheijde et al. 2011).
Conversely, compositional changes in this gap might be caused by enhanced collisions
within the disk or the presence of an accreting protoplanet causing a steep truncation to the
disk. Both of these possibilities are supported in part by the recent discovery to a sharp
cutoff in the millimeter emission from dust at 60 AU, which is not present in similar high
resolution imaging of CO gas (Andrews et al. 2012a). Since we see scattered light from
dust well beyond this cut-off it is clearly due to a change in the bulk size distribution or
millimeter emission properties of the dust, which in of itself may be a signature of a planetary
companion or change in bulk dust composition.
The gap could instead be an unresolved spiral structure in the disk, as seen in NIC-
MOS images of HD 141569, where spiral structure at lower spatial resolution mimicked a
gap structure (Weinberger et al. 1999; Clampin et al. 2003). This could explain both the
asymmetry as well as the decrease in surface brightness and a hint of non-axisymmetric
structure is seen in the higher spatial resolution STIS images of the TW Hya disk. Higher
spatial resolution images might further solve this mystery.
The provocative nature of such a structure indicates that significant, large scale physical
processes at large separations occur for protoplanetary disks and can significantly impact

– 23 –
their midplane structures. Whatever the specific origin of this feature within the TW Hya
disk, the combined observations of optical/NIR scattering with longer wavelength photom-
etry and spatially resolved imaging may lead to a new understanding of the conditions in
which planetary systems form.
The authors would like to thank the anonymous referee for several helpful suggestions,
including a suggestion to investigate the spectral type of TW Hya. We would also like
to thank Ted Bergin, Diego Munoz, and Ruobing Dong for enlightening conversations on
alternative origins for disk gaps, as well as A. Meredith Hughes for discussions of TW Hya
CO data. Support for program #10167 was provided by NASA through a grant from the
Space Telescope Science Institute, which is operated by the Association of Universities for
Research in Astronomy, Inc., under NASA contract NAS 5-26555.
REFERENCES
Akeson, R. L., Millan-Gabet, R., Ciardi, D. R., Boden, A. F., Sargent, A. I., Monnier, J. D.,
McAlister, H., ten Brummelaar, T., Sturmann, J., Sturmann, L., & Turner, N. 2011,
ApJ, 728, 96
Alencar, S. H. P. & Batalha, C. 2002, ApJ, 571, 378
Ammons, S. M., Robinson, S. E., Strader, J., Laughlin, G., Fischer, D., & Wolf, A. 2006,
ApJ, 638, 1004
Andrews, S. M., Wilner, D. J., Hughes, A. M., Qi, C., Rosenfeld, K. A., Oberg, K. I.,
Birnstiel, T., Espaillat, C., Cieza, L. A., Williams, J. P., Lin, S.-Y., & Ho, P. T. P.
2012a, ApJ, 744, 162
—. 2012b, ApJ, 744, 162
Apai, D., Pascucci, I., Brandner, W., Henning, T., Lenzen, R., Potter, D. E., Lagrange,
A.-M., & Rousset, G. 2004, A&A, 415, 671
Baraffe, I., Chabrier, G., Allard, F., & Hauschildt, P. H. 1998, A&A, 337, 403
Batalha, C., Batalha, N. M., Alencar, S. H. P., Lopes, D. F., & Duarte, E. S. 2002, ApJ,
580, 343
Bate, M. R., Lubow, S. H., Ogilvie, G. I., & Miller, K. A. 2003, MNRAS, 341, 213
– 24 –
Bergin, E. A., Cleeves, L. I., Gorti, U., Zhang, K., Blake, G. A., Green, J. D., Andrews,
S. M., Evans, II, N. J., Henning, T., Oberg, K., Pontoppidan, K., Qi, C., Salyk, C.,
& van Dishoeck, E. F. 2013, Nature, 493, 644
Bergin, E. A., Hogerheijde, M. R., Brinch, C., Fogel, J., Yıldız, U. A., Kristensen, L. E.,
van Dishoeck, E. F., Bell, T. A., Blake, G. A., Cernicharo, J., Dominik, C., Lis,
D., Melnick, G., Neufeld, D., Panic, O., Pearson, J. C., Bachiller, R., Baudry, A.,
Benedettini, M., Benz, A. O., Bjerkeli, P., Bontemps, S., Braine, J., Bruderer, S.,
Caselli, P., Codella, C., Daniel, F., di Giorgio, A. M., Doty, S. D., Encrenaz, P., Fich,
M., Fuente, A., Giannini, T., Goicoechea, J. R., de Graauw, T., Helmich, F., Herczeg,
G. J., Herpin, F., Jacq, T., Johnstone, D., Jørgensen, J. K., Larsson, B., Liseau, R.,
Marseille, M., McCoey, C., Nisini, B., Olberg, M., Parise, B., Plume, R., Risacher,
C., Santiago-Garcıa, J., Saraceno, P., Shipman, R., Tafalla, M., van Kempen, T. A.,
Visser, R., Wampfler, S. F., Wyrowski, F., van der Tak, F., Jellema, W., Tielens,
A. G. G. M., Hartogh, P., Stutzki, J., & Szczerba, R. 2010, A&A, 521, L33
Bethell, T. J. & Bergin, E. A. 2011, ApJ, 739, 78
Boisse, I., Bonfils, X., & Santos, N. C. 2012, ArXiv e-prints
Bryden, G., Chen, X., Lin, D. N. C., Nelson, R. P., & Papaloizou, J. C. B. 1999, ApJ, 514,
344
Calvet, N., D’Alessio, P., Hartmann, L., Wilner, D., Walsh, A., & Sitko, M. 2002, The
Astrophysical Journal, 568, 1008, (c) 2002: The American Astronomical Society
Calvet, N., Patino, A., Magris, G. C., & D’Alessio, P. 1991, ApJ, 380, 617
Clampin, M., Krist, J. E., Ardila, D. R., Golimowski, D. A., Hartig, G. F., Ford, H. C.,
Illingworth, G. D., Bartko, F., Benıtez, N., Blakeslee, J. P., Bouwens, R. J., Broad-
hurst, T. J., Brown, R. A., Burrows, C. J., Cheng, E. S., Cross, N. J. G., Feldman,
P. D., Franx, M., Gronwall, C., Infante, L., Kimble, R. A., Lesser, M. P., Martel,
A. R., Menanteau, F., Meurer, G. R., Miley, G. K., Postman, M., Rosati, P., Sirianni,
M., Sparks, W. B., Tran, H. D., Tsvetanov, Z. I., White, R. L., & Zheng, W. 2003,
AJ, 126, 385
Crida, A., Morbidelli, A., & Masset, F. 2006, Icarus, 181, 587
D’Alessio, P., Calvet, N., & Hartmann, L. 2001, ApJ, 553, 321
D’Alessio, P., Calvet, N., Hartmann, L., Lizano, S., & Canto, J. 1999, ApJ, 527, 893
– 25 –
D’Alessio, P., Canto, J., Calvet, N., & Lizano, S. 1998, ApJ, 500, 411
de la Reza, R., Jilinski, E., & Ortega, V. G. 2006, The Astronomical Journal, 131, 2609, (c)
2006: The American Astronomical Society
Donati, J.-F., Gregory, S. G., Alencar, S. H. P., Bouvier, J., Hussain, G., Skelly, M., Douga-
dos, C., Jardine, M. M., Menard, F., Romanova, M. M., & Unruh, Y. C. 2011,
MNRAS, 417, 472
Dupree, A. K., Brickhouse, N. S., Cranmer, S. R., Luna, G. J. M., Schneider, E. E., Bessell,
M. S., Bonanos, A., Crause, L. A., Lawson, W. A., Mallik, S. V., & Schuler, S. C.
2012, ApJ, 750, 73
Frasca, A., Covino, E., Spezzi, L., Alcala, J. M., Marilli, E., Fzresz, G., & Gandolfi, D. 2009,
A&A, 508, 1313
Fukagawa, M., Hayashi, M., Tamura, M., Itoh, Y., Hayashi, S. S., Oasa, Y., Takeuchi, T.,
Morino, J.-i., Murakawa, K., Oya, S., Yamashita, T., Suto, H., Mayama, S., Naoi,
T., Ishii, M., Pyo, T.-S., Nishikawa, T., Takato, N., Usuda, T., Ando, H., Iye, M.,
Miyama, S. M., & Kaifu, N. 2004, ApJ, 605, L53
Gorti, U., Hollenbach, D., Najita, J., & Pascucci, I. 2011, ApJ, 735, 90
Gregg, M. D., Silva, D., Rayner, J., Valdes, F., Worthey, G., Pickles, A., Rose, J. A., Vacca,
W., & Carney, B. 2004, in Bulletin of the American Astronomical Society, Vol. 36,
American Astronomical Society Meeting Abstracts, 1496
Gregg, M. D., Silva, D., Rayner, J., Worthey, G., Valdes, F., Pickles, A., Rose, J., Carney,
B., & Vacca, W. 2006, in The 2005 HST Calibration Workshop: Hubble After the
Transition to Two-Gyro Mode, ed. A. M. Koekemoer, P. Goudfrooij, & L. L. Dressel,
209
Hartmann, L., Calvet, N., Gullbring, E., & D’Alessio, P. 1998, ApJ, 495, 385
Heap, S. & Lindler, D. J. 2009, in New Quests in Stellar Astrophysics. II. Ultraviolet Prop-
erties of Evolved Stellar Populations, ed. M. Chavez Dagostino, E. Bertone, D. Rosa
Gonzalez, & L. H. Rodriguez-Merino, 273–281
Heap, S. R. & Lindler, D. 2007, in IAU Symposium, Vol. 241, IAU Symposium, ed.
A. Vazdekis & R. F. Peletier, 95–96
– 26 –
Hogerheijde, M. R., Bergin, E. A., Brinch, C., Cleeves, L. I., Fogel, J. K. J., Blake, G. A., Do-
minik, C., Lis, D. C., Melnick, G., Neufeld, D., Panic, O., Pearson, J. C., Kristensen,
L., Yıldız, U. A., & van Dishoeck, E. F. 2011, Science, 334, 338
Houdebine, E. R. 2010, MNRAS, 407, 1657
Huelamo, N., Figueira, P., Bonfils, X., Santos, N. C., Pepe, F., Gillon, M., Azevedo, R.,
Barman, T., Fernandez, M., di Folco, E., Guenther, E. W., Lovis, C., Melo, C. H. F.,
Queloz, D., & Udry, S. 2008, A&A, 489, L9
Hughes, A. M., Wilner, D. J., Andrews, S. M., Qi, C., & Hogerheijde, M. R. 2011a, ApJ,
727, 85
—. 2011b, ApJ, 727, 85
Hughes, A. M., Wilner, D. J., Calvet, N., D’Alessio, P., Claussen, M. J., & Hogerheijde, M. R.
2007, The Astrophysical Journal, 664, 536, (c) 2007: The American Astronomical
Society
Hughes, A. M., Wilner, D. J., Qi, C., & Hogerheijde, M. R. 2008, ApJ, 678, 1119
Isella, A., Carpenter, J. M., & Sargent, A. I. 2009, ApJ, 701, 260
Ivanov, V. D., Rieke, M. J., Engelbracht, C. W., Alonso-Herrero, A., Rieke, G. H., &
Luhman, K. L. 2004, ApJS, 151, 387
Jang-Condell, H. 2008, ApJ, 679, 797
—. 2009, ApJ, 700, 820
Jang-Condell, H. & Sasselov, D. D. 2003, ApJ, 593, 1116
—. 2004, ApJ, 608, 497
Jang-Condell, H. & Turner, N. J. 2012, ApJ, 749, 153
Jenkins, J. S., Ramsey, L. W., Jones, H. R. A., Pavlenko, Y., Gallardo, J., Barnes, J. R., &
Pinfield, D. J. 2009, ApJ, 704, 975
Katz, D., Soubiran, C., Cayrel, R., Barbuy, B., Friel, E., Bienayme, O., & Perrin, M.-N.
2011, A&A, 525, A90
Koleva, M. & Vazdekis, A. 2012, A&A, 538, A143
Kovtyukh, V. V., Soubiran, C., Belik, S. I., & Gorlova, N. I. 2003, A&A, 411, 559
– 27 –
Krist, J. E., Stapelfeldt, K. R., Menard, F., Padgett, D. L., & Burrows, C. J. 2000, The
Astrophysical Journal, 538, 793, (c) 2000: The American Astronomical Society
Laor, A. & Draine, B. T. 1993, ApJ, 402, 441
Lynden-Bell, D. & Pringle, J. E. 1974, MNRAS, 168, 603
Marois, C., Macintosh, B., Barman, T., Zuckerman, B., Song, I., Patience, J., Lafreniere,
D., & Doyon, R. 2008, Science, 322, 1348
Mentuch, E., Brandeker, A., van Kerkwijk, M. H., Jayawardhana, R., & Hauschildt, P. H.
2008, The Astrophysical Journal, 689, 1127, (c) 2008: The American Astronomical
Society
Milone, A. D. C., Sansom, A. E., & Sanchez-Blazquez, P. 2011, MNRAS, 414, 1227
Morales, J. C., Ribas, I., & Jordi, C. 2008, A&A, 478, 507
Navascues, D. B. Y. 2006, Astronomy and Astrophysics, 459, 511
Prugniel, P. & Soubiran, C. 2001, A&A, 369, 1048
Prugniel, P., Vauglin, I., & Koleva, M. 2011, A&A, 531, A165
Qi, C., Ho, P. T. P., Wilner, D. J., Takakuwa, S., Hirano, N., Ohashi, N., Bourke, T. L.,
Zhang, Q., Blake, G. A., Hogerheijde, M., Saito, M., Choi, M., & Yang, J. 2004, ApJ,
616, L11
Qi, C., Wilner, D. J., Aikawa, Y., Blake, G. A., & Hogerheijde, M. R. 2008, ApJ, 681, 1396
Qi, C., Wilner, D. J., Calvet, N., Bourke, T. L., Blake, G. A., Hogerheijde, M. R., Ho,
P. T. P., & Bergin, E. 2006, The Astrophysical Journal, 636, L157, (c) 2006: The
American Astronomical Society
Roberge, A., Weinberger, A. J., & Malumuth, E. M. 2005, The Astrophysical Journal, 622,
1171, (c) 2005: The American Astronomical Society
Rosenfeld, K. A., Qi, C., Andrews, S. M., Wilner, D. J., Corder, S. A., Dullemond, C. P.,
Lin, S.-Y., Hughes, A. M., D’Alessio, P., & Ho, P. T. P. 2012, ApJ, 757, 129
Rucinski, S. M. & Krautter, J. 1983, Astronomy and Astrophysics (ISSN 0004-6361), 121,
217
Schneider, G., Becklin, E. E., Smith, B. A., Weinberger, A. J., Silverstone, M., & Hines,
D. C. 2001, AJ, 121, 525
– 28 –
Schneider, G., Silverstone, M. D., & Hines, D. C. 2005, ApJ, 629, L117
Soubiran, C., Bienayme, O., Mishenina, T. V., & Kovtyukh, V. V. 2008, A&A, 480, 91
Soubiran, C., Le Campion, J.-F., Cayrel de Strobel, G., & Caillo, A. 2010, A&A, 515, A111
Takeda, G., Ford, E. B., Sills, A., Rasio, F. A., Fischer, D. A., & Valenti, J. A. 2007, ApJS,
168, 297
Vacca, W. D. & Sandell, G. 2011, ApJ, 732, 8
van Belle, G. T. & von Braun, K. 2009, ApJ, 694, 1085
van Leeuwen, F. 2007, Springer
Warren, S. G. 1984, Appl. Opt., 23, 1206
Webb, R. A., Zuckerman, B., Platais, I., Patience, J., White, R. J., Schwartz, M. J., &
McCarthy, C. 1999, ApJ, 512, L63
Weinberger, A. J., Anglada-Escude, G., & Boss, A. P. 2013, ApJ, 762, 118
Weinberger, A. J., Becklin, E. E., Schneider, G., Chiang, E. I., Lowrance, P. J., Silverstone,
M. D., Zuckerman, B., Hines, D. C., & Smith, B. A. 2002, The Astrophysical Journal,
566, 409, (c) 2002: The American Astronomical Society
Weinberger, A. J., Becklin, E. E., Schneider, G., Smith, B. A., Lowrance, P. J., Silverstone,
M. D., Zuckerman, B., & Terrile, R. J. 1999, ApJ, 525, L53
Weintraub, D. A., Sandell, G., & Duncan, W. D. 1989, ApJ, 340, L69
Wilner, D. J., D’Alessio, P., Calvet, N., Claussen, M. J., & Hartmann, L. 2005, The Astro-
physical Journal, 626, L109, (c) 2005: The American Astronomical Society
Wilner, D. J., Ho, P. T. P., Kastner, J. H., & Rodrıguez, L. F. 2000, The Astrophysical
Journal, 534, L101, (c) 2000: The American Astronomical Society
Wolf, S. & Voshchinnikov, N. V. 2004, Computer Physics Communications, 162, 113
Wright, N. J., Drake, J. J., Mamajek, E. E., & Henry, G. W. 2011, ApJ, 743, 48
Yang, H., Johns-Krull, C. M., & Valenti, J. A. 2005, ApJ, 635, 466
This preprint was prepared with the AAS LATEX macros v5.2.
– 29 –
Table 1. Photometry of TW Hya and PSF Scalings
Filter PSF Reference Star Scaling TW Hya Flux Density (Jy)
STIS HD 85512 0.0544,0.0586 0.1862
F110W τ 1 Eridani 0.099±0.0027 0.747
F160W Gl 879 0.031±0.002 1.03
F171M CD-432742 0.541±0.008 0.94±0.01
F180M CD-432742 0.528±0.001 0.84±0.01
F204M CD-432742 0.56±0.01 0.77±0.01
F222M CD-432742 0.61±0.01 0.76±0.02
Table 2. Spectral Comparisons from the STIS NGSL
Star Spectral Type Teff (K) Radius (R⊙) Refs.
HR 8086 K7V 3985±115 0.628 4,7,8,11,12,16,17
HIP 32939 M0V 4352 ... 1
GJ 825 M0V 3729±164 0.51 7,10,14,15
HD 33793 sdM1 3585±93 ... 3,7,14
BD+442051 M2V 3600±300 ... 2,6,7,9,11,13,14
HD 95735 M2V 3597±131 0.359 3,5-7,12,16
References. — (1) Ammons et al. (2006); (2)Frasca et al. (2009); (3) Houde-
bine (2010); (4) Ivanov et al. (2004); (5) Jenkins et al. (2009); (6) Katz et al.
(2011); (7) Koleva & Vazdekis (2012); (8) Kovtyukh et al. (2003); (9) Milone
et al. (2011); (10) Morales et al. (2008); (11) Prugniel & Soubiran (2001);
(12) Prugniel et al. (2011); (13) Soubiran et al. (2008); (14) Soubiran et al.
(2010); (15) Takeda et al. (2007); (16) van Belle & von Braun (2009); (17)
Wright et al. (2011)
– 30 –
F222M
F171M F180M
F204M
1"
0.70−0.52−1.75log mJy/(arcsec)2
N
E
Fig. 1.— Final, roll combined, PSF-subtracted images of TW Hya in the four medium band
filters observed, F171M, F180M, F204M, and F222M. Regions in which there is no data, i.e.
under the coronagraph are blacked out. The mottled appearance in the filters, particularly
F204M, is the result of systematic residuals from diffraction and scattering patterns within
the NICMOS camera.
– 31 –
1 2 3 4R (Arcsec)
10-6
10-5
10-4
10-3
SB
(Jy
/Arc
sec2 )
1 2 3 4R (Arcsec)
10-6
10-5
10-4
10-3
SB
(Jy
/Arc
sec2 )
F171MF180MF204MF222M
53 AU 107 AU 161 AU 214 AU
Fig. 2.— Surface brightness profiles of the TW Hya disk at 1.71, 1.80, 2.04, and 2.22 µm.
The 1.80, 2.04, and 2.22 µm curves are scaled by factors of 0.5, 0.25, and 0.125 respectively.
Overplotted on the F222M data are three gap-less flared disk models with self-similar expo-
nential truncation knees at 60 (solid line), 100 (dashed line), and 150 AU (dash-dotted line;
See §4.3). None of the gap-less models fit the changes in the SB profile we observe across
multiple wavelengths.
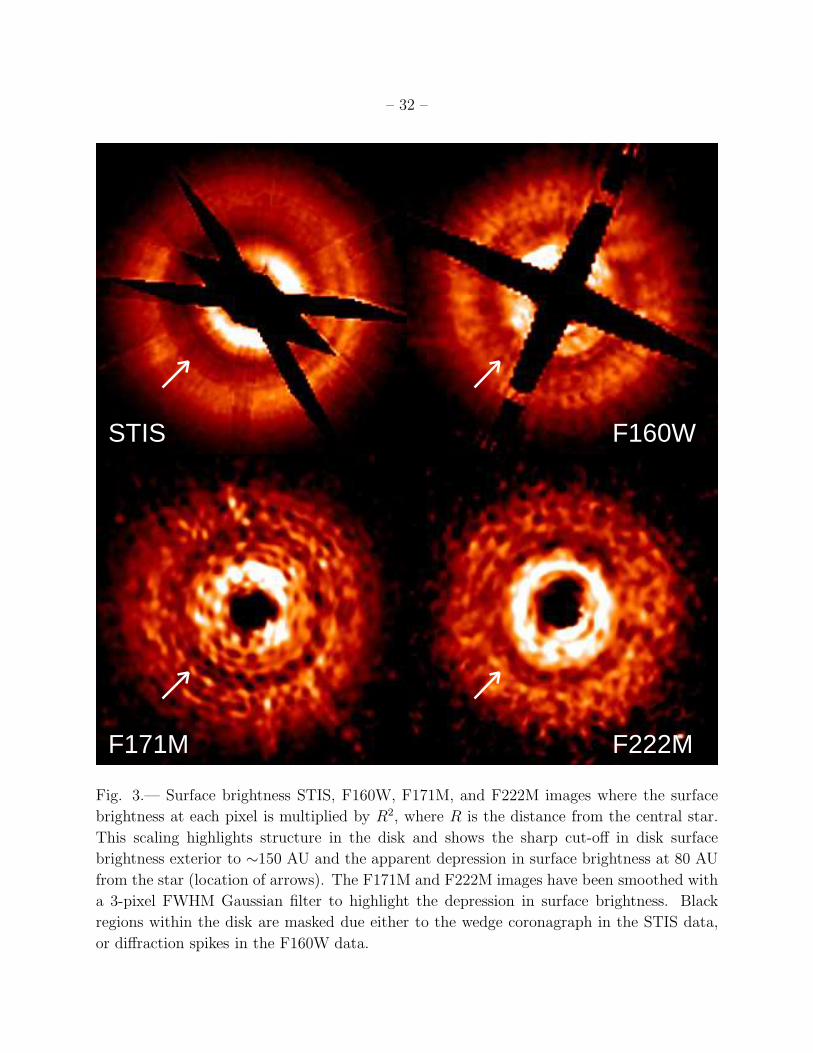
– 32 –
F222M
STIS F160W
F171M
Fig. 3.— Surface brightness STIS, F160W, F171M, and F222M images where the surface
brightness at each pixel is multiplied by R2, where R is the distance from the central star.
This scaling highlights structure in the disk and shows the sharp cut-off in disk surface
brightness exterior to ∼150 AU and the apparent depression in surface brightness at 80 AU
from the star (location of arrows). The F171M and F222M images have been smoothed with
a 3-pixel FWHM Gaussian filter to highlight the depression in surface brightness. Black
regions within the disk are masked due either to the wedge coronagraph in the STIS data,
or diffraction spikes in the F160W data.
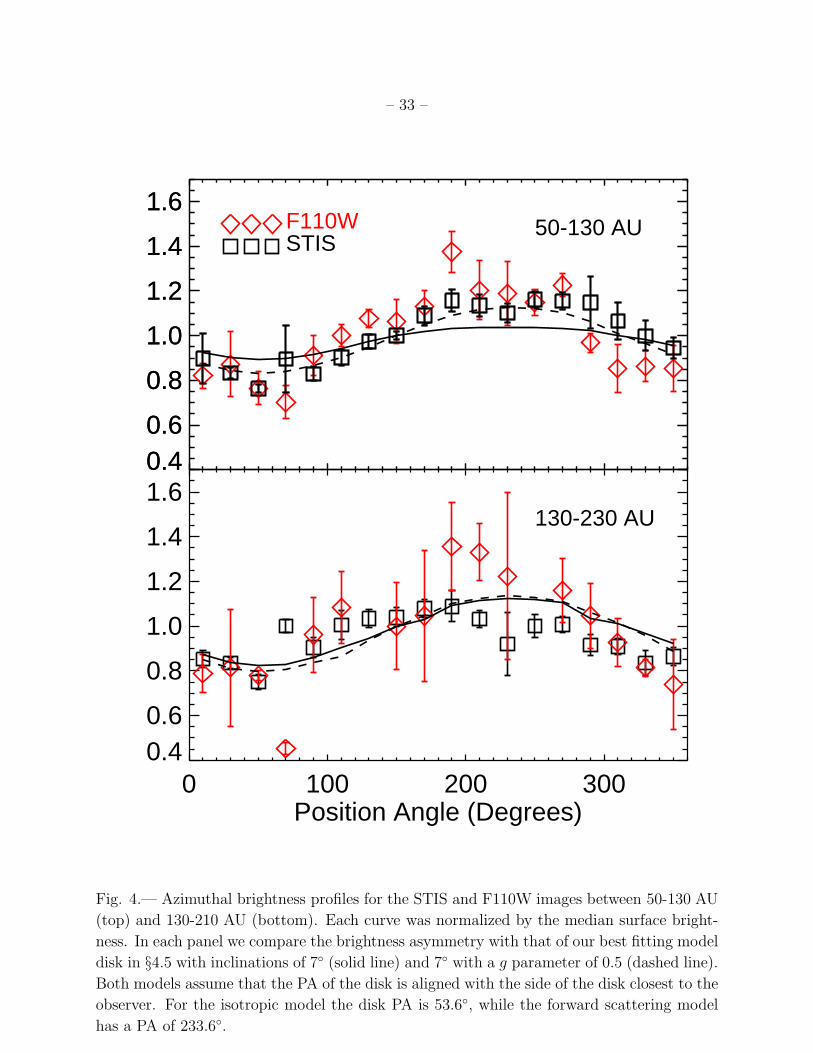
– 33 –
0.40.6
0.8
1.0
1.2
1.4
1.6
0.40.6
0.8
1.0
1.2
1.4
1.6
STISF110W 50-130 AU
0 100 200 300Position Angle (Degrees)
0.40.6
0.8
1.0
1.2
1.4
1.6130-230 AU
Fig. 4.— Azimuthal brightness profiles for the STIS and F110W images between 50-130 AU
(top) and 130-210 AU (bottom). Each curve was normalized by the median surface bright-
ness. In each panel we compare the brightness asymmetry with that of our best fitting model
disk in §4.5 with inclinations of 7 (solid line) and 7 with a g parameter of 0.5 (dashed line).
Both models assume that the PA of the disk is aligned with the side of the disk closest to the
observer. For the isotropic model the disk PA is 53.6, while the forward scattering model
has a PA of 233.6.
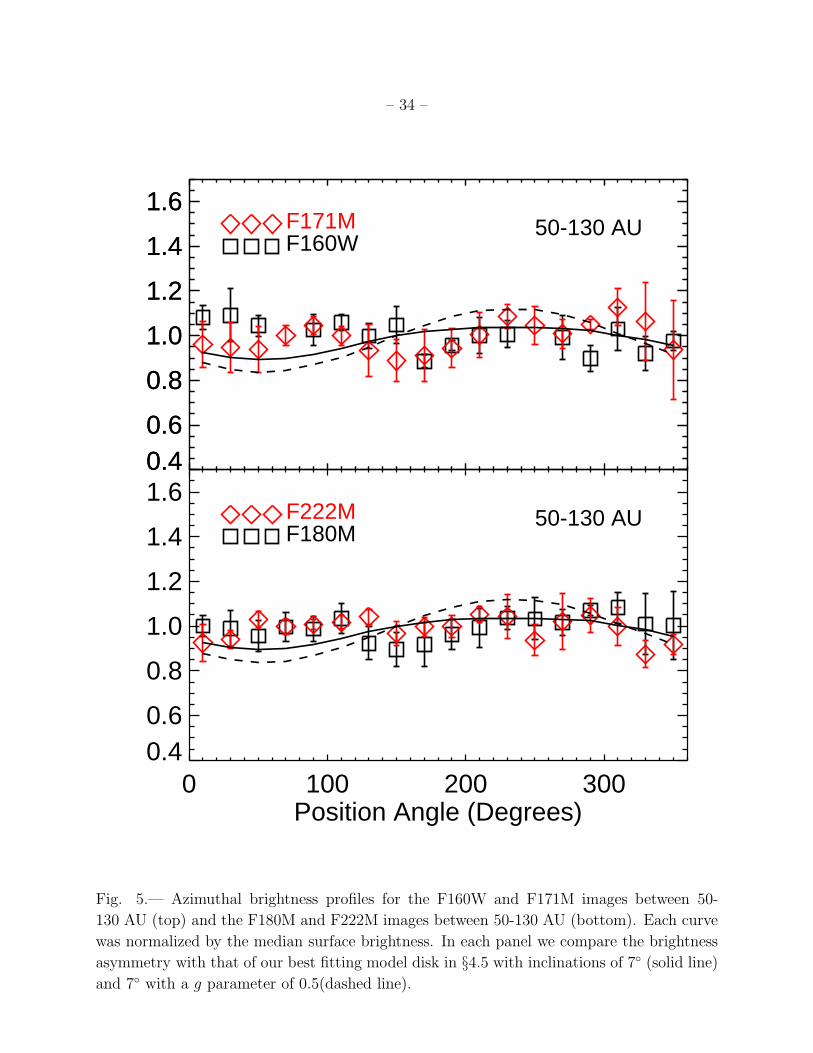
– 34 –
0.40.6
0.8
1.0
1.2
1.4
1.6
0.40.6
0.8
1.0
1.2
1.4
1.6
F160WF171M 50-130 AU
0 100 200 300Position Angle (Degrees)
0.40.6
0.8
1.0
1.2
1.4
1.6
F180MF222M 50-130 AU
Fig. 5.— Azimuthal brightness profiles for the F160W and F171M images between 50-
130 AU (top) and the F180M and F222M images between 50-130 AU (bottom). Each curve
was normalized by the median surface brightness. In each panel we compare the brightness
asymmetry with that of our best fitting model disk in §4.5 with inclinations of 7 (solid line)
and 7 with a g parameter of 0.5(dashed line).
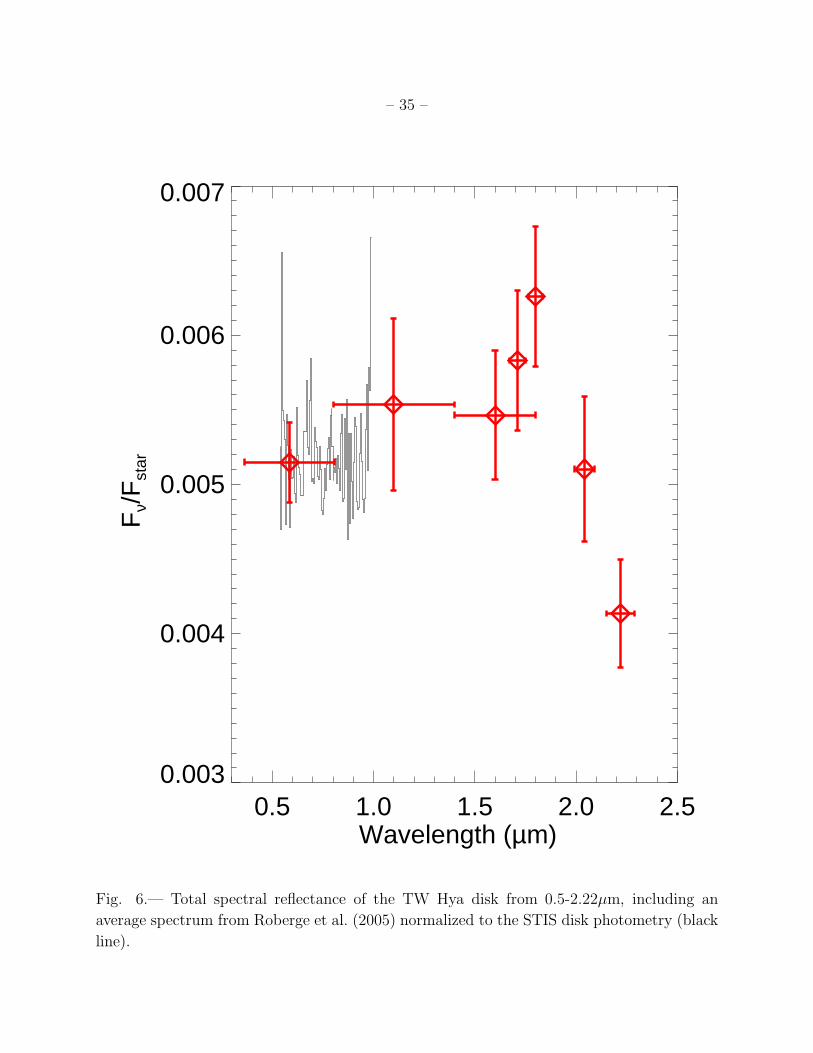
– 35 –
0.5 1.0 1.5 2.0 2.5Wavelength (µm)
0.003
0.004
0.005
0.006
0.007
Fν/
Fst
ar
Fig. 6.— Total spectral reflectance of the TW Hya disk from 0.5-2.22µm, including an
average spectrum from Roberge et al. (2005) normalized to the STIS disk photometry (black
line).
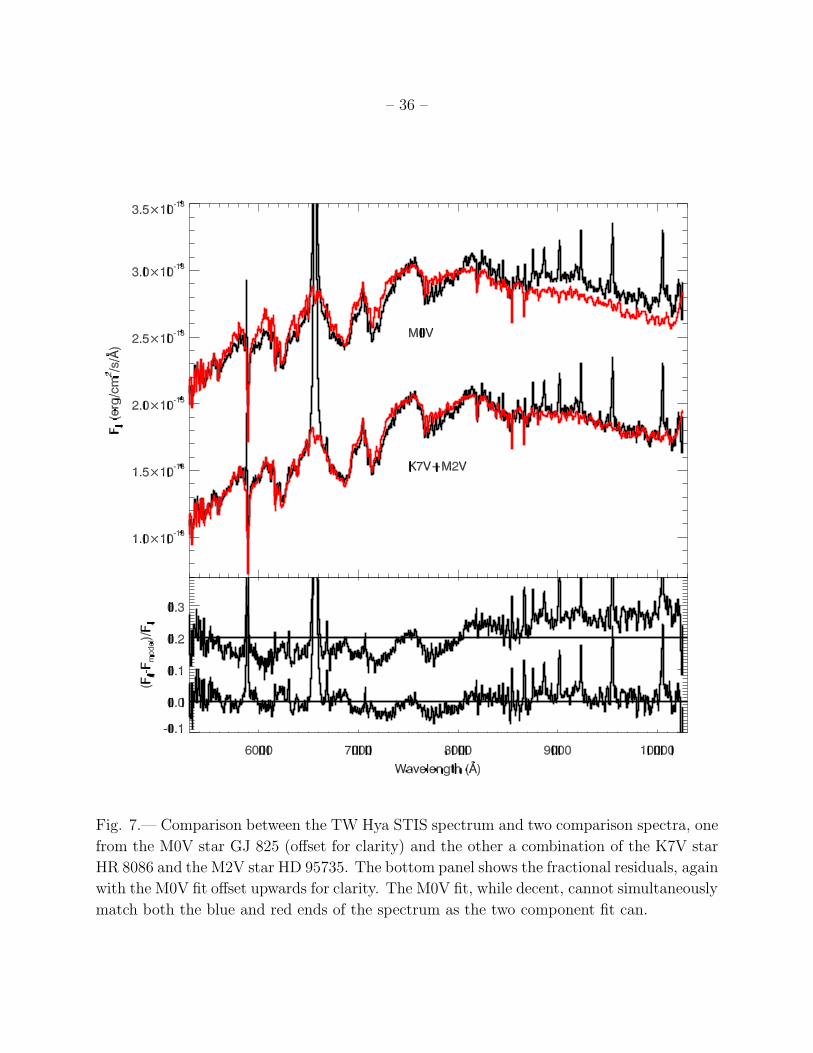
– 36 –
Fig. 7.— Comparison between the TW Hya STIS spectrum and two comparison spectra, one
from the M0V star GJ 825 (offset for clarity) and the other a combination of the K7V star
HR 8086 and the M2V star HD 95735. The bottom panel shows the fractional residuals, again
with the M0V fit offset upwards for clarity. The M0V fit, while decent, cannot simultaneously
match both the blue and red ends of the spectrum as the two component fit can.
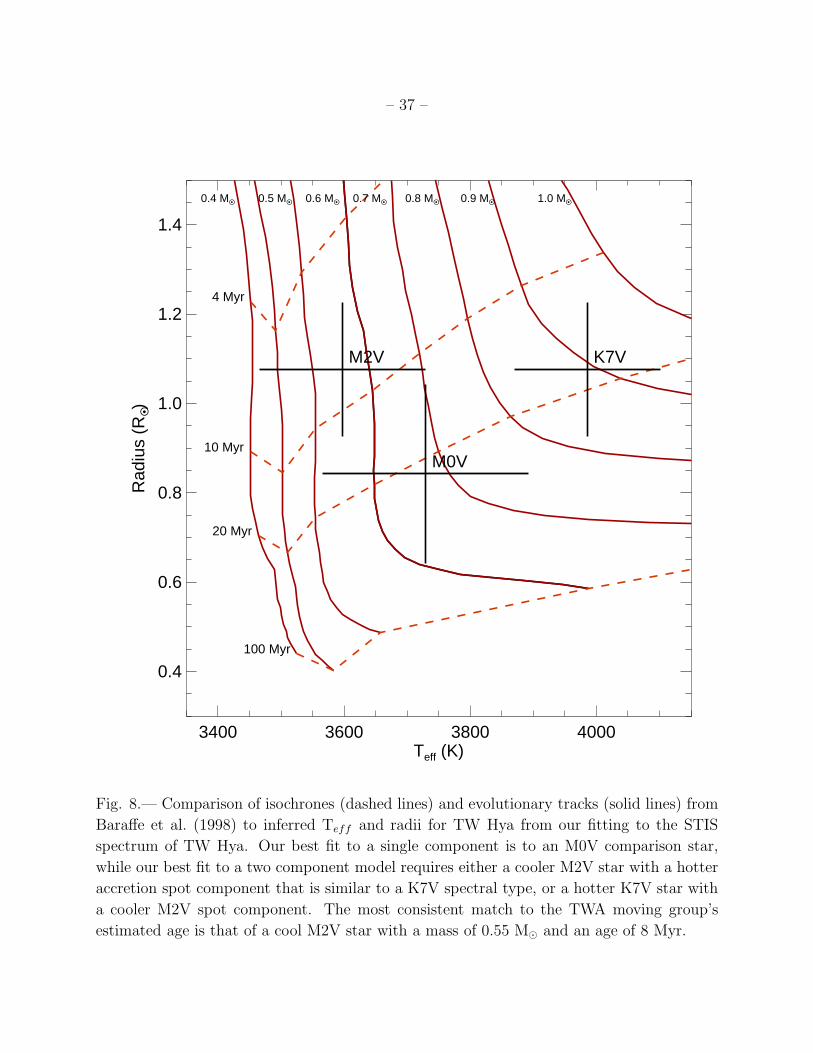
– 37 –
3400 3600 3800 4000Teff (K)
0.4
0.6
0.8
1.0
1.2
1.4
Rad
ius
(RO •)
M2V
M0V
K7V
100 Myr
20 Myr
10 Myr
4 Myr
0.4 MO •
0.5 MO •
0.6 MO •
0.7 MO •
0.8 MO •
0.9 MO •
1.0 MO •
Fig. 8.— Comparison of isochrones (dashed lines) and evolutionary tracks (solid lines) from
Baraffe et al. (1998) to inferred Teff and radii for TW Hya from our fitting to the STIS
spectrum of TW Hya. Our best fit to a single component is to an M0V comparison star,
while our best fit to a two component model requires either a cooler M2V star with a hotter
accretion spot component that is similar to a K7V spectral type, or a hotter K7V star with
a cooler M2V spot component. The most consistent match to the TWA moving group’s
estimated age is that of a cool M2V star with a mass of 0.55 M⊙ and an age of 8 Myr.
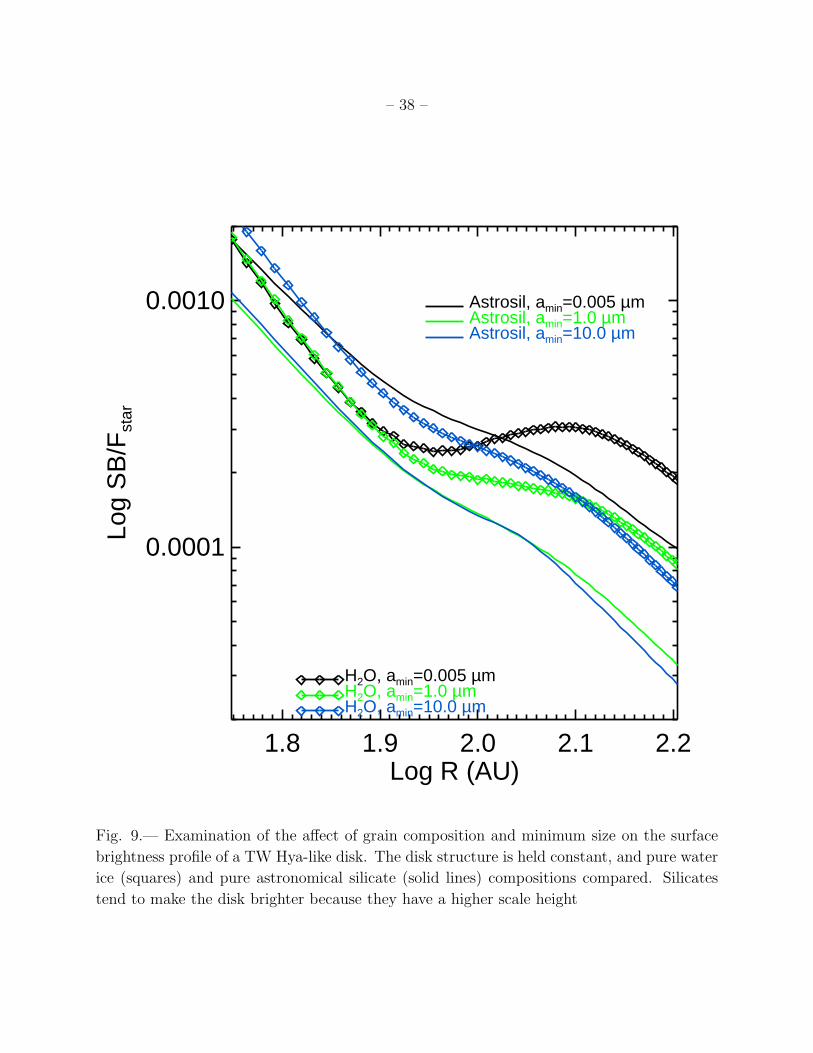
– 38 –
1.8 1.9 2.0 2.1 2.2Log R (AU)
0.0001
0.0010
Log
SB
/Fst
ar
H2O, amin=0.005 µmH2O, amin=1.0 µmH2O, amin=10.0 µm
Astrosil, amin=0.005 µmAstrosil, amin=1.0 µmAstrosil, amin=10.0 µm
Fig. 9.— Examination of the affect of grain composition and minimum size on the surface
brightness profile of a TW Hya-like disk. The disk structure is held constant, and pure water
ice (squares) and pure astronomical silicate (solid lines) compositions compared. Silicates
tend to make the disk brighter because they have a higher scale height
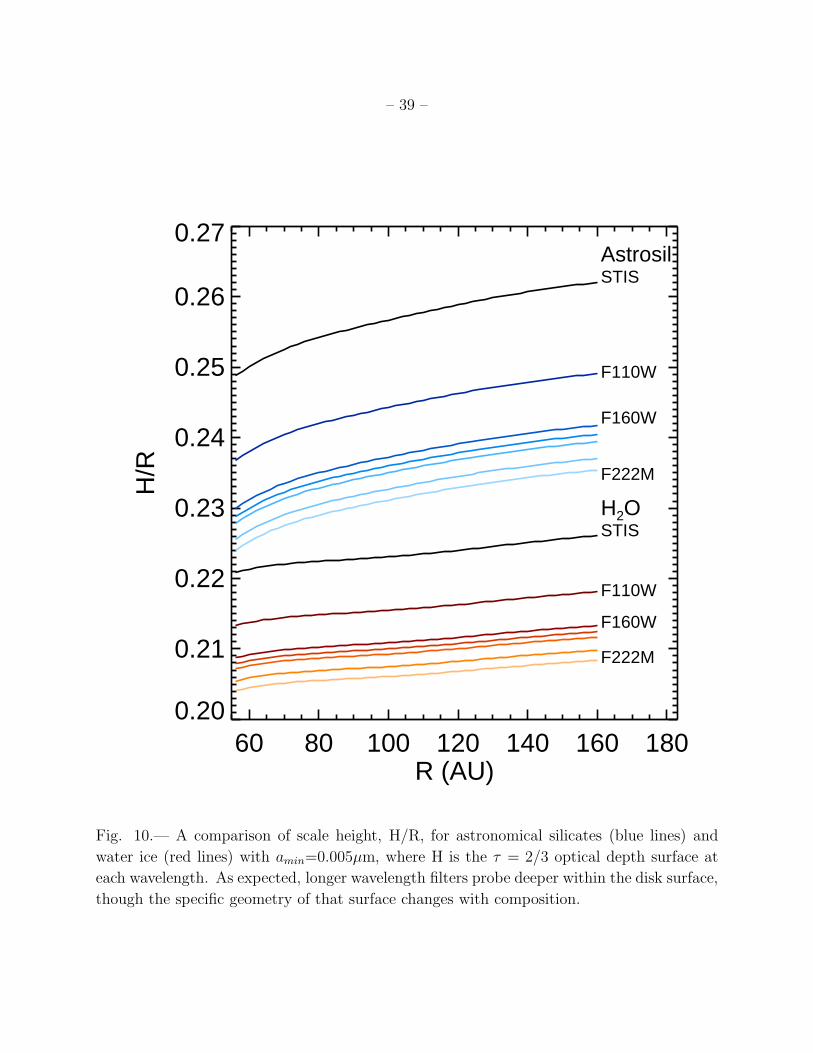
– 39 –
60 80 100 120 140 160 180R (AU)
0.20
0.21
0.22
0.23
0.24
0.25
0.26
0.27
H/R
AstrosilSTIS
F110W
F160W
F222M
H2OSTIS
F110W
F160W
F222M
Fig. 10.— A comparison of scale height, H/R, for astronomical silicates (blue lines) and
water ice (red lines) with amin=0.005µm, where H is the τ = 2/3 optical depth surface at
each wavelength. As expected, longer wavelength filters probe deeper within the disk surface,
though the specific geometry of that surface changes with composition.
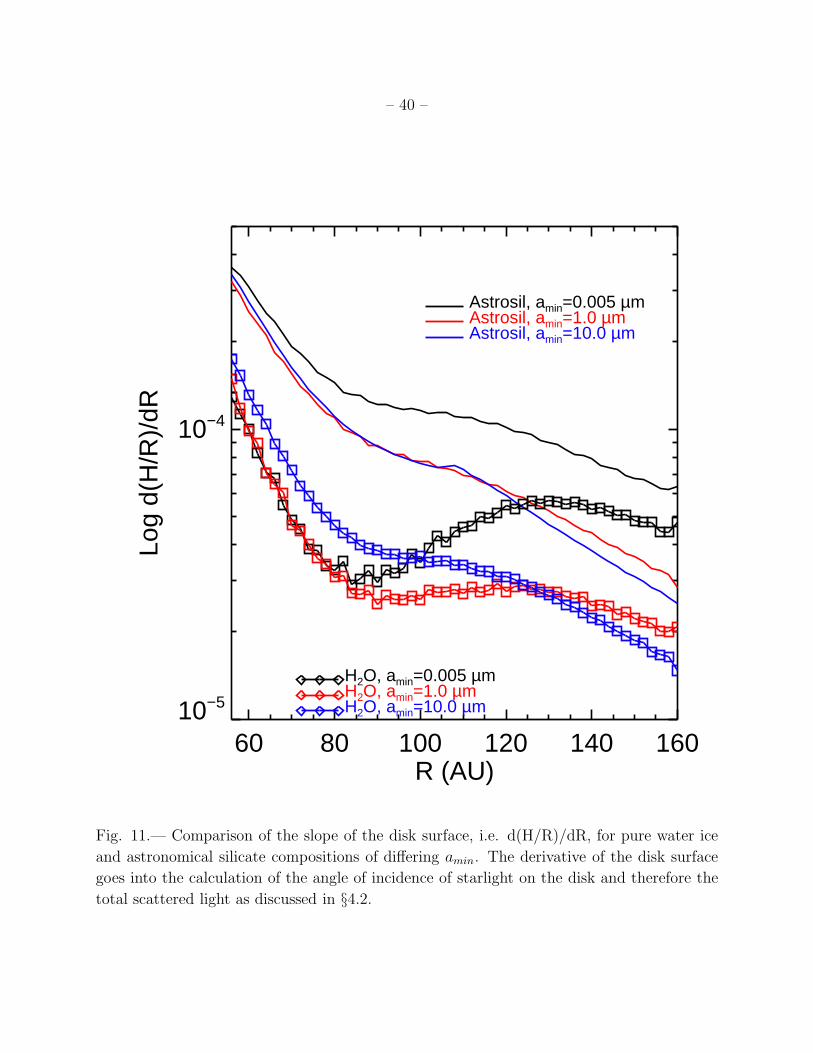
– 40 –
60 80 100 120 140 160R (AU)
10−5
10−4
Log
d(H
/R)/
dR
H2O, amin=0.005 µmH2O, amin=1.0 µmH2O, amin=10.0 µm
Astrosil, amin=0.005 µmAstrosil, amin=1.0 µmAstrosil, amin=10.0 µm
Fig. 11.— Comparison of the slope of the disk surface, i.e. d(H/R)/dR, for pure water ice
and astronomical silicate compositions of differing amin. The derivative of the disk surface
goes into the calculation of the angle of incidence of starlight on the disk and therefore the
total scattered light as discussed in §4.2.
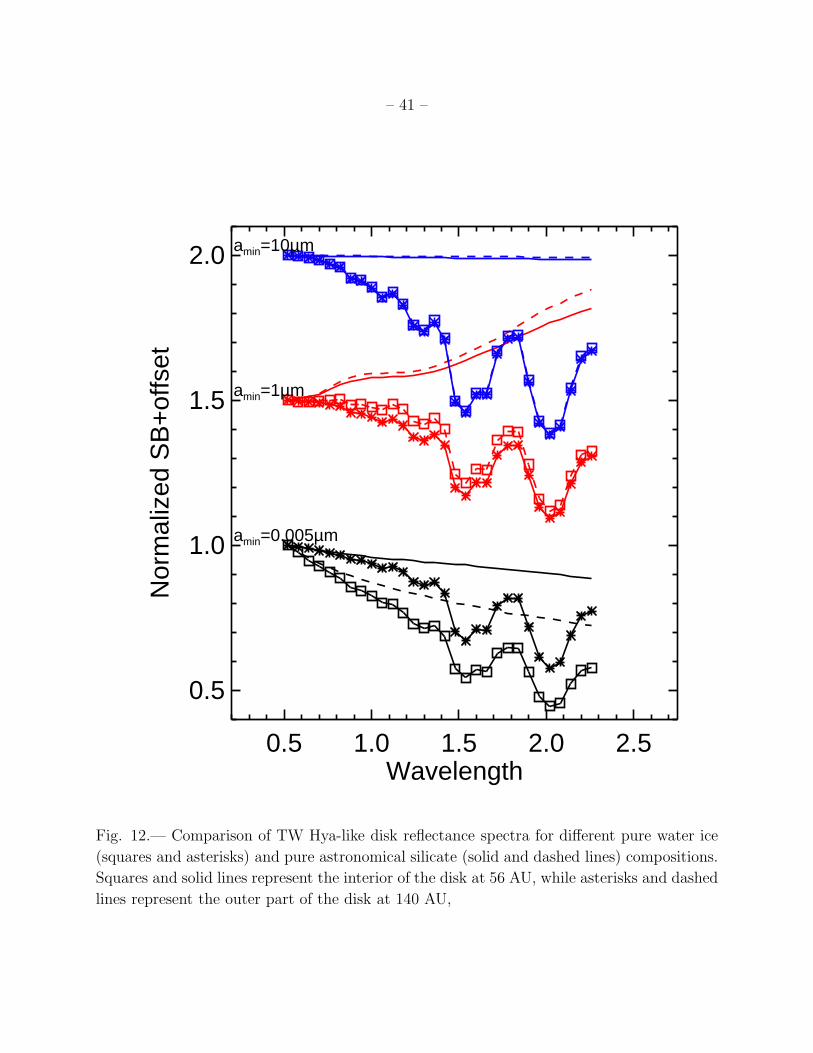
– 41 –
0.5 1.0 1.5 2.0 2.5Wavelength
0.5
1.0
1.5
2.0
Nor
mal
ized
SB
+of
fset
amin=10µm
amin=1µm
amin=0.005µm
Fig. 12.— Comparison of TW Hya-like disk reflectance spectra for different pure water ice
(squares and asterisks) and pure astronomical silicate (solid and dashed lines) compositions.
Squares and solid lines represent the interior of the disk at 56 AU, while asterisks and dashed
lines represent the outer part of the disk at 140 AU,
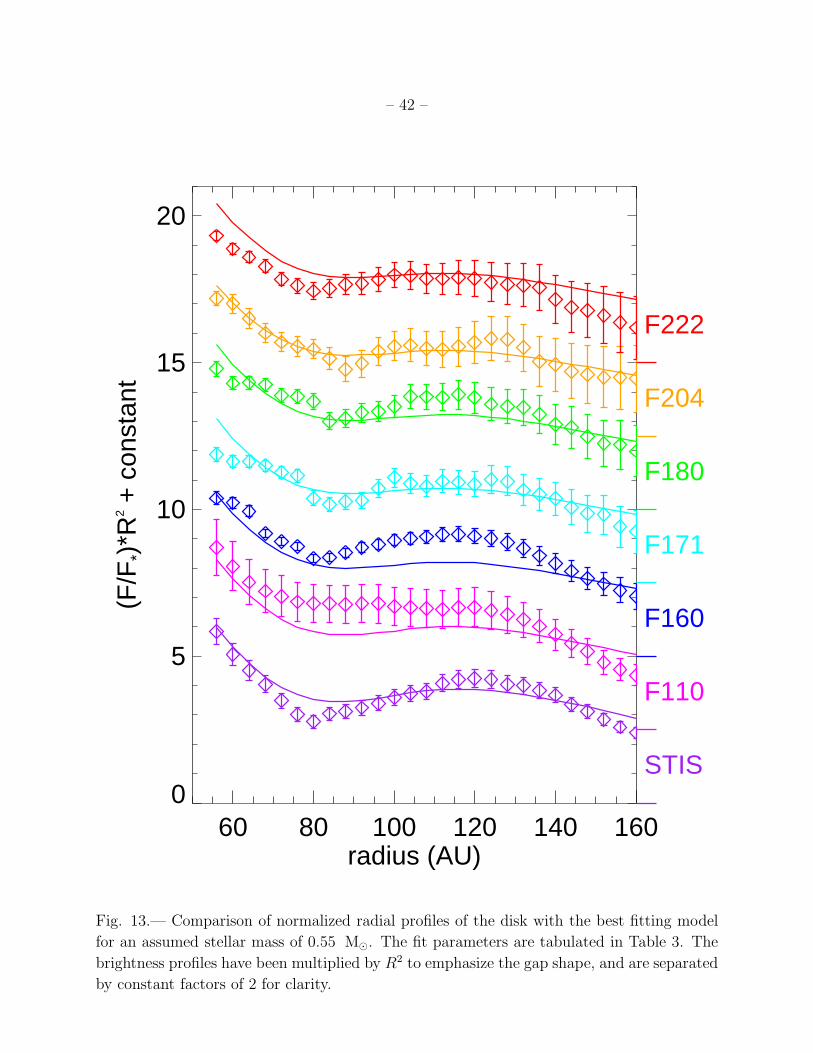
– 42 –
60 80 100 120 140 160radius (AU)
0
5
10
15
20
(F/F
*)*R
2 + c
onst
ant
STIS
F110
F160
F171
F180
F204
F222
Fig. 13.— Comparison of normalized radial profiles of the disk with the best fitting model
for an assumed stellar mass of 0.55 M⊙. The fit parameters are tabulated in Table 3. The
brightness profiles have been multiplied by R2 to emphasize the gap shape, and are separated
by constant factors of 2 for clarity.
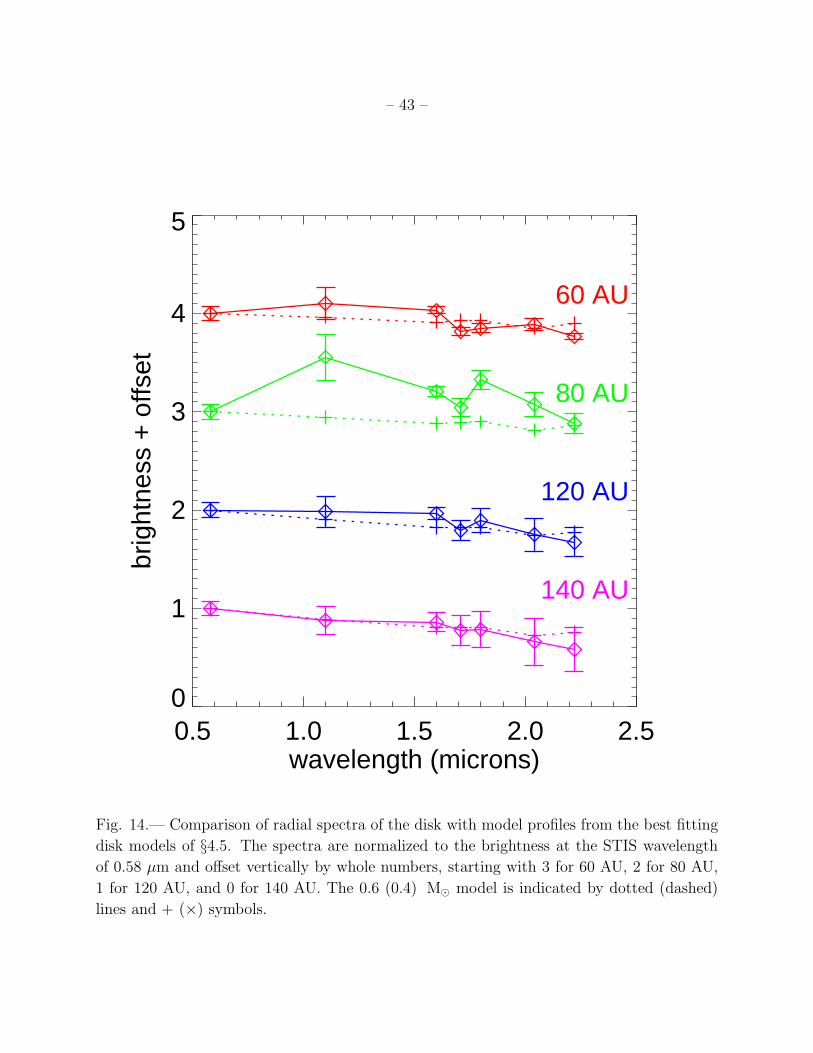
– 43 –
0.5 1.0 1.5 2.0 2.5wavelength (microns)
0
1
2
3
4
5
brig
htne
ss +
offs
et
60 AU
80 AU
120 AU
140 AU
Fig. 14.— Comparison of radial spectra of the disk with model profiles from the best fitting
disk models of §4.5. The spectra are normalized to the brightness at the STIS wavelength
of 0.58 µm and offset vertically by whole numbers, starting with 3 for 60 AU, 2 for 80 AU,
1 for 120 AU, and 0 for 140 AU. The 0.6 (0.4) M⊙ model is indicated by dotted (dashed)
lines and + (×) symbols.
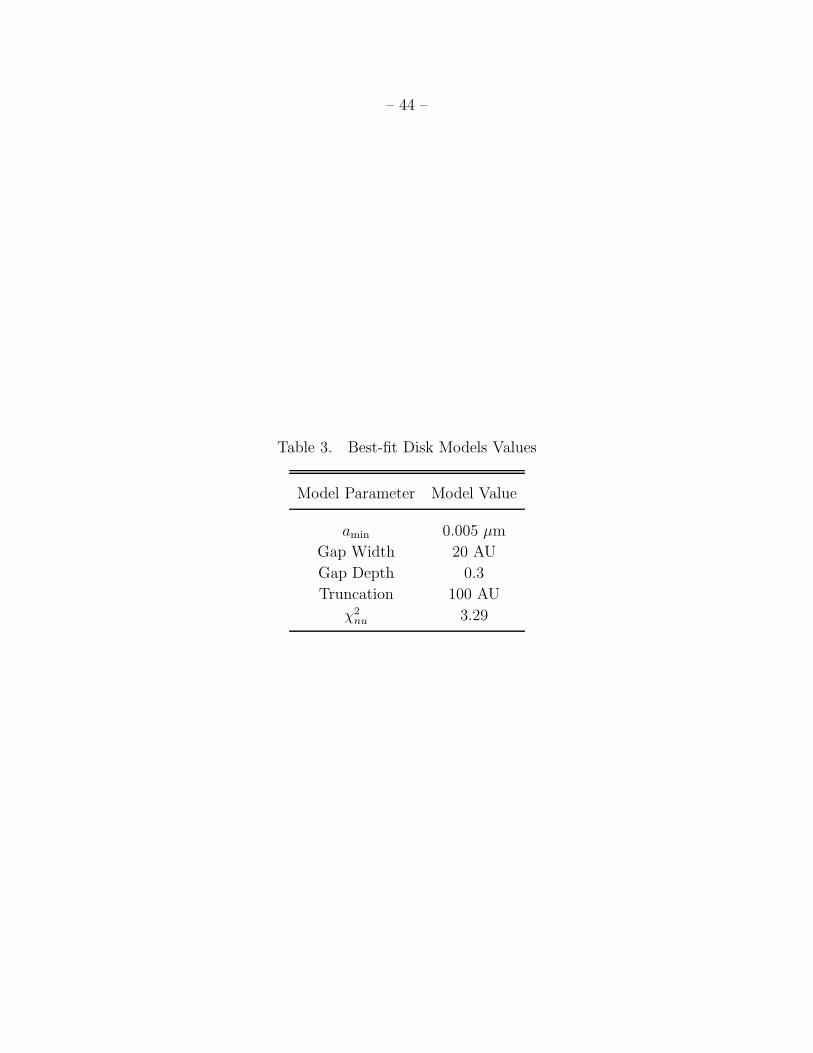
– 44 –
Table 3. Best-fit Disk Models Values
Model Parameter Model Value
amin 0.005 µm
Gap Width 20 AU
Gap Depth 0.3
Truncation 100 AU
χ2nu 3.29