Embed Size (px)
Citation preview

Anti-Immigrant Attitudes in Europe: Outgroup-size and Perceived Ethnic Threat
Silke Schneider Department of Sociology/Nuffield College

20/02/2007 2
Contents Research question Theory Hypotheses Previous research Method Results Conclusions The big BUT…

20/02/2007 3
Research Question Does the actual presence of immigrants
influence anti-immigrant attitudes in a country?
How? Why?
20/02/2007 4
Ethnic Competition Theory I: Context Attitudes and behaviour between groups
primarily serve the maintenance of the groups’ status position.
The more conflict and competition between two social groups, the stronger are negative attitudes against the outgroup expressed by ingroup members.
Conflict and competition over what? • Economic resources, social status • Cultural values, traditions, national identity

20/02/2007 5
Ethnic Competition Theory II: Still context Assumption: The larger the outgroup (with
constant resources), the more intergroup conflict and competition. Thus:
the larger an economically threatening outgroup (holding economic resources constant)
and/or (?) the larger a culturally threatening outgroup, the more perceived ethnic threat on the
side of the ingroup.
20/02/2007 6
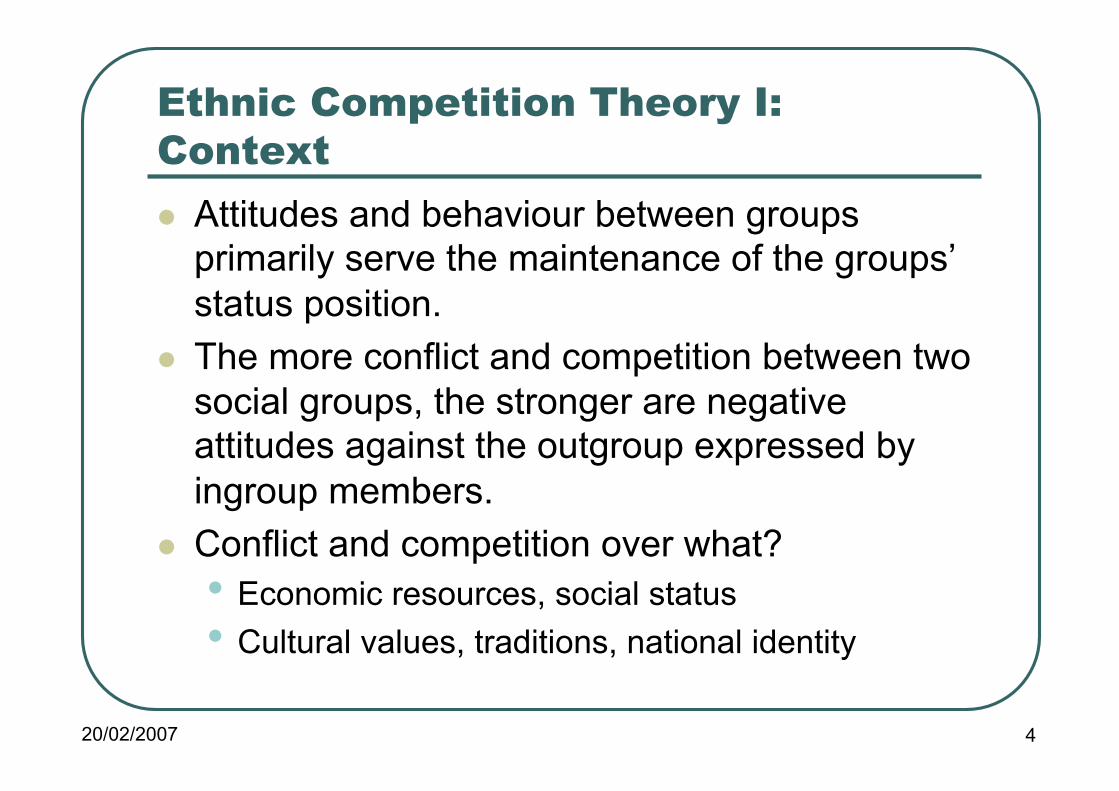
Ethnic Competition Theory II: The Individual Also the need to preserve one’s individual
status may lead to the rejection of an outgroup, particularly if its members are perceived as threatening the individuals’ social status.
There is more competition between immigrants and members of the majority population in social niches that don’t require much education, i.e. low status jobs. Thus:
The lower an individuals socio-economic status,
the more perceived ethnic threat felt by these individuals.

20/02/2007 7
Intergroup contact theory and Familiarisation Contact between members of different social groups
improves the group members’ attitudes vis-à-vis each other (given certain conditions are met). Contact hypothesis
Why? Contact is the most basic condition for familiarity, maybe even friendship.
Assumptions: • The larger the outgroup, the more contact
opportunities between in- and outgroup. • Familiarisation over and above the effects of direct
contact (e.g. indirect contact through the media) Thus: The larger the outgroup, the weaker is ethnic threat perceived by the ingroup

20/02/2007 8
Linking ethnic competition and intergroup contact theory Outgroup size measures both competition and
contact opportunities, which counteract. Thus, both theories have to be taken into account (e.g. contact has to be controlled for on the individual level).
It can be assumed that competition and familiarity increase simultaneously.
Modified hypothesis on the effect of outgroup-size: at higher levels of outgroup-size, outgroup-size does not increase ethnic threat perceptions any more (Familiarisation).

20/02/2007 9
Cross-level interaction hypotheses I: Competition*outgroup size interaction A larger outgroup is economically more
threatening to people who have a low socio-economic status.
If there are no immigrants, even low status individuals cannot perceive ethnic threat on realistic grounds (theoretically).
Thus, the larger the outgroup, the stronger the expression of prejudice against the outgroup among ingroup members with a low socio-economic status.

20/02/2007 10
Cross-level interaction hypotheses: Contact*outgroup size interaction A larger outgroup is culturally more threatening
to people who do not have any contact with members of that group than for those who do.
People who have contact with immigrants have more such contacts when the outgroup is larger.
Thus, the larger the outgroup, the stronger the expression of prejudice against the outgroup among ingroup members without outgroup contact.
20/02/2007 11
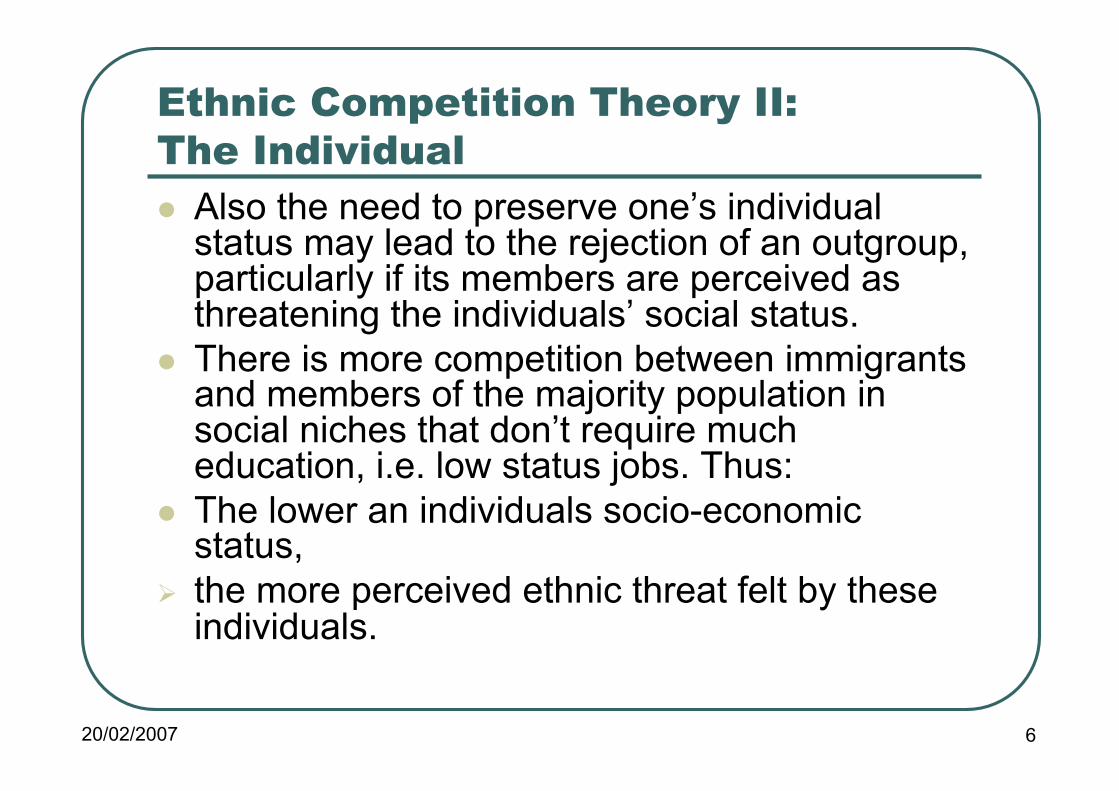
Overview over the hypotheses
20/02/2007 12
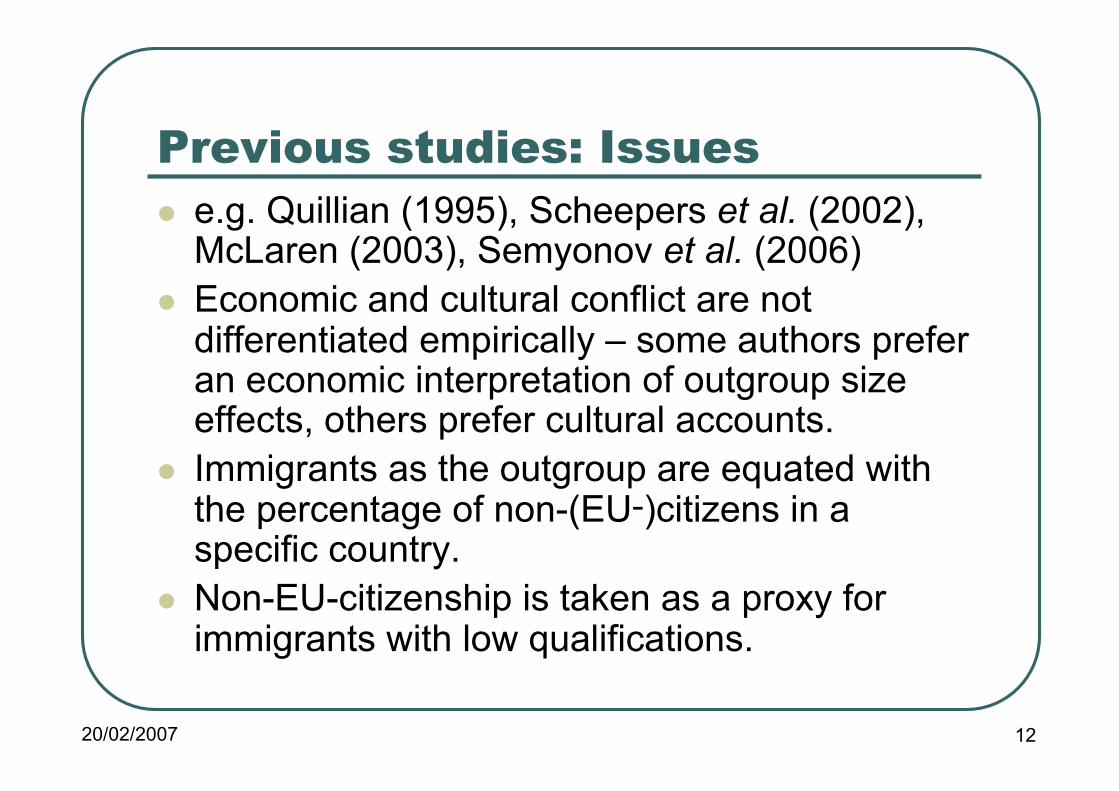
Previous studies: Issues e.g. Quillian (1995), Scheepers et al. (2002),
McLaren (2003), Semyonov et al. (2006) Economic and cultural conflict are not
differentiated empirically – some authors prefer an economic interpretation of outgroup size effects, others prefer cultural accounts.
Immigrants as the outgroup are equated with the percentage of non-(EU‑)citizens in a specific country.
Non-EU-citizenship is taken as a proxy for immigrants with low qualifications.

20/02/2007 13
Methods and Data European Social Survey (ESS) 2002/2003 Ethnic threat perception index (mean score) built from 6 items:
D25 Using this card, would you say that people who come to live here generally take jobs away from workers in [country], or generally help to create new jobs?
D26 Most people who come to live here work and pay taxes. They also use health and welfare services. On balance, do you think people who come here take out more than they put in or put in more than they take out?
D27 Would you say it is generally bad or good for [country]’s economy that people come to live here from other countries?
D28 And, using this card, would you say that [country]’s cultural life is generally undermined or enriched by people coming to live here from other countries?
D29 Is [country] made a worse or a better place to live by people coming to live here from other countries?
D30 Are [country]’s crime problems made worse or better by people coming to live here from other countries?
Source: Norwegian Social Science Data Services (2004)
20/02/2007 14
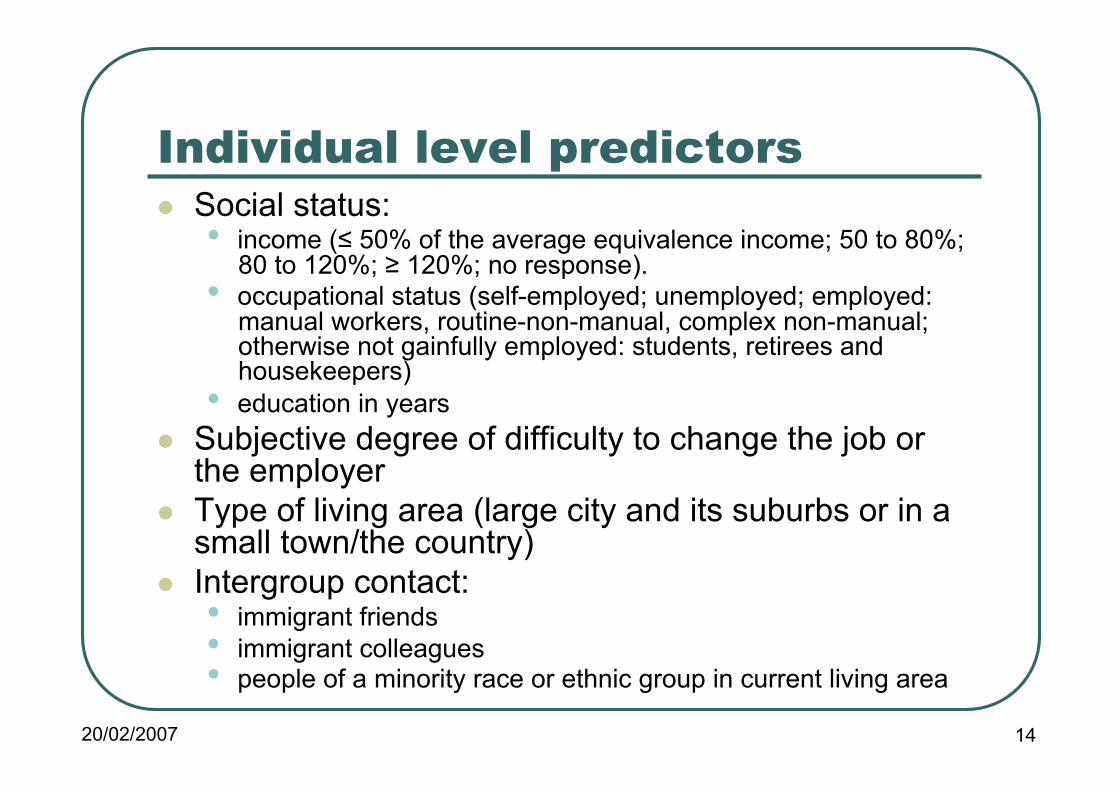
Individual level predictors Social status:
• income (≤ 50% of the average equivalence income; 50 to 80%; 80 to 120%; ≥ 120%; no response).
• occupational status (self-employed; unemployed; employed: manual workers, routine-non-manual, complex non-manual; otherwise not gainfully employed: students, retirees and housekeepers)
• education in years Subjective degree of difficulty to change the job or
the employer Type of living area (large city and its suburbs or in a
small town/the country) Intergroup contact:
• immigrant friends • immigrant colleagues • people of a minority race or ethnic group in current living area
20/02/2007 15
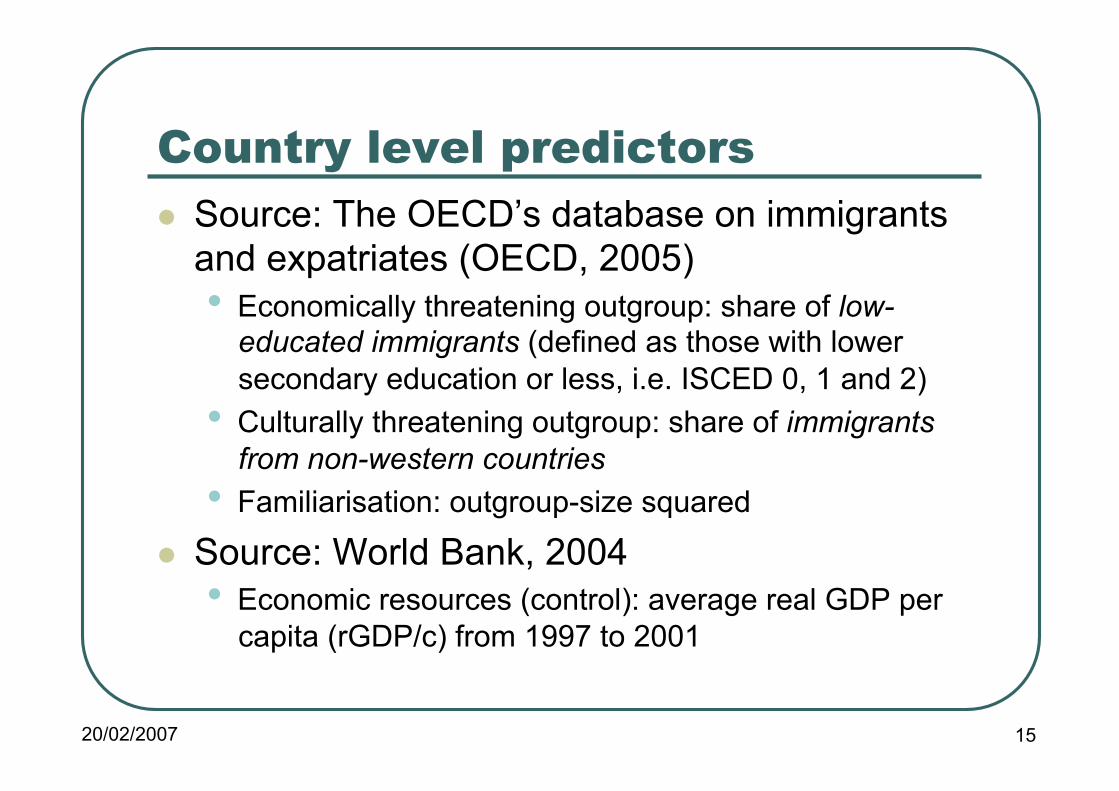
Country level predictors Source: The OECD’s database on immigrants
and expatriates (OECD, 2005) • Economically threatening outgroup: share of low-
educated immigrants (defined as those with lower secondary education or less, i.e. ISCED 0, 1 and 2)
• Culturally threatening outgroup: share of immigrants from non-western countries
• Familiarisation: outgroup-size squared
Source: World Bank, 2004 • Economic resources (control): average real GDP per
capita (rGDP/c) from 1997 to 2001

20/02/2007 16
Statistical method: Multilevel modelling Regression analysis of clustered sample data dependent variable is located on the individual level
and the independent variables are found on at least two levels of analysis
variance explained by attributes of the context and variance explained by attributes of the individual are separable
Contextual and individual effects as well as interaction effects between contextual and individual variables are modelled simultaneously
standard errors are estimated correctly

20/02/2007 17
Results: Descriptive cross-national differences

20/02/2007 18
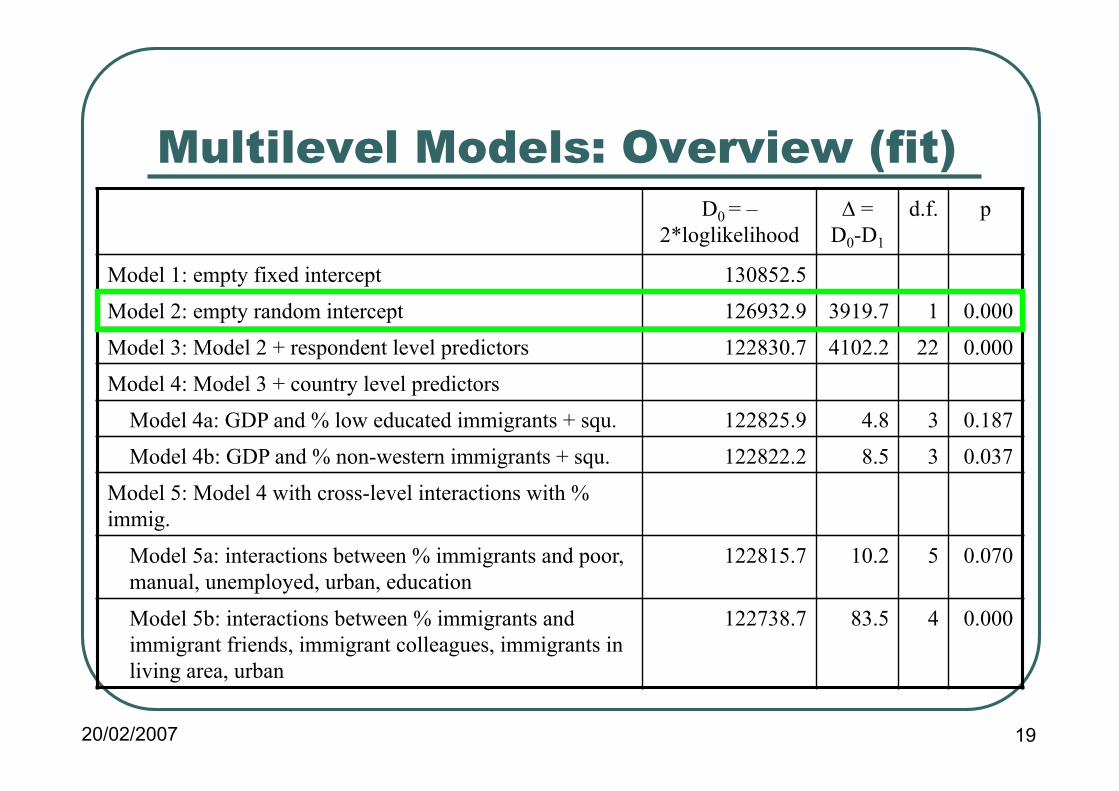
Multilevel Models: Overview (fit) D0 = –
2*loglikelihood ∆ =
D0-D1 d.f. p
Model 1: empty fixed intercept 130852.5 Model 2: empty random intercept 126932.9 3919.7 1 0.000 Model 3: Model 2 + respondent level predictors 122830.7 4102.2 22 0.000 Model 4: Model 3 + country level predictors
Model 4a: GDP and % low educated immigrants + squ. 122825.9 4.8 3 0.187 Model 4b: GDP and % non-western immigrants + squ. 122822.2 8.5 3 0.037
Model 5: Model 4 with cross-level interactions with % immig.
Model 5a: interactions between % immigrants and poor, manual, unemployed, urban, education
122815.7 10.2 5 0.070
Model 5b: interactions between % immigrants and immigrant friends, immigrant colleagues, immigrants in living area, urban
122738.7 83.5 4 0.000
20/02/2007 19
Multilevel Models: Overview (fit) D0 = –
2*loglikelihood ∆ =
D0-D1 d.f. p
Model 1: empty fixed intercept 130852.5 Model 2: empty random intercept 126932.9 3919.7 1 0.000 Model 3: Model 2 + respondent level predictors 122830.7 4102.2 22 0.000 Model 4: Model 3 + country level predictors
Model 4a: GDP and % low educated immigrants + squ. 122825.9 4.8 3 0.187 Model 4b: GDP and % non-western immigrants + squ. 122822.2 8.5 3 0.037
Model 5: Model 4 with cross-level interactions with % immig.
Model 5a: interactions between % immigrants and poor, manual, unemployed, urban, education
122815.7 10.2 5 0.070
Model 5b: interactions between % immigrants and immigrant friends, immigrant colleagues, immigrants in living area, urban
122738.7 83.5 4 0.000

20/02/2007 20
Multilevel Models: Overview (fit) D0 = –
2*loglikelihood ∆ =
D0-D1 d.f. p
Model 1: empty fixed intercept 130852.5 Model 2: empty random intercept 126932.9 3919.7 1 0.000 Model 3: Model 2 + respondent level predictors 122830.7 4102.2 22 0.000 Model 4: Model 3 + country level predictors
Model 4a: GDP and % low educated immigrants + squ. 122825.9 4.8 3 0.187 Model 4b: GDP and % non-western immigrants + squ. 122822.2 8.5 3 0.037
Model 5: Model 4 with cross-level interactions with % immig.
Model 5a: interactions between % immigrants and poor, manual, unemployed, urban, education
122815.7 10.2 5 0.070
Model 5b: interactions between % immigrants and immigrant friends, immigrant colleagues, immigrants in living area, urban
122738.7 83.5 4 0.000

20/02/2007 21
Multilevel Models: Overview (fit) D0 = –
2*loglikelihood ∆ =
D0-D1 d.f. p
Model 1: empty fixed intercept 130852.5 Model 2: empty random intercept 126932.9 3919.7 1 0.000 Model 3: Model 2 + respondent level predictors 122830.7 4102.2 22 0.000 Model 4: Model 3 + country level predictors
Model 4a: GDP and % low educated immigrants + squ. 122825.9 4.8 3 0.187 Model 4b: GDP and % non-western immigrants + squ. 122822.2 8.5 3 0.037
Model 5: Model 4 with cross-level interactions with % immig.
Model 5a: interactions between % immigrants and poor, manual, unemployed, urban, education
122815.7 10.2 5 0.070
Model 5b: interactions between % immigrants and immigrant friends, immigrant colleagues, immigrants in living area, urban
122738.7 83.5 4 0.000

20/02/2007 22
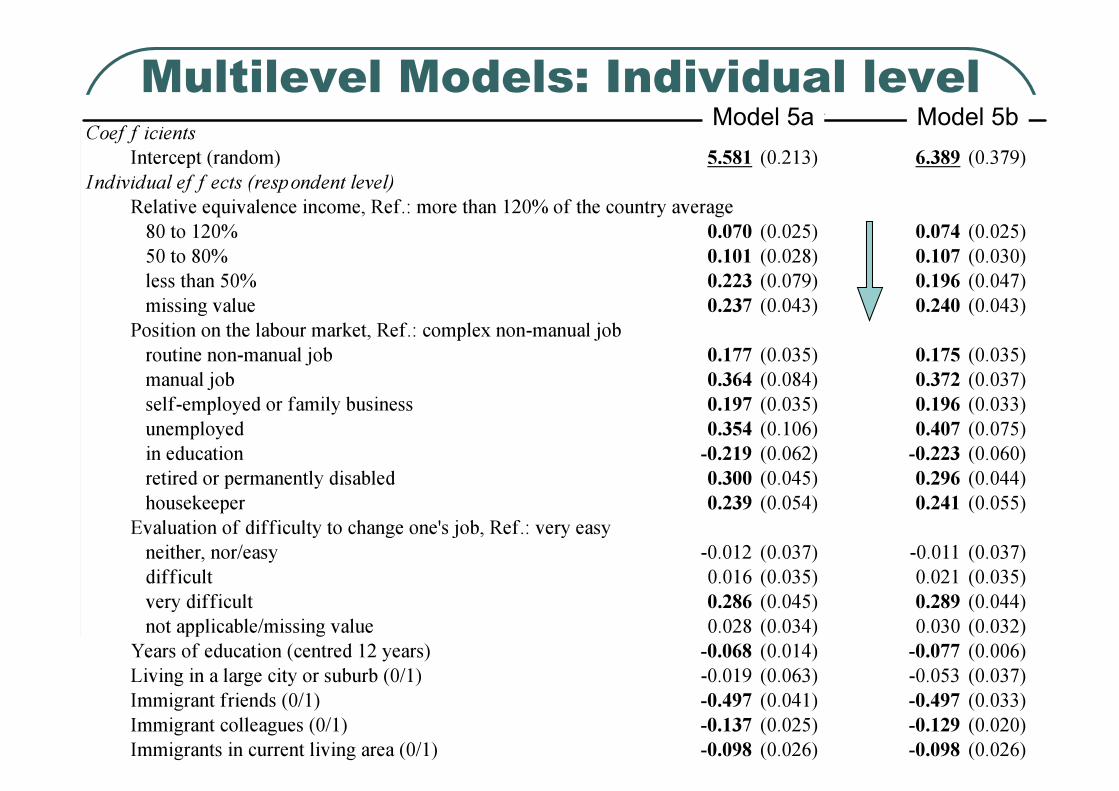
Multilevel Models: Individual level Model 5a Model 5b
20/02/2007 23
Multilevel Models: Individual level Model 5a Model 5b

20/02/2007 24
Multilevel Models: Individual level
What does this mean?
Model 5a Model 5b

20/02/2007 25
Multilevel Models: Individual level Model 5a Model 5b

20/02/2007 26
Multilevel Models: Individual level Model 5a Model 5b

20/02/2007 27
Multilevel Models: Individual level Model 5a Model 5b

20/02/2007 28
Multilevel Models: Individual level
Self-selection… Self-selection…
Model 5a Model 5b

20/02/2007 29
Multilevel Models: Country level Model 5a Model 5b

20/02/2007 30
Multilevel Models: Country level Model 5a Model 5b
20/02/2007 31
The non-linear effect of outgroup size
Predicted score on the index of perceived ethnic threat

20/02/2007 32
Multilevel Models: Country level
Lots left unexplained…
Quite ok!
Model 5a Model 5b
20/02/2007 33
Conclusions: context Not the economic status (low education) of immigrants, but their
non-western origin adds to the average level of perceived ethnic threat in European countries. The higher the percentage of non-western immigrants, the higher the country’s average level of perceived ethnic threat.
Thus, the proportion of non-EU citizens (as used in other studies) proxies culturally unfamiliar immigrants rather than low educated immigrants.
the relationship between the percentage of culturally distant immigrants and average perceived ethnic threat is not linear: the effect levels off
This result limits the validity of ethnic competition theory: A large outgroup does not only increase competition, but it also increases contact opportunities and familiarity with immigrants
20/02/2007 34
Conclusions: Individuals Effects of low socio-economic status are independent of the
size of an economically threatening outgroup (low-educated immigrants), so they cannot be explained by realistic economic competition between low-status majority population and immigrants. Thus, economic threats at the individual level seem rather distorted than real
Contact with immigrants limits ethnic threat perceptions; and the effect of outgroup-size is weaker for individuals with intergroup contact than for individuals without
Residual variance left on both levels of analysis - incomplete explanations

20/02/2007 35
BUT… “Information on the proportion of foreign-born population with education at ISCED levels 0-2 presented in the paper can absolutely not be trusted. It is not clear to me how this figures where calculated, at any rate they do not concur with anything I have seen thus far. Please re-check this information, consult other sources, e.g. Eurostat EULFS data, and you will get absolutely different and actually more realistic figures. The levels of low-secondary education for immigrants reported in Table A1 (and not Table 4 as stated on page 18) are extremely low, which does not reflect the reality, and unless these are corrected and the models re-estimated the paper cannot be published in its present form.”

20/02/2007 36
Hooooooray, another revision!*
* that will keep me away from my PhD thesis for a while…
Thank you for you comments.


![[NAME] - Muhlenberg College · Filipino Immigrant Attitudes Towards Tagalog and Maintaining Tagalog in the United States Project Start & End Date ... Thesis Advisor: [FACULTY NAME]](https://img.dokumen.tips/doc/110x75/5b3d45137f8b9a895a8dd0cb/name-muhlenberg-filipino-immigrant-attitudes-towards-tagalog-and-maintaining.jpg)