Embed Size (px)
Citation preview

Annual Report of the Thrift Savings Plan Required by §105 of the
TSP Enhancement Act of 2009
June 30, 2017

Annual Report of the Thrift Savings Plan Page 2 of 3
Introduction
In compliance with §105 of the TSP Enhancement Act of 2009, Public Law 111-31, the Federal Retirement Thrift Investment Board (FRTIB) has prepared this annual report which outlines the status of the development and implementation of the mutual fund window in the Thrift Savings Plan (TSP) as well as provide participant statistics and diversity demographics of the investment manager of the assets in the Thrift Savings Fund.
Mutual Fund Window
In 2013, under order to examine the benefits of and concerns with a MFW, the
FRTIB assembled a cross-functional team with representation from its operations, legal,
investment, finance, communications, research, and technology offices. The team
presented its findings on industry offerings, participant interest, costs, and operational
considerations to the Board and ETAC in May 2014. However, there were two additional
areas where the TSP wanted to do additional research – doing a withdrawal survey and
researching the feasibility of screening the funds offered via the MFW.
In 2014, FRTIB conducted a survey of participants who made post-separation or
age-based withdrawals, in order to better understand the reasons funds are withdrawn
from the Plan. The findings of this survey supported our thesis that one of the reasons
participants withdraw funds from the Plan when eligible is to achieve greater investment
diversification. This finding supports the Agency’s proposal to add a mutual fund window
to the Plan. We also learned that financial need and/or desire for withdrawal flexibility
were the other significant contributors to age-based and post-separation withdrawals.
The FRTIB also conducted additional research on the impact and implications of
screening the number and type of funds that might be made available in the
MFW. Screens might be based on the cost or type of funds. We determined that filters
may be added to the platforms, but would likely cause a significant reduction in the
number of funds available (i.e. limiting access to SRI, emerging managers and sector
funds). The Board requested that further research be performed on the costs of a
mutual fund window, both for implementation and maintenance.
Additional research determined that implementation costs would be roughly $6-
10 million and on-going costs would be roughly $1 million. In July of 2015, the
Executive Director recommended to the Board Members that a mutual fund window be
added to the TSP. The Board concurred, with the understanding that if the Agency’s
understanding of the costs of implementation or maintenance changed significantly that
the Agency would provide that information to the Board before proceeding.
Shortly after these Board discussions, Congress passed the National Defense
Authorization Act creating “Blended Retirement” for members of the uniformed services
and mandated a January 1, 2018, effective date. As a result, a number of initiatives,
including further work on the Mutual Fund Window, were postponed as the Agency had
Annual Report of the Thrift Savings Plan Page 3 of 3
to do considerable work to prepare to enroll the new auto-enrolled uniformed services
members coming as a result of the new Blended Retirement program. As a
consequence, the MFW will not be operational before 2020.
Investment Manager Diversity Demographics
The attached report (Appendix A) from the TSP investment manager, BlackRock, provides a breakdown of its employee diversity.
TSP Participant Behavior and Demographics Report
The 2016 Participant Behavior and Demographics Report is attached to this report as Appendix B. This report is an analysis of data extracted from the Thrift Savings Plan recordkeeping systems.

EQUAL EMPLOYMENT OPPORTUNITYCO=
U=
SECTION C - TEST FOR FILING REQUIREMENTSECTION B - COMPANY IDENTIFICATION
2.a.1.
SECTION E - ESTABLISHMENT INFORMATIONc.
SECTION D - EMPLOYMENT DATA
NOT-HISPANIC OR LATINOHISPANIC ORLATINO
* * * * * * * * * * * FEMALE * * * * * * * * * * ** * * * * * * * * * * * MALE * * * * * * * * * * * *OVERALL
TOTALSTWOOR
MORERACESNATIVE
ALASKANINDIAN ORAMERICAN
ASIAN
ISLANDERPACIFIC
OR
NATIVEHAWAIIAN
BLACK OR
AFRICAN
AMERICANWHITE
TWOOR
MORERACESNATIVE
ALASKANINDIAN ORAMERICAN
ASIAN
NATIVEHAWAIIAN
PACIFICOR
ISLANDER
BLACK OR
AFRICAN
AMERICANWHITEFEMALEMALE
JOB CATEGORIES
EXECUTIVE/SR OFFICIALS & MGRS
FIRST/MID OFFICIALS & MGRS
PROFESSIONALS
TECHNICIANS
SALES WORKERS
ADMINISTRATIVE SUPPORT
CRAFT WORKERS
OPERATIVES
LABORERS & HELPERS
SERVICE WORKERS
TOTAL
PREVIOUS REPORT TOTAL
SECTION F - REMARKS
BLACKROCK40 EAST 52ND STREETNEW YORK, NY 10022
BLACKROCK40 EAST 52ND STREETNEW YORK, NY 10022
1-Y 2-Y 3-Y DUNS NO.:786987052 EIN :320174431
NAICS:
2016 EMPLOYER INFORMATION REPORT
CT46098
CT46098
CONSOLIDATED REPORT - TYPE 2
333
66
22
22
6
0
0
00
152
015
62
6
16
35
0
0
00
134
601034
1075
265
397
20
0
0
00
2851
025
58
24
13
7
0
0
00
127
01
3
0
0
0
0
0
00
4
12185
396
310
45
13
0
0
00
961
00
3
1
0
0
0
0
00
4
09
20
6
8
0
0
0
00
43
11356
702
102
179
174
0
0
00
1524
011
70
11
9
46
0
0
00
147
00
2
0
0
0
0
0
00
2
283
384
152
54
30
0
0
00
705
01
2
1
0
1
0
0
00
5
06
28
4
9
5
0
0
00
52
881759
2871
904
752
337
0
0
00
6711
DATES OF PAYROLL PERIOD: THRU08/15/2016 08/31/2016SECTION G - CERTIFICATION
CERTIFYING OFFICIAL: MOLLIE WONG TITLE: VP - HR RISK & COMPLIANCE EEO-1 REPORT CONTACT PERSON: MOLLIE WONG TITLE: VP - HR RISK & COMPLIANCEEMAIL: [email protected] TELEPHONE NO: 415.670.7952 CERTIFIED DATE[EST]: 09/27/2016 01:53 PM
149 132 2931 113 9 927 2 47 1518 144 2 687 4 41 6706
Y
APPENDIX A
APPENDIX A

Thrift Savings Plan
Participant Behavior
and Demographics
Analysis of 2012 – 2016
APPENDIX B

2
Introduction
This analysis of Thrift Savings Plan (TSP) participant demographics prepared by the Federal Retirement Thrift Investment Board is based on participant data. The analysis of calendar year 2016 data is similar to analysis of data conducted in previous years, except that additional indicative data from the Office of Personnel Management (OPM) used in previous years was not available this year.
As with the 2014 report, the 2016 analysis will focus solely on participants in FERS, the Federal Employee Retirement System. The participant population in the Civil Service Retirement System (CSRS) is a very small and declining segment of the TSP, and the Uniformed Services participation will be included after the introduction of the Blended Retirement System in 2018. Information from this analysis provides insight on demographics, investment behaviors and how plan design changes may have influenced participation and contribution behaviors. Finally, this analysis helps us identify trends with participant usage of benefit options.
Background
The Federal Retirement Thrift Investment Board is an independent Federal agency that was established to administer the Thrift Savings Plan (TSP) under the Federal Employees’ Retirement System Act of 1986 (See 5 U.S.C. §§ 8351; 8401 et seq.). Similar to the type of savings and tax benefits that many private corporations offer their employees under I.R.C. §401(k) plans, the TSP provides Federal civilian employees and members of the uniformedservices the opportunity to save for additional retirement security. The Agency’s mission is to act solely in the interest of its participants and beneficiaries.
TSP participants can invest their employee and employer contributions in the following core funds:
Government Securities Investment Fund (G Fund)
Fixed Income Index Investment Fund (F Fund)
Common Stock Index Investment Fund (C Fund)
Small Cap Stock Index Investment Fund (S Fund)
International Stock Index Investment Fund (I Fund)
In addition to these indexed core funds, participants may also invest in five Lifecycle Funds (L Funds). The L Funds are custom target-date funds invested exclusively in the G, F, C, S, and I Funds.
During the period covered by this report, the TSP underwent one major plan design change. In September 2015 the default investment switched from the G Fund to an age-appropriate L Fund. The ongoing impact of this change on participant behavior will be discussed in this analysis.
3
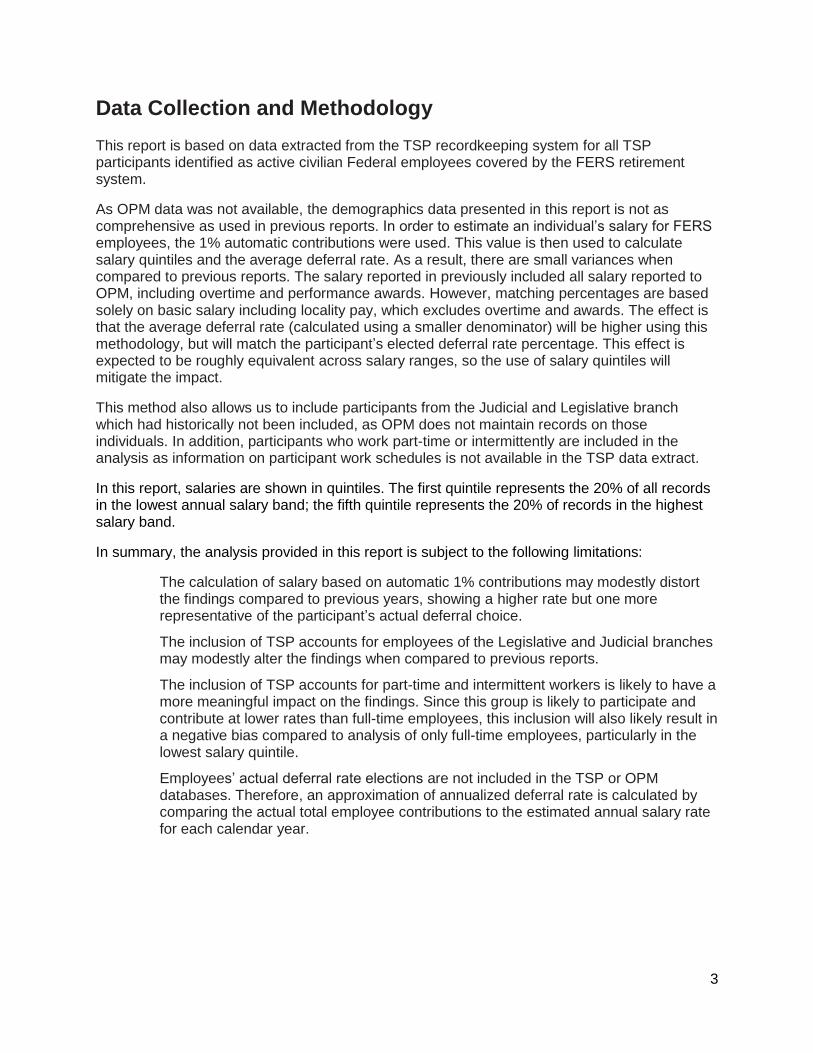
Data Collection and Methodology
This report is based on data extracted from the TSP recordkeeping system for all TSP participants identified as active civilian Federal employees covered by the FERS retirement system.
As OPM data was not available, the demographics data presented in this report is not as comprehensive as used in previous reports. In order to estimate an individual’s salary for FERS employees, the 1% automatic contributions were used. This value is then used to calculate salary quintiles and the average deferral rate. As a result, there are small variances when compared to previous reports. The salary reported in previously included all salary reported to OPM, including overtime and performance awards. However, matching percentages are based solely on basic salary including locality pay, which excludes overtime and awards. The effect is that the average deferral rate (calculated using a smaller denominator) will be higher using this methodology, but will match the participant’s elected deferral rate percentage. This effect is expected to be roughly equivalent across salary ranges, so the use of salary quintiles will mitigate the impact.
This method also allows us to include participants from the Judicial and Legislative branch which had historically not been included, as OPM does not maintain records on those individuals. In addition, participants who work part-time or intermittently are included in the analysis as information on participant work schedules is not available in the TSP data extract.
In this report, salaries are shown in quintiles. The first quintile represents the 20% of all records in the lowest annual salary band; the fifth quintile represents the 20% of records in the highest salary band.
In summary, the analysis provided in this report is subject to the following limitations:
The calculation of salary based on automatic 1% contributions may modestly distort the findings compared to previous years, showing a higher rate but one more representative of the participant’s actual deferral choice.
The inclusion of TSP accounts for employees of the Legislative and Judicial branches may modestly alter the findings when compared to previous reports.
The inclusion of TSP accounts for part-time and intermittent workers is likely to have a more meaningful impact on the findings. Since this group is likely to participate and contribute at lower rates than full-time employees, this inclusion will also likely result in a negative bias compared to analysis of only full-time employees, particularly in the lowest salary quintile.
Employees’ actual deferral rate elections are not included in the TSP or OPM databases. Therefore, an approximation of annualized deferral rate is calculated by comparing the actual total employee contributions to the estimated annual salary rate for each calendar year.
4
Analysis
The following sections of this report examine the behaviors of FERS participants across a five-year timeframe ending December 31, 2016 and through the lens of two demographic filters – age and salary. The exhibits and narratives display the relationships between these demographic factors and participant behaviors associated with participation and automatic enrollment, contribution deferral rates, investment allocation, and loan and hardship withdrawal usage.
Plan Participation
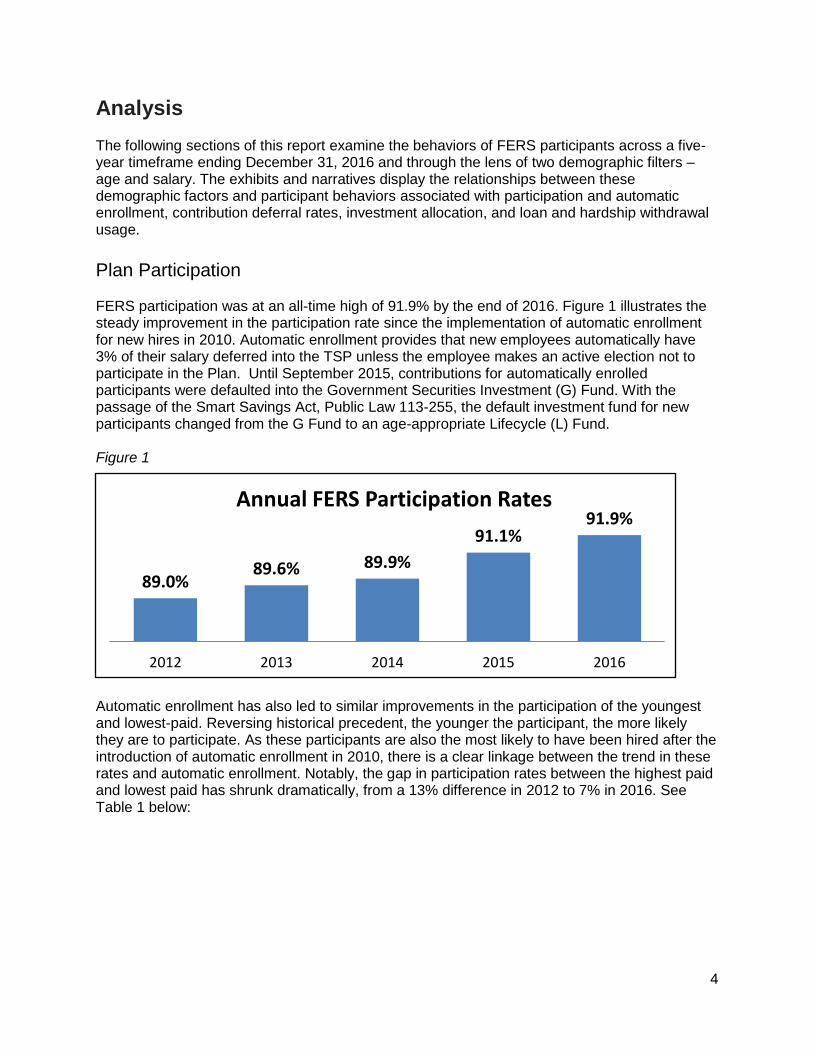
FERS participation was at an all-time high of 91.9% by the end of 2016. Figure 1 illustrates the steady improvement in the participation rate since the implementation of automatic enrollment for new hires in 2010. Automatic enrollment provides that new employees automatically have 3% of their salary deferred into the TSP unless the employee makes an active election not to participate in the Plan. Until September 2015, contributions for automatically enrolled participants were defaulted into the Government Securities Investment (G) Fund. With the passage of the Smart Savings Act, Public Law 113-255, the default investment fund for new participants changed from the G Fund to an age-appropriate Lifecycle (L) Fund.
Figure 1
Automatic enrollment has also led to similar improvements in the participation of the youngest and lowest-paid. Reversing historical precedent, the younger the participant, the more likely they are to participate. As these participants are also the most likely to have been hired after the introduction of automatic enrollment in 2010, there is a clear linkage between the trend in these rates and automatic enrollment. Notably, the gap in participation rates between the highest paid and lowest paid has shrunk dramatically, from a 13% difference in 2012 to 7% in 2016. See Table 1 below:
89.0%89.6% 89.9%
91.1%91.9%
2012 2013 2014 2015 2016
Annual FERS Participation Rates
5
Table 1
Annual FERS Participation Rates by Demographic Cohorts
2012 2013 2014 2015 2016
Age
<= 29 91.7% 93.3% 94.6% 95.6% 96.8%
30 – 39 89.5% 90.5% 91.3% 93.0% 94.2%
40 – 49 87.6% 88.0% 88.4% 90.2% 91.3%
50 – 59 88.7% 88.9% 89.0% 90.2% 90.8%
60 – 69 89.1% 89.1% 89.1% 89.9% 90.2%
70+ 87.5% 87.8% 87.2% 87.1% 86.9%
Salary Quintile
Q1 Lowest Paid 82.7% 84.3% 85.8% 89.8% 89.1%
Q2 Lower Paid 83.6% 83.8% 84.2% 86.7% 87.7%
Q3 Mid-Range 89.0% 89.4% 89.1% 89.2% 90.2%
Q4 Higher Paid 92.8% 93.1% 93.3% 93.8% 94.4%
Q5 Highest Paid 95.6% 95.7% 95.8% 96.3% 96.6%
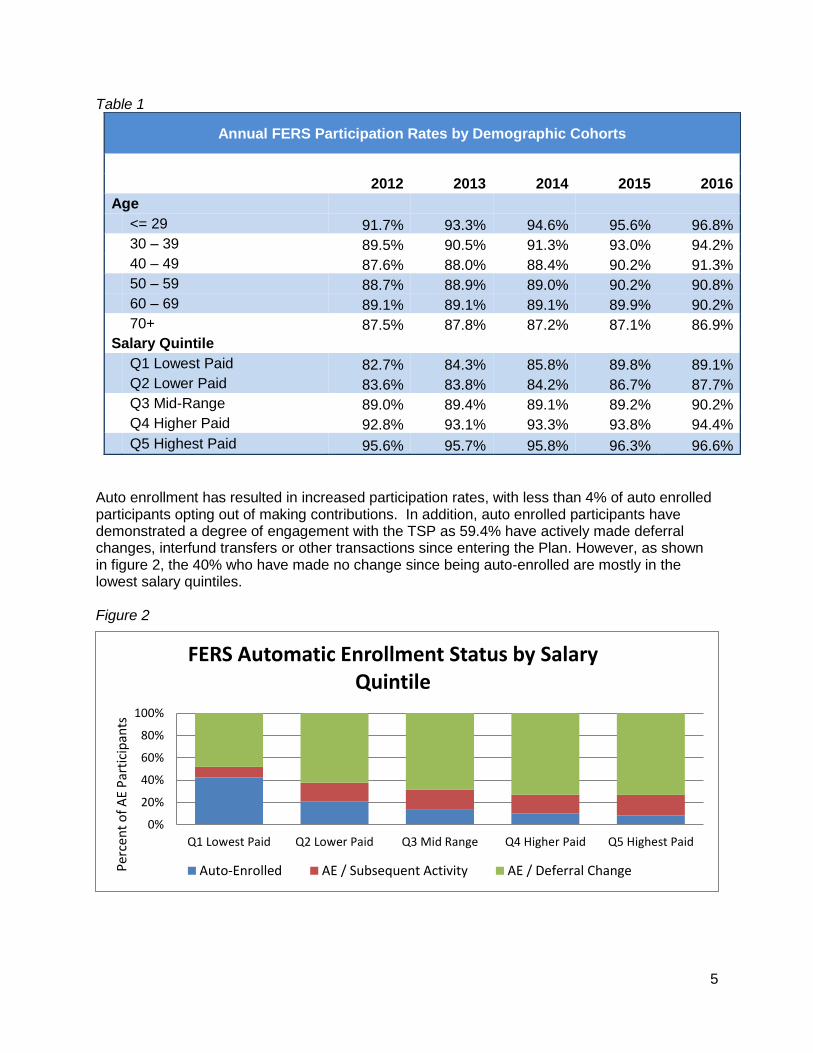
Auto enrollment has resulted in increased participation rates, with less than 4% of auto enrolled participants opting out of making contributions. In addition, auto enrolled participants have demonstrated a degree of engagement with the TSP as 59.4% have actively made deferral changes, interfund transfers or other transactions since entering the Plan. However, as shown in figure 2, the 40% who have made no change since being auto-enrolled are mostly in the lowest salary quintiles. Figure 2
0%
20%
40%
60%
80%
100%
Q1 Lowest Paid Q2 Lower Paid Q3 Mid Range Q4 Higher Paid Q5 Highest Paid
Per
cen
t o
f A
E P
arti
cip
ants
FERS Automatic Enrollment Status by Salary Quintile
Auto-Enrolled AE / Subsequent Activity AE / Deferral Change

6
Contribution Deferral Rates The FERS deferral rate (includes employee Roth, traditional and catch-up contributions) dropped slightly during the five years since the implementation of automatic enrollment, from 8.4% to 7.8% in 2016 as shown in figure 3. While the FERS deferral rate exceeds the 5.9% average deferral rate (ADP)1 of other defined contribution plans, it is significantly lower than the 9.5% FERS deferral rates of the mid-2000s. This drop is a side effect of automatic enrollment. Automatic enrollment brings many new participants into the Plan who would not otherwise have been participating. However, many, if not most of these auto-enrolled participants have continued to contribute at the 3% default level. This increase in new participants at the default level has caused the average deferral rate to slowly decline.
Figure 4 below illustrates the power of plan design on participant behavior. FERS participants receive dollar-for-dollar matching contributions on the first 3% of pay and 50 cents on the dollar on the next 2%. The full match is achieved with a 5% contribution. Consequently, deferral rates aggregate in the 5-6% range, with 29.5% of TSP contributors being in this range in 2016. The impact of automatic enrollment can clearly be seen as the percent of participants contributing 2% or less shows a steady decline while the percent at the default contribution rate of 3% has consistently grown over the last 5 years. Still of significant note, however, 31.9% of participants are not receiving the full matching contribution as they are contributing less than 5%.
1 “For [Non-highly compensated employees], the median ADP was 5.9% . . ., while the median ADP for [highly
compensated employees was 7.0%. . . .” Deloitte, Annual Defined Contribution Benchmarking Survey – Ease of
Use Drives Engagement in Saving for Retirement, 2015 Edition
Figure 3

7
Figure 4
The lowest-paid participants are deferring the least – 4.3% less than the highest paid. See table 2. However, with an average deferral rate of 5.5%, many of the lowest paid are still receiving the full match. The youngest participants have the lowest deferral rates with deferrals steadily increasing with age. Table 2
Annual FERS Deferral Rates by Demographic Cohorts
2012 2013 2014 2015 2016
Age
<= 29 5.2% 4.9% 4.9% 5.3% 5.3%
30 – 39 6.3% 6.1% 6.1% 6.4% 6.4%
40 – 49 7.4% 7.1% 7.2% 7.2% 7.2%
50 – 59 9.2% 9.0% 9.0% 9.2% 9.1%
60 – 69 10.5% 10.3% 10.2% 10.5% 10.0%
70+ 11.9% 11.6% 11.4% 11.6% 10.8%
Salary Quintile
Q1 Lowest Paid 5.4% 5.1% 5.1% 5.7% 5.5%
Q2 Lower Paid 7.5% 7.4% 7.4% 7.0% 7.2%
Q3 Mid-Range 7.5% 7.3% 7.5% 8.0% 8.1%
Q4 Higher Paid 8.8% 8.6% 8.7% 8.8% 8.9%
Q5 Highest Paid 9.8% 9.7% 9.8% 9.9% 9.8%
0%
5%
10%
15%
20%
25%
30%
35%
2012 2013 2014 2015 2016
Par
tici
pan
ts
Distribution of FERS Deferral Rates
0 - 2%
3 - 4%
5 - 6%
7 - 8%
9 - 10%
11 - 12%
13 - 14%
15%
> 15%
8
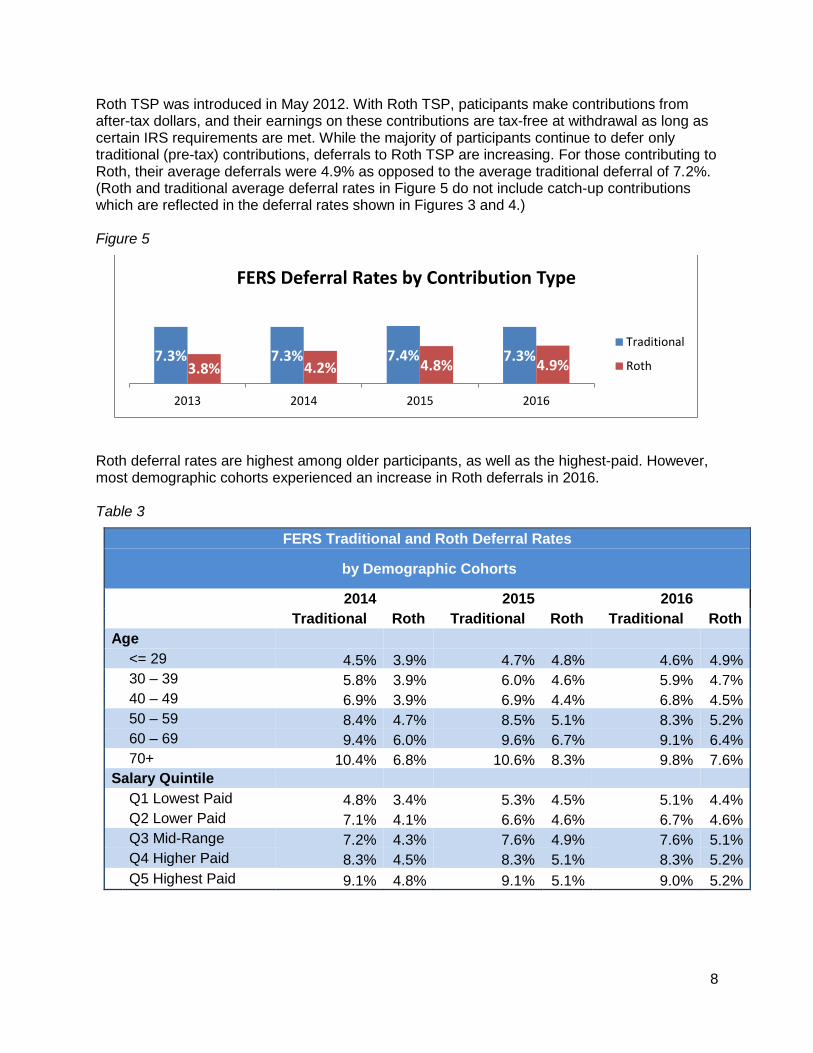
Roth TSP was introduced in May 2012. With Roth TSP, paticipants make contributions from after-tax dollars, and their earnings on these contributions are tax-free at withdrawal as long as certain IRS requirements are met. While the majority of participants continue to defer only traditional (pre-tax) contributions, deferrals to Roth TSP are increasing. For those contributing to Roth, their average deferrals were 4.9% as opposed to the average traditional deferral of 7.2%. (Roth and traditional average deferral rates in Figure 5 do not include catch-up contributions which are reflected in the deferral rates shown in Figures 3 and 4.) Figure 5
Roth deferral rates are highest among older participants, as well as the highest-paid. However, most demographic cohorts experienced an increase in Roth deferrals in 2016. Table 3
FERS Traditional and Roth Deferral Rates
by Demographic Cohorts
2014 2015 2016
Traditional Roth Traditional Roth Traditional Roth
Age
<= 29 4.5% 3.9% 4.7% 4.8% 4.6% 4.9%
30 – 39 5.8% 3.9% 6.0% 4.6% 5.9% 4.7%
40 – 49 6.9% 3.9% 6.9% 4.4% 6.8% 4.5%
50 – 59 8.4% 4.7% 8.5% 5.1% 8.3% 5.2%
60 – 69 9.4% 6.0% 9.6% 6.7% 9.1% 6.4%
70+ 10.4% 6.8% 10.6% 8.3% 9.8% 7.6%
Salary Quintile
Q1 Lowest Paid 4.8% 3.4% 5.3% 4.5% 5.1% 4.4%
Q2 Lower Paid 7.1% 4.1% 6.6% 4.6% 6.7% 4.6%
Q3 Mid-Range 7.2% 4.3% 7.6% 4.9% 7.6% 5.1%
Q4 Higher Paid 8.3% 4.5% 8.3% 5.1% 8.3% 5.2%
Q5 Highest Paid 9.1% 4.8% 9.1% 5.1% 9.0% 5.2%
7.3% 7.3% 7.4% 7.3%3.8% 4.2% 4.8% 4.9%
2013 2014 2015 2016
FERS Deferral Rates by Contribution Type
Traditional
Roth

9
Investment Allocation In Figure 6, we note that allocations to the G Fund increase as the age of the TSP’s population increases. This behavior is consistent with the expectation that participants shift their investment allocation toward the relative safety of guaranteed/income producing assets as they approach retirement age. The noteworthy exception to this observation is in the grouping of participants aged 29 and under. In this age cohort, we note that participants invest 40.7% of their accounts in the G Fund, probably as a result of the default investment option being the G Fund prior to 2015. This is a slight improvement from 2014 when the youngest participants held 41.7% of their assets in the G Fund. Figure 6
The lowest-paid participants have approximately 50.9% allocated to the G fund as compared to the highest paid who allocated only 25.4% to the G Fund. See Table 4. When examining L Fund allocations, the two youngest age cohorts had the highest level of usage at 32.8% and 31.8% while the two oldest age cohorts had L Fund allocations of 14.9% and 9.6%. When compared to 2014, the biggest increases were in the L fund allocations for those under 50. This is most likely influenced by the default investment changing from the G Fund to an age appropriate L Fund in 2015. See Table 4.
0%
20%
40%
60%
80%
100%
<= 29 30 - 39 40 - 49 50 - 59 60 - 69 70+
Per
cen
t A
lloca
ted
FERS Investment Allocation By Age
G Fund
F Fund
C Fund
S Fund
I Fund
Lifecycle Funds
The youngest participants who have the longest time horizon to reap the benefits of compounding returns have 40.7% of their assets invested in the G Fund.

10
Table 4
2016 Investment Allocations by Demographic Cohorts
G Fund F Fund C Fund S Fund I Fund L Funds
Age
<= 29 40.7% 1.3% 13.0% 8.9% 3.4% 32.8%
30 – 39 28.4% 2.3% 18.3% 12.8% 6.3% 31.8%
40 – 49 25.1% 3.7% 31.1% 13.2% 5.8% 21.1%
50 – 59 33.8% 4.7% 30.1% 10.2% 4.0% 17.1%
60 – 69 43.2% 5.6% 25.2% 8.0% 3.2% 14.9%
70+ 48.0% 5.9% 26.0% 7.6% 2.8% 9.6% Salary Quintile
Q1 Lowest Paid 50.9% 3.4% 19.2% 7.7% 3.5% 15.3%
Q2 Lower Paid 44.0% 4.5% 26.8% 8.1% 3.5% 13.0%
Q3 Mid-Range 36.3% 4.1% 24.4% 10.6% 4.5% 20.1%
Q4 Higher Paid 30.6% 4.3% 26.6% 12.0% 4.9% 21.7%
Q5 Highest Paid 25.4% 4.7% 33.2% 11.9% 4.9% 19.9%
Of the participants utilizing the L Funds, the allocation is largely as we would expect. Those in the age 29 and under cohort were taking advantage of the L2040 and L2050 Funds. Participants who would likely retire between 2027 and 2037 (the 40-49 age group) were in L2030 and L2040 Funds. The age 50-59 cohort was aggregated in the L2020 and L2030 Funds. Participants aged 60-69 were solidly investing in the L2020, while those 70 and over had the highest allocation in the L Income Fund. See Figure 7.
Figure 7
The L Funds' strategy is to invest in an appropriate mix of the G, F, C, S, and I Funds for a particular time horizon. The investment mix of each L Fund becomes more conservative as its target date approaches. Thus, the participant only needs to invest in one L Fund in order to achieve diversification among the core funds. As shown in Figure 8, the use of one L Fund is most common with the two youngest age cohorts – 46.1% for those age 29 and under and 22.1% for those age 30 to 39. While the percent of participants who invest solely in the F, C, S, and I Funds is minor, all age cohorts have a significant percentage of participants investing solely in the G Fund. Since 2014, the most significant change can be seen in the younger age
0%
20%
40%
60%
80%
100%
<= 29 30 - 39 40 - 49 50 - 59 60 - 69 70+
Per
cen
t A
lloca
ted
FERS L Fund Investment Allocation By Age
L 2050 Fund
L 2040 Fund
L 2030 Fund
L 2020 Fund
Income Fund
11
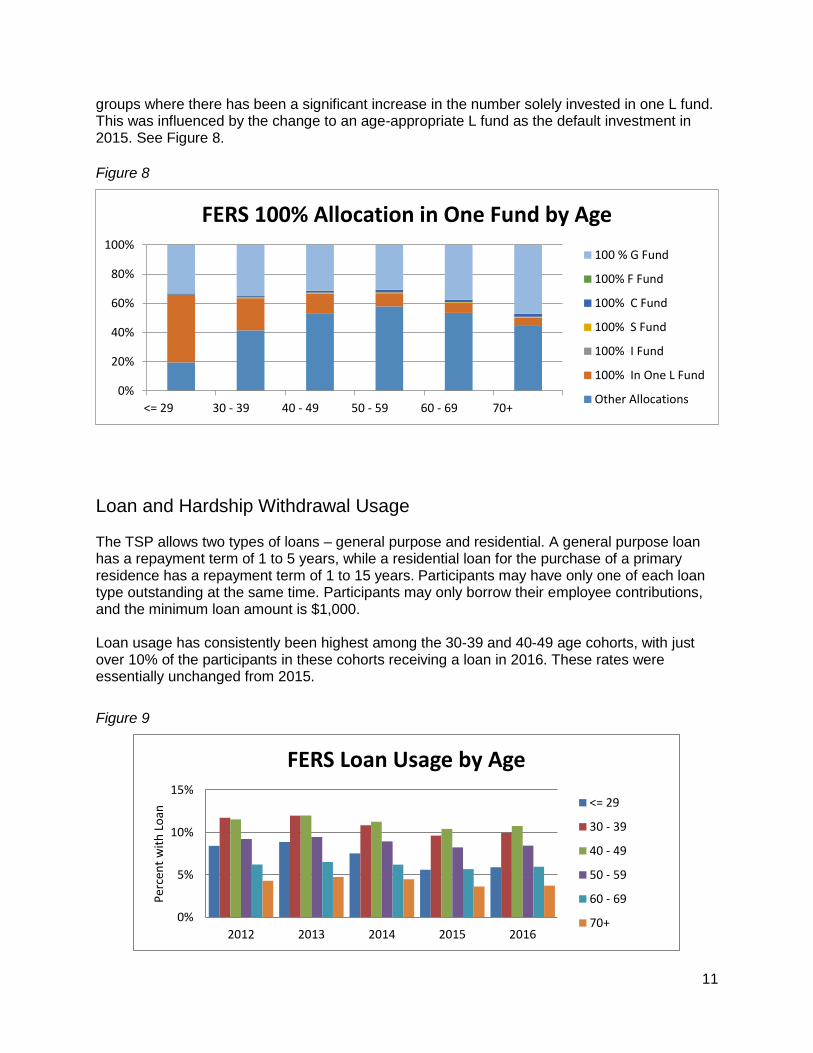
groups where there has been a significant increase in the number solely invested in one L fund. This was influenced by the change to an age-appropriate L fund as the default investment in 2015. See Figure 8.
Figure 8
Loan and Hardship Withdrawal Usage The TSP allows two types of loans – general purpose and residential. A general purpose loan has a repayment term of 1 to 5 years, while a residential loan for the purchase of a primary residence has a repayment term of 1 to 15 years. Participants may have only one of each loan type outstanding at the same time. Participants may only borrow their employee contributions, and the minimum loan amount is $1,000. Loan usage has consistently been highest among the 30-39 and 40-49 age cohorts, with just over 10% of the participants in these cohorts receiving a loan in 2016. These rates were essentially unchanged from 2015.
Figure 9
0%
20%
40%
60%
80%
100%
<= 29 30 - 39 40 - 49 50 - 59 60 - 69 70+
FERS 100% Allocation in One Fund by Age
100 % G Fund
100% F Fund
100% C Fund
100% S Fund
100% I Fund
100% In One L Fund
Other Allocations
0%
5%
10%
15%
2012 2013 2014 2015 2016
Per
cen
t w
ith
Lo
an
FERS Loan Usage by Age
<= 29
30 - 39
40 - 49
50 - 59
60 - 69
70+

12
Participants may take a hardship withdrawal if they have a financial need as the result of a recurring negative cash flow, medical expenses, a personal casualty loss, or legal expenses associated with a divorce. Participants may only withdraw their employee contributions, and the minimum withdrawal amount is $1,000. In addition to a 10% early withdrawal penalty if the participant is younger than 59 ½, employee contributions are suspended for six months after a hardship withdrawal. As a result of the employee contribution suspension, FERS participants do not receive any Agency Matching Contributions during this period.
Hardship withdrawal usage is consistently highest among the age 40-49 cohort, with 4% to 5% of participants in this cohort receiving a hardship withdrawal during the five years covered in this report. All cohorts have experienced a slow decrease in hardship withdrawal usage since 2013. Figure 10
There is a stair-step pattern of hardship withdrawal usage among the salary quintiles, with usage generally declining as salary levels increase. See figure 11. However, the first quintile presents an exception to this pattern, as hardship withdrawals were lower than those of the next highest quintile in each of the years examined. It is important to note that hardship withdrawal usage is lower than loan usage among all salary quintiles. In 2016, the second salary quintile had the highest usage rate at 4.7%, which is 1.5% percent drop from the peak in 2013. Figure 11
0%
1%
2%
3%
4%
5%
6%
2012 2013 2014 2015 2016
FERS Hardship Withdrawal Usage by Age
<= 29
30 - 39
40 - 49
50 - 59
60 - 69
70 +
0%
2%
4%
6%
8%
2012 2013 2014 2015 2016
FERS Hardship Withdrawal Usage by Salary Quintile
Q1 Lowest Paid
Q2 Lower Paid
Q3 Mid Range
Q4 Higher Paid
Q5 Highest Paid

13
Summary The analysis reveals an improvement in the FERS participation with a five-year high of 91.9% by the end of 2016. However, the average contribution deferral rate dropped to 7.8% - the lowest rate in this reporting period. Automatic enrollment was a contributing factor to both of these observations. Automatic enrollment continues to improve participation among the youngest participants. Participants under the age of 29 now participate at a rate of 96.8% – the highest rate of participation among all age groups. Consistent increases were also present when the participation rate was viewed from a salary quintile perspective. The only cohort that did not show an increase was the 70 and over age group, but given their proximity to retirement, this is not unexpected. The analysis also revealed that the majority of auto-enrolled participants have “engaged” with 59.4% making deferral changes. Deferral behavior appears to be relatively unchanged, as deferral rates continue to aggregate in the 5-6% range, with 29.5% of TSP contributors falling in this range, nearly 70% of FERS participants are estimated to be receiving the full match. Participants are gradually increasing their contributions to Roth TSP with average Roth deferral rates growing by a half percent to 4.9% in 2016. Participants aged 29 and under continue to have a disproportionate percentage (40.7%) of their account balances in the G Fund although this is an improvement from 2014 when 41.7% of their balances where in the G Fund. However, this group also has the highest utilization of the L Funds (32.8%). Overall, participants are investing in the L Fund in a manner appropriate for their age cohort. When loan usage is examined by age cohort, the 30-39 and 40-49 age cohorts have the highest loan usage rate at approximately 10% each although loan usage trended downward among all age cohorts since 2012. The age 40-49 cohort also had the highest hardship withdrawal usage, with 3% to 4% of participants in this cohort receiving a hardship withdrawal in each year of this reporting period. From a salary perspective, participants in the second and third quintile have the highest rates of usage of hardship withdrawals. Overall, however, loan and hardship withdrawals usage trends have been decreasing in the under age 60 groups, but remained flat for those 60 and over.