Embed Size (px)
Citation preview

YCG ENHANCED FUNDa series of the YCG Funds
Annual ReportNovember 30, 2020 Ticker Symbol: YCGEX

2
YCG Enhanced Fund
MESSAGE TO SHAREHOLDERS(Unaudited)
Dear Fellow Shareholder:
For the fiscal year ended November 30, 2020, the YCG Enhanced Fund achieved atotal net return of 14.49%. During the same time period, the S&P 500 Index had atotal return of 17.46%, and the S&P Global Broad Market Index had a total return of15.19%. The Fund’s top five equity winners and top five equity losers during thisperiod were as follows:
TOP FIVE EQUITY TOP FIVE EQUITYWINNERS LOSERSMSCI, Inc. Wells Fargo & Co.
NIKE, Inc. – Class B Bank of America Corp.Facebook, Inc. – Class A Aon PLC – Class A
Moody’s Corp. Walt Disney Co.Verisk Analytics, Inc. Marsh & McLennan Cos, Inc.
The top 5 equity winners and equity losers are determined based on a ranking of thedollar gains and losses of all the equity securities owned in the portfolio over theperiod specified above. This calculation excludes the portfolio’s options positions,which may have experienced a gain or a loss during the period specified.Additionally, the Fund seeks to maximize long term capital appreciation withreasonable investment risk. We believe that one year is too short a period toaccurately assess the soundness of our investment strategy, and, thus, we try not todraw too many conclusions from the chart above. Instead, we evaluate ourselves bythe Fund’s performance over a full economic cycle, which we define as a period thatincludes both a recession and an economic expansion.
In many of our past letters, we’ve picked a specific company and written a deep diveon it, with the hope that you’ll better understand one of the businesses that the Fundowns as well as appreciate the depth of analysis we do before introducing a stockinto the Fund. However, given the economic, political, and virus uncertainty that wecontinue to face, we think it’s much more important to communicate our thoughts onrisk mitigation. We have two main risk mitigation principles:
Principle #1: Bet only on outcomes that we deem to be highly probable
Our high-conviction beliefs are as follows:
1) Global wealth will continue to rise over time.
2) There are going to be economic bumps in the road from time to time, andneither we, nor anyone else, can know in advance when they’ll occur, wherethey’ll occur, or how big they’ll be.
3) Many investors want to get rich quickly and are overconfident about theirabilities, causing them to generally overvalue risky stocks and undervalue thestocks of businesses with high and sustainable returns.

3
YCG Enhanced Fund
4) We believe enduring pricing power is the most important determinant of highand sustainable returns. We define enduring pricing power as the ability of acompany to a) charge a large premium for products or services that arevirtually identical to those of their competitors and b) maintain or grow thatpremium pricing for decades while still growing volumes at healthy rates.
5) Enduring pricing power most often occurs in businesses that operate dominantnetworks in industries that grow at least as fast as Gross Domestic Product(“GDP”) over time. The network effects give the business the ability to charge alarge premium versus competitors, and the GDP-or-better growth of the industryenables the business to raise prices at least as fast as inflation over time.
6) Businesses run by founders or families or CEOs with large ownership stakesare generally incentivized to better allocate capital for the long-run andtherefore more likely to maintain or grow their pricing power over time.
7) Buying businesses with high and sustainable returns at prices where ourestimated forward rate of return is meaningfully higher than the risk-free rategenerally results in satisfactory long-term investment outcomes (i.e. paying areasonable price for a great business tends to work out well).
Principle #2: Try and minimize damage to the portfolio if we’re wrong
We attempt to accomplish this goal by preferencing the following business andportfolio characteristics:
Business
1) Number one or two by market share in its industry
2) Strong product, customer, and geographic diversification
3) Low operational leverage as demonstrated by high returns on capital, grossmargins, and profit margins and/or significant variable costs
4) Low financial leverage, preferably net cash
5) History of relatively consistent revenue demand across the business cycle
6) History of generating excess free cash flow even in recessions
7) Run by owners who’ve shown a long history of treating minority shareholdersfairly
8) Headquartered in a country that protects minority shareholder rights throughstrong cultural norms and legal precedence
Portfolio
1) Strict upper-bound on how much of the portfolio we will invest in any onestock or industry
2) Wide diversification across industry, product category, geography, types oftechnological disruption risk, and macroeconomic factors (interest-ratesensitivity, cyclicality, etc.)

3) Reduction of other company-specific idiosyncratic risks. For example, ifmultiple businesses in the same industry have dominant networks, similar risk-adjusted returns, and strong owner-oriented management teams, own them allso as to minimize the risk of surprise capital allocation or strategy decisions
Risk Management Principles in Practice
Now that we’ve explained our principles, let’s look at some of the ways we’veapplied these principles in practice. Below, we’ve divided the portfolio into sixteencategories. By measuring the portfolio this way and grouping stocks together by typeof business and thus also by risk factor (since similar businesses generally havesimilar risks), we are better able to limit our exposure to any one future outcome.After each category, we list a representative example with a short paragraphdescribing why we like the business. As you read through the list, notice how similarmany of the descriptions are and how they almost all possess the two keycharacteristics we described earlier in the letter: 1) they operate a dominant network;and 2) they operate in a category that we believe will continue to grow at least as fastas GDP (i.e. remain the same or even grow as a percentage of people’s and/orbusinesses’ budgets).
Household Products/Personal Care/Packaged Food/Beverages
Representative Example: Unilever
In a crowded, competitive world where time is an ever-scarcer resource, peopledesire filters that can help them save time or identify potential collaborators. Bycreating belief networks that connect their brands to certain characteristics, consumerproducts companies provide consumers with valuable filtering tools. Unilever hascreated one of the largest collections of consumer product belief networks ever.Through savvy marketing, innovative design, a strong heritage, and brilliantacquisitions, Unilever has assembled and cultivated a collection of brands that standfor everything from quality to beauty to consistency to sustainable environmentalism.This stable of iconic brands, which literally numbers in the dozens, includes industrypowerhouses such as Dove, Lifebuoy, Knorr, Lux, Sunlight, Vim, and Lipton. Thestrength of Unilever’s brand portfolio is evidenced by both its size and scope. Manyof the company’s brands are globally recognized and span a variety of disparateproduct areas, everything from soap to hair care to household cleaning to soup andmeal mixes, each of which is a large and growing revenue generator for the company.Moreover, the company’s brands have strong heritages and deeply-entrenchedmindshare, with many of the brands having established meaningful market share inmany developed and emerging markets well over a hundred years ago. This heritageaspect is particularly important since new brands can’t go back in time and create aheritage, putting them at a disadvantage versus incumbent brands such as those inUnilever’s portfolio. As a result of the social signaling value of some of thecompany’s brands in addition to the low-cost information filtering functions they
4
YCG Enhanced Fund

provide (they’re quite cheap relative to most people’s incomes), we believe Unileveris likely to grow both its volume and pricing over time.
Cosmetics/Skin Care/Beauty
Representative Example: Estee Lauder
In a crowded, competitive world where time is an ever-scarcer resource, people desirefilters that can help them quickly identify high-value collaborators. By creating beliefnetworks that connect their brands to certain characteristics, luxury goods companiesprovide consumers with valuable filtering tools. Estee Lauder has created one of thelargest collections of luxury beauty belief networks ever. Through savvy marketing,innovative design, a storied heritage, and brilliant acquisitions, Estee Lauder hasassembled and cultivated a collection of brands that many consumers believe aresynonymous with beauty, wealth, culture, coolness, and status. This stable of iconicbrands, which literally numbers in the dozens, includes industry powerhouses such asEstee Lauder, MAC, Aveda, La Mer, Bobbi Brown, Too Faced, and Tom Ford Beauty.The strength of Estee Lauder’s brands is evidenced by both their size and scope. Thecompany’s brands are globally recognized and span a variety of disparate beautyproduct areas, everything from makeup to skincare to fragrance to hair care, each ofwhich is a large and rapidly growing revenue generator for the company. Moreover, thecompany has a storied heritage connected to celebrities, entertainers, supermodels, andcenters of culture going back, in some cases, for over a hundred years. This heritageaspect is particularly important since new brands can’t go back in time and create aheritage, putting them at a huge disadvantage versus incumbent brands such as those inEstee Lauder’s portfolio. As a result of the social signaling value of the company’sbrands, we believe Estee Lauder is likely to grow both its volume and pricing over time.In fact, we believe its pricing outlook is among the most favorable in our wholeportfolio. Because signals of loyalty to a group and status with a group are only reliableso long as they are costly to send, Estee Lauder has to raise its prices as wealth increasesin order to maintain its brands’ value propositions. This pricing power is furtherreinforced by favorable industry tailwinds. Whereas many industries have shrunk as apercentage of budgets over time, spending on personal care as a percentage of globalconsumer expenditures has grown from 2.33% in 1996 to 2.41%1 by the end of 2016.Not only does Estee Lauder benefit from enduring pricing power and long-term volumegrowth opportunities, but its products are also disposable and have short repurchasecycles, causing their demand to be fairly stable across various economic environments.In fact, global cosmetics revenue even grew during the recession of 2008.
____________1 See https://www.rankingthebrands.com/The-Brand-Rankings.aspx?rankingID=299&year=1261.
5
YCG Enhanced Fund

Athletic Shoes/Sportswear
Representative Example: Nike
In a crowded, competitive world where time is an ever-scarcer resource, peopledesire filters that can help them quickly identify high-value collaborators. Bycreating belief networks that connect their brands to certain characteristics, luxurygoods companies provide consumers with valuable filtering tools. Nike has createdone of the most robust luxury goods belief networks ever. Through savvy marketing,impressive design, and a storied heritage, Nike has cultivated a brand that manyconsumers believe stands for the epitome of athleticism, power, fitness, wealth, andcoolness. The strength of this brand is evidenced by both its size and scope. The Nikebrand is globally recognized and, in fact, is almost akin to a global luxury language.The brand is so strong that the company has successfully attached it to a variety ofproduct areas, everything from sneakers to athletic apparel to fashion and fashionaccessories, each of which is a large and rapidly growing revenue generator for thecompany. Moreover, the company has spent billions to create a storied heritage thatconnects their brand to legendary athletes, teams, celebrities, and centers of cultureand competition going back to its founding in Oregon in 1964. This heritage aspect isparticularly important since new brands can’t go back in time and create a heritage,putting them at a huge disadvantage versus incumbents such as Nike. As a result ofits strength as a people filter, we believe Nike is likely to grow both its volume andpricing over time, particularly as billions more people are added to the global middleclass and the value of their belief network likely grows even stronger. In fact, webelieve its pricing outlook is among the most favorable in our whole portfolio. Evenif competitors create virtually identical products, for the aforementioned reasons, webelieve Nike will be able to continue to sell its products at a premium. Furthermore,because the Nike brand serves as a signal of athleticism, power, fitness, wealth, andcoolness, and this signal is only reliable if it is costly to send, Nike has to raise itsprices as wealth increases in order to maintain the brand’s value proposition.
Traditional Luxury Goods (Handbags, Clothing & Accessories, Jewelry, ExoticSports Cars)
Representative Example: Hermès
In a crowded, competitive world where time is an ever-scarcer resource, peopledesire filters that can help them quickly identify high-value collaborators. Bycreating belief networks that connect their brands to certain characteristics, luxurygoods companies provide consumers with valuable filtering tools. Hermès hascreated one of the most robust luxury goods belief networks ever. Through savvymarketing, impressive craftsmanship, and a storied heritage, Hermès has cultivated abrand that many consumers believe stands for the epitome of wealth, culture, andstatus. The strength of this brand is evidenced by both its size and scope. The Hermèsbrand is globally recognized and, in fact, is almost akin to a global luxury language.
6
YCG Enhanced Fund

The brand is so strong that the company has successfully attached it to a variety ofdisparate product areas, everything from leather goods to fashion and fashionaccessories to perfumes to watches, each of which is a large and rapidly growingrevenue generator for the company. Moreover, the company has a storied heritageconnected to celebrities, royalty, and centers of culture going back to its founding inParis in 1837. This heritage aspect is particularly important since new brands can’tgo back in time and create a heritage, putting them at a huge disadvantage versusincumbents such as Hermès. As a result of its strength as a people filter, we believeHermès is likely to grow both its volume and pricing over time, particularly asbillions more people are added to the global middle class and the value of their beliefnetwork likely grows even stronger. In fact, we believe its pricing outlook is amongthe most favorable in our whole portfolio. Even if an artisan from an Hermèsworkshop handcrafted an identical bag, it would sell at a fraction of the price becauseit would not be part of Hermès’ global belief network. Furthermore, because theHermès brand serves as a signal of wealth, culture, and status, and this signal is onlyreliable if it is costly to send, Hermès has to raise its prices as wealth increases inorder to maintain the brand’s value proposition. For example, whereas mosthandbags have become cheaper over time after adjusting for inflation, Hermès’Birkin bag pricing has grown faster than inflation.
Payment Processing
Representative Example: Mastercard
Excluding China, where UnionPay has a monopoly, Mastercard is the second largestpayment card processor in the world with a 27% market share as of 2017.2 As aresult of its virtually unrivaled global network of merchant, consumer, banking, andcorporate relationships, we believe Mastercard is in a great position to benefit bothfrom global GDP growth and from the secular trend away from cash, which stillremains the method of payment in 77% of the world’s transactions.3 Moreover,because network value rises exponentially as new participants join a network, webelieve Mastercard is both incredibly difficult to disrupt and highly likely to maintainor even increase its pricing power over time. Remarkably, despite the long runwayfor growth opportunities, it is likely that very little capital will need to be reinvestedto achieve this growth, increasing the earnings multiple investors should be willing topay for the business.
____________2 See https://www.paymentscardsandmobile.com/unionpay-stays-on-top-as-the-worlds-largest-card-scheme/.3 See page 6 of https://www.mckinsey.com/~/media/McKinsey/Industries/Financial%20Services/Our%20Insights/Global%20payments%20Expansive%20growth%20targeted%20opportunities/Global-payments-map-2018.ashx.
7
YCG Enhanced Fund

Financial Markets Benchmarks/Analytics
Representative Example: MSCI
MSCI is a leading index provider that has essentially become a global language. Inother words, for stock, bond, and derivatives markets, its indices, such as its flagshipMSCI All Country World Index, are used by investors and allocators to communicateabout investment performance. Because crowded information marketplaces aregenerally quite inefficient, requiring participants to maintain background knowledgeon numerous providers and analytical methodologies, industries such as indexconstruction and maintenance tend to coalesce around one or two standards. Whilemany developed markets primarily use non-MSCI benchmarks (such as the S&P 500in the U.S.), MSCI’s global and emerging markets stock indices are the globallyrecognized standards in their categories and possess far larger usage networks and farmore data than any of their competitors. Additionally, the scope of their networks isunmatched. They provide the most complete benchmarking solution for globalallocators because of their dominant positions in global and regional benchmarking aswell as in the emerging markets, which overwhelm the developed markets in numberand will eventually overwhelm them in dollars of market capitalization as well.Additionally, they began publishing performance data for their market-leading indicesstarting, in some cases, over forty years ago, and they provide analytical support andsoftware that increases the use-cases for the data. Thus, subscriptions to their databecome a “must have” for industry participants, as demonstrated by their highretention rates. Moreover, most corporations and governments, along with most largeendowments, pension plans, and sovereign wealth funds, are run by employees insteadof owners, further solidifying MSCI’s competitive position because employees areincentivized to make the “safe” choice (in this case, by selecting the industry standardMSCI benchmark instead of an upstart). Additional tailwinds we believe MSCI willcontinue to capitalize on are the trend towards indexing and the “slicing-and-dicing” ofportfolios based on Environmental, Social and Governance (“ESG”) characteristics. Asa result of these industry and competitive dynamics, we believe MSCI is likely to growvolume and pricing at attractive rates for years to come. Remarkably, it is likely thatvery little capital will need to be reinvested to achieve this growth, increasing theearnings multiple investors should be willing to pay for the business.
Rating Agencies
Representative Example: Moody’s
Moody’s sells credit ratings to corporations, governments, and banks so that they canraise debt from the capital markets. The industry in which they participate, debtcapital markets, possesses favorable long-term growth prospects. Debt issuance hashistorically grown at least as fast as GDP, and capital market bond issuance has growneven faster as it has taken share from banking loans. Over the long term, we believethis GDP-or-better growth is likely to continue. Moody’s serves as a key information
8
YCG Enhanced Fund

filter in this industry. Moody’s charges corporations approximately 7 basis points4 torate their bonds yet likely saves them 30 to 50 basis points5 in annual borrowingcosts. Moody’s benefits from both protocol and data network effects. Becausecrowded information marketplaces are generally quite inefficient, requiringparticipants to maintain background knowledge on numerous providers and analyticalmethodologies, industries such as credit ratings tend to coalesce around one or twostandards (i.e. protocols). Moody’s and its main competitor, Standard & Poor’s, arethe globally-recognized credit rating standards with far larger networks and far moredata than any of their competitors. Additionally, the scope of their networks isunmatched. They provide corporate, government, and structured product credit datagoing back, in some cases, over a hundred years, and they provide analytical supportand software that increases the use-cases for the data. Moreover, most corporationsand governments, along with most large endowments, pension plans, and sovereignwealth funds, are run by employees instead of owners, further solidifying Moody’scompetitive position because employees are incentivized to make the “safe” choice(in this case, by hiring an industry leader like Moody’s for their credit rating needsinstead of an upstart). Finally, for much of Moody’s history, the U.S. government andits various regulatory bodies made Moody’s and a few other specially-designatedrating agencies so important to banks’ bond purchases that it made their ratingsalmost mandatory for most corporations and governments, which led to Moody’sbecoming one of the entrenched, global “languages” in the ratings business today. Asa result of these industry and competitive dynamics, we believe Moody’s is likely togrow volume and pricing at attractive rates for years to come. Remarkably, it is likelythat very little capital will need to be reinvested to achieve this growth, increasing theearnings multiple investors should be willing to pay for the business.
Insurance Data Analytics
Representative Example: Verisk
Verisk is a data analytics and risk assessment firm with dominant positions ininsurance and energy information services. Of these two segments, insuranceaccounts for the vast majority of Verisk’s value. Insurance is a fairly acyclicalindustry and has historically grown in line with GDP, naturally growing as businessactivity grows. Verisk serves this industry by collecting sensitive and proprietary datafrom insurance companies, and then these companies, in turn, subscribe to Verisk’smission critical data and analytics to optimize their pricing as they underwrite____________4 See https://www.standardandpoors.com/en_US/delegate/getPDF?articleId=2148688&type=COMMENTS&subType=REGULATORY. Given the duopolistic nature of the industry, we believeStandard & Poor’s pricing is a good proxy for Moody’s. One basis point equals one hundredth ofone percent.
5 In 2012, for the first time in its history, Heineken decided to get its debt rated. Based on Heineken’spost-mortem analysis, getting its debt rated saved the company 30 to 50 basis points of yearly interestcost. See https://web.archive.org/web/20170713073100/http://treasurytoday.com/2013/02/do-companies-need-to-be-rated-to-issue-bonds.
9
YCG Enhanced Fund

policies. Since the network effects inherent in this business make their databasenearly impossible to replicate, and their cost is a very small percentage of companybudgets, they can almost imperceptibly pass on price increases year after year whichdrop to the bottom line and allow them to boast high profit margins. Due to thispricing power and developing new support solutions that are deeply integrated intocustomer work-flows, we believe Verisk is likely to grow both pricing and volumefaster than its industry over time.
Insurance Brokerages
Examples: Aon
Aon is the second largest insurance brokerage in the world. They operate in a fairlyacyclical industry that has maintained its share of GDP over time, naturally growingas business activity grows. Additionally, there is some measure of built-in inflationprotection because as inflations rises, so do premiums and the fees they collect onthose premiums. As a result of its virtually unrivaled global network of insurancebuyers, sellers, and knowledgeable brokers, we believe Aon is in a great position tomaintain its pricing power and act as a toll taker on global insurance activity. In fact,because two drivers of this growth, globalization and urbanization,6 will increase thevalue of large insurance networks, we believe Aon is likely to be able to grow bothpricing and volume faster than its industry over time. Moreover, most businesses arerun by employees instead of owners, further solidifying Aon’s competitive positionbecause employees are incentivized to make the “safe” choice (in this case, by hiringan industry leader like Aon to analyze their complex insurance needs, resulting insticky relationships). Finally, because they earn interest on the premiums they collect,their business benefits from rising interest rates. This earnings boost could potentiallyhelp offset a compressing valuation multiple in a rising interest rate environment.
Banks
Representative Example: Bank of America
Bank of America is the largest bank in the United States by share of domesticdeposits with a little over 10% of the market.7 The banking industry is attractivebecause deposits, which are the raw material that lead to earnings, have grown everysingle year since 1948 and at a pace faster than GDP. Furthermore, contrary topopular belief, the banking industry has been profitable in 83 of the last 85 years.Large banks tend to be good businesses because, through deposits, they are able toborrow money at a low rate relative to their competitors, primarily non-bankcorporations and smaller banks. This funding cost advantage occurs because 1) thegovernment guarantees bank deposits up to $250,000 per account, 2) the industry is
____________6 See https://www.cnbc.com/2018/05/17/two-thirds-of-global-population-will-live-in-cities-by-2050-un-says.html.
7 See https://www.statista.com/statistics/727546/market-share-of-leading-banks-usa-domestic-deposits/.
10
YCG Enhanced Fund

highly regulated, creating barriers to entry, 3) among banks, many customers valuethe liquidity, security, and convenience that the large banks provide over the higherinterest rate they could earn if they deposited their money elsewhere, and4) switching costs prevent most customers from constantly shopping and bouncingaround for the highest deposit rates among the large banks. While this fundingadvantage is the most critical, it’s not the only advantage the large banks possess.After much consolidation in the industry, the large banks also possess superiorgeographic and product diversification that reduces the risk of their loan portfoliorelative to more specialized lenders as well as economies-of-scale cost advantages inareas such as technology, cybersecurity, regulation, and marketing. For all thesereasons, in addition to the much-improved balance sheets of both the banks and theaverage U.S. consumer post the financial crisis, we believe the large banks are likelyto generate returns on equity that are significantly higher than their cost of capitalover time. Finally, their business benefits from rising interest rates, so they may actas an interest rate hedge to the overall portfolio should rates surprise to the upside.
Online Brokerages
Representative Example: Charles Schwab
Schwab is the largest discount brokerage in the United States with trillions in clientassets, enabling them to be the lowest cost producer in their industry. In other words,they are able to offer the largest selection of products and services relevant to thefinancial industry at the lowest prices possible. This scale advantage is a virtuouscycle, allowing them to continue to gather assets at a quick pace, which in turn,allows them to continue to offer the best-in-class technology and suite of wealthmanagement products and services. Instead of having a traditional cost of entry withpricing power, Schwab’s cost of entry is the low rates it offers on deposits where theycan earn a spread. They further increase their earning power by charging third partyvendors, such as mutual funds, to access their massive network of users. Thus, eventhough asset allocation is much like a commodity service where prices are beingdriven down, because Schwab has created a virtually unrivaled network of investors,financial advisors, and wealth management products and services, it has pricingpower through low cost deposits as well as fees to its third-party sellers. As a result,we believe Schwab is well positioned to essentially act as a toll taker on growingglobal wealth and to continue to increase market share of deposits and financialassets. Finally, their business benefits from rising interest rates, so they may act as aninterest rate hedge to the overall portfolio should interest rates surprise to the upside.
Auto Salvage/Insurance
Representative Example: Copart
Copart is the largest provider of online salvage vehicle auctions in the world. Theyoperate in an industry that is typically recession resistant as accidents continue andsalvage rates increase when used car values drop in recessionary environments,
11
YCG Enhanced Fund

offsetting a decrease in miles driven. They benefit from a “not-in-my-backyard”principle by owning the most salvage yards, which also reduces their cost structurerelative to competition. They have a dominant position in the United States, strongpositions in Canada and the UK, and huge reinvestment opportunities as they growoperations in Germany, Ireland, Brazil, Spain, the United Arab Emirates, andFinland. Most importantly, as a result of its virtually unrivaled global network ofvehicle sellers, primarily insurance companies selling totaled vehicles but also thegeneral public and entities such as banks and fleet operators, and vehicle buyers suchas dismantlers, rebuilders, used vehicle dealers, and the general public, we believeCopart is very difficult to disrupt and in a great position to benefit from growth inglobal vehicle auction activity. Moreover, because network value rises exponentiallyas new participants join a network, we believe Copart is likely to maintain or evenincrease its pricing power over time.
CRE Brokerages & Outsourcers
Representative Example: CBRE
CBRE is a worldwide leader in commercial real estate services, an attractive industrysince commercial real estate is one of the few industries shown to maintain its shareof GDP over time. CBRE’s scale allows them to cost effectively provide local marketinsight and specialized expertise, utilizing premier technology tools and resources,thus often becoming the safe, one-stop shop of choice for many Fortune 500companies to service their various commercial real estate needs. As a result of itsvirtually unrivaled global network of real estate buyers, sellers, and knowledgeablebrokers, we believe CBRE is in a great position to benefit from growth in globalcommercial real estate activity. In fact, because two drivers of this growth,globalization and urbanization,8 will increase the value of large global real estatenetworks, we believe CBRE is likely to be able to grow both pricing and volumefaster than its industry over time.
Online Advertising
Representative Example: Alphabet
Alphabet owns the largest search engine, video sharing platform, mobile operatingsystem, and mapping service in the world, enabling it to capture an estimated 31%share of the global digital advertising market as of 2019.9 Excluding China, whereAlphabet’s properties are essentially banned, Alphabet has a 41% global marketshare. As opposed to an absolute good where prices are driven down throughinnovation and competition, advertising is a relative good where businesses seek tooutspend their competitors to maintain mind share. As such, the advertising industry____________8 See https://www.cnbc.com/2018/05/17/two-thirds-of-global-population-will-live-in-cities-by-2050-un-says.html.
9 See https://www.emarketer.com/content/global-digital-ad-spending-2019 and https://www.emarketer.com/content/china-digital-ad-spending-2019.
12
YCG Enhanced Fund

is one of the few industries that has maintained its share of GDP over time. As aresult of Alphabet’s virtually unrivaled network of users, publishers, and advertisers,we believe the company is in a great position to benefit from both growth in theglobal advertising market and the secular trend toward digital advertising, whichcurrently only accounts for 50% of total spend. Moreover, because a) network valuerises exponentially as new participants join a network and b) the company continuesto invest heavily in emerging media platforms such as Waymo, we believe Alphabetis likely to maintain or even increase its pricing power over time.
Business/Tax/Cloud Software
Representative Example: Microsoft
Through Office, Windows, Azure, SQL Database Management System, LinkedIn,Github, and its numerous other products and services, many of which benefit fromboth network effects and high switching costs, Microsoft has cleverly positioned itselfas a toll road over which nearly all businesses must pass. Furthermore, the company’sembrace of the open source movement in IT, its shift to a more subscription-and-cloud-based model, and the rapidly-expanding value of its growing network ofservices have all made this toll feel like much more of a win-win for customers. Webelieve this dynamic will allow for consistent price increases in its subscriptionrenewals. Additionally, we believe Microsoft will continue to benefit both fromlong-term growth in global GDP as well as the continued migration of businesses tothe cloud. Remarkably, despite its long runway for growth opportunities, it is likelythat very little capital will need to be reinvested to achieve this growth, increasing theearnings multiple investors should be willing to pay for the business.
Travel Software & Internet Services
Representative Example: Booking
Booking is the largest online travel agent in the world. As a result of its virtuallyunrivaled global network of travelers and accommodation, airline, and rental carproviders, we believe Booking is in a great position to benefit both from global GDPgrowth and from the secular trend toward more travel and tourism, which,pre-COVID-19, was forecast to grow as a percentage of GDP from 3.2% in 2018 to3.5% by 2029.10 While COVID-19 will significantly impact this forecast over theshort and medium term, we believe the travel and tourism industry will continue togrow as percentage of GDP over the long term.
____________10 See page 7 of https://www.wttc.org/-/media/files/reports/economic-impact-research/regions-
2019/world2019.pdf.
13
YCG Enhanced Fund

Concluding Thoughts
We hope this letter has given you both a more holistic view of the Funds portfolioand an increased understanding of how we approach risk mitigation. In a nutshell,our approach is to invest in businesses with enduring pricing power and long-termvolume growth opportunities that we believe have a high probability of generatingattractive long-term returns and then to build in numerous redundancies (such asfinancial conservatism and geographic diversification at both the business andportfolio level) and resiliencies (such as preferencing businesses with low cyclicality,high margins, and significant variable costs). By building in these redundancies andresiliencies, we believe we have materially reduced the probability and degree ofpermanent capital loss if we are wrong in our assessments of our businesses’prospects. In times as uncertain as these, we gain tremendous comfort from these riskmitigation measures. We hope you do as well.
As always, know we’re invested right alongside you, and please let us know if thereis anything you need. We are here to help.
Sincerely,
The YCG Team
Past performance does not guarantee future results.
Mutual fund investing involves risk. Principal loss is possible. The Fund’s principal risks and itsnon-principal risks are described in the Fund’s most recent Prospectus and Statement of AdditionalInformation.
The Fund is non-diversified, meaning it may concentrate its assets in fewer individual holdings thana diversified fund. Therefore, the Fund is more exposed to individual stock volatility than adiversified fund.
The Fund invests primarily in equity securities without regard to market capitalization, thusinvestments will be made in mid and smaller capitalization companies, which involve additionalrisks such as limited liquidity and greater volatility.
The Fund writes put options and covered call options on a substantial portion of the Fund’s longequity portfolio, which have the risks of early option contract assignment forcing the Fund topurchase the underlying stock at the exercise price which may be the cause of significant losses dueto the failure of correctly predicting the direction of securities prices, interest rates and currencyexchange rates. The investment in options is not suitable for all investors. Covered call writing maylimit the upside of an underlying security.
The Fund may also invest in foreign securities which involve political, economic and currency risks,greater volatility, and differences in accounting methods.
Investments in debt securities typically decrease in value when interest rates rise. This risk isusually greater for longer-term debt securities. Investment in lower-rated, non-rated and distressedsecurities presents a greater risk of loss to principal and interest than higher-rated securities.
14
YCG Enhanced Fund

Diversification does not guarantee a profit or protect from loss in a declining market.
Fund holdings and sector allocations are subject to change at any time and should not be consideredrecommendations to buy or sell any security. Please see the Schedule of Investments in this report for acomplete list of Fund holdings.
The S&P 500 or Standard & Poor’s 500 Index is a market-capitalization-weighted index of the 500 largestU.S. publicly traded companies. The index is widely regarded as the best gauge of large-cap U.S. equities.
The S&P Global Broad Market Index is a market capitalization-weighted index that provides a broadmeasure of the global equities markets and includes approximately 11,000 companies in more than 52countries covering both developed and emerging markets.
The MSCI All Country World Index (“MSCI ACWI”) is a market capitalization weighted index designedto provide a broad measure of equity-market performance throughout the world. The MSCI ACWI indextracks about 3,000 stocks in 49 developed and emerging market countries, representing a total marketcapitalization of tens of trillions of dollars.
It is not possible to invest in an index. The indices are used herein for comparative purposes in accordancewith SEC regulations.
Cash flow is a measure of changes in a company’s cash account during an accounting period, specificallyits cash income minus the cash payments it makes. All else being equal, we greatly prefer companies thathave high “free cash flows,” which we define as the cash flow from operations that is left over afterspending on maintenance capital expenditures and acquisitions that are required to protect the business. Inother words, it’s the cash flow from operations that is free and clear to be distributed to shareholders in theform of dividends and share repurchases, and/or to be allocated towards ways to grow the existingbusiness through means such as “growth” acquisitions or new capital expenditures, or simply pay downdebt. Typically, we calculate this by looking at a normalized view of net income plus depreciation andamortization minus the maintenance capital expenditures and acquisitions that are required to protect thebusiness, adjusted for often overlooked items such as pensions, stock option expenses, and leases.
The forward risk-adjusted rate of return of a stock is our probability- and risk-weighted estimate of thecompound annualized return we believe we are likely to achieve by owning the stock. Using ourmethodology, the forward risk-adjusted rate of return is calculated by taking the sum total of the free cashflow per share of the company divided by its price (its “Free Cash Flow Yield”) and the long-term rate atwhich we expect these free cash flows to grow (the “Growth Rate of Free Cash Flow”) and then adjustingthis number up or down based on the risk inherent in the stock (i.e. how wide the potential distribution ofexpected returns are in the various possible future scenarios).
Return on Capital is a profitability ratio. It measures the return that an investment generates for capitalcontributors i.e. stockholders. It indicates how effective a company is at turning capital into profits.
Return on Equity (“ROE”) is a measure of financial performance calculated by dividing net income byshareholders’ equity. Because shareholders’ equity is equal to a company’s assets minus its debt, ROEcould be thought of as the return on net assets. ROE is considered a measure of how effectivelymanagement is using a company’s assets to create profits.
Must be proceeded/accompanied by a prospectus.
Quasar Distributors, LLC
Earnings growth is not representative of the fund’s future performance.
15
YCG Enhanced Fund

16
YCG Enhanced Fund
EXPENSE EXAMPLEFor the six months ended November 30, 2020 (Unaudited)
As a shareholder of the YCG Enhanced Fund (the “Fund”), you incur ongoing costs,including management fees and other Fund expenses. If you invest through afinancial intermediary, you may also incur additional costs such as a transaction feecharged on the purchase or sale of the Fund or an asset-based management fee. Thisexample is intended to help you understand your ongoing costs (in dollars) ofinvesting in the Fund and to compare these costs with the ongoing costs of investingin other mutual funds.
The Example is based on an investment of $1,000 invested at the beginning of theperiod and held for the entire period from June 1, 2020 to November 30, 2020.
Actual Expenses
The first line of the table on the next page provides information about actual accountvalues and actual expenses. You may use the information provided in this line,together with the amount you invested, to estimate the expenses that you paid overthe period. Simply divide your account value by $1,000 (for example, an $8,600ending account value divided by $1,000 = 8.6), then multiply the result by thenumber in the first line under the heading entitled “Expenses Paid During the Period”to estimate the expenses you paid on your account during the period.
Hypothetical Example for Comparison Purposes
The second line of the table on the next page provides information abouthypothetical account values and hypothetical expenses based on the Fund’s actualexpense ratio and an assumed rate of return of 5% per year before expenses, which isnot the Fund’s actual return. The hypothetical account values and expenses may notbe used to estimate the actual ending account balance or expenses you paid for theperiod. You may use this information to compare the ongoing costs of investing inthe Fund and other funds. To do so, compare this 5% hypothetical example with the5% hypothetical examples that appear in the shareholder reports of the other funds.

Please note that the expenses shown in the table are meant to highlight your ongoingcosts only and do not reflect any costs that may be associated with investing in theFund through a financial intermediary. Therefore, the second line of the table isuseful in comparing the ongoing costs only, and will not help you determine therelative total costs of owning different funds. In addition, if any costs associated withinvesting through a financial intermediary were included, your costs would havebeen higher.
Expenses PaidBeginning Ending During Period(1)
Account Value Account Value 6/1/20 –6/1/20 11/30/20 11/30/20_____________ _____________ ______________
Actual $1,000.00 $1,207.00 $6.57Hypothetical (5% returnbefore expenses) 1,000.00 1,019.05 6.01
(1) Expenses are equal to the Fund’s annualized expense ratio of 1.19%, multiplied by the average accountvalue over the period, multiplied by 183/366 to reflect the period.
17
YCG Enhanced Fund
EXPENSE EXAMPLE (continued)For the six months ended November 30, 2020 (Unaudited)

This chart assumes an initial gross investment of $10,000 made on December 28,2012 (commencement of the Fund’s operations). Returns shown include thereinvestment of all dividends. Returns shown do not reflect the deductions of taxesthat a shareholder would pay on Fund distributions or the redemption of Fundshares. In the absence of fee waivers and reimbursements, when they are necessaryto keep expenses at the expense cap, total return would be reduced. Pastperformance is not predictive of future performance. Investment return and principalvalue will fluctuate so that your shares, when redeemed, may be worth more or lessthan original cost. Index returns do not reflect the effects of fees or expenses. It isnot possible to invest directly in an index.
Since InceptionOne Year Three Year Five Year (12/28/2012)________ __________ _________ ______________
Average Annual ReturnsYCG Enhanced Fund 14.49% 15.76% 14.64% 14.33%S&P 500 Index 17.46% 13.17% 13.99% 15.04%S&P Global BMI TR Index 15.19% 8.99% 11.16% 10.59%
18
YCG Enhanced Fund
GROWTH OF $10,000 INVESTMENT(Unaudited)
BB
BBB
BBB
BB
BBBBBB
BBBBBBBBBBBBB
BBBB
FF
FFF
FFFFFFFF
FFFFFF
FFFFFFFFFFFFFF
HH
HHH
HHHHHHHHHHHHHHHHHHHHHHHH
HHHH
$0
$5,000
$10,000
$15,000
$20,000
$25,000
$30,000
$35,000
12/28/12 11/30/15 11/30/16 11/30/1711/30/13 11/30/14 11/30/18 11/30/19 11/30/20
B YCG Enhanced Fund – $28,902F S&P 500 Index – $30,341
H S&P Global BMI TR Index – $22,200

ConsumerDiscretionary 14%
ConsumerStaples 15%
CommunicationServices 6%
Financials 28%
Industrials 9%
InformationTechnology 13%
Real Estate 4%
Cash and OtherAssets in Excess
of Liabilities 11%
Percentage of Net Assets____________
MSCI, Inc. 5.71%Moody’s Corp. 4.75%MasterCard, Inc. – Class A 4.69%Microsoft Corp. 4.28%NIKE, Inc. – Class B 3.96%CBRE Group, Inc. – Class A 3.94%Verisk Analytics, Inc. 3.63%Marsh & McLennan Cos, Inc. 3.51%Aon PLC – Class A 3.42%L’Oreal SA 3.41%_______Total 41.30%______________
ALLOCATION OF PORTFOLIO HOLDINGS (as a % of net assets)November 30, 2020 (Unaudited)
For Fund compliance purposes, the Fund’s industry classifications refer to any one ormore of the industry sub-classifications used by one or more widely recognizedmarket indexes or ratings group indexes, and/or they may be defined by Fundmanagement. This definition does not apply for all purposes of this report, whichmay combine sub-classifications for reporting ease. Categories are shown as apercentage of net assets.
19
YCG Enhanced Fund
TOP TEN EQUITY HOLDINGSNovember 30, 2020 (Unaudited)

Shares Value
COMMON STOCKS – 89.05%
Automobiles – 1.01%Ferrari NV 19,774 $ 4,174,489___________
Banks – 4.88%Bank of America Corp. 185,497 5,223,595JPMorgan Chase & Co. 43,171 5,088,997Wells Fargo & Co. 361,336 9,882,540___________
20,195,132___________
Beverages – 1.98%PepsiCo., Inc. 56,870 8,202,360___________
Capital Markets – 13.41%Moody’s Corp. (a) 69,508 19,624,889MSCI, Inc. 57,630 23,594,875S&P Global, Inc. (a) 6,034 2,122,640The Charles Schwab Corp. 206,919 10,093,509___________
55,435,913___________
Commercial Services & Supplies – 3.37%Copart, Inc. (a)(b) 120,695 13,934,238___________
Household Products – 3.97%Colgate-Palmolive Co. 96,186 8,237,369The Procter & Gamble Co. (c) 59,035 8,198,190___________
16,435,559___________
Insurance – 10.34%Aon PLC – Class A (c) 68,979 14,133,107Marsh & McLennan Cos, Inc. 126,768 14,532,684The Progressive Corp. 161,849 14,098,666___________
42,764,457___________
Interactive Media & Services – 6.60%Alphabet, Inc. – Class C (a)(b) 8,001 14,087,681Facebook, Inc. – Class A (a)(b) 47,631 13,192,358___________
27,280,039___________
Internet & Direct Marketing Retail – 2.49%Booking Holdings, Inc. (b) 5,065 10,274,099___________
20
YCG Enhanced Fund
SCHEDULE OF INVESTMENTSNovember 30, 2020
See notes to financial statements.

Shares Value
COMMON STOCKS – 89.05% (continued)
IT Services – 5.40%MasterCard, Inc. – Class A 57,685 $ 19,411,579Visa, Inc. – Class A (a) 13,925 2,929,124___________
22,340,703___________
Personal Products – 8.72%L’Oreal SA (d) 38,547 14,106,879The Estee Lauder Companies, Inc. – Class A (a) 53,853 13,211,218Unilever PLC – ADR 143,369 8,754,111___________
36,072,208___________
Professional Services – 5.28%CoStar Group, Inc. (a)(b) 7,489 6,819,259Verisk Analytics, Inc. (a) 75,668 15,005,721___________
21,824,980___________
Real Estate Management & Development – 3.94%CBRE Group, Inc. – Class A (b) 266,205 16,275,774___________
Software – 7.29%Adobe, Inc. (a)(b) 12,828 6,137,813Intuit, Inc. (a) 17,911 6,305,030Microsoft Corp. (a) 82,776 17,719,859___________
30,162,702___________
Textiles, Apparel & Luxury Goods – 10.37%Adidas AG (b)(d) 18,342 5,848,313Cie Financiere Richemont SA (d) 45,222 3,756,101Hermes International (d) 8,483 8,271,211LVMH Moet Hennessy Louis Vuitton SE (d) 14,988 8,633,480NIKE, Inc. – Class B (a) 121,659 16,387,467___________
42,896,572___________TOTAL COMMON STOCKS (Cost $216,404,859) 368,269,225___________
WARRANTS – 0.00% (e)
Textiles, Apparel & Luxury Goods – 0.00% (e)Cie Financiere Richemont SA (b)(d) 90,444 17,915___________TOTAL WARRANTS (Cost $0) 17,915___________
21
YCG Enhanced Fund
SCHEDULE OF INVESTMENTS (continued)November 30, 2020
See notes to financial statements.

PrincipalAmount Value
SHORT-TERM INVESTMENTS – 8.12%
U.S. Treasury Bills – 8.12%0.000%, 12/03/2020 (b) $ 2,908,000 $ 2,907,9800.000%, 12/17/2020 (b) 21,000 20,9990.000%, 12/24/2020 (b) 3,370,000 3,369,8540.000%, 12/31/2020 (b) 12,600,000 12,599,3700.000%, 01/14/2021 (b) 14,000 13,9990.000%, 01/21/2021 (b) 130,000 129,9870.000%, 02/04/2021 (b) 2,041,000 2,040,7140.000%, 02/11/2021 (b) 2,349,000 2,348,6590.000%, 02/18/2021 (b) 2,261,000 2,260,6400.000%, 02/25/2021 (b) 3,000 3,0000.000%, 03/02/2021 (b) 155,000 154,9710.000%, 03/04/2021 (b) 498,000 497,9040.000%, 03/11/2021 (b) 16,000 15,9970.000%, 03/18/2021 (b) 203,000 202,9490.000%, 03/25/2021 (b) 2,996,000 2,995,2050.000%, 04/08/2021 (b) 102,000 101,9710.000%, 04/13/2021 (b) 1,339,000 1,338,6140.000%, 04/15/2021 (b) 1,334,000 1,333,6000.000%, 04/20/2021 (b) 63,000 62,9800.000%, 04/22/2021 (b) 839,000 838,7310.000%, 04/29/2021 (b) 109,000 108,9640.000%, 05/27/2021 (b) 209,000 208,910___________
33,555,998___________TOTAL SHORT-TERM INVESTMENTS (Cost $33,557,304) 33,555,998___________Total Investments (Cost $249,962,163) – 97.17% 401,843,138Other Assets in Excess of Liabilities – 2.83% 11,710,335___________TOTAL NET ASSETS – 100.00% $413,553,473______________________
Percentages are stated as a percent of net assets.ADR American Depositary ReceiptPLC Public Limited Company(a) Security held in connection with options written.(b) Non-Income Producing.(c) A portion of this security is pledged as collateral on options written. As of November 30, 2020, the
value of collateral is $9,699,313.
22
YCG Enhanced Fund
SCHEDULE OF INVESTMENTS (continued)November 30, 2020
See notes to financial statements.

(d) Foreign issued security.(e) Less than 0.05%.
The Global Industry Classification Standard (GICS) was developed by and/or is theexclusive property of MSCI, Inc. (“MSCI”) and Standard & Poor Financial ServicesLLC (“S&P”). GICS is a service mark of MSCI and S&P and has been licensed foruse by U.S. Bank Global Fund Services.
23
YCG Enhanced Fund
SCHEDULE OF INVESTMENTS (continued)November 30, 2020
See notes to financial statements.

NotionalContracts Amount Value
PUT OPTIONS(a)
Adobe, Inc.Expiration: January 2021; Exercise Price: $455.00 35 $1,592,500 $ 52,850Expiration: January 2021; Exercise Price: $510.00 114 5,814,000 494,475
Alphabet, Inc. – Class CExpiration: January 2021; Exercise Price: $1,740.00 4 696,000 23,120
Copart, Inc.Expiration: February 2021; Exercise Price: $115.00 240 2,760,000 157,440
CoStar Group, Inc.Expiration: January 2021; Exercise Price: $910.00 18 1,638,000 60,300
The Estee Lauder Cos, Inc. – Class AExpiration: January 2021; Exercise Price: $230.00 37 851,000 18,648Expiration: January 2021; Exercise Price: $240.00 26 624,000 22,854
Facebook, Inc.Expiration: January 2021; Exercise Price: $275.00 57 1,567,500 72,390
Intuit, Inc.Expiration: January 2021; Exercise Price: $350.00 185 6,475,000 270,100
Microsoft Corp.Expiration: December 2020; Exercise Price: $205.00 333 6,826,500 59,940Expiration: January 2021; Exercise Price: $215.00 31 666,500 28,365
Moody’s Corp.Expiration: February 2021; Exercise Price: $280.00 187 5,236,000 272,085Expiration: February 2021; Exercise Price: $290.00 40 1,160,000 78,600
24
YCG Enhanced Fund
SCHEDULE OF OPTIONS WRITTENNovember 30, 2020
See notes to financial statements.

NotionalContracts Amount Value
PUT OPTIONS(a) (continued)NIKE, Inc. – Class BExpiration: January 2021; Exercise Price: $130.00 50 $ 650,000 $ 22,600
S&P Global, Inc.Expiration: January 2021; Exercise Price: $350.00 13 455,000 15,860
Verisk Analytics, Inc.Expiration: December 2020; Exercise Price: $185.00 86 1,591,000 10,320
Visa, Inc. – Class AExpiration: January 2021; Exercise Price: $205.00 220 4,510,000 118,800Expiration: January 2021; Exercise Price: $210.00 40 840,000 31,600Expiration: January 2021; Exercise Price: $215.00 52 1,118,000 56,576_________
Total Options Written(Premiums received $3,145,622) $1,866,923__________________
(a) Exchange Traded
25
YCG Enhanced Fund
SCHEDULE OF OPTIONS WRITTEN (continued)November 30, 2020
See notes to financial statements.
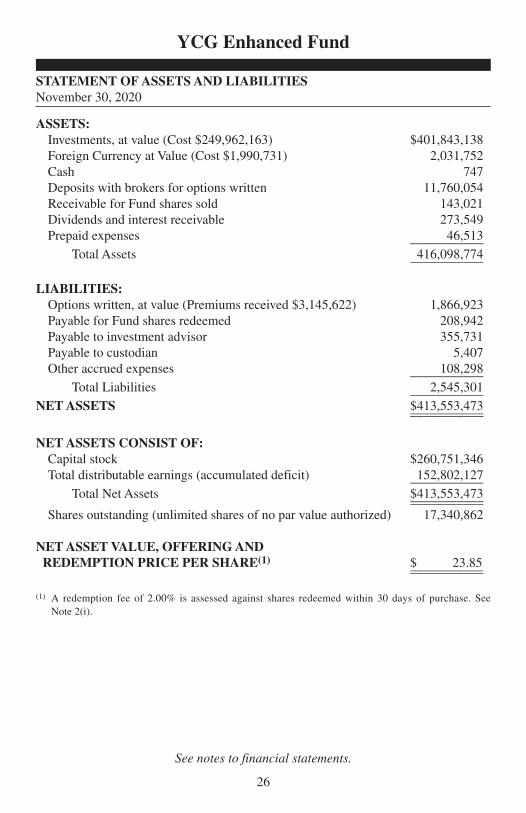
ASSETS:Investments, at value (Cost $249,962,163) $401,843,138Foreign Currency at Value (Cost $1,990,731) 2,031,752Cash 747Deposits with brokers for options written 11,760,054Receivable for Fund shares sold 143,021Dividends and interest receivable 273,549Prepaid expenses 46,513___________
Total Assets 416,098,774___________
LIABILITIES:Options written, at value (Premiums received $3,145,622) 1,866,923Payable for Fund shares redeemed 208,942Payable to investment advisor 355,731Payable to custodian 5,407Other accrued expenses 108,298___________
Total Liabilities 2,545,301___________NET ASSETS $413,553,473______________________
NET ASSETS CONSIST OF:Capital stock $260,751,346Total distributable earnings (accumulated deficit) 152,802,127___________
Total Net Assets $413,553,473______________________Shares outstanding (unlimited shares of no par value authorized) 17,340,862
NET ASSET VALUE, OFFERING AND REDEMPTION PRICE PER SHARE(1) $ 23.85______________________
(1) A redemption fee of 2.00% is assessed against shares redeemed within 30 days of purchase. SeeNote 2(i).
26
YCG Enhanced Fund
STATEMENT OF ASSETS AND LIABILITIESNovember 30, 2020
See notes to financial statements.
27
YCG Enhanced Fund
See notes to financial statements.
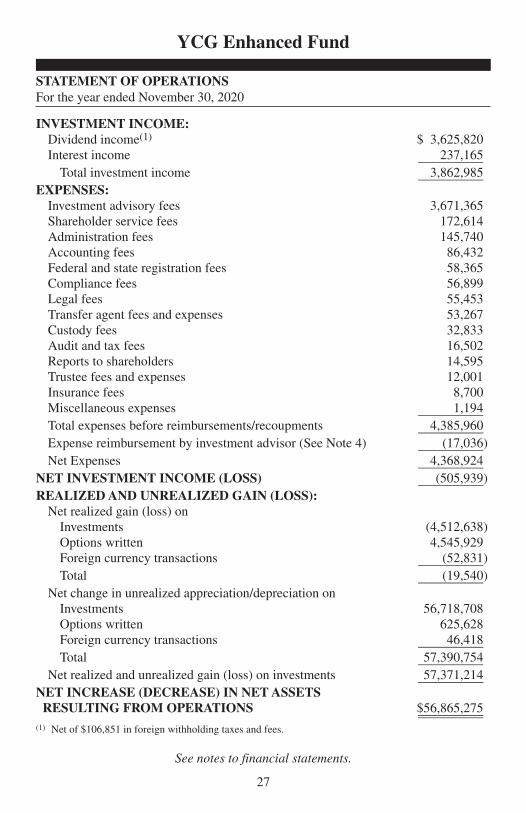
INVESTMENT INCOME:Dividend income(1) $ 3,625,820Interest income 237,165__________Total investment income 3,862,985__________
EXPENSES:Investment advisory fees 3,671,365Shareholder service fees 172,614Administration fees 145,740Accounting fees 86,432Federal and state registration fees 58,365Compliance fees 56,899Legal fees 55,453Transfer agent fees and expenses 53,267Custody fees 32,833Audit and tax fees 16,502Reports to shareholders 14,595Trustee fees and expenses 12,001Insurance fees 8,700Miscellaneous expenses 1,194__________Total expenses before reimbursements/recoupments 4,385,960__________Expense reimbursement by investment advisor (See Note 4) (17,036)__________Net Expenses 4,368,924__________
NET INVESTMENT INCOME (LOSS) (505,939)__________REALIZED AND UNREALIZED GAIN (LOSS):Net realized gain (loss) onInvestments (4,512,638)Options written 4,545,929Foreign currency transactions (52,831)__________Total (19,540)__________
Net change in unrealized appreciation/depreciation onInvestments 56,718,708Options written 625,628Foreign currency transactions 46,418__________Total 57,390,754__________
Net realized and unrealized gain (loss) on investments 57,371,214__________NET INCREASE (DECREASE) IN NET ASSETS RESULTING FROM OPERATIONS $56,865,275____________________
(1) Net of $106,851 in foreign withholding taxes and fees.
STATEMENT OF OPERATIONSFor the year ended November 30, 2020

Year Ended Year EndedNovember 30, 2020 November 30, 2019
OPERATIONS:Net investment income (loss) $ (505,939) $ 228,840Net realized gain (loss) on investments and options written (19,540) 1,624,214Net change in unrealized appreciation (depreciation) on investments and options written 57,390,754 58,114,688____________ ___________Net increase (decrease) in net assetsresulting from operations 56,865,275 59,967,742____________ ___________
CAPITAL SHARE TRANSACTIONS:Proceeds from shares sold 146,143,174 74,203,482Proceeds from reinvestment of distributions 1,689,631 5,917,849Redemption fees 45,166 8,849____________ ___________
147,877,971 80,130,180Payments for shares redeemed (106,820,398) (17,825,146)____________ ___________Net increase (decrease) 41,057,573 62,305,034____________ ___________
DISTRIBUTIONS TO SHAREHOLDERS:Distributions to shareholders (1,852,171) (6,366,375)
TOTAL INCREASE (DECREASE) IN NET ASSETS 96,070,677 115,906,401
NET ASSETS:Beginning of year 317,482,796 201,576,395____________ ___________End of year $ 413,553,473 $317,482,796____________ _______________________ ___________
CHANGES IN SHARES OUTSTANDING:Shares sold 7,576,427 3,958,521Issued in reinvestment of distributions 79,625 395,578Shares redeemed (5,471,065) (1,061,421)____________ ___________Net increase (decrease) 2,184,987 3,292,678____________ _______________________ ___________
28
YCG Enhanced Fund
STATEMENTS OF CHANGES IN NET ASSETS
See notes to financial statements.

For a Fund share outstanding throughout the year
Year Ended November 30, 2020 2019 2018 2017 2016
NET ASSET VALUE:Beginning of year $20.95 $16.99 $16.60 $14.00 $13.73______ ______ ______ ______ ______
OPERATIONS:Net investment income (loss) (0.03) 0.02 0.06 0.07 0.08Net realized and unrealized gain (loss) on investment securities 3.05 4.48 0.93 3.00 0.48______ ______ ______ ______ ______Total from investment operations 3.02 4.50 0.99 3.07 0.56______ ______ ______ ______ ______Redemption fee proceeds —(1) —(1) —(1) —(1) —(1)______ ______ ______ ______ ______
Distributions from netinvestment income (0.01) (0.06) (0.07) (0.08) (0.06)Distributions from net realized gains (0.11) (0.48) (0.53) (0.39) (0.23)______ ______ ______ ______ ______Total distributions (0.12) (0.54) (0.60) (0.47) (0.29)______ ______ ______ ______ ______
NET ASSET VALUE:End of year $23.85 $20.95 $16.99 $16.60 $14.00______ ______ ______ ______ ____________ ______ ______ ______ ______
TOTAL RETURN 14.49% 27.74% 6.08% 22.58% 4.11%
SUPPLEMENTAL DATA AND RATIOS:Net assets; end of year (000’s) $413,553 $317,483 $201,576 $142,099 $109,568Ratio of expenses to average net assets:Expenses including reimbursement (recapture) 1.19% 1.19% 1.19% 1.19% 1.24%(2)
Expenses excluding reimbursement (recapture) 1.19% 1.20% 1.24% 1.34% 1.36%Net investment income (loss) including reimbursement (recapture) (0.14)% 0.09% 0.37% 0.47% 0.58%Net investment income (loss) excluding reimbursement (recapture) (0.14)% 0.08% 0.32% 0.32% 0.46%
Portfolio turnover rate 44% 6% 21% 16% 24%
(1) Amount represents less than $0.01 per share.(2) See Note 4.
29
YCG Enhanced Fund
FINANCIAL HIGHLIGHTS
See notes to financial statements.
1. ORGANIZATION
YCG Funds (the “Trust”) is a Delaware statutory trust organized under an Agreementand Declarations of Trust dated September 4, 2012. The Trust is an open-endmanagement investment company, as defined in the Investment Company Act of1940 (the “1940 Act”), as amended. The Trust consists of one series, YCG EnhancedFund (the “Fund”). The Fund is classified and operates as a non-diversified fundunder the 1940 Act. The Fund commenced operations on December 28, 2012. TheFund’s investment adviser is YCG, LLC (the “Adviser”). There are an unlimitednumber of authorized shares. The investment objective of the Fund is to maximizelong-term capital appreciation with reasonable investment risk.
2. SUMMARY OF SIGNIFICANT ACCOUNTING POLICIES
The following is a summary of significant accounting policies consistently followedby the Fund in the preparation of its financial statements. The financial statementshave been prepared in conformity with accounting principles generally accepted inthe United States of America (“GAAP”). The Fund is an investment company andaccordingly follows the investment company accounting and reporting guidance ofthe Financial Accounting Standards Board (“FASB”) Accounting StandardsCodification (“ASC”) Topic 946 Financial Services – Investment Companies.
a) Subsequent Events Evaluation – In preparing these financial statements, theFund has evaluated events and transactions for potential recognition or disclosureresulting from subsequent events through the date the financial statements wereissued. This evaluation did not result in any subsequent events that necessitateddisclosures and/or adjustments other than noted below.
Effective as of January 4, 2021, Herald Investment Marketing LLC is the newdistributor for the Trust.
b) Foreign Currency – Investment securities and other assets and liabilitiesdenominated in foreign currencies are translated into U.S. dollar amounts at the dateof valuation. Purchases and sales of investment securities and income and expenseitems denominated in foreign currencies are translated into U.S. dollar amounts onthe respective dates of such transactions. The Fund does not isolate that portion ofthe results of operations resulting from changes in foreign exchange rates oninvestments and currency gains or losses realized between the trade and settlementdates on securities transactions from the fluctuations arising from changes in marketprices of securities held. Such fluctuations are included with the net realized andunrealized gain or loss from investments. Reported net realized foreign exchangegains or losses that arise from sales of foreign currencies, currency gains or lossesrealized between the trade and settlement dates on foreign currency transactions, and
30
YCG Enhanced Fund
NOTES TO FINANCIAL STATEMENTSNovember 30, 2020

the difference between the amounts of dividends, interest, and foreign withholdingtaxes recorded on the Fund’s books and the U.S. dollar equivalent of the amountsactually received or paid. Net unrealized foreign exchange gains and losses arisefrom changes in the values of assets and liabilities, other than investments insecurities at fiscal period end, resulting from changes in exchange rates.
c) Investment Valuation – The Fund’s investments are valued at fair value. Fairvalue as used for determining the Fund’s net asset value is in contrast to the use ofthe term “fair value” for making valuation measurements in connection withpreparing the Fund’s financial statements, as discussed below under “ValuationMeasurements.” FASB Accounting Standard Codification Topic 820: Fair ValueMeasurement uses the term “fair value” to refer generally to the value of an asset orliability, regardless of whether that value is based on readily available marketquotations or on other inputs.
Securities which are traded on a national stock exchange are valued at the last saleprice on the securities exchange on which such securities are primarily traded.Securities that are traded on The Nasdaq OMX Group, Inc., referred to as Nasdaq,are valued at the Nasdaq Official Closing Price. Exchange-traded securities for whichthere were no transactions are valued at the current bid prices. Securities traded ononly over-the-counter markets are valued on the basis of closing over-the-counter bidprices. Short-term debt instruments maturing within 60 days are valued by theamortized cost method, which approximates fair value. Amortized cost is not used ifits use would be inappropriate due to credit or other impairments of the issuer, inwhich case the security’s fair value would be determined, as described below. Debtsecurities (other than those valued using the amortized cost method) are valued at themarket price furnished by a national pricing service, if available, and otherwise at themost recent bid quotation or evaluated price, subject to review by the Adviser anddetermination of the appropriate price whenever a furnished price is significantlydifferent from the previous day’s furnished price. Options written or purchased bythe Fund are valued at the last sales price. If there are no trades for an option on agiven day, options are valued at the mean between the current bid and asked prices. Ifmarket quotations are not readily available for a security or if a security’s value hasbeen materially affected by events occurring after the close of the exchange ormarket on which the security is principally traded, then that security may be valuedby another method that the Board of Trustees believes accurately reflects fair value.A security’s valuation may differ depending on the method used for determining fairvalue. Fair value in this context is the value of securities for which no readilyavailable market quotations exist, as determined in good faith by the Adviserpursuant to procedures established by and under the supervision of the Board.
31
YCG Enhanced Fund
NOTES TO FINANCIAL STATEMENTS (continued)November 30, 2020
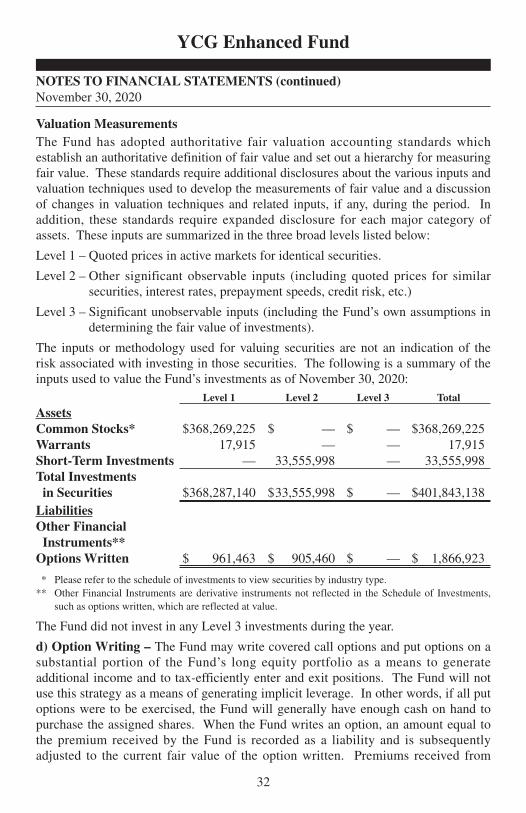
Valuation MeasurementsThe Fund has adopted authoritative fair valuation accounting standards whichestablish an authoritative definition of fair value and set out a hierarchy for measuringfair value. These standards require additional disclosures about the various inputs andvaluation techniques used to develop the measurements of fair value and a discussionof changes in valuation techniques and related inputs, if any, during the period. Inaddition, these standards require expanded disclosure for each major category ofassets. These inputs are summarized in the three broad levels listed below:
Level 1 – Quoted prices in active markets for identical securities.
Level 2 – Other significant observable inputs (including quoted prices for similarsecurities, interest rates, prepayment speeds, credit risk, etc.)
Level 3 – Significant unobservable inputs (including the Fund’s own assumptions indetermining the fair value of investments).
The inputs or methodology used for valuing securities are not an indication of therisk associated with investing in those securities. The following is a summary of theinputs used to value the Fund’s investments as of November 30, 2020:
Level 1 Level 2 Level 3 Total
AssetsCommon Stocks* $368,269,225 $ — $ — $368,269,225Warrants 17,915 — — 17,915Short-Term Investments — 33,555,998 — 33,555,998Total Investments in Securities $368,287,140 $33,555,998 $ — $401,843,138LiabilitiesOther Financial Instruments**Options Written $ 961,463 $ 905,460 $ — $ 1,866,923
* Please refer to the schedule of investments to view securities by industry type.** Other Financial Instruments are derivative instruments not reflected in the Schedule of Investments,
such as options written, which are reflected at value.
The Fund did not invest in any Level 3 investments during the year.
d) Option Writing – The Fund may write covered call options and put options on asubstantial portion of the Fund’s long equity portfolio as a means to generateadditional income and to tax-efficiently enter and exit positions. The Fund will notuse this strategy as a means of generating implicit leverage. In other words, if all putoptions were to be exercised, the Fund will generally have enough cash on hand topurchase the assigned shares. When the Fund writes an option, an amount equal tothe premium received by the Fund is recorded as a liability and is subsequentlyadjusted to the current fair value of the option written. Premiums received from
32
YCG Enhanced Fund
NOTES TO FINANCIAL STATEMENTS (continued)November 30, 2020

writing options that expire unexercised are treated by the Fund on the expiration dateas realized gains from options written. The difference between the premium and theamount paid on effecting a closing purchase transaction, including brokeragecommissions, is also treated as a realized gain, or, if the premium is less than theamount paid for the closing purchase transaction, as a realized loss. If a call optionis exercised, the premium is added to the proceeds from the sale of the underlyingsecurity in determining whether the Fund has realized a gain or loss. If a put optionis exercised, the premium reduces the cost basis of the securities purchased by theFund. The Fund, as a writer of an option, bears the market risk of an unfavorablechange in the price of the security underlying the written option. Upon writing anoption, the Fund is required to pledge an amount of cash or securities, as determinedby the broker, as collateral. As of November 30, 2020, the Fund held securities witha value of $9,699,313 and cash of $11,760,054 as collateral for options written.During the period, the Fund used written covered call and put options in a mannerconsistent with the strategy described above.
The value of Derivative Instruments on the Statement of Assets and Liabilities as ofNovember 30, 2020, are as follows:
Liability Derivatives__________________________________Derivatives not accounted for as hedging instruments Location ValueEquity Contracts – Options Options written, at value $1,866,923
The effect of Derivative Instruments on the Statement of Operations for the periodended November 30, 2020, are as follows:
Amount of Realized Gain on Change in Unrealized Appreciation Derivatives Recognized in Income on Derivatives Recognized in Income
Derivatives not Derivatives not accounted for as Options accounted for as Optionshedging instruments Written hedging instruments WrittenEquity Contracts $4,545,929 Equity Contracts $625,628
The average monthly value of options written during the period ended November 30,2020 was $2,534,531.
Derivative RisksThe risks of using the various types of derivatives in which the Fund may engageinclude the risk that movements in the value of the derivative may not fully offset orcomplement instruments currently held in the Fund in the manner intended by theAdviser, the risk that the counterparty to a derivative contract may fail to complywith its obligations to the Fund, the risk that there may not be a liquid secondary
33
YCG Enhanced Fund
NOTES TO FINANCIAL STATEMENTS (continued)November 30, 2020

market for the derivative at a time when the Fund would look to disengage theposition, the risk that additional capital from the Fund may be called upon to fulfillthe conditions of the derivative contract, the risk that the use of derivatives mayinduce leverage in the Fund, and the risk that the cost of the derivative may reducethe overall returns experience by the Fund.
Offsetting Assets and LiabilitiesThe Fund is subject to various Master Netting Arrangements, which govern the terms ofcertain transactions with select counterparties. The Master Netting Arrangements allowthe Fund to close out and net its total exposure to a counterparty in the event of adefault with respect to all the transactions governed under a single agreement with acounterparty. The Master Netting Arrangements also specify collateral postingarrangements at pre-arranged exposure levels. Under the Master Netting Arrangements,collateral is routinely transferred if the total net exposure to certain transactions (net ofexisting collateral already in place) governed under the relevant Master NettingArrangement with a counterparty in a given account exceeds a specified thresholddepending on the counterparty and the type of Master Netting Arrangement.
The following is a summary of the Assets and Liabilities subject to offsetting in theFund as of November 30, 2020:Liabilities Gross Amounts Not
Offset in the Statement of Assets and Liabilities_____________________
Gross NetAmounts AmountsOffset Presented
Gross in the in theAmounts Statement Statementof of Assets of Assets
Description / Recognized and and Financial Collateral NetCounterparty Liabilities Liabilities Liabilities Instruments Pledged Amount
Options WrittenInteractive Brokers $1,866,923 $ — $1,866,923 $ — $1,866,923 $ —
In some instances, the collateral amounts disclosed in the tables were adjusted due tothe requirement to limit the collateral amounts to avoid the effect ofovercollateralization. Actual collateral received/pledged may be more than theamounts disclosed herein.
e) Federal Income Taxes – The Fund intends to qualify as a “regulated investmentcompany” under Subchapter M of the Internal Revenue Code of 1986, as amended.If so qualified, the Fund will not be subject to federal income tax to the extent itdistributes substantially all of its net investment income and capital gains toshareholders. Therefore, no federal income tax provision is required.
34
YCG Enhanced Fund
NOTES TO FINANCIAL STATEMENTS (continued)November 30, 2020

The Fund has adopted financial reporting rules regarding recognition andmeasurement of tax positions taken or expected to be taken on a tax return. TheFund recognizes interest and penalties, if any, related to unrecognized tax benefits asincome tax expense in the Statement of Operations. During the year, the Fund didnot incur any interest or penalties. As of and during the year ended November 30,2020, the Fund did not have any liabilities for unrecognized tax benefits.
The Fund is not subject to examination by U.S. tax authorities for tax years prior tothe period ended November 30, 2017.
f) Distributions to Shareholders – The Fund will declare and distribute any netinvestment income and any net realized long or short-term capital gains annually.Distributions to shareholders are recorded on the ex-dividend date. The character ofdistributions made during the year from net investment income or net realized gainsmay differ from the characterization for federal income tax purposes due todifferences in the recognition of income, expense and gain items for financialstatement and tax purposes. Where appropriate, reclassifications between capitalaccounts are made for such differences that are permanent in nature.
g) Use of Estimates – The preparation of the financial statements in conformity withGAAP requires management to make estimates and assumptions that affect thereported amounts of assets and liabilities and disclosure of contingent assets andliabilities at the date of the financial statements and the reported amounts ofincreases and decreases in net assets from operations during the reporting period.Actual results could differ from those estimates.
h) Guarantees and Indemnifications – Under the Fund’s organizational documents,its officers and trustees are indemnified by the Fund against certain liabilities arisingout of the performance of their duties to the Fund. Additionally, in the normal courseof business, the Fund enters into contracts with service providers that contain generalindemnification clauses. The Fund’s maximum exposure under these arrangementsis unknown as this would involve future claims against the Fund that have not yetoccurred. Currently, the Fund expects the risk of loss to be remote.
i) Redemption Fee – Those who buy and sell the Fund within 30 calendar days willincur a 2% redemption fee, retained for the benefit of long-term shareholders,recorded as additional capital in the Statement of Changes in Net Assets.
j) Beneficial Ownership – The beneficial ownership, either directly or indirectly, ofmore than 25% of the voting securities of a fund creates a presumption of control ofthe Fund, under Section 2(a)(9) of the 1940 Act. At November 30, 2020, noshareholder held more than 25% of the outstanding shares of the YCG Enhanced Fund.
k) Other – Investment transactions and shareholder transactions are accounted for on thetrade date. Net realized gains and losses on securities are computed on the basis ofspecific identification. Dividend income is recognized on the ex-dividend date and
35
YCG Enhanced Fund
NOTES TO FINANCIAL STATEMENTS (continued)November 30, 2020

interest income is recognized on an accrual basis. Discounts and premiums on securitiespurchased are accreted and amortized over the lives of the respective securities.Withholding taxes on foreign dividends have been provided for in accordance with theFund’s understanding of the applicable country’s tax rules and regulations.
3. INVESTMENT TRANSACTIONS
For the year ended November 30, 2020, the aggregate purchases and sales ofsecurities, excluding short-term securities, were $173,880,985 and $144,366,104respectively for the Fund. For the year ended November 30, 2020, there were nolong-term purchases or sales of U.S. Government securities for the Fund.
4. COMMITMENTS AND OTHER RELATED PARTY TRANSACTIONS
The Adviser acts as the investment adviser to the Fund pursuant to an investmentadvisory agreement (the “Advisory Agreement”) which has been approved by theBoard (including a majority of the Trustees who are not parties to the AdvisoryAgreement, or interested persons of any such party). Under the terms of the AdvisoryAgreement between the Fund and the Adviser, the Adviser conducts investmentresearch and management for the Fund and is responsible for the purchase and sale ofsecurities for the Fund’s investment portfolio. The Adviser provides the Fund withinvestment advice, supervises the management and investment programs and providesinvestment advisory facilities and executive and supervisory personnel for managingthe investments and effectuating portfolio transactions. The Adviser also furnishes, atits own expense, all necessary administrative services, office space, equipment andclerical personnel for servicing the investments of the Fund. With the exception ofthe Chief Compliance Officer, who became an employee of the Advisor in March2020, such officers receive no compensation from the Fund for serving in theirrespective roles. The Fund makes reimbursement payments to the Advisor for thesalary and benefits associated with the office of the Chief Compliance Officer. Thecompliance fees expensed by the Fund during the year ended November 30, 2020, areincluded in the Statement of Operations. Under the Advisory Agreement, the monthlycompensation paid to the Adviser is accrued daily at an annual rate of 1.00% on theaverage daily net assets of the Fund.
In the interest of limiting the expenses of the Fund, the Adviser has entered into acontractual expense limitation agreement with the Fund. Pursuant to the ExpenseLimitation Agreement, the Adviser (for the lifetime of the Fund) has agreed to waiveor limit its fees and assume other expenses of the Fund (excluding interest, taxes,brokerage commissions and dividend expenses on securities sold short andextraordinary expenses not incurred in the ordinary course of business) so that theFund’s ratio of total annual operating expenses is limited to 1.39%. In addition to thelifetime limit, the Adviser has agreed to reimburse the Fund to the extent necessary
36
YCG Enhanced Fund
NOTES TO FINANCIAL STATEMENTS (continued)November 30, 2020

to ensure that total annual fund operating expenses to do not exceed 1.19% at leastthrough April 1, 2022. The Adviser is entitled to the reimbursement of fees waived orreimbursed by the Adviser to the Fund subject to the limitations that (1) thereimbursement is made only for fees and expenses incurred not more than thirty-sixmonths following the month in which the reimbursement occurred, and (2) thereimbursement may not be made if it would cause the Fund’s annual expenselimitation to be exceeded. The reimbursement amount may not include anyadditional charges or fees, such as interest accruable on the reimbursement account.During the year ended November 30, 2020, the Fund reimbursed $57,269 ofpreviously waived expenses but also waived $74,305 to the Adviser. As ofNovember 30, 2020, expenses of $90,321, $41,779 and $74,305 are subject torecoupment by the Adviser, expiring during the year ended November 30, 2021,November 30, 2022 and November 30, 2023, respectively.
Certain officers, trustees and shareholders of the Fund are also owners or employeesof the Adviser.
Quasar Distributors, LLC, (“Quasar”) acted as the Fund’s principal underwriter in acontinuous public offering of the Fund’s shares during the fiscal year endedNovember 30, 2020. Effective as of January 4, 2021, Herald Investment Marketing,LLC will replace Quasar as the principal underwriter.
The Fund has entered into Service Agreements with U.S. Bancorp Fund Services,LLC doing business as U.S. Bank Global Fund Services (“Fund Services”), and aCustody Agreement with U.S. Bank, N.A. Under these agreements, Fund Servicesand U.S. Bank, N.A. provide certain transfer agency, administrative, accounting andcustody services.
For the period ended November 30, 2020, the Fund paid U.S Bank, N.A., while itwas an affiliate of Quasar, $9,666 for brokerage commissions.
5. CERTAIN RISKS
Non-Diversification Risk: The Fund is non-diversified. A non-diversified fund mayinvest more of its assets in fewer companies than if it were a diversified fund. TheFund may be more exposed to the risks of loss and volatility than a fund that investsmore broadly.
COVID-19 Risk: The global outbreak of COVID-19 (commonly referred to as“coronavirus”) has disrupted economic markets and the prolonged economic impactis uncertain. The ultimate economic fallout from the pandemic, and the long-termimpact on economies, markets, industries and individual issuers, are not known. Theoperational and financial performance of the issuers of securities in which the Fundsinvest depends on future developments, including the duration and spread of theoutbreak, and such uncertainty may in turn adversely affect the value and liquidity of
37
YCG Enhanced Fund
NOTES TO FINANCIAL STATEMENTS (continued)November 30, 2020
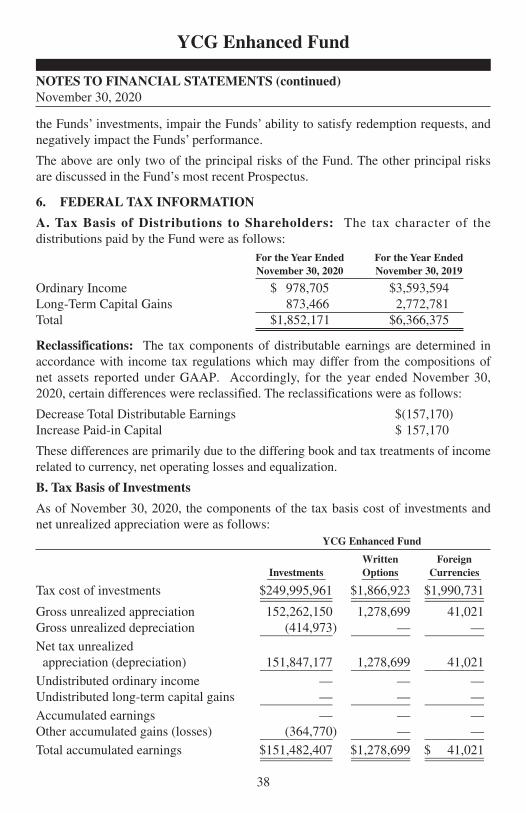
the Funds’ investments, impair the Funds’ ability to satisfy redemption requests, andnegatively impact the Funds’ performance.
The above are only two of the principal risks of the Fund. The other principal risksare discussed in the Fund’s most recent Prospectus.
6. FEDERAL TAX INFORMATION
A. Tax Basis of Distributions to Shareholders: The tax character of thedistributions paid by the Fund were as follows:
For the Year Ended For the Year EndedNovember 30, 2020 November 30, 2019
Ordinary Income $ 978,705 $3,593,594Long-Term Capital Gains 873,466 2,772,781Total $1,852,171 $6,366,375
Reclassifications: The tax components of distributable earnings are determined inaccordance with income tax regulations which may differ from the compositions ofnet assets reported under GAAP. Accordingly, for the year ended November 30,2020, certain differences were reclassified. The reclassifications were as follows:
Decrease Total Distributable Earnings $(157,170)Increase Paid-in Capital $ 157,170
These differences are primarily due to the differing book and tax treatments of incomerelated to currency, net operating losses and equalization.
B. Tax Basis of Investments
As of November 30, 2020, the components of the tax basis cost of investments andnet unrealized appreciation were as follows:
YCG Enhanced Fund
Written ForeignInvestments Options Currencies___________ _______ __________
Tax cost of investments $249,995,961 $1,866,923 $1,990,731___________ _________ ____________________ _________ _________Gross unrealized appreciation 152,262,150 1,278,699 41,021Gross unrealized depreciation (414,973) — —___________ _________ _________Net tax unrealized appreciation (depreciation) 151,847,177 1,278,699 41,021___________ _________ _________Undistributed ordinary income — — —Undistributed long-term capital gains — — —___________ _________ _________Accumulated earnings — — —Other accumulated gains (losses) (364,770) — —___________ _________ _________Total accumulated earnings $151,482,407 $1,278,699 $ 41,021___________ _________ ____________________ _________ _________
38
YCG Enhanced Fund
NOTES TO FINANCIAL STATEMENTS (continued)November 30, 2020

The tax basis of investments for tax and financial reporting purposes differs,principally due to the deferral of losses on wash sales.
At November 30, 2020 the Fund had the following capital loss carryforwards:Short-Term Long-Term Expires___________ __________ _______
YCG $ — $279 Indefinite
Net capital losses incurred after October 31, and within the taxable year are deemed toarise on the first business day of the Fund’s next taxable year. Qualified late-yearordinary losses are the excess of the sum of the specified loss attributable to theportion of the taxable year after October 31, and the late-year losses attributable to theportion of the taxable year after December 31, over the sum of the specified gainsattributable to the portion of the taxable year after October 31, and other ordinaryincome attributable to the portion of the taxable year after December 31. For the fiscalyear ended November 30, 2020, there were late year losses deferred of 369,464.
7. NEW ACCOUNTING PRONOUNCEMENT
In August 2018, FASB issued ASU 2018-13, Fair Value Measurement (Topic 820):Disclosure Framework—Changes to the Disclosure Requirements for Fair ValueMeasurement (“ASU 2018-13”). The primary focus of ASU 2018-13 is to improve theeffectiveness of the disclosure requirements for fair value measurements. The changesaffect all companies that are required to include fair value measurement disclosures. Ingeneral, the amendments in ASU 2018-13 are effective for all entities for fiscal yearsand interim periods within those fiscal years, beginning after December 15, 2019. Anentity is permitted to early adopt the removed or modified disclosures upon the issuanceof ASU 2018-13 and may delay adoption of the additional disclosures, which arerequired for public companies only, until their effective date. Management has chosento early adopt the eliminated or modified disclosures. There was no significant impact.
39
YCG Enhanced Fund
NOTES TO FINANCIAL STATEMENTS (continued)November 30, 2020

To the Shareholders of YCG Enhanced Fund andBoard of Trustees of YCG Funds
Opinion on the Financial Statements
We have audited the accompanying statement of assets and liabilities, including the schedulesof investments and options written, of YCG Enhanced Fund (the “Fund”), a series of YCGFunds, as of November 30, 2020, and the related statement of operations for the year thenended, the statements of changes in net assets for each of the two years in the period thenended, including the related notes, and the financial highlights for each of the five years in theperiod then ended (collectively referred to as the “financial statements”). In our opinion, thefinancial statements present fairly, in all material respects, the financial position of the Fund asof November 30, 2020, the results of its operations for the year then ended, the changes in itsnet assets for each of the two years in the period then ended, and the financial highlights foreach of the five years in the period then ended, in conformity with accounting principlesgenerally accepted in the United States of America.
Basis for Opinion
These financial statements are the responsibility of the Fund’s management. Our responsibilityis to express an opinion on the Fund’s financial statements based on our audits. We are apublic accounting firm registered with the Public Company Accounting Oversight Board(United States) (“PCAOB”) and are required to be independent with respect to the Fund inaccordance with the U.S. federal securities laws and the applicable rules and regulations of theSecurities and Exchange Commission and the PCAOB.
We conducted our audits in accordance with the standards of the PCAOB. Those standardsrequire that we plan and perform the audit to obtain reasonable assurance about whether thefinancial statements are free of material misstatement whether due to error or fraud.
Our audits included performing procedures to assess the risks of material misstatement of thefinancial statements, whether due to error or fraud, and performing procedures that respond tothose risks. Such procedures included examining, on a test basis, evidence regarding theamounts and disclosures in the financial statements. Our procedures included confirmation ofsecurities owned as of November 30, 2020, by correspondence with the custodian and broker.Our audits also included evaluating the accounting principles used and significant estimatesmade by management, as well as evaluating the overall presentation of the financialstatements. We believe that our audits provide a reasonable basis for our opinion.
We have served as the Fund’s auditor since 2012.
COHEN & COMPANY, LTD.Chicago, IllinoisJanuary 25, 2021
40
YCG Enhanced Fund
REPORT OF INDEPENDENT REGISTERED PUBLIC ACCOUNTING FIRM

41
YCG Enhanced Fund
1. SHAREHOLDER NOTIFICATION OF FEDERAL TAX STATUS
For the year ended November 30, 2020, 100% of the dividends paid from netinvestment income, including short-term capital gains, for the YCG Enhanced Fundqualify for the dividends received deduction available to corporate shareholders.
For the year ended November 30, 2020, 100% of the dividends paid from netinvestment income, including short-term capital gains, for the YCG Enhanced Fundare designated as qualified dividend income.
2. COMPENSATION OF TRUSTEES
During the fiscal year, each Trustee who is not an “interested person” of the Trust (i.e.an “Independent Trustee”) received $1,000 per meeting attended, as well asreimbursement for expenses incurred in connection with attendance at such meetings.The Fund’s Statement of Additional Information includes additional informationabout the Trustees and is available upon request by calling toll free 1-855-444-9243 orby accessing the Fund’s website at www.ycgfunds.com. (Note for clarification: Theinformation on our website is not incorporated by reference into this report.)
3. PROXY VOTING POLICIES AND PROCEDURES
For a description of the policies and procedures that the Fund uses to determine howto vote proxies relating to portfolio securities, please call 1-855-444-9243 andrequest a Statement of Additional Information. One will be mailed to you free ofcharge. The Statement of Additional Information is also available on the Fund’swebsite at www.ycgfunds.com or on the web site of the Securities and ExchangeCommission at http://www.sec.gov. Information on how the Fund voted proxiesrelating to portfolio securities during the most recent 12-month period ended June 30is available without charge, upon request, by calling 1-855-444-9243 or by accessingthe website of the Securities and Exchange Commission at http://www.sec.gov.
4. DISCLOSURE OF PORTFOLIO HOLDINGS
The Fund files a complete schedule of portfolio holdings with the Securities andExchange Commission for the first and third quarters of each fiscal year as an exhibitto its reports on Form N-PORT. The Fund’s Form N-PORT reports are available onthe website of the Securities and Exchange Commission at http://www.sec.gov or onrequest by calling 1-800-SEC-0330.
ADDITIONAL INFORMATION(Unaudited)

5. BOARD ANNUAL RENEWAL OF INVESTMENT ADVISORYAGREEMENT
On October 22, 2020, the Board of Trustees of YCG Funds (the “Trust”) met to,among other things, approve the continuation of the investment advisory agreementfor the YCG Enhanced Fund (the “Fund”). As part of the process for approving thecontinuation of the investment advisory agreement, the Trustees reviewed theirfiduciary duties and the relevant factors for the Trustees to consider, and the Trusteeswho are not “interested persons” (as defined in the Investment Company Act of1940) of the Fund (the “Independent Trustees”) met in executive session to discussthe approval of the continuation of the investment advisory agreement.
In advance of the meeting, YCG, LLC (the “Adviser”) sent detailed information tothe Trustees to assist them in their evaluation of the investment advisory agreement.This information included, but was not limited to, a memorandum from counsel tothe Fund and the Independent Trustees that summarized the legal standardsapplicable to the Trustees’ consideration of the advisory agreement; comparativeinformation relating to the Fund’s management fees and other expenses of the Fund;information regarding fees paid and other payments; information on the Adviser’sprofitability; information about brokerage commissions; comparative informationrelating to the Fund’s performance; information about sales and redemptions of theFund; information about the Fund’s compliance program; and other information theTrustees believed was useful in evaluating the approval of the investment advisoryagreement. Counsel to the Fund and the Independent Trustees advised the Trusteeson their fiduciary duties under the rules.
All of the factors discussed by the Trustees were considered as a whole, and wereconsidered separately by the Independent Trustees, meeting in executive session. Thefactors were viewed in their totality by the Trustees, with no single factor being theprincipal or determinative factor in the Trustees’ determination of whether to approvethe continuation of the investment advisory agreement. The Trustees recognized thatthe management and fee arrangements for the Fund are the result of years of reviewand discussion between the Independent Trustees and the Adviser, that certainaspects of such arrangements may receive greater scrutiny in some years than inothers and that the Trustees’ conclusions may be based, in part, on their considerationof these same arrangements and information received during the course of the yearand in prior years.
Prior to approving the continuation of the investment advisory agreement, the Trusteesand the Independent Trustees in executive session considered, among other items:
• The nature and quality of the investment advisory services provided by theAdviser.
42
YCG Enhanced Fund
ADDITIONAL INFORMATION (continued)(Unaudited)

• A comparison of the fees and expenses of the Fund to other similar funds.
• A comparison of the fee structures of other accounts managed by the Adviser.
• Whether economies of scale are recognized by the Fund.
• The costs and profitability of the Fund to the Adviser.
• The performance of the Fund.
• The other benefits to the Adviser from serving as investment adviser to theFund (in addition to the advisory fee).
The material considerations and determinations of the Board, including all of theIndependent Trustees, are as follows:
Nature, Extent and Quality of Investment Advisory Services
The Trustees noted that the Adviser supervises the investment portfolio of the Fund,directing the day-to-day management of the Fund’s portfolio, including the purchaseand sale of investment securities. They then discussed with management the natureof the investment process employed by the portfolio managers of the Fund, which isresearch intensive, and discussed staffing at the Adviser. The Trustees concluded thatthe Adviser is well staffed to conduct the research needed to meet the investmentobjectives of the Fund.
In addition to the nature of the Adviser’s investment process, the Trustees consideredthe background and experience of the Adviser’s senior management and expertise of,and the amount of attention given to the Fund by investment personnel of the Adviser.In addition, the Trustees considered the quality of the material service providers to theFund, who provide administrative and distribution services on behalf of the Fund andare overseen by the Adviser, and the overall reputation and capabilities of the Adviser.The Trustees noted that the Adviser actively oversees the service providers to theFund to ensure that the Fund is well served. Based on this review, the Trustees believethat the Adviser provides high quality services to the Fund, as the Adviser’s personnelare focused on servicing the Fund.
In light of the Trustees’ discussions and considerations regarding the Adviser, theTrustees concluded that they were satisfied with the nature, extent and quality of theinvestment advisory services provided to the Fund by the Adviser, and that thenature and extent of the services provided by the Adviser are appropriate to assurethat the Fund’s operations are conducted in compliance with applicable laws, rulesand regulations.
43
YCG Enhanced Fund
ADDITIONAL INFORMATION (continued)(Unaudited)

Comparative Fees and Expenses
The Trustees then discussed with management the variables, in addition to themanagement fees, such as administrative and transaction fees, which impact costs tothe shareholders of the Fund. Management reviewed with the Trustees thecomparison of the Fund’s expense ratios to other similar funds. As part of thediscussion with management, the Trustees ensured that they understood and werecomfortable with the criteria used by the Adviser to determine the mutual funds thatmake up the peer groups identified and discussed below.
In the materials provided to the Trustees, there was a report comparing the Fund totwo peer groups. The first peer group was a comparison versus the MorningstarLarge Cap Blend Category peers, and the second peer group was a comparisonversus custom “stockpicking” and “option” peers. In discussing and evaluating thereport, the Trustees noted the following:
• While the Fund had higher than average advisory and net expenses comparedto the Morningstar Large Cap Blend category peers, the Fund’s return over thelast few years is in the top half of the funds in the category. The Trustees alsonoted that unlike most peers in the category, the Fund utilizes an optionenhancement strategy.
• The Fund’s expense ratio is very favorable compared to option peers, which isimportant because the Trustees believe that the Fund’s option enhancementstrategy is a unique strategy that sets the Fund apart from its competitors. Asnoted above, other funds in the Morningstar Large Cap Blend Categorygenerally do not utilize an option strategy.
• The Fund outperformed peer group funds on a since inception, five-year,three-year, and one-year basis.
• The Fund performed extremely well against many of the stockpicking andlarge cap blend category peer group funds.
• The Fund is still relatively small in assets under management, and the Adviseris subsidizing the expenses of the Fund to remain competitive with other funds.
After reviewing and discussing the comparison of the Fund’s expense ratios to othersimilar funds, as noted above, the Trustee’s concluded that the expense ratio of theFund is within a reasonable range of comparable mutual funds, particularly fundsthat have an option strategy, and that the Fund’s fees are reasonable.
44
YCG Enhanced Fund
ADDITIONAL INFORMATION (continued)(Unaudited)

Comparison of Fee Structures of Other Accounts
The Trustees then inquired of management regarding the distinction between theservices performed by the Adviser for separately managed accounts and thoseperformed by the Adviser for the Fund. The Adviser noted that the management ofthe Fund involves comprehensive and substantive duties beyond those involved withseparate accounts. Specifically, the Adviser noted the following:
• The Adviser provides tailored investment advisory services to the Fund in orderto accommodate the cash flow volatility presented by the purchases andredemptions of shareholders, as shareholder are able to redeem on a daily basis.
• With regard to the Fund, the Adviser attempts to serve the needs of hundredsof accounts, ranging from direct accounts holding a few thousand dollars tothe large omnibus accounts of intermediaries.
• The Adviser maintains a robust shareholder communication effort for theFund to reach shareholders through direct contact, through intermediaries, orvia the financial press, and has contributed significant financial resources tomarketing efforts for the Fund.
• The Adviser focuses on marketing the Fund and has found that the mosteffective way is through one-on-one meetings with RIA’s, which requiresignificant amounts of time and resources to attract investors.
• The Adviser coordinates with the Fund’s Chief Compliance Officer and otherservice providers to ensure compliance with regulatory regimens imposed byFederal law and the Internal Revenue Code or the Fund (there are not similarrequirements that are applicable to separate accounts).
The Trustees concluded that the services performed by the Adviser for the Fundrequire a higher level of service and oversight than those performed for separateaccounts. On the other hand, they noted that the Adviser has found that the clientservicing of separately managed accounts can be very resource intensive. As themanagement of the Fund and the separately managed accounts is distinct, theTrustees concluded that the differential in advisory fees between the Fund and theseparate accounts is reasonable and concluded that the fee rate charged to the Fund incomparison to those charged to the Adviser’s other clients is reasonable.
Performance
The Trustees reviewed the Adviser’s quality of investment management, managementhistory and ability to successfully market the Fund. The Trustees noted that at eachquarterly meeting, the Trustees review reports regarding the investment performanceof the Fund. Based on the information provided at this meeting and the information
45
YCG Enhanced Fund
ADDITIONAL INFORMATION (continued)(Unaudited)

and quarterly discussions regarding the Fund’s investment performance, the Trusteesbelieve that the Adviser manages the Fund in a manner that is materially consistentwith its stated investment objective and style.
In assessing the performance of the Fund, which is positive, the Trustees noted thefollowing:
• The Fund’s return over the last three years is in the top half of the funds in theMorningstar Large Cap Blend category.
• The Fund outperformed peer group funds on a since inception, five-year,three-year, and one-year basis.
• The Fund performed extremely well against many of the stockpicking andlarge cap blend category peer group funds.
The Trustees concluded that the performance of the Fund, particularly adjusting forrisk, has been satisfactory on a relative basis and more than satisfactory on anabsolute basis. They continue to believe that the Adviser’s discipline should lead tomore favorable results in the long-term and concluded that renewal of the existingadvisory agreement was in the best interest of the Fund’s shareholders.
Costs and Profitability
The Trustees considered the cost of services provided and the profits realized by theAdviser. They also considered the Fund’s overall expense ratios compared to peergroup funds. The Trustees concluded that given the size of the Fund and the nichestrategy of the Fund, that the Fund’s fee structure is appropriate and reasonable.
The Trustees discussed in detail the profitability this year of the Adviser as it relatesto the Fund, and they discussed the impact of the intermediary service fees on theprofitability. The Trustees also considered the resources and revenues that theAdviser has put into managing and distributing the Fund and concluded that the levelof profitability realized by the Adviser from its provision of services to the Fund isreasonable, and that the overall expense ratios and investment advisory fees were fairand within a reasonable range of industry averages.
Economies of Scale
The Trustees discussed with management whether economies of scale are recognizedby the Fund. They noted that as Fund assets grow, certain fixed costs are spread overthe larger asset base, which may lead to some economies of scale. On the other hand,the Trustees noted that many of the Fund’s expenses are subject to diseconomies ofscale. For example, the intermediary service fees increase as the Fund’s assets grow.
46
YCG Enhanced Fund
ADDITIONAL INFORMATION (continued)(Unaudited)
Given the size of the Fund, the Trustees determined that the Fund has not realizedeconomies of scale. They noted that the expenses for the Fund are currently cappedand any excess is paid by the Adviser, which benefits shareholders. The Trusteesconcluded that the current fees were appropriate at foreseeable asset levels.
Fall-Out Benefits
The Trustees then considered other benefits to the Adviser from serving as Adviser tothe Fund (in addition to the advisory fee). The Trustees noted that the Adviser doesnot derive ancillary benefits from its association with the Fund in the form ofproprietary and third-party research products and services, as the Adviser does notreceive any research or other services from the broker-dealers that the Fund tradeswith. They also briefly discussed soft dollars and the fact that the Fund does notutilize them.
It was noted that managing the Fund has provided more visibility for the Adviser inthe financial media and industry in general, as the Fund has been highlighted inpublications, including national publications. However, the primary focus of thesearticles has been the Fund.
Based on the Trustees’ discussion and analysis, the Trustees concluded that the otherbenefits realized by the Adviser from its relationship with the Fund were reasonable.
Conclusion
After reviewing the materials provided at the meeting, management’s presentation, aswell as other information regularly provided at the Board’s quarterly meetingsthroughout the year regarding the quality of services provided by the Adviser, theperformance of the Fund, expense information, regulatory compliance issues, tradinginformation and related matters and other factors deemed relevant by the Board, theTrustees, including all of the Independent Trustees, approved the continuation of theinvestment advisory agreement.
47
YCG Enhanced Fund
ADDITIONAL INFORMATION (continued)(Unaudited)

The business of the Fund is managed under the direction of the Board. The Boardformulates the general policies of the Fund and meets periodically to review theFund’s performance, monitor investment activities and practices, and discuss othermatters affecting the Fund. The Trustees are fiduciaries for the Fund’s shareholdersand are governed by the laws of the State of Delaware in this regard. The names andaddresses of the Trustees and Officers of the Trust are listed below along with adescription of their principal occupations over at least the last five years. Trusteeswho are “interested persons”, as defined by the 1940 Act, are indicated by asterisk.The Fund’s Statement of Additional Information includes additional informationabout the Trustees and is available, without charge, upon request by (1) calling tollfree 1-855-444-9243; (2) on the Fund’s website located at http://www.ycgfunds.com;or (3) on the SEC’s website http://www.sec.gov.
Term of Office Number of and Portfolios Principal Other
Position(s) Length in Fund Occupation(s) DirectorshipsName, address Held with of Time Complex During Past Held by and age the Fund Served Overseen Five Years TrusteeBrian Yacktman* Trustee Indefinite, 1 Manager, Founding None.3207 Ranch Road Trustee Partner and Chief620 South, Suite 200 since 2012 Investment Officer,Austin, TX 78738 President One year YCG, LLC,Age: 41 term, investment adviser
President to the Fund,since 2012 since 2007.
William D. Kruger* Chairman Indefinite, 1 Manager, Partner None.3207 Ranch Road and Trustee and CEO, YCG,620 South, Suite 200 Trustee since 2012 LLC, investmentAustin, TX 78738 Vice One year adviser to the Fund,Age: 41 President term, Vice since 2008.
and Presidentsince 2012
Treasurer One yearterm, Treasurer since 2012
48
YCG Enhanced Fund
TRUSTEES AND OFFICERS(Unaudited)

Term of Office Number of and Portfolios Principal Other
Position(s) Length in Fund Occupation(s) DirectorshipsName, address Held with of Time Complex During Past Held by and age the Fund Served Overseen Five Years Trustee
Independent Trustees:
Travis E. Oliphant Trustee Indefinite, 1 Scientific and None.3207 Ranch Road Trustee Technical Software620 South, Suite 200 since 2012 Manager andAustin, TX 78738 Executive.Age: 49 Founder and CEO
of Anaconda(Continuum Analytics), January 2012 – 2017. Founder and CEO of Quansight, 2018 – Present.
Rory M. McDonald Trustee Indefinite, 1 Assistant Professor None.3207 Ranch Road Trustee of Business620 South, Suite 200 since 2012 Administration inAustin, TX 78738 the TechnologyAge: 41 and Operations
Management Unit at Harvard Business School, 2013 – Present.
Cyril James Speirs Trustee Indefinite, 1 Retired, Previously, None.3207 Ranch Road Trustee Global Vice President620 South, Suite 200 since 2017 Procurement for WholeAustin, TX 78738 Foods Market, Inc.,Age: 65 2005 – 2016.
49
YCG Enhanced Fund
TRUSTEES AND OFFICERS (continued)(Unaudited)

Term of Office Number of and Portfolios Principal Other
Position(s) Length in Fund Occupation(s) DirectorshipsName, address Held with of Time Complex During Past Held by and age the Fund Served Overseen Five Years Trustee
Officers who are not Trustees:
Elliott Savage Vice One year N/A Manager, None.3207 Ranch Road President term, Vice Partner and620 South, Suite 200 President Portfolio manager,Austin, TX 78738 since YCG, LLC,Age: 40 December investment adviser
2012 to the Fund, Secretary One year since 2012.
term, SecretarysinceFebruary2016
Assistant One year Treasurer term,
Assistant Treasurer since December 2012
Lelia Long Chief One year N/A Chief Compliance None.3207 Ranch Road Compliance term, Chief Officer, YCG, LLC 620 South, Suite 200 Officer Compliance 2016 – Present, Austin, TX 78738 Officer InvestmentAge: 58 since Management &
March 2016 ComplianceConsultant, VigilantCompliance LLC,2009 – 2020.Treasurer, New Ireland Fund, Inc., 2002 – 2020.
* Brian Yacktman and William Kruger are considered to be “interested persons” of the Trust, a term thatis defined in the 1940 Act. Mr. Yacktman and Mr. Kruger are interested persons because: (1) each is anofficer of the Trust; and (2) each is the owner of the investment adviser to the Fund.
Each trustee holds office for an indefinite term and until the earlier of: the Trust’s nextmeeting of shareholders and the election and qualification of his successor; or until thedate a trustee dies, resigns or is removed in accordance with the Trust’s Declaration ofTrust and By-laws. Each officer holds office at the pleasure of the Board and serves fora period of one year, or until his successor is duly elected and qualified.
50
YCG Enhanced Fund
TRUSTEES AND OFFICERS (continued)(Unaudited)

51
Privacy Notice
FACTS WHAT DOES YCG FUNDS DO WITH YOUR PERSONALINFORMATION?
WHY? Financial companies choose how they share your personal information.Federal law gives consumers the right to limit some, but not allinformation sharing. Federal law also requires us to tell you how wecollect, share, and protect your personal information. Please read thisNotice carefully to understand what we do.
WHAT? The types of information we collect and share depend on the product orservice you have with us. This information can include:
• Social Security Number• Assets• Retirement Assets• Transaction History• Checking Account History• Purchase History• Account Balances• Account Transactions• Wire Transfer Instructions
When you are no longer our customer, we continue to share yourinformation as described in this Notice.
HOW? All financial companies need to share your personal information to runtheir everyday business. In the section below, we list the reasons financialcompanies can share their customers’ personal information; the reasonsYCG Funds chooses to share; and whether you can limit this sharing.
Does YCG Funds Can you limitReasons we can share your personal information. Trust share? this sharing?
For our everyday business purposes—Such as to process your transactions, maintain your account(s), respond to court orders and Yes Nolegal investigations, or report to credit bureaus.
For our marketing purposes—to offer our products and services to you. No We don’t share
For joint marketing with other financial companies No We don’t share
For our affiliates’ everyday business purposes—information about your transactions and experiences. Yes No
For our affiliates’ everyday business purposes—information about your creditworthiness No We don’t share
For non-affiliates to market to you No We don’t share
Questions? Call 855-444-YCGF (9243)

52
Privacy Notice (continued)
Who we areWho is providing YCG Fundsthis Notice? YCG, LLC (investment adviser to the Trust)
US Bancorp Fund Services, LLC (administrator to the Trust)
What we do
How does To protect your personal information from unauthorized YCG Funds access and use, we use security measures that comply protect with federal law. These measures include computer safeguards your personal and secured files and buildings.information? Our service providers are held accountable for adhering to strict
policies and procedures to prevent any misuse or your nonpublicpersonal information.
How does We collect your personal information, for example, when youYCG Funds • Open an accountcollect your • Provide account informationpersonal • Give us your contact informationinformation? • Make deposits or withdrawals from your account
• Make a wire transfer• Tell us where to send the money• Tell us who receives the money• Show your government-issued ID• Show your drivers’ licenseWe also collect your personal information from other companies.
Why can’t I Federal law gives you the right to limit only:limit all sharing? • Sharing for affiliates’ everyday business purposes—information
about your creditworthiness.• Affiliates from using your information to market to you.• Sharing for non-affiliates to market to you.State laws and individual companies may give you additional rights tolimit sharing.
Definitions
Affiliates Companies related by common ownership or control. They can befinancial and non-financial companies.
YCG, LLC, is an affiliate of YCG Funds
Non-affiliates Companies not related by common ownership or control. They can befinancial and non-financial companies.
• YCG Funds does not share with non-affiliates so they can market toyou.
Joint marketing A formal agreement between non-affiliated financial companies thattogether market financial products to you.
• YCG Funds does not jointly market.

(This Page Intentionally Left Blank.)


For Fund information and shareholder services, call 1-855-444-9243web site: www.ycgfunds.com
YCG Fundsc/o U.S. Bancorp Fund Services, LLCP.O. Box 701Milwaukee, WI 53201-0701
Investment AdviserYCG, LLC3207 Ranch Road 620 South, Suite 200Austin, TX 78738
Legal CounselFoley & Lardner LLP777 East Wisconsin AvenueMilwaukee, WI 53202
Independent Registered Public Accounting FirmCohen & Company, Ltd.151 North Franklin Street, Suite 575Chicago, IL 60606
Transfer Agent, Fund Accountant, and Fund AdministratorU.S. Bancorp Fund Services, LLC 615 East Michigan Street Milwaukee, WI 53202
CustodianU.S. Bank, N.A.1555 North RiverCenter Drive, Suite 302Milwaukee, WI 53212
DistributorQuasar Distributors, LLC111 East Kilbourn Avenue Suite 2200Milwaukee, WI 53202
This report is submitted for the general information of shareholders of the YCGEnhanced Fund. It is not authorized for distribution to prospective investors unlessaccompanied or preceded by an effective Prospectus for the Fund, which containsmore information concerning the Fund’s investment policies, as well as fees andexpenses and other pertinent information. Read the Prospectus carefully.


