Embed Size (px)
Citation preview

THIS REPORT CONTAINS ASSESSMENTS OF COMMODITY AND TRADE ISSUES MADE BY
USDA STAFF AND NOT NECESSARILY STATEMENTS OF OFFICIAL U.S. GOVERNMENT
POLICY
Date:
GAIN Report Number:
Approved By:
Prepared By:
Report Highlights:
In 2014, Brazil imported US$ 2.8 billion worth in intermediate products and US$4.6 billion in
consumer-oriented products. In 2015, although Brazil is suffering an economic crisis, imports decreased
much less than expected, which shows opportunities for U.S. companies to gain market share within
both segments. This report provides a general overview of procedures and requirements for companies
exporting U.S. agricultural products to Brazil. Most administrative requirements fall under the
responsibility of the Brazilian importer, nevertheless exporters can expedite the process by providing
Fabiana Fonseca,
Agricultural Marketing
Specialist
Chanda Berk, Agricultural
Consul
Annual Report
Exporter Guide
Brazil
BR15014
1/4/2016
Required Report - public distribution
accurate information and proper documentation crucial to clear customs with minimal administrative
delays.
I. Market Overview
In 2014, Brazil’s GDP reached US$2.2 trillion, which positioned the country as the 7th
largest economy
in the world and the largest and most influential economy in Latin America. However, in the same year,
Brazil fell into a recession. Corruption scandals, rising inflation, and government inability to control the
budget deficit, caused consumer and investor confidence to drop and has set the country on a downward
spiral. From 2003 to 2013 Brazil made substantial progress in its social agenda: increased minimum
wage, implemented redistribution programs and facilitated access to credit for a larger portion of the
population. All together, these measures helped boost domestic market consumption, but proved to be
unsustainable. For 2015, economists are forecasting the Brazilian crisis to reach its peak - GDP is
estimated to shrink by four percent; inflation is expected to end the year in double digits, and the
benchmark interest rate is estimated to continue its upward cycle, severely affecting household
expenditures. The forecast for the economy in 2016 is a negative GDP growth of about three percent,
but better results for inflation and interest rates. The trend will shift in 2017, when economists predict
recovery will began.
Despite the delicate political and economic situation, Brazil is still a major player and an important
market for agricultural products. Food processors, wholesalers, retailers, food service operators and
food importers are all part of a well-developed food industry, that contributes to making domestic
scenario competitive and dynamic. In 2014, imports of intermediate products by Brazil reached US$2.8
billion, a five percent increase compared to the previous year, while purchases of consumer-oriented
products amounted to US$ 4.6 billion, a nearly two percent increase compared to 2013. In the same
period, the United States exported to Brazil US$233.7 million worth in intermediate products and
US$377 million in consumer oriented products. Sales of intermediate and consumer oriented products
from the United States to Brazil declined almost six percent for the first category and increased 14
percent for the second. For the period of January to October, 2015, overall exports of intermediate
products to Brazil declined 15 percent, but were valued at US$2 billion, while exports of consumer
oriented products suffered a 10 percent decline, but were valued at US$3.4 billion. During this same
period, U.S. exports of intermediate products decreased six percent, reaching US$185 million, while
sales of U.S. high-valued products shrank four percent, amounting to US$299 million. These figures are
not as negative as they may seem, considering the Brazilian real depreciated approximately 40 percent
against the U.S. dollar since the end of 2014.
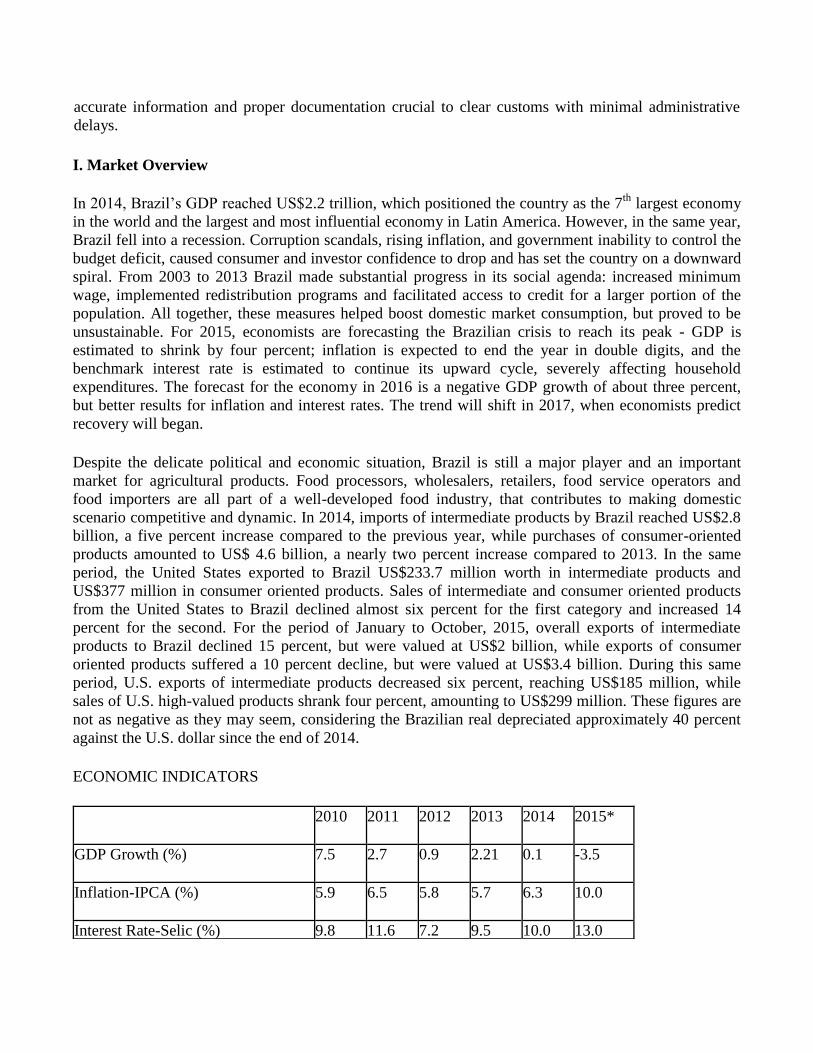
ECONOMIC INDICATORS
2010
2011 2012 2013 2014 2015*
GDP Growth (%)
7.5 2.7 0.9 2.21 0.1 -3.5
Inflation-IPCA (%)
5.9 6.5 5.8 5.7 6.3 10.0
Interest Rate-Selic (%) 9.8 11.6 7.2 9.5 10.0 13.0
Average Exchange Rate (R$-US$)
1.70 1.67 1.98 2.28 2.36 3.29
Source: Brazilian Institute of Geography and Statistics (IBGE) and the Brazilian Central Bank
(1) IPCA is calculated by IBGE. It is the Government of Brazil’s target measure of inflation and
measures price variation for products and services consumed by families with earnings from 1 to 40
minimum wage salaries in metropolitan areas of Porto Alegre, Belo Horizonte, Recife, Sao Paulo,
Belem, Fortaleza, Salvador, Curitiba, Distrito Federal and Goiania.
(2) SELIC refers to the Brazilian Central Bank interest rate benchmark.
(*) Forecast
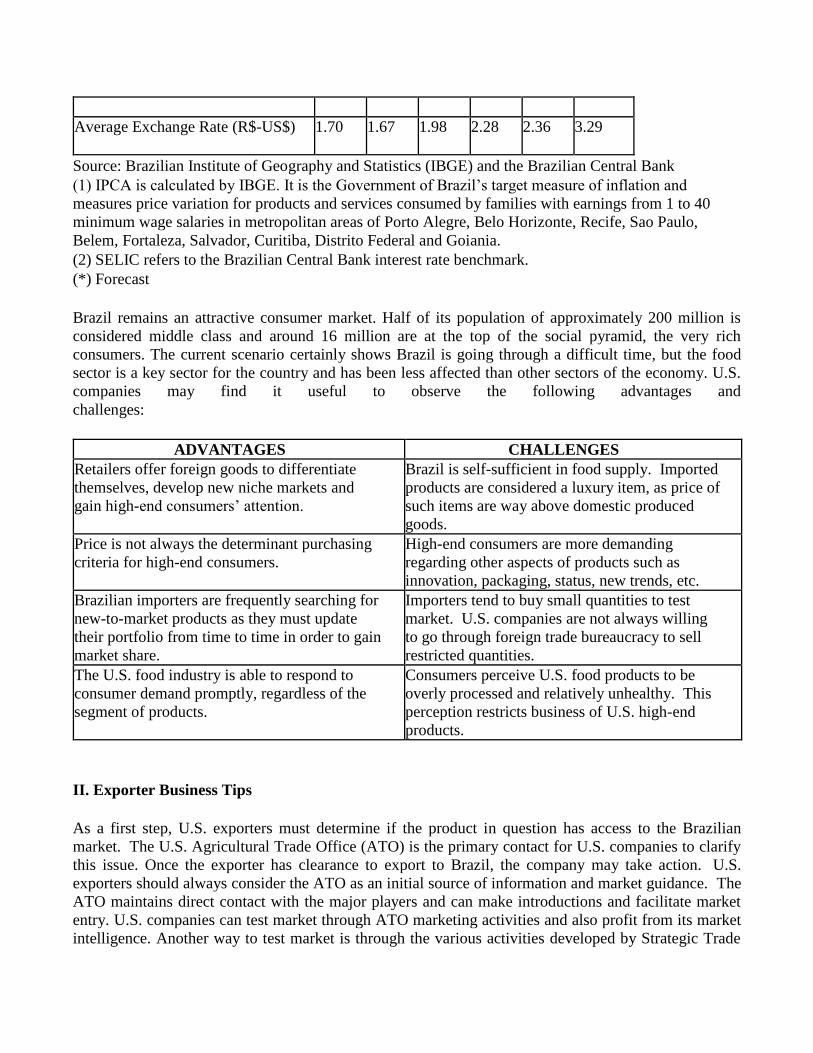
Brazil remains an attractive consumer market. Half of its population of approximately 200 million is
considered middle class and around 16 million are at the top of the social pyramid, the very rich
consumers. The current scenario certainly shows Brazil is going through a difficult time, but the food
sector is a key sector for the country and has been less affected than other sectors of the economy. U.S.
companies may find it useful to observe the following advantages and
challenges:
ADVANTAGES CHALLENGES
Retailers offer foreign goods to differentiate
themselves, develop new niche markets and
gain high-end consumers’ attention.
Brazil is self-sufficient in food supply. Imported
products are considered a luxury item, as price of
such items are way above domestic produced
goods.
Price is not always the determinant purchasing
criteria for high-end consumers.
High-end consumers are more demanding
regarding other aspects of products such as
innovation, packaging, status, new trends, etc.
Brazilian importers are frequently searching for
new-to-market products as they must update
their portfolio from time to time in order to gain
market share.
Importers tend to buy small quantities to test
market. U.S. companies are not always willing
to go through foreign trade bureaucracy to sell
restricted quantities.
The U.S. food industry is able to respond to
consumer demand promptly, regardless of the
segment of products.
Consumers perceive U.S. food products to be
overly processed and relatively unhealthy. This
perception restricts business of U.S. high-end
products.
II. Exporter Business Tips
As a first step, U.S. exporters must determine if the product in question has access to the Brazilian
market. The U.S. Agricultural Trade Office (ATO) is the primary contact for U.S. companies to clarify
this issue. Once the exporter has clearance to export to Brazil, the company may take action. U.S.
exporters should always consider the ATO as an initial source of information and market guidance. The
ATO maintains direct contact with the major players and can make introductions and facilitate market
entry. U.S. companies can test market through ATO marketing activities and also profit from its market
intelligence. Another way to test market is through the various activities developed by Strategic Trade
Regional Groups (SRTGs) and Trade Associations. Finally, ATO also recommends U.S. exporters
develop a direct dialogue with potential buyers as they are best equipped to discuss key topics such as
product feasibility, market size, prices, distribution, and marketing tools.
A common error U.S. companies make when approaching the Brazilian market is assuming products
that fit well in other Latin American countries will fit well in Brazil. In general terms, a product
imported from the United States or Europe reaches 4-5 times the FOB price at retail. U.S. exporters
should have in mind that when an imported product reaches supermarket shelves it will fit in the
premium price category and for this reason premium attributes must be perceived by consumers. An
imported product is generally considered a luxury item.
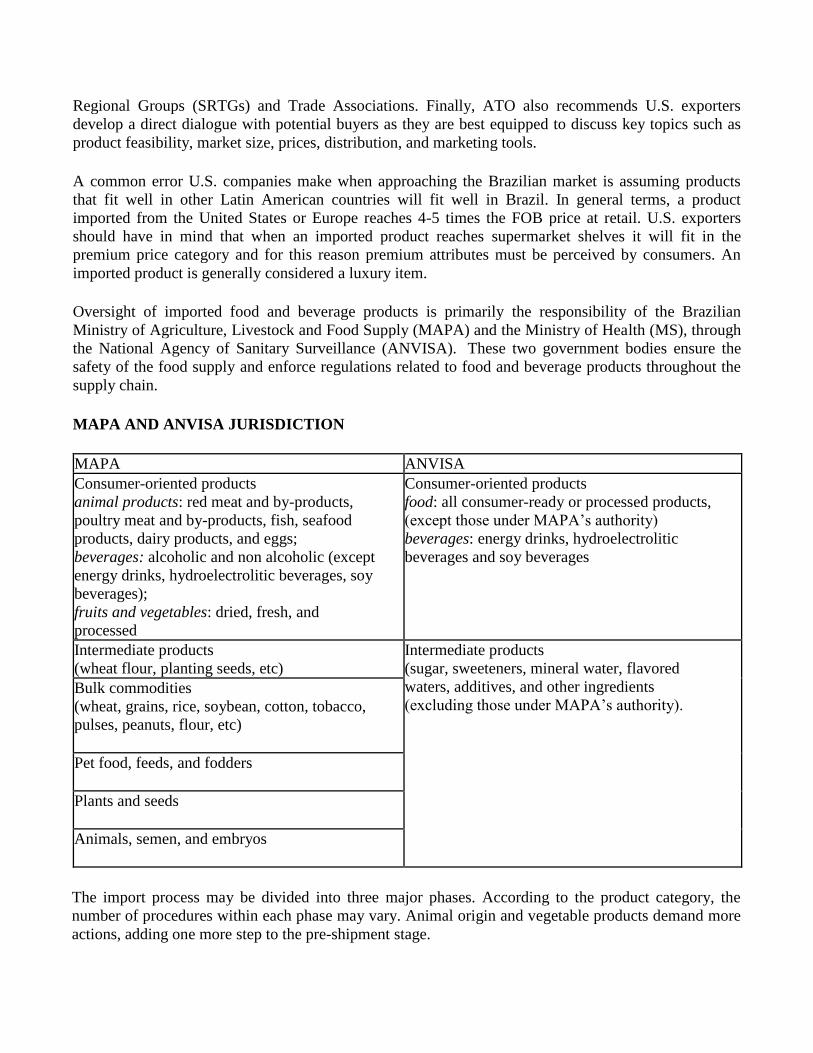
Oversight of imported food and beverage products is primarily the responsibility of the Brazilian
Ministry of Agriculture, Livestock and Food Supply (MAPA) and the Ministry of Health (MS), through
the National Agency of Sanitary Surveillance (ANVISA). These two government bodies ensure the
safety of the food supply and enforce regulations related to food and beverage products throughout the
supply chain.
MAPA AND ANVISA JURISDICTION
MAPA ANVISA
Consumer-oriented products
animal products: red meat and by-products,
poultry meat and by-products, fish, seafood
products, dairy products, and eggs;
beverages: alcoholic and non alcoholic (except
energy drinks, hydroelectrolitic beverages, soy
beverages);
fruits and vegetables: dried, fresh, and
processed
Consumer-oriented products
food: all consumer-ready or processed products,
(except those under MAPA’s authority)
beverages: energy drinks, hydroelectrolitic
beverages and soy beverages
Intermediate products
(wheat flour, planting seeds, etc)
Intermediate products
(sugar, sweeteners, mineral water, flavored
waters, additives, and other ingredients
(excluding those under MAPA’s authority). Bulk commodities
(wheat, grains, rice, soybean, cotton, tobacco,
pulses, peanuts, flour, etc)
Pet food, feeds, and fodders
Plants and seeds
Animals, semen, and embryos
The import process may be divided into three major phases. According to the product category, the
number of procedures within each phase may vary. Animal origin and vegetable products demand more
actions, adding one more step to the pre-shipment stage.
Stricter control is set for animal origin goods, which means that all manufacturing plants must be
approved and registered by MAPA prior to exporting their products to Brazil. To comply with the
Brazilian regulation, U.S. companies may contact the USDA/FAS/Office of Agricultural Affairs (OAA)
in Brasilia, who is responsible for initiating the registration process with MAPA.
MAPA also establishes phytosanitary measures to allow imports of vegetable origin products. Products
of vegetable origin are classified according to risk level. In order to approve imports, MAPA must
evaluate the risk of the product in question. According to the risk presented, a Pest and Risk
Assessment (PRA) may be requested. Once completed, the product must be included in the List of
Products Authorized to Import (PVIA), indicating no risk or a risk is controlled by phytosanitary
measures. Only products included in the PVIA list are authorized to enter the country. MAPA maintains
a list of products approved to be shipped to Brazil here:
http://www.agricultura.gov.br/vegetal/importacao/requisitos-fitossanitarios/consulta-de-produtos-de-
importacao-autorizada
For beverages under MAPA responsibility, MAPA requires the exporting country to provide a list of
entities eligible to issue Certificate of Analysis and Certificate of Origin. Once the list is sent to MAPA
by an official source, the name of the institution will be placed here:
http://sistemasweb.agricultura.gov.br/siscole/consultaPublicaCadastro!consultarCadastro.action. At
clearance, MAPA will only accept documents from entities included in this list. The Alcohol and
Tobacco Tax and Trade Bureau (TTB) has the authority to certify labs and institutions to issue the
certificates for alcoholic beverages. Should a lab approved by TTB not be included on MAPA’s list,
TTB can request an update. The current TTB list of approved labs for wine, distilled spirits, and beer
can be found here: http://www.ttb.gov/ssd/chemist_certification.shtml. For guidance for non-alcoholic
beverages, the exporter may contact ATO São Paulo.
To fulfill local requirements the importer must work together with the exporter, particularly in the initial
phase, when the documents for shipment are prepared. On the clearance phase, upon product arrival
most companies contract a customs agent who will be responsible for clearance formalities. Although
the scheme below presents a general structure for imports of food and beverage in Brazil,
importers/exporters must note other Ministries, aside from MAPA and ANVISA, share jurisdiction for
ensuring the safety of the Brazilian food supply and for regulation of imports of agricultural
commodities and foods. The most updated set of rules each administrative agency releases must be
observed prior to shipment as it directly impacts the access for foreign goods into Brazil.
Import Procedures Pre-Shipment
1. Ingredients Evaluation
Brazilian legislation provides “positive” lists of approved ingredients. This means that only products
(including additives, colorings, preservatives, etc) that are specifically authorized by Brazilian
regulations are allowed to enter the market. Therefore, the importer must ensure the Brazilian
Government (GoB) permits the entry of the foreign product. All ingredients contained in food or
beverage items should meet GoB specifications and tolerance levels. To comply, the Identity and
Quality Standard (PIQ) established by MAPA and ANVISA must be followed.
Under ANVISA, food products containing new ingredients and foods containing ingredients that are
already consumed but with tolerance levels above the Brazilian diet patterns are considered “new
foods”. Such products must be analyzed and approved by ANVISA prior to importation.
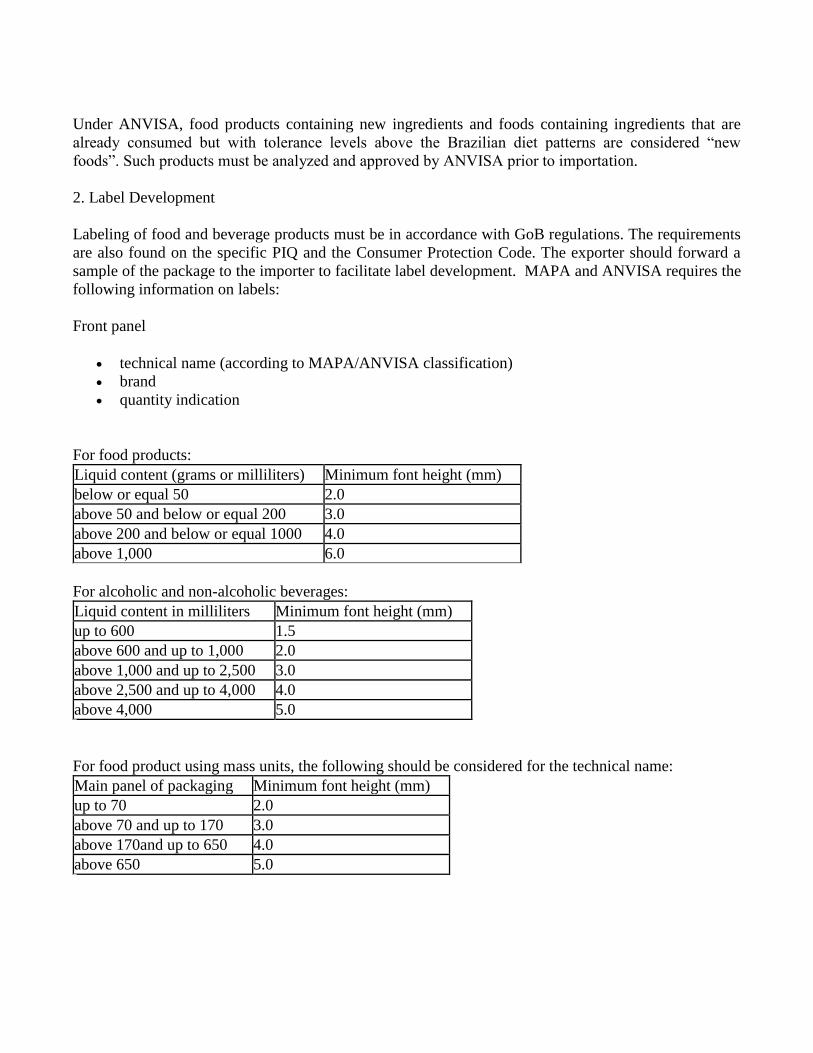
2. Label Development
Labeling of food and beverage products must be in accordance with GoB regulations. The requirements
are also found on the specific PIQ and the Consumer Protection Code. The exporter should forward a
sample of the package to the importer to facilitate label development. MAPA and ANVISA requires the
following information on labels:
Front panel
technical name (according to MAPA/ANVISA classification)
brand
quantity indication
For food products:
Liquid content (grams or milliliters) Minimum font height (mm)
below or equal 50 2.0
above 50 and below or equal 200 3.0
above 200 and below or equal 1000 4.0
above 1,000 6.0
For alcoholic and non-alcoholic beverages:
Liquid content in milliliters Minimum font height (mm)
up to 600 1.5
above 600 and up to 1,000 2.0
above 1,000 and up to 2,500 3.0
above 2,500 and up to 4,000 4.0
above 4,000 5.0
For food product using mass units, the following should be considered for the technical name:
Main panel of packaging Minimum font height (mm)
up to 70 2.0
above 70 and up to 170 3.0
above 170and up to 650 4.0
above 650 5.0
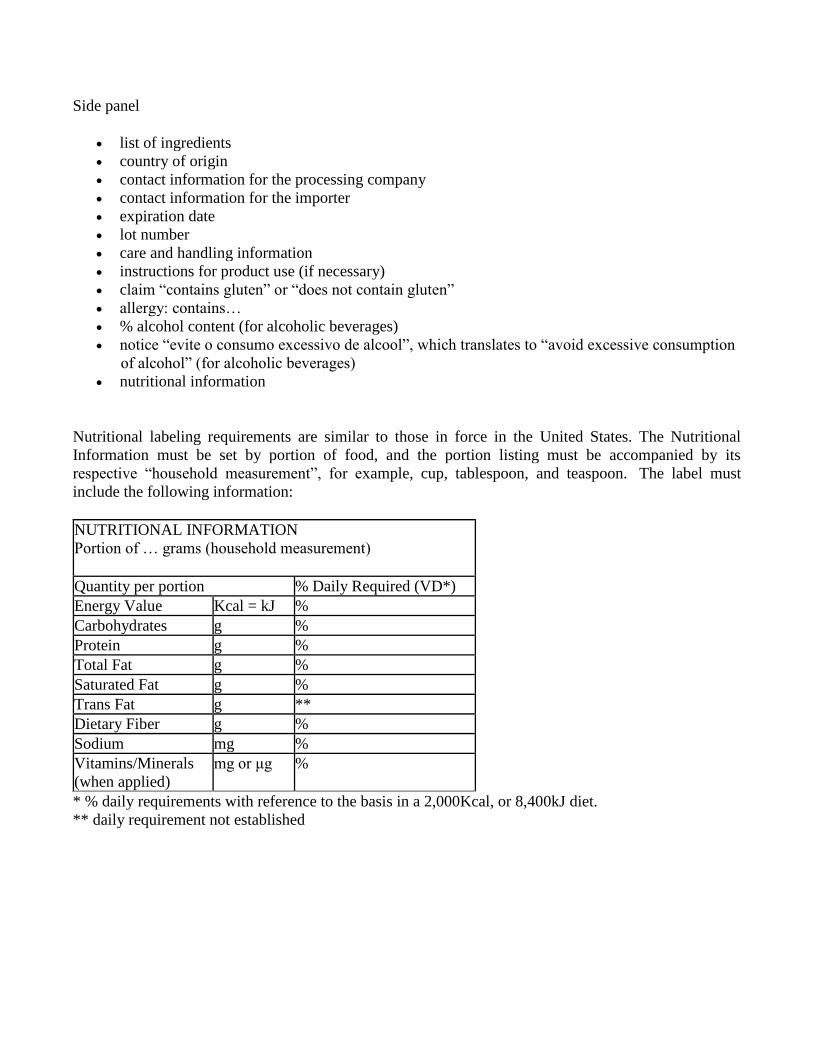
Side panel
list of ingredients
country of origin
contact information for the processing company
contact information for the importer
expiration date
lot number
care and handling information
instructions for product use (if necessary)
claim “contains gluten” or “does not contain gluten”
allergy: contains…
% alcohol content (for alcoholic beverages)
notice “evite o consumo excessivo de alcool”, which translates to “avoid excessive consumption
of alcohol” (for alcoholic beverages)
nutritional information
Nutritional labeling requirements are similar to those in force in the United States. The Nutritional
Information must be set by portion of food, and the portion listing must be accompanied by its
respective “household measurement”, for example, cup, tablespoon, and teaspoon. The label must
include the following information:
NUTRITIONAL INFORMATION
Portion of … grams (household measurement)
Quantity per portion % Daily Required (VD*)
Energy Value Kcal = kJ %
Carbohydrates g %
Protein g %
Total Fat g %
Saturated Fat g %
Trans Fat g **
Dietary Fiber g %
Sodium mg %
Vitamins/Minerals
(when applied)
mg or μg %
* % daily requirements with reference to the basis in a 2,000Kcal, or 8,400kJ diet.
** daily requirement not established
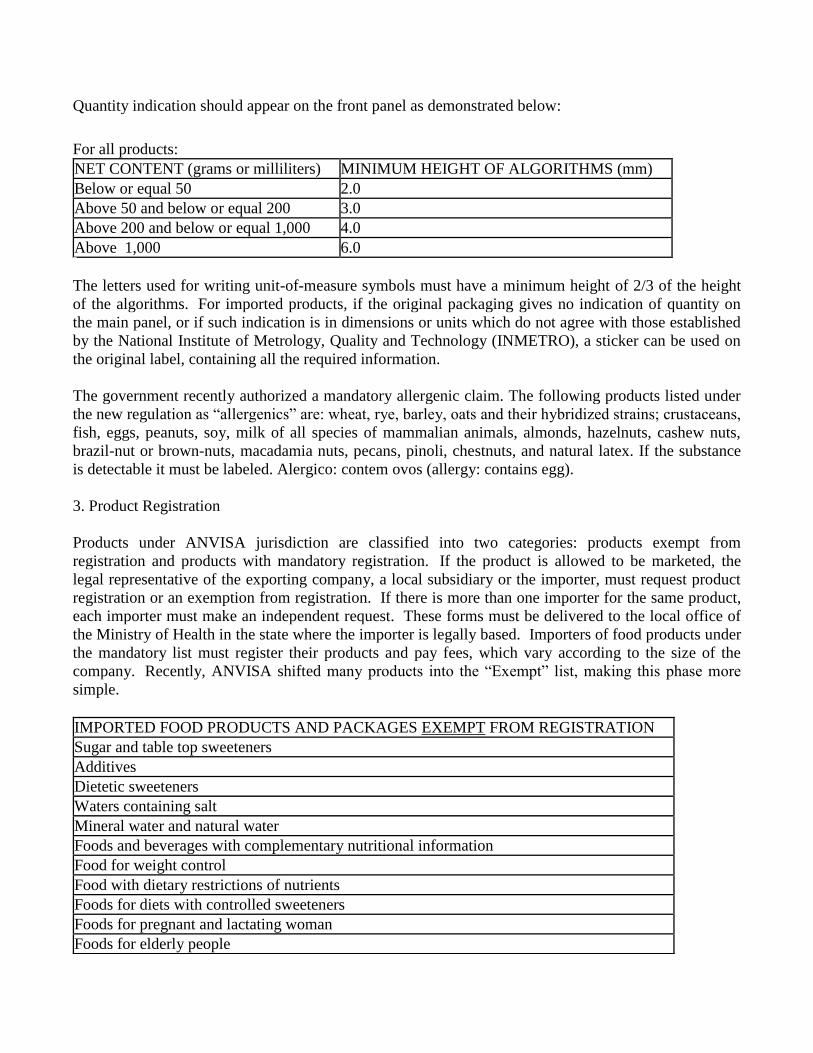
Quantity indication should appear on the front panel as demonstrated below:
For all products:
NET CONTENT (grams or milliliters) MINIMUM HEIGHT OF ALGORITHMS (mm)
Below or equal 50 2.0
Above 50 and below or equal 200 3.0
Above 200 and below or equal 1,000 4.0
Above 1,000 6.0
The letters used for writing unit-of-measure symbols must have a minimum height of 2/3 of the height
of the algorithms. For imported products, if the original packaging gives no indication of quantity on
the main panel, or if such indication is in dimensions or units which do not agree with those established
by the National Institute of Metrology, Quality and Technology (INMETRO), a sticker can be used on
the original label, containing all the required information.
The government recently authorized a mandatory allergenic claim. The following products listed under
the new regulation as “allergenics” are: wheat, rye, barley, oats and their hybridized strains; crustaceans,
fish, eggs, peanuts, soy, milk of all species of mammalian animals, almonds, hazelnuts, cashew nuts,
brazil-nut or brown-nuts, macadamia nuts, pecans, pinoli, chestnuts, and natural latex. If the substance
is detectable it must be labeled. Alergico: contem ovos (allergy: contains egg).
3. Product Registration
Products under ANVISA jurisdiction are classified into two categories: products exempt from
registration and products with mandatory registration. If the product is allowed to be marketed, the
legal representative of the exporting company, a local subsidiary or the importer, must request product
registration or an exemption from registration. If there is more than one importer for the same product,
each importer must make an independent request. These forms must be delivered to the local office of
the Ministry of Health in the state where the importer is legally based. Importers of food products under
the mandatory list must register their products and pay fees, which vary according to the size of the
company. Recently, ANVISA shifted many products into the “Exempt” list, making this phase more
simple.
IMPORTED FOOD PRODUCTS AND PACKAGES EXEMPT FROM REGISTRATION
Sugar and table top sweeteners
Additives
Dietetic sweeteners
Waters containing salt
Mineral water and natural water
Foods and beverages with complementary nutritional information
Food for weight control
Food with dietary restrictions of nutrients
Foods for diets with controlled sweeteners
Foods for pregnant and lactating woman
Foods for elderly people
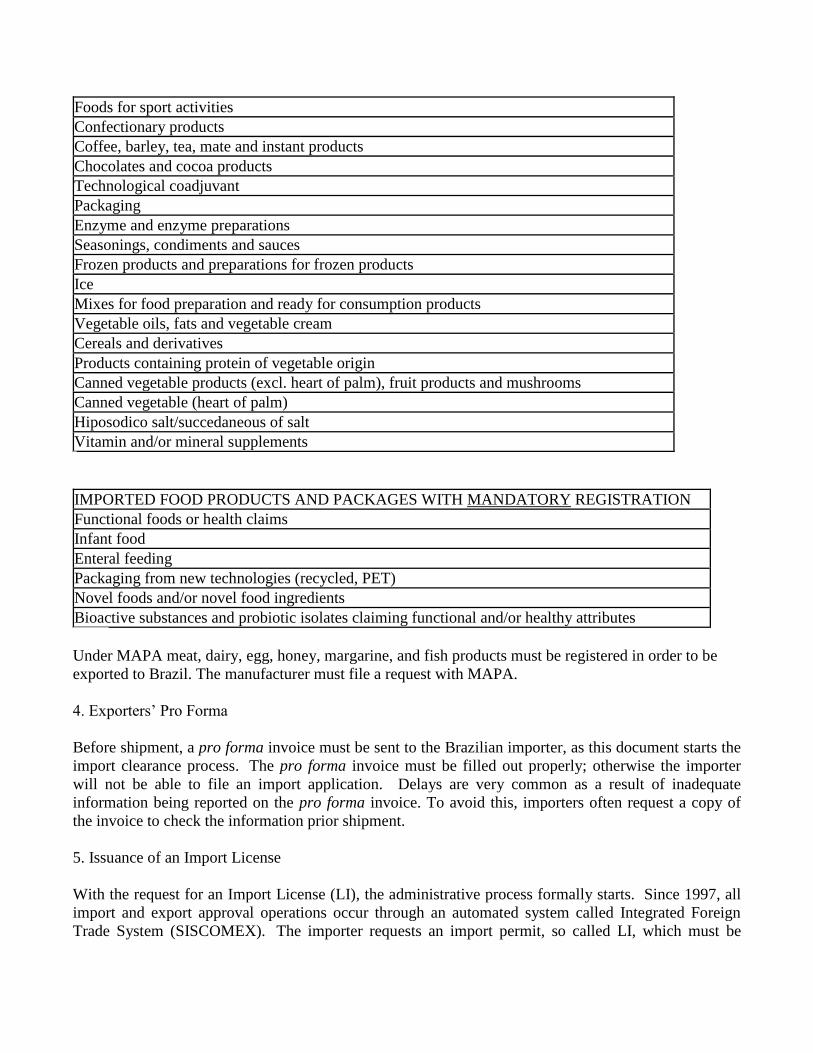
Foods for sport activities
Confectionary products
Coffee, barley, tea, mate and instant products
Chocolates and cocoa products
Technological coadjuvant
Packaging
Enzyme and enzyme preparations
Seasonings, condiments and sauces
Frozen products and preparations for frozen products
Ice
Mixes for food preparation and ready for consumption products
Vegetable oils, fats and vegetable cream
Cereals and derivatives
Products containing protein of vegetable origin
Canned vegetable products (excl. heart of palm), fruit products and mushrooms
Canned vegetable (heart of palm)
Hiposodico salt/succedaneous of salt
Vitamin and/or mineral supplements
IMPORTED FOOD PRODUCTS AND PACKAGES WITH MANDATORY REGISTRATION
Functional foods or health claims
Infant food
Enteral feeding
Packaging from new technologies (recycled, PET)
Novel foods and/or novel food ingredients
Bioactive substances and probiotic isolates claiming functional and/or healthy attributes
Under MAPA meat, dairy, egg, honey, margarine, and fish products must be registered in order to be
exported to Brazil. The manufacturer must file a request with MAPA.
4. Exporters’ Pro Forma
Before shipment, a pro forma invoice must be sent to the Brazilian importer, as this document starts the
import clearance process. The pro forma invoice must be filled out properly; otherwise the importer
will not be able to file an import application. Delays are very common as a result of inadequate
information being reported on the pro forma invoice. To avoid this, importers often request a copy of
the invoice to check the information prior shipment.
5. Issuance of an Import License
With the request for an Import License (LI), the administrative process formally starts. Since 1997, all
import and export approval operations occur through an automated system called Integrated Foreign
Trade System (SISCOMEX). The importer requests an import permit, so called LI, which must be
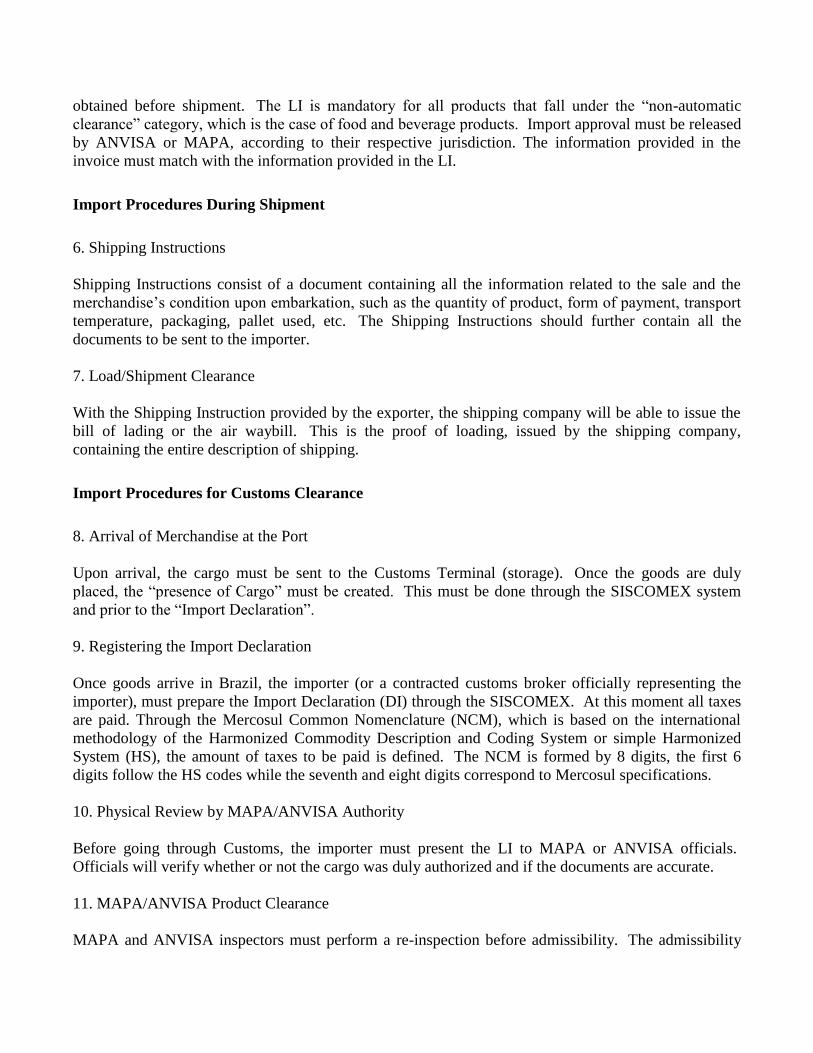
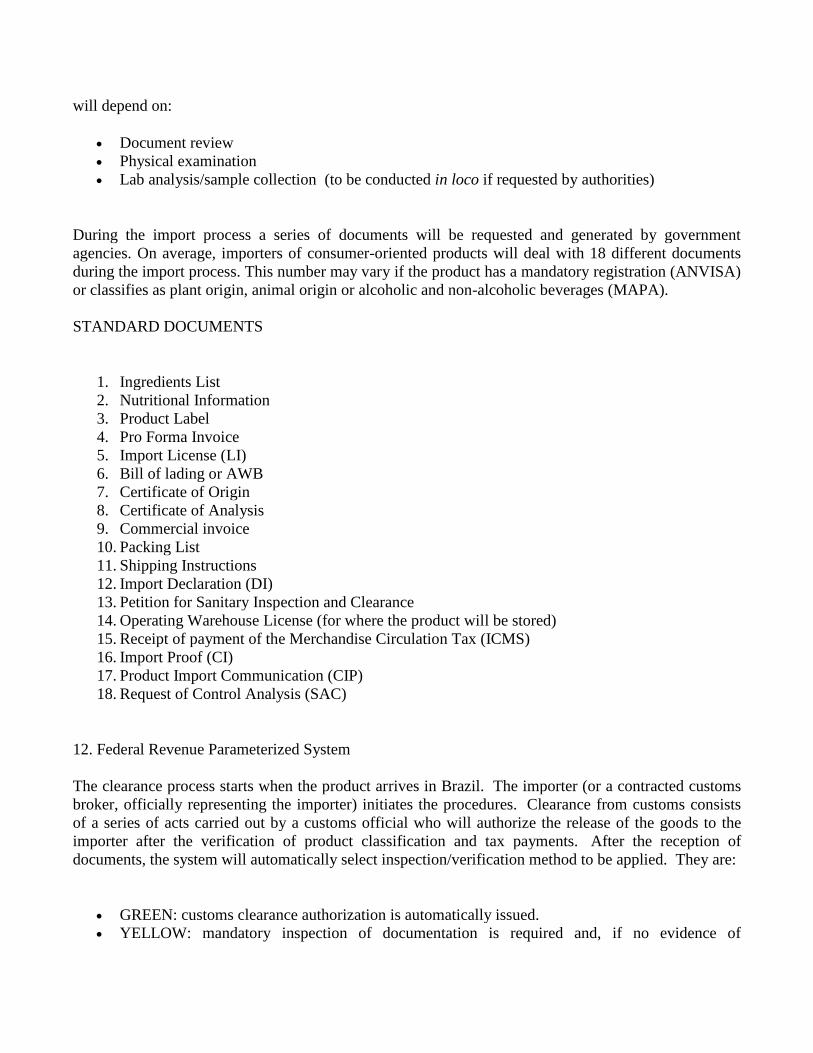
obtained before shipment. The LI is mandatory for all products that fall under the “non-automatic
clearance” category, which is the case of food and beverage products. Import approval must be released
by ANVISA or MAPA, according to their respective jurisdiction. The information provided in the
invoice must match with the information provided in the LI.
Import Procedures During Shipment
6. Shipping Instructions
Shipping Instructions consist of a document containing all the information related to the sale and the
merchandise’s condition upon embarkation, such as the quantity of product, form of payment, transport
temperature, packaging, pallet used, etc. The Shipping Instructions should further contain all the
documents to be sent to the importer.
7. Load/Shipment Clearance
With the Shipping Instruction provided by the exporter, the shipping company will be able to issue the
bill of lading or the air waybill. This is the proof of loading, issued by the shipping company,
containing the entire description of shipping.
Import Procedures for Customs Clearance
8. Arrival of Merchandise at the Port
Upon arrival, the cargo must be sent to the Customs Terminal (storage). Once the goods are duly
placed, the “presence of Cargo” must be created. This must be done through the SISCOMEX system
and prior to the “Import Declaration”.
9. Registering the Import Declaration
Once goods arrive in Brazil, the importer (or a contracted customs broker officially representing the
importer), must prepare the Import Declaration (DI) through the SISCOMEX. At this moment all taxes
are paid. Through the Mercosul Common Nomenclature (NCM), which is based on the international
methodology of the Harmonized Commodity Description and Coding System or simple Harmonized
System (HS), the amount of taxes to be paid is defined. The NCM is formed by 8 digits, the first 6
digits follow the HS codes while the seventh and eight digits correspond to Mercosul specifications.
10. Physical Review by MAPA/ANVISA Authority
Before going through Customs, the importer must present the LI to MAPA or ANVISA officials.
Officials will verify whether or not the cargo was duly authorized and if the documents are accurate.
11. MAPA/ANVISA Product Clearance
MAPA and ANVISA inspectors must perform a re-inspection before admissibility. The admissibility
will depend on:
Document review
Physical examination
Lab analysis/sample collection (to be conducted in loco if requested by authorities)
During the import process a series of documents will be requested and generated by government
agencies. On average, importers of consumer-oriented products will deal with 18 different documents
during the import process. This number may vary if the product has a mandatory registration (ANVISA)
or classifies as plant origin, animal origin or alcoholic and non-alcoholic beverages (MAPA).
STANDARD DOCUMENTS
1. Ingredients List
2. Nutritional Information
3. Product Label
4. Pro Forma Invoice
5. Import License (LI)
6. Bill of lading or AWB
7. Certificate of Origin
8. Certificate of Analysis
9. Commercial invoice
10. Packing List
11. Shipping Instructions
12. Import Declaration (DI)
13. Petition for Sanitary Inspection and Clearance
14. Operating Warehouse License (for where the product will be stored)
15. Receipt of payment of the Merchandise Circulation Tax (ICMS)
16. Import Proof (CI)
17. Product Import Communication (CIP)
18. Request of Control Analysis (SAC)
12. Federal Revenue Parameterized System
The clearance process starts when the product arrives in Brazil. The importer (or a contracted customs
broker, officially representing the importer) initiates the procedures. Clearance from customs consists
of a series of acts carried out by a customs official who will authorize the release of the goods to the
importer after the verification of product classification and tax payments. After the reception of
documents, the system will automatically select inspection/verification method to be applied. They are:
GREEN: customs clearance authorization is automatically issued.
YELLOW: mandatory inspection of documentation is required and, if no evidence of
irregularities is found, customs clearance is issued.
RED: mandatory inspection of documentation and of goods is required before customs clearance
authorization is issued.
GRAY: mandatory inspection of documents, merchandise, and recalculation of import taxes
applied.
Except for the green option, all documents including the Import Declaration, the receipt generated by
the SISCOMEX, and the Value Added Tax (ICMS) payment receipt (or waiver) must be presented to
the Secretariat of Federal Revenue (SRF). For goods assigned the gray option, a Declaration of
Customs Value (DVA) must be made and transmitted via SISCOMEX to justify the product price and
commercial aspects of the transaction. Any correction to the information presented must be carried out
in accordance with SISCOMEX procedures. After registering customs clearance, the fiscal authority -
the Secretariat of Federal Revenue - will release an import confirmation, approving customs clearance
and the entry of goods.
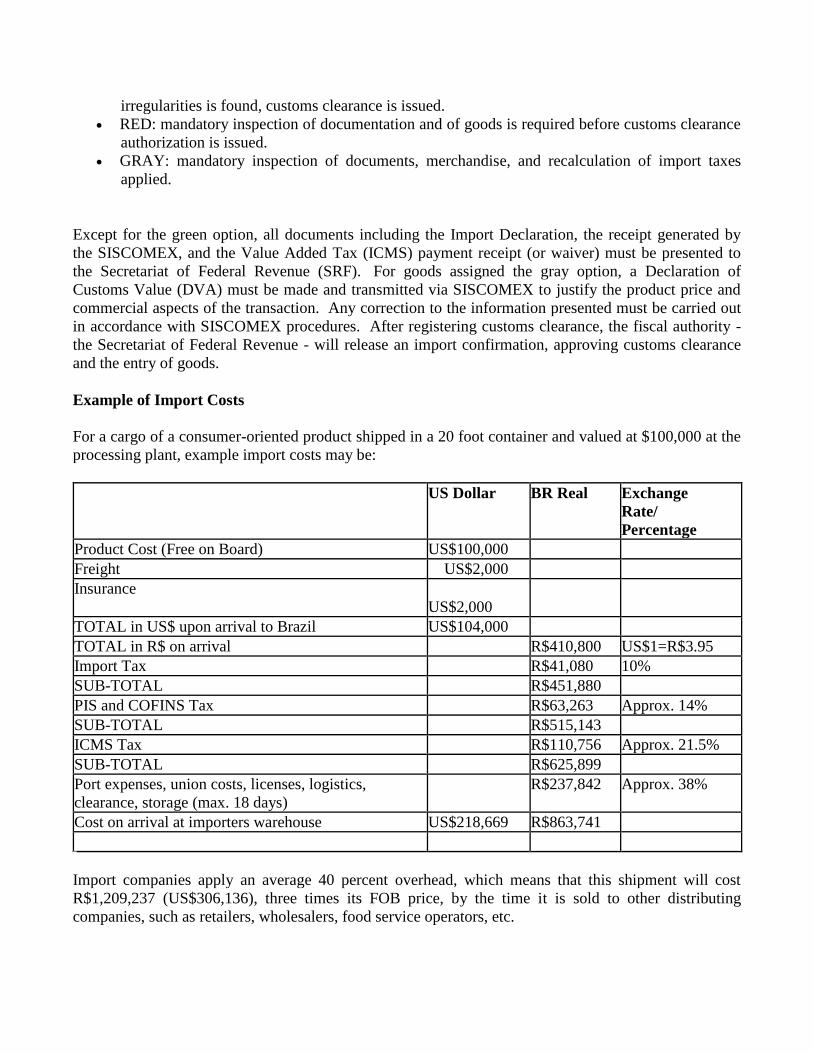
Example of Import Costs
For a cargo of a consumer-oriented product shipped in a 20 foot container and valued at $100,000 at the
processing plant, example import costs may be:
US Dollar BR Real Exchange
Rate/
Percentage
Product Cost (Free on Board) US$100,000
Freight US$2,000
Insurance
US$2,000
TOTAL in US$ upon arrival to Brazil US$104,000
TOTAL in R$ on arrival R$410,800 US$1=R$3.95
Import Tax R$41,080 10%
SUB-TOTAL R$451,880
PIS and COFINS Tax R$63,263 Approx. 14%
SUB-TOTAL R$515,143
ICMS Tax R$110,756 Approx. 21.5%
SUB-TOTAL R$625,899
Port expenses, union costs, licenses, logistics,
clearance, storage (max. 18 days)
R$237,842 Approx. 38%
Cost on arrival at importers warehouse US$218,669 R$863,741
Import companies apply an average 40 percent overhead, which means that this shipment will cost
R$1,209,237 (US$306,136), three times its FOB price, by the time it is sold to other distributing
companies, such as retailers, wholesalers, food service operators, etc.
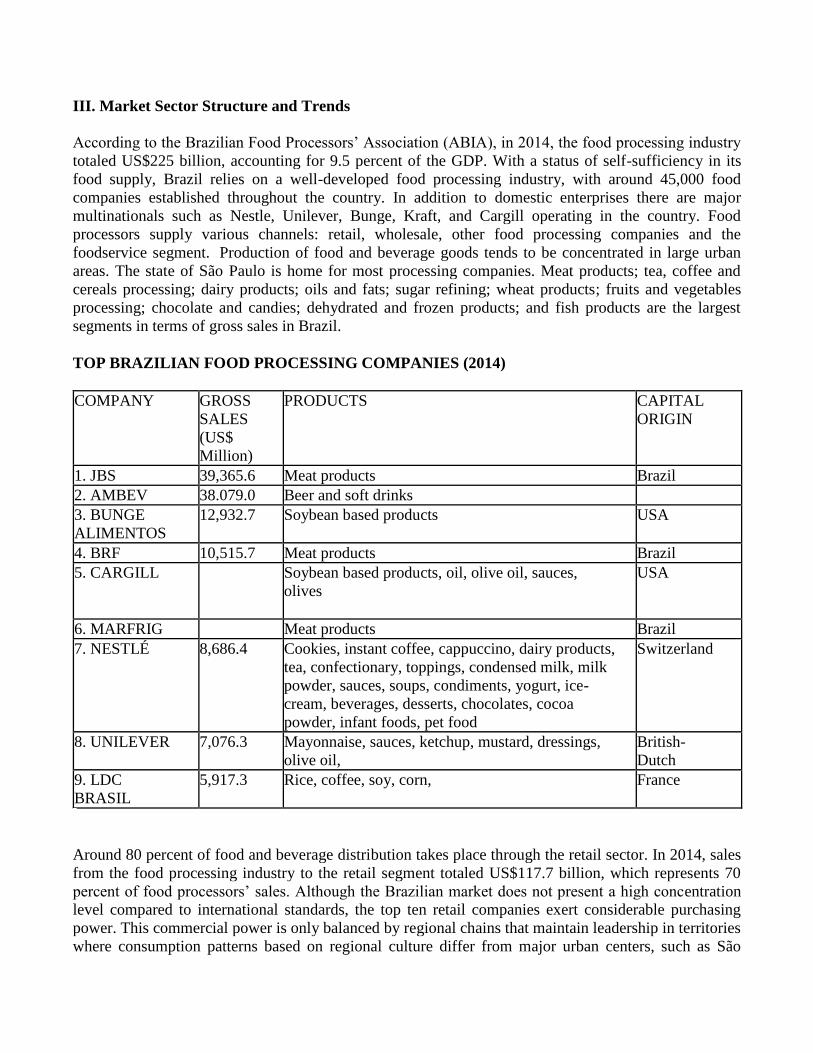
III. Market Sector Structure and Trends
According to the Brazilian Food Processors’ Association (ABIA), in 2014, the food processing industry
totaled US$225 billion, accounting for 9.5 percent of the GDP. With a status of self-sufficiency in its
food supply, Brazil relies on a well-developed food processing industry, with around 45,000 food
companies established throughout the country. In addition to domestic enterprises there are major
multinationals such as Nestle, Unilever, Bunge, Kraft, and Cargill operating in the country. Food
processors supply various channels: retail, wholesale, other food processing companies and the
foodservice segment. Production of food and beverage goods tends to be concentrated in large urban
areas. The state of São Paulo is home for most processing companies. Meat products; tea, coffee and
cereals processing; dairy products; oils and fats; sugar refining; wheat products; fruits and vegetables
processing; chocolate and candies; dehydrated and frozen products; and fish products are the largest
segments in terms of gross sales in Brazil.
TOP BRAZILIAN FOOD PROCESSING COMPANIES (2014)
COMPANY GROSS
SALES
(US$
Million)
PRODUCTS CAPITAL
ORIGIN
1. JBS 39,365.6 Meat products Brazil
2. AMBEV 38.079.0 Beer and soft drinks
3. BUNGE
ALIMENTOS
12,932.7 Soybean based products USA
4. BRF 10,515.7 Meat products Brazil
5. CARGILL Soybean based products, oil, olive oil, sauces,
olives
USA
6. MARFRIG Meat products Brazil
7. NESTLÉ 8,686.4 Cookies, instant coffee, cappuccino, dairy products,
tea, confectionary, toppings, condensed milk, milk
powder, sauces, soups, condiments, yogurt, ice-
cream, beverages, desserts, chocolates, cocoa
powder, infant foods, pet food
Switzerland
8. UNILEVER 7,076.3 Mayonnaise, sauces, ketchup, mustard, dressings,
olive oil,
British-
Dutch
9. LDC
BRASIL
5,917.3 Rice, coffee, soy, corn, France
Around 80 percent of food and beverage distribution takes place through the retail sector. In 2014, sales
from the food processing industry to the retail segment totaled US$117.7 billion, which represents 70
percent of food processors’ sales. Although the Brazilian market does not present a high concentration
level compared to international standards, the top ten retail companies exert considerable purchasing
power. This commercial power is only balanced by regional chains that maintain leadership in territories
where consumption patterns based on regional culture differ from major urban centers, such as São
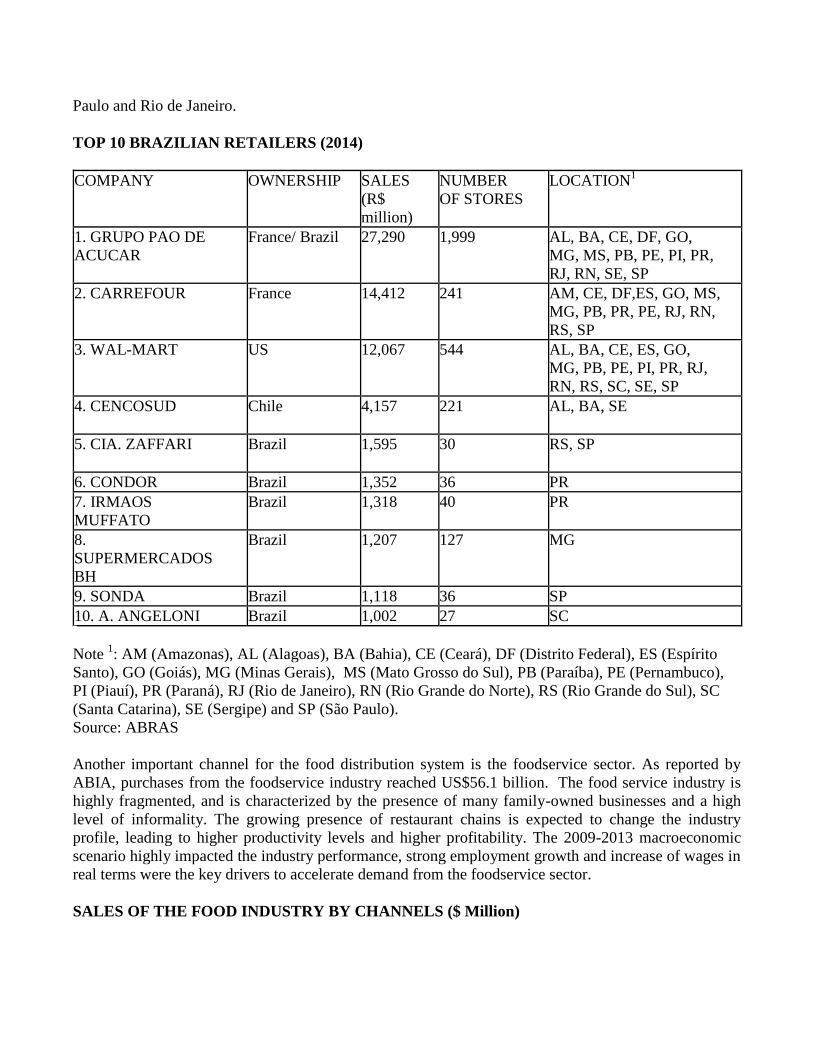
Paulo and Rio de Janeiro.
TOP 10 BRAZILIAN RETAILERS (2014)
COMPANY OWNERSHIP SALES
(R$
million)
NUMBER
OF STORES
LOCATION1
1. GRUPO PAO DE
ACUCAR
France/ Brazil 27,290 1,999 AL, BA, CE, DF, GO,
MG, MS, PB, PE, PI, PR,
RJ, RN, SE, SP
2. CARREFOUR
France 14,412 241 AM, CE, DF,ES, GO, MS,
MG, PB, PR, PE, RJ, RN,
RS, SP
3. WAL-MART
US 12,067 544 AL, BA, CE, ES, GO,
MG, PB, PE, PI, PR, RJ,
RN, RS, SC, SE, SP
4. CENCOSUD
Chile 4,157
221 AL, BA, SE
5. CIA. ZAFFARI
Brazil 1,595 30 RS, SP
6. CONDOR Brazil 1,352 36 PR
7. IRMAOS
MUFFATO
Brazil 1,318 40 PR
8.
SUPERMERCADOS
BH
Brazil 1,207 127 MG
9. SONDA Brazil 1,118 36 SP
10. A. ANGELONI Brazil 1,002 27 SC
Note 1: AM (Amazonas), AL (Alagoas), BA (Bahia), CE (Ceará), DF (Distrito Federal), ES (Espírito
Santo), GO (Goiás), MG (Minas Gerais), MS (Mato Grosso do Sul), PB (Paraíba), PE (Pernambuco),
PI (Piauí), PR (Paraná), RJ (Rio de Janeiro), RN (Rio Grande do Norte), RS (Rio Grande do Sul), SC
(Santa Catarina), SE (Sergipe) and SP (São Paulo).
Source: ABRAS
Another important channel for the food distribution system is the foodservice sector. As reported by
ABIA, purchases from the foodservice industry reached US$56.1 billion. The food service industry is
highly fragmented, and is characterized by the presence of many family-owned businesses and a high
level of informality. The growing presence of restaurant chains is expected to change the industry
profile, leading to higher productivity levels and higher profitability. The 2009-2013 macroeconomic
scenario highly impacted the industry performance, strong employment growth and increase of wages in
real terms were the key drivers to accelerate demand from the foodservice sector.
SALES OF THE FOOD INDUSTRY BY CHANNELS ($ Million)
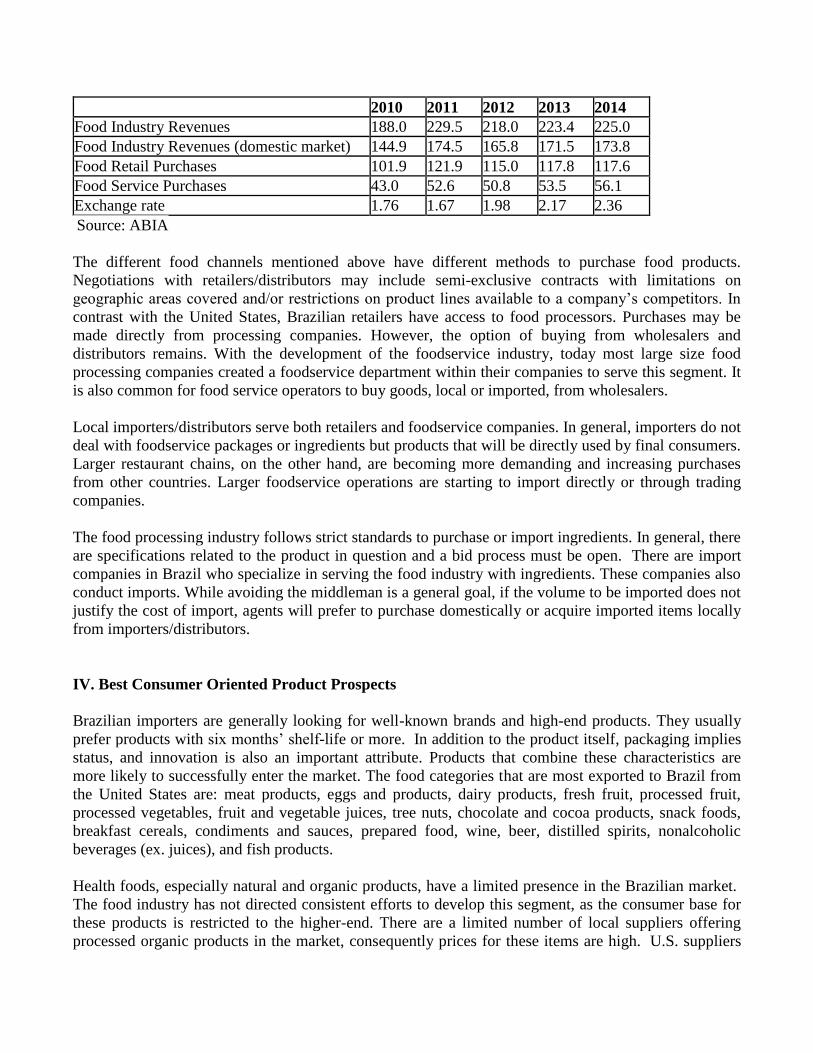
2010 2011 2012 2013 2014
Food Industry Revenues 188.0 229.5 218.0 223.4 225.0
Food Industry Revenues (domestic market) 144.9 174.5 165.8 171.5 173.8
Food Retail Purchases 101.9 121.9 115.0 117.8 117.6
Food Service Purchases 43.0 52.6 50.8 53.5 56.1
Exchange rate 1.76 1.67 1.98 2.17 2.36
Source: ABIA
The different food channels mentioned above have different methods to purchase food products.
Negotiations with retailers/distributors may include semi-exclusive contracts with limitations on
geographic areas covered and/or restrictions on product lines available to a company’s competitors. In
contrast with the United States, Brazilian retailers have access to food processors. Purchases may be
made directly from processing companies. However, the option of buying from wholesalers and
distributors remains. With the development of the foodservice industry, today most large size food
processing companies created a foodservice department within their companies to serve this segment. It
is also common for food service operators to buy goods, local or imported, from wholesalers.
Local importers/distributors serve both retailers and foodservice companies. In general, importers do not
deal with foodservice packages or ingredients but products that will be directly used by final consumers.
Larger restaurant chains, on the other hand, are becoming more demanding and increasing purchases
from other countries. Larger foodservice operations are starting to import directly or through trading
companies.
The food processing industry follows strict standards to purchase or import ingredients. In general, there
are specifications related to the product in question and a bid process must be open. There are import
companies in Brazil who specialize in serving the food industry with ingredients. These companies also
conduct imports. While avoiding the middleman is a general goal, if the volume to be imported does not
justify the cost of import, agents will prefer to purchase domestically or acquire imported items locally
from importers/distributors.
IV. Best Consumer Oriented Product Prospects
Brazilian importers are generally looking for well-known brands and high-end products. They usually
prefer products with six months’ shelf-life or more. In addition to the product itself, packaging implies
status, and innovation is also an important attribute. Products that combine these characteristics are
more likely to successfully enter the market. The food categories that are most exported to Brazil from
the United States are: meat products, eggs and products, dairy products, fresh fruit, processed fruit,
processed vegetables, fruit and vegetable juices, tree nuts, chocolate and cocoa products, snack foods,
breakfast cereals, condiments and sauces, prepared food, wine, beer, distilled spirits, nonalcoholic
beverages (ex. juices), and fish products.
Health foods, especially natural and organic products, have a limited presence in the Brazilian market.
The food industry has not directed consistent efforts to develop this segment, as the consumer base for
these products is restricted to the higher-end. There are a limited number of local suppliers offering
processed organic products in the market, consequently prices for these items are high. U.S. suppliers
may find great opportunities within this niche. Other food categories being sought by local importers
are lactose free products, kosher products, diet products, and gluten free products.
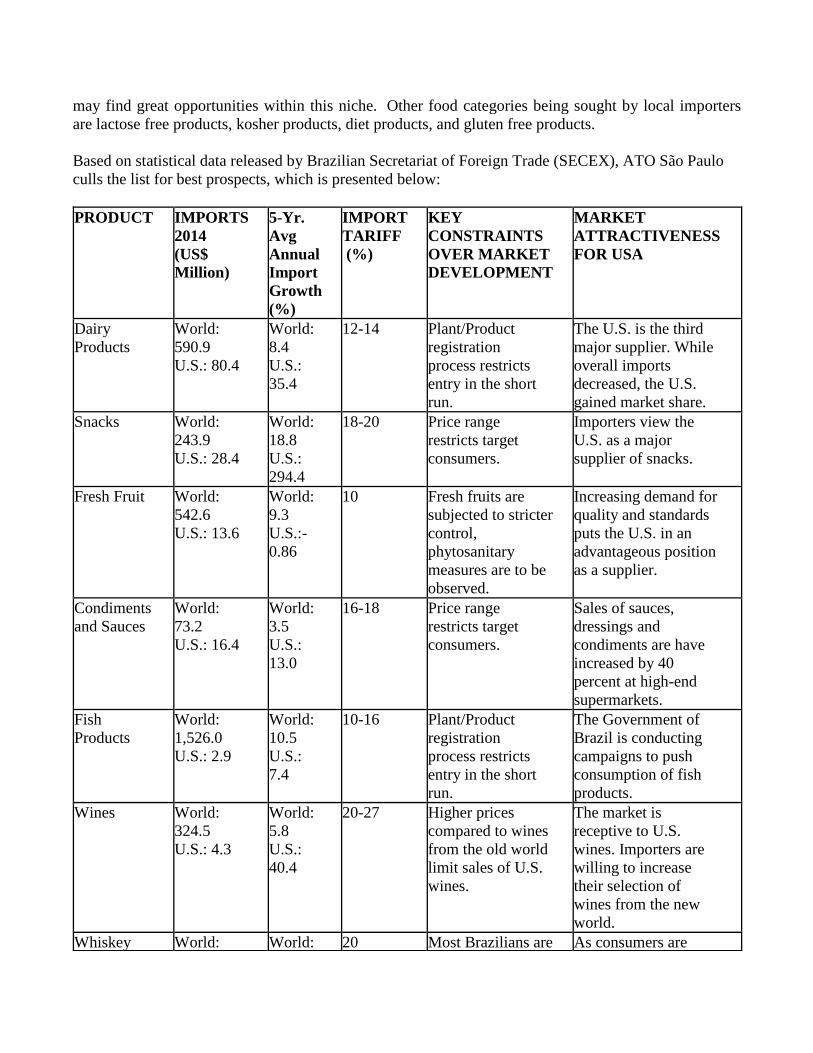
Based on statistical data released by Brazilian Secretariat of Foreign Trade (SECEX), ATO São Paulo
culls the list for best prospects, which is presented below:
PRODUCT IMPORTS
2014
(US$
Million)
5-Yr.
Avg
Annual
Import
Growth
(%)
IMPORT
TARIFF
(%)
KEY
CONSTRAINTS
OVER MARKET
DEVELOPMENT
MARKET
ATTRACTIVENESS
FOR USA
Dairy
Products
World:
590.9
U.S.: 80.4
World:
8.4
U.S.:
35.4
12-14 Plant/Product
registration
process restricts
entry in the short
run.
The U.S. is the third
major supplier. While
overall imports
decreased, the U.S.
gained market share.
Snacks World:
243.9
U.S.: 28.4
World:
18.8
U.S.:
294.4
18-20 Price range
restricts target
consumers.
Importers view the
U.S. as a major
supplier of snacks.
Fresh Fruit World:
542.6
U.S.: 13.6
World:
9.3
U.S.:-
0.86
10 Fresh fruits are
subjected to stricter
control,
phytosanitary
measures are to be
observed.
Increasing demand for
quality and standards
puts the U.S. in an
advantageous position
as a supplier.
Condiments
and Sauces
World:
73.2
U.S.: 16.4
World:
3.5
U.S.:
13.0
16-18 Price range
restricts target
consumers.
Sales of sauces,
dressings and
condiments are have
increased by 40
percent at high-end
supermarkets.
Fish
Products
World:
1,526.0
U.S.: 2.9
World:
10.5
U.S.:
7.4
10-16 Plant/Product
registration
process restricts
entry in the short
run.
The Government of
Brazil is conducting
campaigns to push
consumption of fish
products.
Wines World:
324.5
U.S.: 4.3
World:
5.8
U.S.:
40.4
20-27 Higher prices
compared to wines
from the old world
limit sales of U.S.
wines.
The market is
receptive to U.S.
wines. Importers are
willing to increase
their selection of
wines from the new
world.
Whiskey World: World: 20 Most Brazilians are As consumers are
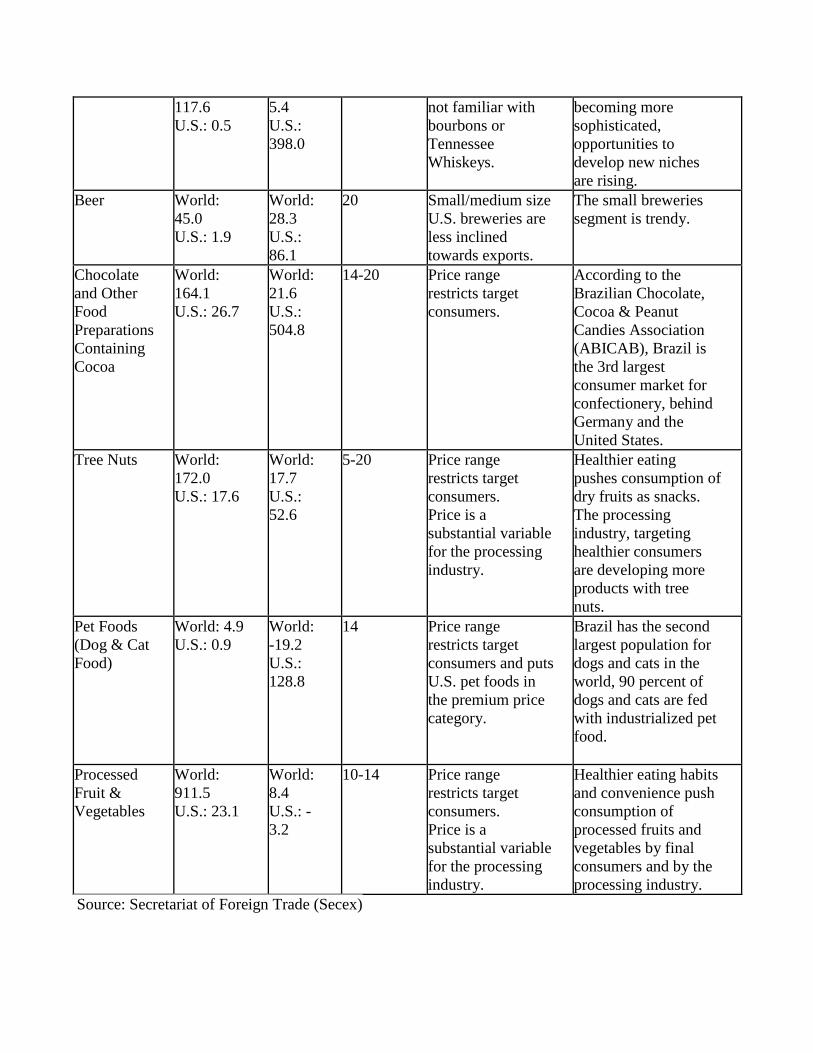
117.6
U.S.: 0.5
5.4
U.S.:
398.0
not familiar with
bourbons or
Tennessee
Whiskeys.
becoming more
sophisticated,
opportunities to
develop new niches
are rising.
Beer World:
45.0
U.S.: 1.9
World:
28.3
U.S.:
86.1
20 Small/medium size
U.S. breweries are
less inclined
towards exports.
The small breweries
segment is trendy.
Chocolate
and Other
Food
Preparations
Containing
Cocoa
World:
164.1
U.S.: 26.7
World:
21.6
U.S.:
504.8
14-20 Price range
restricts target
consumers.
According to the
Brazilian Chocolate,
Cocoa & Peanut
Candies Association
(ABICAB), Brazil is
the 3rd largest
consumer market for
confectionery, behind
Germany and the
United States.
Tree Nuts World:
172.0
U.S.: 17.6
World:
17.7
U.S.:
52.6
5-20 Price range
restricts target
consumers.
Price is a
substantial variable
for the processing
industry.
Healthier eating
pushes consumption of
dry fruits as snacks.
The processing
industry, targeting
healthier consumers
are developing more
products with tree
nuts.
Pet Foods
(Dog & Cat
Food)
World: 4.9
U.S.: 0.9
World:
-19.2
U.S.:
128.8
14 Price range
restricts target
consumers and puts
U.S. pet foods in
the premium price
category.
Brazil has the second
largest population for
dogs and cats in the
world, 90 percent of
dogs and cats are fed
with industrialized pet
food.
Processed
Fruit &
Vegetables
World:
911.5
U.S.: 23.1
World:
8.4
U.S.: -
3.2
10-14 Price range
restricts target
consumers.
Price is a
substantial variable
for the processing
industry.
Healthier eating habits
and convenience push
consumption of
processed fruits and
vegetables by final
consumers and by the
processing industry.
Source: Secretariat of Foreign Trade (Secex)
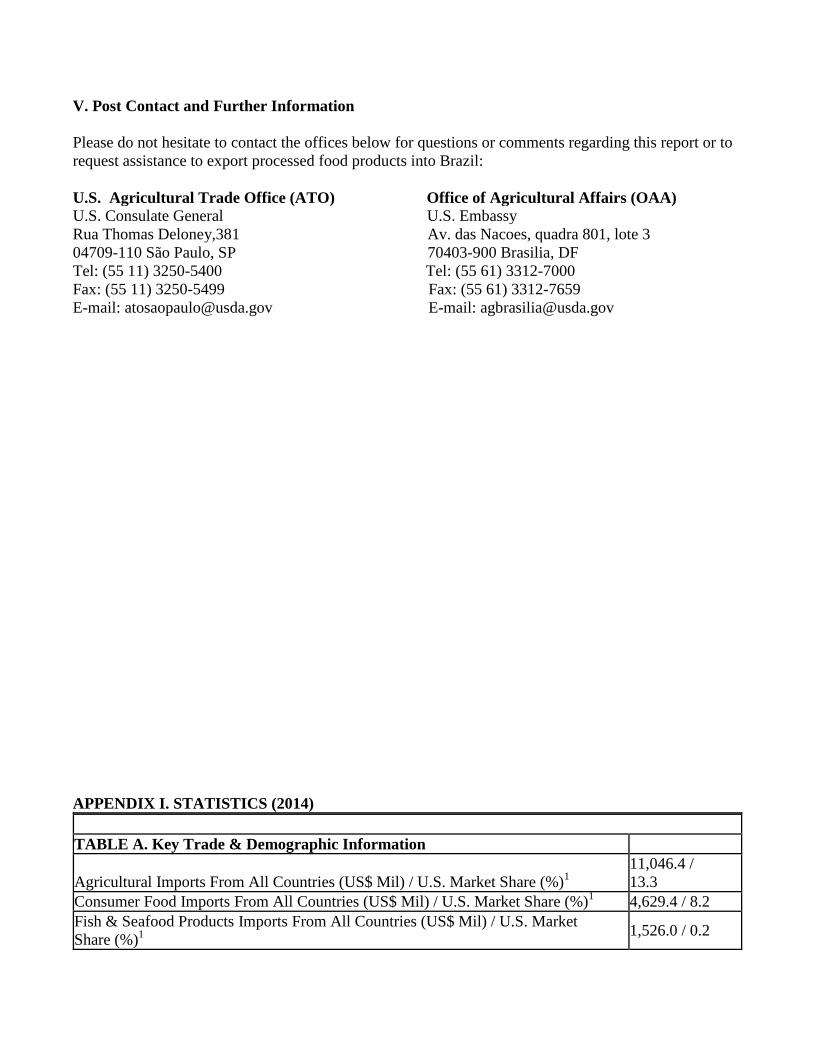
V. Post Contact and Further Information
Please do not hesitate to contact the offices below for questions or comments regarding this report or to
request assistance to export processed food products into Brazil:
U.S. Agricultural Trade Office (ATO) Office of Agricultural Affairs (OAA) U.S. Consulate General U.S. Embassy
Rua Thomas Deloney,381 Av. das Nacoes, quadra 801, lote 3
04709-110 São Paulo, SP 70403-900 Brasilia, DF
Tel: (55 11) 3250-5400 Tel: (55 61) 3312-7000
Fax: (55 11) 3250-5499 Fax: (55 61) 3312-7659
E-mail: [email protected] E-mail: [email protected]
APPENDIX I. STATISTICS (2014)
TABLE A. Key Trade & Demographic Information
Agricultural Imports From All Countries (US$ Mil) / U.S. Market Share (%)1
11,046.4 /
13.3
Consumer Food Imports From All Countries (US$ Mil) / U.S. Market Share (%)1 4,629.4 / 8.2
Fish & Seafood Products Imports From All Countries (US$ Mil) / U.S. Market
Share (%)1
1,526.0 / 0.2
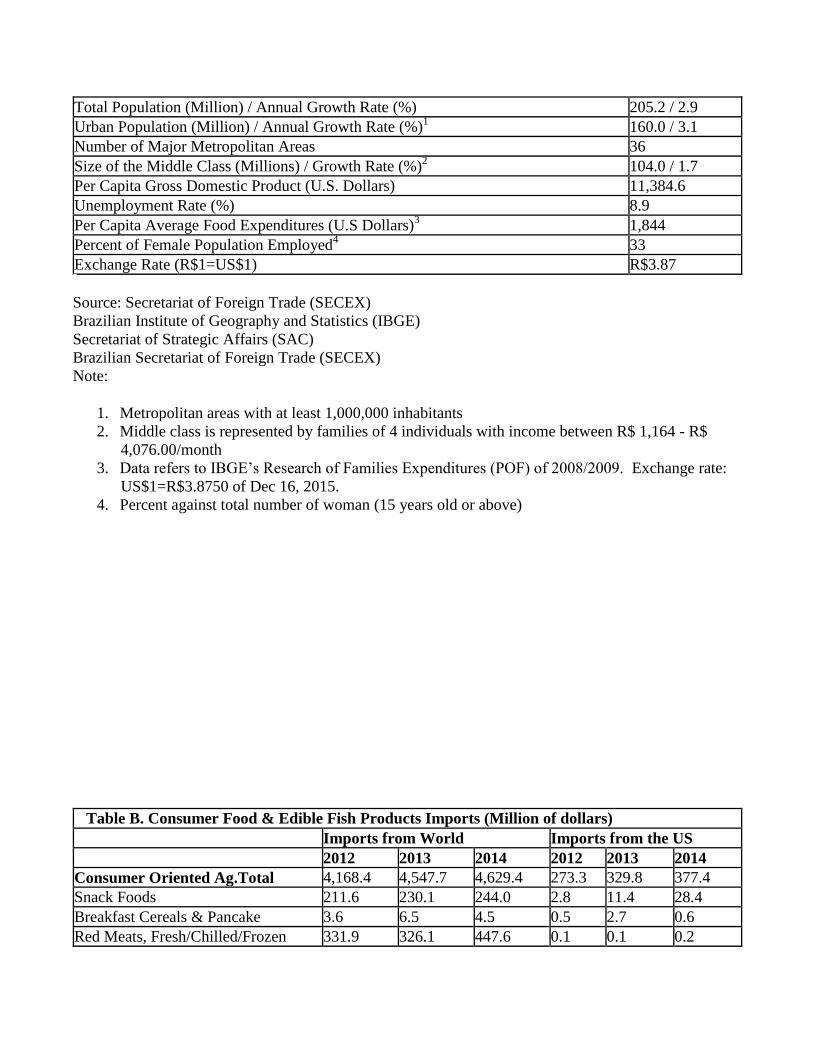
Total Population (Million) / Annual Growth Rate (%) 205.2 / 2.9
Urban Population (Million) / Annual Growth Rate (%)1 160.0 / 3.1
Number of Major Metropolitan Areas 36
Size of the Middle Class (Millions) / Growth Rate (%)2 104.0 / 1.7
Per Capita Gross Domestic Product (U.S. Dollars) 11,384.6
Unemployment Rate (%) 8.9
Per Capita Average Food Expenditures (U.S Dollars)3 1,844
Percent of Female Population Employed4 33
Exchange Rate (R$1=US$1) R$3.87
Source: Secretariat of Foreign Trade (SECEX)
Brazilian Institute of Geography and Statistics (IBGE)
Secretariat of Strategic Affairs (SAC)
Brazilian Secretariat of Foreign Trade (SECEX)
Note:
1. Metropolitan areas with at least 1,000,000 inhabitants
2. Middle class is represented by families of 4 individuals with income between R$ 1,164 - R$
4,076.00/month
3. Data refers to IBGE’s Research of Families Expenditures (POF) of 2008/2009. Exchange rate:
US$1=R$3.8750 of Dec 16, 2015.
4. Percent against total number of woman (15 years old or above)
Table B. Consumer Food & Edible Fish Products Imports (Million of dollars)
Imports from World Imports from the US
2012 2013 2014 2012 2013 2014
Consumer Oriented Ag.Total 4,168.4 4,547.7 4,629.4 273.3 329.8 377.4
Snack Foods 211.6 230.1 244.0 2.8 11.4 28.4
Breakfast Cereals & Pancake 3.6 6.5 4.5 0.5 2.7 0.6
Red Meats, Fresh/Chilled/Frozen 331.9 326.1 447.6 0.1 0.1 0.2
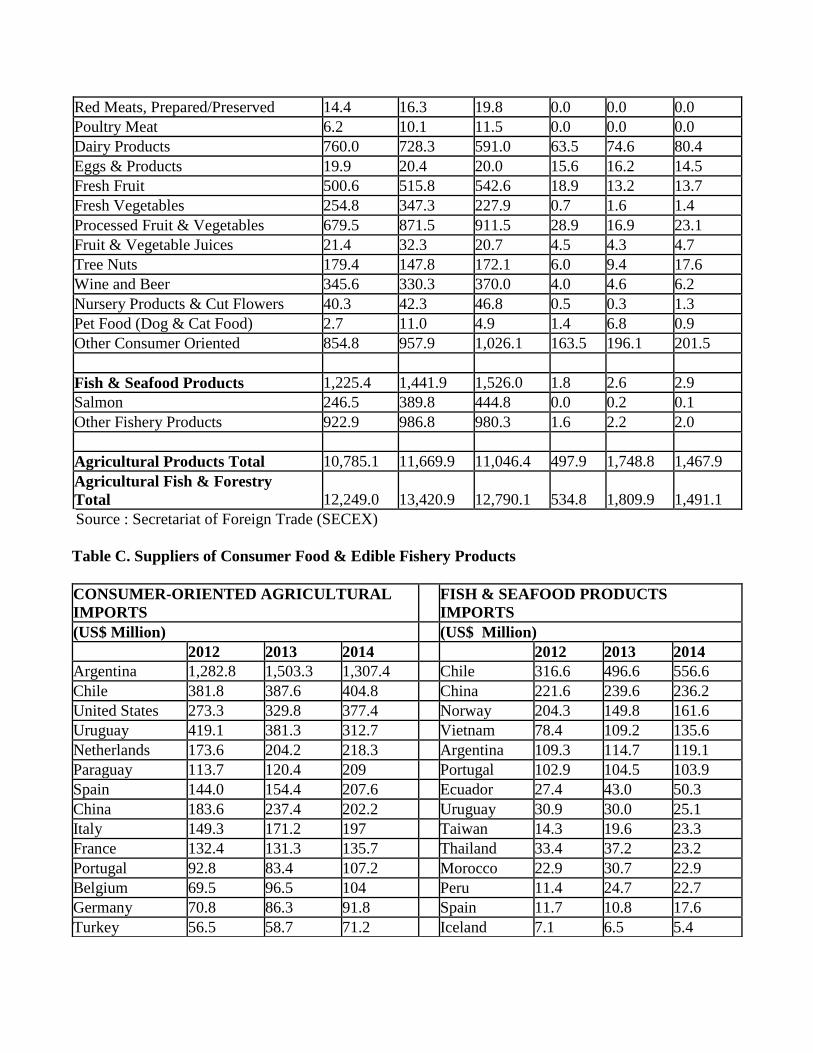
Red Meats, Prepared/Preserved 14.4 16.3 19.8 0.0 0.0 0.0
Poultry Meat 6.2 10.1 11.5 0.0 0.0 0.0
Dairy Products 760.0 728.3 591.0 63.5 74.6 80.4
Eggs & Products 19.9 20.4 20.0 15.6 16.2 14.5
Fresh Fruit 500.6 515.8 542.6 18.9 13.2 13.7
Fresh Vegetables 254.8 347.3 227.9 0.7 1.6 1.4
Processed Fruit & Vegetables 679.5 871.5 911.5 28.9 16.9 23.1
Fruit & Vegetable Juices 21.4 32.3 20.7 4.5 4.3 4.7
Tree Nuts 179.4 147.8 172.1 6.0 9.4 17.6
Wine and Beer 345.6 330.3 370.0 4.0 4.6 6.2
Nursery Products & Cut Flowers 40.3 42.3 46.8 0.5 0.3 1.3
Pet Food (Dog & Cat Food) 2.7 11.0 4.9 1.4 6.8 0.9
Other Consumer Oriented 854.8 957.9 1,026.1 163.5 196.1 201.5
Fish & Seafood Products 1,225.4 1,441.9 1,526.0 1.8 2.6 2.9
Salmon 246.5 389.8 444.8 0.0 0.2 0.1
Other Fishery Products 922.9 986.8 980.3 1.6 2.2 2.0
Agricultural Products Total 10,785.1 11,669.9 11,046.4 497.9 1,748.8 1,467.9
Agricultural Fish & Forestry
Total 12,249.0 13,420.9 12,790.1 534.8 1,809.9 1,491.1
Source : Secretariat of Foreign Trade (SECEX)
Table C. Suppliers of Consumer Food & Edible Fishery Products
CONSUMER-ORIENTED AGRICULTURAL
IMPORTS
FISH & SEAFOOD PRODUCTS
IMPORTS
(US$ Million)
(US$ Million)
2012 2013 2014
2012 2013 2014
Argentina 1,282.8 1,503.3 1,307.4
Chile 316.6 496.6 556.6
Chile 381.8 387.6 404.8
China 221.6 239.6 236.2
United States 273.3 329.8 377.4
Norway 204.3 149.8 161.6
Uruguay 419.1 381.3 312.7
Vietnam 78.4 109.2 135.6
Netherlands 173.6 204.2 218.3
Argentina 109.3 114.7 119.1
Paraguay 113.7 120.4 209
Portugal 102.9 104.5 103.9
Spain 144.0 154.4 207.6
Ecuador 27.4 43.0 50.3
China 183.6 237.4 202.2
Uruguay 30.9 30.0 25.1
Italy 149.3 171.2 197
Taiwan 14.3 19.6 23.3
France 132.4 131.3 135.7
Thailand 33.4 37.2 23.2
Portugal 92.8 83.4 107.2
Morocco 22.9 30.7 22.9
Belgium 69.5 96.5 104
Peru 11.4 24.7 22.7
Germany 70.8 86.3 91.8
Spain 11.7 10.8 17.6
Turkey 56.5 58.7 71.2
Iceland 7.1 6.5 5.4
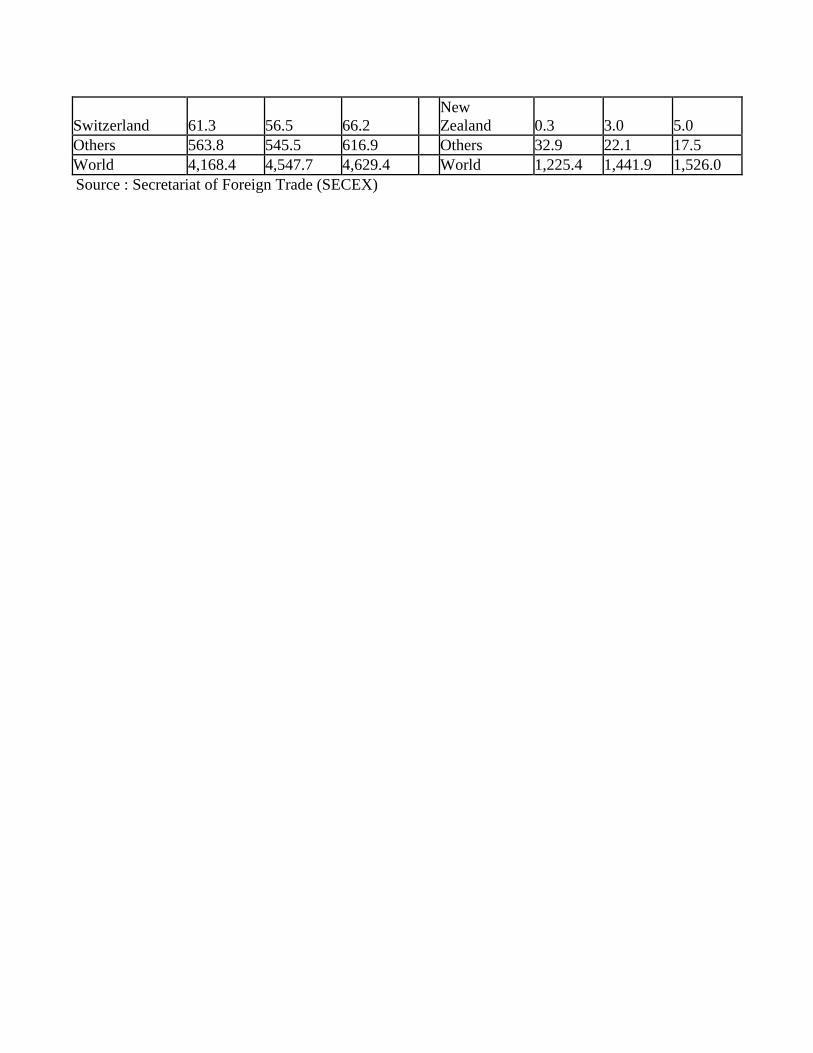
Switzerland 61.3 56.5 66.2
New
Zealand 0.3 3.0 5.0
Others 563.8 545.5 616.9
Others 32.9 22.1 17.5
World 4,168.4 4,547.7 4,629.4
World 1,225.4 1,441.9 1,526.0
Source : Secretariat of Foreign Trade (SECEX)