Embed Size (px)
Citation preview

Annual Report and Accounts 2018
Strategic report
1 RBS plc Annual Report and Accounts 2018
Page
Strategic Report
Presentation of information 1
RBS Group ring-fencing 1
Performance overview 1
Board of directors and secretary 2
Financial review 3
Capital and risk management 6
Report of the directors 47
Statement of directors’ responsibilities 50
Financial statements 51
Presentation of information On 30 April 2018 following the completion of the first Ring-Fenced Transfer Scheme (RFTS) the entity formerly known as Adam & Company plc was renamed The Royal Bank of Scotland plc. The Royal Bank of Scotland plc (the ‘Bank’ or ‘RBS plc’) is a wholly-owned subsidiary of NatWest Holdings Ltd (the ‘intermediate holding company’, NatWest Holdings or ‘NWH Ltd’). National Westminster Bank Plc (NatWest) is also a wholly-owned subsidiary of NWH Ltd. The ultimate parent company is The Royal Bank of Scotland Group plc (RBSG or the ‘ultimate holding company’). ‘RBS Group’ comprises the ultimate holding company and its subsidiary and associated undertakings. The Bank publishes its financial statements in pounds sterling (‘£’ or ‘sterling’). The abbreviations ‘£m’ and ‘£bn’ represent millions and thousands of millions of pounds sterling, respectively, and references to ‘pence’ represent pence in the United Kingdom (‘UK’). Reference to ‘dollars’ or ‘$’ are to United States of America (‘US’) dollars. The abbreviations ‘$m’ and ‘$bn’ represent millions and thousands of millions of dollars, respectively, and references to ‘cents’ represent cents in the US. The abbreviation ‘€’ represents the ‘euro’, and the abbreviations ‘€m’ and ‘€bn’ represent millions and thousands of millions of euros, respectively. RBS Group ring-fencing The UK ring-fencing legislation requires the separation of essential banking services from investment banking services from 1 January 2019. RBS Group has placed the majority of the UK and Western European banking business in ring-fenced banking entities under an intermediate holding company, NatWest Holdings. NatWest Markets Plc (NWM Plc) and RBS International (RBSI) are separate banks outside the ring-fence, both as subsidiaries of RBSG. NatWest Holdings The majority of NWM Plc’s (formerly RBS plc) Personal and Business Banking (PBB) and Commercial Banking business, to be included in the ring-fenced bank, was transferred to the Bank in 2018. This was followed by the transfer of NatWest Holdings, the Bank’s intermediate holding company to RBSG on 2 July 2018 to create a separate ring-fenced bank. Profile post Ring-Fenced Transfer Scheme (RFTS) As at 31 December 2018, total assets were £94.5 billion. The business can be summarised as follows: A top 10 UK banking entity by asset size. Approximately four million customers who have access to RBS
Group-wide shared services including telephony, digital, mobile and online.
Customers are served through a Scottish network of branches and ATM services, a presence in England & Wales and relationship management structures in Business Banking, Commercial and Private Banking.
Segmental structure The Bank has both retail and commercial banking activities. The reportable operating segments are UK Personal & Business Banking (UK PBB), Commercial Banking and Private Banking. Product offering A wide range of personal products is offered including current accounts, credit cards and personal loans. This includes a mortgage book of £23.7 billion as at 31 December 2018. The commercial banking product offering includes a wide range of services to small and medium sized enterprises (SMEs), mid-corporate and large corporate clients.
Customer geography The geographic location of customers is predominately within the UK with a strategic focus on Scotland. Cost structure Substantially all costs are recharges from NatWest. NatWest provides the majority of shared services (including technology) and operational processes under intra-group agreements. The Bank only directly employs a small number of Private Banking staff; front office customer facing staff are seconded from NatWest with costs recharged. The majority of the operational costs are represented by central service and support staff and other administrative expenses. Capital structure Immediately prior to the business transfers, the Bank was re-capitalised as follows; A £5.8 billion capital contribution was received from NatWest
Holdings. The issuance of £1 billion AT1 instruments and £1.3 billion Tier 2
instruments, both held by NatWest Holdings.
The internal capital ratio minimum target of 13% continued to be met; with a CET 1 ratio at 31 December 2018 of 13.2%. The Bank expects to declare a dividend of £1.8 billion in February 2019. The payment of this will be reflected in the 2019 Annual Report and Accounts, however its impact has been incorporated in the CET 1 ratio and in the associated capital position as it is reasonably foreseeable. Performance overview The profit for 2018 of £690 million primarily represents eight months of activity for the business transferred in under ring-fencing related transfers. This compares with profit for 2017 of £3.3 million which represents only the Private Banking business of Adam & Company. The operating profit before tax of £976 million includes £566 million relating to UK PBB, £385 million relating to Commercial Banking and £14 million relating to Private Banking, each reflecting strong margins achieved in a competitive market. Total income of £1,755 million included net interest income (£1,300 million), net fees and commission income (£343 million), and other operating income (£111 million). Of this total income approximately 63% was from UK PBB, 35% from Commercial Banking and 2% from Private Banking, Operating expenses of £754 million primarily reflected inter-company recharges (£485 million), strategic costs of £15 million and litigation and conduct charges of £124 million primarily relating to an increased provision for PPI.
Board of directors and secretary
2 RBS plc Annual Report and Accounts 2018
Approval of Strategic Report The Strategic Report for the year ended 31 December 2018 set out on pages 1 to 46 was approved by the Board of directors on 14 February 2019. By order of the Board Aileen Taylor Company secretary 14 February 2019
Chairman Howard Davies
Executive directors Ross McEwan Katie Murray Alison Rose-Slade
Non-executive directors Francesca Barnes Robert Gillespie Graham Beale Yasmin Jetha Ian Cormack Baroness Noakes Alison Davis Mike Rogers Patrick Flynn Mark Seligman Morten Friis Dr Lena Wilson
Chairman Howard Davies (appointed 27 April 2018) Nominations (Chairman)
Executive directors Ross McEwan (appointed 27 April 2018) Executive (Chairman)
Katie Murray (appointed 1 January 2019) Executive
Alison Rose-Slade (appointed 3 December 2018) Executive
Independent non-executive directors Francesca Barnes (resigned on 27 April and re-appointed 1 May 2018)
Graham Beale (appointed 1 May 2018) Audit, Nominations, Risk
Ian Cormack (appointed 1 May 2018) Audit, Remuneration, Risk
Alison Davis (appointed 27 April 2018) Remuneration
Patrick Flynn (appointed 1 June 2018) Audit (Chairman), Risk
Morten Friis (appointed 27 April 2018) Audit, Risk
Robert Gillespie (appointed 27 April 2018) Remuneration (Chairman), Nominations, Risk
Yasmin Jetha (appointed 27 April 2018) Remuneration
Baroness Noakes (appointed 27 April 2018) Risk (Chairman), Audit, Nominations
Mike Rogers (appointed 27 April 2018) Remuneration
Mark Seligman (appointed 27 April 2018) Audit, Nominations, Remuneration
Dr Lena Wilson (appointed 27 April 2018)
Chief Governance & Regulatory Officer and Board Counsel Aileen Taylor (Company Secretary) (appointed 27 April 2018)
Preparation for ring-fencing During 2018 in preparation for ring-fencing, a number of changes were made to the composition of the Bank’s board of directors and secretary to align the membership with National Westminster Bank Plc, the other main ring-fenced UK bank in the RBS Group. At the same time as the new directors and secretary were appointed the previous members as follows resigned.
Non-executive director resignations: Alexa Henderson (19 January 2018) Francesca Barnes* (27 April 2018) The Rt Hon Lord William Waldegrave of North Hill, PC (27 April 2018) Mark Lund (27 April 2018) Linda Urquhart OBE (27 April 2018)
*re-appointed on 1 May 2018
Executive director resignations: Graham Storrie (27 April 2018) Michael Regan (27 April 2018) Peter Flavel (27 April 2018)
Fiona Mackay who was previously the company secretary also resigned on 27 April 2018.
Changes to the governance committees In addition to the changes to the Bank’s board of directors and secretary above the committee membership and calendar was also updated to be in alignment with National Westminster Bank Plc, the other main UK ring-fenced bank in the RBS Group. Other board changes in 2018: Sandy Crombie (non-executive director) resigned on 1 January 2018 Ewen Stevenson (executive director) resigned on 30 September 2018 Penny Hughes (non-executive director) resigned on 30 May 2018 Brendan Nelson (non-executive director) resigned on 31 December 2018.
Auditors Ernst & Young LLP Chartered Accountants and Statutory Auditor 25 Churchill Place London E14 5EY
Registered office 36 St Andrew Square Edinburgh EH2 2YB Telephone: +44 (0)131 556 8555
Principal offices PO Box 1000 Gogarburn Edinburgh EH12 1HQ Telephone +44 (0)131 626 0000
24/25 St Andrew Square Edinburgh EH2 1AF
The Royal Bank of Scotland plc Registered in Scotland No. SC083026 Key: Audit member of the Audit Committee Executive member of the Executive Committee Nominations member of the Nominations Committee Remuneration member of the Performance and Remuneration Committee Risk member of the Board Risk Committee For additional detail on the activities of the Committees above, refer to the Report of the directors.
Financial review
3 RBS plc Annual Report and Accounts 2018
Financial summary Summary income statement for the year ended 31 December 2018
2018 2017 Variance £m £m £m
Net interest income 1,300.3 24.0 1,276.3
Fees and commissions receivable 416.0 3.5 412.5
Fees and commissions payable (72.8) (0.4) (72.4)
Other operating income 111.3 1.2 110.1
Non-interest income 454.5 4.3 450.2
Total income 1,754.8 28.3 1,726.5
Operating expenses (754.4) (22.3) (732.1)
Profit before impairment losses 1,000.4 6.0 994.4
Impairment losses (24.4) (1.3) (23.1)
Operating profit before tax 976.0 4.7 971.3
Tax charge (285.6) (1.4) (284.2)
Profit for the year 690.4 3.3 687.1
Attributable to:
Ordinary shareholders 644.6 3.3 641.3
Paid-in equity holders 45.8 — 45.8
690.4 3.3 687.1
Key metrics & ratios
Cost:income ratio (%) 43.0 78.7 (35.7%)
CET 1 ratio (%) 13.2 18.6 (5.4%)
Leverage ratio (%) 5.6 10.7 (5.1%)
Risk weighted assets (£bn) 34.5 0.4 34.1
2018
Net Net fees Other non- interest and interest Total Operating Impairment Operating income commissions income income expenses releases profit
£m £m £m £m £m £m £m
UK Personal & Business Banking 904.4 185.9 12.5 1,102.8 (465.0) (71.7) 566.1
Commercial Banking 426.5 152.0 31.2 609.7 (271.8) 47.3 385.2
Private Banking 25.3 5.0 1.3 31.6 (17.6) 0.4 14.4
Commercial & Private Banking 451.8 157.0 32.5 641.3 (289.4) 47.7 399.6
Central items & other (55.9) 0.3 66.3 10.7 — (0.4) 10.3
Total 1,300.3 343.2 111.3 1,754.8 (754.4) (24.4) 976.0
2017 Private Banking 24.0 3.1 1.2 28.3 (22.3) (1.3) 4.7
Central items & other — — — — — — —
Total 24.0 3.1 1.2 28.3 (22.3) (1.3) 4.7
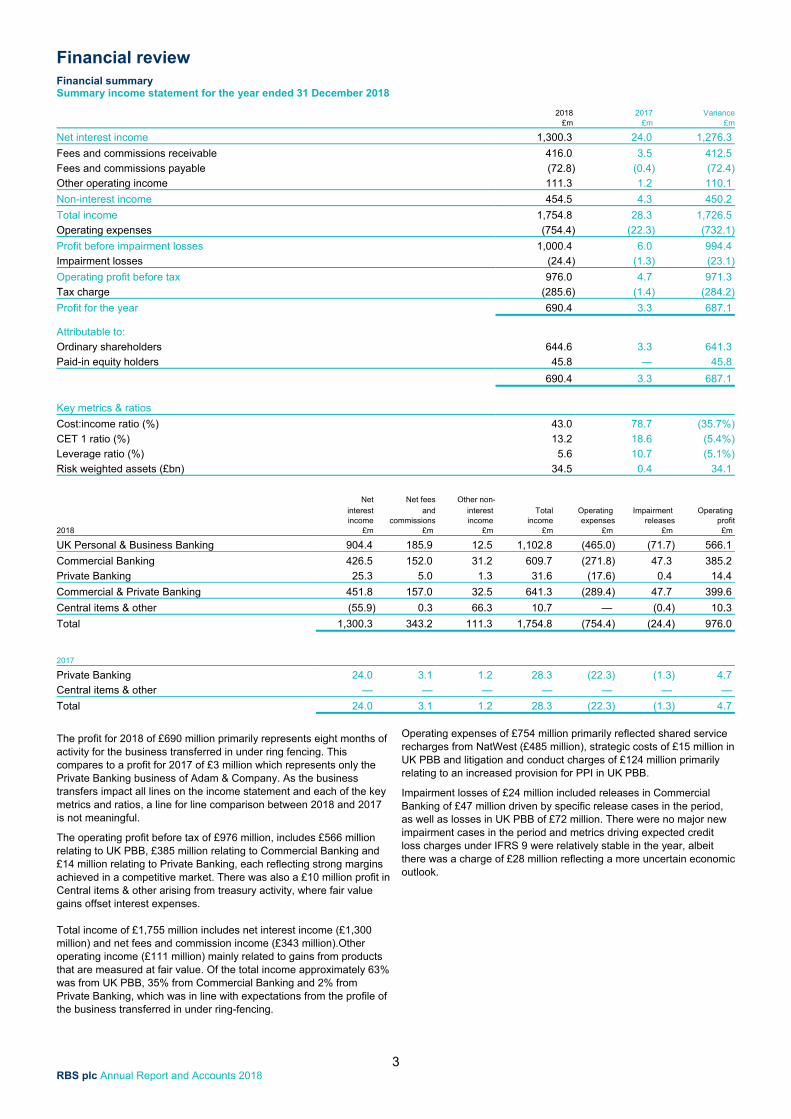
The profit for 2018 of £690 million primarily represents eight months of activity for the business transferred in under ring fencing. This compares to a profit for 2017 of £3 million which represents only the Private Banking business of Adam & Company. As the business transfers impact all lines on the income statement and each of the key metrics and ratios, a line for line comparison between 2018 and 2017 is not meaningful.
The operating profit before tax of £976 million, includes £566 million relating to UK PBB, £385 million relating to Commercial Banking and £14 million relating to Private Banking, each reflecting strong margins achieved in a competitive market. There was also a £10 million profit in Central items & other arising from treasury activity, where fair value gains offset interest expenses.
Total income of £1,755 million includes net interest income (£1,300 million) and net fees and commission income (£343 million).Other operating income (£111 million) mainly related to gains from products that are measured at fair value. Of the total income approximately 63% was from UK PBB, 35% from Commercial Banking and 2% from Private Banking, which was in line with expectations from the profile of the business transferred in under ring-fencing.
Operating expenses of £754 million primarily reflected shared service recharges from NatWest (£485 million), strategic costs of £15 million in UK PBB and litigation and conduct charges of £124 million primarily relating to an increased provision for PPI in UK PBB.
Impairment losses of £24 million included releases in Commercial Banking of £47 million driven by specific release cases in the period, as well as losses in UK PBB of £72 million. There were no major new impairment cases in the period and metrics driving expected credit loss charges under IFRS 9 were relatively stable in the year, albeit there was a charge of £28 million reflecting a more uncertain economic outlook.
Financial review
4 RBS plc Annual Report and Accounts 2018
Summary balance sheet as at 31 December 2018 2018 2017 Variance
£m £m £m
Assets
Cash and balances at central banks 21,650.4 0.1 21,650.3
Loans to banks - amortised cost 2,344.0 10.7 2,333.3
Loans to customers - amortised cost 60,521.1 705.6 59,815.5
Amounts due from holding companies and fellow subsidiaries 8,916.8 1,476.5 7,440.3
Other assets 1,064.6 39.5 1,025.1
Total assets 94,496.9 2,232.4 92,264.5
Liabilities
Bank deposits 1,216.6 — 1,216.6
Customer deposits 75,023.6 1,850.6 73,173.0
Amounts due to holding companies and fellow subsidiaries 7,167.4 272.1 6,895.3
Other financial liabilities 883.4 — 883.4
Notes in circulation 1,285.7 — 1,285.7
Other liabilities 1,359.5 23.7 1,335.8
Total liabilities 86,936.2 2,146.4 84,789.8
Total equity 7,560.7 86.0 7,474.7 Total liabilities and equity 94,496.9 2,232.4 92,264.5
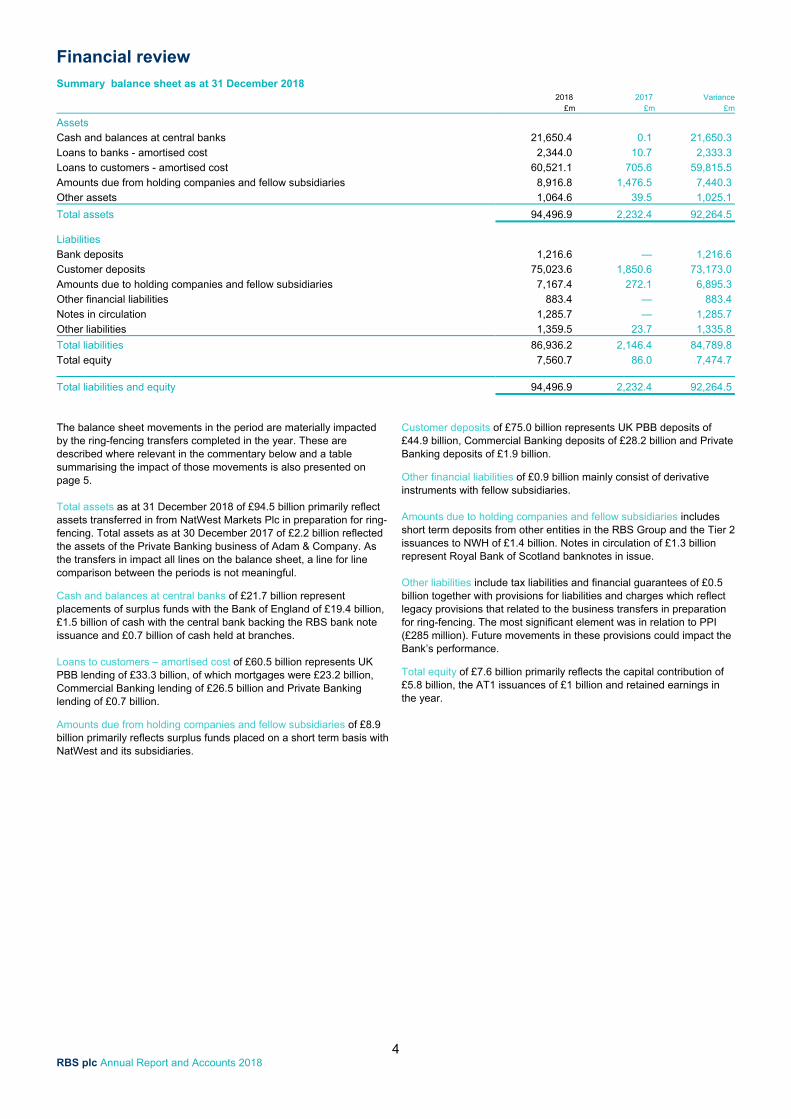
The balance sheet movements in the period are materially impacted by the ring-fencing transfers completed in the year. These are described where relevant in the commentary below and a table summarising the impact of those movements is also presented on page 5. Total assets as at 31 December 2018 of £94.5 billion primarily reflect assets transferred in from NatWest Markets Plc in preparation for ring-fencing. Total assets as at 30 December 2017 of £2.2 billion reflected the assets of the Private Banking business of Adam & Company. As the transfers in impact all lines on the balance sheet, a line for line comparison between the periods is not meaningful.
Cash and balances at central banks of £21.7 billion represent placements of surplus funds with the Bank of England of £19.4 billion, £1.5 billion of cash with the central bank backing the RBS bank note issuance and £0.7 billion of cash held at branches. Loans to customers – amortised cost of £60.5 billion represents UK PBB lending of £33.3 billion, of which mortgages were £23.2 billion, Commercial Banking lending of £26.5 billion and Private Banking lending of £0.7 billion.
Amounts due from holding companies and fellow subsidiaries of £8.9 billion primarily reflects surplus funds placed on a short term basis with NatWest and its subsidiaries.
Customer deposits of £75.0 billion represents UK PBB deposits of £44.9 billion, Commercial Banking deposits of £28.2 billion and Private Banking deposits of £1.9 billion.
Other financial liabilities of £0.9 billion mainly consist of derivative instruments with fellow subsidiaries. Amounts due to holding companies and fellow subsidiaries includes short term deposits from other entities in the RBS Group and the Tier 2 issuances to NWH of £1.4 billion. Notes in circulation of £1.3 billion represent Royal Bank of Scotland banknotes in issue. Other liabilities include tax liabilities and financial guarantees of £0.5 billion together with provisions for liabilities and charges which reflect legacy provisions that related to the business transfers in preparation for ring-fencing. The most significant element was in relation to PPI (£285 million). Future movements in these provisions could impact the Bank’s performance.
Total equity of £7.6 billion primarily reflects the capital contribution of £5.8 billion, the AT1 issuances of £1 billion and retained earnings in the year.
Financial review
5 RBS plc Annual Report and Accounts 2018
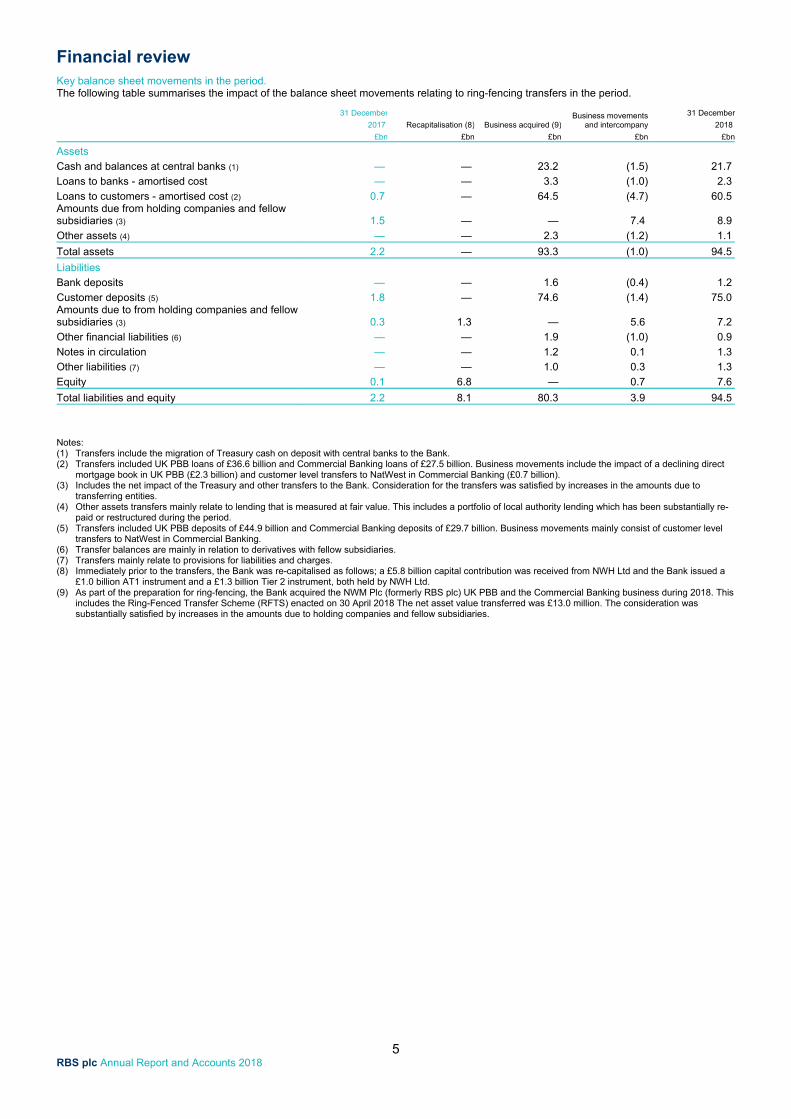
Key balance sheet movements in the period. The following table summarises the impact of the balance sheet movements relating to ring-fencing transfers in the period.
31 December
Recapitalisation (8) Business acquired (9)Business movements
and intercompany
31 December
2017 2018
£bn £bn £bn £bn £bn
Assets
Cash and balances at central banks (1) — — 23.2 (1.5) 21.7
Loans to banks - amortised cost — — 3.3 (1.0) 2.3
Loans to customers - amortised cost (2) 0.7 — 64.5 (4.7) 60.5 Amounts due from holding companies and fellow subsidiaries (3) 1.5 — — 7.4 8.9
Other assets (4) — — 2.3 (1.2) 1.1
Total assets 2.2 — 93.3 (1.0) 94.5
Liabilities
Bank deposits — — 1.6 (0.4) 1.2
Customer deposits (5) 1.8 — 74.6 (1.4) 75.0 Amounts due to from holding companies and fellow subsidiaries (3) 0.3 1.3 — 5.6 7.2
Other financial liabilities (6) — — 1.9 (1.0) 0.9
Notes in circulation — — 1.2 0.1 1.3
Other liabilities (7) — — 1.0 0.3 1.3
Equity 0.1 6.8 — 0.7 7.6
Total liabilities and equity 2.2 8.1 80.3 3.9 94.5
Notes: (1) Transfers include the migration of Treasury cash on deposit with central banks to the Bank. (2) Transfers included UK PBB loans of £36.6 billion and Commercial Banking loans of £27.5 billion. Business movements include the impact of a declining direct
mortgage book in UK PBB (£2.3 billion) and customer level transfers to NatWest in Commercial Banking (£0.7 billion). (3) Includes the net impact of the Treasury and other transfers to the Bank. Consideration for the transfers was satisfied by increases in the amounts due to
transferring entities. (4) Other assets transfers mainly relate to lending that is measured at fair value. This includes a portfolio of local authority lending which has been substantially re-
paid or restructured during the period. (5) Transfers included UK PBB deposits of £44.9 billion and Commercial Banking deposits of £29.7 billion. Business movements mainly consist of customer level
transfers to NatWest in Commercial Banking. (6) Transfer balances are mainly in relation to derivatives with fellow subsidiaries. (7) Transfers mainly relate to provisions for liabilities and charges. (8) Immediately prior to the transfers, the Bank was re-capitalised as follows; a £5.8 billion capital contribution was received from NWH Ltd and the Bank issued a
£1.0 billion AT1 instrument and a £1.3 billion Tier 2 instrument, both held by NWH Ltd. (9) As part of the preparation for ring-fencing, the Bank acquired the NWM Plc (formerly RBS plc) UK PBB and the Commercial Banking business during 2018. This
includes the Ring-Fenced Transfer Scheme (RFTS) enacted on 30 April 2018 The net asset value transferred was £13.0 million. The consideration was substantially satisfied by increases in the amounts due to holding companies and fellow subsidiaries.
Capital and risk management
6 RBS plc Annual Report and Accounts 2018
Presentation of information Where indicated in the section headers, information in the Capital and risk management section (pages 6 to 46) is within the scope of the independent auditor’s report. Where a main section header, presented in bold, is marked as audited all sub sections are also audited. Capital and risk management are generally conducted on an overall basis in the RBS Group such that common policies, procedures, frameworks and models apply across the RBS Group. Therefore, for the most part, discussion on these qualitative aspects reflects those in the RBS Group as relevant for the businesses and operations in the Bank. Ring-fencing – capital and risk profile This section summarises the profile of the Bank resulting from the significant transfers in preparation for Ring-Fencing under ICB. The Bank’s principal activity is to carry out retail and commercial banking activities in the UK. The risk profile of the entity is consistent with the RBS Group’s ring-fenced banking activities. Further detail on the Bank’s capital profile is provided on page 15. Refer to page 19 for further detail on RBS plc’s credit risk profile.
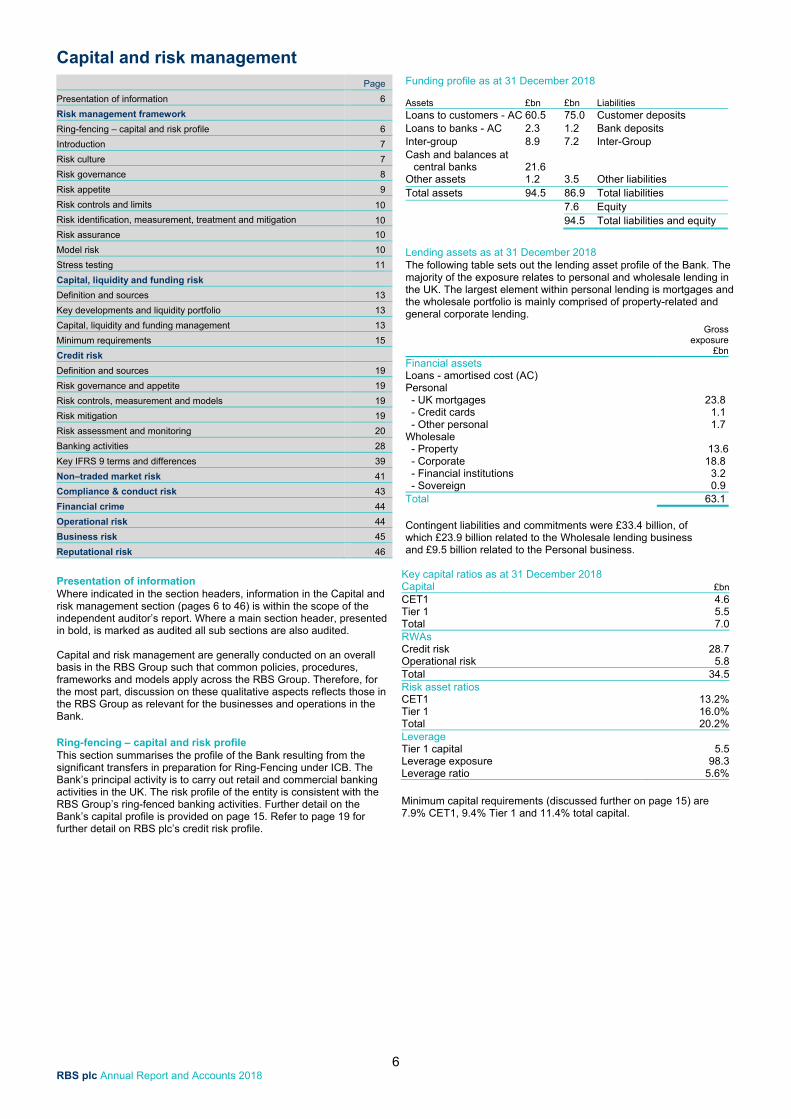
Funding profile as at 31 December 2018 Assets
£bn
£bn
Liabilities
Loans to customers - AC 60.5 75.0 Customer deposits Loans to banks - AC 2.3 1.2 Bank deposits Inter-group 8.9 7.2 Inter-Group Cash and balances at
central banks 21.6
Other assets 1.2 3.5 Other liabilities Total assets 94.5 86.9 Total liabilities 7.6 Equity 94.5 Total liabilities and equity
Lending assets as at 31 December 2018 The following table sets out the lending asset profile of the Bank. The majority of the exposure relates to personal and wholesale lending in the UK. The largest element within personal lending is mortgages and the wholesale portfolio is mainly comprised of property-related and general corporate lending. Gross exposure £bnFinancial assets Loans - amortised cost (AC) Personal - UK mortgages 23.8 - Credit cards 1.1 - Other personal 1.7 Wholesale - Property 13.6 - Corporate 18.8 - Financial institutions 3.2 - Sovereign 0.9 Total 63.1 Contingent liabilities and commitments were £33.4 billion, of which £23.9 billion related to the Wholesale lending business and £9.5 billion related to the Personal business.
Key capital ratios as at 31 December 2018 Capital
£bn
CET1 4.6 Tier 1 5.5 Total 7.0 RWAs Credit risk 28.7 Operational risk 5.8 Total 34.5 Risk asset ratios CET1 13.2% Tier 1 16.0% Total 20.2% Leverage Tier 1 capital 5.5 Leverage exposure 98.3 Leverage ratio 5.6% Minimum capital requirements (discussed further on page 15) are 7.9% CET1, 9.4% Tier 1 and 11.4% total capital.
Page
Presentation of information 6
Risk management framework
Ring-fencing – capital and risk profile 6
Introduction 7
Risk culture 7
Risk governance 8
Risk appetite 9
Risk controls and limits 10
Risk identification, measurement, treatment and mitigation 10
Risk assurance 10
Model risk 10
Stress testing 11
Capital, liquidity and funding risk
Definition and sources 13
Key developments and liquidity portfolio 13
Capital, liquidity and funding management 13
Minimum requirements 15
Credit risk
Definition and sources 19
Risk governance and appetite 19
Risk controls, measurement and models 19
Risk mitigation 19
Risk assessment and monitoring 20
Banking activities 28
Key IFRS 9 terms and differences 39
Non–traded market risk 41
Compliance & conduct risk 43
Financial crime 44
Operational risk 44
Business risk 45
Reputational risk 46
Capital and risk management
7 RBS plc Annual Report and Accounts 2018
Riskculture
Businessstrategy
Risk identification
Riskappetite
Capability, people &
Infrastructure
Measurement, evaluation &transparency
Control definition &
effectiveness
Response
Governance
Stress & scenario analysis
RBS Group’s strategy is informed and shaped by
an understanding of the risks it faces
RBS Group is able to absorb shocks and is
prepared to manage new, emerging and unforeseen
risks
RBS Group continually improves how risk is managed,
by taking action where necessary
RBS Group has the appropriate
policies and controls embedded in the
business to manage the risks it takes
RBS Group understands
and communicates the financial and
non-financial risks it is taking RBS Group has the tools
and capability to support risk management and
decision-making across the organisation
Ensuring RBS Group is confident the
right decisions are being taken, by the
right people, at the right time
Defining the level of risk which RBS Group is willing to
accept
RBS Group identifies the
risks that arise as a result of running
its business and delivering
its strategy
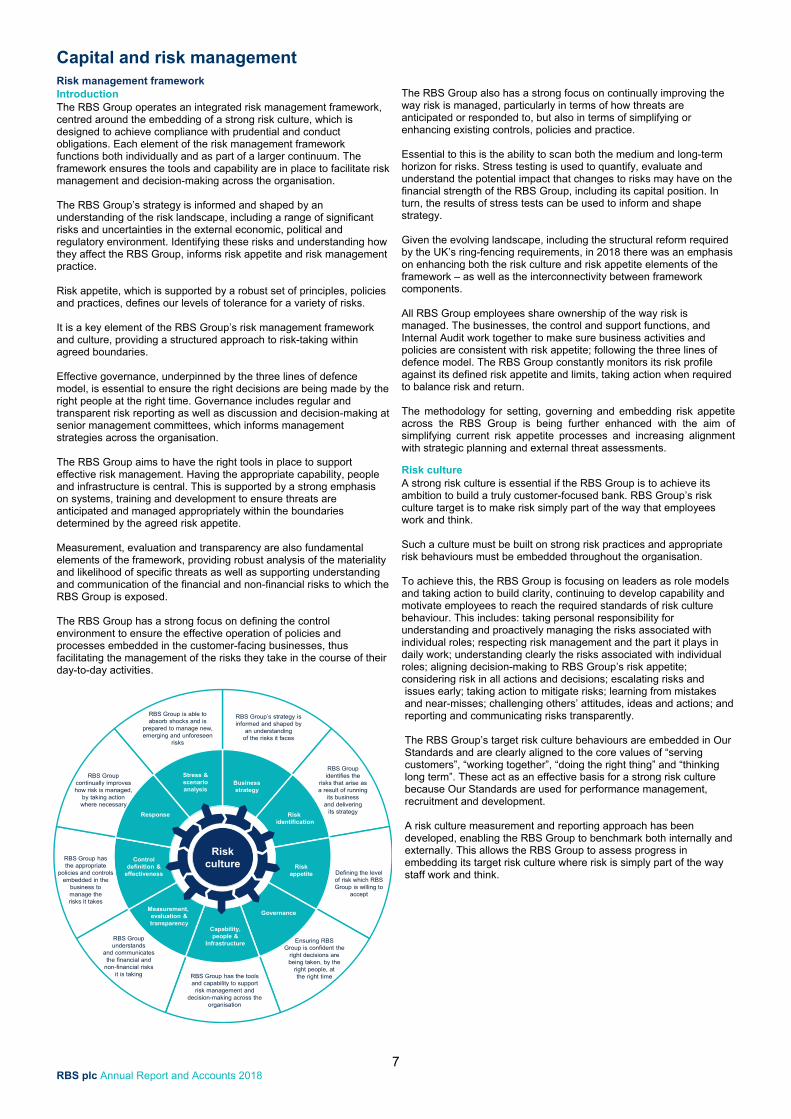
Risk management framework Introduction The RBS Group operates an integrated risk management framework, centred around the embedding of a strong risk culture, which is designed to achieve compliance with prudential and conduct obligations. Each element of the risk management framework functions both individually and as part of a larger continuum. The framework ensures the tools and capability are in place to facilitate risk management and decision-making across the organisation. The RBS Group’s strategy is informed and shaped by an understanding of the risk landscape, including a range of significant risks and uncertainties in the external economic, political and regulatory environment. Identifying these risks and understanding how they affect the RBS Group, informs risk appetite and risk management practice. Risk appetite, which is supported by a robust set of principles, policies and practices, defines our levels of tolerance for a variety of risks. It is a key element of the RBS Group’s risk management framework and culture, providing a structured approach to risk-taking within agreed boundaries. Effective governance, underpinned by the three lines of defence model, is essential to ensure the right decisions are being made by the right people at the right time. Governance includes regular and transparent risk reporting as well as discussion and decision-making at senior management committees, which informs management strategies across the organisation. The RBS Group aims to have the right tools in place to support effective risk management. Having the appropriate capability, people and infrastructure is central. This is supported by a strong emphasis on systems, training and development to ensure threats are anticipated and managed appropriately within the boundaries determined by the agreed risk appetite. Measurement, evaluation and transparency are also fundamental elements of the framework, providing robust analysis of the materiality and likelihood of specific threats as well as supporting understanding and communication of the financial and non-financial risks to which the RBS Group is exposed. The RBS Group has a strong focus on defining the control environment to ensure the effective operation of policies and processes embedded in the customer-facing businesses, thus facilitating the management of the risks they take in the course of their day-to-day activities.
The RBS Group also has a strong focus on continually improving the way risk is managed, particularly in terms of how threats are anticipated or responded to, but also in terms of simplifying or enhancing existing controls, policies and practice. Essential to this is the ability to scan both the medium and long-term horizon for risks. Stress testing is used to quantify, evaluate and understand the potential impact that changes to risks may have on the financial strength of the RBS Group, including its capital position. In turn, the results of stress tests can be used to inform and shape strategy. Given the evolving landscape, including the structural reform required by the UK’s ring-fencing requirements, in 2018 there was an emphasis on enhancing both the risk culture and risk appetite elements of the framework – as well as the interconnectivity between framework components. All RBS Group employees share ownership of the way risk is managed. The businesses, the control and support functions, and Internal Audit work together to make sure business activities and policies are consistent with risk appetite; following the three lines of defence model. The RBS Group constantly monitors its risk profile against its defined risk appetite and limits, taking action when required to balance risk and return. The methodology for setting, governing and embedding risk appetite across the RBS Group is being further enhanced with the aim of simplifying current risk appetite processes and increasing alignment with strategic planning and external threat assessments.
Risk culture A strong risk culture is essential if the RBS Group is to achieve its ambition to build a truly customer-focused bank. RBS Group’s risk culture target is to make risk simply part of the way that employees work and think. Such a culture must be built on strong risk practices and appropriate risk behaviours must be embedded throughout the organisation. To achieve this, the RBS Group is focusing on leaders as role models and taking action to build clarity, continuing to develop capability and motivate employees to reach the required standards of risk culture behaviour. This includes: taking personal responsibility for understanding and proactively managing the risks associated with individual roles; respecting risk management and the part it plays in daily work; understanding clearly the risks associated with individual roles; aligning decision-making to RBS Group’s risk appetite; considering risk in all actions and decisions; escalating risks and issues early; taking action to mitigate risks; learning from mistakes and near-misses; challenging others’ attitudes, ideas and actions; and reporting and communicating risks transparently. The RBS Group’s target risk culture behaviours are embedded in Our Standards and are clearly aligned to the core values of “serving customers”, “working together”, “doing the right thing” and “thinking long term”. These act as an effective basis for a strong risk culture because Our Standards are used for performance management, recruitment and development. A risk culture measurement and reporting approach has been developed, enabling the RBS Group to benchmark both internally and externally. This allows the RBS Group to assess progress in embedding its target risk culture where risk is simply part of the way staff work and think.
Capital and risk management
8 RBS plc Annual Report and Accounts 2018
Risk management framework continued Training Enabling employees to have the capabilities and confidence to manage risk is core to the RBS Group’s learning strategy. The RBS Group offers a wide range of risk learning, both technical and behavioural, across the risk disciplines. This training can be mandatory, role-specific or for personal development.
Code of Conduct Aligned to the RBS Group’s values is the Code of Conduct. The code provides guidance on expected behaviour and sets out the standards of conduct that support the values. It explains the effect of decisions that are taken and describes the principles that must be followed.
These principles cover conduct-related issues as well as wider business activities. They focus on desired outcomes, with practical guidelines to align the values with commercial strategy and actions. The embedding of these principles facilitates sound decision-making and a clear focus on good customer outcomes. A simple decision-making guide – the “YES check” – has been included in the Code of Conduct. It is a simple set of five questions, designed to ensure the RBS Group values guide day-to-day decisions:
Does what I am doing keep our customers and the RBS Group safe and secure?
Would customers and colleagues say I am acting with integrity?
Am I happy with how this would be perceived on the outside?
Is what I am doing meeting the standards of conduct required?
In five years’ time would others see this as a good way to work?
Each of the five questions is a prompt to think about how the situation fits with the RBS Group’s values. It ensures that employees can think through decisions that do not have a clear answer, and guides their judgements.
If conduct falls short of the RBS Group’s required standards, the accountability review process is used to assess how this should be reflected in pay outcomes for those individuals concerned. RBS Group-wide remuneration policy ensures that the remuneration arrangements for all employees reflect the principles and standards prescribed by the PRA rulebook and the FCA handbook. Any employee falling short of the expected standards would also be subject to internal disciplinary policies and procedures. If appropriate, the relevant authority would be notified.
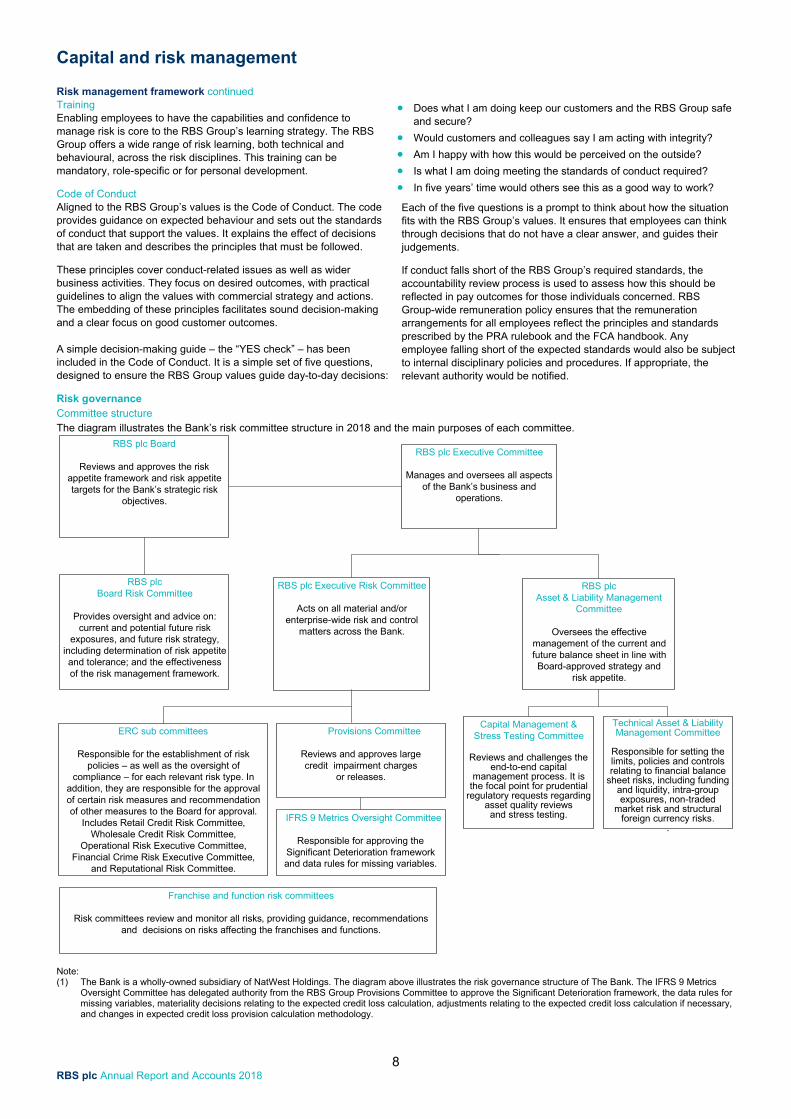
Risk governance Committee structure The diagram illustrates the Bank’s risk committee structure in 2018 and the main purposes of each committee.
RBS plc Executive Risk Committee
Acts on all material and/or enterprise-wide risk and control
matters across the Bank.
RBS plc Executive Committee
Manages and oversees all aspects of the Bank’s business and
operations.
RBS plc Board
Reviews and approves the risk appetite framework and risk appetite targets for the Bank’s strategic risk
objectives.
RBS plcBoard Risk Committee
Provides oversight and advice on: current and potential future risk
exposures, and future risk strategy, including determination of risk appetite and tolerance; and the effectiveness of the risk management framework.
Provisions Committee
Reviews and approves large credit impairment charges
or releases.
IFRS 9 Metrics Oversight Committee
Responsible for approving the Significant Deterioration framework and data rules for missing variables.
RBS plcAsset & Liability Management
Committee
Oversees the effective management of the current and future balance sheet in line with Board-approved strategy and
risk appetite.
Capital Management & Stress Testing Committee
Reviews and challenges the end-to-end capital
management process. It is the focal point for prudential
regulatory requests regarding asset quality reviewsand stress testing.
Technical Asset & Liability Management Committee
Responsible for setting the limits, policies and controls relating to financial balance
sheet risks, including funding and liquidity, intra-group exposures, non-traded
market risk and structural foreign currency risks.
.
ERC sub committees
Responsible for the establishment of risk policies – as well as the oversight of
compliance – for each relevant risk type. In addition, they are responsible for the approval of certain risk measures and recommendation of other measures to the Board for approval.
Includes Retail Credit Risk Committee, Wholesale Credit Risk Committee,
Operational Risk Executive Committee, Financial Crime Risk Executive Committee,
and Reputational Risk Committee.
Franchise and function risk committees
Risk committees review and monitor all risks, providing guidance, recommendations and decisions on risks affecting the franchises and functions.
Note: (1) The Bank is a wholly-owned subsidiary of NatWest Holdings. The diagram above illustrates the risk governance structure of The Bank. The IFRS 9 Metrics
Oversight Committee has delegated authority from the RBS Group Provisions Committee to approve the Significant Deterioration framework, the data rules for missing variables, materiality decisions relating to the expected credit loss calculation, adjustments relating to the expected credit loss calculation if necessary, and changes in expected credit loss provision calculation methodology.
Capital and risk management
9 RBS plc Annual Report and Accounts 2018
Risk management framework continued
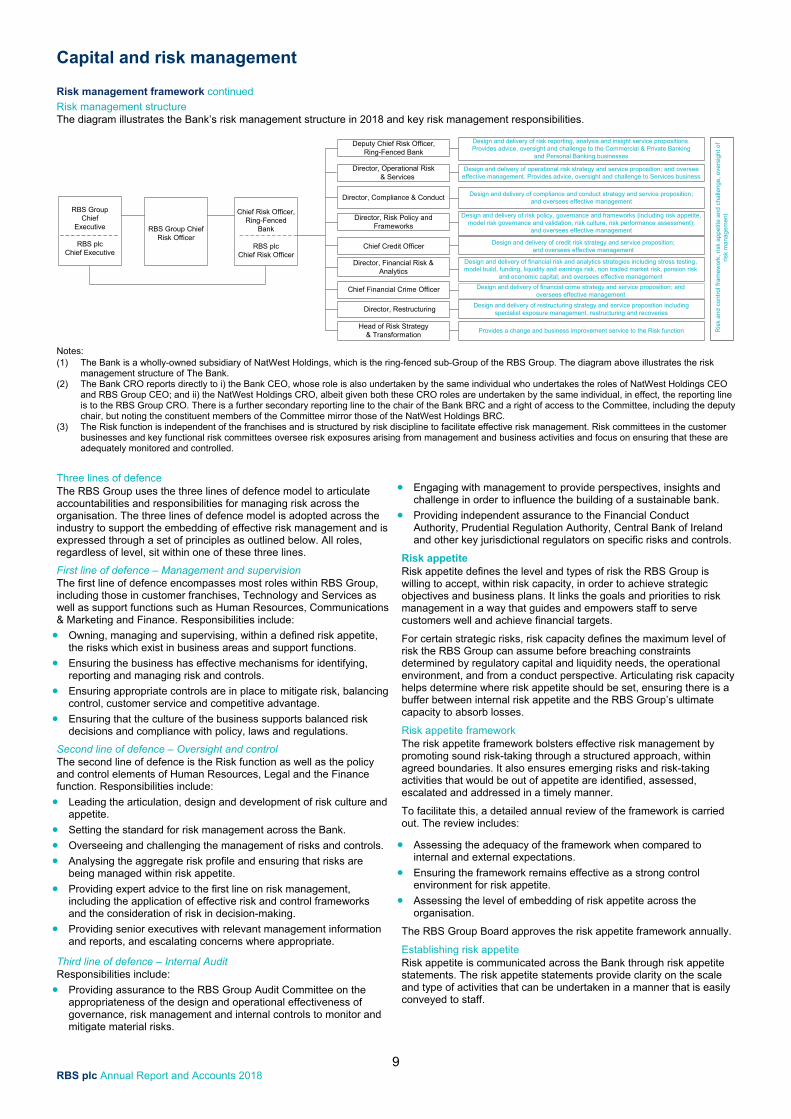
Risk management structure The diagram illustrates the Bank’s risk management structure in 2018 and key risk management responsibilities.
Design and delivery of risk policy, governance and frameworks (including risk appetite, model risk governance and validation, risk culture, risk performance assessment);
and oversees effective management
Provides a change and business improvement service to the Risk function
Design and delivery of operational risk strategy and service proposition; and oversee effective management. Provides advice, oversight and challenge to Services business
Design and delivery of financial crime strategy and service proposition; and oversees effective management
Design and delivery of restructuring strategy and service proposition including specialist exposure management, restructuring and recoveries
Chief Financial Crime Officer
Director, Restructuring
Head of Risk Strategy & Transformation
Director, Risk Policy and Frameworks
Director, Operational Risk & Services
Ris
k a
nd
con
tro
l fra
mew
ork
, ris
k a
pp
etite
and
ch
alle
ng
e, o
vers
ight
of
risk
man
agem
ent
Director, Financial Risk & Analytics
Design and delivery of financial risk and analytics strategies including stress testing, model build, funding, liquidity and earnings risk, non traded market risk, pension risk
and economic capital; and oversees effective management
Design and delivery of credit risk strategy and service proposition; and oversees effective management
Chief Credit Officer
Deputy Chief Risk Officer, Ring-Fenced Bank
Design and delivery of risk reporting, analysis and insight service propositions. Provides advice, oversight and challenge to the Commercial & Private Banking
and Personal Banking businesses
Director, Compliance & Conduct Design and delivery of compliance and conduct strategy and service proposition;and oversees effective management
RBS GroupChief
Executive
RBS plc Chief Executive
Chief Risk Officer,Ring-Fenced
Bank
RBS plc Chief Risk Officer
RBS Group ChiefRisk Officer
Notes: (1) The Bank is a wholly-owned subsidiary of NatWest Holdings, which is the ring-fenced sub-Group of the RBS Group. The diagram above illustrates the risk
management structure of The Bank. (2) The Bank CRO reports directly to i) the Bank CEO, whose role is also undertaken by the same individual who undertakes the roles of NatWest Holdings CEO
and RBS Group CEO; and ii) the NatWest Holdings CRO, albeit given both these CRO roles are undertaken by the same individual, in effect, the reporting line is to the RBS Group CRO. There is a further secondary reporting line to the chair of the Bank BRC and a right of access to the Committee, including the deputy chair, but noting the constituent members of the Committee mirror those of the NatWest Holdings BRC.
(3) The Risk function is independent of the franchises and is structured by risk discipline to facilitate effective risk management. Risk committees in the customer businesses and key functional risk committees oversee risk exposures arising from management and business activities and focus on ensuring that these are adequately monitored and controlled.
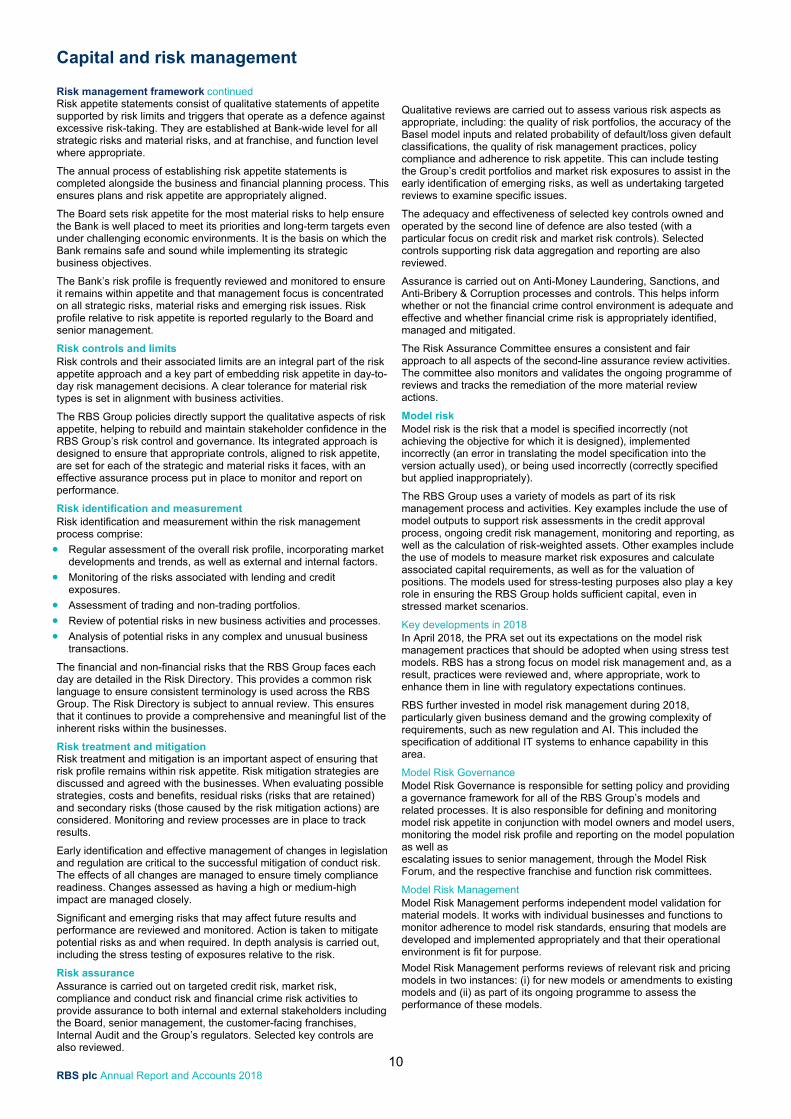
Three lines of defence The RBS Group uses the three lines of defence model to articulate accountabilities and responsibilities for managing risk across the organisation. The three lines of defence model is adopted across the industry to support the embedding of effective risk management and is expressed through a set of principles as outlined below. All roles, regardless of level, sit within one of these three lines.
First line of defence – Management and supervision The first line of defence encompasses most roles within RBS Group, including those in customer franchises, Technology and Services as well as support functions such as Human Resources, Communications & Marketing and Finance. Responsibilities include:
Owning, managing and supervising, within a defined risk appetite, the risks which exist in business areas and support functions.
Ensuring the business has effective mechanisms for identifying, reporting and managing risk and controls.
Ensuring appropriate controls are in place to mitigate risk, balancing control, customer service and competitive advantage.
Ensuring that the culture of the business supports balanced risk decisions and compliance with policy, laws and regulations.
Second line of defence – Oversight and control The second line of defence is the Risk function as well as the policy and control elements of Human Resources, Legal and the Finance function. Responsibilities include:
Leading the articulation, design and development of risk culture and appetite.
Setting the standard for risk management across the Bank.
Overseeing and challenging the management of risks and controls.
Analysing the aggregate risk profile and ensuring that risks are being managed within risk appetite.
Providing expert advice to the first line on risk management, including the application of effective risk and control frameworks and the consideration of risk in decision-making.
Providing senior executives with relevant management information and reports, and escalating concerns where appropriate.
Third line of defence – Internal Audit Responsibilities include:
Providing assurance to the RBS Group Audit Committee on the appropriateness of the design and operational effectiveness of governance, risk management and internal controls to monitor and mitigate material risks.
Engaging with management to provide perspectives, insights and challenge in order to influence the building of a sustainable bank.
Providing independent assurance to the Financial Conduct Authority, Prudential Regulation Authority, Central Bank of Ireland and other key jurisdictional regulators on specific risks and controls.
Risk appetite Risk appetite defines the level and types of risk the RBS Group is willing to accept, within risk capacity, in order to achieve strategic objectives and business plans. It links the goals and priorities to risk management in a way that guides and empowers staff to serve customers well and achieve financial targets. For certain strategic risks, risk capacity defines the maximum level of risk the RBS Group can assume before breaching constraints determined by regulatory capital and liquidity needs, the operational environment, and from a conduct perspective. Articulating risk capacity helps determine where risk appetite should be set, ensuring there is a buffer between internal risk appetite and the RBS Group’s ultimate capacity to absorb losses. Risk appetite framework The risk appetite framework bolsters effective risk management by promoting sound risk-taking through a structured approach, within agreed boundaries. It also ensures emerging risks and risk-taking activities that would be out of appetite are identified, assessed, escalated and addressed in a timely manner. To facilitate this, a detailed annual review of the framework is carried out. The review includes: Assessing the adequacy of the framework when compared to
internal and external expectations.
Ensuring the framework remains effective as a strong control environment for risk appetite.
Assessing the level of embedding of risk appetite across the organisation.
The RBS Group Board approves the risk appetite framework annually. Establishing risk appetite Risk appetite is communicated across the Bank through risk appetite statements. The risk appetite statements provide clarity on the scale and type of activities that can be undertaken in a manner that is easily conveyed to staff.
Capital and risk management
10 RBS plc Annual Report and Accounts 2018
Risk management framework continued Risk appetite statements consist of qualitative statements of appetite supported by risk limits and triggers that operate as a defence against excessive risk-taking. They are established at Bank-wide level for all strategic risks and material risks, and at franchise, and function level where appropriate. The annual process of establishing risk appetite statements is completed alongside the business and financial planning process. This ensures plans and risk appetite are appropriately aligned. The Board sets risk appetite for the most material risks to help ensure the Bank is well placed to meet its priorities and long-term targets even under challenging economic environments. It is the basis on which the Bank remains safe and sound while implementing its strategic business objectives. The Bank’s risk profile is frequently reviewed and monitored to ensure it remains within appetite and that management focus is concentrated on all strategic risks, material risks and emerging risk issues. Risk profile relative to risk appetite is reported regularly to the Board and senior management. Risk controls and limits Risk controls and their associated limits are an integral part of the risk appetite approach and a key part of embedding risk appetite in day-to-day risk management decisions. A clear tolerance for material risk types is set in alignment with business activities. The RBS Group policies directly support the qualitative aspects of risk appetite, helping to rebuild and maintain stakeholder confidence in the RBS Group’s risk control and governance. Its integrated approach is designed to ensure that appropriate controls, aligned to risk appetite, are set for each of the strategic and material risks it faces, with an effective assurance process put in place to monitor and report on performance. Risk identification and measurement Risk identification and measurement within the risk management process comprise:
Regular assessment of the overall risk profile, incorporating market developments and trends, as well as external and internal factors.
Monitoring of the risks associated with lending and credit exposures.
Assessment of trading and non-trading portfolios.
Review of potential risks in new business activities and processes.
Analysis of potential risks in any complex and unusual business transactions.
The financial and non-financial risks that the RBS Group faces each day are detailed in the Risk Directory. This provides a common risk language to ensure consistent terminology is used across the RBS Group. The Risk Directory is subject to annual review. This ensures that it continues to provide a comprehensive and meaningful list of the inherent risks within the businesses. Risk treatment and mitigation Risk treatment and mitigation is an important aspect of ensuring that risk profile remains within risk appetite. Risk mitigation strategies are discussed and agreed with the businesses. When evaluating possible strategies, costs and benefits, residual risks (risks that are retained) and secondary risks (those caused by the risk mitigation actions) are considered. Monitoring and review processes are in place to track results.
Early identification and effective management of changes in legislation and regulation are critical to the successful mitigation of conduct risk. The effects of all changes are managed to ensure timely compliance readiness. Changes assessed as having a high or medium-high impact are managed closely. Significant and emerging risks that may affect future results and performance are reviewed and monitored. Action is taken to mitigate potential risks as and when required. In depth analysis is carried out, including the stress testing of exposures relative to the risk. Risk assurance Assurance is carried out on targeted credit risk, market risk, compliance and conduct risk and financial crime risk activities to provide assurance to both internal and external stakeholders including the Board, senior management, the customer-facing franchises, Internal Audit and the Group’s regulators. Selected key controls are also reviewed.
Qualitative reviews are carried out to assess various risk aspects as appropriate, including: the quality of risk portfolios, the accuracy of the Basel model inputs and related probability of default/loss given default classifications, the quality of risk management practices, policy compliance and adherence to risk appetite. This can include testing the Group’s credit portfolios and market risk exposures to assist in the early identification of emerging risks, as well as undertaking targeted reviews to examine specific issues. The adequacy and effectiveness of selected key controls owned and operated by the second line of defence are also tested (with a particular focus on credit risk and market risk controls). Selected controls supporting risk data aggregation and reporting are also reviewed. Assurance is carried out on Anti-Money Laundering, Sanctions, and Anti-Bribery & Corruption processes and controls. This helps inform whether or not the financial crime control environment is adequate and effective and whether financial crime risk is appropriately identified, managed and mitigated. The Risk Assurance Committee ensures a consistent and fair approach to all aspects of the second-line assurance review activities. The committee also monitors and validates the ongoing programme of reviews and tracks the remediation of the more material review actions. Model risk Model risk is the risk that a model is specified incorrectly (not achieving the objective for which it is designed), implemented incorrectly (an error in translating the model specification into the version actually used), or being used incorrectly (correctly specified but applied inappropriately). The RBS Group uses a variety of models as part of its risk management process and activities. Key examples include the use of model outputs to support risk assessments in the credit approval process, ongoing credit risk management, monitoring and reporting, as well as the calculation of risk-weighted assets. Other examples include the use of models to measure market risk exposures and calculate associated capital requirements, as well as for the valuation of positions. The models used for stress-testing purposes also play a key role in ensuring the RBS Group holds sufficient capital, even in stressed market scenarios. Key developments in 2018 In April 2018, the PRA set out its expectations on the model risk management practices that should be adopted when using stress test models. RBS has a strong focus on model risk management and, as a result, practices were reviewed and, where appropriate, work to enhance them in line with regulatory expectations continues. RBS further invested in model risk management during 2018, particularly given business demand and the growing complexity of requirements, such as new regulation and AI. This included the specification of additional IT systems to enhance capability in this area. Model Risk Governance Model Risk Governance is responsible for setting policy and providing a governance framework for all of the RBS Group’s models and related processes. It is also responsible for defining and monitoring model risk appetite in conjunction with model owners and model users, monitoring the model risk profile and reporting on the model population as well as escalating issues to senior management, through the Model Risk Forum, and the respective franchise and function risk committees. Model Risk Management Model Risk Management performs independent model validation for material models. It works with individual businesses and functions to monitor adherence to model risk standards, ensuring that models are developed and implemented appropriately and that their operational environment is fit for purpose.
Model Risk Management performs reviews of relevant risk and pricing models in two instances: (i) for new models or amendments to existing models and (ii) as part of its ongoing programme to assess the performance of these models.
Capital and risk management
11 RBS plc Annual Report and Accounts 2018
Stress testing usage within
RBS
(4)Risk
Mitigation
(1)StrategicFinancial& CapitalPlanning
(2)Risk
Appetite
(3)Risk
Identification
Financialperformance assessment
Capitaladequacy
Earningsvolatility
Sector review& credit limit
setting
Businessvulnerabilities
analysis
Tail-riskassessment
Earlywarning
indicators
Contingencyplanning & management
actions
Risk management framework continued Model Risk Management reviews may test and challenge the logic and conceptual soundness of the methodology, or the assumptions underlying a model. Reviews may also test whether or not all appropriate risks have been sufficiently captured as well as checking the accuracy and robustness of calculations.
Based on the review and findings from Model Risk Management, the RBS Group’s model or risk committees consider whether a model can be approved for use. Models used for regulatory reporting may additionally require regulatory approval before implementation.
Model Risk Management reassesses the appropriateness of approved risk models on a periodic basis. Each periodic review begins with an initial assessment. Based on the initial assessment, an internal model governance committee will decide to re-ratify a model or to carry out additional work.
In the initial assessment, Model Risk Management assesses factors such as a change in the size or composition of the portfolio, market changes, the performance of – or any amendments to – the model and the status of any outstanding issues or scheduled activities carried over from previous reviews.
Model Risk Management also monitors the performance of the RBS Group’s portfolio of models to ensure they appropriately capture underlying business rationale.
Stress testing Stress testing – capital management Stress testing is a key risk management tool and a fundamental component of the RBS Group’s approach to capital management. It is used to quantify, evaluate and understand the potential impact of specified changes to risk factors on the financial strength of the RBS Group, including its capital position. Stress testing includes:
Scenario testing, which examines the impact of a hypothetical future state to define changes in risk factors
Sensitivity testing, which examines the impact of an incremental change to one or more risk factors.
The process for stress testing consists of four broad stages:
Define
scenarios
Identify the RBS Group-specific vulnerabilities and risks.
Define and calibrate scenarios to examine risks and vulnerabilities.
Formal governance process to agree scenarios.
Assess impact
Translate scenarios into risk drivers.
Assess impact to positions, income and costs.
Impact assessment captures input from across the RBS Group.
Calculate results and
assess implications
Aggregate impacts into overall results.
Results form part of risk management process.
Scenario results are used to inform the RBS Group’s business and capital plans.
Develop and agree
management actions
Scenario results are analysed by subject matter experts and appropriate management actions are then developed.
Scenario results and management actions are reviewed and agreed by senior management through executive committees including Executive Risk Committee, Board Risk Committee and the Board.
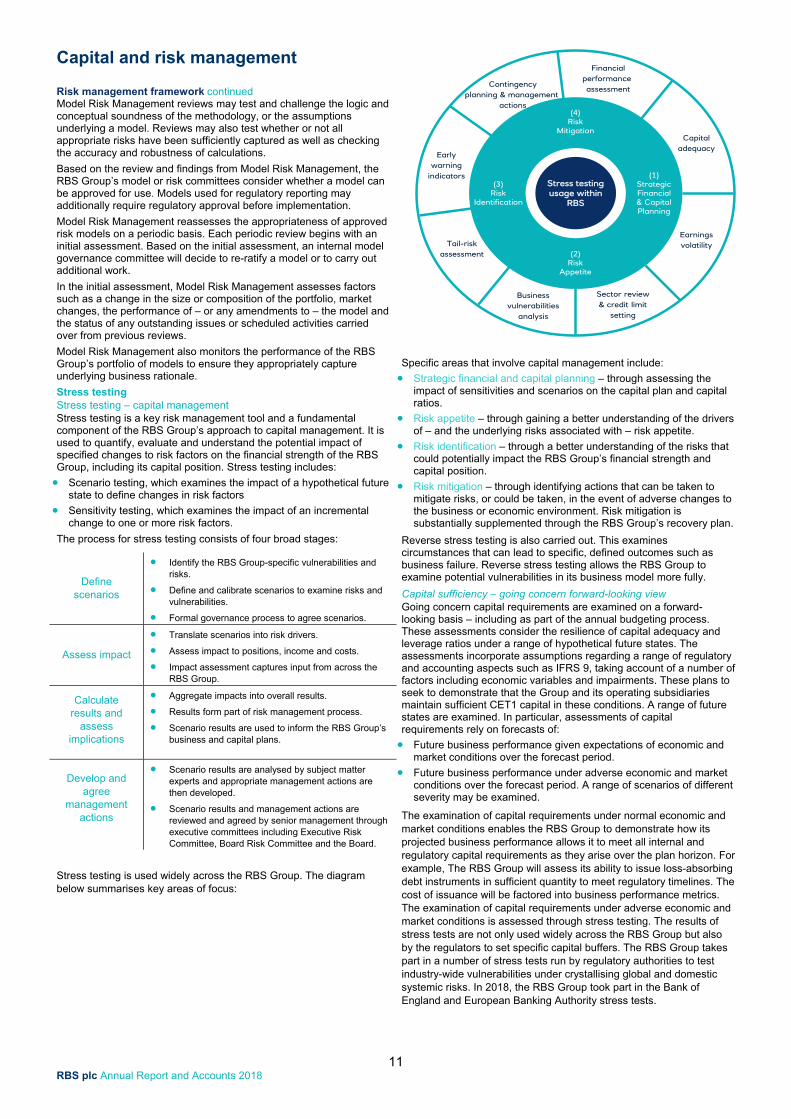
Stress testing is used widely across the RBS Group. The diagram below summarises key areas of focus:
Specific areas that involve capital management include:
Strategic financial and capital planning – through assessing the impact of sensitivities and scenarios on the capital plan and capital ratios.
Risk appetite – through gaining a better understanding of the drivers of – and the underlying risks associated with – risk appetite.
Risk identification – through a better understanding of the risks that could potentially impact the RBS Group’s financial strength and capital position.
Risk mitigation – through identifying actions that can be taken to mitigate risks, or could be taken, in the event of adverse changes to the business or economic environment. Risk mitigation is substantially supplemented through the RBS Group’s recovery plan.
Reverse stress testing is also carried out. This examines circumstances that can lead to specific, defined outcomes such as business failure. Reverse stress testing allows the RBS Group to examine potential vulnerabilities in its business model more fully. Capital sufficiency – going concern forward-looking view Going concern capital requirements are examined on a forward-looking basis – including as part of the annual budgeting process. These assessments consider the resilience of capital adequacy and leverage ratios under a range of hypothetical future states. The assessments incorporate assumptions regarding a range of regulatory and accounting aspects such as IFRS 9, taking account of a number of factors including economic variables and impairments. These plans to seek to demonstrate that the Group and its operating subsidiaries maintain sufficient CET1 capital in these conditions. A range of future states are examined. In particular, assessments of capital requirements rely on forecasts of:
Future business performance given expectations of economic and market conditions over the forecast period.
Future business performance under adverse economic and market conditions over the forecast period. A range of scenarios of different severity may be examined.
The examination of capital requirements under normal economic and market conditions enables the RBS Group to demonstrate how its projected business performance allows it to meet all internal and regulatory capital requirements as they arise over the plan horizon. For example, The RBS Group will assess its ability to issue loss-absorbing debt instruments in sufficient quantity to meet regulatory timelines. The cost of issuance will be factored into business performance metrics. The examination of capital requirements under adverse economic and market conditions is assessed through stress testing. The results of stress tests are not only used widely across the RBS Group but also by the regulators to set specific capital buffers. The RBS Group takes part in a number of stress tests run by regulatory authorities to test industry-wide vulnerabilities under crystallising global and domestic systemic risks. In 2018, the RBS Group took part in the Bank of England and European Banking Authority stress tests.
Capital and risk management
12 RBS plc Annual Report and Accounts 2018
Risk management framework continued Under stress testing, IFRS 9 volatility can have a more material impact. This is because the peak-to-trough change in CET1 may be affected by the transitions from Stage 1 to Stage 2 in stress conditions. RBS uses stress and the peak-to-trough movements to help assess the amount of CET1 capital it needs to hold in stress conditions in accordance with the capital risk appetite framework.
Internal assessment of capital adequacy An internal assessment of material risks is carried out annually to enable an evaluation of the amount, type and distribution of capital required to cover these risks. This is referred to as the Internal Capital Adequacy Assessment Process (ICAAP). The ICAAP consists of a point-in-time assessment of the RBS Group’s exposures and risks at the end of the financial year together with a forward-looking stress capital assessment. The ICAAP is approved by the Board and submitted to the PRA. The ICAAP is used to form a view of capital adequacy separately to the minimum regulatory requirements. The ICAAP is used by the PRA to make an assessment of the RBS Group-specific capital requirements through the Pillar 2 framework. Capital allocation The RBS Group has mechanisms to allocate capital across its legal entities and businesses which aim to optimise the utilisation of capital resources taking into account applicable regulatory requirements, strategic and business objectives and risk appetite. The framework for allocating capital is approved by the Asset & Liability Management Committee. Governance Capital management is subject to substantial review and governance. Formal approval of capital management policies is either by the Asset & Liability Management Committee or by the Board on the recommendation of the Board Risk Committee. The Board approves the capital plans, including those for key legal entities and businesses as well as the results of the stress tests relating to those capital plans.
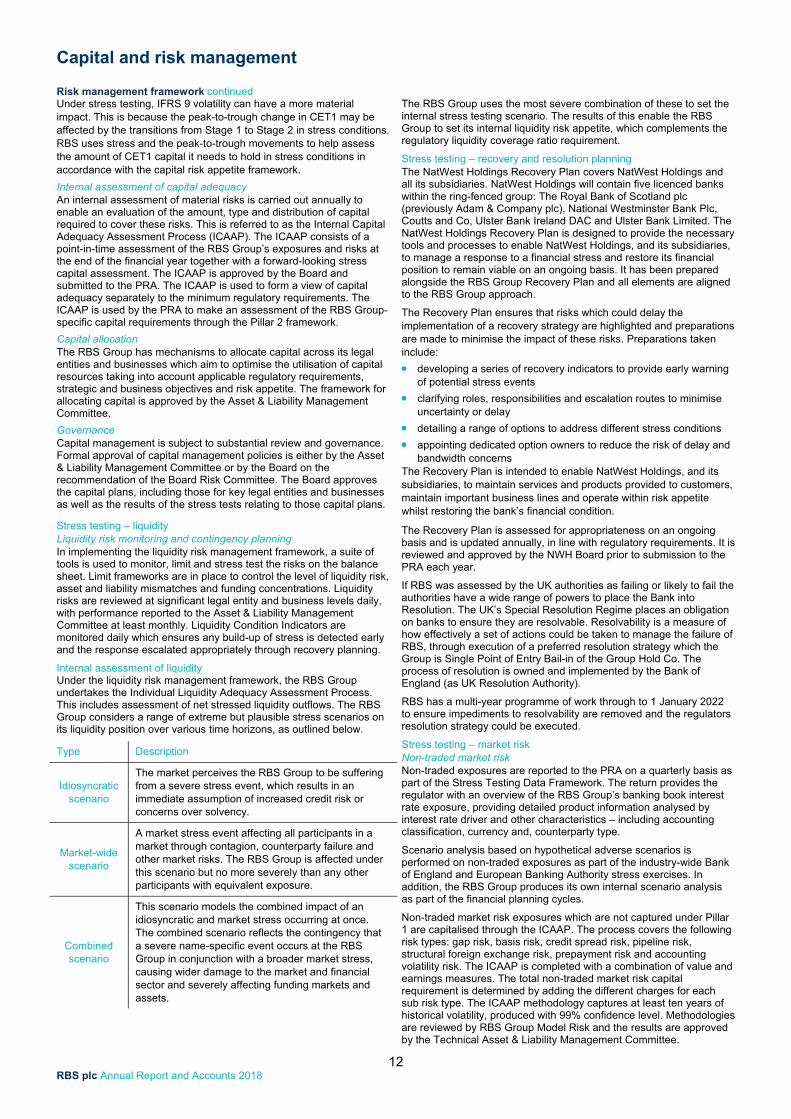
Stress testing – liquidity Liquidity risk monitoring and contingency planning In implementing the liquidity risk management framework, a suite of tools is used to monitor, limit and stress test the risks on the balance sheet. Limit frameworks are in place to control the level of liquidity risk, asset and liability mismatches and funding concentrations. Liquidity risks are reviewed at significant legal entity and business levels daily, with performance reported to the Asset & Liability Management Committee at least monthly. Liquidity Condition Indicators are monitored daily which ensures any build-up of stress is detected early and the response escalated appropriately through recovery planning. Internal assessment of liquidity Under the liquidity risk management framework, the RBS Group undertakes the Individual Liquidity Adequacy Assessment Process. This includes assessment of net stressed liquidity outflows. The RBS Group considers a range of extreme but plausible stress scenarios on its liquidity position over various time horizons, as outlined below.
Type Description
Idiosyncratic scenario
The market perceives the RBS Group to be suffering from a severe stress event, which results in an immediate assumption of increased credit risk or concerns over solvency.
Market-wide scenario
A market stress event affecting all participants in a market through contagion, counterparty failure and other market risks. The RBS Group is affected under this scenario but no more severely than any other participants with equivalent exposure.
Combined scenario
This scenario models the combined impact of an idiosyncratic and market stress occurring at once. The combined scenario reflects the contingency that a severe name-specific event occurs at the RBS Group in conjunction with a broader market stress, causing wider damage to the market and financial sector and severely affecting funding markets and assets.
The RBS Group uses the most severe combination of these to set the internal stress testing scenario. The results of this enable the RBS Group to set its internal liquidity risk appetite, which complements the regulatory liquidity coverage ratio requirement. Stress testing – recovery and resolution planning The NatWest Holdings Recovery Plan covers NatWest Holdings and all its subsidiaries. NatWest Holdings will contain five licenced banks within the ring-fenced group: The Royal Bank of Scotland plc (previously Adam & Company plc), National Westminster Bank Plc, Coutts and Co, Ulster Bank Ireland DAC and Ulster Bank Limited. The NatWest Holdings Recovery Plan is designed to provide the necessary tools and processes to enable NatWest Holdings, and its subsidiaries, to manage a response to a financial stress and restore its financial position to remain viable on an ongoing basis. It has been prepared alongside the RBS Group Recovery Plan and all elements are aligned to the RBS Group approach. The Recovery Plan ensures that risks which could delay the implementation of a recovery strategy are highlighted and preparations are made to minimise the impact of these risks. Preparations taken include:
developing a series of recovery indicators to provide early warning of potential stress events
clarifying roles, responsibilities and escalation routes to minimise uncertainty or delay
detailing a range of options to address different stress conditions
appointing dedicated option owners to reduce the risk of delay and bandwidth concerns
The Recovery Plan is intended to enable NatWest Holdings, and its subsidiaries, to maintain services and products provided to customers, maintain important business lines and operate within risk appetite whilst restoring the bank’s financial condition. The Recovery Plan is assessed for appropriateness on an ongoing basis and is updated annually, in line with regulatory requirements. It is reviewed and approved by the NWH Board prior to submission to the PRA each year. If RBS was assessed by the UK authorities as failing or likely to fail the authorities have a wide range of powers to place the Bank into Resolution. The UK’s Special Resolution Regime places an obligation on banks to ensure they are resolvable. Resolvability is a measure of how effectively a set of actions could be taken to manage the failure of RBS, through execution of a preferred resolution strategy which the Group is Single Point of Entry Bail-in of the Group Hold Co. The process of resolution is owned and implemented by the Bank of England (as UK Resolution Authority). RBS has a multi-year programme of work through to 1 January 2022 to ensure impediments to resolvability are removed and the regulators resolution strategy could be executed. Stress testing – market risk Non-traded market risk Non-traded exposures are reported to the PRA on a quarterly basis as part of the Stress Testing Data Framework. The return provides the regulator with an overview of the RBS Group’s banking book interest rate exposure, providing detailed product information analysed by interest rate driver and other characteristics – including accounting classification, currency and, counterparty type. Scenario analysis based on hypothetical adverse scenarios is performed on non-traded exposures as part of the industry-wide Bank of England and European Banking Authority stress exercises. In addition, the RBS Group produces its own internal scenario analysis as part of the financial planning cycles. Non-traded market risk exposures which are not captured under Pillar 1 are capitalised through the ICAAP. The process covers the following risk types: gap risk, basis risk, credit spread risk, pipeline risk, structural foreign exchange risk, prepayment risk and accounting volatility risk. The ICAAP is completed with a combination of value and earnings measures. The total non-traded market risk capital requirement is determined by adding the different charges for each sub risk type. The ICAAP methodology captures at least ten years of historical volatility, produced with 99% confidence level. Methodologies are reviewed by RBS Group Model Risk and the results are approved by the Technical Asset & Liability Management Committee.
Capital and risk management
13 RBS plc Annual Report and Accounts 2018
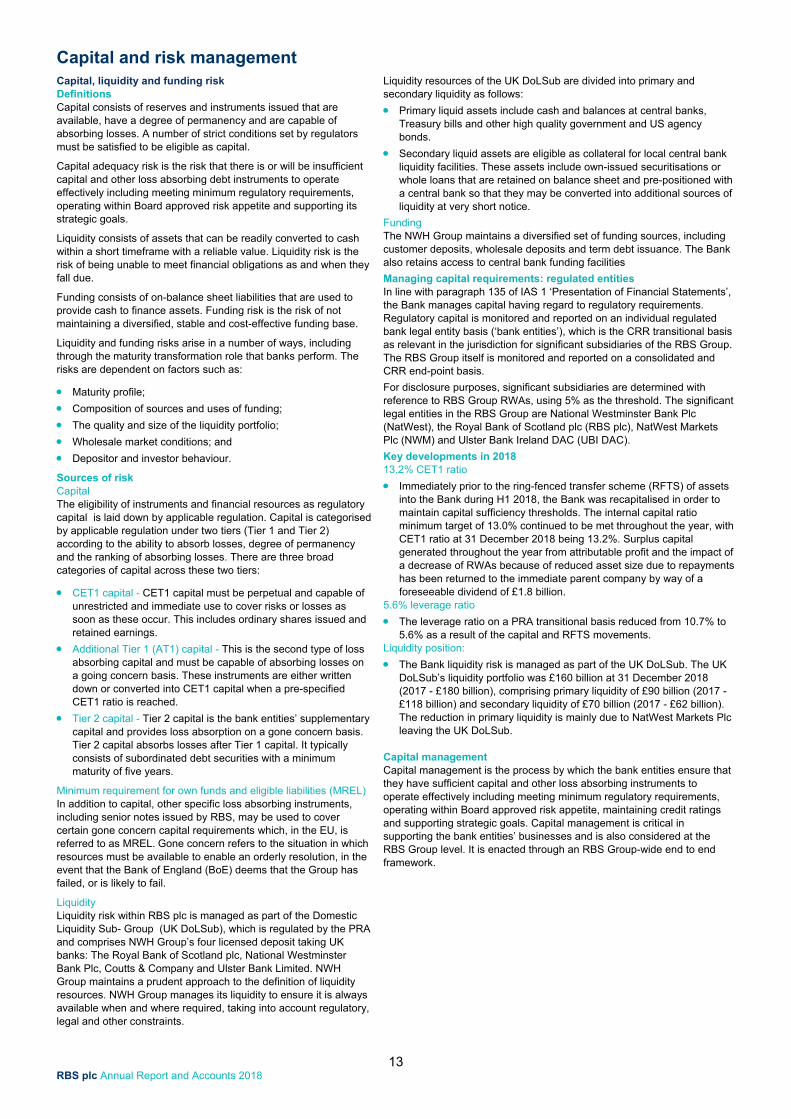
Capital, liquidity and funding risk Definitions
Capital consists of reserves and instruments issued that are available, have a degree of permanency and are capable of absorbing losses. A number of strict conditions set by regulators must be satisfied to be eligible as capital. Capital adequacy risk is the risk that there is or will be insufficient capital and other loss absorbing debt instruments to operate effectively including meeting minimum regulatory requirements, operating within Board approved risk appetite and supporting its strategic goals. Liquidity consists of assets that can be readily converted to cash within a short timeframe with a reliable value. Liquidity risk is the risk of being unable to meet financial obligations as and when they fall due. Funding consists of on-balance sheet liabilities that are used to provide cash to finance assets. Funding risk is the risk of not maintaining a diversified, stable and cost-effective funding base. Liquidity and funding risks arise in a number of ways, including through the maturity transformation role that banks perform. The risks are dependent on factors such as: Maturity profile;
Composition of sources and uses of funding;
The quality and size of the liquidity portfolio;
Wholesale market conditions; and
Depositor and investor behaviour. Sources of risk Capital The eligibility of instruments and financial resources as regulatory capital is laid down by applicable regulation. Capital is categorised by applicable regulation under two tiers (Tier 1 and Tier 2) according to the ability to absorb losses, degree of permanency and the ranking of absorbing losses. There are three broad categories of capital across these two tiers: CET1 capital - CET1 capital must be perpetual and capable of
unrestricted and immediate use to cover risks or losses as soon as these occur. This includes ordinary shares issued and retained earnings.
Additional Tier 1 (AT1) capital - This is the second type of loss absorbing capital and must be capable of absorbing losses on a going concern basis. These instruments are either written down or converted into CET1 capital when a pre-specified CET1 ratio is reached.
Tier 2 capital - Tier 2 capital is the bank entities’ supplementary capital and provides loss absorption on a gone concern basis. Tier 2 capital absorbs losses after Tier 1 capital. It typically consists of subordinated debt securities with a minimum maturity of five years.
Minimum requirement for own funds and eligible liabilities (MREL) In addition to capital, other specific loss absorbing instruments, including senior notes issued by RBS, may be used to cover certain gone concern capital requirements which, in the EU, is referred to as MREL. Gone concern refers to the situation in which resources must be available to enable an orderly resolution, in the event that the Bank of England (BoE) deems that the Group has failed, or is likely to fail. Liquidity Liquidity risk within RBS plc is managed as part of the Domestic Liquidity Sub- Group (UK DoLSub), which is regulated by the PRA and comprises NWH Group’s four licensed deposit taking UK banks: The Royal Bank of Scotland plc, National Westminster Bank Plc, Coutts & Company and Ulster Bank Limited. NWH Group maintains a prudent approach to the definition of liquidity resources. NWH Group manages its liquidity to ensure it is always available when and where required, taking into account regulatory, legal and other constraints.
Liquidity resources of the UK DoLSub are divided into primary and secondary liquidity as follows:
Primary liquid assets include cash and balances at central banks, Treasury bills and other high quality government and US agency bonds.
Secondary liquid assets are eligible as collateral for local central bank liquidity facilities. These assets include own-issued securitisations or whole loans that are retained on balance sheet and pre-positioned with a central bank so that they may be converted into additional sources of liquidity at very short notice.
Funding The NWH Group maintains a diversified set of funding sources, including customer deposits, wholesale deposits and term debt issuance. The Bank also retains access to central bank funding facilities
Managing capital requirements: regulated entities In line with paragraph 135 of IAS 1 ‘Presentation of Financial Statements’, the Bank manages capital having regard to regulatory requirements. Regulatory capital is monitored and reported on an individual regulated bank legal entity basis (‘bank entities’), which is the CRR transitional basis as relevant in the jurisdiction for significant subsidiaries of the RBS Group. The RBS Group itself is monitored and reported on a consolidated and CRR end-point basis.
For disclosure purposes, significant subsidiaries are determined with reference to RBS Group RWAs, using 5% as the threshold. The significant legal entities in the RBS Group are National Westminster Bank Plc (NatWest), the Royal Bank of Scotland plc (RBS plc), NatWest Markets Plc (NWM) and Ulster Bank Ireland DAC (UBI DAC).
Key developments in 2018 13.2% CET1 ratio
Immediately prior to the ring-fenced transfer scheme (RFTS) of assets into the Bank during H1 2018, the Bank was recapitalised in order to maintain capital sufficiency thresholds. The internal capital ratio minimum target of 13.0% continued to be met throughout the year, with CET1 ratio at 31 December 2018 being 13.2%. Surplus capital generated throughout the year from attributable profit and the impact of a decrease of RWAs because of reduced asset size due to repayments has been returned to the immediate parent company by way of a foreseeable dividend of £1.8 billion.
5.6% leverage ratio
The leverage ratio on a PRA transitional basis reduced from 10.7% to 5.6% as a result of the capital and RFTS movements.
Liquidity position:
The Bank liquidity risk is managed as part of the UK DoLSub. The UK DoLSub’s liquidity portfolio was £160 billion at 31 December 2018 (2017 - £180 billion), comprising primary liquidity of £90 billion (2017 - £118 billion) and secondary liquidity of £70 billion (2017 - £62 billion). The reduction in primary liquidity is mainly due to NatWest Markets Plc leaving the UK DoLSub.
Capital management Capital management is the process by which the bank entities ensure that they have sufficient capital and other loss absorbing instruments to operate effectively including meeting minimum regulatory requirements, operating within Board approved risk appetite, maintaining credit ratings and supporting strategic goals. Capital management is critical in supporting the bank entities’ businesses and is also considered at the RBS Group level. It is enacted through an RBS Group-wide end to end framework.
Capital and risk management
14 RBS plc Annual Report and Accounts 2018
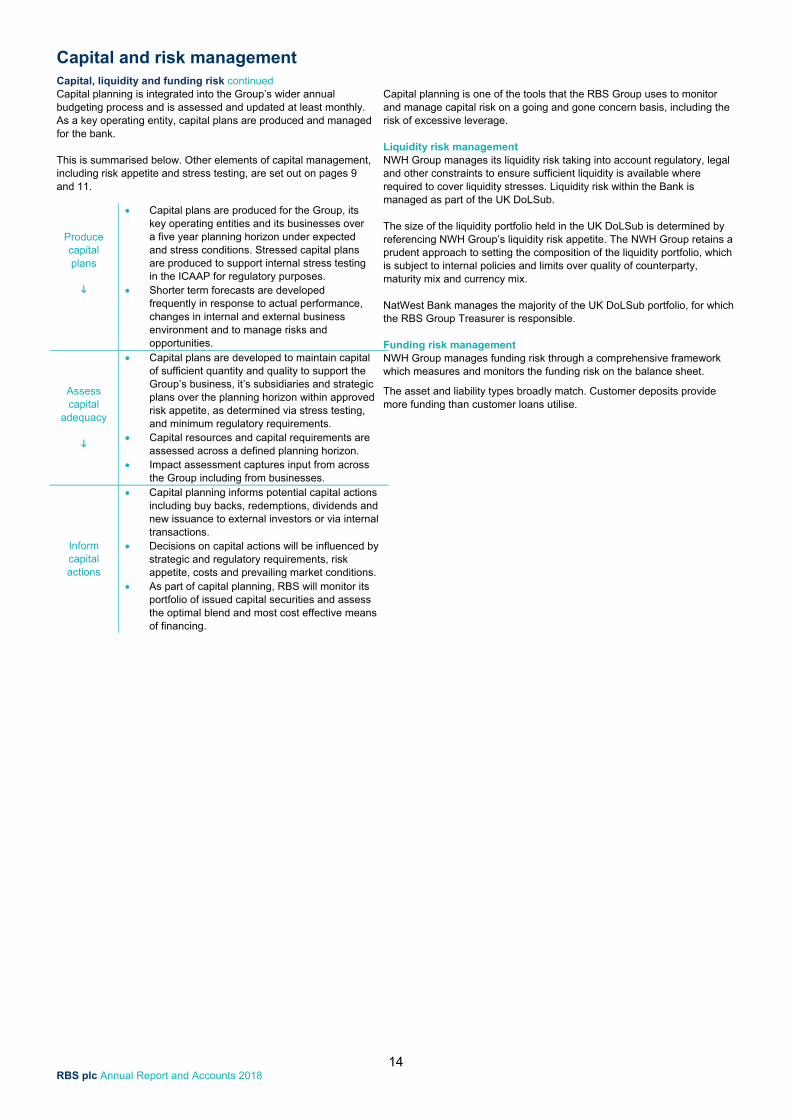
Capital, liquidity and funding risk continued Capital planning is integrated into the Group’s wider annual budgeting process and is assessed and updated at least monthly. As a key operating entity, capital plans are produced and managed for the bank. This is summarised below. Other elements of capital management, including risk appetite and stress testing, are set out on pages 9 and 11.
Produce capital plans
Capital plans are produced for the Group, its key operating entities and its businesses over a five year planning horizon under expected and stress conditions. Stressed capital plans are produced to support internal stress testing in the ICAAP for regulatory purposes.
Shorter term forecasts are developed frequently in response to actual performance, changes in internal and external business environment and to manage risks and opportunities.
Assess capital
adequacy
Capital plans are developed to maintain capital of sufficient quantity and quality to support the Group’s business, it’s subsidiaries and strategic plans over the planning horizon within approved risk appetite, as determined via stress testing, and minimum regulatory requirements.
Capital resources and capital requirements are assessed across a defined planning horizon.
Impact assessment captures input from across the Group including from businesses.
Inform capital actions
Capital planning informs potential capital actions including buy backs, redemptions, dividends and new issuance to external investors or via internal transactions.
Decisions on capital actions will be influenced by strategic and regulatory requirements, risk appetite, costs and prevailing market conditions.
As part of capital planning, RBS will monitor its portfolio of issued capital securities and assess the optimal blend and most cost effective means of financing.
Capital planning is one of the tools that the RBS Group uses to monitor and manage capital risk on a going and gone concern basis, including the risk of excessive leverage.
Liquidity risk management NWH Group manages its liquidity risk taking into account regulatory, legal and other constraints to ensure sufficient liquidity is available where required to cover liquidity stresses. Liquidity risk within the Bank is managed as part of the UK DoLSub. The size of the liquidity portfolio held in the UK DoLSub is determined by referencing NWH Group’s liquidity risk appetite. The NWH Group retains a prudent approach to setting the composition of the liquidity portfolio, which is subject to internal policies and limits over quality of counterparty, maturity mix and currency mix. NatWest Bank manages the majority of the UK DoLSub portfolio, for which the RBS Group Treasurer is responsible. Funding risk management NWH Group manages funding risk through a comprehensive framework which measures and monitors the funding risk on the balance sheet.
The asset and liability types broadly match. Customer deposits provide more funding than customer loans utilise.
Capital and risk management
15 RBS plc Annual Report and Accounts 2018
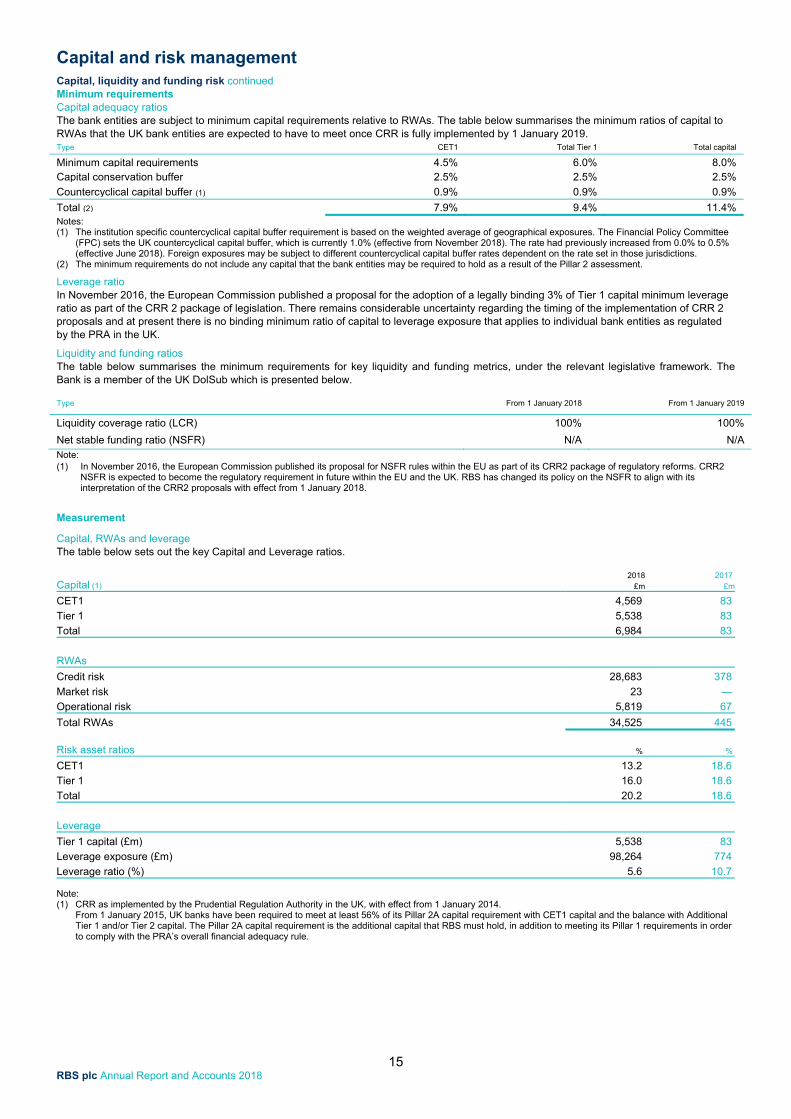
Capital, liquidity and funding risk continued Minimum requirements Capital adequacy ratios The bank entities are subject to minimum capital requirements relative to RWAs. The table below summarises the minimum ratios of capital to RWAs that the UK bank entities are expected to have to meet once CRR is fully implemented by 1 January 2019. Type CET1 Total Tier 1 Total capital
Minimum capital requirements 4.5% 6.0% 8.0% Capital conservation buffer 2.5% 2.5% 2.5%
Countercyclical capital buffer (1) 0.9% 0.9% 0.9%
Total (2) 7.9% 9.4% 11.4% Notes: (1) The institution specific countercyclical capital buffer requirement is based on the weighted average of geographical exposures. The Financial Policy Committee
(FPC) sets the UK countercyclical capital buffer, which is currently 1.0% (effective from November 2018). The rate had previously increased from 0.0% to 0.5% (effective June 2018). Foreign exposures may be subject to different countercyclical capital buffer rates dependent on the rate set in those jurisdictions.
(2) The minimum requirements do not include any capital that the bank entities may be required to hold as a result of the Pillar 2 assessment. Leverage ratio In November 2016, the European Commission published a proposal for the adoption of a legally binding 3% of Tier 1 capital minimum leverage ratio as part of the CRR 2 package of legislation. There remains considerable uncertainty regarding the timing of the implementation of CRR 2 proposals and at present there is no binding minimum ratio of capital to leverage exposure that applies to individual bank entities as regulated by the PRA in the UK. Liquidity and funding ratios The table below summarises the minimum requirements for key liquidity and funding metrics, under the relevant legislative framework. The Bank is a member of the UK DolSub which is presented below.
Type From 1 January 2018 From 1 January 2019
Liquidity coverage ratio (LCR) 100% 100%
Net stable funding ratio (NSFR) N/A N/A Note: (1) In November 2016, the European Commission published its proposal for NSFR rules within the EU as part of its CRR2 package of regulatory reforms. CRR2
NSFR is expected to become the regulatory requirement in future within the EU and the UK. RBS has changed its policy on the NSFR to align with its interpretation of the CRR2 proposals with effect from 1 January 2018.
Measurement
Capital, RWAs and leverage The table below sets out the key Capital and Leverage ratios.
Capital (1) 2018 2017
£m £m
CET1 4,569 83
Tier 1 5,538 83
Total 6,984 83
RWAs Credit risk 28,683 378
Market risk 23 —
Operational risk 5,819 67
Total RWAs 34,525 445
Risk asset ratios % %
CET1 13.2 18.6
Tier 1 16.0 18.6
Total 20.2 18.6
Leverage
Tier 1 capital (£m) 5,538 83
Leverage exposure (£m) 98,264 774
Leverage ratio (%) 5.6 10.7 Note: (1) CRR as implemented by the Prudential Regulation Authority in the UK, with effect from 1 January 2014.
From 1 January 2015, UK banks have been required to meet at least 56% of its Pillar 2A capital requirement with CET1 capital and the balance with Additional Tier 1 and/or Tier 2 capital. The Pillar 2A capital requirement is the additional capital that RBS must hold, in addition to meeting its Pillar 1 requirements in order to comply with the PRA’s overall financial adequacy rule.
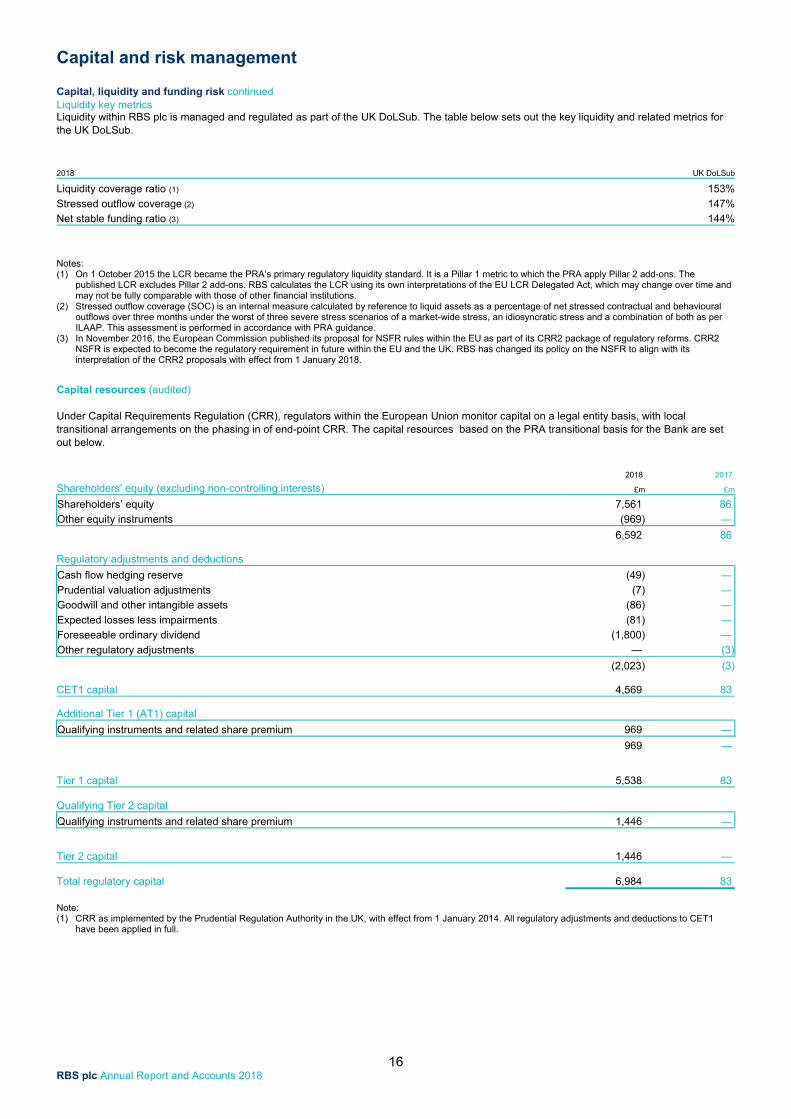
Capital and risk management
16 RBS plc Annual Report and Accounts 2018
Capital, liquidity and funding risk continued Liquidity key metrics Liquidity within RBS plc is managed and regulated as part of the UK DoLSub. The table below sets out the key liquidity and related metrics for the UK DoLSub.
2018 UK DoLSub
Liquidity coverage ratio (1) 153%
Stressed outflow coverage (2) 147%
Net stable funding ratio (3) 144%
Notes: (1) On 1 October 2015 the LCR became the PRA’s primary regulatory liquidity standard. It is a Pillar 1 metric to which the PRA apply Pillar 2 add-ons. The
published LCR excludes Pillar 2 add-ons. RBS calculates the LCR using its own interpretations of the EU LCR Delegated Act, which may change over time and may not be fully comparable with those of other financial institutions.
(2) Stressed outflow coverage (SOC) is an internal measure calculated by reference to liquid assets as a percentage of net stressed contractual and behavioural outflows over three months under the worst of three severe stress scenarios of a market-wide stress, an idiosyncratic stress and a combination of both as per ILAAP. This assessment is performed in accordance with PRA guidance.
(3) In November 2016, the European Commission published its proposal for NSFR rules within the EU as part of its CRR2 package of regulatory reforms. CRR2 NSFR is expected to become the regulatory requirement in future within the EU and the UK. RBS has changed its policy on the NSFR to align with its interpretation of the CRR2 proposals with effect from 1 January 2018.
Capital resources (audited) Under Capital Requirements Regulation (CRR), regulators within the European Union monitor capital on a legal entity basis, with local transitional arrangements on the phasing in of end-point CRR. The capital resources based on the PRA transitional basis for the Bank are set out below.
2018 2017
Shareholders’ equity (excluding non-controlling interests) £m £m
Shareholders’ equity 7,561 86
Other equity instruments (969) —
6,592 86
Regulatory adjustments and deductions
Cash flow hedging reserve (49) —
Prudential valuation adjustments (7) —
Goodwill and other intangible assets (86) —
Expected losses less impairments (81) —
Foreseeable ordinary dividend (1,800) —
Other regulatory adjustments — (3)
(2,023) (3)
CET1 capital 4,569 83
Additional Tier 1 (AT1) capital
Qualifying instruments and related share premium 969 —
969 — Tier 1 capital 5,538 83
Qualifying Tier 2 capital
Qualifying instruments and related share premium 1,446 —
Tier 2 capital 1,446 —
Total regulatory capital 6,984 83
Note: (1) CRR as implemented by the Prudential Regulation Authority in the UK, with effect from 1 January 2014. All regulatory adjustments and deductions to CET1
have been applied in full.
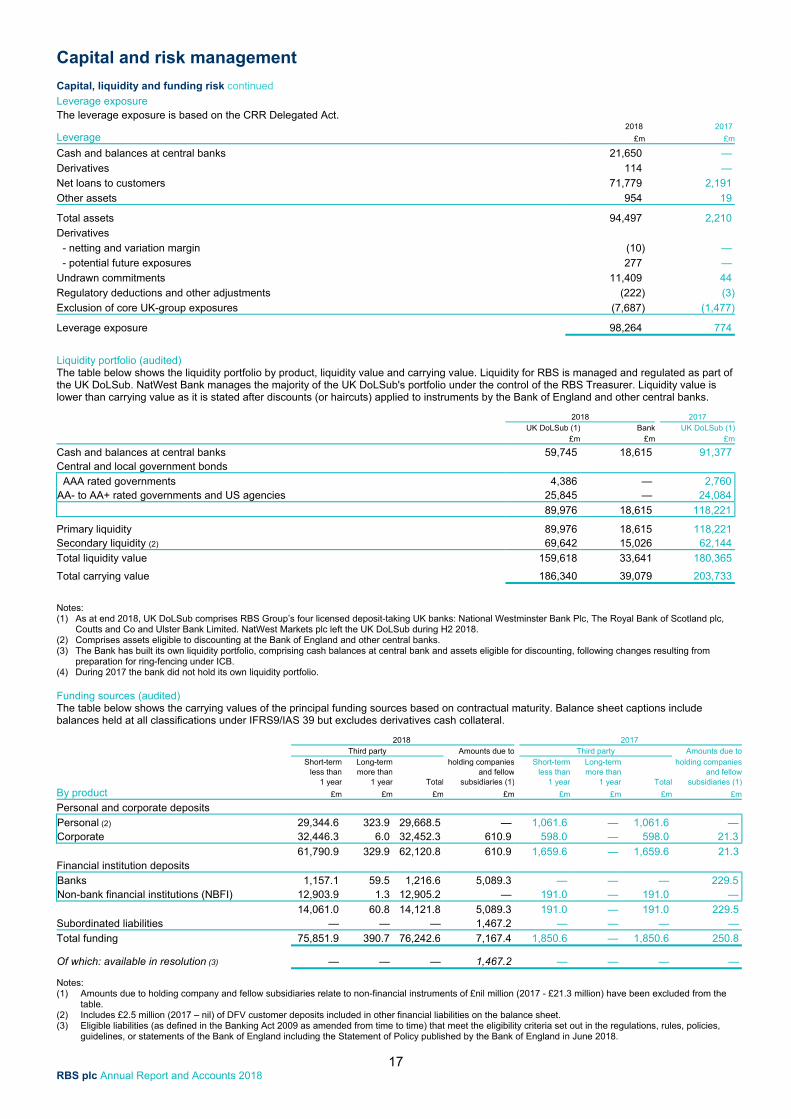
Capital and risk management
17 RBS plc Annual Report and Accounts 2018
Capital, liquidity and funding risk continued Leverage exposure The leverage exposure is based on the CRR Delegated Act. 2018 2017
Leverage £m £m
Cash and balances at central banks 21,650 —
Derivatives 114 —
Net loans to customers 71,779 2,191
Other assets 954 19
Total assets 94,497 2,210
Derivatives
- netting and variation margin (10) —
- potential future exposures 277 —
Undrawn commitments 11,409 44
Regulatory deductions and other adjustments (222) (3)
Exclusion of core UK-group exposures (7,687) (1,477)
Leverage exposure 98,264 774
Liquidity portfolio (audited) The table below shows the liquidity portfolio by product, liquidity value and carrying value. Liquidity for RBS is managed and regulated as part of the UK DoLSub. NatWest Bank manages the majority of the UK DoLSub's portfolio under the control of the RBS Treasurer. Liquidity value is lower than carrying value as it is stated after discounts (or haircuts) applied to instruments by the Bank of England and other central banks. 2018 2017
UK DoLSub (1) Bank UK DoLSub (1)
£m £m £m
Cash and balances at central banks 59,745 18,615 91,377 Central and local government bonds
AAA rated governments 4,386 — 2,760 AA- to AA+ rated governments and US agencies 25,845 — 24,084
89,976 18,615 118,221
Primary liquidity 89,976 18,615 118,221 Secondary liquidity (2) 69,642 15,026 62,144
Total liquidity value 159,618 33,641 180,365
Total carrying value 186,340 39,079 203,733
Notes: (1) As at end 2018, UK DoLSub comprises RBS Group’s four licensed deposit-taking UK banks: National Westminster Bank Plc, The Royal Bank of Scotland plc,
Coutts and Co and Ulster Bank Limited. NatWest Markets plc left the UK DoLSub during H2 2018. (2) Comprises assets eligible to discounting at the Bank of England and other central banks. (3) The Bank has built its own liquidity portfolio, comprising cash balances at central bank and assets eligible for discounting, following changes resulting from
preparation for ring-fencing under ICB. (4) During 2017 the bank did not hold its own liquidity portfolio. Funding sources (audited) The table below shows the carrying values of the principal funding sources based on contractual maturity. Balance sheet captions include balances held at all classifications under IFRS9/IAS 39 but excludes derivatives cash collateral.
2018 2017 Third party Amounts due to Third party Amounts due to Short-term Long-term holding companies Short-term Long-term holding companies less than more than and fellow less than more than and fellow 1 year 1 year Total subsidiaries (1) 1 year 1 year Total subsidiaries (1)
By product £m £m £m £m £m £m £m £m
Personal and corporate deposits
Personal (2) 29,344.6 323.9 29,668.5 — 1,061.6 — 1,061.6 — Corporate 32,446.3 6.0 32,452.3 610.9 598.0 — 598.0 21.3
61,790.9 329.9 62,120.8 610.9 1,659.6 — 1,659.6 21.3 Financial institution deposits
Banks 1,157.1 59.5 1,216.6 5,089.3 — — — 229.5 Non-bank financial institutions (NBFI) 12,903.9 1.3 12,905.2 — 191.0 — 191.0 —
14,061.0 60.8 14,121.8 5,089.3 191.0 — 191.0 229.5 Subordinated liabilities — — — 1,467.2 — — — —
Total funding 75,851.9 390.7 76,242.6 7,167.4 1,850.6 — 1,850.6 250.8
Of which: available in resolution (3) — — — 1,467.2 — — — —
Notes: (1) Amounts due to holding company and fellow subsidiaries relate to non-financial instruments of £nil million (2017 - £21.3 million) have been excluded from the
table. (2) Includes £2.5 million (2017 – nil) of DFV customer deposits included in other financial liabilities on the balance sheet. (3) Eligible liabilities (as defined in the Banking Act 2009 as amended from time to time) that meet the eligibility criteria set out in the regulations, rules, policies,
guidelines, or statements of the Bank of England including the Statement of Policy published by the Bank of England in June 2018.
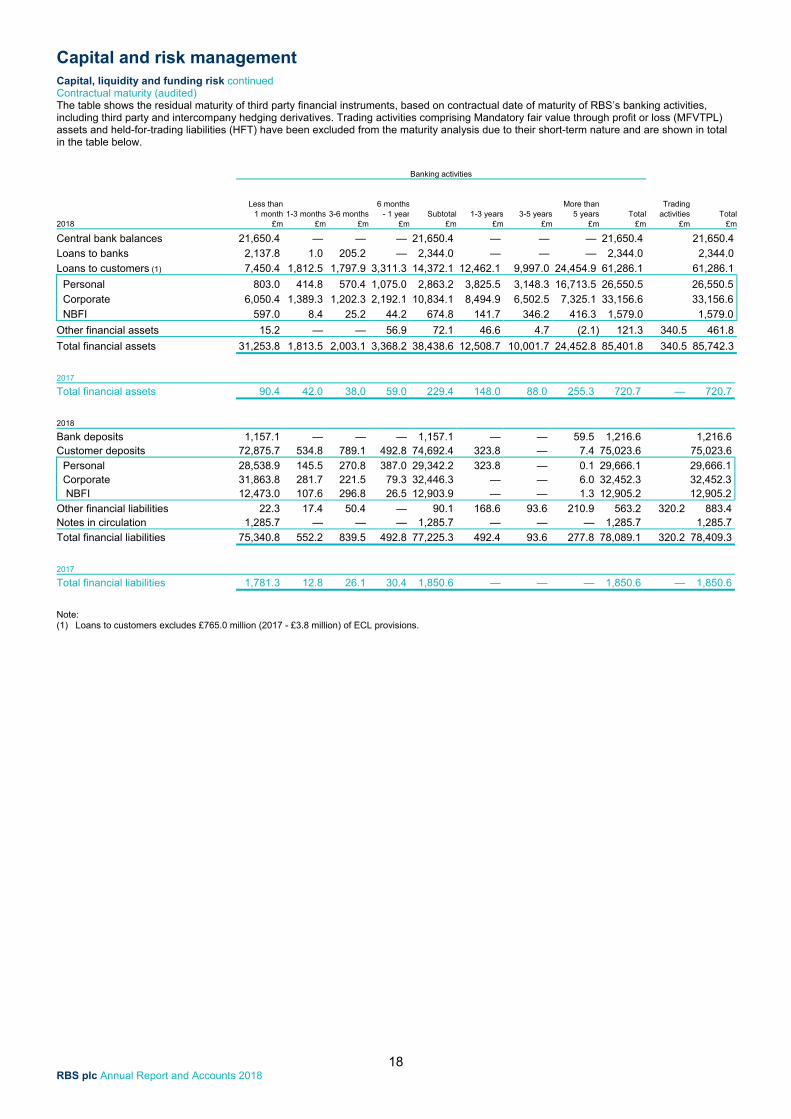
Capital and risk management
18 RBS plc Annual Report and Accounts 2018
Capital, liquidity and funding risk continued Contractual maturity (audited) The table shows the residual maturity of third party financial instruments, based on contractual date of maturity of RBS’s banking activities, including third party and intercompany hedging derivatives. Trading activities comprising Mandatory fair value through profit or loss (MFVTPL) assets and held-for-trading liabilities (HFT) have been excluded from the maturity analysis due to their short-term nature and are shown in total in the table below.
Banking activities
Less than 6 months More than Trading 1 month 1-3 months 3-6 months - 1 year Subtotal 1-3 years 3-5 years 5 years Total activities Total2018 £m £m £m £m £m £m £m £m £m £m £m
Central bank balances 21,650.4 — — — 21,650.4 — — — 21,650.4 21,650.4
Loans to banks 2,137.8 1.0 205.2 — 2,344.0 — — — 2,344.0 2,344.0
Loans to customers (1) 7,450.4 1,812.5 1,797.9 3,311.3 14,372.1 12,462.1 9,997.0 24,454.9 61,286.1 61,286.1
Personal 803.0 414.8 570.4 1,075.0 2,863.2 3,825.5 3,148.3 16,713.5 26,550.5 26,550.5
Corporate 6,050.4 1,389.3 1,202.3 2,192.1 10,834.1 8,494.9 6,502.5 7,325.1 33,156.6 33,156.6
NBFI 597.0 8.4 25.2 44.2 674.8 141.7 346.2 416.3 1,579.0 1,579.0
Other financial assets 15.2 — — 56.9 72.1 46.6 4.7 (2.1) 121.3 340.5 461.8
Total financial assets 31,253.8 1,813.5 2,003.1 3,368.2 38,438.6 12,508.7 10,001.7 24,452.8 85,401.8 340.5 85,742.3
2017 Total financial assets 90.4 42.0 38.0 59.0 229.4 148.0 88.0 255.3 720.7 — 720.7
2018 Bank deposits 1,157.1 — — — 1,157.1 — — 59.5 1,216.6 1,216.6 Customer deposits 72,875.7 534.8 789.1 492.8 74,692.4 323.8 — 7.4 75,023.6 75,023.6
Personal 28,538.9 145.5 270.8 387.0 29,342.2 323.8 — 0.1 29,666.1 29,666.1 Corporate 31,863.8 281.7 221.5 79.3 32,446.3 — — 6.0 32,452.3 32,452.3 NBFI 12,473.0 107.6 296.8 26.5 12,903.9 — — 1.3 12,905.2 12,905.2
Other financial liabilities 22.3 17.4 50.4 — 90.1 168.6 93.6 210.9 563.2 320.2 883.4 Notes in circulation 1,285.7 — — — 1,285.7 — — — 1,285.7 1,285.7
Total financial liabilities 75,340.8 552.2 839.5 492.8 77,225.3 492.4 93.6 277.8 78,089.1 320.2 78,409.3
2017 Total financial liabilities 1,781.3 12.8 26.1 30.4 1,850.6 — — — 1,850.6 — 1,850.6
Note: (1) Loans to customers excludes £765.0 million (2017 - £3.8 million) of ECL provisions.
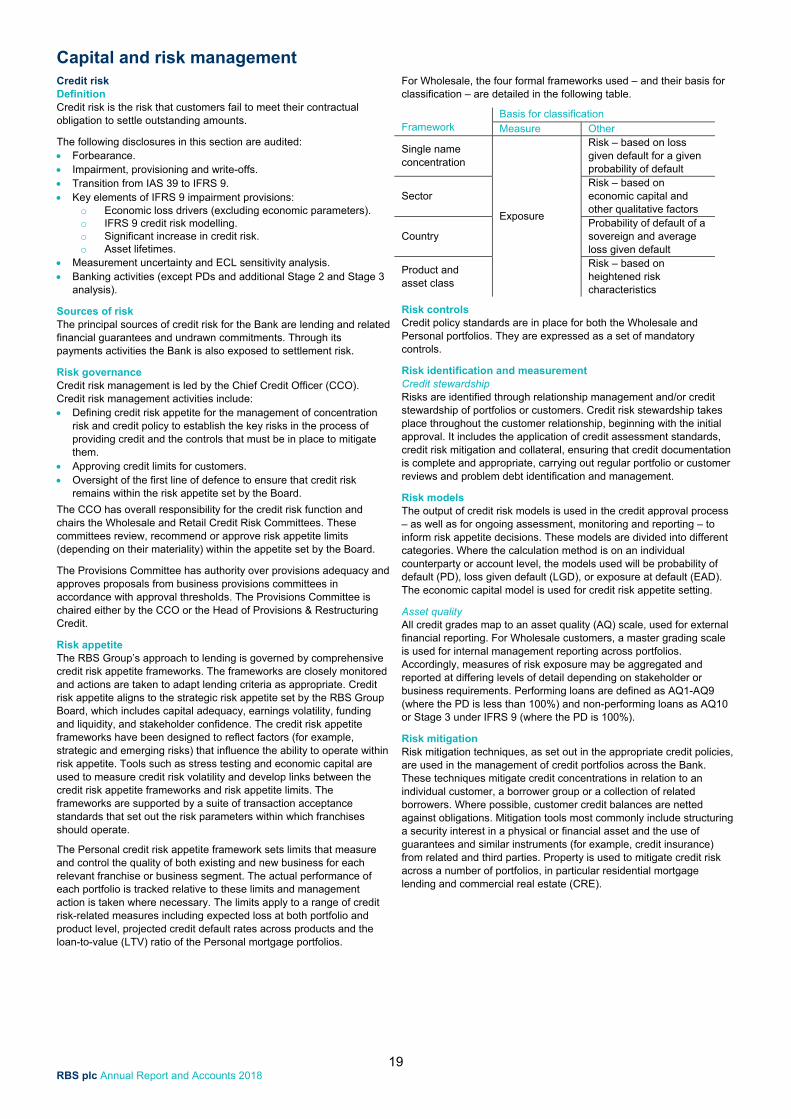
Capital and risk management
19 RBS plc Annual Report and Accounts 2018
Credit risk Definition Credit risk is the risk that customers fail to meet their contractual obligation to settle outstanding amounts.
The following disclosures in this section are audited: Forbearance. Impairment, provisioning and write-offs. Transition from IAS 39 to IFRS 9. Key elements of IFRS 9 impairment provisions:
o Economic loss drivers (excluding economic parameters). o IFRS 9 credit risk modelling. o Significant increase in credit risk. o Asset lifetimes.
Measurement uncertainty and ECL sensitivity analysis. Banking activities (except PDs and additional Stage 2 and Stage 3
analysis).
Sources of risk The principal sources of credit risk for the Bank are lending and related financial guarantees and undrawn commitments. Through its payments activities the Bank is also exposed to settlement risk.
Risk governance Credit risk management is led by the Chief Credit Officer (CCO). Credit risk management activities include: Defining credit risk appetite for the management of concentration
risk and credit policy to establish the key risks in the process of providing credit and the controls that must be in place to mitigate them.
Approving credit limits for customers. Oversight of the first line of defence to ensure that credit risk
remains within the risk appetite set by the Board.
The CCO has overall responsibility for the credit risk function and chairs the Wholesale and Retail Credit Risk Committees. These committees review, recommend or approve risk appetite limits (depending on their materiality) within the appetite set by the Board.
The Provisions Committee has authority over provisions adequacy and approves proposals from business provisions committees in accordance with approval thresholds. The Provisions Committee is chaired either by the CCO or the Head of Provisions & Restructuring Credit.
Risk appetite The RBS Group’s approach to lending is governed by comprehensive credit risk appetite frameworks. The frameworks are closely monitored and actions are taken to adapt lending criteria as appropriate. Credit risk appetite aligns to the strategic risk appetite set by the RBS Group Board, which includes capital adequacy, earnings volatility, funding and liquidity, and stakeholder confidence. The credit risk appetite frameworks have been designed to reflect factors (for example, strategic and emerging risks) that influence the ability to operate within risk appetite. Tools such as stress testing and economic capital are used to measure credit risk volatility and develop links between the credit risk appetite frameworks and risk appetite limits. The frameworks are supported by a suite of transaction acceptance standards that set out the risk parameters within which franchises should operate.
The Personal credit risk appetite framework sets limits that measure and control the quality of both existing and new business for each relevant franchise or business segment. The actual performance of each portfolio is tracked relative to these limits and management action is taken where necessary. The limits apply to a range of credit risk-related measures including expected loss at both portfolio and product level, projected credit default rates across products and the loan-to-value (LTV) ratio of the Personal mortgage portfolios.
For Wholesale, the four formal frameworks used – and their basis for classification – are detailed in the following table.
Framework
Basis for classification Measure Other
Single name concentration
Exposure
Risk – based on loss given default for a given probability of default
Sector Risk – based on economic capital and other qualitative factors
Country Probability of default of a sovereign and average loss given default
Product and asset class
Risk – based on heightened risk characteristics
Risk controls Credit policy standards are in place for both the Wholesale and Personal portfolios. They are expressed as a set of mandatory controls.
Risk identification and measurement Credit stewardship Risks are identified through relationship management and/or credit stewardship of portfolios or customers. Credit risk stewardship takes place throughout the customer relationship, beginning with the initial approval. It includes the application of credit assessment standards, credit risk mitigation and collateral, ensuring that credit documentation is complete and appropriate, carrying out regular portfolio or customer reviews and problem debt identification and management.
Risk models The output of credit risk models is used in the credit approval process – as well as for ongoing assessment, monitoring and reporting – to inform risk appetite decisions. These models are divided into different categories. Where the calculation method is on an individual counterparty or account level, the models used will be probability of default (PD), loss given default (LGD), or exposure at default (EAD). The economic capital model is used for credit risk appetite setting.
Asset quality All credit grades map to an asset quality (AQ) scale, used for external financial reporting. For Wholesale customers, a master grading scale is used for internal management reporting across portfolios. Accordingly, measures of risk exposure may be aggregated and reported at differing levels of detail depending on stakeholder or business requirements. Performing loans are defined as AQ1-AQ9 (where the PD is less than 100%) and non-performing loans as AQ10 or Stage 3 under IFRS 9 (where the PD is 100%).
Risk mitigation Risk mitigation techniques, as set out in the appropriate credit policies, are used in the management of credit portfolios across the Bank. These techniques mitigate credit concentrations in relation to an individual customer, a borrower group or a collection of related borrowers. Where possible, customer credit balances are netted against obligations. Mitigation tools most commonly include structuring a security interest in a physical or financial asset and the use of guarantees and similar instruments (for example, credit insurance) from related and third parties. Property is used to mitigate credit risk across a number of portfolios, in particular residential mortgage lending and commercial real estate (CRE).
Capital and risk management
20 RBS plc Annual Report and Accounts 2018
Credit risk continued The valuation methodologies for residential mortgage collateral and CRE are detailed below. Residential mortgages – The Bank takes collateral in the form of residential property to mitigate the credit risk arising from mortgages. The Bank values residential property during the loan underwriting process by either appraising properties individually or valuing them collectively using statistically valid models. The Bank updates residential property values quarterly using the Halifax quarterly regional house price index.
The current indexed value of the property is a component of the expected credit loss (ECL) provisioning calculation.
Commercial real estate valuations – The Bank has a panel of chartered surveying firms that cover the spectrum of geography and property sectors in which the Bank takes collateral. Suitable valuers for particular assets are contracted through a single service agreement to ensure consistency of quality and advice. Valuations are commissioned when an asset is taken as security; a material increase in a facility is requested; or a default event is anticipated or has occurred. In the UK, an independent third-party market indexation is applied to update external valuations once they are more than a year old and every three years a formal independent valuation is commissioned. The current indexed value of the property is a component of the ECL provisioning calculation.
Risk assessment and monitoring Practices for credit stewardship – including credit assessment, approval and monitoring as well as the identification and management of problem debts – differ between the Personal and Wholesale portfolios.
Personal Personal customers are served through a lending approach that entails making a large number of small-value loans. To ensure that these lending decisions are made consistently, the Bank analyses internal credit information as well as external data supplied from credit reference agencies (including historical debt servicing behaviour of customers with respect to both the Bank and other lenders). The Bank then sets its lending rules accordingly, developing different rules for different products.
The process is then largely automated, with each customer receiving an individual credit score that reflects both internal and external behaviours and this score is compared with the lending rules set. For relatively high-value, complex personal loans, including some residential mortgage lending, specialist credit managers make the final lending decisions. These decisions are made within specified delegated authority limits that are issued dependent on the experience of the individual.
Underwriting standards and portfolio performance are monitored on an ongoing basis to ensure they remain adequate in the current market environment and are not weakened materially to sustain growth.
Wholesale Wholesale customers – including corporates, banks and other financial institutions – are grouped by industry sectors and geography as well as by product/asset class and are managed on an individual basis. Consideration is given to identifying groups of individual customers with sufficient inter-connectedness to merit assessment as a single risk.
A credit assessment is carried out before credit facilities are made available to customers. The assessment process is dependent on the complexity of the transaction.
For lower risk transactions below specific thresholds, credit decisions can be approved through self-sanctioning within the business. This process is facilitated through an auto-decision making system, which utilises scorecards, strategies and policy rules to provide a recommended credit decision. Such credit decisions must be within the approval authority of the relevant business sanctioner.
For all other transactions credit is only granted to customers following joint approval by an approver from the business and the credit risk function. The joint business and credit approvers act within a delegated approval authority under the Wholesale Credit Authorities Framework Policy.
The level of delegated authority held by approvers is dependent on their experience and expertise with only a small number of senior executives holding the highest approval authority.
Both business and credit approvers are accountable for the quality of each decision taken, although the credit risk approver holds ultimate sanctioning authority.
Transaction Acceptance Standards provide detailed transactional lending and risk acceptance metrics and structuring guidance. As such, these standards provide a mechanism to manage risk appetite at the customer/transaction level and are supplementary to the established credit risk appetite.
Credit grades (PD and LGD) are reviewed and if appropriate re-approved annually. The review process assesses borrower performance, including reconfirmation or adjustment of risk parameter estimates; the adequacy of security; compliance with terms and conditions; and refinancing risk.
A key aspect of credit risk stewardship is ensuring that, when signs of customer stress are identified, appropriate debt management actions are applied.
Problem debt management Personal Early Problem Identification Pre-emptive triggers are in place to help identify customers that may be at risk of being in financial difficulty. These triggers are both internal, using the Bank’s data and external, information from credit reference agencies. Pro-active contact is then made with the customer to establish if they require help with managing their finances. By adopting this approach the aim is to prevent a customer’s financial position deteriorating which may then require intervention from the Collections and Recoveries teams.
Personal customers experiencing financial difficulty are managed by the Collections team. If the Collections team is unable to provide appropriate support after discussing suitable options with the customer, management of that customer moves to the Recoveries team. If at any point in the Collections and Recoveries process, the customer is identified as being potentially vulnerable, the customer will be separated from the regular process and supported by a specialist team to ensure the customer receives appropriate support for their circumstances.
Collections When a customer exceeds an agreed limit or misses a regular monthly payment the customer is contacted by the Bank and requested to remedy the position. If the situation is not regularised then, where appropriate, the Collections team will become more fully involved and the customer will be supported by skilled debt management staff who endeavour to provide customers with bespoke solutions. Solutions include short-term account restructuring, refinance loans and forbearance which can include interest suspension and ‘breathing space’. In the event that an affordable/sustainable agreement with a customer cannot be reached, the debt will transition to the Recoveries team. For provisioning purposes, under IFRS 9, exposure to customers managed by the Collections team is categorised as Stage 2 and subject to a lifetime loss assessment.
Recoveries The Recoveries team will issue a notice of intention to default to the customer and, if appropriate, a formal demand, while also registering the account with credit reference agencies where appropriate. Following this, the customer’s debt may then be placed with a third-party debt collection agency, or alternatively a solicitor, in order to agree an affordable repayment plan with the customer. Exposures subject to formal debt recovery are defaulted and categorised as Stage 3 impaired.
Capital and risk management
21 RBS plc Annual Report and Accounts 2018
Credit risk continued Wholesale Early problem identification Each segment and sector has defined early warning indicators to identify customers experiencing financial difficulty, and to increase monitoring if needed. Early warning indicators may be internal, such as a customer’s bank account activity, or external, such as a publicly-listed customer’s share price. If early warning indicators show a customer is experiencing potential or actual difficulty, or if relationship managers or credit officers identify other signs of financial difficulty they may decide to classify the customer within the Risk of Credit Loss framework.
Risk of Credit Loss framework
The framework focuses on Wholesale customers whose credit profiles have deteriorated since origination. Expert judgement is applied by experienced credit risk officers to classify cases into categories that reflect progressively deteriorating credit risk to the Bank. There are two classifications which apply to non-defaulted customers within the framework – Heightened Monitoring and Risk of Credit Loss. For the purposes of provisioning, all exposures subject to the framework are categorised as Stage 2 and subject to a lifetime loss assessment. The framework also applies to those customers that have met the Bank’s default criteria (AQ10 exposures). Defaulted exposures are categorised as Stage 3 impaired for provisioning purposes.
Heightened Monitoring customers are performing customers that have met certain characteristics, which have led to significant credit deterioration. Collectively, characteristics reflect circumstances that may affect the customer’s ability to meet repayment obligations. Characteristics include trading issues, covenant breaches, material PD downgrades and past due facilities. Heightened Monitoring customers require pre-emptive actions (outside the customer’s normal trading patterns) to return or maintain their facilities within the Bank’s current risk appetite prior to maturity.
Risk of Credit Loss customers are performing customers that have met the criteria for Heightened Monitoring and also pose a risk of credit loss to the Bank in the next 12 months (should mitigating action not be taken or not be successful).
Once classified as either Heightened Monitoring or Risk of Credit Loss, a number of mandatory actions are taken in accordance with policies. Actions include a review of the customer’s credit grade, facility and security documentation and the valuation of security.
Depending on the severity of the financial difficulty and the size of the exposure, the customer relationship strategy is reassessed by credit officers, by specialist credit risk or relationship management units in the relevant business or by Restructuring.
Agreed customer management strategies are regularly monitored by both the business and credit teams. The largest Risk of Credit Loss exposures are regularly reviewed by a Risk of Credit Loss Committee. The committee members are experienced credit, business and restructuring specialists. The purpose of the committee is to review and challenge the strategies undertaken for customers that pose the largest risk of credit loss to the Bank.
Appropriate corrective action is taken when circumstances emerge that may affect the customer’s ability to service its debt (see Heightened Monitoring characteristics). Corrective actions may include granting a customer various types of concessions. Any decision to approve a concession will be a function of specific appetite, the credit quality of the customer, the market environment and the loan structure and security. All customers granted forbearance are classified Heightened Monitoring as a minimum.
Other potential outcomes of the relationship review are to: remove the customer from the Risk of Credit Loss framework, offer additional lending and continue monitoring, transfer the relationship to Restructuring if appropriate, or exit the relationship.
The Risk of Credit Loss framework does not apply to problem debt management for Business Banking customers in UK PBB. These customers are, where necessary, managed by specialist problem debt management teams, depending on the size of exposure or by the Business Banking recoveries team where a loan has been impaired.
Restructuring For the Wholesale problem debt portfolio, customer relationships are mainly managed by the Restructuring team (excluding customers managed by UK PBB). The purpose of Restructuring is to protect the Bank’s capital. Where practicable, Restructuring does this by working with corporate and commercial customers to support their turnaround and recovery strategies and enable them to return to mainstream banking. Restructuring will always aim to recover capital in a fair and efficient manner.
Specialists in Restructuring work with customers experiencing financial difficulties and showing signs of financial stress. Throughout Restructuring’s involvement the mainstream relationship manager will remain an integral part of the customer relationship, unless an exit strategy is deemed appropriate. The objective is to find a mutually acceptable solution, including restructuring of existing facilities, repayment or refinancing.
Where a solvent outcome is not possible, insolvency may be considered as a last resort. However, helping the customer return to financial health and restoring a normal banking relationship is always the preferred outcome.
Forbearance (audited)
Forbearance takes place when a concession is made on the contractual terms of a loan/debt in response to a customer’s financial difficulties.
The aim of forbearance is to support and restore the customer to financial health while minimising risk. To ensure that forbearance is appropriate for the needs of the customer, minimum standards are applied when assessing, recording, monitoring and reporting forbearance. A loan/debt may be forborne more than once, generally where a temporary concession has been granted and circumstances warrant another temporary or permanent revision of the loan’s terms.
In the Personal portfolio, loans are considered forborne until they meet the exit criteria set out by the European Banking Authority. These include being classified as performing for two years since the last forbearance event, making regular repayments and the loan/debt being less than 30 days past due. Exit criteria are not currently applied for Wholesale portfolios.
Types of forbearance Personal In the Personal portfolio, forbearance may involve payment concessions and loan rescheduling (including extensions in contractual maturity) and/or capitalisation of arrears. Forbearance is granted principally to customers with mortgages and less frequently to customers with unsecured loans. This includes instances where forbearance may be provided to customers with highly flexible mortgages.
Wholesale In the Wholesale portfolio, forbearance may involve covenant waivers, amendments to margins, payment concessions and loan rescheduling (including extensions in contractual maturity), capitalisation of arrears, and debt forgiveness or debt-for-equity swaps.
Monitoring of forbearance Personal For Personal portfolios, forborne loans are separated and regularly monitored and reported while the forbearance strategy is implemented, until they exit forbearance.
Capital and risk management
22 RBS plc Annual Report and Accounts 2018
Credit risk continued Wholesale In the Wholesale portfolio, customer PDs and facility LGDs are re-assessed prior to finalising any forbearance arrangement.
The ultimate outcome of a forbearance strategy is highly dependent on the cooperation of the borrower and a viable business or repayment outcome. Where forbearance is no longer appropriate, the Bank will consider other options such as the enforcement of security, insolvency proceedings or both, although these are options of last resort.
Provisioning for forbearance Personal The methodology used for provisioning in respect of Personal forborne loans will differ depending on whether the loans are performing or non-performing.
Granting forbearance will only change the arrears status of the loan in specific circumstances, which can include capitalisation of principal and interest in arrears, where the loan may be returned to the performing book if the customer has demonstrated an ability to meet regular payments and is likely to continue to do so. The loan would remain in forbearance for the defined probation period and be subject to performance criteria. These include making regular repayments and being less than 30 days past due.
Additionally for some forbearance types a loan may be transferred to the performing book if a customer makes payments that reduce loan arrears below 90 days.
For ECL provisioning, all forborne but performing exposures are categorised as Stage 2 and are subject to a lifetime loss provisioning assessment.
For non-performing forborne loans, the Stage 3 loss assessment process is the same as for non-forborne loans.
Wholesale Provisions for forborne loans are assessed in accordance with normal provisioning policies. The customer’s financial position and prospects – as well as the likely effect of the forbearance, including any concessions granted, and revised PD or LGD gradings – are considered in order to establish whether an impairment provision is required.
Wholesale loans granted forbearance are individually assessed in most cases. Performing loans subject to forbearance treatment are categorised as Stage 2 and subject to a lifetime loss assessment.
Forbearance may result in the value of the outstanding debt exceeding the present value of the estimated future cash flows. This difference will lead to a customer being classified as non-performing.
In the case of non-performing forborne loans, an individual loan impairment provision assessment generally takes place prior to forbearance being granted. The amount of the loan impairment provision may change once the terms of the forbearance are known, resulting in an additional provision charge or a release of the provision in the period the forbearance is granted.
The transfer of Wholesale loans from impaired to performing status follows assessment by relationship managers and credit. When no further losses are anticipated and the customer is expected to meet the loan’s revised terms, any provision is written-off or released and the balance of the loan returned to performing status. This is not dependent on a specified time period and follows the credit risk manager’s assessment. Impairment, provisioning and write-offs (audited) In the overall assessment of credit risk, impairment, provisioning and write-offs are used as key indicators of credit quality.
The new IFRS 9 impairment provisions accounting standard was implemented with effect from 1 January 2018. Set out below is further detail regarding the impact of the transition from IAS 39 to IFRS 9 impairment provisioning, how key credit risk management activities link to IFRS 9 impairment provisioning and the key policy and modelling decisions that have been made in implementing IFRS 9 (refer also to Accounting policy 11 and Note 12 on the accounts). Transition from IAS 39 to IFRS 9 (audited)
The Bank implemented IFRS 9 with effect from 1 January 2018 with no restatement of comparatives other than the Day One impact on implementation reflected in opening equity.
Cash flows and cash losses are unchanged by the change in impairment framework from IAS 39 to IFRS 9. IFRS 9 has changed the basis of loss calculation to expected loss (forward-looking), as opposed to the incurred loss model under IAS 39, which focused only on losses that had already occurred. There are a number of changes as well as judgements involved in measuring ECL. New elements include:
Move from incurred loss model to expected loss model, including all performing assets having 12-month ECL on origination.
Determination of significant increase in credit risk – this moves a subset of assets from a 12-month ECL (Stage 1) to lifetime ECL (Stage 2) when credit risk has significantly increased since origination.
Change in scope of impaired assets (Stage 3).
Incorporation of forward-looking information, including multiple economic scenarios (MES). MES are assessed in order to identify non-linearity of losses in the portfolio.
Key elements of IFRS 9 impairment provisions (audited) IFRS 9 introduced additional complexity into the determination of credit impairment provisioning requirements. However, the building blocks that deliver an ECL calculation already existed in the RBS Group. Existing Basel models were used as a starting point in the construction of IFRS 9 models, which also incorporate term extension and forward-looking information.
Five key areas may materially influence the measurement of credit impairment under IFRS 9 – two of these relate to model build and three relate to their application:
Model build: o The determination of economic indicators that have most
influence on credit loss for each portfolio and the severity of impact (this leverages existing stress testing mechanisms).
o The build of term structures to extend the determination of the risk of loss beyond 12 months that will influence the impact of lifetime loss for assets in Stage 2.
Model application: o The assessment of the significant increase in credit risk and
the formation of a framework capable of consistent application. o The determination of asset lifetimes that reflect behavioural
characteristics while also representing management actions and processes (using historical data and experience).
o The determination of a base case (or central) economic scenario which has the most material impact (of all forward-looking scenarios) on the measurement of loss (the Bank uses consensus forecasts to remove management bias).
Policy elections and simplifications relating to IFRS 9 In addition to the five key areas above, which are relevant from period to period, there was one further significant judgment that was made as a one-off exercise to support the Day One implementation: this was the application of the new IFRS 9 models to the determination of origination date metrics. Since it is not possible to determine the economic forecasts and alternative scenarios going backwards in time it is necessary to use a series of assumptions to enable this process. The Bank assumed a flat economic forecast, for all dates historically.
Capital and risk management
23 RBS plc Annual Report and Accounts 2018
Credit risk continued There were some other less significant judgments, elections and simplification assumptions that informed the ECL process; these were not seen as ‘critical’ in determining the appropriate level of impairment but represented choices taken by management across areas of estimation uncertainty. The main examples of these are: Models – for example in the case of some low default portfolios,
Basel parameter estimates have been applied for IFRS 9. Non-modelled portfolios – certain portfolios have their Basel II
capital requirement calculated under the standardised framework for regulatory purposes and do not have systematically modelled PDs, EADs and LGDs. Under IFRS 9, they have bespoke treatments for the identification of significant increase in credit risk and ECL provisions. With respect to the latter, benchmark PDs, EADs and LGDs are used with the benchmarks being reviewed annually for appropriateness.
Discounting of future losses – the ECL calculation is based on expected future cash-flows. These are discounted using the effective interest rate – for practical purposes, this is typically applied at a portfolio level rather than being established and operated at an individual asset level.
Multiple economic scenarios (MES) – it is the selection of the central (or base) scenario that is most critical to the ECL calculation, independent of the method used to generate a range of alternative outcomes and their probabilities. Different approaches to model MES around the central scenario have all been found of low significance for the overall ECL impact.
Economic loss drivers Introduction (audited) The portfolio segmentation and selection of economic loss drivers for IFRS 9 follow closely the approach already used in stress testing. To enable robust modelling the forecasting models for each portfolio segment (defined by asset class and where relevant – industry sector and region) are based on a selected, small number of economic factors, (typically two to four) that best explain the temporal variations in portfolio loss rates. The process to select economic loss drivers involves empirical analysis and expert judgment.
The most material primary economic loss drivers for Personal portfolios include UK GDP, unemployment rate, House Price Index, and base rate for UK portfolios as relevant.
In addition to some of these loss drivers, for Wholesale portfolios, World GDP is a primary loss driver.
Central base case economic scenario (audited) The internal base case scenario is the primary forward-looking economic information driving the calculation of ECL. The same base case scenario is used for the Bank’s financial planning. The key elements of the current economic base case, which includes forecasts over a five year forecast horizon, are summarised below.
The central scenario projects modest growth in the UK economy, in line with the consensus outlook. Brexit related uncertainty results in subdued confidence in the near term, placing it in the lower quartile of advanced economies. Business investment is weak at the start of the forecast, improving only gradually. Consumer spending rises steadily as households benefit from falling inflation and rising wage growth, though it is a modest upturn. The central scenario assumes slower job growth than seen in recent years, meaning unemployment edges up from its current historic lows. House price growth slows, extending the current slowdown, before picking up to low single digit growth in later years. Monetary policy follows the market implied path for Bank of England base rate at the time the scenarios were set, therefore it is assumed only two further base rate increases over the next five years.
Use of the central base case in Personal In Personal the internal base case is directly used as the central scenario for the ECL calculations by feeding the forecasted economic loss drivers into the respective PD and LGD models
Use of the central base case in Wholesale As in Personal the primary input is the central base case scenario but a further adjustment is applied to explicitly enforce a gradual reversion to long run average credit cycle conditions from the first projected year onwards. This adjustment process leverages the existing Wholesale credit models framework that utilises Credit Cycle Indices (CCI) to measure the point-in-time default rate conditions in a comprehensive set of region/industry groupings. The CCI are constructed by summarising market data based point-in-time PDs for all publicly listed entities in the respective region/industry grouping on a monthly frequency. Positive CCI values indicate better than average conditions, i.e. low default rates and a CCI value of zero indicates default rate conditions at long run average levels. The CCI can be interpreted as an aggregation of the primary economic loss drivers most relevant for each portfolio segment into a single measure. The central base case scenario forecasts provided at the level of economic loss drivers are fed into the ECL calculations by first translating them into corresponding CCI forecasts for each portfolio segment and subsequently applying the aforementioned mean-reversion adjustment.
Initially at transition mean reversion was applied from year five onwards. Since H1 2018, mean reversion is applied from the first year onwards. The earlier application of the mean reversion adjustment was introduced to account for two empirical observations. Firstly historic credit loss rates in Wholesale portfolios show pronounced mean reversion behaviour and secondly, the accuracy of economic forecasts tends to drop significantly for horizons beyond one or two years.
Approach for MES (audited) The response of portfolio loss rates to changes in economic conditions is typically non-linear and asymmetric. Therefore in order to appropriately take account of the uncertainty in economic forecasts a range of MES are considered when calculating ECL.
Personal – the approach to MES is based on using a set of discrete scenarios. In addition to the central base case a further four bespoke scenarios are taken into account – a base case upside and downside – and an additional upside and downside. The overall MES ECL is calculated as a probability weighted average across all five scenarios (refer to the Probability weightings of scenarios section below).
The ECL impact on the Personal portfolio arising from the application of MES over the single, central base case is relatively low, and following review by the Provisions Committee, overlays were agreed to ensure the expected effect of non-linearity of losses was appropriately recognised. As at 31 December 2018, the value of the overlays was £7 million for UK PBB.
Wholesale – the approach to MES is a Monte Carlo method that involves simulating a large number of alternative scenarios around the central scenario (adjusted for mean reversion) and averaging the losses and PD values for each individual scenario into unbiased expectations of losses (ECL) and PD.
The simulation of alternative scenarios does not occur on the level of the individual economic loss drivers but operates on the aggregate CCI described earlier. Since the existing Wholesale credit models for PD and LGD were already built within the CCI framework the chosen Monte Carlo method provided a conceptually rigorous but still efficient approach to implement the MES requirement.
The Monte Carlo MES approach increases Wholesale ECL for Stage 1 and Stage 2 by approximately 5% above the single, central scenario outcomes. No additional MES overlay was applied for Wholesale.
For both Personal and Wholesale, the impact from MES is factored in to account level PDs through scalars. These MES-adjusted PDs are used to assess whether a significant increase in credit risk has occurred.
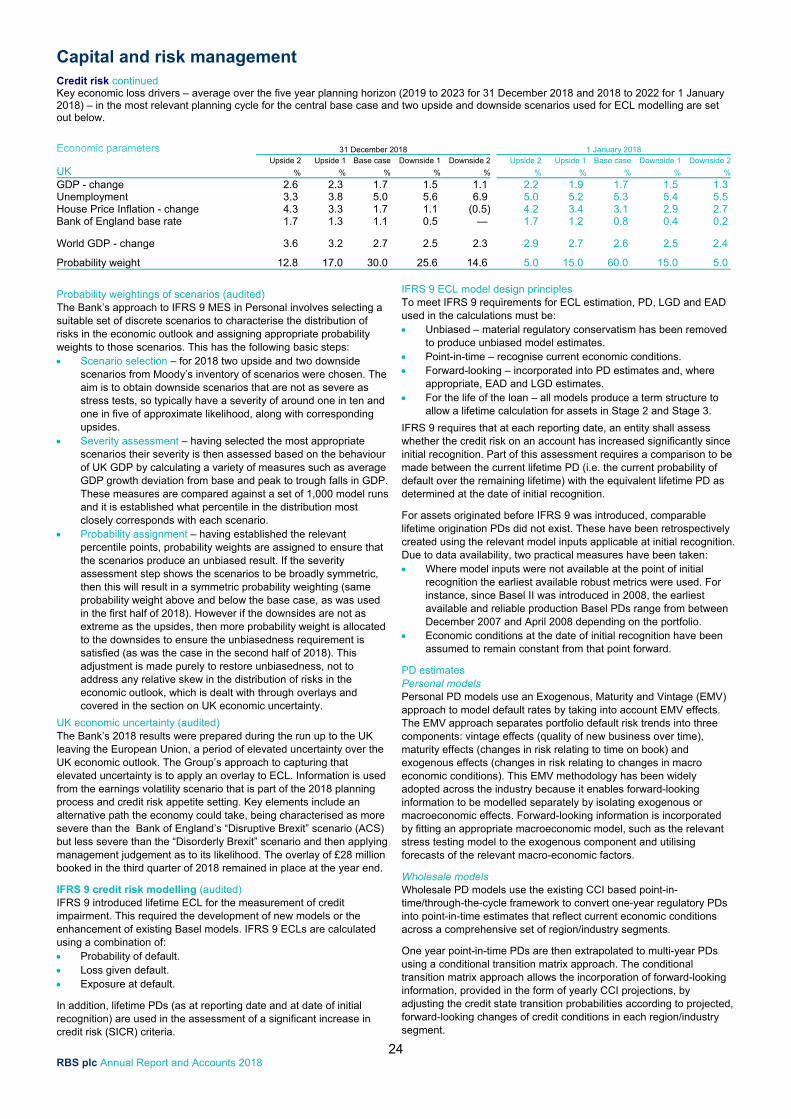
Capital and risk management
24 RBS plc Annual Report and Accounts 2018
Credit risk continued Key economic loss drivers – average over the five year planning horizon (2019 to 2023 for 31 December 2018 and 2018 to 2022 for 1 January 2018) – in the most relevant planning cycle for the central base case and two upside and downside scenarios used for ECL modelling are set out below.
Economic parameters 31 December 2018 1 January 2018 Upside 2 Upside 1 Base case Downside 1 Downside 2 Upside 2 Upside 1 Base case Downside 1 Downside 2
UK % % % % % % % % % %
GDP - change 2.6 2.3 1.7 1.5 1.1 2.2 1.9 1.7 1.5 1.3 Unemployment 3.3 3.8 5.0 5.6 6.9 5.0 5.2 5.3 5.4 5.5 House Price Inflation - change 4.3 3.3 1.7 1.1 (0.5) 4.2 3.4 3.1 2.9 2.7 Bank of England base rate 1.7 1.3 1.1 0.5 — 1.7 1.2 0.8 0.4 0.2 World GDP - change 3.6 3.2 2.7 2.5 2.3 2.9 2.7 2.6 2.5 2.4
Probability weight 12.8 17.0 30.0 25.6 14.6 5.0 15.0 60.0 15.0 5.0
Probability weightings of scenarios (audited) The Bank’s approach to IFRS 9 MES in Personal involves selecting a suitable set of discrete scenarios to characterise the distribution of risks in the economic outlook and assigning appropriate probability weights to those scenarios. This has the following basic steps: Scenario selection – for 2018 two upside and two downside
scenarios from Moody’s inventory of scenarios were chosen. The aim is to obtain downside scenarios that are not as severe as stress tests, so typically have a severity of around one in ten and one in five of approximate likelihood, along with corresponding upsides.
Severity assessment – having selected the most appropriate scenarios their severity is then assessed based on the behaviour of UK GDP by calculating a variety of measures such as average GDP growth deviation from base and peak to trough falls in GDP. These measures are compared against a set of 1,000 model runs and it is established what percentile in the distribution most closely corresponds with each scenario.
Probability assignment – having established the relevant percentile points, probability weights are assigned to ensure that the scenarios produce an unbiased result. If the severity assessment step shows the scenarios to be broadly symmetric, then this will result in a symmetric probability weighting (same probability weight above and below the base case, as was used in the first half of 2018). However if the downsides are not as extreme as the upsides, then more probability weight is allocated to the downsides to ensure the unbiasedness requirement is satisfied (as was the case in the second half of 2018). This adjustment is made purely to restore unbiasedness, not to address any relative skew in the distribution of risks in the economic outlook, which is dealt with through overlays and covered in the section on UK economic uncertainty.
UK economic uncertainty (audited) The Bank’s 2018 results were prepared during the run up to the UK leaving the European Union, a period of elevated uncertainty over the UK economic outlook. The Group’s approach to capturing that elevated uncertainty is to apply an overlay to ECL. Information is used from the earnings volatility scenario that is part of the 2018 planning process and credit risk appetite setting. Key elements include an alternative path the economy could take, being characterised as more severe than the Bank of England’s “Disruptive Brexit” scenario (ACS) but less severe than the “Disorderly Brexit” scenario and then applying management judgement as to its likelihood. The overlay of £28 million booked in the third quarter of 2018 remained in place at the year end.
IFRS 9 credit risk modelling (audited) IFRS 9 introduced lifetime ECL for the measurement of credit impairment. This required the development of new models or the enhancement of existing Basel models. IFRS 9 ECLs are calculated using a combination of: Probability of default. Loss given default. Exposure at default.
In addition, lifetime PDs (as at reporting date and at date of initial recognition) are used in the assessment of a significant increase in credit risk (SICR) criteria.
IFRS 9 ECL model design principles To meet IFRS 9 requirements for ECL estimation, PD, LGD and EAD used in the calculations must be: Unbiased – material regulatory conservatism has been removed
to produce unbiased model estimates. Point-in-time – recognise current economic conditions. Forward-looking – incorporated into PD estimates and, where
appropriate, EAD and LGD estimates. For the life of the loan – all models produce a term structure to
allow a lifetime calculation for assets in Stage 2 and Stage 3.
IFRS 9 requires that at each reporting date, an entity shall assess whether the credit risk on an account has increased significantly since initial recognition. Part of this assessment requires a comparison to be made between the current lifetime PD (i.e. the current probability of default over the remaining lifetime) with the equivalent lifetime PD as determined at the date of initial recognition.
For assets originated before IFRS 9 was introduced, comparable lifetime origination PDs did not exist. These have been retrospectively created using the relevant model inputs applicable at initial recognition. Due to data availability, two practical measures have been taken: Where model inputs were not available at the point of initial
recognition the earliest available robust metrics were used. For instance, since Basel II was introduced in 2008, the earliest available and reliable production Basel PDs range from between December 2007 and April 2008 depending on the portfolio.
Economic conditions at the date of initial recognition have been assumed to remain constant from that point forward.
PD estimates Personal models Personal PD models use an Exogenous, Maturity and Vintage (EMV) approach to model default rates by taking into account EMV effects. The EMV approach separates portfolio default risk trends into three components: vintage effects (quality of new business over time), maturity effects (changes in risk relating to time on book) and exogenous effects (changes in risk relating to changes in macro economic conditions). This EMV methodology has been widely adopted across the industry because it enables forward-looking information to be modelled separately by isolating exogenous or macroeconomic effects. Forward-looking information is incorporated by fitting an appropriate macroeconomic model, such as the relevant stress testing model to the exogenous component and utilising forecasts of the relevant macro-economic factors.
Wholesale models Wholesale PD models use the existing CCI based point-in-time/through-the-cycle framework to convert one-year regulatory PDs into point-in-time estimates that reflect current economic conditions across a comprehensive set of region/industry segments.
One year point-in-time PDs are then extrapolated to multi-year PDs using a conditional transition matrix approach. The conditional transition matrix approach allows the incorporation of forward-looking information, provided in the form of yearly CCI projections, by adjusting the credit state transition probabilities according to projected, forward-looking changes of credit conditions in each region/industry segment.
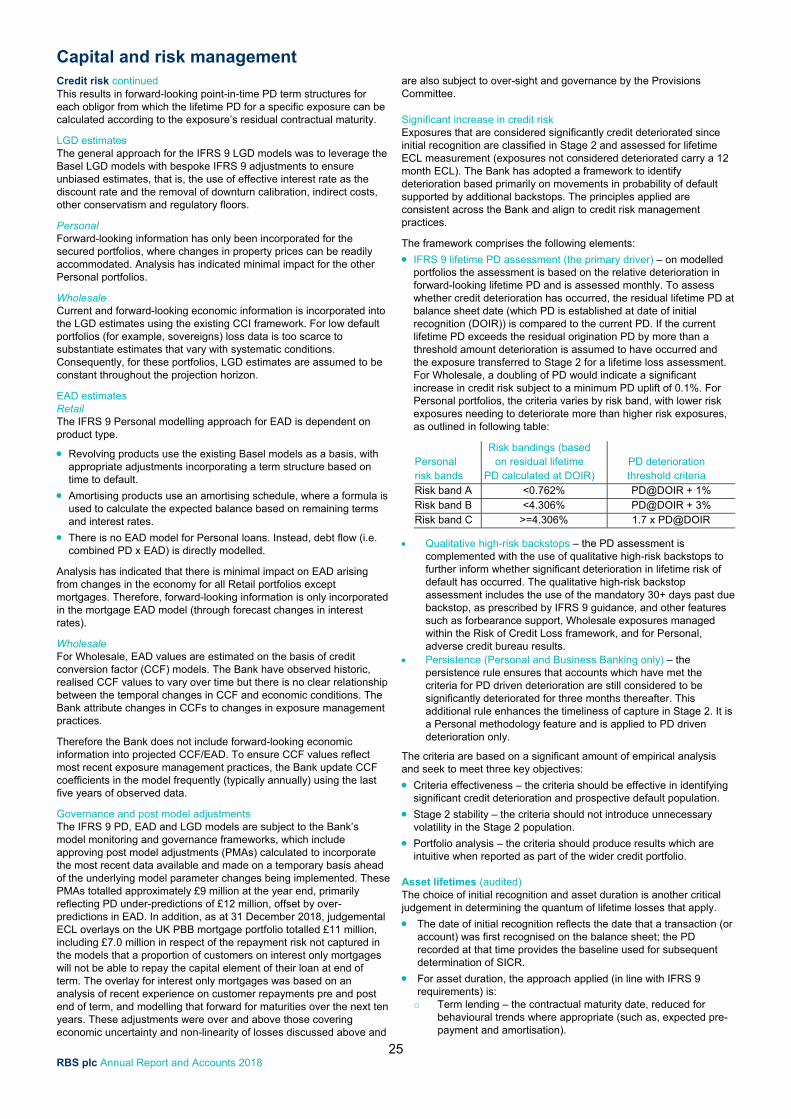
Capital and risk management
25 RBS plc Annual Report and Accounts 2018
Credit risk continued This results in forward-looking point-in-time PD term structures for each obligor from which the lifetime PD for a specific exposure can be calculated according to the exposure’s residual contractual maturity.
LGD estimates The general approach for the IFRS 9 LGD models was to leverage the Basel LGD models with bespoke IFRS 9 adjustments to ensure unbiased estimates, that is, the use of effective interest rate as the discount rate and the removal of downturn calibration, indirect costs, other conservatism and regulatory floors.
Personal Forward-looking information has only been incorporated for the secured portfolios, where changes in property prices can be readily accommodated. Analysis has indicated minimal impact for the other Personal portfolios.
Wholesale Current and forward-looking economic information is incorporated into the LGD estimates using the existing CCI framework. For low default portfolios (for example, sovereigns) loss data is too scarce to substantiate estimates that vary with systematic conditions. Consequently, for these portfolios, LGD estimates are assumed to be constant throughout the projection horizon.
EAD estimates Retail The IFRS 9 Personal modelling approach for EAD is dependent on product type.
Revolving products use the existing Basel models as a basis, with appropriate adjustments incorporating a term structure based on time to default.
Amortising products use an amortising schedule, where a formula is used to calculate the expected balance based on remaining terms and interest rates.
There is no EAD model for Personal loans. Instead, debt flow (i.e. combined PD x EAD) is directly modelled.
Analysis has indicated that there is minimal impact on EAD arising from changes in the economy for all Retail portfolios except mortgages. Therefore, forward-looking information is only incorporated in the mortgage EAD model (through forecast changes in interest rates).
Wholesale For Wholesale, EAD values are estimated on the basis of credit conversion factor (CCF) models. The Bank have observed historic, realised CCF values to vary over time but there is no clear relationship between the temporal changes in CCF and economic conditions. The Bank attribute changes in CCFs to changes in exposure management practices.
Therefore the Bank does not include forward-looking economic information into projected CCF/EAD. To ensure CCF values reflect most recent exposure management practices, the Bank update CCF coefficients in the model frequently (typically annually) using the last five years of observed data.
Governance and post model adjustments The IFRS 9 PD, EAD and LGD models are subject to the Bank’s model monitoring and governance frameworks, which include approving post model adjustments (PMAs) calculated to incorporate the most recent data available and made on a temporary basis ahead of the underlying model parameter changes being implemented. These PMAs totalled approximately £9 million at the year end, primarily reflecting PD under-predictions of £12 million, offset by over-predictions in EAD. In addition, as at 31 December 2018, judgemental ECL overlays on the UK PBB mortgage portfolio totalled £11 million, including £7.0 million in respect of the repayment risk not captured in the models that a proportion of customers on interest only mortgages will not be able to repay the capital element of their loan at end of term. The overlay for interest only mortgages was based on an analysis of recent experience on customer repayments pre and post end of term, and modelling that forward for maturities over the next ten years. These adjustments were over and above those covering economic uncertainty and non-linearity of losses discussed above and
are also subject to over-sight and governance by the Provisions Committee. Significant increase in credit risk Exposures that are considered significantly credit deteriorated since initial recognition are classified in Stage 2 and assessed for lifetime ECL measurement (exposures not considered deteriorated carry a 12 month ECL). The Bank has adopted a framework to identify deterioration based primarily on movements in probability of default supported by additional backstops. The principles applied are consistent across the Bank and align to credit risk management practices.
The framework comprises the following elements:
IFRS 9 lifetime PD assessment (the primary driver) – on modelled portfolios the assessment is based on the relative deterioration in forward-looking lifetime PD and is assessed monthly. To assess whether credit deterioration has occurred, the residual lifetime PD at balance sheet date (which PD is established at date of initial recognition (DOIR)) is compared to the current PD. If the current lifetime PD exceeds the residual origination PD by more than a threshold amount deterioration is assumed to have occurred and the exposure transferred to Stage 2 for a lifetime loss assessment. For Wholesale, a doubling of PD would indicate a significant increase in credit risk subject to a minimum PD uplift of 0.1%. For Personal portfolios, the criteria varies by risk band, with lower risk exposures needing to deteriorate more than higher risk exposures, as outlined in following table:
Personal risk bands
Risk bandings (based on residual lifetime
PD calculated at DOIR) PD deterioration threshold criteria
Risk band A <0.762% PD@DOIR + 1% Risk band B <4.306% PD@DOIR + 3% Risk band C >=4.306% 1.7 x PD@DOIR
Qualitative high-risk backstops – the PD assessment is complemented with the use of qualitative high-risk backstops to further inform whether significant deterioration in lifetime risk of default has occurred. The qualitative high-risk backstop assessment includes the use of the mandatory 30+ days past due backstop, as prescribed by IFRS 9 guidance, and other features such as forbearance support, Wholesale exposures managed within the Risk of Credit Loss framework, and for Personal, adverse credit bureau results.
Persistence (Personal and Business Banking only) – the persistence rule ensures that accounts which have met the criteria for PD driven deterioration are still considered to be significantly deteriorated for three months thereafter. This additional rule enhances the timeliness of capture in Stage 2. It is a Personal methodology feature and is applied to PD driven deterioration only.
The criteria are based on a significant amount of empirical analysis and seek to meet three key objectives:
Criteria effectiveness – the criteria should be effective in identifying significant credit deterioration and prospective default population.
Stage 2 stability – the criteria should not introduce unnecessary volatility in the Stage 2 population.
Portfolio analysis – the criteria should produce results which are intuitive when reported as part of the wider credit portfolio.
Asset lifetimes (audited) The choice of initial recognition and asset duration is another critical judgement in determining the quantum of lifetime losses that apply.
The date of initial recognition reflects the date that a transaction (or account) was first recognised on the balance sheet; the PD recorded at that time provides the baseline used for subsequent determination of SICR.
For asset duration, the approach applied (in line with IFRS 9 requirements) is: o Term lending – the contractual maturity date, reduced for
behavioural trends where appropriate (such as, expected pre-payment and amortisation).
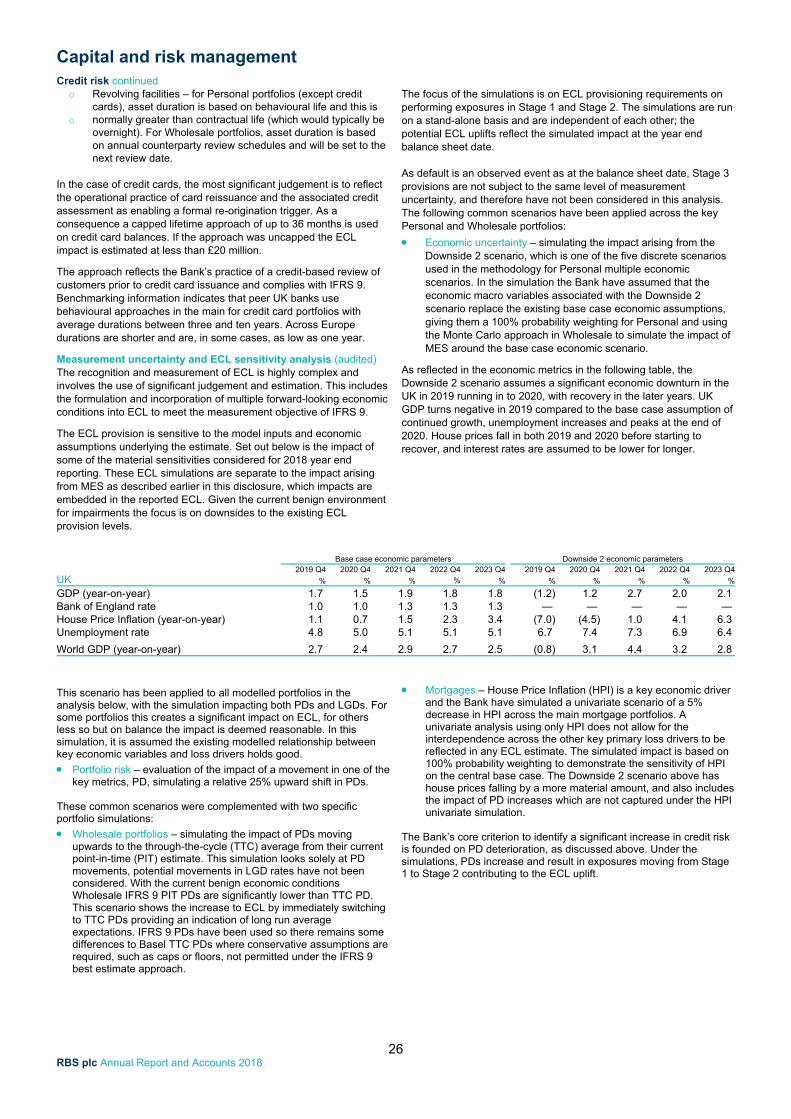
Capital and risk management
26 RBS plc Annual Report and Accounts 2018
Credit risk continued o Revolving facilities – for Personal portfolios (except credit
cards), asset duration is based on behavioural life and this is o normally greater than contractual life (which would typically be
overnight). For Wholesale portfolios, asset duration is based on annual counterparty review schedules and will be set to the next review date.
In the case of credit cards, the most significant judgement is to reflect the operational practice of card reissuance and the associated credit assessment as enabling a formal re-origination trigger. As a consequence a capped lifetime approach of up to 36 months is used on credit card balances. If the approach was uncapped the ECL impact is estimated at less than £20 million.
The approach reflects the Bank’s practice of a credit-based review of customers prior to credit card issuance and complies with IFRS 9. Benchmarking information indicates that peer UK banks use behavioural approaches in the main for credit card portfolios with average durations between three and ten years. Across Europe durations are shorter and are, in some cases, as low as one year.
Measurement uncertainty and ECL sensitivity analysis (audited) The recognition and measurement of ECL is highly complex and involves the use of significant judgement and estimation. This includes the formulation and incorporation of multiple forward-looking economic conditions into ECL to meet the measurement objective of IFRS 9.
The ECL provision is sensitive to the model inputs and economic assumptions underlying the estimate. Set out below is the impact of some of the material sensitivities considered for 2018 year end reporting. These ECL simulations are separate to the impact arising from MES as described earlier in this disclosure, which impacts are embedded in the reported ECL. Given the current benign environment for impairments the focus is on downsides to the existing ECL provision levels.
The focus of the simulations is on ECL provisioning requirements on performing exposures in Stage 1 and Stage 2. The simulations are run on a stand-alone basis and are independent of each other; the potential ECL uplifts reflect the simulated impact at the year end balance sheet date. As default is an observed event as at the balance sheet date, Stage 3 provisions are not subject to the same level of measurement uncertainty, and therefore have not been considered in this analysis. The following common scenarios have been applied across the key Personal and Wholesale portfolios:
Economic uncertainty – simulating the impact arising from the Downside 2 scenario, which is one of the five discrete scenarios used in the methodology for Personal multiple economic scenarios. In the simulation the Bank have assumed that the economic macro variables associated with the Downside 2 scenario replace the existing base case economic assumptions, giving them a 100% probability weighting for Personal and using the Monte Carlo approach in Wholesale to simulate the impact of MES around the base case economic scenario.
As reflected in the economic metrics in the following table, the Downside 2 scenario assumes a significant economic downturn in the UK in 2019 running in to 2020, with recovery in the later years. UK GDP turns negative in 2019 compared to the base case assumption of continued growth, unemployment increases and peaks at the end of 2020. House prices fall in both 2019 and 2020 before starting to recover, and interest rates are assumed to be lower for longer.
Base case economic parameters Downside 2 economic parameters
UK 2019 Q4 2020 Q4 2021 Q4 2022 Q4 2023 Q4 2019 Q4 2020 Q4 2021 Q4 2022 Q4 2023 Q4
% % % % % % % % % %
GDP (year-on-year) 1.7 1.5 1.9 1.8 1.8 (1.2) 1.2 2.7 2.0 2.1 Bank of England rate 1.0 1.0 1.3 1.3 1.3 — — — — — House Price Inflation (year-on-year) 1.1 0.7 1.5 2.3 3.4 (7.0) (4.5) 1.0 4.1 6.3 Unemployment rate 4.8 5.0 5.1 5.1 5.1 6.7 7.4 7.3 6.9 6.4
World GDP (year-on-year) 2.7 2.4 2.9 2.7 2.5 (0.8) 3.1 4.4 3.2 2.8 This scenario has been applied to all modelled portfolios in the analysis below, with the simulation impacting both PDs and LGDs. For some portfolios this creates a significant impact on ECL, for others less so but on balance the impact is deemed reasonable. In this simulation, it is assumed the existing modelled relationship between key economic variables and loss drivers holds good.
Portfolio risk – evaluation of the impact of a movement in one of the key metrics, PD, simulating a relative 25% upward shift in PDs.
These common scenarios were complemented with two specific portfolio simulations:
Wholesale portfolios – simulating the impact of PDs moving upwards to the through-the-cycle (TTC) average from their current point-in-time (PIT) estimate. This simulation looks solely at PD movements, potential movements in LGD rates have not been considered. With the current benign economic conditions Wholesale IFRS 9 PIT PDs are significantly lower than TTC PD. This scenario shows the increase to ECL by immediately switching to TTC PDs providing an indication of long run average expectations. IFRS 9 PDs have been used so there remains some differences to Basel TTC PDs where conservative assumptions are required, such as caps or floors, not permitted under the IFRS 9 best estimate approach.
Mortgages – House Price Inflation (HPI) is a key economic driver and the Bank have simulated a univariate scenario of a 5% decrease in HPI across the main mortgage portfolios. A univariate analysis using only HPI does not allow for the interdependence across the other key primary loss drivers to be reflected in any ECL estimate. The simulated impact is based on 100% probability weighting to demonstrate the sensitivity of HPI on the central base case. The Downside 2 scenario above has house prices falling by a more material amount, and also includes the impact of PD increases which are not captured under the HPI univariate simulation.
The Bank’s core criterion to identify a significant increase in credit risk is founded on PD deterioration, as discussed above. Under the simulations, PDs increase and result in exposures moving from Stage 1 to Stage 2 contributing to the ECL uplift.
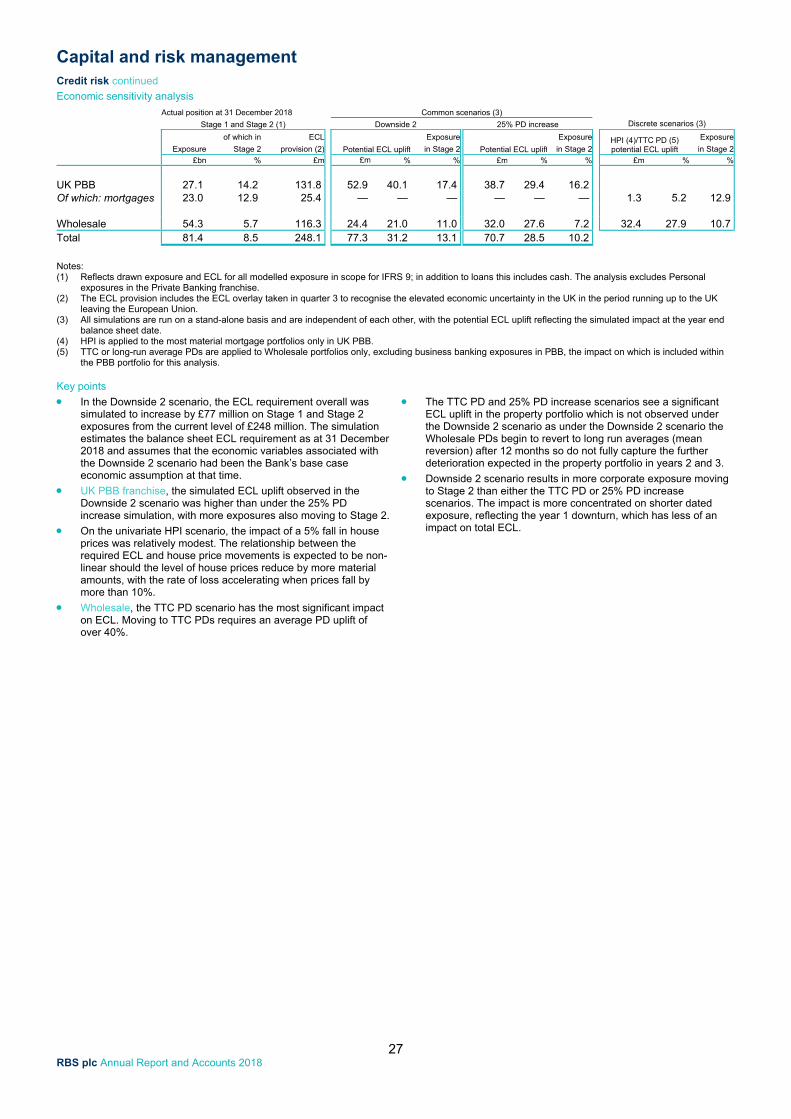
Capital and risk management
27 RBS plc Annual Report and Accounts 2018
Credit risk continued
Economic sensitivity analysis
Actual position at 31 December 2018 Common scenarios (3)
Stage 1 and Stage 2 (1) Downside 2 25% PD increase Discrete scenarios (3)
of which in ECL Exposure Exposure HPI (4)/TTC PD (5) potential ECL uplift
Exposure
Exposure Stage 2 provision (2) Potential ECL uplift in Stage 2 Potential ECL uplift in Stage 2 in Stage 2
£bn % £m £m % % £m % % £m % %
UK PBB 27.1 14.2 131.8 52.9 40.1 17.4 38.7 29.4 16.2 Of which: mortgages 23.0 12.9 25.4 — — — — — — 1.3 5.2 12.9 Wholesale 54.3 5.7 116.3 24.4 21.0 11.0 32.0 27.6 7.2 32.4 27.9 10.7 Total 81.4 8.5 248.1 77.3 31.2 13.1 70.7 28.5 10.2
Notes: (1) Reflects drawn exposure and ECL for all modelled exposure in scope for IFRS 9; in addition to loans this includes cash. The analysis excludes Personal
exposures in the Private Banking franchise. (2) The ECL provision includes the ECL overlay taken in quarter 3 to recognise the elevated economic uncertainty in the UK in the period running up to the UK
leaving the European Union. (3) All simulations are run on a stand-alone basis and are independent of each other, with the potential ECL uplift reflecting the simulated impact at the year end
balance sheet date. (4) HPI is applied to the most material mortgage portfolios only in UK PBB. (5) TTC or long-run average PDs are applied to Wholesale portfolios only, excluding business banking exposures in PBB, the impact on which is included within
the PBB portfolio for this analysis. Key points
In the Downside 2 scenario, the ECL requirement overall was simulated to increase by £77 million on Stage 1 and Stage 2 exposures from the current level of £248 million. The simulation estimates the balance sheet ECL requirement as at 31 December 2018 and assumes that the economic variables associated with the Downside 2 scenario had been the Bank’s base case economic assumption at that time.
UK PBB franchise, the simulated ECL uplift observed in the Downside 2 scenario was higher than under the 25% PD increase simulation, with more exposures also moving to Stage 2.
On the univariate HPI scenario, the impact of a 5% fall in house prices was relatively modest. The relationship between the required ECL and house price movements is expected to be non-linear should the level of house prices reduce by more material amounts, with the rate of loss accelerating when prices fall by more than 10%.
Wholesale, the TTC PD scenario has the most significant impact on ECL. Moving to TTC PDs requires an average PD uplift of over 40%.
The TTC PD and 25% PD increase scenarios see a significant ECL uplift in the property portfolio which is not observed under the Downside 2 scenario as under the Downside 2 scenario the Wholesale PDs begin to revert to long run averages (mean reversion) after 12 months so do not fully capture the further deterioration expected in the property portfolio in years 2 and 3.
Downside 2 scenario results in more corporate exposure moving to Stage 2 than either the TTC PD or 25% PD increase scenarios. The impact is more concentrated on shorter dated exposure, reflecting the year 1 downturn, which has less of an impact on total ECL.
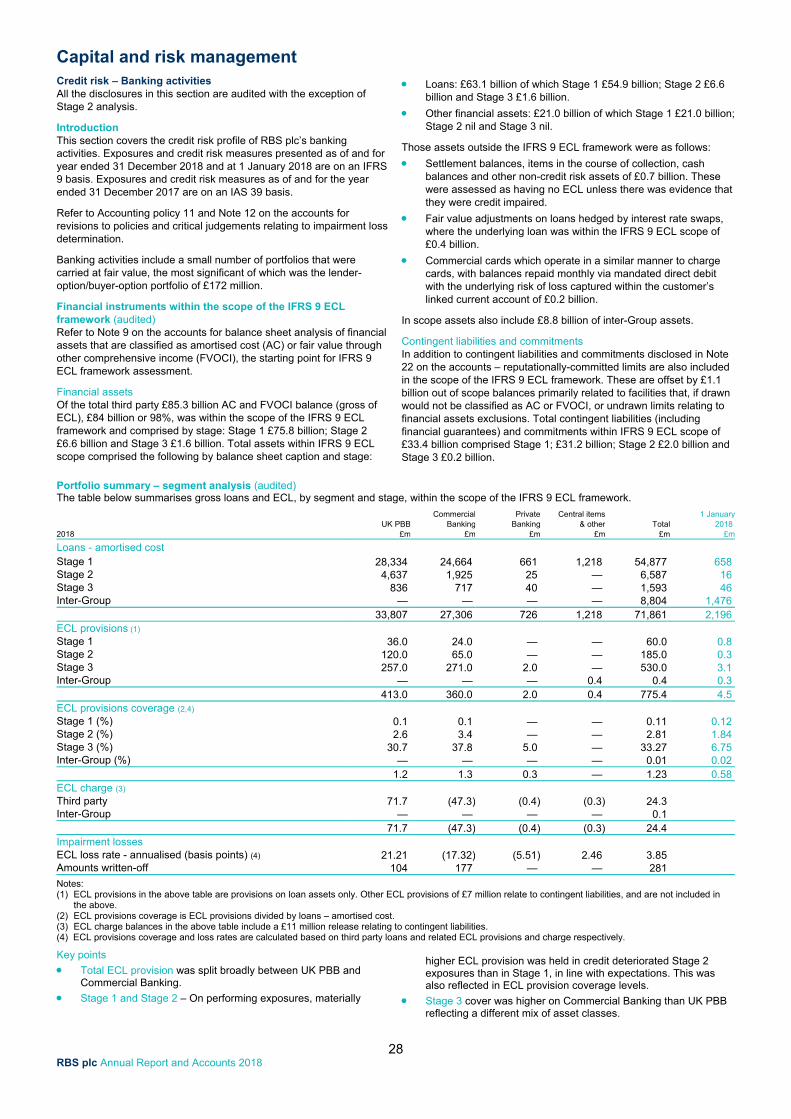
Capital and risk management
28 RBS plc Annual Report and Accounts 2018
Credit risk – Banking activities All the disclosures in this section are audited with the exception of Stage 2 analysis.
Introduction This section covers the credit risk profile of RBS plc’s banking activities. Exposures and credit risk measures presented as of and for year ended 31 December 2018 and at 1 January 2018 are on an IFRS 9 basis. Exposures and credit risk measures as of and for the year ended 31 December 2017 are on an IAS 39 basis.
Refer to Accounting policy 11 and Note 12 on the accounts for revisions to policies and critical judgements relating to impairment loss determination.
Banking activities include a small number of portfolios that were carried at fair value, the most significant of which was the lender-option/buyer-option portfolio of £172 million.
Financial instruments within the scope of the IFRS 9 ECL framework (audited) Refer to Note 9 on the accounts for balance sheet analysis of financial assets that are classified as amortised cost (AC) or fair value through other comprehensive income (FVOCI), the starting point for IFRS 9 ECL framework assessment.
Financial assets Of the total third party £85.3 billion AC and FVOCI balance (gross of ECL), £84 billion or 98%, was within the scope of the IFRS 9 ECL framework and comprised by stage: Stage 1 £75.8 billion; Stage 2 £6.6 billion and Stage 3 £1.6 billion. Total assets within IFRS 9 ECL scope comprised the following by balance sheet caption and stage:
Loans: £63.1 billion of which Stage 1 £54.9 billion; Stage 2 £6.6 billion and Stage 3 £1.6 billion.
Other financial assets: £21.0 billion of which Stage 1 £21.0 billion; Stage 2 nil and Stage 3 nil.
Those assets outside the IFRS 9 ECL framework were as follows:
Settlement balances, items in the course of collection, cash balances and other non-credit risk assets of £0.7 billion. These were assessed as having no ECL unless there was evidence that they were credit impaired.
Fair value adjustments on loans hedged by interest rate swaps, where the underlying loan was within the IFRS 9 ECL scope of £0.4 billion.
Commercial cards which operate in a similar manner to charge cards, with balances repaid monthly via mandated direct debit with the underlying risk of loss captured within the customer’s linked current account of £0.2 billion.
In scope assets also include £8.8 billion of inter-Group assets.
Contingent liabilities and commitments In addition to contingent liabilities and commitments disclosed in Note 22 on the accounts – reputationally-committed limits are also included in the scope of the IFRS 9 ECL framework. These are offset by £1.1 billion out of scope balances primarily related to facilities that, if drawn would not be classified as AC or FVOCI, or undrawn limits relating to financial assets exclusions. Total contingent liabilities (including financial guarantees) and commitments within IFRS 9 ECL scope of £33.4 billion comprised Stage 1; £31.2 billion; Stage 2 £2.0 billion and Stage 3 £0.2 billion.
Portfolio summary – segment analysis (audited) The table below summarises gross loans and ECL, by segment and stage, within the scope of the IFRS 9 ECL framework. Commercial Private Central items 1 January UK PBB Banking Banking & other Total 2018 2018 £m £m £m £m £m £m
Loans - amortised cost Stage 1 28,334 24,664 661 1,218 54,877 658 Stage 2 4,637 1,925 25 — 6,587 16 Stage 3 836 717 40 — 1,593 46 Inter-Group — — — — 8,804 1,476 33,807 27,306 726 1,218 71,861 2,196 ECL provisions (1) Stage 1 36.0 24.0 — — 60.0 0.8 Stage 2 120.0 65.0 — — 185.0 0.3 Stage 3 257.0 271.0 2.0 — 530.0 3.1 Inter-Group — — — 0.4 0.4 0.3 413.0 360.0 2.0 0.4 775.4 4.5 ECL provisions coverage (2,4) Stage 1 (%) 0.1 0.1 — — 0.11 0.12 Stage 2 (%) 2.6 3.4 — — 2.81 1.84 Stage 3 (%) 30.7 37.8 5.0 — 33.27 6.75 Inter-Group (%) — — — — 0.01 0.02 1.2 1.3 0.3 — 1.23 0.58 ECL charge (3) Third party 71.7 (47.3) (0.4) (0.3) 24.3 Inter-Group — — — — 0.1 71.7 (47.3) (0.4) (0.3) 24.4 Impairment losses ECL loss rate - annualised (basis points) (4) 21.21 (17.32) (5.51) 2.46 3.85 Amounts written-off 104 177 — — 281
Notes: (1) ECL provisions in the above table are provisions on loan assets only. Other ECL provisions of £7 million relate to contingent liabilities, and are not included in
the above. (2) ECL provisions coverage is ECL provisions divided by loans – amortised cost. (3) ECL charge balances in the above table include a £11 million release relating to contingent liabilities. (4) ECL provisions coverage and loss rates are calculated based on third party loans and related ECL provisions and charge respectively. Key points
Total ECL provision was split broadly between UK PBB and Commercial Banking.
Stage 1 and Stage 2 – On performing exposures, materially
higher ECL provision was held in credit deteriorated Stage 2 exposures than in Stage 1, in line with expectations. This was also reflected in ECL provision coverage levels.
Stage 3 cover was higher on Commercial Banking than UK PBB reflecting a different mix of asset classes.
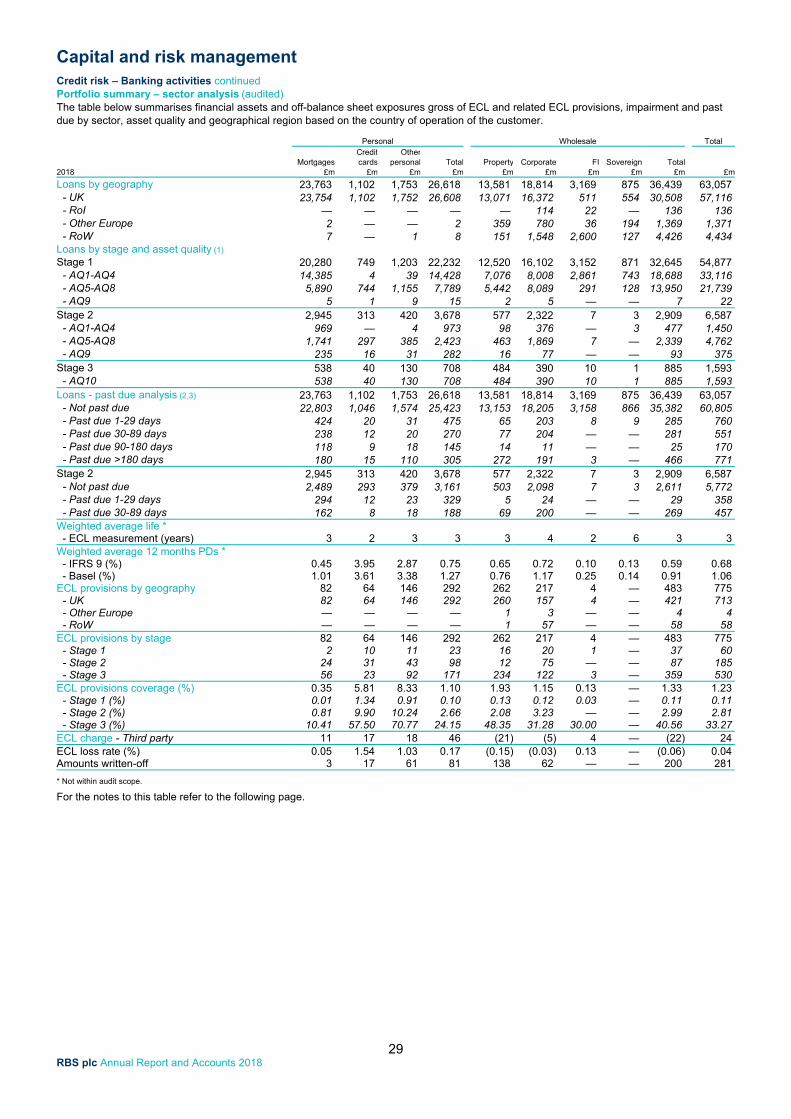
Capital and risk management
29 RBS plc Annual Report and Accounts 2018
Credit risk – Banking activities continued Portfolio summary – sector analysis (audited) The table below summarises financial assets and off-balance sheet exposures gross of ECL and related ECL provisions, impairment and past due by sector, asset quality and geographical region based on the country of operation of the customer.
Personal Wholesale Total Credit Other Mortgages cards personal Total Property Corporate FI Sovereign Total2018 £m £m £m £m £m £m £m £m £m £m
Loans by geography 23,763 1,102 1,753 26,618 13,581 18,814 3,169 875 36,439 63,057 - UK 23,754 1,102 1,752 26,608 13,071 16,372 511 554 30,508 57,116 - RoI — — — — — 114 22 — 136 136 - Other Europe 2 — — 2 359 780 36 194 1,369 1,371 - RoW 7 — 1 8 151 1,548 2,600 127 4,426 4,434 Loans by stage and asset quality (1) Stage 1 20,280 749 1,203 22,232 12,520 16,102 3,152 871 32,645 54,877 - AQ1-AQ4 14,385 4 39 14,428 7,076 8,008 2,861 743 18,688 33,116 - AQ5-AQ8 5,890 744 1,155 7,789 5,442 8,089 291 128 13,950 21,739 - AQ9 5 1 9 15 2 5 — — 7 22 Stage 2 2,945 313 420 3,678 577 2,322 7 3 2,909 6,587 - AQ1-AQ4 969 — 4 973 98 376 — 3 477 1,450 - AQ5-AQ8 1,741 297 385 2,423 463 1,869 7 — 2,339 4,762 - AQ9 235 16 31 282 16 77 — — 93 375 Stage 3 538 40 130 708 484 390 10 1 885 1,593 - AQ10 538 40 130 708 484 390 10 1 885 1,593 Loans - past due analysis (2,3) 23,763 1,102 1,753 26,618 13,581 18,814 3,169 875 36,439 63,057 - Not past due 22,803 1,046 1,574 25,423 13,153 18,205 3,158 866 35,382 60,805 - Past due 1-29 days 424 20 31 475 65 203 8 9 285 760 - Past due 30-89 days 238 12 20 270 77 204 — — 281 551 - Past due 90-180 days 118 9 18 145 14 11 — — 25 170 - Past due >180 days 180 15 110 305 272 191 3 — 466 771 Stage 2 2,945 313 420 3,678 577 2,322 7 3 2,909 6,587 - Not past due 2,489 293 379 3,161 503 2,098 7 3 2,611 5,772 - Past due 1-29 days 294 12 23 329 5 24 — — 29 358 - Past due 30-89 days 162 8 18 188 69 200 — — 269 457 Weighted average life *
- ECL measurement (years) 3 2 3 3 3 4 2 6 3 3 Weighted average 12 months PDs * - IFRS 9 (%) 0.45 3.95 2.87 0.75 0.65 0.72 0.10 0.13 0.59 0.68 - Basel (%) 1.01 3.61 3.38 1.27 0.76 1.17 0.25 0.14 0.91 1.06 ECL provisions by geography 82 64 146 292 262 217 4 — 483 775 - UK 82 64 146 292 260 157 4 — 421 713 - Other Europe — — — — 1 3 — — 4 4 - RoW — — — — 1 57 — — 58 58 ECL provisions by stage 82 64 146 292 262 217 4 — 483 775 - Stage 1 2 10 11 23 16 20 1 — 37 60 - Stage 2 24 31 43 98 12 75 — — 87 185 - Stage 3 56 23 92 171 234 122 3 — 359 530 ECL provisions coverage (%) 0.35 5.81 8.33 1.10 1.93 1.15 0.13 — 1.33 1.23 - Stage 1 (%) 0.01 1.34 0.91 0.10 0.13 0.12 0.03 — 0.11 0.11 - Stage 2 (%) 0.81 9.90 10.24 2.66 2.08 3.23 — — 2.99 2.81 - Stage 3 (%) 10.41 57.50 70.77 24.15 48.35 31.28 30.00 — 40.56 33.27 ECL charge - Third party 11 17 18 46 (21) (5) 4 — (22) 24 ECL loss rate (%) 0.05 1.54 1.03 0.17 (0.15) (0.03) 0.13 — (0.06) 0.04 Amounts written-off 3 17 61 81 138 62 — — 200 281
* Not within audit scope. For the notes to this table refer to the following page.
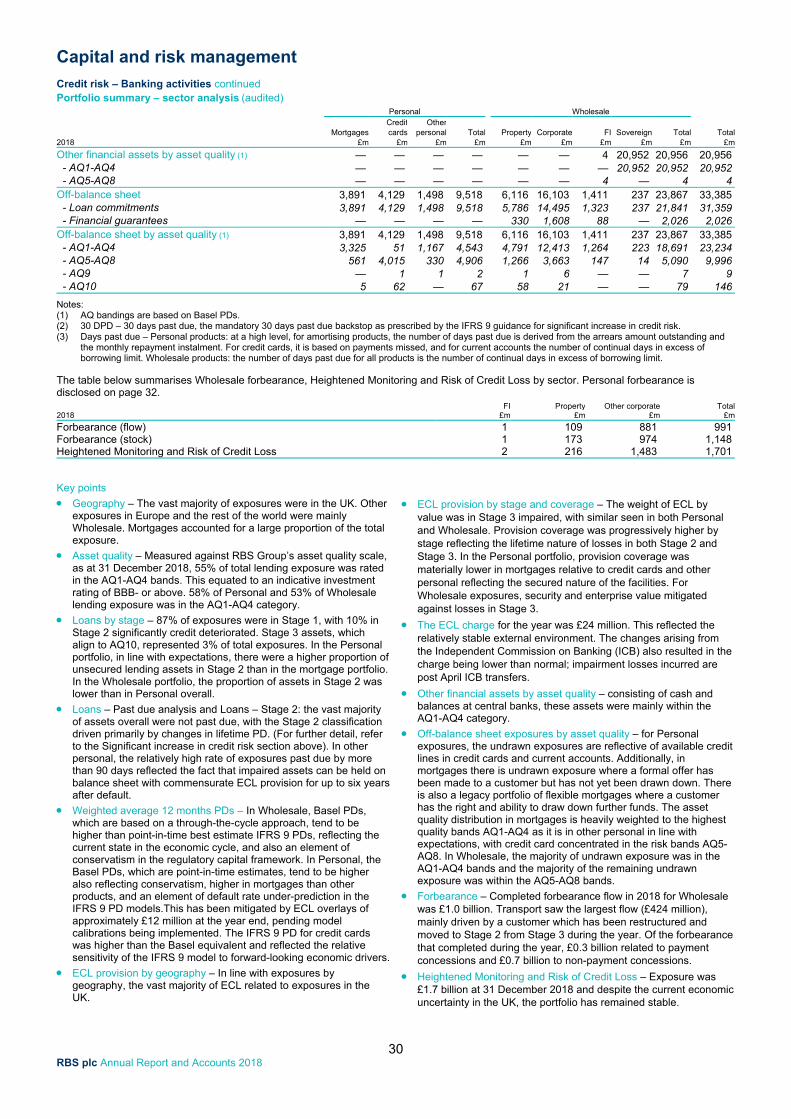
Capital and risk management
30 RBS plc Annual Report and Accounts 2018
Credit risk – Banking activities continued Portfolio summary – sector analysis (audited) Personal Wholesale Credit Other Mortgages cards personal Total Property Corporate FI Sovereign Total Total2018 £m £m £m £m £m £m £m £m £m £m
Other financial assets by asset quality (1) — — — — — — 4 20,952 20,956 20,956 - AQ1-AQ4 — — — — — — — 20,952 20,952 20,952 - AQ5-AQ8 — — — — — — 4 — 4 4 Off-balance sheet 3,891 4,129 1,498 9,518 6,116 16,103 1,411 237 23,867 33,385 - Loan commitments 3,891 4,129 1,498 9,518 5,786 14,495 1,323 237 21,841 31,359 - Financial guarantees — — — — 330 1,608 88 — 2,026 2,026 Off-balance sheet by asset quality (1) 3,891 4,129 1,498 9,518 6,116 16,103 1,411 237 23,867 33,385 - AQ1-AQ4 3,325 51 1,167 4,543 4,791 12,413 1,264 223 18,691 23,234 - AQ5-AQ8 561 4,015 330 4,906 1,266 3,663 147 14 5,090 9,996 - AQ9 — 1 1 2 1 6 — — 7 9 - AQ10 5 62 — 67 58 21 — — 79 146 Notes: (1) AQ bandings are based on Basel PDs. (2) 30 DPD – 30 days past due, the mandatory 30 days past due backstop as prescribed by the IFRS 9 guidance for significant increase in credit risk. (3) Days past due – Personal products: at a high level, for amortising products, the number of days past due is derived from the arrears amount outstanding and
the monthly repayment instalment. For credit cards, it is based on payments missed, and for current accounts the number of continual days in excess of borrowing limit. Wholesale products: the number of days past due for all products is the number of continual days in excess of borrowing limit.
The table below summarises Wholesale forbearance, Heightened Monitoring and Risk of Credit Loss by sector. Personal forbearance is disclosed on page 32. FI Property Other corporate Total2018 £m £m £m £m
Forbearance (flow) 1 109 881 991 Forbearance (stock) 1 173 974 1,148 Heightened Monitoring and Risk of Credit Loss 2 216 1,483 1,701
Key points
Geography – The vast majority of exposures were in the UK. Other exposures in Europe and the rest of the world were mainly Wholesale. Mortgages accounted for a large proportion of the total exposure.
Asset quality – Measured against RBS Group’s asset quality scale, as at 31 December 2018, 55% of total lending exposure was rated in the AQ1-AQ4 bands. This equated to an indicative investment rating of BBB- or above. 58% of Personal and 53% of Wholesale lending exposure was in the AQ1-AQ4 category.
Loans by stage – 87% of exposures were in Stage 1, with 10% in Stage 2 significantly credit deteriorated. Stage 3 assets, which align to AQ10, represented 3% of total exposures. In the Personal portfolio, in line with expectations, there were a higher proportion of unsecured lending assets in Stage 2 than in the mortgage portfolio. In the Wholesale portfolio, the proportion of assets in Stage 2 was lower than in Personal overall.
Loans – Past due analysis and Loans – Stage 2: the vast majority of assets overall were not past due, with the Stage 2 classification driven primarily by changes in lifetime PD. (For further detail, refer to the Significant increase in credit risk section above). In other personal, the relatively high rate of exposures past due by more than 90 days reflected the fact that impaired assets can be held on balance sheet with commensurate ECL provision for up to six years after default.
Weighted average 12 months PDs – In Wholesale, Basel PDs, which are based on a through-the-cycle approach, tend to be higher than point-in-time best estimate IFRS 9 PDs, reflecting the current state in the economic cycle, and also an element of conservatism in the regulatory capital framework. In Personal, the Basel PDs, which are point-in-time estimates, tend to be higher also reflecting conservatism, higher in mortgages than other products, and an element of default rate under-prediction in the IFRS 9 PD models.This has been mitigated by ECL overlays of approximately £12 million at the year end, pending model calibrations being implemented. The IFRS 9 PD for credit cards was higher than the Basel equivalent and reflected the relative sensitivity of the IFRS 9 model to forward-looking economic drivers.
ECL provision by geography – In line with exposures by geography, the vast majority of ECL related to exposures in the UK.
ECL provision by stage and coverage – The weight of ECL by
value was in Stage 3 impaired, with similar seen in both Personal and Wholesale. Provision coverage was progressively higher by stage reflecting the lifetime nature of losses in both Stage 2 and Stage 3. In the Personal portfolio, provision coverage was materially lower in mortgages relative to credit cards and other personal reflecting the secured nature of the facilities. For Wholesale exposures, security and enterprise value mitigated against losses in Stage 3.
The ECL charge for the year was £24 million. This reflected the relatively stable external environment. The changes arising from the Independent Commission on Banking (ICB) also resulted in the charge being lower than normal; impairment losses incurred are post April ICB transfers.
Other financial assets by asset quality – consisting of cash and balances at central banks, these assets were mainly within the AQ1-AQ4 category.
Off-balance sheet exposures by asset quality – for Personal exposures, the undrawn exposures are reflective of available credit lines in credit cards and current accounts. Additionally, in mortgages there is undrawn exposure where a formal offer has been made to a customer but has not yet been drawn down. There is also a legacy portfolio of flexible mortgages where a customer has the right and ability to draw down further funds. The asset quality distribution in mortgages is heavily weighted to the highest quality bands AQ1-AQ4 as it is in other personal in line with expectations, with credit card concentrated in the risk bands AQ5-AQ8. In Wholesale, the majority of undrawn exposure was in the AQ1-AQ4 bands and the majority of the remaining undrawn exposure was within the AQ5-AQ8 bands.
Forbearance – Completed forbearance flow in 2018 for Wholesale was £1.0 billion. Transport saw the largest flow (£424 million), mainly driven by a customer which has been restructured and moved to Stage 2 from Stage 3 during the year. Of the forbearance that completed during the year, £0.3 billion related to payment concessions and £0.7 billion to non-payment concessions.
Heightened Monitoring and Risk of Credit Loss – Exposure was £1.7 billion at 31 December 2018 and despite the current economic uncertainty in the UK, the portfolio has remained stable.
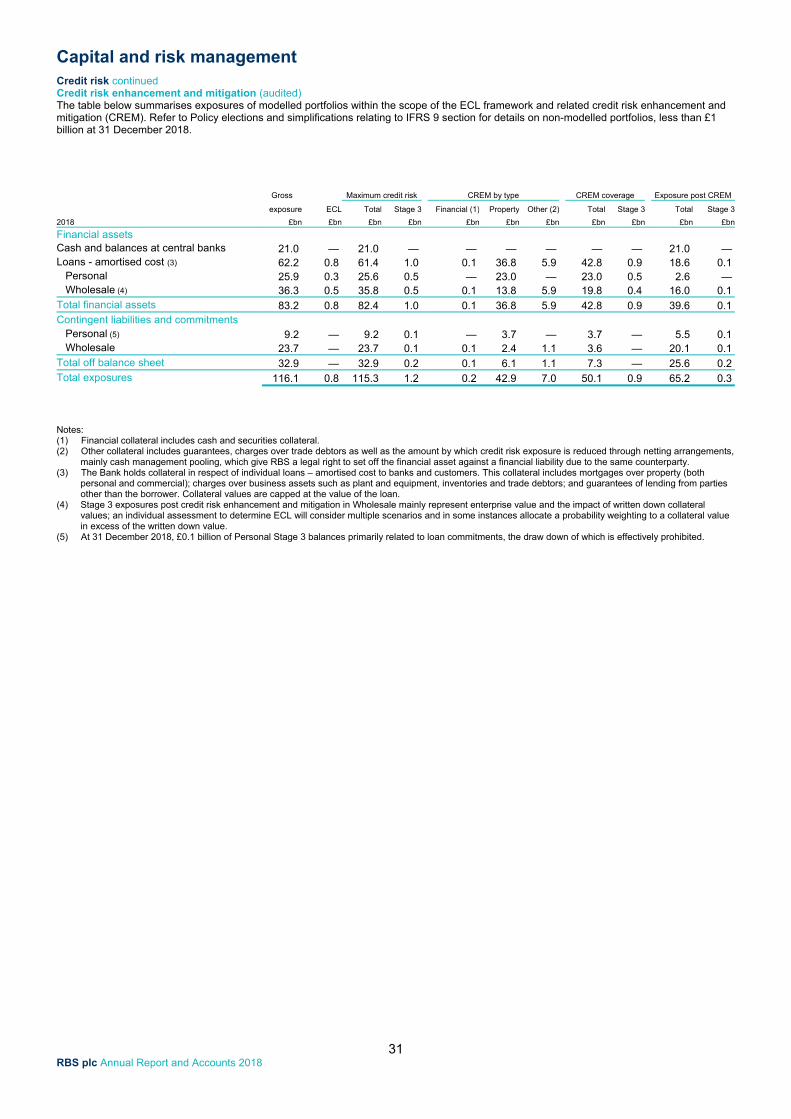
Capital and risk management
31 RBS plc Annual Report and Accounts 2018
Credit risk continued Credit risk enhancement and mitigation (audited) The table below summarises exposures of modelled portfolios within the scope of the ECL framework and related credit risk enhancement and mitigation (CREM). Refer to Policy elections and simplifications relating to IFRS 9 section for details on non-modelled portfolios, less than £1 billion at 31 December 2018.
Gross Maximum credit risk CREM by type CREM coverage Exposure post CREM
exposure ECL Total Stage 3 Financial (1) Property Other (2) Total Stage 3 Total Stage 3
2018 £bn £bn £bn £bn £bn £bn £bn £bn £bn £bn £bn
Financial assets
Cash and balances at central banks 21.0 — 21.0 — — — — — — 21.0 — Loans - amortised cost (3) 62.2 0.8 61.4 1.0 0.1 36.8 5.9 42.8 0.9 18.6 0.1 Personal 25.9 0.3 25.6 0.5 — 23.0 — 23.0 0.5 2.6 — Wholesale (4) 36.3 0.5 35.8 0.5 0.1 13.8 5.9 19.8 0.4 16.0 0.1 Total financial assets 83.2 0.8 82.4 1.0 0.1 36.8 5.9 42.8 0.9 39.6 0.1 Contingent liabilities and commitments Personal (5) 9.2 — 9.2 0.1 — 3.7 — 3.7 — 5.5 0.1 Wholesale 23.7 — 23.7 0.1 0.1 2.4 1.1 3.6 — 20.1 0.1 Total off balance sheet 32.9 — 32.9 0.2 0.1 6.1 1.1 7.3 — 25.6 0.2 Total exposures 116.1 0.8 115.3 1.2 0.2 42.9 7.0 50.1 0.9 65.2 0.3
Notes: (1) Financial collateral includes cash and securities collateral. (2) Other collateral includes guarantees, charges over trade debtors as well as the amount by which credit risk exposure is reduced through netting arrangements,
mainly cash management pooling, which give RBS a legal right to set off the financial asset against a financial liability due to the same counterparty. (3) The Bank holds collateral in respect of individual loans – amortised cost to banks and customers. This collateral includes mortgages over property (both
personal and commercial); charges over business assets such as plant and equipment, inventories and trade debtors; and guarantees of lending from parties other than the borrower. Collateral values are capped at the value of the loan.
(4) Stage 3 exposures post credit risk enhancement and mitigation in Wholesale mainly represent enterprise value and the impact of written down collateral values; an individual assessment to determine ECL will consider multiple scenarios and in some instances allocate a probability weighting to a collateral value in excess of the written down value.
(5) At 31 December 2018, £0.1 billion of Personal Stage 3 balances primarily related to loan commitments, the draw down of which is effectively prohibited.
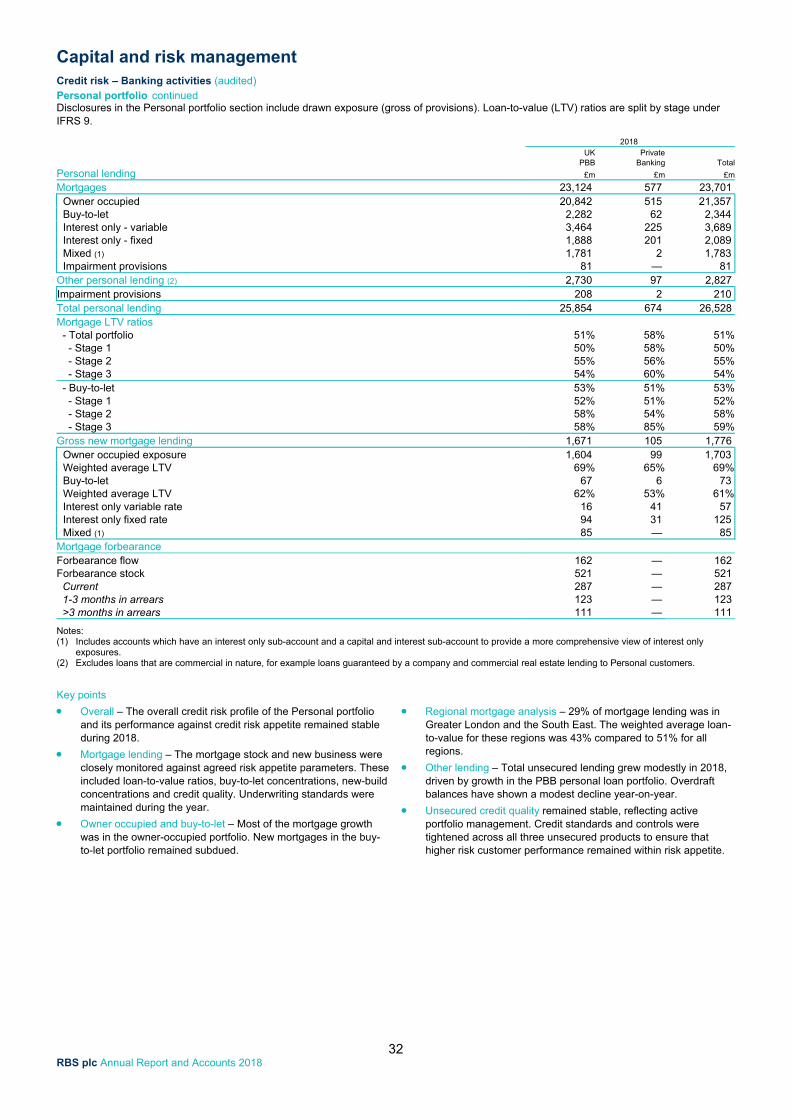
Capital and risk management
32 RBS plc Annual Report and Accounts 2018
Credit risk – Banking activities (audited) Personal portfolio continued Disclosures in the Personal portfolio section include drawn exposure (gross of provisions). Loan-to-value (LTV) ratios are split by stage under IFRS 9.
2018 UK Private PBB Banking Total
Personal lending £m £m £m
Mortgages 23,124 577 23,701 Owner occupied 20,842 515 21,357 Buy-to-let 2,282 62 2,344 Interest only - variable 3,464 225 3,689 Interest only - fixed 1,888 201 2,089 Mixed (1) 1,781 2 1,783 Impairment provisions 81 — 81 Other personal lending (2) 2,730 97 2,827 Impairment provisions 208 2 210 Total personal lending 25,854 674 26,528 Mortgage LTV ratios - Total portfolio 51% 58% 51% - Stage 1 50% 58% 50% - Stage 2 55% 56% 55% - Stage 3 54% 60% 54% - Buy-to-let 53% 51% 53% - Stage 1 52% 51% 52% - Stage 2 58% 54% 58% - Stage 3 58% 85% 59%Gross new mortgage lending 1,671 105 1,776 Owner occupied exposure 1,604 99 1,703 Weighted average LTV 69% 65% 69% Buy-to-let 67 6 73 Weighted average LTV 62% 53% 61% Interest only variable rate 16 41 57 Interest only fixed rate 94 31 125 Mixed (1) 85 — 85 Mortgage forbearance Forbearance flow 162 — 162 Forbearance stock 521 — 521 Current 287 — 287 1-3 months in arrears 123 — 123 >3 months in arrears 111 — 111
Notes: (1) Includes accounts which have an interest only sub-account and a capital and interest sub-account to provide a more comprehensive view of interest only
exposures. (2) Excludes loans that are commercial in nature, for example loans guaranteed by a company and commercial real estate lending to Personal customers.
Key points
Overall – The overall credit risk profile of the Personal portfolio and its performance against credit risk appetite remained stable during 2018.
Mortgage lending – The mortgage stock and new business were closely monitored against agreed risk appetite parameters. These included loan-to-value ratios, buy-to-let concentrations, new-build concentrations and credit quality. Underwriting standards were maintained during the year.
Owner occupied and buy-to-let – Most of the mortgage growth was in the owner-occupied portfolio. New mortgages in the buy-to-let portfolio remained subdued.
Regional mortgage analysis – 29% of mortgage lending was in Greater London and the South East. The weighted average loan-to-value for these regions was 43% compared to 51% for all regions.
Other lending – Total unsecured lending grew modestly in 2018, driven by growth in the PBB personal loan portfolio. Overdraft balances have shown a modest decline year-on-year.
Unsecured credit quality remained stable, reflecting active portfolio management. Credit standards and controls were tightened across all three unsecured products to ensure that higher risk customer performance remained within risk appetite.
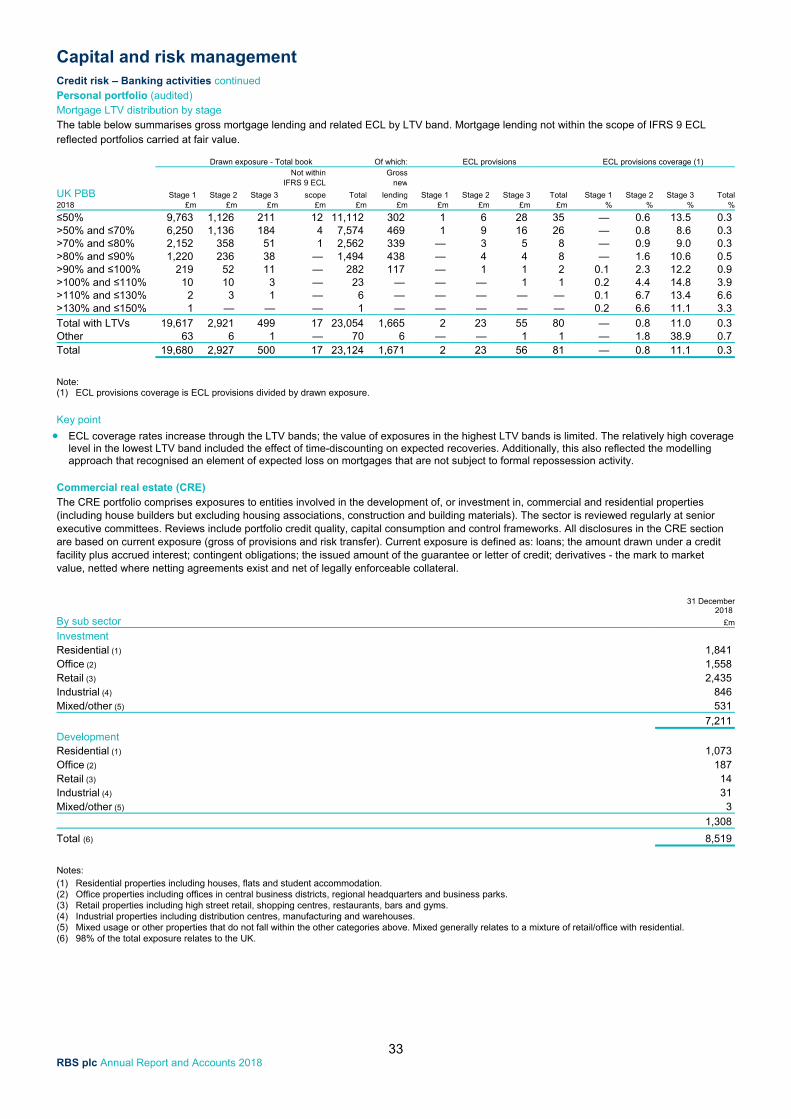
Capital and risk management
33 RBS plc Annual Report and Accounts 2018
Credit risk – Banking activities continued Personal portfolio (audited) Mortgage LTV distribution by stage The table below summarises gross mortgage lending and related ECL by LTV band. Mortgage lending not within the scope of IFRS 9 ECL reflected portfolios carried at fair value.
Drawn exposure - Total book Of which: ECL provisions ECL provisions coverage (1) Not within Gross IFRS 9 ECL new
UK PBB Stage 1 Stage 2 Stage 3 scope Total lending Stage 1 Stage 2 Stage 3 Total Stage 1 Stage 2 Stage 3 Total2018 £m £m £m £m £m £m £m £m £m £m % % % %
≤50% 9,763 1,126 211 12 11,112 302 1 6 28 35 — 0.6 13.5 0.3 >50% and ≤70% 6,250 1,136 184 4 7,574 469 1 9 16 26 — 0.8 8.6 0.3 >70% and ≤80% 2,152 358 51 1 2,562 339 — 3 5 8 — 0.9 9.0 0.3 >80% and ≤90% 1,220 236 38 — 1,494 438 — 4 4 8 — 1.6 10.6 0.5 >90% and ≤100% 219 52 11 — 282 117 — 1 1 2 0.1 2.3 12.2 0.9 >100% and ≤110% 10 10 3 — 23 — — — 1 1 0.2 4.4 14.8 3.9 >110% and ≤130% 2 3 1 — 6 — — — — — 0.1 6.7 13.4 6.6 >130% and ≤150% 1 — — — 1 — — — — — 0.2 6.6 11.1 3.3
Total with LTVs 19,617 2,921 499 17 23,054 1,665 2 23 55 80 — 0.8 11.0 0.3 Other 63 6 1 — 70 6 — — 1 1 — 1.8 38.9 0.7 Total 19,680 2,927 500 17 23,124 1,671 2 23 56 81 — 0.8 11.1 0.3
Note: (1) ECL provisions coverage is ECL provisions divided by drawn exposure.
Key point
ECL coverage rates increase through the LTV bands; the value of exposures in the highest LTV bands is limited. The relatively high coverage level in the lowest LTV band included the effect of time-discounting on expected recoveries. Additionally, this also reflected the modelling approach that recognised an element of expected loss on mortgages that are not subject to formal repossession activity.
Commercial real estate (CRE) The CRE portfolio comprises exposures to entities involved in the development of, or investment in, commercial and residential properties (including house builders but excluding housing associations, construction and building materials). The sector is reviewed regularly at senior executive committees. Reviews include portfolio credit quality, capital consumption and control frameworks. All disclosures in the CRE section are based on current exposure (gross of provisions and risk transfer). Current exposure is defined as: loans; the amount drawn under a credit facility plus accrued interest; contingent obligations; the issued amount of the guarantee or letter of credit; derivatives - the mark to market value, netted where netting agreements exist and net of legally enforceable collateral.
31 December 2018
By sub sector £m
Investment Residential (1) 1,841 Office (2) 1,558 Retail (3) 2,435 Industrial (4) 846 Mixed/other (5) 531
7,211
Development Residential (1) 1,073 Office (2) 187 Retail (3) 14 Industrial (4) 31 Mixed/other (5) 3
1,308
Total (6) 8,519
Notes: (1) Residential properties including houses, flats and student accommodation. (2) Office properties including offices in central business districts, regional headquarters and business parks. (3) Retail properties including high street retail, shopping centres, restaurants, bars and gyms. (4) Industrial properties including distribution centres, manufacturing and warehouses. (5) Mixed usage or other properties that do not fall within the other categories above. Mixed generally relates to a mixture of retail/office with residential. (6) 98% of the total exposure relates to the UK.
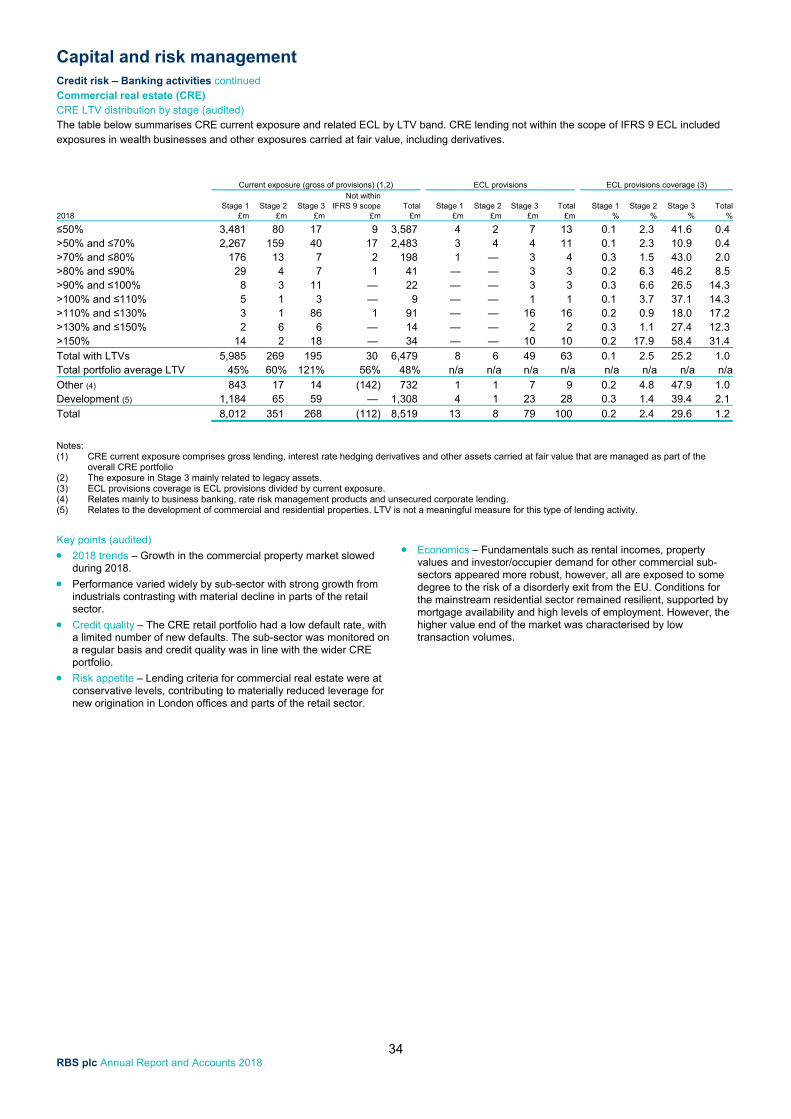
Capital and risk management
34 RBS plc Annual Report and Accounts 2018
Credit risk – Banking activities continued Commercial real estate (CRE) CRE LTV distribution by stage (audited) The table below summarises CRE current exposure and related ECL by LTV band. CRE lending not within the scope of IFRS 9 ECL included exposures in wealth businesses and other exposures carried at fair value, including derivatives.
Current exposure (gross of provisions) (1,2) ECL provisions ECL provisions coverage (3)
Not withinStage 1 Stage 2 Stage 3 IFRS 9 scope Total Stage 1 Stage 2 Stage 3 Total Stage 1 Stage 2 Stage 3 Total
2018 £m £m £m £m £m £m £m £m £m % % % %
≤50% 3,481 80 17 9 3,587 4 2 7 13 0.1 2.3 41.6 0.4 >50% and ≤70% 2,267 159 40 17 2,483 3 4 4 11 0.1 2.3 10.9 0.4 >70% and ≤80% 176 13 7 2 198 1 — 3 4 0.3 1.5 43.0 2.0 >80% and ≤90% 29 4 7 1 41 — — 3 3 0.2 6.3 46.2 8.5 >90% and ≤100% 8 3 11 — 22 — — 3 3 0.3 6.6 26.5 14.3 >100% and ≤110% 5 1 3 — 9 — — 1 1 0.1 3.7 37.1 14.3 >110% and ≤130% 3 1 86 1 91 — — 16 16 0.2 0.9 18.0 17.2 >130% and ≤150% 2 6 6 — 14 — — 2 2 0.3 1.1 27.4 12.3 >150% 14 2 18 — 34 — — 10 10 0.2 17.9 58.4 31.4
Total with LTVs 5,985 269 195 30 6,479 8 6 49 63 0.1 2.5 25.2 1.0 Total portfolio average LTV 45% 60% 121% 56% 48% n/a n/a n/a n/a n/a n/a n/a n/a
Other (4) 843 17 14 (142) 732 1 1 7 9 0.2 4.8 47.9 1.0 Development (5) 1,184 65 59 — 1,308 4 1 23 28 0.3 1.4 39.4 2.1
Total 8,012 351 268 (112) 8,519 13 8 79 100 0.2 2.4 29.6 1.2
Notes: (1) CRE current exposure comprises gross lending, interest rate hedging derivatives and other assets carried at fair value that are managed as part of the
overall CRE portfolio (2) The exposure in Stage 3 mainly related to legacy assets. (3) ECL provisions coverage is ECL provisions divided by current exposure. (4) Relates mainly to business banking, rate risk management products and unsecured corporate lending. (5) Relates to the development of commercial and residential properties. LTV is not a meaningful measure for this type of lending activity.
Key points (audited)
2018 trends – Growth in the commercial property market slowed during 2018.
Performance varied widely by sub-sector with strong growth from industrials contrasting with material decline in parts of the retail sector.
Credit quality – The CRE retail portfolio had a low default rate, with a limited number of new defaults. The sub-sector was monitored on a regular basis and credit quality was in line with the wider CRE portfolio.
Risk appetite – Lending criteria for commercial real estate were at conservative levels, contributing to materially reduced leverage for new origination in London offices and parts of the retail sector.
Economics – Fundamentals such as rental incomes, property values and investor/occupier demand for other commercial sub-sectors appeared more robust, however, all are exposed to some degree to the risk of a disorderly exit from the EU. Conditions for the mainstream residential sector remained resilient, supported by mortgage availability and high levels of employment. However, the higher value end of the market was characterised by low transaction volumes.
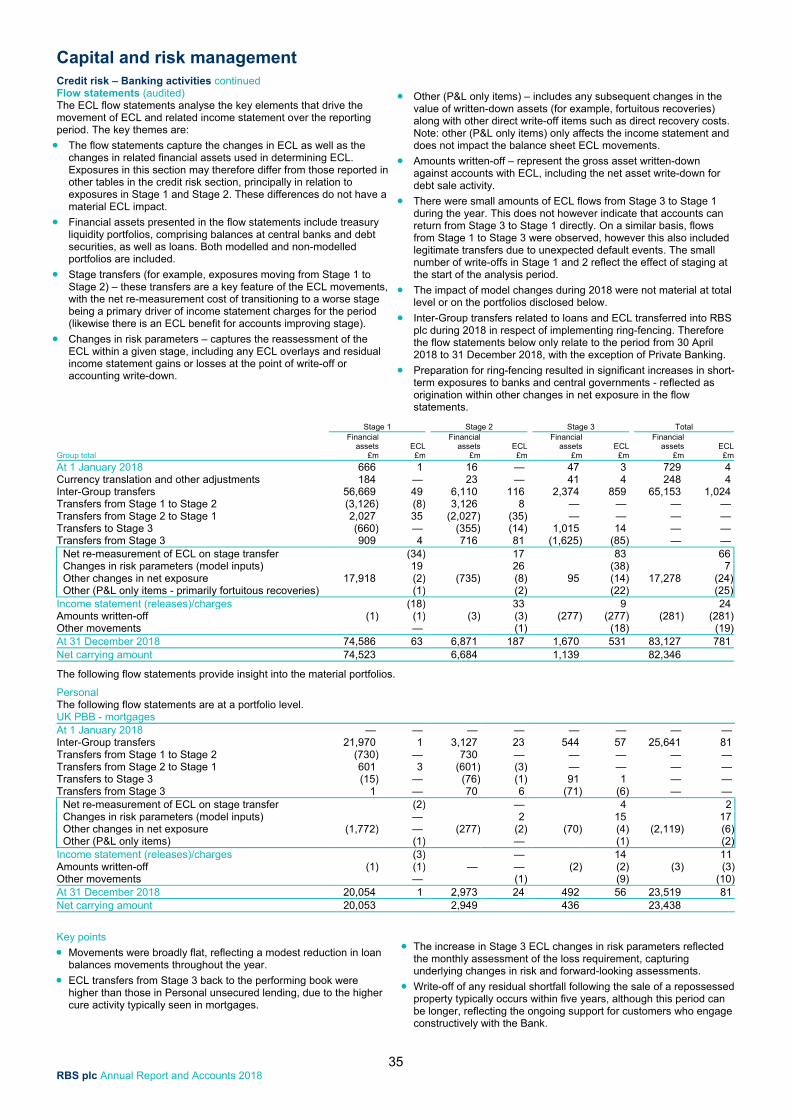
Capital and risk management
35 RBS plc Annual Report and Accounts 2018
Credit risk – Banking activities continued Flow statements (audited) The ECL flow statements analyse the key elements that drive the movement of ECL and related income statement over the reporting period. The key themes are:
The flow statements capture the changes in ECL as well as the changes in related financial assets used in determining ECL. Exposures in this section may therefore differ from those reported in other tables in the credit risk section, principally in relation to exposures in Stage 1 and Stage 2. These differences do not have a material ECL impact.
Financial assets presented in the flow statements include treasury liquidity portfolios, comprising balances at central banks and debt securities, as well as loans. Both modelled and non-modelled portfolios are included.
Stage transfers (for example, exposures moving from Stage 1 to Stage 2) – these transfers are a key feature of the ECL movements, with the net re-measurement cost of transitioning to a worse stage being a primary driver of income statement charges for the period (likewise there is an ECL benefit for accounts improving stage).
Changes in risk parameters – captures the reassessment of the ECL within a given stage, including any ECL overlays and residual income statement gains or losses at the point of write-off or accounting write-down.
Other (P&L only items) – includes any subsequent changes in the value of written-down assets (for example, fortuitous recoveries) along with other direct write-off items such as direct recovery costs. Note: other (P&L only items) only affects the income statement and does not impact the balance sheet ECL movements.
Amounts written-off – represent the gross asset written-down against accounts with ECL, including the net asset write-down for debt sale activity.
There were small amounts of ECL flows from Stage 3 to Stage 1 during the year. This does not however indicate that accounts can return from Stage 3 to Stage 1 directly. On a similar basis, flows from Stage 1 to Stage 3 were observed, however this also included legitimate transfers due to unexpected default events. The small number of write-offs in Stage 1 and 2 reflect the effect of staging at the start of the analysis period.
The impact of model changes during 2018 were not material at total level or on the portfolios disclosed below.
Inter-Group transfers related to loans and ECL transferred into RBS plc during 2018 in respect of implementing ring-fencing. Therefore the flow statements below only relate to the period from 30 April 2018 to 31 December 2018, with the exception of Private Banking.
Preparation for ring-fencing resulted in significant increases in short-term exposures to banks and central governments - reflected as origination within other changes in net exposure in the flow statements.
Stage 1 Stage 2 Stage 3 Total Financial Financial Financial Financial assets ECL assets ECL assets ECL assets ECLGroup total £m £m £m £m £m £m £m £m
At 1 January 2018 666 1 16 — 47 3 729 4 Currency translation and other adjustments 184 — 23 — 41 4 248 4 Inter-Group transfers 56,669 49 6,110 116 2,374 859 65,153 1,024 Transfers from Stage 1 to Stage 2 (3,126) (8) 3,126 8 — — — — Transfers from Stage 2 to Stage 1 2,027 35 (2,027) (35) — — — — Transfers to Stage 3 (660) — (355) (14) 1,015 14 — — Transfers from Stage 3 909 4 716 81 (1,625) (85) — — Net re-measurement of ECL on stage transfer (34) 17 83 66 Changes in risk parameters (model inputs) 19 26 (38) 7 Other changes in net exposure 17,918 (2) (735) (8) 95 (14) 17,278 (24) Other (P&L only items - primarily fortuitous recoveries) (1) (2) (22) (25)Income statement (releases)/charges (18) 33 9 24 Amounts written-off (1) (1) (3) (3) (277) (277) (281) (281)Other movements — (1) (18) (19)At 31 December 2018 74,586 63 6,871 187 1,670 531 83,127 781 Net carrying amount 74,523 6,684 1,139 82,346
The following flow statements provide insight into the material portfolios. Personal The following flow statements are at a portfolio level. UK PBB - mortgages At 1 January 2018 — — — — — — — — Inter-Group transfers 21,970 1 3,127 23 544 57 25,641 81 Transfers from Stage 1 to Stage 2 (730) — 730 — — — — — Transfers from Stage 2 to Stage 1 601 3 (601) (3) — — — — Transfers to Stage 3 (15) — (76) (1) 91 1 — — Transfers from Stage 3 1 — 70 6 (71) (6) — — Net re-measurement of ECL on stage transfer (2) — 4 2 Changes in risk parameters (model inputs) — 2 15 17 Other changes in net exposure (1,772) — (277) (2) (70) (4) (2,119) (6) Other (P&L only items) (1) — (1) (2)Income statement (releases)/charges (3) — 14 11 Amounts written-off (1) (1) — — (2) (2) (3) (3)Other movements — (1) (9) (10)At 31 December 2018 20,054 1 2,973 24 492 56 23,519 81 Net carrying amount 20,053 2,949 436 23,438
Key points
Movements were broadly flat, reflecting a modest reduction in loan balances movements throughout the year.
ECL transfers from Stage 3 back to the performing book were higher than those in Personal unsecured lending, due to the higher cure activity typically seen in mortgages.
The increase in Stage 3 ECL changes in risk parameters reflected the monthly assessment of the loss requirement, capturing underlying changes in risk and forward-looking assessments.
Write-off of any residual shortfall following the sale of a repossessed property typically occurs within five years, although this period can be longer, reflecting the ongoing support for customers who engage constructively with the Bank.
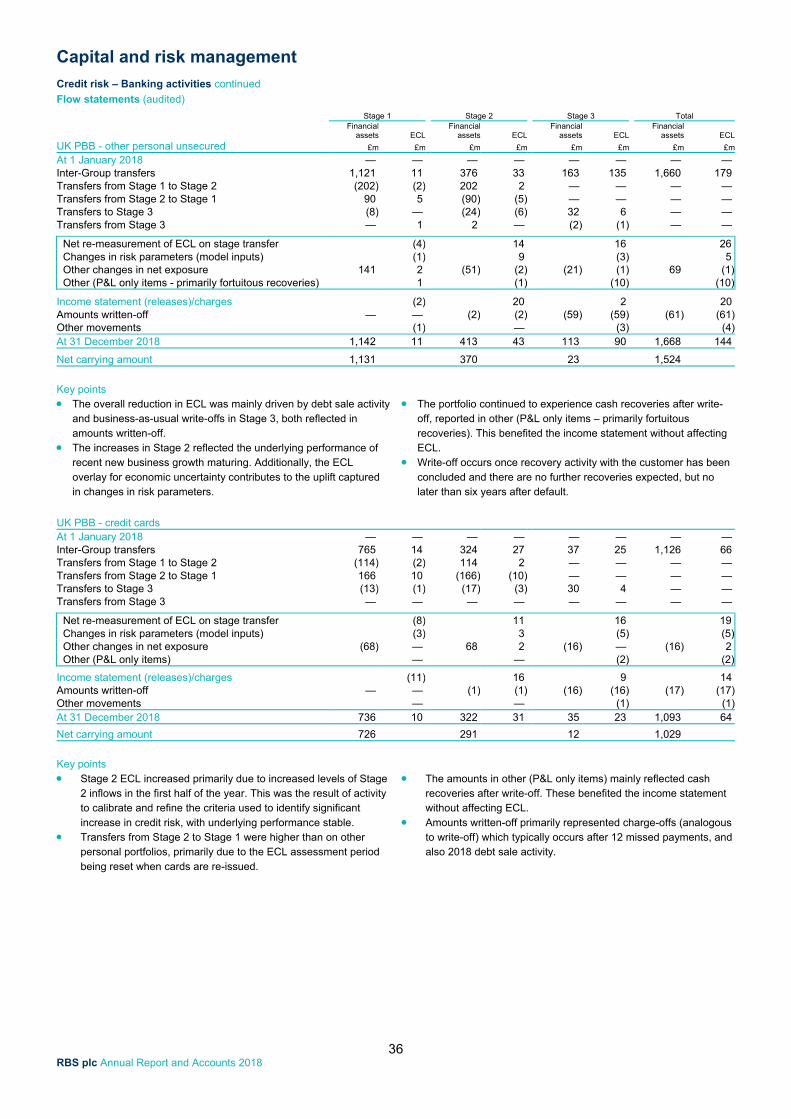
Capital and risk management
36 RBS plc Annual Report and Accounts 2018
Credit risk – Banking activities continued Flow statements (audited) Stage 1 Stage 2 Stage 3 Total Financial Financial Financial Financial assets ECL assets ECL assets ECL assets ECL
UK PBB - other personal unsecured £m £m £m £m £m £m £m £m
At 1 January 2018 — — — — — — — — Inter-Group transfers 1,121 11 376 33 163 135 1,660 179 Transfers from Stage 1 to Stage 2 (202) (2) 202 2 — — — — Transfers from Stage 2 to Stage 1 90 5 (90) (5) — — — — Transfers to Stage 3 (8) — (24) (6) 32 6 — — Transfers from Stage 3 — 1 2 — (2) (1) — —
Net re-measurement of ECL on stage transfer (4) 14 16 26 Changes in risk parameters (model inputs) (1) 9 (3) 5 Other changes in net exposure 141 2 (51) (2) (21) (1) 69 (1) Other (P&L only items - primarily fortuitous recoveries) 1 (1) (10) (10)
Income statement (releases)/charges (2) 20 2 20 Amounts written-off — — (2) (2) (59) (59) (61) (61)Other movements (1) — (3) (4)At 31 December 2018 1,142 11 413 43 113 90 1,668 144
Net carrying amount 1,131 370 23 1,524
Key points The overall reduction in ECL was mainly driven by debt sale activity
and business-as-usual write-offs in Stage 3, both reflected in amounts written-off.
The increases in Stage 2 reflected the underlying performance of recent new business growth maturing. Additionally, the ECL overlay for economic uncertainty contributes to the uplift captured in changes in risk parameters.
The portfolio continued to experience cash recoveries after write-
off, reported in other (P&L only items – primarily fortuitous recoveries). This benefited the income statement without affecting ECL.
Write-off occurs once recovery activity with the customer has been concluded and there are no further recoveries expected, but no later than six years after default.
UK PBB - credit cards At 1 January 2018 — — — — — — — — Inter-Group transfers 765 14 324 27 37 25 1,126 66 Transfers from Stage 1 to Stage 2 (114) (2) 114 2 — — — — Transfers from Stage 2 to Stage 1 166 10 (166) (10) — — — — Transfers to Stage 3 (13) (1) (17) (3) 30 4 — — Transfers from Stage 3 — — — — — — — —
Net re-measurement of ECL on stage transfer (8) 11 16 19 Changes in risk parameters (model inputs) (3) 3 (5) (5) Other changes in net exposure (68) — 68 2 (16) — (16) 2 Other (P&L only items) — — (2) (2)
Income statement (releases)/charges (11) 16 9 14 Amounts written-off — — (1) (1) (16) (16) (17) (17)Other movements — — (1) (1)At 31 December 2018 736 10 322 31 35 23 1,093 64
Net carrying amount 726 291 12 1,029
Key points Stage 2 ECL increased primarily due to increased levels of Stage
2 inflows in the first half of the year. This was the result of activity to calibrate and refine the criteria used to identify significant increase in credit risk, with underlying performance stable.
Transfers from Stage 2 to Stage 1 were higher than on other personal portfolios, primarily due to the ECL assessment period being reset when cards are re-issued.
The amounts in other (P&L only items) mainly reflected cash
recoveries after write-off. These benefited the income statement without affecting ECL.
Amounts written-off primarily represented charge-offs (analogous to write-off) which typically occurs after 12 missed payments, and also 2018 debt sale activity.
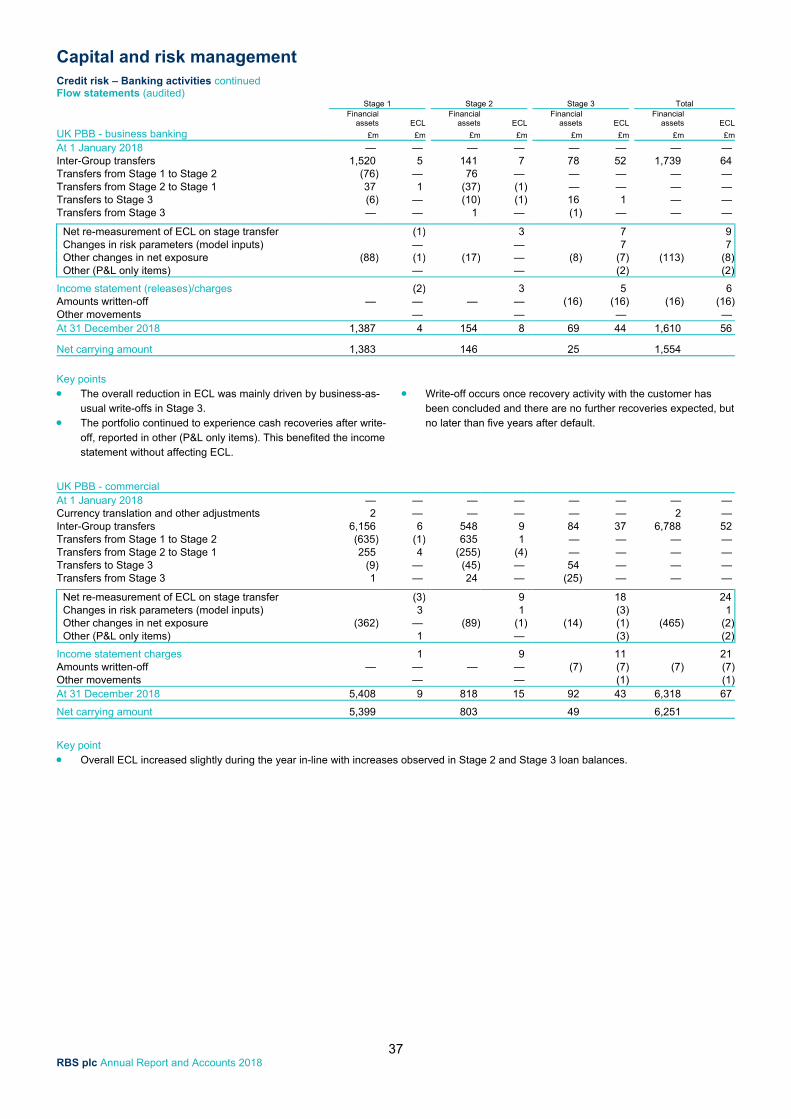
Capital and risk management
37 RBS plc Annual Report and Accounts 2018
Credit risk – Banking activities continued Flow statements (audited) Stage 1 Stage 2 Stage 3 Total Financial Financial Financial Financial assets ECL assets ECL assets ECL assets ECL
UK PBB - business banking £m £m £m £m £m £m £m £m
At 1 January 2018 — — — — — — — — Inter-Group transfers 1,520 5 141 7 78 52 1,739 64 Transfers from Stage 1 to Stage 2 (76) — 76 — — — — — Transfers from Stage 2 to Stage 1 37 1 (37) (1) — — — — Transfers to Stage 3 (6) — (10) (1) 16 1 — — Transfers from Stage 3 — — 1 — (1) — — —
Net re-measurement of ECL on stage transfer (1) 3 7 9 Changes in risk parameters (model inputs) — — 7 7 Other changes in net exposure (88) (1) (17) — (8) (7) (113) (8) Other (P&L only items) — — (2) (2)
Income statement (releases)/charges (2) 3 5 6 Amounts written-off — — — — (16) (16) (16) (16)Other movements — — — — At 31 December 2018 1,387 4 154 8 69 44 1,610 56
Net carrying amount 1,383 146 25 1,554
Key points The overall reduction in ECL was mainly driven by business-as-
usual write-offs in Stage 3. The portfolio continued to experience cash recoveries after write-
off, reported in other (P&L only items). This benefited the income statement without affecting ECL.
Write-off occurs once recovery activity with the customer has
been concluded and there are no further recoveries expected, but no later than five years after default.
UK PBB - commercial At 1 January 2018 — — — — — — — — Currency translation and other adjustments 2 — — — — — 2 — Inter-Group transfers 6,156 6 548 9 84 37 6,788 52 Transfers from Stage 1 to Stage 2 (635) (1) 635 1 — — — — Transfers from Stage 2 to Stage 1 255 4 (255) (4) — — — — Transfers to Stage 3 (9) — (45) — 54 — — — Transfers from Stage 3 1 — 24 — (25) — — —
Net re-measurement of ECL on stage transfer (3) 9 18 24 Changes in risk parameters (model inputs) 3 1 (3) 1 Other changes in net exposure (362) — (89) (1) (14) (1) (465) (2) Other (P&L only items) 1 — (3) (2)
Income statement charges 1 9 11 21 Amounts written-off — — — — (7) (7) (7) (7)Other movements — — (1) (1)At 31 December 2018 5,408 9 818 15 92 43 6,318 67
Net carrying amount 5,399 803 49 6,251
Key point Overall ECL increased slightly during the year in-line with increases observed in Stage 2 and Stage 3 loan balances.
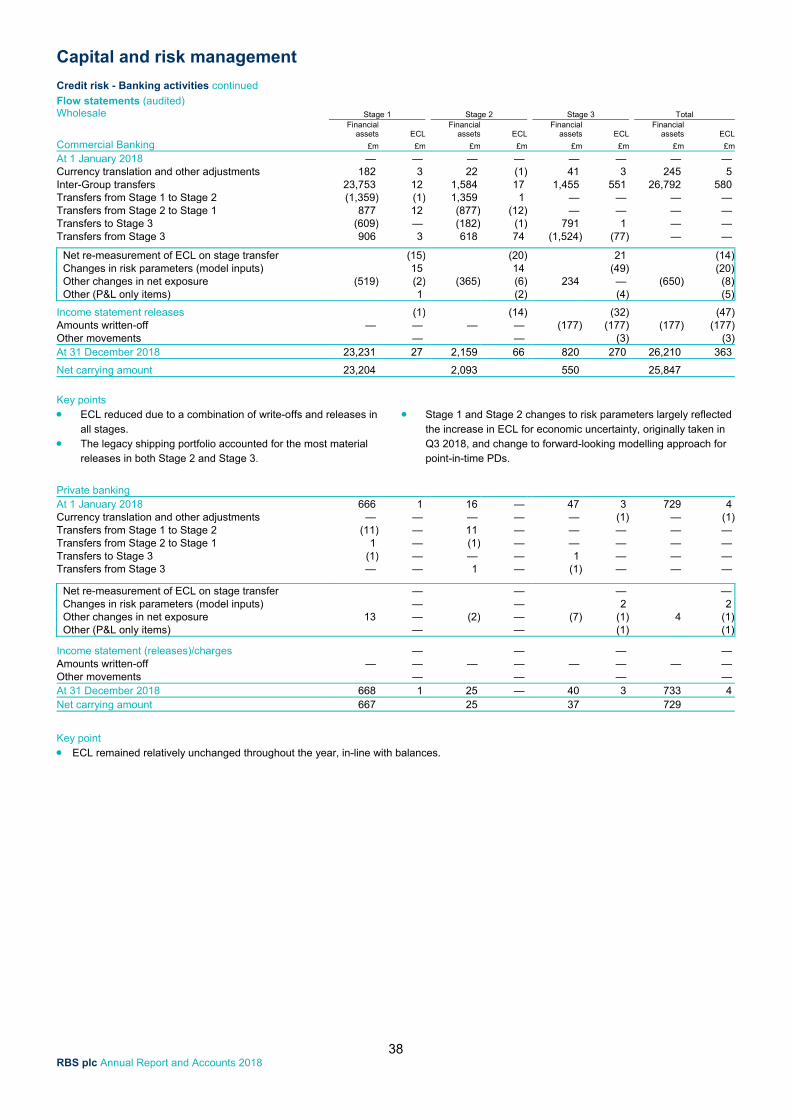
Capital and risk management
38 RBS plc Annual Report and Accounts 2018
Credit risk - Banking activities continued Flow statements (audited) Wholesale Stage 1 Stage 2 Stage 3 Total Financial Financial Financial Financial assets ECL assets ECL assets ECL assets ECL
Commercial Banking £m £m £m £m £m £m £m £m
At 1 January 2018 — — — — — — — — Currency translation and other adjustments 182 3 22 (1) 41 3 245 5 Inter-Group transfers 23,753 12 1,584 17 1,455 551 26,792 580 Transfers from Stage 1 to Stage 2 (1,359) (1) 1,359 1 — — — — Transfers from Stage 2 to Stage 1 877 12 (877) (12) — — — — Transfers to Stage 3 (609) — (182) (1) 791 1 — — Transfers from Stage 3 906 3 618 74 (1,524) (77) — —
Net re-measurement of ECL on stage transfer (15) (20) 21 (14) Changes in risk parameters (model inputs) 15 14 (49) (20) Other changes in net exposure (519) (2) (365) (6) 234 — (650) (8) Other (P&L only items) 1 (2) (4) (5)
Income statement releases (1) (14) (32) (47)Amounts written-off — — — — (177) (177) (177) (177)Other movements — — (3) (3)At 31 December 2018 23,231 27 2,159 66 820 270 26,210 363
Net carrying amount 23,204 2,093 550 25,847
Key points ECL reduced due to a combination of write-offs and releases in
all stages. The legacy shipping portfolio accounted for the most material
releases in both Stage 2 and Stage 3.
Stage 1 and Stage 2 changes to risk parameters largely reflected
the increase in ECL for economic uncertainty, originally taken in Q3 2018, and change to forward-looking modelling approach for point-in-time PDs.
Private banking At 1 January 2018 666 1 16 — 47 3 729 4 Currency translation and other adjustments — — — — — (1) — (1)Transfers from Stage 1 to Stage 2 (11) — 11 — — — — — Transfers from Stage 2 to Stage 1 1 — (1) — — — — — Transfers to Stage 3 (1) — — — 1 — — — Transfers from Stage 3 — — 1 — (1) — — —
Net re-measurement of ECL on stage transfer — — — — Changes in risk parameters (model inputs) — — 2 2 Other changes in net exposure 13 — (2) — (7) (1) 4 (1) Other (P&L only items) — — (1) (1)
Income statement (releases)/charges — — — — Amounts written-off — — — — — — — — Other movements — — — — At 31 December 2018 668 1 25 — 40 3 733 4 Net carrying amount 667 25 37 729
Key point ECL remained relatively unchanged throughout the year, in-line with balances.
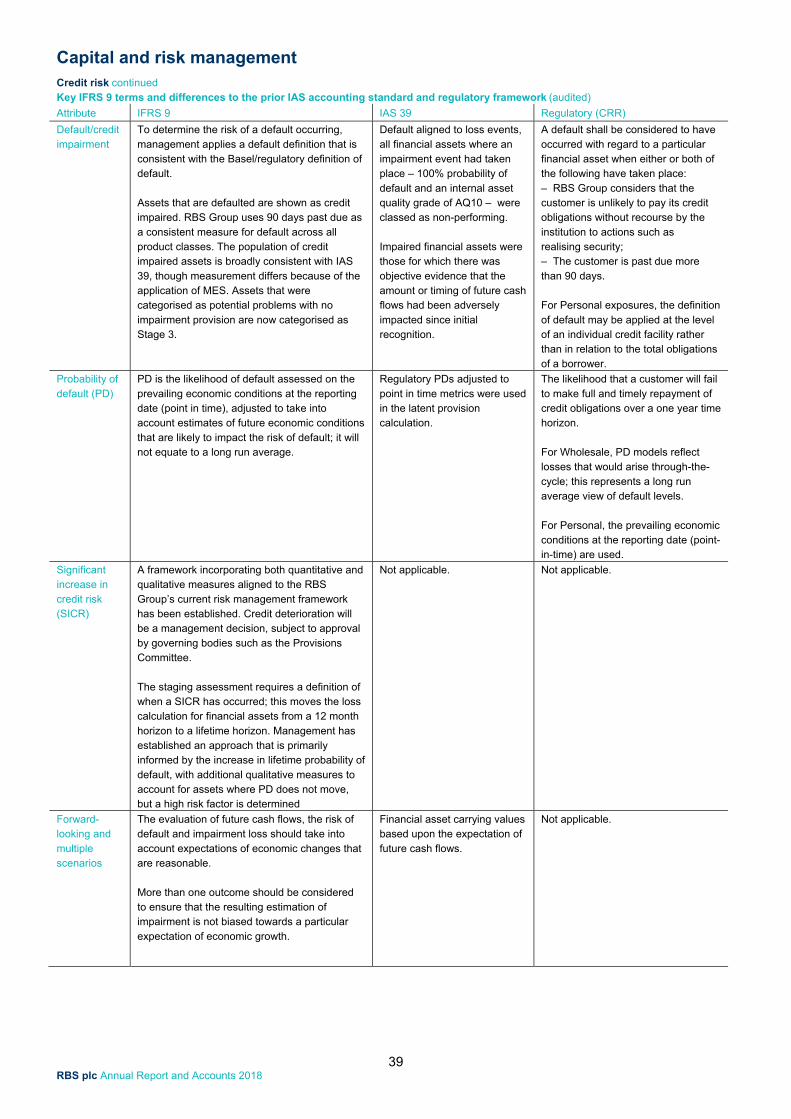
Capital and risk management
39 RBS plc Annual Report and Accounts 2018
Credit risk continued
Key IFRS 9 terms and differences to the prior IAS accounting standard and regulatory framework (audited)
Attribute IFRS 9 IAS 39 Regulatory (CRR)
Default/credit impairment
To determine the risk of a default occurring, management applies a default definition that is consistent with the Basel/regulatory definition of default.
Assets that are defaulted are shown as credit impaired. RBS Group uses 90 days past due as a consistent measure for default across all product classes. The population of credit impaired assets is broadly consistent with IAS 39, though measurement differs because of the application of MES. Assets that were categorised as potential problems with no impairment provision are now categorised as Stage 3.
Default aligned to loss events, all financial assets where an impairment event had taken place – 100% probability of default and an internal asset quality grade of AQ10 – were classed as non-performing.
Impaired financial assets were those for which there was objective evidence that the amount or timing of future cash flows had been adversely impacted since initial recognition.
A default shall be considered to have occurred with regard to a particular financial asset when either or both of the following have taken place: – RBS Group considers that the customer is unlikely to pay its credit obligations without recourse by the institution to actions such as realising security; – The customer is past due more than 90 days. For Personal exposures, the definition of default may be applied at the level of an individual credit facility rather than in relation to the total obligations of a borrower.
Probability of default (PD)
PD is the likelihood of default assessed on the prevailing economic conditions at the reporting date (point in time), adjusted to take into account estimates of future economic conditions that are likely to impact the risk of default; it will not equate to a long run average.
Regulatory PDs adjusted to point in time metrics were used in the latent provision calculation.
The likelihood that a customer will fail to make full and timely repayment of credit obligations over a one year time horizon. For Wholesale, PD models reflect losses that would arise through-the-cycle; this represents a long run average view of default levels. For Personal, the prevailing economic conditions at the reporting date (point-in-time) are used.
Significant increase in credit risk (SICR)
A framework incorporating both quantitative and qualitative measures aligned to the RBS Group’s current risk management framework has been established. Credit deterioration will be a management decision, subject to approval by governing bodies such as the Provisions Committee.
The staging assessment requires a definition of when a SICR has occurred; this moves the loss calculation for financial assets from a 12 month horizon to a lifetime horizon. Management has established an approach that is primarily informed by the increase in lifetime probability of default, with additional qualitative measures to account for assets where PD does not move, but a high risk factor is determined
Not applicable. Not applicable.
Forward-looking and multiple scenarios
The evaluation of future cash flows, the risk of default and impairment loss should take into account expectations of economic changes that are reasonable. More than one outcome should be considered to ensure that the resulting estimation of impairment is not biased towards a particular expectation of economic growth.
Financial asset carrying values based upon the expectation of future cash flows.
Not applicable.
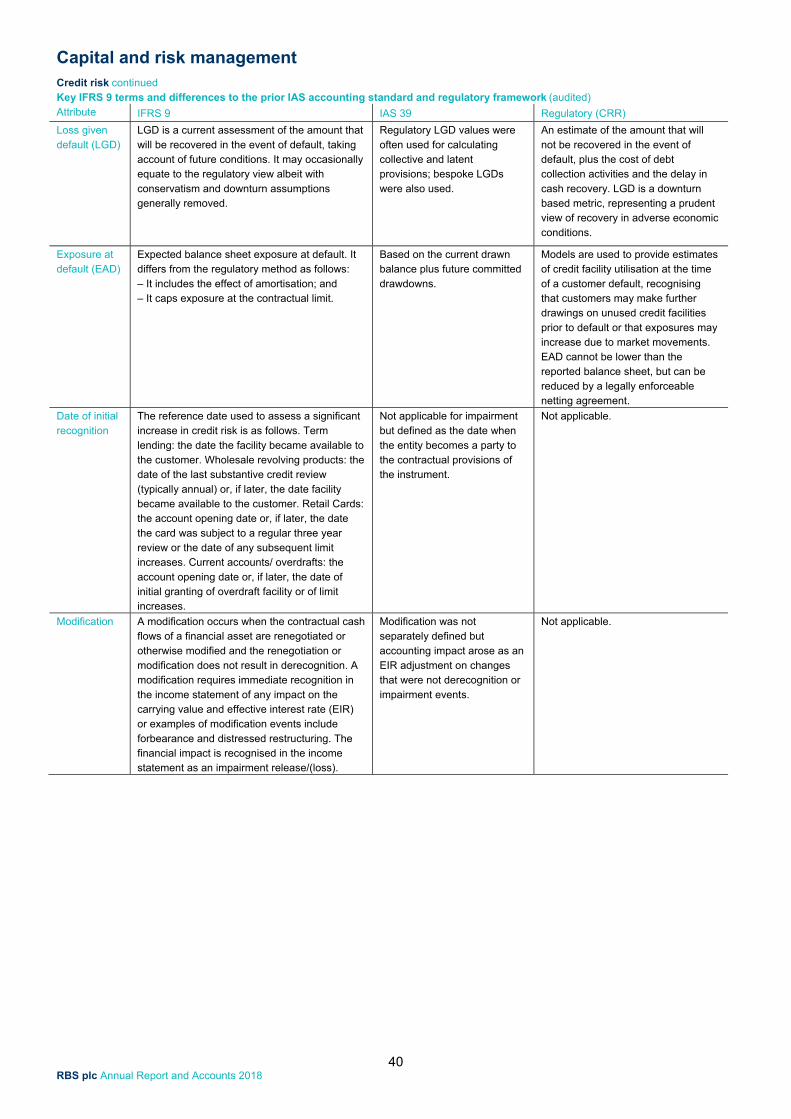
Capital and risk management
40 RBS plc Annual Report and Accounts 2018
Credit risk continued
Key IFRS 9 terms and differences to the prior IAS accounting standard and regulatory framework (audited) Attribute IFRS 9 IAS 39 Regulatory (CRR)
Loss given default (LGD)
LGD is a current assessment of the amount that will be recovered in the event of default, taking account of future conditions. It may occasionally equate to the regulatory view albeit with conservatism and downturn assumptions generally removed.
Regulatory LGD values were often used for calculating collective and latent provisions; bespoke LGDs were also used.
An estimate of the amount that will not be recovered in the event of default, plus the cost of debt collection activities and the delay in cash recovery. LGD is a downturn based metric, representing a prudent view of recovery in adverse economic conditions.
Exposure at default (EAD)
Expected balance sheet exposure at default. It differs from the regulatory method as follows: – It includes the effect of amortisation; and – It caps exposure at the contractual limit.
Based on the current drawn balance plus future committed drawdowns.
Models are used to provide estimates of credit facility utilisation at the time of a customer default, recognising that customers may make further drawings on unused credit facilities prior to default or that exposures may increase due to market movements. EAD cannot be lower than the reported balance sheet, but can be reduced by a legally enforceable netting agreement.
Date of initial recognition
The reference date used to assess a significant increase in credit risk is as follows. Term lending: the date the facility became available to the customer. Wholesale revolving products: the date of the last substantive credit review (typically annual) or, if later, the date facility became available to the customer. Retail Cards: the account opening date or, if later, the date the card was subject to a regular three year review or the date of any subsequent limit increases. Current accounts/ overdrafts: the account opening date or, if later, the date of initial granting of overdraft facility or of limit increases.
Not applicable for impairment but defined as the date when the entity becomes a party to the contractual provisions of the instrument.
Not applicable.
Modification A modification occurs when the contractual cash flows of a financial asset are renegotiated or otherwise modified and the renegotiation or modification does not result in derecognition. A modification requires immediate recognition in the income statement of any impact on the carrying value and effective interest rate (EIR) or examples of modification events include forbearance and distressed restructuring. The financial impact is recognised in the income statement as an impairment release/(loss).
Modification was not separately defined but accounting impact arose as an EIR adjustment on changes that were not derecognition or impairment events.
Not applicable.
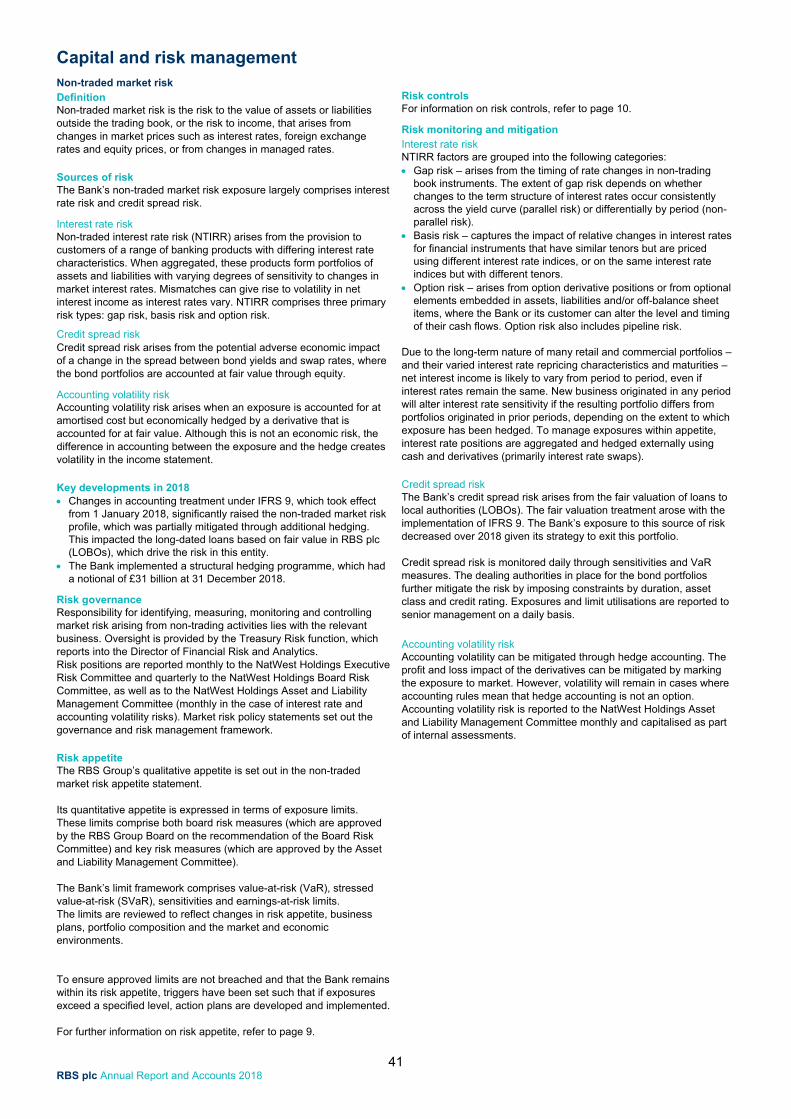
Capital and risk management
41 RBS plc Annual Report and Accounts 2018
Non-traded market risk Definition Non-traded market risk is the risk to the value of assets or liabilities outside the trading book, or the risk to income, that arises from changes in market prices such as interest rates, foreign exchange rates and equity prices, or from changes in managed rates.
Sources of risk The Bank’s non-traded market risk exposure largely comprises interest rate risk and credit spread risk.
Interest rate risk Non-traded interest rate risk (NTIRR) arises from the provision to customers of a range of banking products with differing interest rate characteristics. When aggregated, these products form portfolios of assets and liabilities with varying degrees of sensitivity to changes in market interest rates. Mismatches can give rise to volatility in net interest income as interest rates vary. NTIRR comprises three primary risk types: gap risk, basis risk and option risk.
Credit spread risk Credit spread risk arises from the potential adverse economic impact of a change in the spread between bond yields and swap rates, where the bond portfolios are accounted at fair value through equity.
Accounting volatility risk Accounting volatility risk arises when an exposure is accounted for at amortised cost but economically hedged by a derivative that is accounted for at fair value. Although this is not an economic risk, the difference in accounting between the exposure and the hedge creates volatility in the income statement.
Key developments in 2018 Changes in accounting treatment under IFRS 9, which took effect
from 1 January 2018, significantly raised the non-traded market risk profile, which was partially mitigated through additional hedging. This impacted the long-dated loans based on fair value in RBS plc (LOBOs), which drive the risk in this entity.
The Bank implemented a structural hedging programme, which had a notional of £31 billion at 31 December 2018.
Risk governance Responsibility for identifying, measuring, monitoring and controlling market risk arising from non-trading activities lies with the relevant business. Oversight is provided by the Treasury Risk function, which reports into the Director of Financial Risk and Analytics. Risk positions are reported monthly to the NatWest Holdings Executive Risk Committee and quarterly to the NatWest Holdings Board Risk Committee, as well as to the NatWest Holdings Asset and Liability Management Committee (monthly in the case of interest rate and accounting volatility risks). Market risk policy statements set out the governance and risk management framework.
Risk appetite The RBS Group’s qualitative appetite is set out in the non-traded market risk appetite statement. Its quantitative appetite is expressed in terms of exposure limits. These limits comprise both board risk measures (which are approved by the RBS Group Board on the recommendation of the Board Risk Committee) and key risk measures (which are approved by the Asset and Liability Management Committee). The Bank’s limit framework comprises value-at-risk (VaR), stressed value-at-risk (SVaR), sensitivities and earnings-at-risk limits. The limits are reviewed to reflect changes in risk appetite, business plans, portfolio composition and the market and economic environments. To ensure approved limits are not breached and that the Bank remains within its risk appetite, triggers have been set such that if exposures exceed a specified level, action plans are developed and implemented. For further information on risk appetite, refer to page 9.
Risk controls For information on risk controls, refer to page 10.
Risk monitoring and mitigation Interest rate risk NTIRR factors are grouped into the following categories: Gap risk – arises from the timing of rate changes in non-trading
book instruments. The extent of gap risk depends on whether changes to the term structure of interest rates occur consistently across the yield curve (parallel risk) or differentially by period (non-parallel risk).
Basis risk – captures the impact of relative changes in interest rates for financial instruments that have similar tenors but are priced using different interest rate indices, or on the same interest rate indices but with different tenors.
Option risk – arises from option derivative positions or from optional elements embedded in assets, liabilities and/or off-balance sheet items, where the Bank or its customer can alter the level and timing of their cash flows. Option risk also includes pipeline risk.
Due to the long-term nature of many retail and commercial portfolios – and their varied interest rate repricing characteristics and maturities – net interest income is likely to vary from period to period, even if interest rates remain the same. New business originated in any period will alter interest rate sensitivity if the resulting portfolio differs from portfolios originated in prior periods, depending on the extent to which exposure has been hedged. To manage exposures within appetite, interest rate positions are aggregated and hedged externally using cash and derivatives (primarily interest rate swaps).
Credit spread risk The Bank’s credit spread risk arises from the fair valuation of loans to local authorities (LOBOs). The fair valuation treatment arose with the implementation of IFRS 9. The Bank’s exposure to this source of risk decreased over 2018 given its strategy to exit this portfolio. Credit spread risk is monitored daily through sensitivities and VaR measures. The dealing authorities in place for the bond portfolios further mitigate the risk by imposing constraints by duration, asset class and credit rating. Exposures and limit utilisations are reported to senior management on a daily basis.
Accounting volatility risk Accounting volatility can be mitigated through hedge accounting. The profit and loss impact of the derivatives can be mitigated by marking the exposure to market. However, volatility will remain in cases where accounting rules mean that hedge accounting is not an option. Accounting volatility risk is reported to the NatWest Holdings Asset and Liability Management Committee monthly and capitalised as part of internal assessments.
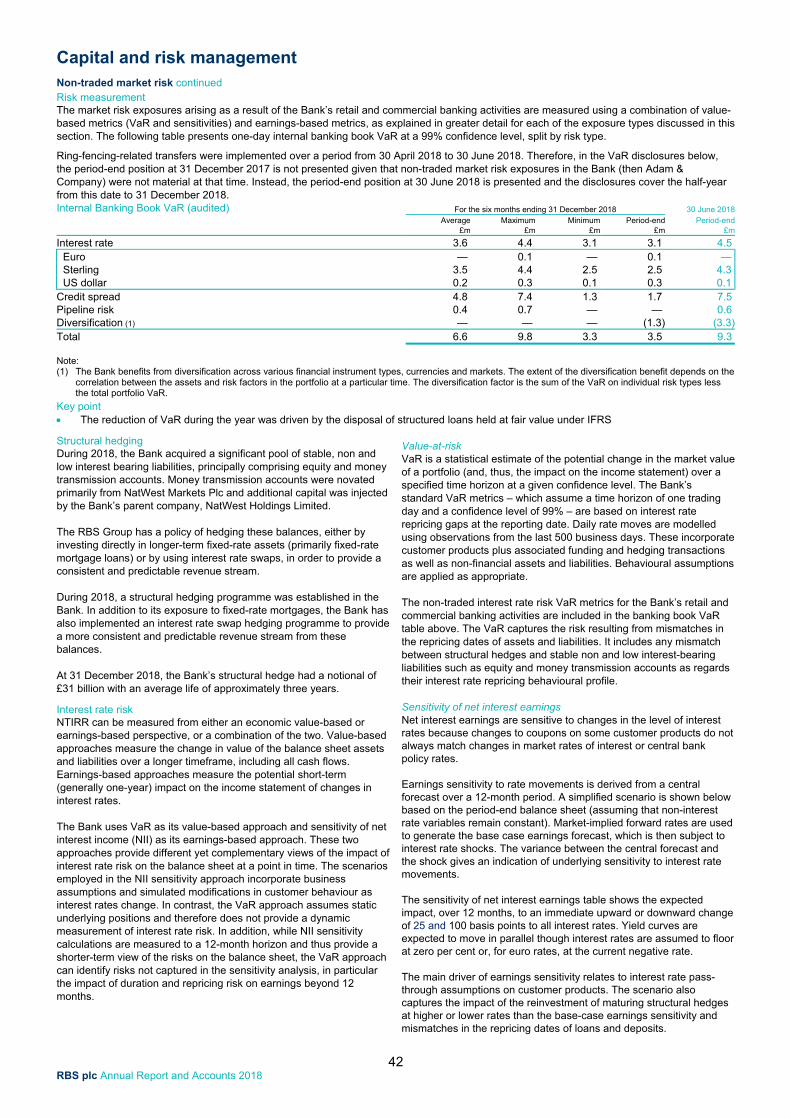
Capital and risk management
42 RBS plc Annual Report and Accounts 2018
Non-traded market risk continued Risk measurement The market risk exposures arising as a result of the Bank’s retail and commercial banking activities are measured using a combination of value-based metrics (VaR and sensitivities) and earnings-based metrics, as explained in greater detail for each of the exposure types discussed in this section. The following table presents one-day internal banking book VaR at a 99% confidence level, split by risk type.
Ring-fencing-related transfers were implemented over a period from 30 April 2018 to 30 June 2018. Therefore, in the VaR disclosures below, the period-end position at 31 December 2017 is not presented given that non-traded market risk exposures in the Bank (then Adam & Company) were not material at that time. Instead, the period-end position at 30 June 2018 is presented and the disclosures cover the half-year from this date to 31 December 2018. Internal Banking Book VaR (audited) For the six months ending 31 December 2018 30 June 2018 Average Maximum Minimum Period-end Period-end £m £m £m £m £m
Interest rate 3.6 4.4 3.1 3.1 4.5 Euro — 0.1 — 0.1 — Sterling 3.5 4.4 2.5 2.5 4.3 US dollar 0.2 0.3 0.1 0.3 0.1 Credit spread 4.8 7.4 1.3 1.7 7.5 Pipeline risk 0.4 0.7 — — 0.6 Diversification (1) — — — (1.3) (3.3)Total 6.6 9.8 3.3 3.5 9.3 Note: (1) The Bank benefits from diversification across various financial instrument types, currencies and markets. The extent of the diversification benefit depends on the
correlation between the assets and risk factors in the portfolio at a particular time. The diversification factor is the sum of the VaR on individual risk types less the total portfolio VaR.
Key point The reduction of VaR during the year was driven by the disposal of structured loans held at fair value under IFRS
Structural hedging During 2018, the Bank acquired a significant pool of stable, non and low interest bearing liabilities, principally comprising equity and money transmission accounts. Money transmission accounts were novated primarily from NatWest Markets Plc and additional capital was injected by the Bank’s parent company, NatWest Holdings Limited. The RBS Group has a policy of hedging these balances, either by investing directly in longer-term fixed-rate assets (primarily fixed-rate mortgage loans) or by using interest rate swaps, in order to provide a consistent and predictable revenue stream. During 2018, a structural hedging programme was established in the Bank. In addition to its exposure to fixed-rate mortgages, the Bank has also implemented an interest rate swap hedging programme to provide a more consistent and predictable revenue stream from these balances. At 31 December 2018, the Bank’s structural hedge had a notional of £31 billion with an average life of approximately three years.
Interest rate risk NTIRR can be measured from either an economic value-based or earnings-based perspective, or a combination of the two. Value-based approaches measure the change in value of the balance sheet assets and liabilities over a longer timeframe, including all cash flows. Earnings-based approaches measure the potential short-term (generally one-year) impact on the income statement of changes in interest rates. The Bank uses VaR as its value-based approach and sensitivity of net interest income (NII) as its earnings-based approach. These two approaches provide different yet complementary views of the impact of interest rate risk on the balance sheet at a point in time. The scenarios employed in the NII sensitivity approach incorporate business assumptions and simulated modifications in customer behaviour as interest rates change. In contrast, the VaR approach assumes static underlying positions and therefore does not provide a dynamic measurement of interest rate risk. In addition, while NII sensitivity calculations are measured to a 12-month horizon and thus provide a shorter-term view of the risks on the balance sheet, the VaR approach can identify risks not captured in the sensitivity analysis, in particular the impact of duration and repricing risk on earnings beyond 12 months.
Value-at-risk VaR is a statistical estimate of the potential change in the market value of a portfolio (and, thus, the impact on the income statement) over a specified time horizon at a given confidence level. The Bank’s standard VaR metrics – which assume a time horizon of one trading day and a confidence level of 99% – are based on interest rate repricing gaps at the reporting date. Daily rate moves are modelled using observations from the last 500 business days. These incorporate customer products plus associated funding and hedging transactions as well as non-financial assets and liabilities. Behavioural assumptions are applied as appropriate. The non-traded interest rate risk VaR metrics for the Bank’s retail and commercial banking activities are included in the banking book VaR table above. The VaR captures the risk resulting from mismatches in the repricing dates of assets and liabilities. It includes any mismatch between structural hedges and stable non and low interest-bearing liabilities such as equity and money transmission accounts as regards their interest rate repricing behavioural profile. Sensitivity of net interest earnings Net interest earnings are sensitive to changes in the level of interest rates because changes to coupons on some customer products do not always match changes in market rates of interest or central bank policy rates. Earnings sensitivity to rate movements is derived from a central forecast over a 12-month period. A simplified scenario is shown below based on the period-end balance sheet (assuming that non-interest rate variables remain constant). Market-implied forward rates are used to generate the base case earnings forecast, which is then subject to interest rate shocks. The variance between the central forecast and the shock gives an indication of underlying sensitivity to interest rate movements. The sensitivity of net interest earnings table shows the expected impact, over 12 months, to an immediate upward or downward change of 25 and 100 basis points to all interest rates. Yield curves are expected to move in parallel though interest rates are assumed to floor at zero per cent or, for euro rates, at the current negative rate. The main driver of earnings sensitivity relates to interest rate pass-through assumptions on customer products. The scenario also captures the impact of the reinvestment of maturing structural hedges at higher or lower rates than the base-case earnings sensitivity and mismatches in the repricing dates of loans and deposits.
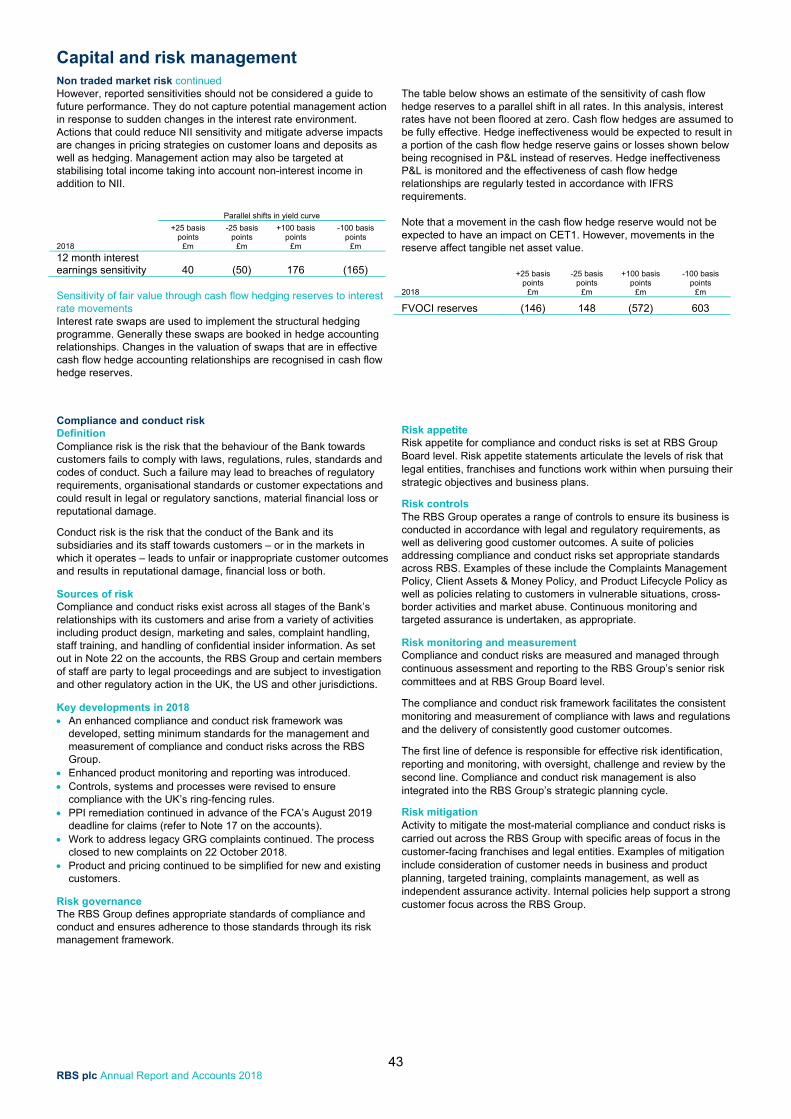
Capital and risk management
43 RBS plc Annual Report and Accounts 2018
Non traded market risk continued However, reported sensitivities should not be considered a guide to future performance. They do not capture potential management action in response to sudden changes in the interest rate environment. Actions that could reduce NII sensitivity and mitigate adverse impacts are changes in pricing strategies on customer loans and deposits as well as hedging. Management action may also be targeted at stabilising total income taking into account non-interest income in addition to NII.
Parallel shifts in yield curve
2018
+25 basis points
£m
-25 basis points
£m
+100 basis points
£m
-100 basis points
£m
12 month interest earnings sensitivity 40 (50) 176 (165) Sensitivity of fair value through cash flow hedging reserves to interest rate movements Interest rate swaps are used to implement the structural hedging programme. Generally these swaps are booked in hedge accounting relationships. Changes in the valuation of swaps that are in effective cash flow hedge accounting relationships are recognised in cash flow hedge reserves.
The table below shows an estimate of the sensitivity of cash flow hedge reserves to a parallel shift in all rates. In this analysis, interest rates have not been floored at zero. Cash flow hedges are assumed to be fully effective. Hedge ineffectiveness would be expected to result in a portion of the cash flow hedge reserve gains or losses shown below being recognised in P&L instead of reserves. Hedge ineffectiveness P&L is monitored and the effectiveness of cash flow hedge relationships are regularly tested in accordance with IFRS requirements. Note that a movement in the cash flow hedge reserve would not be expected to have an impact on CET1. However, movements in the reserve affect tangible net asset value.
2018
+25 basis points
£m
-25 basis points
£m
+100 basis points
£m
-100 basis points
£m
FVOCI reserves (146) 148 (572) 603
Compliance and conduct risk Definition Compliance risk is the risk that the behaviour of the Bank towards customers fails to comply with laws, regulations, rules, standards and codes of conduct. Such a failure may lead to breaches of regulatory requirements, organisational standards or customer expectations and could result in legal or regulatory sanctions, material financial loss or reputational damage.
Conduct risk is the risk that the conduct of the Bank and its subsidiaries and its staff towards customers – or in the markets in which it operates – leads to unfair or inappropriate customer outcomes and results in reputational damage, financial loss or both.
Sources of risk Compliance and conduct risks exist across all stages of the Bank’s relationships with its customers and arise from a variety of activities including product design, marketing and sales, complaint handling, staff training, and handling of confidential insider information. As set out in Note 22 on the accounts, the RBS Group and certain members of staff are party to legal proceedings and are subject to investigation and other regulatory action in the UK, the US and other jurisdictions.
Key developments in 2018 An enhanced compliance and conduct risk framework was
developed, setting minimum standards for the management and measurement of compliance and conduct risks across the RBS Group.
Enhanced product monitoring and reporting was introduced. Controls, systems and processes were revised to ensure
compliance with the UK’s ring-fencing rules. PPI remediation continued in advance of the FCA’s August 2019
deadline for claims (refer to Note 17 on the accounts). Work to address legacy GRG complaints continued. The process
closed to new complaints on 22 October 2018. Product and pricing continued to be simplified for new and existing
customers.
Risk governance The RBS Group defines appropriate standards of compliance and conduct and ensures adherence to those standards through its risk management framework.
Risk appetite Risk appetite for compliance and conduct risks is set at RBS Group Board level. Risk appetite statements articulate the levels of risk that legal entities, franchises and functions work within when pursuing their strategic objectives and business plans.
Risk controls The RBS Group operates a range of controls to ensure its business is conducted in accordance with legal and regulatory requirements, as well as delivering good customer outcomes. A suite of policies addressing compliance and conduct risks set appropriate standards across RBS. Examples of these include the Complaints Management Policy, Client Assets & Money Policy, and Product Lifecycle Policy as well as policies relating to customers in vulnerable situations, cross-border activities and market abuse. Continuous monitoring and targeted assurance is undertaken, as appropriate.
Risk monitoring and measurement Compliance and conduct risks are measured and managed through continuous assessment and reporting to the RBS Group’s senior risk committees and at RBS Group Board level.
The compliance and conduct risk framework facilitates the consistent monitoring and measurement of compliance with laws and regulations and the delivery of consistently good customer outcomes.
The first line of defence is responsible for effective risk identification, reporting and monitoring, with oversight, challenge and review by the second line. Compliance and conduct risk management is also integrated into the RBS Group’s strategic planning cycle.
Risk mitigation Activity to mitigate the most-material compliance and conduct risks is carried out across the RBS Group with specific areas of focus in the customer-facing franchises and legal entities. Examples of mitigation include consideration of customer needs in business and product planning, targeted training, complaints management, as well as independent assurance activity. Internal policies help support a strong customer focus across the RBS Group.
Capital and risk management
44 RBS plc Annual Report and Accounts 2018
Financial crime Definition Financial crime risk is the risk presented by criminal activity in the form of money laundering, terrorist financing, bribery and corruption, sanctions and tax evasion. It does not include fraud risk management.
Sources of risk Financial crime risk may be presented if the Bank’s employees, customers or third parties undertake or facilitate financial crime, or if the Bank’s products or services are used to facilitate such crime. Financial crime risk is an inherent risk across all of the Bank’s lines of business.
Key developments in 2018
In October 2018, the Federal Reserve Board terminated a Cease & Desist Order originally imposed in December 2013. The Order, which related to RBS Group and RBS plc’s historical compliance with Office of Foreign Assets Control (OFAC) economic sanctions regulations, was terminated following a multi-year programme of work to establish a robust, sustainable OFAC Sanctions compliance framework.
While the financial crime governance framework was strengthened during 2018 – along with the introduction of enhanced control effectiveness assurance processes, enhancements to existing risk assessment models, the introduction of a new Anti-Tax Evasion risk assessment; and improved monitoring controls and enhanced investigation processes – the journey of improvement continues.
Risk governance Financial crime risk is principally governed through the Financial Crime Risk Executive Committee, which is chaired by the Chief Financial Crime Officer. The committee reviews and, where appropriate, escalates material risks and issues to the RBS Group Executive Risk Committee and the Group Board Risk Committee.
Risk appetite The Bank has no appetite to operate in an environment where systems and controls do not enable the Bank to identify, assess, monitor, manage and mitigate financial crime risk. The Bank’s systems and controls must be comprehensive and proportionate to the nature, scale and complexity of its businesses. The Bank has no tolerance to systematically or repeatedly breach relevant financial crime regulations and laws.
Risk mitigation Through the financial crime framework, the Bank employs relevant policies, systems, processes and controls to mitigate financial crime risk. This would include the use of dedicated screening and monitoring controls to identify people, organisations, transactions and behaviours which might require further investigation or other actions. The Bank ensures that centralised expertise is available to detect and disrupt threats to the Bank and its customers. Intelligence is shared with law enforcement, regulators and government bodies in order to strengthen national and international defences against those who would misuse the financial system for criminal motives. Risk controls The Bank operates a framework of preventative and detective controls designed to ensure the Bank mitigates the risk that it could facilitate financial crime. These controls are supported by a suite of policies, procedures and detailed instructions to ensure they operate effectively.
Risk monitoring and measurement Financial crime risks are identified and reported through continuous risk management and regular monthly reporting to RBS Group’s senior risk committees and the Board. Quantitative and qualitative data is reviewed and assessed to measure whether financial crime risk is within the Bank’s risk appetite.
Operational risk Definition Operational risk is the risk of loss resulting from inadequate or failed internal processes, people and systems, or external events. It arises from day-to-day operations and is relevant to every aspect of the business.
Sources of risk Operational risk may arise from a failure to manage operations, systems, transactions and assets appropriately. This can take the form of human error, an inability to deliver change adequately or on time, the non-availability of technology services, or the loss of customer data. Fraud and theft – as well as the increasing threat of cyber attacks – are sources of operational risk, as is the impact of natural and man-made disasters. Operational risk can also arise from a failure to account for changes in law or regulations or to take appropriate measures to protect assets.
Key developments in 2018 Risk provided oversight of several bank-wide programmes
including the Transformation portfolio, structural reform, European Commission (EC) State Aid obligations and Brexit preparations.
Key corporate structural reform milestones were delivered, including the implementation of the Financial Services Markets Act Part VII and migration activities to separate the ring-fence bank from the non ring-fenced bank.
The Bank is well positioned to deliver the activities required to support the Business Banking Switch Scheme that is due to commence in 2019, as part of the Bank’s final EC State Aid obligation.
The bank has established an Innovation Risk Oversight team to provide bank-wide oversight of its innovation portfolio to help deliver safely and at pace.
The Bank continued to review its well established incident management procedures to manage the persistent and evolving nature of information and cyber security risks.
Internal security improvement programmes and controls were developed and strengthened to protect RBS and its customers. The Bank uses proactive threat management and intelligence processes to identify, manage and mitigate credible threats.
The Bank continued to reduce and simplify its technology estate through strategic investment and Technology transformation initiatives to limit opportunities for hackers and fraudsters. Improvements in capability were also made to the Security Operations Centre, strengthening controls to prevent data leakage, enhance malware defences and management of user access to key systems.
Internal training programmes ensure all employees are aware of the threats facing the Bank and remain vigilant to unauthorised attempts to access systems and data.
Risk governance A strong operational risk management function is vital to support the Bank’s ambitions to serve its customers better. Improved management of operational risk against defined appetite directly supports the strategic risk objective of improving stakeholder confidence and is vital for stability and reputational integrity.
The operational risk function, which is the second line of defence, delivers a robust operational risk management framework and culture across the Bank.
The Operational Risk function is responsible for the execution and continuous improvement of the operational risk management framework.
The Operational Risk Executive Committee is responsible for reviewing operational risk exposure; identifying and assessing both current and emerging material operational risks; reviewing and monitoring the operational risk profile; and reviewing and approving material operational risk policy changes.
Capital and risk management
45 RBS plc Annual Report and Accounts 2018
Operational risk continued Risk appetite Operational risk appetite supports effective management of material operational risks. It expresses the level and types of operational risk the Bank is willing to accept to achieve its strategic objectives and business plans.
The Bank-wide operational risk appetite statement encompasses the full range of operational risks faced by our legal entities, franchises and functions, supported by Board Risk Measures, which are those that, should the limit be breached, would impact on our ability to achieve business plans and threaten stakeholder confidence.
Risk controls The Control Environment Certification (CEC) process is a half yearly self-assessment by the CEO of the Bank’s business units, as well as the heads of the support and control functions, providing a view on the adequacy and effectiveness of the internal control environment in a consistent and comparable manner.
CEC covers material risks and the underlying key controls, including financial, operational and compliance controls, as well as supporting risk management frameworks. The CEC outcomes, including forward-looking assessments for the next two half-yearly cycles and progress on control environment improvements, are reported to the Board, RBS Group Audit Committee and Board Risk Committee. They are also shared with external auditors.
Risk monitoring and measurement Risk and control assessments are used across all business areas and support functions to identify and assess material operational and conduct risks and key controls. All risks and controls are mapped to the Bank’s Risk Directory. Risk assessments are refreshed at least annually to ensure they remain relevant and capture any emerging risks, with associated trigger processes to ensure risks are reassessed at key periods of change.
The process is designed to confirm that risks are effectively managed and prioritised in line with risk appetite. Controls are tested at the appropriate frequency to verify that they remain fit-for-purpose and operate effectively.
The Bank uses the standardised approach to calculate its Pillar 1 operational risk capital requirement. This is based on multiplying three years’ average historical gross income by coefficients set by the regulator based on business line. As part of the wider Internal Capital Adequacy Assessment Process an operational risk economic capital model is used to assess Pillar 2A, which is a risk-sensitive add-on to Pillar 1.The model uses historical loss data (internal and external) and forward-looking scenario analysis that is provided by Operational Risk to provide a risk-sensitive view of the Bank’s P2A capital requirement.
Scenario analysis is used to assess how extreme but plausible operational risks will affect the Bank. It provides a forward-looking basis for evaluating and managing operational risk exposures. Refer to the Capital, liquidity and funding risk section for operational risk capital requirement figures.
Event and loss data management The operational risk event and loss data management process ensures the Bank captures and records operational risk loss events that meet defined criteria. Loss data is used for regulatory and industry reporting and is included in capital modelling when calculating economic capital for operational risk. The most serious events are escalated in a simple, standardised process to all senior management, by way of a Group Notifiable Event Process. All losses and recoveries associated with an operational risk event are reported against their financial accounting date. A single event can result in multiple losses (or recoveries) that may take time to crystallise. Losses and recoveries with a financial accounting date in 2018 may relate to
events that occurred, or were identified in, prior years. The Bank purchases insurance against specific losses and to comply with statutory or contractual requirements.
Operational resilience The Bank manages and monitors operational resilience through its risk and control assessments methodology. As challenges to operational resilience become more demanding, given a hostile cyber environment and a greater focus on serving customers through digital platforms, the Bank is working with supervisory authorities in the UK to ensure the provision of its products and services can be maintained regardless of the cause of disruption.
This is underpinned by setting, monitoring and testing tolerances for key business services, which define the amount of disruption that could be tolerated.
Risk mitigation Risks are mitigated by applying key preventative and detective controls, an integral step in the risk assessment methodology which determines residual risk exposure. Control owners are accountable for the design, execution, performance and maintenance of key controls. Key controls are regularly assessed for adequacy and tested for effectiveness. The results are monitored and, where a material change in performance is identified, the associated risk is re-evaluated.
Business risk Definition Business risk is the risk that the Bank does not have a strategy that is sufficiently well defined to provide clarity on its long-term ambitions to key internal and external stakeholders, or that it is not able to execute upon its chosen strategy as communicated to the market, regulators and other key stakeholders. The risk is that the Bank does not deliver its expected business performance which could give rise to a deterioration in stakeholder trust and confidence and/or a breach of regulatory thresholds. The Bank may not be able to execute its chosen strategy if there are material changes to the bank’s internal or external operating environment.
Sources of risk Business risk arises as a result of the Bank’s exposure to the macro-economy (including economic and political factors), the competitive environment, regulatory and technological changes. In addition, internal factors such as the ability to deliver complex change, volatility in sales volumes, input costs, and other operational risks affect the Bank’s ability to execute its chosen strategic business plan as intended and thus contribute to business risk.
Key developments in 2018 As part of its preparation for ring-fencing under ICB the RBS
Group made a number of changes to the structure of its business. The UK Personal & Business Banking and Commercial Banking business of NatWest Markets (formerly RBS plc renamed in 2018) were transferred to the Bank. The Bank also took over as issuer of RBS plc banknotes.
Risk governance The Board has ultimate responsibility for business risk and for approving strategic plans, initiatives and changes to strategic direction.
The Bank’s strategic planning process is managed by Strategy and Corporate Development. The Risk and Finance functions are key contributors to strategic planning.
Responsibility for the day-to-day management of business risk lies primarily with the franchises, with oversight by the Finance function. The franchises are responsible for delivery of their business plans and the management of such factors as pricing, sales volumes, marketing expenditure and other factors that can introduce volatility into earnings.

Capital and risk management
46 RBS plc Annual Report and Accounts 2018
Business risk continued Risk appetite Risk Appetite defines the level and types of risk the Bank is willing to accept in order to achieve its strategic objectives and business plans. The Bank articulates its appetite for business risk through the implementation of qualitative risk appetite statements and quantitative risk measures at franchise and function level. These statements and measures help determine the level and types of business risk the Bank is willing to accept.
Risk controls
For information on risk controls, refer to page 10.
Risk monitoring and measurement Business risk is identified and managed at the product and transaction level. Estimated revenue, costs and capital are key considerations in the design of any new product or in any new investment decision. Business risk is reported, assessed and challenged at every governance level within the organisation. Each franchise monitors its financial performance relative to plans and reports this on a regular basis to the finance directors of each franchise.
Risk mitigation The Bank operates a monthly rolling forecasting process to identify projected changes in, or risks to, key financial metrics, and ensures appropriate actions are taken.
Reputational risk Definition Reputational risk is the risk to the Bank’s public image from a failure to meet stakeholders’ expectations in relation to performance, conduct or business profile. Stakeholders include customers, investors, employees, suppliers, government, regulators, special interest and consumer groups, media and the general public.
Sources of risk Reputational risk can arise from the conduct of employees; customer activities and the sectors and countries in which they operate; provision of products and transactions; as well as operations and infrastructure.
Key developments in 2018
Metrics were reviewed and enhanced to help measure reputational risk across the Bank.
Risk appetite positions for countries and sectors identified as presenting heightened reputational risk continued to be reviewed and strengthened.
Risk governance A reputational risk policy supports reputational risk management across the Bank. Reputational risk committees review relevant issues at an individual franchise or entity level, while the RBS Group Reputational Risk Committee – which has delegated authority from the Executive Risk Committee – opines on cases, issues, sectors and themes that represent a material reputational risk to the RBS Group. The Board Risk Committee oversees the identification and reporting of reputational risk. The Sustainable Banking Committee has a specific focus on environmental, social and ethical issues.
Risk appetite The Bank manages and articulates its appetite for reputational risk through a qualitative reputational risk appetite statement and quantitative measures. The Bank seeks a continued improvement in the identification, assessment and management of customers, transactions, products and issues that present a material reputational risk.
Risk controls For information on risk controls, refer to page 10. Risk monitoring and measurement Primary reputational risk measures are in place to assess internal activity relating to the management of reputational risk, including training. A number of secondary risk measures – including measures also used in the management of operational, conduct and financial risks – are used to assess relevant external factors. Quarterly reports on performance against these measures are provided to the Executive Risk Committee and Board Risk Committee.
Risk mitigation Reputational risk is mitigated through the policy and governance framework, with ongoing staff training to ensure early identification, assessment and escalation of material issues. The most material threats to the Bank’s reputation continued to originate from historical and more recent conduct issues. As a result, the Bank has been the subject of investigations and reviews by a number of regulators and governmental authorities, some of which have resulted in fines, settlements and public censure. Refer to the Litigation, investigations and reviews section on page 81.

Report of the directors
47 RBS plc Annual Report and Accounts 2018
The directors present their report together with the audited accounts for the year ended 31 December 2018. Other information incorporated into this report by reference can be found at:
Page/Note
RBS Group ring-fencing 1
Board of directors and secretary 2
Financial review 3
Segmental analysis Note 4
Share capital and reserves Note 18
Post balance sheet events Note 30
Group structure The Royal Bank of Scotland plc (the ‘Bank’) is a wholly owned subsidiary of NatWest Holdings Limited (‘NWH Ltd’, ‘NatWest Holdings’ or the ‘intermediate holding company’). National Westminster Bank Plc (NatWest) is also a wholly-owned subsidiary of NWH Ltd. The ultimate holding company is The Royal Bank of Scotland Group plc (‘RBSG’ or the ‘ultimate parent company) which is incorporated in Great Britain and has its registered office at 36 St Andrew Square, Edinburgh, EH2 2YB. Details of the principal subsidiary undertakings of the Bank are shown in Note 15 on the accounts. ‘RBS Group’ comprises The Royal Bank of Scotland Group plc (the ‘ultimate holding company’) and its subsidiary and associated undertakings. The financial statements of The Royal Bank of Scotland Group plc can be obtained from RBS Corporate Governance and Regulatory Affairs, RBS Gogarburn, Edinburgh, EH12 1HQ, the Registrar of Companies or through the RBS Group’s website rbs.com. Strategic report Activities The Bank is engaged principally in providing a wide range of banking and other financial services in the UK. Results and dividends The profit attributable to the ordinary shareholders of the Bank for the year ended 31 December 2018 amounted to £644.6 million compared with a profit of £3.3 million for the year ended 31 December 2017, as set out in the statement of comprehensive income on page 58. The Bank did not pay a dividend on ordinary shares to the intermediate holding company in 2018 or 2017. Employees As at 31 December 2018, the Bank directly employs 2,700 people (full-time equivalent basis, including temporary workers). NatWest provides the majority of shared services (including technology) and operational processes under Intra-Group Agreements. Details of related costs are included in Note 3 on the accounts.
Creating a healthy culture Building a healthy culture that embodies Our Values is a core priority for the RBS Group. Our Values, which guide the way the RBS Group identifies the right people to serve customers well, and how to manage, engage and reward colleagues, are at the heart of Our Code (the bank-wide Code of Conduct). Engaging colleagues Engaging colleagues is crucial to achieving RBS Group’s ambition. Every year colleagues are asked to share their thoughts on what it’s like to work for the RBS Group via a colleague opinion survey. The results from the 2018 survey are the most positive ever reported since engagement started to be measured in 2002. All key measures have improved and the RBS Group is now above the global financial norms in all comparable survey categories. The continued strengthening of the culture in the RBS Group was also echoed in this year’s improved Banking Standards Board assessment which provided further proof of progress across a range of measures. Rewarding employees The RBS Group’s approach to performance management provides clarity for employees about how their contribution links to the RBS Group’s ambition. The RBS Group has made further progress on making sure employees are paid fairly for the work they do with simple and transparent pay structures, and in the UK the RBS Group’s rates continue to exceed the Living Wage. More information can be found on page 62 of the 2018 Annual Report and Accounts of the RBS Group. Developing colleagues The RBS Group offers a wide range of additional learning opportunities. In 2018 the NextGen talent development programme was launched for high-potential colleagues at managerial level, helping them become the future leaders the RBS Group will need. There is also a range of Female Development Programmes supporting women to reach their full potential, and helping the RBS Group in the aspiration to be fully gender balanced by 2030. 2018 also saw Sales Excellence, the RBS Group’s bank-wide sales programme, get underway, teaching the tools and techniques that enable those in sales roles to be the best at ethical, needs-based selling. More information can be found on page 15 of the 2018 Annual Report and Accounts of the RBS Group and on the Sustainable Banking pages on rbs.com. Youth Employment In 2018, the RBS Group welcomed 516 people across the Graduate and Apprenticeship schemes as well as around 150 Interns into internship programmes.
Health and wellbeing of colleagues As a strong component of making the RBS Group a great place to work, wellbeing has successfully delivered against three pillars – physical, mental, and social; and in 2018 built momentum on the fourth pillar, financial wellbeing. Further details can be found on page 16 of the 2018 Annual Report and Accounts of the RBS Group and on the Sustainable Banking pages on rbs.com. Employee consultation The RBS Group recognises employee representatives such as trade unions and work councils in a number of businesses and countries, and management regularly discuss developments and updates on the progress of its strategic plans with the European Employee Council (EEC). The RBS Group has ongoing engagement and discussion with those bodies given the scale of change taking place across the RBS Group. Colleague Voice In response to changes which have been made to the UK Corporate Governance Code, the RBS Group has established a Colleague Advisory Panel (“the Panel”) which is chaired by Lena Wilson, Non-executive Director. The purpose of the Panel is to promote greater colleague voice in the boardroom and provide an additional way for the Board to engage directly with colleagues. The Panel consists of existing employee representatives (e.g. Unite, Financial Services Union (FSU), EEC, Employee Led Networks, Junior Management/Colleague Focus Groups and colleagues who have volunteered to be involved). Colleagues from locations outside of the UK and Ireland also sit on the Panel to ensure a broad, diverse range of views. In total, there are approximately 20 colleagues (or their representatives) who attend each Panel meeting. The Panel does not duplicate existing methods to inform and consult, in particular with employee representatives, focusing instead on broader strategic issues facing the RBS Group. The design of the Panel has been built around having two-way dialogue with clear outputs from the sessions and follow-up to ensure it is viewed as a valuable addition to existing colleague voice methods. More detail can be found on page 14 of the 2018 Annual Report and Accounts of the RBS Group. Inclusion Building a more inclusive RBS Group is essential for customers and colleagues. The ambition to be number one for customer service, trust and advocacy will only be achieved by understanding the needs of all colleagues and customers. The RBS Group’s inclusion guidelines apply to all colleagues globally and cover being LGBT Innovative, Gender Balanced, Disability Smart, Ethnically Diverse, all leading to Inclusive Culture. Detailed information can be found on page 16 of the 2018 Annual Report and Accounts of the RBS Group and on the Sustainable Banking pages on rbs.com.

Report of the directors
48 RBS plc Annual Report and Accounts 2018
The RBS Group has been recognised for work on Equality, Diversity and Inclusion in 2018 by retaining position in the Times Top 50 Employers for Women; being recognised again as a Top 10 Employer for Working Families; being rated as an Exemplary Level Employer by Carer Positive Scotland; being named a Stonewall Global Diversity Champion; being Platinum Ranked by Business in the Community for both Gender and Ethnicity work; and being upgraded to Gold Rated Disability Standard for the Business Disability Forum. The RBS Group was also proud to be named Employer of the Year by Women in Finance 2018. Going concern The Bank’s business activities and financial position, the factors likely to affect its future development and performance and its objectives and policies in managing the financial risks to which it is exposed, and its capital, are discussed in the Business review. The Bank’s regulatory capital resources and significant developments in 2018, and anticipated future developments are detailed in the Capital, liquidity and funding section on pages 13 to 18. This section also describes the Bank’s funding and liquidity profile, including changes in key metrics and the build up of liquidity reserves. Having reviewed the Bank’s forecasts, projections and other relevant evidence, the directors have a reasonable expectation that the Bank will continue in operational existence for the foreseeable future. Accordingly, the financial statements of the Bank have been prepared on a going concern basis. Corporate governance Internal control over financial reporting The internal controls over financial reporting for the Group are consistent with those at the RBS Group level. The Group has designed and assessed the effectiveness of its internal control over financial reporting as of 31 December 2018 based on the criteria set forth by the Committee of Sponsoring Organizations of the Treadway Commission in the 2013 publication of ‘Internal Control – Integrated Framework’. Any deficiencies identified are reported to the Group Audit Committee along with management’s remediation plans. The RBS Group's auditors have audited the effectiveness of the RBS Group's internal control over financial reporting and have given an unqualified opinion. Double Independent Non-Executive Directors An integral part of our ring-fencing governance arrangements is the appointment of “Double Independent Non-Executive Directors” or “DINEDs” to the NWH Ltd sub-group boards (NWH Ltd, the Bank, Ulster Bank Limited and National Westminster Bank Plc, and board committees.
The DINEDs are independent in two respects: (i) independent of management as non-executives; and (ii) independent of the rest of the RBS Group by virtue of their NWH Ltd sub group-only directorships. They play a critical role in our ring-fencing governance structure, with an enhanced role in managing any conflicts which may arise between the interests of NWH Ltd and RBSG. The DINEDs attend RBSG Board meetings in an observer capacity. On 30 April 2018 Yasmin Jetha stood down as a director of RBSG allowing her to assume DINED status. A further 3 DINEDs were appointed to the NWH Ltd sub-group boards with effect from 1 May 2018: Francesca Barnes, Graham Beale and Ian Cormack. Board of directors The Board is the main decision-making forum for the Bank. The Board is collectively responsible for the long-term success of the Bank and the delivery of sustainable value to its shareholders. The Board’s role is to provide leadership of the Bank. It monitors and maintains the consistency of the Bank’s activities within the strategic direction of the RBS Group; it reviews and approves risk appetite for strategic and material risks in accordance with the RBS Group Risk Appetite Framework and it monitors performance against risk appetite for the Bank. It approves the Bank’s key financial objectives and keeps the capital and liquidity positions of the Bank under review. The Board’s terms of reference includes key aspects of the Bank’s affairs reserved for the Board’s decision and are reviewed at least annually. There are a number of areas where the Board has delegated specific responsibility to management, including the Chief Executive and the Chief Financial Officer. These include responsibility for the operational management of the Bank’s businesses as well as reviewing high level strategic issues and considering risk appetite, risk policies and risk management strategies in advance of these being considered by the Board and/or its Committees. Specific delegated authorities are also in place in relation to business commitments across the Bank. The roles of Chairman and Chief Executive are distinct and separate, with a clear division of responsibilities. The Chairman leads the Board and ensures the effective engagement and contribution of all executive and non-executive directors. The Chief Executive has responsibility for all Bank businesses and acts in accordance with authority delegated by the Board. The non-executive directors combine broad business and commercial experience with independent and objective judgement and they provide independent challenge to the executive directors and the leadership team.
The governance arrangements for the committees have been designed to enable RBSG to exercise appropriate oversight and to ensure that, as far as is reasonably practicable, the NWH Ltd sub-group is able to take decisions independently of the wider RBS Group. The Audit, Performance & Remuneration, Nominations and Executive Committees of NWH Ltd operate as the Audit, Performance & Remuneration, Nominations and Executive Committees of each of, NWH Ltd, the Bank,Ulster Bank Limited and National Westminster Bank Plc, with meetings running concurrently. The Audit Committee comprises at least three independent non-executive directors and assists the Board in discharging its responsibilities for monitoring the quality of the financial statements. It reviews the accounting policies, financial reporting and regulatory compliance practices of the Bank, the Bank’s system and standards of internal controls, and monitors the Bank’s processes for internal audit and external audit. The Board Risk Committee comprises at least three independent non-executive directors. It provides oversight and advice to the Board on current and potential future risk exposures of the Group and future risk strategy. It reviews the Bank’s compliance with approved risk appetite and oversees the operation of the RBS Group’s Policy Framework and submission to regulators.. The Performance and Remuneration Committee comprises at least three independent non-executive directors and assists the RBSG Performance and Remuneration Committee with the oversight and implementation of the Bank’s policy on remuneration. It also considers and makes recommendations on remuneration arrangements for senior executives of the Bank. The Nominations Committee comprises four non-executive directors, and is chaired by the Chairman of the Bank. It is responsible for assisting the Board in the formal selection and appointment of directors. It reviews the structure, size and composition of the Board, and membership and chairmanship of Board committees. The Executive Committee comprises the Bank’s most senior executives and supports the Chief Executive Officer in managing the Bank’s businesses. It is responsible for managing and overseeing strategic, financial capital, risk and operational issues.

Report of the directors
49 RBS plc Annual Report and Accounts 2018
Directors The names of the current directors are shown on page 2.
All directors of the Bank are required to stand for election or re-election at the Annual General Meeting.
Directors’ interests Where directors of the Bank are also directors of RBSG, their interests in the shares of the ultimate holding company at 31 December 2018 are shown in the Corporate governance, Annual report on remuneration section of the 2018 Annual Report and Accounts of the RBS Group. None of the directors held an interest in the loan capital of the ultimate holding company, or in the shares of the Bank, during the period from 1 January 2018 to 14 February 2019.
Directors’ indemnities In terms of section 236 of the Companies Act 2006 (the “Companies Act”), Qualifying Third Party Indemnity Provisions have been issued by the ultimate holding company to its directors, members of the RBS Group Executive Committee, individuals authorised by the PRA/FCA and certain directors and/or officers of RBS Group subsidiaries.
Political donations During 2018, no political donations were made in the UK or EU, nor any political expenditure incurred in the UK or EU.
Directors’ disclosure to auditors Each of the directors who are also directors of the RBS Group at the date of approval of this report confirms that: (a) so far as the director is aware, there is norelevant audit information of which the Bank’sauditors are unaware; and(b) the director has taken all the steps thathe/she ought to have taken as a director to make himself/herself aware of any relevant audit information and to establish that the Bank’s auditors are aware of that information.
This confirmation is given and should be interpreted in accordance with the provisions of section 418 of the Companies Act.
Auditors EY LLP are the Bank’s auditors and have indicated their willingness to continue in office. A resolution to re-appoint EY LLP as the Bank’s auditors will be proposed at the forthcoming Annual General Meeting.
By order of the Board
Aileen Taylor Company Secretary 14 February 2019
The Royal Bank of Scotland plc is registered in Scotland No. SC083026
50 RBS plc Annual Report and Accounts 2018
Statement of directors’ responsibilities This statement should be read in conjunction with the responsibilities of the auditor set out in their report on pages 52 to 57.
The directors are responsible for the preparation of the Annual Report and Accounts which include the Strategic Report, Directors’ Report and the accounts. The Directors, as permitted by the Companies Act 2006, have elected to prepare company accounts, for each financial year in accordance with International Financial Reporting Standards as adopted by the European Union. They are responsible for preparing accounts that present fairly the financial position, financial performance and cash flows of the Bank. In preparing those accounts, the directors are required to:
select suitable accounting policies and then apply them consistently;
make judgements and estimates that are reasonable and prudent; and
state whether applicable accounting standards have been followed, subject to any material departures disclosed and explained in theaccounts.
The directors are responsible for keeping proper accounting records which disclose with reasonable accuracy at any time the financial position of the Bank and to enable them to ensure that the Annual Report and Accounts complies with the Companies Act 2006. They are also responsible for safeguarding the assets of the Bank and hence for taking reasonable steps for the prevention and detection of fraud and other irregularities.
The directors confirm that to the best of their knowledge:
the financial statements, prepared in accordance with International Financial Reporting Standards, give a true and fair view of the assets,liabilities, financial position and profit or loss of the Bank taken as a whole; and
the Strategic report and Directors’ report (incorporating the Financial review) include a fair review of the development and performance ofthe business and the position of the Bank taken as a whole, together with a description of the principal risks and uncertainties that theyface.
By order of the Board
Howard Davies Ross McEwan Katie Murray Chairman Chief Executive Chief Financial Officer
14 February 2019
Board of directors Chairman Executive directors Non-executive directorsHoward Davies Ross McEwan
Katie Murray Alison Rose-Slade
Francesca Barnes Graham Beale Ian Cormack Alison Davis Patrick Flynn Morten Friis Robert Gillespie Yasmin Jetha Baroness Noakes Mike Rogers Mark Seligman Dr Lena Wilson
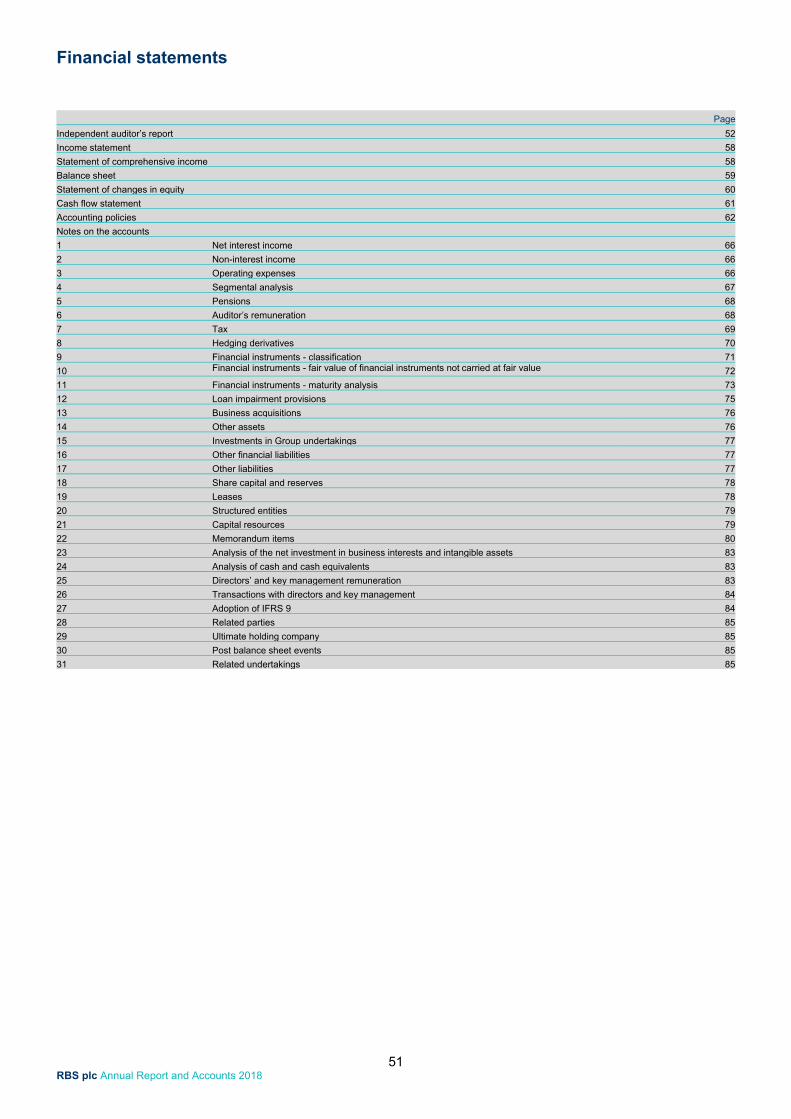
Financial statements
51 RBS plc Annual Report and Accounts 2018
Page
Independent auditor’s report 52
Income statement 58
Statement of comprehensive income 58
Balance sheet 59
Statement of changes in equity 60
Cash flow statement 61
Accounting policies 62
Notes on the accounts
1 Net interest income 66
2 Non-interest income 66
3 Operating expenses 66
4 Segmental analysis 67
5 Pensions 68
6 Auditor’s remuneration 68
7 Tax 69
8 Hedging derivatives 70
9 Financial instruments - classification 71
10 Financial instruments - fair value of financial instruments not carried at fair value 72
11 Financial instruments - maturity analysis 73
12 Loan impairment provisions 75
13 Business acquisitions 76
14 Other assets 76
15 Investments in Group undertakings 77
16 Other financial liabilities 77
17 Other liabilities 77
18 Share capital and reserves 78
19 Leases 78
20 Structured entities 79
21 Capital resources 79
22 Memorandum items 80
23 Analysis of the net investment in business interests and intangible assets 83
24 Analysis of cash and cash equivalents 83
25 Directors’ and key management remuneration 83
26 Transactions with directors and key management 84
27 Adoption of IFRS 9 84
28 Related parties 85
29 Ultimate holding company 85
30 Post balance sheet events 85
31 Related undertakings 85
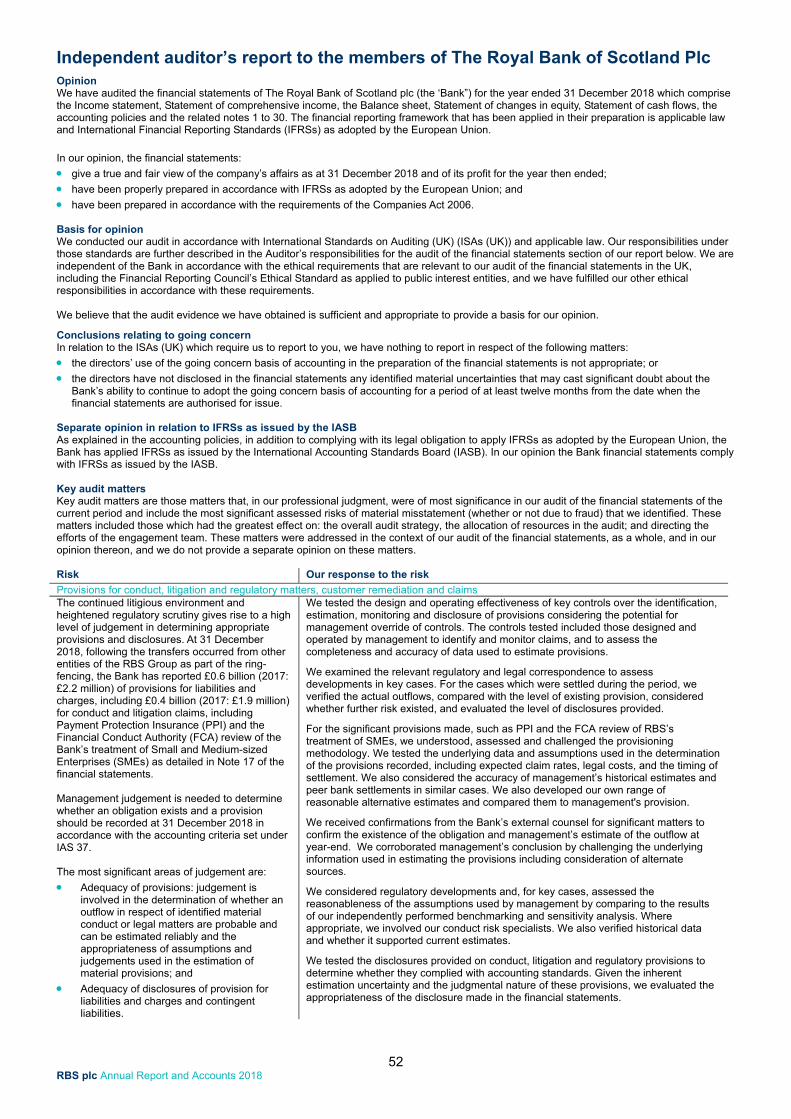
Independent auditor’s report to the members of The Royal Bank of Scotland Plc
52 RBS plc Annual Report and Accounts 2018
Opinion We have audited the financial statements of The Royal Bank of Scotland plc (the ‘Bank”) for the year ended 31 December 2018 which comprise the Income statement, Statement of comprehensive income, the Balance sheet, Statement of changes in equity, Statement of cash flows, the accounting policies and the related notes 1 to 30. The financial reporting framework that has been applied in their preparation is applicable law and International Financial Reporting Standards (IFRSs) as adopted by the European Union.
In our opinion, the financial statements:
give a true and fair view of the company’s affairs as at 31 December 2018 and of its profit for the year then ended;
have been properly prepared in accordance with IFRSs as adopted by the European Union; and
have been prepared in accordance with the requirements of the Companies Act 2006.
Basis for opinion We conducted our audit in accordance with International Standards on Auditing (UK) (ISAs (UK)) and applicable law. Our responsibilities under those standards are further described in the Auditor’s responsibilities for the audit of the financial statements section of our report below. We are independent of the Bank in accordance with the ethical requirements that are relevant to our audit of the financial statements in the UK, including the Financial Reporting Council’s Ethical Standard as applied to public interest entities, and we have fulfilled our other ethical responsibilities in accordance with these requirements.
We believe that the audit evidence we have obtained is sufficient and appropriate to provide a basis for our opinion.
Conclusions relating to going concern In relation to the ISAs (UK) which require us to report to you, we have nothing to report in respect of the following matters:
the directors’ use of the going concern basis of accounting in the preparation of the financial statements is not appropriate; or
the directors have not disclosed in the financial statements any identified material uncertainties that may cast significant doubt about theBank’s ability to continue to adopt the going concern basis of accounting for a period of at least twelve months from the date when thefinancial statements are authorised for issue.
Separate opinion in relation to IFRSs as issued by the IASB As explained in the accounting policies, in addition to complying with its legal obligation to apply IFRSs as adopted by the European Union, the Bank has applied IFRSs as issued by the International Accounting Standards Board (IASB). In our opinion the Bank financial statements comply with IFRSs as issued by the IASB.
Key audit matters Key audit matters are those matters that, in our professional judgment, were of most significance in our audit of the financial statements of the current period and include the most significant assessed risks of material misstatement (whether or not due to fraud) that we identified. These matters included those which had the greatest effect on: the overall audit strategy, the allocation of resources in the audit; and directing the efforts of the engagement team. These matters were addressed in the context of our audit of the financial statements, as a whole, and in our opinion thereon, and we do not provide a separate opinion on these matters.
Risk Our response to the risk
Provisions for conduct, litigation and regulatory matters, customer remediation and claims The continued litigious environment and heightened regulatory scrutiny gives rise to a high level of judgement in determining appropriate provisions and disclosures. At 31 December 2018, following the transfers occurred from other entities of the RBS Group as part of the ring-fencing, the Bank has reported £0.6 billion (2017: £2.2 million) of provisions for liabilities and charges, including £0.4 billion (2017: £1.9 million) for conduct and litigation claims, including Payment Protection Insurance (PPI) and the Financial Conduct Authority (FCA) review of the Bank’s treatment of Small and Medium-sized Enterprises (SMEs) as detailed in Note 17 of the financial statements.
Management judgement is needed to determine whether an obligation exists and a provision should be recorded at 31 December 2018 in accordance with the accounting criteria set under IAS 37.
The most significant areas of judgement are:
Adequacy of provisions: judgement isinvolved in the determination of whether anoutflow in respect of identified materialconduct or legal matters are probable andcan be estimated reliably and theappropriateness of assumptions andjudgements used in the estimation ofmaterial provisions; and
Adequacy of disclosures of provision forliabilities and charges and contingentliabilities.
We tested the design and operating effectiveness of key controls over the identification, estimation, monitoring and disclosure of provisions considering the potential for management override of controls. The controls tested included those designed and operated by management to identify and monitor claims, and to assess the completeness and accuracy of data used to estimate provisions.
We examined the relevant regulatory and legal correspondence to assess developments in key cases. For the cases which were settled during the period, we verified the actual outflows, compared with the level of existing provision, considered whether further risk existed, and evaluated the level of disclosures provided.
For the significant provisions made, such as PPI and the FCA review of RBS’s treatment of SMEs, we understood, assessed and challenged the provisioning methodology. We tested the underlying data and assumptions used in the determination of the provisions recorded, including expected claim rates, legal costs, and the timing of settlement. We also considered the accuracy of management’s historical estimates and peer bank settlements in similar cases. We also developed our own range of reasonable alternative estimates and compared them to management's provision.
We received confirmations from the Bank’s external counsel for significant matters to confirm the existence of the obligation and management’s estimate of the outflow at year-end. We corroborated management’s conclusion by challenging the underlying information used in estimating the provisions including consideration of alternate sources.
We considered regulatory developments and, for key cases, assessed the reasonableness of the assumptions used by management by comparing to the results of our independently performed benchmarking and sensitivity analysis. Where appropriate, we involved our conduct risk specialists. We also verified historical data and whether it supported current estimates.
We tested the disclosures provided on conduct, litigation and regulatory provisions to determine whether they complied with accounting standards. Given the inherent estimation uncertainty and the judgmental nature of these provisions, we evaluated the appropriateness of the disclosure made in the financial statements.
Independent auditor’s report to the members of The Royal Bank of Scotland Plc
53 RBS plc Annual Report and Accounts 2018
Risk Our response to the risk
Provisions for conduct, litigation and regulatory matters, customer remediation and claims Key observations communicated to the Audit Committee(1) We are satisfied that the Bank’s provisions for conduct, litigation and regulatory matters, customer remediation and claims are within a reasonable range and recognised in accordance with IFRS. We did not identify any material unrecorded provisions. We highlighted the following matters to the Audit Committee:
The PPI provision remains sensitive to key assumptions, the most significant of which is future complaint volumes. Management’sestimate was within our range of outcomes based on reasonable alternative assumptions; and
The provision related to the FCA review of the Bank’s treatment of SMEs is sensitive to a number of assumptions. Management’sestimate is within an acceptable range based on the current information available.
Relevant references in the Annual Report and Accounts Accounting policies Note 17 on the financial statements Risk Our response to the risk
Impairment of loans On 1 January 2018, a new accounting standard for financial instruments (IFRS 9) became effective, which introduced impairment based on expected credit losses, rather than the incurred loss model previously applied under IAS 39.
At 31 December 2018 the Bank reported total gross loans of £71.9 billion and £775 million of expected credit loss provisions.
Key judgements and estimates in respect of the timing and measurement of expected credit losses (ECL) include:
Allocation of assets to stage 1, 2, or 3 usingcriteria in accordance with the accountingstandard;
Accounting interpretations and modellingassumptions used to build the models thatcalculate the ECL;
Completeness and accuracy of data used tocalculate the ECL;
Inputs and assumptions used to estimatethe impact of multiple economic scenarios;
Completeness and valuation of post modeladjustments;
Measurements of individually assessedprovisions including the assessment ofmultiple scenarios; and
Accuracy and adequacy of the financialstatement disclosures.
As IFRS 9 was adopted at the start of the year, we performed audit procedures on the opening balances to gain assurance on the transition from IAS 39. This included evaluating the accounting interpretations for compliance with IFRS 9 and testing the adjustments and disclosures made on transition.
We tested the design and operating effectiveness of key controls across the processes relevant to the ECL. This included the allocation of assets into stages, model governance, data accuracy and completeness, credit monitoring, multiple economic scenarios, post model adjustments, individual provisions and production of journal entries and disclosures.
We observed the key executive finance and risk committees where the inputs, assumptions and adjustments to the ECL were discussed and approved.
We performed an overall assessment of the ECL provision levels by stage to determine if they were reasonable considering the Bank’s portfolio, risk profile, credit risk management practices and the macroeconomic environment. We considered trends in the economy and industries to which the Bank is exposed.
We challenged the criteria used to allocate an asset to stage 1, 2 or 3 in accordance with IFRS 9; this included peer benchmarking to assess staging levels. We tested assets in stage 1, 2 and 3 to verify that they were allocated to the appropriate stage.
With the support of our internal modelling specialists, we tested the assumptions, inputs and formulas used in a sample of ECL models. This included assessing the appropriateness of model design and formulas used, considering alternative modelling techniques and recalculating the Probability of Default, Loss Given Default and Exposure at Default for a sample of models.
To verify data quality, we tested the data used in the ECL calculation by reconciling to source systems. To test credit monitoring, we recalculated the risk ratings for a sample of performing loans.
With the support of our internal economic specialists, we assessed the base case and alternative economic scenarios, including challenging probability weights and comparing to other scenarios from a variety of external sources, as well as EY internally developed forecasts. We assessed whether forecasted macroeconomic variables were appropriate, such as GDP, unemployment, interest rates and House Price Index. With the support of our modelling specialists we challenged the correlation and impact of the macroeconomic factors to the ECL including how non-linearity was captured.
We assessed the completeness and appropriateness of post model adjustments and recalculated a sample. Based on current economic conditions and market circumstances, we considered the need for sector or systemic adjustments. We assessed the appropriateness of the scenarios used and calculation of the overlay in response to Brexit related economic uncertainty.
With the support of our internal valuation specialists, we recalculated a sample of individually assessed provisions including comparing to alternative scenarios and challenging probability weights assigned. The sample was based on a number of factors including higher risk sectors such as construction, retail, automotive, commercial real estate, shipping and oil and gas
We assessed the adequacy and appropriateness of disclosures for compliance with the accounting standards including disclosure of transition from IAS 39.
Note: (1) NatWest Holdings Audit Committee covers the ring-fenced bank legal entities of RBS Group, including RBS plc.
Independent auditor’s report to the members of The Royal Bank of Scotland Plc
54 RBS plc Annual Report and Accounts 2018
Key observations communicated to the Audit Committee
We are satisfied that credit impairment provisions were reasonable and in compliance with IFRS 9. We highlighted the following matters to the Audit Committee: Control deficiencies were identified on the transition to IFRS 9 and several compensating controls were implemented notably in the
process to produce the financial statement disclosures; Our testing and sensitivity analysis on the staging criteria did not identify material differences and overall, we concluded that the stage
allocation at 31 December 2018 was reasonable; Our testing of models and model assumptions did not highlight material differences; andFor individually assessed impairments, in a few instances we reported judgemental differences in respect of the extent of the impairmentidentified, however none of these differences were considered material.Relevant references in the Annual Report and Accounts Credit Risk section of the Capital and risk management section Accounting policies Note 12 on the financial statements Risk Our response to the risk
Financial impact of structural reform The Independent Commission on Banking’s (ICB) structural reform required banks to ensure certain activities and services are undertaken in a ring-fenced bank (RFB) by 1 January 2019. The Bank’s implementation of structural reform resulted in the reorganisation of some of the legal entities in the RBS Group and the transfer of assets and liabilities between the RFB and other entities of the group. These transfers mainly related to the transfer of customer loans (£64.5 billion) and customer deposits (£74.6 billion) from NWM plc to RBS plc. Ring-fencing related transfers also included the transfer of the RBS Treasury function and related balances to NatWest Bank plc from NatWest Markets plc.
Accounting and reporting risks arising include:
Appropriate application of accountingstandards in recording the value of assets andliabilities transferred between legal entities,specifically with respect to fair value andhedge accounting in the financial statementsof the relevant entities;
Future profitability estimates at a legal entitylevel, given the transfer of activities andservices, and the impact on the impairmentassessment of the carrying value ofinvestments in subsidiaries;
Accuracy of costs recorded in each legal entitygiven changes to the Bank’s approach to costrecharging and cost allocation;
Impact of the restructuring of the RBS Groupand movement of legal entities including thecarrying value of investments and reserves;and
Accuracy of financial reporting given changesto the legal entity financial reporting closingprocesses to reflect changes in the Bank.
With the support of our regulatory specialists we understood the implications of ICB for the Bank and gained an understanding of management’s process for implementing the ring-fencing regulation. We also examined the relevant regulatory correspondence to understand the impact and resolution of any significant findings that might impact financial reporting.
We challenged management’s assessment of the accounting impacts of ICB, including the accounting treatment for transfers of businesses and legal entities and the appropriateness of the interpretations used on areas of judgement, including hedge accounting and pensions, as well as the valuation of the assets moved. We analysed significant changes to financial information arising from legal entity changes and assessed if they were in line with our expectations.
We tested the design and operating effectiveness of key controls and performed substantive procedures over the transfer of balances between legal entities.
We assessed the control environment for the impairment of value of investments based on the post-ringfencing profit forecasts for each legal entity, considering the implications of other changes across legal entities on forecasted profitability.
We tested the design and operating effectiveness of the Bank’s key controls over legal entity recharges, including the governance and implementation of changes to legal entity recharges due to ICB. We tested adherence to internally agreed policies at a legal entity level, including assessments on the appropriateness of transfer pricing mark-ups applied.
We tested the design and operating effectiveness of the Bank’s key controls over financial reporting as it relates to the implications of ICB and the relevant disclosures. We assessed the quality of the disclosures including any need for additional notes.
Key observations communicated to the Audit Committee We are satisfied that the impact of structural reform has been properly accounted for and disclosed in accordance with IFRS. We highlighted the following to the Audit Committee:
Processes and controls in place over the transfer of balances including the measurement of assets transferred were designed andoperated effectively.
Relevant references in the Annual Report and Accounts Accounting policies Note 13 on the financial statements
Independent auditor’s report to the members of The Royal Bank of Scotland Plc
55 RBS plc Annual Report and Accounts 2018
Risk Our response to the risk IT systems and controls impacting financial reporting The IT environment is complex and pervasive to the operations of the Bank due to the large volume of transactions processed in numerous locations daily and the reliance on automated and IT dependent manual controls. Appropriate IT controls are required to ensure that applications process data as expected and that changes are made in an appropriate manner. Such controls contribute to mitigating the risk of potential fraud or errors as a result of changes to applications and data.
Our audit approach relies upon IT applications and the related control environment including:
User access management across application,database and operating systems;
Changes to the IT environment, includingtransformation that changes the IT landscape;
IT operational controls;
IT application or IT dependent controls; and
Evaluation of IT control environment at thirdparty service providers.
We assessed and challenged the design and operating effectiveness of IT controls over the applications, operating systems and databases that are relevant to financial reporting.
We assessed automated controls within business processes and the reliability of relevant reports used as part of a manual control. This included challenging the integrity of system interfaces, the completeness and accuracy of data feeds, automated calculations and specific input controls.
We assessed and challenged system migrations and related technology changes resulting from transformation programmes and the implementation of ICB that were material to financial reporting.
Where we identified systems outsourced to third party service providers we challenged IT general controls through the relevant Service Organisation Controls Reports produced by third parties and tested assessed required complementary controls performed by the Bank.
Where control deficiencies were identified, we tested remediation activities performed by management and compensating controls in place and assessed where necessary to mitigate any residual risk.
Key observations communicated to the Audit Committee We are satisfied that IT controls relevant to financial reporting operated effectively at year-end. We highlighted the following matters to the Audit Committee:
Instances of user access related deficiencies were identified. Compensating controls were tested or alternate procedures wereperformed; and
Exceptions were reported in some Service Organisation Controls Reports provided by third parties, including Cloud providers. We testedcompensating controls with no issues noted.
Relevant references in the Annual Report and Accounts Accounting policies
In the prior year, our auditor’s report included key audit matters in relation to legal entity recharges. In 2018, given materiality and the impact of Structural reform, these were not considered key audit matters.
An overview of the scope of our audit Tailoring the scope Our assessment of audit risk, our evaluation of materiality and our allocation of performance materiality determine our audit scope for each component of the Bank. This enables us to form an opinion on the financial statements. We take into account the size and risk profile of the component and its activities, the organisation of the Bank and effectiveness of RBS Group-wide controls, changes in the business environment and other factors such as recent internal audit results when assessing the level of work to be performed at each component.
Component Scope Key locations
UK Personal & Business Banking Full United Kingdom Commercial Banking Full United Kingdom Private Banking Specific United Kingdom Central items, Treasury and Services Full United Kingdom, India, Poland
Changes from the prior year The Bank was the entity formerly known as Adam & Company plc in the prior year. The entity was renamed The Royal Bank of Scotland plc following the first Ring-Fenced Transfer Scheme on 30 April 2018. As such, the scope of the audit changed to incorporate the components identified above in 2018.
The table below illustrates the coverage obtained from the work performed by our audit teams, the coverage includes the full scope components presented in disposal groups as noted above. We considered total assets, total equity and absolute value of the amounts in the income statement (meaning the magnitude of the amounts without regard to their positive or negative value) to verify we had appropriate overall coverage on the income statement.
Full scope (1) Specific scope (2) Other procedures (3) Total Total assets 98% 2% 0% 100% Total equity 99% 1% 0% 100% Absolute value of the income statement 99% 1% 0% 100% The audit scope of Specific scope component may not have included testing of all significant accounts within the component. However the testing will have contributed to the total coverage of significant accounts tested for the overall Bank.
Notes: (1) Full scope audit procedures on all significant accounts. (2) Specific scope: audit procedures on selected accounts. (3) Specific scope: audit procedures on selected accounts.
Independent auditor’s report to the members of The Royal Bank of Scotland Plc
56 RBS plc Annual Report and Accounts 2018
Our application of materiality We apply the concept of materiality in planning and performing the audit, in evaluating the effect of identified misstatements on the audit and in forming our audit opinion.
Materiality The magnitude of omission or misstatement that, individually or in the aggregate, could reasonably be expected to influence the economic decisions of the users of the financial statements. Materiality provides a basis for determining the nature and extent of our audit procedures.
We determined materiality for the Bank to be £50 million (2017 materiality: £2 million), which is 5% of forecasted profit before tax of the Bank. The significant increase in materiality is due to the impact of the transfer of balances as part of the ring-fencing of the RBS Group, as described above. The measure of materiality for the Bank is consistent with the wider industry and is the standard for listed and regulated entities.
Performance materiality The application of materiality at the individual account or balance level is set at an amount to reduce to an appropriately low level the probability that the aggregate of uncorrected and corrected misstatements exceed materiality.
On the basis of our risk assessments, together with our assessment of the Bank’s overall control environment, our judgement was that performance materiality was 50% of our planning materiality, namely £25 million (2017: £1 million). We have set performance materiality at this percentage (which is at the lowest end of the range of our audit methodology) based on various considerations including the past history of misstatements, our ability to assess the likelihood of misstatements, the effectiveness of the control environment and other factors affecting the entity and its financial reporting.
Reporting threshold An amount below which identified misstatements are considered to be [clearly trivial].
We agreed with the Audit Committee that we would report to them all corrected and uncorrected audit misstatements in excess of £2 million, which is set at 5% of planning materiality, as well as misstatements below that threshold that, in our view, warranted reporting on qualitative grounds.
We evaluate any uncorrected misstatements against both the quantitative and qualitative measures of materiality discussed above and in light of other relevant qualitative considerations in forming our opinion.
Other information The other information comprises the information included in the annual report, other than the financial statements and our auditor’s report thereon. The directors are responsible for the other information.
Our opinion on the financial statements does not cover the other information and, except to the extent otherwise explicitly stated in this report, we do not express any form of assurance conclusion thereon.
In connection with our audit of the financial statements, our responsibility is to read the other information and, in doing so, consider whether the other information is materially inconsistent with the financial statements or our knowledge obtained in the audit or otherwise appears to be materially misstated. If we identify such material inconsistencies or apparent material misstatements, we are required to determine whether there is a material misstatement in the financial statements or a material misstatement of the other information. If, based on the work we have performed, we conclude that there is a material misstatement of the other information, we are required to report that fact.
We have nothing to report in this regard.
Opinions on other matters prescribed by the Companies Act 2006 In our opinion, based on the work undertaken in the course of the audit:
the information given in the Strategic report and the Report of the directors for the financial year for which the financial statements areprepared is consistent with the financial statements; and
the Strategic report and the Report of the directors have been prepared in accordance with applicable legal requirements.
Matters on which we are required to report by exception In the light of the knowledge and understanding of the Bank and its environment obtained in the course of the audit, we have not identified material misstatements in the Strategic report or the Report of the directors.
We have nothing to report in respect of the following matters in relation to which the Companies Act 2006 requires us to report to you if, in our opinion:
adequate accounting records have not been kept by the Bank, or returns adequate for our audit have not been received from branches notvisited by us; or
the financial statements are not in agreement with the accounting records and returns; or
certain disclosures of directors’ remuneration specified by law are not made; or
we have not received all the information and explanations we require for our audit
Responsibilities of directors As explained more fully in the directors’ responsibilities statement, the directors are responsible for the preparation of the financial statements and for being satisfied that they give a true and fair view, and for the implementation of such internal control as the directors determine is necessary to enable the preparation of financial statements that are free from material misstatement, whether due to fraud or error.
In preparing the financial statements, the directors are responsible for assessing the Bank’s ability to continue as a going concern, disclosing, as applicable, matters related to going concern and using the going concern basis of accounting unless the directors either intend to liquidate the Bank or to cease operations, or have no realistic alternative but to do so.
Independent auditor’s report to the members of The Royal Bank of Scotland Plc
57 RBS plc Annual Report and Accounts 2018
Auditor’s responsibilities for the audit of the financial statements Our objectives are to obtain reasonable assurance about whether the financial statements as a whole are free from material misstatement, whether due to fraud or error, and to issue an auditor’s report that includes our opinion. Reasonable assurance is a high level of assurance, but is not a guarantee that an audit conducted in accordance with ISAs (UK) will always detect a material misstatement when it exists. Misstatements can arise from fraud or error and are considered material if, individually or in the aggregate, they could reasonably be expected to influence the economic decisions of users taken on the basis of these financial statements.
Explanation as to what extent the audit was considered capable of detecting irregularities, including fraud The objectives of our audit, in respect to fraud, are; to identify and assess the risks of material misstatement of the financial statements due to fraud; to obtain sufficient appropriate audit evidence regarding the assessed risks of material misstatement due to fraud, through designing and implementing appropriate responses; and to respond appropriately to fraud or suspected fraud identified during the audit. However, the primary responsibility for the prevention and detection of fraud rests with both those charged with governance of the entity and management.
We obtained an understanding of the legal and regulatory frameworks that are applicable to the Bank and have a direct impact on the preparation of the financial statements. We determined that the most significant are:
The regulations, licence conditions and supervisory requirements of the Prudential Regulation Authority (PRA) and the Financial ConductAuthority (FCA).
Companies Act 2006
Financial Reporting Council (FRC) and the UK Corporate Governance Code
Tax Legislation (governed by HM Revenue and Customs)
We understood how the Bank is complying with those frameworks by reviewing the RBS Policy Framework, holding discussions with the Bank’s general counsel, external counsel compliance group, regulatory group, internal audit, amongst others. We inquired as to any known instances of non-compliance or suspected non-compliance with laws and regulations. We also reviewed the Bank’s Complaints Management Policy and Whistleblowing Policy. We assessed the susceptibility of the Bank’s financial statements to material misstatement, including how fraud might occur by holding discussions with senior management, including the Chief Executive, Chief Financial Officer, Chief Risk Officer, Head of Internal Audit and the Audit Committee Chairman. We also reviewed the Bank’s fraud-related policies and mandates of different governance forums assessing fraud. Based on this understanding we designed our audit procedures to identify non-compliance with such laws and regulations. Our procedures involved inquiring of key management, reviewing the key policies and reports on the aforementioned regulatory frameworks as well as reviewing the correspondence exchanged with the Regulators.
A further description of our responsibilities for the audit of the financial statements is located on the Financial Reporting Council’s website at https://www.frc.org.uk/auditorsresponsibilities. This description forms part of our auditor’s report.
Other matters we are required to address
Following the recommendation of the Audit Committee we were appointed by the Bank at its annual general meeting on 4 May 2016 to auditthe financial statements of the Bank for the period ending 31 December 2016 and subsequent financial periods. The period of totaluninterrupted engagement including previous renewals and reappointments is 3 years, covering periods from our appointment through 31December 2018.
The non-audit services prohibited by the FRC’s Ethical Standard were not provided to the Bank and we remain independent of the Bank inconducting the audit.
The audit opinion is consistent with the additional report to the Audit Committee
Use of our report This report is made solely to the company’s members, as a body, in accordance with Chapter 3 of Part 16 of the Companies Act 2006. Our audit work has been undertaken so that we might state to the company’s members those matters we are required to state to them in an auditor’s report and for no other purpose. To the fullest extent permitted by law, we do not accept or assume responsibility to anyone other than the company and the company’s members as a body, for our audit work, for this report, or for the opinions we have formed.
Jonathan Bourne (Senior Statutory Auditor) for and on behalf of Ernst & Young LLP, Statutory Auditor London, United Kingdom 14 February 2019
Note: (1) The maintenance and integrity of the RBS Group web site is the responsibility of the directors; the work carried out by the auditors does not involve
consideration of these matters and, accordingly, the auditors accept no responsibility for any changes that may have occurred to the financial statements since they were initially presented on the web site. Legislation in the United Kingdom governing the preparation and dissemination of financial statements may differ from legislation in other jurisdictions.
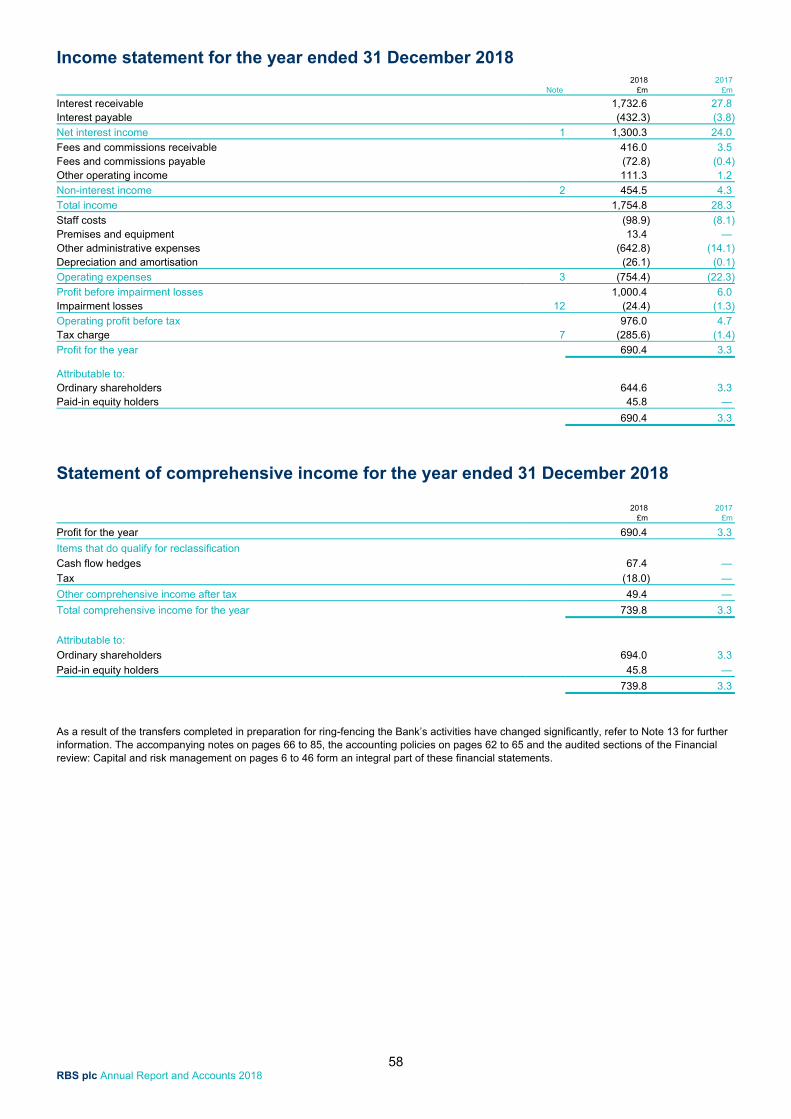
Income statement for the year ended 31 December 2018
58 RBS plc Annual Report and Accounts 2018
Note 2018 2017
£m £m
Interest receivable 1,732.6 27.8 Interest payable (432.3) (3.8)
Net interest income 1 1,300.3 24.0
Fees and commissions receivable 416.0 3.5 Fees and commissions payable (72.8) (0.4)Other operating income 111.3 1.2
Non-interest income 2 454.5 4.3
Total income 1,754.8 28.3
Staff costs (98.9) (8.1)Premises and equipment 13.4 — Other administrative expenses (642.8) (14.1)Depreciation and amortisation (26.1) (0.1)
Operating expenses 3 (754.4) (22.3)
Profit before impairment losses 1,000.4 6.0 Impairment losses 12 (24.4) (1.3)
Operating profit before tax 976.0 4.7 Tax charge 7 (285.6) (1.4)
Profit for the year 690.4 3.3
Attributable to: Ordinary shareholders 644.6 3.3 Paid-in equity holders 45.8 —
690.4 3.3
Statement of comprehensive income for the year ended 31 December 2018
2018 2017 £m £m
Profit for the year 690.4 3.3
Items that do qualify for reclassification
Cash flow hedges 67.4 —
Tax (18.0) —
Other comprehensive income after tax 49.4 —
Total comprehensive income for the year 739.8 3.3
Attributable to:
Ordinary shareholders 694.0 3.3
Paid-in equity holders 45.8 —
739.8 3.3
As a result of the transfers completed in preparation for ring-fencing the Bank’s activities have changed significantly, refer to Note 13 for further information. The accompanying notes on pages 66 to 85, the accounting policies on pages 62 to 65 and the audited sections of the Financial review: Capital and risk management on pages 6 to 46 form an integral part of these financial statements.
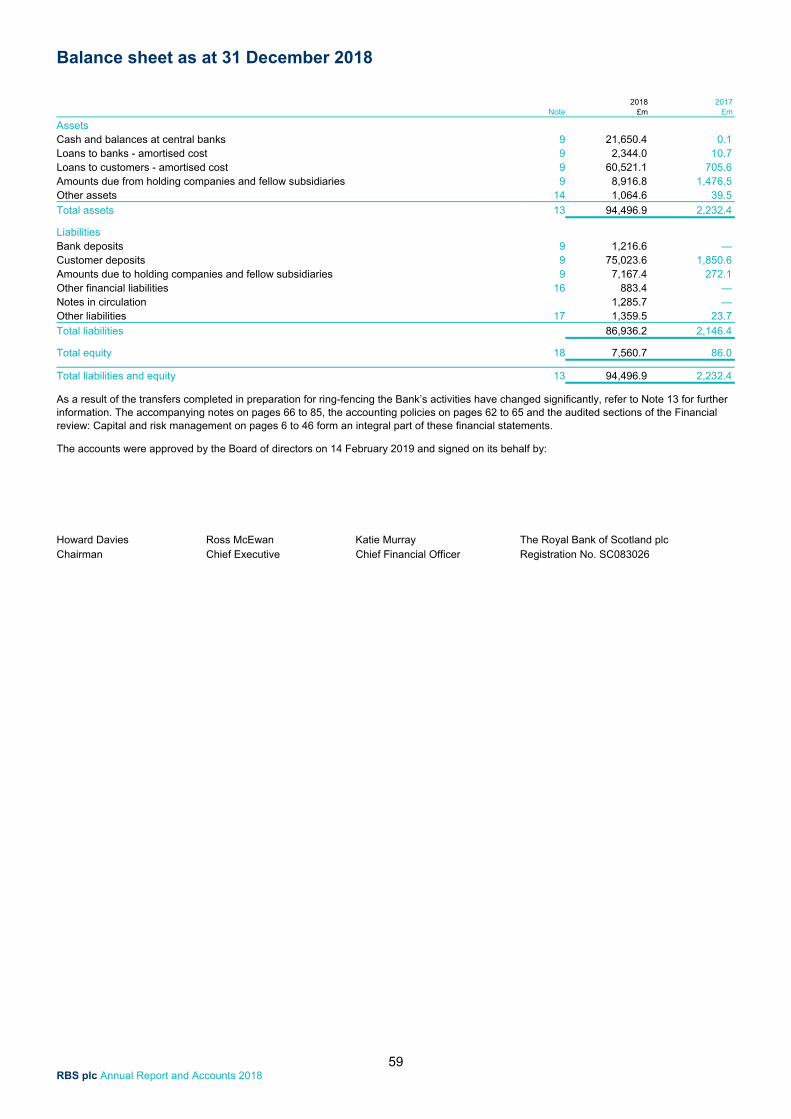
Balance sheet as at 31 December 2018
59 RBS plc Annual Report and Accounts 2018
Note
2018 2017
£m £m
Assets Cash and balances at central banks 9 21,650.4 0.1 Loans to banks - amortised cost 9 2,344.0 10.7 Loans to customers - amortised cost 9 60,521.1 705.6 Amounts due from holding companies and fellow subsidiaries 9 8,916.8 1,476.5 Other assets 14 1,064.6 39.5
Total assets 13 94,496.9 2,232.4
Liabilities Bank deposits 9 1,216.6 — Customer deposits 9 75,023.6 1,850.6 Amounts due to holding companies and fellow subsidiaries 9 7,167.4 272.1 Other financial liabilities 16 883.4 — Notes in circulation 1,285.7 — Other liabilities 17 1,359.5 23.7
Total liabilities 86,936.2 2,146.4
Total equity 18 7,560.7 86.0
Total liabilities and equity 13 94,496.9 2,232.4
As a result of the transfers completed in preparation for ring-fencing the Bank’s activities have changed significantly, refer to Note 13 for further information. The accompanying notes on pages 66 to 85, the accounting policies on pages 62 to 65 and the audited sections of the Financial review: Capital and risk management on pages 6 to 46 form an integral part of these financial statements.
The accounts were approved by the Board of directors on 14 February 2019 and signed on its behalf by:
Howard Davies Ross McEwan Katie Murray The Royal Bank of Scotland plc Chairman Chief Executive Chief Financial Officer Registration No. SC083026
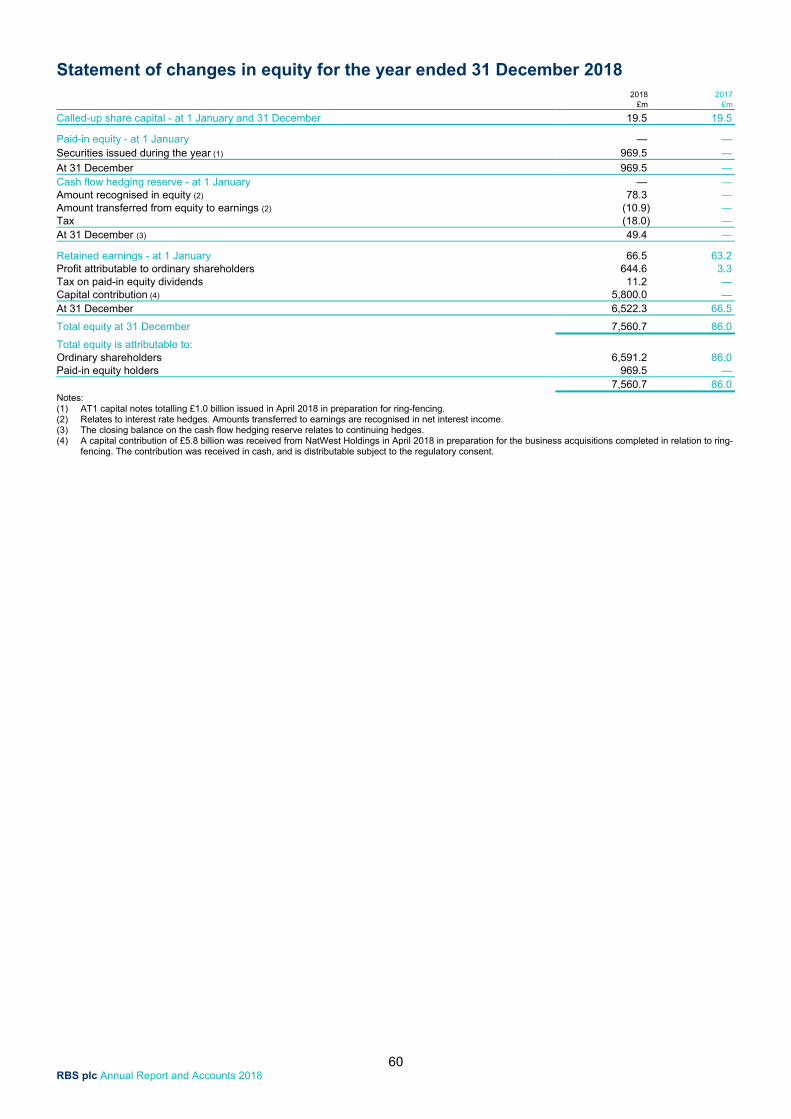
Statement of changes in equity for the year ended 31 December 2018
60 RBS plc Annual Report and Accounts 2018
2018 2017 £m £m
Called-up share capital - at 1 January and 31 December 19.5 19.5
Paid-in equity - at 1 January — — Securities issued during the year (1) 969.5 —
At 31 December 969.5 — Cash flow hedging reserve - at 1 January — — Amount recognised in equity (2) 78.3 — Amount transferred from equity to earnings (2) (10.9) — Tax (18.0) — At 31 December (3) 49.4 —
Retained earnings - at 1 January 66.5 63.2 Profit attributable to ordinary shareholders 644.6 3.3 Tax on paid-in equity dividends 11.2 — Capital contribution (4) 5,800.0 — At 31 December 6,522.3 66.5
Total equity at 31 December 7,560.7 86.0
Total equity is attributable to: Ordinary shareholders 6,591.2 86.0 Paid-in equity holders 969.5 — 7,560.7 86.0 Notes: (1) AT1 capital notes totalling £1.0 billion issued in April 2018 in preparation for ring-fencing. (2) Relates to interest rate hedges. Amounts transferred to earnings are recognised in net interest income. (3) The closing balance on the cash flow hedging reserve relates to continuing hedges. (4) A capital contribution of £5.8 billion was received from NatWest Holdings in April 2018 in preparation for the business acquisitions completed in relation to ring-
fencing. The contribution was received in cash, and is distributable subject to the regulatory consent.
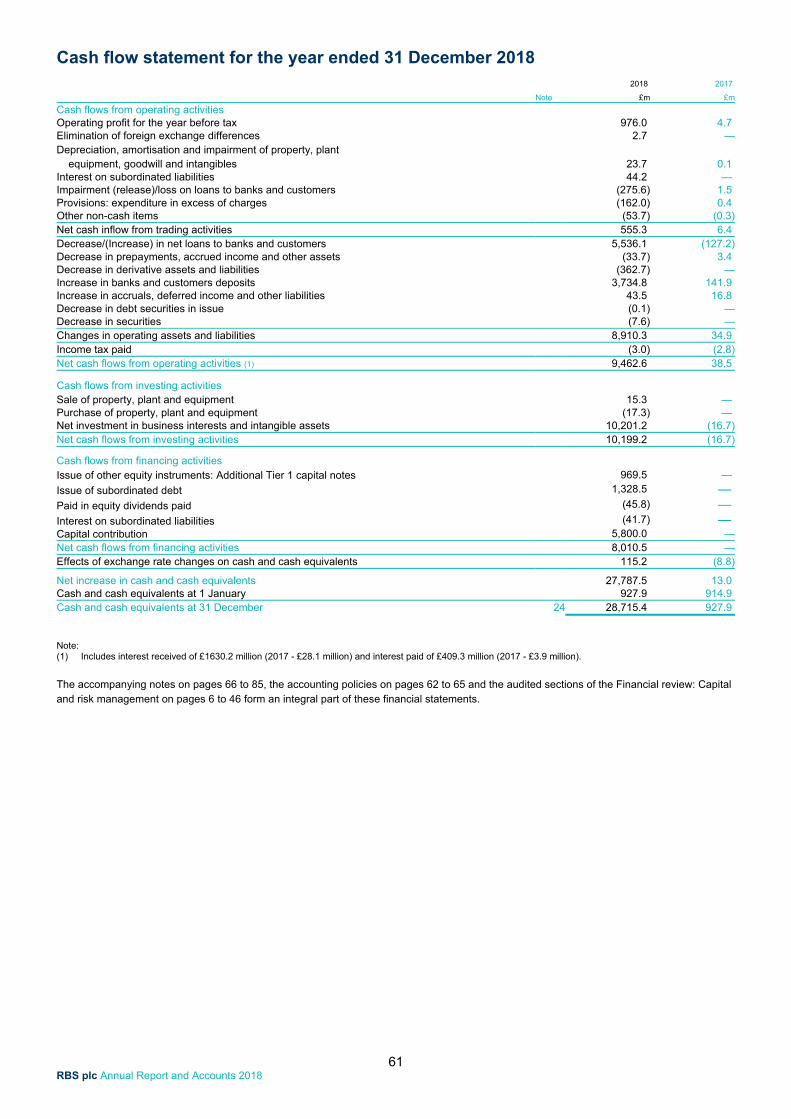
Cash flow statement for the year ended 31 December 2018
61 RBS plc Annual Report and Accounts 2018
2018 2017
Note £m £m
Cash flows from operating activities
Operating profit for the year before tax 976.0 4.7 Elimination of foreign exchange differences 2.7 —Depreciation, amortisation and impairment of property, plant equipment, goodwill and intangibles 23.7 0.1 Interest on subordinated liabilities 44.2 — Impairment (release)/loss on loans to banks and customers (275.6) 1.5 Provisions: expenditure in excess of charges (162.0) 0.4 Other non-cash items (53.7) (0.3)Net cash inflow from trading activities 555.3 6.4 Decrease/(Increase) in net loans to banks and customers 5,536.1 (127.2)Decrease in prepayments, accrued income and other assets (33.7) 3.4 Decrease in derivative assets and liabilities (362.7) —Increase in banks and customers deposits 3,734.8 141.9 Increase in accruals, deferred income and other liabilities 43.5 16.8 Decrease in debt securities in issue (0.1) —Decrease in securities (7.6) —Changes in operating assets and liabilities 8,910.3 34.9 Income tax paid (3.0) (2.8)Net cash flows from operating activities (1) 9,462.6 38.5
Cash flows from investing activities Sale of property, plant and equipment 15.3 — Purchase of property, plant and equipment (17.3) — Net investment in business interests and intangible assets 10,201.2 (16.7)Net cash flows from investing activities 10,199.2 (16.7)
Cash flows from financing activities Issue of other equity instruments: Additional Tier 1 capital notes 969.5 —
Issue of subordinated debt 1,328.5 — Paid in equity dividends paid (45.8) — Interest on subordinated liabilities (41.7) — Capital contribution 5,800.0 —Net cash flows from financing activities 8,010.5 —Effects of exchange rate changes on cash and cash equivalents 115.2 (8.8)
Net increase in cash and cash equivalents 27,787.5 13.0 Cash and cash equivalents at 1 January 927.9 914.9 Cash and cash equivalents at 31 December 24 28,715.4 927.9
Note: (1) Includes interest received of £1630.2 million (2017 - £28.1 million) and interest paid of £409.3 million (2017 - £3.9 million).
The accompanying notes on pages 66 to 85, the accounting policies on pages 62 to 65 and the audited sections of the Financial review: Capital and risk management on pages 6 to 46 form an integral part of these financial statements.

Accounting policies
62 RBS plc Annual Report and Accounts 2018
1. Presentation of accounts The accounts set out on pages 58 to 85, including these accounting policies on pages 62 to 65 and the audited sections of the Financial review: Capital and risk management on pages 6 to 46, are prepared on a going concern basis (see the Report of the directors, page 47) and in accordance with International Financial Reporting Standards as issued by the International Accounting Standards Board (IASB) and interpretations as issued by the IFRS Interpretations Committee of the IASB and adopted by the European Union (EU) (together IFRS). The company is incorporated in the UK and registered in Scotland. Its accounts are presented in accordance with the Companies Act 2006. With the exception of certain financial instruments as described in Accounting policies 10 and 17, the accounts are presented on an historical cost basis. Consolidated financial statements The financial statements contain information about the Bank as an individual company and do not contain consolidated financial information as the parent of a group. The Bank is exempt under IFRS 10 Consolidated Financial Statements and section 400 of the Companies Act 2006 from the requirement to prepare consolidated financial statements as in accordance with IFRS 10. The Bank and its subsidiaries are included by full consolidation in the IFRS consolidated financial statements of its ultimate parent, The Royal Bank of Scotland Group plc, a public company registered in Scotland whose registered address is 36 St Andrew Square, Edinburgh. EH2 2YB. Adoption of IFRS 9 Refer to Note 27 for details of the adoption of IFRS 9. Other amendments to IFRS IFRS 15 ‘Revenue from Contracts with Customers’ has been adopted with effect from 1 January 2018. The Accounting policy is updated to reflect the terminology in the new standard but it has had no effect on financial information reported in the current or comparative periods. Interest income and expense continues to be recognised using the effective interest rate method for financial instruments measured at historical cost. There has been no restatement of profit or loss for comparative periods. Other amendments to IFRS effective for 2018, including IFRS 2 ‘Share-based payments’ and IAS 40 ‘Investment Property’ have not had a material effect on the Bank’s financial statements. 2. Recognition of business transfers. On the acquisition of a business from a group company, the assets, liabilities and IFRS reserves are recognised at inherited values. Inherited values are taken from the consolidated accounts of RBSG plc and including the accounting history since initial recognition. The acquirer recognises in
merger reserve any difference between the consideration paid and the net items recognised at inherited values.
3. Revenue recognition Interest income or expense on financial instruments that are measured at amortised cost and fair value through other comprehensive income is determined using the effective interest rate method. The effective interest rate allocates the interest income or interest expense over the expected life of the asset or liability at the rate that exactly discounts all estimated future cash flows to equal the instrument's initial carrying amount. Calculation of the effective interest rate takes into account fees payable or receivable that are an integral part of the instrument's yield, premiums or discounts on acquisition or issue, early redemption fees and transaction costs. All contractual terms of a financial instrument are considered when estimating future cash flows. Negative effective interest accruing to financial assets is presented in interest payable. Net interest income in the income statement only relates to financial instruments measured at amortised cost; the interest on debt instruments classified as fair value through OCI; and the effective part of any related accounting hedging instruments. Other interest relating to financial instruments measured at fair value is recognised as part of the movement in fair value.
Fees in respect of services are recognised as the right to consideration accrues through the performance of each distinct service obligation to the customer. The arrangements are generally contractual and the cost of providing the service is incurred as each service is performed. The price is usually fixed and always determinable.
4. Employee benefits Short-term employee benefits, such as salaries, paid absences, and other benefits are accounted for on an accruals basis over the period in which the employees provide the related services. Employees may receive variable compensation satisfied by cash, by debt instruments issued by the RBS Group or by RBSG shares. Variable compensation is charged to profit or loss over the period from the start of the year to which the variable compensation relates to the expected settlement date taking account of forfeiture and clawback criteria.
Contributions to defined contribution pension schemes and defined benefit pension schemes sponsored by other member of the RBS Group are recognised in profit or loss when payable.
For defined benefit schemes, the defined benefit obligation is measured on an actuarial basis using the projected unit credit method and discounted at a rate determined by reference to market yields at the end of the reporting period on high quality corporate bonds of equivalent term and currency to the scheme liabilities. Scheme assets are measured at their fair value. The difference between scheme assets and scheme
liabilities, the net defined benefit asset or liability, is recognised in the balance sheet. A defined benefit asset is limited to the present value of any economic benefits available to the Bank in the form of refunds from the plan or reduced contributions to it.
The charge to profit or loss for pension costs (recorded in operating expenses) comprises: the current service cost interest, computed at the rate used to
discount scheme liabilities, on the net defined benefit liability or asset
past service cost resulting from a scheme amendment or curtailment
gains or losses on settlement.
Actuarial gains and losses (i.e. gains or and losses on re-measuring the net defined benefit asset or liability) are recognised in other comprehensive income in full in the period in which they arise. 5. Impairment of investments and intangible assets At each balance sheet date, the Bank assesses whether there is any indication that its investment or intangible assets are impaired. If any such indication exists, it estimates the recoverable amount of the asset and the impairment loss if any. 6. Foreign currencies The financial statements are presented in sterling which is the functional currency of the company. Transactions in foreign currencies are recorded in the functional currency at the foreign exchange rate ruling at the date of transaction. Monetary assets and liabilities denominated in foreign currencies are translated into the relevant functional currency at the foreign exchange rates ruling at the balance sheet date. Foreign exchange differences arising on the settlement of foreign currency transactions and from the translation of monetary assets and liabilities are reported in income from ordinary activities except for differences arising on cash flow hedges (see Accounting policy 17. Non-monetary items denominated in foreign currencies that are stated at fair value are translated into the relevant functional currency at the foreign exchange rates ruling at the dates the values are determined. Translation differences arising on non-monetary items measured at fair value are recognised in profit or loss except for differences arising on available for sale non-monetary financial assets, for example equity shares, which are recognised in other comprehensive income unless the asset is the hedged item in a fair value hedge.
7. Leases The Bank’s contracts to lease assets are principally operating leases. Operating lease rental expense is included in Premises and equipment costs and recognised as an expense on a straight-line basis over the lease term unless another systematic basis better represents the benefit to the Bank.

Accounting policies
63 RBS plc Annual Report and Accounts 2018
8. Provisions The Bank recognises a provision for a present obligation resulting from a past event when it is more likely than not that it will be required to transfer economic benefits to settle the obligation and the amount of the obligation can be estimated reliably. Provision is made for restructuring costs, including the costs of redundancy, when the Bank has a constructive obligation to restructure. An obligation exists when the Bank has a detailed formal plan for the restructuring and has raised a valid expectation in those affected by starting to implement the plan or by announcing its main features. If the Bank has a contract that is onerous, it recognises the present obligation under the contract as a provision. An onerous contract is one where the unavoidable costs of meeting the Bank’s contractual obligations exceed the expected economic benefits. When the Bank vacates a leasehold property, a provision is recognised for the costs under the lease less any expected economic benefits (such as rental income). Contingent liabilities are possible obligations arising from past events, whose existence will be confirmed only by uncertain future events, or present obligations arising from past events that are not recognised because either an outflow of economic benefits is not probable or the amount of the obligation cannot be reliably measured. Contingent liabilities are not recognised but information about them is disclosed unless the possibility of any outflow of economic benefits in settlement is remote. 9. Tax Income tax expense or income, comprising current tax and deferred tax, is recorded in the income statement except income tax on items recognised outside profit or loss which is credited or charged to other comprehensive income or to equity as appropriate. Current tax is income tax payable or recoverable in respect of the taxable profit or loss for the year arising in profit or loss, other comprehensive income or equity. Provision is made for current tax at rates enacted or substantively enacted at the balance sheet date. Deferred tax is the tax expected to be payable or recoverable in respect of temporary differences between the carrying amount of an asset or liability for accounting purposes and its carrying amount for tax purposes. Deferred tax liabilities are generally recognised for all taxable temporary differences and deferred tax assets are recognised to the extent that it is probable that the asset will be recovered. Deferred tax is not recognised on temporary differences that arise from initial recognition of an asset or a liability in a transaction (other than a business combination) that at the time of the transaction affects neither accounting nor taxable profit or loss. Deferred tax is calculated using tax rates expected to apply in
the periods when the assets will be realised or the liabilities settled, based on tax rates and laws enacted, or substantively enacted, at the balance sheet date. Deferred tax assets and liabilities are offset where the Bank has a legally enforceable right to offset and where they relate to income taxes levied by the same taxation authority either on an individual company or on RBS Group companies in the same tax group that intend, in future periods, to settle current tax liabilities and assets on a net basis or on a gross basis simultaneously. 10. Financial instruments On initial recognition, financial instruments are measured at fair value. Subsequently they are classified as follows: designated at fair value through profit or loss; amortised cost, the default class for liabilities; fair value through profit or loss, the default class for assets; or financial assets may be designated as at fair value through other comprehensive income. Regular way purchases of financial assets classified as amortised cost are recognised on the settlement date; all other regular way transactions in financial assets are recognised on the trade date. Designated as at fair value through profit or loss – a financial instrument may be designated as at fair value through profit or loss only if such designation (a) eliminates or significantly reduces a measurement or recognition inconsistency; or (b) applies to a group of financial assets, financial liabilities or both, that the Bank manages and evaluates on a fair value basis; or (c) relates to a financial liability that contains an embedded derivative which is not evidently closely related to the host contract. Financial assets that the Bank designates on initial recognition as being at fair value through profit or loss are recognised at fair value, with transaction costs being recognised in profit or loss, and are subsequently measured at fair value. Gains and losses are recognised in profit or loss as they arise. Amortised cost assets – have to meet both the following criteria:
the asset is held within a business model whose objective is solely to hold assets to collect contractual cash flows; and
the contractual terms of the financial asset are solely payments of principal and interest on the outstanding balance.
Amortised cost liabilities – all liabilities that are not subsequently measured at fair value are measured at amortised cost. Assets designated at fair value through other comprehensive income – An equity instrument may be designated irrevocably at fair value through other comprehensive income. Other assets have to meet both the following criteria: (a) the asset is held within a business model
whose objective is both to hold assets to collect contractual cash flows and selling financial assets; and
(b) the contractual terms of the financial asset are solely payments of principal and interest on the outstanding balance.
Fair value through profit or loss - a financial liability is measured at fair value if it arises from: a financial guarantee contract; a commitment to lend at below market rates; an obligation arising from the failed sale of an asset; or a contingent consideration for a business acquisition. Fair value through profit or loss is the default classification for a financial asset. Reclassifications – financial liabilities cannot be reclassified. Financial assets are only reclassified where there has been a change in the business model. Fair value – the fair value is the price that would be received to sell an asset or paid to transfer a liability in an orderly transaction between market participants at the measurement date. Business model assessment – business models are assessed at portfolio level, being the level at which they are managed. This is expected to result in the most consistent classification of assets because it aligns with the stated objectives of the portfolio, its risk management, manager’s remuneration and the ability to monitor sales of assets from a portfolio. The criteria for classifying cash flows as solely principal and interest are assessed against the contractual terms of a facility, with attention to leverage features; prepayment and extension terms; and triggers that might reset the effective rate of interest. 11. Impairments At each balance sheet date each financial asset or portfolio of loans measured at amortised cost or at fair value through other comprehensive income, issued financial guarantee and loan commitment is assessed for impairment. Loss allowances are forward looking, based on 12 month expected credit losses where there has not been a significant increase in credit risk rating, otherwise allowances are based on lifetime expected losses. Loss allowances for lease receivables are always made on a lifetime basis. Expected credit losses are a probability-weighted estimate of credit losses. The probability is determined by the risk of default which is applied to the cash flow estimates. In the absence of a change in credit rating, allowances are recognised when there is reduction in the net present value of expected cash flows. On a significant increase in credit risk, allowances are recognised without a change in the expected cash flows, although typically expected cash flows do also change; and expected credit losses are rebased from 12 month to lifetime expectations. On restructuring a financial asset without causing derecognition of the original asset the revised cash flows are used in re-estimating the credit loss. Where restructuring causes derecognition of the original financial asset,

Accounting policies
64 RBS plc Annual Report and Accounts 2018
the fair value of the replacement asset is used as the closing cash flow of the original asset. Where, in the course of the orderly realisation of a loan, it is exchanged for equity shares or property, the exchange is accounted for as the sale of the loan and the acquisition of equity securities or investment property. Where the Bank’s interest in equity shares following the exchange is such that the Bank controls an entity, that entity is consolidated. The costs of loss allowances on assets held at amortised cost are presented as impairments in the income statement. Allowances in respect financial guarantees and loan commitments are presented in administrative expenses. Impaired loans and receivables are written off, when the Group concludes that there is no longer any realistic prospect of recovery of part or all of the loan. For loans that are individually assessed for impairment, the timing of write off is determined on a case-by-case basis. Such loans are reviewed regularly and write off will be prompted by bankruptcy, insolvency, renegotiation and similar events. The typical time frames from initial impairment to write off for the Group’s collectively-assessed portfolios are:
Retail mortgages: write off usually occurs within five years, or when an account is closed if earlier.
Credit cards: the irrecoverable amount is written off after 12 months; three years later any remaining amounts outstanding are written off. Overdrafts and other unsecured loans: write off occurs within six years.
Overdrafts and other unsecured loans: write off occurs within six years
Commercial loans: write offs are determined in the light of individual circumstances; the period does not exceed five years.
Business loans are generally written off within five years.
12. Financial guarantee contracts Under a financial guarantee contract, the Bank, in return for a fee, undertakes to meet a customer’s obligations under the terms of a debt instrument if the customer fails to do so. A financial guarantee is recognised as a liability; initially at fair value and, if not designated as at fair value through profit or loss, subsequently at the higher of its initial value less cumulative amortisation and any provision under the contract measured in accordance with Accounting policy 12. Amortisation is calculated so as to recognise fees receivable in profit or loss over the period of the guarantee. 13. Loan commitments Provision is made for loan commitments, other than those classified as held-for-trading. Syndicated loan commitments in excess of the level of lending under the commitment approved for retention by the Bank are classified as held-for-trading and measured at fair value.
14. Derecognition A financial asset is derecognised when the contractual right to receive cash flows from the asset has expired or when it has been transferred and the transfer qualifies for derecognition. A transfer requires that the Bank either (a) transfers the contractual rights to receive the asset's cash flows; or (b) retains the right to the asset's cash flows but assumes a contractual obligation to pay those cash flows to a third party. After a transfer, the Bank assesses the extent to which it has retained the risks and rewards of ownership of the transferred asset. The asset remains on the balance sheet if substantially all the risks and rewards have been retained. It is derecognised if substantially all the risks and rewards have been transferred. If substantially all the risks and rewards have been neither retained nor transferred, the Bank assesses whether or not it has retained control of the asset. If the Bank has retained control of the asset, it continues to recognise the asset to the extent of its continuing involvement; if the Bank has not retained control of the asset, it is derecognised. A financial liability is removed from the balance sheet when the obligation is discharged, or is cancelled, or expires. On the redemption or settlement of debt securities (including subordinated liabilities) issued by the Bank, the Bank derecognises the debt instrument and records a gain or loss being the difference between the debt's carrying amount and the cost of redemption or settlement. The same treatment applies where the debt is exchanged for a new debt issue that has terms substantially different from those of the existing debt. The assessment of whether the terms of the new debt instrument are substantially different takes into account qualitative and quantitative characteristics including a comparison of the present value of the cash flows under the new terms with the present value of the remaining cash flows of the original debt issue discounted at the effective interest rate of the original debt issue. 15. Netting Financial assets and financial liabilities are offset and the net amount presented in the balance sheet when, and only when, the Bank currently has a legally enforceable right to set off the recognised amounts and it intends either to settle on a net basis or to realise the asset and settle the liability simultaneously. The Bank is party to a number of arrangements, including master netting agreements, that give it the right to offset financial assets and financial liabilities, but where it does not intend to settle the amounts net or simultaneously, the assets and liabilities concerned are presented gross. 16. Capital instruments The Bank classifies a financial instrument that it issues as a liability if it is a contractual obligation to deliver cash or another financial asset, or to exchange financial assets or financial liabilities on potentially unfavourable terms and as equity if it evidences a residual
interest in the assets of the Bank after the deduction of liabilities. The components of a compound financial instrument issued by the Bank are classified and accounted for separately as financial assets, financial liabilities or equity as appropriate. Incremental costs and related tax that are directly attributable to an equity transaction are deducted from equity. The consideration for any ordinary shares of the company purchased by the Bank (treasury shares) is deducted from equity. On the cancellation of treasury shares their nominal value is removed from equity and any excess of consideration over nominal value is treated in accordance with the capital maintenance provisions of the Companies Act. On the sale or reissue of treasury shares the consideration received and related tax are credited to equity, net of any directly attributable incremental costs. 17. Derivatives and hedging In accordance with IAS 39 ‘Hedge relationships’, derivative financial instruments are initially recognised, and subsequently measured, at fair value. A derivative embedded in a contract is accounted for as a stand-alone derivative if its economic characteristics are not closely related to the economic characteristics of the host contract; unless the host is a financial asset or the entire contract is measured at fair value with changes in fair value recognised in profit or loss. Gains and losses arising from changes in the fair value of derivatives that are not the hedging instrument in a qualifying hedge are recognised as they arise in profit or loss. Gains and losses are recorded in Income from ordinary activities except for gains and losses on those derivatives that are managed together with financial instruments designated at fair value; these gains and losses are included in Other operating income. The Bank enters into two types of hedge relationship: hedges of changes in the fair value of a recognised asset or liability or unrecognised firm commitment (fair value hedges); hedges of the variability in cash flows from a recognised asset or liability or a highly probable forecast transaction (cash flow hedges). Hedge relationships are formally designated and documented at inception. The documentation identifies the hedged item and the hedging instrument and details the risk that is being hedged and the way in which effectiveness will be assessed at inception and during the period of the hedge. If the hedge is not highly effective in offsetting changes in fair values or cash flows attributable to the hedged risk, consistent with the documented risk management strategy, hedge accounting is discontinued. Hedge accounting is also discontinued if the Bank revokes the designation of a hedge relationship.
Accounting policies
65 RBS plc Annual Report and Accounts 2018
Fair value hedge - in a fair value hedge, the gain or loss on the hedging instrument is recognised in profit or loss. The gain or loss on the hedged item attributable to the hedged risk is recognised in profit or loss and, where the hedged item is measured at amortised cost, adjusts the carrying amount of the hedged item. Hedge accounting is discontinued if the hedge no longer meets the criteria for hedge accounting; or if the hedging instrument expires or is sold, terminated or exercised; or if hedge designation is revoked. If the hedged item is one for which the effective interest rate method is used, any cumulative adjustment is amortised to profit or loss over the life of the hedged item using a recalculated effective interest rate. Cash flow hedge - in a cash flow hedge, the effective portion of the gain or loss on the hedging instrument is recognised in other comprehensive income and the ineffective portion in profit or loss. When the forecast transaction results in the recognition of a financial asset or financial liability, the cumulative gain or loss is reclassified from equity to profit or loss in the same periods in which the hedged forecast cash flows affect profit or loss. Otherwise the cumulative gain or loss is removed from equity and recognised in profit or loss at the same time as the hedged transaction. Hedge accounting is discontinued if the hedge no longer meets the criteria for hedge accounting; if the hedging instrument expires or is sold, terminated or exercised; if the forecast transaction is no longer expected to occur; or if hedge designation is revoked. On the discontinuance of hedge accounting (except where a forecast transaction is no longer expected to occur), the cumulative unrealised gain or loss is reclassified from equity to profit or loss when the hedged cash flows occur or, if the forecast transaction results in the recognition of a financial asset or financial liability, when the hedged forecast cash flows affect profit or loss. Where a forecast transaction is no longer expected to occur, the cumulative unrealised gain or loss is reclassified from equity to profit or loss immediately. 18. Cash and cash equivalents In the cash flow statement, cash and cash equivalents comprises cash and deposits with banks with an original maturity of less than three months together with short-term highly liquid investments that are readily convertible to known amounts of cash and subject to insignificant risk of change in value. 19. Shares in Group entities The Bank’s investment in its subsidiaries are stated as cost less any impairment. Critical accounting policies and key sources of estimation uncertainty The reported results of the Bank are sensitive to the accounting policies, assumptions and estimates that underlie the preparation of its financial statements. UK company law and IFRS require the directors, in preparing the Bank's financial statements, to select suitable
accounting policies, apply them consistently and make judgements and estimates that are reasonable and prudent. In the absence of an applicable standard or interpretation, IAS 8 ‘Accounting Policies, Changes in Accounting Estimates and Errors’, requires management to develop and apply an accounting policy that results in relevant and reliable information in the light of the requirements and guidance in IFRS dealing with similar and related issues and the IASB's ’Conceptual Framework for Financial Reporting’. The judgements and assumptions involved in the Bank's accounting policies that are considered by the Board to be the most important to the portrayal of its financial condition are discussed below. The use of estimates, assumptions or models that differ from those adopted by the Bank would affect its reported results
Critical accounting policy Note Loan impairment provision 12 Business acquisitions 13 Provisions for liabilities and charges
17
Accounting developments International Financial Reporting Standards A number of IFRSs and amendments to IFRS were in issue at 31 December 2018 that would affect RBS Group from 1 January 2019 or later. Effective 1 January 2019 IFRS 16 ‘Leases’ was issued in January 2016 to replace IAS 17 ‘Leases’. The Bank will apply the standard with effect from 1 January 2019. Lessees will capitalise operating leases through the recognition of assets representing the contractual rights of use. The present value of contractual payments will be recognised as lease liabilities. The Bank has new models and processes to implement IFRS 16. The most significant impact from initially applying IFRS 16 will be to recognise rights of use assets in respect of branches and office properties leased by the Bank under contracts classified as operating leases under IAS 17. The present value of other contracts is immaterial. The Bank will apply IFRS 16 on a modified retrospective basis without restating prior years and electing for the following exemptions on transition at 1 January 2019. The Bank will
apply IFRS 16 to contracts previously identified as leases by IAS 17
use the incremental borrowing rate as the discount rate
not apply IFRS 16 to operating leases with a remaining lease term of less than 12 months or low value leases (non property leases)
rely on the assessment of whether the lease contract is onerous under IAS 37 at 31 December 2018 as an alternative to performing an impairment review of the right of use assets created on 1 January 2019 Where this is the case the carrying amount of the assets will be adjusted by the onerous lease provision.
exclude initial direct costs from the measurement of the right of use asset.
The opening balance sheet of the Bank at 1 January 2019 will be adjusted to create a right of use asset of approximately £132 million. A lease liability will also be recognised of £171 million. Retained earnings will decrease by £23 million after tax. Application of IFRS 16 by the Bank is not expected to have a significant impact on lessor accounting or for finance lease accounting by lessees. Effective after 2019 IFRS 17 ‘Insurance contracts’ was issued in May 2017 to replace IFRS 4 and to establish a comprehensive standard for inceptors of insurance policies. The effective date is 1 January 2021, subject to IASB’s approval of a deferral until 1 January 2022.
In February 2018 the IASB amended IAS 19’ Employee Benefits’ to clarify the need to update assumptions whenever there is a plan amendment, curtailment or settlement. The Bank is assessing the effect of adopting these standards on its financial statements.
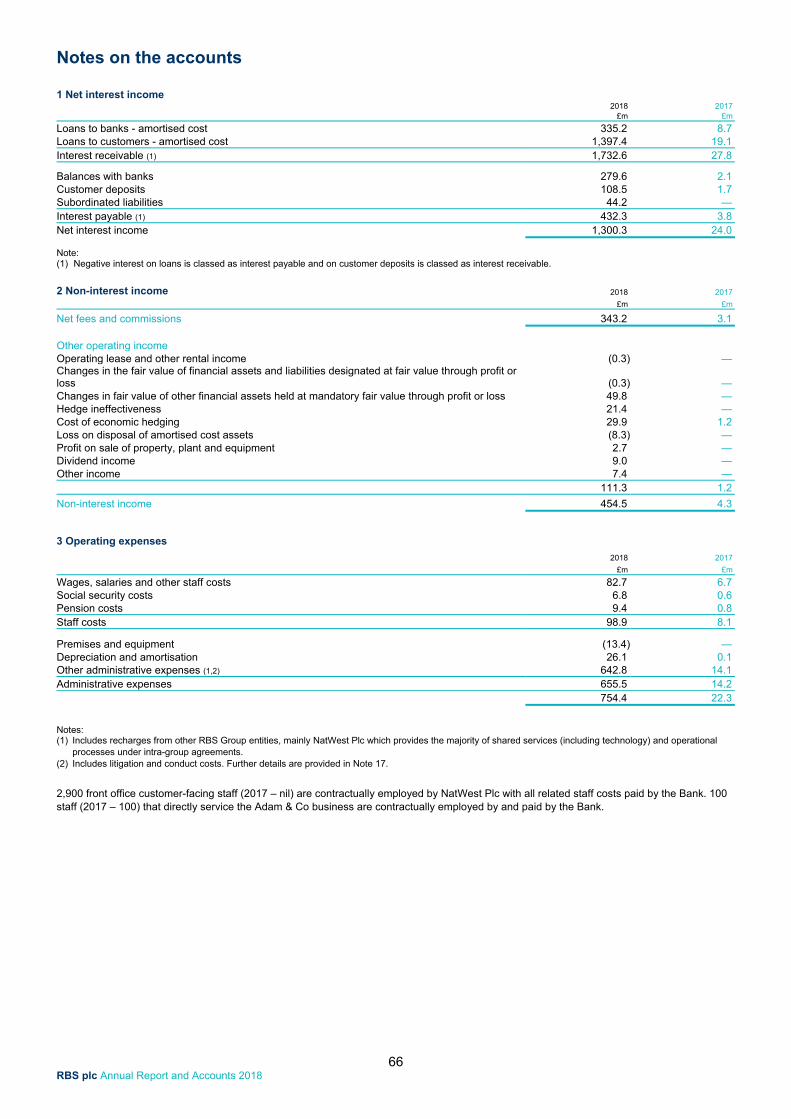
Notes on the accounts
66 RBS plc Annual Report and Accounts 2018
1 Net interest income
2018 2017
£m £m
Loans to banks - amortised cost 335.2 8.7 Loans to customers - amortised cost 1,397.4 19.1 Interest receivable (1) 1,732.6 27.8
Balances with banks 279.6 2.1 Customer deposits 108.5 1.7 Subordinated liabilities 44.2 — Interest payable (1) 432.3 3.8 Net interest income 1,300.3 24.0 Note: (1) Negative interest on loans is classed as interest payable and on customer deposits is classed as interest receivable.
2 Non-interest income 2018 2017
£m £m
Net fees and commissions 343.2 3.1 Other operating income Operating lease and other rental income (0.3) — Changes in the fair value of financial assets and liabilities designated at fair value through profit or loss (0.3) — Changes in fair value of other financial assets held at mandatory fair value through profit or loss 49.8 — Hedge ineffectiveness 21.4 — Cost of economic hedging 29.9 1.2 Loss on disposal of amortised cost assets (8.3) — Profit on sale of property, plant and equipment 2.7 — Dividend income 9.0 — Other income 7.4 — 111.3 1.2
Non-interest income 454.5 4.3
3 Operating expenses 2018 2017
£m £m
Wages, salaries and other staff costs 82.7 6.7 Social security costs 6.8 0.6 Pension costs 9.4 0.8 Staff costs 98.9 8.1
Premises and equipment (13.4) — Depreciation and amortisation 26.1 0.1 Other administrative expenses (1,2) 642.8 14.1 Administrative expenses 655.5 14.2 754.4 22.3
Notes: (1) Includes recharges from other RBS Group entities, mainly NatWest Plc which provides the majority of shared services (including technology) and operational
processes under intra-group agreements. (2) Includes litigation and conduct costs. Further details are provided in Note 17.
2,900 front office customer-facing staff (2017 – nil) are contractually employed by NatWest Plc with all related staff costs paid by the Bank. 100 staff (2017 – 100) that directly service the Adam & Co business are contractually employed by and paid by the Bank.
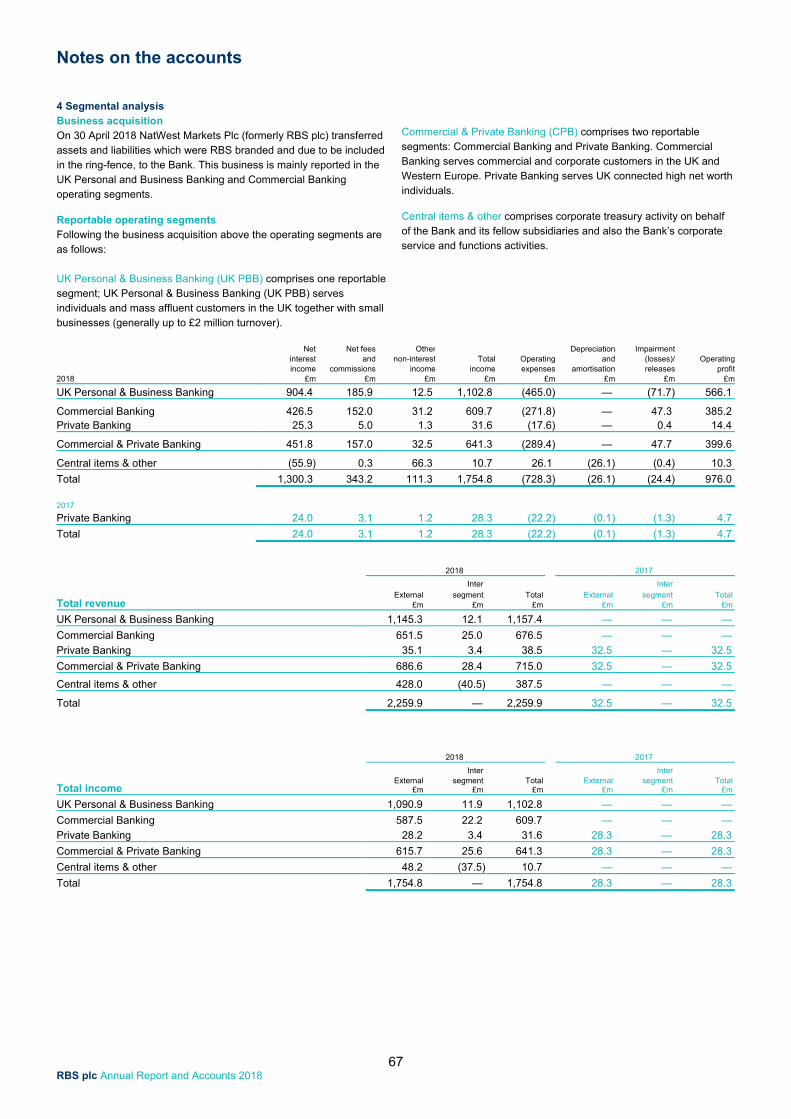
Notes on the accounts
67 RBS plc Annual Report and Accounts 2018
4 Segmental analysis Business acquisition On 30 April 2018 NatWest Markets Plc (formerly RBS plc) transferred assets and liabilities which were RBS branded and due to be included in the ring-fence, to the Bank. This business is mainly reported in the UK Personal and Business Banking and Commercial Banking operating segments.
Reportable operating segments Following the business acquisition above the operating segments are as follows: UK Personal & Business Banking (UK PBB) comprises one reportable segment; UK Personal & Business Banking (UK PBB) serves individuals and mass affluent customers in the UK together with small businesses (generally up to £2 million turnover).
Commercial & Private Banking (CPB) comprises two reportable segments: Commercial Banking and Private Banking. Commercial Banking serves commercial and corporate customers in the UK and Western Europe. Private Banking serves UK connected high net worth individuals.
Central items & other comprises corporate treasury activity on behalf of the Bank and its fellow subsidiaries and also the Bank’s corporate service and functions activities.
2018
Net Net fees Other Depreciation Impairment interest and non-interest Total Operating and (losses)/ Operating income commissions income income expenses amortisation releases profit
£m £m £m £m £m £m £m £m
UK Personal & Business Banking 904.4 185.9 12.5 1,102.8 (465.0) — (71.7) 566.1
Commercial Banking 426.5 152.0 31.2 609.7 (271.8) — 47.3 385.2 Private Banking 25.3 5.0 1.3 31.6 (17.6) — 0.4 14.4
Commercial & Private Banking 451.8 157.0 32.5 641.3 (289.4) — 47.7 399.6
Central items & other (55.9) 0.3 66.3 10.7 26.1 (26.1) (0.4) 10.3
Total 1,300.3 343.2 111.3 1,754.8 (728.3) (26.1) (24.4) 976.0
2017 Private Banking 24.0 3.1 1.2 28.3 (22.2) (0.1) (1.3) 4.7
Total 24.0 3.1 1.2 28.3 (22.2) (0.1) (1.3) 4.7
2018 2017
Total revenue
Inter Inter External segment Total External segment Total
£m £m £m £m £m £m
UK Personal & Business Banking 1,145.3 12.1 1,157.4 — — —
Commercial Banking 651.5 25.0 676.5 — — —
Private Banking 35.1 3.4 38.5 32.5 — 32.5
Commercial & Private Banking 686.6 28.4 715.0 32.5 — 32.5
Central items & other 428.0 (40.5) 387.5 — — —
Total 2,259.9 — 2,259.9 32.5 — 32.5
2018 2017
Total income
Inter Inter External segment Total External segment Total
£m £m £m £m £m £m
UK Personal & Business Banking 1,090.9 11.9 1,102.8 — — —
Commercial Banking 587.5 22.2 609.7 — — —
Private Banking 28.2 3.4 31.6 28.3 — 28.3
Commercial & Private Banking 615.7 25.6 641.3 28.3 — 28.3
Central items & other 48.2 (37.5) 10.7 — — —
Total 1,754.8 — 1,754.8 28.3 — 28.3
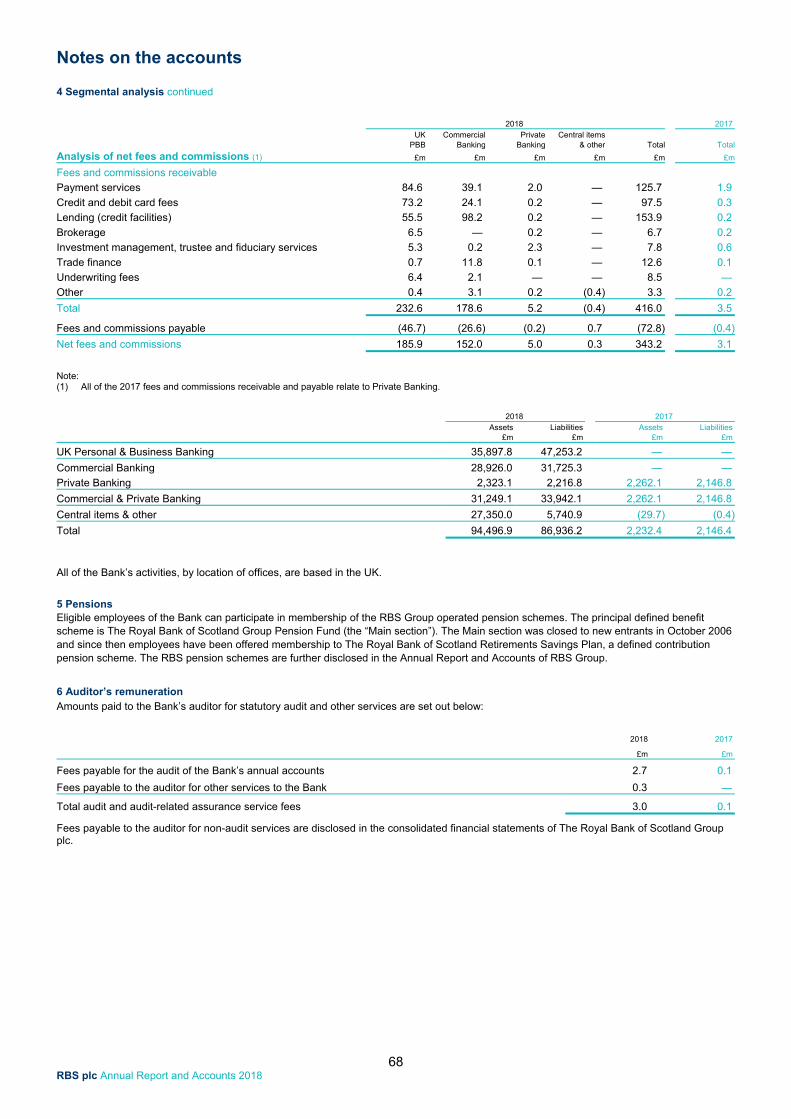
Notes on the accounts
68 RBS plc Annual Report and Accounts 2018
4 Segmental analysis continued
2018 2017 UK Commercial Private Central items PBB Banking Banking & other Total Total
Analysis of net fees and commissions (1) £m £m £m £m £m £m
Fees and commissions receivable Payment services 84.6 39.1 2.0 — 125.7 1.9
Credit and debit card fees 73.2 24.1 0.2 — 97.5 0.3
Lending (credit facilities) 55.5 98.2 0.2 — 153.9 0.2
Brokerage 6.5 — 0.2 — 6.7 0.2
Investment management, trustee and fiduciary services 5.3 0.2 2.3 — 7.8 0.6
Trade finance 0.7 11.8 0.1 — 12.6 0.1
Underwriting fees 6.4 2.1 — — 8.5 —
Other 0.4 3.1 0.2 (0.4) 3.3 0.2
Total 232.6 178.6 5.2 (0.4) 416.0 3.5
Fees and commissions payable (46.7) (26.6) (0.2) 0.7 (72.8) (0.4)
Net fees and commissions 185.9 152.0 5.0 0.3 343.2 3.1
Note: (1) All of the 2017 fees and commissions receivable and payable relate to Private Banking.
2018 2017 Assets Liabilities Assets Liabilities £m £m £m £m
UK Personal & Business Banking 35,897.8 47,253.2 — —
Commercial Banking 28,926.0 31,725.3 — —
Private Banking 2,323.1 2,216.8 2,262.1 2,146.8
Commercial & Private Banking 31,249.1 33,942.1 2,262.1 2,146.8
Central items & other 27,350.0 5,740.9 (29.7) (0.4)
Total 94,496.9 86,936.2 2,232.4 2,146.4
All of the Bank’s activities, by location of offices, are based in the UK.
5 Pensions Eligible employees of the Bank can participate in membership of the RBS Group operated pension schemes. The principal defined benefit scheme is The Royal Bank of Scotland Group Pension Fund (the “Main section”). The Main section was closed to new entrants in October 2006 and since then employees have been offered membership to The Royal Bank of Scotland Retirements Savings Plan, a defined contribution pension scheme. The RBS pension schemes are further disclosed in the Annual Report and Accounts of RBS Group. 6 Auditor’s remuneration Amounts paid to the Bank’s auditor for statutory audit and other services are set out below:
2018 2017
£m £m
Fees payable for the audit of the Bank’s annual accounts 2.7 0.1
Fees payable to the auditor for other services to the Bank 0.3 —
Total audit and audit-related assurance service fees 3.0 0.1
Fees payable to the auditor for non-audit services are disclosed in the consolidated financial statements of The Royal Bank of Scotland Group plc.
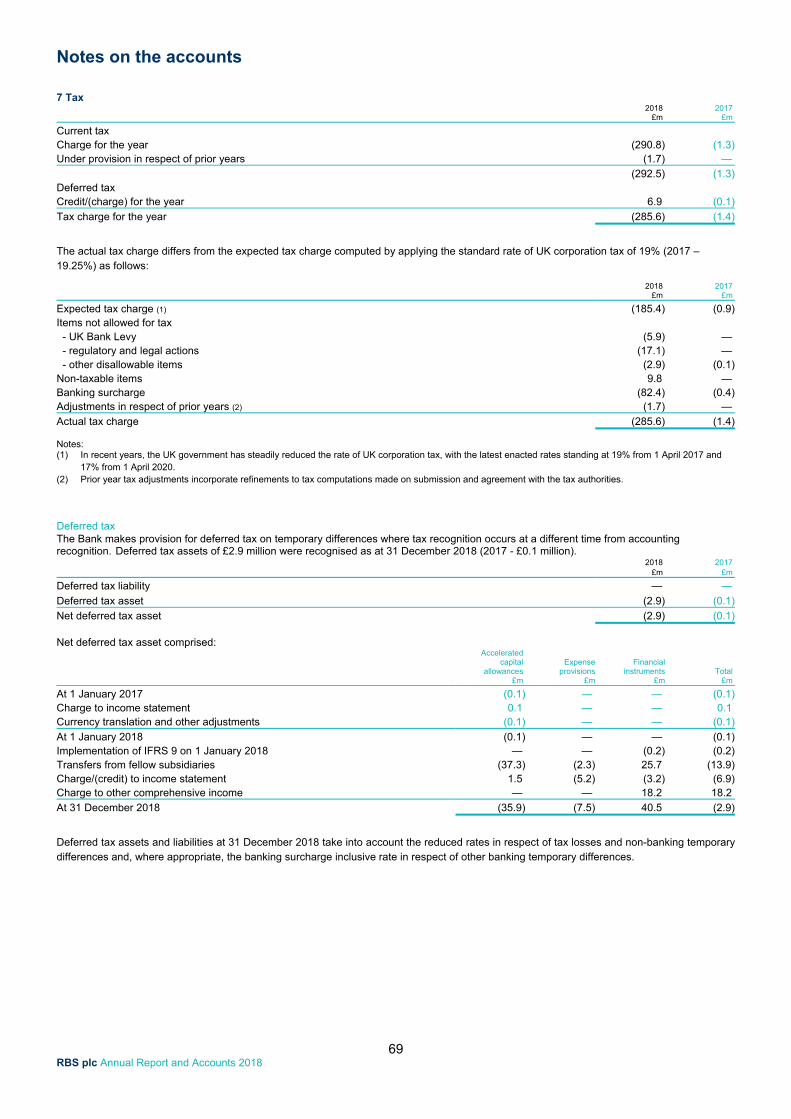
Notes on the accounts
69 RBS plc Annual Report and Accounts 2018
7 Tax 2018 2017 £m £m
Current tax
Charge for the year (290.8) (1.3)Under provision in respect of prior years (1.7) —
(292.5) (1.3)Deferred tax Credit/(charge) for the year 6.9 (0.1)
Tax charge for the year (285.6) (1.4)
The actual tax charge differs from the expected tax charge computed by applying the standard rate of UK corporation tax of 19% (2017 – 19.25%) as follows:
2018 2017 £m £m
Expected tax charge (1) (185.4) (0.9)Items not allowed for tax - UK Bank Levy (5.9) — - regulatory and legal actions (17.1) — - other disallowable items (2.9) (0.1)Non-taxable items 9.8 — Banking surcharge (82.4) (0.4)Adjustments in respect of prior years (2) (1.7) —
Actual tax charge (285.6) (1.4) Notes: (1) In recent years, the UK government has steadily reduced the rate of UK corporation tax, with the latest enacted rates standing at 19% from 1 April 2017 and
17% from 1 April 2020. (2) Prior year tax adjustments incorporate refinements to tax computations made on submission and agreement with the tax authorities.
Deferred tax The Bank makes provision for deferred tax on temporary differences where tax recognition occurs at a different time from accounting recognition. Deferred tax assets of £2.9 million were recognised as at 31 December 2018 (2017 - £0.1 million).
2018 2017 £m £m
Deferred tax liability — —
Deferred tax asset (2.9) (0.1)
Net deferred tax asset (2.9) (0.1) Net deferred tax asset comprised: Accelerated capital Expense Financial allowances provisions instruments Total £m £m £m £m
At 1 January 2017 (0.1) — — (0.1)Charge to income statement 0.1 — — 0.1 Currency translation and other adjustments (0.1) — — (0.1)
At 1 January 2018 (0.1) — — (0.1)Implementation of IFRS 9 on 1 January 2018 — — (0.2) (0.2)Transfers from fellow subsidiaries (37.3) (2.3) 25.7 (13.9)Charge/(credit) to income statement 1.5 (5.2) (3.2) (6.9)Charge to other comprehensive income — — 18.2 18.2
At 31 December 2018 (35.9) (7.5) 40.5 (2.9)
Deferred tax assets and liabilities at 31 December 2018 take into account the reduced rates in respect of tax losses and non-banking temporary differences and, where appropriate, the banking surcharge inclusive rate in respect of other banking temporary differences.
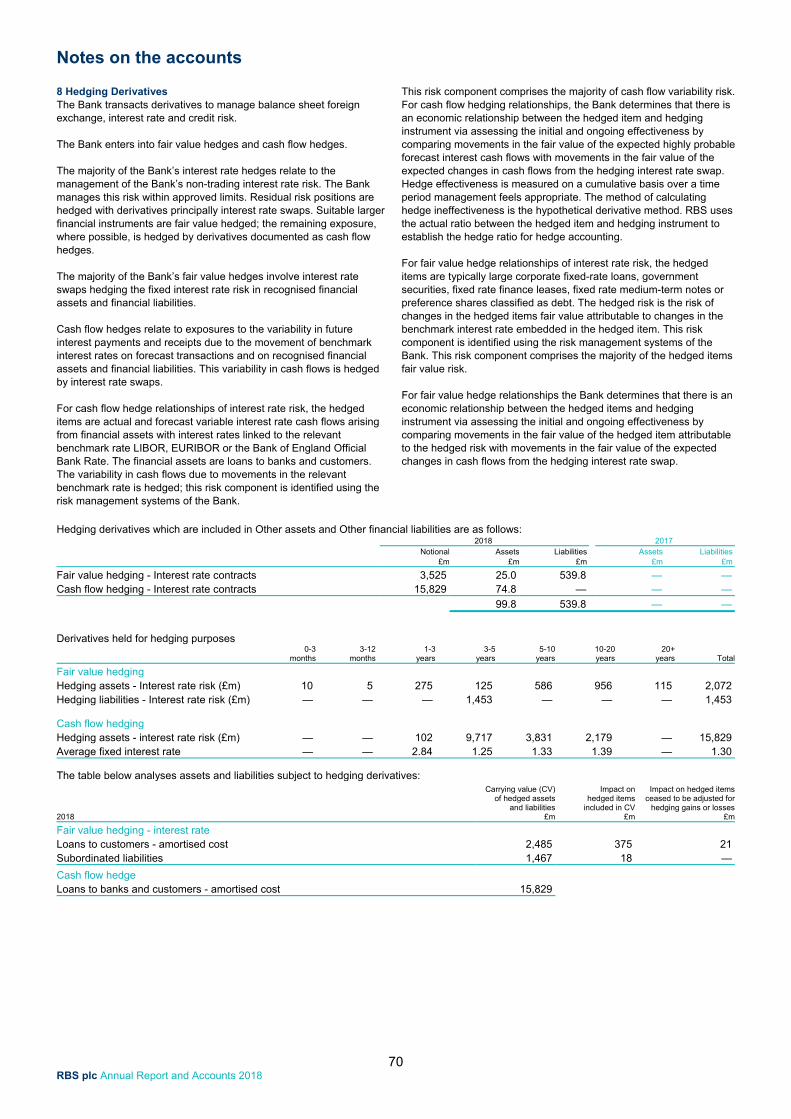
Notes on the accounts
70 RBS plc Annual Report and Accounts 2018
8 Hedging Derivatives The Bank transacts derivatives to manage balance sheet foreign exchange, interest rate and credit risk. The Bank enters into fair value hedges and cash flow hedges. The majority of the Bank’s interest rate hedges relate to the management of the Bank’s non-trading interest rate risk. The Bank manages this risk within approved limits. Residual risk positions are hedged with derivatives principally interest rate swaps. Suitable larger financial instruments are fair value hedged; the remaining exposure, where possible, is hedged by derivatives documented as cash flow hedges. The majority of the Bank’s fair value hedges involve interest rate swaps hedging the fixed interest rate risk in recognised financial assets and financial liabilities. Cash flow hedges relate to exposures to the variability in future interest payments and receipts due to the movement of benchmark interest rates on forecast transactions and on recognised financial assets and financial liabilities. This variability in cash flows is hedged by interest rate swaps. For cash flow hedge relationships of interest rate risk, the hedged items are actual and forecast variable interest rate cash flows arising from financial assets with interest rates linked to the relevant benchmark rate LIBOR, EURIBOR or the Bank of England Official Bank Rate. The financial assets are loans to banks and customers. The variability in cash flows due to movements in the relevant benchmark rate is hedged; this risk component is identified using the risk management systems of the Bank.
This risk component comprises the majority of cash flow variability risk. For cash flow hedging relationships, the Bank determines that there is an economic relationship between the hedged item and hedging instrument via assessing the initial and ongoing effectiveness by comparing movements in the fair value of the expected highly probable forecast interest cash flows with movements in the fair value of the expected changes in cash flows from the hedging interest rate swap. Hedge effectiveness is measured on a cumulative basis over a time period management feels appropriate. The method of calculating hedge ineffectiveness is the hypothetical derivative method. RBS uses the actual ratio between the hedged item and hedging instrument to establish the hedge ratio for hedge accounting. For fair value hedge relationships of interest rate risk, the hedged items are typically large corporate fixed-rate loans, government securities, fixed rate finance leases, fixed rate medium-term notes or preference shares classified as debt. The hedged risk is the risk of changes in the hedged items fair value attributable to changes in the benchmark interest rate embedded in the hedged item. This risk component is identified using the risk management systems of the Bank. This risk component comprises the majority of the hedged items fair value risk. For fair value hedge relationships the Bank determines that there is an economic relationship between the hedged items and hedging instrument via assessing the initial and ongoing effectiveness by comparing movements in the fair value of the hedged item attributable to the hedged risk with movements in the fair value of the expected changes in cash flows from the hedging interest rate swap.
Hedging derivatives which are included in Other assets and Other financial liabilities are as follows:
2018 2017 Notional Assets Liabilities Assets Liabilities
£m £m £m £m £m
Fair value hedging - Interest rate contracts 3,525 25.0 539.8 — — Cash flow hedging - Interest rate contracts 15,829 74.8 — — —
99.8 539.8 — —
Derivatives held for hedging purposes
0-3 months
3-12 months
1-3 years
3-5 years
5-10 years
10-20 years
20+ years Total
Fair value hedging Hedging assets - Interest rate risk (£m) 10 5 275 125 586 956 115 2,072 Hedging liabilities - Interest rate risk (£m) — — — 1,453 — — — 1,453 Cash flow hedging Hedging assets - interest rate risk (£m) — — 102 9,717 3,831 2,179 — 15,829 Average fixed interest rate — — 2.84 1.25 1.33 1.39 — 1.30
The table below analyses assets and liabilities subject to hedging derivatives: Carrying value (CV) Impact on Impact on hedged items of hedged assets hedged items ceased to be adjusted for and liabilities included in CV hedging gains or losses2018 £m £m £m
Fair value hedging - interest rate Loans to customers - amortised cost 2,485 375 21 Subordinated liabilities 1,467 18 —
Cash flow hedge Loans to banks and customers - amortised cost 15,829
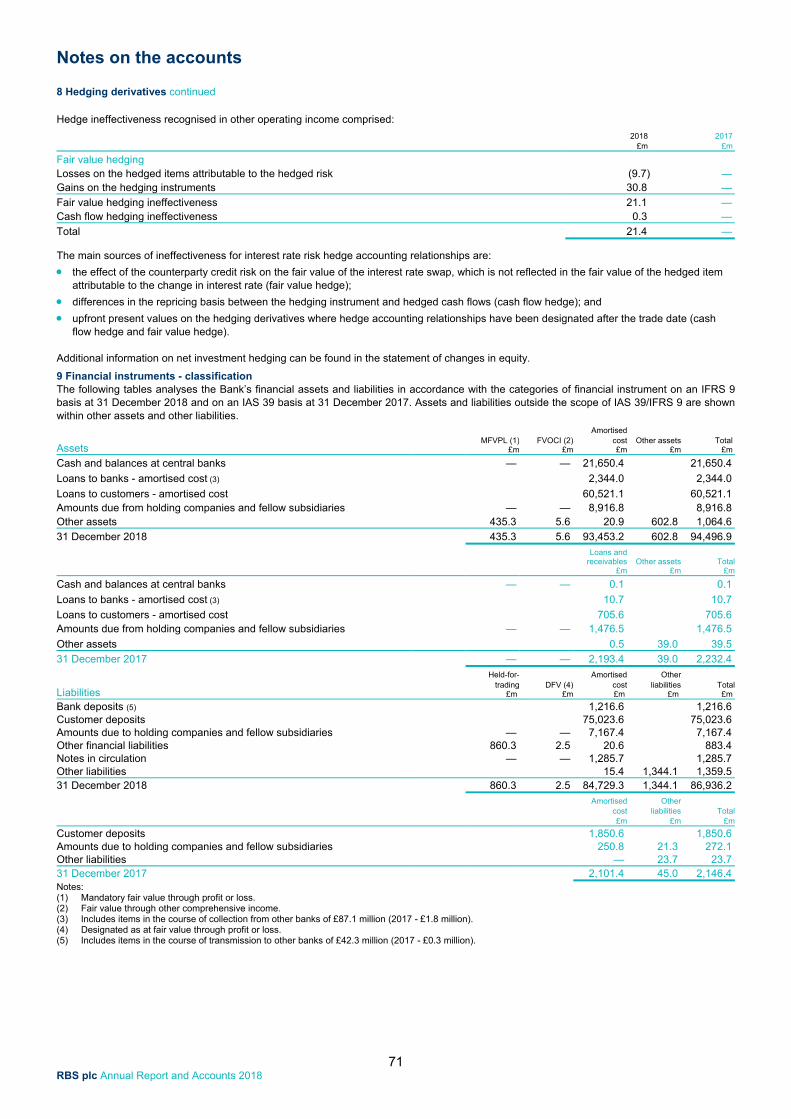
Notes on the accounts
71 RBS plc Annual Report and Accounts 2018
8 Hedging derivatives continued
Hedge ineffectiveness recognised in other operating income comprised: 2018 2017 £m £m
Fair value hedging
Losses on the hedged items attributable to the hedged risk (9.7) — Gains on the hedging instruments 30.8 —
Fair value hedging ineffectiveness 21.1 — Cash flow hedging ineffectiveness 0.3 —
Total 21.4 —
The main sources of ineffectiveness for interest rate risk hedge accounting relationships are:
the effect of the counterparty credit risk on the fair value of the interest rate swap, which is not reflected in the fair value of the hedged item attributable to the change in interest rate (fair value hedge);
differences in the repricing basis between the hedging instrument and hedged cash flows (cash flow hedge); and
upfront present values on the hedging derivatives where hedge accounting relationships have been designated after the trade date (cash flow hedge and fair value hedge).
Additional information on net investment hedging can be found in the statement of changes in equity. 9 Financial instruments - classification The following tables analyses the Bank’s financial assets and liabilities in accordance with the categories of financial instrument on an IFRS 9 basis at 31 December 2018 and on an IAS 39 basis at 31 December 2017. Assets and liabilities outside the scope of IAS 39/IFRS 9 are shown within other assets and other liabilities.
Assets Amortised MFVPL (1) FVOCI (2) cost Other assets Total £m £m £m £m £m
Cash and balances at central banks — — 21,650.4 21,650.4
Loans to banks - amortised cost (3) 2,344.0 2,344.0
Loans to customers - amortised cost 60,521.1 60,521.1 Amounts due from holding companies and fellow subsidiaries — — 8,916.8 8,916.8 Other assets 435.3 5.6 20.9 602.8 1,064.6
31 December 2018 435.3 5.6 93,453.2 602.8 94,496.9 Loans and receivables Other assets Total £m £m £m
Cash and balances at central banks — — 0.1 0.1
Loans to banks - amortised cost (3) 10.7 10.7
Loans to customers - amortised cost 705.6 705.6 Amounts due from holding companies and fellow subsidiaries — — 1,476.5 1,476.5
Other assets 0.5 39.0 39.5
31 December 2017 — — 2,193.4 39.0 2,232.4
Liabilities Held-for- Amortised Other trading DFV (4) cost liabilities Total £m £m £m £m £m
Bank deposits (5) 1,216.6 1,216.6 Customer deposits 75,023.6 75,023.6 Amounts due to holding companies and fellow subsidiaries — — 7,167.4 7,167.4 Other financial liabilities 860.3 2.5 20.6 883.4 Notes in circulation — — 1,285.7 1,285.7 Other liabilities 15.4 1,344.1 1,359.5 31 December 2018 860.3 2.5 84,729.3 1,344.1 86,936.2 Amortised Other cost liabilities Total £m £m £m
Customer deposits 1,850.6 1,850.6 Amounts due to holding companies and fellow subsidiaries 250.8 21.3 272.1 Other liabilities — 23.7 23.7 31 December 2017 2,101.4 45.0 2,146.4 Notes: (1) Mandatory fair value through profit or loss. (2) Fair value through other comprehensive income. (3) Includes items in the course of collection from other banks of £87.1 million (2017 - £1.8 million). (4) Designated as at fair value through profit or loss. (5) Includes items in the course of transmission to other banks of £42.3 million (2017 - £0.3 million).
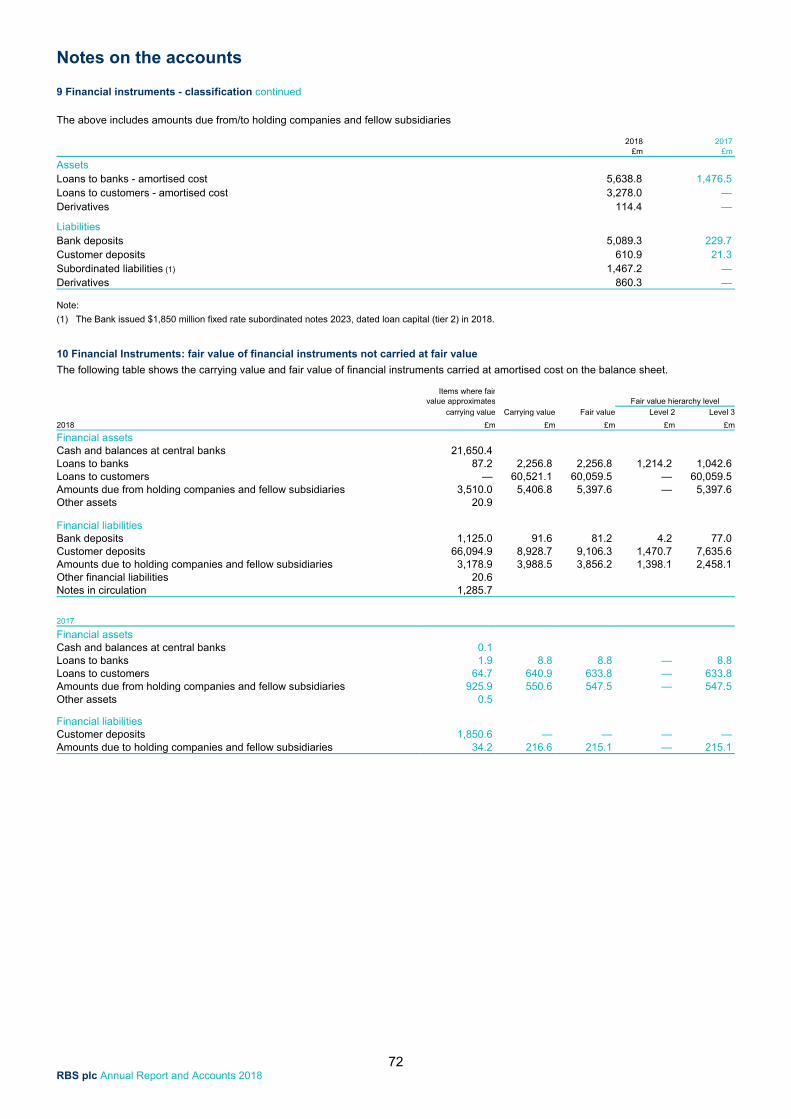
Notes on the accounts
72 RBS plc Annual Report and Accounts 2018
9 Financial instruments - classification continued
The above includes amounts due from/to holding companies and fellow subsidiaries
2018 2017 £m £m
Assets
Loans to banks - amortised cost 5,638.8 1,476.5 Loans to customers - amortised cost 3,278.0 — Derivatives 114.4 —
Liabilities Bank deposits 5,089.3 229.7 Customer deposits 610.9 21.3 Subordinated liabilities (1) 1,467.2 — Derivatives 860.3 —
Note: (1) The Bank issued $1,850 million fixed rate subordinated notes 2023, dated loan capital (tier 2) in 2018.
10 Financial Instruments: fair value of financial instruments not carried at fair value The following table shows the carrying value and fair value of financial instruments carried at amortised cost on the balance sheet. Items where fair value approximates Fair value hierarchy level carrying value Carrying value Fair value Level 2 Level 3
2018 £m £m £m £m £m
Financial assets Cash and balances at central banks 21,650.4 Loans to banks 87.2 2,256.8 2,256.8 1,214.2 1,042.6 Loans to customers — 60,521.1 60,059.5 — 60,059.5 Amounts due from holding companies and fellow subsidiaries 3,510.0 5,406.8 5,397.6 — 5,397.6 Other assets 20.9 Financial liabilities Bank deposits 1,125.0 91.6 81.2 4.2 77.0 Customer deposits 66,094.9 8,928.7 9,106.3 1,470.7 7,635.6 Amounts due to holding companies and fellow subsidiaries 3,178.9 3,988.5 3,856.2 1,398.1 2,458.1 Other financial liabilities 20.6 Notes in circulation 1,285.7
2017 Financial assets Cash and balances at central banks 0.1 Loans to banks 1.9 8.8 8.8 — 8.8 Loans to customers 64.7 640.9 633.8 — 633.8 Amounts due from holding companies and fellow subsidiaries 925.9 550.6 547.5 — 547.5 Other assets 0.5
Financial liabilities Customer deposits 1,850.6 — — — — Amounts due to holding companies and fellow subsidiaries 34.2 216.6 215.1 — 215.1
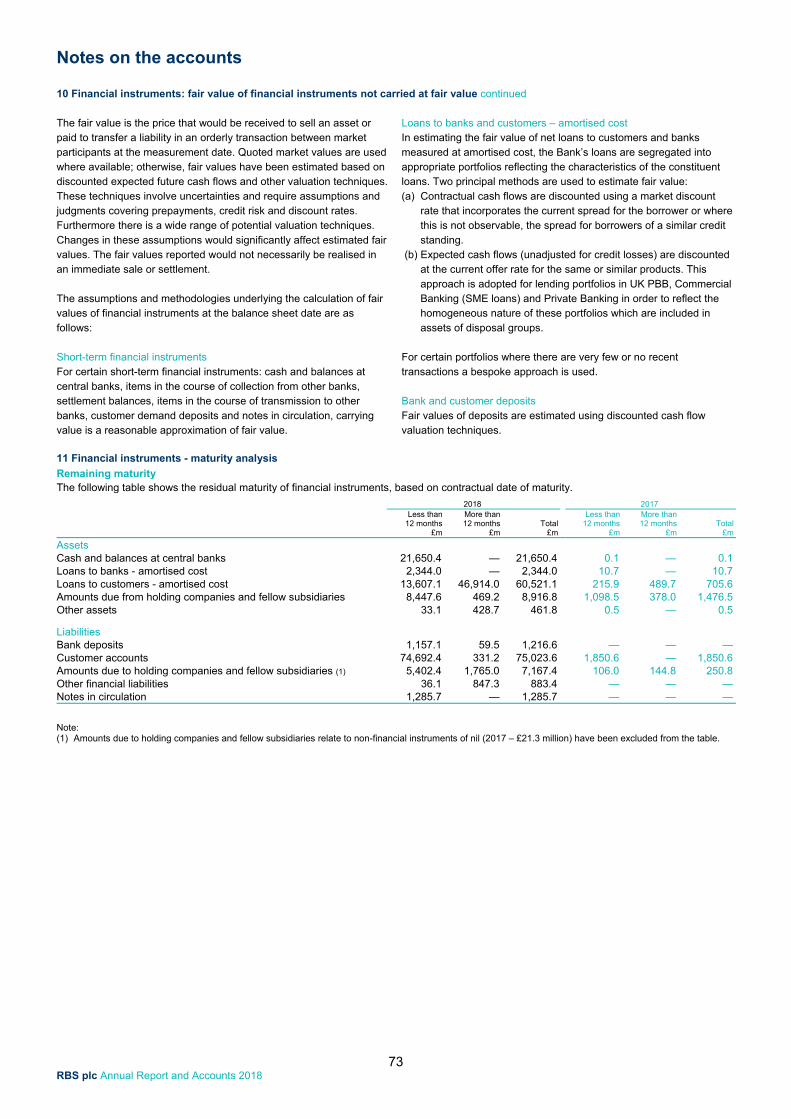
Notes on the accounts
73 RBS plc Annual Report and Accounts 2018
10 Financial instruments: fair value of financial instruments not carried at fair value continued The fair value is the price that would be received to sell an asset or paid to transfer a liability in an orderly transaction between market participants at the measurement date. Quoted market values are used where available; otherwise, fair values have been estimated based on discounted expected future cash flows and other valuation techniques. These techniques involve uncertainties and require assumptions and judgments covering prepayments, credit risk and discount rates. Furthermore there is a wide range of potential valuation techniques. Changes in these assumptions would significantly affect estimated fair values. The fair values reported would not necessarily be realised in an immediate sale or settlement. The assumptions and methodologies underlying the calculation of fair values of financial instruments at the balance sheet date are as follows: Short-term financial instruments For certain short-term financial instruments: cash and balances at central banks, items in the course of collection from other banks, settlement balances, items in the course of transmission to other banks, customer demand deposits and notes in circulation, carrying value is a reasonable approximation of fair value.
Loans to banks and customers – amortised cost In estimating the fair value of net loans to customers and banks measured at amortised cost, the Bank’s loans are segregated into appropriate portfolios reflecting the characteristics of the constituent loans. Two principal methods are used to estimate fair value: (a) Contractual cash flows are discounted using a market discount
rate that incorporates the current spread for the borrower or where this is not observable, the spread for borrowers of a similar credit standing.
(b) Expected cash flows (unadjusted for credit losses) are discounted at the current offer rate for the same or similar products. This approach is adopted for lending portfolios in UK PBB, Commercial Banking (SME loans) and Private Banking in order to reflect the homogeneous nature of these portfolios which are included in assets of disposal groups.
For certain portfolios where there are very few or no recent transactions a bespoke approach is used. Bank and customer deposits Fair values of deposits are estimated using discounted cash flow valuation techniques.
11 Financial instruments - maturity analysis Remaining maturity The following table shows the residual maturity of financial instruments, based on contractual date of maturity. 2018 2017
Less than More than
Total Less than More than
Total 12 months 12 months 12 months 12 months £m £m £m £m £m £m
Assets
Cash and balances at central banks 21,650.4 — 21,650.4 0.1 — 0.1 Loans to banks - amortised cost 2,344.0 — 2,344.0 10.7 — 10.7 Loans to customers - amortised cost 13,607.1 46,914.0 60,521.1 215.9 489.7 705.6 Amounts due from holding companies and fellow subsidiaries 8,447.6 469.2 8,916.8 1,098.5 378.0 1,476.5 Other assets 33.1 428.7 461.8 0.5 — 0.5
Liabilities Bank deposits 1,157.1 59.5 1,216.6 — — — Customer accounts 74,692.4 331.2 75,023.6 1,850.6 — 1,850.6 Amounts due to holding companies and fellow subsidiaries (1) 5,402.4 1,765.0 7,167.4 106.0 144.8 250.8 Other financial liabilities 36.1 847.3 883.4 — — — Notes in circulation 1,285.7 — 1,285.7 — — —
Note: (1) Amounts due to holding companies and fellow subsidiaries relate to non-financial instruments of nil (2017 – £21.3 million) have been excluded from the table.
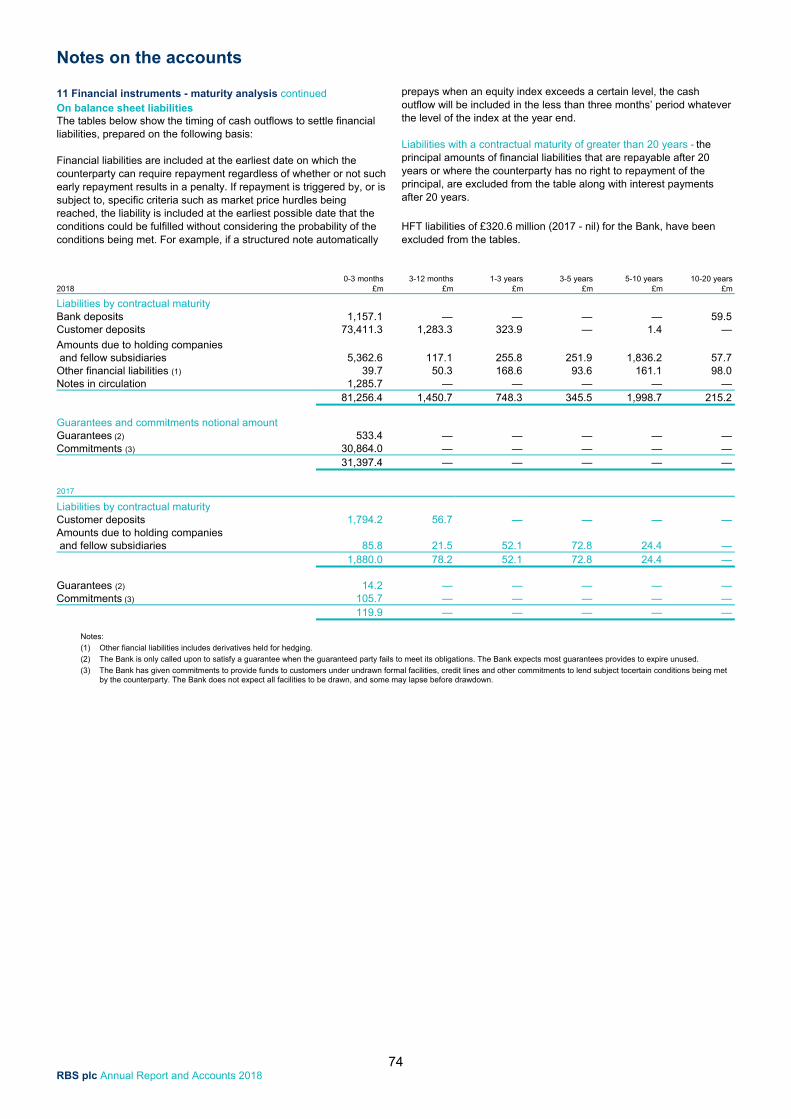
Notes on the accounts
74 RBS plc Annual Report and Accounts 2018
11 Financial instruments - maturity analysis continued On balance sheet liabilities The tables below show the timing of cash outflows to settle financial liabilities, prepared on the following basis: Financial liabilities are included at the earliest date on which the counterparty can require repayment regardless of whether or not such early repayment results in a penalty. If repayment is triggered by, or is subject to, specific criteria such as market price hurdles being reached, the liability is included at the earliest possible date that the conditions could be fulfilled without considering the probability of the conditions being met. For example, if a structured note automatically
prepays when an equity index exceeds a certain level, the cash outflow will be included in the less than three months’ period whatever the level of the index at the year end. Liabilities with a contractual maturity of greater than 20 years - the principal amounts of financial liabilities that are repayable after 20 years or where the counterparty has no right to repayment of the principal, are excluded from the table along with interest payments after 20 years.
HFT liabilities of £320.6 million (2017 - nil) for the Bank, have been excluded from the tables.
0-3 months 3-12 months 1-3 years 3-5 years 5-10 years 10-20 years 2018 £m £m £m £m £m £m
Liabilities by contractual maturity Bank deposits 1,157.1 — — — — 59.5 Customer deposits 73,411.3 1,283.3 323.9 — 1.4 —
Amounts due to holding companies and fellow subsidiaries 5,362.6 117.1 255.8 251.9 1,836.2 57.7 Other financial liabilities (1) 39.7 50.3 168.6 93.6 161.1 98.0 Notes in circulation 1,285.7 — — — — —
81,256.4 1,450.7 748.3 345.5 1,998.7 215.2 Guarantees and commitments notional amount Guarantees (2) 533.4 — — — — — Commitments (3) 30,864.0 — — — — — 31,397.4 — — — — — 2017 Liabilities by contractual maturity Customer deposits 1,794.2 56.7 — — — — Amounts due to holding companies and fellow subsidiaries 85.8 21.5 52.1 72.8 24.4 —
1,880.0 78.2 52.1 72.8 24.4 —
Guarantees (2) 14.2 — — — — — Commitments (3) 105.7 — — — — — 119.9 — — — — —
Notes:
(1) Other fiancial liabilities includes derivatives held for hedging.
(2) The Bank is only called upon to satisfy a guarantee when the guaranteed party fails to meet its obligations. The Bank expects most guarantees provides to expire unused.
(3) The Bank has given commitments to provide funds to customers under undrawn formal facilities, credit lines and other commitments to lend subject tocertain conditions being met by the counterparty. The Bank does not expect all facilities to be drawn, and some may lapse before drawdown.
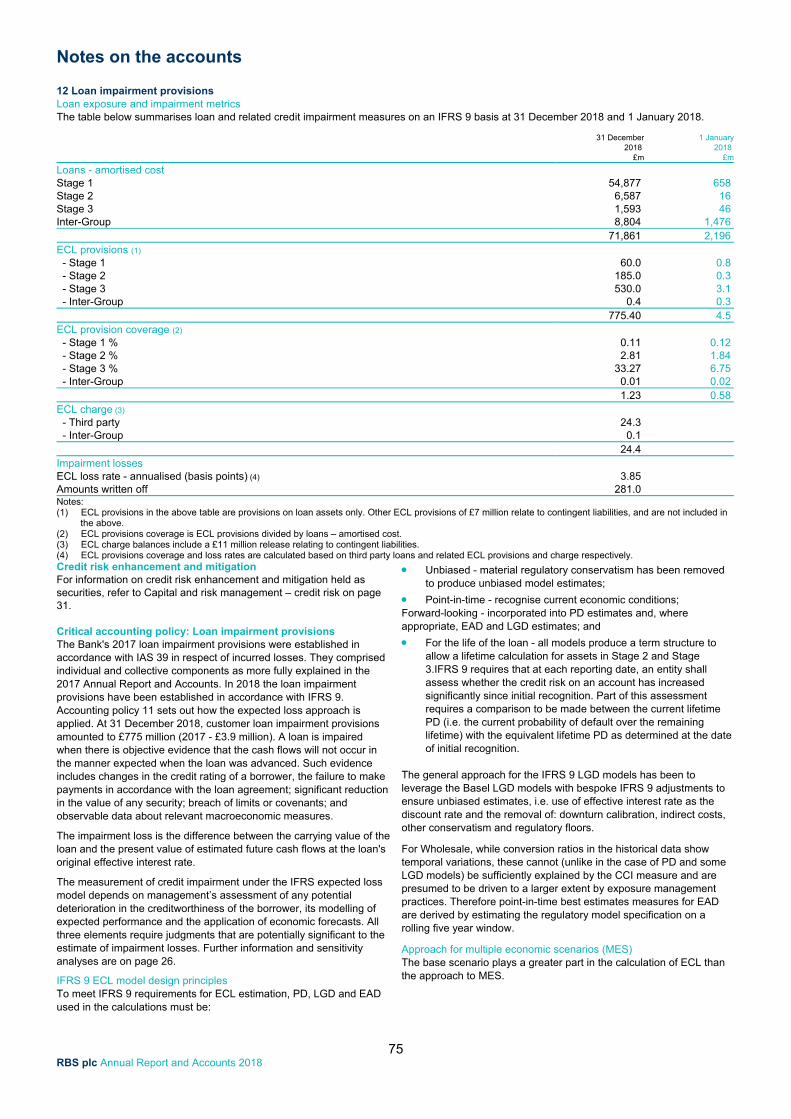
Notes on the accounts
75 RBS plc Annual Report and Accounts 2018
12 Loan impairment provisions Loan exposure and impairment metrics The table below summarises loan and related credit impairment measures on an IFRS 9 basis at 31 December 2018 and 1 January 2018.
31 December 1 January 2018 2018 £m £m
Loans - amortised cost Stage 1 54,877 658 Stage 2 6,587 16 Stage 3 1,593 46 Inter-Group 8,804 1,476 71,861 2,196 ECL provisions (1) - Stage 1 60.0 0.8 - Stage 2 185.0 0.3 - Stage 3 530.0 3.1 - Inter-Group 0.4 0.3 775.40 4.5 ECL provision coverage (2) - Stage 1 % 0.11 0.12 - Stage 2 % 2.81 1.84 - Stage 3 % 33.27 6.75 - Inter-Group 0.01 0.02 1.23 0.58 ECL charge (3) - Third party 24.3 - Inter-Group 0.1 24.4 Impairment losses ECL loss rate - annualised (basis points) (4) 3.85 Amounts written off 281.0 Notes: (1) ECL provisions in the above table are provisions on loan assets only. Other ECL provisions of £7 million relate to contingent liabilities, and are not included in
the above. (2) ECL provisions coverage is ECL provisions divided by loans – amortised cost. (3) ECL charge balances include a £11 million release relating to contingent liabilities. (4) ECL provisions coverage and loss rates are calculated based on third party loans and related ECL provisions and charge respectively. Credit risk enhancement and mitigation For information on credit risk enhancement and mitigation held as securities, refer to Capital and risk management – credit risk on page 31. Critical accounting policy: Loan impairment provisions The Bank's 2017 loan impairment provisions were established in accordance with IAS 39 in respect of incurred losses. They comprised individual and collective components as more fully explained in the 2017 Annual Report and Accounts. In 2018 the loan impairment provisions have been established in accordance with IFRS 9. Accounting policy 11 sets out how the expected loss approach is applied. At 31 December 2018, customer loan impairment provisions amounted to £775 million (2017 - £3.9 million). A loan is impaired when there is objective evidence that the cash flows will not occur in the manner expected when the loan was advanced. Such evidence includes changes in the credit rating of a borrower, the failure to make payments in accordance with the loan agreement; significant reduction in the value of any security; breach of limits or covenants; and observable data about relevant macroeconomic measures.
The impairment loss is the difference between the carrying value of the loan and the present value of estimated future cash flows at the loan's original effective interest rate.
The measurement of credit impairment under the IFRS expected loss model depends on management’s assessment of any potential deterioration in the creditworthiness of the borrower, its modelling of expected performance and the application of economic forecasts. All three elements require judgments that are potentially significant to the estimate of impairment losses. Further information and sensitivity analyses are on page 26.
IFRS 9 ECL model design principles To meet IFRS 9 requirements for ECL estimation, PD, LGD and EAD used in the calculations must be:
Unbiased - material regulatory conservatism has been removed to produce unbiased model estimates;
Point-in-time - recognise current economic conditions; Forward-looking - incorporated into PD estimates and, where appropriate, EAD and LGD estimates; and
For the life of the loan - all models produce a term structure to allow a lifetime calculation for assets in Stage 2 and Stage 3.IFRS 9 requires that at each reporting date, an entity shall assess whether the credit risk on an account has increased significantly since initial recognition. Part of this assessment requires a comparison to be made between the current lifetime PD (i.e. the current probability of default over the remaining lifetime) with the equivalent lifetime PD as determined at the date of initial recognition.
The general approach for the IFRS 9 LGD models has been to leverage the Basel LGD models with bespoke IFRS 9 adjustments to ensure unbiased estimates, i.e. use of effective interest rate as the discount rate and the removal of: downturn calibration, indirect costs, other conservatism and regulatory floors.
For Wholesale, while conversion ratios in the historical data show temporal variations, these cannot (unlike in the case of PD and some LGD models) be sufficiently explained by the CCI measure and are presumed to be driven to a larger extent by exposure management practices. Therefore point-in-time best estimates measures for EAD are derived by estimating the regulatory model specification on a rolling five year window.
Approach for multiple economic scenarios (MES) The base scenario plays a greater part in the calculation of ECL than the approach to MES.
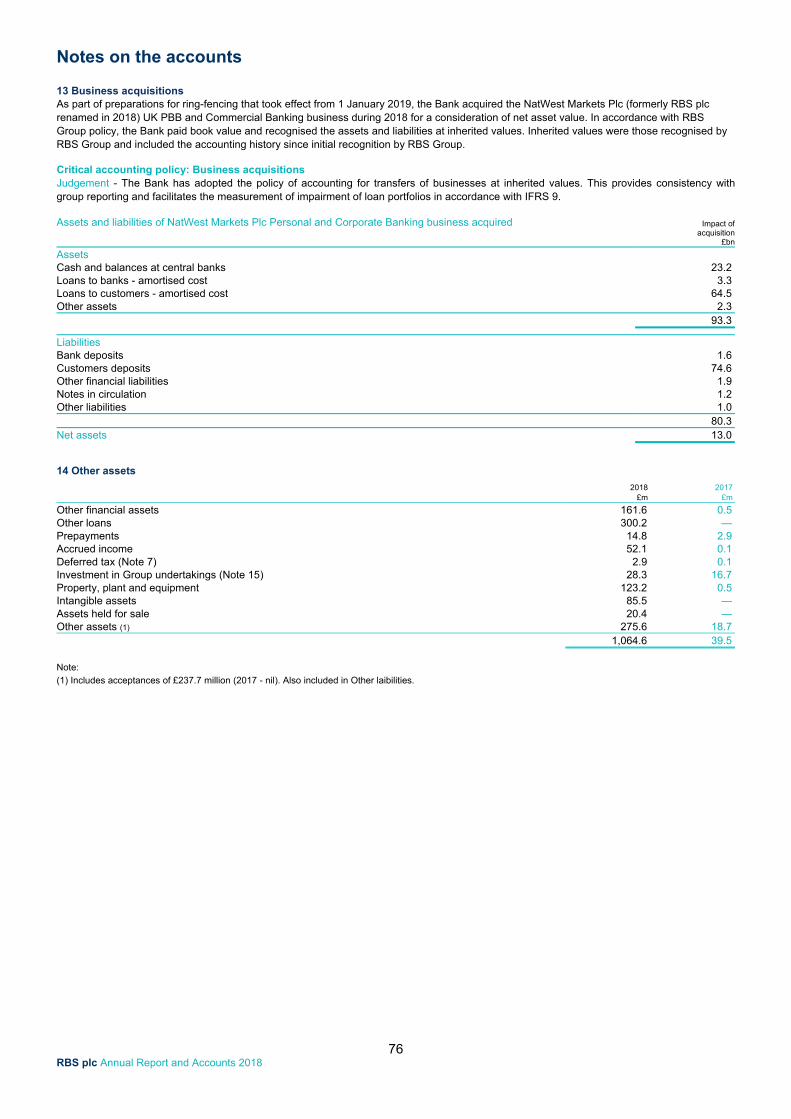
Notes on the accounts
76 RBS plc Annual Report and Accounts 2018
13 Business acquisitions As part of preparations for ring-fencing that took effect from 1 January 2019, the Bank acquired the NatWest Markets Plc (formerly RBS plc renamed in 2018) UK PBB and Commercial Banking business during 2018 for a consideration of net asset value. In accordance with RBS Group policy, the Bank paid book value and recognised the assets and liabilities at inherited values. Inherited values were those recognised by RBS Group and included the accounting history since initial recognition by RBS Group. Critical accounting policy: Business acquisitions Judgement - The Bank has adopted the policy of accounting for transfers of businesses at inherited values. This provides consistency with group reporting and facilitates the measurement of impairment of loan portfolios in accordance with IFRS 9. Assets and liabilities of NatWest Markets Plc Personal and Corporate Banking business acquired Impact of acquisition £bn
Assets Cash and balances at central banks 23.2 Loans to banks - amortised cost 3.3 Loans to customers - amortised cost 64.5 Other assets 2.3 93.3
Liabilities Bank deposits 1.6 Customers deposits 74.6 Other financial liabilities 1.9 Notes in circulation 1.2 Other liabilities 1.0 80.3 Net assets 13.0
14 Other assets 2018 2017 £m £m
Other financial assets 161.6 0.5 Other loans 300.2 — Prepayments 14.8 2.9 Accrued income 52.1 0.1 Deferred tax (Note 7) 2.9 0.1 Investment in Group undertakings (Note 15) 28.3 16.7 Property, plant and equipment 123.2 0.5 Intangible assets 85.5 — Assets held for sale 20.4 — Other assets (1) 275.6 18.7 1,064.6 39.5 Note: (1) Includes acceptances of £237.7 million (2017 - nil). Also included in Other laibilities.
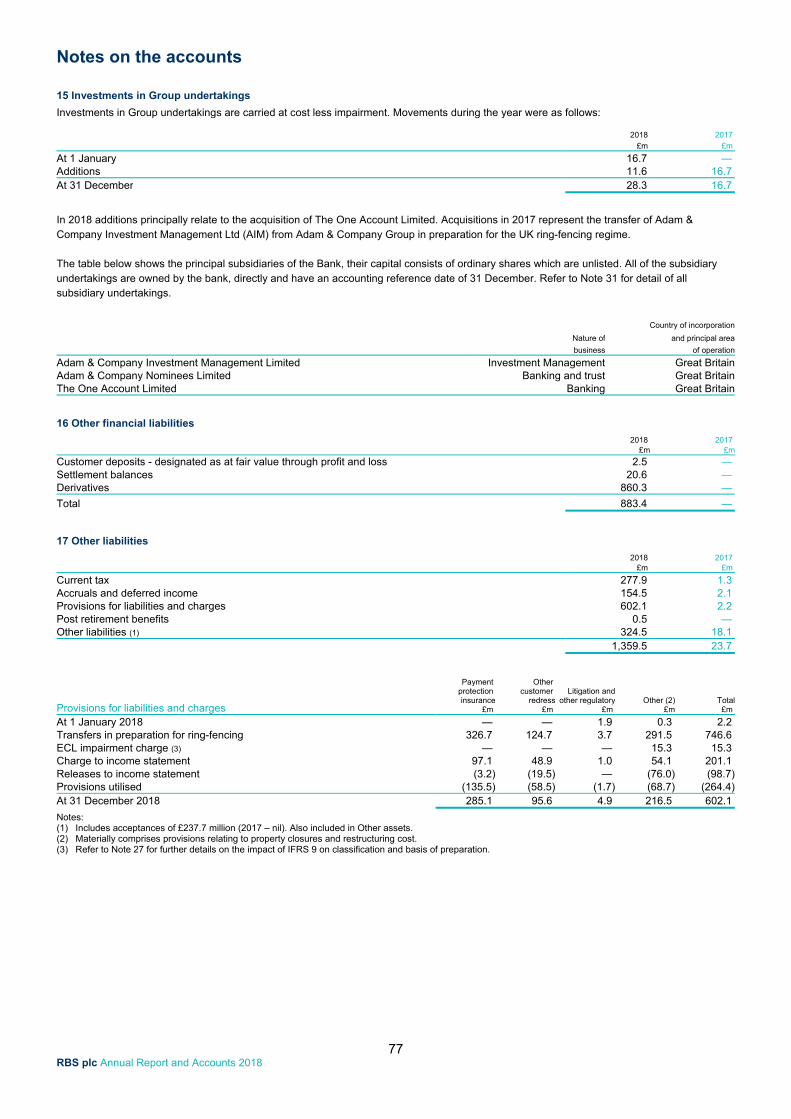
Notes on the accounts
77 RBS plc Annual Report and Accounts 2018
15 Investments in Group undertakings Investments in Group undertakings are carried at cost less impairment. Movements during the year were as follows:
2018 2017 £m £m
At 1 January 16.7 — Additions 11.6 16.7 At 31 December 28.3 16.7
In 2018 additions principally relate to the acquisition of The One Account Limited. Acquisitions in 2017 represent the transfer of Adam & Company Investment Management Ltd (AIM) from Adam & Company Group in preparation for the UK ring-fencing regime. The table below shows the principal subsidiaries of the Bank, their capital consists of ordinary shares which are unlisted. All of the subsidiary undertakings are owned by the bank, directly and have an accounting reference date of 31 December. Refer to Note 31 for detail of all subsidiary undertakings.
Country of incorporation
Nature of and principal area
business of operation
Adam & Company Investment Management Limited Investment Management Great BritainAdam & Company Nominees Limited Banking and trust Great BritainThe One Account Limited Banking Great Britain
16 Other financial liabilities 2018 2017 £m £m
Customer deposits - designated as at fair value through profit and loss 2.5 — Settlement balances 20.6 — Derivatives 860.3 —
Total 883.4 —
17 Other liabilities 2018 2017 £m £m
Current tax 277.9 1.3 Accruals and deferred income 154.5 2.1 Provisions for liabilities and charges 602.1 2.2 Post retirement benefits 0.5 — Other liabilities (1) 324.5 18.1 1,359.5 23.7
Provisions for liabilities and charges
Payment Other
Totalprotection customer Litigation andinsurance redress other regulatory Other (2)
£m £m £m £m £m
At 1 January 2018 — — 1.9 0.3 2.2 Transfers in preparation for ring-fencing 326.7 124.7 3.7 291.5 746.6 ECL impairment charge (3) — — — 15.3 15.3 Charge to income statement 97.1 48.9 1.0 54.1 201.1 Releases to income statement (3.2) (19.5) — (76.0) (98.7)Provisions utilised (135.5) (58.5) (1.7) (68.7) (264.4)At 31 December 2018 285.1 95.6 4.9 216.5 602.1
Notes: (1) Includes acceptances of £237.7 million (2017 – nil). Also included in Other assets. (2) Materially comprises provisions relating to property closures and restructuring cost. (3) Refer to Note 27 for further details on the impact of IFRS 9 on classification and basis of preparation.
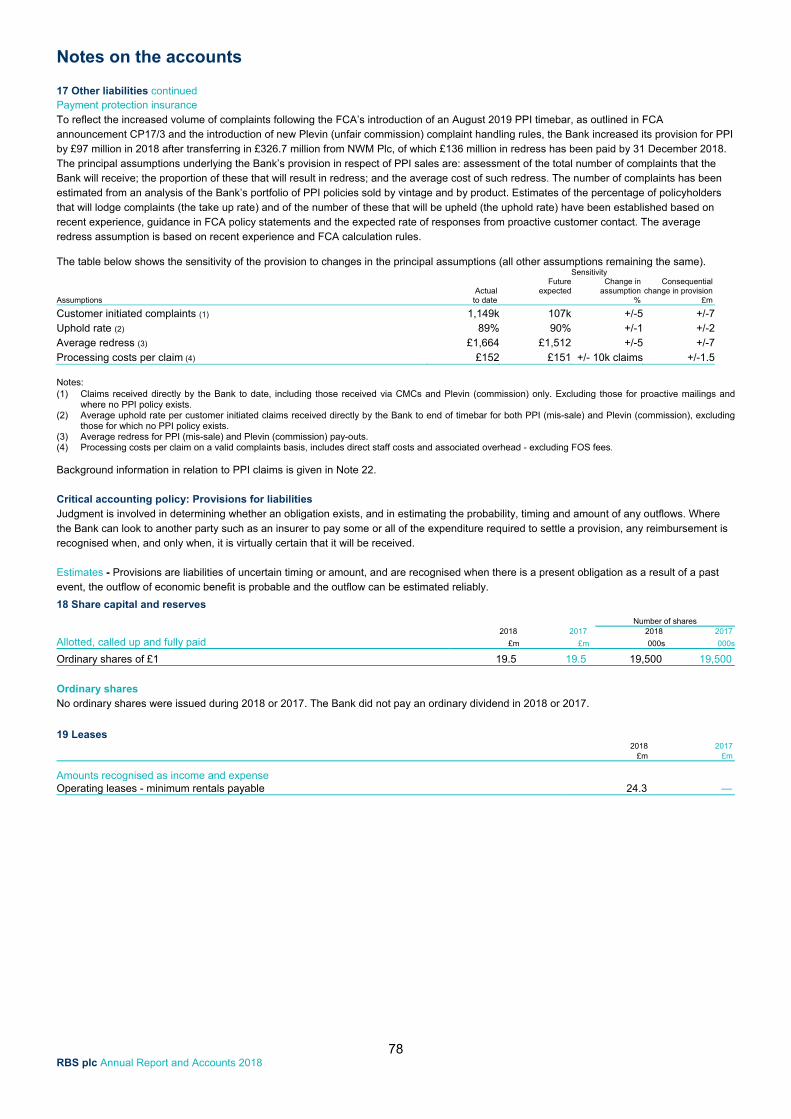
Notes on the accounts
78 RBS plc Annual Report and Accounts 2018
17 Other liabilities continued Payment protection insurance To reflect the increased volume of complaints following the FCA’s introduction of an August 2019 PPI timebar, as outlined in FCA announcement CP17/3 and the introduction of new Plevin (unfair commission) complaint handling rules, the Bank increased its provision for PPI by £97 million in 2018 after transferring in £326.7 million from NWM Plc, of which £136 million in redress has been paid by 31 December 2018. The principal assumptions underlying the Bank’s provision in respect of PPI sales are: assessment of the total number of complaints that the Bank will receive; the proportion of these that will result in redress; and the average cost of such redress. The number of complaints has been estimated from an analysis of the Bank’s portfolio of PPI policies sold by vintage and by product. Estimates of the percentage of policyholders that will lodge complaints (the take up rate) and of the number of these that will be upheld (the uphold rate) have been established based on recent experience, guidance in FCA policy statements and the expected rate of responses from proactive customer contact. The average redress assumption is based on recent experience and FCA calculation rules. The table below shows the sensitivity of the provision to changes in the principal assumptions (all other assumptions remaining the same). Sensitivity
Assumptions Actual
to date
Future expected
Change in assumption
%
Consequential change in provision
£m
Customer initiated complaints (1) 1,149k 107k +/-5 +/-7Uphold rate (2) 89% 90% +/-1 +/-2Average redress (3) £1,664 £1,512 +/-5 +/-7Processing costs per claim (4) £152 £151 +/- 10k claims +/-1.5
Notes: (1) Claims received directly by the Bank to date, including those received via CMCs and Plevin (commission) only. Excluding those for proactive mailings and
where no PPI policy exists. (2) Average uphold rate per customer initiated claims received directly by the Bank to end of timebar for both PPI (mis-sale) and Plevin (commission), excluding
those for which no PPI policy exists. (3) Average redress for PPI (mis-sale) and Plevin (commission) pay-outs. (4) Processing costs per claim on a valid complaints basis, includes direct staff costs and associated overhead - excluding FOS fees.
Background information in relation to PPI claims is given in Note 22. Critical accounting policy: Provisions for liabilities Judgment is involved in determining whether an obligation exists, and in estimating the probability, timing and amount of any outflows. Where the Bank can look to another party such as an insurer to pay some or all of the expenditure required to settle a provision, any reimbursement is recognised when, and only when, it is virtually certain that it will be received. Estimates - Provisions are liabilities of uncertain timing or amount, and are recognised when there is a present obligation as a result of a past event, the outflow of economic benefit is probable and the outflow can be estimated reliably.
18 Share capital and reserves Number of shares 2018 2017 2018 2017
Allotted, called up and fully paid £m £m 000s 000s
Ordinary shares of £1 19.5 19.5 19,500 19,500
Ordinary shares No ordinary shares were issued during 2018 or 2017. The Bank did not pay an ordinary dividend in 2018 or 2017.
19 Leases
2018 2017
£m £m
Amounts recognised as income and expense Operating leases - minimum rentals payable 24.3 —
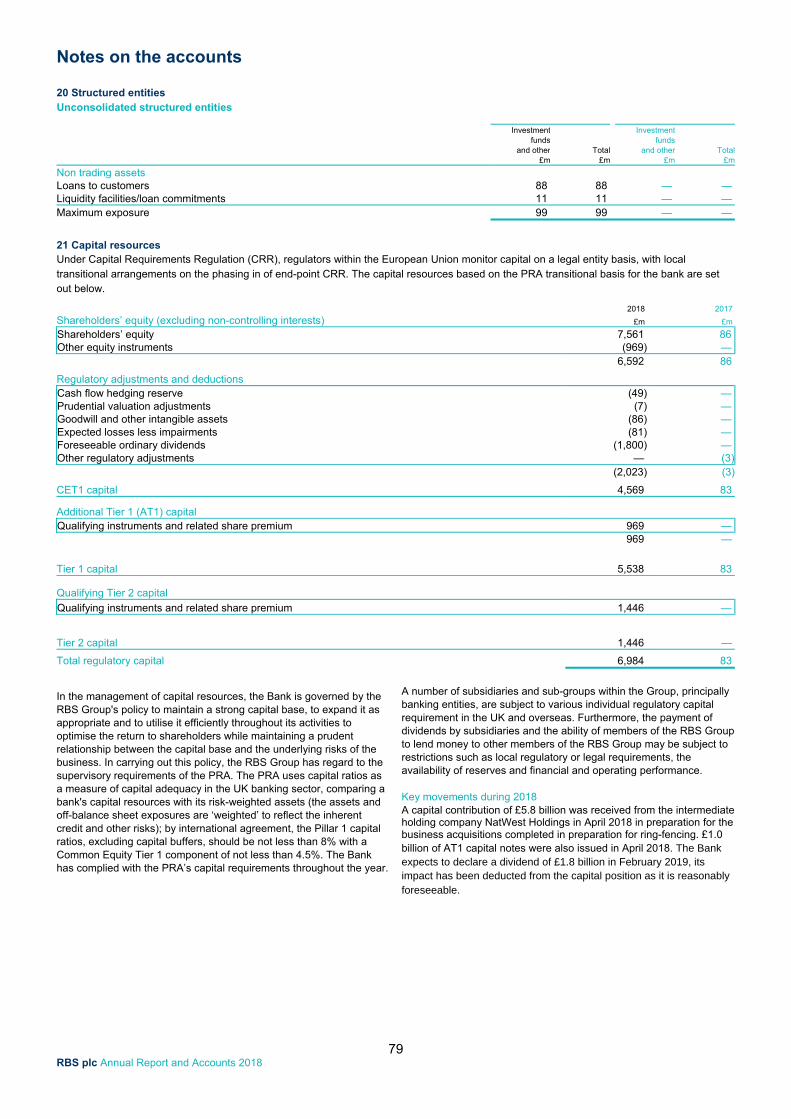
Notes on the accounts
79 RBS plc Annual Report and Accounts 2018
20 Structured entities Unconsolidated structured entities
Investment Investmentfunds funds
and other Total and other Total£m £m £m £m
Non trading assets
Loans to customers 88 88 — — Liquidity facilities/loan commitments 11 11 — — Maximum exposure 99 99 — —
21 Capital resources Under Capital Requirements Regulation (CRR), regulators within the European Union monitor capital on a legal entity basis, with local transitional arrangements on the phasing in of end-point CRR. The capital resources based on the PRA transitional basis for the bank are set out below.
2018 2017
Shareholders’ equity (excluding non-controlling interests) £m £m
Shareholders’ equity 7,561 86 Other equity instruments (969) — 6,592 86
Regulatory adjustments and deductions Cash flow hedging reserve (49) — Prudential valuation adjustments (7) — Goodwill and other intangible assets (86) — Expected losses less impairments (81) — Foreseeable ordinary dividends (1,800) — Other regulatory adjustments — (3) (2,023) (3)
CET1 capital 4,569 83
Additional Tier 1 (AT1) capital Qualifying instruments and related share premium 969 — 969 —
Tier 1 capital 5,538 83
Qualifying Tier 2 capital
Qualifying instruments and related share premium 1,446 —
Tier 2 capital 1,446 —
Total regulatory capital 6,984 83
In the management of capital resources, the Bank is governed by the RBS Group's policy to maintain a strong capital base, to expand it as appropriate and to utilise it efficiently throughout its activities to optimise the return to shareholders while maintaining a prudent relationship between the capital base and the underlying risks of the business. In carrying out this policy, the RBS Group has regard to the supervisory requirements of the PRA. The PRA uses capital ratios as a measure of capital adequacy in the UK banking sector, comparing a bank's capital resources with its risk-weighted assets (the assets and off-balance sheet exposures are ‘weighted’ to reflect the inherent credit and other risks); by international agreement, the Pillar 1 capital ratios, excluding capital buffers, should be not less than 8% with a Common Equity Tier 1 component of not less than 4.5%. The Bank has complied with the PRA’s capital requirements throughout the year.
A number of subsidiaries and sub-groups within the Group, principally banking entities, are subject to various individual regulatory capital requirement in the UK and overseas. Furthermore, the payment of dividends by subsidiaries and the ability of members of the RBS Group to lend money to other members of the RBS Group may be subject to restrictions such as local regulatory or legal requirements, the availability of reserves and financial and operating performance. Key movements during 2018 A capital contribution of £5.8 billion was received from the intermediate holding company NatWest Holdings in April 2018 in preparation for the business acquisitions completed in preparation for ring-fencing. £1.0 billion of AT1 capital notes were also issued in April 2018. The Bank expects to declare a dividend of £1.8 billion in February 2019, its impact has been deducted from the capital position as it is reasonably foreseeable.
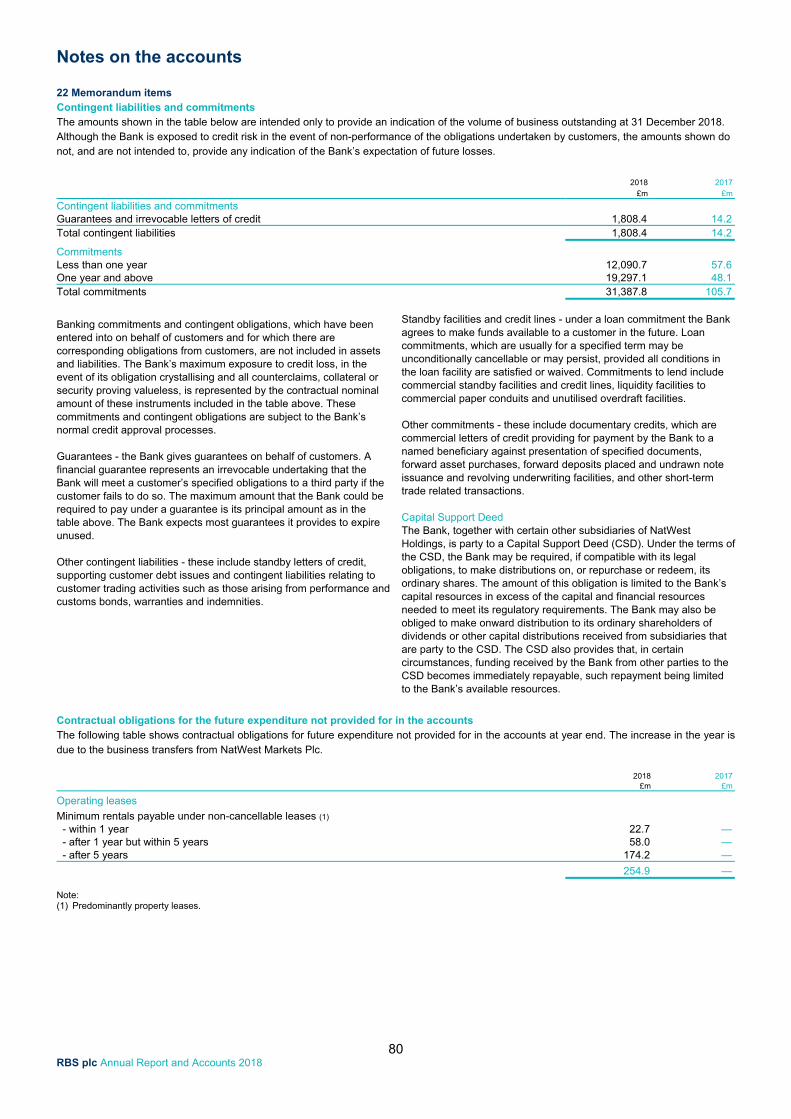
Notes on the accounts
80 RBS plc Annual Report and Accounts 2018
22 Memorandum items Contingent liabilities and commitments The amounts shown in the table below are intended only to provide an indication of the volume of business outstanding at 31 December 2018. Although the Bank is exposed to credit risk in the event of non-performance of the obligations undertaken by customers, the amounts shown do not, and are not intended to, provide any indication of the Bank’s expectation of future losses.
2018 2017 £m £m
Contingent liabilities and commitments
Guarantees and irrevocable letters of credit 1,808.4 14.2 Total contingent liabilities 1,808.4 14.2
Commitments Less than one year 12,090.7 57.6 One year and above 19,297.1 48.1 Total commitments 31,387.8 105.7
Banking commitments and contingent obligations, which have been entered into on behalf of customers and for which there are corresponding obligations from customers, are not included in assets and liabilities. The Bank’s maximum exposure to credit loss, in the event of its obligation crystallising and all counterclaims, collateral or security proving valueless, is represented by the contractual nominal amount of these instruments included in the table above. These commitments and contingent obligations are subject to the Bank’s normal credit approval processes. Guarantees - the Bank gives guarantees on behalf of customers. A financial guarantee represents an irrevocable undertaking that the Bank will meet a customer’s specified obligations to a third party if the customer fails to do so. The maximum amount that the Bank could be required to pay under a guarantee is its principal amount as in the table above. The Bank expects most guarantees it provides to expire unused. Other contingent liabilities - these include standby letters of credit, supporting customer debt issues and contingent liabilities relating to customer trading activities such as those arising from performance and customs bonds, warranties and indemnities.
Standby facilities and credit lines - under a loan commitment the Bank agrees to make funds available to a customer in the future. Loan commitments, which are usually for a specified term may be unconditionally cancellable or may persist, provided all conditions in the loan facility are satisfied or waived. Commitments to lend include commercial standby facilities and credit lines, liquidity facilities to commercial paper conduits and unutilised overdraft facilities. Other commitments - these include documentary credits, which are commercial letters of credit providing for payment by the Bank to a named beneficiary against presentation of specified documents, forward asset purchases, forward deposits placed and undrawn note issuance and revolving underwriting facilities, and other short-term trade related transactions. Capital Support Deed The Bank, together with certain other subsidiaries of NatWest Holdings, is party to a Capital Support Deed (CSD). Under the terms of the CSD, the Bank may be required, if compatible with its legal obligations, to make distributions on, or repurchase or redeem, its ordinary shares. The amount of this obligation is limited to the Bank’s capital resources in excess of the capital and financial resources needed to meet its regulatory requirements. The Bank may also be obliged to make onward distribution to its ordinary shareholders of dividends or other capital distributions received from subsidiaries that are party to the CSD. The CSD also provides that, in certain circumstances, funding received by the Bank from other parties to the CSD becomes immediately repayable, such repayment being limited to the Bank’s available resources.
Contractual obligations for the future expenditure not provided for in the accounts The following table shows contractual obligations for future expenditure not provided for in the accounts at year end. The increase in the year is due to the business transfers from NatWest Markets Plc.
2018 2017 £m £m
Operating leases Minimum rentals payable under non-cancellable leases (1) - within 1 year 22.7 — - after 1 year but within 5 years 58.0 — - after 5 years 174.2 —
254.9 — Note: (1) Predominantly property leases.
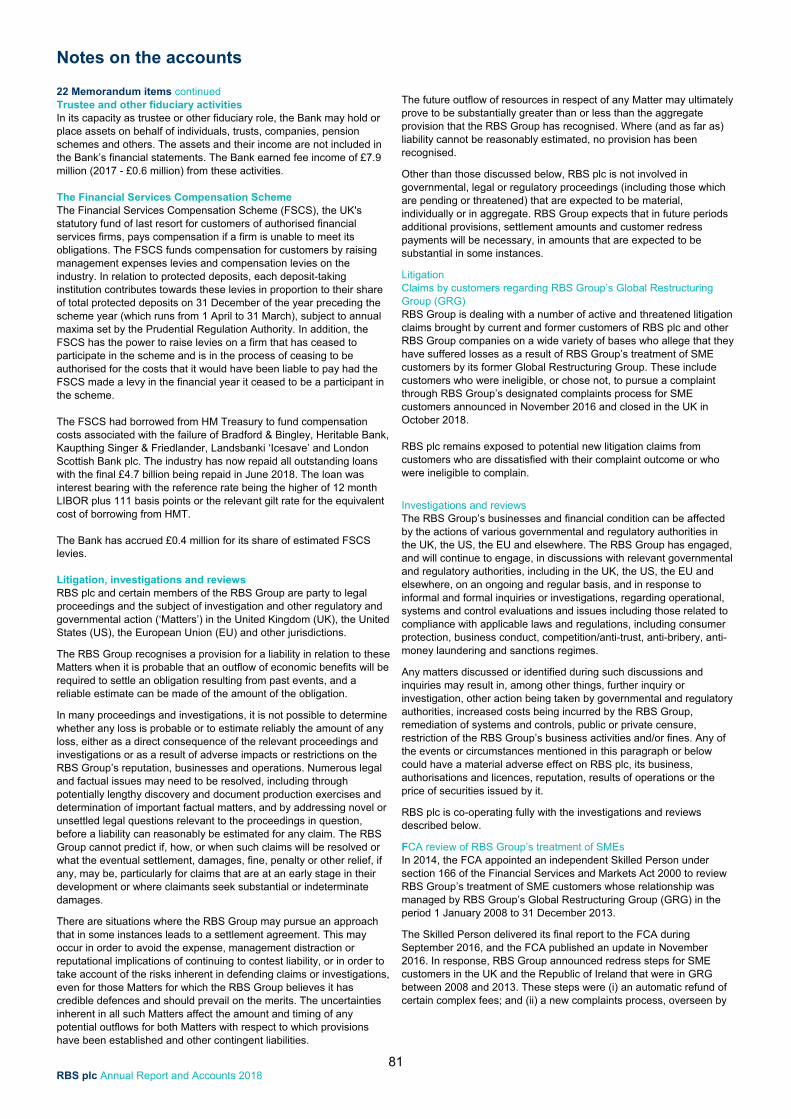
Notes on the accounts
81 RBS plc Annual Report and Accounts 2018
22 Memorandum items continued Trustee and other fiduciary activities In its capacity as trustee or other fiduciary role, the Bank may hold or place assets on behalf of individuals, trusts, companies, pension schemes and others. The assets and their income are not included in the Bank’s financial statements. The Bank earned fee income of £7.9 million (2017 - £0.6 million) from these activities. The Financial Services Compensation Scheme The Financial Services Compensation Scheme (FSCS), the UK's statutory fund of last resort for customers of authorised financial services firms, pays compensation if a firm is unable to meet its obligations. The FSCS funds compensation for customers by raising management expenses levies and compensation levies on the industry. In relation to protected deposits, each deposit-taking institution contributes towards these levies in proportion to their share of total protected deposits on 31 December of the year preceding the scheme year (which runs from 1 April to 31 March), subject to annual maxima set by the Prudential Regulation Authority. In addition, the FSCS has the power to raise levies on a firm that has ceased to participate in the scheme and is in the process of ceasing to be authorised for the costs that it would have been liable to pay had the FSCS made a levy in the financial year it ceased to be a participant in the scheme. The FSCS had borrowed from HM Treasury to fund compensation costs associated with the failure of Bradford & Bingley, Heritable Bank, Kaupthing Singer & Friedlander, Landsbanki ‘Icesave’ and London Scottish Bank plc. The industry has now repaid all outstanding loans with the final £4.7 billion being repaid in June 2018. The loan was interest bearing with the reference rate being the higher of 12 month LIBOR plus 111 basis points or the relevant gilt rate for the equivalent cost of borrowing from HMT. The Bank has accrued £0.4 million for its share of estimated FSCS levies. Litigation, investigations and reviews RBS plc and certain members of the RBS Group are party to legal proceedings and the subject of investigation and other regulatory and governmental action (‘Matters’) in the United Kingdom (UK), the United States (US), the European Union (EU) and other jurisdictions.
The RBS Group recognises a provision for a liability in relation to these Matters when it is probable that an outflow of economic benefits will be required to settle an obligation resulting from past events, and a reliable estimate can be made of the amount of the obligation.
In many proceedings and investigations, it is not possible to determine whether any loss is probable or to estimate reliably the amount of any loss, either as a direct consequence of the relevant proceedings and investigations or as a result of adverse impacts or restrictions on the RBS Group’s reputation, businesses and operations. Numerous legal and factual issues may need to be resolved, including through potentially lengthy discovery and document production exercises and determination of important factual matters, and by addressing novel or unsettled legal questions relevant to the proceedings in question, before a liability can reasonably be estimated for any claim. The RBS Group cannot predict if, how, or when such claims will be resolved or what the eventual settlement, damages, fine, penalty or other relief, if any, may be, particularly for claims that are at an early stage in their development or where claimants seek substantial or indeterminate damages.
There are situations where the RBS Group may pursue an approach that in some instances leads to a settlement agreement. This may occur in order to avoid the expense, management distraction or reputational implications of continuing to contest liability, or in order to take account of the risks inherent in defending claims or investigations, even for those Matters for which the RBS Group believes it has credible defences and should prevail on the merits. The uncertainties inherent in all such Matters affect the amount and timing of any potential outflows for both Matters with respect to which provisions have been established and other contingent liabilities.
The future outflow of resources in respect of any Matter may ultimately prove to be substantially greater than or less than the aggregate provision that the RBS Group has recognised. Where (and as far as) liability cannot be reasonably estimated, no provision has been recognised.
Other than those discussed below, RBS plc is not involved in governmental, legal or regulatory proceedings (including those which are pending or threatened) that are expected to be material, individually or in aggregate. RBS Group expects that in future periods additional provisions, settlement amounts and customer redress payments will be necessary, in amounts that are expected to be substantial in some instances.
Litigation Claims by customers regarding RBS Group’s Global Restructuring Group (GRG) RBS Group is dealing with a number of active and threatened litigation claims brought by current and former customers of RBS plc and other RBS Group companies on a wide variety of bases who allege that they have suffered losses as a result of RBS Group’s treatment of SME customers by its former Global Restructuring Group. These include customers who were ineligible, or chose not, to pursue a complaint through RBS Group’s designated complaints process for SME customers announced in November 2016 and closed in the UK in October 2018. RBS plc remains exposed to potential new litigation claims from customers who are dissatisfied with their complaint outcome or who were ineligible to complain.
Investigations and reviews The RBS Group’s businesses and financial condition can be affected by the actions of various governmental and regulatory authorities in the UK, the US, the EU and elsewhere. The RBS Group has engaged, and will continue to engage, in discussions with relevant governmental and regulatory authorities, including in the UK, the US, the EU and elsewhere, on an ongoing and regular basis, and in response to informal and formal inquiries or investigations, regarding operational, systems and control evaluations and issues including those related to compliance with applicable laws and regulations, including consumer protection, business conduct, competition/anti-trust, anti-bribery, anti-money laundering and sanctions regimes.
Any matters discussed or identified during such discussions and inquiries may result in, among other things, further inquiry or investigation, other action being taken by governmental and regulatory authorities, increased costs being incurred by the RBS Group, remediation of systems and controls, public or private censure, restriction of the RBS Group’s business activities and/or fines. Any of the events or circumstances mentioned in this paragraph or below could have a material adverse effect on RBS plc, its business, authorisations and licences, reputation, results of operations or the price of securities issued by it.
RBS plc is co-operating fully with the investigations and reviews described below.
FCA review of RBS Group’s treatment of SMEs In 2014, the FCA appointed an independent Skilled Person under section 166 of the Financial Services and Markets Act 2000 to review RBS Group’s treatment of SME customers whose relationship was managed by RBS Group’s Global Restructuring Group (GRG) in the period 1 January 2008 to 31 December 2013.
The Skilled Person delivered its final report to the FCA during September 2016, and the FCA published an update in November 2016. In response, RBS Group announced redress steps for SME customers in the UK and the Republic of Ireland that were in GRG between 2008 and 2013. These steps were (i) an automatic refund of certain complex fees; and (ii) a new complaints process, overseen by
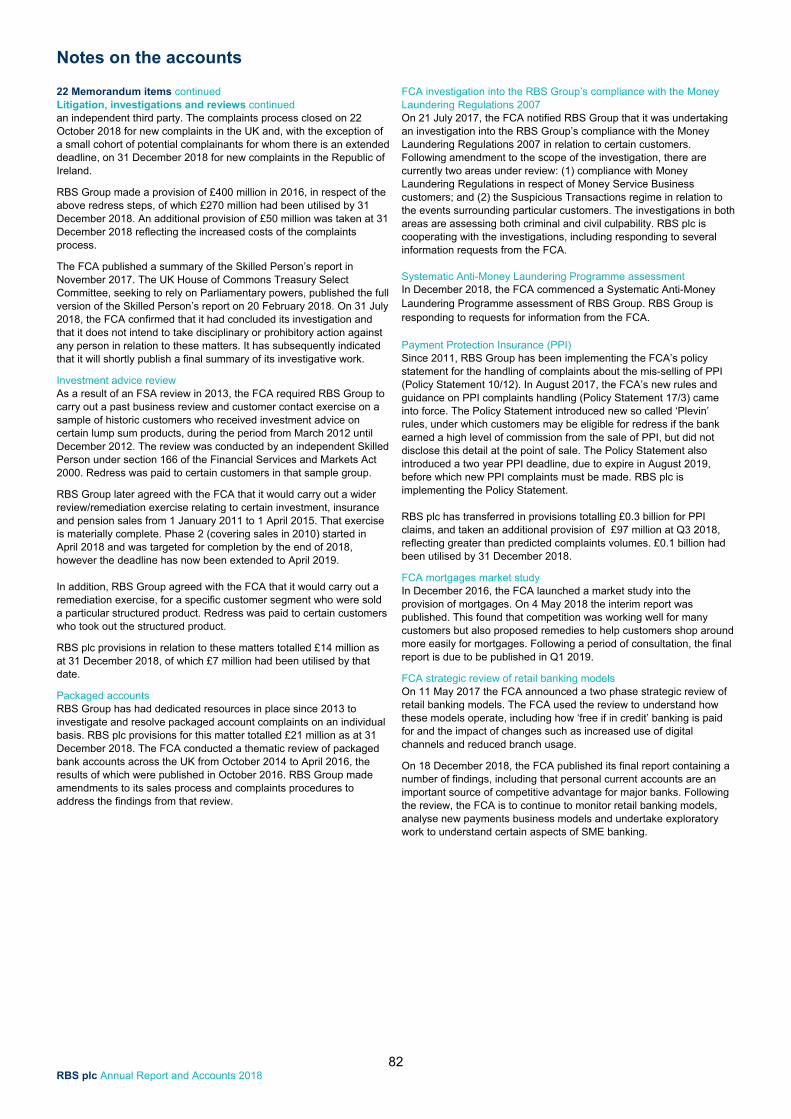
Notes on the accounts
82 RBS plc Annual Report and Accounts 2018
22 Memorandum items continued Litigation, investigations and reviews continued an independent third party. The complaints process closed on 22 October 2018 for new complaints in the UK and, with the exception of a small cohort of potential complainants for whom there is an extended deadline, on 31 December 2018 for new complaints in the Republic of Ireland.
RBS Group made a provision of £400 million in 2016, in respect of the above redress steps, of which £270 million had been utilised by 31 December 2018. An additional provision of £50 million was taken at 31 December 2018 reflecting the increased costs of the complaints process.
The FCA published a summary of the Skilled Person’s report in November 2017. The UK House of Commons Treasury Select Committee, seeking to rely on Parliamentary powers, published the full version of the Skilled Person’s report on 20 February 2018. On 31 July 2018, the FCA confirmed that it had concluded its investigation and that it does not intend to take disciplinary or prohibitory action against any person in relation to these matters. It has subsequently indicated that it will shortly publish a final summary of its investigative work.
Investment advice review As a result of an FSA review in 2013, the FCA required RBS Group to carry out a past business review and customer contact exercise on a sample of historic customers who received investment advice on certain lump sum products, during the period from March 2012 until December 2012. The review was conducted by an independent Skilled Person under section 166 of the Financial Services and Markets Act 2000. Redress was paid to certain customers in that sample group.
RBS Group later agreed with the FCA that it would carry out a wider review/remediation exercise relating to certain investment, insurance and pension sales from 1 January 2011 to 1 April 2015. That exercise is materially complete. Phase 2 (covering sales in 2010) started in April 2018 and was targeted for completion by the end of 2018, however the deadline has now been extended to April 2019. In addition, RBS Group agreed with the FCA that it would carry out a remediation exercise, for a specific customer segment who were sold a particular structured product. Redress was paid to certain customers who took out the structured product.
RBS plc provisions in relation to these matters totalled £14 million as at 31 December 2018, of which £7 million had been utilised by that date.
Packaged accounts RBS Group has had dedicated resources in place since 2013 to investigate and resolve packaged account complaints on an individual basis. RBS plc provisions for this matter totalled £21 million as at 31 December 2018. The FCA conducted a thematic review of packaged bank accounts across the UK from October 2014 to April 2016, the results of which were published in October 2016. RBS Group made amendments to its sales process and complaints procedures to address the findings from that review.
FCA investigation into the RBS Group’s compliance with the Money Laundering Regulations 2007 On 21 July 2017, the FCA notified RBS Group that it was undertaking an investigation into the RBS Group’s compliance with the Money Laundering Regulations 2007 in relation to certain customers. Following amendment to the scope of the investigation, there are currently two areas under review: (1) compliance with Money Laundering Regulations in respect of Money Service Business customers; and (2) the Suspicious Transactions regime in relation to the events surrounding particular customers. The investigations in both areas are assessing both criminal and civil culpability. RBS plc is cooperating with the investigations, including responding to several information requests from the FCA. Systematic Anti-Money Laundering Programme assessment In December 2018, the FCA commenced a Systematic Anti-Money Laundering Programme assessment of RBS Group. RBS Group is responding to requests for information from the FCA.
Payment Protection Insurance (PPI) Since 2011, RBS Group has been implementing the FCA’s policy statement for the handling of complaints about the mis-selling of PPI (Policy Statement 10/12). In August 2017, the FCA’s new rules and guidance on PPI complaints handling (Policy Statement 17/3) came into force. The Policy Statement introduced new so called ‘Plevin’ rules, under which customers may be eligible for redress if the bank earned a high level of commission from the sale of PPI, but did not disclose this detail at the point of sale. The Policy Statement also introduced a two year PPI deadline, due to expire in August 2019, before which new PPI complaints must be made. RBS plc is implementing the Policy Statement. RBS plc has transferred in provisions totalling £0.3 billion for PPI claims, and taken an additional provision of £97 million at Q3 2018, reflecting greater than predicted complaints volumes. £0.1 billion had been utilised by 31 December 2018.
FCA mortgages market study In December 2016, the FCA launched a market study into the provision of mortgages. On 4 May 2018 the interim report was published. This found that competition was working well for many customers but also proposed remedies to help customers shop around more easily for mortgages. Following a period of consultation, the final report is due to be published in Q1 2019.
FCA strategic review of retail banking models On 11 May 2017 the FCA announced a two phase strategic review of retail banking models. The FCA used the review to understand how these models operate, including how ‘free if in credit’ banking is paid for and the impact of changes such as increased use of digital channels and reduced branch usage.
On 18 December 2018, the FCA published its final report containing a number of findings, including that personal current accounts are an important source of competitive advantage for major banks. Following the review, the FCA is to continue to monitor retail banking models, analyse new payments business models and undertake exploratory work to understand certain aspects of SME banking.
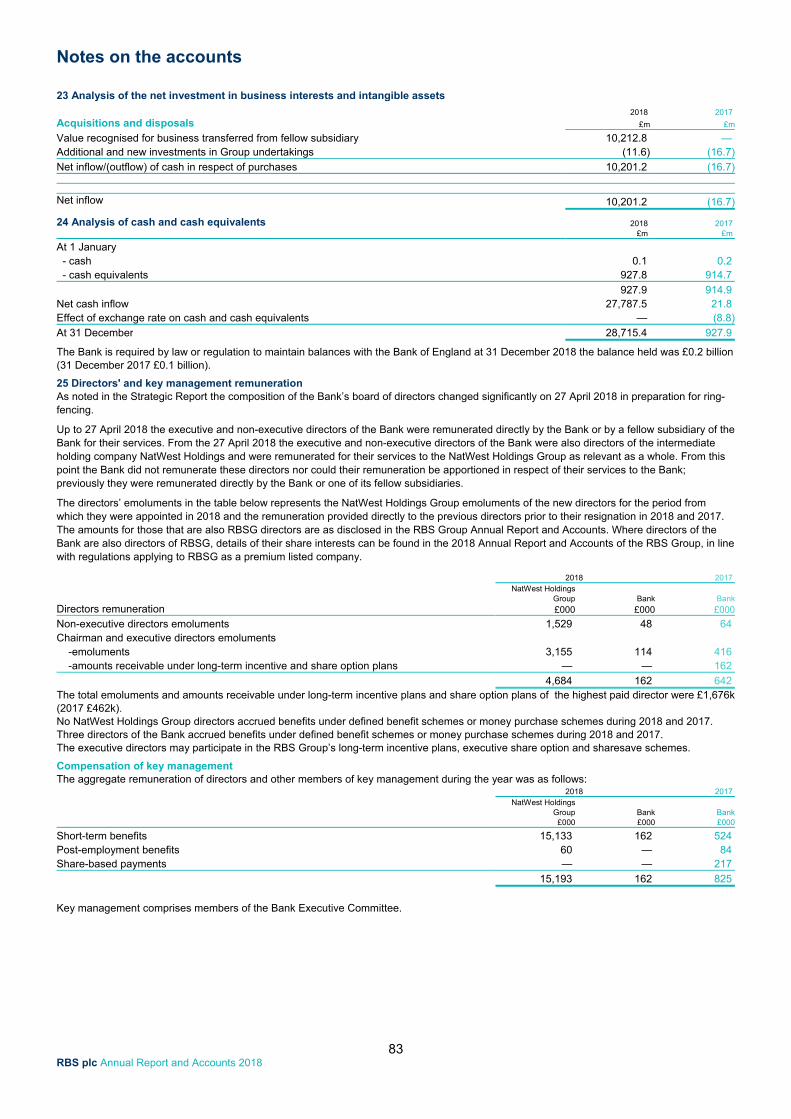
Notes on the accounts
83 RBS plc Annual Report and Accounts 2018
23 Analysis of the net investment in business interests and intangible assets 2018 2017
Acquisitions and disposals £m £m
Value recognised for business transferred from fellow subsidiary 10,212.8 — Additional and new investments in Group undertakings (11.6) (16.7)
Net inflow/(outflow) of cash in respect of purchases 10,201.2 (16.7)
Net inflow 10,201.2 (16.7)
24 Analysis of cash and cash equivalents 2018 2017 £m £m
At 1 January
- cash 0.1 0.2 - cash equivalents 927.8 914.7
927.9 914.9 Net cash inflow 27,787.5 21.8 Effect of exchange rate on cash and cash equivalents — (8.8)
At 31 December 28,715.4 927.9 The Bank is required by law or regulation to maintain balances with the Bank of England at 31 December 2018 the balance held was £0.2 billion (31 December 2017 £0.1 billion). 25 Directors' and key management remuneration As noted in the Strategic Report the composition of the Bank’s board of directors changed significantly on 27 April 2018 in preparation for ring-fencing. Up to 27 April 2018 the executive and non-executive directors of the Bank were remunerated directly by the Bank or by a fellow subsidiary of the Bank for their services. From the 27 April 2018 the executive and non-executive directors of the Bank were also directors of the intermediate holding company NatWest Holdings and were remunerated for their services to the NatWest Holdings Group as relevant as a whole. From this point the Bank did not remunerate these directors nor could their remuneration be apportioned in respect of their services to the Bank; previously they were remunerated directly by the Bank or one of its fellow subsidiaries. The directors’ emoluments in the table below represents the NatWest Holdings Group emoluments of the new directors for the period from which they were appointed in 2018 and the remuneration provided directly to the previous directors prior to their resignation in 2018 and 2017. The amounts for those that are also RBSG directors are as disclosed in the RBS Group Annual Report and Accounts. Where directors of the Bank are also directors of RBSG, details of their share interests can be found in the 2018 Annual Report and Accounts of the RBS Group, in line with regulations applying to RBSG as a premium listed company.
2018 2017 NatWest Holdings
Directors remuneration
Group Bank Bank
£000 £000 £000
Non-executive directors emoluments 1,529 48 64 Chairman and executive directors emoluments -emoluments 3,155 114 416 -amounts receivable under long-term incentive and share option plans — — 162
4,684 162 642 The total emoluments and amounts receivable under long-term incentive plans and share option plans of the highest paid director were £1,676k (2017 £462k). No NatWest Holdings Group directors accrued benefits under defined benefit schemes or money purchase schemes during 2018 and 2017. Three directors of the Bank accrued benefits under defined benefit schemes or money purchase schemes during 2018 and 2017. The executive directors may participate in the RBS Group’s long-term incentive plans, executive share option and sharesave schemes. Compensation of key management The aggregate remuneration of directors and other members of key management during the year was as follows:
2018 2017 NatWest Holdings
Group Bank Bank£000 £000 £000
Short-term benefits 15,133 162 524 Post-employment benefits 60 — 84 Share-based payments — — 217
15,193 162 825 Key management comprises members of the Bank Executive Committee.
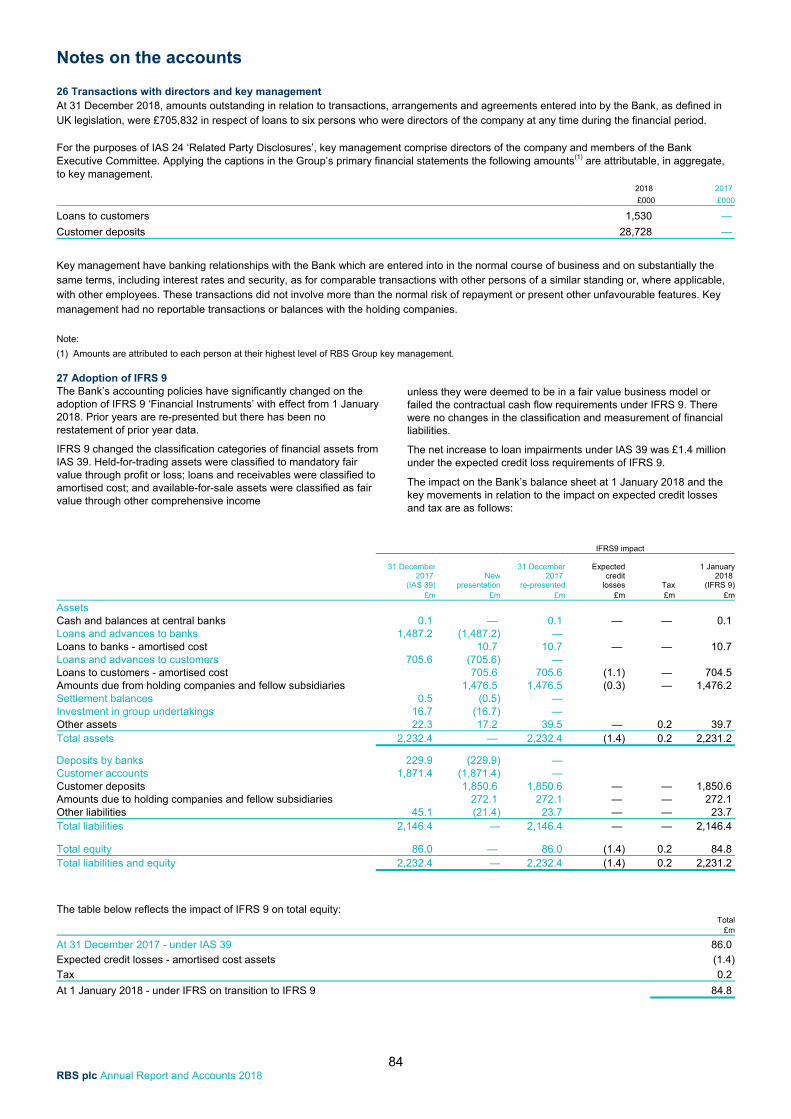
Notes on the accounts
84 RBS plc Annual Report and Accounts 2018
26 Transactions with directors and key management At 31 December 2018, amounts outstanding in relation to transactions, arrangements and agreements entered into by the Bank, as defined in UK legislation, were £705,832 in respect of loans to six persons who were directors of the company at any time during the financial period. For the purposes of IAS 24 ‘Related Party Disclosures’, key management comprise directors of the company and members of the Bank Executive Committee. Applying the captions in the Group’s primary financial statements the following amounts(1) are attributable, in aggregate, to key management.
2018 2017
£000 £000
Loans to customers 1,530 —
Customer deposits 28,728 —
Key management have banking relationships with the Bank which are entered into in the normal course of business and on substantially the same terms, including interest rates and security, as for comparable transactions with other persons of a similar standing or, where applicable, with other employees. These transactions did not involve more than the normal risk of repayment or present other unfavourable features. Key management had no reportable transactions or balances with the holding companies.
Note:
(1) Amounts are attributed to each person at their highest level of RBS Group key management. 27 Adoption of IFRS 9 The Bank’s accounting policies have significantly changed on the adoption of IFRS 9 ‘Financial Instruments’ with effect from 1 January 2018. Prior years are re-presented but there has been no restatement of prior year data.
IFRS 9 changed the classification categories of financial assets from IAS 39. Held-for-trading assets were classified to mandatory fair value through profit or loss; loans and receivables were classified to amortised cost; and available-for-sale assets were classified as fair value through other comprehensive income
unless they were deemed to be in a fair value business model or failed the contractual cash flow requirements under IFRS 9. There were no changes in the classification and measurement of financial liabilities.
The net increase to loan impairments under IAS 39 was £1.4 million under the expected credit loss requirements of IFRS 9.
The impact on the Bank’s balance sheet at 1 January 2018 and the key movements in relation to the impact on expected credit losses and tax are as follows:
IFRS9 impact 31 December 31 December Expected 1 January 2017 New 2017 credit 2018
(IAS 39) presentation re-presented losses Tax (IFRS 9)
£m £m £m £m £m £m
Assets Cash and balances at central banks 0.1 — 0.1 — — 0.1 Loans and advances to banks 1,487.2 (1,487.2) — Loans to banks - amortised cost 10.7 10.7 — — 10.7 Loans and advances to customers 705.6 (705.6) — Loans to customers - amortised cost 705.6 705.6 (1.1) — 704.5 Amounts due from holding companies and fellow subsidiaries 1,476.5 1,476.5 (0.3) — 1,476.2 Settlement balances 0.5 (0.5) — Investment in group undertakings 16.7 (16.7) — Other assets 22.3 17.2 39.5 — 0.2 39.7 Total assets 2,232.4 — 2,232.4 (1.4) 0.2 2,231.2
Deposits by banks 229.9 (229.9) — Customer accounts 1,871.4 (1,871.4) — Customer deposits 1,850.6 1,850.6 — — 1,850.6 Amounts due to holding companies and fellow subsidiaries 272.1 272.1 — — 272.1 Other liabilities 45.1 (21.4) 23.7 — — 23.7 Total liabilities 2,146.4 — 2,146.4 — — 2,146.4 Total equity 86.0 — 86.0 (1.4) 0.2 84.8 Total liabilities and equity 2,232.4 — 2,232.4 (1.4) 0.2 2,231.2
The table below reflects the impact of IFRS 9 on total equity:
Total
£m
At 31 December 2017 - under IAS 39 86.0
Expected credit losses - amortised cost assets (1.4)
Tax 0.2
At 1 January 2018 - under IFRS on transition to IFRS 9 84.8
Notes on the accounts
85 RBS plc Annual Report and Accounts 2018
28 Related parties UK Government On 1 December 2008, the UK Government through HM Treasury became the ultimate controlling party of The Royal Bank of Scotland Group plc. The UK Government's shareholding is managed by UK Government Investments Limited, a company wholly owned by the UK Government. As a result, the UK Government and UK Government controlled bodies became related parties of the Bank.
In 2015, HM Treasury sold 630 million of the company’s ordinary shares. In June 2018 HMT sold a further 925 million of the company’s ordinary shares. At 31 December 2018, HM Treasury’s holding in the company’s ordinary shares was 62.3%.
The Bank enters into transactions with many of these bodies on an arm’s length basis. Transactions include the payment of: taxes principally UK corporation tax (Note 7) and value added tax; national insurance contributions; local authority rates; and regulatory fees and together with banking transactions such as loans and deposits undertaken in the normal course of banker-customer relationships.
Service entity On 30 April 2018, in preparation for ring-fencing, NatWest Plc became the main provider of shared service activities for the RBS
Group, including the Bank. Previously NatWest Markets provided these services. This includes Treasury services as well as shared service activity.
Bank of England facilities The Bank may participate in a number of schemes operated by the Bank of England in the normal course of business.
The Bank is a UK authorised institution and is required to maintain non-interest bearing (cash ratio) deposits with the Bank of England amounting to 0.296% of their average eligible liabilities in excess of £600 million. The Bank also has access to Bank of England reserve accounts: sterling current accounts that earn interest at the Bank of England Rate.
Other related parties In their roles as providers of finance, the Bank provides development and other types of capital support to businesses. These investments are made in the normal course of business and on arm's length terms. In some instances, the investment may extend to ownership or control over 20% or more of the voting rights of the investee company. However, these investments are not considered to give rise to transactions of a materiality requiring disclosure under IAS 24.
The table below discloses items included in income and operating expenses on transactions between the Bank and fellow subsidiaries of the RBS Group. 2018 2017
£m £m
Interest receivable 269.1 8.8
Interest payable (326.7) (1.1)
Fees and commissions payable (7.8) —
Other administrative expenses (1.5) —
(66.9) 7.7 29 Ultimate holding company The Bank’s ultimate holding company is The Royal Bank of Scotland Group plc which is incorporated in Great Britain and registered in Scotland and its intermediate holding company is NatWest Holdings Ltd which is incorporated in Great Britain and registered in England. As at 31 December 2018, The Royal Bank of Scotland Group plc heads the largest group in which the Bank is consolidated. Copies of the consolidated accounts may be obtained from The Secretary, The Royal Bank of Scotland Group plc, Gogarburn, PO Box 1000, Edinburgh EH12 1HQ. Following placing and open offers by The Royal Bank of Scotland Group plc in December 2008 and April 2009, the UK Government, through HM Treasury, currently holds 62.3% of the issued ordinary share capital of the holding company and is therefore the Bank’s ultimate controlling party. 30 Post balance sheet events There have been no other significant events between 31 December 2018 and the date of approval of these accounts which would require a change to or additional disclosure in the accounts. 31 Related undertakings Bank legal entities and activities at 31 December 2018 In accordance with the Companies Act 2006, the Bank’s related undertakings and the accounting treatment for each are listed below. All undertakings are wholly-owned by the Bank or subsidiaries of the Bank and are consolidated in the RBS Group accounts by reason of contractual control (Section 1162(2) CA 2006), unless otherwise indicated. RBS Group interest refers to ordinary shares of equal values and voting rights unless further analysis is provided in the notes. The following table details active related undertakings incorporated in the UK which are 100% owned by the Bank and fully consolidated in the RBS Group accounts for accounting purposes.
The following table details related undertakings that are dormant.
Entity Name Activity Regulatory Treatment Notes Entity Name
Accounting Treatment
Regulatory Treatment % held Notes
Adam & Company Investment Management Ltd
BF FC (1)
Adam & Company (Nominees) Ltd
FC FC 100 (1)
The One Account Ltd BF FC (2)
Key:
BF Banking and financial institution FC Full consolidation Notes: Registered addresses Country of incorporation (1) 25 St Andrew Square, Edinburgh, EH2 1AF, Scotland UK (2) 250 Bishopsgate, London, EC2M 4AA, England UK