Embed Size (px)
Citation preview

Strategy in actionAnnual report and accounts 2005

Contents
1 Group financial highlights2 Petrofac at a glance4 Chairman’s statement6 Group Chief Executive’s
review10 Operating review
Engineering & Construction16 Operations Services22 Resources25 Financial review30 Corporate social
responsibility32 Board of directors34 Corporate governance38 Directors’ remuneration
report42 Statement of directors’
responsibilities43 Independent auditors’
report to the shareholders ofPetrofac Limited
44 Consolidated incomestatement
45 Consolidated balance sheet46 Consolidated cash flow
statement48 Consolidated statement of
changes in equity50 Notes to the consolidated
financial statements83 Four year summary84 Shareholder information
Petrofac aims to generate sustainable growthin value for its shareholders by being the leadinginternational provider of facilities solutions to the oil &gas production and processing industry; delivering world-class project development, project management,engineering, procurement, construction, operations andtraining services.
Petrofac aims to achieve this goal by:
• Leveraging customer relationships by providing a rangeof services across the life cycle of an asset
• Focusing on regions with major hydrocarbon reserves wheresignificant capital and operational expenditures are expected
• Expanding its established service offering into newcountries and regions
• Assisting customers in achieving their local content goals by increasing the use of indigenous resources and improving the competence and technical skills of localworkforces
• Improving revenue and earnings stability through a diversifiedand complementary business model
• Attracting and retaining specialists and key personnel
• Maintaining and improving on high safety standards
• Identifying, acquiring, integrating and developingcomplementary businesses where appropriate

Annual report and accounts 2005 Petrofac 1
Group financial highlights1
US$1,485mRevenue2004 US$952m
US$3,244mBacklog2
2004 US$1,740m
US$115.6mEBITDA3
2004 US$96.1m
32.5%Return on capital employed2004 31.4%
US$75.4mNet profit4
2004 US$46.1m
22.4 centsEarnings per share (diluted)2004 11.9 cents
1 Unless otherwise stated, results on pages 1 to 29 are on continuing operations.2 Backlog consists of the estimated revenue attributable to the uncompleted portion of
lump-sum engineering, procurement and construction contracts and variation ordersplus, with regard to engineering services and facilities management contracts, theestimated revenue attributable to the lesser of the remaining term of the contract and,in the case of life-of-field facilities management contracts, five years. The group usesthis key performance indicator as a measure of the visibility of future earnings. Backlog
is not an audited measure. Other companies in the oil & gas industry may calculate thismeasure differently.
3 EBITDA means earnings before interest, tax, depreciation and amortisation and iscalculated as profit from continuing operations before tax and finance costs adjustedto add back charges for depreciation, amortisation and impairment (see note 3 to thefinancial statements).
4 Profit for the year attributable to Petrofac Limited shareholders.
02 03 04 05
34.3 38
.4
46.1
75.4
Net profit (US$ millions)
02 03 04 05
391
629
952
1,48
5
Revenue (US$ millions)

2 Petrofac Annual report and accounts 2005
Petrofac at a glance
Petrofac provides services across the lifecycle forupstream, midstream and downstream facilities andinfrastructure. By working in partnership with the ownersof oil & gas reserves and infrastructure, providinginnovative and cost-efficient services, Petrofac aims tocreate value across all aspects of an asset’s development.
Abu DhabiSharjahDoha
LondonAberdeen
Woking
Khartoum
Bishkek
Moscow
Ahmadi
BakuTehranAlgiers
DamascusHouston
LagosKuala Lumpur
Mumbai
Petrofac CorporateServices:1 London, England
Petrofac OperationsServices:2 Aberdeen, Scotland3 Sharjah, UAE
Petrofac Engineering& Construction:4 Sharjah, UAE5 Mumbai, India6 Woking, England
Petrofac Resources7 London, England8 Sharjah, UAE9 Kuala Lumpur,
Malaysia
Petrofac CountryOffices10 Abu Dhabi, UAE11 Algiers, Algeria12 Baku, Azerbaijan13 Tehran, Iran14 Ahmadi, Kuwait15 Bishkek, Kyrgyzstan16 Lagos, Nigeria17 Doha, Qatar18 Moscow, Russia19 Khartoum, Sudan20 Damascus, Syria21 Houston, USA
Petrofac’s customer base includes many of the world’s leading integrated, independentand national oil & gas companies. The group’s core focus is on the UK Continental Shelf,Middle East, Africa and the Former Soviet Union; it has 17 offices worldwide andapproximately 7,000 employees.

Annual report and accounts 2005 Petrofac 3
Petrofac delivers services through its three divisions, Engineering &Construction, Operations Services and Resources, enabling the groupto provide a total solutions approach to meeting customers’ needsacross the full lifecycle of oil & gas assets.
Engineering & Construction
Petrofac’s development planning specialistsand project professionals provide customersaround the world with project developmentservices to help them maximise the lifetimevalue of their oil & gas assets.
Petrofac’s engineering, procurement andconstruction expertise covers oil & gasgathering, processing and transportation inboth greenfield and brownfielddevelopments. By tailoring constructionplanning and detailed schedule activitiesaround specific site conditions, Petrofacprovides a differentiated approach anddelivers innovative solutions to logisticallydifficult and technically complex projects.Utilising the latest developments in processengineering technology and equipment,Petrofac provides fast-track engineering,procurement and construction services forfacilities and processes – from wellhead tofinished refined products.
Operations Services
Operations Services comprises PetrofacFacilities Management and Petrofac Training.Petrofac Facilities Management providesoperations management customers with aturnkey service, delivering production, safetyand environmental performance from theirhydrocarbon production and processingassets. In addition, Petrofac FacilitiesManagement provides a range of solutions inoperations support, brownfielddevelopment, performance management,plant asset management, maintenancemanagement, turbo machinery andmanpower supply.
Training is integral to the development ofsafe, efficient and multi-skilled workforcesand core to Petrofac’s overall proposition.Petrofac Training is a provider of specialistoperations, production and technical trainingto industry, and is also the home of worldleading safety training provider, RGITMontrose and the international specialist inemergency response and crisismanagement, Rubicon Response.
Resources
Petrofac will invest alongside its clients indevelopment projects, producing assets andoil & gas infrastructure where, throughproviding facilities engineering services, itcan enhance value by facilitating projectviability and containing or reducing design,construction or operational costs. Inaddition, the division aims to identify anddevelop opportunities in producing andproved or probable but undevelopedreserves.

4 Petrofac Annual report and accounts 2005
Chairman’s statement
I am delighted to report on a year of significantachievements for Petrofac and to present thefinancial results for the year ended31 December 2005.
These results demonstrate the growing position and reputation thatwe are building in our core markets. Over the past year, we haveincreased revenue by 56% to US$1,485 million and net profit by 64%to US$75.4 million.
Market overview 2005 was characterised by high commodity prices with Brentoil averaging nearly US$55 per barrel and Henry Hub Gas averageprice approaching US$9 per million British thermal unit (mmbtu),respectively over 40% and 50% above 2004 averages. Energy pricesremained volatile as OPEC’s surplus capacity averaged less than2 million barrels per day (bpd) for the third year running and a seriesof unrelated factors caused disruption to energy supplies across theworld.
Our industry faces the challenge of meeting the world’s increasingdemand for energy fuelled by good economic growth and from thestill relatively low energy intensive economies of China and the Indiansubcontinent. In addition, the industry is struggling with rising rates ofdepletion of existing production, particularly as the “super-major”fields in the Middle East reach their maturity. These twin challengeswill require a sustained period of increased capital investment in orderto bring on more production every year. It will not be easy to build agreater level of surplus capacity back into the world’s system, but weand others are committed to this effort.
As a company that designs, builds, operates and invests in oil & gasinfrastructure, Petrofac is very much involved in helping to addressthese challenges. While the increasing use of renewable energysources and greater energy conservation will both help to bring thesupply and demand for energy into balance, there remains a pressingneed to develop more oil & gas reserves every year. We are workinghard to help our clients meet this need and we enter 2006 with arecord backlog of approximately US$3.2 billion. We are well placed totake advantage of new opportunities as they arise over the comingyear.

DividendThe Board is recommending a final dividend of 1.87 cents perordinary share with an equivalent of 1.07 pence per ordinary sharebeing payable which, if approved, will be paid on 31 May 2006 toeligible shareholders on the register at 28 April 2006. This proposedfinal dividend reflects the fact that the Company was listed forapproximately three months of the 2005 financial year and isapproximately half the level that would have been declared hadPetrofac been listed for the whole of the 2005 financial year, havingtaken account of the intention to pay two-thirds of the annualdividend as a final dividend.
Admission to the London Stock ExchangePetrofac’s admission to listing on the London Stock Exchange was amajor highlight of our year. Due to the strength and depthof the executive management team, this major exercise had nodiscernible impact on our operational performance during the year.The institutional marketing, which represented almost 50% of theCompany’s shares, was well received by the market and, since listing,our share price has performed well. The Company was admitted intothe FTSE 250 index in December 2005. On behalf of the Board, Iwould like to welcome all of our new shareholders into Petrofac.
Our peopleAfter four years with the group, during which time he played a key rolein establishing our Woking based engineering business, Dr MikeStacey stepped down from the Board and retired from the Company.I would like to thank him for his contribution and wish him a happyretirement. Also, immediately prior to the Company’s admission to theLondon Stock Exchange, Amjad Bseisu and Robin Pinchbeck left theBoard although they both continue in their roles as Divisional ChiefExecutives. Kjell Almskog and I joined the Board during the year.
As a provider of facilities solutions to the oil & gas production andprocessing industry, the Company’s greatest resource is its people.This has been an exceptional year, both for the Company’s businessperformance and its corporate development and, on behalf of theBoard, I would like to thank all of our employees for the tremendousway they have responded to the challenges of 2005.
Corporate governance As Chairman of the Board, I am very conscious that one of myprincipal objectives is to ensure that the Board fulfils its obligations toshareholders and stakeholders without stifling the Company’sentrepreneurial spirit. The Board has an important duty to ensuregood governance, and I believe that this effort will aid our growthstrategy and help to maximise long term value for our shareholders.As part of our role, my directors and I will test the Company’sstrategic direction, monitor its operations in pursuit of that strategyand seek to ensure that Petrofac’s activities are consistent with ourstated values and deliver superior shareholder returns.
I look forward with confidence to another challenging and excitingyear ahead.
Rodney ChaseChairman
Annual report and accounts 2005 Petrofac 5
88%Earnings per share (diluted)
1.87centsFinal dividend per ordinary share

6 Petrofac Annual report and accounts 2005
1 Excluding consolidation and elimination adjustments.
Group Chief Executive’s review
2005 was an exciting and eventful year for Petrofacand one in which considerable progress was madetowards our goal of becoming the leading facilitiessolutions provider to the oil & gas industry.
During the year, we secured a number of large and strategicallyimportant projects, extended the scope and duration of contractswith some of our core customers and, in October, completedPetrofac’s Initial Public Offering (IPO) on the London Stock Exchange.By working in partnership with the owners of oil & gas reserves andinfrastructure, providing innovative and cost-efficient projectdevelopment, engineering, construction and facilities operation,maintenance and training services, we aim to create value across allaspects of an asset’s development.
I am pleased to be able to report a strong set of financial results forthe year ended 31 December 2005. Group revenue increased by56.1% to US$1,485.5 million (2004: US$951.5 million) reflectingsignificant growth in our Engineering & Construction and OperationsServices divisions. EBITDA increased by 20.3% to US$115.6 million(2004: US$96.1 million). Our Engineering & Construction divisionaccounted for 51.4% (2004: 43.9%) of group EBITDA, OperationsServices 22.2% (2004: 22.2%) and Resources 26.4% (2004:33.9%)1. Net profit attributable to Petrofac Limited shareholders onthe group’s continuing business activities increased by 63.6% toUS$75.4 million (2004: US$46.1 million).
At the close of 2005, the combined backlog of the Engineering &Construction and Operations Services divisions was approximatelyUS$3,244 million (2004: US$1,740 million), representing a year-on-year increase of 86%.
We have sought to ensure that our Engineering & Constructionbusiness is positioned where there are significant medium and long-term programmes for investment expenditure, in particular the MiddleEast, the Former Soviet Union and Africa. The scale of thehydrocarbon resources in these areas is substantial and there isconsiderable commitment on the part of both the international andnational oil companies to develop these assets. Through positioningat an early stage in these developments and executing to the higheststandard, there are good prospects for sustained growth and, withthe operational expenditure that should follow, the opportunity toprovide operations management and support and training services.
Our Operations Services business has performed well this yearwith considerable activity in its core market of the UK ContinentalShelf (UKCS). Our longstanding presence in the UK hasdemonstrated our operations services and training capability in a verydiscerning and demanding market. We have successfully expandedinto Kuwait, Iran and Sudan, and look forward to continuing thisgrowth by leveraging the international network of our Engineering &Construction and Resources divisions.

Annual report and accounts 2005 Petrofac 7
A key area of focus across much of our business is the needto increase the use of local resources and improve the technical skillsof national workforces, thereby ensuring our clients achieve their localcontent goals. In this regard, Petrofac has two key differentiators – wehave considerable experience of working with the leading localsubcontractors in our core markets and we have a leading presenceand focus on providing health, safety and operational trainingservices. With a diverse mix of nationalities and cultures within ourown business, we are well placed to deliver international competenceto our clients with local capability.
Our Resources business made a strong contribution to the financialperformance of the group and its existing investments and projectsunder development continued to meet our expectations. While wecontinue to see competition for asset investments, we are confidentthat our strong service platform will continue to provide attractive anddifferentiated investment opportunities where, alongside our partners,we are able to leverage our engineering and operational skills andunlock an enhanced return.
Overall, Petrofac has had another very successful year. Inacknowledging these achievements, I would like to extend my thanksto all our employees for their dedication, hard work and commitment.We enter the current year with a record backlog and I am confidentthat our strategy will deliver sustainable growth in value in 2006 andbeyond.
OutlookAfter an extended period of relative under-investment by the oil & gasindustry and with increasing demand for energy and rising rates ofdepletion of existing production, we believe the capital investment,both brownfield and greenfield, necessary to enable the industry tobuild the required capacity is substantial and will continue over anumber of years.
Each of our three divisions achieved a strong financial performance in2005 and, on entering 2006 with record backlog, the group is wellpositioned to deliver further growth.
Our Engineering & Construction division finished 2005 with backlogof approximately US$2.1 billion, of which approximately US$1 billionwas awarded as recently as December 2005. With good progresshaving been made on those contracts that were in an early phase ofexecution during much of 2005 and on contracts that are enteringtheir final stages, in the absence of unforeseen circumstances andsubject to the scale and timing of further contract awards, thedirectors expect to see some positive progression in profit margins inthis division during the year ahead.
Our Operations Services division secured a number of significantcontract renewals, extensions and wins during 2005 and revenueincreased significantly as a result. At 31 December 2005, the backlogfor the division was approximately US$1.1 billion with a furtherUS$0.3 billion in new awards which, at that time, remained subject tofinal contract. Revenue for the current year should benefit from a fullyear’s impact from the new business secured during 2005. Thedirectors expect that, in the absence of unforeseen circumstances,the division’s profit margins will be maintained in the year ahead.
The Ohanet investment continued to dominate the financialcontribution from our Resources division’s investment portfolio and isexpected to produce relatively stable revenues and cash flowsthroughout the year. We expect our investment in the Cendor field tocommence production in late 2006, which is anticipated to result inincreased revenues and profitability for the division in accordancewith the terms of the Cendor production sharing contract.
We are well placed to address the execution challenges and resourceconstraints that accompany a buoyant market and, with the strengthand breadth of our service offering and strategic positioning, tocapitalise on the many opportunities it offers. Against this backdrop,and with the significant increase in backlog, we are well positioned forcontinued growth during the current year and beyond.
Ayman AsfariGroup Chief Executive
56%Revenue
20%EBITDA
64%Net profit
86%Backlog

Petrofac’s success in securing business inKuwait reflects its ‘focus on regions withmajor hydrocarbon reserves wheresignificant capital and operationalexpenditures are expected’ as Kuwait isforecasting to spend more thanUS$40 billion over the next few years toupgrade and modernise its oil facilities.
In addition, Petrofac’s commitment toensuring that 25% of the maintenancecontract workforce will be comprised ofKuwaiti nationals by 2010 underscores thegroup’s ability to ‘assist customers inachieving their local content goals’.
Demonstrating strategy in action
The contract awards by KOC involve boththe Engineering & Construction andOperations Services divisions. TheEngineering & Construction contractinvolves upgrade work to a number ofKOC’s facilities including seven oil-gathering stations and two gas boosterstations. The Operations Services divisionis providing full maintenance services for oilproduction facilities in the North and Westof Kuwait. This is the first contract of itstype in Kuwait.
The two contracts build on a relationshipthat Petrofac has had with KOC since2000. Engineering & Construction’supgrade contract involves increasingproduction capacity and safetyimprovements which are critical to KOC’sfuture operations. In addition, PetrofacOperations Services will provide integratedmaintenance management and fullmaintenance services with the objective ofimproving equipment availability byproviding cost effective maintenance andassociated technical support.
Kuwait Oil Company (KOC)
In early 2005, Petrofac securedtwo important contracts in Kuwaitenabling the group to play anincreasingly significant role in thecountry’s plans to upgrade its oilproduction and export facilities.
8 Petrofac Annual report and accounts 2005

800mUS$ value of contracts awardedto Petrofac by KOC in 2005
5,000number of staff expected towork on E&C upgrade projectat its peak
25%of workforce to be Kuwaitinationals by 2010
Annual report and accounts 2005 Petrofac 9
4mbarrels per day of anticipatedoutput capacity in Kuwait by2020

Engineering & Construction enjoyed a year ofsubstantial growth, successful project execution anda record level of new orders.
Our staff numbers increased by one-third in 2005 to approximately2,400 personnel, with the majority of this growth in our Mumbai andWoking offices, where we have now achieved critical mass to carryout large-scale projects. Our Woking office has broadened its serviceoffering to include project management contracts (PMC) and,selectively, brownfield and greenfield engineering, procurement andconstruction (EPC) execution. Our Mumbai office now offers a trulyworld-class engineering capability that we expect to continue to growthrough 2006.
While there is increasing competition for experienced engineers in oursector, we strive to ensure that we attract and retain the best talentand reward and incentivise our employees appropriately whilemaintaining a competitive cost structure. In addition, Petrofac hascontinued its focus on graduate recruitment with great success.There is no doubt that the future of our business growth and furthersuccess will depend on successfully attracting first-rate, motivatedyoung engineers.
In terms of project execution, there were a number of highlightsduring 2005. These included the completion of the BTC pipeline andpumping stations in Georgia and Azerbaijan; entering the final stages,ahead of schedule, of engineering and procurement for the threeprocess plants for the Kashagan Field Development project inKazakhstan; the mechanical completion of the Crescent Gas Plant inthe UAE; and entering the final phase of a major upgrade project forQatar Petroleum. These achievements have been accomplishedwhile maintaining a good HSE record.
New order intake during the year was in excess of US$2.1 billion(2004: US$0.7 billion), with major awards in Oman, Kuwait, Russiaand Kazakhstan, and smaller awards in the UKCS, Africa and theUAE. In addition to a buoyant market that is yielding significantopportunities, our success in securing new business has beenachieved through Petrofac’s reputation for execution excellence. Ourfocus on Project Development Services has achieved strong growthduring the year, underpinned by the award of several PMC typecontracts and a larger flow of consultancy work and studies. It ispleasing to note that these recent successes have createdopportunities for major contracts in our Operations Services divisionfor both Facilities Management and Training services.
The Engineering & Construction division’s strategic focus is oncustomers and regions that will create a platform for sustainedgrowth through significant medium and long-term investmentprogrammes. In particular, we are well placed for future phases andexpansion opportunities on our current projects in Oman and thenorth Caspian region. The challenges ahead remain in finding anddeveloping the resources required to support growth.
The outlook in our core regional markets of the UKCS, Middle East,Africa and Former Soviet Union is expected to remain positivethrough 2006. Our main focus will be to maintain our track record ofsafe, high quality and cost effective project development andexecution and continue to meet our customers’ expectations.
Maroun Semaan
Chief ExecutiveEngineering & Construction
Operating review
Engineering & Construction
10 Petrofac Annual report and accounts 2005
81%Revenue
66%Net profit
187%Backlog

From its three principal operating centres – Sharjah (UAE), Mumbai(India), and Woking (UK) – Petrofac’s Engineering & Constructiondivision provides both ‘front-end’ services during projectdevelopment (Project Development Services) and projectimplementation capability by way of comprehensive engineering,procurement and construction contracting services (EPC Services).
Project Development Services cover concept, feasibility andcommerciality studies together with a full front-end engineering anddesign (FEED) capability. This capability includes feasibility andplanning, consultancy, design and engineering, project services andcost estimating.
EPC Services encompass the detailed engineering, procurement,construction, commissioning and start-up phases of the projects.More specifically, EPC Services include extended basic and detailedengineering, procurement, inspection, testing, expediting, transportand clearance of equipment and materials, installation andconstruction on site, pre-commissioning, commissioning,performance testing and start-up services and full projectdocumentation.
The division’s geographic focus is in areas where there is expected tobe sustained high levels of capital investment over the medium tolong-term, predominantly the Middle East, Africa, and the FormerSoviet Union. The division will also continue to focus on the mature,but core, market of the UKCS.
During 2005, the Engineering & Construction division undertook workin countries including Kazakhstan, Qatar, UAE, Kuwait, Azerbaijan,Georgia, Iran, Oman, Russia and the UK.
A number of new EPC Services projects were awarded andcommenced during 2005:
In late 2005, Petrofac secured a large lump-sum turnkey project withthe award of a contract by PDO for the second phase of the HarweelCluster Development in southern Oman. The contract, worth close toUS$1 billion, will be executed over three years.
The scope of the contract includes a new oil & gas processingstation, associated facilities with a capacity of 10,000 cubic metresper day (m3/d) of oil production, facilities for 5 million m3/d gasinjection into the Zalzala oilfield and modifications to the existingHarweel processing station.
PDO has the option to extend the scope to cover an additional10 million m3/d gas injection facilities into the Sakhiya oilfield,additional gathering facilities and expansion of the Harweel oilprocessing facilities to 20,000 m3/d.
During July 2005, Petrofac secured a contract with the Sultanate ofOman’s MOG to build a new gas plant in the Kauther field in northOman at a value over US$200 million. The Kauther field wasdiscovered by PDO in 2001 and is being developed and operated byPDO on behalf of MOG. The single-train plant will recover valuablegas and condensate reserves and will have a capacity of20 million m3/d.
Petrofac’s role in the project will draw on its capability from both theEngineering & Construction and Operations Services divisions, asPetrofac is responsible for engineering, procurement andconstruction and operating the plant for an initial one-year periodfollowing commissioning.
Both the Harweel and Kauther projects will be executed inconjunction with Petrofac’s long-term in-country construction partner,Galfar, a leading Omani engineering and construction company. Theaward of these contracts represents Petrofac’s return to Oman,where in 1994, the group successfully completed the North OmanCrude Stabilisation project for PDO with Galfar.
Following the successful upgrade of an oil gathering centre (GC-23)and the 2004 award for the replacement of the north Kuwait crude oilexport system, which at the end of 2005 was in its final stages, KOCand Petrofac have extended their relationship with the award of aUS$680 million facilities upgrade contract.
Under the contract, Petrofac is tasked with modernising facilities atnine locations, including seven oil gathering centres and two gasbooster stations. The project is key to KOC’s future operations, whichaim to improve the performance of the facilities and increase thestate-owned oil company’s oil production.
The two year contract will be executed through the division’s base inSharjah and a project office in Kuwait and is scheduled for completionin 2007.
Kuwait Oil Company (KOC), Facilities Upgrade, Kuwait
Ministry of Oil & Gas (MOG), Kauther Gas Plant, Oman
Petroleum Development Oman (PDO), Harweel ClusterDevelopment, Oman
Annual report and accounts 2005 Petrofac 11
12 Petrofac Annual report and accounts 2005
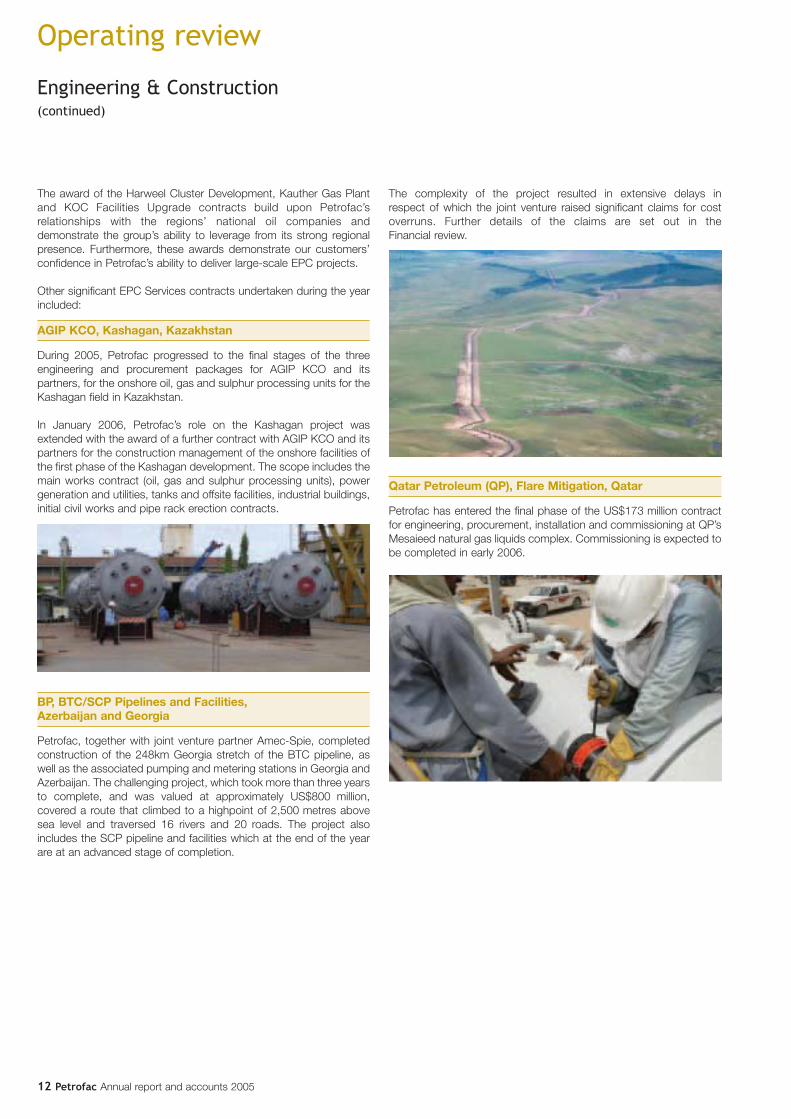
The award of the Harweel Cluster Development, Kauther Gas Plantand KOC Facilities Upgrade contracts build upon Petrofac’srelationships with the regions’ national oil companies anddemonstrate the group’s ability to leverage from its strong regionalpresence. Furthermore, these awards demonstrate our customers’confidence in Petrofac’s ability to deliver large-scale EPC projects.
Other significant EPC Services contracts undertaken during the yearincluded:
During 2005, Petrofac progressed to the final stages of the threeengineering and procurement packages for AGIP KCO and itspartners, for the onshore oil, gas and sulphur processing units for theKashagan field in Kazakhstan.
In January 2006, Petrofac’s role on the Kashagan project wasextended with the award of a further contract with AGIP KCO and itspartners for the construction management of the onshore facilities ofthe first phase of the Kashagan development. The scope includes themain works contract (oil, gas and sulphur processing units), powergeneration and utilities, tanks and offsite facilities, industrial buildings,initial civil works and pipe rack erection contracts.
Petrofac, together with joint venture partner Amec-Spie, completedconstruction of the 248km Georgia stretch of the BTC pipeline, aswell as the associated pumping and metering stations in Georgia andAzerbaijan. The challenging project, which took more than three yearsto complete, and was valued at approximately US$800 million,covered a route that climbed to a highpoint of 2,500 metres abovesea level and traversed 16 rivers and 20 roads. The project alsoincludes the SCP pipeline and facilities which at the end of the yearare at an advanced stage of completion.
The complexity of the project resulted in extensive delays inrespect of which the joint venture raised significant claims for costoverruns. Further details of the claims are set out in theFinancial review.
Petrofac has entered the final phase of the US$173 million contractfor engineering, procurement, installation and commissioning at QP’sMesaieed natural gas liquids complex. Commissioning is expected tobe completed in early 2006.
Qatar Petroleum (QP), Flare Mitigation, Qatar
BP, BTC/SCP Pipelines and Facilities,Azerbaijan and Georgia
AGIP KCO, Kashagan, Kazakhstan
Operating review
Engineering & Construction(continued)

Annual report and accounts 2005 Petrofac 13
In late 2005, Petrofac substantially completed the US$82 millioncontract for Crescent Petroleum in Sharjah, UAE on time and withinbudget. Petrofac provided engineering, procurement andconstruction services for the new gas processing facility on a17 month fast-track schedule. The plant includes an onshore gasreceiving and processing facility, two gas sweetening trains, a sulphurrecovery plant and associated utilities and infrastructure.
Key Project Development Services undertaken during 2005 included:
In late 2005, Petrofac was awarded a contract to carry out FEEDwork for both the onshore and offshore elements of BG Tunisia’sHasdrubal field development.
With conceptual and pre-FEED work for the offshore and onshorefacilities already completed by Petrofac from its Woking office, theplan is to develop the field with a normally unmanned installation andproduce hydrocarbons through a new multiphase export pipeline toonshore processing facilities that will be constructed adjacent to theexisting BG Tunisia Hannibal plant.
Once in operation the Hasdrubal onshore facilities will export gas tothe Tunisian gas grid and condensate to a storage facility along thecoast at La Skhira via a newly constructed pipeline. The facilities willalso produce separate liquid propane and butane products, makingthe very most of the value of the hydrocarbon fluids being extractedfrom the Hasdrubal field.
In September 2005, Petrofac and Lundin extended their relationshipwith the award of two further contracts for the development of theOudna field, located approximately 80km off the coast of northeastern Tunisia.
Petrofac is providing engineering, procurement and projectmanagement services during the drilling and facilities developmentphases which are scheduled to last until October 2006. In addition tomonitoring and reporting on all drilling-related project costs, Petrofacis also responsible for the engineering, procurement and projectmanagement of all subsea hardware and process, vessel andmooring system modifications required to convert the Ikdam floating,production, storage and offloading (FPSO) vessel and install it forservice on the Oudna field.
In 2004, Petrofac was awarded and completed a FEED study forRospan, a subsidiary of TNK-BP, in relation to their gas andcondensate field in Western Siberia. During 2005, further engineeringservices were provided in relation to safety and integrity upgrades forthe gas plant.
In December 2005, Petrofac was awarded two further contracts withsubsidiaries of TNK-BP. These contracts are in connection with thedevelopment of the Kovykta gas and condensate field in East Siberia.The contracts run for three years and are worth over US$60 million.
The first contract, awarded by RUSSIA Petroleum, will see Petrofacprovide project management services for the engineering,procurement and construction of new 7 million m3/d gas productionfacilities and condensate loading system. Under the second contract,with the East Siberian Gas Company, Petrofac will provide projectmanagement services for the design and construction of the maingas pipeline which will provide gas to local consumers in the Irkutskregion. The 645km pipeline will extend from the processing facilitiesat Kovykta to the region’s capital, Irkutsk, with first gas scheduled tobe delivered to consumers towards the end of 2006. The totalinvestment being made which is under Petrofac’s projectmanagement amounts to approximately US$1.1 billion.
TNK-BP, Kovykta Field Development, Russia
Lundin, Oudna Field Development, Tunisia
BG, Hasdrubal Field Development, Tunisia
Crescent Petroleum, Gas Processing Facility, Sharjah

The acquisition of Rubicon Responsedemonstrates Petrofac’s ongoingcommitment to ‘identify, acquire,integrate and develop complementarybusinesses’. In identifying the synergieswith this specialist emergency responseand crisis management provider, andthrough the subsequent acquisition,Petrofac enhanced its training andconsultancy capability, and has been able
to utilise the expertise of RubiconResponse to ‘maintain and improveupon existing high safety standards’within the group.
Rubicon Response is now fully integratedwithin Petrofac Training and is thespecialist emergency response and crisismanagement arm of the Petrofac group.
A key initiative has been the creation ofthe North Sea’s first integratedEmergency Response Service Centre(ERSC) in Aberdeen, Scotland,underpinning the importance that thegroup places on safety and the proactiveapproach it takes in order to addresssafety issues in the oil & gas industry.
Demonstrating strategy in action
14 Petrofac Annual report and accounts 2005

A division of Petrofac Training, RubiconResponse has since pioneered thedevelopment of the North Sea’s firstintegrated Emergency Response ServiceCentre (ERSC), providing multiple operatorswith access to a dedicated professionalemergency management service.
The strategic location of the facility enablesthe team from Rubicon Response to workclosely with the emergency services, industryregulators and other agencies to provide anefficient and swift response service.
The facility is held at a constant state ofreadiness, allowing response to any typeof incident at any time. Out of hours it couldnormally take 40 – 60 minutes to mobilisean emergency response team, but with a24/7 operation, the on-duty EmergencyResponse Operator ensures that the ERSCresponds immediately.
Rubicon Response
Petrofac enhanced its training andconsultancy capability with theacquisition of emergency responseand crisis management specialist,Rubicon Response in January 2005.
1integrated Emergency ResponseService Centre co-located withthe Marine Coastguard Agencyand Oil Spill Response services
250responders trained to usethe facility
24/7operation with a constant stateof readiness
35assets in the North Sea canbe supported
Annual report and accounts 2005 Petrofac 15

16 Petrofac Annual report and accounts 2005
Operations Services had a successful 2005, aidedby a buoyant core market, the UKCS, driven bysustained high oil prices.
Overall, key contracts were renewed, competence was extended,both organically and through acquisition, major projects weremobilised and significant new business was secured. All of theseachievements were accomplished while maintaining high safetystandards.
Key contract renewals included five year operations support contractswith ExxonMobil and CNR, a two year extension to our trainingmanagement solutions contract for Shell, and one year extensions withMaersk Oil for the Gryphon, Janice and Global Producer III installationoperations support contract and with Sea Production for the dutyholder contract on Talisman Energy’s Galley field.
A number of significant new contract awards were secured during theyear including the five year Marathon engineering, construction,operations and maintenance contract won in competitive tender andnow being delivered in conjunction with our Engineering &Construction division. We also extended our relationship with TullowOil, taking responsibility for the Schooner & Ketch and Horne & Wrenfacilities.
The year also saw excellent progress in project execution. Wesuccessfully mobilised two major projects, the Heather & Thistleservice operator contract for Lundin Petroleum and the
maintenance services contract for KOC in Kuwait, our largestinternational contract so far. These projects demonstrate Petrofac’sability to mobilise rapidly and to execute large-scale operations andmaintenance projects, both in the UK and internationally, at a timewhen the industry is facing a shortage of skilled people.
Sustained high oil prices had mixed effects on the business. Ourspecialist manpower services and survival training businesses sawparticular benefit from these economic conditions. However, the priceenvironment led to something of a hiatus in mature UK field assettrading. It has typically been in periods of increased asset tradingactivity that Petrofac has been able to secure service operatorcontracts with new entrant independent oil companies. During theyear, major oil companies largely postponed asset divestmentprogrammes due to improved economic viability and potentiallyreflecting a relative shortage of available reserve replacementopportunities.
During the year, we saw the ownership of two of our clients change.Paladin Resources was acquired by Talisman Energy andKerr-McGee’s UK oil & gas assets were acquired by Maersk Oil. Inboth cases, we continue to work on the same assets for the newowners, although, with regard to the Montrose & Arbroath facilities,now owned by Talisman Energy, in line with their establishedoperating strategy, we expect to transition duty holder responsibilityduring the course of this year. Such events require Petrofac to beagile and responsive to changing customers’ needs but they alsocreate opportunities to demonstrate our capabilities to newcustomers of scale.
Petrofac Facilities Management supported national oil companies(NOCs) and their subsidiaries, directly and in consortia, in Iran,Sudan, and Kuwait, while Petrofac Training continued to expand andservice our target markets of NOCs, major oil companies andindependents.
Petrofac Training acquired Rubicon Response, a specialist provider ofemergency response and crisis management solutions, in January2005. This acquisition positioned Petrofac as a world leader in theprovision of this specialised capability and is an excellent fit with ouroverall service offering.
We are confident in the growth potential of our businesses as wecontinue to develop our capabilities and project them internationally.
Robin PinchbeckChief ExecutiveOperations Services
Operating review
Operations Services
38%Revenue
62%Net profit
25%Backlog1
1 on a constant currency basis

Annual report and accounts 2005 Petrofac 17
Petrofac Facilities ManagementPetrofac Facilities Management is focused on growing its operationalcoverage of assets in the UK sector of the North Sea and indeveloping operations support, maintenance and facilitiesmanagement opportunities worldwide.
EuropePetrofac Facilities Management works in the UKCS with globalintegrated oil companies and both large international and regionalindependents. Our customers include BP, ExxonMobil, Total, BG,BHP Billiton, Marathon, Maersk Oil, CNR, Talisman Energy, LundinPetroleum, Tullow Oil and Venture Production. In total, Petrofac eitheroperates or provides support services to more than thirty platforms inthe UK oil & gas sector operating on more than twenty fields withproduction of around 360,000 bpd of oil and approximately 72 millionm3/d of gas. This production level equates to approximately 810,000bpd of oil equivalent and represents around 25% of current UKproduction.
2005 was a successful year for major contract awards and renewals:
In January 2005, Petrofac secured its fifth life-of-field service operatorcontract in the UK with Lundin Petroleum. Lundin Petroleum’sHeather and Thistle assets were successfully transitioned by Petrofacin the second quarter of 2005. Petrofac is responsible, as facilitiesmanager and safety case duty holder, for the fields’ production andmaintenance operations on a life-of-field basis.
The award of this contract covers the provision of engineering,construction, operations and maintenance (ECOM) services for theBrae field (UKCS) and engineering and construction services for theCentral Africa Business unit (Equatorial Guinea and Gabon), over aninitial five year period.
The execution of this contract will bring together the skill sets from theEngineering & Construction and Operations Services divisionsof Petrofac.
Effective May 2005, Petrofac was awarded a five year contractextension with ExxonMobil. The extension is for the provision ofoffshore personnel to the Beryl Alpha and Bravo facilities, which havebeen supported by Petrofac since 1989.
Petrofac was awarded a contract with CNR to provide operationssupport services for four fixed installations in the UKCS comprisingthe Ninian and Murchison fields where Petrofac has provided servicessince the mid 1990s. CNR acquired the assets from Kerr-McGee andbecame operator of the fixed installations in December 2002. Thecontract, which has an estimated value of US$35 million, willcommence in early 2006, when Petrofac’s existing contract ends,with an initial term of five years but with the intent of continuing for thelife of the assets.
CNR International (CNR), Maintenance andServices contract
ExxonMobil, Operations and Maintenance contract
Marathon, Engineering, Construction, Operationsand Maintenance contract
Lundin, Service Operator contract

18 Petrofac Annual report and accounts 2005
In late 2005, following its acquisition of Kerr-McGee’s UK assets,Maersk Oil awarded Petrofac an extension of the current operationssupport contract for the Gryphon, Janice, and Global Producer IIIassets. The extension of the original five year contract becameeffective in January 2006 and runs until late 2006.
In early 2005, Sea Production awarded Petrofac an extension worthan estimated US$26 million for the provision of operations serviceson board the Northern Producer to July 2006.
The Northern Producer, a floating production installation located onthe Talisman-operated Galley field, is managed by Petrofac on behalfof Sea Production. Petrofac acts as facilities manager (providingoperations and maintenance management) and safety case dutyholder. Petrofac is also responsible for the onshore and offshoreoperations team and provides facilities engineering support.
When the project started in 1998, it was forecast to have a lifespanof approximately four years. Seven years from first production, thefield has produced nearly 55 million barrels of oil.
During the year, Tullow Oil and Petrofac agreed to expand the scopeof their existing service operator relationship to include the Schooner& Ketch platforms and new Horne & Wren assets. These platformsare normally unmanned.
International2005 represented a year of both consolidation and expansion forPetrofac Facilities Management internationally. Contracts in Sudanand Iran ran their first full year, while the award of a five yearmaintenance contract with KOC provided the basis for significantgrowth.
Petrofac secured a US$125 million maintenance contract withKOC to deliver full maintenance services on the North and West areasin Kuwait.
The five year contract was the first performance-based fullmaintenance services contract within Kuwait to be awarded to aninternational contractor. Petrofac provide integrated maintenancemanagement and full maintenance services with the aim of improvingequipment availability by providing cost-effective maintenance andassociated technical support services.
The contract covers maintenance of 16 facilities comprising oilgathering centres, gas booster stations, gas steam and waterinjection plants, water gathering and pumping stations, gas andcrude oil pipelines and well heads. To facilitate the execution of thiscontract, Petrofac has established an in-country base includingoffice, workshop and warehouse facilities working with KharafiNational, a leading Kuwaiti contractor, to provide in-country support.
As part of Petrofac’s commitment to developing skills locally, by 2010,at least 25% of the workforce will be comprised of Kuwaiti nationals.
KOC, Maintenance Services contract
Tullow Oil, Service Operator contract scope extension
Sea Production, Operations and Maintenance contract
Maersk Oil, Operations and Maintenance contract
Operating review
Operations Services(continued)

Annual report and accounts 2005 Petrofac 19
Petrofac TrainingPetrofac Training is focused on providing specialist safety, operations,production and technical training services to the worldwide oil & gasindustry.
In January 2005, Petrofac Training expanded its capability throughthe acquisition of Rubicon Response, a specialist provider ofemergency response and crisis management solutions,headquartered in Aberdeen. Petrofac Training now houses tworespected training brands within its comprehensive portfolio ofoperations, production and technical training services – RubiconResponse and RGIT Montrose (which focuses on health and safetytraining in the UK). The latter performed well in 2005 with the marketfor offshore survival training being particularly buoyant. RubiconResponse, now fully integrated into Petrofac Training, serves clientsacross a wide range of geographies.
In early 2005, Petrofac Training successfully re-secured andexpanded an important existing contract with Shell to provide trainingmanagement solutions. The two year contract covers managementof training for Shell’s three key European operating centres in the UK,Holland and Norway. In late 2005, the contract was further extendedto cover Ireland. Internationally, Petrofac Training secured a three yearcontract to provide safety training, and a training managementsolution for BP in Sharjah.
In conjunction with joint venture partner TTE International, Petrofachas continued to provide training management, trainers and supportstaff to BP and third parties at the Caspian Technical Training Centrein Baku, Azerbaijan. The training centre, near Baku in Azerbaijan,aims to deliver a highly skilled, safe, efficient and motivated nationalworkforce to match the growing needs of the industry in the Caspianregion.
During the year, Petrofac provided training and consultancy servicesto many major oil companies, national oil companies and majorservice contractor clients in seventeen countries.
In addition to stand-alone opportunities, Petrofac Training is seeingan increasing number of joint opportunities with both the FacilitiesManagement and Engineering & Construction businesses, whoseown contracting activities can generate significant trainingopportunities.
The oil & gas industry faces a critical shortage of key technical andoperational skills across the spectrum of activities and acrossregions: in mature areas the problem is an ageing workforce, while innewer regions, such as the Caspian, the basic skills base still needsto be created. Petrofac Training is highly focused on the developmentof national workforces and is therefore presented with worldwideopportunities for growth.

Cendor – PM304
Petrofac’s three divisionscombine to provide innovativedevelopment solutions.
Demonstrating strategy in action
The stake in the undeveloped Cendor fieldin Block PM304 in offshore PeninsularMalaysia demonstrates Petrofac’s ability to‘improve revenue and earnings stabilitythrough a diversified and complementarybusiness model’.
The Resources team are supportedin the execution of this project bypersonnel from Petrofac’s two otherdivisions, Engineering & Construction andOperations Services, enabling the group to‘leverage customer relationships byproviding a range of services across thelife cycle of an asset’.
The Cendor field offshore PeninsularMalaysia in Block PM304 is beingdeveloped by a Petrofac-led jointoperating team with PetronasCarigali under a Production SharingContract (PSC).
Under the revenue-over-cost PSC,Petrofac bears 100% of the investmentcost and receives revenue from thedate of first oil to recover thatinvestment and also a profit element toyield an appropriate return on theinvestment made.
The Resources team has beensupported by staff from other divisionsof Petrofac with Engineering &Construction providing projectconstruction management and theOperations Services division managingfacilities and operations prior to first oil.
The field development plan for thisproject was formulated and approvedrapidly and an innovative technologicalsolution was developed to executethe plans.
The Cendor field had been undevelopeduntil Petrofac’s development solutionand focused approach were applied.
20 Petrofac Annual report and accounts 2005

30%the stake that Petrofac has inthe Cendor field in Block PM304
3partners in the development:Petronas Carigali, Kuwait ForeignPetroleum Exploration Companyand PetroVietnam InvestmentDevelopment Company
2006first oil expected in 2H
24.6mestimated barrels of proved reservesin Cendor PM304
Annual report and accounts 2005 Petrofac 21

22 Petrofac Annual report and accounts 2005
Petrofac Resources enjoyed another successful yearwith an increase in our business developmentcapability allowing access to a greater number ofopportunities.
In particular, we expanded our presence in Malaysia, bringing SouthEast Asia into our areas of core focus. Our existing investmentsperformed well during the year and we made good progress withthose that are under development. Furthermore, we expanded theinvestment portfolio with the acquisition of an interest in the West Donfield in the UKCS.
Our Upstream group aims to identify and develop opportunities inproducing and proved or probable but undeveloped reservesthrough, for example, participation in large onshore fielddevelopments, onshore and offshore field developments that majoroil companies may consider to be marginal, and late life producingassets, particularly those offshore. The investment in theundeveloped Cendor field offshore Peninsular Malaysia in BlockPM304 is an excellent example of this and, following approval of thefield development plan early in 2005, the year saw considerableactivity on this project with the establishment of the full project team.First production is currently scheduled for the second half of 2006.
In late 2005, we reached agreement to acquire Centrica’s interest inthe Hewett field. However, following the exercise of pre-emptionrights by the existing partners, this investment did not proceed. Whilethis was a disappointment, we continue to seek opportunities toachieve greater alignment with our partners. As announced in early2006, we completed the acquisition of an interest in the West Donfield, alongside FirstOil and Valiant Petroleum, and the fielddevelopment plan is currently being prepared. We also secured a50% interest in the adjoining block in the UK’s 23rd oil & gas licensinground.
The Energy Infrastructure Solutions group aims to identify anddevelop brownfield and greenfield opportunities in oil & gasmidstream and downstream infrastructure, for example, refineries,pipeline transmission, tolling process plants and utilities. Typically,these will be structured either as the direct acquisition of an asset orin a turnkey project development structure, including Build OperateTransfer (BOT), Build Own Operate Transfer (BOOT) and Build OwnOperate (BOO) development arrangements. During the year, weestablished an alliance with First Reserve, a US private equity firmspecialising in the energy industry. The alliance brings togetherFirst Reserve’s financing and transaction structuring expertise, withPetrofac’s project identification and assessment capabilities, particularlyin relation to assets and regions where our Engineering &Construction and Operations Services businesses have experience.
In addition to our development investments, our portfolio comprisestwo assets that have been cash flowing for some time; theoperational performance of the Ohanet gas field in Algeria during theyear was very satisfactory, with a 17% increase in production levelsover 2004, while in Kyrgyzstan, our refinery joint venture alsoperformed well through the year.
While we continue to see competition for asset investments, we areconfident that our experienced business development team and ourenhanced ability to assess and manage risk through accessing thewider group’s capabilities, should enable us to secure suitableinvestment opportunities.
Amjad BseisuChief ExecutiveResources
Operating review
Resources
3%Revenue
163%Net profit

Annual report and accounts 2005 Petrofac 23
Petrofac invests alongside its partners to add value through itsexpertise in Engineering & Construction or Operations Services.Petrofac’s optimised facilities solutions can facilitate project viability,manage project risks, and improve alignment. Petrofac also providesfacilities to customers on a fully-financed or BOT/BOOT/BOO basis.
Current investment portfolioPetrofac Resources’ investment portfolio currently comprisesinterests in the Ohanet gas redevelopment project in Algeria, blockPM304 of the Cendor field in offshore Peninsular Malaysia, the WestDon, Cragganmore and Elke fields in the UKCS and KyrgyzPetroleum Company, owner of the only operating refinery in theKyrgyz Republic.
Petrofac Resources’ largest investment is in the Ohanet project,Algeria. Petrofac, in joint venture with BHP Billiton (as joint ventureoperator), Japan Ohanet Oil & Gas Co, and Woodside Energy(Algeria), has invested in excess of US$100 million for a 10% share ina Risk Service Contract (RSC) with Sonatrach, Algeria’s national oilcompany. The US$1 billion Ohanet development is located in the Illiziprovince of Algeria, southeast of Algiers and close to the Libyanborder. Petrofac’s Engineering & Construction division carried out theEPC contract for the gas processing facilities at Ohanet in jointventure with ABB Lummus. The group’s Operations Services divisionwas also responsible for part of the on-site commissioning works.
First gas for export began flowing in late 2003. During 2005, Ohanetproduced, on average, approximately 15.5 million m3/d (2004: 13.5)of gas for export, approximately 28,008 bpd (2004: 23,900) ofcondensate and approximately 2,227 tonnes per day (2004: 1,800)of liquefied petroleum gas (151,700 bpd of oil equivalent; 2004:130,000).
Under the terms of the RSC, signed in July 2000, Petrofac and itsjoint venture partners receive a portion of the monthly liquidsproduction over a target eight year period, up to a defined return onthe investment. Should the defined return not be achieved withineight years, the period can be further extended by three years, and ifnecessary, a further one year. At Petrofac’s current base caseproduction profiles, and current oil price forecasts, it is unlikely thatthere will be an extension of the repayment period.
During 2004, Petrofac Resources acquired a 30% interest in theProduction Sharing Contract for the undeveloped Cendor fieldoffshore Peninsular Malaysia in Block PM304. Proven reserves areestimated at 24.6 million barrels of oil.
The field is being developed by a Petrofac-led, joint operating teamwith Petronas Carigali. Other field partners are Kuwait ForeignPetroleum Exploration Company and PetroVietnam InvestmentDevelopment Company.
During 2005, the field development plan (FDP) was submitted to, andapproved by, Petronas. In accordance with the FDP, contracts weresecured by competitive tender for a mobile operating production unit(MOPU) and a mobile operating drilling unit (MODU). The MOPU wassourced from the Gulf of Mexico, and arrived in Malaysia in December2005, where some additional engineering works were performed. TheMODU is available and on standby.
Kyrgyz Petroleum Company (KPC) is engaged in the production andrefining of crude oil and the marketing and sale of oil products in theKyrgyz Republic. KPC is jointly owned by Kyrgyzneftegaz, the state-owned oil & gas company, and Petrofac. Petrofac has managedKPC’s facilities and operations since 1998. KPC continues to be theonly integrated oil refiner and distributor of petroleum products in thecountry. The refinery is located in Jalalabat and is now capable ofprocessing all local crude oil production (up to 10,000 bpd). KPCemploys around 170 technical specialists and support personnelwho, after a major training programme, are now almost entirelyKyrgyz citizens.
During the year the refinery produced an average of 314 bpd ofgasoline (2004: 410), 657 bpd of diesel (2004: 554) and 731 bpd offuel oil (2004: 762). The steady supply of feedstock remains achallenge and was impacted in the later part of the year byrestrictions on the export of crude oil from Kazakhstan.
Kyrgyz Petroleum Company, Kyrgyz Republic
Cendor PM304, Malaysia
Ohanet, Algeria

24 Petrofac Annual report and accounts 2005
Petrofac Resources acquired a 5.58% interest in Block 9/28a Area Bin the UKCS in January 2004. The block contains the Crawford field,since renamed Cragganmore, which was originally produced byHamilton Oil and Gas (now BHP Billiton) using a converted semi-submersible production vessel. The field, with remaining oil in placeestimated to be in excess of 200 million barrels, was abandoned in1990 when oil prices were low and there were better opportunities touse the vessel elsewhere.
The field is being re-mapped using up-to-date data processing andinterpretation methods. A number of development options will beevaluated together with a prospect inventory of additional appraisaltargets. Petrofac’s involvement as operator is with a view to servicesbeing provided by the group’s Engineering & Construction divisionand ultimately by the Operations Services division.
Petrofac Resources hold a 100% interest in Block 28/3 in the UKCS,containing the Elke field. The field was discovered in 2002 by OMVand contains approximately 227 million barrels of heavyoil initially in place. However, due to the high viscosity of the oil, thefield remained undeveloped by OMV and its original partners.Developing an offshore field with high viscosity oil requires aninnovative development scheme and Petrofac is looking to drawon the expertise of its Engineering & Construction and OperationsServices divisions with a view to providing an economic FDP.If successful, the approach may have application to other offshoreheavy oil fields.
New business developmentDuring 2005, major bid submissions were made for projects inKuwait, Syria, Algeria, Nigeria and the UK, including joint bidsubmissions with Cal Dive International for mature offshore oil & gasproperties and proven undeveloped reserves in the UKCS. Othersignificant developments included:
Petrofac Resources acquired a 40% interest in Block 211/18a in theUKCS, containing 80% of the undeveloped West Don field. Petrofacacquired the field together with First Oil and Valiant, each with a 30%interest, from BP and ConocoPhillips. Petrofac Resources and Valiantboth secured a 50% interest in the adjoining Block 211/18c in theUnited Kingdom’s 23rd oil & gas licensing round. Petrofac and itspartners will draw on the expertise from the rest of the Petrofac groupto help successfully develop these interests.
First Reserve Petrofac Resources and First Reserve, a US private equity firmspecialising in the energy industry, entered into an alliance formidstream and downstream investment opportunities. The alliancewill target opportunities for investing in assets and regions wherePetrofac already has experience and expertise. The alliance will sharerisks and rewards and will allow Petrofac Resources to invest in largerscale projects. The alliance will benefit from synergies particularlywhere Petrofac provide Engineering & Construction and OperationsServices.
West Don, UKCS
Elke, UKCS
Cragganmore, UKCS
Operating review
Resources(continued)

Annual report and accounts 2005 Petrofac 25
2005 was an important year for the group.After months of intense activity and preparation,Petrofac was admitted to the Official List of theLondon Stock Exchange on 7 October following asuccessful IPO.
The IPO provided liquidity for our employee shareholders and afull exit for the 3i Group (3i), which, at the time, was our onlyinstitutional shareholder.
Our recent contract awards, particularly in the Engineering &Construction and Operations Services divisions, demonstrate ourcustomers’ confidence in our capability to undertake larger-scaleprojects and, as our business has grown, we have enhanced our riskmanagement systems and financial controls. Following theestablishment of our current divisional structure in 2004, weestablished new divisional boards during the year. These changeshave improved our management of resources and have affordedeach of our divisions an increased focus on strategy. The group’s riskreview process was further enhanced during the year with theestablishment of divisional risk review committees. These committeesprovide both an additional layer of review of major proposals,contracts and investments and, within a framework of delegatedauthorities, are the principal review body for opportunities which areconsidered lower risk.
We have continued to refine our management reporting systems andour business management systems. These improvements haveresulted in improved communication between our internationallocations and more efficient and robust processes. During the year,we also strengthened our information technology resources and weare in the process of reviewing our IT network infrastructure and theintegration of systems internationally.
In December, we were delighted that Petrofac achieved the milestoneof admission to the FTSE 250 index of the London Stock Exchange,capping a year of significant growth and corporate development forthe group.
Keith RobertsChief Financial Officer
Financial review

26 Petrofac Annual report and accounts 2005
Financial review(continued)
Economic environmentThe trend in increasing oil prices during 2004 extended throughout2005. Oil prices ranged from US$41 to US$67 per barrel, closing theyear at around US$58 per barrel. Prices continue to be driven by highglobal demand, particularly in emerging economies combined withlittle spare capacity in the supply chain.
Such economic conditions are forecast to continue, at least in themedium term, as reflected in market expectations of future oil prices.The combination of high oil prices and the need for oil companies tomaintain and improve reserve replacement ratios has resulted in theplanning of significant investment programmes in both upstreamactivities, as high oil prices increase profits from production andextend the viability of marginal assets, and in downstream activities,to ease current processing limitations and to keep pace with plannedfuture production levels. Such investment programmes are expectedto provide opportunities for all three of the group’s divisions.
Results for the year from continuing operations2005 2004
US$’000 US$’000
Revenue 1,485,472 951,530Operating profit
188,603 68,283
Net profit2 75,397 46,083EBITDA 115,634 96,0651 Profit from continuing operations before tax and finance costs.2 Attributable to Petrofac Limited shareholders.
Group revenue increased by 56.1% to US$1,485.5 million(2004: US$951.5 million) reflecting significant growth in theEngineering & Construction and Operations Services divisions. The Resources division reported slightly higher revenues from asimilar portfolio of investments to that held in 2004.
Operating profit increased from US$68.3 million in 2004 toUS$88.6 million in 2005, an increase of 29.8%, reflecting the stronggrowth in revenue within Engineering & Construction and OperationsServices. As a percentage of revenue, operating profit decreasedfrom 7.2% in 2004 to 6.0% in 2005, primarily reflecting the stage ofcompletion, and, therefore, timing of profit recognition, and risk profileof major projects executed by the Engineering & Construction divisionand the impact of US$6.3 million of one-off costs associated with theIPO. These dilutive factors were partially offset by a decrease indepreciation costs as a percentage of revenue and the cessation ofgoodwill amortisation.
Net profit attributable to the shareholders of Petrofac Limited on thegroup’s continuing business activities increased by 63.6% toUS$75.4 million (2004: US$46.1 million). Notwithstanding thedecrease in operating margin, the net margin increased from 4.8% in2004 to 5.1% in 2005. The increase in net margin was due primarilyto the group’s low effective tax rate in 2005 and a decrease in netfinance costs.
EBITDA increased to US$115.6 million (2004: US$96.1 million),representing 7.8% (2004: 10.1%) of revenue. The decrease inEBITDA margin was largely attributable to lower operating marginsfrom the Engineering & Construction division and the impact of one-off costs associated with the Company’s listing.
The significant growth experienced in 2005 by the Engineering &Construction and Operations Services divisions diluted the proportionof EBITDA provided by the Resources division relative to 2004,though in absolute terms its EBITDA contribution was marginallyhigher than in 2004. Taken as a percentage of EBITDA, excluding theeffect of consolidation and elimination adjustments, Engineering &Construction accounted for 51.4% (2004: 43.9%) of group EBITDA,Operations Services 22.2% (2004: 22.2%) and Resources 26.4%(2004: 33.9%).
At the close of 2005 the combined backlog of the Engineering &Construction and Operations Services divisions was approximatelyUS$3.2 billion (2004: US$1.7 billion), representing an increase of86.4% on the comparative figure at 31 December 2004.
Petrofac’s functional currency for financial reporting purposes is USdollars. However, there are a number of group subsidiaries with non-US dollar functional currencies. In particular, the group’s main tradingsubsidiaries with activities in the UK use Sterling as their functionalcurrency. During 2005, there was only a slight change in the averageUS$/Sterling exchange rate compared to 2004, and therefore theyear on year impact of currency fluctuation on the group’s UK tradingactivities was not significant. The table below sets out the averageand year end exchange rates for US dollar and Sterling for the yearsended 31 December 2005 and 2004 as used by Petrofac for itsfinancial reporting.
2005 2004US$/Sterling US$/Sterling
Average rate for the year 1.81 1.83Year end rate 1.72 1.93

Annual report and accounts 2005 Petrofac 27
Engineering & ConstructionThe Engineering & Construction division reported significant growth inrevenue, increasing to US$858.2 million (2004: US$473.5 million).The increase was largely attributable to the execution of projectssecured in 2004, including significant progress on the Kashaganengineering and procurement contract and substantial completion ofprojects for QP, Crescent Petroleum and KOC, and the completion ofthe BTC pipeline (with significant progress being made on the SCPpipeline).
Net profit increased by 66.4% to US$55.1 million (2004:US$33.1 million) representing a net margin of 6.4% (2004: 7.0%). Thereduction in net margin in 2005 was due primarily to a decrease inoperating margin:
• profit recognition on lump-sum contracts in the Engineering &Construction division is significantly impacted by the number andtiming of projects reaching completion during the year. Typically,profits are not recognised on such contracts in the early stagesof completion. It is therefore not unusual for profit recognition oncontracts to lag revenue recognition. In 2004 and 2005, anumber of projects reached completion toward the end of theyear, however, in 2005, early stage contracts generated a greaterproportion of revenue, with correspondingly lower recognition ofmargin; and,
• a large proportion of revenue in 2005 was generated by theKashagan engineering and procurement contract, which, since itdoes not involve construction management, was bid at a lowermargin than typical EPC contracts.
The dilution in margin due to the above factors was partially offset bythe following:
• the result for 2005 included a net credit of US$2.5 million andfollowed a favourable reassessment of the expected overall losson the BTC/SCP project. At 31 December 2005, the group hadcumulatively provided US$17.5 million in respect of its share ofthe loss in relation to this project (2004: US$20.0 million). Thereassessment reflects the current status of ongoing negotiationswith the customer regarding claims for reimbursement of costoverruns and associated costs; and,
• a decrease in depreciation costs as a percentage of revenue, alower effective tax rate and higher finance income.
The Engineering & Construction division’s backlog increased 187%from US$739 million at 31 December 2004, to US$2,121 million at31 December 2005, due to the significant order intake achieved in2005, particularly for contracts in Oman and Kuwait.
Operations ServicesIn 2005, the Operations Services division experienced strong growthwith revenue up 37.5% to US$605.3 million (2004: US$440.1 million).A large proportion of the growth was attributable to a new serviceoperator contract with Lundin Petroleum in the UK, which contributedsignificant revenues. Growth was also generated by the newbrownfield service offering, and, internationally, by thecommencement of the maintenance management contract withKOC. Additionally, RGIT Montrose contributed a full year’s revenue in2005 after its acquisition in February 2004, while Rubicon Response,which was acquired in January 2005, contributed US$3.8 million ofrevenue in 2005.
Operations Services’ net profit increased to US$15.6 million (2004:US$9.6 million). Net margin increased to 2.6% in 2005 (2004: 2.2%)due primarily to an increase in the operating margin and a lowereffective tax rate. Notwithstanding the dilution effect of increasedpass-through revenues, which resulted in the lower EBITDA margin,the operating margin increased to 4.2% (2004: 3.9%) due primarily tothe cessation of goodwill amortisation.
Segment performanceRevenue Operating profit Net profit EBITDA
US$’000 2005 2004 2005 2004 2005 2004 2005 2004
Engineering & Construction 858,206 473,466 52,592 33,524 55,063 33,100 63,540 41,880Operations Services 605,331 440,127 25,250 17,347 15,578 9,643 27,466 21,135Resources 46,331 45,042 18,495 17,164 18,321 6,953 32,594 32,289Consolidation & elimination1 (24,396) (7,105) (7,734) 248 (13,565) (3,613) (7,966) 761
Total 1,485,472 951,530 88,603 68,283 75,397 46,083 115,634 96,0651 2005 figures for operating profit, net profit and EBITDA include US$6.3 million of expenses relating to the IPO.
Revenue growth Operating margin Net margin EBITDA marginGrowth/margin analysis 2005 2004 2005 2004 2005 2004 2005 2004
Engineering & Construction 81.3% 38.1% 6.1% 7.1% 6.4% 7.0% 7.4% 8.8%Operations Services 37.5% 60.1% 4.2% 3.9% 2.6% 2.2% 4.5% 4.8%Resources 2.9% 211.9% 39.9% 38.1% 39.5% 15.4% 70.4% 71.7%
Total 56.1% 51.3% 6.0% 7.2% 5.1% 4.8% 7.8% 10.1%

28 Petrofac Annual report and accounts 2005
Backlog for the Operations Services division increased toUS$1,123 million at 31 December 2005 (2004: US$1,001 million). Asthe majority of backlog for the division related to Sterlingdenominated contracts, the US$/Sterling exchange rate had asignificant impact on the calculation of Operations Services backlogat the end of 2005 as compared to 2004. Eliminating the impact ofthe exchange rate movement, Operations Services’ backlogincreased 25% from 31 December 2004 to 31 December 2005reflecting a successful year of new contract wins and extensions. Inaddition, at the year end, the division was providing services underletters of award which, had formal contracts been entered into at thattime, would have added approximately US$0.3 billion to backlog at31 December 2005.
ResourcesRevenue for the Resources division increased marginally toUS$46.3 million (2004: US$45.0 million) reflecting the division’sportfolio of investments remaining largely as it was through 2004. Theincrease in revenue is primarily attributable to higher product pricesfor sales from the KPC refinery.
In 2005, net profit increased to US$18.3 million (2004:US$7.0 million) primarily reflecting the impact of an income tax creditof US$8.9 million from tax losses in Petrofac (Malaysia-PM304)Limited (the division’s investment in Cendor PM304) and a reductionin finance costs due to the repayment of project finance loans relatingto the Ohanet investment. The Resources division earned EBITDAand operating margins broadly comparable to 2004.
Discontinued operationsNet losses from the group’s discontinued operation in the US,Petrofac Inc, were US$0.8 million (2004: US$13.2 million).Operational activities in the US are now largely complete. The loss forthe year includes a small impairment provision against the operation’sremaining freehold property.
Interest and taxationNet interest payable on continuing operations decreased during theyear to US$5.3 million (2004: US$5.5 million) despite increases inLIBOR interest rates for both US dollar and Sterling denominatedborrowings. The reduction in net interest payable was largelyattributable to the group’s higher average cash balances, a reductionin borrowings relating to the Ohanet investment and the conversionof 3i’s loan notes.
The group had interest cover of 16.9 times (2004: 12.3 times) basedon profit from continuing operations. The significant improvement ininterest cover was attributable to an increase in operating profit andlower interest costs.
Interest coverUS$’000 (unless otherwise stated) 2005 2004
Operating profit from continuing operations (A) 88,603 68,283
Net interest cost (B) 5,255 5,547
Interest cover (A/B) 16.9 times 12.3 times
An analysis of the income tax charge is set out in note 6 to thegroup’s financial statements. The income tax charge on continuingoperations as a percentage of profit before tax in 2005 was 9.5%(2004: 26.6%). The tax rate in 2005 was affected by the followingfactors:
• the recognition of a tax credit of US$8.9 million from tax lossesin Petrofac (Malaysia-PM304) Limited within the Resourcesdivision following the approval of the company’s fielddevelopment plan for Cendor PM304 (2004: nil);
• the improved profitability in various projects resulting in theutilisation of US$3.1 million of tax losses brought forward thathad not been previously recognised as deferred tax assets(2004: nil), net of unrecognised tax losses of US$1.5 millionrelated to tax losses in various jurisdictions (2004:US$3.1 million); and,
• expenditure not allowable for tax purposes of US$2.3 million(2004 : US$0.2 million).
Adjusting for these factors, the underlying effective tax rate was19.3% for 2005 (2004: 21.4%), as set out in the table below:
Effective tax rateUS$’000 (unless otherwise stated) 2005 2005 2004 2004
Reported tax charge 7,951 9.5% 16,699 26.6%
Tax credit re Cendor PM304 8,943 10.7% – –
Net project tax losses utilised/(unrecognised) 1,538 1.9% (3,087) (4.9%)
Expenditure not allowable for tax purposes (2,328) (2.8%) (174) (0.3%)
16,104 19.3% 13,438 21.4%
Earnings per shareFully diluted earnings per share on continuing operations increased in2005 to 22.41 cents per share (2004: 11.93 cents per share, afteradjusting for the 40:1 share split), reflecting primarily the group’simproved profitability and, to a lesser extent, the lower weightedaverage number of shares outstanding.
Operating cash flow and liquidityThe net cash flow from all operating activities in 2005 wasUS$108.2 million (2004: US$80.9 million). On continuing operations,net cash flow from operating activities was US$108.9 millioncompared with US$89.8 million in 2004, representing 94.1% ofEBITDA (2004: 93.5%).
The significant cash generation from operations together with theconversion of the loan notes held by 3i prior to listing enabled thegroup to reduce its level of interest-bearing loans and borrowings toUS$106.9 million (2004: US$161.5 million) and restore a net cashposition.
Financial review(continued)

Annual report and accounts 2005 Petrofac 29
The group’s gross gearing ratio decreased to 54.8% at 31 December2005 (2004: 116.5%) reflecting the strong cash generation in 2005and the conversion of 3i’s loan notes. The group’s net cash at the endof 2005 compared with a 13.0% net gearing ratio at 31 December2004.
Gearing ratioUS$’000 (unless otherwise stated) 2005 2004
Interest-bearing loans and borrowings (A) 106,870 161,478
Cash and short term deposits (B) 208,896 143,534
Net cash/(debt) (C = B - A) 102,026 (17,944)
Total net assets (D) 195,127 138,558
Gross gearing ratio (A/D) 54.8% 116.5%
Net gearing ratio (C/D) Net cash position 13.0%
The group’s total gross borrowings before associated debtacquisition costs at the end of 2005 were US$108.3 million (2004:US$166.8 million), of which 49.5% was denominated in US dollars(2004: 65.9%), 44.7% was denominated in Sterling (2004: 34.1%)with the balance 5.8% denominated in Kuwaiti Dinars (2004: nil).
The group maintained a balanced borrowing profile with 28.3% ofborrowings maturing within one year, 56.1% maturing between oneand five years and the remaining 15.6% maturing in more than fiveyears (2004: 30.4%, 51.9% and 17.7% respectively). The borrowingsrepayable within one year include US$15.0 million of bank overdraftsand revolving credit facilities (representing 13.8% of total grossborrowings), which are expected to be renewed during 2006 in thenormal course of business (2004: US$19.0 million and 11.4% of totalgross borrowings).
The group’s policy is to hedge between 60% and 80% of variableinterest rate loans and borrowings. At 31 December 2005, 84.7% ofthe group’s term interest-bearing loans and borrowings were hedged(2004: 67.6%). The percentage hedged at the end of 2005 increasedabove the policy limit due to the conversion of 3i’s loan notes. Ananalysis of the derivative instruments used by the group to hedge thisexposure is contained in note 29 to the financial statements.
With the exception of Petrofac International Ltd, which undertakesthe majority of Petrofac’s lump-sum EPC contracts and which, underits existing banking covenants, is restricted from making upstreamcash payments in excess of 70% of its net profit in any one year, noneof the Company’s subsidiaries is subject to any material restrictionson their ability to transfer funds in the form of cash dividends, loansor advances to the Company.
Capital expenditureCapital expenditure on property, plant and equipment during 2005was US$17.6 million (2004: US$17.1 million). The main elements ofthe expenditure included investment in, and replacement of, vehiclesand equipment to support the growth in the Engineering &Construction and Operations Services divisions and Resources’investment in Cendor PM304 in Malaysia.
Shareholders’ equityTotal equity increased from US$138.6 million at 31 December 2004to US$195.1 million at 31 December 2005. The main elements of theincrease were the retained profits for the year, net of dividends paid,and the conversion of 3i’s loan notes to equity, partly offset by themovement in the group’s unrealised position on derivativeinstruments.
On 7 October 2005, the Company’s shares were admitted to theOfficial List and to trading on the London Stock Exchange, at whichtime the then “A” ordinary shares were reclassified as ordinary sharesand immediately following the reclassification, a 40:1 share split of allordinary shares then authorised was unconditionally approved. Ananalysis of the movements in share capital is set out in note 20 to thefinancial statements.
DividendsThe Company proposes a final dividend of 1.87 cents per share forthe year ended 31 December 2005. The level of the final dividendreflects the fact that the Company was listed for approximately threemonths of the 2005 financial year and is approximately half the levelthat would have been declared as a final dividend had Petrofac beenlisted for the whole of the 2005 financial year, having taken accountof the intention to pay two thirds of the full year dividend as a finaldividend. In September 2005, the Company paid a dividend of3.01 cents per share.

30 Petrofac Annual report and accounts 2005
The Board recognises that it must win and retain the support ofvarious constituencies in order to keep improving the group’sservices, thereby safeguarding the Company’s future success andsustainability. The Company believes that to maximise long-termshareholder value, it must take account of its shareholders,customers, employees and communities if it is to improve itsperformance and develop its reputation. The Company is currentlyreviewing the group’s Corporate Social Responsibility (CSR) policywith the aim of ensuring that all group activities are consistent withthese objectives wherever the location. This report outlines thegroup’s current activities. The Company believes that it demonstratesthat it has much to be proud of and that it has laid a solid foundationfor further CSR development.
Petrofac: the businessPetrofac employees are guided by the Company’s values – to besafe, ethical, innovative, cost-conscious, responsive to customersand focus relentlessly on delivering results. These values areembodied within a variety of practical policies and procedures thatgovern areas of our activity: health and safety; security; environmentand ethical business conduct. The group uses a system of riskmanagement to assess the impact of its activities on health, safety,security and the environment.
Health, safety and securityThe health, safety and security of everyone who works with us andfor us is critical to the success of our business. The health and safetyof the public and communities who may be affected by our businessactivities is also a priority to us. The Board has recently endorsed areview of the Company’s Health Management Programme in 2006. Inaddition, the Board has approved the development andimplementation of a group Security Policy including the introductionof revised security plans for each locality where the Company works.The Board will be monitoring progress on both these mattersthroughout 2006.
The Company has a well established group safety managementstrategy, which is part of the group’s business management system.Managers are accountable for ensuring that safety risks are properlyassessed and as far as possible mitigated. The Company placesgreat emphasis on training and ensuring that facilities are wellmaintained. Management closely monitor safety performancethrough the setting and monitoring of Key Performance Indicators(KPIs). The Board is regularly updated on matters relating to Safety.
During 2005, approximately 38 million man-hours were workedacross the group’s operations (2004: 40 million). During the year, thegroup experienced 107 Recordable Injuries (RIs) (2004: 109), a RIfrequency rate of 0.55 per 200,000 man-hours (2004: 0.55) and 13Lost Time Injuries (LTIs) (2004: 13), a LTI frequency rate of 0.07 per200,000 man-hours (2004: 0.07). This performance is comparablewith the best in the oil & gas industry and also within targets set at0.70 RI and 0.070 LTI for the group in 2005. The Board is pleasedthat the overall RI and LTI performance is being sustained despite thepotentially higher risks associated with the increase in the number ofnew operations started during the year. It is believed that the groupwide rollout of the programme, the eight Golden Rules of Safety,during 2005, has assisted in sustaining performance.
Despite meeting these important targets, the Board deeply regretsthere was an incident in July 2005, which resulted in a fatal injury toan employee of our joint venture with AMEC Spie on the BTC/SCPpipeline project in Georgia. The group immediately carried out aninvestigation in conjunction with AMEC Spie into the incident as aresult of which the joint venture made various proceduralimprovements in the way it works.
Petrofac peoplePetrofac is an international organisation and as such, the Companybelieves that its workforce, management and recruitment shouldreflect the diverse communities in which the group operates. TheCompany is committed to employing, training and developing localstaff and leaders in its operations across the globe. The Companyhas a policy of equal opportunity where decisions on recruitment,career development, promotion, training and reward are based solelyon an individual’s merit. The Company is committed to developing anopen and honest working environment where people are treated withrespect. The Company does not tolerate bullying or harassment inthe work place. Many Petrofac employees are shareholders, as theCompany has long encouraged employee share ownership throughthe operation of various schemes. The Company will continue tosupport employee share ownership and introduced three new shareincentive schemes at the time of listing.
The Company understands that it is vital to communicate with its staffespecially since they work in many locations around the world. TheCompany publishes a quarterly in-house magazine, Petrofacts, andhas developed a number of local intranet sites for employees. Inaddition, the Company relies on targeted e-mails, managementpresentations and team briefings. Petrofac believes that effectivecommunication facilitates employee awareness of the financial,economic, social and environmental factors affectingPetrofac’s performance.
03 04 05
0.05
0.07
0.07
Lost time injuries (per 200,000 man hours)
03 04 05
0.65
0.55
0.55
Recordable injuries (per 200,000 man hours)
Corporate social responsibility

Annual report and accounts 2005 Petrofac 31
The Company continues to emphasise the importance of doingbusiness ethically. The Standards of Business Conduct policy is keptunder regular review and communicated to the workforce. TheCompany has a clear anti-corruption policy, including a prohibition onbribes and other inducements and the making of unauthorisedfacilitation payments. If an employee is found to have acted in breachof this policy, the individual will be subject to disciplinary action whichmay result in dismissal.
The environmentPetrofac understands that it must give proper consideration toprotecting the environment. The Company seeks to balanceenvironmental concerns with operational objectives whereverpossible. The Board has recently approved the development andimplementation of a group environmental policy, which will result inthe introduction of environmental plans for all activities. Some parts ofthe Company have certified environmental management systems andthe Company has committed to working towards certification to ISO14001:1996 for all its business operations.
Society The Company is mindful of its responsibilities to the communities inwhich it operates. It tries to ensure that its relationships with non-governmental organisations (NGOs), customers, suppliers,communities and governments are founded on the basis of mutualrespect. Petrofac’s relationships last for many years, so it is essentialthat the Company understands the aspirations of those with whom itdoes business. The Company has decided that in its formalassessment regarding whether or not to undertake a particular pieceof business, it will in future formulate a specific community relationsstrategy for each major project taking account of the particular long-term local needs.
The Company places particular emphasis upon contributing to thecommunities in which it operates. In the UK, Petrofac’s CommunityInvolvement Group (CIG) provides support to a number of charities,groups and individuals. In 2005, CIG named Cornerstone CommunityCare as its charity of the year for the third year running and, throughfundraising activities, supported the charity in offering services andsupport to people with learning disabilities. CIG continued to providesupport to Kenny Herriot, a wheelchair athlete. Petrofac hassponsored Kenny since 2001 following an accident in 2000 that lefthim paralysed. In 2005, Petrofac helped Kenny to compete in majorcompetitions throughout the world.
In recognition of the essential role of arts and science in buildingquality of life, Petrofac continues to be a main sponsor of theAberdeen Youth Festival, which showcases the musical, dancing andacting talents of young people from around the world; and Techfest,a festival of science, technology and engineering in Aberdeen visitedby over 10,000 school pupils.
The group has recently decided to focus a number of its communitytargeted projects around education and training themes. Petrofachas a longstanding and nationally acclaimed education-industrypartnership with Kincorth Academy in Aberdeen. Not only has theCompany helped raise significant funding for the Academy but it hasprovided pupils with an insight into the oil & gas industry and thegeneral working environment through mentoring programmes andcareers evenings. In the Middle East, Petrofac has supported theAmerican Universities in Sharjah and Beirut. Funding provided byPetrofac has assisted their Engineering Faculties to invest in leadingedge technologies and to enhance standards of educationalexcellence. Maroun Semaan currently sits on the board of trustees ofthe American University in Sharjah. Petrofac has also madea significant donation to the Sharjah English School towardsthe construction of a new chemistry laboratory in the new secondaryschool.
The Company looks forward to expanding its support for education,learning and training as its geographical spread increases. Inparticular, the Company intends to replicate its Kincorth styleeducation-industry partnership with an academic institution in Indiathrough its Mumbai office.
The Company has a policy of not making political contributions.

32 Petrofac Annual report and accounts 2005
Board of directors
Group Chief Executive, Age 47.Ayman Asfari joined Petrofac in 1991to establish Petrofac International.
Ayman has 25 years’ experience in theoil & gas industry and served asChief Executive Officer of PetrofacInternational until his appointment asGroup Chief Executive of Petrofac Limitedin January 2002.
Ayman previously worked as the managingdirector of a major civil and mechanicalconstruction business based in Oman.
Ayman Asfari3
Chief Executive,Engineering & Construction, Age 50.Maroun Semaan joined Petrofac in 1991 toestablish Petrofac International.
From 1977 to 1991, Maroun held variousproject positions with ConsolidatedContractors International Co. (CCC), basedin the Middle East, where he was involved inthe management of oil and gas pipeline,process facilities and civil worksconstruction contracts in Oman andBahrain. He was appointed Chief Executiveof Petrofac Engineering & Construction inApril 2004.
Maroun Semaan
Chief Financial Officer, Age 49.Keith Roberts joined Petrofac in March 2002as Chief Financial Officer having spent mostof his working life as an investment bankerbased in the city of London. After positions incommercial banking with StandardChartered Bank and then with County Bank,the merchant banking subsidiary of NationalWestminster Bank, Keith moved intocorporate finance with Hawkpoint Partnerswhere he was a managing director and amember of the operating committee.
Keith has recently served as a non-executivedirector of The Peacock Group plc, steppingdown from the board at the time that thecompany was taken private.
Keith Roberts
Non-executive Chairman, Age 62.Rodney Chase was appointed non-executive Chairman of Petrofac on 21 June2005. Rodney spent 38 years at BP plc, ofwhich 11 were served on its board. He wasdeputy group CEO on his retirement from theBP group in May 2003. He also spent timeas CEO of the exploration and production,and marketing and refining divisions.
He is currently non-executive deputychairman of Tesco plc, non-executivedirector of Computer Sciences Corporation,non-executive director of Nalco Companyand senior adviser to Lehman Brothers.He has previously held positions as aboard member of BOC plc and Diageo plc.
Rodney Chase3

Annual report and accounts 2005 Petrofac 33
Non-executive Director, Age 65.Kjell Almskog was appointed to the PetrofacBoard in March 2005. After starting hisprofessional career in brand management,with Procter & Gamble, Kjell subsequentlyspent some 25 years in various seniorexecutive positions.
During 13 years in the ABB group, Kjellwas country manager in Norway while inparallel, developing a substantial andhighly successful international oil and gasactivity, ultimately becoming group executivevice-president and head of ABB Oil, Gas andPetrochemicals. In 1998, he moved toKvaerner as chief executive withresponsibility for executing a majorturnaround of that business until itsacquisition by Aker in 2001.
Presently, Kjell is senior adviser andnon-executive director of severalinternational companies, including: Orkla,a large listed Norwegian group involved inbranded consumer goods, chemicalsand financial investments and KITRONASA, a listed Norwegian group specialisingin electronics manufacturing. He is alsochairman of the Kverneland Group, aNorwegian listed international supplier ofagricultural machinery.
Kjell Almskog123
Non-executive Director, Age 63.Bernard de Combret was appointed to thePetrofac Board in November 2003. Bernardis an international consultant and wasdeputy chairman of TotalFinaElf’s executivecommittee until his retirement in 2002.
Following senior positions in both the FrenchMinistry of Foreign Affairs and Ministry ofFinance, he spent 24 years with Elf andsubsequently Total, and was heavily involvedin building the trading organisation. He alsoheld various senior executive positions,including CEO of refining marketing, CEO forgas and power and CEO for trading andshipping.
He is currently a director of AXA-RE andWinstar Resources Ltd, and a member of theinternational advisory board of BancoSantander. He has previously held positionsas a board member of Renault VI, CEPSAand Banco Central Hispano.
Bernard de Combret123
Senior Independent DirectorNon-executive Director, Age 58.Michael Press was appointed to the PetrofacBoard in April 2002, having previously heldsenior executive positions for the StandardOil Company Inc and BP and as a mainboard director of Amerada Hess. Between1997 and 2001, Michael held various postsat KBC Advanced Technologies includingnon-executive director, executive chairman,and chief executive.
He is currently also non-executive chairmanof SPS International, a supplier of downholetools and services used in wellbore clean-upand filtration, a director of ABARTA Inc andT3EnergyServices and a member of theadvisory board of Pharmadule Emtunga.
Michael Press123
1 Member of the Audit Committee2 Member of the Remuneration Committee3 Member of the Nominations Committee

34 Petrofac Annual report and accounts 2005
Provision Reason for non-compliance
The Company has recently introduced a “whistleblowing” policy andprocess, which the Committee will shortly review.
C3.4 The Audit Committee should review arrangements by whichstaff may raise concerns in confidence.
While the Company operated an Audit Committee throughout theyear, its terms of reference have been amended to ensure fullcompliance in 2006.
C3.2 Partial compliance with the role and responsibilities of theAudit Committee prior to listing.
The current Committee membership is compliant but from 1 January 2005 to 13 September 2005, an executive director of theCompany was a member of the Committee.
C3.1 The Audit Committee membership should consist of threeindependent non-executive directors.
The current Board has been in existence for less than a year and theCompany was only admitted to the London Stock Exchange on7 October 2005. The Board considered that carrying out appraisalsin 2005 would be premature. The Board will implement anevaluation programme in 2006.
A6.1 Annual performance evaluation of Board, Committees andindividual directors.
All the directors were appointed when the shares in the Companywere not listed so limited consideration was given to devising aformal, tailored induction programme. Prior to listing, all directorswere fully briefed on their responsibilities and henceforth the Boardwill ensure that it regularly reviews individual training needs in relationto business operations, legal responsibilities and investor relations.
A5.1 New directors receive a full, formal and tailored induction onjoining the Board, including offering major shareholders theopportunity to meet a new non-executive director.
Prior to listing, the Company did not have a standing NominationsCommittee. The Chairman was introduced to the Company by oneof the Company’s advisers.
A4.1 A Nominations Committee to be established and newdirectors to be recruited using an external search agency oropen advertisement.
The current Board is compliant but from 1 January 2005 to 13 September 2005, the Board was comprised of a majority ofexecutive directors.
A3.2 The Board should have a balance between non-executiveand executive directors.
The Company is incorporated in Jersey, where there is no formalcode relating to corporate governance. However, the Board iscommitted to the principles of corporate governance contained in the2003 Combined Code on Corporate Governance (the Code) annexedto the Listing Rules of the Financial Services Authority (FSA) and forwhich the Board is accountable to shareholders. The Code seeks toensure that the Company is run in a manner whereby the interests ofshareholders are protected and as such the Code sets out principlestogether with supporting principles and provisions which outline howthis may be achieved.
Statement about applying Principles of Good Governance The Company was admitted to the London Stock Exchange on7 October 2005. Although the Board has applied many of theprinciples of good governance for some time, the Board undertook areview of the Company’s governance in preparation for admission to
the London Stock Exchange, with the intention that all principlesshould be applied in future. The Company has applied the principlesof good governance set out in section 1 of the Code as reportedbelow and in the Directors’ Remuneration Report.
Statement of compliance with the Provisions ofGood GovernanceThe Company has complied with the majority of the provisions ofsection 1 of the Code following listing. Areas of non-compliance for2005 are identified in the following table, with the majority of suchmatters having arisen prior to the Company’s listing.
Areas of non-compliance with those provisions of the Code relatingto remuneration are outlined in the Remuneration Report.
Corporate governance report

Annual report and accounts 2005 Petrofac 35
Dialogue with shareholdersThe Board attaches great importance to dialogue with itsshareholders. The Chairman intends to maintain regular contact withmajor shareholders and ensure that the Board is apprised of theirviews. The Group Chief Executive and Chief Financial Officer alsomeet with major institutional shareholders and fund managers, andkeep the Board informed about their views through board reports andcopies of brokers’ notes. The Board takes the view that, by thesemeans, it receives a sufficiently frequent and clear impression of theviews of shareholders. Michael Press, as senior independent director,is available to discuss issues with shareholders. Prior to admission tothe London Stock Exchange, the Company appointed an individualto take responsibility for investor relations.
Interests in 3% or more of the issued share capital which have beennotified to the Company, in accordance with the Articles ofAssociation of the Company as at 1 March 2006 were as follows:
Number of Percentageordinary of allotted
shares share capital
Petrofac ESOP Trustees Limited 31,830,488 9.22%Alima Trust 21,355,157 6.19%
In addition to the shareholdings above, Ayman Asfari and his familyholds an interest in 69,282,114 shares through the Lamia Trustrepresenting 20.07% of issued share capital; and Maroun Semaanand his family holds an interest in 34,068,799 shares through theNola Trust representing 9.87% of issued share capital. PetrofacESOP Trustees Limited includes interests of directors and senioremployees as well as other employees.
The Company’s first annual general meeting as a public company willbe used as an opportunity to provide a review of the group’s progressduring the year and for shareholders to put questions to the directors.Details of proxy votes for and against each resolution will beannounced at the meeting.
Board of DirectorsThe Board currently comprises seven directors, made up of four non-executive and three executive directors. The non-executive directorsare all independent of management and contribute independentjudgement and extensive knowledge and experience to theproceedings of the Board. The executive directors are responsiblefor the management of the group’s activities. Michael Press is the seniorindependent director. The Chairman and Kjell Almskog were appointedto the Board during the year and Amjad Bseisu, Robin Pinchbeck andMike Stacey stepped down from the Board prior to listing.
Brief biographies of the directors appear on pages 32 and 33.Ayman Asfari, Keith Roberts and Maroun Semaan, being the longestserving directors, will offer themselves for election at this year’s annualgeneral meeting. Henceforth, all directors must submit themselves forelection at the annual general meeting following their appointment and,thereafter, for re-election at least once every three years.
During the year the Board met five times and the current intention isthat henceforth the Board should meet six times a year andadditionally as required.
The Board has adopted a schedule of matters reserved to itself fordecision, including, but not limited to, matters of a strategic nature;approval of the annual budget; approval of major acquisitions; majorchanges to the group’s capital structure; the recommendation ordeclaration of dividends; the entry into contracts which are materialstrategically or by reason of size; appointments to the Board;ensuring the maintenance of a sound system of internal controls;reviewing its own and its committees’ performance and reviewing thegroup’s overall corporate governance arrangements.
The Board receives appropriate and timely information frommanagement to enable it to perform its duties, including reports onoperating and financial issues at each board meeting.
The roles of the Chairman and Chief Executive are separate. Since hisappointment in June 2005, the Chairman has met with the other non-executive directors on a number of occasions without the executivedirectors present. It is the Board’s intention to undertake its firstformal evaluation of its performance and that of its committees andindividual directors in 2006. The Board will use the process to identifyany training needs of directors.
Directors have access to the advice and services of the Secretary tothe Board, who is responsible for ensuring that board procedures andapplicable rules and regulations are observed, and for advising theBoard on governance matters. The directors are entitled to takeindependent professional advice, at the Company’s expense,if necessary.

36 Petrofac Annual report and accounts 2005
Corporate governance report(continued)
The Board is assisted by various committees, principally the AuditCommittee, the Remuneration Committee and the NominationsCommittee. A summary of the work of the Audit Committee and theNominations Committee is set out below. The report of theRemuneration Committee is included in the Directors’ RemunerationReport on page 38. The Committees’ terms of reference are availableon the Company’s website. The minutes of meetings and/or reportsfrom the chairmen of the committees are made available to the Boardfor its scheduled meeting next following the committee meeting inquestion, or otherwise as soon as practicable thereafter.
Audit CommitteeThe Audit Committee is chaired by Bernard de Combret and alsocomprises Kjell Almskog and Michael Press. Kjell Almskog wasappointed during the year and Mike Stacey stepped down on hisresignation from the Board. Both Bernard de Combret and KjellAlmskog have recent and relevant financial experience. In 2005, theCommittee met four times. The Committee’s principal roles andresponsibilities include:
• monitoring the integrity of the Company’s financial statementsand its interim and preliminary announcements;
• reviewing the Company’s internal financial controls and riskmanagement system;
• monitoring and reviewing the effectiveness of the Company’sinternal audit function;
• reviewing the terms of engagement, objectivity andindependence of the external auditors and to recommend to theBoard of Directors their appointment, re-appointment orremoval;
• establishing and monitoring a policy on the engagement of theexternal auditors to supply non-audit services; and,
• reporting to the Board, identifying any matters in respect ofwhich it considers that action or other improvement is neededand making recommendations as to the steps to be taken.
Previously, the Audit Committee has tended to concentrate on themore traditional work of an audit committee; that is reviewing theauditors’ terms of engagement and the scope of audit work andassessing the Company’s financial statements. The Committee iscurrently considering how best to undertake a systematic review ofthe Company’s controls and risk management processes and isworking with the recently appointed Group Head of Internal Audit toestablish a suitable framework to achieve this. It is anticipated thatthe group internal audit function will be strengthened further duringthe course of 2006. Although the Company has previously takensteps to ensure that auditor independence is maintained when it hasappointed its external auditors to undertake non-audit work, theCommittee intends to adopt a formal policy in 2006 on theprocurement of non-audit work from the auditors. The Committee willmeet sufficiently often in 2006 in order to fulfil its responsibilities andin any event will meet no less than three times.
Attendance at Committee meetings is at the invitation of theChairman of the Committee. However, the Chief Financial Officer,Group Financial Controller, Group Head of Internal Audit and theexternal auditors will generally be invited to attend Committeemeetings. The Group Head of Internal Audit and the external auditorshave the right to speak directly to the Chairman of the Committee atany time and will be given the opportunity to meet the Committeewithout management present at least once a year.
Committees of the BoardAttendance by the directors at the meetings of the Board and its committees are summarised below:
Audit Remuneration NominationsBoard Committee Committee Committee1
Number of meetings held in 2005 5 4 4 0
Executive directorsAyman Asfari 5Keith Roberts 5Maroun Semaan 5Amjad Bseisu (resigned 13 September 2005) 4Robin Pinchbeck (resigned 13 September 2005) 3Mike Stacey (resigned 13 September 2005) 4 3 3
Non-executive directorsRodney Chase (appointed 21 June 2005) 3Kjell Almskog (appointed 25 March 2005) 4 3 3Bernard de Combret 5 4 4Michael Press 5 4 41 The Nominations Committee was only formed as a standing Committee following the Company’s listing.

Annual report and accounts 2005 Petrofac 37
Nominations CommitteeThe Nominations Committee was formed during the year and ischaired by Rodney Chase and also comprises Kjell Almskog, Bernardde Combret, Michael Press and Ayman Asfari. The Committee willmeet at least twice a year to review the structure of the Board and,as appropriate, consider candidates for appointment to the Board.Prior to the Committee’s formation, the Board created ad hocCommittees to consider issues, which would ordinarily fall within theremit of a Nominations Committee; one such Committee consideredthe appointments of Kjell Almskog and Rodney Chase. An externalsearch consultancy was appointed for the recruitment of KjellAlmskog. Rodney Chase was introduced to the Company by anadviser. The Board considered him to be an exceptionally qualifiedcandidate and saw no merit in undertaking a fullscale search process.
Audit and accountabilityThe Board acknowledges that it is responsible for the group’s systemof financial and operational controls and monitoring theireffectiveness. The group’s system of internal control is designed tomanage rather than eliminate the risk of failure to achieve businessobjectives, and can only provide reasonable and not absoluteassurance against material misstatement or loss.
An ongoing process has been established for identifying, evaluatingand managing the significant risks faced by the group, which hasbeen in place for the year under review and up to the date of thisAnnual Report. This process is regularly reviewed by the Board andis in accordance with the guidance provided by the TurnbullCommittee on internal control. The key elements of the internalcontrol system and the processes used by the Board to review theeffectiveness of the system are detailed below:
Control environmentThe group has a clear organisational structure for the control andmonitoring of its businesses, including defined lines of responsibilityand delegation of authority. The group has issued a group policy inrelation to standards of business conduct which includes provisionsto ensure that staff may raise ethical concerns in confidence.
Risk managementEach division is required to produce a risk matrix which identifies thekey business risks, the probability of those risks occurring, theirimpact if they do occur and the actions being taken in order tomanage those risks. The Board receives regular formal updates frommanagement on the key risks and the related controls in relation tothe group’s existing business and if appropriate, on potential newbusiness. Management also thoroughly considers risks associatedwith undertaking new business via divisional and group risk reviewcommittees.
AssurancesThe directors receive assurances from the following internal andexternal controls:
• historical financial performance and revised forecasts for the fullyear with significant variances are regularly reported bymanagement to the Board;
• reports from the Audit Committee;
• client audits;
• external audits including management letters from the group’sauditors;
• reports from the group health, safety, security, environment andquality function; and,
• reports from the Group Internal Audit function.
Going concernThe financial statements have been prepared on a going concernbasis since the directors have reasonable expectation that, firstly, theCompany’s and group’s activities are sustainable and, secondly, thatadequate resources are available to continue in operational existencefor the foreseeable future.

38 Petrofac Annual report and accounts 2005
This report has been prepared by the Remuneration Committee andhas been approved by the Board.
The Remuneration Committee (the Committee) met four times in2005 and henceforth will meet at least twice a year. The Committeeconsiders group wide incentive schemes and sets the policy for theremuneration of the Chairman, executive directors and first tier ofmanagement below the Board and furthermore determines theremuneration packages for the individuals concerned. The fees of thenon-executive directors other than the Chairman are a matter fordecision by the Chairman and the executive directors.
Good governance The Company has applied the principles of good governance set outin section 1 of the Code as reported below. The Company hascomplied with all the provisions of section 1 of the Code in 2005except for the following:
B2.1 The Committee membership should consist of threeindependent non-executive directors.
The current Committee membership is compliant but from 1 January2005 to 13 September 2005 an executive director of the Companywas a member of the Committee.
Composition of the Remuneration CommitteeThe Committee comprises Michael Press (Chairman), Kjell Almskogand Bernard de Combret. Michael Press and Bernard de Combretserved throughout the year and Kjell Almskog joined the Committeeafter his appointment to the Board. Mike Stacey stepped down fromthe Committee following his resignation from the Board. None of thedirectors has any personal interest in the matters to be decided (otherthan as shareholders of the Company), any potential conflict ofinterest arising out of cross-directorships or any day to dayinvolvement in the management of the group’s business activities.
At the invitation of the Chairman of the Committee, the Group ChiefExecutive attended meetings during the year in order to provideadvice on setting remuneration for other executive directors althoughhe attended no part of a meeting at which his own remuneration wasbeing discussed. In addition, the group’s Director of Legal andCommercial Affairs, Norton Rose, Watson Wyatt Limited and Deloitte& Touche LLP have provided advice to the Committee.
Remuneration policyThe Committee aims to establish a level of remuneration, which issufficient to attract, retain and motivate directors and key executivesof the calibre required to achieve the group’s objectives; and which,furthermore, reflects the size and complexity of the group’s businesstogether with an executive’s individual contribution and geographicallocation. In order to ensure that the range and level of emolumentsand incentive schemes are competitive in the market place, theCommittee takes advice from independent external bodies on theremuneration policies of companies whose turnover and/or businessactivities are similar to those of the group. Reviews of theremuneration policy are carried out regularly.
The components of executive directors’ remuneration packagesinclude:
• basic salary, cash allowances and non-cash benefits;
• annual cash bonus payments; and,
• awards of shares under the Company’s Deferred Bonus SharePlan and Performance Share Plan.
Executive directors are entitled to accept up to one non-executivedirectorship outside and unconnected to the group provided priorpermission is sought from the Board. Any fees earned from such anappointment are retained by the director.
Basic salary, cash allowances and non-cash benefitsBasic salaryOrdinarily, the Committee determines an executive director’s basicsalary at the beginning of each year. During 2005, the Committeeundertook an additional mid-year review of executive directors’overall remuneration in order to ensure that the directors’ respectivepackages were appropriate, particularly in view of the Company’santicipated admission to listing on the London Stock Exchange. TheCommittee took advice from Watson Wyatt Limited and Deloitte &Touche LLP on this matter. In determining levels of overallremuneration, the Committee seeks to ensure that a significant partof the total package is dependent upon group and individualperformance.
Cash allowancesIn addition to basic salary, UK resident executive directors receive acash allowance in place of benefits including, but not limited to,pension contributions and car allowances. In addition to basic salary,UAE resident executive directors are required by local statute toreceive an end of service indemnity and the Company accordinglyaccrues an amount each year with the intention that a cash sum bepaid to the director on the termination of his employment within theUAE.
Non-cash benefitsAll executive directors receive certain benefits-in-kind. UK residentexecutive directors currently receive private health insurance, lifeassurance and long-term disability insurance. Maroun Semaan andRobin Pinchbeck, who are resident in the UAE, receive similarbenefits as well as other benefits typical for expatriate seniorexecutives such as car, housing and education allowances.
Annual cash bonus paymentsThe Committee considers whether or not to award each executivedirector an annual cash bonus for the previous year in the first quarterof each year. In its deliberations, the Committee considers twoprincipal elements in determining a director’s cash bonus:
• first, the extent to which the group’s financial performance, and,as appropriate, the business division for which the individualdirector is primarily responsible, have achieved annuallyestablished budgets and targets; and,
• second, to what extent the individual has met personalobjectives, which are agreed at the start of each year in questionand which are established with the aim of achieving the group’sbusiness strategy.
Directors’ remuneration report

Annual report and accounts 2005 Petrofac 39
In 2005, the Committee set the maximum cash bonus potential at100% of basic annual salary for achievement of corporate andpersonal targets but retained the ability to increase this to 150% ofbasic annual salary in exceptional circumstances. Actual bonuses forthe year are disclosed in the table set out on page 40, and taken inconjunction with awards to directors under the Company’s DeferredBonus Share Plan and Performance Share Plan, reflect theRemuneration Committee’s assessment of each director’sachievement of his objectives in 2005 and their contribution to thegroup’s performance in the period. Details of awards to directorsunder the Company’s share incentive schemes are outlined onpages 40 and 41 of this Report.
Awards of sharesThe Committee took advice from the Director of Group Legal andCommercial Affairs, Watson Wyatt Limited, Deloitte & Touche LLP,Norton Rose and Ogier in connection with the establishment of theCompany’s current share incentive schemes.
Deferred Bonus Share Plan (DBSP)The DBSP was established upon listing. Executive directors andselected employees are eligible to participate in the DBSP.Participants may be invited to elect or in some cases, be required, toreceive a proportion of any bonus in ordinary shares of the Company.These shares are called “Invested Shares” and are comprised in“Invested Awards”. Following such award, the Company will generallygrant the participant an additional award over a number of sharesbearing a specified ratio to the number of his or her invested sharesand these shares are called “Matching Shares” and are comprised in“Matching Awards”. Awards will generally vest three years after grantand, subject to a limited number of exceptions, provided theparticipant does not leave the Company’s employment. TheCommittee has determined that any participation of executivedirectors in the DBSP should not include Matching Awards as suchawards do not contain performance conditions.
Performance Share Plan (PSP)The PSP was established upon listing. Executive directors and arestricted number of other senior executives may receiveperformance related share awards on an annual basis. Participantsare granted contingent awards to receive ordinary shares in theCompany which will in normal circumstances vest after three yearssubject to the continued employment of the participant and to theextent that performance conditions have been satisfied. The initialmarket value of the shares over which any such award is made to anyparticipant in any financial year may not in any event exceed 100% ofbasic annual salary or, in circumstances which the Committee deemsto be exceptional, 150% of basic annual salary.
The Committee has determined that up to 50% of awards willvest according to the Company’s total shareholder return (TSR)performance in comparison to an index composed of selectedrelevant companies; and that up to 50% of awards will vestdepending upon the extent to which the Company achieves earningsper share growth targets.
The Petrofac approved Share Incentive Plan (SIP)A SIP was established upon listing. All UK employees, including UKresident directors, are eligible to participate in the SIP. Employeesmay invest up to £1,500 per tax year of gross salary (or, if less, 10%of salary) to purchase ordinary shares. There is no holding period forthese shares.
There were no awards under the DBSP, PSP or SIP in 2005.
The group operated two share participation schemes prior to theCompany’s admission to listing: the Petrofac Limited Executive ShareScheme (ESS) and Petrofac Limited Long Term Incentive Plan (LTIP).
Under the ESS participants were invited to purchase participatoryinterests in shares in the Company. The underlying shares were heldin trust for the benefit of the participants subject to the rules of thescheme. On listing, the majority of participants became entitled to callfor the transfer to them by the Trustee of the shares comprised in theirparticipatory interest. No further awards will be made under the ESS.
All awards made under the LTIP vested in full upon the Company’sadmission to listing and the scheme ended. There were noperformance conditions attached to awards under the LTIP.
Performance graphThe Company’s TSR is defined as share price growth plus reinvesteddividends. For shareholders’ information, the Company’s TSRperformance since the Company was admitted to listing on theLondon Stock Exchange on 7 October 2005 is shown on the graphbelow compared with the performance achieved by the FTSE 250Index, which the Committee believes is the most relevant benchmarkto allow a meaningful assessment of the Company’s performance.
Oct 05 Nov 05 Dec 05
Petrofac total shareholder return FTSE 250 total shareholder return
0102030405060708090
100110120130140

Directors’ detailed emolumentsSalaries & Cash Cash 2005 2004
fees allowances4 Benefits bonus total totalUS$’000 US$’000 US$’000 US$’000 US$’000 US$’000
Executive directorsAyman Asfari 479 21 1 814 1,315 699Keith Roberts 332 14 1 235 582 511Maroun Semaan 255 23 119 350 747 568Amjad Bseisu1 218 6 1 242 467 483Robin Pinchbeck1 168 17 68 70 323 509Mike Stacey1 223 – 1 – 224 430
Non-executive directorsRodney Chase2 102 – – – 102 –Kjell Almskog3 43 – – – 43 –Bernard de Combret 63 – – – 63 49Michael Press 59 – – – 59 43
1,942 81 191 1,711 3,925 3,292
40 Petrofac Annual report and accounts 2005
Date of Notice Unexpiredcontract period term
Executive directorsAyman Asfari 13 September 2005 12 months 12 months1
Keith Roberts 13 September 2005 12 months 12 months1
Maroun Semaan 13 September 2005 12 months 12 months1
Non-executive directorsRodney Chase 13 September 2005 3 months 66 months2
Kjell Almskog 13 September 2005 3 months 63 months2
Bernard de Combret 13 September 2005 3 months 47 months2
Michael Press 13 September 2005 3 months 28 months2
1 The executive directors’ contracts are on a 12 month rolling basis. 2 Unexpired terms for non-executive directors run from their respective dates of appointment and are assumed to run for a duration of two three-year terms.
Each of the executive directors is contractually restricted to atermination payment equal to 12 months’ salary and benefits.
Each non-executive director is typically expected to serve two three-year terms from the date of his initial appointment although the Boardmay invite a director to serve an additional three year period.
In addition, Keith Roberts and Robin Pinchbeck will be awarded£100,000 of shares and US$100,000 of shares, respectively, as partof their bonus award for 2005 under the Company’s DBSP. Thisaward will be made in 2006. There will be no matching awards ofshares as the Remuneration Committee believes that this would beinappropriate given that such awards would be made without theattachment of any performance criteria. These shares will in normalcircumstances vest three years after they have been granted subjectto continued employment.
Directors’ interests in the LTIPAt the start of the year, no director held any interest in shares underthe LTIP. On 29 April 2005, prior to the Company’s 40:1 share split,Keith Roberts and Robin Pinchbeck were awarded 5,000 ordinaryshares each under the Company’s LTIP. The shares were to vest freeof charge in four equal instalments commencing on the award dateand annually thereafter. The rules provided for all awards to vest in fullon admission to listing. At the time of the awards, there was nomarket in the Company’s shares although the fair value of shares,determined using a net asset based formula, was US$16.93 perordinary share. At the time that the shares vested, the award wasequivalent to 200,000 ordinary shares following the Company’s 40:1share split and the market price of the shares was £2.15 at the timethe Company’s shares were admitted to listing on the London StockExchange.
Directors’ remuneration report(continued)
1 For the period 1 January 2005 to 13 September 2005. Amjad Bseisu, Robin Pinchbeck and Mike Stacey resigned as directors on 13 September 2005. Amjad Bseisu and RobinPinchbeck continued to be employed by the group and earned a further US$210,000 and US$141,000, respectively, as employees of the group during the year following theirresignations from the Board. US$30,000 of Amjad Bseisu’s salary as a director was paid to a related party.
2 For the period 1 June 2005 to 31 December 2005.3 For the period 25 March 2005 to 31 December 2005.4 Payment in lieu of pension allowance and other benefits for UK resident directors and end of service indemnity for UAE resident directors. None of the directors are eligible to receive
pension contributions from the Company.5 UK based directors are paid in Sterling. Amounts have been translated to US dollars based on the prevailing rate at the date of payment or award with the exception of bonus amounts,
which have been translated using the average exchange rate for the year.
Annual report and accounts 2005 Petrofac 41
Director’s interest in share optionIn 2002, the Company awarded Keith Roberts an option to acquireup to 75,000 ordinary shares at $25.00 per share. On 18 May 2005,this option agreement was cancelled. The option was awarded priorto the Company’s 40:1 share split.
Directors’ beneficial interests in ordinary shares at 31 December 2005
Number ofNumber of shares as at
shares 31 Decemberas at 2004 or date
31 December of appointment2005 if later1
Executive directorsAyman Asfari 69,282,114 101,641,480Keith Roberts2 3,120,000 2,000,000Maroun Semaan 34,068,799 49,981,200
Non-executive directors Rodney Chase2 1,000,000 800,000Kjell Almskog2 400,000 –Bernard de Combret 600,000 400,000Michael Press2 240,000 200,000
The Company’s share price at the end of the financial year was 254pand the market price during the period that the Company’s shareswere listed was in the range 200p to 254p.
There have been no changes to the directors’ share interests sincethe year end.
Other earnings by directorsKeith Roberts received fees of £33,512 in 2005 (2004: £27,000)for his non-executive directorship of The Peacock Group plc, whichhe retained. Robin Pinchbeck received fees of £26,740 in 2005(2004: £23,059) for his non-executive directorship of Sondex plc,which he retained.
Annual General Meeting approvalThe Remuneration Report will be submitted for approval to theAnnual General Meeting to be held on Friday, 19 May 2006.
On behalf of the Board
Michael PressChairman of the Remuneration Committee15 March 2006
1 Shares have been expressed as if the 40:1 share split of the Company’s share capitalwhich became effective at listing had been completed by 31 December 2004 in orderto provide a like-for-like comparison. Refer to note 20 of the Company’s financialstatements for further details of the 40:1 share split.
2 During the year, the following directors subscribed for shares under the Company’sESS: Keith Roberts (3,000,000 shares); Rodney Chase (800,000 shares); Kjell Almskog(200,000 shares); and Michael Press (200,000 shares). The awards have beenexpressed as if the 40:1 share split had been effective at the time of the awards.

42 Petrofac Annual report and accounts 2005
The directors are responsible for preparing the financial statements inaccordance with applicable Jersey law and generally acceptedaccounting principles.
Jersey Company law requires the directors to prepare financialstatements for each financial year which give a true and fair view ofthe state of affairs of the Company and of the profit or loss of theCompany for that period. In preparing these financial statements, thedirectors should:
• select suitable accounting policies and then apply themconsistently;
• make judgements and estimates that are reasonable andprudent; and,
• prepare the financial statements on the going concern basisunless it is inappropriate to presume that the Company willcontinue in business.
The directors are responsible for keeping proper accounting recordsthat disclose with reasonable accuracy at any time the financialposition of the Company and enable them to ensure that the financialstatements comply with the Law. They are also responsible forsafeguarding the assets of the Company and hence for takingreasonable steps for the prevention and detection of fraud and otherirregularities.
Statement of directors’ responsibilities

Annual report and accounts 2005 Petrofac 43
We have audited the accompanying consolidated financialstatements of Petrofac Limited (“the Company”) and its subsidiaries(together “the group”) for the year ended 31 December 2005 whichcomprise consolidated income statement, consolidated balancesheet, consolidated cash flow statement, consolidated statement ofchange in equity and the related notes 1 to 31. These financialstatements have been prepared under the accounting policies set outtherein.
This report is made solely to the Company’s members, as a body, inaccordance with Article 110 of the Companies (Jersey) Law 1991.Our audit work has been undertaken so that we might state to theCompany’s members those matters we are required to state to themin an auditors’ report and for no other purpose. To the fullest extentpermitted by law, we do not accept or assume responsibility toanyone other than the Company and the Company’s members as abody, for our audit work, for this report, or for the opinions we haveformed.
Respective responsibilities of directors and auditorsThe directors are responsible for the preparation of the financialstatements in accordance with applicable Jersey law as set out in theStatement of directors’ responsibilities.
Our responsibility is to audit the financial statements in accordancewith relevant legal and regulatory requirements and InternationalStandards on Auditing (UK and Ireland) and the Listing Rules of theFinancial Services Authority.
We report to you our opinion as to whether the financial statementsgive a true and fair view and have been properly prepared inaccordance with the Companies (Jersey) Law 1991. We also reportto you if, in our opinion, the Company has not kept proper accountingrecords or if we have not received all the information and explanationswe require for our audit.
We review whether the Corporate Governance Statement reflects theCompany’s compliance with the nine provisions of the 2003 FRCCombined Code specified for our review by the Listing Rules of theFinancial Services Authority, and we report if it does not. We are notrequired to consider whether the Board’s statements on internalcontrol cover all risks and controls, or form an opinion on theeffectiveness of the group’s corporate governance procedures or itsrisk and control procedures.
We read other information contained in the Annual Report andconsider whether it is consistent with the audited financialstatements. This other information comprises the Directors’remuneration report, Chairman’s statement, Operating and Financialreview and Corporate governance statement. We consider theimplications for our report if we become aware ofany apparent misstatements or material inconsistencies with thefinancial statements. Our responsibilities do not extend to anyother information.
Basis of audit opinionWe conducted our audit in accordance with International Standardson Auditing (UK and Ireland) issued by the Auditing Practices Board.An audit includes examination, on a test basis, of evidence relevantto the amounts and disclosures in the financial statements. It alsoincludes an assessment of the significant estimates and judgementsmade by the directors in the preparation of the financial statements,and of whether the accounting policies are appropriate to the group’scircumstances, consistently applied and adequately disclosed.
We planned and performed our audit so as to obtain all theinformation and explanations which we considered necessary inorder to provide us with sufficient evidence to give reasonableassurance that the financial statements are free from materialmisstatement, whether caused by fraud or other irregularity or error.In forming our opinion we also evaluated the overall adequacy of thepresentation of information in the financial statements.
OpinionIn our opinion the consolidated financial statements give a trueand fair view, in accordance with International Financial ReportingStandards, of the state of the group’s affairs as at 31 December 2005and of its profit for the year then ended and have been properlyprepared in accordance with the Companies (Jersey) Law 1991.
Ernst & Young LLPLondon15 March 2006
Independent auditors’ report to theshareholders of Petrofac Limited

44 Petrofac Annual report and accounts 2005
2005 2004Notes US$’000 US$’000
Restated
Continuing operationsRevenue 4a 1,485,472 951,530Cost of sales (1,324,673) (829,081)
Gross profit 160,799 122,449Selling, general and administration expenses 4d (74,928) (58,825)Other income 4b 5,223 6,246Other expenses 4c (2,491) (1,587)
Profit from continuing operations before tax and finance costs 88,603 68,283Finance costs 5 (8,448) (7,544)Finance income 5 3,193 1,997
Profit before tax 83,348 62,736Income tax expense 6 (7,951) (16,699)
Profit for the year from continuing operations 75,397 46,037
Discontinued operationsLoss for the year from discontinued operation 7 (815) (13,162)Profit for the year 74,582 32,875
Attributable to:Petrofac Limited shareholders 74,582 32,921Minority interests – (46)
74,582 32,875
Earnings per share (US cents) 8 RestatedFrom continuing and discontinued operations:– Basic 24.52 9.43– Diluted 22.17 8.70
From continuing operations:– Basic 24.79 13.19– Diluted 22.41 11.93
The attached notes 1 to 31 form part of these consolidated financial statements.
Consolidated income statementFor the year ended 31 December 2005

2005 2004Notes US$’000 US$’000
Restated
AssetsNon-current assetsProperty, plant and equipment 10 120,431 123,413Goodwill 12 49,183 49,653Intangible assets 13 2,982 6,721Available-for-sale financial assets 15 2,413 4,104Other financial assets 16 680 11,205Deferred income tax assets 6 5,576 782
181,265 195,878
Current assetsInventories 1,156 1,702Work in progress 17 235,047 109,037Trade and other receivables 18 325,716 216,796Due from related parties 28 28,402 20,889Other financial assets 16 4,501 37,843Cash and short-term deposits 19 208,896 143,534
803,718 529,801
Assets of discontinued operation classified as held for sale 7 1,667 3,678Total assets 986,650 729,357
Equity and liabilitiesEquity attributable to Petrofac Limited shareholdersShare capital 20 8,629 7,166Share premium 66,210 28,553Capital redemption reserve 10,881 10,881Treasury shares (17) –Other reserves 21 (12,426) 27,047Retained earnings 121,850 64,911Total equity 195,127 138,558
Non-current liabilitiesInterest-bearing loans and borrowings 22 76,187 110,787Provisions 23 8,284 5,912Other financial liabilities 24 1,222 6,877Deferred income tax liabilities 6 3,121 1,535
88,814 125,111
Current liabilitiesTrade and other payables 25 219,425 157,934Due to related parties 28 1,335 1,453Interest-bearing loans and borrowings 22 30,683 50,691Other financial liabilities 24 15,810 1,275Income tax payable 2,210 3,172Billings in excess of cost and estimated earnings 17 69,776 72,155Accrued contract expenses 26 363,470 179,008
702,709 465,688Total liabilities 791,523 590,799Total equity and liabilities 986,650 729,357
The attached notes 1 to 31 form part of these consolidated financial statements.
Consolidated balance sheetAt 31 December 2005
Annual report and accounts 2005 Petrofac 45
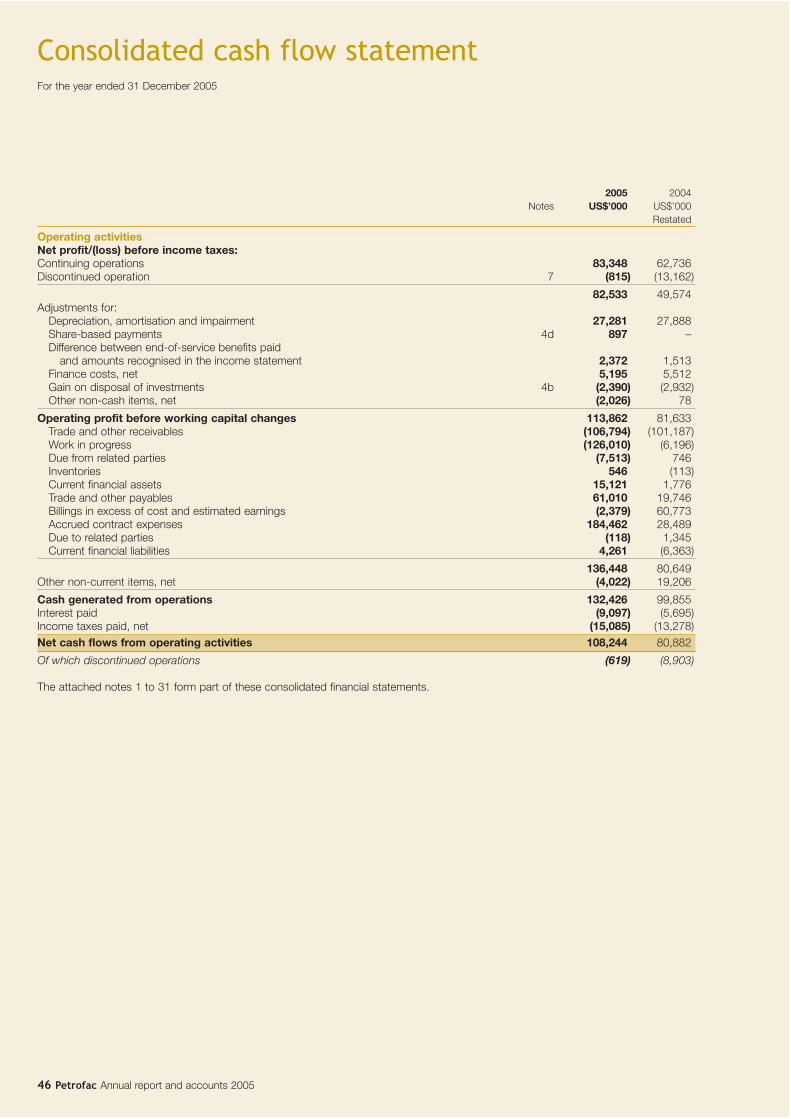
Consolidated cash flow statementFor the year ended 31 December 2005
46 Petrofac Annual report and accounts 2005
2005 2004Notes US$’000 US$’000
Restated
Operating activitiesNet profit/(loss) before income taxes:Continuing operations 83,348 62,736Discontinued operation 7 (815) (13,162)
82,533 49,574Adjustments for:
Depreciation, amortisation and impairment 27,281 27,888Share-based payments 4d 897 –Difference between end-of-service benefits paid
and amounts recognised in the income statement 2,372 1,513Finance costs, net 5,195 5,512Gain on disposal of investments 4b (2,390) (2,932)Other non-cash items, net (2,026) 78
Operating profit before working capital changes 113,862 81,633Trade and other receivables (106,794) (101,187)Work in progress (126,010) (6,196)Due from related parties (7,513) 746Inventories 546 (113)Current financial assets 15,121 1,776Trade and other payables 61,010 19,746Billings in excess of cost and estimated earnings (2,379) 60,773Accrued contract expenses 184,462 28,489Due to related parties (118) 1,345Current financial liabilities 4,261 (6,363)
136,448 80,649Other non-current items, net (4,022) 19,206
Cash generated from operations 132,426 99,855Interest paid (9,097) (5,695)Income taxes paid, net (15,085) (13,278)Net cash flows from operating activities 108,244 80,882
Of which discontinued operations (619) (8,903)
The attached notes 1 to 31 form part of these consolidated financial statements.

2005 2004Notes US$’000 US$’000
Restated
Investing activitiesPurchase of property, plant and equipment 10 (17,556) (17,142)Acquisition of business assets 11 – (695)Acquisition of subsidiary, net of cash acquired 11 (4,073) (9,119)Purchase of minority interest 11 (1,644) –Acquisition of interest in joint venture 11 – (1,000)Purchase of intangible oil & gas assets (3,079) (4,480)Purchase of available-for-sale financial assets (691) –Proceeds from disposal of property, plant and equipment 647 804Proceeds from disposal of assets of discontinued operation
classified as held for sale 1,832 –Proceeds from disposal of available-for-sale financial assets 4,545 2,344Net foreign exchange difference (135) (1,659)Interest received 3,442 1,665Net cash flows used in investing activities (16,712) (29,282)
Of which discontinued operations 1,892 39
Financing activitiesProceeds from issue of share capital – 1,511Proceeds from interest-bearing loans and borrowings 28,339 45,722Repayment of interest-bearing loans and borrowings (32,026) (35,684)Purchase of derivative financial instruments (689) (62)Shareholders loan note transactions, net 4,968 (1,581)Transactions with employee share plan, net 537 3,016Exercise of option to acquire group shares 11 (2,400) – Repurchase of shares 20 – (30,760)Equity dividends paid (15,243) (1,315)Net cash flows used in financing activities (16,514) (19,153)
Of which discontinued operations – –
Net increase in cash and cash equivalents 75,018 32,447Cash and cash equivalents at 1 January 127,823 95,376Cash and cash equivalents at 31 December 19 202,841 127,823
The attached notes 1 to 31 form part of these consolidated financial statements.
Consolidated cash flow statement(continued)
For the year ended 31 December 2005
Annual report and accounts 2005 Petrofac 47

48 Petrofac Annual report and accounts 2005
Issued Capitalshare Share redemption Treasury Other Retained Minority Total
capital premium reserve shares reserves earnings Total interest equityUS$’000 US$’000 US$’000 US$’000 US$’000 US$’000 US$’000 US$’000 US$’000
Balance at 1 January 2004 9,066 52,592 8,634 – (1,803) 35,552 104,041 2,241 106,282Change in accounting policy (note 2) – – – (106) – – (106) – (106)Balance at 1 January 2004 (restated) 9,066 52,592 8,634 (106) (1,803) 35,552 103,935 2,241 106,176
Foreign currency translation – – – – 3,598 – 3,598 – 3,598Net loss on maturity of cash flow
hedges recognised in income statement – – – – 486 – 486 – 486Net changes in fair value of derivatives – – – – 23,498 – 23,498 – 23,498Changes in the fair value of available-for-
sale financial assets – – – – 1,268 – 1,268 – 1,268
Total income and expenses for the year recognised in equity – – – – 28,850 – 28,850 – 28,850
Net profit for the year – – – – – 32,921 32,921 (46) 32,875Total income and expenses for the year – – – – 28,850 32,921 61,771 (46) 61,725
Shares issued during the year 115 1,396 – – – – 1,511 – 1,511Shares repurchased during the year (2,247) (28,513) 2,247 – – (2,247) (30,760) – (30,760)Petrofac ESOP transactions, net 232 2,784 – 106 – – 3,122 – 3,122Increase in value of stock warrants – 294 – – – – 294 – 294Elimination of minority interest – – – – – – – (2,195) (2,195)Dividends – – – – – (1,315) (1,315) – (1,315)Balance at 31 December 2004 7,166 28,553 10,881 – 27,047 64,911 138,558 – 138,558
For the comparative year ended 31 December 2004 a capital redemption reserve resulting from shares repurchased was not disclosedseparately from retained earnings. This comparative data has been restated to reflect this separate disclosure.
As restated, a capital redemption reserve of US$8,634,000 is reflected as at 1 January 2004. Retained earnings has been reduced bythis amount at this date. During 2004, the capital redemption reserve increased as a result of further shares repurchased during the year(US$2,247,000). This movement has been reclassified from retained earnings. As at 31 December 2004, a capital redemption reserve isseparately disclosed of US$10,881,000 with a corresponding reduction in retained earnings. There is no impact on basic or dilutedearnings per share.
The attached notes 1 to 31 form part of these consolidated financial statements.
Attributable to shareholders of Petrofac Limited
Consolidated statement of changes in equityFor the year ended 31 December 2005 (Restated)

Issued Capitalshare Share redemption Treasury Other Retained Minority Total
capital premium reserve shares reserves earnings Total interest equityUS$’000 US$’000 US$’000 US$’000 US$’000 US$’000 US$’000 US$’000 US$’000
Balance at 1 January 2005 7,166 28,553 10,881 – 27,047 64,911 138,558 – 138,558
Foreign currency translation – – – – (4,248) – (4,248) – (4,248)Net gain on maturity of cash flow
hedges recognised in income statement – – – – (5,628) – (5,628) – (5,628)Net changes in fair value of derivatives – – – – (28,549) – (28,549) – (28,549)Changes in the fair value of available-for-
sale financial assets – – – – (1,048) – (1,048) – (1,048)
Total income and expenses for theyear recognised in equity – – – – (39,473) – (39,473) – (39,473)
Net profit for the year – – – – – 74,582 74,582 – 74,582Total income and expenses for the year – – – – (39,473) 74,582 35,109 – 35,109
Petrofac ESOP transactions, net 65 1,398 – (17) – – 1,446 – 1,446Conversion of debt instruments 1,398 36,259 – – – – 37,657 – 37,657Exercise option to acquire group
shares (note 11) – – – – – (2,400) (2,400) – (2,400)Dividends – – – – – (15,243) (15,243) – (15,243)Balance at 31 December 2005 8,629 66,210 10,881 (17) (12,426) 121,850 195,127 – 195,127
The attached notes 1 to 31 form part of these consolidated financial statements.
Attributable to shareholders of Petrofac Limited
Consolidated statement of changes in equity(continued)
For the year ended 31 December 2005 (Restated)
Annual report and accounts 2005 Petrofac 49

50 Petrofac Annual report and accounts 2005
1 Corporate informationThe consolidated financial statements of Petrofac Limited (theCompany) for the year ended 31 December 2005 were authorisedfor issue in accordance with a resolution of the directors on15 March 2006.
Petrofac Limited is a limited liability company registered in Jerseyunder the Companies (Jersey) Law 1991 and is the holdingcompany for the international group of Petrofac subsidiaries(together “the group”). The group’s principal activity is the provisionof facilities solutions to the oil & gas production and processingindustry.
A full listing of all group companies, including joint venturecompanies, is contained in note 30 to these consolidated financialstatements.
2 Summary of significant accounting policiesBasis of preparationThe consolidated financial statements have been prepared on ahistorical cost basis, except for derivative financial instruments andavailable-for-sale financial assets that have been measured at fairvalue. The functional currency of the consolidated financialstatements is United States dollars (US$), as a significantproportion of the group’s assets, liabilities, income and expensesare US$ denominated. The consolidated financial statements arepresented in US$ and all values are rounded to the nearestthousand (US$’000) except where otherwise stated.
Statement of complianceThe consolidated financial statements of Petrofac Limited and allits subsidiaries have been prepared in accordance with accountingprinciples generally accepted in the island of Jersey, incorporatingInternational Financial Reporting Standards (IFRS) and incompliance with the applicable requirements of Jersey law.
Basis of consolidationThe consolidated financial statements comprise the financialstatements of Petrofac Limited and its subsidiaries. The financialstatements of subsidiaries are prepared using consistentaccounting policies. Where necessary, adjustments are made tobring the accounting policies into line with those of the group.
Subsidiaries are consolidated from the date on which control istransferred to the group and cease to be consolidated from thedate on which control is transferred out of the group. All intra-group balances and transactions, including unrealised profits, havebeen eliminated on consolidation.
Changes in accounting policiesThe group has changed its accounting policy for oil & gas assetsfrom the full cost method of accounting for oil & gas assets to thesuccessful efforts method. The group believes this change inaccounting policy will enhance the transparency of the financialreporting of future performance. The reported net profit andshareholders’ equity for the year ended 31 December 2004 areunaffected by the adoption of this method of accounting for oil &gas assets. There is no impact on the net profit and shareholders’equity for the year ended 31 December 2005.
With the exception of accounting for oil & gas assets, theaccounting policies adopted are consistent with those of theprevious financial year except that the group has adopted new andrevised Standards and Interpretations issued by the InternationalAccounting Standards Board (IASB) and the International FinancialReporting Interpretations Committee (IFRIC) of the IASB that arerelevant to its operations and effective for accounting periodsbeginning on or after 1 January 2005. The principal effects of theadoption of new and amended standards are discussed below:
IFRS 2 ‘Share-Based Payment’IFRS 2 ‘Share-Based Payment’ requires an expense to berecognised where the group buys goods or services in exchangefor shares or rights over shares (‘equity-settled transactions’).
The group has taken advantage of the transitional provisions ofIFRS 2 in respect of equity-settled awards and has applied IFRS 2only to equity-settled awards granted after 7 November 2002 thathad not vested before 1 January 2005.
As a result of adopting IFRS 2, the group has recognised anexpense in the year of US$897,000 relating to employees’ share-based incentives. This expense is classified within selling, generaland administration expenses in the income statement. The effectof the adopting this standard on basic and diluted earnings pershare is as follows:
• a decrease in basic earnings per share by 0.29 US cents• a decrease in diluted earnings per share by 0.26 US cents
The reported net profit and shareholders’ equity for the year ended31 December 2004 are unaffected by the adoption of this newstandard.
Standing Interpretations Committee (SIC) 12 ‘SpecialPurpose Entities’The Company has adopted the recently amended SIC 12 ‘SpecialPurpose Entities’. This requires special purpose entities, formed forthe purpose of equity compensation plans, to be consolidatedwithin the financial statements of the group.
The adoption of SIC 12 has required the group to consolidatePetrofac ESOP Trustees Limited (Petrofac ESOP) and,consequently, to offset the cost of shares temporarily held byPetrofac ESOP as treasury shares from equity. Prior to adoptingSIC 12, Petrofac ESOP was not consolidated and the cost ofshares held was disclosed as a current receivable within TotalAssets. Total equity as at 1 January 2004 has been reduced byUS$106,000 due to the adoption of this amended Standard. Thisrestatement is reflected under the heading ‘Treasury shares’ withintotal equity.
IFRS 3 ‘Business Combinations’, IAS 36 (revised)‘Impairment of Assets’IFRS 3 applies to accounting for business combinations for whichthe agreement date is on or after 31 March 2004.
The effect of the adoption of IFRS 3 and IAS 36 (revised) hasresulted in the group ceasing annual goodwill amortisation andcommencing testing for impairment at the cash-generating unitlevel annually, unless an event occurs during the year whichrequires the goodwill to be tested more frequently, from 1 January2005.
Notes to the consolidated financial statementsAt 31 December 2005

This revised accounting policy has been applied prospectively, inaccordance with the transitional rules of IFRS 3, and therefore thereported net profit and shareholders’ equity for the year ended31 December 2004 are unaffected by the adoption of this newStandard.
IFRS 5 ‘Non-current Assets Held for Sale andDiscontinued Operations’The group has adopted IFRS 5 ‘Non-current Assets Held for Saleand Discontinued Operations’ with effect from 1 January 2005.IFRS 5 requires an operation to be classified as discontinued whenthe criteria to be classified as held for sale have been met or thegroup has disposed of the operation. The adoption of thisStandard has required the group to separately disclose, on theface of the balance sheet, those assets held for sale within itsdiscontinued operation.
In addition, the presentation of the income statement fordiscontinued operations is no longer required on a line-by-linebasis. Instead, the Standard requires the net profit or loss fromdiscontinued operations to be disclosed as a single line item at thefoot of the income statement.
The comparative figures for the year ended 31 December 2004have been restated to conform with the presentation required byIFRS 5. These restatements do not affect previously reported netprofit or shareholders’ equity.
Amendment to IAS 21 ‘The Effects Of Changes In ForeignExchange Rates – Net Investment in a Foreign Operation’The group has adopted Amendment to IAS 21 ‘Net Investment ina Foreign Operation’ with effect from 1 January 2005’. Theamendment to IAS 21 requires all exchange differences arisingfrom the group’s net investment in subsidiaries to be taken directlyto equity, irrespective of which group entity provides theinvestment.
As a result of adopting this Amendment to IAS 21, US$526,000 oftranslation losses arising in the year from the group’s netinvestment in subsidiaries has been recognised within the foreigncurrency translation reserve in equity. Prior to adopting thisamended Standard this translation loss would have been chargedto the income statement. The effect of adopting this amendedStandard on basic and diluted earnings per share is as follows:
• an increase in basic earnings per share by 0.17 US cents• an increase in diluted earnings per share by 0.15 US cents
The reported net profit and shareholders’ equity for the year ended31 December 2004 are unaffected by the adoption of thisamended Standard.
Significant accounting judgements and estimatesJudgementsIn the process of applying the group’s accounting policies,management has made the following judgements, apart fromthose involving estimations, which have the most significant effecton the amounts recognised in the financial statements:
Petrofac Resources (Ohanet) Jersey Limited (Petrofac Ohanet): thegroup acquired Petrofac Ohanet on 27 May 2005. Prior to itsacquisition, the group consolidated Petrofac Ohanet in itsconsolidated financial statements as it determined it heldsignificant operating and financial control over the company.
Revenue recognition on fixed-price engineering, procurement andconstruction contracts: the group recognises revenue on fixedprice engineering, procurement and construction contracts on thepercentage-of-completion method, based on surveys of workperformed. The group has determined this basis of revenuerecognition is the best available measure of progress on suchcontracts.
Estimation uncertaintyThe key assumptions concerning the future and other key sourcesof estimation uncertainty at the balance sheet date, that have asignificant risk of causing a material adjustment to the carryingamounts of assets and liabilities within the next financial year arediscussed below:
Impairment of goodwill: the group determines whether goodwill isimpaired at least on an annual basis. This requires an estimation ofthe value in use of the cash-generating units to which the goodwillis allocated. Estimating the value in use requires the group to makean estimate of the expected future cash flows from each cash-generating unit and also to choose a suitable discount rate in orderto calculate the present value of those cash flows. The carryingamount of goodwill at 31 December 2005 was US$49,183,000(2004: US$49,653,000).
Project cost to complete estimates: at each balance sheet datethe group is required to estimate costs to complete on fixed pricecontracts. Estimating costs to complete on such contractsrequires the group to make estimates of future costs to beincurred, based on work to be performed beyond the balancesheet date.
Interests in joint ventures The group has a number of contractual arrangements with otherparties which represent joint ventures. These take the form ofagreements to share control over other entities (‘jointly controlledentities’) and commercial collaborations (‘jointly controlledoperations’). The group’s interests in jointly controlled entities andoperations are accounted for by proportionate consolidation,which involves recognising its proportionate share of the jointventure’s assets, liabilities, income and expenses with similar itemsin the consolidated financial statements on a line-by-line basis.
The financial statements of the group’s jointly controlled entitiesand operations are prepared using consistent accounting policies.Where necessary, adjustments are made to bring the accountingpolicies into line with those of the group.
Transactions in foreign currenciesIn the accounts of individual group companies, transactions inforeign currencies are recorded at the prevailing rate at the date ofthe transaction. At the year end, monetary assets and liabilitiesdenominated in foreign currencies are retranslated at the rates ofexchange prevailing at the balance sheet date. All foreignexchange gains and losses are taken to the income statement withthe exception of exchange differences arising on monetary assetsand liabilities that form part of the group’s net investment insubsidiaries. These are taken directly to equity until the disposal ofthe net investment at which time they are recognised in the incomestatement.
Annual report and accounts 2005 Petrofac 51

Notes to the consolidated financial statements(continued)
At 31 December 2005
52 Petrofac Annual report and accounts 2005
2 Summary of significant accounting policies (continued)Foreign group companiesThe balance sheets of overseas subsidiaries and joint ventures aretranslated using the closing rate method, whereby assets andliabilities are translated at the rates of exchange ruling at thebalance sheet date. The income statements of overseassubsidiaries and joint ventures are translated at average exchangerates for the year. Exchange differences arising on the retranslationof net assets are taken directly to equity.
On the disposal of a foreign entity, accumulated exchangedifferences are recognised in the income statement as acomponent of the gain or loss on disposal.
Property, plant and equipment Property, plant and equipment is stated at cost less accumulateddepreciation and any impairment in value. Depreciation is providedon a straight-line basis at the following rates:
Oil & gas facilities 10% – 12.5%Plant and equipment 4% – 33%Buildings and leasehold improvements 5% – 33%Office furniture and equipment 25% – 100%Vehicles 20% – 33%
No depreciation is charged on land or assets under construction.
Borrowing costsBorrowing costs directly attributable to the construction ofqualifying assets, which are assets that necessarily take asubstantial period of time to prepare for their intended use, areadded to the cost of those assets, until such time as the assets aresubstantially ready for their intended use. All other borrowing costsare recognised as interest payable in the income statement in theperiod in which they are incurred.
GoodwillGoodwill acquired in a business combination is initially measuredat cost being the excess of the cost of the business combinationover the net fair value of the identifiable assets, liabilities andcontingent liabilities of the entity at the date of acquisition.Following initial recognition, goodwill is measured at cost less anyaccumulated impairment losses. Goodwill is reviewed forimpairment annually, or more frequently if events or changes incircumstances indicate that such carrying value may be impaired.
For the purpose of impairment testing, goodwill acquired isallocated to the related cash-generating units. Each unit to whichgoodwill is allocated represents the lowest level within the group atwhich the goodwill is monitored for internal management purposesand is not larger than a segment based on either the group’sprimary or the group’s secondary reporting format determined inaccordance with IAS 14 ‘Segment Reporting’.
Impairment is determined by assessing the recoverable amount ofthe cash-generating unit to which the goodwill relates. Where therecoverable amount of the cash-generating unit is less than thecarrying amount, an impairment loss is recognised.
Where goodwill forms part of a cash-generating unit and part ofthe operation within that unit is disposed of, the goodwillassociated with the operation disposed of is included in thecarrying amount of the operation when determining the gain orloss on disposal of the operation. Goodwill disposed of in thiscircumstance is measured based on the relative values of theoperation disposed of and the portion of the cash-generating unitretained.
Oil & gas assetsCapitalised costsThe group’s activities in relation to oil & gas assets are limited toacquisition, appraisal and development. The group does notundertake oil & gas exploration activities.
The group follows the successful efforts method of accounting foroil & gas assets, under which expenditure relating to theacquisition and appraisal of oil & gas interests, including anappropriate share of directly attributable overheads and relevantfinancing costs, are initially capitalised at cost as intangible assets,pending determination of commercial reserves.
Intangible oil & gas assets are carried forward, on a field-by-fieldbasis, until declared part of a commercial development, at whichpoint the relevant total cost is transferred to tangible oil & gasassets. All intangible oil & gas assets are assessed for anyimpairment prior to transfer and any impairment loss is recognisedin the income statement. Costs relating to unsuccessful appraisalsare charged to the income statement in the period in which thedetermination is made.
Tangible oil & gas assets are depreciated, on a field-by-field basis,using the unit-of-production method based on entitlement toproved reserves, taking account of estimated future developmentexpenditure relating to those reserves.
The group utilises proved reserves estimates in performingimpairment testing on its oil & gas assets.
Changes in unit-of-production factorsChanges in factors which affect unit-of-production calculations aredealt with prospectively, not by immediate adjustment of prioryears’ amounts.
DecommissioningProvision for future decommissioning costs is made in full whenthe group has an obligation to dismantle and remove a facility oran item of plant and to restore the site on which it is located, andwhen a reasonable estimate of that liability can be made. Theamount recognised is the present value of the estimated futureexpenditure. An amount equivalent to the initial provision fordecommissioning costs is capitalised and amortised over the life ofthe underlying asset on a unit-of-production basis over provedreserves. Any change in the present value of the estimatedexpenditure is reflected as an adjustment to the provision and theoil & gas asset.
The unwinding of the discount of future decommissioningprovisions is included as a separate financial item in the incomestatement under finance costs.

Annual report and accounts 2005 Petrofac 53
Available-for-sale financial assetsInvestments classified as available-for-sale are initially stated atcost, being the fair value of consideration given, includingacquisition charges associated with the investment.
After initial recognition, available-for-sale financial assets aremeasured at their fair value using quoted market rates. Gains andlosses are recognised as a separate component of equity until theinvestment is sold or impaired, at which time the cumulative gainor loss previously reported in equity is included in the incomestatement.
Impairment of assets (excluding goodwill)At each balance sheet date, the group reviews the carryingamounts of its tangible and intangible assets to assess whetherthere is an indication that those assets may be impaired. If anysuch indication exists, the group makes an estimate of the asset’srecoverable amount. An asset’s recoverable amount is the higherof an asset’s fair value less costs to sell and its value in use. Inassessing value in use, the estimated future cash flows attributableto the asset are discounted to their present value using a pre-taxdiscount rate that reflects current market assessments of the timevalue of money and the risks specific to the asset.
If the recoverable amount of an asset is estimated to be less thanits carrying amount, the carrying amount of the asset is reduced toits recoverable amount. An impairment loss is recognisedimmediately in the income statement, unless the relevant asset iscarried at a revalued amount, in which case the impairment loss istreated as a revaluation decrease.
Where an impairment loss subsequently reverses, the carryingamount of the asset is increased to the revised estimate of itsrecoverable amount, but so that the increased carrying amountdoes not exceed the carrying amount that would have beendetermined had no impairment loss been recognised for the assetin prior years. A reversal of an impairment loss is recognisedimmediately in the income statement, unless the relevant asset iscarried at a revalued amount, in which case the reversal of theimpairment is treated as a revaluation increase.
InventoriesInventories, which comprise raw materials and consumables, arevalued at the lower of cost and net realisable value. Net realisablevalue is the estimated selling price in the ordinary course ofbusiness, less estimated costs of completion and the estimatedcosts necessary to make the sale.
Work in progress and billings in excess of cost andestimated earningsWork in progress is stated at cost and estimated earnings lessprovision for any anticipated losses and progress paymentsreceived or receivable. Where the payments received or receivablefor any contract exceed the cost and estimated earnings lessprovision for any anticipated losses, the excess is shown as billingsin excess of cost and estimated earnings within current liabilities.
Trade and other receivables Trade receivables are recognised and carried at original invoiceamounts less an allowance for any amounts estimated to beuncollectible. An estimate for doubtful debts is made whencollection of the full amount is no longer probable. Bad debts arewritten off when identified.
A proportion of the group’s trading cycle is on average more thantwelve months due to the long term nature of the contractsundertaken. Retentions relating to long term contracts arepresented as a current asset although they may not be recoveredwithin twelve months of the balance sheet date.
Cash and cash equivalentsCash and cash equivalents consist of cash at hand and bank andshort-term deposits with an original maturity of three months orless. For the purpose of the cash flow statement, cash and cashequivalents consists of cash and cash equivalents as definedabove, net of outstanding bank overdrafts.
Interest-bearing loans and borrowingsAll interest-bearing loans and borrowings are initially recognised atcost, being the fair value of the consideration received net of issuecosts directly attributable to the borrowing.
After initial recognition, interest-bearing loans and borrowings aresubsequently measured at amortised cost using the effectiveinterest rate method. Amortised cost is calculated by taking intoaccount any issue costs, and any discount or premium onsettlement.
ProvisionsProvisions are recognised when the group has a present legal orconstructive obligation as a result of past events, it is probable thatan outflow of resources will be required to settle the obligation anda reliable estimate can be made of the amount of the obligation. Ifthe time value of money is material, provisions are discountedusing a current pre-tax rate that reflects, where appropriate, therisks specific to the liability. Where discounting is used, theincrease in the provision due to the passage of time is recognisedin the income statement as a finance cost.
Derecognition of financial assets and liabilitiesFinancial assetsA financial asset (or, where applicable a part of a financial asset) isderecognised where:
• the rights to receive cash flows from the asset have expired;• the group retains the right to receive cash flows from the asset,
but has assumed an obligation to pay them in full withoutmaterial delay to a third party under a ‘pass-through’arrangement; or,
• the group has transferred its rights to receive cash flows fromthe asset and either a) has transferred substantially all the risksand rewards of the asset, or b) has neither transferred norretained substantially all the risks and rewards of the asset, buthas transferred control of the asset.

Notes to the consolidated financial statements(continued)
At 31 December 2005
54 Petrofac Annual report and accounts 2005
2 Summary of significant accounting policies (continued)Financial liabilitiesA financial liability is derecognised when the obligation under theliability is discharged or cancelled or expires.
If an existing financial liability is replaced by another from the samelender, on substantially different terms, or the terms of an existingliability are substantially modified, such an exchange ormodification is treated as a derecognition of the original liability andthe recognition of a new liability such that the difference in therespective carrying amounts together with any costs or feesincurred are recognised in the income statement.
Pensions and employees’ end-of-service benefitsThe group has various defined contribution pension schemes inaccordance with the local conditions and practices in the countriesin which it operates. The amount charged to the income statementin respect of pension costs is the contributions payable in the year.Differences between contributions payable during the year andcontributions actually paid are shown as either accrued liabilities orprepaid assets in the balance sheet.
Employees’ end-of-service benefits are provided in accordancewith the labour laws of the countries in which the group operates,further details of which are given in note 23.
Share-based payment transactionsEmployees (including directors) of the group receive remunerationin the form of share-based payment transactions, wherebyemployees render services in exchange for shares or rights overshares (‘equity-settled transactions’).
Equity-settled transactionsThe cost of equity-settled transactions with employees ismeasured by reference to the fair value at the date on which theyare granted. In valuing equity-settled transactions, no account istaken of any performance conditions, other than conditions linkedto the price of the shares of Petrofac Limited (‘market conditions’),if applicable.
The cost of equity-settled transactions is recognised, together witha corresponding increase in equity, over the period in which therelevant employees become fully entitled to the award (the ‘vestingdate’). The cumulative expense recognised for equity-settledtransactions at each reporting date until the vesting date reflectsthe extent to which the vesting period has expired and the group’sbest estimate of the number of equity instruments that willultimately vest. The income statement charge or credit for a periodrepresents the movement in cumulative expense recognised as atthe beginning and end of that period.
No expense is recognised for awards that do not ultimately vest,except for awards where vesting is conditional upon a marketcondition, which are treated as vesting irrespective of whether ornot the market condition is satisfied, provided that all otherperformance conditions are satisfied.
The group has taken advantage of the transitional provisions ofIFRS 2 in respect of equity-settled awards and has applied IFRS 2only to equity-settled awards granted after 7 November 2002 thathad not vested before 1 January 2005.
Employee Share Ownership Plan (ESOP)Through Petrofac ESOP, the Company temporarily warehousesordinary shares that are expected, in the foreseeable future, to beoffered to new or existing employees (including directors). The costof shares temporarily held by Petrofac ESOP are reflected astreasury shares and deducted from equity. Petrofac ESOPacquires shares from the Company at fair value, as determinedusing a net asset based formula, and the Company extends aninterest free loan to Petrofac ESOP to acquire these shares. Theeffects of share issues and repurchase transactions arising withinPetrofac ESOP are taken directly to equity.
LeasesThe group has entered into various operating leases the paymentsunder which are treated as rentals and charged to the incomestatement on a straight-line basis over the lease terms.
Revenue recognitionRevenue is recognised to the extent that it is probable economicbenefits will flow to the group and the revenue can be reliablymeasured. The following specific recognition criteria also apply:
Engineering, procurement and construction servicesRevenues from fixed-price contracts are recognised on thepercentage-of-completion method, based on surveys of workperformed when the outcome of a contract can be estimatedreliably. In the early stages of contract completion, when theoutcome of a contract cannot be estimated reliably, contractrevenues are recognised only to the extent of costs incurred thatare expected to be recoverable.
Revenues from cost-plus-fee contracts are recognised on thebasis of costs incurred during the year plus the fee earnedmeasured by the cost-to-cost method.
Provision is made for all losses expected to arise on completion ofcontracts entered into at the balance sheet date, whether or notwork has commenced on these contracts.
Incentive payments are included in revenue when the contract issufficiently advanced and the amount of the incentive paymentscan be measured reliably. Claims are only included in revenuewhen negotiations have reached an advanced stage such that it isprobable the claim will be accepted and can be measured reliably.
Facilities management, engineering and training servicesRevenues from reimbursable contracts are recognised in theperiod in which the services are provided based on the agreedcontract schedule of rates.
Revenues from fixed-price contracts are recognised on thepercentage-of-completion method, measured by milestonescompleted or earned value when the outcome of a contract canbe estimated reliably. In the early stages of contract completion,when the outcome of a contract cannot be estimated reliably,contract revenues are recognised only to the extent of costsincurred that are expected to be recoverable.
Incentive payments are included in revenue when the contract issufficiently advanced and the amount of the incentive paymentscan be measured reliably. Claims are only included in revenuewhen negotiations have reached an advanced stage such that it isprobable the claim will be accepted and can be measured reliably.

Annual report and accounts 2005 Petrofac 55
Oil & gas activitiesOil & gas revenues comprise the group’s share of sales from theprocessing or sale of hydrocarbons on an entitlement basis.
Income taxesIncome tax expense represents the sum of the tax currentlypayable and deferred tax.
The tax currently payable is based on taxable profit for the year.Taxable profit differs from profit as reported in the incomestatement because it excludes items of income or expense thatare taxable or deductible in other years and it further excludesitems that are never taxable or deductible. The group’s liability forcurrent tax is calculated using tax rates that have been enacted orsubstantively enacted by the balance sheet date.
Deferred income tax is recognised on all temporary differences atthe balance sheet date between the carrying amounts of assetsand liabilities in the financial statements and the corresponding taxbases used in the computation of taxable profit, with the followingexceptions:• where the temporary difference arises from the initial
recognition of goodwill or of an asset or liability in a transactionthat is not a business combination that at the time of thetransaction affects neither accounting nor taxable profit or loss;
• in respect of taxable temporary differences associated withinvestments in subsidiaries, associates and joint ventures,where the timing of reversal of the temporary differences can becontrolled and it is probable that the temporary differences willnot reverse in the foreseeable future; and,
• deferred income tax assets are recognised only to the extentthat it is probable that a taxable profit will be available againstwhich the deductible temporary differences, carried forward taxcredits or tax losses can be utilised.
Deferred income tax assets and liabilities are measured on anundiscounted basis at the tax rates that are expected to applywhen the asset is realised or the liability is settled, based on taxrates and tax laws enacted or substantively enacted at the balancesheet date.
Income tax is charged or credited directly to equity if it relates toitems that are credited or charged to equity. Otherwise, income taxis recognised in the income statement.
Derivative financial instruments and hedging The group uses derivative financial instruments such as forwardcurrency contracts and interest rate caps and swaps to hedge itsrisks associated with foreign currency and interest ratefluctuations. Such derivative financial instruments are initiallyrecognised at fair value on the date on which a derivative contractis entered into and are subsequently remeasured at fair value.
Derivatives are carried as assets when the fair value is positive andas liabilities when the fair value is negative.
The fair value of forward currency contracts is calculated byreference to current forward exchange rates for contracts withsimilar maturity profiles. The fair value of interest rate cap and swapcontracts is determined by reference to market values for similarinstruments.
For the purposes of hedge accounting, hedges are classified as:• fair value hedges when hedging the exposure to changes in the
fair value of a recognised asset or liability; or,• cash flow hedges when hedging exposure to variability in cash
flows that is either attributable to a particular risk associatedwith a recognised asset or liability or a highly probable forecasttransaction.
Any gains or losses arising from changes in the fair value ofderivatives that do not qualify for hedge accounting are taken tothe income statement. The treatment of gains and losses arisingfrom revaluing derivatives designated as hedging instrumentsdepends on the nature of hedging relationship, as follows:
Fair value hedgesFor fair value hedges, the carrying amount of the hedged item isadjusted for gains and losses attributable to the risk being hedged;the derivative is remeasured at fair value and gains and losses fromboth are taken to the income statement. For hedged items carriedat amortised cost, the adjustment is amortised through the incomestatement such that it is fully amortised by maturity.
The group discontinues fair value hedge accounting if the hedginginstrument expires or is sold, terminated or exercised, the hedgeno longer meets the criteria for hedge accounting or the grouprevokes the designation.
Cash flow hedgesFor cash flow hedges, the effective portion of the gain or loss onthe hedging instrument is recognised directly in equity, while theineffective portion is recognised in the income statement. Amountstaken to equity are transferred to the income statement when thehedged transaction affects the income statement.
If the hedging instrument expires or is sold, terminated orexercised without replacement or rollover, or if its designation as ahedge is revoked, any cumulative gain or loss existing in equity atthat time remains in equity and is recognised when the forecasttransaction is ultimately recognised in the income statement.When a forecast transaction is no longer expected to occur, thecumulative gain or loss that was reported in equity is immediatelytransferred to the income statement.

56 Petrofac Annual report and accounts 2005
Notes to the consolidated financial statements(continued)
At 31 December 2005
3 Segment information The group’s primary continuing operations are organised on a worldwide basis into three business segments: Engineering & Construction,Operations Services and Resources. The accounting policies of the segments are the same as those described in note 2 above. Thegroup accounts for inter-segment sales as if the sales were to third parties, that is, at current market prices. The group evaluates theperformance of its segments and allocates resources to them based on this evaluation.
The group’s secondary segment reporting format is geographical. Geographical segments are based on the location of the group’sassets. Sales to external customers disclosed in geographical segments are based on the geographical location of its customers.
Business segmentsThe following tables present revenue and profit information and certain asset and liability information relating to the group’s businesssegments for the years ended 31 December 2005 and 2004. Included within the consolidation and eliminations columns are certainbalances, which due to their nature, are not allocated to segments.
Continuing operations
Engineering & Operations Consolidation Discontinued Total Construction Services Resources & eliminations Total operations Eliminations operations
US$’000 US$’000 US$’000 US$’000 US$’000 US$’000 US$’000 US$’000
Year ended 31 December 2005RevenueExternal sales 833,648 605,493 46,331 – 1,485,472 204 – 1,485,676Inter-segment sales 24,558 (162) – (24,396) – – – –Total revenue 858,206 605,331 46,331 (24,396) 1,485,472 204 – 1,485,676
ResultsSegment operating results 52,592 25,250 18,495 740 97,077 (875) – 96,202Unallocated corporate
income/(costs) – – – (8,474) (8,474) – – (8,474)
Profit/(loss) fromoperating activities 52,592 25,250 18,495 (7,734) 88,603 (875) – 87,728
Finance costs (166) (2,043) (986) (5,253) (8,448) – – (8,448)Finance income 4,023 82 129 (1,041) 3,193 60 – 3,253
Profit/(loss) beforeincome tax 56,449 23,289 17,638 (14,028) 83,348 (815) – 82,533
Income tax(expense)/income (1,386) (7,711) 683 463 (7,951) – – (7,951)
Net profit/(loss) 55,063 15,578 18,321 (13,565) 75,397 (815) – 74,582
Year ended 31 December 2004RevenueExternal sales 467,116 439,372 45,042 – 951,530 12,624 – 964,154Inter-segment sales 6,350 755 – (7,105) – 1,126 (1,126) –Total revenue 473,466 440,127 45,042 (7,105) 951,530 13,750 (1,126) 964,154
ResultsSegment operating results 33,524 17,347 17,164 (550) 67,485 (13,197) – 54,288Unallocated corporate
income/(costs) – – – 798 798 – – 798
Profit/(loss) fromoperating activities 33,524 17,347 17,164 248 68,283 (13,197) – 55,086
Finance costs (133) (1,127) (1,968) (4,316) (7,544) (5) – (7,549)Finance income 1,969 104 17 (93) 1,997 40 – 2,037
Profit/(loss) beforeincome tax 35,360 16,324 15,213 (4,161) 62,736 (13,162) – 49,574
Income tax(expense)/income (2,260) (6,681) (8,306) 548 (16,699) – – (16,699)
Minority interests – – 46 – 46 – – 46Net profit/(loss) 33,100 9,643 6,953 (3,613) 46,083 (13,162) – 32,921

Engineering & Operations Discontinued Consolidation TotalConstruction Services Resources operations & eliminations operations
US$’000 US$’000 US$’000 US$’000 US$’000 US$’000
Year ended 31 December 2005Assets and liabilitiesSegment assets 700,186 205,160 113,071 2,961 (45,875) 975,503Inter-segment assets (42,964) (2,774) (33) (104) 45,875 –Investments – – 2,413 – – 2,413
657,222 202,386 115,451 2,857 – 977,916Unallocated assets – – – – 3,158 3,158Income tax assets 603 736 7,750 – (3,513) 5,576Total assets 657,825 203,122 123,201 2,857 (355) 986,650
Segment liabilities 561,368 133,081 101,112 25,435 (130,157) 690,839Inter-segment liabilities (1,726) (19,891) (83,776) (24,764) 130,157 –
559,642 113,190 17,336 671 – 690,839Unallocated liabilities – – – – 95,353 95,353Income tax liabilities 2,142 5,610 1,861 – (4,282) 5,331Total liabilities 561,784 118,800 19,197 671 91,071 791,523
Other segment informationCapital expenditures:Property, plant and equipment 10,174 3,492 3,812 – 78 17,556Intangible oil & gas assets – – 4,825 – – 4,825Goodwill – 5,405 – – – 5,405
Charges:Depreciation 10,948 2,216 14,099 – (672) 26,591Amortisation – – – – 440 440Impairment losses – – – 250 – 250End-of-service benefits 2,206 636 36 – 25 2,903Share-based payments 685 102 – – 110 897
Year ended 31 December 2004Assets and liabilitiesSegment assets 489,663 164,717 119,173 7,385 (64,235) 716,703Inter-segment assets (63,166) (604) (61) (404) 64,235 –Investments – – 4,104 – – 4,104
426,497 164,113 123,216 6,981 – 720,807Unallocated assets – – – – 7,768 7,768Income tax assets – 780 – – 2 782Total assets 426,497 164,893 123,216 6,981 7,770 729,357
Segment liabilities 347,316 99,804 100,175 29,044 (108,273) 468,066Inter-segment liabilities (3,133) (16,751) (61,960) (26,429) 108,273 –
344,183 83,053 38,215 2,615 – 468,066Unallocated liabilities – – – – 118,026 118,026Income tax liabilities 712 3,838 – – 157 4,707Total liabilities 344,895 86,891 38,215 2,615 118,183 590,799
Other segment informationCapital expenditures:Property, plant and equipment 11,673 2,931 3,744 – (1,206) 17,142Intangible oil & gas assets – – 6,721 – – 6,721Goodwill – 19,118 – – – 19,118
Charges:Depreciation 8,356 1,357 14,809 106 (696) 23,932Goodwill amortisation – 2,168 316 – – 2,484Other amortisation – 263 – – 1,209 1,472End-of-service benefits 1,550 176 35 – 88 1,849
Annual report and accounts 2005 Petrofac 57

58 Petrofac Annual report and accounts 2005
Notes to the consolidated financial statements(continued)
At 31 December 2005
3 Segment information (continued)Geographical segmentsThe following tables present revenue, assets and capital expenditure by geographical segments for the years ended 31 December 2005and 2004.
FormerMiddle East Soviet
& Africa Union/Asia Europe Americas ConsolidatedUS$’000 US$’000 US$’000 US$’000 US$’000
Year ended 31 December 2005Segment revenueContinuing operations 354,326 609,270 518,175 3,701 1,485,472Discontinued operation – – – 204 204
354,326 609,270 518,175 3,905 1,485,676
Carrying amount of segment assets 488,164 306,209 185,153 7,124 986,650
Capital expenditure:Property, plant and equipment 3,755 9,920 3,843 38 17,556Intangible oil & gas assets – 2,070 2,755 – 4,825
Year ended 31 December 2004Segment revenueContinuing operations 281,678 272,384 392,085 5,383 951,530Discontinued operation – – – 12,624 12,624
281,678 272,384 392,085 18,007 964,154
Carrying amount of segment assets 382,100 127,561 207,576 12,120 729,357
Capital expenditure:Property, plant and equipment 5,674 8,851 2,537 80 17,142Intangible oil & gas assets – 6,721 – – 6,721
4 Revenues and expensesa. Revenue
2005 2004US$’000 US$’000
Rendering of services 1,478,187 945,375Sale of processed hydrocarbons 7,285 6,155
1,485,472 951,530
b. Other income2005 2004
US$’000 US$’000Restated
Gain on sale of investments 2,390 2,932Foreign exchange gains 1,200 2,088Other income 1,614 1,206Gain on sale of property, plant and equipment 19 20
5,223 6,246
c. Other expenses2005 2004
US$’000 US$’000
Foreign exchange losses 2,302 1,460Other expenses 189 127
2,491 1,587

Annual report and accounts 2005 Petrofac 59
d. Selling, general and administration expenses 2005 2004
US$’000 US$’000Restated
Included in selling, general and administration expenses:Staff costs 40,893 27,910Depreciation 2,221 1,684Amortisation and impairment 440 3,956Other operating expenses 31,374 25,275
74,928 58,825
In the year ended 31 December 2005, other operating expenses include US$6,311,000 of legal and professional expenses in relation tothe Company’s listing on the London Stock Exchange in October 2005 (2004: nil).
2005 2004US$’000 US$’000
Restated
Total staff costs:Wages and salaries 359,860 283,915Social security costs 23,494 22,097Defined contribution pension costs 7,252 6,823End-of-service benefit costs (note 23) 2,903 1,849Expense of share based payments 897 –
394,406 314,684
The average number of persons employed by the group during the year in continuing operations was 6,598 (2004: 5,284).
Equity-settled transactionsOn 29 April 2005 the Company introduced a Long Term Incentive Plan (LTIP) for senior employees (including directors). Under the schemerules, participatory interests in ordinary shares are granted to eligible employees. Unless varied by the Trustees of the scheme, 25% ofthe participatory interests in ordinary shares granted vest on award date with the balance vesting equally over the following three years,provided the recipients remain employees of the group. The scheme rules also stipulate participatory interests in ordinary shares will vestimmediately on the occurrence of certain events, including the admission of the Company’s shares to the Official List and to trading onthe London Stock Exchange.
In the year to 31 December 2005, 53,000 participatory interests in US$1.00 ordinary shares were granted under the LTIP scheme rules.The fair value of the interests granted, as determined using a net asset based formula, was US$897,000 or US$16.93 per US$1.00ordinary share. As a result of the Company’s listing on the London Stock Exchange on 7 October 2005, as governed by the LTIP schemerules, all then unvested awards of participatory interests in ordinary shares vested immediately. Consequently, the group recognised atotal expense of US$897,000 during the year in relation to these equity-settled transactions (2004: nil).
Auditors’ remuneration(including out-of-pocket expenses) 2005 2004
US$’000 US$’000
Audit fees 651 564Fees for other services:Assurance services related to the Company’s Initial Public Offering 2,262 –Tax services 154 118Other 67 105
3,134 787

Notes to the consolidated financial statements(continued)
At 31 December 2005
60 Petrofac Annual report and accounts 2005
5 Finance costs/(income)2005 2004
US$’000 US$’000Restated
Interest payable:Long-term borrowings 5,954 6,608Other interest, including short-term loans and overdrafts 1,938 936“A” ordinary shares 556 –Total finance cost 8,448 7,544
Bank interest receivable (2,952) (1,644)Other interest receivable (241) (353)Total finance income (3,193) (1,997)
“A” ordinary sharesDuring the year, the conditions allowing the Company to call upon 3i Group plc (3i) to convert its unsecured variable rate loan notes toequity (as “A” ordinary shares) were satisfied (note 22(ix)). Under IAS 32 ‘Financial Instruments: Disclosure and Presentation’, theCompany classified the “A” ordinary shares as a financial liability, as the then Articles of Association of the Company provided the shareswith priority of dividends, including the right to an annual 5% fixed dividend. The finance cost of US$556,000 in 2005 reflects the 5%dividend accruing on the “A” ordinary shares between the date of issue and the date the “A” ordinary shares were reclassified as ordinaryshares (note 20).
Other interest receivableOther interest receivable includes shareholder loan interest receivable on loans advanced to employees for the purchase of participatoryinterests in ordinary shares of the Company (note 16). The offer to purchase participatory interests in ordinary shares was extendedthrough the Petrofac Limited Executive Share Scheme (ESS), which is administered by Petrofac ESOP. The rules of the ESS, unless variedby the Trustee, required a down-payment on acquisition of participatory interests with the balance structured as an interest bearingshareholder loan note, payable over three years. Shareholder loan notes bear interest at rates between 3.4% and 4.5% (2004: between3.4% and 6.2%) dependent on the year of issue.
6 Income taxa. Tax on ordinary activitiesThe major components of income tax expense are as follows:
2005 2004US$’000 US$’000
Current income taxCurrent income tax charge 13,495 15,576Adjustments in respect of current income tax of previous years (590) 69Deferred income taxRelating to origination and reversal of temporary differences (4,929) 1,095Adjustment in respect of deferred income tax of previous year (25) (41)Income tax expense reported in Consolidated Income Statement 7,951 16,699
b. Reconciliation of total tax chargeUnder Article 123A of the Income Tax (Jersey) law 1961, as amended, the Company has obtained Jersey exempt company status andis therefore exempt from Jersey income tax on non Jersey source income and bank interest (by concession). An annual exempt companyfee is payable by the Company.
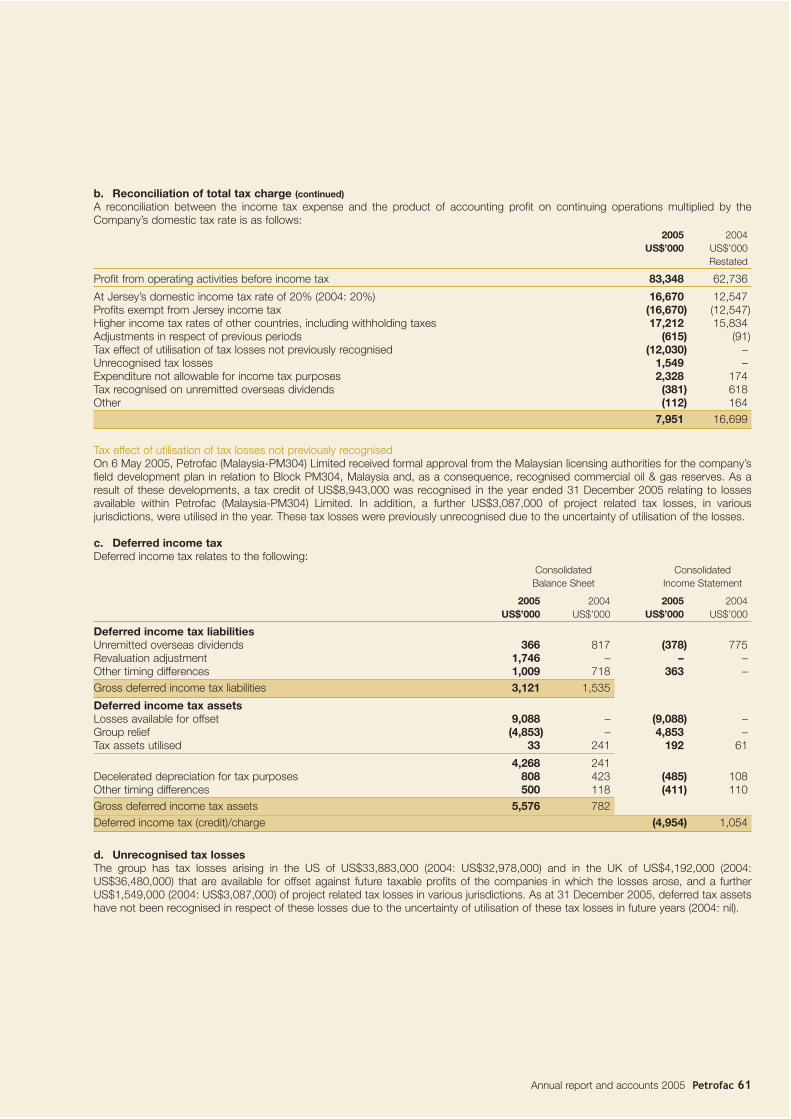
b. Reconciliation of total tax charge (continued)A reconciliation between the income tax expense and the product of accounting profit on continuing operations multiplied by theCompany’s domestic tax rate is as follows:
2005 2004US$’000 US$’000
Restated
Profit from operating activities before income tax 83,348 62,736
At Jersey’s domestic income tax rate of 20% (2004: 20%) 16,670 12,547Profits exempt from Jersey income tax (16,670) (12,547)Higher income tax rates of other countries, including withholding taxes 17,212 15,834Adjustments in respect of previous periods (615) (91)Tax effect of utilisation of tax losses not previously recognised (12,030) –Unrecognised tax losses 1,549 –Expenditure not allowable for income tax purposes 2,328 174Tax recognised on unremitted overseas dividends (381) 618Other (112) 164
7,951 16,699
Tax effect of utilisation of tax losses not previously recognisedOn 6 May 2005, Petrofac (Malaysia-PM304) Limited received formal approval from the Malaysian licensing authorities for the company’sfield development plan in relation to Block PM304, Malaysia and, as a consequence, recognised commercial oil & gas reserves. As aresult of these developments, a tax credit of US$8,943,000 was recognised in the year ended 31 December 2005 relating to lossesavailable within Petrofac (Malaysia-PM304) Limited. In addition, a further US$3,087,000 of project related tax losses, in variousjurisdictions, were utilised in the year. These tax losses were previously unrecognised due to the uncertainty of utilisation of the losses.
c. Deferred income taxDeferred income tax relates to the following:
Consolidated ConsolidatedBalance Sheet Income Statement
2005 2004 2005 2004US$’000 US$’000 US$’000 US$’000
Deferred income tax liabilitiesUnremitted overseas dividends 366 817 (378) 775Revaluation adjustment 1,746 – – –Other timing differences 1,009 718 363 –Gross deferred income tax liabilities 3,121 1,535
Deferred income tax assetsLosses available for offset 9,088 – (9,088) –Group relief (4,853) – 4,853 –Tax assets utilised 33 241 192 61
4,268 241Decelerated depreciation for tax purposes 808 423 (485) 108Other timing differences 500 118 (411) 110Gross deferred income tax assets 5,576 782Deferred income tax (credit)/charge (4,954) 1,054
d. Unrecognised tax lossesThe group has tax losses arising in the US of US$33,883,000 (2004: US$32,978,000) and in the UK of US$4,192,000 (2004:US$36,480,000) that are available for offset against future taxable profits of the companies in which the losses arose, and a furtherUS$1,549,000 (2004: US$3,087,000) of project related tax losses in various jurisdictions. As at 31 December 2005, deferred tax assetshave not been recognised in respect of these losses due to the uncertainty of utilisation of these tax losses in future years (2004: nil).
Annual report and accounts 2005 Petrofac 61

Notes to the consolidated financial statements(continued)
At 31 December 2005
62 Petrofac Annual report and accounts 2005
7 Discontinued operationsOn 29 April 2003, the group sold certain assets of Petrofac Inc., a wholly owned subsidiary, for cash consideration. The assets soldcomprised substantially all of the operating assets of Petrofac Inc. although the group retained contractual responsibility for the work inhand at the date of the sale. By 31 December 2005, all physical work relating to residual projects within the business of Petrofac Inc. wascomplete, subject to a number of relatively minor commercial issues, principally relating to ongoing legal disputes.
The results of Petrofac Inc. are presented below: 2005 2004
US$’000 US$’000
Revenue 204 13,750Cost of sales (375) (26,039)
Gross loss (171) (12,289)Selling, general and administration expenses (784) (1,043)Other income 80 135
Loss from discontinued operation (875) (13,197)Finance income, net 60 35
Loss before tax from discontinued operation (815) (13,162)Income tax expense – –Net loss attributable to discontinued operation (815) (13,162)
The major classes of assets and liabilities comprising the discontinued operation are as follows:2005 2004
US$’000 US$’000
Property, plant and equipment 28 28Work in progress 9 347Trade and other receivables 1,131 1,315Other current assets – 1,800Cash and short-term deposits 126 217
1,294 3,707Assets classified as held for sale:Freehold land and buildings 1,667 3,678Total assets 2,961 7,385
Trade and other payables 25,373 28,109Accrued contract expenses and provisions – 830Accrued expenses and other liabilities 62 105Total liabilities 25,435 29,044
Net liabilities of discontinued operation (22,474) (21,659)
Trade and other payables include US$24,742,000 (2004: US$26,290,000) payable to the Company.
Freehold land and buildings included in assets held for sale are valued at the lower of cost and fair value less costs to sell. An impairmentprovision of US$250,000 was recognised in the year ended 31 December 2005 (2004: nil) in relation to a freehold property, reflecting itsanticipated fair value, net of selling costs. This charge is included within the selling, general and administration expense of US$784,000.
Cash flowThe cash flows of Petrofac Inc. have been disclosed on the face of the Consolidated Cash Flow Statement.
Earnings per share The earnings per share from discontinued operations are as set out below. The weighted average number of shares used for calculatingboth basic and diluted earnings per share for 2004 have been restated to reflect the Company’s 40:1 share split (note 20).
2005 2004US$’000 US$’000
Restated
Earnings per share (US cents):Basic from discontinued operations (0.27) (3.77)Diluted from discontinued operations (0.24) (3.23)

8 Earnings per shareBasic earnings per share amounts are calculated by dividing the net profit for the year attributable to ordinary shareholders by theweighted average number of ordinary shares outstanding during the year.
Diluted earnings per share amounts are calculated by dividing the net profit attributable to ordinary shareholders, after adding interestrelating to convertible share warrants, by the weighted average number of ordinary shares outstanding during the year, adjusted for theeffects of dilutive warrants and options on ordinary shares.
The weighted average number of ordinary shares used for calculating both basic and diluted earnings per share for 2004 have beenrestated to reflect the Company’s 40:1 share split (note 20).
The following reflects the income and share data used in calculating basic and diluted earnings per share:
Continuing and discontinued operations2005 2004
US$’000 US$’000
Net profit attributable to ordinary shareholders for basic earnings per share 74,582 32,921Income statement charge on variable rate unsecured loan notes (note 22 (ix)) 1,873 2,611Net profit attributable to ordinary shareholders for diluted earnings per share 76,455 35,532
Continuing operations2005 2004
US$’000 US$’000
Net profit attributable to ordinary shareholders for basic earnings per share 75,397 46,083Income statement charge on variable rate unsecured loan notes (note 22 (ix)) 1,873 2,611Net profit attributable to ordinary shareholders for diluted earnings per share 77,270 48,694
2005 2004Number Number
’000 ’000Restated
Weighted average number of ordinary shares for basic earnings per share 304,141 349,280Convertible share warrants (note 20) 39,361 55,992Ordinary share option 1,134 3,000Unvested portion of LTIP shares 166 –Adjusted weighted average number of ordinary shares for diluted earnings per share 344,802 408,272
To calculate discontinued earnings per share, the weighted average number of ordinary shares for both basic and diluted is as set outabove. The following reflects the loss figure used as the numerator:
2005 2004US$’000 US$’000
Net loss attributable to ordinary shareholders from discontinued operations for basic and diluted earnings per share (815) (13,162)
Annual report and accounts 2005 Petrofac 63

Notes to the consolidated financial statements(continued)
At 31 December 2005
64 Petrofac Annual report and accounts 2005
9 Dividends paid and proposedAll dividend per ordinary share figures within this note reflect the Company’s 40:1 share split (note 20).
2005 2004US$’000 US$’000
Declared and paid during the yearEquity dividends on ordinary shares:
Final dividend for 2004: 2.30 cents (2003: 0.36 cents) 6,586 1,3152005 pre-listing dividend: 3.01 cents 8,657 –
15,243 1,315
On 19 August 2005, a dividend of 40 cents per “A” ordinary share was approved for payment. Under IAS 32, and prior to thereclassification of the “A” ordinary shares to ordinary shares (note 20), the Company classified the “A” ordinary shares as a financial liabilityrather than as part of equity. As a consequence, the dividend paid on these “A” ordinary shares is recognised in the income statementas a finance cost.
2005 2004US$’000 US$’000
Proposed for approval at AGM (not recognised as a liability as at 31 December)Equity dividends on ordinary shares:
Final dividend for 2005: 1.87 cents (2004: 2.30 cents) 6,454 6,586
10 Property, plant and equipmentLand, buildings Office
Oil & gas Oil & gas and leasehold Plant and furniture andassets facilities improvements equipment Vehicles equipment Total
US$’000 US$’000 US$’000 US$’000 US$’000 US$’000 US$’000
CostAt 1 January 2004 – 121,076 11,504 17,095 6,425 11,112 167,212Adjustment to opening balances – – – (650) – 650 –Additions – 2,285 3,316 2,761 3,819 4,961 17,142Acquisition of subsidiaries – – 9,210 2,431 106 – 11,747Transfer attributable to discontinued
operation – – (4,382) – – – (4,382)Disposals – – – (110) (709) (2,624) (3,443)Exchange difference – 12 358 134 42 347 893
At 1 January 2005 – 123,373 20,006 21,661 9,683 14,446 189,169Transfers – – – (342) 55 287 –Additions 2,765 1,218 937 1,620 3,940 7,076 17,556Acquisition of subsidiaries – – – – – 81 81Transfers from intangible oil & gas assets 8,467 – – – – – 8,467Disposals – – (376) (401) (627) (1,621) (3,025)Exchange difference – – (1,284) (881) (57) (783) (3,005)
At 31 December 2005 11,232 124,591 19,283 21,657 12,994 19,486 209,243
DepreciationAt 1 January 2004 – (20,136) (1,884) (11,964) (2,097) (7,965) (44,046)Adjustment to opening balances – – – 467 – (467) –Charge for the year – (13,734) (3,017) (2,456) (2,515) (2,210) (23,932)Acquisition of subsidiaries – – (168) (560) (32) – (760)Transfer attributable to discontinued
operation – – 704 – – – 704Disposals – – – 2 464 2,259 2,725Exchange difference – (1) (89) (69) (8) (280) (447)
At 1 January 2005 – (33,871) (4,454) (14,580) (4,188) (8,663) (65,756)Transfers – – – 110 (3) (107) –Charge for the year – (13,009) (3,394) (2,628) (3,432) (4,128) (26,591)Disposals – – 239 241 503 1,598 2,581Exchange difference – – 137 352 26 439 954
At 31 December 2005 – (46,880) (7,472) (16,505) (7,094) (10,861) (88,812)
Net carrying amount:At 31 December 2005 11,232 77,711 11,811 5,152 5,900 8,625 120,431
At 31 December 2004 – 89,502 15,552 7,081 5,495 5,783 123,413

Oil & gas facilities include capitalised interest, net of depreciation, of US$2,927,000 (2004: US$3,421,000).
Of the total charge for depreciation in the income statement for continuing operations, US$24,370,000 (2004: US$22,142,000) isincluded in cost of sales and US$2,221,000 (2004: US$1,684,000) in selling, general and administration expenses.
11 Business combinationsPlant Asset Management On 20 October 2005, the group acquired the remaining 49% minority interest stake in Plant Asset Management Limited (Plant AssetManagement) for a total consideration of US$1,644,000 including transaction cost of US$52,000. The consideration was settled in cash.The difference between the consideration paid and the fair value of assets acquired has been allocated as goodwill and is included in theFacilities Management cash-generating unit for the purposes of impairment testing. Included in the US$1,644,000 of goodwill recognisedabove are certain intangible assets that cannot be individually separated and reliably measured due to their nature.
Prior to acquisition, the group did not carry a minority interest balance in relation to Plant Asset Management as the company had netliabilities and the group had no rights of recovery against the minority shareholders.
Petrofac OhanetOn 27 May 2005, following the group’s voluntary prepayment of non-recourse project finance provided by GE Structured Finance inrelation to the Ohanet project (note 22), the group exercised its option to acquire Petrofac Resources (Ohanet) Jersey Limited (PetrofacOhanet) for US$2,400,000. The consideration was settled in cash. The option to acquire Petrofac Ohanet was established in May 2002as part of the group’s corporate reorganisation and the investment by 3i (note 22). Prior to exercising the option, the group consolidatedthe financial results of Petrofac Ohanet in its consolidated financial statements as the group held significant operating and financial controlover the company. The consideration paid to exercise the option has been taken to equity.
Rubicon ResponseOn 28 January 2005, the group acquired 100% of the issued and outstanding shares of Rubicon Response Limited (Rubicon Response),a leading provider of emergency response management consultancy and training services to the upstream oil & gas exploration andproduction markets. Total consideration for the acquisition of the shares inclusive of transaction costs of US$82,000, was US$6,326,000.The fair value of the net assets acquired was US$2,565,000.
The fair value and carried value of the identifiable net assets and liabilities acquired were as follows:US$’000
Property, plant and equipment 81Trade and other receivables 1,083Cash and short-term deposits 2,253
Total assets 3,417
Deferred tax liability (11)Trade and other payables (841)
Total liabilities (852)
Fair value of net assets acquired 2,565Goodwill arising on acquisition (note 12) 3,761
6,326
Cash outflow on acquisition:Net cash acquired with the subsidiary 2,253Cash paid on acquisition (6,326)
(4,073)
Included in the US$3,761,000 of goodwill recognised above are certain intangible assets that cannot be individually separated and reliablymeasured due to their nature.
From the date of acquisition, Rubicon Response has contributed US$399,000 to net profit for the group. If the combination had takenplace at the beginning of the year, net profit for the group would have been US$74,608,000 and revenue from continuing operationswould have been US$1,485,655,000.
ChrysalisOn 1 April 2003, the group acquired the entire trade and assets and liabilities of Chrysalis Learning Limited (Chrysalis), a UK provider oftraining services, for consideration of US$29,000. The net liabilities of Chrysalis acquired on the date of acquisition were US$344,000.On 26 August 2004, the group paid an additional US$695,000 as earn-out consideration.
Annual report and accounts 2005 Petrofac 65

Notes to the consolidated financial statements(continued)
At 31 December 2005
66 Petrofac Annual report and accounts 2005
11 Business combinations (continued)Petrofac (Malaysia-PM304) LimitedOn 16 June 2004, the group acquired 100% of the issued and outstanding shares of Amerada Hess (Malaysia-PM304) Limited.Subsequent to the acquisition, the company name was changed to Petrofac (Malaysia-PM304) Limited (PM304). At the date ofacquisition, PM304 held a 40.5% interest in a Production Sharing Contract (PSC) in Block PM304, Malaysia. The consideration for theacquisition was US$3,418,000 in cash with further cash consideration of US$4,450,000 due (note 24), contingent on the commercialproduction of oil from the block. No goodwill arose on this acquisition.
Under pre-emption rights contained within the PSC, PM304 entered into a sale and purchase agreement with a partner in the PSC forthe sale of 10.5% of the PSC on, pro rata, the same commercial terms and conditions associated with the acquisition from AmeradaHess. The total consideration payable by the partner for the 10.5% share of the PSC is US$2,040,000 of which US$1,154,000 isdeferred, contingent on commercial production of oil from the block.
The fair value of the identifiable assets and liabilities acquired, net of the pre-emption disposal, were as follows:US$’000
Intangible oil & gas asset 5,828Inventories 369Trade and other receivables 11Cash and short-term deposits 4
Total assets 6,212
Trade and other payables (20)Other current liabilities (364)
Total liabilities (384)Fair value of net assets acquired 5,828
Petrofac TrainingOn 12 February 2004, the group acquired 100% of the issued and outstanding shares of RGIT Montrose Holdings Limited, a leadingprovider of training and consultancy services to the upstream oil & gas exploration and production markets. Following the acquisition, thecompany changed its name to Petrofac Training Holdings Limited (Petrofac Training). Total consideration for the acquisition of the shares,inclusive of transaction costs of US$562,000, was US$17,236,000. The fair value of the identifiable net assets and liabilities of PetrofacTraining acquired were as follows:
US$’000
Property, plant and equipment 10,987Goodwill 4,707Other non-current assets 386Trade and other receivables 7,259Other current assets 2,508Cash and short-term deposits 609
Total assets 26,456
Non-current interest-bearing loan notes (8,678)Deferred tax liability (580)Trade and other payables (8,938)Current interest-bearing loan notes (1,159)Other current liabilities (3,409)
Total liabilities (22,764)
Fair value of net assets acquired 3,692Goodwill arising on acquisition (note 12) 13,544
17,236
Included in the goodwill recognised above are certain intangible assets that cannot be individually separated and reliably measured dueto their nature.

Petrofac Training (continued)
Cash outflow on acquisition:US$’000
Net cash acquired with the subsidiary 609Cash paid on acquisition (9,728)
(9,119)
The consideration was settled by a combination of cash and the issue of bank guaranteed loan notes. Interest is payable on the loannotes at UK LIBOR less 1% (note 22).
Kyrgyz Petroleum CompanyOn 29 January 2004, Petrofac Resources International Limited (PRIL), acquired a 50% interest in Kyrgyz Petroleum Company (KPC) fromits subsidiary Kyrgoil Holding Corporation (KHC). PRIL indirectly held a 32.1% interest in KPC during 2004 to the date of acquisition,through its 64.2% investment in KHC. The agreed consideration for the acquisition was the cancellation of 50 million shares held in KHCand a cash payment of US$1,000,000. The fair value of the shares at the date of cancellation was US$3,562,000.
12 GoodwillWith effect 1 January 2005, following the prospective adoption of IFRS 3, the group has ceased to amortise goodwill and hereafter testsfor impairment on an annual basis, or more frequently if events or changes in circumstances indicate that goodwill may be impaired.
A summary of the movements in goodwill is presented below:
2005 2004US$’000 US$’000
At 1 January, net of amortisation 49,653 26,376Acquisitions during the year 5,405 19,118Amortisation charge – (2,484)Exchange difference (5,875) 6,643At 31 December, net of amortisation 49,183 49,653
Goodwill acquired through business combinations has been allocated to three individual cash-generating units, which are reportablesegments, for impairment testing as follows:• Facilities Management cash-generating unit (comprising Petrofac Facilities Management and Plant Asset Management)• Training cash-generating unit (comprising Petrofac Training, Chrysalis Learning and Rubicon Response)• Resources cash-generating unit (comprising Petrofac Resources International Limited)
These represent the lowest level within the group at which the goodwill is monitored for internal management purposes.
Facilities Management and Training cash-generating unitsThe recoverable amounts for the Facilities Management and Training units have been determined based on value in use calculations,using discounted pre-tax cash flow projections. Management has adopted a 10 year projection period to assess each unit’s value in useas it considers the life of the goodwill for both the Facilities Management and Training cash-generating units to significantly exceed the5 year impairment test period referred to in IAS 36. The cash flow projections are based on financial budgets approved by seniormanagement covering a three-year period, extrapolated, thereafter at a growth rate of 5% per annum. Management considers this aconservative long-term growth rate relative to both the economic outlook for the units in their respective markets within the oil & gasindustry and the growth rates experienced in the recent past by each unit.
Resources cash-generating unitThe recoverable amount of the Resources unit is also determined on a value in use calculation using discounted pre-tax cash flowprojections based on financial budgets and economic parameters for the unit approved by senior management and covering a five-yearperiod, as recommended under IAS 36.
Carrying amount of goodwill allocated to each of the cash-generating units2005 2004
US$’000 US$’000
Facilities Management unit 26,117 27,849Training unit 20,849 19,587Resources unit 2,217 2,217At 31 December 49,183 49,653
Annual report and accounts 2005 Petrofac 67

Notes to the consolidated financial statements(continued)
At 31 December 2005
68 Petrofac Annual report and accounts 2005
12 Goodwill (continued)Key assumptions used in value in use calculationsThe calculation of value in use for both the Facilities Management and Training units is most sensitive to the following assumptions:• Market share• Growth rate• Net profit margins; and,• Discount rate
Market share: the assumption relating to market share for the Facilities Management unit is based on the unit re-securing those existingcustomer contracts in the UK which are due to expire during the projection period; for the Training unit, the key assumptions relate tomanagement’s assessment of maintaining the unit’s market share in the UK and developing further the business in international markets.
Growth rate: estimates are based on management’s assessment of market share having regard to macro-economic factors and thegrowth rates experienced in the recent past by each unit. A growth rate of 5% per annum has been applied for the remaining 7 years ofthe 10 year projection period.
Net profit margins: estimates are based on management’s assumption of achieving a level of performance at least in line with the recentpast performance of each of the units.
Discount rate: management has used a discount rate of 9.1% per annum throughout the assessment period, reflecting the estimatedweighted average cost of capital of the group. This discount rate has been calculated using an estimated risk free rate of return adjustedfor the group’s estimated equity market risk premium and the group’s cost of debt.
The calculation of value in use for the Resources unit is most sensitive to the following assumptions:• Financial returns; and,• Discount rate
Financial returns: estimates are based on the unit achieving returns on existing investments (comprising both those that are currently cashflowing and those which are in development and which may therefore be consuming cash) at least in line with current forecast incomeand cost budgets during the planning period.
Discount rate: management has used an estimate of the pre-tax weighted average cost of capital of the group plus a risk premium toreflect the particular risk characteristics of each individual investment. The discount rates range between 9.9% and 17.0%.
Sensitivity to changes in assumptionsWith regard to the assessment of value in use of the cash generating units, management believes that no reasonably possible changesin any of the above key assumptions would cause the carrying value of the relevant unit to exceed its recoverable amount, after givingdue consideration to the macro-economic outlook for the oil & gas industry and the commercial arrangements with customersunderpinning the cash flow forecasts for each of the units.
13 Intangible assetsIntangible oil & gas assets
2005 2004US$’000 US$’000
At 1 January 6,721 –Additions 4,825 6,721Transferred to tangible oil & gas assets (8,467) –Exchange difference (97) –At 31 December 2,982 6,721
On 6 May 2005, Petrofac (Malaysia–PM304) Limited received formal approval from the Malaysian licensing authorities for the company’sfield development plan in relation to Block PM304, Malaysia and, as a consequence, recognised commercial oil & gas reserves. As aresult of this development, the carrying value of intangible assets associated with Block PM304 was transferred from intangible oil & gasassets to tangible oil & gas assets.
Intangible oil & gas assets at 31 December 2005 relate to the group’s interest in two UK offshore oil & gas licences.

14 Interest in joint venturesIn the normal course of business, the group establishes jointly controlled entities and operations for the execution of certain of itsoperations and contracts. The group’s share of assets, liabilities, revenues and expenses relating to jointly controlled entities andoperations, which are proportionately consolidated within these consolidated financial statements, are as follows:
2005 2004US$’000 US$’000
Revenue 159,041 229,237Cost of sales (150,802) (251,690)
Gross profit/(loss) 8,239 (22,453)Selling, general and administration expenses (883) (742)Finance income, net 21 46
Profit/(loss) before income tax 7,377 (23,149)Income tax (373) (224)Net profit/(loss) 7,004 (23,373)
Current assets 96,266 99,154Non-current assets 12,314 16,970
Total assets 108,580 116,124
Current liabilities 100,276 112,776Non-current liabilities 290 132
Total liabilities 100,566 112,908Net assets 8,014 3,216
15 Available-for-sale financial assets2005 2004
US$’000 US$’000
Shares – listed 2,413 4,104
Available-for-sale financial assets consist of investments in ordinary shares and therefore have no fixed maturity date or coupon rate.
16 Other financial assets2005 2004
US$’000 US$’000
Other financial assets – non-currentFair value of derivative instruments 672 6,394Notes receivable from shareholders – 3,342Restricted cash – 91Other 8 1,378
680 11,205
Other financial assets – currentRestricted cash 1,648 17,587Fair value of derivative instruments 461 17,371Short-term notes receivable from shareholders 414 2,057Other 1,978 828
4,501 37,843
Restricted cash is comprised of deposits with financial institutions securing various guarantees and performance bonds associated withthe group’s trading activities.
Annual report and accounts 2005 Petrofac 69

Notes to the consolidated financial statements(continued)
At 31 December 2005
70 Petrofac Annual report and accounts 2005
17 Work in progress and billings in excess of cost and estimated earnings2005 2004
US$’000 US$’000
Cost and estimated earnings 1,453,455 820,360Less: Billings (1,218,408) (711,323)Work in progress 235,047 109,037
Billings 210,582 148,334Less: Cost and estimated earnings (140,806) (76,179)Billings in excess of cost and estimated earnings 69,776 72,155
18 Trade and other receivables2005 2004
US$’000 US$’000
Contract receivables 290,313 194,919Retentions receivable 5,408 2,190Advances 18,256 4,329Prepayments and deposits 9,213 9,866Other receivables 2,526 5,492
325,716 216,796
Contract receivables are non-interest bearing and are generally on 30 to 60 days’ terms.
Advances represent payments made to certain of the group’s sub-contractors for projects in progress, on which the related work hadnot been performed at the balance sheet date.
19 Cash and short-term deposits2005 2004
US$’000 US$’000
Cash at bank and in hand 91,339 45,169Short-term deposits 117,557 98,365
208,896 143,534
Cash at bank earns interest at floating rates based on daily bank deposit rates. Short-term deposits are made for varying periods ofbetween one day and one month depending on the immediate cash requirements of the group, and earn interest at respective short-term deposit rates. The fair value of cash and bank balances is US$208,896,000 (2004: US$143,534,000).
For the purposes of the cash flow statement, cash and cash equivalents comprise the following:2005 2004
US$’000 US$’000
Cash at bank and in hand 91,339 45,169Short-term deposits 117,557 98,365Bank overdrafts (note 22) (6,055) (15,711)
202,841 127,823

20 Share capitalOn 15 September 2005, conditional upon listing on the London Stock Exchange, the shareholders of the Company approved thereclassification of the issued “A” ordinary shares as ordinary shares and, immediately following the reclassification, a 40:1 share split forall ordinary shares then authorised such that the nominal value of ordinary shares reduced from US$1.00 per share to US$0.025 pershare. The shareholders also conditionally approved the redemption of the “B” deferred share at its nominal value. On 7 October 2005the Company’s shares were admitted to the Official List and to trading on the London Stock Exchange, at which time the reclassificationof the “A” ordinary shares and the subsequent share split became unconditional, and the “B” deferred share was redeemed at its nominalvalue.
The share capital of the Company as at 31 December was as follows: 2005 2004
US$’000 US$’000
Authorised750,000,000 ordinary shares of US$0.025 each (2004: 15,000,000 ordinary shares of US$1.00 each) 18,750 15,000
Nil “A” ordinary shares of US$1.00 each (2004: 3,750,000 “A” ordinary shares of US$1.00 each) – 3,750
Nil deferred ordinary share of US$1.00 (Class “B”) (2004: 1 ordinary share Class “B”) – –
Issued and fully paid345,159,920 ordinary shares of US$0.025 each (2004: 7,166,330 ordinary shares of US$1.00 each) 8,629 7,166Nil deferred ordinary share of US$1.00 each (Class “B”) (2004: 1 ordinary share Class “B”) – –
8,629 7,166
The movement in the number of issued and fully paid ordinary shares and “A” ordinary shares is as follows:Number
Ordinary sharesBalance of ordinary shares of US$1.00 each at 1 January 2004 9,066,401Issued during the year 346,617Repurchased and cancelled during the year (2,246,688)
Balance of ordinary shares of US$1.00 each at 31 December 2004 7,166,330Issued in period to 7 October 2005 47,486Reclassification of “A” ordinary shares of US$1.00 each as ordinary shares of US$1.00 each 1,397,557
Balance of ordinary shares of US$1.00 each at 7 October 2005 and immediately prior to share split 8,611,373
Balance of ordinary shares of US$0.025 each following the Company’s 40:1 share split 344,454,920Issued during the period 7 October 2005 to 31 December 2005 705,000Balance of ordinary shares of US$0.025 each at 31 December 2005 345,159,920
“A” ordinary sharesBalance at 1 January 2005 –Issued during the year 1,397,557Reclassification as ordinary shares of US$1.00 each (1,397,557)Balance at 31 December 2005 –
During 2005, the Company issued 47,486 ordinary shares of US$1.00 each and 705,000 ordinary shares of US$0.025 each to PetrofacESOP for a combined consideration of US$1,102,000.
Annual report and accounts 2005 Petrofac 71

Notes to the consolidated financial statements(continued)
At 31 December 2005
72 Petrofac Annual report and accounts 2005
20 Share capital (continued)Between 21 June 2005, being the date of issue, and 7 October 2005, being the date of reclassification, the “A” ordinary shares wereclassified as a financial liability (see share options note below).
During 2004, the Company issued 115,000 ordinary shares of US$1.00 each to the senior executives of Petrofac Training for a totalconsideration of US$1,511,000 and 231,617 ordinary shares of US$1.00 each to Petrofac ESOP for a total consideration ofUS$3,043,000.
On 21 October 2004, the Company repurchased 2,246,688 ordinary shares from two retiring senior executives for a total considerationof US$30,760,000. The premium on the share buy-back of US$28,513,000 has been deducted from the share premium account. Theshares repurchased were cancelled.
Petrofac ESOPThrough Petrofac ESOP, the Company temporarily warehouses ordinary shares that are expected, in the foreseeable future, to be offeredto new or existing employees (including directors). The movements in the warehousing of ordinary shares are noted below:
2005 2004Number Number
Share transactions prior to the Company’s 40:1 share splitNew issue of US$1.00 ordinary shares of the Company acquired by Petrofac ESOP 47,486 231,617
Existing US$1.00 ordinary shares of the Company acquired by Petrofac ESOP 185,989 176,569
US$1.00 ordinary shares of the Company sold by Petrofac ESOP (198,100) (418,100)
US$1.00 ordinary shares granted under LTIP awards by Petrofac ESOP (35,375) –
Share transactions after the Company’s 40:1 share splitNew issue of US$0.025 ordinary shares of the Company acquired by Petrofac ESOP 705,000 –
Existing US$0.025 ordinary shares of the Company acquired by Petrofac ESOP 40,000 –
US$0.025 ordinary shares granted under LTIP awards by Petrofac ESOP (705,000) –
The net difference between the acquisition (including new shares issued and acquired by Petrofac ESOP) and sales cost of US$1,398,000(2004: US$2,784,000) has been credited to the share premium account of the Company. At 31 December 2005, Petrofac ESOP held40,000 ordinary shares of US$0.025 each in the Company and, in respect of which, had an indebtedness to the Company of US$17,000(31 December 2004: nil shares and indebtedness of nil).
Share optionsIn 2002 the Company extended an option to a director of the Company to acquire up to 75,000 ordinary shares of US$1.00 each atUS$25.00 per share. On 18 May 2005, this option agreement was cancelled.
As part of an investment agreement entered into in May 2002 (note 22), 3i was issued one “B” ordinary share. The Company also grantedan option to 3i to acquire shares representing 13.0% of the Company’s share capital, as so enlarged (the Option Shares), subject toadjustment to 20.0% in the event of the 3i variable rate unsecured loan notes remaining unpaid. On 21 October 2004, this option wasamended, providing 3i with a revised right to acquire shares representing 16.2% of the Company’s share capital, as so enlarged, subjectto adjustment to 23.2% in the event of the 3i variable rate unsecured loan notes remaining unpaid. The option was exercisable by 3i atany time until 30 June 2009 and by the Company upon the fulfilment of certain conditions. During the year, the conditions allowing theCompany to call upon 3i to subscribe for the Options Shares were satisfied and, on 21 June 2005, the aggregate subscription amountwas satisfied by the cancellation of the loan notes and the issue of 1,397,557 “A” ordinary shares to 3i. In addition, and as part of theconsideration for the Option Shares, the one “B” ordinary share held by 3i was converted to a deferred ordinary share (Class “B”). Thisdeferred ordinary share had no right to receive notice of general meetings of the Company or rights to attend or vote at general meetingsand on 7 October 2005 was redeemed at its nominal value.
Under IAS 32, the Company classified the “A” ordinary shares as a financial liability, as the then Articles of Association of the Companyprovided the shares with priority of dividends, including the right to an annual 5% fixed dividend. The then Articles of Association of theCompany also provided that certain matters, including the approval of certain ordinary share dividends, the conversion of “A” ordinaryshares to ordinary shares and the approval of certain ordinary share transfers, required the approval of the holders of 75% or more of the“A” ordinary shares.
Employee share schemesOn 13 September 2005, conditional upon listing on the London Stock Exchange, the Company approved the establishment of three newemployee share schemes, details of which are contained within the Directors’ Remuneration Report. There have been no awards orcommitments made in relation to these schemes either in the year or since the reporting date and before the completion of these financialstatements.

21 Other reservesNet
Net gains on (losses)/ Foreignavailable-for-sale gains on currency
financial assets derivatives translation TotalUS$’000 US$’000 US$’000 US$’000
Balance at 1 January 2004 1,127 (1,020) (1,910) (1,803)Foreign currency translation – – 3,598 3,598Net loss on maturity of cash flow hedges recognised in income statement – 486 – 486Net changes in fair value of derivatives – 23,498 – 23,498Changes in fair value of available-for-sale financial assets 1,268 – – 1,268
Balance at 31 December 2004 2,395 22,964 1,688 27,047Foreign currency translation – – (4,248) (4,248)Net gain on maturity of cash flow hedges recognised in income statement – (5,628) – (5,628)Net changes in fair value of derivatives – (28,549) – (28,549)Changes in fair value of available-for-sale financial assets (1,048) – – (1,048)Balance at 31 December 2005 1,347 (11,213) (2,560) (12,426)
Nature and purpose of other reservesNet gains on available-for-sale financial assetsThis reserve records fair value changes on available-for-sale financial assets held by the group.
Net (losses)/gains on derivativesThe portion of gains or losses on hedging instruments in cash flow hedges that are determined to be effective hedges are included withinthis reserve.
Foreign currency translation reserveThe foreign currency translation reserve is used to record exchange differences arising from the translation of the financial statements inforeign subsidiaries. It is also used to record exchange differences arising on monetary items that form part of the group’s net investmentin subsidiaries.
22 Interest-bearing loans and borrowingsThe group had the following interest-bearing loans and borrowings outstanding:
Effective 2005 2004interest rate% Maturity US$’000 US$’000
CurrentLoan notes (i) UK LIBOR - 1.00% 2005 – 7,699Revolving credit facility (ii)(a) US LIBOR + 1.50% on demand 2,400 3,250Revolving credit facility (ii)(b) US LIBOR + 1.75% 2006 6,500 –Short term loan (iii) KD Discount Rate + 2.00% 2006 6,228 –Bank overdrafts (iv) UK LIBOR + 1.25% on demand 6,055 15,711Other loans:
Project term loan (v) US LIBOR + 2.00% 2006 7,000 –Non-recourse structured finance (vi) US LIBOR + 3.00% 2005 – 24,031
Current portion of Term loan (vii) 5.48% to 6.20% 2006 2,500 –(2004: 5.38% to 6.31%)
30,683 50,691
Non-currentRevolving credit facility (viii) US/UK LIBOR +1.75% 2008 8,077 –Term loan (vii) 5.48% to 6.20% 2007-2011 69,522 68,838
(2004: 5.38% to 6.31%) Variable rate unsecured (ix) n/a n/a
loan notes (2004: 7.66%) (2007-2009) – 40,250Other loans:
Project term loan (v) US LIBOR + 2.00% 2006 – 7,000
77,599 116,088Less:
Debt acquisition costs, net of accumulated amortisation (1,412) (3,334)Warrants, net of accumulated amortisation – (1,967)
76,187 110,787
Annual report and accounts 2005 Petrofac 73

74 Petrofac Annual report and accounts 2005
Notes to the consolidated financial statements(continued)
At 31 December 2005
22 Interest-bearing loans and borrowings (continued)Details of the group’s interest-bearing loans and borrowings are as follows:
(i) Loan notesThe loan notes related to deferred consideration associated with the acquisition of Petrofac Training. Interest accrued at the currentprevailing 3 month UK LIBOR rate less 1.00%. On 30 June 2005 the loan notes were repaid in full using the group’s term loan facility (vii).
(ii) Revolving credit facilities(a) This revolving credit borrowing relates to US$ denominated borrowings.
(b) This facility, provided by The Royal Bank of Scotland/Halifax Bank of Scotland (RBOS/HBOS), is committed until 30 September 2006and subject to annual review thereafter. Until 1 September 2005, the revolving credit facility was secured by a floating charge overcertain of the group’s assets. On 1 September 2005, this charge was released.
(iii) Short term loanThe short term loan is denominated in Kuwaiti Dinars (KD) and relates to funding provided for a project in Kuwait. The loan is committeduntil 30 June 2006 and subject to annual review thereafter.
(iv) Bank overdraftsBank overdrafts are denominated in Sterling. Until 1 September 2005, the bank overdrafts were secured by a floating charge over certainof the group’s assets. On 1 September 2005, this charge was released.
(v) Project term loanThe project term loan relates to project funding provided for the group’s Ohanet investment in Algeria and is repayable in full in April 2006.
(vi) Non-recourse structured financeThe group’s non-recourse structured finance related to funding provided by GE Structured Finance for the Ohanet project in Algeria. Thisproject facility was voluntarily prepaid in full on 7 April 2005.
(vii) Term loanIn October 2004, the group secured new term loan facilities with RBOS/HBOS. The term loan at 31 December 2005 comprised drawingsof US$35,310,000 denominated in US$ and US$36,712,000 denominated in Sterling. Both elements of the loan are repayable over aperiod of five years commencing 31 December 2006. Until 1 September 2005, the term loan was secured by a floating charge overcertain of the group’s assets. On 1 September 2005, this charge was released.
(viii) Revolving credit facilityThe drawings against this facility, which is also provided by RBOS/HBOS, will be converted to a term loan on 30 September 2008 to berepaid over a period of three years ending 30 September 2011. The drawing at 31 December 2005 comprised US$2,400,000denominated in US$ and US$5,677,000 denominated in Sterling. Until 1 September 2005, the revolving credit facility was secured by afloating charge over certain of the group’s assets. On 1 September 2005, this charge was released.
(ix) Variable rate unsecured loan notesIn May 2002, the group entered into an investment agreement with 3i pursuant to which 3i subscribed for US$40,250,000 of variablerate unsecured loan notes. Through the issuance of warrants associated with this investment agreement, the group granted an option to3i to acquire shares representing 16.2% of the Company’s share capital, as so enlarged, subject to adjustment to 23.2% in the event ofthe 3i variable rate unsecured loan notes remaining unpaid. The option was exercisable by 3i at any time until 30 June 2009 and by theCompany upon the fulfilment of certain conditions. During the year the conditions allowing the Company to call upon 3i to convert thevariable rate unsecured loan notes to equity were satisfied. On 21 June 2005, the aggregate subscription amount was satisfied by thecancellation of the loan notes and the issue of “A” ordinary shares to 3i.
The group’s credit facilities and debt agreements contain covenants relating to cash flow cover, cost of borrowings cover, dividends andvarious other financial ratios. With the exception of Petrofac International Ltd, which under its existing bank covenants is restricted frommaking upstream cash payments in excess of 70 per cent. of its net income in any one year, none of the Company’s subsidiaries issubject to any material restrictions on their ability to transfer funds in the form of cash dividends, loans or advances to the Company.

23 ProvisionsEnd-of-service
benefitsUS$’000
At 1 January 2005 5,912Arising during the year 2,903Utilised (531)At 31 December 2005 8,284
End-of-service benefitsLabour laws in certain countries in which the group operates require employers to provide for end-of-service benefits. These benefits arepayable to employees at the end of their period of employment. The provision for end-of-service benefits is calculated based on theemployees’ final salary and length of service, subject to the completion of a minimum service period in accordance with the local labourlaws of the jurisdictions in which the group operates.
24 Other financial liabilities2005 2004
US$’000 US$’000
Other financial liabilities – non-currentFair value of derivative instruments 1,097 210Deferred consideration on acquisitions – 4,450Other 125 2,217
1,222 6,877
Other financial liabilities – currentFair value of derivative instruments 10,502 12Deferred consideration on acquisitions 4,450 –Interest payable 858 1,263
15,810 1,275
25 Trade and other payables2005 2004
US$’000 US$’000
Trade payables 91,490 99,927Advances received from customers 64,170 12,327Accrued expenses 49,652 30,897Other taxes payable 9,936 10,649Other payables 4,177 4,134
219,425 157,934
Trade payables are non-interest bearing and are normally settled on between 30-day and 60-day terms.
Advances from customers represent payments received for contracts on which the related work had not been performed at the balancesheet date.
Included in other payables are retentions held against subcontractors of US$3,197,000 (2004: US$933,000).
26 Accrued contract expenses2005 2004
US$’000 US$’000
Accrued contract expenses 362,609 174,731Reserve for contract losses 861 4,277
363,470 179,008
Annual report and accounts 2005 Petrofac 75

76 Petrofac Annual report and accounts 2005
Notes to the consolidated financial statements(continued)
At 31 December 2005
27 Commitments and contingenciesCommitmentsIn the normal course of business the group will obtain surety bonds, letters of credit and guarantees, which are contractually required tosecure performance, advance payment or in lieu of retentions being withheld. Some of these facilities are secured by issue of corporateguarantees by the Company in favour of the issuing banks.
At 31 December 2005, the group had letters of credit of US$10,899,000 (2004: US$34,081,000) and outstanding letters of guarantee,including performance and bid bonds, of US$385,556,000 (2004: US$219,590,000) against which the group had pledged or restrictedcash balances of, in aggregate, US$1,648,000 (2004: US$17,678,000).
At 31 December 2005, the group had outstanding forward exchange contracts amounting to US$381,003,000 (2004: US$185,619,000).These commitments consist of future obligations to either acquire or sell designated amounts of foreign currency at agreed rates andvalue dates (note 29).
LeasesThe group has financial commitments in respect of non-cancellable operating leases for office space and equipment. These non-cancellable leases have remaining non-cancellable lease terms of between one and ten years and, for certain property leases, are subjectto renegotiation at various intervals as specified in the lease agreements. The future minimum rental commitments under these non-cancellable leases are as follows:
2005 2004US$’000 US$’000
Within one year 7,159 4,667After one year but not more than five years 15,382 13,963More than five years 8,501 10,717
31,042 29,347
Minimum lease payments recognised as an operating lease expense during the year amounted to US$7,212,000 (2004: US$4,255,000).
Capital commitmentsAt 31 December 2005, the group had capital commitments of US$3,410,000 (2004: nil).
On 24 January 2006, the group approved a commitment to construct a new office building in Sharjah, United Arab Emirates. The totalvalue of this commitment, including the cost of land, is US$34,060,000.
28 Related party transactionsThe consolidated financial statements include the financial statements of Petrofac Limited and the subsidiaries listed in note 30. PetrofacLimited is the ultimate parent entity of the group.
The following table provides the total amount of transactions which have been entered into with related parties:
Sales to related Purchases from Amounts owed Amounts owedparties related parties by related parties to related parties
US$’000 US$’000 US$’000 US$’000
Joint ventures 2005 8,194 2,674 28,402 1,3332004 11,656 14 20,361 1,428
Directors’ loans 2005 – – – –2004 – – 528 –
Other directors’ interests 2005 – 30 – 22004 – 252 – 25
All sales to and purchases from joint ventures are made at normal market prices and the pricing policies and terms of these transactionsare approved by the group’s management.

Directors’ loansDirectors’ loans receivable include the following items:
2005 2004US$’000 US$’000
Loans advanced to directors for the purchase of participatory interests in ordinary shares – 528
The loans advanced to directors of the Company for the purchase of participatory interests in ordinary shares in the Company throughthe Petrofac ESS carried interest at rates between 3.4% and 3.8%, dependent on the year of grant. The loans were repaid in full during2005.
Directors’ interests in share options In 2002 the Company extended an option to a director of the Company to acquire up to 75,000 ordinary shares of US$1.00 each atUS$25.00 per share. On 18 May 2005, this option agreement was cancelled.
Other Directors’ interestsDuring the year the following payments were made to a related party for services provided to the group by a director of the Company:
2005 2004US$’000 US$’000
Purchases from related party 30 252
Amount owed by the group at 31 December 2 25
Other Directors’ transactionsAt the time of appointment in 2002, an agreement was reached between a director of the Company and 3i, pursuant to which the directorreceived a cash payment of US$1,422,000 from 3i following the Company’s listing on the London Stock Exchange.
On 21 October 2004, the Company repurchased 1,730,211 ordinary shares from a retiring director of the Company for a totalconsideration of US$23,652,000.
Petrofac OhanetCertain of the Company’s directors held direct or beneficial interests in the holding company of Petrofac Ohanet. On 27 May 2005 thegroup acquired Petrofac Ohanet from its parent for cash consideration of US$2,400,000. The amount received in aggregate by thedirectors, either directly or beneficially, as a result of this transaction was US$1,437,000. The acquisition price was determined by a fixedprice option that was established in May 2002.
Compensation of key management personnel 2005 2004
US$’000 US$’000
Short-term employee benefits 4,249 2,993End-of-service benefits 51 46Share-based payments 169 –Fees paid to non-executive directors 266 92
4,735 3,131
Annual report and accounts 2005 Petrofac 77

78 Petrofac Annual report and accounts 2005
29 Financial instrumentsRisk management objectives and policiesThe group’s principal financial instruments, other than derivatives, comprise bank loans, loan notes, non-recourse structured finance, cashand short-term deposits. The main purpose of these financial instruments is to finance the group’s operations. The group has various otherfinancial instruments such as trade receivables and trade payables, which arise directly from its operations.
The group also uses derivative transactions, principally interest rate swaps and caps, and forward currency contracts to manage theinterest rate and currency risks arising from the group’s operations and its sources of finance. It is the group’s policy that no trading infinancial instruments be undertaken.
The main risks arising from the group’s financial instruments are interest rate risk, foreign currency risk, credit risk and liquidity risk.
Interest rate riskThe group’s exposure to market risk for changes in interest rates relates primarily to the group’s long-term variable rate debt obligationsand its cash and bank balances. The group’s policy is to manage its interest cost using a mix of fixed and variable rate debt andspecifically to keep between 60% and 80% of its borrowings at fixed or capped rates of interest. At 31 December 2005, after taking intoaccount the effect of interest rate swaps and caps, approximately 84.7% (2004: 67.6%) of the group’s term borrowings are at a fixed orcapped rate of interest.
Foreign currency riskThe group uses forward currency contracts to eliminate the currency exposure on transactions significant to its operations. It is thegroup’s policy not to enter into forward contracts until a firm commitment is in place and to negotiate the terms of the hedge derivativesto match the terms of the hedged item to maximise hedge effectiveness.
Credit riskThe group trades only with recognised, creditworthy third parties. Receivable balances are monitored on an ongoing basis with the resultthat the group’s exposure to bad debts is not considered significant. At 31 December 2005, the group’s five largest customers accountedfor 69.8% of outstanding trade receivables and work in progress (2004: 62.6%).
With respect to credit risk arising from the other financial assets of the group, which comprise cash and cash equivalents, available-for-sale financial assets and certain derivative instruments, the group’s exposure to credit risk arises from default of the counterparty, with amaximum exposure equal to the carrying amount of these instruments.
Liquidity riskThe group’s objective is to maintain a balance between continuity of funding and flexibility through the use of overdrafts, revolving creditfacilities, project finance and term loans.
Fair valuesThe fair value of the group’s financial instruments as compared to their carrying amounts included within the group’s balance sheet areset out below:
Carrying amount Fair value
2005 2004 2005 2004US$’000 US$’000 US$’000 US$’000
Financial assetsCash and short-term deposits 208,896 143,534 208,896 143,534Restricted cash 1,648 17,678 1,648 17,678Available-for-sale financial assets 2,413 4,104 2,413 4,104Interest rate caps and swaps 672 53 672 53Forward currency contracts – 23,712 – 23,712Forward currency purchase option 461 – 461 –Other non-current financial assets 8 4,720 8 4,720Other current financial assets 2,392 2,885 2,392 2,885
Financial liabilitiesInterest-bearing loans and borrowings 106,870 161,478 106,870 162,404Deferred consideration 4,450 4,450 4,450 4,450Interest rate swaps 147 210 147 210Forward currency contracts 11,452 12 11,452 12Other non-current financial liabilities 125 2,217 125 2,217Other current financial liabilities 858 1,263 858 1,263
Market values have been used to determine the fair values of available-for-sale financial assets and forward currency contracts. The fairvalues of interest rate swaps and caps have been calculated by discounting the expected future cash flows at prevailing interest rates.
Notes to the consolidated financial statements(continued)
At 31 December 2005

Annual report and accounts 2005 Petrofac 79
Interest rate riskInterest rate risk arises from the possibility that changes in interest rates will affect the value of the group’s interest-bearing financialliabilities and assets. The following table indicates the years over which these financial liabilities and assets will reprice or mature:
Within 1-2 2-3 3-4 4-5 More than1 year years years years years 5 years Total
US$’000 US$’000 US$’000 US$’000 US$’000 US$’000 US$’000
Year ended 31 December 2005Financial liabilitiesFloating ratesRevolving credit facilities 8,900 – 404 1,817 2,827 3,029 16,977Short term loan 6,228 – – – – – 6,228Bank overdrafts 6,055 – – – – – 6,055Project term loan 7,000 – – – – – 7,000Term loan 2,500 10,000 11,250 15,625 18,750 13,897 72,022
30,683 10,000 11,654 17,442 21,577 16,926 108,282
Financial assetsFloating ratesCash and short-term deposits 208,896 – – – – – 208,896Restricted cash balances 1,648 – – – – – 1,648
210,544 – – – – – 210,544
Year ended 31 December 2004Financial liabilitiesFloating ratesLoan notes 7,699 – – – – – 7,699Revolving credit facilities 3,250 – – – – – 3,250Bank overdrafts 15,711 – – – – – 15,711Non-recourse structured finance 24,031 – – – – – 24,031Project term loan – 7,000 – – – – 7,000Unsecured loan notes – 13,417 13,417 13,416 – – 40,250Term loan – 2,500 10,000 11,250 15,625 29,463 68,838
50,691 22,917 23,417 24,666 15,625 29,463 166,779
Financial assetsFloating ratesCash and short-term deposits 143,534 – – – – – 143,534Restricted cash balances 17,587 91 – – – – 17,678
161,121 91 – – – – 161,212
Financial liabilities in the above table are disclosed gross of debt acquisition costs of US$1,412,000 (2004: US$3,334,000) and warrantdebt discount of nil (2004: US$1,967,000).
Interest on financial instruments classified as floating rate is repriced at intervals of less than one year. The other financial instruments ofthe group that are not included in the above tables are non-interest bearing and are therefore not subject to interest rate risk.

80 Petrofac Annual report and accounts 2005
29 Financial instruments (continued)Derivative instruments designated as cash flow hedges At 31 December 2005, the group held the following derivative instruments, designated as cash flow hedges in relation to floating rateinterest-bearing loans and borrowings:
Fair value asset/(liability)
2005 2004Instrument Duration Commencement date US$’000 US$’000
UK LIBOR interest rate swap 4 years and 9 months 31 December 2004 (147) (70)UK interest rate cap 3 years 31 December 2004 5 50US LIBOR interest rate swap 3 years 31 December 2004 667 (140)US interest rate cap 3 years and 4 months 31 January 2002 – 3
Foreign exchange riskThe functional currency of the group is US dollars. The group is exposed to foreign currency risk on sales, purchases and borrowingsthat are entered into in a currency other than US dollars. The group uses forward foreign exchange contracts to hedge its foreign currencyrisk, when considered appropriate. At 31 December 2005, the group had foreign exchange contracts designated as cash flow hedgeswith a fair value loss of US$11,452,000 (2004: fair value gain US$23,700,000) as follows:
NetContract Fair unrealised
value value (loss)/gain
2005 2004 2005 2004 2005 2004US$’000 US$’000 US$’000 US$’000 US$’000 US$’000
Euro currency purchases 344,107 179,125 332,689 202,676 (11,418) 23,551Sterling currency purchases 36,896 6,494 36,862 6,643 (34) 149
(11,452) 23,700
The group has also acquired an option from a bank to purchase Euro currency equivalent to US$31,368,000 by paying a premium ofUS$689,000. At 31 December 2005, the fair value of the option was US$461,000 with an unrealised loss deferred in equity ofUS$228,000.
The above foreign exchange contracts mature between January 2006 and June 2007 (2004: between January 2005 and April 2006).
Notes to the consolidated financial statements(continued)
At 31 December 2005

Annual report and accounts 2005 Petrofac 81
30 Subsidiaries and joint venturesAt 31 December 2005, the group had investments in the following subsidiaries and incorporated joint ventures:
Proportion of nominalCountry of value of issued shares
Name of company incorporation controlled by the group
Trading subsidiaries 2005 2004
Petrofac Inc. USA 100* 100*Petrofac International Ltd Jersey 100* 100*Petrofac Resources Limited England 100* 100*Petrofac Resources International Limited Jersey 100* 100*Petrofac UK Holdings Limited England 100* 100*Petrofac Facilities Management International Limited Jersey 100* 100*Petrofac Services Limited England 100* 100*Petrofac Services Inc. USA 100* 100*Petrofac Training International Limited Jersey 100* 100*Petroleum Facilities E & C Limited Jersey 100* 100*Petrofac ESOP Trustees Limited Jersey 100* 100*Atlantic Resourcing Limited Scotland 100 100Monsoon Shipmanagement Limited Cyprus 100 100Petrofac Alger URAL Algeria 100 100Petrofac Engineering India Private Limited India 100 100Petrofac Engineering Limited England 100 100Petrofac Offshore Management Limited Jersey 100 100Petrofac Facilities Management Group Limited Scotland 100 100Petrofac Facilities Management Limited Scotland 100 100Petrofac International Nigeria Ltd Nigeria 100 100Petrofac Pars (PJSC) Iran 100 100Petrofac Iran (PJSC) Iran 100 100Plant Asset Management Limited Scotland 100 51Petrofac Nuigini Limited Papua New Guinea 100 100PFMAP Sendirian Berhad Malaysia 100 100Petrofac Caspian Limited Azerbaijan 100 100Petrofac (Malaysia-PM304) Limited England 100 100Petrofac Training Group Limited Scotland 100 100Petrofac Training Holdings Limited Scotland 100 100Petrofac Training Limited Scotland 100 100RGIT Montrose Inc. USA 100 100RGIT Montrose (Trinidad) Limited Trinidad 100 100Monsoon Shipmanagement Limited Jersey 100 n/aPetrofac E&C International Limited United Arab Emirates 100 n/aRubicon Response Limited Scotland 100 n/aPetrofac Resources (Ohanet) Jersey Limited Jersey 100 n/aPetrofac Resources (Ohanet) LLC USA 100 n/a
* Directly held by Petrofac Limited

82 Petrofac Annual report and accounts 2005
30 Subsidiaries and joint ventures (continued)Proportion of nominal
Country of value of issued sharesName of company incorporation controlled by the group
Joint ventures 2005 2004
Costain Petrofac Limited England 50 50Kyrgyz Petroleum Company Kyrgyz Republic 50 50MJVI Sendirian Berhad Brunei 50 50Spie Capag – Petrofac International Limited Jersey 50 50TTE Petrofac Limited Jersey 50 50
Dormant subsidiaries
Petrofac Sakha Limited England 100* 100*Petrofac Saudi Arabia Limited Saudi Arabia 100 100ASJV Venezuela SA Venezuela 100 100Joint Venture International Limited Scotland 100 100Montrose Park Hotels Limited Scotland 100 100Montrose Scota Limited Scotland 100 100Petrofac Resources (Palmyra) Limited Jersey 100 100RGIT Ethos Health & Safety Limited Scotland 100 100Scota Limited Scotland 100 100
* Directly held by Petrofac Limited
31 Comparative amountsCertain of the corresponding figures in the balance sheet for 2004 have been reclassified in order to conform with the presentation forthe current year, primarily to reflect the separate disclosure of financial assets and liabilities and the reclassification of end-of-servicebenefits to provisions. Such reclassifications do not affect previously reported totals of non-current assets, current assets, non-currentliabilities or current liabilities, nor do they affect previously reported net profit or shareholders’ equity.
The table below summarises the reclassifications between the balance sheet line items affected.
As reported Restated 2004 Reclassification 2004
US$’000 US$’000 US$’000
Other financial assets – non-current – 11,205 11,205Other non-current assets 11,205 (11,205) –Trade and other receivables 200,042 16,754 216,796Other current assets 54,597 (54,597) –Other financial assets – current – 37,843 37,843
265,844 – 265,844
Other financial liabilities – non-current – 6,877 6,877Provisions – 5,912 5,912Other non-current liabilities 12,789 (12,789) –Trade and other payables 114,873 43,061 157,934Accrued expenses and other liabilities 44,336 (44,336) –Other financial liabilities – current – 1,275 1,275
171,998 – 171,998
Notes to the consolidated financial statements(continued)
At 31 December 2005

Annual report and accounts 2005 Petrofac 83
2005 2004 2003 2002Restated Restated Restated
Revenues2 1,485,472 951,530 628,702 391,398EBITDA2 115,634 96,065 48,075 39,043Profit for the year2, 3 75,397 46,083 38,359 34,336Diluted earnings per share (cents)2 22.41 11.93 8.94 7.51
Total assets 986,650 729,357 527,088 467,643Total equity 195,127 138,558 109,394 96,102
Average number of employees2 6,598 5,284 3,330 920Backlog (US$ millions) 3,244 1,740 1,097 885
1 In US$’000 unless otherwise stated.2 On continuing operations.3 Attributable to Petrofac Limited shareholders.
Four year summary1
02 03 04 05
885
1,09
7
1,74
0
3,24
4
Backlog (US$ millions)
02 03 04 05
39.0
48.1
96.1
115.
6
EBITDA (US$ millions)

Petrofac shares are traded on the London Stock Exchange using code ‘PFC.L’.
Registrar Company Secretary and registered officeCapita Registrars Ogier Secretaries (Jersey) LimitedThe Registry Whiteley Chambers34 Beckenham Road Don Street, St HelierBeckenham Jersey JE4 9WGKent BR3 4TU
Legal advisers to the companyAs to English Law As to Jersey LawNorton Rose OgierKempson House Whiteley ChambersCamomile Street Don Street, St HelierLondon EC3A 7AN Jersey JE4 9WG
Joint brokersCredit Suisse Lehman Brothers1 Cabot Square 25 Bank StreetLondon E14 4QJ London E14 5LE
Auditors Corporate and financial PRErnst & Young Bell Pottinger Corporate & Financial1 More London Place 6th Floor Holburn GateLondon SE1 2AF 330 High Holburn
London WC1V 7QD
2006 financial calendar*
19 May 2006 Annual general meeting
31 May 2006 Final dividend payment
18 September 2006 Interim results announcement
November 2006 Interim dividend payment
*Dates correct at time of print, but subject to change
Shareholder information
84 Petrofac Annual report and accounts 2005

Petrofac is a culturally diverseinternational company, united byshared values.
Petrofac people are:
• Safe
• Ethical
• Innovative
• Cost-conscious
• Responsive to customers
and focus relentlessly on delivering results
Designed and produced by Rare Corporate Design, London. www.rarecorporate.co.uk

www.petrofac.com