Embed Size (px)
Citation preview
Annual Report 2017

Annual Report 2017
2
Barilla celebrates 140 years of history. Over four generations, it has always been led by passion and values inspired by its mission: “Good for You, Good for the Planet”.
3
Chairman’s letter
Directors and officers
Barilla’s history
Barilla Group
Our purpose
Barilla in the world
Directors’ Report
Transactions involving subsidiaries Accounting standards - International Financial Reporting Standards (IFRS) General information Consolidated financial highlights Our brands Group structure and organisation Economic scenario Group operating activities Capital expenditure Corporate Governance Only one way of doing business: “Good for You, Good for the Planet” Risk management Significant events after the year-end Management outlook Other significant operating events Related party transactions
Consolidated financial statementsfor the year ended 31 December 2017
Statement of financial position Consolidated income statement Statement of comprehensive income Statement of changes in equity Statement of cash flow
Illustrative notes
1. Group structure and business 2. Significant events after the year-end 3. Declaration of compliance with International Financial Reporting Standards (IFRS) 4. Basis of preparation Accounting and valuation policies 5. Change in the scope of consolidation 6. Notes to the consolidated financial statements 7. Financial instruments and net financial position 8. Disclosures in accordance with IAS 24 for related party transactions and key management compensation
Appendices
1. List of companies included in the scope of consolidation 2. List of investments in associated and other companies 3. Currency rates of exchange
Report of Indipendent Auditors
Corporate information and contacts
Summary
5
8
9
12
13
14
16
16
161617202323232525
263030303131
34
3437383940
42
4242
42
42555575
81
83
83
8586
88
92
4
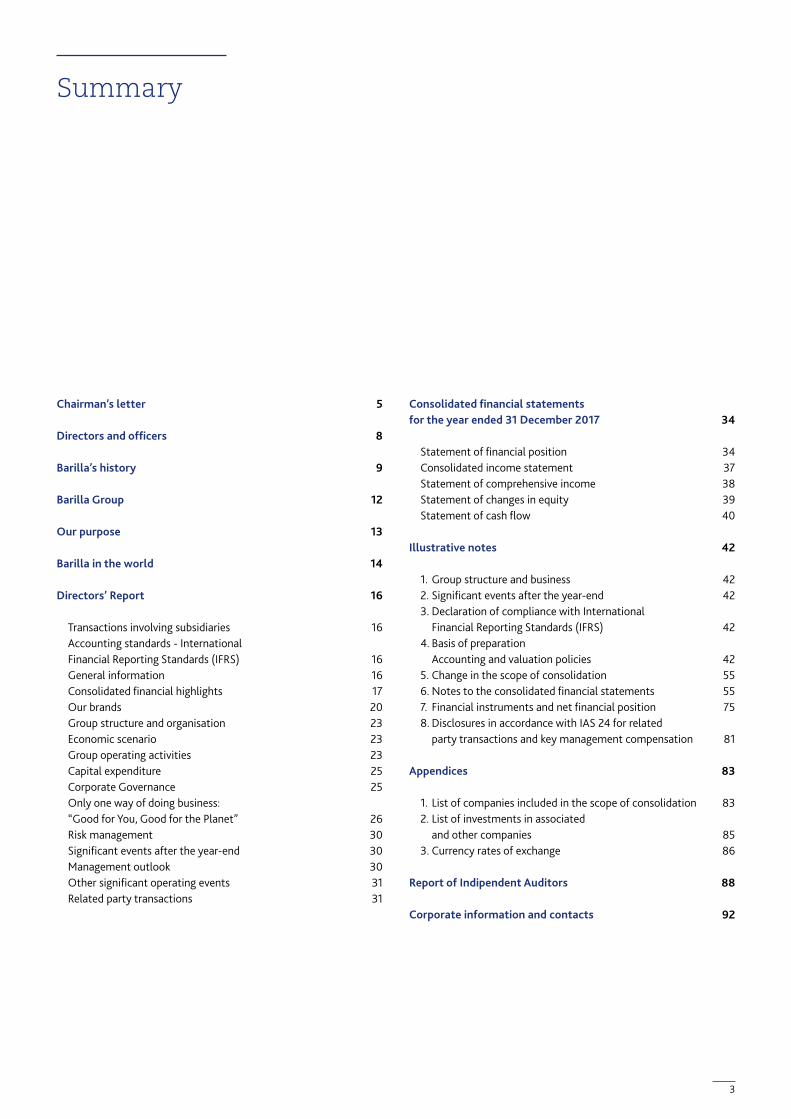
“Give people food you would give to your own children”Pietro Barilla From left: Paolo Barilla (Deputy Chairman), Luca Barilla (Deputy Chairman), Guido Maria Barilla (Chairman), Claudio Colzani (Chief Executive Officer and General Manager)
5
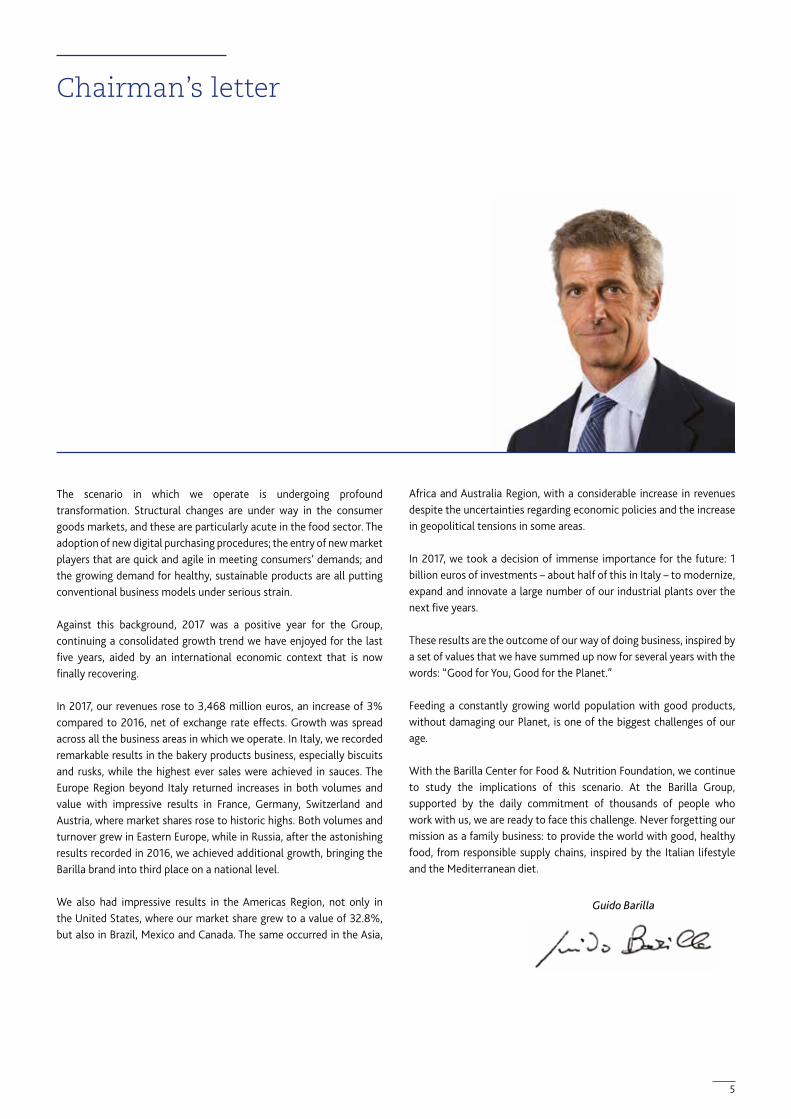
The scenario in which we operate is undergoing profound transformation. Structural changes are under way in the consumer goods markets, and these are particularly acute in the food sector. The adoption of new digital purchasing procedures; the entry of new market players that are quick and agile in meeting consumers’ demands; and the growing demand for healthy, sustainable products are all putting conventional business models under serious strain.
Against this background, 2017 was a positive year for the Group, continuing a consolidated growth trend we have enjoyed for the last five years, aided by an international economic context that is now finally recovering.
In 2017, our revenues rose to 3,468 million euros, an increase of 3% compared to 2016, net of exchange rate effects. Growth was spread across all the business areas in which we operate. In Italy, we recorded remarkable results in the bakery products business, especially biscuits and rusks, while the highest ever sales were achieved in sauces. The Europe Region beyond Italy returned increases in both volumes and value with impressive results in France, Germany, Switzerland and Austria, where market shares rose to historic highs. Both volumes and turnover grew in Eastern Europe, while in Russia, after the astonishing results recorded in 2016, we achieved additional growth, bringing the Barilla brand into third place on a national level.
We also had impressive results in the Americas Region, not only in the United States, where our market share grew to a value of 32.8%, but also in Brazil, Mexico and Canada. The same occurred in the Asia,
Africa and Australia Region, with a considerable increase in revenues despite the uncertainties regarding economic policies and the increase in geopolitical tensions in some areas.
In 2017, we took a decision of immense importance for the future: 1 billion euros of investments – about half of this in Italy – to modernize, expand and innovate a large number of our industrial plants over the next five years.
These results are the outcome of our way of doing business, inspired by a set of values that we have summed up now for several years with the words: “Good for You, Good for the Planet.”
Feeding a constantly growing world population with good products, without damaging our Planet, is one of the biggest challenges of our age.
With the Barilla Center for Food & Nutrition Foundation, we continue to study the implications of this scenario. At the Barilla Group, supported by the daily commitment of thousands of people who work with us, we are ready to face this challenge. Never forgetting our mission as a family business: to provide the world with good, healthy food, from responsible supply chains, inspired by the Italian lifestyle and the Mediterranean diet.
Guido Barilla
Chairman’s letter

6
The Barilla bakery products production plant in Melfi (Italy) celebrates 30 years of operation in the presence of Vice Chairmen Luca and Paolo Barilla. October 2017

7

8
BARILLA INIZIATIVE S.p.A
Board of directors
ChairmanGuido Maria Barilla
Deputy chairmenLuca BarillaPaolo Barilla
Chief executive officerClaudio Colzani
DirectorsEmanuela BarillaGratian AndaNicolaus IssenmannAndrea PontremoliAntonio Belloni
Board of statutory auditors
ChairmanMario Tardini
AuditorsAlberto PizziAugusto Schianchi
BARILLA G. E R. FRATELLI S.p.A
Board of directors
ChairmanGuido Maria Barilla
Deputy chairmenLuca BarillaPaolo Barilla
Chief executive officer and General ManagerClaudio Colzani
DirectorsEmanuela BarillaAntonio BelloniNicolaus IssenmannAndrea Pontremoli
Board of statutory auditors
ChairmanAugusto Schianchi
AuditorsMario TardiniMarco Ziliotti
Independent auditorsKPMG S.p.A.
Directors and officers

Barilla’s history in a nutshell, since 1877
«I STARTED WORKING WHEN I WAS THIRTEEN YEARS OLD. MY FATHER WOULD SEND ME WITH OUR HANDCART TO FETCH A FEW SACKS OF FLOUR, WHICH WERE THEN TRANSFORMED INTO BREAD IN OUR OLD SMALL BRICK OVEN. AFTER A FEW YEARS, IN A SMALL SHOP, WITH THE HELP OF MY SISTERS AND MY MOTHER WHO WORKED AT THE COUNTER, WE SOLD THE BREAD THAT MY FATHER AND I PRODUCED BY WORKING FOR UP TO 18 HOURS A DAY.»
Riccardo Barilla
«IT IS IMPORTANT TO UNDERLINE THAT, IF BARILLA AFTER MANY YEARS MANAGED TO BECAME AN ESTIMATED AND WELL REPUTED COMPANY, IT IS ALSO BECAUSE IT HAS ALWAYS BEEN COMMITTED TO CREATE WELLBEING FOR THE ENTIRE COMMUNITY.»
Luca Barilla
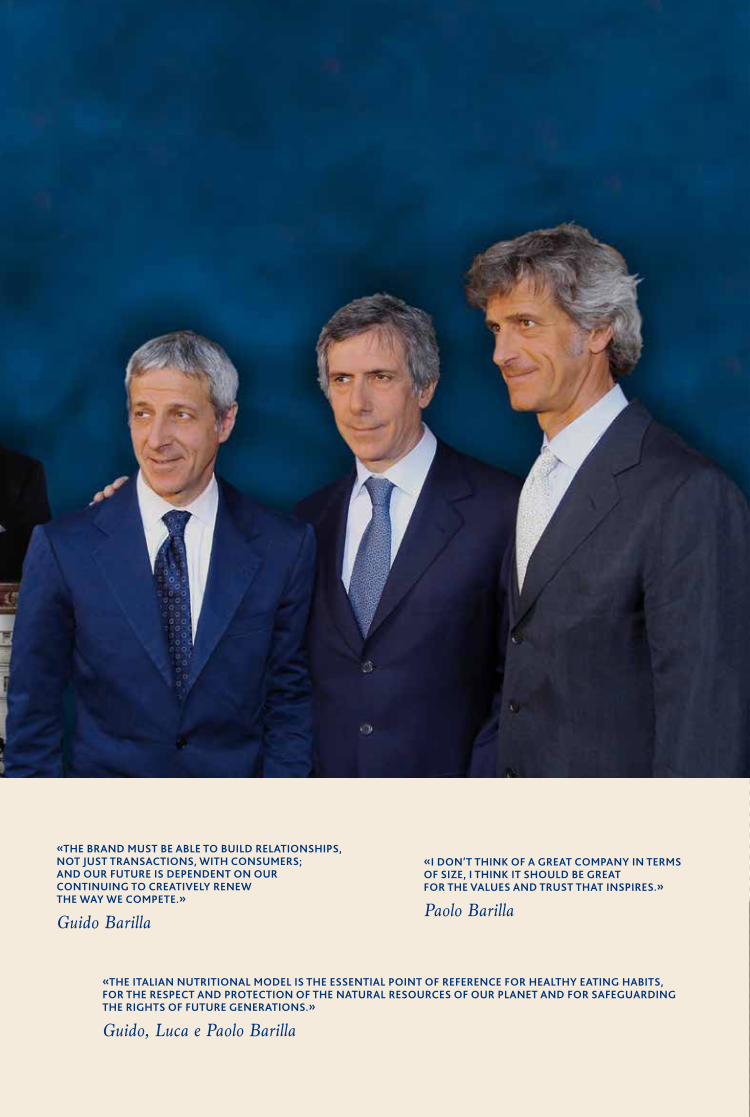
«THE BRAND MUST BE ABLE TO BUILD RELATIONSHIPS, NOT JUST TRANSACTIONS, WITH CONSUMERS; AND OUR FUTURE IS DEPENDENT ON OUR CONTINUING TO CREATIVELY RENEW THE WAY WE COMPETE.»
Guido Barilla
«I DON’T THINK OF A GREAT COMPANY IN TERMS OF SIZE, I THINK IT SHOULD BE GREAT FOR THE VALUES AND TRUST THAT INSPIRES.»
Paolo Barilla
«THE ITALIAN NUTRITIONAL MODEL IS THE ESSENTIAL POINT OF REFERENCE FOR HEALTHY EATING HABITS, FOR THE RESPECT AND PROTECTION OF THE NATURAL RESOURCES OF OUR PLANET AND FOR SAFEGUARDING THE RIGHTS OF FUTURE GENERATIONS.»
Guido, Luca e Paolo Barilla
«IT IS MY BELIEF THAT THE THREE CHARACTERISTICS OF A BUSINESSMAN ARE COURAGE, INTUITION, AND OPTIMISM. I THINK THAT THE ENTREPRENEUR HAS AN IMPORTANT ROLE TO PLAY NO MATTER WHAT HIS FIELD. BUT THE FOOD SECTOR HAS A SPECIFIC ROLE, I WOULD CALL IT A DEEPER AND MORE CHALLENGING ONE, BECAUSE FOOD GOES OUT TO EVERYONE: TO CHILDREN, TO THE ELDERLY, TO FAMILIES. FOOD HAS THIS SENSITIVITY, THIS IMPORTANCE FOR THE HEALTH OF PEOPLE.»
Pietro Barilla
Barilla Group
We were born in Parma in 1877, 140 years ago, when Pietro Barilla opened a small bread and pasta shop. That moment marked the beginning of a journey of quality and passion that has identified Barilla over the years, leading us to the development of iconic brands in the food sector.
TURNOVER (MLN EURO)
GEOGRAPHICAL AREAS
EMPLOYEES
3,403
2016
8,400
2016
3,468
2017
8,358
2017
4.3%
ASIA, AFRICA,
AUSTRALIA
45.3%
ITALY
19.4%
AMERICAS
31.0%
REST OFEUROPE
AND RUSSIA

Barilla’s history in a nutshell, since 1877
«I STARTED WORKING WHEN I WAS THIRTEEN YEARS OLD. MY FATHER WOULD SEND ME WITH OUR HANDCART TO FETCH A FEW SACKS OF FLOUR, WHICH WERE THEN TRANSFORMED INTO BREAD IN OUR OLD SMALL BRICK OVEN. AFTER A FEW YEARS, IN A SMALL SHOP, WITH THE HELP OF MY SISTERS AND MY MOTHER WHO WORKED AT THE COUNTER, WE SOLD THE BREAD THAT MY FATHER AND I PRODUCED BY WORKING FOR UP TO 18 HOURS A DAY.»
Riccardo Barilla
«IT IS IMPORTANT TO UNDERLINE THAT, IF BARILLA AFTER MANY YEARS MANAGED TO BECAME AN ESTIMATED AND WELL REPUTED COMPANY, IT IS ALSO BECAUSE IT HAS ALWAYS BEEN COMMITTED TO CREATE WELLBEING FOR THE ENTIRE COMMUNITY.»
Luca Barilla
«THE BRAND MUST BE ABLE TO BUILD RELATIONSHIPS, NOT JUST TRANSACTIONS, WITH CONSUMERS; AND OUR FUTURE IS DEPENDENT ON OUR CONTINUING TO CREATIVELY RENEW THE WAY WE COMPETE.»
Guido Barilla
«I DON’T THINK OF A GREAT COMPANY IN TERMS OF SIZE, I THINK IT SHOULD BE GREAT FOR THE VALUES AND TRUST THAT INSPIRES.»
Paolo Barilla
«THE ITALIAN NUTRITIONAL MODEL IS THE ESSENTIAL POINT OF REFERENCE FOR HEALTHY EATING HABITS, FOR THE RESPECT AND PROTECTION OF THE NATURAL RESOURCES OF OUR PLANET AND FOR SAFEGUARDING THE RIGHTS OF FUTURE GENERATIONS.»
Guido, Luca e Paolo Barilla
«IT IS MY BELIEF THAT THE THREE CHARACTERISTICS OF A BUSINESSMAN ARE COURAGE, INTUITION, AND OPTIMISM. I THINK THAT THE ENTREPRENEUR HAS AN IMPORTANT ROLE TO PLAY NO MATTER WHAT HIS FIELD. BUT THE FOOD SECTOR HAS A SPECIFIC ROLE, I WOULD CALL IT A DEEPER AND MORE CHALLENGING ONE, BECAUSE FOOD GOES OUT TO EVERYONE: TO CHILDREN, TO THE ELDERLY, TO FAMILIES. FOOD HAS THIS SENSITIVITY, THIS IMPORTANCE FOR THE HEALTH OF PEOPLE.»
Pietro Barilla
Barilla Group
We were born in Parma in 1877, 140 years ago, when Pietro Barilla opened a small bread and pasta shop. That moment marked the beginning of a journey of quality and passion that has identified Barilla over the years, leading us to the development of iconic brands in the food sector.
TURNOVER (MLN EURO)
GEOGRAPHICAL AREAS
EMPLOYEES
3,403
2016
8,400
2016
3,468
2017
8,358
2017
4.3%
ASIA, AFRICA,
AUSTRALIA
45.3%
ITALY
19.4%
AMERICAS
31.0%
REST OFEUROPE
AND RUSSIA

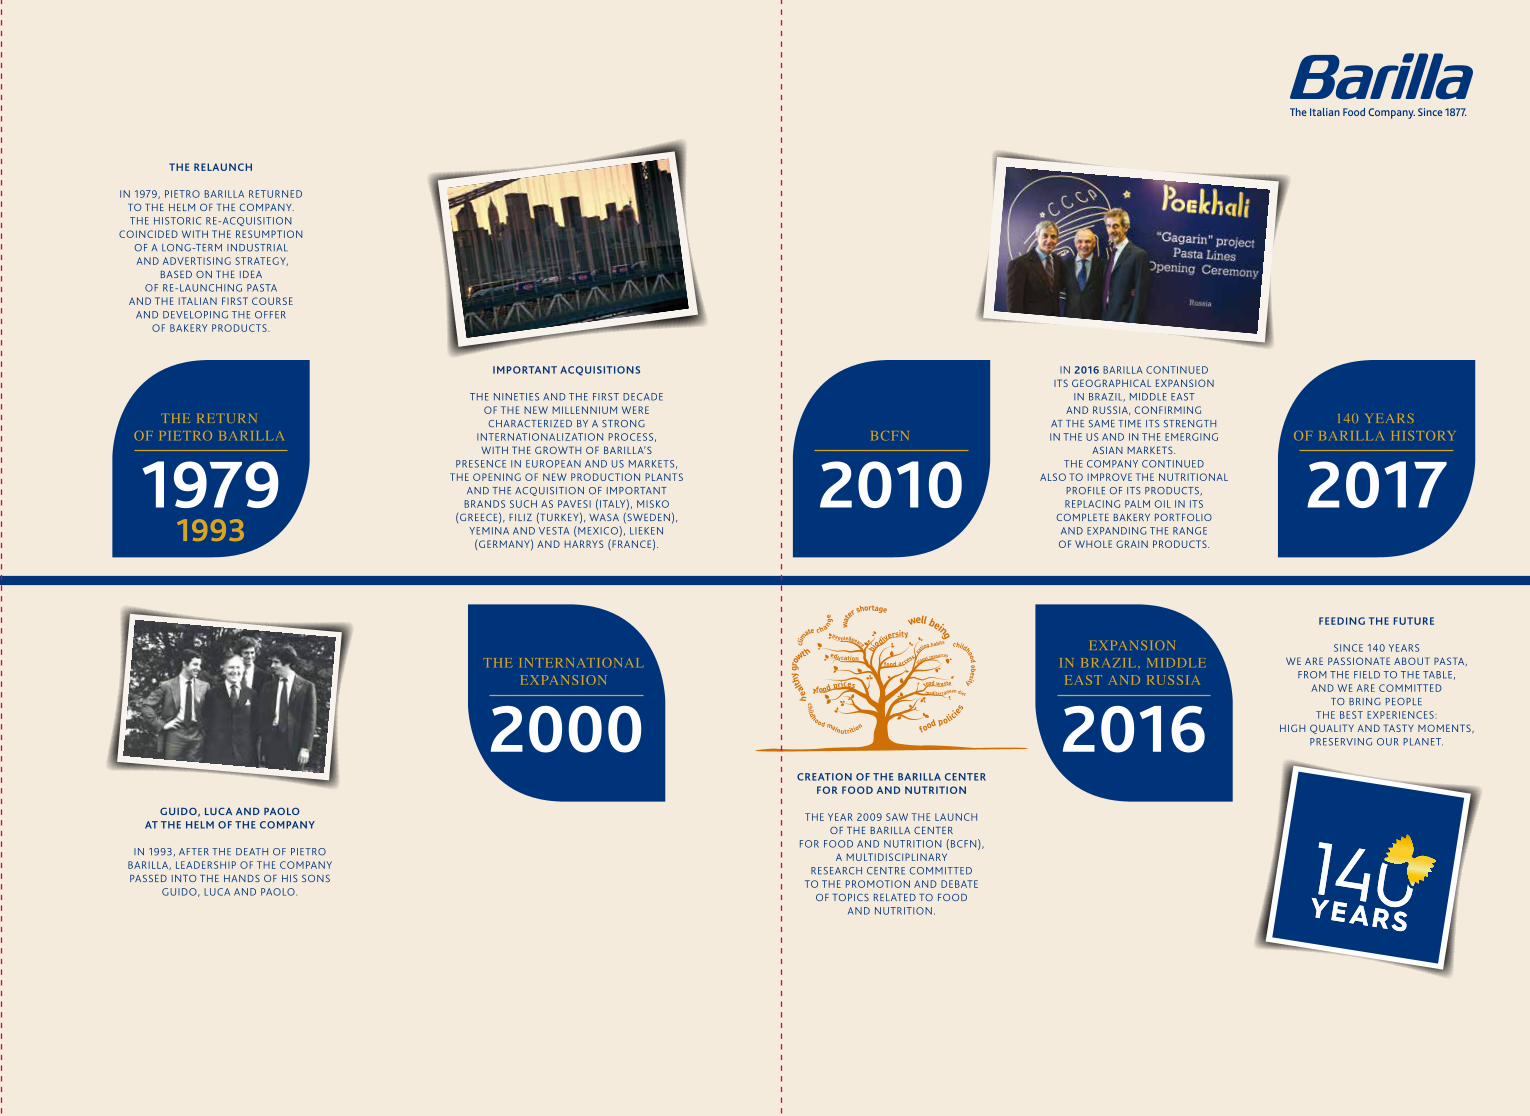
IN 2016 BARILLA CONTINUED ITS GEOGRAPHICAL EXPANSION
IN BRAZIL, MIDDLE EAST AND RUSSIA, CONFIRMING
AT THE SAME TIME ITS STRENGTH IN THE US AND IN THE EMERGING
ASIAN MARKETS. THE COMPANY CONTINUED
ALSO TO IMPROVE THE NUTRITIONAL PROFILE OF ITS PRODUCTS, REPLACING PALM OIL IN ITS
COMPLETE BAKERY PORTFOLIO AND EXPANDING THE RANGE OF WHOLE GRAIN PRODUCTS.
2016EXPANSION
IN BRAZIL, MIDDLE EAST AND RUSSIA
THE PEDRIGNANO (PARMA) FACTORY IS BUILT
IN THE EARLY SIXTIES, BARILLA BECAME A LIMITED COMPANY.
IT HAD 1,300 EMPLOYEES AND 200 SALESPEOPLE.
IN 1965, BARILLA ENTERED THE PACKAGED BAKERY PRODUCTS
MARKET FOR THE FIRST TIME, WITH THE PRODUCTION
OF BREADSTICKS AND CRACKERS. IN 1969, THE PEDRIGNANO (PARMA) FACTORY WAS BUILT, THE LARGEST
PASTA PRODUCTION PLANT IN THE WORLD, WITH A PRODUCTION
CAPACITY OF 1,000 TONS A DAY.
19581970
BARILLA ITALIAN LEADER
GIANNI AND PIETROAT THE HELM OF THE COMPANY
AFTER RICCARDO BARILLA’S DEATHIN 1947, HIS SONS PIETRO
AND GIANNI TOOK THE REINS OF THE COMPANY, DEVELOPING MODERN PRODUCTION SYSTEMS
AND ENGAGING IN INTENSE BUSINESS COMMUNICATION
AND ADVERTISING ACTIVITIES.
1947POST WORLD WAR II YEARS
1877THE BEGINNINGS
1910RICCARDO
AT THE HELMOF BARILLA
1975THE MULINO
BIANCOERA BEGIN
MULINO BIANCO IS CREATED
1975 SAW THE LAUNCH OF MULINOBIANCO, A NEW BAKERY PRODUCTSLINE, INCLUDING BISCUITS, BREAD
SUBSTITUTES AND SNACKS,CHARACTERIZED BY AUTHENTICITY
AND RECIPES WITH NATURALINGREDIENTS, USING THE EXPERIENCE
BARILLA HAS GAINED IN CENTURIESOF CEREAL PROCESSING.
TH
E H
IST
OR
Y O
F B
AR
ILL
A
GUIDO, LUCA AND PAOLO AT THE HELM OF THE COMPANY
IN 1993, AFTER THE DEATH OF PIETROBARILLA, LEADERSHIP OF THE COMPANY PASSED INTO THE HANDS OF HIS SONS
GUIDO, LUCA AND PAOLO.
CREATION OF THE BARILLA CENTERFOR FOOD AND NUTRITION
THE YEAR 2009 SAW THE LAUNCH OF THE BARILLA CENTER
FOR FOOD AND NUTRITION (BCFN), A MULTIDISCIPLINARY
RESEARCH CENTRE COMMITTED TO THE PROMOTION AND DEBATE
OF TOPICS RELATED TO FOOD AND NUTRITION.
2010BCFN
2000THE INTERNATIONAL
EXPANSION
IMPORTANT ACQUISITIONS
THE NINETIES AND THE FIRST DECADEOF THE NEW MILLENNIUM WERE CHARACTERIZED BY A STRONG
INTERNATIONALIZATION PROCESS,WITH THE GROWTH OF BARILLA’S
PRESENCE IN EUROPEAN AND US MARKETS, THE OPENING OF NEW PRODUCTION PLANTS
AND THE ACQUISITION OF IMPORTANT BRANDS SUCH AS PAVESI (ITALY), MISKO
(GREECE), FILIZ (TURKEY), WASA (SWEDEN), YEMINA AND VESTA (MEXICO), LIEKEN
(GERMANY) AND HARRYS (FRANCE).
19791993
THE RETURNOF PIETRO BARILLA
THE RELAUNCH
IN 1979, PIETRO BARILLA RETURNEDTO THE HELM OF THE COMPANY. THE HISTORIC RE-ACQUISITION
COINCIDED WITH THE RESUMPTION OF A LONG-TERM INDUSTRIAL AND ADVERTISING STRATEGY,
BASED ON THE IDEA OF RE-LAUNCHING PASTA
AND THE ITALIAN FIRST COURSE AND DEVELOPING THE OFFER
OF BAKERY PRODUCTS.
FEEDING THE FUTURE
SINCE 140 YEARS WE ARE PASSIONATE ABOUT PASTA,
FROM THE FIELD TO THE TABLE, AND WE ARE COMMITTED
TO BRING PEOPLE THE BEST EXPERIENCES:
HIGH QUALITY AND TASTY MOMENTS, PRESERVING OUR PLANET.
2017140 YEARS
OF BARILLA HISTORY
THE BARILLA ADVENTURE STARTS
THE BARILLA STORY BEGINS IN 1877WITH PIETRO BARILLA, IN A BREADAND PASTA SHOP IN THE CENTRE
OF PARMA.
THE FIRST FACTORY OPENED
IN THE EARLY YEARS OF THE 20TH CENTURY, THE FOUNDER WAS SUCCEEDED
BY HIS SONS RICCARDO AND GUALTIERO. THE FIRST FACTORY OPENED,
EMPLOYING 100 WORKERS AND PRODUCING 80,000KG OF PASTA A
DAY, AND IN THE SAME YEAR BARILLA REGISTERED ITS FIRST TRADEMARK:
A LITTLE BOY CRACKING AN EGG YOLK INTO A FLOUR TROUGH.
AFTER THE DEATH OF HIS FATHER AND BROTHER, RICCARDO BARILLA STEERED THE COMPANY’S GROWTH
IN THE TWENTIES AND THIRTIES. IN 1936, PIETRO, RICCARDO’S SON,
ENTERED THE COMPANY AND BEGAN DEVELOPING ITS COMMERCIAL NETWORK.

Barilla’s history in a nutshell, since 1877
«I STARTED WORKING WHEN I WAS THIRTEEN YEARS OLD. MY FATHER WOULD SEND ME WITH OUR HANDCART TO FETCH A FEW SACKS OF FLOUR, WHICH WERE THEN TRANSFORMED INTO BREAD IN OUR OLD SMALL BRICK OVEN. AFTER A FEW YEARS, IN A SMALL SHOP, WITH THE HELP OF MY SISTERS AND MY MOTHER WHO WORKED AT THE COUNTER, WE SOLD THE BREAD THAT MY FATHER AND I PRODUCED BY WORKING FOR UP TO 18 HOURS A DAY.»
Riccardo Barilla
«IT IS IMPORTANT TO UNDERLINE THAT, IF BARILLA AFTER MANY YEARS MANAGED TO BECAME AN ESTIMATED AND WELL REPUTED COMPANY, IT IS ALSO BECAUSE IT HAS ALWAYS BEEN COMMITTED TO CREATE WELLBEING FOR THE ENTIRE COMMUNITY.»
Luca Barilla
«THE BRAND MUST BE ABLE TO BUILD RELATIONSHIPS, NOT JUST TRANSACTIONS, WITH CONSUMERS; AND OUR FUTURE IS DEPENDENT ON OUR CONTINUING TO CREATIVELY RENEW THE WAY WE COMPETE.»
Guido Barilla
«I DON’T THINK OF A GREAT COMPANY IN TERMS OF SIZE, I THINK IT SHOULD BE GREAT FOR THE VALUES AND TRUST THAT INSPIRES.»
Paolo Barilla
«THE ITALIAN NUTRITIONAL MODEL IS THE ESSENTIAL POINT OF REFERENCE FOR HEALTHY EATING HABITS, FOR THE RESPECT AND PROTECTION OF THE NATURAL RESOURCES OF OUR PLANET AND FOR SAFEGUARDING THE RIGHTS OF FUTURE GENERATIONS.»
Guido, Luca e Paolo Barilla
«IT IS MY BELIEF THAT THE THREE CHARACTERISTICS OF A BUSINESSMAN ARE COURAGE, INTUITION, AND OPTIMISM. I THINK THAT THE ENTREPRENEUR HAS AN IMPORTANT ROLE TO PLAY NO MATTER WHAT HIS FIELD. BUT THE FOOD SECTOR HAS A SPECIFIC ROLE, I WOULD CALL IT A DEEPER AND MORE CHALLENGING ONE, BECAUSE FOOD GOES OUT TO EVERYONE: TO CHILDREN, TO THE ELDERLY, TO FAMILIES. FOOD HAS THIS SENSITIVITY, THIS IMPORTANCE FOR THE HEALTH OF PEOPLE.»
Pietro Barilla
Barilla Group
We were born in Parma in 1877, 140 years ago, when Pietro Barilla opened a small bread and pasta shop. That moment marked the beginning of a journey of quality and passion that has identified Barilla over the years, leading us to the development of iconic brands in the food sector.
TURNOVER (MLN EURO)
GEOGRAPHICAL AREAS
EMPLOYEES
3,403
2016
8,400
2016
3,468
2017
8,358
2017
4.3%
ASIA, AFRICA,
AUSTRALIA
45.3%
ITALY
19.4%
AMERICAS
31.0%
REST OFEUROPE
AND RUSSIA

13
Our purpose
We bring to the world joyful and wholesome food habits, coming from clean and responsible supply chains, inspired by the Italian lifestyle and the Mediterranean Diet.
Because food for barilla is not just food: it is the pleasure you feel, the energy inside you, it is being well for many years to come, it is respect for us and for the planet we live on. With our know-how, with simple and authentic gestures we talk about our only way of doing business: Good for You, Good for the Planet.
We are convinced that a company can only have a long term presence if it is committed to caring for people and the environment every day.
“Good for You, Good for the Planet” is Barilla’s approach to give its contribution to the 2030 Agenda of the United Nations and the 17 Sustainable Development Goals.
14
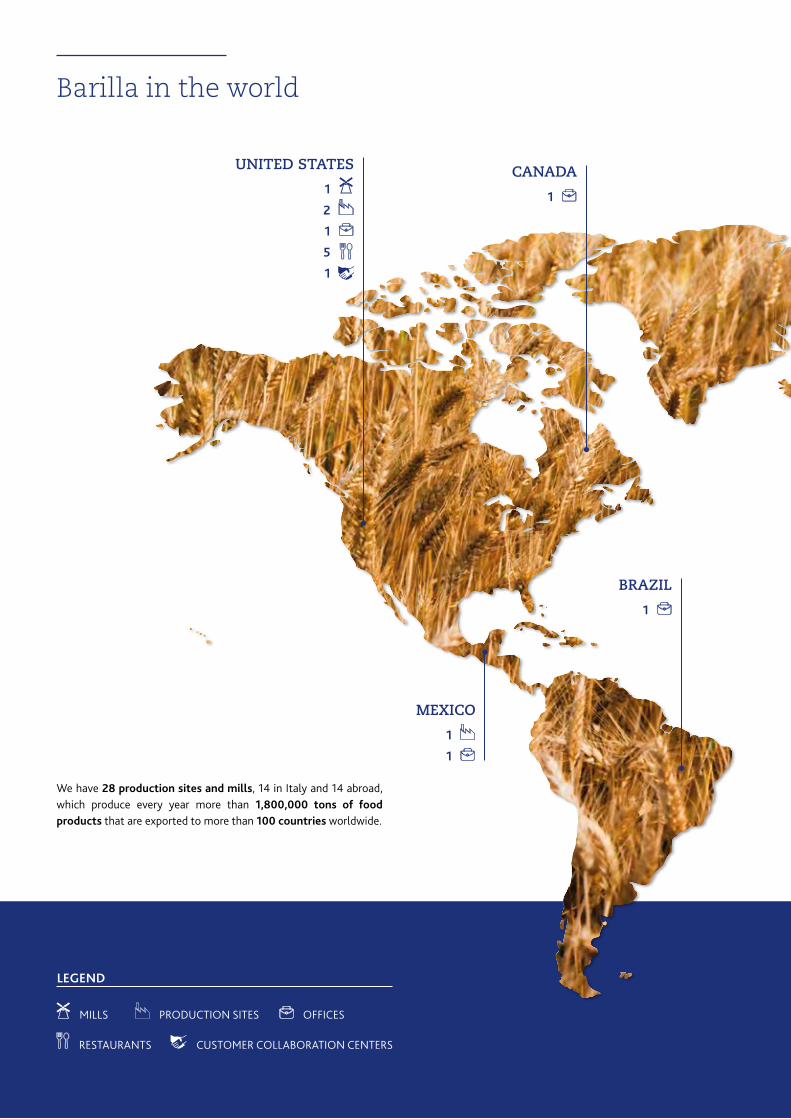
MEXICO
CANADA
1
1
1
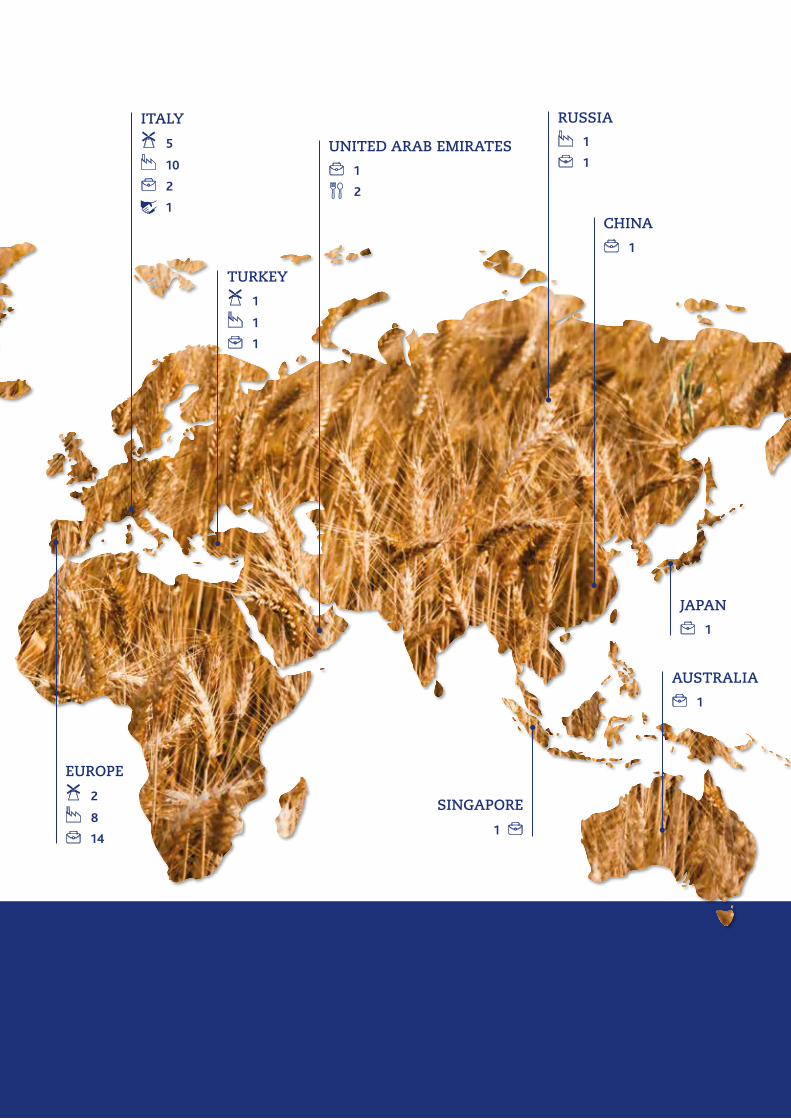
MILLS
RESTAURANTS
PRODUCTION SITES
CUSTOMER COLLABORATION CENTERS
LEGEND
OFFICES
Barilla in the world
We have 28 production sites and mills, 14 in Italy and 14 abroad, which produce every year more than 1,800,000 tons of food products that are exported to more than 100 countries worldwide.
BRAZIL
1
UNITED STATES
2
1
5
1
1
15
EUROPE
ITALY
UNITED ARAB EMIRATES
CHINA
JAPAN
AUSTRALIA
RUSSIA
TURKEY
SINGAPORE
18
10
1
1
14
2
1
1
1
1
1
1
21
2
5
1

16
Directors’ Report
The 2017 was the first in a number of years to show an upturn in the economy which expanded from the United States across Europe stabilizing over the course of the year.
Italy recorded modest growth, although it is amongst the lowest in Europe, particularly in respect of GDP per capita, with further increases expected in 2018.
The Barilla Group results benefited immediately from these economic developments that led to renewed growth resulting in increased sales volumes and total revenue of euro 3,468 million, a 2% increase on the previous year, corresponding to a 3% increase net of the foreign exchange impact.
The 2017 consolidated the Group’s long-term strategy that is centered on the following objectives:• Continue to strengthen and consolidate corporate values by
concentrating on the well-being of our consumers (Good for You, Good for the Planet - GYGP), the related constant research on product safety aimed at continuous improvement, the sustainability of production (through agreements with local farmers), and the development of people as part of the project ‘Diversity and Inclusion’.
• A system of Corporate Governance that embodies these values that are part of the cultural heritage of the Company and the entire organization, which becomes best practice particularly in respect of the most innovative aspects and is in line recent developments in the Company’s international growth.
• Confirm growth objectives within the context of prudent financial policy, even in the event of a probable, albeit moderate, increase in international interest rates. Growth levers will be: - A product portfolio focused on innovation and the Premium and
Better for You sectors; - Attaining further increases in market share through balanced
marketing policies and the measured consolidation of margins and cash flow generation;
- Renewed industrial capital resulting in significant improvements in productivity;
- Implementation of a de-complexity process and a gradual, but constant reduction in fixed overheads.
Transactions involving subsidiaries
There were no significant changes in the Group structure compared to the previous year.The following commentary provides a detailed review of the activities of the individual Group companies and Barilla Iniziative S.p.A. (“the Company”) in accordance with the disclosure requirements of article 2428 of the Italian Civil Code and article 40 of the Legislative Decree 127 of 9 April 1991, modified by L. D. 32/2007.
Accounting standards - International Financial Reporting Standards (IFRS)
The Group’s Consolidated financial statements have been prepared in accordance with International Financial Reporting Standards - IFRS (hereinafter IAS/IFRS) endorsed by the European Union. For any further detail on the accounting policies adopted, see the Illustrative notes to the Consolidated financial statements.
General information
All amounts are expressed in thousands of euro except where otherwise indicated. All comparisons made throughout this Report and the Consolidated financial statements refer to the financial information for the previous reporting period (disclosed in brackets). Percentages (on margins and changes) are calculated based on the values expressed in thousands of euro.The Group, of which Barilla Iniziative S.p.A. is the parent company, is defined as “the Barilla Iniziative Group” or “the Group”. Where comments relate specifically to the parent company, or the individual subsidiaries, the full name and legal form of the companies are stated.
17
Consolidated financial highlights
Operating profit from continuing operations (EBIT) totaled euro 373 million (euro 380 million), representing 11% of revenue (11%). In terms of cash flows, operating profit from continuing operations, net of depreciation, amortization and impairment of intangibles and property, plant and equipment (EBITDA), amounted to euro 504 million (euro 513 million), corresponding to an average 15% of revenue (15%).
Profit before income tax amounted to euro 364 million (euro 372 million).
Consolidated profit for the year amounted to euro 288 million compared to a profit of euro 240 million in 2016.
Consolidated profit attributable to owners of the parent (net of non-controlling interests) amounted to euro 286 million, compared to euro 238 million last year. Profit attributable to non-controlling interests amounted approximately to euro 3 million.
Current and deferred income taxes for the year totaled euro 76 million (euro 131 million); the effective tax rate fell to 21% (35%). The fall on last year is principally due to tax benefits on income of the Italian subsidiaries arising on the use of intellectual property (including trademarks and licenses, software and designs, know-how - “Patent Box”), the tax benefit arising on application of the “Super-depreciation” incentive, incentives introduced by the 2017 Italian Finance Law to encourage investment in line with “Industry 4.0” and a fall in the national nominal tax rate.
The Group’s net financial position (NFP) was negative and amounted to euro 218 million at the end of 2017 (the previous year it was positive for euro 62 million); for further details see the Illustrative notes to the Consolidated financial statements. The fall in the NFP is principally due to the significant distribution of reserves (euro 427 million).
The principal loans in place are:• Bonds issued by Barilla France S.A.S. totaling USD 200 million
placed with US institutional investors in July 2011 and divided into tranches (maturing between 2018 and 2023). The bonds, including the related hedging instruments, amounted to euro 136 million at the year-end;
• USD 150 million bond issued by Barilla Iniziative S.p.A., placed with US institutional investors that matures in 2025. This bond, including the related hedging instruments valued at mark-to-market, amounted to euro 114 million at the year-end;
• USD 185 million bond issued by Barilla Iniziative S.p.A., placed with US institutional investors that matures in 2027. This bond, including the related hedging instruments valued at mark-to-market, amounted to euro 167 million at the year-end;
• A euro 700 million five-year revolving credit facility (2014-2019) between Barilla Iniziative S.p.A., Barilla G. e R. Fratelli Società per Azioni, Barilla France S.A.S. and 15 Italian and international banks. The facility was totally unused at 31 December 2017 and was renewed at the beginning of 2018 as explained further below in the paragraph ‘Significant events after the year-end’;
• A fixed-term amortizable loan of euro 50 million negotiated in January 2012 between Barilla Iniziative S.p.A., Barilla G. e R. Fratelli Società per Azioni and the European Investment Bank (EIB) that matures in 2020. The outstanding debt at 31 December 2017 amounted to Euro 16 million.
The Group confirms its ability to generate value while minimizing financial risk.

18
Barilla starts the expansion of its Rubbiano (Italy) sauces production plant, to make it one of the most sustainable of its kind in the world. February 2017

19

20
Our brands
The Barilla brand has its roots in a small bread and pasta store opened in Parma in 1877. Today it is the number one pasta in Italy and around the world. Thanks to the best durum wheat and impressive modern technologies, Barilla supplies millions around the world with pasta that always cooks to a perfect al dente texture, as well as ready-to-eat pasta sauces.
Voiello was established in 1879 as a small store in Torre Annunziata, a small town outside Naples, a world capital of pasta making since the 16th century. Voiello pasta comes in all the most popular Neapolitan shapes. Its secret is the uneven surface achieved with bronze dies. Voiello was acquired by Barilla in 1973.
On December 1st, 2013, Barilla opened the company’s first restaurants in New York - 6th Avenue 52nd - with the goal of bringing Italian conviviality to the world. Currently there are seven restaurants and the growth plan is ambitious.
Founded in 1975, Mulino Bianco is truly a part of the cultural fabric of Italian food and of the everyday diet of Italian families. This brand offers simple, genuine bakery products in all categories that are perfect for eating at home or on the go.
The Pavesi brand was established in 1937 by Mario Pavesi, an inventive baker and entrepreneur in the city of Novara. It offers a wide range of bakery products and pastries, all of which have unique flavor and rely on well-developed production technologies. Pavesi was acquired by Barilla in 1992.
The leading pasta brand in Greece, Misko was established in 1927 and represents Greece’s substantial pasta tradition; its logo depicts the monk Akakio on his donkey, going to buy pasta at the village market. Barilla acquired Misko in 1991.

21
Established in 1977, Filiz is one of the top pasta producers in Turkey, one of the biggest pasta consuming countries. Barilla acquired Filiz in 1994.
Founded in Sweden in 1919, Wasa is the world’s largest producer of crispbreads. It distributes its many rye and wheat products in more than 40 countries. Barilla acquired Wasa in 1999.
Pan di Stelle was created in 1983 as one of Mulino Bianco’s breakfast biscuits. In 2007, with the launch of the snacks and the cake, it began its career as a stand-alone brand to become a trademark in its own right much loved by people everywhere.
FIRST is a brand specialized in retail sales services.
Launched in 1970 on the baked goods market in France, the Harrys brand today is leader in the soft bread market and an important player in the morning goods market. Quality and innovation are two of the most important key success factors.
Gran Cereale was founded in 1989 as a Mulino Bianco whole grain biscuit and has grown to become a Barilla brand of whole grain and natural products. Nowadays, the brand offers consumers a wide range of products ranging from Biscuits to Cereals, from Crackers to “Snackbiscotto”.
Yemina, created in 1952, and Vesta, in 1966, are two of the leading Mexican brands. Barilla entered that market by forming a joint venture with the Mexican Grupo Herdez in 2002.
Launched in Italy in 2015 via a partnership with Whirpool, CucinaBarilla is a project which offers a “service” comprising a special oven and a series of ready-to-use ingredient kits for the easy preparation of quality recipes.

22
In line with its mission, Barilla respects diversity and promotes inclusion. Barilla views its Refugee Program as an integral part of this commitment. The company not only donates funds and products, but also supports the employment of refugees and supports their induction.
December 2017 - In the photo, the Refugee Program receives the Barilla Excellence Award during the Yearly Leadership Team Meeting.
23
Group structure and organisation
The Group’s investments in its operating subsidiaries are held through the sub-holding Barilla G. e R. Fratelli Società per Azioni, which focuses on the manufacture and sale of pasta, sauces and bakery products both in the domestic and international markets, and Italian Kitchen S.r.l, which operates in the development and management of the Restaurants business.
The Group operates directly in 26 countries, exports its products to more than 100 countries and owns 28 production facilities across 9 countries.
Economic scenario
The period of expansion that commenced last year was further consolidated in 2017, the most stable year since 2010. World trade, despite having slowed down, grew in line with economic growth: this is due to increased investment and manufacturing with continued favorable global financial terms. On the other hand, inflation was still contained in 2017 in both developed and emerging economies, thus confirming a lack of pressure on demand. Even rising energy and food prices slowed down towards the end of the year.
The positive trend of recent quarters continued in Italy, although below the European average, thanks to both local (boosted by higher growth in disposable income per capita) and overseas demand. Investment picked up in the second half of the year while consumer price inflation remained modest.
Market developments in France in 2017 were largely driven by private investment and a corresponding increase in the level of debt. An increase in public investment is expected in 2018. There was a downturn in the growth in private consumption due to the erosion of purchasing power caused by increased inflation.
Growth in GDP peaked in Germany in 2017, recording the highest rate in six years (2.2%) with further growth forecast over the next two years, boosted by increased private consumption; unemployment hit a record low, investment increased and overseas demand grew. Germany continues to act as the driving force of the Eurozone despite its tight fiscal policy.
The economic boom, led by rapidly growing public spending, contributed to solid growth in Sweden. This growth together with fiscal policy has given rise to a budget surplus, a fall in public debt and expansion of the workforce with increased demand thanks to continuous investment, while monetary policy has kept inflation at the target 2%.
Economic growth in Russia is expected to continue at a modest pace as in 2017. Demand is weak, inflation is declining and oil prices (the country’s main economic resource) are stuck at USD 70 a barrel. Productivity remains stagnant, the workforce is shrinking and international sanctions restrict international trade and access to new technologies.
Economic recovery continued in the United States with an acceleration in growth supported by favorable financial conditions and sustained public confidence. Consumer spending, which is one of the largest components of the US economy, increased in the last
quarter reaching its highest level since 2014, supported by rising household wealth, tax cuts linked to new reforms and wage growth due to the further fall in unemployment.
This recovery is expected to expand to Latin America, particularly to Mexico that will benefit from high US demand, as will Brazil.
The positive trend recorded in 2017 not only reflects the expansion of developed economies but also the acceleration of emerging markets driven by China and India in particular.
Growth in Turkey is forecast to be higher than expected due to expansive fiscal policies, loose monetary policy and a high demand for exports.
Despite the auspicious framework established in 2017, 2018 shows signs of fragility and uncertainty. International trade and capital flows have slowed down compared to global GDP.
The new protectionist policies implemented in the United States, the tapering out policies relating to quantitative easing with a rise in interest rates (expected in Europe from 2019), the possible bubble in the financial markets, growth in the levels of public and private debt, international geopolitical tension and the populist surge increase, all contribute to heightening uncertainty.
In the period 2016-17, the fast moving consumer goods markets underwent a structural change. Revenue growth rates of the large multinationals slowed down from the previous 5% to the current 2.3%. Mass marketing, large sales forces and heavy investment in large manufacturing facilities risk being a losing strategy in the long-term. The new methods of digital consumption, the demand for innovative products, the market entry of new “small” but agile players that are ready to satisfy consumer demands, are all changing the traditional business methods. Large groups are inherently slower to pick up on changes in consumer preferences and according to latest estimates large companies in the United States have lost USD 22 billion in sales to smaller companies in the period from 2011 to 2016. Large industries grew at a rate of 7.7% from 2006 to 2011 compared to only 0.7% between 2012 and 2016.
This is compounded by price competition between discount and online distribution. Low inflation, volatility and uncertainty are factors influencing today’s fast moving consumer goods industry. All companies have implemented cost cutting, zero-base budgeting and product portfolio reduction strategies with the aim of de-complexity.
Group operating activities
Barilla G. e R. Fratelli The Group operates in the following Regions: • Italy;• Europe, including Russia but excluding Italy;• America including the entire American continent;• Asia, Africa and Australia, including Turkey.
The specific know-how and brands are maintained and safeguarded through the following Categories and Brands:• Meal Solutions, comprising the manufacturing and sale of first
courses (pasta and sauces) under the Barilla, Voiello, Misko, Filiz, Yemina and Vesta brands;
24
• Bakery, consisting in the production and sale of bakery products principally through the Mulino Bianco, Pavesi, Wasa and Harrys brands.
The Barilla Restaurants business area is responsible for creating and developing the Business to Consumer models and spreading the Italian gastronomic culture and Mediterranean lifestyle throughout the world.
Italy RegionFollowing a drawn out, difficult economic period, expenditure growth in 2017 was largely driven by the consumption of fresh products, while spending on packaged products was still limited. This growth came through Superstores and Discount stores, while traditional stores continued to lose ground. The “winners on the shelves” are private and local labels that offer high quality, healthy and advantageous products in order to enhance the categories.Within this framework the Barilla Group also experienced a positive trend and growth in almost all of the categories in which it operates, in particular in the sauces segment and in the majority of bakery products.
In the Bakery business, the removal of palm oil from all products in 2016, the continuous improvements to recipes, the expansion of the Better for You & Healthy ranges and the implementation of various strategic innovations contributed to growth of the key brands and an increase in the market share of the main product categories with some of these enjoying record levels in late 2017.These results were most notable in the Biscuits, Rusks and Dry snacks categories where the sales and marketing initiatives implemented in the course of 2017 were particularly effective, while the Minicakes business recovered most of the ground lost in 2016. The Soft breads category performed well thanks to an expansion of the product range.
In the Meal Solutions business, sauces maintained strong growth building on the previous significant and constant growth trend and allowing the business to attain record revenues that were supported by the core business and rapid growth in this segment. In the Pasta segment, results improved thanks to the contribution of the premium brand Voiello that recorded significant growth within its sector as a result of effective marketing strategies implemented some years ago. Products in the Better for You segment (Organic, Whole Grain, Multi Cereal and Gluten Free Pasta) also contributed significantly to the growth of the Pasta business in line with the current rapid growth in consumption.
Europe RegionThe Europe Region performed well in 2017 enjoying a 6% growth in sales volumes and 4% in revenue (at constant exchange rates) compared to 2016.
Analyzing the individual areas performances as follows:• The Western Europe cluster recorded a 3% growth in volumes and
1% in revenue (at constant exchange rates), which was largely attributable to the French market where market share increased across all of the key product categories (both Meal solution and Bakery). On the other hand the results of the Spanish, Portuguese, Belgian and UK market were either in line or slightly below last year;
• The Central Europe cluster continued to enjoy growth in both volumes (+6%) and revenue (+5% at constant exchange rates)
compared to the previous year, achieving record market shares in respect of both pasta and sauces in Germany, Switzerland and Austria. Of note is the positive entry of the fresh pasta category in Germany;
• The Northern Europe cluster performed in line with the previous year (stable volumes, revenue -1% at constant exchange rates), with excellent results in the Meal solution segment in Sweden (where Barilla consolidated its market leader position), which were offset by fierce competition in the Dry breads category, the entry of new, aggressive rivals in Sweden and a drop in the Norwegian market (despite increasing market shares);
• The Eastern Europe cluster grew by 5% both in volumes and revenue thanks to the outstanding performance in Poland, Romania, Hungary and the Czech Republic where the market share in the Pasta and Sauces categories was further consolidated. Following years of poor performance due to the difficult macroeconomic situation, the Group’s overall results in Greece remained stable in 2017 (+1% in volumes, -1% in revenue);
• The Russia & CIS cluster recorded 36% growth in both volumes and revenue (at constant exchange rates), with an increase in the Pasta market share that led Barilla to be the third player in the Russian market (both in volumes and revenue), second in Moscow and first in Saint Petersburg (in revenue). An investment to increase the capacity of the pasta production line in the SolneČnogorsk factory near Moscow was approved in late 2017.
America RegionThe US economy recorded higher growth in 2017 compared to the previous year, with 2.3% growth in GDP, 0.8% higher than 2016. Mexico enjoyed positive growth of 2% albeit lower than the 2.9% recorded last year, while Brazil witnessed positive growth of 0.7% following two consecutive significant recession years. Canada’s economy grew by 3%, double of the previous year.
Given this period of economic growth, revenue in the America Region increased in all of the countries in which the Group operates:• The United States continues to represent the most important
market in the Region. Barilla recorded growth once again in the Pasta category, increasing market share by 1% in value terms to reach 32.8%, thanks to increased consumption of classic products sold in the iconic blue packaging (durum wheat pasta) and innovative Barilla Premium Pasta products (including Gluten Free, Collezione and the new Ready Pasta - an affordable, pre-cooked product launched in 2017), all of which supported by significant investment in marketing;
• The market share of the Modern Trade channel in Mexico reached 34.2% in value terms (a 0.8% increase on last year), thanks to the continuous support of new product launches and packaging improvements;
• In Brazil the Group consolidated its market share thus improving the financial stability of the business. The market share in value terms in the São Paolo area, in which the Group’s activities are concentrated, increased by 1.6% on last year bringing it to 24.2%;
• In Canada, the Group’s market share in the Pasta segment is now 11.9% (+ 0.5%) in value, which is largely attributable to trade support and marketing activities implemented last year.
Asia, Africa and Australia RegionThe performance of the Asia, Africa and Australia Region was affected in 2017 by uncertainty surrounding economic policy in this area and rising geopolitical tensions. Many countries in the Asia Pacific area recorded solid growth in the presence of financial

25
volatility, while many governments in the Middle East and Africa have gradually introduced protectionist measures.
The stable performance of the Region given this economic situation may be attributed to the following countries:• Despite the devaluation of the Turkish lira, greater care exercised
by consumers and strong price competition, Turkey enjoyed solid revenue growth of 7% compared to the previous year;
• Development of the business in Asia and the Middle East continued with further expansion in Saudi Arabia, Lebanon and the UAE;
• Revenue increased by double digits in China resulting in an increase in market share due to the market penetration strategy focused on the four major cities with the greatest purchasing power;
• Australia recorded strong revenue growth thanks to the positive performance in the Pasta and Sauces categories with solid progress also made in terms of market share.
Revenue in the region increased by 8% compared to last year, at constant exchange rates, with volumes remaining stable but with more widespread distribution and significant penetration of high value added products such as Sauces.
Barilla RestaurantsIn 2017 the Barilla Restaurants business continued its mission of spreading the Mediterranean food and lifestyle experience through the restaurant business. Two new restaurants, USC Village and South Coast Plaza, were opened in South California, joining the three existing restaurants in New York City. USC Village is in the campus of the famous University of Southern California, while South Coast Plaza, in Orange County, is located in one of California’s main shopping areas. A franchising agreement was signed last year with an important local operator in the Arab states that are members of the Gulf Cooperation Council, which resulted in the opening of two restaurants in Dubai in late 2016.
Capital expenditure
The Group’s objectives to achieve product innovation, increase production capacity and improve efficiency resulted in capital expenditure of euro 218 million, corresponding to 6.3% of revenue. The main investments included:• The upgrade and expansion of production capacity at the sauces
plant in Rubbiano (Parma, Italy);• Implementation of two new pasta production lines with related
packaging facilities; expansion of wheat storage facilities and extension of rail transport for raw material delivery at the Ames manufacturing facility (America);
• Redesigning the automated pallet system in order to obtain an higher flexibility and versatility, at the Pedrignano plant (Parma, Italy);
• Completion of projects aimed at guaranteeing removal of traces of allergens from pasta production at the Pedrignano plant (Parma, Italy);
• The Gluten Free dry breads production line in Celle (Germany);• Increasing storage and flow capacity in the automated warehouse
in Pedrignano (Parma, Italy);• Replacement of line 10 at the Caserta factory (Italy);• Design and fitting out of two new restaurants opened during the
year on the Californian coast (America).
Corporate Governance
The corporate governance structure of Barilla Iniziative S.p.A. (hereinafter “the Company”) consists of the following corporate bodies: the Board of Directors, the Board of Statutory Auditors and the Independent Auditors.
The Board of Directors (BoD) is the body vested with the widest powers possible and is responsible for managing the Company and assessing the adequacy of the organization, administration and accounting functions, the review of the overall operating performance and the adoption of resolutions that require the approval of the BoD pursuant to the articles of association. The Company may be managed by a Sole Director or a BoD made up of three or more members as approved by the General Shareholders Meeting (GSM) and envisaged by the Company’s articles of association. The current BoD comprises nine directors (two of whom represent non-controlling interests) whose term of office expires on the next GSM called to approve the 2017 Annual Report.
The Board of Statutory Auditors, appointed by the same GSM that approved the change in legal status of the Company from a S.r.l. to a S.p.A., oversees compliance with the law and the articles of association, on matters involving compliance with the principles of correct administration. The term of office of the Board of Statutory Auditors expires on approval of the 2017 Annual Report.
KPMG S.p.A. has been appointed as Independent Auditors to perform the audit of the Separate financial statements as required by law. It has also been appointed to audit the Consolidated financial statements of the Barilla Iniziative Group and the separate financial statements of the main Group subsidiaries.
The governance structure is developed taking into consideration the operating conditions in the case of the main Italian subsidiaries and local legislation also in respect of overseas entities.With regard to Barilla G. e R. Fratelli Società per Azioni and its subsidiaries, the governance structure is similar to that of Barilla Iniziative S.p.A. The internal control system of Barilla G e R. Fratelli Società per Azioni however, is more company specific depending on the different operating context and it has adopted an Organization, Management and Control Model that complies with Legislative Decree 231/2001 (hereinafter “the MOG Model” or “MOG”). The MOG includes a general section and special sections relating to particular offences together with the Code of Ethics. These define the types of corporate crimes, the business areas considered at risk of a crime being committed, the procedures, systems and protocols aimed at preventing crimes and the set of principles and values that the Barilla Group companies identify with and that the directors, statutory auditors, employees, external collaborators, suppliers and customers are required to adhere to.The MOG Model was approved by the Barilla G. e R. Fratelli Società per Azioni BoD on 4 March 2005; subsequently the BoD approved the latest version of the MOG, updated to reflect the introduction of new offences, on 26 February 2018.In order to evaluate the effective and correct implementation of the MOG Model, the BoD of Barilla G. e R. Fratelli Società per Azioni appointed a Supervisory Board, which is composed of the heads of Barilla Holding Società per Azioni Group’s Legal and Corporate Affairs and Group Internal Audit Process Unit and an external member who is a university lecturer and self-employed professional. The Supervisory Board reports on a half-yearly basis to the BoD
26
regarding its activities and receives notices and recommendations from employees and third parties. In light of the increasing internationalization of the Group, a project was launched last year with the purpose of establishing a Compliance department and an Integrated Compliance System (hereinafter “the System”). The Group Legal and Corporate Affairs Officer was appointed to the role of Group Compliance Officer.
In the course of 2017, the Group Compliance Officer and the Compliance department continued implementation of the System, which entails, where necessary, the strengthening of control policies and procedures, training of Group employees in the relevant areas and a whistleblowing channel that allows potential violation of policies, notified anonymously. The System is governed by a Master Policy, in addition to specific policies aimed at ensuring compliance with the relevant topics, namely: Privacy, Competition Law, Money Laundering, Anti-corruption, International Sanctions, Food Legislation and Advertising.
Only one way of doing business:“Good for You, Good for the Planet”
The mission “Good for You, Good for the Planet” represents a group of values and principles that drive Barilla’s decision making and a concrete commitment to respond to the complex challenges faced at international level.The concept is simple: Barilla wants its brands and products to bring good, wholesome, responsibly sourced foods to the world, inspired by the Italian lifestyle and the Mediterranean Diet.This is an important project that the Group intends to pursue “from field to fork”, focusing on all stages of the supply chain, from farming of raw materials to consumption.
In order to succeed in this mission, Barilla will continue to strive for improvement, investing in the nutritional quality of products, increasing brand identity, strengthening presence in key markets and reinforcing the geographic expansion currently underway. Sustainability and business are inextricably linked in a single strategy that can satisfy economic objectives while contributing to the global challenges facing the food industry.
The Barilla Center for Food and Nutrition Foundation (BCFN), a multi-disciplinary think tank that studies and analyses the economic, scientific, social and environmental factors associated with the food industry, plays a fundamental role in influencing the Group’s day-to-day activities.Through its collaboration with scientists and international experts, the BCFN regularly publishes scientific studies aimed at analyzing issues surrounding the current agro-food sector and promoting the move towards a healthier, sustainable lifestyle in line with the Sustainable Development Goals adopted by the United Nations in the 2030 Agenda.
Environmental managementThe Group has been dedicated to the management and control of its environmental impact for many years; to this end various projects and initiatives have been implemented to control and minimize the impact on the planet:• 93% of the Group’s factories (bakeries, pasta factories and
mills) hold an Integrated Environmental Management System, developed in accordance with international technical standard UNI EN ISO 14001; consequently, roughly 93% of sales volumes is produced in ISO 14001 certified factories (specific certification on the subject of environmental management);
• In accordance with stringent European IPPC regulations (Integrated Pollution Prevention and Control), all bakeries, the Italian pasta factories and the Altamura, Castelplanio and Ferrara mills hold the Integrated Environmental Authorization that envisages, amongst other things, adherence to sector specific Best Available Techniques - BAT;
• Barilla has employed a Life Cycle Assessment tool for more than 10 years in order to assess the environmental impact of its products; in accordance with the international EPD system (Environmental Product Declaration) - www.environdec.com - Barilla publishes information regarding the certified environmental impact and it is the first food group to have developed and obtained third party certification on a system that measures the environmental impact of its products. In 2017 61 EPDs for Barilla products were available on the website environdec.com, corresponding to around 70% of production volumes;
• With regard to product packaging, the virgin fiber cardboard used for pasta packaging is sourced from responsibly managed forests. Moreover, about 99% of packaging on the market is technically recyclable.
With regard to energy saving and the use of energy from renewable sources:• The production of Mulino Bianco, Wasa and Barilla sauces is
covered by specific certificates (GOs - European Guarantees of Origin) confirming that production uses renewable energy sources;
• The factory in Melfi has approved the installation of a photovoltaic plant;
• In order to improve efficiency and reduce the environmental impact, all of the Italian pasta factories run a cogeneration plant that enables the combined production of electricity and thermal energy. Furthermore, plans to reduce energy consumption continue.
The ESP - Energy Saving Project, established at least 10 years ago to develop improvement projects across all of the factories, launched the implementation of an Energy Management System in accordance with the recently introduced international technical standard ISO 50001. As a result, up today, more than 36% of current production takes place in ISO 50001 certified factories (specific energy certification).The two plants in Parma and Foggia (Italy) are covered by the Emissions Trading Scheme and are certified periodically by an independent third party.New durum wheat storage silos and rail links to transport wheat to the Pedrignano plant (Parma, Italy) have been in operation for some years, which has reduced the number of trucks on the roads by on average more than 2,500 each year.

27
“The value of food: ideas for a healthy, sustainable future”: a discussion between Guido Barilla, President of the Barilla Center for Food & Nutrition Foundation (BCFN) and Carlo Petrini, founder and President of Slow Food International, during the Barilla Foundation’s eighth International Forum on Food and Nutrition in Milan. December 2017

28
Health and SafetyThe Group developed the Barilla Integrated Safety-at-Work Management System that has been rolled out to all of the European operating sites. This system was developed in accordance with international technical standard OHSAS 18001 (Occupational Health and Safety Assessment Series) to guarantee improved health and safety standards for employees and covers 86% of the Group’s factories.The global audit plan continues to cover the areas of safety, the environment, fire prevention and energy and around 120 specific checks took place in 2017 throughout all of the pasta factories, bakeries and mills with the support of specialist enterprises.
More than 42,000 training hours took place on the subjects of health, safety at work, the environment and fire prevention in the course of 2017. The prevention efforts carried out on the areas of health and safety at work have favored a significant fall in the accident rate of the entire Group in recent years. The sauces plant in Rubbiano, Parma (Italy), the pasta plants in Thiva (Greece) and Ames (America) and 5 mills achieved the target of no accidents being recorded, in some cases for a number of years. The extensive prevention activities has resulted in a 57% fall in the number of accidents across the entire Group, a 54% drop in the accident frequency compared to 2010. No critical accidents involving employees occurred in the workplace in 2017 and no actions are pending in respect of health and safety matters.
Human capitalThe number of employees at 31 December 2017 was 8,358 (8,400), of which 4,045 (4,024) are in Italy and 4,313 (4,376) overseas. An analysis of employees compared to the previous year is illustrated below:
The 2017 may be considered a year of transparency and clarity in regard to Human Resources (HR) processes. A portal was launched on which all of the HR processes have been made available to all employees. Global training on the site was provided to all employees involved in these processes. This year saw the culmination of years of work aimed at simplifying systems, linking them to corporate strategy and engaging management to act as fundamental players in people management.
The Company continued its journey towards smart working that comprises new, innovative work methods accompanied by new communication technologies and new workspaces. More specifically, the 2017 focused on the workspace with the significant redesign of the headquarters to an open space format, carefully studied with state of the art technology to improve acoustic, light and energy quality. The project envisages open, informal spaces and an increase in shared areas. The same logic is applied in all of the Group’s operating locations.
Training activities this year focused on developing professional and leadership skills. The former were addressed by launching
12/31/2017 12/31/2016
Managers and white-collar staff 2,990 3,032
Blue-collar staff 5,368 5,368
Total 8,358 8,400
internal training labs (Academy) across various corporate functions (Marketing, Sales, Finance), in which all of the professional communities may acquire the abilities and skills required to attain executive excellence and consequently better results. The Academies use both classic and more advanced training techniques.With regard to leadership skills, training focused on the development of functional skills, corporate identity and change support.
Together with the support of top management, the Diversity & Inclusion Advisory Board, whose mission is to set challenging objectives in supporting a workforce that is highly diversified and inclusive, has launched projects in the communities in which Barilla works and continued to drive cultural change within the Group. The employee-led groups, Employee Resource Groups - ERG, grew in size over the course of the year: “Balance”, aimed at promoting gender balance and work-life balance, “Voce” to support LGBT employees and sympathizers, “WelcHome” to foster inclusion and multiculturalism and “YOUNG” to improve generation relations.
The Survey Diversity & Inclusion was drawn up and conducted with the participation of more than 85% of all employees involved and was subsequently followed up with the outcome shared openly in each operating division and country. On conclusion of these discussions, specific action plans were outlined and implemented.Barilla is determined more than ever to create an organization guided by the principles of diversity and inclusion in order to support all of its employees widespreadly and equally, develop a more inclusive culture and respect clients and consumers, recognizing that differences between human beings enrich the lives of people and the company.
Research and development activitiesIntensive research continued aimed at guaranteeing the provision of nutritionally improved products, which has been at the heart of the Group’s business for some years now in realizing its mission summarized in the “Good for You, Good for the Planet”; the Group invested euro 40 million on research and development activities in this area. The Nutrition Advisory Board, a group of international experts that for a number of years has provided support to the corporate teams in areas of nutritional research, became the Health and Well-being Advisory Board in 2017, extending its remit to “guiding the Company towards promoting sustainable diets and healthy lifestyles”.
The following key activities were carried out in 2017:• Numerous new whole grain product launches across varying
categories (biscuits, snacks, bread and bread substitutes) that will contribute to the increased consumption of fiber and whole grain cereals, as recommended by international, nutritional guidelines, which is finally on the increase but still too low;
• In the area of nutritional improvement, in which the Group has been involved constantly since 2009, particular focus was placed this year on sugar content, with activities carried out to reduce the sugar content of certain biscuits, and this will be extended to various product categories over the coming years;
• Several clinical studies are underway in Europe and the United States aimed at assessing independently and with scientific objectivity, the impact of pasta consumption on body weight, glycemic response and more generally the role this product plays in a healthy diet and Mediterranean tradition, in order to divulge accurate information on the nutritional quality of complex carbohydrates provided by pasta, which act differently from many

29
other carbohydrate food sources;• Studies to determine the benefits of consuming rye based
products, in particular Crispbreads, the consumption of which is widespread in Northern Europe; rye is one of the most fiber rich cereals, consumption of which could help maintain ideal body weight;
• The project “sì.mediterraneo”, which over the years has raised the Group’s employees’ awareness of healthy lifestyles through training activities and the company canteens, gained important recognition in 2017 through publication of scientific results and presentation of the results at influential conferences.
Sustainable supply chain management and relations with the local territoryIn line with the “Good for You, Good for the Planet” mission, the Barilla Group has been committed for some years now to purchasing raw materials and packaging materials that minimize the environmental impact and contribute to the well-being of the territory in which they operate.Barilla’s products are created through collaboration with more than 1,200 worldwide suppliers and using more than 800 types of raw materials and 50 of packaging materials.In order to standardize the approach across the different raw materials and packaging materials supply chains, Barilla established a Sustainable Agriculture Code (named SAC) and Sustainable Packaging Principles. Both of them are based on the five principles that underpin the responsible management practices of the strategic supply chains.
The 2017 marked significant acceleration in application of these principles, many of the sustainable agriculture projects launched in previous years brought significant results increasing the total of key materials acquired under the SAC and the Principles from 30% to 45%.More specifically the purchase of strategic packaging materials regularly meets 99% of the requisites and 40% of the volume of raw materials purchases meet the terms of the SAC, a marked improvement on 19% attained in 2016.
With regard to the durum wheat supply chain, Barilla continues to rely on a network of manufacturing partners and academics to promote sustainable farming, employing techniques with a reduced environmental impact while at the same time guaranteeing greater control over production quality, balanced pricing strategies and greater financial sustainability for farmers. The agreements with the supply chain partners accounted for 57% of total purchases in Italy and 29% in Greece in 2017. An increasing portion of the harvest was farmed in compliance with the provisions of the “Decalogue for Sustainable Farming of Durum Wheat”, applying a sophisticated Decisional Support System for the farmer aimed at making the farming stage more sustainable: in Italy, the portion of wheat harvested using this advanced system increased from 26% to 33% and involved around 2,000 farmers.Thanks to the collaboration with the University of Thessaly in Greece, the same system is now available for farmers who planted more than 2,000 hectares in 2017 in accordance with the provisions.In the United States, three collaborations in different geographical areas are underway. In North Dakota and Canada, the projects were completed and more sustainable agronomic practices were identified; the North Dakota State University (NDSU) has already published a free “Field Guide” for all members of the supply chain thanks to Barilla’s commitment in this area. Publication will take
place in Canada in early 2018. In Arizona, collaboration with the University of Arizona will begin in 2018 with the first results expected in 2019.As testimony of the commitment to the local territory, in 2017 92% of durum wheat used in the manufacture of the numerous Barilla Group brands was farmed locally in the country in which the pasta was produced.This commitment did not only involve the durum wheat supply chain but was extended to all the key supply chains and resulted in widespread recognition. The BBFAW (Business Benchmark on Farmed Animal Welfare) named Barilla the Italian leader in animal welfare in 2017 thanks to an intensive public campaign on animal welfare and 97% of eggs being sourced from free-range hens. The changeover to free-range hens will be completed in Brazil and Russia in late 2018 bringing the Group closer to the 100% target.
International agreements ensure that 100% of cocoa is sourced from members of international organizations responsible for sustainability and safeguarding human and environmental rights, furthermore, the Pan di Stelle brand tried out a more advanced compliance system thanks to the “a dream called cocoa” project. This pilot project will be rolled out to all of the brands by 2019.
The removal of palm oil from all recipes has led to a significant increase in the volume of sunflower and rapeseed oil purchased. The criteria for applying the Principles of Sustainable Agriculture were defined in 2017 and the first purchases of sustainable sunflower oil were carried out covering 42% of the volumes used in Italy, the aim being to cover 100% in all countries by 2020.84% of tomatoes used in Barilla brand sauces produced in Italy in 2017 were sourced from Global Gap certified farming that guarantees safe production for the consumer, traceability, respect for the environment, safeguarding employees’ health, with the aim being to reach 100% of production by 2020. 100% of the tomatoes used in the United States come from California where a study carried out on the supply chain with the University of California Davis highlighted a significant fall in the environmental impact over the last 10 years. The study will be published in early 2018.
The 99% of key packaging materials, principally paper and cardboard, plastic materials, glass and caps is 100% recyclable and more than 99% of packaging provides recycling instructions for the consumer. All of the paper supply chain is certified in accordance with state of the art standards such as FSC and PEFC.Full implementation of the Principles has opened up new challenges for Barilla, the aim being to use materials only derived from renewable sources and/or recycled materials.
Customer relations In order to establish a relationship of trust with its customers, the Barilla Group has chosen to guarantee the provision of good, safe, high-quality and nutritionally-balanced products in line with the model of the Mediterranean diet. In addition to guaranteeing product quality through stringent controls “from field to fork”, the Group is committed to people’s well-being, safeguarding the planet’s resources and developing local communities. The aim of continuously working with the local territory is to foster diversity inclusion, create access to food and promote responsible choices through specific educational projects.
Barilla’s consumer relationships are fundamental to the development of the company and its way of doing business.
30
The constant dialogue with people through different listening channels across the diverse geographical locations brings the Group closer to customer needs and enables perceived quality to be monitored and facilitates continuous improvement.With this objective in mind, in 2017 digital and other platforms were launched both nationally and overseas that contributed to establishing even stronger customer relations, receive notifications, feedback, and suggestions on both products and the business.
Risk management
The Group launched a project in 2017 to ensure constant improvement of the Enterprise Risk Management model in order to optimize the support provided by business decision processes, activities relating to “Good for You, Good for the Planet” and Company Transformation, and will be implemented in the period 2017 - 2019.
This project, proposed by the Group Finance department and managed by the Enterprise Risk Management department, has also benefited from the active participation of the Group Leadership Team, the Board of Statutory Auditors and the Group Strategy department and provided information regarding key business risks for the BoD.
The initial phase of the project involved the review of risk governance and the annual risk management process and optimization of a number of organizational aspects. The risk assessment process involved 14 departments within the organization, 7 Group risk matter experts (Treasury; Tax; Health, Safety and the Environment; Compliance; Quality, Food Safety & Techregulatory; Scientific Relations & Sustainability; Digital & Business Technology) and resulted in a 360 degree mapping of the major risks to which the business is exposed, which were measured and classified using common standards aimed at prioritizing risk.
More specifically, the assessment activities resulted in:• A new, dedicated data base (Risk Register) listing 170 risk scenarios
across 26 categories;• Mapping of the inherent and residual risk categories and related
scenarios, taking into consideration the corrective and preventative actions currently adopted by the company;
• Enabled identification of the major residual risk categories that potentially exceed the Group’s risk appetite and that also present scope for improvement in relation to the specific operational strategy;
• Definition, together with top management, of the priorities and risk mitigation plans for the key risks identified;
• Identification of the departments responsible for managing specific risks (Risk Ownership).
The regular monitoring of the implementation of the agreed mitigation plans will also enable the constant evaluation of the effectiveness of the action plans and the adequacy of the level of controls adopted for the mapped risks.The updated risk profile is presented to top management on a regular basis in order to monitor critical risk exposure and implementation of planned control measures.
With regard to Information Technology risk, the Group adopts a disaster recovery service for most of its applications, in particular those that are critical to business continuity. A network infrastructure has been adopted that provides a further level of redundancy for remote access to systems.
Cyber Security presents a constant worry to the Group and it continued to pursue projects and carry out investment in this area. Regular vulnerability assessments are carried out by independent specialists in order to maintain a sufficient level of security. The corporate network is equipped with a sophisticated infrastructure that only allows the connection of automatically recognized, authorized devices and an anti-intrusion system. A Security Information & Event Management system was launched during the year equipped with management services for the systematic monitoring of events.
A project was launched to develop a SIEM system “Security Information & Event Management” in line with ISO 27001, by establishing a series of organizational, regulatory and technical measures to protect and control information assets.
Significant events after the year-end
In January 2018, the credit facility maturing in July 2019 has been amended in order to extend its maturity date until January 2023, with the option to extend for a further two years. Furthermore, the size of the facility has been decreased from the initial euro 700 million to 500 million, but with the option to subsequently increase to euro 800 million. The entities Barilla Iniziative S.p.A. and Barilla G. e R. Fratelli Società per Azioni remain as borrowers and guarantors, while Barilla France S.A.S. is not an alternative borrower, save for the option to subsequently designate other borrowers within the Group. The parties to the bank pool have remained substantially unchanged.
Management outlook
The forecast results for 2018 are currently in line with budget, with performance more stable than the 2017 last quarter. Moreover, the process of focusing on the company’s key markets and achieving Group synergies, with particular emphasis on marketing, continued. Seven Regions, representing a new central organizational structure, were set up with the aim of creating a more agile organization in which key markets are further integrated centrally. Within the Marketing function, the organization will be structured in such a way as to recentralize strategic processes in order to coordinate the development of global brands.

31
Other significant operating events
No changes were made to the Group organization structure during the year.
Related party transactions
Transactions with Group companies and related parties are considered neither uncharacteristic nor unusual as they are carried out in the normal course of business of the Group companies. These transactions take place on an arm’s length basis, taking into account market conditions.The nature of the principal transactions with the above parties and the detailed disclosures required by IAS 24 are set out in paragraph 8 of the Illustrative notes to the Consolidated financial statements.

32
The new Barilla Middle East and Africa offices were opened in Dubai, in the presence of Chairman Guido Barilla, CEO Claudio Colzani, Regional President Federico Vescovi and the Barilla Middle East & Africa team. May 2017

33

34
Consolidated financial statementsfor the year ended 31 December 2017
Assets Note 12/31/2017 12/31/2016
Current assets
Cash and cash equivalents 6.1 246,893 535,533
Trade receivables 6.2 427,384 423,434
Tax credits 6.3 28,541 27,867
Other receivables due from parent company 6.4 16,662 555
Other assets 6.5 94,085 119,935
Inventories 6.6 282,717 258,841
Derivative financial instruments 6.20 13,057 2,387
Total current assets 1,109,339 1,368,552
Non-current assets
Property, plant and equipment 6.7 1,001,145 932,675
Goodwill 6.8 467,254 471,793
Other intangible assets 6.9 32,856 39,173
Trade and other receivables 6.10 2,146 2,062
Other receivables due from parent company 6.4 10,322 10,322
Deferred income tax assets 6.11 41,902 67,978
Equity instruments 6.12 1,297 1,550
Derivative financial instruments 6.20 43,828 111,385
Total non-current assets 1,600,750 1,636,938
Total assets 2,710,089 3,005,490
Statement of financial position
(euro thousands)
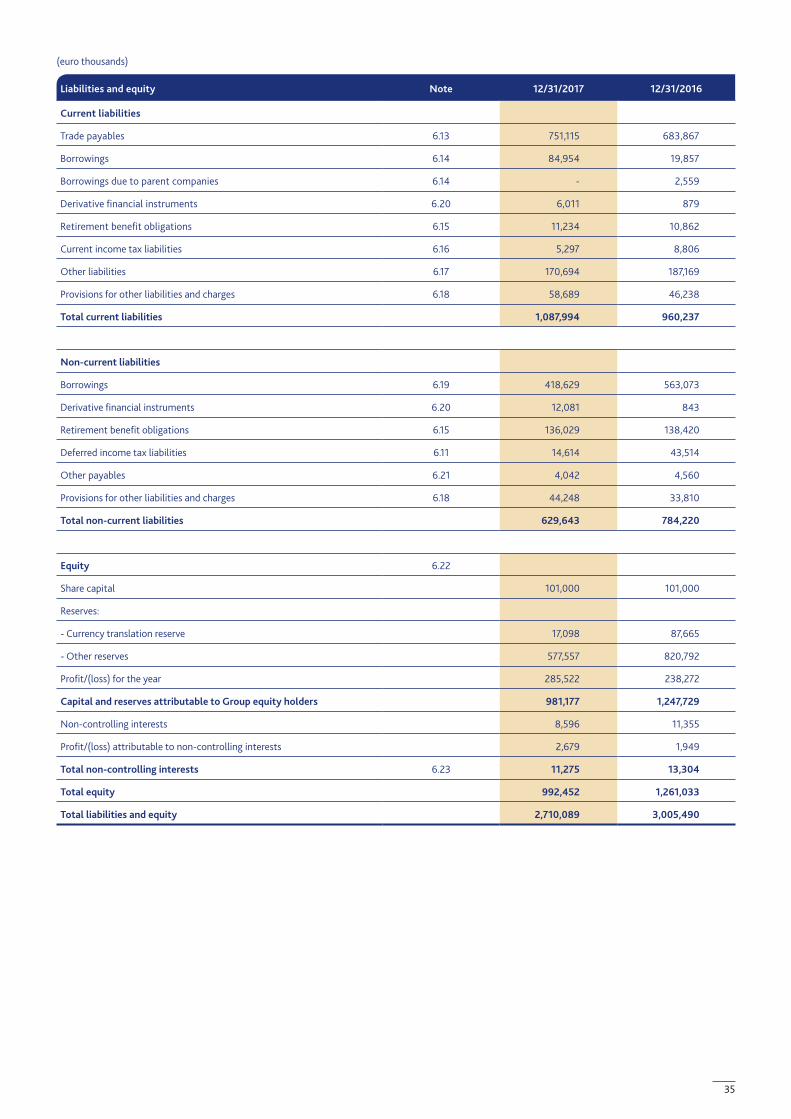
35
(euro thousands)
Liabilities and equity Note 12/31/2017 12/31/2016
Current liabilities
Trade payables 6.13 751,115 683,867
Borrowings 6.14 84,954 19,857
Borrowings due to parent companies 6.14 - 2,559
Derivative financial instruments 6.20 6,011 879
Retirement benefit obligations 6.15 11,234 10,862
Current income tax liabilities 6.16 5,297 8,806
Other liabilities 6.17 170,694 187,169
Provisions for other liabilities and charges 6.18 58,689 46,238
Total current liabilities 1,087,994 960,237
Non-current liabilities
Borrowings 6.19 418,629 563,073
Derivative financial instruments 6.20 12,081 843
Retirement benefit obligations 6.15 136,029 138,420
Deferred income tax liabilities 6.11 14,614 43,514
Other payables 6.21 4,042 4,560
Provisions for other liabilities and charges 6.18 44,248 33,810
Total non-current liabilities 629,643 784,220
Equity 6.22
Share capital 101,000 101,000
Reserves:
- Currency translation reserve 17,098 87,665
- Other reserves 577,557 820,792
Profit/(loss) for the year 285,522 238,272
Capital and reserves attributable to Group equity holders 981,177 1,247,729
Non-controlling interests 8,596 11,355
Profit/(loss) attributable to non-controlling interests 2,679 1,949
Total non-controlling interests 6.23 11,275 13,304
Total equity 992,452 1,261,033
Total liabilities and equity 2,710,089 3,005,490
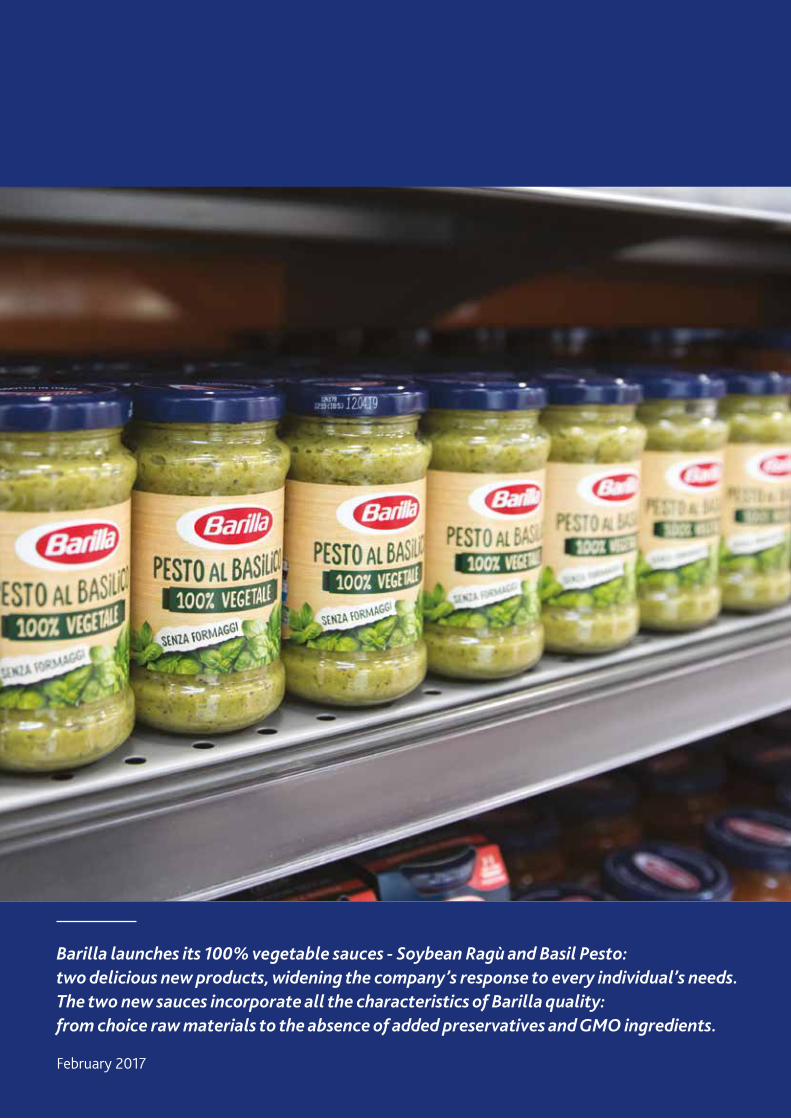
36
Barilla launches its 100% vegetable sauces - Soybean Ragù and Basil Pesto: two delicious new products, widening the company’s response to every individual’s needs. The two new sauces incorporate all the characteristics of Barilla quality: from choice raw materials to the absence of added preservatives and GMO ingredients. February 2017

37
Note 2017 2016
Revenue 6.24 3,467,931 3,403,160
Cost of sales 6.25 (2,022,036) (1,989,174)
Gross profit 1,445,895 1,413,986
Logistics costs 6.25 (302,703) (285,632)
Selling costs 6.25 (152,348) (149,425)
Marketing costs 6.25 (425,062) (394,997)
Research and development costs 6.25 (27,462) (26,164)
General and administrative expenses 6.25 (165,702) (175,226)
Other income and (expenses) 6.26 792 (2,157)
Operating profit 373,410 380,385
Finance income and (costs) 6.27 (9,115) (8,706)
Profit before income tax 364,295 371,679
Income tax expense 6.28 (76,094) (131,458)
Profit for the year from continuing operations 288,201 240,221
Profit/(Loss) attributable to non-controlling interests 2,679 1,949
Profit/(Loss) attributable to Group equity holders 285,522 238,272
Consolidated income statement
(euro thousands)
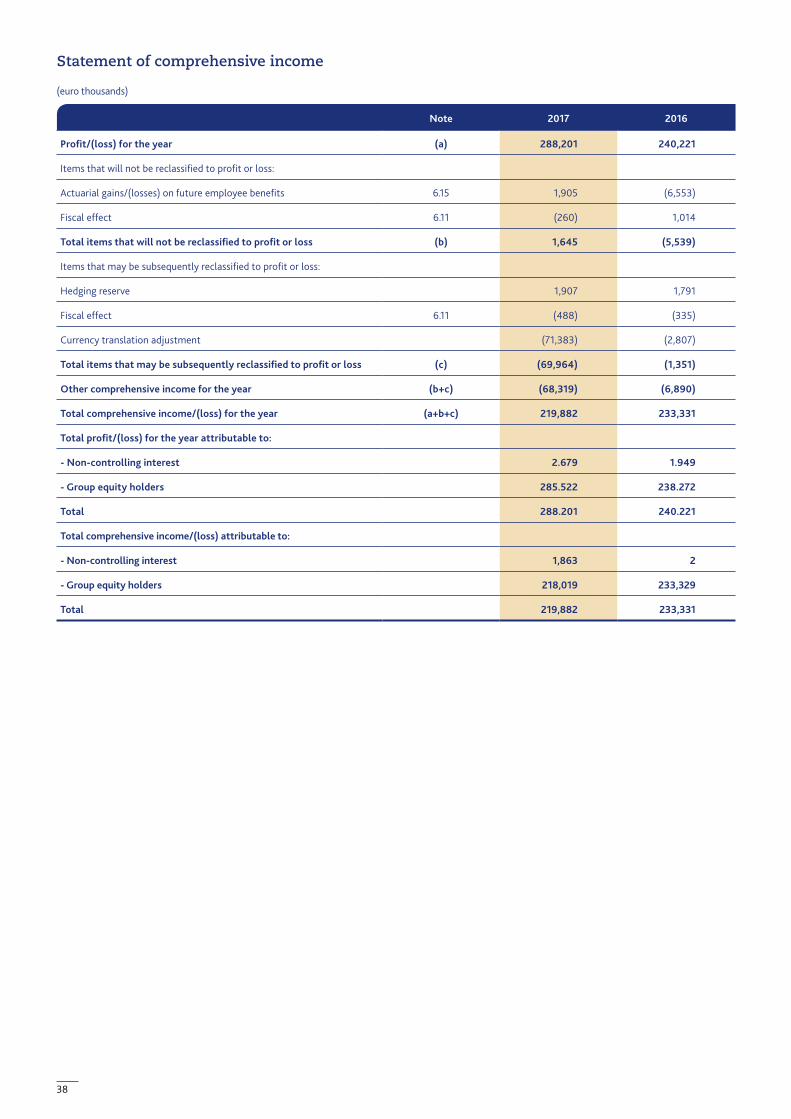
38
Note 2017 2016
Profit/(loss) for the year (a) 288,201 240,221
Items that will not be reclassified to profit or loss:
Actuarial gains/(losses) on future employee benefits 6.15 1,905 (6,553)
Fiscal effect 6.11 (260) 1,014
Total items that will not be reclassified to profit or loss (b) 1,645 (5,539)
Items that may be subsequently reclassified to profit or loss:
Hedging reserve 1,907 1,791
Fiscal effect 6.11 (488) (335)
Currency translation adjustment (71,383) (2,807)
Total items that may be subsequently reclassified to profit or loss (c) (69,964) (1,351)
Other comprehensive income for the year (b+c) (68,319) (6,890)
Total comprehensive income/(loss) for the year (a+b+c) 219,882 233,331
Total profit/(loss) for the year attributable to:
- Non-controlling interest 2.679 1.949
- Group equity holders 285.522 238.272
Total 288.201 240.221
Total comprehensive income/(loss) attributable to:
- Non-controlling interest 1,863 2
- Group equity holders 218,019 233,329
Total 219,882 233,331
Statement of comprehensive income
(euro thousands)

39
Share capital
Currency translation
reserve
Actuarial gains
(losses) reserve
Hedging reserve
Deferred taxes
reserve
Retained earnings Profit
Total Group equity
Non controlling
interests
Total equity
Balance at 31 December 2015 101,000 88,523 (39,197) (7,352) 12,847 758,815 170,383 1,085,019 15,802 1,100,821
Destination of the profit - - - - - 170,383 (170,383) - - -
Dividends and reserves distribution - - - - - (70,619) - (70,619) (2,500) (73,119)
Comprehensive income:
Profit - - - - - - 238,272 238,272 1,949 240,221
Other comprehensive income - (858) (6,553) 1,791 677 - - (4,943) (1,947) (6,890)
Total comprehensive income - (858) (6,553) 1,791 677 - 238,272 233,329 2 233,331
Balance at 31 December 2016 101,000 87,665 (45,750) (5,561) 13,524 858,579 238,272 1,247,729 13,304 1,261,033
Share capital
Currency translation
reserve
Actuarial gains
(losses) reserve
Hedging reserve
Deferred taxes
reserve
Retained earnings Profit
Total Group equity
Non controlling
interests
Total equity
Balance at 31 December 2016 101,000 87,665 (45,750) (5,561) 13,524 858,579 238,272 1,247,729 13,304 1,261,033
IFRS 9 adoption - - - 4,976 (1,659) (5,583) - (2,266) - (2,266)
Destination of the profit - - - - - 238,272 (238,272) - - -
Dividends and reserves distribution - - - - - (482,305) - (482,305) (3,892) (486,197)
Comprehensive income:
Profit - - - - - - 285,522 285,522 2,679 288,201
Other comprehensive income - (70,567) 1,905 1,907 (748) - - (67,503) (816) (68,319)
Total comprehensive income - (70,567) 1,905 1,907 (748) - 285,522 218,019 1,863 219,882
Balance at 31 December 2017 101,000 17,098 (43,845) 1,322 11,117 608,963 285,522 981,177 11,275 992,452
Statement of changes in equity
(euro thousands)

40
Statement of cash flow
Note 2017 2016
Profit/(loss) before income tax 364,295 371,679
Finance costs - net, excluding gains on disposals of equity investments 9,115 8,706
Amortization and depreciation 130,755 132,514
(Profit)/loss on disposal of property, plant and equipment, intangible assets 2,646 1,934
Change in fair value of equity investments 253 -
Change in trade receivables/payables 63,298 30,920
Change in inventories (23,876) 14,626
Change in provisions (including employee provisions) 10,774 8,741
Changes in other assets and liabilities 18,184 (17,197)
Income taxes paid (97,579) (118,075)
Foreign exchange gains/(losses), translation and other minor differences (57,124) (4,016)
Net cash generated from/(used in) operating activities (a) 420,741 429,832
Purchases of property, plant and equipment (208,373) (110,111)
Purchases of software (9,264) (7,407)
Proceeds from sale of property, plant and equipment, intangible assets 408 325
Purchases of other intangible assets (2,382) (1,429)
Proceeds from capital grants 1,081 703
Net cash generated from/(used in) investing activities (b) (218,530) (117,919)
Net change in borrowings 6.19 (4,608) (3,023)
Net change in borrowings due to parent companies 6.19 (2,559) (390)
Net change in derivatives on commodities 70 302
Dividends paid and reserve distribution (486,197) (73,119)
Interest paid (8,052) (7,907)
Net cash generated from/(used in) financing activities (c) (501,346) (84,137)
Net (decrease)/increase in cash and cash equivalents and bank overdrafts (a+b+c) (299,135) 227,776
Cash and cash equivalents net of bank overdrafts at beginning of the year 531,802 301,354
Cash and cash equivalents net of bank overdrafts at end of the year 245,922 531,802
Exchange differences on cash and bank overdrafts (13,255) (2,672)
Net (decrease)/increase in cash and cash equivalents (299,135) 227,776
Bank balances 246,893 535,533
Bank overdrafts (971) (3,731)
Total cash and cash equivalents net of bank overdrafts 245,922 531,802
(euro thousands)

41
A selection of outstanding ingredients, such as semolinas obtained from the choicest grains, is used to obtain the superior quality of the new BluRhapsody pasta concept: an innovation that embodies the highest expression of Italian-made pasta and three-dimensional forms in which artistic flair finds full expression.

42
Illustrative notes
1. Group structure and business
Barilla Iniziative S.p.A. (hereinafter “Barilla Iniziative”), with registered offices in Parma (Italy), is the parent company of the Barilla Iniziative Group (hereinafter “the Group”). The Group operates in the manufacture and sale of pasta, sauces and bakery products, both in Italy and worldwide.Barilla Holding Società per Azioni owns 85% of Barilla Iniziative with the remaining 15% of share capital owned by Gafina B.V.The controlling company Guido M. Barilla and F.lli S.r.L. & C. S.a.p.A. draws up the Consolidated financial statements of the Group which is presented together with the Statutory financial statements, filed to the Parma Companies Register (Italy), together with Directors’ and Auditors’ Reports.A list of the companies included in the scope of consolidation is provided in Appendix 1 and a list of investments in associated and other companies in Appendix 2.
2. Significant events after the year-end
In January 2018 the bank credit facility expiring in July 2019 has been amended in order to extend its maturity date until January 2023, with further extension options for additional two years. Furthermore, the size of the facility has been decreased from the initial euro 700 million to 500 million, but with the option to subsequently increase to euro 800 million. The entities Barilla Iniziative S.p.A. and Barilla G. e R. Fratelli Società per Azioni remain as borrowers and guarantors, while Barilla France S.A.S. is not an alternative borrower, save for the option to subsequently designate other borrowers within the Group. The parties to the bank pool have remained substantially unchanged.
3. Declaration of compliance with International Financial Reporting Standards (IFRS)
The Group’s Consolidated financial statements have been prepared in accordance with all the International Financial Reporting Standards (IFRS) issued by the International Accounting Standards Board (IASB) and endorsed by the European Union (EU). IFRS comprise
all of the International Financial Reporting Standards, International Accounting Standards (IAS) and the interpretations issued by the IFRS Interpretations Committee (IFRSIC), previously named the Standards Interpretations Committee (SIC).
4. Basis of preparation Accounting and valuation policies
In accordance with Regulation 1606 issued by the European Parliament and the European Council in July 2002, the Group’s Consolidated financial statements (hereinafter “the Financial Statements”) have been prepared in accordance with International Financial Reporting Standards (IAS/IFRS) in force as at 31 December 2017.IFRS have been adopted in Italy and in other countries. A significant number of IFRS have recently been published or revised for which no established practice relating to their interpretation and application exists. Consequently, the Financial Statements have been prepared based on the most recent information and technical guidance available in respect of IFRS. Any new or revised interpretation or practice will be reflected in future financial statements in accordance with the relevant accounting standards.The Financial Statements for the year ended 31 December 2017 have been compared with the prior year financial statements (amounts included in brackets in the Notes to the financial statements), and include the statement of financial position, consolidated income statement, statement of comprehensive income, statement of changes in equity, statement of cash flow and the illustrative notes to the consolidated financial statements. Where necessary, certain comparative data from prior year, as well as the relative disclosures, have been consistently reclassified. Amounts are presented in thousands of euro, the functional currency of the Group, being the euro the currency of the economy where the parent and the major companies of the Group operate.
The Group has chosen to present the income statement using the classification of expenses by function while the statement of financial position has been prepared with separate disclosure of current and non-current assets and liabilities.Cost of sales includes all production costs of goods sold, comprising
43
raw materials, components, internal and third party direct and indirect production labor costs, industrial depreciation and amortization and all other production expenses. The cash flow statement has been presented applying the indirect method.
The consolidation principles, translation of financial statements denominated in foreign currencies, accounting and valuation policies have been applied consistently with the accounts closed on 31 December 2016. The only exception is the early adoption of the IFRS 9 - ‘Financial Instruments’ accounting principle, for which comparative data have not been restated according to paragraph 7.2.26 of the same standard and the amendment provided for under IAS 1, paragraph 82.
Accounting standards, amendments and interpretations effective from 1 January 2017
The following accounting standards, interpretations and amendments approved by the European Commission will be applicable for financial years beginning 1 January 2017:
Amendments to IAS 12 – ‘Recognition of Deferred Tax Assets for Unrealised Losses’The amendment clarifies the accounting treatment of deferred tax assets related to the unrealized losses originating from the recognition of debt instruments at fair value, regardless to the fact that its possessor expects to recover the carrying amount holding the instrument until maturity or through its sale.
Amendments to IAS 7 – ‘Disclosure Initiative’The amendment introduces the new paragraph 44-a), according to which additional disclosures should be provided for the statement of cash flows in order to enable users of financial statements to evaluate the changes occurred, during the year, in the financial assets and liabilities comprising the financing activities including also the non-cash changes.
In particular, the following information is required:• changes in financing cash flows;• changes arising from obtaining or losing control of subsidiaries or
part of businesses;• the effect of changes in foreign exchange rates;• changes in fair values, typically from hedging financial activities
on borrowings;• any other change not specifically indicated.
As formerly mentioned, the Group opted for the early adoption of the accounting standard IFRS 9 ‘Financial Instrument’, ‘Classification and measurement, impairment and hedge accounting’.The new standard establishes that, at initial recognition, financial activities are recognized at fair value and classified as “Debt instruments” or “Equity instruments”. Based on the business model, financial activities are grouped into three categories: amortized cost, fair value through profit and loss and fair value through reserve of other comprehensive income – OCI.The standard introduces a new ‘three stages’ model for the impairment of receivables and other debt instruments based on their lifetime expected credit losses, for all possible default events.Concerning the hedge accounting, the new model introduces some amendments to the hedge effectiveness test rules and to the accounting treatment of the items. Among others, certain former requirements under the IAS 39 to assess the hedge effectiveness have been removed, such as the need to perform a retrospective testing and the 80%-125% rule. In any case, a retrospective test shall be performed at each balance sheet date, in order to measure the hedging relationship of the instruments according to the stated rules and any possible partial ineffectiveness.As far as the equity investments are concerned, the fair value exemption to measure unlisted investments has been eliminated.With the exception of hedge accounting, the retrospective application of the standard is required but it is not mandatory to provide comparative information. As far as the hedge accounting is concerned, the standard in general applies prospectively, with a few limited exceptions not applicable to the Group.The disclosures prompted from the IFRS 9 adoption is provided in the illustrative notes related to the individual items in scope.

44
Accounting standards, amendments and interpretations not yet effective and not early adopted by the Group
IFRS 15 – ‘Revenues from contracts with customers’ and related Clarifications (mandatory application for financial years beginning on 1 January 2018)The purpose of IFRS 15 is to establish the principles that an entity shall apply to report useful information to users of financial statements about the nature, amount, timing, and uncertainty of revenue and cash flows arising from a contract with a customer.The standard introduces a new accounting model that requires five steps: (i) identifying a contract with a customer; (ii) identifying the performance obligations entailed by the contract; (iii) determining the transaction price; (iv) allocating the transaction price to the performance obligations; (v) recognizing revenues when the entity satisfies a performance obligation.
IFRS 16 – ‘Leases’ (mandatory application for financial years beginning on I January 2019, or earlier adoption from 1 January 2018)The standard introduces a single accounting model for leases, or the lease component of a contract service, which removes the distinction currently existing between operating and finance lease from the perspective of a lessee. All the contracts in force, with the exception of short-term leases (duration lower than 12 months) or low-value assets (with respect to the price of a single item when new) should be recognized in the statement of financial position as a ‘right-of-use’ asset and respective lease liability. The asset will be classified among non-current tangible assets and depreciated in the income statement on a straight-line basis over its estimated useful life, whereas the measurement of the lease liability will vary according to the payment of capital quotas, with respective recognition of financial interest at income statement according to the internal rate of return (amortized cost method). The standard additionally provides specific application guidelines in the case of sub-leasing.
Annual Improvements to IFRS Standards 2014-2016 Cycle (mandatory application for financial years beginning on 1 January 2018)The improvements will impact on: (i) IFRS 1 eliminating the short-term exemptions for first-time adopters; (ii) IAS 28 regarding the accounting treatment of associates and joint ventures; (iii) IFRS 12, clarifying the extension of the principle also to investments in companies classified as held for sale.
The Group is still evaluating the impact of the application of the new aforementioned standards.
Amendments to IFRS 2 – ‘Classification and Measurement of Share-based Payment Transactions’ (mandatory application for financial years beginning on 1 January 2018)The amendments clarify the accounting treatment for certain share-based payments.
Amendments to IFRS 4 – ‘Applying IFRS 9 Financial Instruments with IFRS 4 Insurance Contracts’ (mandatory application for financial years beginning on 1 January 2018)The amendments establish two options for the entities who issue insurance contracts under IFRS 4: (i) the possibility to reclassify some costs and income related to designated financial activities in the statement of comprehensive income; and (ii) the option of temporary exemption from the application of IFRS 9 for the entities
whose predominant activity is the issuing of insurance contracts.
As of now, the Group is not subject to any impact arising from the application of the above-listed amendments.
Accounting standards, amendments and interpretations not yet approved by the European Union on 31 December 2017
The following accounting standard, amendments and interpretations were issued by the IASB but not yet approved by the EU: • IFRIC 22 - ‘Foreign Currency Transactions and Advance
Consideration’ (mandatory application for financial years beginning on 1 January 2018);
• IFRIC 23 - ‘Uncertainty over Income Tax Treatments’ (mandatory application for financial years beginning on 1 January 2019);
• Amendments to IAS 40 - ‘Transfers of Investment Property’ (mandatory application for financial years beginning on 1 January 2018);
• Amendments to IFRS 9 - ‘Prepayment Features with Negative Compensation’ (mandatory application for financial years beginning on 1 January 2019);
• Amendments to IAS 28 - ‘Long-term Interests in Associates and Joint Ventures’ (mandatory application for financial years beginning on 1 January 2019);
• Amendments to IAS 19 - ‘Plan Amendment, Curtailment or Settlement’ (mandatory application for financial years beginning on 1 January 2019);
• Annual Cycle of Improvements to IFRS Standards 2015-2017 (mandatory application for financial years beginning on 1 January 2019);
• IFRS 17 - ‘Insurance contracts’ (mandatory application for financial years beginning on 1 January 2021).
The Group is still evaluating the impact of application of the new above-listed standards.
Accounting and valuation policies
Basis of preparationThe Financial Statements are presented in euro and all amounts are stated in thousands of euro (unless otherwise stated).The Financial Statements have been prepared under the historical cost convention, as modified for impairment losses where applicable, with the exception of financial instruments measured at fair value and the effect of business aggregations, with recognition of assets and liabilities subject to aggregation at fair value. The accounting policies are uniformly adopted by all Group companies.The purchase or sale of financial assets are recognized or derecognized using settlement date accounting.
Estimates and assumptionsThe preparation of the Financial Statements requires the management to adopt estimates based on subjective assumptions derived from historical experience that are considered reasonable and realistic in relation to the specific circumstances. Such estimates affect the reported amounts of assets and liabilities, revenues and costs and the disclosures relating to contingent assets and liabilities at the balance sheet date.Estimates and assumptions principally relate to the evaluation of the recoverable amount of intangible assets, definition of the useful lives of property, plant and equipment, the recoverability of trade

45
and other receivables and the recognition and measurement of provisions for other liabilities and charges.Estimates and assumptions are based on the best knowledge available at the date of preparation of the financial statements.
Critical accounting policiesA summary of the accounting policies that require management to exercise more critical judgment in forming estimates, and for which a change in the underlying conditions of the assumptions used could have a significant impact on the Financial Statements, is set out below:
a. GoodwillThe value of goodwill is tested for impairment on an annual basis in order to identify any potential impairment losses (impairment test). This assessment requires goodwill to be allocated to cash generating units (CGU) and determination of the recoverable amount, representing the higher of fair value and value in use.Where the recoverable amount of the cash generating units is lower than the carrying amount, including allocated goodwill, an impairment loss is recognized. Allocation of goodwill to the CGUs and determination of their value in use require estimates to be made that are based on subjective assumptions and factors that may change over time with potentially significant effects on the valuations carried out by management.
b. DepreciationThe cost of property, plant and equipment is depreciated systematically over the estimated useful lives of the related assets. The useful life of Group assets is determined by management at the acquisition date; this is based on historical experience for similar assets, market conditions and information regarding future events that could affect the useful life, for example changes in technology. As a result, the effective economic life of an asset may differ from the estimated useful life. The Group reviews changes in technology and business factors on a regular basis in order to update the residual useful lives. This update may result in a change in the depreciation period and an adjustment to the depreciation charge for future periods.
c. Impairment of fixed assetsThe carrying amount of fixed assets is tested for impairment to identify any impairment losses, when there is any indication that the carrying value cannot be recovered through future use or sale. The identification of any such impairment indicators requires management to carry out subjective valuations based on both internally and externally available information, and subjective assumptions based on historical experience. Moreover, where there is an indication of a potential impairment, this should be determined applying suitable valuation techniques. The proper identification of impairment indicators and the estimates used to determine the recoverable amounts depend on subjective assumptions and factors which may vary over time, affecting management valuations and estimates.
d. Deferred income tax assetsAccounting for deferred income tax assets is based on expectations relating to the generation of future taxable income, and the evaluation of technical and institutional factors relating to the fiscal regime to which the taxes relate (for example: time limits for the recovery of tax losses). The estimate of future taxable income for the purpose of recording deferred tax assets depends on factors and
assumptions that may vary over time and could have a significant impact on the valuation of deferred tax assets.
e. Provisions for other liabilities and chargesProvisions are made to cover the potential liability relating to legal and tax risks. The measurement of the provisions recognized in the financial statements in relation to these risks, represents management’s best estimate at the balance sheet date. This estimate requires assumptions to be made that depend on factors that may change over time and could therefore have a significant effect on the current estimates made by management in the preparation of the financial statements.
f. Determination of the fair value of financial instrumentsThe fair value of financial instruments is based on market quotations or, where unavailable, applying suitable valuation techniques with up-to-date financial variables used by market investors and, where possible, taking into account the prices of recent transactions on similar financial instruments.The fair value hierarchy introduces three levels of input:• Level 1: quoted prices in active markets for identical assets or
liabilities;• Level 2: prices calculated using observable market inputs;• Level 3: prices calculated using inputs that are not based on
observable market data.
The fair value of financial instruments of level 2 is determined by using standard valuation techniques. Barilla has developed a model based on market practices, which are commonly based on similar financial instruments indicators, cash flow analysis and pricing models based on observable market data. In the determination of the valuation, the Group maximizes the use of market data compared to internal specific estimates.
Principles of consolidation
The Financial Statements comprise the financial statements of the parent company Barilla Iniziative and the subsidiaries in which Barilla Iniziative holds, either directly or indirectly, a controlling interest. Subsidiaries represent those companies over which Barilla Iniziative exercises control as it has the power, either directly or indirectly, over the investee or it is exposed to variable returns from its involvement with the subsidiary, or it has the rights to variable returns based on the ability to affect those returns through its power over the investee.The financial statements of the subsidiaries are consolidated on a line-by-line basis from the date on which the parent gains effective control up to the date on which such control ceases. The impact of all transactions between the subsidiaries and the Group is eliminated. The reporting date of all Group companies is 31 December.
Non-controlling interestsNon-controlling interests are measured at their proportionate share of the net assets from the date of the acquisition.
Foreign currency transactionsAll transactions are measured using the currency of the primary economic environment in which each Group company operates (the functional currency). Transactions denominated in currencies different from the functional currency of the Group companies are translated at the exchange rate prevailing on the transaction date. Monetary assets and liabilities are translated using year-end exchange rates and exchange differences are recognized in the
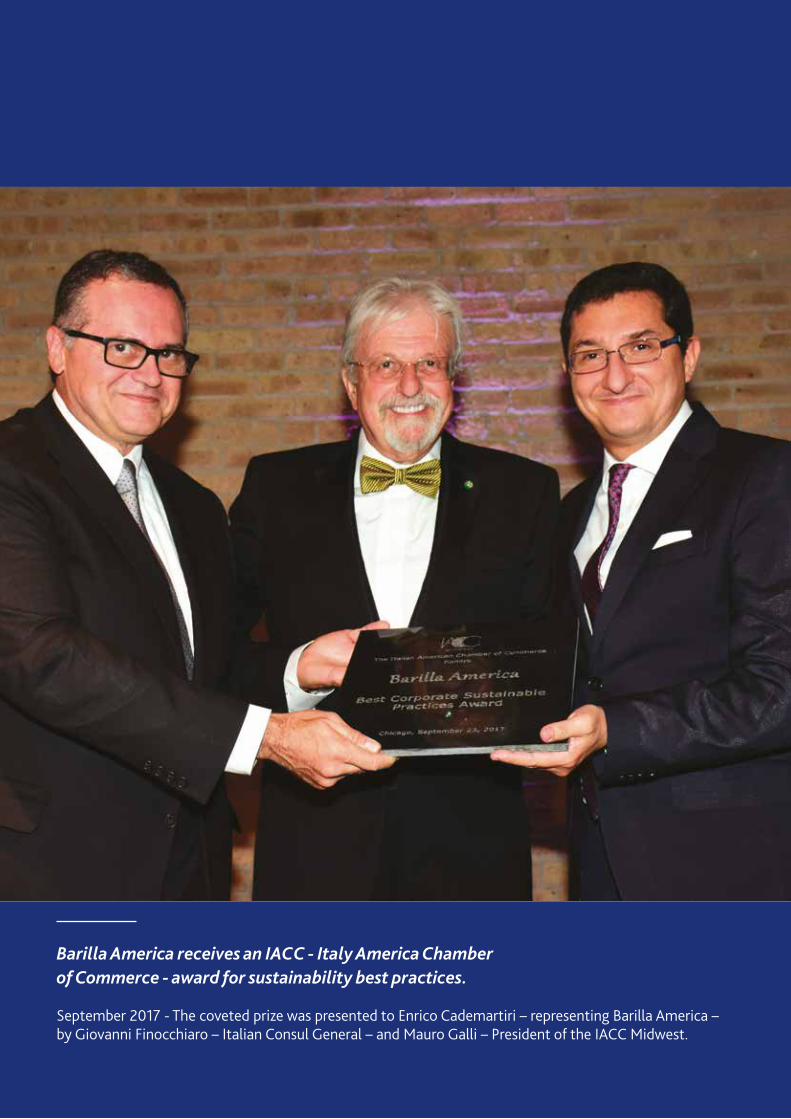
46
Barilla America receives an IACC - Italy America Chamber of Commerce - award for sustainability best practices. September 2017 - The coveted prize was presented to Enrico Cademartiri – representing Barilla America – by Giovanni Finocchiaro – Italian Consul General – and Mauro Galli – President of the IACC Midwest.

47
“ONLY ONE WAY OF DOING BUSINESS:GOOD FOR YOU, GOOD FOR THE PLANET„
Guido Barilla

48
consolidated income statement as financial items. Non-monetary assets and liabilities, which are measured at historical cost and denominated in foreign currency, are converted at the exchange rate prevailing on the transaction date.
Translation of financial statements denominated in foreign currenciesThe financial statements of subsidiaries denominated in non-euro functional currencies, are translated as follows:• assets and liabilities are translated at the year-end rate;• revenue and expenses are translated at average exchange rates for
the period;• all resulting translation differences are reported in the statement
of comprehensive income.
On disposal of those entities that gave rise to exchange differences, the cumulative amount of exchange differences deferred in a separate component of the statement of comprehensive income are recognized in the income statement.The exchange rates used are presented in the Appendix 3.
Intangible assetsIntangible assets with a finite useful life are valued at cost, net of amortization and impairment losses, while those with an indefinite useful life, comprising exclusively goodwill, are reviewed annually for impairment. Cost does not include capitalized borrowing costs. Amortization commences when the asset is available for use.
GoodwillThe positive difference between the purchase price and the Group’s share of the fair value of assets, liabilities and contingent liabilities acquired as part of a business combination, is recorded as goodwill and is classified as an intangible asset with an indefinite useful life. Goodwill is not amortized but is subjected to an annual impairment test. For the purpose of this assessment, goodwill is allocated to groups of cash generating units (CGU) that generally represent an operating segment (Business Unit). Goodwill impairment losses may not be reversed under no circumstances.
Trademarks and licenses Trademarks and licenses are valued at cost less amortization and accumulated impairment losses. Trademarks are amortized over their useful lives while licenses are amortized over the lower of the contract duration and their useful lives.
SoftwareThe cost of software licenses, including other incremental costs, is capitalized and recorded in the financial statements net of amortization and accumulated impairment losses.
Research and development costsThe research costs relating to new products and/or processes are entirely expensed when incurred. Given the nature of the Group’s business, no development costs, qualified for capitalization, are incurred.The useful lives of intangible assets are as follows:
Property, plant and equipmentProperty, plant and equipment are stated at acquisition or production cost, potentially revalued according to designated monetary revaluation laws, including directly attributable expenses, less accumulated depreciation and accumulated impairment losses, with the exception of land, which is not depreciated but valued at cost less accumulated impairment losses. Based on the type of investment activities, cost does not generally include capitalized borrowing costs.Depreciation is recorded from the month in which the asset is available for use, or when it is potentially able to provide economic benefits.Depreciation is calculated systematically on a monthly basis applying depreciation rates that allocate the depreciable amount of the asset over its useful life or, where the asset is disposed of, up until the last entire month of use.The useful lives, which have been reviewed during the year 2017 for the newly capitalized assets as a result of the new technology and production processes, are set out as follows:
Government grants relating to property, plant and equipment are recorded as a reduction in the value of the related asset and are recognized as income over the depreciation period.Leasehold improvements are classified in property, plant and equipment in line with the nature of the cost incurred.The depreciation period is the lower between the residual useful life of the asset and the residual period of the lease contract.Spare parts that are significant in value are capitalized and depreciated over the useful life of the asset to which they relate; the cost of other spare parts is expensed in the income statement as incurred.
LeasingProperty, plant and equipment acquired under finance leases, whereby all of the risks and rewards relating to the assets are transferred to the Group, are recognized at current value or, where lower, the present value of the minimum lease payment obligations, including any amounts to be paid upon redemption. The corresponding liability due to the lessor is classified in financial payables. The assets are depreciated applying the rates presented above in respect of “Property, plant and equipment”, except where the lease term is lower than the estimated useful life and it is not reasonably certain that ownership of the leased asset will be transferred on contract maturity; in this case the depreciation period corresponds to the lease term.Lease contracts in which the lessor substantially maintains the risks and rewards arising from ownership of the assets are classified as
CategoryUseful life until
31 December 2016
Useful life from 1 January
2017
Buildings 33 years 15 - 50 years
Plant and machinery:- generic- specific - highly-technological
13 years10 - 20 years
5 - 8 years
10 - 30 years5 - 30 years
10 years
Industrial and commercial equipment:
- furniture and fittings- electronic machinery
8 years3.5 years
8,33 years2 - 3.5 years
Motor vehicles 5 years 5 years
Other equipment 2.5 years 2.5 years
Category Useful life
Trademarks 5 to 20 years
Software 3 to 5 years
49
operating leases. The costs incurred in respect of operating leases are charged to the income statement on a systematic basis over the term of the lease contract.
Impairment of property, plant and equipment and intangible assetsIn the presence of specific indicators of a loss in value, an impairment test should be carried out on property, plant and equipment and intangible assets.The impairment test consists in the measurement of the recoverable value of the assets and comparison with the related carrying amount.If the recoverable amount of an asset is lower than its carrying amount, the latter should be reduced to the recoverable amount. This reduction represents an impairment loss and should be recognized as an expense in the consolidated income statement. In respect to assets that are not amortized, property, plant and equipment that are no longer used and intangible assets and property, plant and equipment not yet available for use, the impairment test is carried out on an annual basis, irrespective of whether specific indicators exist. During the year, the Group assesses whether there is any indication that property, plant and equipment and intangible assets with finite useful lives may be impaired. For this purpose both internal and external sources of information are taken into consideration.With regard to internal sources, the following indicators are considered: obsolescence or physical deterioration of the asset, significant adverse changes in the extent to which an asset is used and deterioration in the expected level of the asset’s performance.With regard to external sources, these include: trend of the market price of the asset, significant adverse changes in the technological, market, and legal environment, the trend in market rates of return and the discount rate used in valuing investments.The recoverable value of an asset is defined as the higher of the fair value net of selling costs and value in use. The value in use is determined as the present value of expected future cash flows calculated applying a discount rate that reflects the current market valuation of the time value of money and the risks inherent in the asset. Where it is not possible to estimate the recoverable value of a single asset, the Group estimates the recoverable value of the cash generating unit to which it belongs. Where the conditions that led to the reduction in value no longer exist, the carrying value of the asset or the cash generating unit is restated to the new estimated recoverable value, which may not exceed the carrying value that would have been recognized if the original impairment had not been incurred. This restatement is recorded in the consolidated income statement. Purchased goodwill that is allocated to units or groups of cash generating units (CGU) during the year is subjected to an impairment test prior to the end of the financial period in which the purchase and allocation took place.In order to assess its recoverability, the goodwill is allocated at the purchase date to each of the CGUs (or groups of CGUs) that are expected to benefit from the acquisition.Where the carrying value of the CGU (or groups of CGUs) is higher than the respective recoverable amount, an impairment loss is recognized as an expense in the consolidated income statement. Under no circumstances the value of goodwill which was formerly impaired may be restored.The impairment loss is initially recorded as a reduction in the carrying amount of the goodwill allocated to the CGU (or group of CGUs) and secondly to other assets in the CGU on a pro-rata basis considering the relative carrying amount of each asset in the CGU up to the recoverable amount of individual assets with a finite useful life. The future cash flows derive from the business plans approved by
Group management, which normally cover a period not exceeding five years. The long-term growth rate used for the purpose of estimating the terminal value of the CGU (or group of CGUs) does not generally exceed the average long-term growth rate for the industry, the country or the market in which the CGU (or group of CGUs) operates.The future cash flows are estimated with reference to current conditions of the CGUs and do not consider benefits that may arise from future restructuring to which the company is not yet committed, or future investments intended to improve or enhance the performance of the CGU.The Group has identified the cash generating units at production line level.For the purpose of the impairment test, goodwill is allocated to groups of CGUs, which generally represent the operating segments. The Group operating segments correspond to the following Business Units: Region Italy, Region Europe, Region America, Region AAA (Asia, Africa & Australia), for the Categories Meal Solutions and Bakery.
Amortized cost method of measuring financial assets and liabilitiesThe amortized cost method requires calculation of the effective interest rate at the time the transaction is entered into. The effective interest rate is the rate that exactly discounts the future cash flows to the net carrying amount at initial recognition.Any changes in future cash flows, if not attributable to changes in market conditions, result in the restatement of the carrying value of the financial assets and liabilities with a corresponding entry to the income statement.
Financial assetsOn initial recognition, financial assets are measured at fair value and divided based on their type:• Debt instruments;• Equity instruments.
The purchase and sale of financial assets are recognized when the entity becomes party to the contractual provisions of the instrument. They are derecognized when the contractual rights to the financial asset have expired or the Group has substantially transferred all of the risks and rewards relating to the asset.
Debt instruments are measured as follows:
(a) Amortized costsDebt instruments measured at amortized costs are simple financial instruments that involve exclusively the payment of principal and interest and are owned with the aim to collect contractual cash flows (“Held to collect”).These financial assets are recognized initially at fair value, adding the transactions costs, and are subsequently accounted for at amortized cost using the effective interest rate, net of impairment losses.The interests, foreign exchange differences, impairment losses, gains/(losses) for cash flow forecast reviews and for derecognition are recorded in the consolidated income statement.The instruments are classified as current assets, with the exception of those having contractual maturity after twelve months from the reporting date, which are classified as non-current assets.Trade receivables due within one year are recognized at fair value, which normally coincides with the nominal value.The receivables that have been securitized or transferred to factor, with or without recourse, which do not fulfill all the required

50
conditions for derecognition of financial assets, are maintained among the assets in the statement of financial position; a financial liability with equivalent amount is recorded in the financial statements as “Payables due to banks”.The receivables that have been transferred, which fulfill all the required conditions for derecognition of financial assets, are derecognized at the time of the transfer. The gains or losses related to the transfer of these assets are recognized into the consolidated income statement when the same assets are removed from the statement of financial position, being the only aim of the transfer to collect cash flows.
(b) Fair Value through Other Comprehensive Income - OCIThe financial assets valued at Fair value through Other Comprehensive Income are represented by simple instruments that involve exclusively the payment of principal and interest held with the aim to collect contractual cash flows and potential/possible sales.The gains and losses originating from the changes in fair value are recognized in the other comprehensive income (OCI) in the period that they are incurred. The possible reclassification to the consolidated income statement at the line “Profit/loss for change in fair value of financial assets” is made only when the financial asset is effectively transferred.The interests, foreign exchange differences and the impairment losses are instead recorded in the consolidated income statement.
(c) Fair Value Through Profit and LossThe assets valued at Fair value through Profit and Loss are complex instruments that are held for other purposes than the collection of contractual cash flows.The changes in fair value, foreign exchange differences and the gains/(losses) for derecognition are recognized in the consolidated income statement.
At each reporting date the Group evaluates the expected losses related to the debt instruments measured at amortized cost, mainly represented by trade receivables and financial assets at Fair value through Other Comprehensive Income.According to the general principle, all financial assets at initial recognition are subject to impairment using the “12-month expected credit loss” methodology, that is assessing the expected loss over the whole lifetime of the asset for all default events that may occur within the next twelve months after the reporting date (Stage I financial assets).In case a significant increase in credit risk occurs subsequently to the initial recognition (Stage 2 financial assets) and when there is objective evidence of impairment (Stage 3 financial assets), the loss allowance should be measured according to the “lifetime expected credit losses” methodology, that is assessing the expected loss for all default events that may occur over the whole lifetime of the instrument.For the financial receivables without a significant financial component, a simplified approach is applied that allows to calculate the expected losses always based on the “lifetime expected credit losses” method.Expected credit losses are calculated based on the probability of default, on the expected exposure at the time of default (EAD - Exposure at default) evaluated from the future cash flows and the estimated loss in case of default (LGD - Loss given default).The loss allowance is accounted for as an adjustment of the carrying value of the instrument, except in the case of financial assets at Fair Value through Other Comprehensive Income where it is recorded in
the other comprehensive income (OCI).
Equity instruments are valued at Fair Value Through Profit and Loss in case the entity does not opt for the irrevocable option at Fair Value through Other Comprehensive Income at initial recognition.If the aforesaid option is adopted for some investments, the initial carrying amount of the instrument will amount to the sum of fair value and transaction costs, if any. The subsequent changes in fair value, the foreign exchange differences, the impairment losses and the gains/(losses) for derecognition are recorded in the other comprehensive income applying the accrual basis.So far, the Group has not exercised the option for any equity instrument.If the option is not exercised, the changes in fair value, the gains and the losses for derecognition are recognized in the relative items of the consolidated income statement.In any case, dividends coming from the equity participations are shown as dividend income in the consolidated income statement under the heading “Dividends” when the Group has acquired the right to receive this payment.
Financial liabilitiesThe financial liabilities that are not held for trading are initially recorded at fair value net of transaction costs, and subsequently to the initial recognition are measured at amortized cost applying the effective interest rate. The difference between amortized cost and the amount to be repaid is recognized in the income statement over the term of the liability.Upon initial recognition, the fair value option can instead be exercised (Fair Value Through Profit and Loss) only to avoid an “accounting mismatch” between the asset and its respective liability or when the liability is based on fair value or in case the liability includes an embedded derivative to separate.
Financial liabilities are classified as current liabilities unless the Group has, at the reporting date, an unconditional right to extend the term of the financing at least over twelve months from the end of the period.Trade payables and other payables whose maturity fall within the normal commercial terms are recognized at fair value which normally coincides with the nominal value.In case of financial liabilities hedged by fair value hedge derivative instruments, their carrying value is determined based on the fair value of the corresponding hypothetical derivative, which represents a hypothetical derivative contract calibrated at a null value at the time of designation of the hedging relationship.
InventoriesInventories are stated at the lower of cost, measured applying the FIFO (first in - first out) method, and net realizable value. To account for obsolete or slow-moving inventory, provisions are recognized, that are reversed if the circumstances of the abovementioned provisions are no longer applicable.Starting from 2017, the repackaging materials are managed as inventory and valued at weighted average cost, while formerly they were expensed in the consolidated income statement.
Cash and cash equivalentsCash and cash equivalents include cash on hand, bank and postal deposits and short-term highly liquid investments that are readily convertible into cash (three months from the date of acquisition) and not subject to significant fluctuations in value.

51
Employee benefits(a) Pension fundsGroup companies operate both defined contribution and defined benefit plans. A defined contribution plan is a plan where the Group pays fixed contributions to a separate entity (a fund) and will have no legal or constructive obligation to pay further contributions if the fund does not hold sufficient assets to pay all employee benefits relating to employee services in the current and prior periods. With regard to defined contribution plans, the Group pays contributions, either voluntary or specified in the plan rules, to public and private insurance pension funds. Contributions are recognized as payroll costs applying the accrual basis.The defined benefit obligation recorded in the financial statements corresponds to the present value of the obligation at the balance sheet date, less, where applicable, the fair value of any plan assets. The defined benefit obligations are determined on an annual basis by an independent actuary using the Projected Unit Credit Actuarial Method. The present value of the defined benefit plan is determined discounting future cash flows by a rate equal to that of high-quality corporate bonds of equivalent currency and term to the benefit obligations. Remeasurements of actuarial gains and losses arising on the above adjustments and changes in the actuarial assumptions are reflected in the statement of comprehensive income. Service costs and net interest related to the time value in the actuarial calculation (classified within “Finance income and costs”) are recognized in the consolidated income statement.
(b) Termination benefits Termination benefits are those payable on termination of an employment before the normal retirement date, or when an employee accepts voluntary redundancy. The Group recognizes termination benefits when a demonstrable commitment exists and is governed by a detailed formal plan specifying details of the employment termination, or when payment of the benefit is the result of an offer made to encourage voluntary redundancy.
Provisions for other liabilities and chargesProvisions are recorded to cover the Group’s legal, contractual or constructive obligations that derive from a past event. A provision is recognized where it is probable that an outflow of resources will be required and a reliable estimate of the amount can be made. Where it is estimated that these obligations will arise more than twelve months after the balance sheet date and that they will have a material impact on the financial statements, they are recorded at present value applying a discount rate that reflects current market assessments of the time value of money and the risks specific to the liability. Any adjustment to the estimated provision is recognized in the consolidated income statement in the period in which the adjustment occurred. Where discounting is used, any increase in the provision to reflect the passage of time and the impact of changes in the discount rate are recognized as borrowing costs.Restructuring provisions are recognized when there is a constructive obligation, which takes place when the Group has a detailed formal plan and has informed those affected by the plan or when the Group has announced the plan in sufficient detail to raise valid expectation in those affected by the plan that the restructuring will be carried out. Provisions for tax risks are recognized in view of probable tax liabilities for assessments notified to the Group not yet settled at the reporting date.
Derivative financial instrumentsAccounting for derivative financial instrumentsDerivative financial instruments are measured at fair value, with any difference charged to the consolidated income statement, with the exception of cash flow hedges, where gains or losses are recognized in the statement of comprehensive income.
Derivatives that qualify for hedge accountingIn all cases where derivatives are designated as hedging instruments, the Group formally documents, from inception of the hedge, the relationship between the hedging instrument and the related hedged item or transaction, the risk management objectives and the hedging strategy adopted.The Group also documents the valuation methodology and the hedging instrument’s effectiveness to compensate changes attributable to the hedged risk based on changes in the fair value of the hedging instrument compared to changes in the fair value of the hedged item. This assessment is carried out at inception and on a continuous basis throughout the life of the hedge. At the same time, the potential causes of hedging ineffectiveness are reported.
Categories of derivativesHedging instruments are categorized as follows:
I) Derivatives designated as cash flow hedge: if the hedging instrument is designated to cover the exposure to fluctuation in cash flows attributable to a particular risk associated with a recognized asset or liability, or a highly foreseeable transaction, the gains or losses on the effective portion of the hedging instrument are recognized in the statement of comprehensive income; the ineffective portion of the gain or loss on the hedging instrument is recognized in the consolidated income statement. Depending on the nature of the hedge, financial or commodity related, the ineffective portion is classified in either finance income/costs on financial transactions or operating income/costs, respectively.The amounts directly recognized in the statement of comprehensive income are reclassified into the consolidated income statement in the period in which the hedged item affects profit or loss.When a hedging instrument reaches maturity, or it is sold, or it no longer meets the conditions required to be classified as a hedge, the related fair value adjustments accumulated to date will be retained until the hedged item affects profit or loss, and only at that time will it be recognized in the consolidated income statement applying the accounting treatment relevant to the hedged item. If the forecast transaction that was subject to the hedge is no longer expected to affect the consolidated income statement, the accumulated fair value adjustments are immediately recognized in the consolidated income statement.For the valuation of the financial liabilities hedged by cash flow hedges, please refer to the specific paragraph.
II) Derivatives designated as fair value hedge are classified based on the hedged item. The accounting treatment of changes in fair value is the following:
a) when the hedge item relates to commodities, the variation is classified as operating income/costs;b) when the hedged item is purely financial, the variation is classified as follows: - the difference between the valuation, at reporting date, of
the mark-to-market actual derivative, which includes the

52
Accursio Lotà, Italian chef of “Solare” restaurant in San Diego (USA), wins the sixth edition of the Barilla Pasta World Championship. September 2017 - Left to right: Paolo Barilla (Barilla Vice Chairman) and finalists Keita Yuge, Accursio Lotà and Omri Cohe.

53
54
interest rate basis spread component (hereafter ‘basis’), and the mark-to-market actual derivative without basis is recognized in the statement of comprehensive income;
- the basis component of the derivative, as calculated at the inception date, is spread over the consolidated income statement on a straight-line basis over the life of the instrument;
- the foreign exchange differences and the interest component, excluding the basis effect described above, are recognized in the consolidated income statement at the line “finance income and costs”; refer to the dedicated paragraph for further details about the valuation of the hedged item.
At the time the financial instrument is transferred, the residual portion of the basis recorded in the other comprehensive income (OCI) is reclassified into the consolidated income statement.
III) Derivative financial instruments at fair value through profit or loss that are not designated as hedges are classified as current or non-current assets or liabilities based on their contractual maturity.The gain or loss arising from changes in the fair value of these instruments is recognized in the consolidated income statement. Depending on the nature of the underlying instrument, financial or commodity related, the variation of fair value is classified in either finance income/costs on financial transactions or operating income/costs, respectively.
Determination of the fair value of a hedging instrument The fair value of an interest rate swap is determined based on the present value of the expected future cash flows, also considering the market interest rates and the creditworthiness of counterparties. The fair value of forward foreign exchange contracts is determined using the forward exchange market rates at the balance sheet date. The fair value of other hedging instruments listed on an active market is based on the market prices prevailing at the balance sheet date. The fair value of unlisted instruments is determined using valuation techniques based on commonly adopted methods and assumptions and market information at the balance sheet date.
Non-current assets and liabilities held for sale and discontinued operations A non-current asset, or group of non-current assets and liabilities, is classified as held for sale when the carrying amount is to be recovered primarily from a sale transaction rather than through continuing use. The assets (or groups of assets) held for sale are measured at the lower of their carrying amount and their fair value less estimated selling costs. The results and the carrying amount of a component of an entity that represents a separate major line of business or geographical area of operations are classified separately in the income statement and in the balance sheet when they meet the conditions to be classified as held for sale or discontinued operations.
Total equity Costs directly attributable to share capital transactions are recorded as a deduction from total equity.
Revenue recognitionRevenue is recognized at the fair value of the amount received for the sale of products or services, net of returns or discounts, according to the accrual principle.
Sale of productsRevenue from product sales is recognized when all of the following conditions are met, which normally take place on delivery to the customer:• the significant risks and rewards arising from ownership of the
goods are transferred to the buyer; • effective control over the goods is transferred;• the amount of revenue can be reliably measured;• it is probable that the economic benefits associated with the
transaction will flow to the entity;• the costs incurred or to be incurred in respect of the transaction
can be reliably measured.
DividendsDividends are recognized when the legal right to receive payment is established.
Government grantsRevenue based government grants are recognized in the income statement when the right to receive the payment is established.
Finance income and costsFinance income and costs are recorded on an accrual basis and comprise: interest payable accrued on all the borrowings, interest income on cash and cash equivalents and similar securities, dividends, foreign exchange gains and losses and the financial impact arising from hedging transactions over the exposure to interest rate and foreign exchange risk that are booked in the consolidated income statement.
TaxationTaxation includes both current and deferred income taxes. Current income taxes are based on the estimated amount that the Group expects to pay calculated by applying to the taxable income the enacted tax rates, or those substantially enacted, in each of the relevant tax jurisdictions.Deferred income tax assets and liabilities are determined applying the liability method, whereby all of the temporary differences between the tax bases of assets and liabilities and the carrying amounts at the balance sheet date, except for goodwill, are calculated. Deferred income tax assets and liabilities are measured using the tax rates that are expected to apply in the period when the asset will be realized or the liability settled. Income taxes arising upon distribution of dividends are recognized at the time of distribution.For the purpose of recognizing deferred tax assets, the Group assesses the likelihood that sufficient future taxable income will be available to recover these assets. Tax assets and liabilities, both current and deferred, may only be offset where the amounts relate to the same tax authority, when the reversal period is the same and there is a legally enforceable right to offset the recognized amounts.
Distribution of dividendsDividends payable to shareholders are recognized when the legal obligation of payment is established.
Transactions with non-controlling interests The acquisition and disposal of non-controlling interests in companies whose control is already effective are classified as transactions with Group shareholders. Any differences between the carrying value and the purchase price paid or received are recorded in equity.
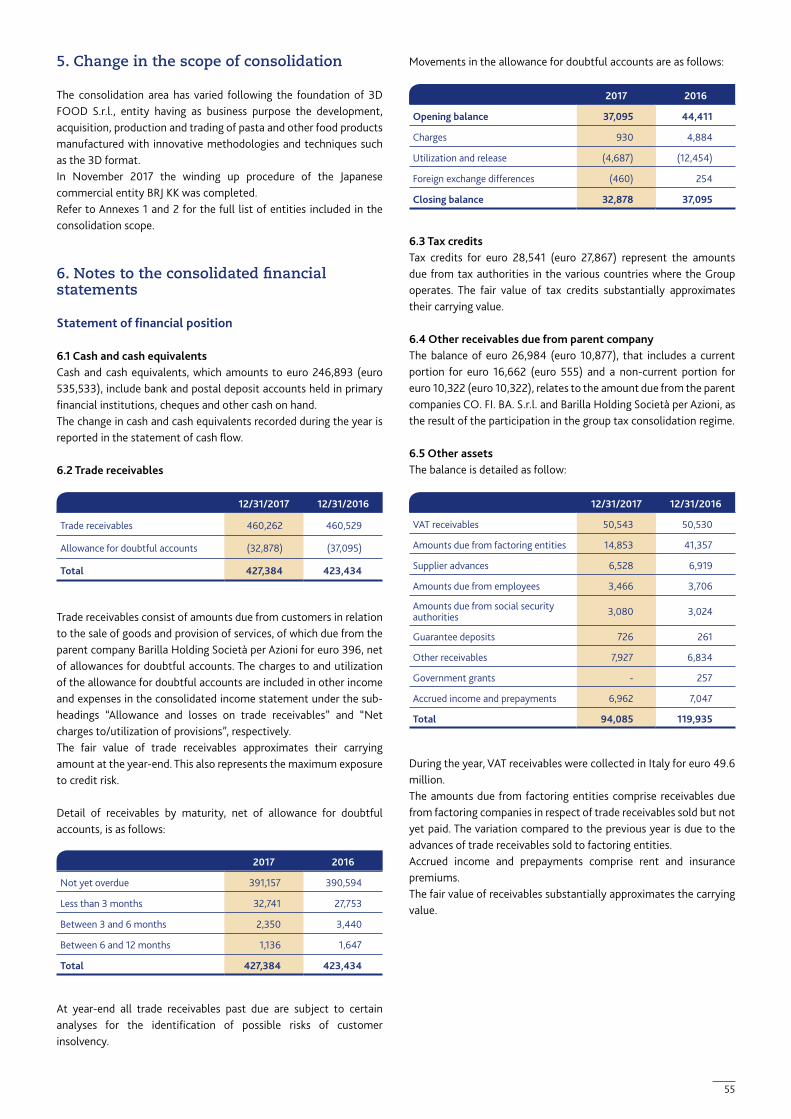
55
5. Change in the scope of consolidation
The consolidation area has varied following the foundation of 3D FOOD S.r.l., entity having as business purpose the development, acquisition, production and trading of pasta and other food products manufactured with innovative methodologies and techniques such as the 3D format.In November 2017 the winding up procedure of the Japanese commercial entity BRJ KK was completed.Refer to Annexes 1 and 2 for the full list of entities included in the consolidation scope.
6. Notes to the consolidated financial statements
Statement of financial position
6.1 Cash and cash equivalentsCash and cash equivalents, which amounts to euro 246,893 (euro 535,533), include bank and postal deposit accounts held in primary financial institutions, cheques and other cash on hand.The change in cash and cash equivalents recorded during the year is reported in the statement of cash flow.
6.2 Trade receivables
Trade receivables consist of amounts due from customers in relation to the sale of goods and provision of services, of which due from the parent company Barilla Holding Società per Azioni for euro 396, net of allowances for doubtful accounts. The charges to and utilization of the allowance for doubtful accounts are included in other income and expenses in the consolidated income statement under the sub-headings “Allowance and losses on trade receivables” and “Net charges to/utilization of provisions”, respectively. The fair value of trade receivables approximates their carrying amount at the year-end. This also represents the maximum exposure to credit risk.
Detail of receivables by maturity, net of allowance for doubtful accounts, is as follows:
At year-end all trade receivables past due are subject to certain analyses for the identification of possible risks of customer insolvency.
Movements in the allowance for doubtful accounts are as follows:
6.3 Tax creditsTax credits for euro 28,541 (euro 27,867) represent the amounts due from tax authorities in the various countries where the Group operates. The fair value of tax credits substantially approximates their carrying value.
6.4 Other receivables due from parent companyThe balance of euro 26,984 (euro 10,877), that includes a current portion for euro 16,662 (euro 555) and a non-current portion for euro 10,322 (euro 10,322), relates to the amount due from the parent companies CO. FI. BA. S.r.l. and Barilla Holding Società per Azioni, as the result of the participation in the group tax consolidation regime.
6.5 Other assets The balance is detailed as follow:
During the year, VAT receivables were collected in Italy for euro 49.6 million.The amounts due from factoring entities comprise receivables due from factoring companies in respect of trade receivables sold but not yet paid. The variation compared to the previous year is due to the advances of trade receivables sold to factoring entities.Accrued income and prepayments comprise rent and insurance premiums.The fair value of receivables substantially approximates the carrying value.
2017 2016
Not yet overdue 391,157 390,594
Less than 3 months 32,741 27,753
Between 3 and 6 months 2,350 3,440
Between 6 and 12 months 1,136 1,647
Total 427,384 423,434
2017 2016
Opening balance 37,095 44,411
Charges 930 4,884
Utilization and release (4,687) (12,454)
Foreign exchange differences (460) 254
Closing balance 32,878 37,095
12/31/2017 12/31/2016
VAT receivables 50,543 50,530
Amounts due from factoring entities 14,853 41,357
Supplier advances 6,528 6,919
Amounts due from employees 3,466 3,706
Amounts due from social security authorities 3,080 3,024
Guarantee deposits 726 261
Other receivables 7,927 6,834
Government grants - 257
Accrued income and prepayments 6,962 7,047
Total 94,085 119,935
12/31/2017 12/31/2016
Trade receivables 460,262 460,529
Allowance for doubtful accounts (32,878) (37,095)
Total 427,384 423,434

56
6.6 InventoriesInventories are detailed as follows:
Movements in the inventory obsolescence provision are detailed as follows:
The book value is in line with the current market values.
6.7 Property, plant and equipmentMovements in property, plant and equipment are as follows:
Land Buildings Plant and machinery
Industrial and commercial
equipment
Other assets
Assets under construction Total
Movements in 2016
Net book amounts at 1/1/2016 30,820 312,786 533,318 22,068 8,340 28,999 936,331
Capital expenditure - - - - - 110,111 110,111
Capitalizations 194 14,292 72,774 3,796 4,002 (95,058) -
Grants received - (375) (328) - - - (703)
Disposals - Cost (77) (1,010) (46,631) (3,263) (3,588) - (54,569)
Disposals - Utilization of accumulated depreciation - 730 44,776 3,220 3,584 - 52,310
Depreciation and impairment losses - (21,876) (82,609) (7,962) (3,128) - (115,575)
Foreign exchange differences 176 2,221 1,749 561 (141) 204 4,770
Net book amounts at 12/31/2016 31,113 306,768 523,049 18,420 9,069 44,256 932,675
Of which:
Historical cost 31,113 648,368 2,330,001 110,057 63,929 44,256 3,227,724
Depreciation and accumulated impairment losses (341,600) (1,806,952) (91,637) (54,860) (2,295,049)
Movements in 2017
Capital expenditure - - - - - 208,373 208,373
Capitalizations 1,332 15,497 114,650 6,931 4,027 (142,437) -
Grants received - (934) (147) - - - (1,081)
Disposals - Cost - (598) (42,453) (2,489) (5,332) - (50,872)
Disposals - Utilization of accumulated depreciation - 501 39,757 2,266 5,332 - 47,856
Depreciation and impairment losses - (18,995) (83,838) (6,908) (3,224) - (112,965)
Foreign exchange differences (1,091) (3,324) (11,979) (4,579) (667) (1,201) (22,841)
Net book amounts at 12/31/2017 31,354 298,915 539,039 13,641 9,205 108,991 1,001,145
Of which:
Historical cost 31,354 652,433 2,367,249 107,764 60,470 108,991 3,328,261
Depreciation and accumulated impairment losses (353,518) (1,828,210) (94,123) (51,265) (2,327,116)
12/31/2017 12/31/2016
Raw materials and semi-finished goods 123,733 108,217
Finished goods 154,296 149,103
Advances 4,688 1,521
Total 282,717 258,841
2017 2016
Opening balance 6,732 5,428
Charges 3,735 3,197
Utilization (2,476) (1,948)
Foreign exchange differences (177) 55
Closing balance 7,814 6,732

57
As of 31 December 2017, the accumulated impairment losses amounted to euro 16,376 (euro 21,978), as a consequence of the reactivation of previously impaired production lines.
Finance leasesThe net book value of assets held under finance leases amounted to euro 12,926 (euro 16,882) and comprised:
The details of the main lease contracts outstanding at 31 December 2017 are provided below:• Barilla G. e R. Fratelli has two finance lease contracts relating to
the cogeneration plants in Italy, amounting to euro 11,101, which will expire in 2020 and 2022 with purchase options available at the end of the lease term;
• Barilla Deutschland has entered a finance lease contract for a mill that will expire in August 2029. The net book value at 31 December 2017 amounted to euro 1,825.
The present value of future minimum lease payments by maturity is as follows:
The reconciliation between the future minimum lease payments and the present value of the lease payments is as follows:
Operating leases The future minimum lease payments by maturity under the major operating lease contracts with duration longer than one year are as follows:
Total net operating lease payments recognized in the consolidated income statement amounted to euro 24,717 (euro 23,136).
6.8 GoodwillMovements in goodwill are as follows:
The impairment is totally related to the goodwill allocated to the segment Russia - Bakery, impaired in the previous years.
An analysis of goodwill by segment for impairment test purposes at 31 December 2017 is summarized in the table below:
The annual impairment test on goodwill consists in estimating the recoverable amount of the groups of cash generating units to which the goodwill is allocated and comparison with the carrying value of the related assets including goodwill. The recoverable amount of the groups of cash generating units was determined based on the value in use, calculated as the present value of the expected future cash flows relating to the groups of cash generating units.The cash flows utilized to determine value in use cover a five-year period plus a terminal value. The plans are prepared with varying detail depending on specific requirements and the relevance of the selected variables, starting from a series of key macroeconomic indicators (e.g. foreign exchange rates, inflation rates, market assumptions) and economic-financial targets.Group management formulates the qualitative and quantitative content of the plan used for the relevant impairment. The flows deriving from groups of cash generating units at the end of the plan period correspond to the perpetual income based on the final year of the plan, appropriately normalized.
The key assumptions used to perform the impairment test are as follows:
Based on the annual impairment test as of 31 December 2017, no further impairment is required.
Buildings Plant and machinery Total
At 12/31/2017 745 12,181 12,926
At 12/31/2016 810 16,072 16,882
12/31/2017 12/31/2016
Not later than one year 5,052 5,052
Later than 1 year and not later than 5 years 10,939 15,252
Later than 5 years 1,676 2,415
Total value of future minimum lease payments 17,667 22,719
12/31/2017 12/31/2016
Total future minimum lease payments 17,667 22,719
Interest (1,937) (2,901)
Present value of lease payments 15,730 19,818
2017 2016
Not later than one year 13,526 12,414
Later than 1 year and not later than 5 years 31,707 23,340
Later than 5 years 28,354 30,086
Total future minimum lease payments 73,587 65,840
Goodwill
Movements in 2016
Opening balance at 1/1/2016 477,906
Foreign exchange differences (6,113)
Total at 12/31/2016 471,793
Movements in 2017
Foreign exchange differences (4,539)
Total at 12/31/2017 467,254
- of which gross value 495,608
- of which accumulated impairments (28,354)
Operating Segments - Business units Amount
Europe Region - Bakery 465,599
Other minor 1,655
Total 467,254
Operating SegmentsBusiness Units
Discount rate
Growth rate
2017 2016 2017 2016
Europe Region - Bakery 6.9% 7% 1.9% 1.6%

58
6.10 Trade and other receivables
The balance comprises:
The fair value of trade and other receivables approximates their carrying value.
Sensitivity analysis on the key assumptions has demonstrated that the variations necessary for a consequent impairment of the CGUs to which the goodwill is allocated are remote, due to a significantly higher excess value compared to the carrying amount of the group of cash generating units.The goodwill denominated in foreign currencies, mainly in Swedish Krone and Norwegian Krone have undergone a change in value due to the accumulated impact of exchange rates fluctuation.At 31 December 2017 the effect of conversion shows mainly a net accumulated loss of euro 13,195. 6.9 Other intangible assetsOther intangible assets consist of the following:
“Trademarks” relates principally to Harrys. The trademarks of Barilla G. e R. (Barilla, Mulino Bianco) have not been recognized in the financial statements as they were developed internally. The increase in “Licenses and software” and “Assets under construction” refers for euro 9,264 (euro 7,407) to the acquisition of new software such as “Enterprise Resources Planning” (ERP) software with respect to the accounting, finance, management and control systems.The amount of “Assets under construction” mainly relates to the costs for ERP not yet in use.
12/31/2017 12/31/2016
Guarantee deposits 644 437
Other non-current receivables 1,502 1,625
Total 2,146 2,062
Licenses and software Trademarks Other Assets under
construction Total
Movements in 2016
Opening balance at 1/1/2016 12,043 30,772 65 4,535 47,415
Acquisitions and capitalizations 10,497 1,048 - (2,709) 8,836
Foreign exchange differences 6 (136) (20) 11 (139)
Amortization (5,571) (11,365) (3) - (16,939)
Total at 12/31/2016 16,975 20,319 42 1,837 39,173
Of which:
Historical cost 111,555 266,938 193 1,837 380,523
Amortization and accumulated impairment losses (94,580) (246,619) (151) (341,350)
Movements in 2017
Acquisitions and capitalizations 6,785 1,575 304 2,981 11,645
Foreign exchange differences (54) (64) 5 (20) (133)
Disposals - - (39) - (39)
Amortization (6,284) (11,495) (11) - (17,790)
Total at 12/31/2017 17,422 10,335 301 4,798 32,856
Of which:
Historical cost 110,020 265,644 582 4,798 381,044
Amortization and accumulated impairment losses (92,598) (255,309) (281) (348,187)

59
Roger Federer is the Global Brand Ambassador for the promotion of Barilla pasta and sauces worldwide: a spokesman for the company’s values, Italian excellence and the centrality of eating properly for individual health and the well-being of our planet.

60
6.11 Deferred income tax assets and liabilities Deferred income tax assets and liabilities are recognized separately in the statement of financial position, exclusively in relation to temporary differences between the carrying value of assets and liabilities in the balance sheet and their tax base.Deferred tax assets on tax losses carried forward are only recognized where it is probable that sufficient future taxable profits will be earned to allow recovery of the tax differences that will be reversed.The table below illustrates the composition and movements in deferred income tax assets and liabilities by underlying balance sheet items and period of generation; deferred taxes are represented as net for each entity where they could be actually offset:
2017 Opening balance IFRS 9 Adoption
Reversals/charges through income
statement
Impact on equity
Foreign exchange
impact
Closing balance
Deferred taxes
Property, plant and equipment (53,584) - 8,884 - 1,602 (43,098)
Leasing 5,514 - (1,103) - 5 4,416
Intangible assets 2,155 - (136) - (12) 2,007
Financial liabilities and derivatives (2,462) 849 2,661 (488) (11) 549
Inventories 5,168 - (846) - (66) 4,256
Spare parts 7,056 - (1,110) - (322) 5,624
Provisions for other liabilities and charges 31,267 - 1,732 - (155) 32,844
Pension funds 15,435 - 595 (260) (148) 15,622
Tax losses carried forward 2,017 - (891) - (163) 963
Other 11,898 - (6,967) - (826) 4,105
Total 24,464 849 2,819 (748) (96) 27,288
Deferred income tax assets 67,978 41,902
Deferred income tax liabilities (43,514) (14,614)
Total 24,464 27,288
2016 Opening balance
Reversals/charges through income
statement
Impact on equity
Foreign exchange
impact
Closing balance
Deferred taxes
Property, plant and equipment (43,760) (9,335) - (489) (53,584)
Leasing 1,088 4,417 - 9 5,514
Intangible assets (1,122) 3,183 - 94 2,155
Financial liabilities and derivatives 695 (2,790) (335) (32) (2,462)
Inventories (1,358) 6,563 - (37) 5,168
Spare parts 6,538 426 - 92 7,056
Provisions for other liabilities and charges 19,372 11,937 - (42) 31,267
Pension funds 12,729 1,799 1,014 (107) 15,435
Tax losses carried forward 1,455 546 - 16 2,017
Other 20,235 (8,599) - 262 11,898
Total 15,872 8,147 679 (234) 24,464
Deferred income tax assets 59,096 67,978
Deferred income tax liabilities (43,224) (43,514)
Total 15,872 24,464

61
Deferred income taxes have not been recognized on the undistributed earnings of subsidiaries, as the Group is able to control the timing of these distributions and it is probable that they will not be distributed in the near future.
6.12 Equity instruments The item principally comprises equity investments in BRW S.p.A., amounting to euro 1,023 and other minor non-current financial assets totaling euro 1,297 (euro 1,550). According to the new early adopted accounting standard IFRS 9, the Group aligned the carrying value of its equity instruments to their fair value. The relevant change in fair value of euro 253 has been booked in the consolidated income statement line “Finance income and (costs)” (note 6.27). 6.13 Trade payablesTrade payables, which amounted to euro 751,115 (euro 683,867), represent amounts due in relation to the purchase of goods and services. Trade payables are recorded at nominal value, which substantially approximates their fair value. All amounts are payable within one year.The total amount includes euro 1,926 (euro 680) due to BRW S.p.A. The balance includes the amounts due to co-packers, which are governed by medium/long-term supply contracts negotiated at arm’s length, that establish guaranteed minimums disclosed in contractual commitments for finished good supplies.
6.14 BorrowingsCurrent borrowings, classified as current liabilities, comprise amounts due within one year and are detailed as follows:
The current portion of bonds amounted to euro 62,917; for further information refer to note 6.19.The short-term portion of bank overdrafts and leasing obligations comprise bank overdrafts amounting to euro 971 (euro 3,731), the amounts due to leasing companies within 12 months for euro 4,318 (euro 4,088), loans for export financing for euro 330 (euro 1,214), loans due within one year for euro 10,182 (euro 4,595). Bank borrowings are not guaranteed by property, plant and equipment.The current portion of the loan with the European Investment Bank (EIB), due within 12 months, amounts to euro 6,236 (euro 6,229). As of 31 December 2016, the financial debt due to parent company related to a loan with Barilla Holding Società per Azioni for euro 2,559 due within 12 months and floating rate linked to Euribor.Current borrowings are measured at amortized cost, which is deemed to represent their fair value.Refer to note 6.19 for the reconciliation of the changes in liabilities arising from financing activities, within and after one year, as highlighted in section “Net cash from financing activities” of the statement of cash flows.
12/31/2017 12/31/2016
Bonds 62,917 -
Short-term portion of bank overdrafts and leasing obligations 15,801 13,628
Current portion of long-term bank loans 6,236 6,229
Financial debt due to parent companies - 2,559
Total borrowings 84,954 22,416
6.15 Retirement benefit obligations Retirement benefit obligations comprise amounts paid to employee defined benefit plans, including the staff leaving indemnity fund (TFR), equivalent plans and pension schemes.Total obligations relating to future benefits payable to employees amounts to euro 147,263 (euro 149,282), of which amounts due within one year are euro 11,234 (euro 10,862) and due after more than one year are euro 136,029 (euro 138,420), net of plan assets for euro 3,760 (euro 4,335).
In Italy, the staff leaving indemnity (TFR) represents the deferred compensation payable by companies to employees on termination of employment, in accordance with article 2120 of the Italian Civil Code. Following reforms introduced in the Italian law, the TFR provision matured up to 31 December 2006 is still considered a defined contribution plan. The principal specific risks related to this plan refers to the accrued benefit that is payable to the members as a lump sum when retiring or leaving the company. According to the Italian law, it is also possible to receive an advance from the total accumulated benefit. Therefore, there is the risk that members will leave the plan sooner than expected or demand an advance payment in a greater measure than expected, generating an actuarial loss in the plan due to cash flow acceleration. Other risks to which the plans are exposed are limited to inflation, to which the accrued benefits are linked, and discount rate.
The other plans and pension schemes relate to companies operating in France, Greece, Germany, Sweden, Turkey, Norway, Mexico and Switzerland.
The principal features of some of the most significant plans are as follows:• In France, there are the “Retirement Indemnity Plan” and the
“Seniority Awards Plan”. The former confers the right to receive a sum of money on termination of employment upon retirement, in proportion to the number of years of service, final salary levels and whether termination was voluntary or not. The specific risks are related to the fact that Retirement Indemnity Plans are mandatory by law and are defined by national bargaining agreements, therefore these plans are subject to the legislative risk and the assumption risks (mainly discount rate and withdrawal rate). The “Seniority Awards plans” pay benefits at any defined anniversary of working life related to the service in the company. The awards paid at this occasion are exempt of payroll taxes within the value of one month of salary. The main risks on these plans would be the fiscal legislation risk characterizing them that would require additional costs. Other risks are related to the change in the discount rate and withdrawal rate of employees, as for the former plan;
• In Greece, the “Retirement Indemnity Plan” provides that the employer is required to pay an indemnity where the employee has reached pensionable age or employment is terminated involuntarily.The indemnity depends on a number of factors including years of service, the equivalent monthly salary in the last year of service (including bonuses) and the reason for termination. A scale of multiples is also defined in order to define the number of months to be paid in relation to years of service, also taking into consideration the reason for termination. Main risks are related to the change in the discount rate;
• In Germany, the “Pension Plan” provides for the payment of an
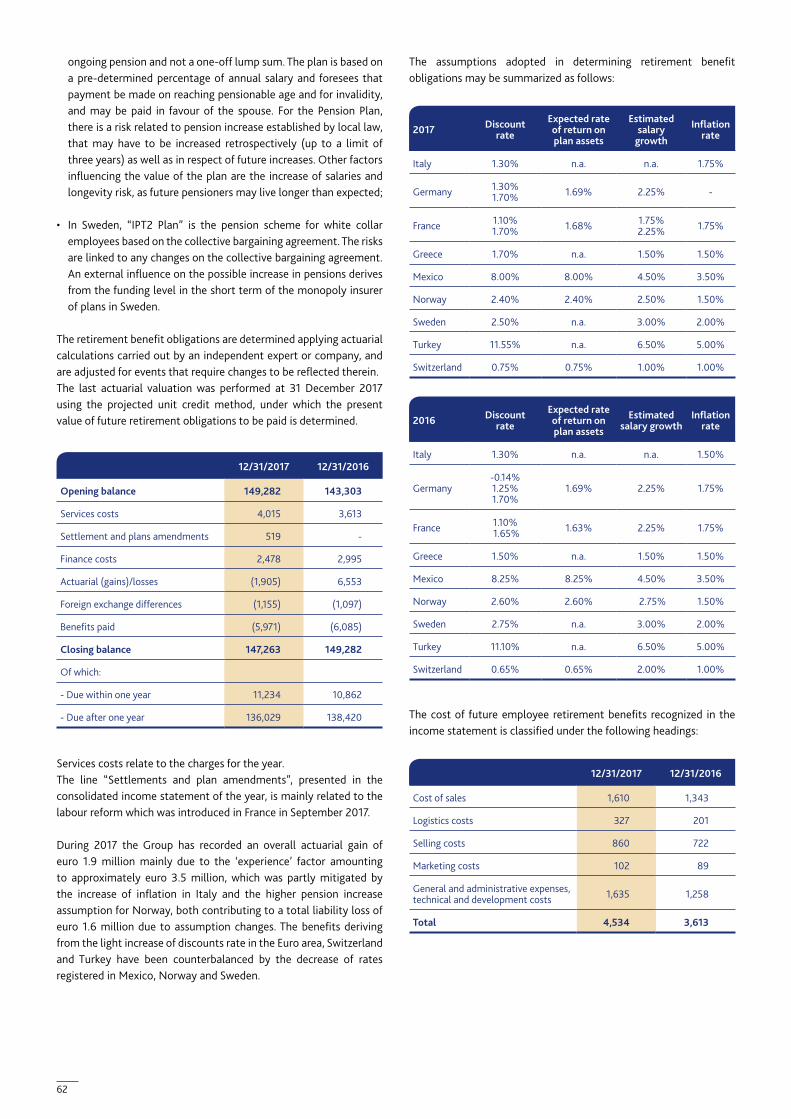
62
ongoing pension and not a one-off lump sum. The plan is based on a pre-determined percentage of annual salary and foresees that payment be made on reaching pensionable age and for invalidity, and may be paid in favour of the spouse. For the Pension Plan, there is a risk related to pension increase established by local law, that may have to be increased retrospectively (up to a limit of three years) as well as in respect of future increases. Other factors influencing the value of the plan are the increase of salaries and longevity risk, as future pensioners may live longer than expected;
• In Sweden, “IPT2 Plan” is the pension scheme for white collar employees based on the collective bargaining agreement. The risks are linked to any changes on the collective bargaining agreement. An external influence on the possible increase in pensions derives from the funding level in the short term of the monopoly insurer of plans in Sweden.
The retirement benefit obligations are determined applying actuarial calculations carried out by an independent expert or company, and are adjusted for events that require changes to be reflected therein.The last actuarial valuation was performed at 31 December 2017 using the projected unit credit method, under which the present value of future retirement obligations to be paid is determined.
Services costs relate to the charges for the year.The line “Settlements and plan amendments”, presented in the consolidated income statement of the year, is mainly related to the labour reform which was introduced in France in September 2017.
During 2017 the Group has recorded an overall actuarial gain of euro 1.9 million mainly due to the ‘experience’ factor amounting to approximately euro 3.5 million, which was partly mitigated by the increase of inflation in Italy and the higher pension increase assumption for Norway, both contributing to a total liability loss of euro 1.6 million due to assumption changes. The benefits deriving from the light increase of discounts rate in the Euro area, Switzerland and Turkey have been counterbalanced by the decrease of rates registered in Mexico, Norway and Sweden.
The assumptions adopted in determining retirement benefit obligations may be summarized as follows:
The cost of future employee retirement benefits recognized in the income statement is classified under the following headings:
12/31/2017 12/31/2016
Opening balance 149,282 143,303
Services costs 4,015 3,613
Settlement and plans amendments 519 -
Finance costs 2,478 2,995
Actuarial (gains)/losses (1,905) 6,553
Foreign exchange differences (1,155) (1,097)
Benefits paid (5,971) (6,085)
Closing balance 147,263 149,282
Of which:
- Due within one year 11,234 10,862
- Due after one year 136,029 138,420
12/31/2017 12/31/2016
Cost of sales 1,610 1,343
Logistics costs 327 201
Selling costs 860 722
Marketing costs 102 89
General and administrative expenses, technical and development costs 1,635 1,258
Total 4,534 3,613
2017 Discount rate
Expected rate of return on plan assets
Estimated salary
growth
Inflation rate
Italy 1.30% n.a. n.a. 1.75%
Germany 1.30%1.70% 1.69% 2.25% -
France 1.10%1.70% 1.68% 1.75%
2.25% 1.75%
Greece 1.70% n.a. 1.50% 1.50%
Mexico 8.00% 8.00% 4.50% 3.50%
Norway 2.40% 2.40% 2.50% 1.50%
Sweden 2.50% n.a. 3.00% 2.00%
Turkey 11.55% n.a. 6.50% 5.00%
Switzerland 0.75% 0.75% 1.00% 1.00%
2016 Discount rate
Expected rate of return on plan assets
Estimated salary growth
Inflation rate
Italy 1.30% n.a. n.a. 1.50%
Germany-0.14%1.25%1.70%
1.69% 2.25% 1.75%
France 1.10% 1.65% 1.63% 2.25% 1.75%
Greece 1.50% n.a. 1.50% 1.50%
Mexico 8.25% 8.25% 4.50% 3.50%
Norway 2.60% 2.60% 2.75% 1.50%
Sweden 2.75% n.a. 3.00% 2.00%
Turkey 11.10% n.a. 6.50% 5.00%
Switzerland 0.65% 0.65% 2.00% 1.00%

63
The plan assets composition is as follows:
The weighted duration of defined benefit obligations is equal to 12 years, split by plan as follows:
The effect on the retirement benefit obligation of a reasonably possible change in the actuarial assumption considered in computing the defined-benefit obligation is provided below:
6.16 Current income tax liabilitiesCurrent income tax liabilities amount to euro 5,297 (euro 8,806) and comprise the provision for current taxes on profit for the year.Concerning the Italian entities that participate in the group tax consolidation regime, the current tax liability relates to the balance of IRAP (trade income tax). The IRES (corporation tax) liability was transferred to the parent company CO.FI.BA. S.r.l. under the group tax consolidation regime in Italy.
6.17 Other liabilitiesOther liabilities consist of the following:
Amounts due to parent companies refer to the balances due to CO.FI.BA. S.r.l. for the group tax consolidation regime.Accruals and deferred income mainly relate to accrued interest payable.The fair value of other liabilities approximates the carrying value.
12/31/2017 12/31/2016
Amounts due to parent companies 12 17,516
Amounts due to employees 110,748 107,666
Amounts due to social security authorities 26,635 25,886
Withholding taxes from employees, consultants and freelance workers 12,559 11,976
VAT payable 1,515 2,728
Other taxes 3,883 6,791
Amounts due to customers 6,186 4,746
Other liabilities 7,259 8,314
Accruals and deferred income 1,897 1,546
Total 170,694 187,169
2017 2016
Listed shares and bonds 91 2,348
Cash and cash equivalents 4 98
Total listed assets 95 2,446
Insurance contracts 3,565 1,602
Not listed - other 100 287
Total assets 3,760 4,335
Years Weighted duration
Average future working lifetime
Average 12.3 10.7
Italy 9 10.4
Germany 15 7.6
France 13.1 15.5
Sweden 16.9 11.7
Greece 15.6 16.3
Turkey 7.6 16.1
Effect% Increase in actuarial assumption
% Decrease in actuarial assumption
Discount rate (0.5% movement) (4.78)% 7.73%
Rate of salary increase (0.5% movement) 4.77% (0.46)%
Inflation rate (0.25% movement) 3.27% (1.06)%
Life expectancy (1 year variation) 3.31% n.a.

64
The plant in Ascoli Piceno (Italy), the first to produce bakery products outside Parma, celebrates its 35th anniversary with Vice Chairman Luca Barilla (front row, at the center). December 2017
65
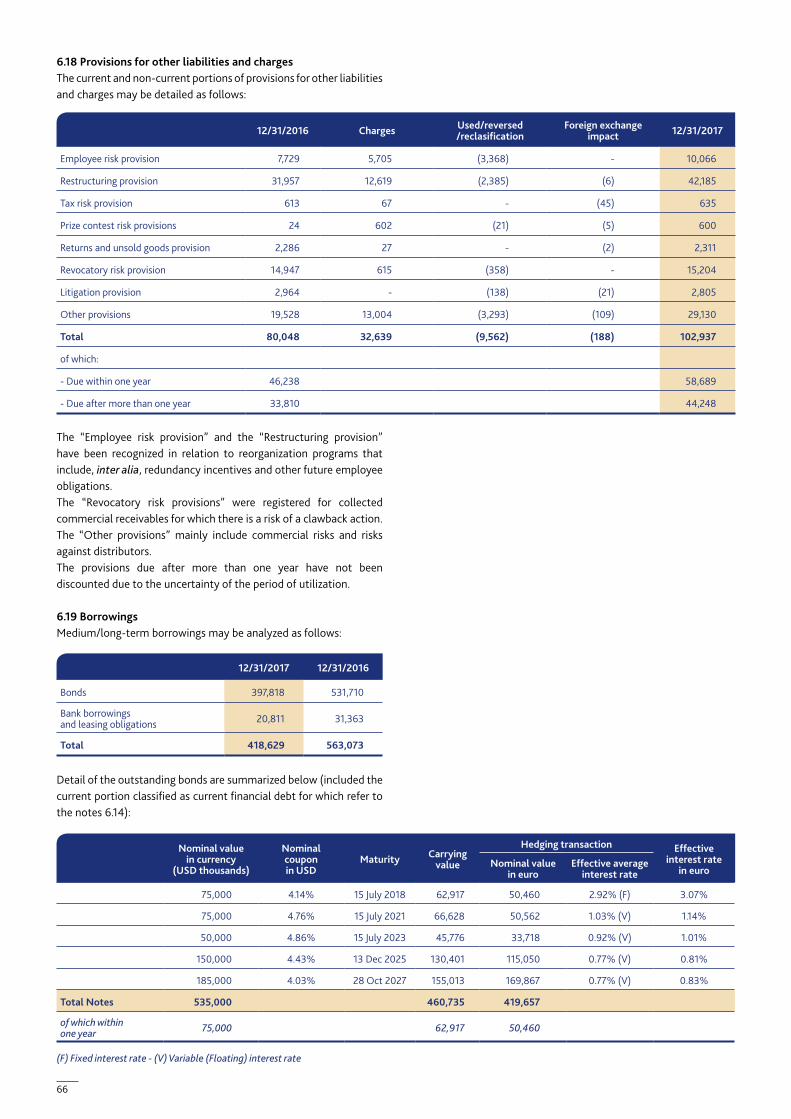
66
6.18 Provisions for other liabilities and charges The current and non-current portions of provisions for other liabilities and charges may be detailed as follows:
The “Employee risk provision” and the “Restructuring provision” have been recognized in relation to reorganization programs that include, inter alia, redundancy incentives and other future employee obligations.The “Revocatory risk provisions” were registered for collected commercial receivables for which there is a risk of a clawback action. The “Other provisions” mainly include commercial risks and risks against distributors.The provisions due after more than one year have not been discounted due to the uncertainty of the period of utilization.
6.19 BorrowingsMedium/long-term borrowings may be analyzed as follows:
Detail of the outstanding bonds are summarized below (included the current portion classified as current financial debt for which refer to the notes 6.14):
12/31/2017 12/31/2016
Bonds 397,818 531,710
Bank borrowings and leasing obligations 20,811 31,363
Total 418,629 563,073
12/31/2016 Charges Used/reversed/reclasification
Foreign exchange impact 12/31/2017
Employee risk provision 7,729 5,705 (3,368) - 10,066
Restructuring provision 31,957 12,619 (2,385) (6) 42,185
Tax risk provision 613 67 - (45) 635
Prize contest risk provisions 24 602 (21) (5) 600
Returns and unsold goods provision 2,286 27 - (2) 2,311
Revocatory risk provision 14,947 615 (358) - 15,204
Litigation provision 2,964 - (138) (21) 2,805
Other provisions 19,528 13,004 (3,293) (109) 29,130
Total 80,048 32,639 (9,562) (188) 102,937
of which:
- Due within one year 46,238 58,689
- Due after more than one year 33,810 44,248
Nominal value in currency
(USD thousands)
Nominal coupon in USD
Maturity Carrying value
Hedging transaction Effective interest rate
in euroNominal value
in euroEffective average
interest rate
75,000 4.14% 15 July 2018 62,917 50,460 2.92% (F) 3.07%
75,000 4.76% 15 July 2021 66,628 50,562 1.03% (V) 1.14%
50,000 4.86% 15 July 2023 45,776 33,718 0.92% (V) 1.01%
150,000 4.43% 13 Dec 2025 130,401 115,050 0.77% (V) 0.81%
185,000 4.03% 28 Oct 2027 155,013 169,867 0.77% (V) 0.83%
Total Notes 535,000 460,735 419,657
of which within one year 75,000 62,917 50,460
(F) Fixed interest rate - (V) Variable (Floating) interest rate

67
Borrowings due within one year and after more than one year are denominated in the following currencies:
The interest rate and foreign exchange risks relating to the US Private Placements are hedged by cross currency and interest rate swaps, details of which are provided in note 7.
The “Bank borrowings and leasing obligations” include an amortizing loan with the European Investment Bank (EIB) subscribed in January 2012 for euro 50,000 and expiring in 2020. The non-current portion outstanding as of 31 December 2017 amounted to euro 9,367 (euro 15,600).
The same line item includes the decrease of the portion of medium/long-term leasing obligations mainly relating to the finance leases for the cogeneration plants in Italy, with a balance at year-end of euro 11,412 (euro 15,730).
The irrevocable credit facility of euro 700,000, that expire in 2019 and was not used as of 31 December 2017, has been renegotiated at the beginning of 2018 with an amendment agreement, as reported in the paragraph ‘Significant events after the year-end’.A complete analysis of the interest rate risk management policy is provided in note 7.
The maturity dates of medium/long-term borrowings are illustrated in the table below:
The following table depicts the borrowings (including the respective hedging instruments) by maturity date and type of interest rate:
The analysis of borrowings by date of interest rate renegotiation is as follows:
Period Carrying value 2017
Carrying value 2016
Within 1 year 433,198 430,456
From 2 to 5 years 15,604 21,829
Over 5 years 15,730 19,818
Total borrowings due within one year and after more than one year *
464,532 472,103
Currency Carrying value 2017
Carrying value 2016
Euro 36,633 42,960
USD (American Dollar) 417,356 423,074
TRY (Turkish Lira) 10,512 5,809
Other 31 260
Total borrowings due within one year and after more than one year *
464,532 472,103
From 2 to 5 years
Over 5 years Total
Bonds 66,628 331,190 397,818
Bank borrowings and leasing obligations 19,365 1,446 20,811
Total medium/long-term bank borrowings 85,993 332,636 418,629
Borrower Description Interest rate At 12/31/2017 Maturity
Barilla France Bonds (including cross currency and interest rate swaps) fixed-floating 136,016 2018 - 2023
Barilla Iniziative Bonds (including cross currency and interest rate swaps) floating 280,731 2025 - 2027
Barilla Iniziative EIB loan floating 15,604 2020
Barilla G.e R. Fratelli Group Banks floating 16,451 2018
Barilla G.e R. Fratelli Group Leasing companies fixed 15,730 2018 - 2029
Total bank borrowings (either due within or after one year) * 464,532
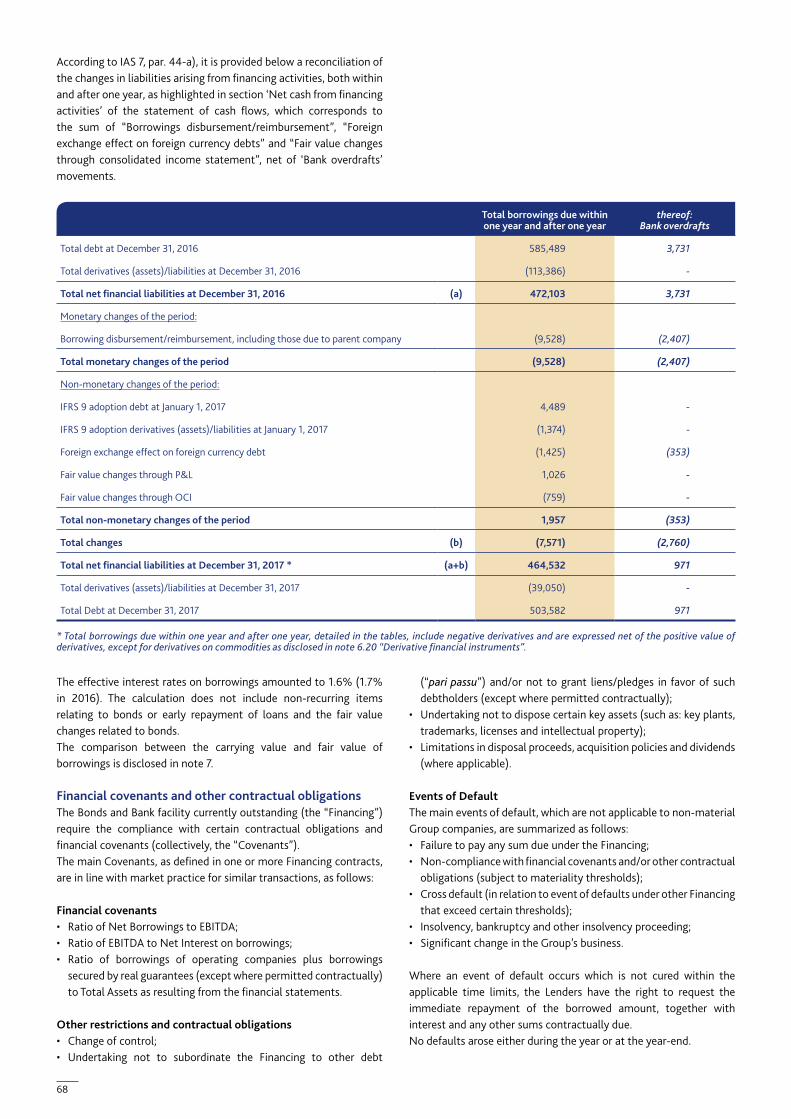
68
* Total borrowings due within one year and after one year, detailed in the tables, include negative derivatives and are expressed net of the positive value of derivatives, except for derivatives on commodities as disclosed in note 6.20 “Derivative financial instruments”.
Total borrowings due within one year and after one year
thereof: Bank overdrafts
Total debt at December 31, 2016 585,489 3,731
Total derivatives (assets)/liabilities at December 31, 2016 (113,386) -
Total net financial liabilities at December 31, 2016 (a) 472,103 3,731
Monetary changes of the period:
Borrowing disbursement/reimbursement, including those due to parent company (9,528) (2,407)
Total monetary changes of the period (9,528) (2,407)
Non-monetary changes of the period:
IFRS 9 adoption debt at January 1, 2017 4,489 -
IFRS 9 adoption derivatives (assets)/liabilities at January 1, 2017 (1,374) -
Foreign exchange effect on foreign currency debt (1,425) (353)
Fair value changes through P&L 1,026 -
Fair value changes through OCI (759) -
Total non-monetary changes of the period 1,957 (353)
Total changes (b) (7,571) (2,760)
Total net financial liabilities at December 31, 2017 * (a+b) 464,532 971
Total derivatives (assets)/liabilities at December 31, 2017 (39,050) -
Total Debt at December 31, 2017 503,582 971
According to IAS 7, par. 44-a), it is provided below a reconciliation of the changes in liabilities arising from financing activities, both within and after one year, as highlighted in section ‘Net cash from financing activities’ of the statement of cash flows, which corresponds to the sum of “Borrowings disbursement/reimbursement”, “Foreign exchange effect on foreign currency debts” and “Fair value changes through consolidated income statement”, net of ‘Bank overdrafts’ movements.
The effective interest rates on borrowings amounted to 1.6% (1.7% in 2016). The calculation does not include non-recurring items relating to bonds or early repayment of loans and the fair value changes related to bonds.The comparison between the carrying value and fair value of borrowings is disclosed in note 7.
Financial covenants and other contractual obligationsThe Bonds and Bank facility currently outstanding (the “Financing”) require the compliance with certain contractual obligations and financial covenants (collectively, the “Covenants”).The main Covenants, as defined in one or more Financing contracts, are in line with market practice for similar transactions, as follows:
Financial covenants• Ratio of Net Borrowings to EBITDA;• Ratio of EBITDA to Net Interest on borrowings;• Ratio of borrowings of operating companies plus borrowings
secured by real guarantees (except where permitted contractually) to Total Assets as resulting from the financial statements.
Other restrictions and contractual obligations• Change of control;• Undertaking not to subordinate the Financing to other debt
(“pari passu”) and/or not to grant liens/pledges in favor of such debtholders (except where permitted contractually);
• Undertaking not to dispose certain key assets (such as: key plants, trademarks, licenses and intellectual property);
• Limitations in disposal proceeds, acquisition policies and dividends (where applicable).
Events of DefaultThe main events of default, which are not applicable to non-material Group companies, are summarized as follows:• Failure to pay any sum due under the Financing;• Non-compliance with financial covenants and/or other contractual
obligations (subject to materiality thresholds);• Cross default (in relation to event of defaults under other Financing
that exceed certain thresholds);• Insolvency, bankruptcy and other insolvency proceeding;• Significant change in the Group’s business.
Where an event of default occurs which is not cured within the applicable time limits, the Lenders have the right to request the immediate repayment of the borrowed amount, together with interest and any other sums contractually due.No defaults arose either during the year or at the year-end.

69
6.20 Derivative financial instruments
The Group has designated the following hedging types:• Currency and interest rate swap contract for a tranche of US
Private Placement bond issued in 2011, with a nominal value of USD 75 million that expires on 15 July 2018, designated as cash flow hedge. The positive fair value at 31 December 2017 amounted to euro 12,419 and the effect charged to the Consolidated income statement for exchange difference amounted to euro 8,594;
• Currency and interest rate swap contracts for the tranches of US Private Placement bond, with a nominal value of USD 75 million that expire on 15 July 2021, designated as fair value hedge. The positive fair value at 31 December 2017 amounted to euro 15,545. The negative impact on the consolidated income statement amounted to euro 10,591 and the positive impact on comprehensive income to euro 403;
• Currency and interest rate swap contracts for the tranches of US Private Placement bond, with a nominal value of USD 50 million that expire on 15 July 2023, designated as fair value hedge. The positive fair value at 31 December 2017 amounted to euro 11,341. The negative impact on the consolidated income statement amounted to euro 7,663 and the positive impact on comprehensive income to euro 308;
• Currency and interest rate swap contracts for the tranches of US Private Placement bond with a nominal value of USD 150 million that expire on 15 December 2025, designated as fair value hedge. The positive fair value at 31 December 2017 amounted to euro 16,764. The negative impact on the consolidated income statement amounted to euro 19,760 and the positive impact on comprehensive income to euro 120;
• Currency and interest rate swap contracts for the tranches of US Private Placement bond issued in 2015, with a nominal value of USD 185 million that expire on 28 October 2027, designated as fair value hedge. The negative fair value at 31 December 2017 amounted to euro 12,081. The negative impact on the consolidated income statement amounted to euro 23,219 and the positive impact on comprehensive income to euro 681.
“Derivative contracts on commodities” mainly hedge electricity costs and the price of wheat.
Movements in the hedging reserve were as follows:
The hedging reserve includes the hedge portion of forward exchange derivatives, the derivatives on commodities and the effective portion related to the interest rate hedge, for the derivatives designated as cash flow hedge, as well as the basis component for the currency and interest rate swap contracts designated as fair value hedge.
As of December 31, 2017 the notional value of the main hedging contracts refers to the cross currency and interest rate swap contracts designated as cash flow hedge for euro 50,460 in respect of the bonds that expire in 2018, to the cross currency and interest rate swap contracts designated as fair value hedge for euro 369,197 in respect of the bonds that expire from 2021 to 2027, and to derivatives on commodities and electricity contracts for euro 8,610.The financial risk management policy is disclosed in note 7.
6.21 Other payablesOther payables, that amounted to euro 4,042 (euro 4,560), largely represent the liability in respect of social security contributions.
12/31/2017 12/31/2016
Assets Liabilities Assets Liabilities
- Cash flow hedge - interest rate derivatives - - 21,469 -
- Fair value hedge - interest rate derivatives 43,650 12,081 89,916 -
- Cash flow hedge - commodities 178 - - 843
Total non-current portion 43,828 12,081 111,385 843
- Cash flow hedge - interest rate derivatives 12,419 - - -
- Cash flow hedge - commodities - 296 - 461
- Cash flow hedge - forward exchange contracts - 336 - 39
- Held for trading - forward exchange contracts 638 5,239 2,387 347
- Held for trading - commodities - 140 - 32
Total current portion 13,057 6,011 2,387 879
Total derivative financial instruments 56,885 18,092 113,772 1,722
Gross reserve Tax effect
Movements in 2016
Opening balance at 1/1/2016 (7,352) 2,042
Change in fair value (462) 414
Exchange difference recognized in the Consolidated income statement
2,253 (750)
Total at 12/31/2016 (5,561) 1,706
Movements in 2017
IFRS 9 adoption 4,976 (1,659)
Change in basis 1,511 (437)
Change in fair value 8,990 (3,010)
Exchange difference recognized in the Consolidated income statement
(8,594) 2,959
Total at 12/31/2017 1,322 (441)

70
WASA marks the historic 50th anniversary of the opening of the production plant at Celle (Germany), with a special ceremony in the presence of Chairman Guido Barilla, CEO Claudio Colzani and all current and past employees. November 2017

71
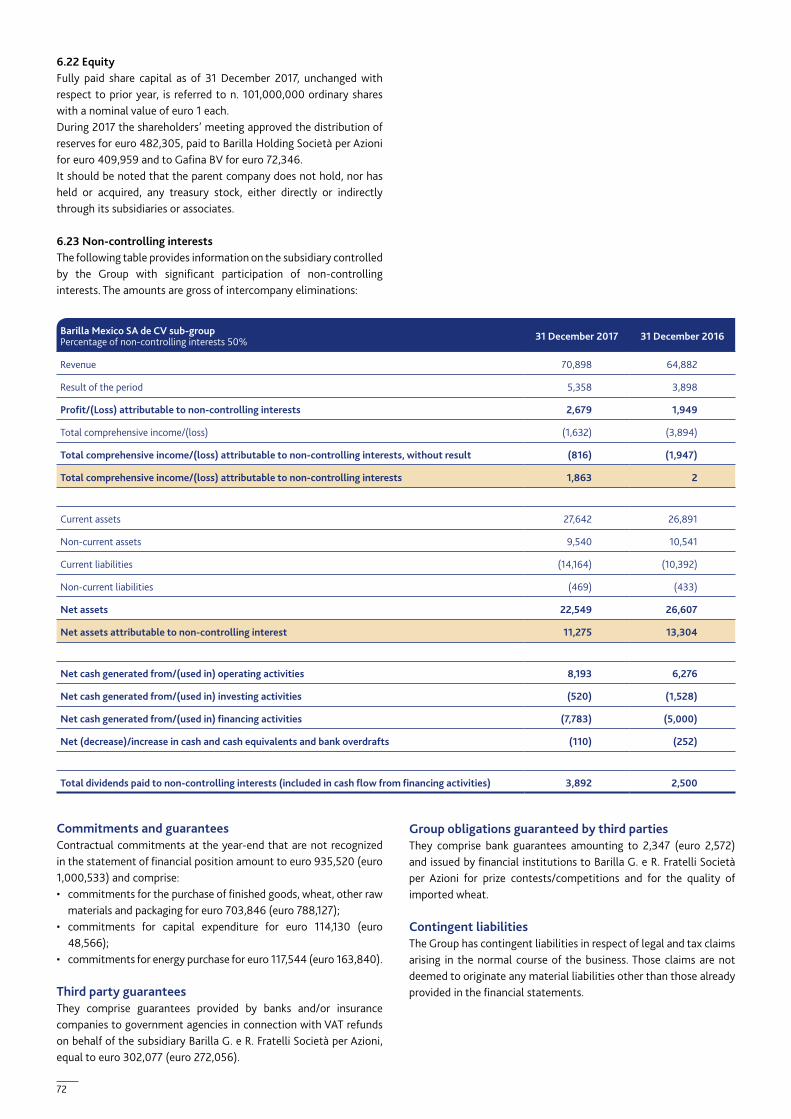
72
Barilla Mexico SA de CV sub-group Percentage of non-controlling interests 50% 31 December 2017 31 December 2016
Revenue 70,898 64,882
Result of the period 5,358 3,898
Profit/(Loss) attributable to non-controlling interests 2,679 1,949
Total comprehensive income/(loss) (1,632) (3,894)
Total comprehensive income/(loss) attributable to non-controlling interests, without result (816) (1,947)
Total comprehensive income/(loss) attributable to non-controlling interests 1,863 2
Current assets 27,642 26,891
Non-current assets 9,540 10,541
Current liabilities (14,164) (10,392)
Non-current liabilities (469) (433)
Net assets 22,549 26,607
Net assets attributable to non-controlling interest 11,275 13,304
Net cash generated from/(used in) operating activities 8,193 6,276
Net cash generated from/(used in) investing activities (520) (1,528)
Net cash generated from/(used in) financing activities (7,783) (5,000)
Net (decrease)/increase in cash and cash equivalents and bank overdrafts (110) (252)
Total dividends paid to non-controlling interests (included in cash flow from financing activities) 3,892 2,500
6.22 EquityFully paid share capital as of 31 December 2017, unchanged with respect to prior year, is referred to n. 101,000,000 ordinary shares with a nominal value of euro 1 each.During 2017 the shareholders’ meeting approved the distribution of reserves for euro 482,305, paid to Barilla Holding Società per Azioni for euro 409,959 and to Gafina BV for euro 72,346.It should be noted that the parent company does not hold, nor has held or acquired, any treasury stock, either directly or indirectly through its subsidiaries or associates. 6.23 Non-controlling interests The following table provides information on the subsidiary controlled by the Group with significant participation of non-controlling interests. The amounts are gross of intercompany eliminations:
Commitments and guaranteesContractual commitments at the year-end that are not recognized in the statement of financial position amount to euro 935,520 (euro 1,000,533) and comprise:• commitments for the purchase of finished goods, wheat, other raw
materials and packaging for euro 703,846 (euro 788,127); • commitments for capital expenditure for euro 114,130 (euro
48,566);• commitments for energy purchase for euro 117,544 (euro 163,840).
Third party guaranteesThey comprise guarantees provided by banks and/or insurance companies to government agencies in connection with VAT refunds on behalf of the subsidiary Barilla G. e R. Fratelli Società per Azioni, equal to euro 302,077 (euro 272,056).
Group obligations guaranteed by third partiesThey comprise bank guarantees amounting to 2,347 (euro 2,572) and issued by financial institutions to Barilla G. e R. Fratelli Società per Azioni for prize contests/competitions and for the quality of imported wheat.
Contingent liabilitiesThe Group has contingent liabilities in respect of legal and tax claims arising in the normal course of the business. Those claims are not deemed to originate any material liabilities other than those already provided in the financial statements.

73
The above total includes services cost towards the parent company Barilla Holding Società per Azioni for euro 3,051.
Depreciation on property, plant and equipment and amortization of intangible assets charged to the consolidated income statement are classified under the following headings:
6.26 Other income and expensesOther income and expenses comprise:
The item includes the services revenues towards the parent company Barilla Holding Società per Azioni for euro 407.
Consolidated income statement
6.24 RevenueRevenue may be analyzed as follows:
For the purposes of a correct representation of comparative data, it should be noted that the sales of raw materials to copackers have been reclassified for euro 9,748 as a reduction to the cost of finished goods, insofar as the re-purchase of such raw materials is expected.
6.25 Detail of costs by natureThe following table sets out the composition of costs by nature in relation to the sum of cost of sales, logistics expenses, selling expenses, marketing expenses, technical and development costs and general and administrative expenses that are presented in the consolidated income statement:
2017 2016
Total sales of finished goods 3,418,731 3,346,614
Sales of by-products 43,374 43,913
Sales of raw materials and others 5,826 12,633
Total 3,467,931 3,403,160
2017 2016
Purchase of raw materials, semi-finished goods, finished goods, materials and change in inventories
1,357,378 1,348,452
Employee costs 506,843 496,699
Promotional and advertising services 341,723 307,613
Transport and warehousing services 283,437 264,779
Depreciation and amortization 130,755 132,514
Services 102,426 94,808
Third party manufacturing costs 81,628 82,963
Utilities 63,206 69,922
Sales commissions 53,291 53,023
Maintenance costs 41,104 40,371
Property leases, rentals and operating leases 24,717 23,136
Purchase of other materials 22,175 23,449
Travel and expenses 15,717 15,407
Consultancy costs 13,740 15,339
Customs duties 10,829 8,180
Other taxes 10,022 9,260
Insurances 8,251 8,009
Postage and telephone expenses 7,354 7,137
Directors’ and statutory auditors’ emoluments 4,909 4,811
Green dot 4,909 4,947
Canteen’s costs 3,628 3,649
Employee training costs 2,887 3,519
Others 4,384 2,631
Total 3,095,313 3,020,618
2017 2016
Cost of sales 103,220 107,100
Logistics costs 4,340 5,923
Selling costs 1,083 247
Marketing costs 140 56
General and administrative expenses, technical and development costs
21,972 19,188
Total 130,755 132,514
2017 2016
Income and expenses from continuing operations:
Net gains/(losses) on disposals of property, plant and equipment (2,646) (1,934)
Insurance repayments 1,196 1,107
Net (charges to)/utilization of provisions (7,965) 7,143
Allowance and losses on trade receivables (968) (4,942)
Property and other taxes (7,040) (6,667)
Donations to employees and third parties (9,910) (8,550)
Membership fees (1,558) (1,500)
Employee leaving incentives (2,299) (2,354)
Income/(expenses) relating to other accounting periods 11,355 2,939
Bank commission and factoring services (2,199) (2,482)
Net services rendered and other minor amounts 22,826 15,083
Total income/(expenses) from continuing operations 792 (2,157)

74
depreciation” allowance (under article 1, par. 91 Law 22 December 2015, n. 208) and the tax benefits to promote investments in the technological and digital field according to the “Industry 4.0” model, provided for by the 2017 Italian Budget Law (Law n. 232 dated 11/12/2016), such as “Hyper-amortization” (article 1, par. 9, Law 232/2016) and relief on software (article 1, par. 10, Law 232/2016);
• the decrease of the nominal tax rate in Italy.
The lower effective tax charge compared to the theoretical amount, calculated as the weighted average of the tax rates in the countries in which the Group operates, is principally due to the abovementioned factors. The nominal tax rates in the countries in which the principal Group companies operate are as follows:
6.27 Finance costs - net Finance costs - net consisted of the following:
Interest expense on medium/long-term bank borrowings also include the amortization of expenses related to the revolving credit facility, whether or not it has been actually drawn. During 2017, the positive change in fair value of bonds depends on, among others, the early adoption of the new standard IFRS 9 ‘Financial instruments’. Accordingly, the bonds accounted at fair value hedge are presented in the balance sheet at their amortised cost, net of the change in value of the hypothetical derivative which underlies the hedging relationship. In prior year, the same item recorded a negative variation following the application of the former IAS 39 accounting principle.Commissions on undrawn amounts relate to the committed revolving credit facility, not used during the year.Other income and costs include interest for deferred payments and interest income on other receivables.
6.28 Income tax expenseThe reconciliation between the theoretical tax charge and the effective tax charge from the financial statements is provided below. The effective tax rate on profit before income tax amounted to 21% (35%).The decrease compared to the previous year is mainly due to:• the reduced taxation, for the Italian companies, on income derived
from the use of intellectual property, such as trademarks and patents, software and designs, know-how (pursuant to article 1, Law 23 December 2014, n. 190 “Patent Box”) which concerns a cumulative tax benefit for the last three fiscal years;
• the tax advantage based on the application of the so-called “Super-
2017 2016
Net costs relating to the net financial position:
Interest income on bank accounts 482 637
Interest expense on short-term bank borrowings (183) (629)
Interest expense on medium/long-term bank borrowings (2,032) (1,392)
Interest expense on bonds (4,675) (4,808)
Positive/(negative) change in fair value of bonds and hedging instruments 5,637 (7,197)
Interest expense on finance leases (964) (1,182)
Total net finance costs relating to the net financial position (1,735) (14,571)
Other finance income/(costs):
Net realized exchange gains/(losses) (4,053) 3,055
Net unrealized exchange gains/(losses) 1,226 7,986
Commissions on undrawn amounts (2,236) (2,242)
Interest costs on pension liabilities (2,478) (2,995)
Change in fair value of equity instruments (253) -
Other income/(costs) 414 61
Total other finance income/(costs) (7,380) 5,865
Total finance costs - net (9,115) (8,706)
Year ended31 December
2017
Profit before income tax 364,295
Theoretical tax charge 106,266
Unrecognized deferred tax assets 4,696
Net non-deductible expenses/(income not subject to tax) (33,598)
Use of deferred tax assets not recognized in prior periods and re-measurement of deferred taxes
(1,270)
Effective tax charge 76,094
Europe
Italy 27.90%
Germany 29.79%
Sweden 22.00%
France 33.33%
Austria 25.00%
Turkey 20.00%
Greece 29.00%
Other countries
Russia 20.00%
Brazil 34.00%
Mexico 30.00%
Australia 30.00%
North America
USA 40.00%
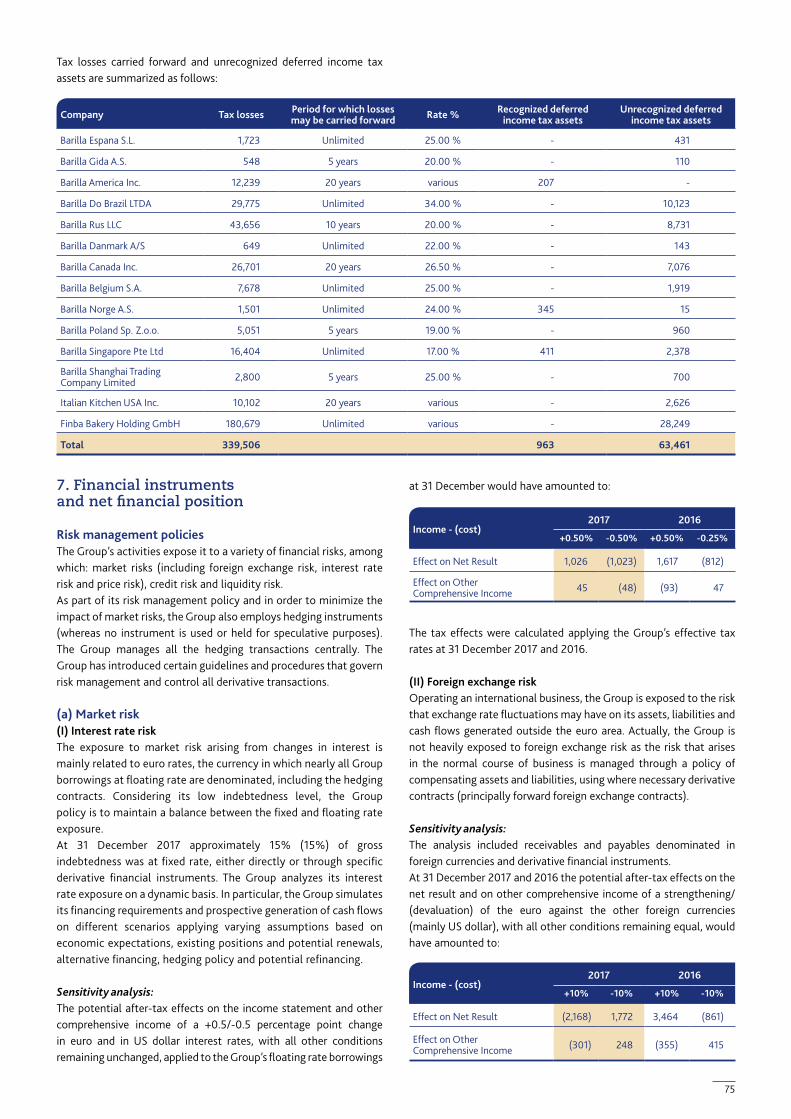
75
Tax losses carried forward and unrecognized deferred income tax assets are summarized as follows:
7. Financial instruments and net financial position
Risk management policiesThe Group’s activities expose it to a variety of financial risks, among which: market risks (including foreign exchange risk, interest rate risk and price risk), credit risk and liquidity risk.As part of its risk management policy and in order to minimize the impact of market risks, the Group also employs hedging instruments (whereas no instrument is used or held for speculative purposes). The Group manages all the hedging transactions centrally. The Group has introduced certain guidelines and procedures that govern risk management and control all derivative transactions.
(a) Market risk(I) Interest rate riskThe exposure to market risk arising from changes in interest is mainly related to euro rates, the currency in which nearly all Group borrowings at floating rate are denominated, including the hedging contracts. Considering its low indebtedness level, the Group policy is to maintain a balance between the fixed and floating rate exposure.At 31 December 2017 approximately 15% (15%) of gross indebtedness was at fixed rate, either directly or through specific derivative financial instruments. The Group analyzes its interest rate exposure on a dynamic basis. In particular, the Group simulates its financing requirements and prospective generation of cash flows on different scenarios applying varying assumptions based on economic expectations, existing positions and potential renewals, alternative financing, hedging policy and potential refinancing.
Sensitivity analysis:The potential after-tax effects on the income statement and other comprehensive income of a +0.5/-0.5 percentage point change in euro and in US dollar interest rates, with all other conditions remaining unchanged, applied to the Group’s floating rate borrowings
Company Tax losses Period for which losses may be carried forward Rate % Recognized deferred
income tax assetsUnrecognized deferred
income tax assets
Barilla Espana S.L. 1,723 Unlimited 25.00 % - 431
Barilla Gida A.S. 548 5 years 20.00 % - 110
Barilla America Inc. 12,239 20 years various 207 -
Barilla Do Brazil LTDA 29,775 Unlimited 34.00 % - 10,123
Barilla Rus LLC 43,656 10 years 20.00 % - 8,731
Barilla Danmark A/S 649 Unlimited 22.00 % - 143
Barilla Canada Inc. 26,701 20 years 26.50 % - 7,076
Barilla Belgium S.A. 7,678 Unlimited 25.00 % - 1,919
Barilla Norge A.S. 1,501 Unlimited 24.00 % 345 15
Barilla Poland Sp. Z.o.o. 5,051 5 years 19.00 % - 960
Barilla Singapore Pte Ltd 16,404 Unlimited 17.00 % 411 2,378
Barilla Shanghai Trading Company Limited 2,800 5 years 25.00 % - 700
Italian Kitchen USA Inc. 10,102 20 years various - 2,626
Finba Bakery Holding GmbH 180,679 Unlimited various - 28,249
Total 339,506 963 63,461
at 31 December would have amounted to:
The tax effects were calculated applying the Group’s effective tax rates at 31 December 2017 and 2016.
(II) Foreign exchange riskOperating an international business, the Group is exposed to the risk that exchange rate fluctuations may have on its assets, liabilities and cash flows generated outside the euro area. Actually, the Group is not heavily exposed to foreign exchange risk as the risk that arises in the normal course of business is managed through a policy of compensating assets and liabilities, using where necessary derivative contracts (principally forward foreign exchange contracts).
Sensitivity analysis:The analysis included receivables and payables denominated in foreign currencies and derivative financial instruments.At 31 December 2017 and 2016 the potential after-tax effects on the net result and on other comprehensive income of a strengthening/(devaluation) of the euro against the other foreign currencies (mainly US dollar), with all other conditions remaining equal, would have amounted to:
Income - (cost)2017 2016
+0.50% -0.50% +0.50% -0.25%
Effect on Net Result 1,026 (1,023) 1,617 (812)
Effect on Other Comprehensive Income 45 (48) (93) 47
Income - (cost)2017 2016
+10% -10% +10% -10%
Effect on Net Result (2,168) 1,772 3,464 (861)
Effect on Other Comprehensive Income (301) 248 (355) 415

76
Nicole Grimaudo and Giorgio Pasotti play Emma and Giovanni, the two young stars of the Mulino Bianco commercials, who share a common dream: to give everyone the joy that only good, genuine food can provide.
Aired on TV from September 2017.

77
“EVERYTHING IS DONE FOR THE FUTURE„
Pietro Barilla

78
(c) Liquidity riskThe Group’s policies aim to make the liquidity risk reasonably remote. This is achieved through the constant availability of funding through undrawn committed credit facilities, which cope with any reasonably foreseeable future financial commitments, also taking into account the Group’s significant generation of cash flows.At 31 December 2017, the Group held undrawn credit facilities expiring in 2019 of approximately euro 700,000 in addition to cash and cash equivalents in excess of euro 246,893.
An analysis of financial liabilities by maturity is provided in the table below. The maturity buckets are based on the period between the year-end date and the contractual maturity of the obligations.The amounts in the table represent the undiscounted cash flows including interest estimated applying year-end exchange rates.
(III) Price riskThe Group manages the mitigation of operating risks relating to the trend in prices of those commodities used in the production process mainly through the adoption of medium-term purchasing contracts with its suppliers, integrating also to a limited extent derivative contracts on wheat. Hedging contracts are entered into in respect of the Swedish electrical energy market using the “Nord Pool” mechanism.
Sensitivity analysis:The analysis considers derivatives on commodities, mainly related to derivative contracts on wheat and electrical energy.At 31 December 2017 and 2016, the potential after-tax effects on the income statement and other comprehensive income of a strengthening/(devaluation) of commodities’ prices, with all other conditions remaining equal, would have amounted to:
(b) Credit riskCredit risk represents the risk that one of the parties to a transaction does not fulfill the financial obligations undertaken. This risk relates to outstanding trade receivables, securities and cash and cash equivalents, and operations with banks and other financial institutions comprising: deposits and other transactions, derivative instruments and the ability to meet the commitment on the irrevocable credit facilities. The Group’s accounts receivable are concentrated in the large-scale retail channel.The Group periodically assesses the creditworthiness of its counterparties and regularly monitors the respect of the credit limits assigned. Insurance policies have been entered into to cover potential losses related to commercial receivables.The Group determines the value of debt instruments and the bank deposits in accordance with the expected credit losses criterion. As far as the credit risk on bank deposits and other financial investments is concerned, the Group has established exposure limits for each bank and it believes not to be currently exposed to significant risks, on the basis of the external credit rating, of the level of credit default swaps and of market information.
31 December 2017Less than
1 year
From 1 to 5 years
Over 5 years Total
Borrowings with banks, other lenders and finance leases
80,473 98,472 354,143 533,088
Derivative financial instruments through consolidated profit or loss
4,938 - - 4,938
Trade and other payables 927,106 4,042 - 931,148
Total 1,012,517 102,514 354,143 1,469,174
31 December 2016Less than
1 year
From 1 to 5 years
Over 5 years Total
Borrowings with banks, other lenders and finance leases
29,802 106,843 419,957 556,602
Derivative financial instruments through consolidated profit or loss
2,002 - - 2,002
Trade and other payables 879,842 4,560 - 884,402
Total 911,646 111,403 419,957 1,443,006
Income - (cost)2017 2016
+5% -5% +5% -5%
Effect on Net Result 116 (116) 53 (53)
Effect on Other Comprehensive Income 98 (98) 245 (245)

79
31 December 2017
Financial assets
at fair value through
profit or loss
Receivables and
financial receivables
Equity instruments at fair value
through profit or loss
Financial liabilities
at fair value through
profit or loss
Financial liabilities
at amortized cost
Hedging derivatives
assets
Hedging derivatives liabilities
Fair valueFair value
evaluation Level
Equity instruments - - 1,297 - - - - 1,297 Level 3
Derivatives (assets) 638 - - - - 56,247 - 56,885 Level 2
Trade and other receivables - 579,140 - - - - - 579,140
Cash and cash equivalents and financial assets
- 246,893 - - - - - 246,893
Borrowings with banks and other lenders
- - - 42,848 460,735 - - 505,308
Trade payables - - - 751,115 - - - 751,115
Other payables - - - 180,033 - - - 180,033
Derivatives (liabilities) - - - 5,379 - - 12,713 18,092 Level 2
Total 638 826,033 1,297 979,375 460,735 56,247 12,713
31 December 2016
Financial assets
at fair value through
profit or loss
Receivables and
financial receivables
Available-for-sale financial
assets
Financial liabilities
at fair value through
profit or loss
Financial liabilities
at amortized cost
Hedging derivatives
assets
Hedging derivatives liabilities
Fair valueFair value
evaluation Level
Available-for-sale financial assets not quoted on an active market
- - 1,550 - - - - n.a.
Derivatives (assets) 2,387 - - - - 111,385 - 113,772 Level 2
Trade and other receivables - 584,175 - - - - - 584,175
Cash and cash equivalents and financial assets
- 535,533 - - - - - 535,533
Borrowings with banks and other lenders
- - - 51,220 531,710 - - 585,222
Trade payables - - - 683,867 - - - 683,867
Other payables - - - 200,535 - - - 200,535
Derivatives (liabilities) - - - 378 - - 1,344 1,722 Level 2
Total 2,387 1,119,708 1,550 936,000 531,710 111,385 1,344
Categories of financial instrumentsIn order to provide full financial risk disclosures, the reconciliation between the categories of financial assets and liabilities as reported in the Group financial position and the categories of financial assets and liabilities identified in accordance with IFRS 7 is presented below, along with the information of fair value evaluation level provided for by IFRS 13:
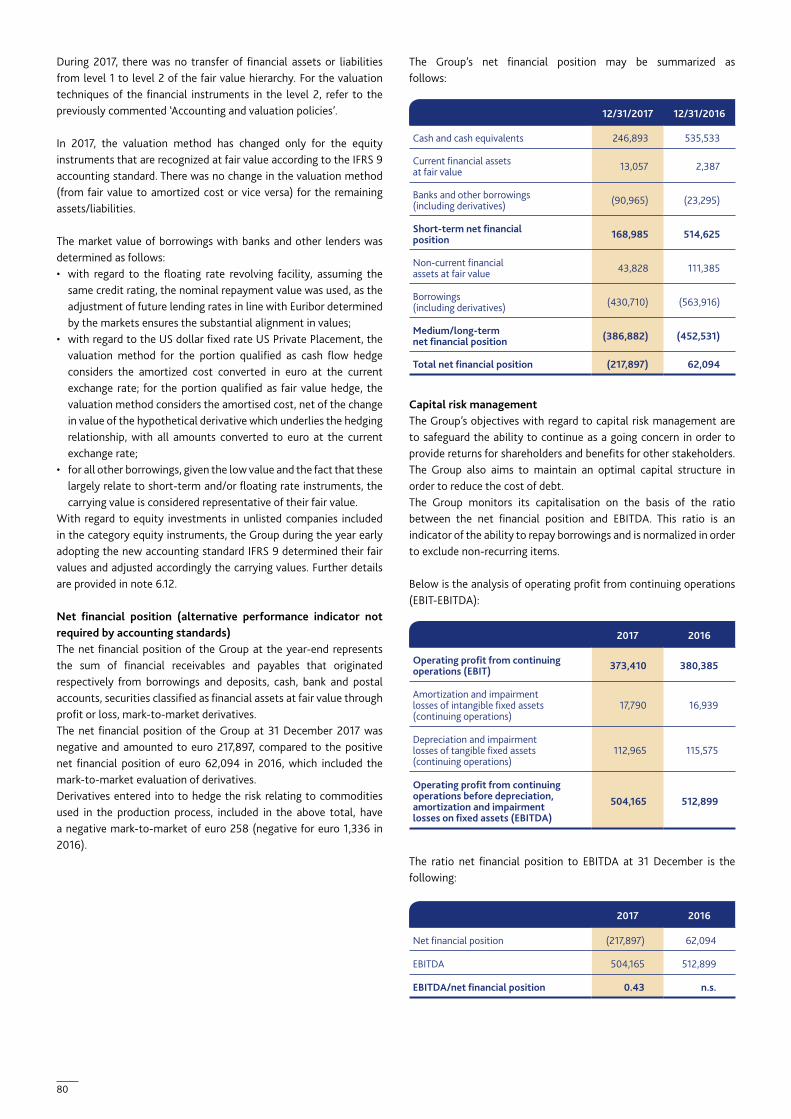
80
The Group’s net financial position may be summarized as follows:
Capital risk managementThe Group’s objectives with regard to capital risk management are to safeguard the ability to continue as a going concern in order to provide returns for shareholders and benefits for other stakeholders. The Group also aims to maintain an optimal capital structure in order to reduce the cost of debt.The Group monitors its capitalisation on the basis of the ratio between the net financial position and EBITDA. This ratio is an indicator of the ability to repay borrowings and is normalized in order to exclude non-recurring items. Below is the analysis of operating profit from continuing operations (EBIT-EBITDA):
The ratio net financial position to EBITDA at 31 December is the following:
During 2017, there was no transfer of financial assets or liabilities from level 1 to level 2 of the fair value hierarchy. For the valuation techniques of the financial instruments in the level 2, refer to the previously commented ‘Accounting and valuation policies’.
In 2017, the valuation method has changed only for the equity instruments that are recognized at fair value according to the IFRS 9 accounting standard. There was no change in the valuation method (from fair value to amortized cost or vice versa) for the remaining assets/liabilities.
The market value of borrowings with banks and other lenders was determined as follows:• with regard to the floating rate revolving facility, assuming the
same credit rating, the nominal repayment value was used, as the adjustment of future lending rates in line with Euribor determined by the markets ensures the substantial alignment in values;
• with regard to the US dollar fixed rate US Private Placement, the valuation method for the portion qualified as cash flow hedge considers the amortized cost converted in euro at the current exchange rate; for the portion qualified as fair value hedge, the valuation method considers the amortised cost, net of the change in value of the hypothetical derivative which underlies the hedging relationship, with all amounts converted to euro at the current exchange rate;
• for all other borrowings, given the low value and the fact that these largely relate to short-term and/or floating rate instruments, the carrying value is considered representative of their fair value.
With regard to equity investments in unlisted companies included in the category equity instruments, the Group during the year early adopting the new accounting standard IFRS 9 determined their fair values and adjusted accordingly the carrying values. Further details are provided in note 6.12.
Net financial position (alternative performance indicator not required by accounting standards)The net financial position of the Group at the year-end represents the sum of financial receivables and payables that originated respectively from borrowings and deposits, cash, bank and postal accounts, securities classified as financial assets at fair value through profit or loss, mark-to-market derivatives.The net financial position of the Group at 31 December 2017 was negative and amounted to euro 217,897, compared to the positive net financial position of euro 62,094 in 2016, which included the mark-to-market evaluation of derivatives. Derivatives entered into to hedge the risk relating to commodities used in the production process, included in the above total, have a negative mark-to-market of euro 258 (negative for euro 1,336 in 2016).
12/31/2017 12/31/2016
Cash and cash equivalents 246,893 535,533
Current financial assets at fair value 13,057 2,387
Banks and other borrowings (including derivatives) (90,965) (23,295)
Short-term net financial position 168,985 514,625
Non-current financial assets at fair value 43,828 111,385
Borrowings (including derivatives) (430,710) (563,916)
Medium/long-term net financial position (386,882) (452,531)
Total net financial position (217,897) 62,094
2017 2016
Operating profit from continuing operations (EBIT) 373,410 380,385
Amortization and impairment losses of intangible fixed assets (continuing operations)
17,790 16,939
Depreciation and impairment losses of tangible fixed assets (continuing operations)
112,965 115,575
Operating profit from continuing operations before depreciation, amortization and impairment losses on fixed assets (EBITDA)
504,165 512,899
2017 2016
Net financial position (217,897) 62,094
EBITDA 504,165 512,899
EBITDA/net financial position 0.43 n.s.
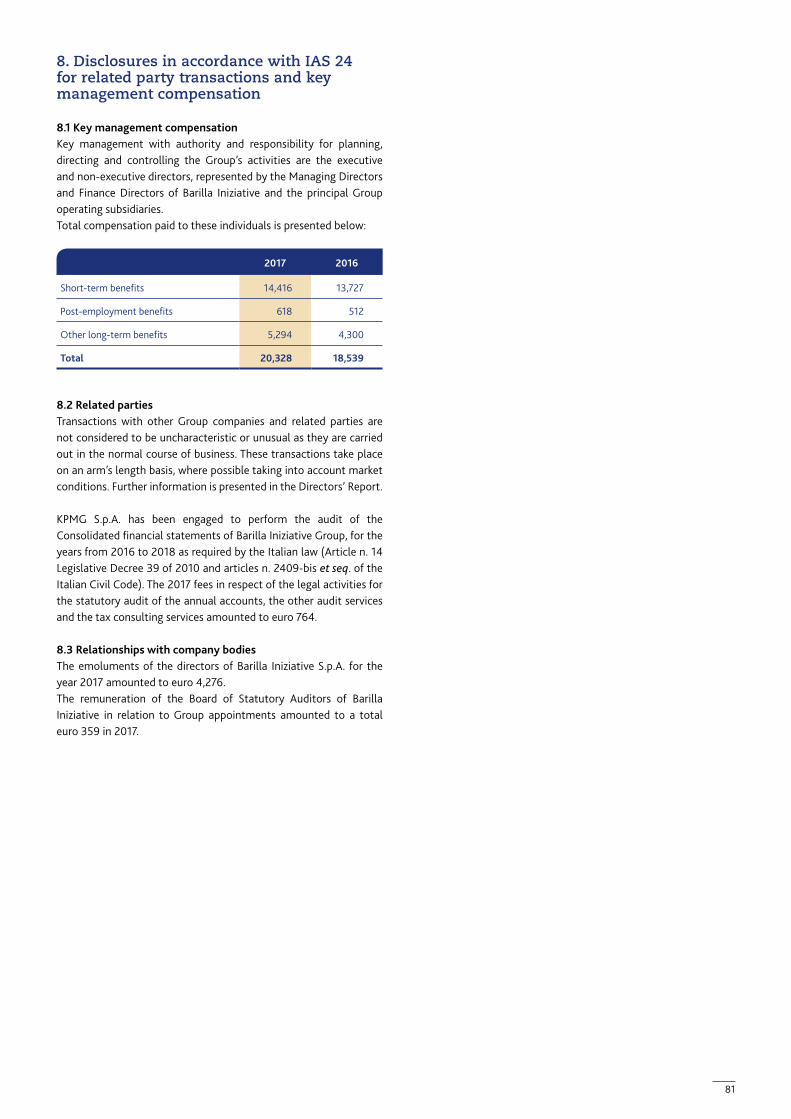
81
8. Disclosures in accordance with IAS 24 for related party transactions and key management compensation
8.1 Key management compensationKey management with authority and responsibility for planning, directing and controlling the Group’s activities are the executive and non-executive directors, represented by the Managing Directors and Finance Directors of Barilla Iniziative and the principal Group operating subsidiaries.Total compensation paid to these individuals is presented below:
8.2 Related partiesTransactions with other Group companies and related parties are not considered to be uncharacteristic or unusual as they are carried out in the normal course of business. These transactions take place on an arm’s length basis, where possible taking into account market conditions. Further information is presented in the Directors’ Report.
KPMG S.p.A. has been engaged to perform the audit of the Consolidated financial statements of Barilla Iniziative Group, for the years from 2016 to 2018 as required by the Italian law (Article n. 14 Legislative Decree 39 of 2010 and articles n. 2409-bis et seq. of the Italian Civil Code). The 2017 fees in respect of the legal activities for the statutory audit of the annual accounts, the other audit services and the tax consulting services amounted to euro 764.
8.3 Relationships with company bodiesThe emoluments of the directors of Barilla Iniziative S.p.A. for the year 2017 amounted to euro 4,276. The remuneration of the Board of Statutory Auditors of Barilla Iniziative in relation to Group appointments amounted to a total euro 359 in 2017.
2017 2016
Short-term benefits 14,416 13,727
Post-employment benefits 618 512
Other long-term benefits 5,294 4,300
Total 20,328 18,539

82
Guido, Luca e Paolo Barilla
“QUALITY IN EVERYTHING WE DO:PASSION, TRUST, INTELLECTUAL CURIOSITY,
INTEGRITY, COURAGE„

83
Appendices
Appendix 1.
List of companies included in the scope of consolidation
Company, headquarter and activity Currency Share Capital(nominal values)
% Group ownership Through %
Italian Kitchen S.r.l. - Socio UnicoVia Mantova 166 - Parma (Italy)Financial company
EURO 100,000 100.00 Barilla Iniziative S.p.A. 100.00
BLU1877 S.r.l.Via Madre Teresa di Calcutta 3/A - Parma (Italy)Start up Food industry
EURO 10,000 100.00 Barilla Iniziative S.p.A. 100.00
3D Food S.r.l.Via Madre Teresa di Calcutta 3/A - Parma (Italy)Production and trade
EURO 25,000 100.00 Barilla Iniziative S.p.A. 100.00
Italian Kitchen USA Inc.2711 Centerville Road, Suite 400 - Wilmington - County of New Castle DE (USA) - Restaurants coordination
USD 10,000 100.00 Italian Kitchen S.r.l.Socio Unico 100.00
IKRG - Midtown West LLCc/o Tarter Krinsky & Drogin LLP, 1350 Broadway - New York NY (USA)Restaurant
USD 10,000 100.00 Italian Kitchen USA Inc. 100.00
IKRG - LADC LLCc/o CSC-Lawyers Incorporation Service, 2710 Gateway Oaks Drive - Sacramento California (USA) - Distribution center
USD 10,000 100.00 Italian Kitchen USA Inc. 100.00
IKRG - LA1 LLCc/o CSC-Lawyers Incorporation Service, 2710 Gateway Oaks Drive - Sacramento California (USA) - Restaurant
USD 10,000 100.00 Italian Kitchen USA Inc. 100.00
IKRG - OC1 LLCc/o CSC-Lawyers Incorporation Service, 2710 Gateway Oaks Drive - Sacramento California (USA) - Restaurant
USD 10,000 100.00 Italian Kitchen USA Inc. 100.00
Finba Bakery Holding GmbHFritz-Vomfelde-Strasse 14-20 - Düsseldorf (Germany)Financial company
EURO 25,000 100.00 Barilla Iniziative S.p.A. 100.00
Barilla G. e R. Fratelli Società per Azioni - Socio Unico Via Mantova 166 - Parma (Italy)Production and trade
EURO 180,639,990 100.00 Barilla Iniziative S.p.A. 100.00
Barilla Servizi Finanziari S.p.A. - Socio UnicoVia Mantova 166 - Parma (Italy) - Leasing EURO 30,000,000 100.00 Barilla G. e R. Fratelli Società
per Azioni - Socio Unico 100.00
F.I.R.S.T. Retailing S.p.A. - Socio UnicoVia Mantova 166 - Parma (Italy) - Trade EURO 5,000,000 100.00 Barilla G. e R. Fratelli Società
per Azioni - Socio Unico 100.00
F.I.R.S.T. Commerciale S.r.l. - Socio UnicoVia Mantova 166 - Parma (Italy) - Trade EURO 10,000 100.00 F.I.R.S.T. Retailing S.p.A. -
Socio Unico 100.00
Barilla Hellas S.A.26 Pappou & Akragantos Str. - Athens (Greece)Production and trade
EURO 7,611,840 100.00 Barilla G. e R. Fratelli Società per Azioni - Socio Unico 100.00
Barilla America Inc.191 North Wacker Drive - Chicago, IL (USA)Production and trade
USD 1,000 100.00 Barilla G. e R. Fratelli Società per Azioni - Socio Unico 100.00
Barilla Japan K.K.9F, 2-7-3 Hirakawacho Chiyoda-ku - Tokyo (Japan)Trade
JPY 400,050,000 100.00 Barilla Singapore Pte Ltd 100.00
Barilla Do Brasil LTDAA.V. Pinzon, 144 - 7° Andar CJ 61, 62 e 73 - São Paulo (Brazil)Trade
BRL 127,937,135 100.00
Barilla G. e R. Fratelli Società per Azioni - Socio Unico 99.99
Barilla Servizi Finanziari S.p.A. - Socio Unico 0.01
Barilla Austria GmbHGrabenweg 64 - Innsbruck (Austria) - Trade EURO 436,000 100.00 Barilla G. e R. Fratelli Società
per Azioni - Socio Unico 100.00
Barilla Mexico S.A. de C.V.Calzada San Bartolo Naucalpan360 Col. Argentina Ponente Deleg. M. Hildalgo - Mexico City (Mexico)Trade
MXN 227,348,096 50.00 Barilla G. e R. Fratelli Società per Azioni - Socio Unico 50.00

84
Company, headquarter and activity Currency Share Capital(nominal values)
% Group ownership Through %
Serpasta S.A. de C.V.Calzada San Bartolo Naucalpan360 Col. Argentina Ponente Deleg. M. Hildalgo - Mexico City (Mexico)Production and trade
MXN 2,050,000 50.00
Barilla G. e R. Fratelli Società per Azioni - Socio Unico 0.05
Barilla Mexico S.A. de C.V. 99.90
Barilla Singapore Pte Ltd27 Kreta Ayer Road - Singapore (Singapore)Trade
SGDUSD
1,000,00038,000,000 100.00 Barilla G. e R. Fratelli Società
per Azioni - Socio Unico 100.00
Barilla (Shanghai) Trading Company LimitedRoom 830-838, Floor 8, Central Plaza n.381, Middle Huai Road, Huangpu District - Shanghai (China) Trade
USD 15,120,000 100.00 Barilla Singapore Pte Ltd 100.00
Barilla Middle East FZE Office No. LB191803, Jebel Ali - Dubai (United Arab Emirates)Trade
AED 1,000,000 100.00 Barilla Singapore Pte Ltd 100.00
Barilla Espana S.L.Zurbano 43 - Madrid (Spain) - Trade EURO 3,100 100.00 Barilla G. e R. Fratelli Società
per Azioni - Socio Unico 100.00
Barilla Canada Inc.26 Yonge Street - Toronto (Canada) - Trade CAD 25,010,000 100.00 Barilla G. e R. Fratelli Società
per Azioni - Socio Unico 100.00
Barilla Gida A.S.Askent sokak n.3A Kosifler Plaza D 11 Ataşehir - Istanbul (Turkey) Production and trade
TRY 2,940,000 100.00 Barilla G. e R. Fratelli Società per Azioni - Socio Unico 100.00
Barilla Switzerland A.G.Zugerstrasse 76B - Baar (Switzerland) - Trade CHF 1,000,000 100.00 Barilla Netherlands B.V. 100.00
Barilla Sverige ABPO BOX 6722, 113 85 - Stockholm (Sweden)Production and trade
SEK 5,000,000 100.00 Barilla G. e R. Fratelli Società per Azioni - Socio Unico 100.00
Barilla Norge ASSandvikavegen 55 - Ottestad (Norway)Trade
NOK 1,952,000 100.00 Barilla Sverige AB 100.00
Barilla Danmark A/Sc/o J. Korsoe Jensen, Sankt Annae Plads 13, 3 sal, 1250 - Copenaghen (Denmark) - Trade
DKK 500,000 100.00 Barilla Sverige AB 100.00
Barilla Poland Sp. Z.o.o.Ul. Poleczki, 23 - Warsaw (Poland) - Trade PLN 14,050,000 100.00 Barilla Sverige AB 100.00
Barilla Deutschland GmbHGustav-Heinemann-Ufer 72 c - Cologne (Germany)Production and trade
EURO 51,100 100.00 Barilla Sverige AB 100.00
Barilla Australia PTY Ltdc\o Norton Rose Australia, Level 16, 225 George Street - Sydney (Australia) - Trade
AUD 30,050,000 100.00 Barilla G. e R. Fratelli Società per Azioni - Socio Unico 100.00
Barilla Netherlands B.V.Orteliuslaan 1000 - Utrecht (The Netherlands)Trade
EURO 18,000 100.00 Barilla G. e R. Fratelli Società per Azioni - Socio Unico 100.00
Barilla Adriatik d.o.o.Tržaška cesta, 315 - Ljubljana (Slovenia)Trade
EURO 50,000 100.00 Barilla G. e R. Fratelli Società per Azioni - Socio Unico 100.00
Barilla Hrvatska d.o.o.Radnička cesta 39 - Zagreb (Croatia) Trade
HRK 75,200 100.00 Barilla G. e R. Fratelli Società per Azioni - Socio Unico 100.00
Barilla America N.Y. Inc.Livington County - New York NY (USA)Production and trade
USD 1,000 100.00 Barilla G. e R. Fratelli Società per Azioni - Socio Unico 100.00
Barilla Rus LLCButyrskij Tupik 1 Solnečnogorsk - Moscow (Russia)Production and trade
RUB 500,000,000 100.00 Barilla G. e R. Fratelli Società per Azioni - Socio Unico 100.00
Barilla France S.A.S.30 Cours de l’île Seguin - Boulogne Billancourt (France)Production, financial and trade
EURO 126,683,296 100.00 Barilla G. e R. Fratelli Società per Azioni - Socio Unico 100.00
Harry’s Restauration S.A.S.72 Route de Chauny - Gauchy (France)Production and trade
EURO 153,000 100.00 Barilla France S.A.S. 100.00
Barilla Belgium S.A.166 Chaussée de la Hulpe - Bruxelles (Belgium)Trade
EURO 693,882 100.00Barilla Netherlands B.V. 71.20
Barilla France S.A.S. 28.80

85
Appendix 2.
List of investments in associated and other companies
Company, headquarter and activity Currency Share Capital(nominal values)
% Group ownership Through %
BRW S.p.A.Via Savona 16 - Milan (Italy)Advertising
EURO 5,440,085 33.620 Barilla G. e R. Fratelli Società per Azioni - Socio Unico 33.620
Fiere di Parma S.p.A.Via delle Esposizioni 393A, Baganzola - Parma (Italy)Fair activities
EURO 25,401,010 0.2814 Barilla G. e R. Fratelli Società per Azioni - Socio Unico 0.2814
CE.P.I.M. - Centro Padano Interscambio Merci S.p.A.Piazza Europa 1, Fontevivo - Parma (Italy)Warehousing
EURO 6,642,928 0.380 Barilla G. e R. Fratelli Società per Azioni - Socio Unico 0.380
Immobiliare Caprazucca S.p.A.Strada al Ponte Caprazucca 6 - Parma (Italy)Real estate trade
EURO 7,517,948 0.00003 Barilla G. e R. Fratelli Società per Azioni - Socio Unico 0.00003
SI.GRA.D. Scrl in liquidazionePiazza Annibaliano 18 - Rome (Italy)Agri-food research
EURO 40,000 2.600 Barilla G. e R. Fratelli Società per Azioni - Socio Unico 2.600
SOGEAP - Aeroporto di ParmaSocietà per la gestione S.p.A.Via Ferretti Licinio 50/A - Parma (Italy)Other airport-related activities
EURO 30,835,220 1.230 Barilla G. e R. Fratelli Società per Azioni - Socio Unico 1.230
Pallino Pastaria Company1207 208th Avenue S.E. - Sammamish WA (USA)Production and trade
USD 501,500 11.060 Barilla America Inc. 11.060
Italia del Gusto - Consorzio ExportLa gastronomia di marcaVia delle Esposizioni 393A, Baganzola - Parma (Italy)Trade
EURO 87,500 2.860 Barilla G. e R. Fratelli Società per Azioni - Socio Unico 2.860
COMIECOVia Litta Pompeo 5 - Milan (Italy) - Other EURO 1,291,000 0.0012 Barilla G. e R. Fratelli Società
per Azioni - Socio Unico 0.0012
CO.NA.I.Via Tomacelli 132 - Rome (Italy) - Other EURO 11,032,798 0.110 Barilla G. e R. Fratelli Società
per Azioni - Socio Unico 0.110
FASTIGHETSAKTIEBOLAGET TAREDOMPumpgatan 5 - Karlstad (Sweden) - Other SEK 796,700 0.200 Barilla Sverige AB 0.200
STOREBRAND ABA Professor Kohts vei 9 - Lysaker (Norway) - Other NOK 2,250,000,000 0.0003 Barilla Norge AS 0.0003
TÅGÅKERIET I BERGSLAGEN AB Kristinehamn (Sweden) - Other SEK 3,000,000 10.000 Barilla Sverige AB 10.000

86
Appendix 3.
Currency rates of exchange
Currency Average 2017 Year end 12/31/2017
AUD Australian Dollar 1.473 1.535
AED Arab Emirates Dirham 4.148 4.404
BRL Brazilian Real 3.605 3.973
CAD Canadian Dollar 1.465 1.504
CHF Swiss Franc 1.112 1.170
CNY Chinese Yuan 7.629 7.804
DKK Danish Krone 7.439 7.445
HRK Croatian Kuna 7.464 7.440
JPY Japanese Yen 126.711 135.010
MXN Mexican Pesos 21.329 23.661
NOK Norwegian Krone 9.327 9.840
PLN Polish Zloty 4.257 4.177
RUB Russian Ruble 65.938 69.392
SEK Swedish Krone 9.635 9.844
TRY Turkish Lira 4.121 4.546
USD United States Dollar 1.130 1.199
The main foreign exchange rates used to translate the financial statements are set below:

87
Barilla presents and launches organic pasta for the Italian market: made from 100% carefully sourced, organically grown Italian durum wheat, it embodies all Barilla’s experience, care and quality.
April 2017

88
Report of Indipendent Auditors

89

90
Report of Indipendent Auditors
91

92
Barilla Iniziative S.p.A
Registered office and headquartersVia Mantova, 166 - 43122 Parma, Italy
Share capital: euro 101,000,000.00 fully paid-inParma Company Register, Tax IDand VAT no. 020407380340R.E.A Parma no. 235460
ContactsTel. +39 0521 2621Fax +39 0521 [email protected]@barilla.comwww.barillagroup.com @barillagroup
PhotoBarilla historical archive
Editing and layoutThe Brand Company (Parma - Italy)
Cover graphic designVisualmade (Milan - Italy)
PrintingGrafiche Step (Parma - Italy)
Corporate information and contacts