Embed Size (px)
Citation preview

CONTENTS
Page | 1
THE PERFORMANCE REPORT IS ISSUED IN TERMS OF SECTION 46 OF THE MUNICIPAL SYSTEMS ACT (NO. 32 OF 2000)
AND WILL BE INCLUDED AS CHAPTER 3 AND 4 OF THE ANNUAL REPORT OF THE MUNICIPALITY AS CONTEMPLATED
IN SECTION 121(3)( C ) OF THE MUNICIPAL FINANCE MANAGEMENT ACT (NO. 5 OF 2000)
LIST OF TABLES ................................................................................... 4
LIST OF FIGURES ................................................................................10
LIST OF GRAPHS ...............................................................................10
CHAPTER 1.....................................................................................11
COMPONENT A: MAYOR’S FOREWORD ..........................11
COMPONENT B: EXECUTIVE SUMMARY ...........................14
1.1 Municipal Manager’s overview ..................................... 14
1.2 Municipal overview ........................................................... 16
1.2.1 Vision and Mission .......................................... 16
1.3 Municipal functions, population and environmental
overview ............................................................................... 16
1.3.1 Population ......................................................... 16
1.3.2 Demographic Information ............................ 17
1.4 Financial health overview ............................................... 19
1.4.1 National Key Performance Indicators –
Municipal Financial Viability and
Management (Ratios) ..................................... 20
1.4.2 Operating Ratios ............................................. 20
1.5 Organisational Development Overview ..................... 20
1.5.1 Municipal Transformation and
Organisational Development Highlights ... 20
1.5.2 Municipal Transformation and
Organisational Development Challenges . 21
1.5.3 Training per department ....................................... 21
CHAPTER 2.....................................................................................22
COMPONENT A: POLITICAL AND ADMINISTRATIVE
GOVERNANCE ......................................................................22
2.1 Governance Structure ...................................................... 22
2.1.1 Political Governance Structure ................... 22
2.1.2 Administrative Governance Structure ...... 25
COMPONENT B: INTERGOVERNMENTAL
RELATIONS ............................................................................. 25
2.2 Intergovernmental Relations ......................................... 25
2.2.1 Intergovernmental Structures ..................... 25
2.2.2 Joint Projects and Functions with Sector
Departments .................................................... 26
COMPONENT C: PUBLIC ACCOUNTABILITY AND
PARTICIPATION.................................................................... 27
2.3 Public Meetings ................................................................. 27
2.4 Representative Forums ................................................... 27
2.4.1 Labour Forum .................................................. 27
2.4.2 IDP Forum ........................................................ 28
2.4.3 District and Local AIDS Council ................ 28
2.5 Shared Services ................................................................. 29
2.5.1 Planning ............................................................. 29
2.5.2 Spatial Planning ................................................ 29
2.5.3 Spatial Plan Land Use Management Act ... 29
2.5.4 Integrated Development Planning .............. 29
COMPONENT D: CORPORATE GOVERNANCE ............. 30
2.6 Risk Management ............................................................ 30
2.7 Anti-Corruption and Anti-Fraud ................................... 30
2.8 Audit Committee and Performance Audit Committee
............................................................................................... 30
2.9 Internal Auditing ............................................................... 31
2.9.1 Annual Audit Plan ........................................... 32
2.10 Auditor-General ................................................................. 32
2.11 By-Laws and Policies ........................................................ 32
CONTENTS
Page | 2
2.12 Communication ................................................................. 34
2.12.1 Communication Activities ............................ 35
2.12.2 Communication Unit: .................................... 35
2.12.3 Newsletters ...................................................... 35
2.12.4 Awareness Campaigns ................................... 35
2.13 Website ................................................................................ 35
CHAPTER 3.....................................................................................38
3.1 Overview of Performance within the Organisation 38
3.1.1 Legislative Requirements .............................. 39
3.1.2 Organisation Performance ........................... 39
3.1.3 The Performance System Followed For
2015/16 .............................................................. 39
3.2 Service Delivery Performance ....................................... 40
3.2.1 Strategic Service Delivery Budget
Implementation Plan (Top Layer) ............... 40
3.2.2 Service Providers Strategic Performance . 58
3.3 Municipal Functions ......................................................... 58
3.3.1 Analysis of Functions ...................................... 58
3.4 Component A: Roads and Housing ............................. 60
3.4.1 Roads .................................................................. 60
3.4.2 Housing .............................................................. 60
3.5 Component B: Planning and Local Economic
Development (LED) ......................................................... 62
3.5.1 Planning .............................................................. 62
3.5.2 Local Economic Development (LED) ........ 63
3.6 Component C: Health ..................................................... 65
3.6.1 Municipal Health .............................................. 65
3.7 Component D: Safety and Security............................. 68
3.7.1 Disaster Management .................................... 68
3.8 Component E: Corporate Policy Offices And Other
Services ................................................................................ 70
3.8.1. Executive and Council ................................... 70
3.8.2 Financial Services ............................................ 71
3.8.3 Human Resource Services ........................... 72
3.8.4 Procurement Services ........................................... 72
3.8.5 Internal Audit ................................................... 74
3.9 Component F: Organisational Performance Scorecard
75
3.9.1 Development and Service Delivery
Priorities for 2016/17 .................................... 75
CHAPTER 4 .................................................................................... 81
4. ORGANISATIONAL DEVELOPMENT
PERFORMANCE ..................................................................... 81
4.1 Introduction to the Municipal Workforce ................ 81
4.1.1 Employment Equity ........................................ 81
4.2 Managing the Municipal Workforce ......................... 84
4.2.1 Injuries ....................................................................... 84
4.2.2 Sick Leave ......................................................... 85
4.2.3 HR Policies and Plans .................................... 85
4.3 Capacitating the Municipal Workforce..................... 86
4.3.1 Skills Matrix ...................................................... 86
4.3.2. Skills Development – Training provided .. 86
4.3.3 Skills Development - Budget allocation .... 87
4.3.4 MFMA Competencies .................................... 87
4.4 The Municipal Workforce Expenditure .................... 88
4.4.1 Personnel Expenditure .................................. 88
CHAPTER 5 .................................................................................... 90
COMPONENT A: STATEMENTS OF FINANCIAL
PERFORMANCE ..................................................................... 90
5.1 Financial Summary .......................................................... 90
5.1.1 Revenue Collection by Vote ....................... 91
5.1.2 Revenue Collection by Source ................... 92
5.1.3 Operational Services Performance ............ 92
CONTENTS
Page | 3
5.2 Grants ................................................................................... 93
5.2.1 Grant Performance ......................................... 93
5.3 Financial Ratio’s based on Key Performance
Indicators ......................................................................................... 94
5.3.1 Liquidity Ratio .................................................. 94
5.3.2 IDP Regulation Financial Viability
Indicators ........................................................... 94
5.3.3 Borrowing Management ................................ 94
5.3.4 Employee Costs ............................................... 94
5.3.5 Repairs and Maintenance .............................. 94
COMPONENT B: CASH FLOW MANAGEMENT AND
INVESTMENTS ........................................................................95
5.4 Cash Flow ............................................................................ 95
5.5 Borrowing and Investments .......................................... 96
5.5.1 Actual Borrowings ......................................... 96
5.7.2 Municipal Investments ................................... 96
COMPONENT C: OTHER FINANCIAL MATTERS ............ 96
5.6 Supply Chain Management .......................................... 96
5.7 GRAP Compliance ............................................................ 96
CHAPTER 6 .................................................................................... 97
COMPONENT A: AUDITOR-GENERAL OPINION 2015/16 ......... 97
6.1 Auditor-General Report 2015/16 ............................... 97
LIST OF ABBREVIATIONS ......................................................... 98
CONTENTS
Page | 4
LIST OF TABLES
OVERVIEW OF THE POPULATION WITHIN
THE DISTRICT AREA ................................. 17
POPULATION BY RACE ............................. 17
NATIONAL KPI’S FOR FINANCIAL
VIABILITY AND MANAGEMENT ............... 20
OPERATING RATIOS ................................ 20
MUNICIPAL TRANSFORMATION AND
ORGANISATIONAL DEVELOPMENT
HIGHLIGHTS .............................................. 20
MUNICIPAL TRANSFORMATION AND
ORGANISATIONAL DEVELOPMENT
CHALLENGES ............................................ 21
TRAINING PER DEPARTMENT .................. 21
COUNCILLORS ......................................... 23
COUNCIL MEETINGS ............................... 23
EXECUTIVE MAYORAL COMMITTEE ....... 23
FINANCIAL PORTFOLIO COMMITTEE ..... 24
ECONOMIC AND SOCIAL DEVELOPMENT
STANDING COMMITTEE .......................... 24
CORPORATE SERVICES STANDING
COMMITTEE .............................................. 24
RULES COMMITTEE .................................. 25
MUNICIPAL PUBLIC ACCOUNTS
COMMITTEE .............................................. 25
ADMINISTRATIVE GOVERNANCE
STRUCTURE ............................................... 25
INTERGOVERNMENTAL STRUCTURES .... 26
JOINT PROJECTS AND FUNCTIONS WITH
SECTION DEPARTMENTS ......................... 26
JOINT PROJECTS AND FUNCTIONS WITH
SECTION DEPARTMENTS .......................... 27
LABOUR FORUM ....................................... 28
IDP FORUM ............................................... 28
DISTRICT AND LOCAL AIDS COUNCIL 28
TABLE 1.: STRATEGIES ................................................ 30
MEMBERS OF THE AUDIT COMMITTEE ... 31
FUNCTIONS OF INTERNAL AUDIT .......... 32
POLICIES DEVELOPED ............................... 34
COMMUNICATION ACTIVITIES ................ 35
COMMUNICATION UNIT ......................... 35
NEWLETTERS DISTRIBUTED ..................... 35
AWARENESS CAMPAIGNS ........................ 35
WEBSITE CHECKLIST ................................ 37
TOP LAYER SDBIP – ALWAYS ENSURE
QUALITY ASSURANCE IN THE WORK AND
CONDUCT OF THE INTERNAL AUDITORS
AS REQUIRED BY THE STANDARD FOR THE
PROFESSIONAL PRACTICE OF INTERNAL
AUDITING. ................................................. 42
TOP LAYER SDBIP – AMELIORATE THE
STRAIN ON DM RESOURCES BY ENGAGING
THE POLITICAL LEADERSHIP OF THE LOCAL
MUNICIPALITIES IN THE NON-PAYMENT OF
SUBSCRIPTIONS TO DM IN AN EFFORT OF
ENSURING THAT THEY BUY INTO THE
PROCESS AND AT THE SAME TIME ENSURE
THAT THEY HOLD THE ADMINISTRATION
ACCOUNTABLE FOR THE SUBSCRIPTIONS
.................................................................... 42
TOP LAYER SDBIP – DISTRICT COUNCIL
TO REVIEW OF THE ORGANIZATIONAL
STRUCTURE AND RECRUIT COMPETENT
CANDIDATES IN CRITICAL POSITIONS .... 42
CONTENTS
Page | 5
TOP LAYER SDBIP – DISTRICT MUST
ENSURE THAT THE SECTION 79 AND 80
COMMITTEES ARE FUNCTIONAL AND THAT
ARE MONITORING MECHANISM IN PLACE.
................................................................... 43
TOP LAYER SDBIP – DISTRICT TO ENSURE
FULL COMPLIANCE WITH MUNICIPAL
SUPPLY CHAIN REGULATIONS AND
POLICY ...................................................... 43
TOP LAYER SDBIP – DISTRICT TO ENSURE
THAT IT SUBMIT GAMAP/GRAP
COMPLIANT FINANCIAL STATEMENTS. ... 43
TOP LAYER SDBIP – ENGAGE IN A
PROCESS OF BUSINESS DEVELOPMENT AND
OR GROWTH THAT WILL ENSURE THAT
THE SCM ISSUES ARE ABLE TO PROMOTE
AN EFFECTIVE BUSINESS ENVIRONMENT
AND AT THE SAME TIME INCREASE THE
BUSINESS CONFIDENCE IN THE AREA ..... 44
TOP LAYER SDBIP – ENGAGE THE OFFICE
OF THE AUDITOR GENERAL ON
EXCEPTIONS AND EXCLUSIONS IN ORDER
TO ADDRESS THE SHORTCOMINGS IN THE
SCM PROCESS AND REPORT TO COUNCIL
REGULARLY ON THE MEASURES PUT IN
PLACE AND AT THE SAME TIME ENSURE
THAT THE DM ACHIEVES A FAVOURABLE
AUDIT OUTCOME ..................................... 44
TOP LAYER SDBIP – ENSURE
PERFORMANCE MANAGEMENT SYSTEM IS
OPERATIONAL AND FULLY COMPLIANT 45
TOP LAYER SDBIP – ENSURE THAT
MUNICIPALITIES ADHERE TO THE SALGBC
ORGANIZATIONAL RIGHTS AGREEMENT
................................................................... 45
TOP LAYER SDBIP – ENSURE THAT THE
COMMUNITIES IN THE DISTRICT BECOME
SELF- SUSTAINABLE THROUGH THE ACTIVE
PROMOTION OF ECONOMIC LIVELIHOODS.
.................................................................... 46
TOP LAYER SDBIP – ENSURE THAT THE
DISTRICT MAINTAIN MUNICIPAL GOOD
GOVERNANCE ........................................... 46
TOP LAYER SDBIP – ENSURING ALL
MUNICIPALITIES WITHIN THE DISTRICT
DOES HAVE AN INDIGENT POLICY IN PLACE
AND ADOPTED BY COUNCIL ................... 47
TOP LAYER SDBIP – HUMAN RESOURCE
AND LEGAL SERVICES ................................ 47
TOP LAYER SDBIP – IMPLEMENTATION OF
THE MUNICIPAL HEALTH 2010
IMPLEMENTATION PLAN........................... 48
TOP LAYER SDBIP – IMPROVE THE
DISTRICT PLANNING CAPACITY IN AN
EFFORT TO ENSURE THAT DISTRICT
INFLUENCES THE LOCAL MUNICIPAL
BUDGETING PROCESS IN AN EFFORT TO
ENSURE UNIFORM RESULTS AND MINIMAL
COMPETITION FOR RESOURCES. .............. 48
TOP LAYER SDBIP – IMPROVE THE SMALL
BUSINESS SUPPORT STRATEGY TO
EMERGING BUSINESSES IN THE AREA FOR
IMPROVED SOCIAL COHESION ................. 49
TOP LAYER SDBIP – SUPPORT THE
DISTRICT AND LOCALS WITH INTERNAL
AUDIT FUNCTION IN ORDER TO IMPROVE
ON AUDIT OUTCOME. .............................. 49
TOP LAYER SDBIP – THAT THE DISTRICT
MUNICIPALITY ALIGN THEMSELVES TO
ASSIST LOCAL MUNICIPALITIES IN
PROFESSIONALLY IMPLEMENT PROJECTS IN
TERMS OF ALL THE GRANT PRESCRIPTIONS
.................................................................... 50
CONTENTS
Page | 6
TOP LAYER SDBIP – THE DISTRICT
MUNICIPALITY AS THE ACCREDITED
HOUSING AUTHORITY ASSIST THE LOCAL
MUNICIPALITIES TO PARTICIPATE IN THE
UPGRADING OF INFORMAL SETTLEMENT
EVEN IF NOT PART OF THE 45 PRIORITY
MUNICIPALITIES ......................................... 50
TOP LAYER SDBIP – THE DISTRICT
MUNICIPALITY SHOULD FACILITATE AND
ASSIST THE LOCAL MUNICIPALITIES IN
DEVELOPING A WARD COMMITTEE SYSTEM
THAT WILL ENSURE A PEOPLE-CENTERED
APPROACH TO GOVERNANCE AND
DEVELOPMENT IN EACH OF THE LOCAL
MUNICIPALITIES ......................................... 51
TOP LAYER SDBIP – THE DISTRICT
MUNICIPALITY SHOULD RE-STRUCTURE
THEIR POLICIES TO INCLUDE THE
OPPORTUNITY FOR LEARNER SHIPS TO
FORM PART OF THEIR OPERATIONS........ 51
TOP LAYER SDBIP – THE DISTRICT
MUNICIPALITY SHOULD THROUGH
VARIOUS INTERVENTIONS SUCH AS
INFRASTRUCTURE AND PRIVATE/BUSINESS
SECTOR PROJECTS CREATE JOBS. ............ 52
TOP LAYER SDBIP – THE DISTRICT
MUNICIPALITY TO ASSIST LOCAL
MUNICIPALITIES IN ENSURING WITH THE
IMPLEMENTATION OF AN INTEGRATED
CAPACITY BUILDING PLAN. ................... 52
TOP LAYER SDBIP – THE DISTRICT
MUNICIPALITY TO ENSURE THAT THE LED
STRATEGY ARE ALIGNED TO THE
NATIONAL AND PROVINCIAL LED
STRATEGY/FRAMEWORK ......................... 53
TOP LAYER SDBIP – THE DISTRICT MUST
ENSURE THAT THE INFRASTRUCTURE
DEVELOPMENT IN THE DIFFERENT LOCAL
MUNICIPALITIES IS PROPERLY FACILITATED
WITH LOCAL ROLE-PLAYERS AND AS A
HOUSING AGENT THAT LOCAL
MUNICIPALITIES IS MORE INVOLVED IN THE
PLANNING AND IMPLEMENTATION OF THE
PROJECTS AND PROGRAMMES ................. 53
TOP LAYER SDBIP – THE DISTRICT MUST
FACILITATE AND ASSIST LOCAL
MUNICIPALITIES IN SIMPLIFYING THEIR IDP
DOCUMENTS TO MAKE THE DOCUMENTS
MORE USER FRIENDLY ............................... 54
TOP LAYER SDBIP – THE DISTRICT
SHOULD ASSIST LOCAL MUNICIPALITIES IN
CAPACITATING AND TRAINING WARD
COMMITTEES .............................................. 54
TOP LAYER SDBIP – THE DISTRICT TO
ASSIST MUNICIPALITIES WITH THE
ESTABLISHMENT OF A MUNICIPAL
PLANNING TRIBUNAL AND ADOPTION OF
THE BY-LAWS AND THE SPATIAL PLANNING
AND LAND USE MANAGEMENT ACT
(SPLUMA) TO PROMOTE OTHERS
EQUITABLE AND EFFICIENT
DEVELOPMENT/PLANNING OF HUMAN
SETTLEMENTS. ............................................ 54
TOP LAYER SDBIP – TO CONSOLIDATE
GRANTS AND MAXIMISING EXPENDITURE
PATTERNS IN MUNICIPALITIES .................. 55
TOP LAYER SDBIP – TO EFFECTIVELY
ENGAGE IN THE PIGF AND OTHER
RELATED FORA IN ORDER TO ENSURE THAT
THERE ARE IMPROVED RELATIONS AND
BETTER COMPLIANCE ACROSS THE
VARIOUS SPHERES OF GOVERNMENT ...... 55
TOP LAYER SDBIP – TO ENSURE THAT
THE MUNICIPALITIES HAVE THE CAPABILITY
CONTENTS
Page | 7
TO RESPOND TO DISASTERS IN THE FUTURE
................................................................... 55
TOP LAYER SDBIP – TO HAVE A STRONG
DISTRICT MUNICIPALITY THAT SUPPORTS
LOCAL MUNICIPALITIES BY
COMMISSIONING A DETAILED STUDY OF
THE ROLE OF THE DISTRICT MUNICIPALITY
AND HOW IT CAN REMAIN RELEVANT ... 56
TOP LAYER SDBIP – TO IMPROVE THE
PLIGHT OF THE FARMERS AND IN
PARTICULAR EMERGING FARMERS BY
SUPPORTING THEM IN BEING A UNIFIED
STRUCTURE THROUGH COOPERATIVES
AND UNIONS. ........................................... 56
TOP LAYER SDBIP – TO IMPROVE THE
RELATIONS WITH OTHER POLITICAL
OFFICES BY DEVELOPING A PROGRAMME OF
ENGAGEMENT BETWEEN THE MAYOR AND
THE POLITICAL LEADERSHIP AT BOTH
NATIONAL AND PROVINCE IN ORDER TO
ENSURE THE TOTAL REALISATION OF
COUNCIL OBJECTIVES .............................. 56
TOP LAYER SDBIP – TO PROMOTE
INTEGRATED PLANNING AND
DEVELOPMENT IN ORDER TO ERADICATE
FRAGMENTED SERVICE DELIVERY BY
ENSURING THAT THE DISTRICT CREATES A
CENTRAL FORUM FOR PLANNERS (IDP,
LED ETC.) THAT WILL FOCUS ON ISSUES
BEYOND THE NORMAL BASKET OF SERVICE
OF WATER AND ELECTRICITY IN THE
DISTRICT. ................................................... 57
TOP LAYER SDBIP – TO STRENGTHEN THE
CAPACITY OF LOCAL MUNICIPALITIES TO
COMMUNICATE WITH THEIR
STAKEHOLDERS AND AS SUCH ENSURE THE
ERADICATION OF THE LACK OF
INFORMATION OF COMMUNITIES AND
ENSURE THAT THEY ARE INFORMED ABOUT
LOCAL GOVERNMENT IN GENERAL ......... 57
FUNCTIONAL AREAS ................................ 59
EMPLOYEES: ROADS .................................. 60
HOUSING HIGHLIGHTS ............................ 61
HOUSING CHALLENGES ........................... 61
HOUSES BUILT IN 2015/16 ...................... 61
EMPLOYEES HOUSING .............................. 62
EMPLOYEES: PLANNING............................ 63
LED HIGHLIGHTS ..................................... 64
CHALLENGES LED .................................... 64
LED OBJECTIVES AND STRATEGIES ........ 64
JOB CREATION THROUGH EPWP
PROJECTS .................................................... 65
MUNICIPAL HEALTH: HIGHLIGHTS ......... 66
MUNICIPAL HEALTH: CHALLENGES........ 67
SERVICE STATISTICS: MUNICIPAL HEALTH
.................................................................... 68
EMPLOYEES: MUNICIPAL HEALTH ........... 68
DISASTER MANAGEMENT HIGHLIGHTS .. 69
DISASTER MANAGEMENT ......................... 69
ACTIVITIES: DISASTER MANAGEMENT .... 69
EMPLOYEES: DISASTER MANAGEMENT ... 70
FINANCIAL SERVICES HIGHLIGHTS ......... 70
FINANCIAL SERVICES CHALLENGES ........ 70
EMPLOYEES: FIRE SERVICES ....................... 70
FINANCIAL SERVICES HIGHLIGHTS ......... 71
FINANCIAL SERVICES CHALLENGES ........ 71
EMPLOYEES: FINANCIAL SERVICES ........... 71
CONTENTS
Page | 8
EMPLOYEES: HUMAN RESOURCE SERVICES
................................................................... 72
PROCUREMENT SERVICES HIGHLIGHTS . 72
PROCUREMENT SERVICES CHALLENGES 73
SERVICE STATISTICS FOR SCM ............... 73
DETAILS OF DEVIATION FROM
PROCUREMENT SERVICES ........................ 73
INTERNAL AUDIT HIGHLIGHTS .............. 74
INTERNAL AUDIT CHALLENGES ............. 74
EMPLOYEES: INTERNAL AUDIT ................ 74
SERVICE DELIVERY PRIORITIES FOR
2016/17 – MANAGE AND IMPROVE THE
IMPLEMENTATION OF THE PERFORMANCE
MANAGEMENT SYSTEM ........................... 75
SERVICES DELIVERY PRIORITIES FOR
2016/17 - THE DISTRICT TO APPROVE THE
SERVICE DELIVERY BUDGET
IMPLEMENTATION PLAN (SDBIP) WITHIN
THE PRESCRIBED TIMEFRAME ................... 75
SERVICES DELIVERY PRIORITIES FOR
2016/17 - THE DISTRICT TO ASSIST LOCAL
MUNICIPALITIES WITH MIG PROJECT
IMPLEMENTATION IN ORDER TO ACHIEVE
100% EXPENDITURE WHERE PMU SERVICE
IS RENDERED ............................................. 75
SERVICES DELIVERY PRIORITIES FOR
2016/17 – THE DISTRICT TO ENSURE
ACCURATE AND PROFESSIONAL REPORTS
AS PRESCRIBED BY THE MFMA ARE
SUBMITTED MONTHLY (SECT 71,72 AND
SECT 46), AND ALSO IMPLEMENT THE
MFMA ....................................................... 76
SERVICES DELIVERY PRIORITIES FOR
2016/17 – THE DISTRICT TO ENSURE
COMPLIANCE IN TERMS OF MFMA
BUDGET SCHEDULE/TIMEFRAMES ........... 76
SERVICE DELIVERY PRIORITIES FOR
2016/17 – THE DISTRICT TO ENSURE
COORDINATION OF POLITICAL IGR AND
TECHNICAL IGR AS A LEGISLATION
REQUIREMENT ON GOVERNMENT .......... 76
SERVICE DELIVERY PRIORITIES FOR
2016/17 – THE DISTRICT TO ENSURE
FUNCTIONALITY OF FORUMS AND
ESTABLISH A FORMAL COOPERATION
BETWEEN COUNCIL AND
ORGANIZATIONS IN THIS SECTOR .......... 77
SERVICE DELIVERY PRIORITIES FOR
2016/17 – THE DISTRICT TO ENSURE
THAT THE MUNICIPALITY IMPROVE MEANS
OF COMMUNICATION, BOTH INTERNALLY
AND EXTERNALLY BY AN IMPROVED
COMMUNICATION STRATEGY, WHICH IS
BOTH EFFECTIVE AND SUSTAINABLE ....... 77
SERVICE DELIVERY PRIORITIES FOR
2016/17 – THE DISTRICT TO FACILITATE
AND ASSIST MUNICIPALITIES WITH
SIMPLIFYING AND REVIEWING THEIR IDP’S
.................................................................... 78
SERVICE DELIVERY PRIORITIES FOR
2016/17 – THE DISTRICT TO IMPLEMENT
EXTENSIVE PROGRAMME OF EPWP
DURING THE IMPLEMENTATION OF
INFRASTRUCTURE PROJECTS (DEPENDS ON
AVAILABILITY OF FUNDS, E.G. DORA
ALLOCATION) ........................................... 78
SERVICE DELIVERY PRIORITIES FOR
2016/17 – THE DISTRICT TO IMPLEMENT
THE LED STRATEGY ................................. 78
CONTENTS
Page | 9
SERVICE DELIVERY PRIORITIES FOR
2016/17 – THE DISTRICT TO IMPLEMENT
THE MUNICIPAL HEALTH SERVICES ........ 79
SERVICE DELIVERY PRIORITIES FOR
2016/17 – THE DISTRICT TO REVIEW AND
IMPLEMENT APPROVE INTERNAL AUDIT
CHARTER ON AN ANNUAL BASIS ........... 79
SERVICE DELIVERY PRIORITIES FOR
2016/17 – THE DISTRICT TO REVIEW THE
ORGANISATIONAL STRUCTURE, IDENTIFY
AND FILL ALL CRITICAL VACANT POSTS 79
SERVICE DELIVERY PRIORITIES FOR
2016/17 – OUTREACH PROGRAM TO
VULNERABLE GROUPS ............................. 80
SERVICE DELIVERY PRIORITIES FOR
2016/17 – THE DISTRICT TO
STRENGTHEN THE CAMPAIGN AGAINST
HIVAIDS, AND ENSURE BETTER
COORDINATION. ..................................... 80
SERVICE DELIVERY PRIORITIES FOR
2016/17 – THE DISTRICT TO SUBMIT
FINANCIAL STATEMENTS BY THE END OF
AUGUST AND SECTION 46 REPORT ...... 80
SERVICE DELIVERY PRIORITIES FOR
2016/17 – THE DISTRICT TO SUPPORT
LOCAL MUNICIPALITIES IN COMPILING AND
IMPLEMENTATION OF THEIR WORKPLACE
SKILLS PLANS (WSP) ............................... 80
2015/16 EE TARGETS/ACTUAL BY RACIAL
CLASSIFICATION ....................................... 81
2015/16 EE TARGETS/ACTUAL BY GENDER
CLASSIFICATION ....................................... 81
OCCUPATIONAL LEVELS ......................... 82
DEPARTMENT – RACE ............................. 82
VACANCY RATE PER POST AND
FUNCTIONAL LEVEL .................................. 83
CRITICAL VACANCIES PER SALARY LEVEL83
TURNOVER RATE ...................................... 84
INJURIES ...................................................... 84
SICK LEAVE DAYS ....................................... 85
HR POLICIES AND PLANS ......................... 85
SKILLS MATRIX .......................................... 86
SKILLS DEVELOPMENT .............................. 87
BUDGET ALLOCATED AND SPENT FOR
SKILLS DEVELOPMENT ............................... 87
BUDGET ALLOCATED AND SPENT FOR
SKILLS DEVELOPMENT ............................... 88
PERSONNEL EXPENDITURE ...................... 88
PERSONNEL EXPENDITURE ...................... 89
FINANCIAL PERFORMANCE 2015/16 ..... 91
PERFORMANCE AGAINST BUDGETS ....... 91
REVENUE BY VOTE .................................... 91
REVENUE COLLECTION BY SOURCE ....... 92
OPERATIONAL SERVICES PERFORMANCE
.................................................................... 93
GRANT PERFORMANCE FOR 2015/16 ... 93
LIQUIDITY FINANCIAL RATIO ................. 94
FINANCIAL VIABILITY NATIONAL KPAS 94
BORROWING MANAGEMENT .................. 94
EMPLOYEE COSTS ..................................... 94
REPAIRS AND MAINTENANCE ................. 94
CASH FLOW............................................... 95
ACTUAL BORROWINGS ........................... 96
MUNICIPAL INVESTMENTS ........................ 96
CONTENTS
Page | 10
AG REPORT 2015/16 .............................. 97
LIST OF FIGURES
FIGURE 1 SDBIP MEASUREMENT CATEGORIES ....................................................................................................................................... 40
FIGURE 2 FOOD HANDLERS (178) RECEIVING TRAINING AND ISSUED WITH TRAINING CERTIFICATES ........................................... 67
FIGURE 3 ENVIRONMENTAL HEALTH PRACTITIONERS CONDUCTING A CAMPAIGN, ON HAND WASHING TO SCHOOL KIDS .... 67
LIST OF GRAPHS
OVERALL STRATEGIC PERFORMANCE PER NATIONAL KPA ................................................................................................. 41

CHAPTER 1: MAYOR’S FOREWORD & EXECUTIVE SUMMARY
Page | 11
CHAPTER 1
COMPONENT A: MAYOR’S FOREWORD
The preamble to the Constitution of the Republic of
South Africa, 1996, states the following amongst a
number of issues, which must serve as the basis for
government’s interaction with the people of the country.
It states, “We therefore, through our freely elected
representatives, adopt this Constitution as the supreme
law of the Republic so as to lay the foundations for a
democratic and open society in which government is
based on the will of the people and every citizen is equally
protected by law,
Improve the quality of life of all citizens and free the
potential of each person…”
The abovementioned quotation from the RSA Constitution, 1996, provides a clear mandate for all public representatives in the
country to serve the people of the country, as well as to serve as the custodians of the interest of the people.
The publication of this annual report for 2015-2016, therefore serves as part of this mandate entrusted by the RSA Constitution,
1996.
The global economic crisis of 2008-2009 started to affect the developing world, including South Africa and the African continent,
more severely in 2015-2016. The quality of life, especially of the poor and unemployed, in the country was negatively affected with
the rise in prices of goods and commodities, to such an extent that many poor households had to be more innovative with their
decreased daily budgets. This situation had a more profound expression in the Pixley ka Seme district, which is a district
characterized by the triple challenges of poverty, unemployment and inequality. It must be the daily concern of all public
representatives serving in all 3 spheres of government to comprehensively respond to the social plight of the poor and vulnerable.
This year, 2016, will also see us going into the next local government elections campaign, as the term of the current local
government representatives will be coming to an end. South Africa has successfully demonstrated, since 1994, its ability to honour
its Constitutional mandate in relations to convening elections. The country always ensured that the will of the people is freely
expressed, in an atmosphere divorced of any intimidation and violence. South Africa is indeed a shining example of democracy,
both on the continent of Africa and in the world. We need to ensure that we maintain this proud record, and not to allow our
campaigning to derail the democratic project laid down in 1994. We need to ensure that the incoming councils inherit functional
municipal-administrations, which will ensure that service delivery is not negatively impacted upon. The outgoing municipal councils
must deliberately ensure that service delivery to our people is not linked to particular political parties being in power, but to
ensure that all people enjoy this constitutionally enshrined right.
CHAPTER 1: MAYOR’S FOREWORD & EXECUTIVE SUMMARY
Page | 12
Pixley ka Seme district has also experienced increased expansion of the solar projects, which served to provide temporary
employment to hundreds of unemployed people in the district. Pixley ka Seme district became famous globally as the district with
one of the biggest solar plants in the world, making it a world-leader in the provision of green energy. The challenge however is
to ensure that the entrepreneurs in the district benefit meaningfully out of the economic injection brought about by such
investments.
All district municipalities started to raise the dwindling role played by district municipalities in the Northern Cape, as compared
to their counter-parts in the rest of the country. It is a known fact that some district municipalities in other parts of the country
are water-services authorities, which ensure that they have a sustainable revenue stream that justifies their existence. This matter
was raised at all relevant platforms during 2015-2016 and hopefully it will receive the necessary attention going forward.
The 2015-2016 audit-outcomes by the Office of the Auditor General once again demonstrated that local government in general
in the district, and Pixley ka Seme District Municipality in particular, improved on the issues raised by the Auditor General in
previous audit periods. Pixley ka Seme District Municipality maintained its unqualified opinion with matters of emphasis. This audit
also saw a reduction in the number of issues raised by the Auditor General. The local municipalities also improved the general
audit opinion, with an increase in the number of qualified and unqualified audit opinions. This is a clear demonstration that the
levels of administrative and financial accountability have increased and that local communities can be assured that public funds are
being managed in a proper manner.
This financial year also experienced some movement on the SONA announcement made by President Zuma in 2015, on the role-
out of broadband in the district. We had visits by the Minister of Telecommunications to various government-sites in the district,
as a start to the process. We are hopeful that this process will be completed in 2016-2017, to serve as another example of
government bringing services closer to the people.
Statistics South Africa has also released their community survey in June 2016. This community survey had as its objective to
provide indicators that will inform the implementation, monitoring and evaluation of development programmes for communities
at local municipal level.
The community survey revealed amongst others, the following: Emthanjeni has the highest population numbers, with Renosterberg
the lowest. The general population numbers in the district increased to 195 595, the number of households in the district increased
to 56 309, the number of informal settlements decreased, the number of people with access to piped drinking water decreased,
whilst the number of people with access to improved sanitation improved, the number of people with access to electricity also
increased. There is also a slight decrease in the levels of poverty. The 5 leading challenges for sector departments and municipalities
in the district are lack of employment opportunities, inadequate housing, lack of safe and reliable water supply, inadequate roads
and inadequate sanitation services.
The information contained in the Statistics South Africa Community Survey for 2016 clearly indicated the achievements of the
government since 2011, but at the same time serves to inform government at large on the challenges and service delivery backlogs
still experienced by the people in the district. The information will be used by all sector departments and municipalities in the
district to ensure proper planning going forward.

CHAPTER 1: MAYOR’S FOREWORD & EXECUTIVE SUMMARY
Page | 13
Pixley ka Seme District Municipality, through its Council Meets the People campaign, visited a number of communities during the
2015-2016 financial year. These visits were welcomed by the people of the district, as it provided them with an opportunity to
raise issues directly with their local councilors, as well as with the Executive Mayor and Members of the Mayoral Committee.
These sessions proved fruitful, as the Executive Mayor and local councilors could successfully address some of the urgent service
delivery matters affecting the people.
I hereby acknowledge the role played by all internal stakeholders, eg Mayoral Committee, municipal manager and senior
management, general management, as well as all other staff members, in ensuring that Pixley ka Seme District Municipality achieved
its set targets for 2015-2016
Cllr MT Kibi
Executive Mayor
CHAPTER 1: MAYOR’S FOREWORD & EXECUTIVE SUMMARY
Page | 14
COMPONENT B: EXECUTIVE SUMMARY
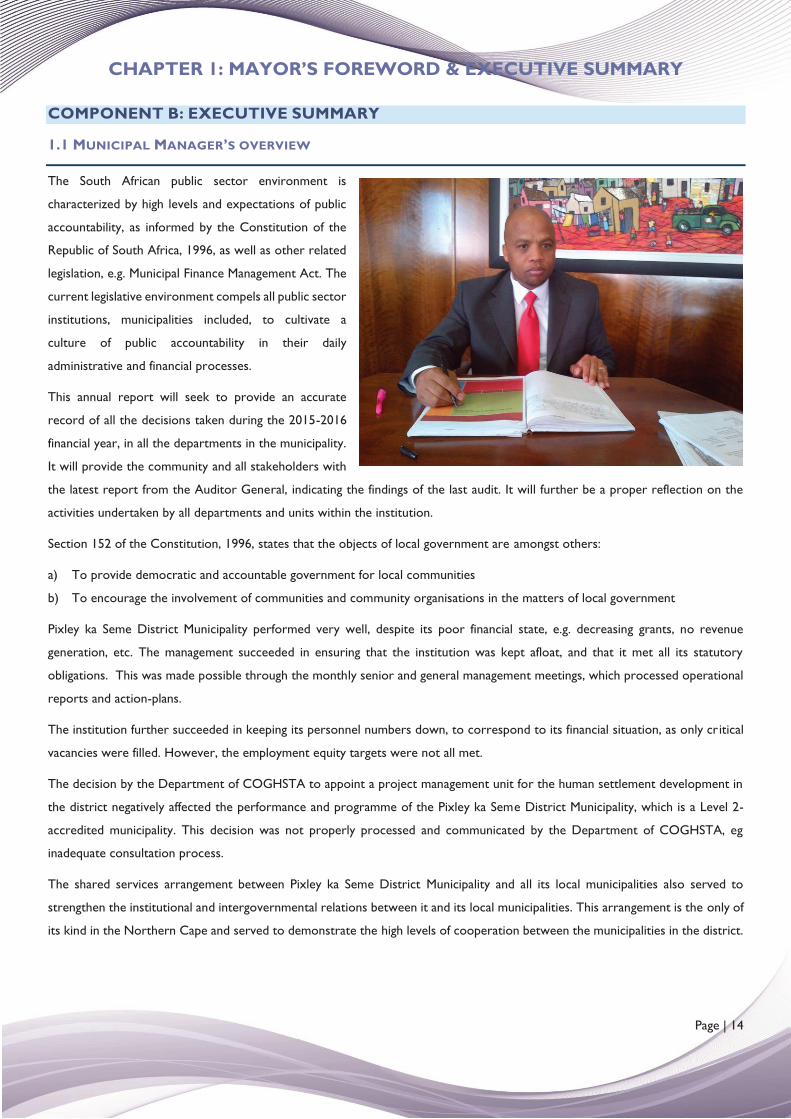
1.1 MUNICIPAL MANAGER’S OVERVIEW
The South African public sector environment is
characterized by high levels and expectations of public
accountability, as informed by the Constitution of the
Republic of South Africa, 1996, as well as other related
legislation, e.g. Municipal Finance Management Act. The
current legislative environment compels all public sector
institutions, municipalities included, to cultivate a
culture of public accountability in their daily
administrative and financial processes.
This annual report will seek to provide an accurate
record of all the decisions taken during the 2015-2016
financial year, in all the departments in the municipality.
It will provide the community and all stakeholders with
the latest report from the Auditor General, indicating the findings of the last audit. It will further be a proper reflection on the
activities undertaken by all departments and units within the institution.
Section 152 of the Constitution, 1996, states that the objects of local government are amongst others:
a) To provide democratic and accountable government for local communities
b) To encourage the involvement of communities and community organisations in the matters of local government
Pixley ka Seme District Municipality performed very well, despite its poor financial state, e.g. decreasing grants, no revenue
generation, etc. The management succeeded in ensuring that the institution was kept afloat, and that it met all its statutory
obligations. This was made possible through the monthly senior and general management meetings, which processed operational
reports and action-plans.
The institution further succeeded in keeping its personnel numbers down, to correspond to its financial situation, as only critical
vacancies were filled. However, the employment equity targets were not all met.
The decision by the Department of COGHSTA to appoint a project management unit for the human settlement development in
the district negatively affected the performance and programme of the Pixley ka Seme District Municipality, which is a Level 2-
accredited municipality. This decision was not properly processed and communicated by the Department of COGHSTA, eg
inadequate consultation process.
The shared services arrangement between Pixley ka Seme District Municipality and all its local municipalities also served to
strengthen the institutional and intergovernmental relations between it and its local municipalities. This arrangement is the only of
its kind in the Northern Cape and served to demonstrate the high levels of cooperation between the municipalities in the district.

CHAPTER 1: MAYOR’S FOREWORD & EXECUTIVE SUMMARY
Page | 15
The annual report will reflect upon the following matters:
Executive Mayor’s Foreword
Executive Summary by Municipal Manager
Political and Administrative Governance
Intergovernmental Relations
Public Accountability and participation
Corporate Governance
Organisational Development
Statements of financial performance
Cash flow management and investments
Other financial matters
Auditor General Opinion (2015-2016)
Mr RE Pieterse
Municipal Manager
CHAPTER 1: MAYOR’S FOREWORD & EXECUTIVE SUMMARY
Page | 16
1.2 MUNICIPAL OVERVIEW
This report addresses the performance of the Pixley Ka Seme District Municipality (DM) in the Northern Cape in respect of its
core legislative obligations. Local government must create the participatory framework that defines and enhances the relationship
between elected leaders and their communities. This requires that the Council of the municipality provides regular and predictable
reporting on programme performance and the general state of affairs in their locality.
The 2015/16 Annual Report reflects on the performance of the Municipality for the period 1 July 2015 to 30 June 2016. The Annual
Report is prepared in terms of Section 121(1) of the Municipal Finance Management Act (MFMA), in terms of which the municipality
must prepare an annual report for each financial year.
1.2.1 Vision and Mission
The Municipality committed itself to the vision and mission of:
“Pixley ka Seme DM, PIONEERS of DEVELOPMENT, a HOME and FUTURE for all.”
The Pixley Ka Seme DM will achieve its vision by:
using the integrated development planning process to create a home for all in our towns, villages and
rural areas;
promoting economic growth that is shared across and within communities;
local economic growth and development, job creation and poverty alleviation;
providing political and administrative leadership in the development planning process;
ensuring that we get the sustainable delivery of basic services right;
mainstream integrated planning in the operations of our municipalities;
focusing on integrated planning as a means if building stronger communities and building bridges
between communities.
1.3 MUNICIPAL FUNCTIONS, POPULATION AND ENVIRONMENTAL OVERVIEW
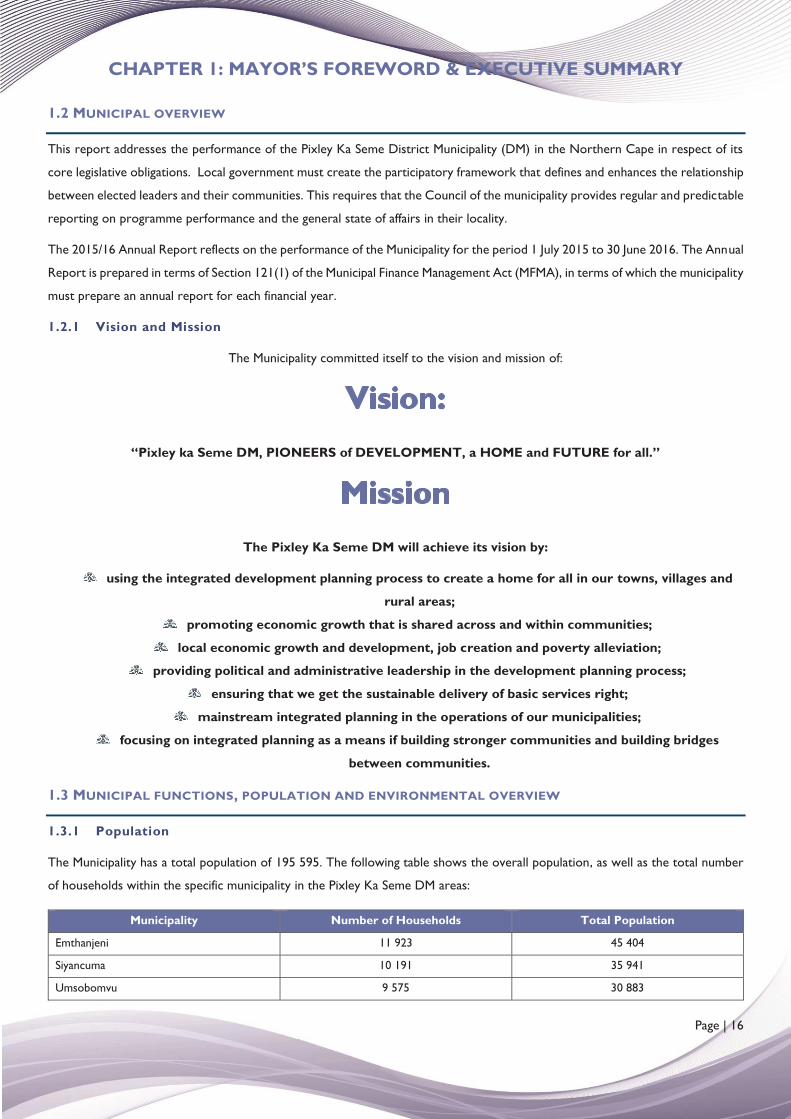
1.3.1 Population
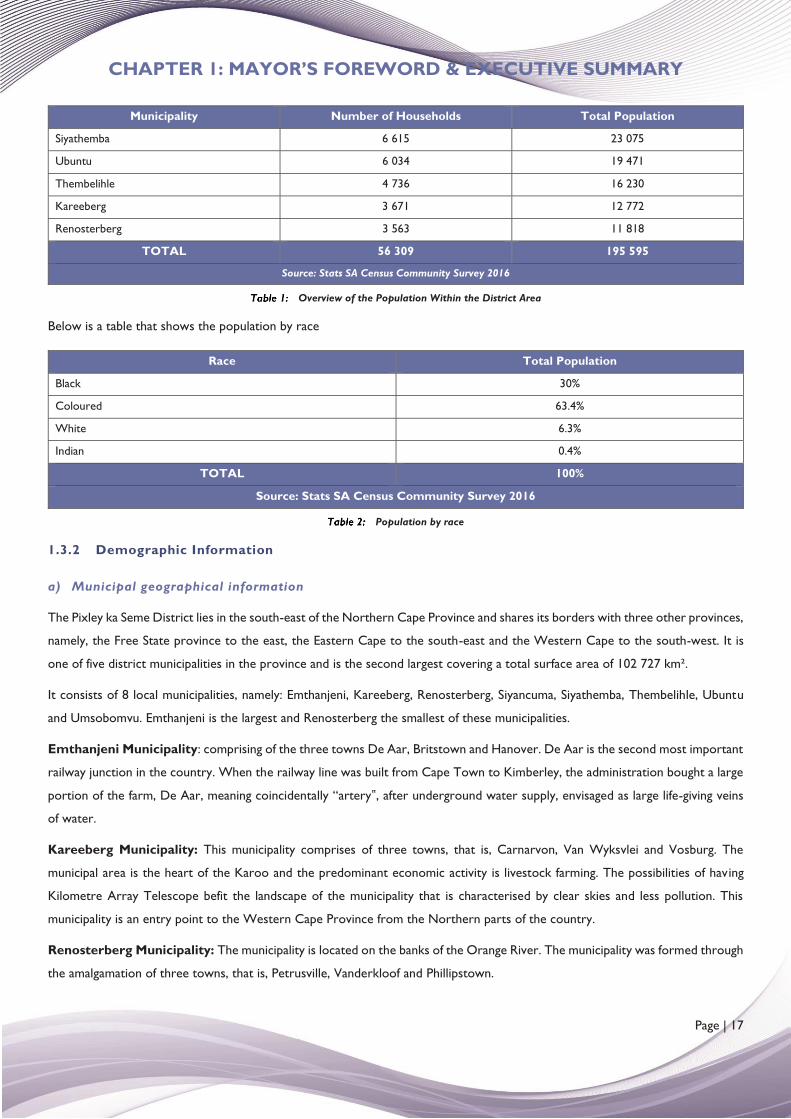
The Municipality has a total population of 195 595. The following table shows the overall population, as well as the total number
of households within the specific municipality in the Pixley Ka Seme DM areas:
Municipality Number of Households Total Population
Emthanjeni 11 923 45 404
Siyancuma 10 191 35 941
Umsobomvu 9 575 30 883
CHAPTER 1: MAYOR’S FOREWORD & EXECUTIVE SUMMARY
Page | 17
Municipality Number of Households Total Population
Siyathemba 6 615 23 075
Ubuntu 6 034 19 471
Thembelihle 4 736 16 230
Kareeberg 3 671 12 772
Renosterberg 3 563 11 818
TOTAL 56 309 195 595
Source: Stats SA Census Community Survey 2016
Overview of the Population Within the District Area
Below is a table that shows the population by race
Race Total Population
Black 30%
Coloured 63.4%
White 6.3%
Indian 0.4%
TOTAL 100%
Source: Stats SA Census Community Survey 2016
Population by race
1.3.2 Demographic Information
a) Municipal geographical information
The Pixley ka Seme District lies in the south-east of the Northern Cape Province and shares its borders with three other provinces,
namely, the Free State province to the east, the Eastern Cape to the south-east and the Western Cape to the south-west. It is
one of five district municipalities in the province and is the second largest covering a total surface area of 102 727 km².
It consists of 8 local municipalities, namely: Emthanjeni, Kareeberg, Renosterberg, Siyancuma, Siyathemba, Thembelihle, Ubuntu
and Umsobomvu. Emthanjeni is the largest and Renosterberg the smallest of these municipalities.
Emthanjeni Municipality: comprising of the three towns De Aar, Britstown and Hanover. De Aar is the second most important
railway junction in the country. When the railway line was built from Cape Town to Kimberley, the administration bought a large
portion of the farm, De Aar, meaning coincidentally “artery‟, after underground water supply, envisaged as large life-giving veins
of water.
Kareeberg Municipality: This municipality comprises of three towns, that is, Carnarvon, Van Wyksvlei and Vosburg. The
municipal area is the heart of the Karoo and the predominant economic activity is livestock farming. The possibilities of having
Kilometre Array Telescope befit the landscape of the municipality that is characterised by clear skies and less pollution. This
municipality is an entry point to the Western Cape Province from the Northern parts of the country.
Renosterberg Municipality: The municipality is located on the banks of the Orange River. The municipality was formed through
the amalgamation of three towns, that is, Petrusville, Vanderkloof and Phillipstown.
CHAPTER 1: MAYOR’S FOREWORD & EXECUTIVE SUMMARY
Page | 18
The municipality covers approximately 553 000 ha of land and forms about 5% of the total area of the district.
Siyancuma Municipality: This municipality hosts the confluence of the Vaal and the Orange River. It comprises in the main of
three towns, that is, Campbell, Douglas and Griekwastad and has densely populated rural settlement called Smitchdrift. The
municipal area is richly endowed with precious and semi-precious stones, that is, diamonds and tiger’s eye. Beneficiation of tiger’s
eye is on the high impact project identified in the District Growth and Development Strategy. The municipality has a great tourism
potential.
Siyathemba Municipality: This municipality is located on the banks of the Orange River and boosts with massive and high scale
irrigation farming, the river not only adds agricultural value to the municipality but also boosts massive tourism and economic
potential. The municipality comprises of three towns, that is, Marydale, Prieska and Niekerkshoop. The municipality has massive
potential for mining activities of both precious and semi-precious stones. The municipality also has the Alkantpan testing area
where international and national ammunition testing is done.
Thembelihle Municipality: This municipality is also located on the banks of the Orange River. The municipality was formed
through the amalgamation of three towns, that is, Hopetown, Strydenburg and Orania. The outcome of the dispute regarding
Orania has not yet been decided upon and the uncertainty still exists as to where Orania is demarcated. N12 cuts through this
municipal area and is a major boost to the economies of Hopetown and Strydenburg.
Ubuntu Municipality: The municipality comprises of three towns that is Victoria West, Loxton and Richmond. The N12 and
N1 pass through this municipality and have a great tourism potential. The preliminary study in the district’s Mining Strategy
highlights that the municipality is endowed with uranium deposits.
Umsobomvu Municipality: This municipality comprises of three towns, that is, Colesberg, Norvalspond and Noupoort. N1
and N9 traverse trough the municipality. It shares borders with other municipalities in the Eastern Cape and Free State Provinces.
In the district this municipality is among the municipalities that hold massive tourism potential.
The composition of the population plays a cardinal role in the development of any geographical area. Population growth and trends
affects the economic, social and physical development within an area through the provision of and demand for services and goods
CHAPTER 1: MAYOR’S FOREWORD & EXECUTIVE SUMMARY
Page | 19
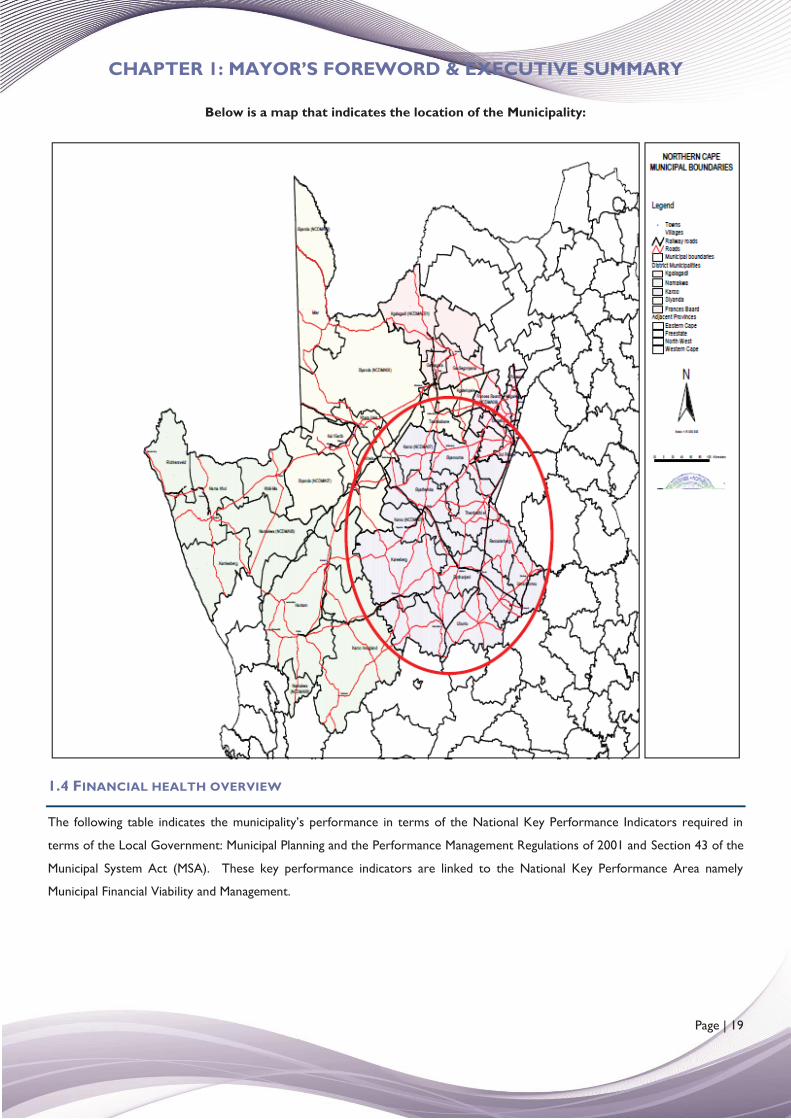
Below is a map that indicates the location of the Municipality:
1.4 FINANCIAL HEALTH OVERVIEW
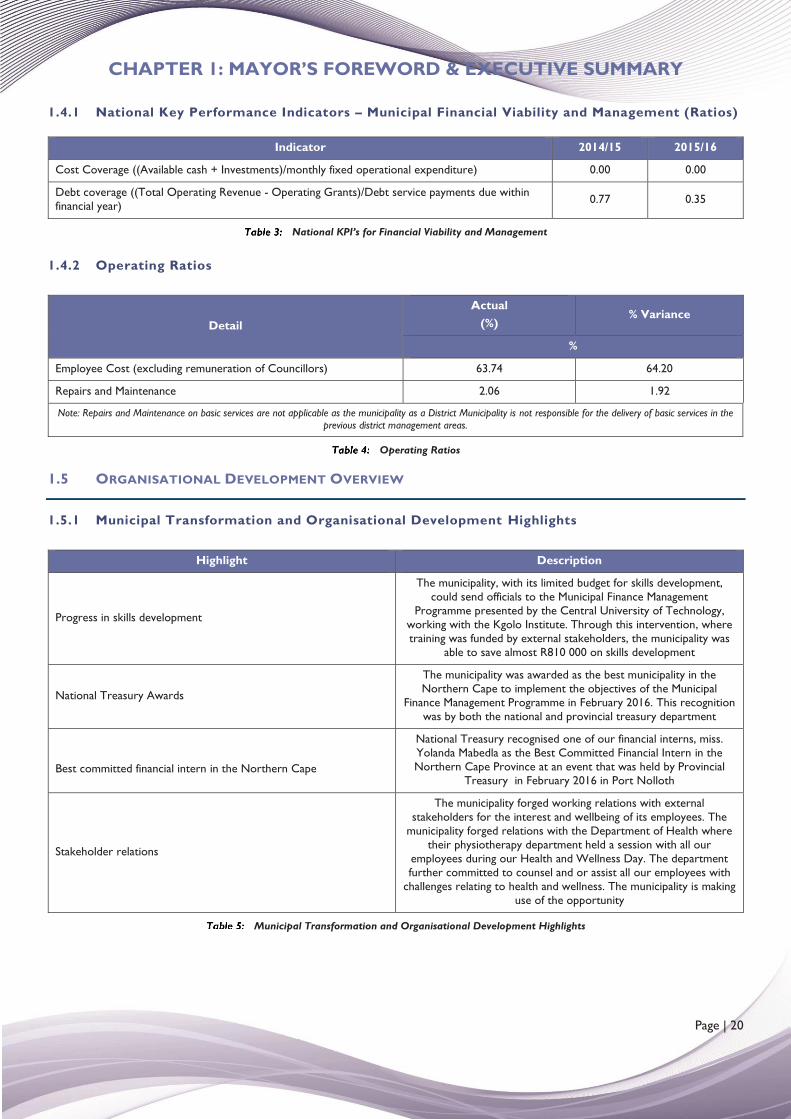
The following table indicates the municipality’s performance in terms of the National Key Performance Indicators required in
terms of the Local Government: Municipal Planning and the Performance Management Regulations of 2001 and Section 43 of the
Municipal System Act (MSA). These key performance indicators are linked to the National Key Performance Area namely
Municipal Financial Viability and Management.
CHAPTER 1: MAYOR’S FOREWORD & EXECUTIVE SUMMARY
Page | 20
1.4.1 National Key Performance Indicators – Municipal Financial Viability and Management (Ratios)
Indicator 2014/15 2015/16
Cost Coverage ((Available cash + Investments)/monthly fixed operational expenditure) 0.00 0.00
Debt coverage ((Total Operating Revenue - Operating Grants)/Debt service payments due within financial year) 0.77 0.35
National KPI’s for Financial Viability and Management
1.4.2 Operating Ratios
Detail
Actual (%)
% Variance
%
Employee Cost (excluding remuneration of Councillors) 63.74 64.20
Repairs and Maintenance 2.06 1.92
Note: Repairs and Maintenance on basic services are not applicable as the municipality as a District Municipality is not responsible for the delivery of basic services in the previous district management areas.
Operating Ratios
1.5 ORGANISATIONAL DEVELOPMENT OVERVIEW
1.5.1 Municipal Transformation and Organisational Development Highlights
Highlight Description
Progress in skills development
The municipality, with its limited budget for skills development, could send officials to the Municipal Finance Management
Programme presented by the Central University of Technology, working with the Kgolo Institute. Through this intervention, where training was funded by external stakeholders, the municipality was
able to save almost R810 000 on skills development
National Treasury Awards
The municipality was awarded as the best municipality in the Northern Cape to implement the objectives of the Municipal
Finance Management Programme in February 2016. This recognition was by both the national and provincial treasury department
Best committed financial intern in the Northern Cape
National Treasury recognised one of our financial interns, miss. Yolanda Mabedla as the Best Committed Financial Intern in the Northern Cape Province at an event that was held by Provincial
Treasury in February 2016 in Port Nolloth
Stakeholder relations
The municipality forged working relations with external stakeholders for the interest and wellbeing of its employees. The
municipality forged relations with the Department of Health where their physiotherapy department held a session with all our
employees during our Health and Wellness Day. The department further committed to counsel and or assist all our employees with
challenges relating to health and wellness. The municipality is making use of the opportunity
Municipal Transformation and Organisational Development Highlights
CHAPTER 1: MAYOR’S FOREWORD & EXECUTIVE SUMMARY
Page | 21
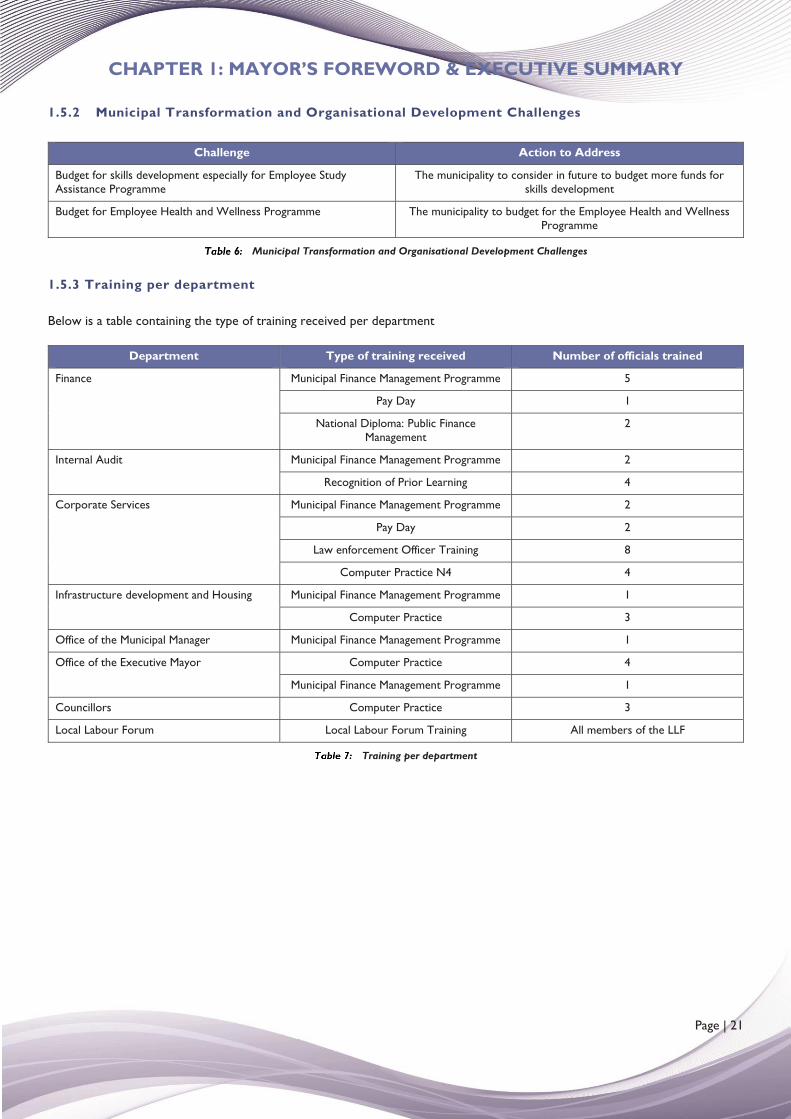
1.5.2 Municipal Transformation and Organisational Development Challenges
Challenge Action to Address
Budget for skills development especially for Employee Study Assistance Programme
The municipality to consider in future to budget more funds for skills development
Budget for Employee Health and Wellness Programme The municipality to budget for the Employee Health and Wellness Programme
Municipal Transformation and Organisational Development Challenges
1.5.3 Training per department
Below is a table containing the type of training received per department
Department Type of training received Number of officials trained
Finance Municipal Finance Management Programme 5
Pay Day 1
National Diploma: Public Finance Management
2
Internal Audit Municipal Finance Management Programme 2
Recognition of Prior Learning 4
Corporate Services Municipal Finance Management Programme 2
Pay Day 2
Law enforcement Officer Training 8
Computer Practice N4 4
Infrastructure development and Housing Municipal Finance Management Programme 1
Computer Practice 3
Office of the Municipal Manager Municipal Finance Management Programme 1
Office of the Executive Mayor Computer Practice 4
Municipal Finance Management Programme 1
Councillors Computer Practice 3
Local Labour Forum Local Labour Forum Training All members of the LLF
Training per department
CHAPTER 2: GOVERNANCE
Page | 22
CHAPTER 2
COMPONENT A: POLITICAL AND ADMINISTRATIVE GOVERNANCE
Good governance has 8 major characteristics. It is participatory, consensus oriented, accountable, transparent, responsive,
effective and efficient, equitable and inclusive and follows the rule of law. It assures that corruption is minimized, the views of
minorities are taken into account and that the voices of the most vulnerable in society are heard in decision-making. It is also
responsive to the present and future needs of society.
2.1 GOVERNANCE STRUCTURE
2.1.1 Political Governance Structure
The Council performs both legislative and executive functions. They focus on legislative, oversight and participatory roles, and
have delegated its executive function to the Executive Mayor and the Mayoral Committee. Their primary role is to debate issues
publicly and to facilitate political debate and discussion. Apart from their functions as decision makers, councillors are also actively
involved in community work and the various social programmes in the municipal area.
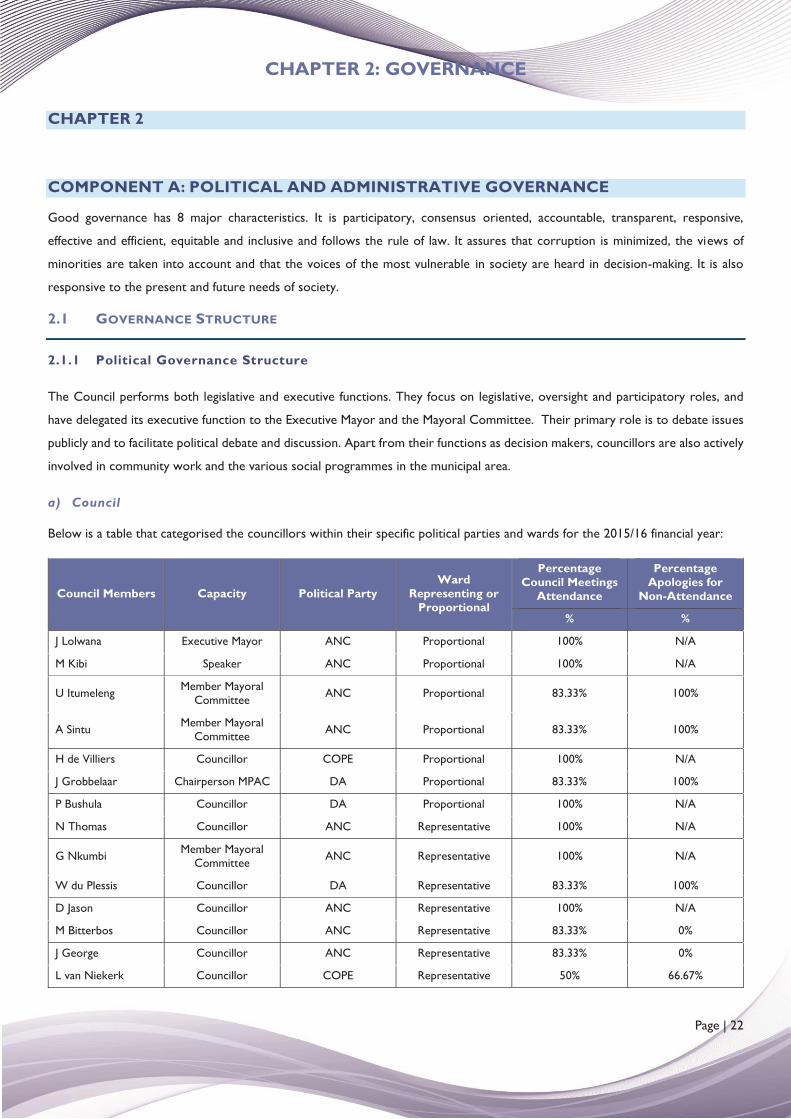
a) Council
Below is a table that categorised the councillors within their specific political parties and wards for the 2015/16 financial year:
Council Members Capacity Political Party Ward
Representing or Proportional
Percentage Council Meetings
Attendance
Percentage Apologies for
Non-Attendance
% %
J Lolwana Executive Mayor ANC Proportional 100% N/A
M Kibi Speaker ANC Proportional 100% N/A
U Itumeleng Member Mayoral Committee ANC Proportional 83.33% 100%
A Sintu Member Mayoral Committee ANC Proportional 83.33% 100%
H de Villiers Councillor COPE Proportional 100% N/A
J Grobbelaar Chairperson MPAC DA Proportional 83.33% 100%
P Bushula Councillor DA Proportional 100% N/A
N Thomas Councillor ANC Representative 100% N/A
G Nkumbi Member Mayoral Committee ANC Representative 100% N/A
W du Plessis Councillor DA Representative 83.33% 100%
D Jason Councillor ANC Representative 100% N/A
M Bitterbos Councillor ANC Representative 83.33% 0%
J George Councillor ANC Representative 83.33% 0%
L van Niekerk Councillor COPE Representative 50% 66.67%
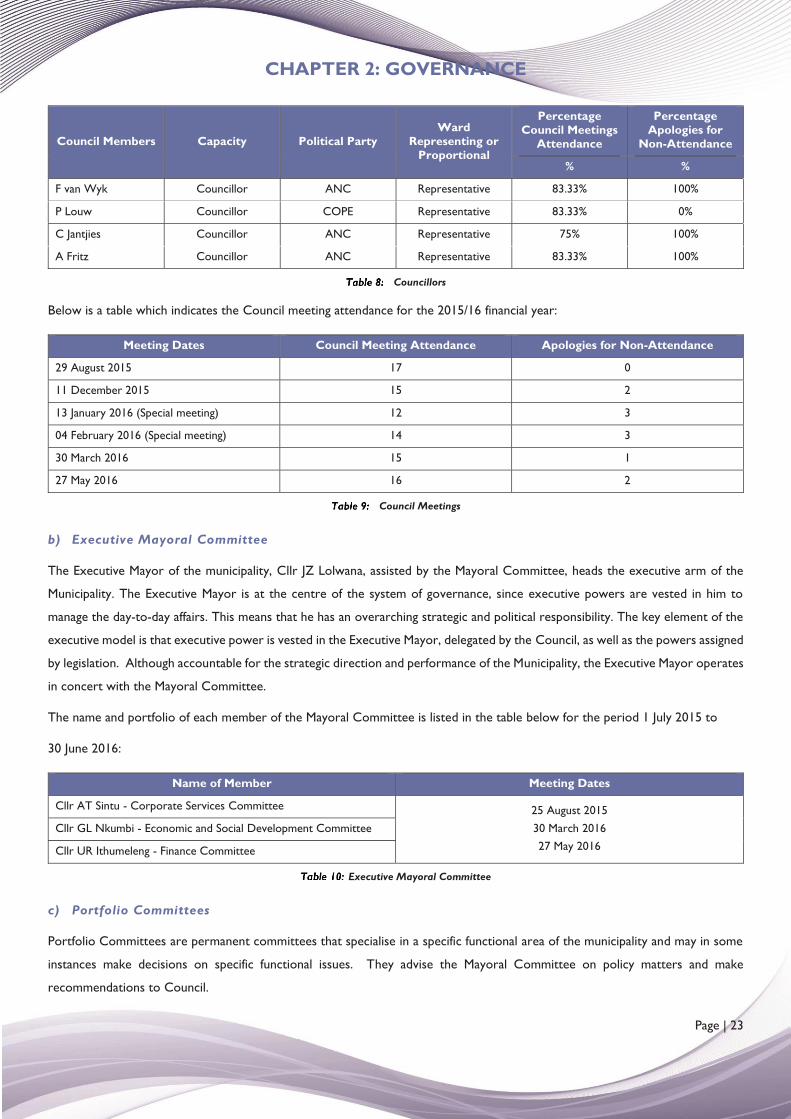
CHAPTER 2: GOVERNANCE
Page | 23
Council Members Capacity Political Party Ward
Representing or Proportional
Percentage Council Meetings
Attendance
Percentage Apologies for
Non-Attendance
% %
F van Wyk Councillor ANC Representative 83.33% 100%
P Louw Councillor COPE Representative 83.33% 0%
C Jantjies Councillor ANC Representative 75% 100%
A Fritz Councillor ANC Representative 83.33% 100%
Councillors
Below is a table which indicates the Council meeting attendance for the 2015/16 financial year:
Meeting Dates Council Meeting Attendance Apologies for Non-Attendance
29 August 2015 17 0
11 December 2015 15 2
13 January 2016 (Special meeting) 12 3
04 February 2016 (Special meeting) 14 3
30 March 2016 15 1
27 May 2016 16 2
Council Meetings
b) Executive Mayoral Committee
The Executive Mayor of the municipality, Cllr JZ Lolwana, assisted by the Mayoral Committee, heads the executive arm of the
Municipality. The Executive Mayor is at the centre of the system of governance, since executive powers are vested in him to
manage the day-to-day affairs. This means that he has an overarching strategic and political responsibility. The key element of the
executive model is that executive power is vested in the Executive Mayor, delegated by the Council, as well as the powers assigned
by legislation. Although accountable for the strategic direction and performance of the Municipality, the Executive Mayor operates
in concert with the Mayoral Committee.
The name and portfolio of each member of the Mayoral Committee is listed in the table below for the period 1 July 2015 to
30 June 2016:
Name of Member Meeting Dates
Cllr AT Sintu - Corporate Services Committee 25 August 2015 30 March 2016 27 May 2016
Cllr GL Nkumbi - Economic and Social Development Committee
Cllr UR Ithumeleng - Finance Committee
Executive Mayoral Committee
c) Portfolio Committees
Portfolio Committees are permanent committees that specialise in a specific functional area of the municipality and may in some
instances make decisions on specific functional issues. They advise the Mayoral Committee on policy matters and make
recommendations to Council.
CHAPTER 2: GOVERNANCE
Page | 24
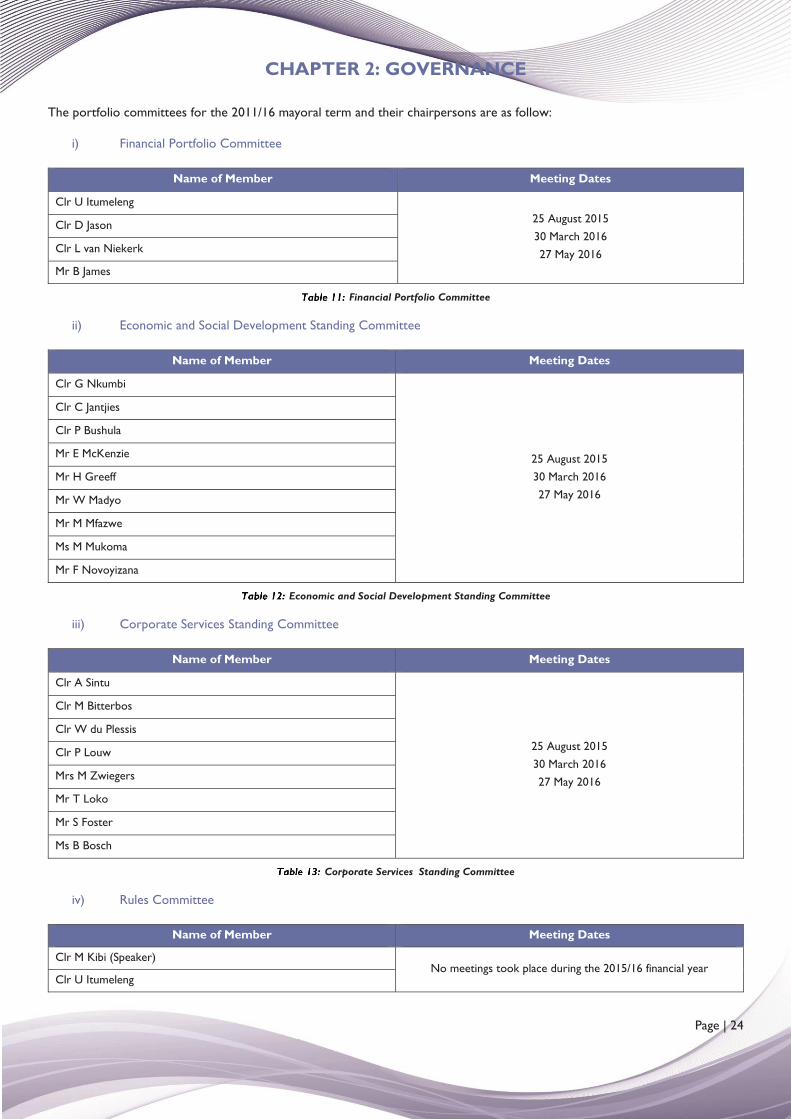
The portfolio committees for the 2011/16 mayoral term and their chairpersons are as follow:
i) Financial Portfolio Committee
Name of Member Meeting Dates
Clr U Itumeleng 25 August 2015 30 March 2016 27 May 2016
Clr D Jason
Clr L van Niekerk
Mr B James
Financial Portfolio Committee
ii) Economic and Social Development Standing Committee
Name of Member Meeting Dates
Clr G Nkumbi
25 August 2015 30 March 2016 27 May 2016
Clr C Jantjies
Clr P Bushula
Mr E McKenzie
Mr H Greeff
Mr W Madyo
Mr M Mfazwe
Ms M Mukoma
Mr F Novoyizana
Economic and Social Development Standing Committee
iii) Corporate Services Standing Committee
Name of Member Meeting Dates
Clr A Sintu
25 August 2015 30 March 2016 27 May 2016
Clr M Bitterbos
Clr W du Plessis
Clr P Louw
Mrs M Zwiegers
Mr T Loko
Mr S Foster
Ms B Bosch
Corporate Services Standing Committee
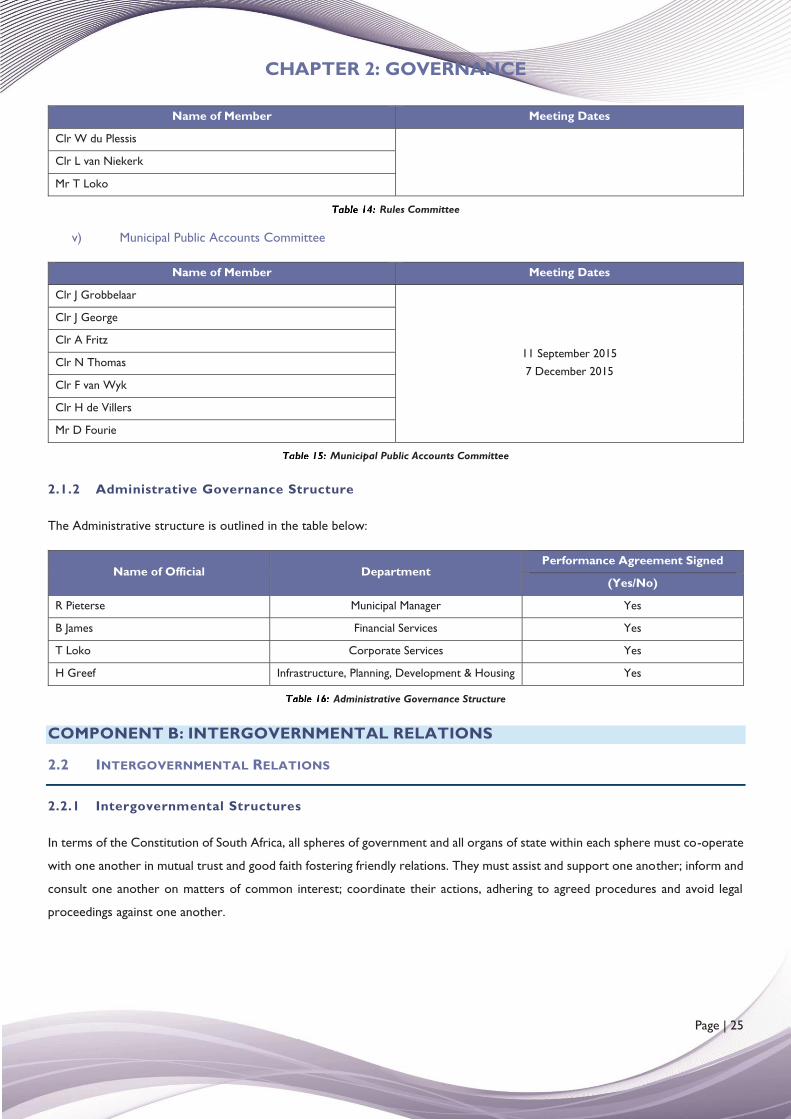
iv) Rules Committee
Name of Member Meeting Dates
Clr M Kibi (Speaker) No meetings took place during the 2015/16 financial year
Clr U Itumeleng
CHAPTER 2: GOVERNANCE
Page | 25
Name of Member Meeting Dates
Clr W du Plessis
Clr L van Niekerk
Mr T Loko
Rules Committee
v) Municipal Public Accounts Committee
Name of Member Meeting Dates
Clr J Grobbelaar
11 September 2015 7 December 2015
Clr J George
Clr A Fritz
Clr N Thomas
Clr F van Wyk
Clr H de Villers
Mr D Fourie
Municipal Public Accounts Committee
2.1.2 Administrative Governance Structure
The Administrative structure is outlined in the table below:
Name of Official Department Performance Agreement Signed
(Yes/No)
R Pieterse Municipal Manager Yes
B James Financial Services Yes
T Loko Corporate Services Yes
H Greef Infrastructure, Planning, Development & Housing Yes
Administrative Governance Structure
COMPONENT B: INTERGOVERNMENTAL RELATIONS
2.2 INTERGOVERNMENTAL RELATIONS
2.2.1 Intergovernmental Structures
In terms of the Constitution of South Africa, all spheres of government and all organs of state within each sphere must co-operate
with one another in mutual trust and good faith fostering friendly relations. They must assist and support one another; inform and
consult one another on matters of common interest; coordinate their actions, adhering to agreed procedures and avoid legal
proceedings against one another.
CHAPTER 2: GOVERNANCE
Page | 26
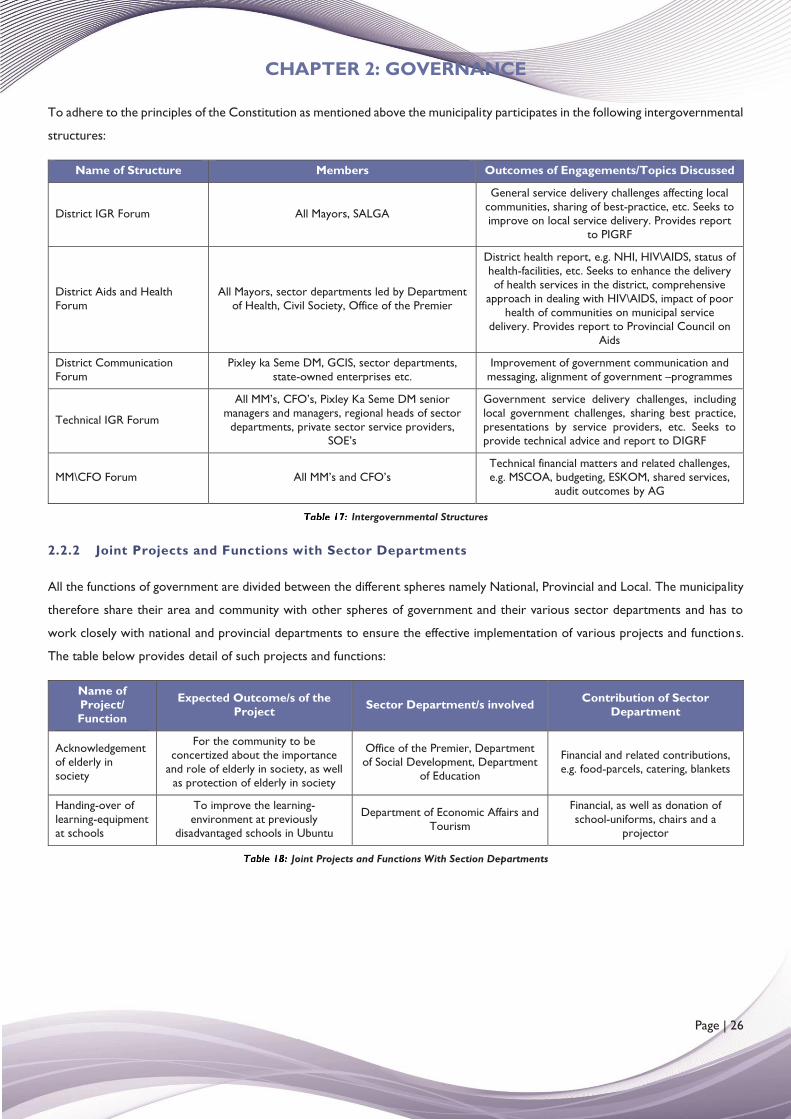
To adhere to the principles of the Constitution as mentioned above the municipality participates in the following intergovernmental
structures:
Name of Structure Members Outcomes of Engagements/Topics Discussed
District IGR Forum All Mayors, SALGA
General service delivery challenges affecting local communities, sharing of best-practice, etc. Seeks to improve on local service delivery. Provides report
to PIGRF
District Aids and Health Forum
All Mayors, sector departments led by Department of Health, Civil Society, Office of the Premier
District health report, e.g. NHI, HIV\AIDS, status of health-facilities, etc. Seeks to enhance the delivery of health services in the district, comprehensive
approach in dealing with HIV\AIDS, impact of poor health of communities on municipal service
delivery. Provides report to Provincial Council on Aids
District Communication Forum
Pixley ka Seme DM, GCIS, sector departments, state-owned enterprises etc.
Improvement of government communication and messaging, alignment of government –programmes
Technical IGR Forum
All MM’s, CFO’s, Pixley Ka Seme DM senior managers and managers, regional heads of sector
departments, private sector service providers, SOE’s
Government service delivery challenges, including local government challenges, sharing best practice, presentations by service providers, etc. Seeks to provide technical advice and report to DIGRF
MM\CFO Forum All MM’s and CFO’s Technical financial matters and related challenges, e.g. MSCOA, budgeting, ESKOM, shared services,
audit outcomes by AG
Intergovernmental Structures
2.2.2 Joint Projects and Functions with Sector Departments
All the functions of government are divided between the different spheres namely National, Provincial and Local. The municipality
therefore share their area and community with other spheres of government and their various sector departments and has to
work closely with national and provincial departments to ensure the effective implementation of various projects and functions.
The table below provides detail of such projects and functions:
Name of Project/ Function
Expected Outcome/s of the Project Sector Department/s involved Contribution of Sector
Department
Acknowledgement of elderly in society
For the community to be concertized about the importance
and role of elderly in society, as well as protection of elderly in society
Office of the Premier, Department of Social Development, Department
of Education
Financial and related contributions, e.g. food-parcels, catering, blankets
Handing-over of learning-equipment at schools
To improve the learning-environment at previously
disadvantaged schools in Ubuntu
Department of Economic Affairs and Tourism
Financial, as well as donation of school-uniforms, chairs and a
projector
Joint Projects and Functions With Section Departments
CHAPTER 2: GOVERNANCE
Page | 27
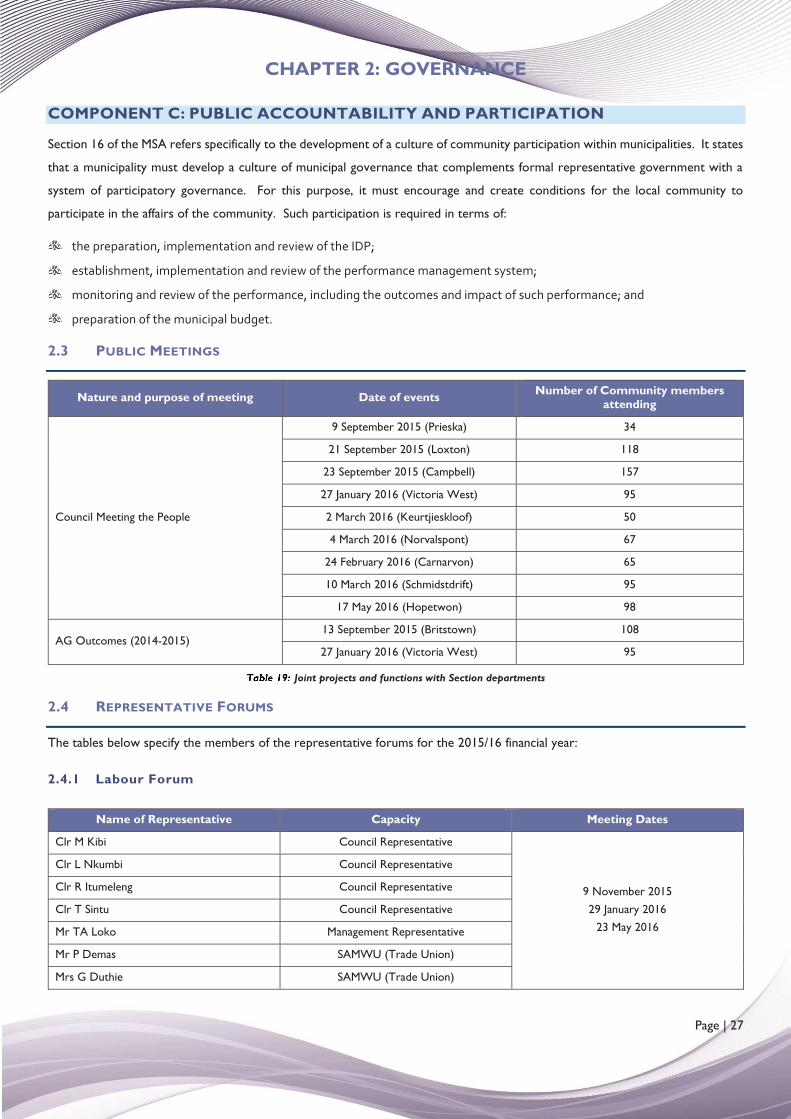
COMPONENT C: PUBLIC ACCOUNTABILITY AND PARTICIPATION
Section 16 of the MSA refers specifically to the development of a culture of community participation within municipalities. It states
that a municipality must develop a culture of municipal governance that complements formal representative government with a
system of participatory governance. For this purpose, it must encourage and create conditions for the local community to
participate in the affairs of the community. Such participation is required in terms of:
the preparation, implementation and review of the IDP;
establishment, implementation and review of the performance management system;
monitoring and review of the performance, including the outcomes and impact of such performance; and
preparation of the municipal budget.
2.3 PUBLIC MEETINGS
Nature and purpose of meeting Date of events Number of Community members attending
Council Meeting the People
9 September 2015 (Prieska) 34
21 September 2015 (Loxton) 118
23 September 2015 (Campbell) 157
27 January 2016 (Victoria West) 95
2 March 2016 (Keurtjieskloof) 50
4 March 2016 (Norvalspont) 67
24 February 2016 (Carnarvon) 65
10 March 2016 (Schmidstdrift) 95
17 May 2016 (Hopetwon) 98
AG Outcomes (2014-2015) 13 September 2015 (Britstown) 108
27 January 2016 (Victoria West) 95
Joint projects and functions with Section departments
2.4 REPRESENTATIVE FORUMS
The tables below specify the members of the representative forums for the 2015/16 financial year:
2.4.1 Labour Forum
Name of Representative Capacity Meeting Dates
Clr M Kibi Council Representative
9 November 2015 29 January 2016
23 May 2016
Clr L Nkumbi Council Representative
Clr R Itumeleng Council Representative
Clr T Sintu Council Representative
Mr TA Loko Management Representative
Mr P Demas SAMWU (Trade Union)
Mrs G Duthie SAMWU (Trade Union)
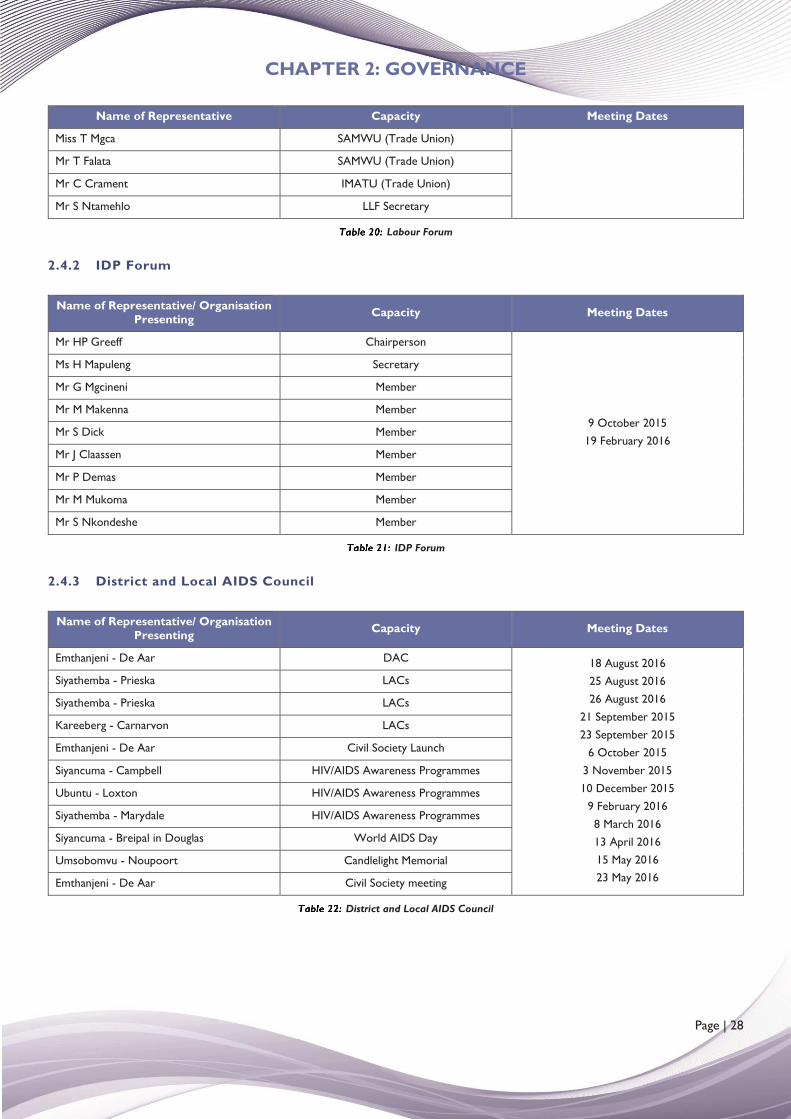
CHAPTER 2: GOVERNANCE
Page | 28
Name of Representative Capacity Meeting Dates
Miss T Mgca SAMWU (Trade Union)
Mr T Falata SAMWU (Trade Union)
Mr C Crament IMATU (Trade Union)
Mr S Ntamehlo LLF Secretary
Labour Forum
2.4.2 IDP Forum
Name of Representative/ Organisation Presenting Capacity Meeting Dates
Mr HP Greeff Chairperson
9 October 2015 19 February 2016
Ms H Mapuleng Secretary
Mr G Mgcineni Member
Mr M Makenna Member
Mr S Dick Member
Mr J Claassen Member
Mr P Demas Member
Mr M Mukoma Member
Mr S Nkondeshe Member
IDP Forum
2.4.3 District and Local AIDS Council
Name of Representative/ Organisation Presenting Capacity Meeting Dates
Emthanjeni - De Aar DAC 18 August 2016 25 August 2016 26 August 2016
21 September 2015 23 September 2015
6 October 2015 3 November 2015 10 December 2015
9 February 2016 8 March 2016 13 April 2016 15 May 2016 23 May 2016
Siyathemba - Prieska LACs
Siyathemba - Prieska LACs
Kareeberg - Carnarvon LACs
Emthanjeni - De Aar Civil Society Launch
Siyancuma - Campbell HIV/AIDS Awareness Programmes
Ubuntu - Loxton HIV/AIDS Awareness Programmes
Siyathemba - Marydale HIV/AIDS Awareness Programmes
Siyancuma - Breipal in Douglas World AIDS Day
Umsobomvu - Noupoort Candlelight Memorial
Emthanjeni - De Aar Civil Society meeting
District and Local AIDS Council
CHAPTER 2: GOVERNANCE
Page | 29
2.5 SHARED SERVICES
2.5.1 Planning
The Planning Section falls under the Infrastructure Development and Housing Department and is charged with the responsibility
of planning for the district. This planning function is multidimensional focusing on spatial planning and integrated development
planning for the district as a whole.
2.5.2 Spatial Planning
Part B of Schedules 4 and 5 of the Constitution of the Republic of South Africa, Act 108 of 1996, places the function of town
planning on local municipalities. However, taking the abilities of the local municipalities in consideration, Council has decided that
Pixley ka Seme District Municipality should provide hands on support to all its local municipalities, in adherence to the prescripts
of the Local Government: Municipal Structures Act, 117 of 1998.
Support was rendered in the following activities:
Processing of building plan applications in order for applicants to get building permits in time.
Assist local municipality with land development applications e.g. zoning, residential layout and removal of restrictions
During the year the following achievements were made in this field:
149 building applications were received of which 75 were approved and 74 not approved and referred back to the applicants.
The quality of the building plans remains a challenge for the section and is a major contributor to the non-approval of building
plans.
2.5.3 Spatial Plan Land Use Management Act
SPLUMA came into effect from 1 July 2015 and since council has decided for the establishment of DMPT the planning unit was
driving the process in order to establish the DMPT.
By-laws were formulated, adopted by the respective Councils and gazetted. The Memorandum of Understanding (MOU) was
signed by all municipalities. Delegations and tariffs were adopted by the respective councils. District SPLUMA meetings were
held in September, January and May during the year.
2.5.4 Integrated Development Planning
The Municipal Systems Act requires municipalities to review and adopt their IDPs annually to guide development within their areas
of jurisdiction. In ensuring sustainable development, poverty eradication and a better life for all, the Pixley Ka Seme DM reviewed
and adopted its IDP for the 2016/17 financial year in May 2016. The District must assist on proper municipal planning of these
nine municipalities to ensure alignment and objective driven IDP’s.
Achievement for 2015/16 was that all the IDP's were reviewed and final IDP's were adopted by the respective councils and
submitted to the MEC of COGHSTA for further assessment.
CHAPTER 2: GOVERNANCE
Page | 30
Pixley ka Seme District Municipality (27/05/2016) Emthanjeni, Siyancuma, Siyathemba, Umsobomvu, Ubuntu, Kareeberg,
Renosterberg and Thembelihle (31/05/2016).
The reviewed IDP is a strategic planning tool for addressing developmental challenges, the plan sets out some strategic agendas
and focus for development and service delivery in years to come. The strategic development agendas are premised on five key
performance areas as set out by the Department of Cooperative Governance, Human Settlements and Traditional Affairs. The
said five key performance areas are basic service delivery, good governance and public participation, municipal institutional
development and transformation, municipal financial viability and management and local economic development.
COMPONENT D: CORPORATE GOVERNANCE
Corporate governance is the set of processes, practices, policies, laws and stakeholders affecting the way an institution is directed,
administered or controlled. Corporate governance also includes the relationships among the many stakeholders involved and the
goals for which the institution is governed.
2.6 RISK MANAGEMENT
In the absence of a dedicated Risk Management Unit, the Internal Audit Services Department assumed a co-ordinating role
regarding the updating of the risk profile for the Municipality. The risk profile was also submitted to the Audit Committee.
The role of the service departments is to assist management in identification and review of risks in order to properly manage
them. Risk management is an integral or natural part of the organisational processes and procedures. Risk management should be
embedded in the organisation. It becomes an intrinsic part of business planning and decision making - there is no direction taken
without looking at potential risks.
2.7 ANTI-CORRUPTION AND ANTI-FRAUD
Section 83(c) of the MSA refers to the implementation of effective bidding structures to minimize the possibility of fraud and
corruption and the MFMA, Section 112(1)(m)(i) identify supply chain measures to be enforced to combat fraud and corruption,
favouritism and unfair and irregular practices. Section 115(1) of the MFMA states that the accounting officer must take steps to
ensure mechanisms and separation of duties in a supply chain management system to minimize the likelihood of corruption and
fraud.
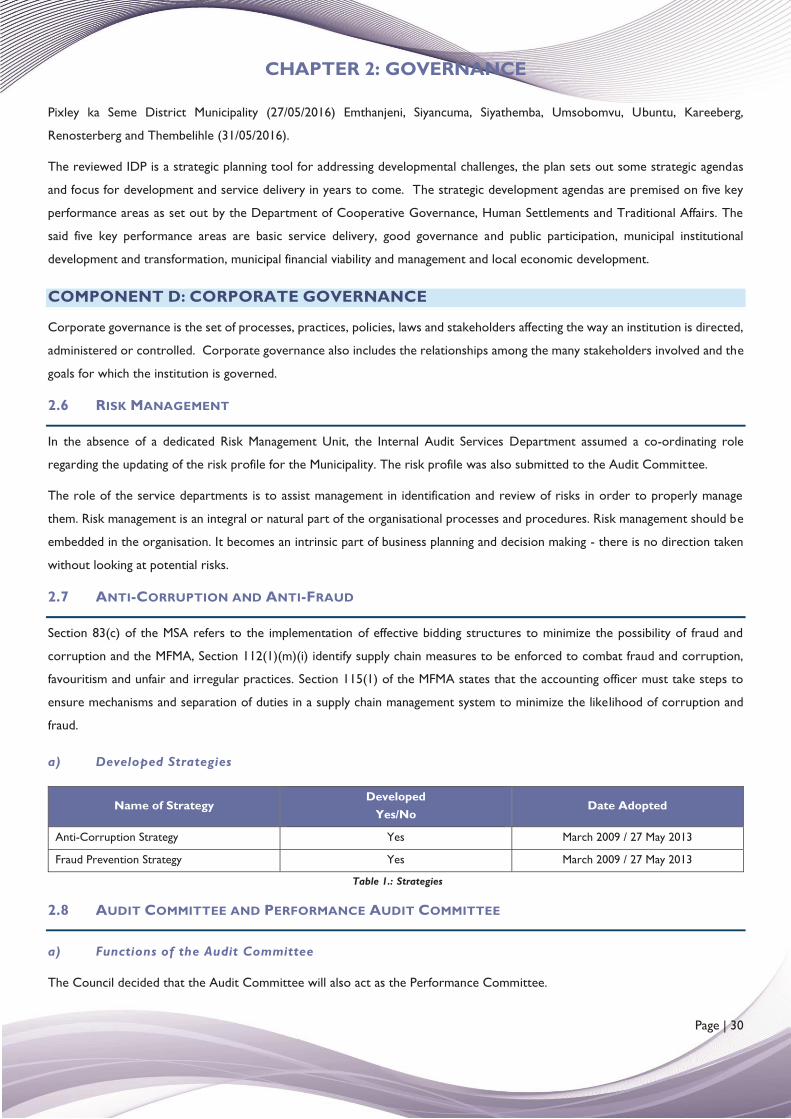
a) Developed Strategies
Name of Strategy Developed
Yes/No Date Adopted
Anti-Corruption Strategy Yes March 2009 / 27 May 2013
Fraud Prevention Strategy Yes March 2009 / 27 May 2013
Table 1.: Strategies
2.8 AUDIT COMMITTEE AND PERFORMANCE AUDIT COMMITTEE
a) Functions of the Audit Committee
The Council decided that the Audit Committee will also act as the Performance Committee.
CHAPTER 2: GOVERNANCE
Page | 31
The Audit Committee have the following main functions as prescribed in Section 166(2)(a-e) of the MFMA, and the Local
Government Municipal and Performance Management Regulation:
To advise the Council on all matters related to compliance and effective governance.
To review the annual financial statements to provide Council with an authoritative and credible view of the financial position
of the municipality, its efficiency and its overall level of compliance with the MFMA, the annual DoRA and other applicable
legislation.
Respond to Council on any issues raised by the Auditor-General in the Audit Report.
Carry out such investigations into the financial affairs of the municipality as Council may request.
To review the quarterly reports submitted by internal audit.
To evaluate audit reports pertaining to financial, administrative and technical systems.
To evaluate the compliance to existing policies and relevant legislation.
To review the performance management system and make recommendations in this regard to Council.
To assess whether the performance indicators are sufficient.
To determine possible reasons for discrepancies between performance and targets.
To identify major risks to which Council is exposed and determine the extent to which risks have been minimized.
To review the annual report of the Municipality.
Investigating cases of fraud, misbehaviour and conflict of interest involving employees.
Review the plans of the Internal Audit Unit and, in so doing, ensure that the plan addresses the high-risk areas and ensure
that adequate resources are available.
Review audit results and action plans implemented by management.
Provide support to the Internal Audit Unit.
Ensure that no restrictions or limitations are placed on the Internal Audit Unit.
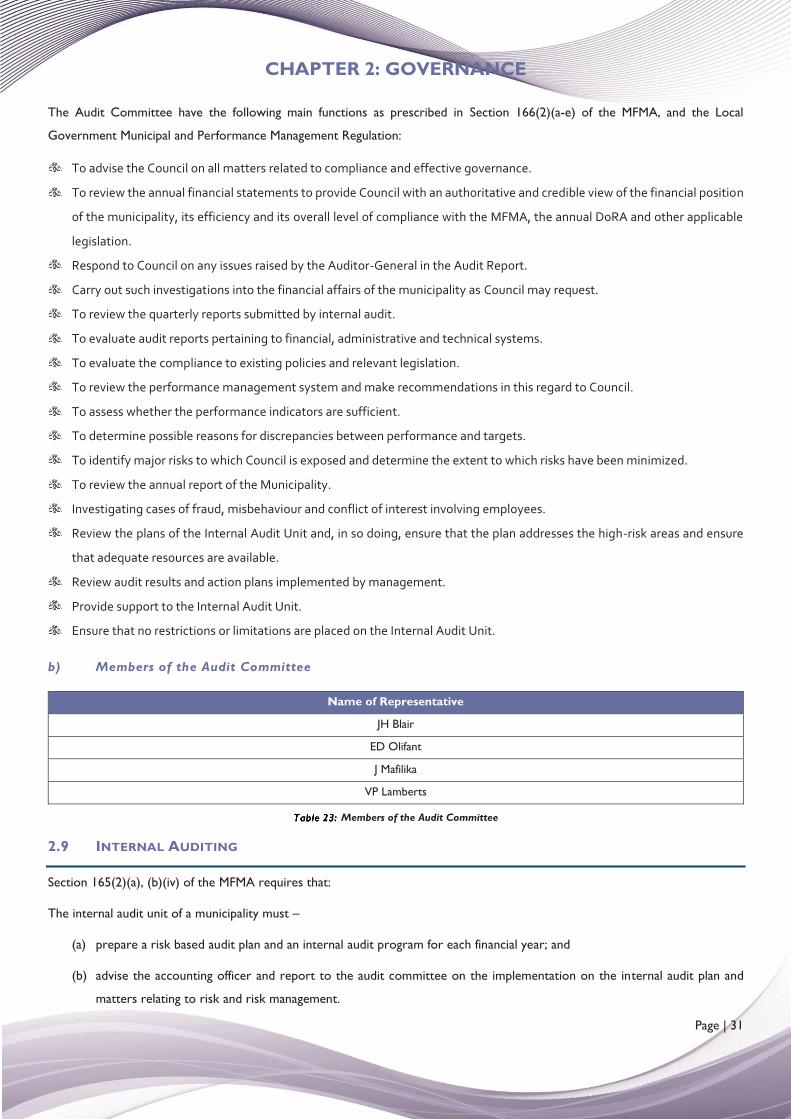
b) Members of the Audit Committee
Name of Representative
JH Blair
ED Olifant
J Mafilika
VP Lamberts
Members of the Audit Committee
2.9 INTERNAL AUDITING
Section 165(2)(a), (b)(iv) of the MFMA requires that:
The internal audit unit of a municipality must –
(a) prepare a risk based audit plan and an internal audit program for each financial year; and
(b) advise the accounting officer and report to the audit committee on the implementation on the internal audit plan and
matters relating to risk and risk management.
CHAPTER 2: GOVERNANCE
Page | 32
The municipality has an in-house Internal Audit function consisting of four auditors, four internal audit clerks, one Senior Internal
Auditor and one Manager.
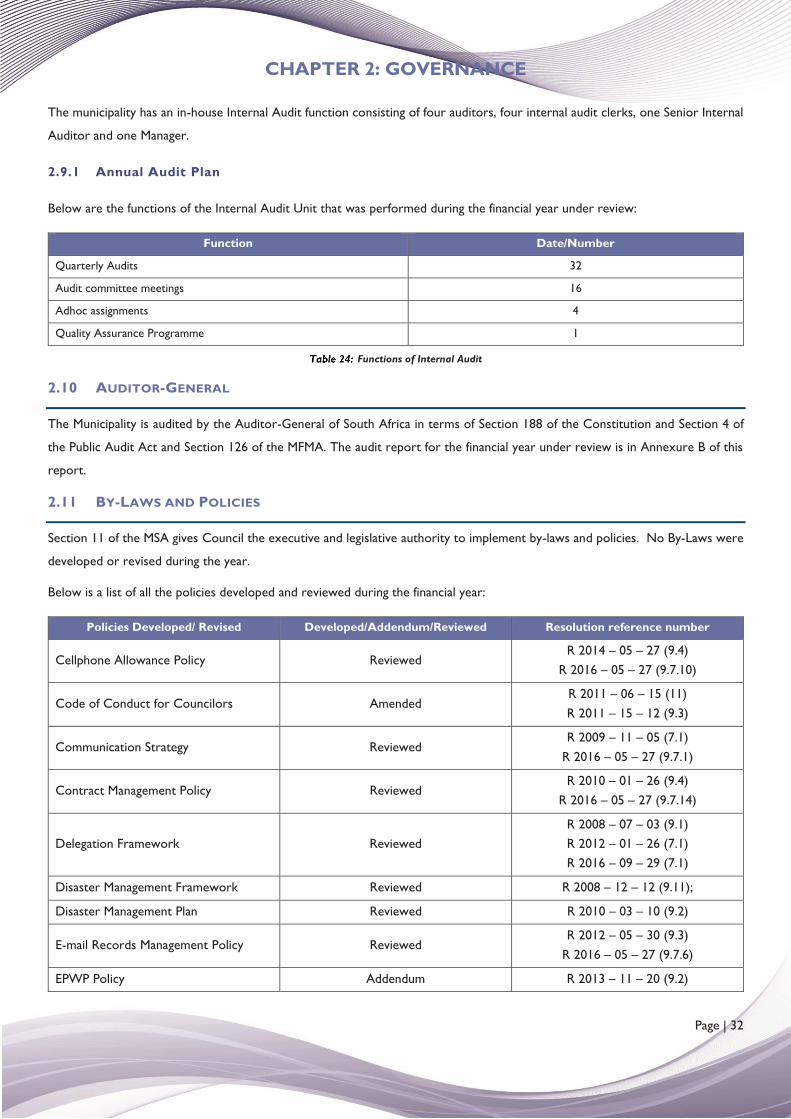
2.9.1 Annual Audit Plan
Below are the functions of the Internal Audit Unit that was performed during the financial year under review:
Function Date/Number
Quarterly Audits 32
Audit committee meetings 16
Adhoc assignments 4
Quality Assurance Programme 1
Functions of Internal Audit
2.10 AUDITOR-GENERAL
The Municipality is audited by the Auditor-General of South Africa in terms of Section 188 of the Constitution and Section 4 of
the Public Audit Act and Section 126 of the MFMA. The audit report for the financial year under review is in Annexure B of this
report.
2.11 BY-LAWS AND POLICIES
Section 11 of the MSA gives Council the executive and legislative authority to implement by-laws and policies. No By-Laws were
developed or revised during the year.
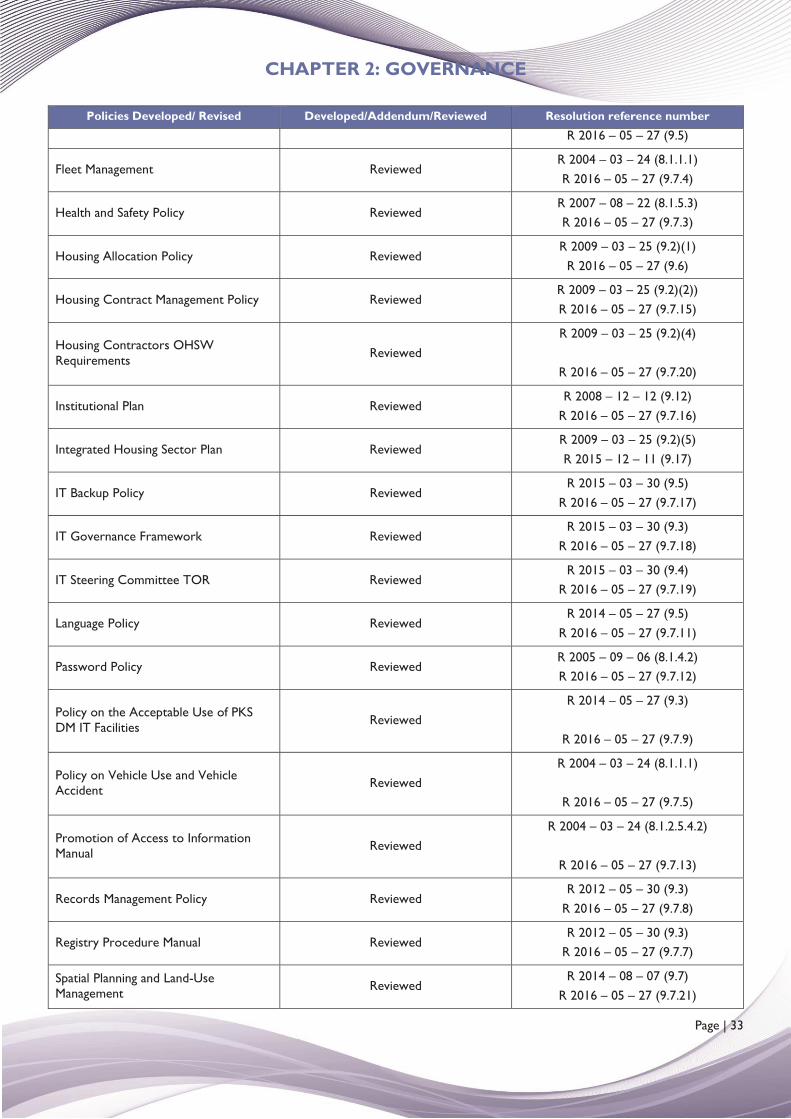
Below is a list of all the policies developed and reviewed during the financial year:
Policies Developed/ Revised Developed/Addendum/Reviewed Resolution reference number
Cellphone Allowance Policy Reviewed R 2014 – 05 – 27 (9.4)
R 2016 – 05 – 27 (9.7.10)
Code of Conduct for Councilors Amended R 2011 – 06 – 15 (11) R 2011 – 15 – 12 (9.3)
Communication Strategy Reviewed R 2009 – 11 – 05 (7.1)
R 2016 – 05 – 27 (9.7.1)
Contract Management Policy Reviewed R 2010 – 01 – 26 (9.4)
R 2016 – 05 – 27 (9.7.14)
Delegation Framework Reviewed R 2008 – 07 – 03 (9.1) R 2012 – 01 – 26 (7.1) R 2016 – 09 – 29 (7.1)
Disaster Management Framework Reviewed R 2008 – 12 – 12 (9.11);
Disaster Management Plan Reviewed R 2010 – 03 – 10 (9.2)
E-mail Records Management Policy Reviewed R 2012 – 05 – 30 (9.3)
R 2016 – 05 – 27 (9.7.6)
EPWP Policy Addendum R 2013 – 11 – 20 (9.2)
CHAPTER 2: GOVERNANCE
Page | 33
Policies Developed/ Revised Developed/Addendum/Reviewed Resolution reference number
R 2016 – 05 – 27 (9.5)
Fleet Management Reviewed R 2004 – 03 – 24 (8.1.1.1) R 2016 – 05 – 27 (9.7.4)
Health and Safety Policy Reviewed R 2007 – 08 – 22 (8.1.5.3) R 2016 – 05 – 27 (9.7.3)
Housing Allocation Policy Reviewed R 2009 – 03 – 25 (9.2)(1)
R 2016 – 05 – 27 (9.6)
Housing Contract Management Policy Reviewed R 2009 – 03 – 25 (9.2)(2)) R 2016 – 05 – 27 (9.7.15)
Housing Contractors OHSW Requirements Reviewed
R 2009 – 03 – 25 (9.2)(4)
R 2016 – 05 – 27 (9.7.20)
Institutional Plan Reviewed R 2008 – 12 – 12 (9.12)
R 2016 – 05 – 27 (9.7.16)
Integrated Housing Sector Plan Reviewed R 2009 – 03 – 25 (9.2)(5) R 2015 – 12 – 11 (9.17)
IT Backup Policy Reviewed R 2015 – 03 – 30 (9.5)
R 2016 – 05 – 27 (9.7.17)
IT Governance Framework Reviewed R 2015 – 03 – 30 (9.3)
R 2016 – 05 – 27 (9.7.18)
IT Steering Committee TOR Reviewed R 2015 – 03 – 30 (9.4)
R 2016 – 05 – 27 (9.7.19)
Language Policy Reviewed R 2014 – 05 – 27 (9.5)
R 2016 – 05 – 27 (9.7.11)
Password Policy Reviewed R 2005 – 09 – 06 (8.1.4.2) R 2016 – 05 – 27 (9.7.12)
Policy on the Acceptable Use of PKS DM IT Facilities Reviewed
R 2014 – 05 – 27 (9.3)
R 2016 – 05 – 27 (9.7.9)
Policy on Vehicle Use and Vehicle Accident Reviewed
R 2004 – 03 – 24 (8.1.1.1)
R 2016 – 05 – 27 (9.7.5)
Promotion of Access to Information Manual Reviewed
R 2004 – 03 – 24 (8.1.2.5.4.2)
R 2016 – 05 – 27 (9.7.13)
Records Management Policy Reviewed R 2012 – 05 – 30 (9.3)
R 2016 – 05 – 27 (9.7.8)
Registry Procedure Manual Reviewed R 2012 – 05 – 30 (9.3)
R 2016 – 05 – 27 (9.7.7)
Spatial Planning and Land-Use Management Reviewed
R 2014 – 08 – 07 (9.7) R 2016 – 05 – 27 (9.7.21)
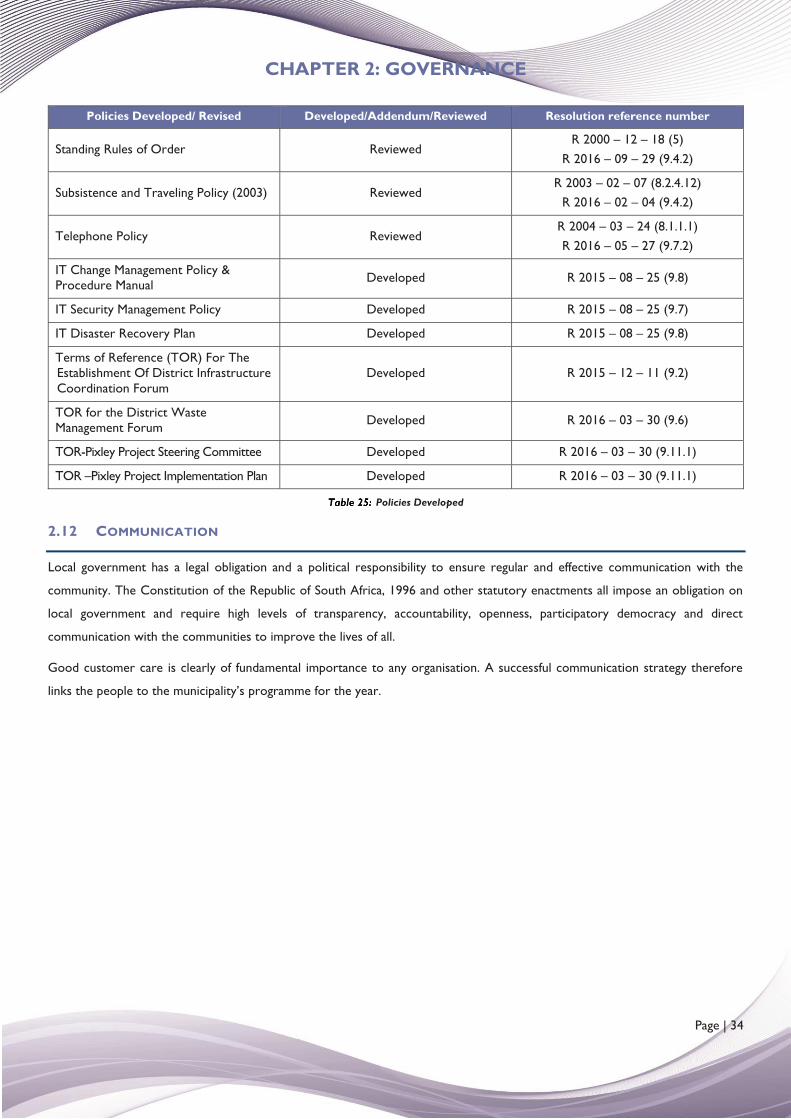
CHAPTER 2: GOVERNANCE
Page | 34
Policies Developed/ Revised Developed/Addendum/Reviewed Resolution reference number
Standing Rules of Order Reviewed R 2000 – 12 – 18 (5)
R 2016 – 09 – 29 (9.4.2)
Subsistence and Traveling Policy (2003) Reviewed R 2003 – 02 – 07 (8.2.4.12)
R 2016 – 02 – 04 (9.4.2)
Telephone Policy Reviewed R 2004 – 03 – 24 (8.1.1.1)R 2016 – 05 – 27 (9.7.2)
IT Change Management Policy & Procedure Manual Developed R 2015 – 08 – 25 (9.8)
IT Security Management Policy Developed R 2015 – 08 – 25 (9.7)
IT Disaster Recovery Plan Developed R 2015 – 08 – 25 (9.8)
Terms of Reference (TOR) For The Establishment Of District Infrastructure Coordination Forum
Developed R 2015 – 12 – 11 (9.2)
TOR for the District Waste Management Forum Developed R 2016 – 03 – 30 (9.6)
TOR-Pixley Project Steering Committee Developed R 2016 – 03 – 30 (9.11.1)
TOR –Pixley Project Implementation Plan Developed R 2016 – 03 – 30 (9.11.1)
Policies Developed
2.12 COMMUNICATION
Local government has a legal obligation and a political responsibility to ensure regular and effective communication with the
community. The Constitution of the Republic of South Africa, 1996 and other statutory enactments all impose an obligation on
local government and require high levels of transparency, accountability, openness, participatory democracy and direct
communication with the communities to improve the lives of all.
Good customer care is clearly of fundamental importance to any organisation. A successful communication strategy therefore
links the people to the municipality’s programme for the year.
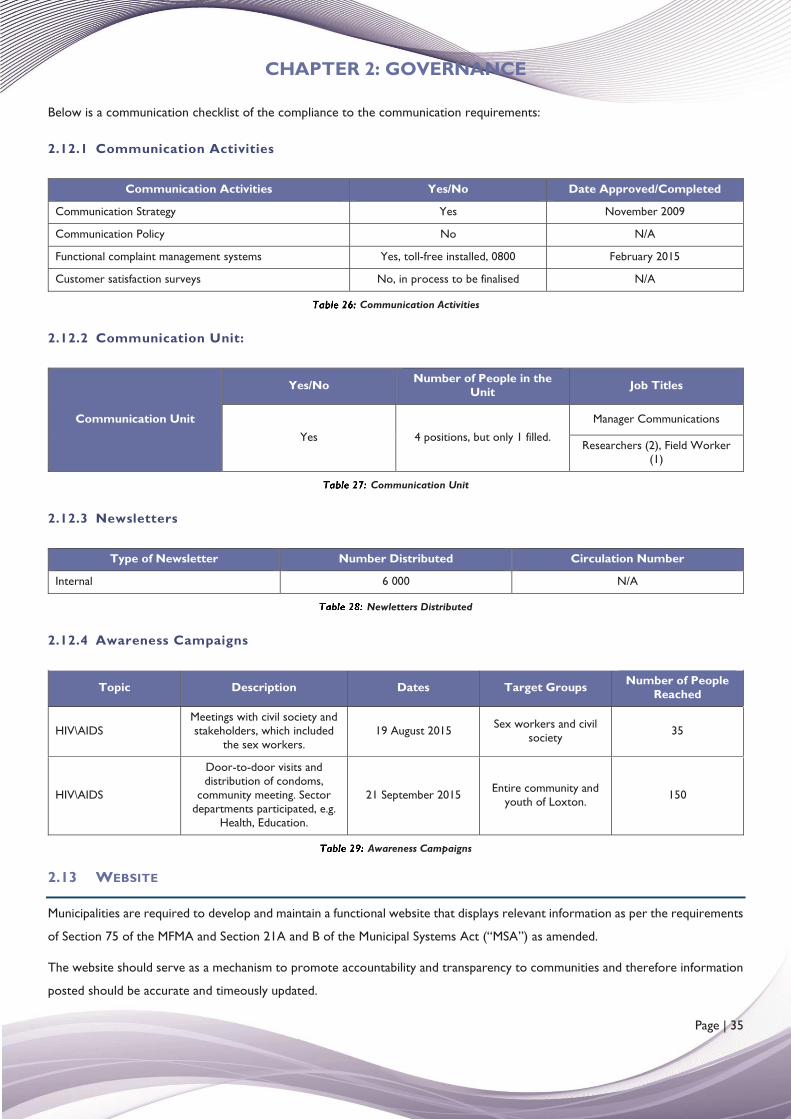
CHAPTER 2: GOVERNANCE
Page | 35
Below is a communication checklist of the compliance to the communication requirements:
2.12.1 Communication Activities
Communication Activities Yes/No Date Approved/Completed
Communication Strategy Yes November 2009
Communication Policy No N/A
Functional complaint management systems Yes, toll-free installed, 0800 February 2015
Customer satisfaction surveys No, in process to be finalised N/A
Communication Activities
2.12.2 Communication Unit:
Communication Unit
Yes/No Number of People in the Unit Job Titles
Yes 4 positions, but only 1 filled.
Manager Communications
Researchers (2), Field Worker (1)
Communication Unit
2.12.3 Newsletters
Type of Newsletter Number Distributed Circulation Number
Internal 6 000 N/A
Newletters Distributed
2.12.4 Awareness Campaigns
Topic Description Dates Target Groups Number of People Reached
HIV\AIDS Meetings with civil society and stakeholders, which included
the sex workers. 19 August 2015 Sex workers and civil
society 35
HIV\AIDS
Door-to-door visits and distribution of condoms,
community meeting. Sector departments participated, e.g.
Health, Education.
21 September 2015 Entire community and youth of Loxton. 150
Awareness Campaigns
2.13 WEBSITE
Municipalities are required to develop and maintain a functional website that displays relevant information as per the requirements
of Section 75 of the MFMA and Section 21A and B of the Municipal Systems Act (“MSA”) as amended.
The website should serve as a mechanism to promote accountability and transparency to communities and therefore information
posted should be accurate and timeously updated.
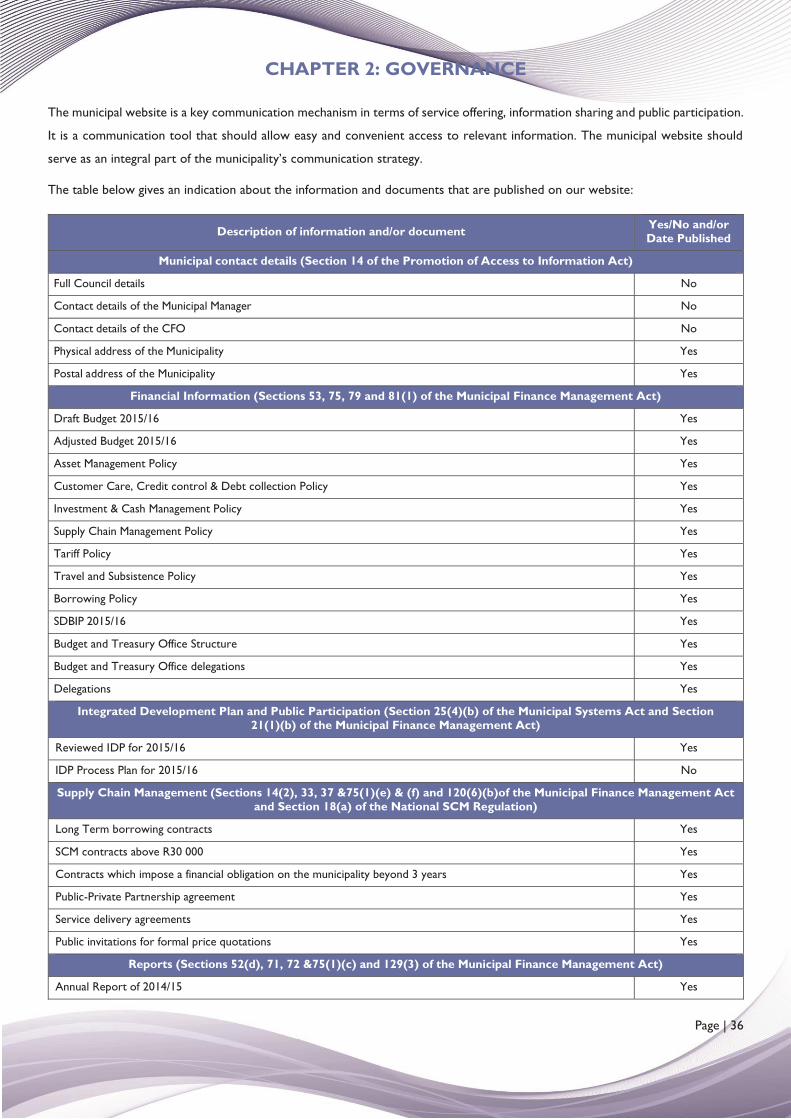
CHAPTER 2: GOVERNANCE
Page | 36
The municipal website is a key communication mechanism in terms of service offering, information sharing and public participation.
It is a communication tool that should allow easy and convenient access to relevant information. The municipal website should
serve as an integral part of the municipality’s communication strategy.
The table below gives an indication about the information and documents that are published on our website:
Description of information and/or document Yes/No and/or Date Published
Municipal contact details (Section 14 of the Promotion of Access to Information Act)
Full Council details No
Contact details of the Municipal Manager No
Contact details of the CFO No
Physical address of the Municipality Yes
Postal address of the Municipality Yes
Financial Information (Sections 53, 75, 79 and 81(1) of the Municipal Finance Management Act)
Draft Budget 2015/16 Yes
Adjusted Budget 2015/16 Yes
Asset Management Policy Yes
Customer Care, Credit control & Debt collection Policy Yes
Investment & Cash Management Policy Yes
Supply Chain Management Policy Yes
Tariff Policy Yes
Travel and Subsistence Policy Yes
Borrowing Policy Yes
SDBIP 2015/16 Yes
Budget and Treasury Office Structure Yes
Budget and Treasury Office delegations Yes
Delegations Yes
Integrated Development Plan and Public Participation (Section 25(4)(b) of the Municipal Systems Act and Section 21(1)(b) of the Municipal Finance Management Act)
Reviewed IDP for 2015/16 Yes
IDP Process Plan for 2015/16 No
Supply Chain Management (Sections 14(2), 33, 37 &75(1)(e) & (f) and 120(6)(b)of the Municipal Finance Management Act and Section 18(a) of the National SCM Regulation)
Long Term borrowing contracts Yes
SCM contracts above R30 000 Yes
Contracts which impose a financial obligation on the municipality beyond 3 years Yes
Public-Private Partnership agreement Yes
Service delivery agreements Yes
Public invitations for formal price quotations Yes
Reports (Sections 52(d), 71, 72 &75(1)(c) and 129(3) of the Municipal Finance Management Act)
Annual Report of 2014/15 Yes
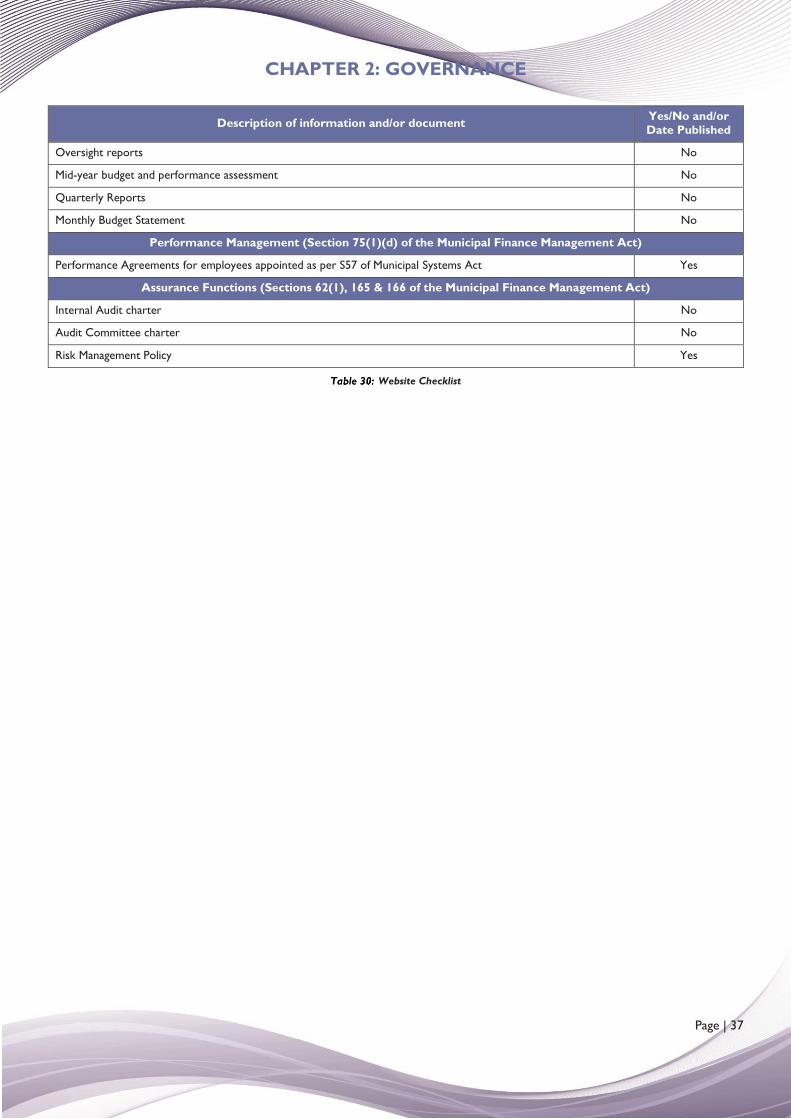
CHAPTER 2: GOVERNANCE
Page | 37
Description of information and/or document Yes/No and/or Date Published
Oversight reports No
Mid-year budget and performance assessment No
Quarterly Reports No
Monthly Budget Statement No
Performance Management (Section 75(1)(d) of the Municipal Finance Management Act)
Performance Agreements for employees appointed as per S57 of Municipal Systems Act Yes
Assurance Functions (Sections 62(1), 165 & 166 of the Municipal Finance Management Act)
Internal Audit charter No
Audit Committee charter No
Risk Management Policy Yes
Website Checklist
CHAPTER 3: SERVICE DELIVERY PERFORMANCE
Page | 38
CHAPTER 3
3.1 OVERVIEW OF PERFORMANCE WITHIN THE ORGANISATION
Performance management is a process which measures the implementation of the organisation’s strategy. It is also a
management tool to plan, monitor, measure and review performance indicators to ensure efficiency, effectiveness and the
impact of service delivery by the municipality.
At local government level performance management is institutionalized through the legislative requirements on the performance
management process for local government. Performance management provides the mechanism to measure whether targets to
meet its strategic goals, set by the organisation and its employees, are met.
The constitution of S.A (1996), Section 152, dealing with the objectives of local government paves the way for performance
management with the requirements for an “accountable government”. The democratic values and principles in terms of Section
195 (1) are also linked with the concept of performance management, with reference to the principles of inter alia:
the promotion of efficient, economic and effective use of resources,
accountable public administration
to be transparent by providing information,
to be responsive to the needs of the community,
and to facilitate a culture of public service and accountability amongst staff.
The Municipal Systems Act (MSA), 2000 requires municipalities to establish a performance management system. Further, the
MSA and the Municipal Finance Management Act (MFMA) requires the Integrated Development Plan (IDP) to be aligned to the
municipal budget and to be monitored for the performance of the budget via the service delivery and the budget implementation
plan (SDBIP).
Regulation 7(1) of the Local Government: Municipal Planning and Performance Management Regulations, 2001 states that “A
Municipality’s Performance Management System entails a framework that describes and represents how the municipality’s cycle
and processes of performance planning, monitoring, measurement, review, reporting and improvement will be conducted,
organised and managed, including determining the roles of the different role players.” Performance management is not only
relevant to the organisation as a whole, but also to the individuals employed in the organization as well as the external service
providers and municipal entities. This framework, inter alia, reflects the linkage between the IDP, budget, SDBIP and individual
and service provider performance.
Council approved and adopted a Performance Management Framework on 12 December 2008. The Municipality reviewed the
framework which was approved by Council on 27 March 2016.
CHAPTER 3: SERVICE DELIVERY PERFORMANCE
Page | 39
3.1.1 Legislative Requirements
In terms of Section 46(1)(a) of the MSA a municipality must prepare for each financial year a performance report reflecting the
municipality’s and any service provider’s performance during the financial year, including comparison with targets of and with
performance in the previous financial year. The report must, furthermore, indicate the development and service delivery priorities
and the performance targets set by the municipality for the following financial year and measures that were or are to be taken to
improve performance.
3.1.2 Organisation Performance
Strategic performance indicates how well the municipality meet its objectives and which policies and processes are working. All
government institutions must report on strategic performance to ensure that service delivery is efficient, effective and economical.
Municipalities must develop strategic plans and allocate resources for the implementation. The implementation must be monitored
on an ongoing basis and the results must be reported on during the financial year to various role-players to enable them to
timeously implement corrective measures where required.
This report highlights the strategic performance in terms of the municipality’s Top Layer SDBIP per strategic objective and the
National Key Performance Indicators prescribed in terms of Section 43 of the MSA.
3.1.3 The Performance System Followed For 2015/16
a) The IDP and the budget
The reviewed IDP and budget for 2015/16 was approved by Council on 26 May 2015.
b) The Service Delivery Budget Implementation Plan
The organisational performance is evaluated by means of a municipal scorecard (Top Layer SDBIP) at organisational level and at
directorate levels.
The SDBIP is a plan that converts the IDP and budget into measurable criteria on how, where and when the strategies, objectives
and normal business process of the municipality is implemented. It also allocates responsibility to directorates to deliver the
services in terms of the IDP and budget.
The Top Layer SDBIP was approved by the Executive Mayor on 15 June 2015.
The Top Layer SDBIP was revised with the adjustments budget in terms of Section 26 (2)(c) of the Municipal Budget and Reporting
Regulations and approved by the Council on 30 March 2016. The following were considered in the development of the amended
Top Layer SDBIP:
Areas to be addressed and root causes of the Auditor-General management letter, as well as the risks identified during the
2014/15 audit
Alignment with the IDP, National KPA’s, Municipal KPA’s and IDP objectives
Alignment with the adjustments budget
Oversight Committee Report on the Annual Report of 2014/15
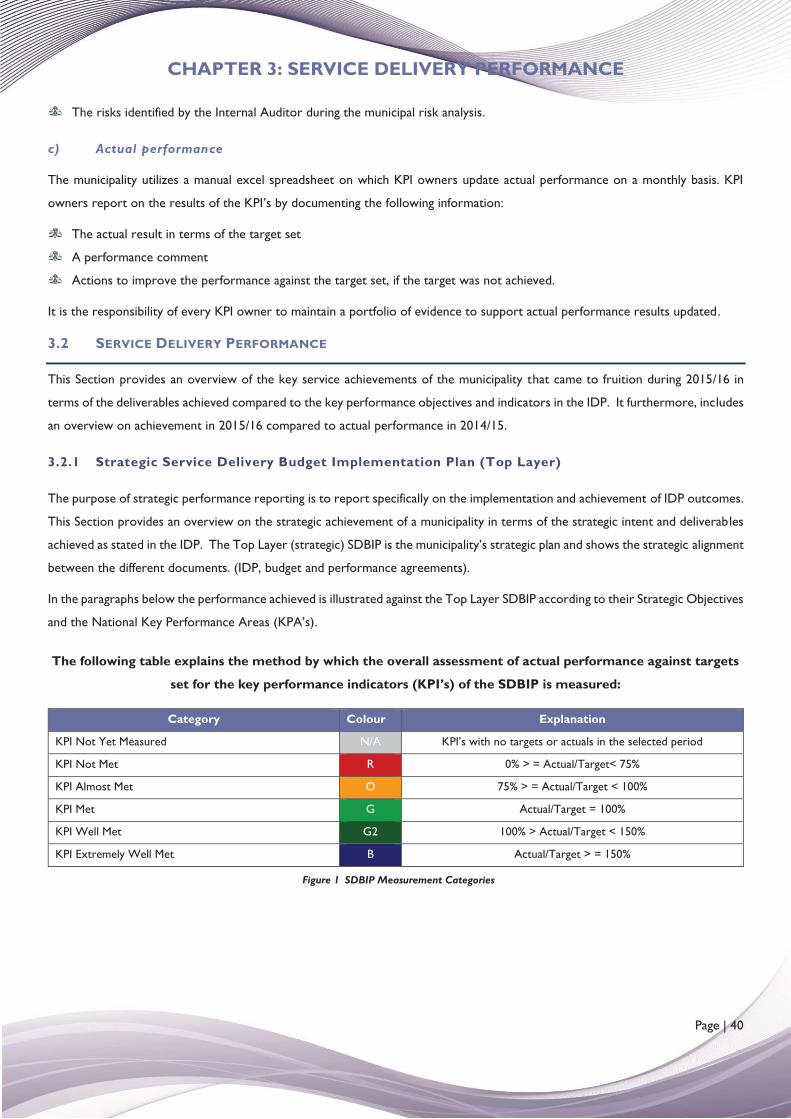
CHAPTER 3: SERVICE DELIVERY PERFORMANCE
Page | 40
The risks identified by the Internal Auditor during the municipal risk analysis.
c) Actual performance
The municipality utilizes a manual excel spreadsheet on which KPI owners update actual performance on a monthly basis. KPI
owners report on the results of the KPI’s by documenting the following information:
The actual result in terms of the target set
A performance comment
Actions to improve the performance against the target set, if the target was not achieved.
It is the responsibility of every KPI owner to maintain a portfolio of evidence to support actual performance results updated.
3.2 SERVICE DELIVERY PERFORMANCE
This Section provides an overview of the key service achievements of the municipality that came to fruition during 2015/16 in
terms of the deliverables achieved compared to the key performance objectives and indicators in the IDP. It furthermore, includes
an overview on achievement in 2015/16 compared to actual performance in 2014/15.
3.2.1 Strategic Service Delivery Budget Implementation Plan (Top Layer)
The purpose of strategic performance reporting is to report specifically on the implementation and achievement of IDP outcomes.
This Section provides an overview on the strategic achievement of a municipality in terms of the strategic intent and deliverables
achieved as stated in the IDP. The Top Layer (strategic) SDBIP is the municipality’s strategic plan and shows the strategic alignment
between the different documents. (IDP, budget and performance agreements).
In the paragraphs below the performance achieved is illustrated against the Top Layer SDBIP according to their Strategic Objectives
and the National Key Performance Areas (KPA’s).
The following table explains the method by which the overall assessment of actual performance against targets
set for the key performance indicators (KPI’s) of the SDBIP is measured:
Category Colour Explanation
KPI Not Yet Measured N/A KPI’s with no targets or actuals in the selected period
KPI Not Met R 0% > = Actual/Target< 75%
KPI Almost Met O 75% > = Actual/Target < 100%
KPI Met G Actual/Target = 100%
KPI Well Met G2 100% > Actual/Target < 150%
KPI Extremely Well Met B Actual/Target > = 150%
Figure 1 SDBIP Measurement Categories
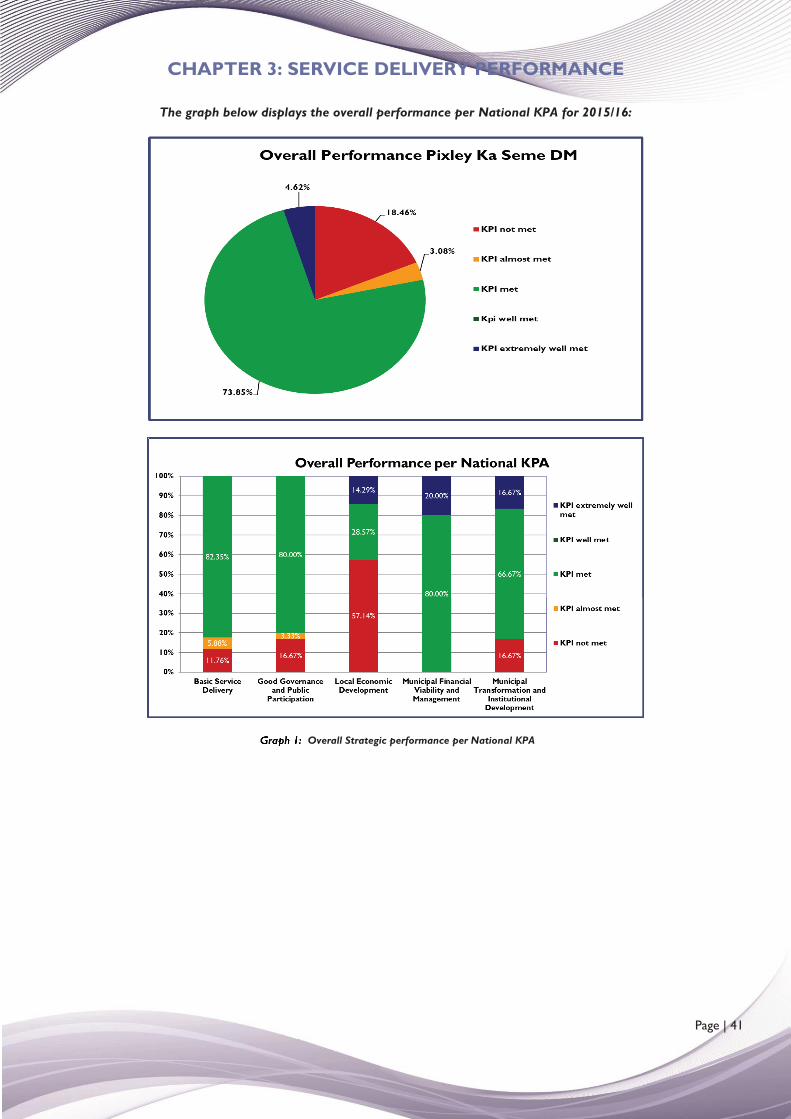
CHAPTER 3: SERVICE DELIVERY PERFORMANCE
Page | 41
The graph below displays the overall performance per National KPA for 2015/16:
Overall Strategic performance per National KPA
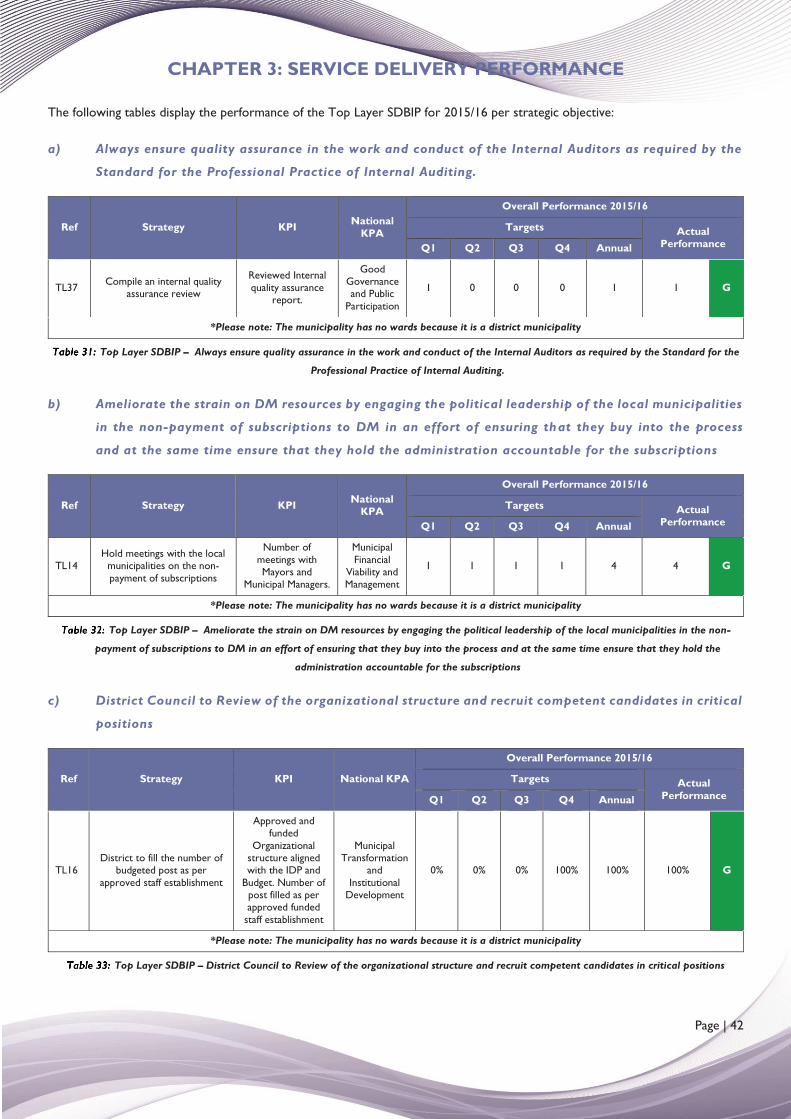
CHAPTER 3: SERVICE DELIVERY PERFORMANCE
Page | 42
The following tables display the performance of the Top Layer SDBIP for 2015/16 per strategic objective:
a) Always ensure quality assurance in the work and conduct of the Internal Auditors as required by the
Standard for the Professional Practice of Internal Auditing.
Ref Strategy KPI National KPA
Overall Performance 2015/16
Targets Actual Performance Q1 Q2 Q3 Q4 Annual
TL37 Compile an internal quality assurance review
Reviewed Internal quality assurance
report.
Good Governance and Public
Participation
1 0 0 0 1 1 G
*Please note: The municipality has no wards because it is a district municipality
Top Layer SDBIP – Always ensure quality assurance in the work and conduct of the Internal Auditors as required by the Standard for the
Professional Practice of Internal Auditing.
b) Ameliorate the strain on DM resources by engaging the political leadership of the local municipalities
in the non-payment of subscriptions to DM in an effort of ensuring that they buy into the process
and at the same time ensure that they hold the administration accountable for the subscriptions
Ref Strategy KPI National KPA
Overall Performance 2015/16
Targets Actual Performance Q1 Q2 Q3 Q4 Annual
TL14 Hold meetings with the local
municipalities on the non-payment of subscriptions
Number of meetings with Mayors and
Municipal Managers.
Municipal Financial
Viability and Management
1 1 1 1 4 4 G
*Please note: The municipality has no wards because it is a district municipality
Top Layer SDBIP – Ameliorate the strain on DM resources by engaging the political leadership of the local municipalities in the non-
payment of subscriptions to DM in an effort of ensuring that they buy into the process and at the same time ensure that they hold the
administration accountable for the subscriptions
c) District Council to Review of the organizational structure and recruit competent candidates in critical
positions
Ref Strategy KPI National KPA
Overall Performance 2015/16
Targets Actual Performance Q1 Q2 Q3 Q4 Annual
TL16 District to fill the number of
budgeted post as per approved staff establishment
Approved and funded
Organizational structure aligned with the IDP and
Budget. Number of post filled as per approved funded
staff establishment
Municipal Transformation
and Institutional
Development
0% 0% 0% 100% 100% 100% G
*Please note: The municipality has no wards because it is a district municipality
Top Layer SDBIP – District Council to Review of the organizational structure and recruit competent candidates in critical positions
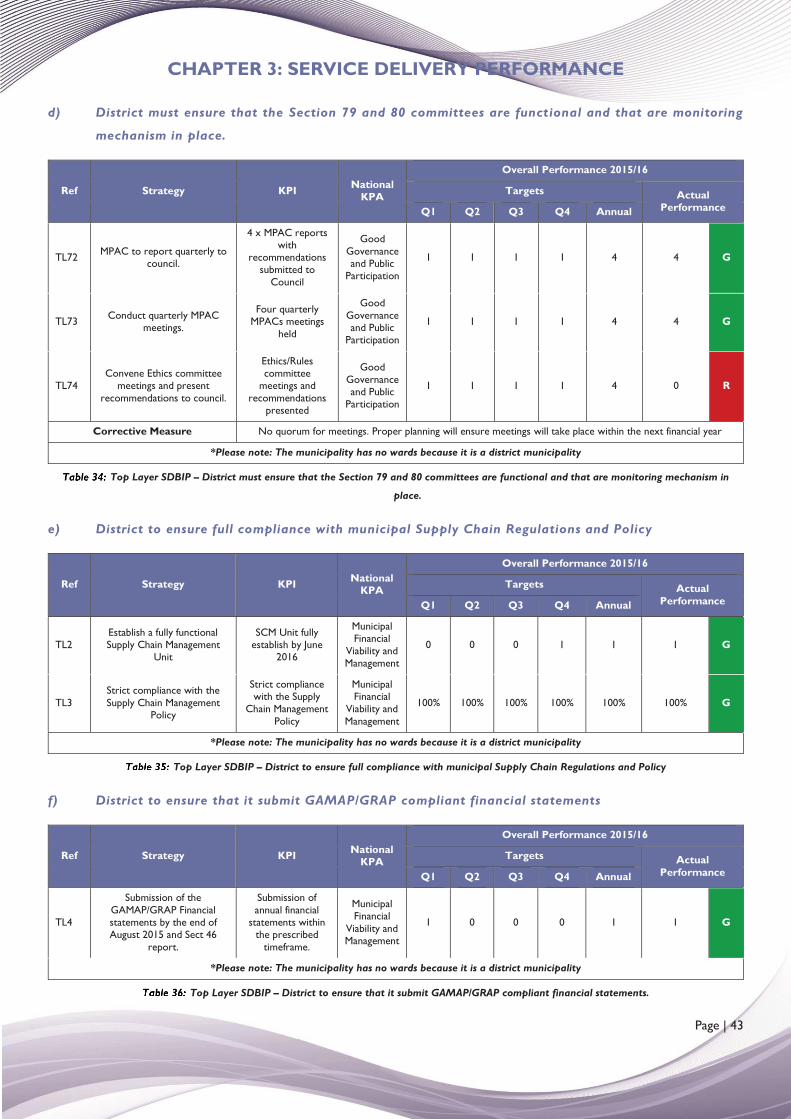
CHAPTER 3: SERVICE DELIVERY PERFORMANCE
Page | 43
d) District must ensure that the Section 79 and 80 committees are functional and that are monitoring
mechanism in place.
Ref Strategy KPI National KPA
Overall Performance 2015/16
Targets Actual Performance Q1 Q2 Q3 Q4 Annual
TL72 MPAC to report quarterly to council.
4 x MPAC reports with
recommendations submitted to
Council
Good Governance and Public
Participation
1 1 1 1 4 4 G
TL73 Conduct quarterly MPAC meetings.
Four quarterly MPACs meetings
held
Good Governance and Public
Participation
1 1 1 1 4 4 G
TL74 Convene Ethics committee
meetings and present recommendations to council.
Ethics/Rules committee
meetings and recommendations
presented
Good Governance and Public
Participation
1 1 1 1 4 0 R
Corrective Measure No quorum for meetings. Proper planning will ensure meetings will take place within the next financial year
*Please note: The municipality has no wards because it is a district municipality
Top Layer SDBIP – District must ensure that the Section 79 and 80 committees are functional and that are monitoring mechanism in
place.
e) District to ensure full compliance with municipal Supply Chain Regulations and Policy
Ref Strategy KPI National KPA
Overall Performance 2015/16
Targets Actual Performance Q1 Q2 Q3 Q4 Annual
TL2 Establish a fully functional Supply Chain Management
Unit
SCM Unit fully establish by June
2016
Municipal Financial
Viability and Management
0 0 0 1 1 1 G
TL3 Strict compliance with the Supply Chain Management
Policy
Strict compliance with the Supply
Chain Management Policy
Municipal Financial
Viability and Management
100% 100% 100% 100% 100% 100% G
*Please note: The municipality has no wards because it is a district municipality
Top Layer SDBIP – District to ensure full compliance with municipal Supply Chain Regulations and Policy
f) District to ensure that it submit GAMAP/GRAP compliant financial statements
Ref Strategy KPI National KPA
Overall Performance 2015/16
Targets Actual Performance Q1 Q2 Q3 Q4 Annual
TL4
Submission of the GAMAP/GRAP Financial statements by the end of August 2015 and Sect 46
report.
Submission of annual financial
statements within the prescribed
timeframe.
Municipal Financial
Viability and Management
1 0 0 0 1 1 G
*Please note: The municipality has no wards because it is a district municipality
Top Layer SDBIP – District to ensure that it submit GAMAP/GRAP compliant financial statements.
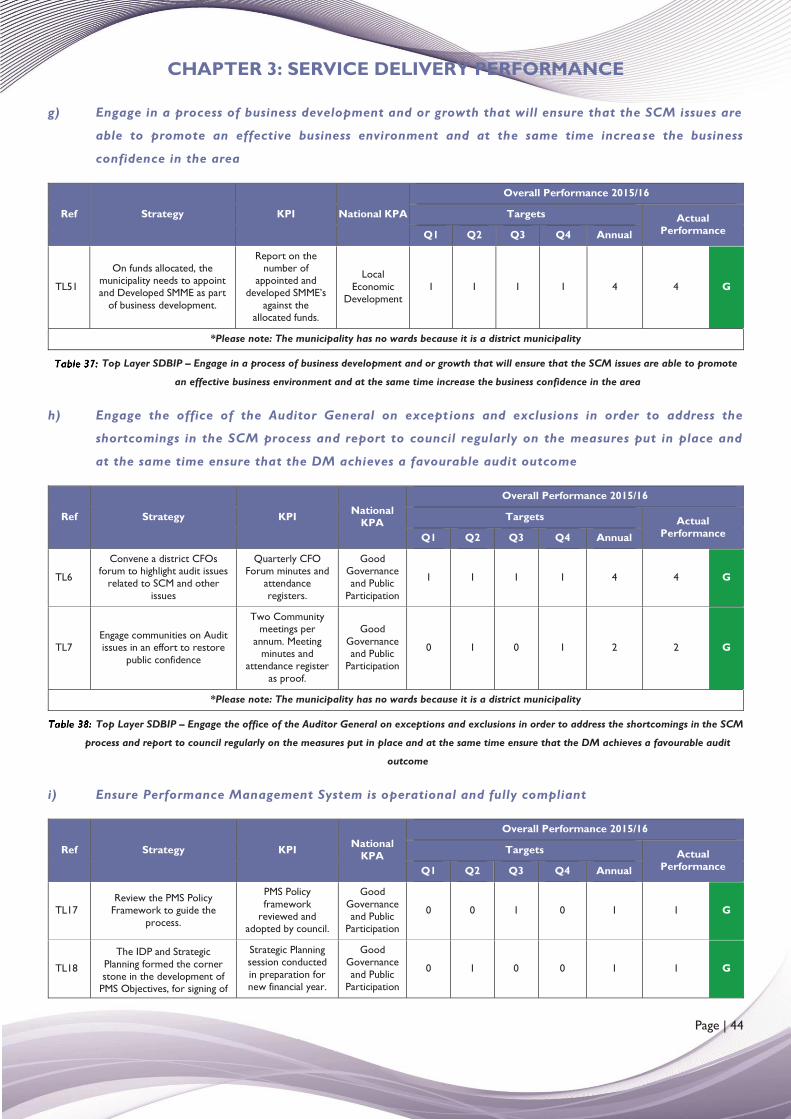
CHAPTER 3: SERVICE DELIVERY PERFORMANCE
Page | 44
g) Engage in a process of business development and or growth that will ensure that the SCM issues are
able to promote an effective business environment and at the same time increa se the business
confidence in the area
Ref Strategy KPI National KPA
Overall Performance 2015/16
Targets Actual Performance Q1 Q2 Q3 Q4 Annual
TL51
On funds allocated, the municipality needs to appoint and Developed SMME as part
of business development.
Report on the number of
appointed and developed SMME’s
against the allocated funds.
Local Economic
Development 1 1 1 1 4 4 G
*Please note: The municipality has no wards because it is a district municipality
Top Layer SDBIP – Engage in a process of business development and or growth that will ensure that the SCM issues are able to promote
an effective business environment and at the same time increase the business confidence in the area
h) Engage the office of the Auditor General on exceptions and exclusions in order to address the
shortcomings in the SCM process and report to council regularly on the measures put in place and
at the same time ensure that the DM achieves a favourable audit outcome
Ref Strategy KPI National KPA
Overall Performance 2015/16
Targets Actual Performance Q1 Q2 Q3 Q4 Annual
TL6
Convene a district CFOs forum to highlight audit issues
related to SCM and other issues
Quarterly CFO Forum minutes and
attendance registers.
Good Governance and Public
Participation
1 1 1 1 4 4 G
TL7 Engage communities on Audit issues in an effort to restore
public confidence
Two Community meetings per
annum. Meeting minutes and
attendance register as proof.
Good Governance and Public
Participation
0 1 0 1 2 2 G
*Please note: The municipality has no wards because it is a district municipality
Top Layer SDBIP – Engage the office of the Auditor General on exceptions and exclusions in order to address the shortcomings in the SCM
process and report to council regularly on the measures put in place and at the same time ensure that the DM achieves a favourable audit
outcome
i) Ensure Performance Management System is operational and fully compliant
Ref Strategy KPI National KPA
Overall Performance 2015/16
Targets Actual Performance Q1 Q2 Q3 Q4 Annual
TL17 Review the PMS Policy
Framework to guide the process.
PMS Policy framework
reviewed and adopted by council.
Good Governance and Public
Participation
0 0 1 0 1 1 G
TL18
The IDP and Strategic Planning formed the corner stone in the development of
PMS Objectives, for signing of
Strategic Planning session conducted in preparation for new financial year.
Good Governance and Public
Participation
0 1 0 0 1 1 G
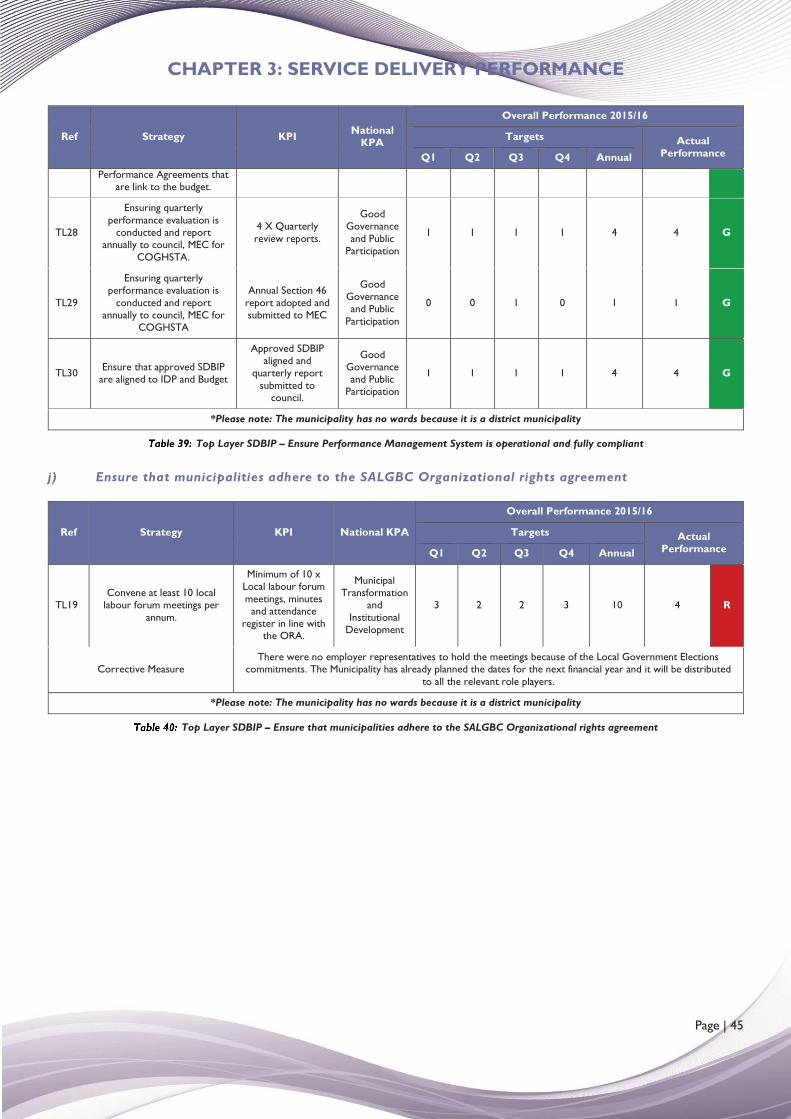
CHAPTER 3: SERVICE DELIVERY PERFORMANCE
Page | 45
Ref Strategy KPI National KPA
Overall Performance 2015/16
Targets Actual Performance Q1 Q2 Q3 Q4 Annual
Performance Agreements that are link to the budget.
TL28
Ensuring quarterly performance evaluation is
conducted and report annually to council, MEC for
COGHSTA.
4 X Quarterly review reports.
Good Governance and Public
Participation
1 1 1 1 4 4 G
TL29
Ensuring quarterly performance evaluation is
conducted and report annually to council, MEC for
COGHSTA
Annual Section 46 report adopted and submitted to MEC
Good Governance and Public
Participation
0 0 1 0 1 1 G
TL30 Ensure that approved SDBIP are aligned to IDP and Budget
Approved SDBIP aligned and
quarterly report submitted to
council.
Good Governance and Public
Participation
1 1 1 1 4 4 G
*Please note: The municipality has no wards because it is a district municipality
Top Layer SDBIP – Ensure Performance Management System is operational and fully compliant
j) Ensure that municipalities adhere to the SALGBC Organizational rights agreement
Ref Strategy KPI National KPA
Overall Performance 2015/16
Targets Actual Performance Q1 Q2 Q3 Q4 Annual
TL19 Convene at least 10 local
labour forum meetings per annum.
Minimum of 10 x Local labour forum meetings, minutes
and attendance register in line with
the ORA.
Municipal Transformation
and Institutional
Development
3 2 2 3 10 4 R
Corrective Measure There were no employer representatives to hold the meetings because of the Local Government Elections
commitments. The Municipality has already planned the dates for the next financial year and it will be distributed to all the relevant role players.
*Please note: The municipality has no wards because it is a district municipality
Top Layer SDBIP – Ensure that municipalities adhere to the SALGBC Organizational rights agreement
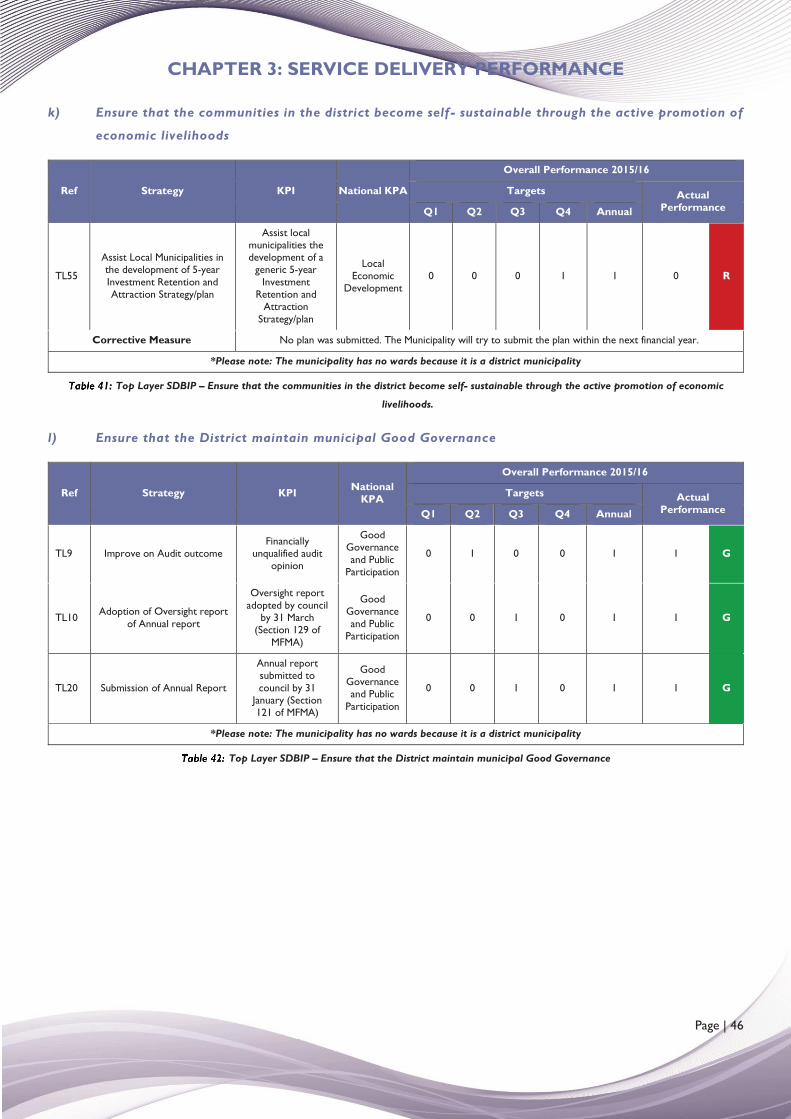
CHAPTER 3: SERVICE DELIVERY PERFORMANCE
Page | 46
k) Ensure that the communities in the district become self - sustainable through the active promotion of
economic livelihoods
Ref Strategy KPI National KPA
Overall Performance 2015/16
Targets Actual Performance Q1 Q2 Q3 Q4 Annual
TL55
Assist Local Municipalities in the development of 5-year Investment Retention and Attraction Strategy/plan
Assist local municipalities the development of a
generic 5-year Investment
Retention and Attraction
Strategy/plan
Local Economic
Development 0 0 0 1 1 0 R
Corrective Measure No plan was submitted. The Municipality will try to submit the plan within the next financial year.
*Please note: The municipality has no wards because it is a district municipality
Top Layer SDBIP – Ensure that the communities in the district become self- sustainable through the active promotion of economic
livelihoods.
l) Ensure that the District maintain municipal Good Governance
Ref Strategy KPI National KPA
Overall Performance 2015/16
Targets Actual Performance Q1 Q2 Q3 Q4 Annual
TL9 Improve on Audit outcome Financially
unqualified audit opinion
Good Governance and Public
Participation
0 1 0 0 1 1 G
TL10 Adoption of Oversight report of Annual report
Oversight report adopted by council
by 31 March (Section 129 of
MFMA)
Good Governance and Public
Participation
0 0 1 0 1 1 G
TL20 Submission of Annual Report
Annual report submitted to council by 31
January (Section 121 of MFMA)
Good Governance and Public
Participation
0 0 1 0 1 1 G
*Please note: The municipality has no wards because it is a district municipality
Top Layer SDBIP – Ensure that the District maintain municipal Good Governance
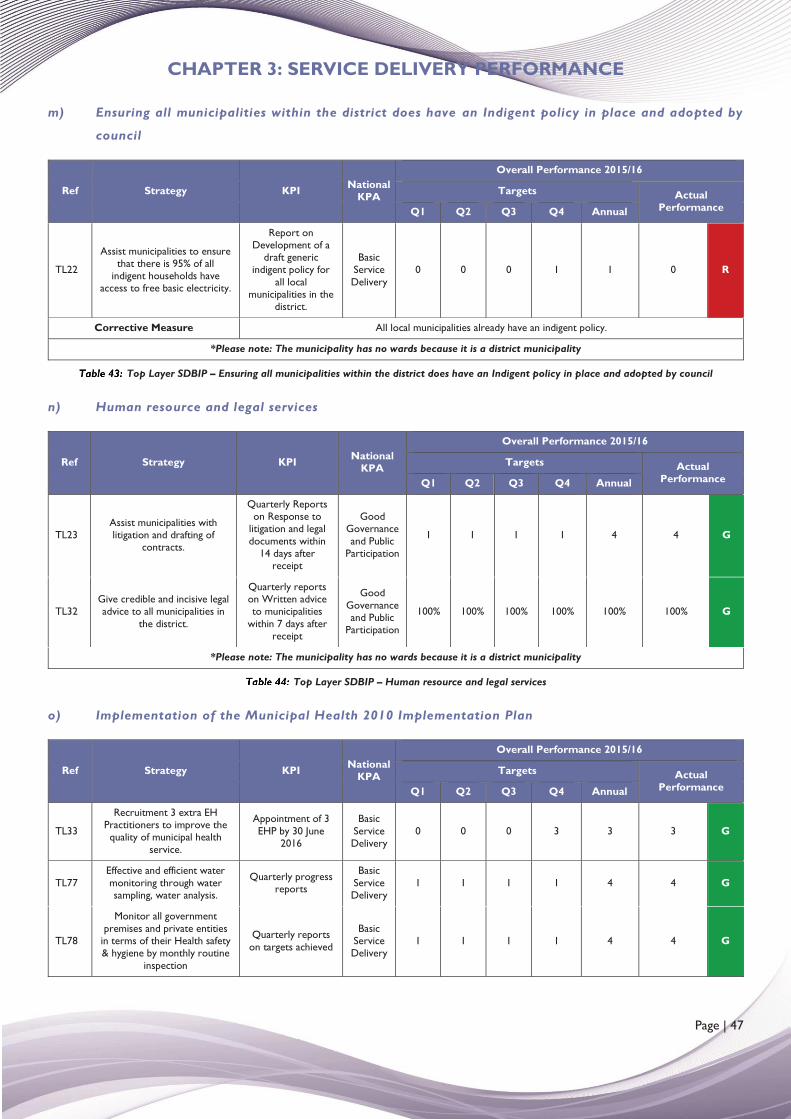
CHAPTER 3: SERVICE DELIVERY PERFORMANCE
Page | 47
m) Ensuring all municipalities within the district does have an Indigent policy in place and adopted by
council
Ref Strategy KPI National KPA
Overall Performance 2015/16
Targets Actual Performance Q1 Q2 Q3 Q4 Annual
TL22
Assist municipalities to ensure that there is 95% of all
indigent households have access to free basic electricity.
Report on Development of a
draft generic indigent policy for
all local municipalities in the
district.
Basic Service Delivery
0 0 0 1 1 0 R
Corrective Measure All local municipalities already have an indigent policy.
*Please note: The municipality has no wards because it is a district municipality
Top Layer SDBIP – Ensuring all municipalities within the district does have an Indigent policy in place and adopted by council
n) Human resource and legal services
Ref Strategy KPI National KPA
Overall Performance 2015/16
Targets Actual Performance Q1 Q2 Q3 Q4 Annual
TL23 Assist municipalities with litigation and drafting of
contracts.
Quarterly Reports on Response to
litigation and legal documents within
14 days after receipt
Good Governance and Public
Participation
1 1 1 1 4 4 G
TL32 Give credible and incisive legal advice to all municipalities in
the district.
Quarterly reports on Written advice to municipalities
within 7 days after receipt
Good Governance and Public
Participation
100% 100% 100% 100% 100% 100% G
*Please note: The municipality has no wards because it is a district municipality
Top Layer SDBIP – Human resource and legal services
o) Implementation of the Municipal Health 2010 Implementation Plan
Ref Strategy KPI National KPA
Overall Performance 2015/16
Targets Actual Performance Q1 Q2 Q3 Q4 Annual
TL33
Recruitment 3 extra EH Practitioners to improve the quality of municipal health
service.
Appointment of 3 EHP by 30 June
2016
Basic Service Delivery
0 0 0 3 3 3 G
TL77 Effective and efficient water monitoring through water sampling, water analysis.
Quarterly progress reports
Basic Service Delivery
1 1 1 1 4 4 G
TL78
Monitor all government premises and private entities
in terms of their Health safety & hygiene by monthly routine
inspection
Quarterly reports on targets achieved
Basic Service Delivery
1 1 1 1 4 4 G
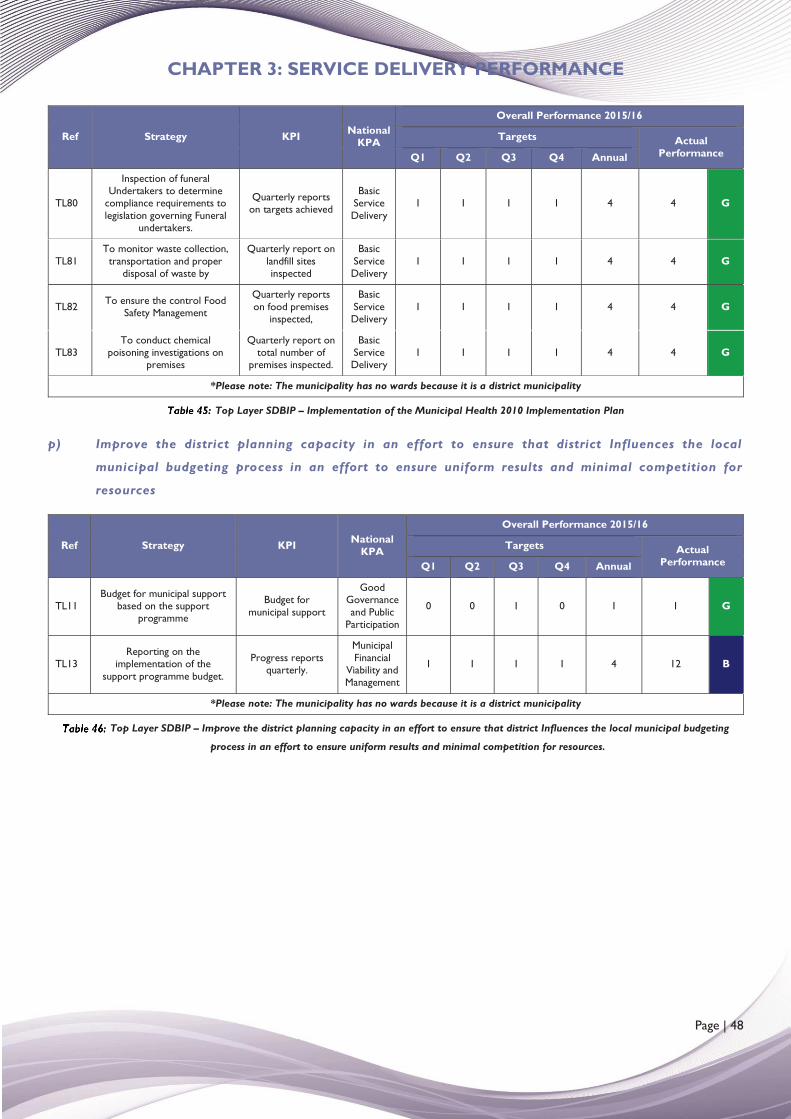
CHAPTER 3: SERVICE DELIVERY PERFORMANCE
Page | 48
Ref Strategy KPI National KPA
Overall Performance 2015/16
Targets Actual Performance Q1 Q2 Q3 Q4 Annual
TL80
Inspection of funeral Undertakers to determine
compliance requirements to legislation governing Funeral
undertakers.
Quarterly reports on targets achieved
Basic Service Delivery
1 1 1 1 4 4 G
TL81 To monitor waste collection,
transportation and proper disposal of waste by
Quarterly report on landfill sites inspected
Basic Service Delivery
1 1 1 1 4 4 G
TL82 To ensure the control Food Safety Management
Quarterly reports on food premises
inspected,
Basic Service Delivery
1 1 1 1 4 4 G
TL83 To conduct chemical
poisoning investigations on premises
Quarterly report on total number of
premises inspected.
Basic Service Delivery
1 1 1 1 4 4 G
*Please note: The municipality has no wards because it is a district municipality
Top Layer SDBIP – Implementation of the Municipal Health 2010 Implementation Plan
p) Improve the district planning capacity in an effort to ensure that district Influences the local
municipal budgeting process in an effort to ensure uniform results and minimal competition for
resources
Ref Strategy KPI National KPA
Overall Performance 2015/16
Targets Actual Performance Q1 Q2 Q3 Q4 Annual
TL11 Budget for municipal support
based on the support programme
Budget for municipal support
Good Governance and Public
Participation
0 0 1 0 1 1 G
TL13 Reporting on the
implementation of the support programme budget.
Progress reports quarterly.
Municipal Financial
Viability and Management
1 1 1 1 4 12 B
*Please note: The municipality has no wards because it is a district municipality
Top Layer SDBIP – Improve the district planning capacity in an effort to ensure that district Influences the local municipal budgeting
process in an effort to ensure uniform results and minimal competition for resources.
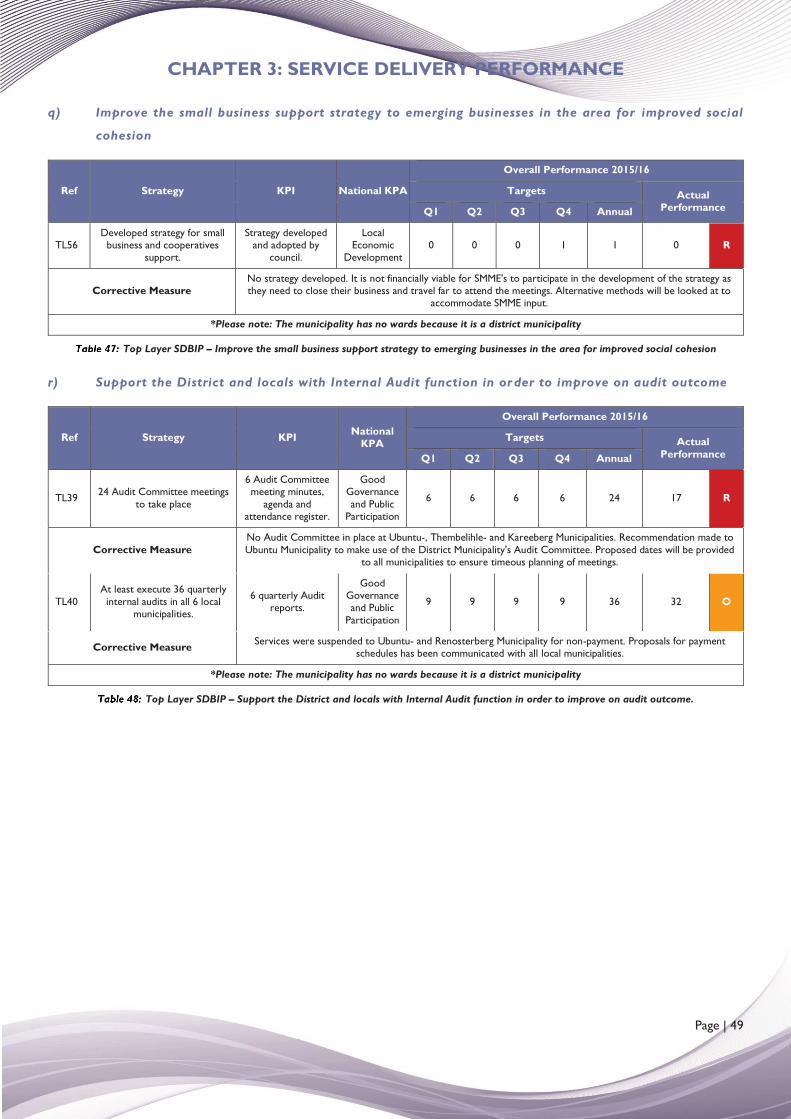
CHAPTER 3: SERVICE DELIVERY PERFORMANCE
Page | 49
q) Improve the small business support strategy to emerging businesses in the area for improved social
cohesion
Ref Strategy KPI National KPA
Overall Performance 2015/16
Targets Actual Performance Q1 Q2 Q3 Q4 Annual
TL56 Developed strategy for small
business and cooperatives support.
Strategy developed and adopted by
council.
Local Economic
Development 0 0 0 1 1 0 R
Corrective Measure No strategy developed. It is not financially viable for SMME's to participate in the development of the strategy as they need to close their business and travel far to attend the meetings. Alternative methods will be looked at to
accommodate SMME input.
*Please note: The municipality has no wards because it is a district municipality
Top Layer SDBIP – Improve the small business support strategy to emerging businesses in the area for improved social cohesion
r) Support the District and locals with Internal Audit function in order to improve on audit outcome
Ref Strategy KPI National KPA
Overall Performance 2015/16
Targets Actual Performance Q1 Q2 Q3 Q4 Annual
TL39 24 Audit Committee meetings to take place
6 Audit Committee meeting minutes,
agenda and attendance register.
Good Governance and Public
Participation
6 6 6 6 24 17 R
Corrective Measure No Audit Committee in place at Ubuntu-, Thembelihle- and Kareeberg Municipalities. Recommendation made to Ubuntu Municipality to make use of the District Municipality's Audit Committee. Proposed dates will be provided
to all municipalities to ensure timeous planning of meetings.
TL40 At least execute 36 quarterly internal audits in all 6 local
municipalities.
6 quarterly Audit reports.
Good Governance and Public
Participation
9 9 9 9 36 32 O
Corrective Measure Services were suspended to Ubuntu- and Renosterberg Municipality for non-payment. Proposals for payment schedules has been communicated with all local municipalities.
*Please note: The municipality has no wards because it is a district municipality
Top Layer SDBIP – Support the District and locals with Internal Audit function in order to improve on audit outcome.
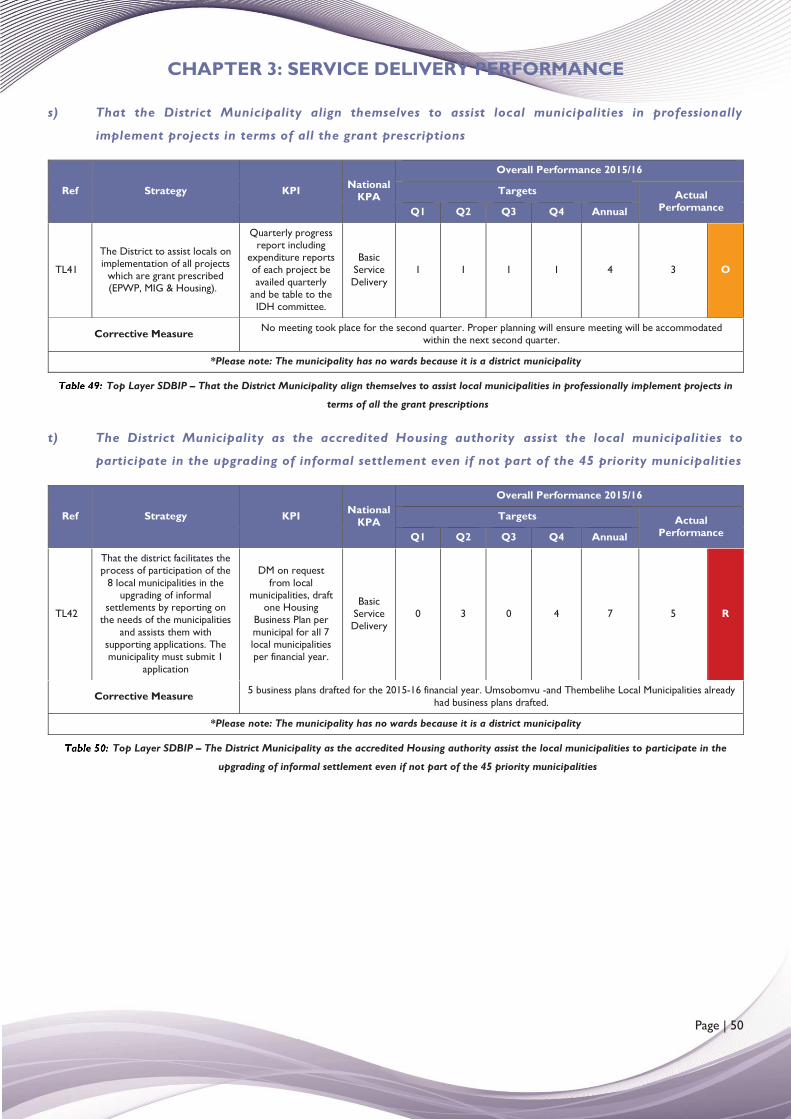
CHAPTER 3: SERVICE DELIVERY PERFORMANCE
Page | 50
s) That the District Municipality align themselves to assist local municipalities in professionally
implement projects in terms of all the grant prescriptions
Ref Strategy KPI National KPA
Overall Performance 2015/16
Targets Actual Performance Q1 Q2 Q3 Q4 Annual
TL41
The District to assist locals on implementation of all projects
which are grant prescribed (EPWP, MIG & Housing).
Quarterly progress report including
expenditure reports of each project be availed quarterly
and be table to the IDH committee.
Basic Service Delivery
1 1 1 1 4 3 O
Corrective Measure No meeting took place for the second quarter. Proper planning will ensure meeting will be accommodated within the next second quarter.
*Please note: The municipality has no wards because it is a district municipality
Top Layer SDBIP – That the District Municipality align themselves to assist local municipalities in professionally implement projects in
terms of all the grant prescriptions
t) The District Municipality as the accredited Housing authority assist the local municipalities to
participate in the upgrading of informal settlement even if not part of the 45 priority municipalities
Ref Strategy KPI National KPA
Overall Performance 2015/16
Targets Actual Performance Q1 Q2 Q3 Q4 Annual
TL42
That the district facilitates the process of participation of the
8 local municipalities in the upgrading of informal
settlements by reporting on the needs of the municipalities
and assists them with supporting applications. The municipality must submit 1
application
DM on request from local
municipalities, draft one Housing
Business Plan per municipal for all 7 local municipalities per financial year.
Basic Service Delivery
0 3 0 4 7 5 R
Corrective Measure 5 business plans drafted for the 2015-16 financial year. Umsobomvu -and Thembelihe Local Municipalities already had business plans drafted.
*Please note: The municipality has no wards because it is a district municipality
Top Layer SDBIP – The District Municipality as the accredited Housing authority assist the local municipalities to participate in the
upgrading of informal settlement even if not part of the 45 priority municipalities
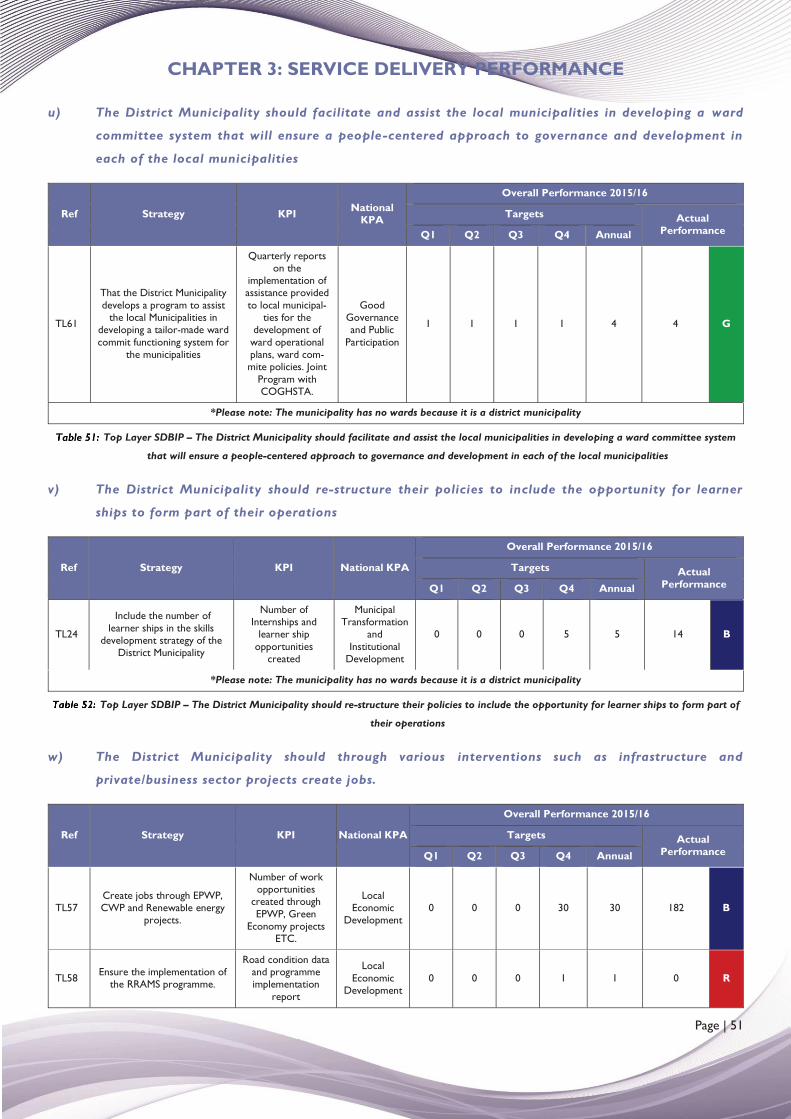
CHAPTER 3: SERVICE DELIVERY PERFORMANCE
Page | 51
u) The District Municipality should facilitate and assist the local municipalities in developing a ward
committee system that will ensure a people-centered approach to governance and development in
each of the local municipalities
Ref Strategy KPI National KPA
Overall Performance 2015/16
Targets Actual Performance Q1 Q2 Q3 Q4 Annual
TL61
That the District Municipality develops a program to assist
the local Municipalities in developing a tailor-made ward commit functioning system for
the municipalities
Quarterly reports on the
implementation of assistance provided to local municipal-
ties for the development of
ward operational plans, ward com-mite policies. Joint
Program with COGHSTA.
Good Governance and Public
Participation
1 1 1 1 4 4 G
*Please note: The municipality has no wards because it is a district municipality
Top Layer SDBIP – The District Municipality should facilitate and assist the local municipalities in developing a ward committee system
that will ensure a people-centered approach to governance and development in each of the local municipalities
v) The District Municipality should re-structure their policies to include the opportunity for learner
ships to form part of their operations
Ref Strategy KPI National KPA
Overall Performance 2015/16
Targets Actual Performance Q1 Q2 Q3 Q4 Annual
TL24
Include the number of learner ships in the skills
development strategy of the District Municipality
Number of Internships and
learner ship opportunities
created
Municipal Transformation
and Institutional
Development
0 0 0 5 5 14 B
*Please note: The municipality has no wards because it is a district municipality
Top Layer SDBIP – The District Municipality should re-structure their policies to include the opportunity for learner ships to form part of
their operations
w) The District Municipality should through various interventions such as infrastructure and
private/business sector projects create jobs.
Ref Strategy KPI National KPA
Overall Performance 2015/16
Targets Actual Performance Q1 Q2 Q3 Q4 Annual
TL57 Create jobs through EPWP, CWP and Renewable energy
projects.
Number of work opportunities
created through EPWP, Green
Economy projects ETC.
Local Economic
Development 0 0 0 30 30 182 B
TL58 Ensure the implementation of the RRAMS programme.
Road condition data and programme implementation
report
Local Economic
Development 0 0 0 1 1 0 R
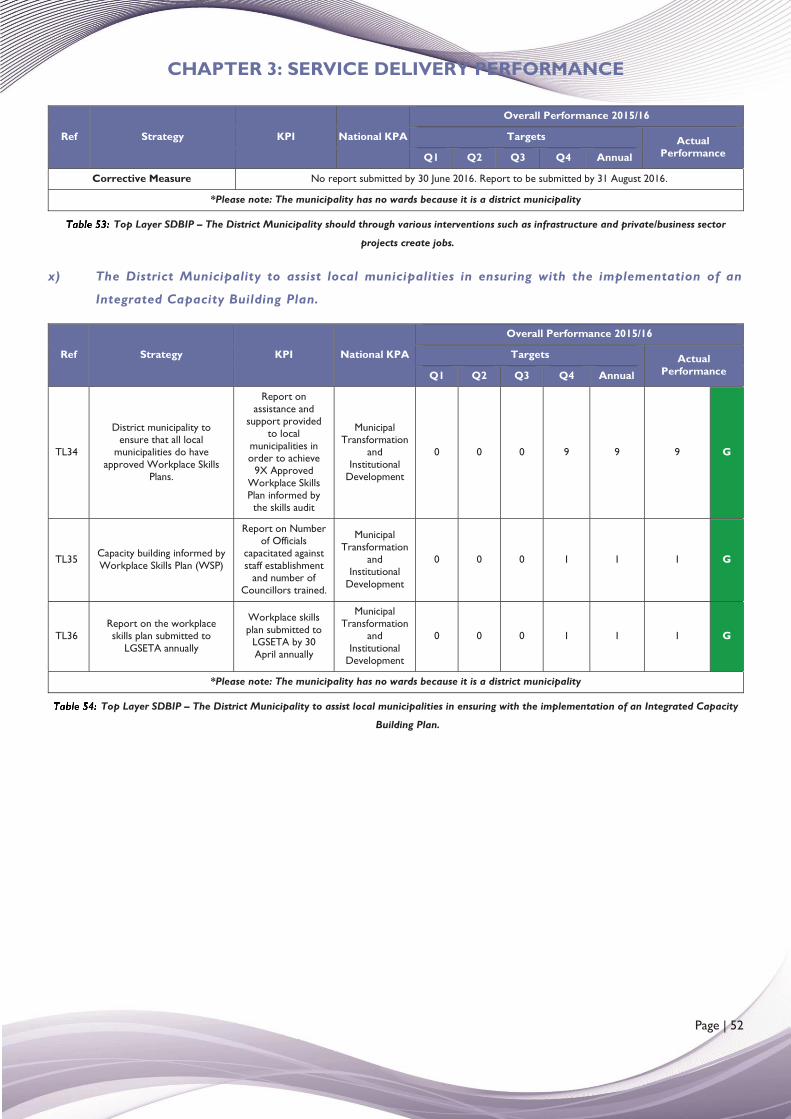
CHAPTER 3: SERVICE DELIVERY PERFORMANCE
Page | 52
Ref Strategy KPI National KPA
Overall Performance 2015/16
Targets Actual Performance Q1 Q2 Q3 Q4 Annual
Corrective Measure No report submitted by 30 June 2016. Report to be submitted by 31 August 2016.
*Please note: The municipality has no wards because it is a district municipality
Top Layer SDBIP – The District Municipality should through various interventions such as infrastructure and private/business sector
projects create jobs.
x) The District Municipality to assist local municipalities in ensuring with the implementation of an
Integrated Capacity Building Plan.
Ref Strategy KPI National KPA
Overall Performance 2015/16
Targets Actual Performance Q1 Q2 Q3 Q4 Annual
TL34
District municipality to ensure that all local
municipalities do have approved Workplace Skills
Plans.
Report on assistance and
support provided to local
municipalities in order to achieve
9X Approved Workplace Skills Plan informed by the skills audit
Municipal Transformation
and Institutional
Development
0 0 0 9 9 9 G
TL35 Capacity building informed by Workplace Skills Plan (WSP)
Report on Number of Officials
capacitated against staff establishment
and number of Councillors trained.
Municipal Transformation
and Institutional
Development
0 0 0 1 1 1 G
TL36 Report on the workplace skills plan submitted to
LGSETA annually
Workplace skills plan submitted to
LGSETA by 30 April annually
Municipal Transformation
and Institutional
Development
0 0 0 1 1 1 G
*Please note: The municipality has no wards because it is a district municipality
Top Layer SDBIP – The District Municipality to assist local municipalities in ensuring with the implementation of an Integrated Capacity
Building Plan.
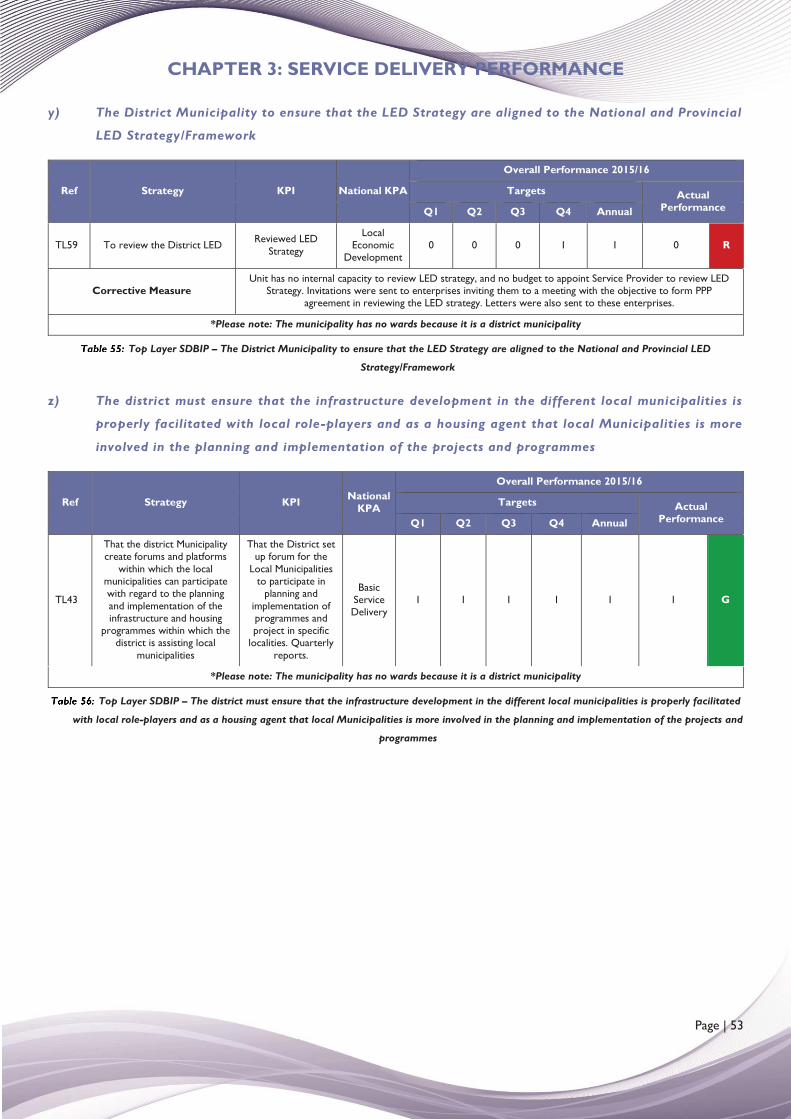
CHAPTER 3: SERVICE DELIVERY PERFORMANCE
Page | 53
y) The District Municipality to ensure that the LED Strategy are aligned to the National and Provincial
LED Strategy/Framework
Ref Strategy KPI National KPA
Overall Performance 2015/16
Targets Actual Performance Q1 Q2 Q3 Q4 Annual
TL59 To review the District LED Reviewed LED Strategy
Local Economic
Development 0 0 0 1 1 0 R
Corrective Measure Unit has no internal capacity to review LED strategy, and no budget to appoint Service Provider to review LED
Strategy. Invitations were sent to enterprises inviting them to a meeting with the objective to form PPP agreement in reviewing the LED strategy. Letters were also sent to these enterprises.
*Please note: The municipality has no wards because it is a district municipality
Top Layer SDBIP – The District Municipality to ensure that the LED Strategy are aligned to the National and Provincial LED
Strategy/Framework
z) The district must ensure that the infrastructure development in the different local municipalities is
properly facilitated with local role-players and as a housing agent that local Municipalities is more
involved in the planning and implementation of the projects and programmes
Ref Strategy KPI National KPA
Overall Performance 2015/16
Targets Actual Performance Q1 Q2 Q3 Q4 Annual
TL43
That the district Municipality create forums and platforms
within which the local municipalities can participate with regard to the planning and implementation of the infrastructure and housing
programmes within which the district is assisting local
municipalities
That the District set up forum for the
Local Municipalities to participate in
planning and implementation of programmes and project in specific
localities. Quarterly reports.
Basic Service Delivery
1 1 1 1 1 1 G
*Please note: The municipality has no wards because it is a district municipality
Top Layer SDBIP – The district must ensure that the infrastructure development in the different local municipalities is properly facilitated
with local role-players and as a housing agent that local Municipalities is more involved in the planning and implementation of the projects and
programmes
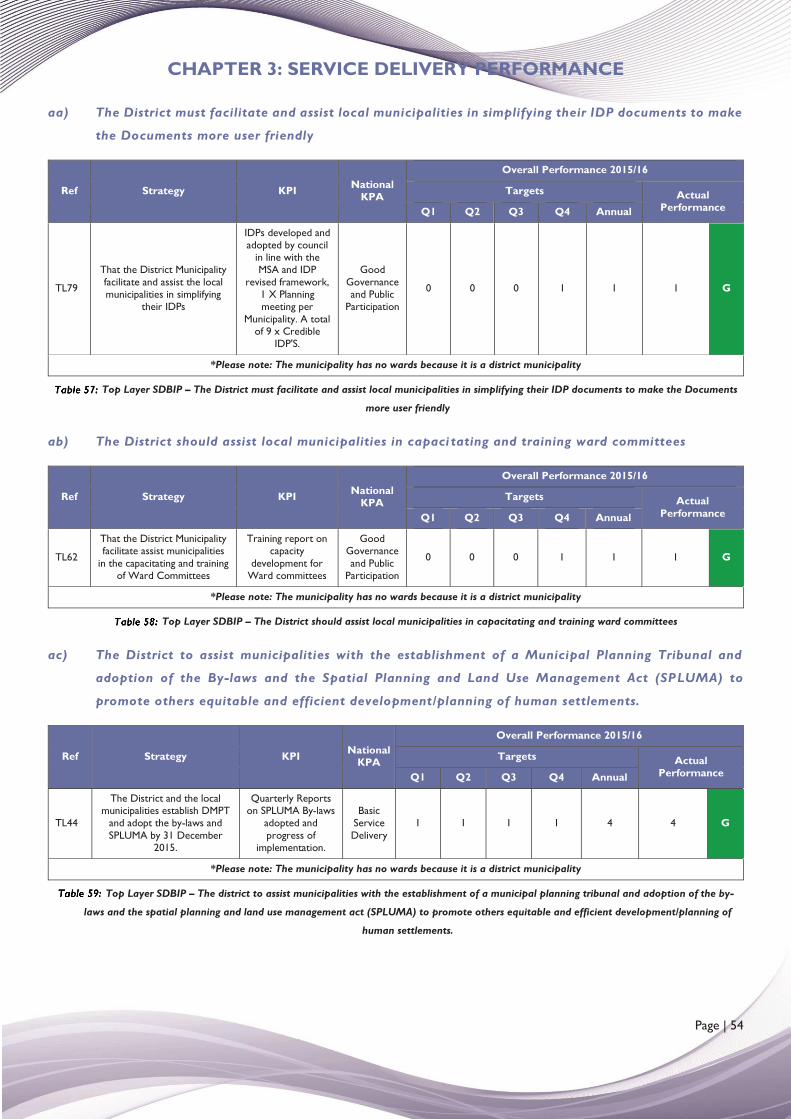
CHAPTER 3: SERVICE DELIVERY PERFORMANCE
Page | 54
aa) The District must facilitate and assist local municipalities in simplifying their IDP documents to make
the Documents more user friendly
Ref Strategy KPI National KPA
Overall Performance 2015/16
Targets Actual Performance Q1 Q2 Q3 Q4 Annual
TL79
That the District Municipality facilitate and assist the local municipalities in simplifying
their IDPs
IDPs developed and adopted by council
in line with the MSA and IDP
revised framework, 1 X Planning meeting per
Municipality. A total of 9 x Credible
IDP'S.
Good Governance and Public
Participation
0 0 0 1 1 1 G
*Please note: The municipality has no wards because it is a district municipality
Top Layer SDBIP – The District must facilitate and assist local municipalities in simplifying their IDP documents to make the Documents
more user friendly
ab) The District should assist local municipalities in capaci tating and training ward committees
Ref Strategy KPI National KPA
Overall Performance 2015/16
Targets Actual Performance Q1 Q2 Q3 Q4 Annual
TL62
That the District Municipality facilitate assist municipalities
in the capacitating and training of Ward Committees
Training report on capacity
development for Ward committees
Good Governance and Public
Participation
0 0 0 1 1 1 G
*Please note: The municipality has no wards because it is a district municipality
Top Layer SDBIP – The District should assist local municipalities in capacitating and training ward committees
ac) The District to assist municipalities with the establishment of a Municipal Planning Tribunal and
adoption of the By-laws and the Spatial Planning and Land Use Management Act (SPLUMA) to
promote others equitable and efficient development/planning of human settlements.
Ref Strategy KPI National KPA
Overall Performance 2015/16
Targets Actual Performance Q1 Q2 Q3 Q4 Annual
TL44
The District and the local municipalities establish DMPT
and adopt the by-laws and SPLUMA by 31 December
2015.
Quarterly Reports on SPLUMA By-laws
adopted and progress of
implementation.
Basic Service Delivery
1 1 1 1 4 4 G
*Please note: The municipality has no wards because it is a district municipality
Top Layer SDBIP – The district to assist municipalities with the establishment of a municipal planning tribunal and adoption of the by-
laws and the spatial planning and land use management act (SPLUMA) to promote others equitable and efficient development/planning of
human settlements.
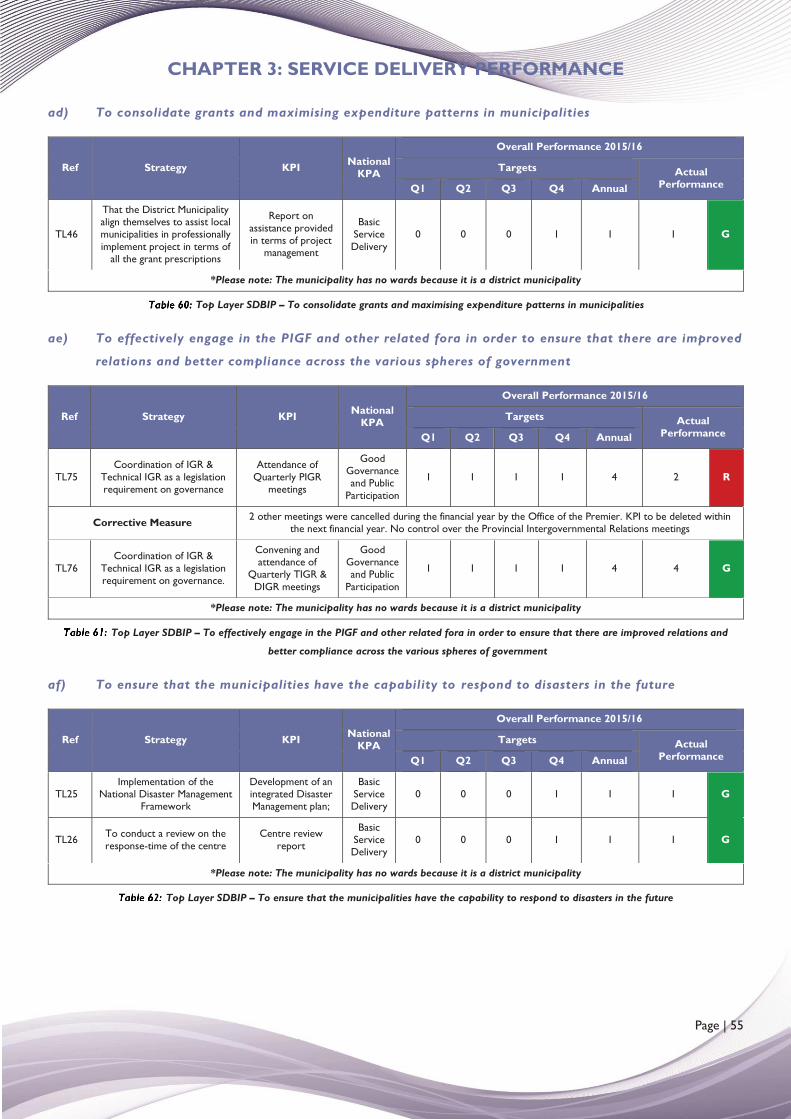
CHAPTER 3: SERVICE DELIVERY PERFORMANCE
Page | 55
ad) To consolidate grants and maximising expenditure patterns in municipalities
Ref Strategy KPI National KPA
Overall Performance 2015/16
Targets Actual Performance Q1 Q2 Q3 Q4 Annual
TL46
That the District Municipality align themselves to assist local municipalities in professionally implement project in terms of
all the grant prescriptions
Report on assistance provided in terms of project
management
Basic Service Delivery
0 0 0 1 1 1 G
*Please note: The municipality has no wards because it is a district municipality
Top Layer SDBIP – To consolidate grants and maximising expenditure patterns in municipalities
ae) To effectively engage in the PIGF and other related fora in order to ensure that there are improved
relations and better compliance across the various spheres of government
Ref Strategy KPI National KPA
Overall Performance 2015/16
Targets Actual Performance Q1 Q2 Q3 Q4 Annual
TL75 Coordination of IGR &
Technical IGR as a legislation requirement on governance
Attendance of Quarterly PIGR
meetings
Good Governance and Public
Participation
1 1 1 1 4 2 R
Corrective Measure 2 other meetings were cancelled during the financial year by the Office of the Premier. KPI to be deleted within the next financial year. No control over the Provincial Intergovernmental Relations meetings
TL76 Coordination of IGR &
Technical IGR as a legislation requirement on governance.
Convening and attendance of
Quarterly TIGR & DIGR meetings
Good Governance and Public
Participation
1 1 1 1 4 4 G
*Please note: The municipality has no wards because it is a district municipality
Top Layer SDBIP – To effectively engage in the PIGF and other related fora in order to ensure that there are improved relations and
better compliance across the various spheres of government
af) To ensure that the municipalities have the capability to respond to disasters in the future
Ref Strategy KPI National KPA
Overall Performance 2015/16
Targets Actual Performance Q1 Q2 Q3 Q4 Annual
TL25 Implementation of the
National Disaster Management Framework
Development of an integrated Disaster Management plan;
Basic Service Delivery
0 0 0 1 1 1 G
TL26 To conduct a review on the response-time of the centre
Centre review report
Basic Service Delivery
0 0 0 1 1 1 G
*Please note: The municipality has no wards because it is a district municipality
Top Layer SDBIP – To ensure that the municipalities have the capability to respond to disasters in the future
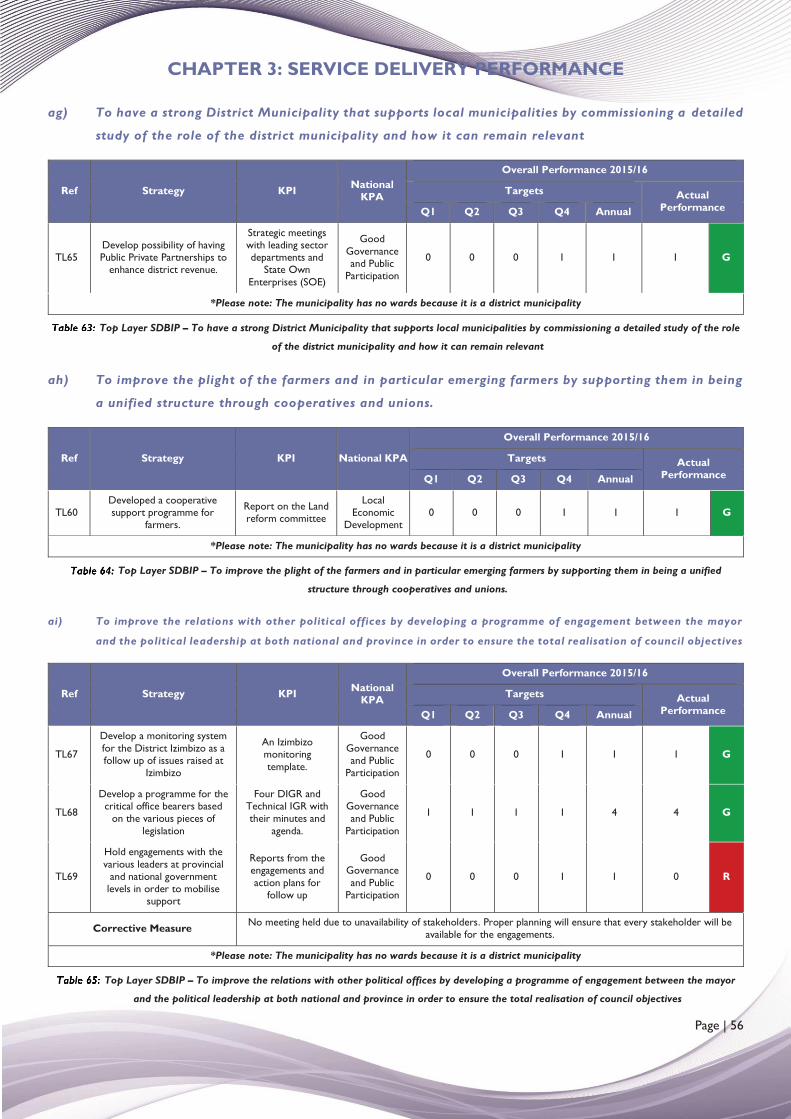
CHAPTER 3: SERVICE DELIVERY PERFORMANCE
Page | 56
ag) To have a strong District Municipality that supports local municipalities by commissioning a detailed
study of the role of the district municipality and how it can remain relevant
Ref Strategy KPI National KPA
Overall Performance 2015/16
Targets Actual Performance Q1 Q2 Q3 Q4 Annual
TL65 Develop possibility of having Public Private Partnerships to
enhance district revenue.
Strategic meetings with leading sector departments and
State Own Enterprises (SOE)
Good Governance and Public
Participation
0 0 0 1 1 1 G
*Please note: The municipality has no wards because it is a district municipality
Top Layer SDBIP – To have a strong District Municipality that supports local municipalities by commissioning a detailed study of the role
of the district municipality and how it can remain relevant
ah) To improve the plight of the farmers and in particular emerging farmers by supporting them in being
a unified structure through cooperatives and unions.
Ref Strategy KPI National KPA
Overall Performance 2015/16
Targets Actual Performance Q1 Q2 Q3 Q4 Annual
TL60 Developed a cooperative support programme for
farmers.
Report on the Land reform committee
Local Economic
Development 0 0 0 1 1 1 G
*Please note: The municipality has no wards because it is a district municipality
Top Layer SDBIP – To improve the plight of the farmers and in particular emerging farmers by supporting them in being a unified
structure through cooperatives and unions.
ai) To improve the relations with other political offices by developing a programme of engagement between the mayor
and the political leadership at both national and province in order to ensure the total realisation of council objectives
Ref Strategy KPI National KPA
Overall Performance 2015/16
Targets Actual Performance Q1 Q2 Q3 Q4 Annual
TL67
Develop a monitoring system for the District Izimbizo as a follow up of issues raised at
Izimbizo
An Izimbizo monitoring template.
Good Governance and Public
Participation
0 0 0 1 1 1 G
TL68
Develop a programme for the critical office bearers based
on the various pieces of legislation
Four DIGR and Technical IGR with their minutes and
agenda.
Good Governance and Public
Participation
1 1 1 1 4 4 G
TL69
Hold engagements with the various leaders at provincial
and national government levels in order to mobilise
support
Reports from the engagements and action plans for
follow up
Good Governance and Public
Participation
0 0 0 1 1 0 R
Corrective Measure No meeting held due to unavailability of stakeholders. Proper planning will ensure that every stakeholder will be available for the engagements.
*Please note: The municipality has no wards because it is a district municipality
Top Layer SDBIP – To improve the relations with other political offices by developing a programme of engagement between the mayor
and the political leadership at both national and province in order to ensure the total realisation of council objectives
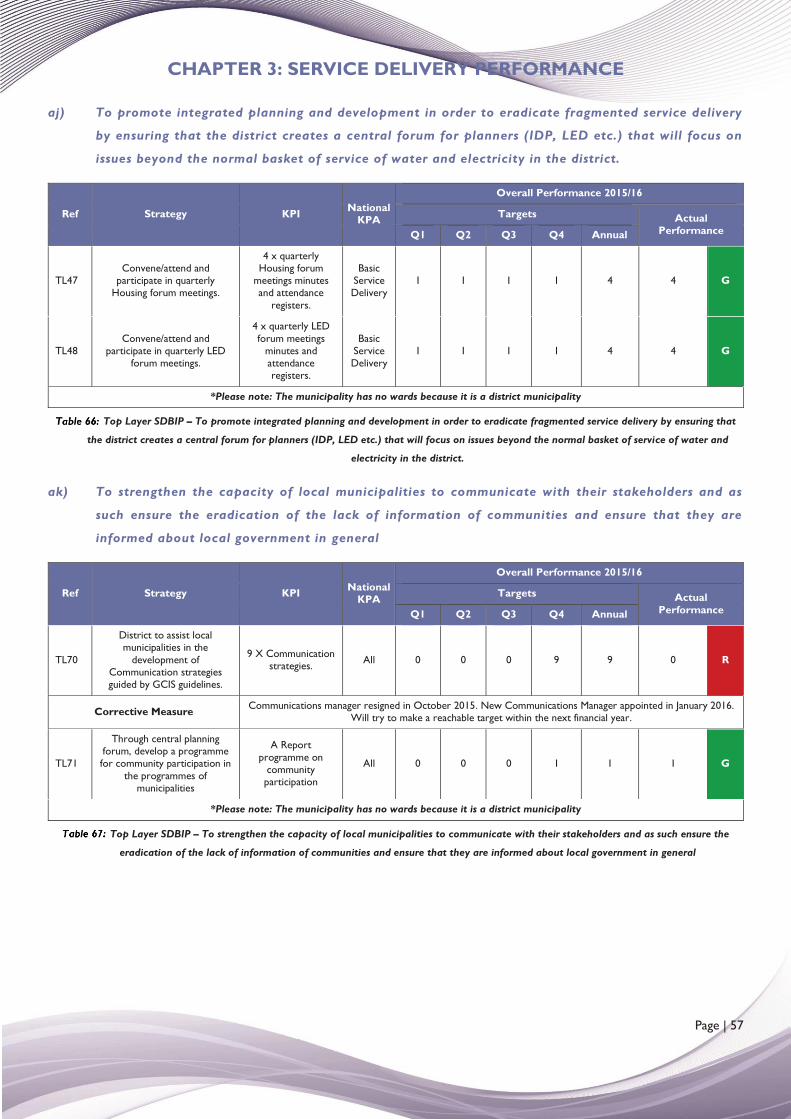
CHAPTER 3: SERVICE DELIVERY PERFORMANCE
Page | 57
aj) To promote integrated planning and development in order to eradicate fragmented service delivery
by ensuring that the district creates a central forum for planners (IDP, LED etc.) that will focus on
issues beyond the normal basket of service of water and electricity in the district.
Ref Strategy KPI National KPA
Overall Performance 2015/16
Targets Actual Performance Q1 Q2 Q3 Q4 Annual
TL47 Convene/attend and
participate in quarterly Housing forum meetings.
4 x quarterly Housing forum
meetings minutes and attendance
registers.
Basic Service Delivery
1 1 1 1 4 4 G
TL48 Convene/attend and
participate in quarterly LED forum meetings.
4 x quarterly LED forum meetings
minutes and attendance registers.
Basic Service Delivery
1 1 1 1 4 4 G
*Please note: The municipality has no wards because it is a district municipality
Top Layer SDBIP – To promote integrated planning and development in order to eradicate fragmented service delivery by ensuring that
the district creates a central forum for planners (IDP, LED etc.) that will focus on issues beyond the normal basket of service of water and
electricity in the district.
ak) To strengthen the capacity of local municipalities to communicate with their stakeholders and as
such ensure the eradication of the lack of information of communities and ensure that they are
informed about local government in general
Ref Strategy KPI National KPA
Overall Performance 2015/16
Targets Actual Performance Q1 Q2 Q3 Q4 Annual
TL70
District to assist local municipalities in the
development of Communication strategies guided by GCIS guidelines.
9 X Communication strategies. All 0 0 0 9 9 0 R
Corrective Measure Communications manager resigned in October 2015. New Communications Manager appointed in January 2016. Will try to make a reachable target within the next financial year.
TL71
Through central planning forum, develop a programme for community participation in
the programmes of municipalities
A Report programme on
community participation
All 0 0 0 1 1 1 G
*Please note: The municipality has no wards because it is a district municipality
Top Layer SDBIP – To strengthen the capacity of local municipalities to communicate with their stakeholders and as such ensure the
eradication of the lack of information of communities and ensure that they are informed about local government in general
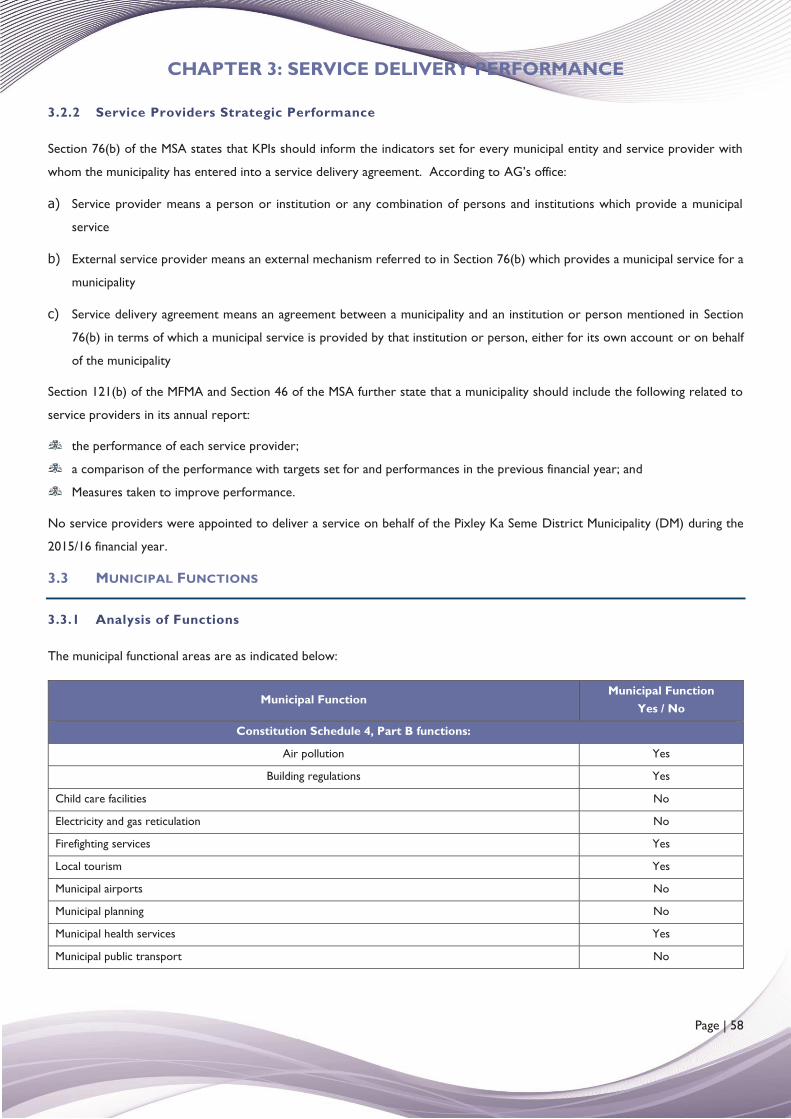
CHAPTER 3: SERVICE DELIVERY PERFORMANCE
Page | 58
3.2.2 Service Providers Strategic Performance
Section 76(b) of the MSA states that KPIs should inform the indicators set for every municipal entity and service provider with
whom the municipality has entered into a service delivery agreement. According to AG’s office:
a) Service provider means a person or institution or any combination of persons and institutions which provide a municipal
service
b) External service provider means an external mechanism referred to in Section 76(b) which provides a municipal service for a
municipality
c) Service delivery agreement means an agreement between a municipality and an institution or person mentioned in Section
76(b) in terms of which a municipal service is provided by that institution or person, either for its own account or on behalf
of the municipality
Section 121(b) of the MFMA and Section 46 of the MSA further state that a municipality should include the following related to
service providers in its annual report:
the performance of each service provider;
a comparison of the performance with targets set for and performances in the previous financial year; and
Measures taken to improve performance.
No service providers were appointed to deliver a service on behalf of the Pixley Ka Seme District Municipality (DM) during the
2015/16 financial year.
3.3 MUNICIPAL FUNCTIONS
3.3.1 Analysis of Functions
The municipal functional areas are as indicated below:
Municipal Function Municipal Function
Yes / No
Constitution Schedule 4, Part B functions:
Air pollution Yes
Building regulations Yes
Child care facilities No
Electricity and gas reticulation No
Firefighting services Yes
Local tourism Yes
Municipal airports No
Municipal planning No
Municipal health services Yes
Municipal public transport No
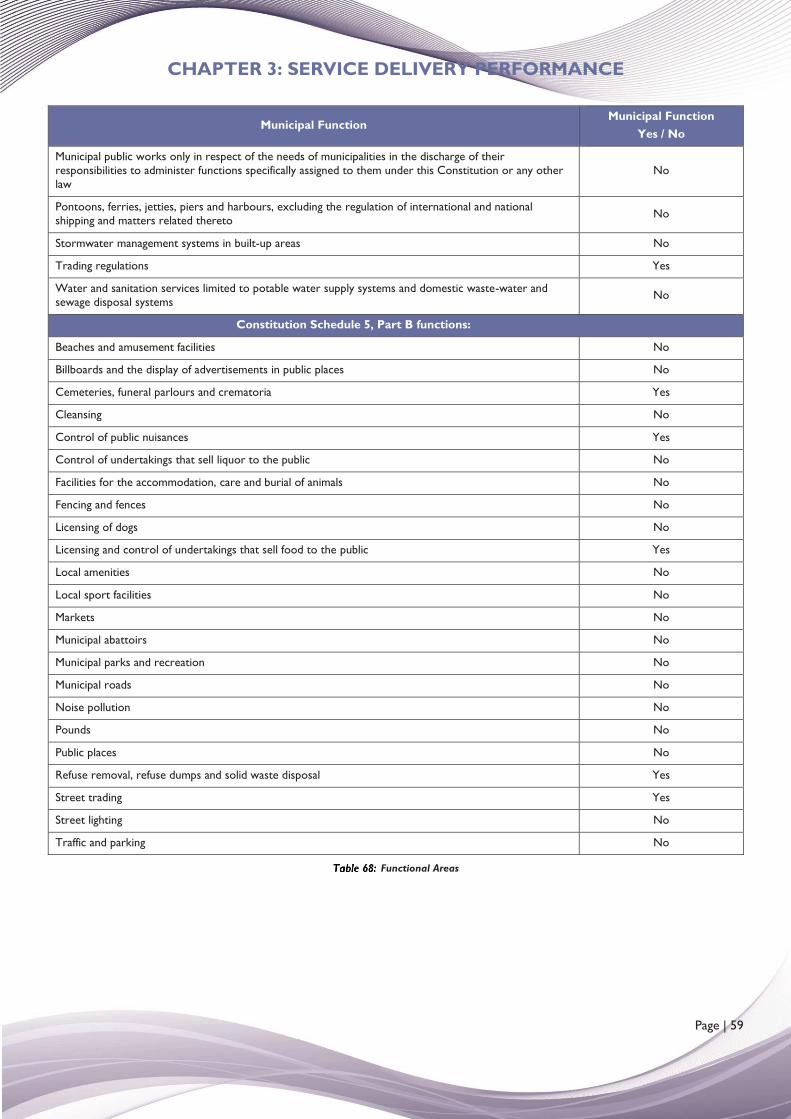
CHAPTER 3: SERVICE DELIVERY PERFORMANCE
Page | 59
Municipal Function Municipal Function
Yes / No
Municipal public works only in respect of the needs of municipalities in the discharge of their responsibilities to administer functions specifically assigned to them under this Constitution or any other law
No
Pontoons, ferries, jetties, piers and harbours, excluding the regulation of international and national shipping and matters related thereto No
Stormwater management systems in built-up areas No
Trading regulations Yes
Water and sanitation services limited to potable water supply systems and domestic waste-water and sewage disposal systems No
Constitution Schedule 5, Part B functions:
Beaches and amusement facilities No
Billboards and the display of advertisements in public places No
Cemeteries, funeral parlours and crematoria Yes
Cleansing No
Control of public nuisances Yes
Control of undertakings that sell liquor to the public No
Facilities for the accommodation, care and burial of animals No
Fencing and fences No
Licensing of dogs No
Licensing and control of undertakings that sell food to the public Yes
Local amenities No
Local sport facilities No
Markets No
Municipal abattoirs No
Municipal parks and recreation No
Municipal roads No
Noise pollution No
Pounds No
Public places No
Refuse removal, refuse dumps and solid waste disposal Yes
Street trading Yes
Street lighting No
Traffic and parking No
Functional Areas
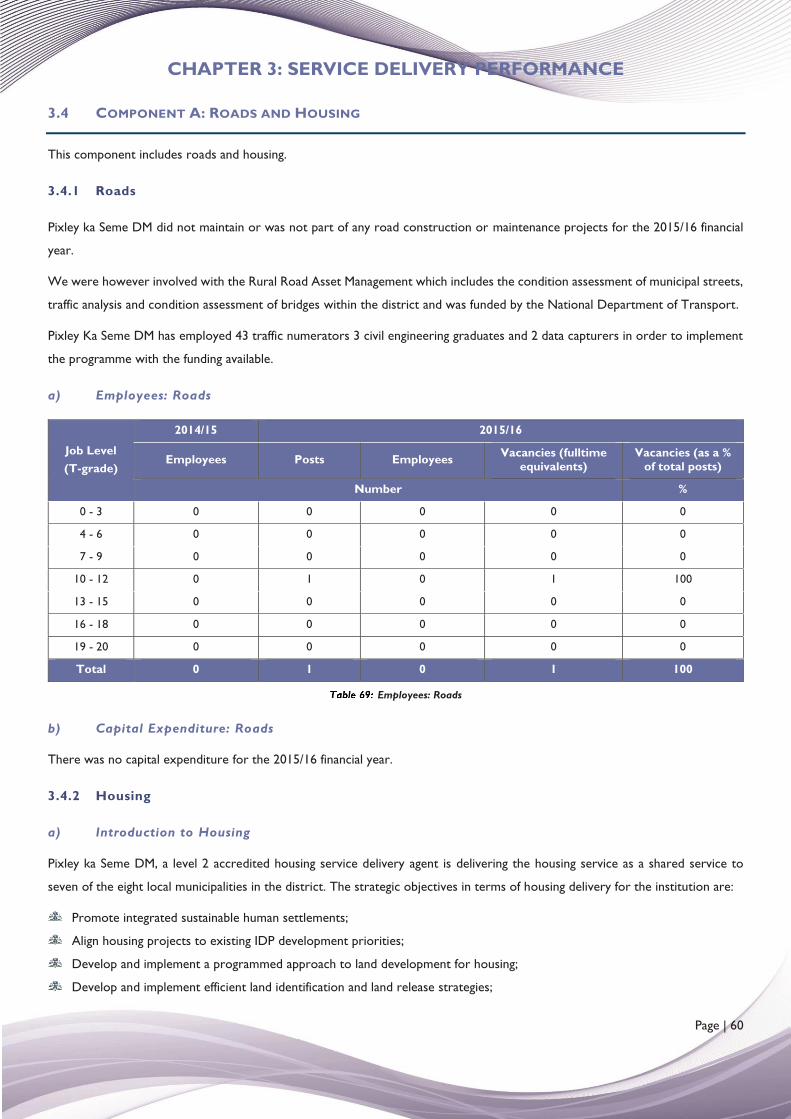
CHAPTER 3: SERVICE DELIVERY PERFORMANCE
Page | 60
3.4 COMPONENT A: ROADS AND HOUSING
This component includes roads and housing.
3.4.1 Roads
Pixley ka Seme DM did not maintain or was not part of any road construction or maintenance projects for the 2015/16 financial
year.
We were however involved with the Rural Road Asset Management which includes the condition assessment of municipal streets,
traffic analysis and condition assessment of bridges within the district and was funded by the National Department of Transport.
Pixley Ka Seme DM has employed 43 traffic numerators 3 civil engineering graduates and 2 data capturers in order to implement
the programme with the funding available.
a) Employees: Roads
Job Level (T-grade)
2014/15 2015/16
Employees Posts Employees Vacancies (fulltime equivalents)
Vacancies (as a % of total posts)
Number %
0 - 3 0 0 0 0 0
4 - 6 0 0 0 0 0
7 - 9 0 0 0 0 0
10 - 12 0 1 0 1 100
13 - 15 0 0 0 0 0
16 - 18 0 0 0 0 0
19 - 20 0 0 0 0 0
Total 0 1 0 1 100
Employees: Roads
b) Capital Expenditure: Roads
There was no capital expenditure for the 2015/16 financial year.
3.4.2 Housing
a) Introduction to Housing
Pixley ka Seme DM, a level 2 accredited housing service delivery agent is delivering the housing service as a shared service to
seven of the eight local municipalities in the district. The strategic objectives in terms of housing delivery for the institution are:
Promote integrated sustainable human settlements;
Align housing projects to existing IDP development priorities;
Develop and implement a programmed approach to land development for housing;
Develop and implement efficient land identification and land release strategies;
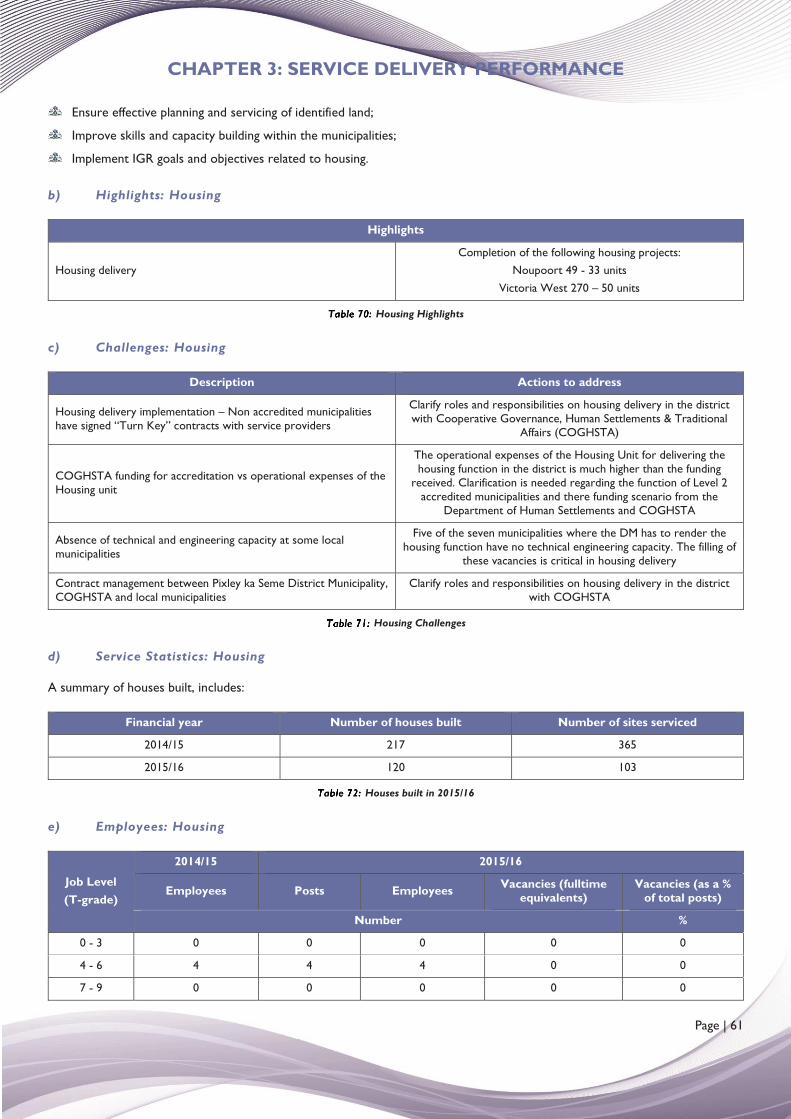
CHAPTER 3: SERVICE DELIVERY PERFORMANCE
Page | 61
Ensure effective planning and servicing of identified land;
Improve skills and capacity building within the municipalities;
Implement IGR goals and objectives related to housing.
b) Highlights: Housing
Highlights
Housing delivery Completion of the following housing projects:
Noupoort 49 - 33 units Victoria West 270 – 50 units
Housing Highlights
c) Challenges: Housing
Description Actions to address
Housing delivery implementation – Non accredited municipalities have signed “Turn Key” contracts with service providers
Clarify roles and responsibilities on housing delivery in the district with Cooperative Governance, Human Settlements & Traditional
Affairs (COGHSTA)
COGHSTA funding for accreditation vs operational expenses of the Housing unit
The operational expenses of the Housing Unit for delivering the housing function in the district is much higher than the funding
received. Clarification is needed regarding the function of Level 2 accredited municipalities and there funding scenario from the
Department of Human Settlements and COGHSTA
Absence of technical and engineering capacity at some local municipalities
Five of the seven municipalities where the DM has to render the housing function have no technical engineering capacity. The filling of
these vacancies is critical in housing delivery
Contract management between Pixley ka Seme District Municipality, COGHSTA and local municipalities
Clarify roles and responsibilities on housing delivery in the district with COGHSTA
Housing Challenges
d) Service Statistics: Housing
A summary of houses built, includes:
Financial year Number of houses built Number of sites serviced
2014/15 217 365
2015/16 120 103
Houses built in 2015/16
e) Employees: Housing
Job Level (T-grade)
2014/15 2015/16
Employees Posts Employees Vacancies (fulltime equivalents)
Vacancies (as a % of total posts)
Number %
0 - 3 0 0 0 0 0
4 - 6 4 4 4 0 0
7 - 9 0 0 0 0 0
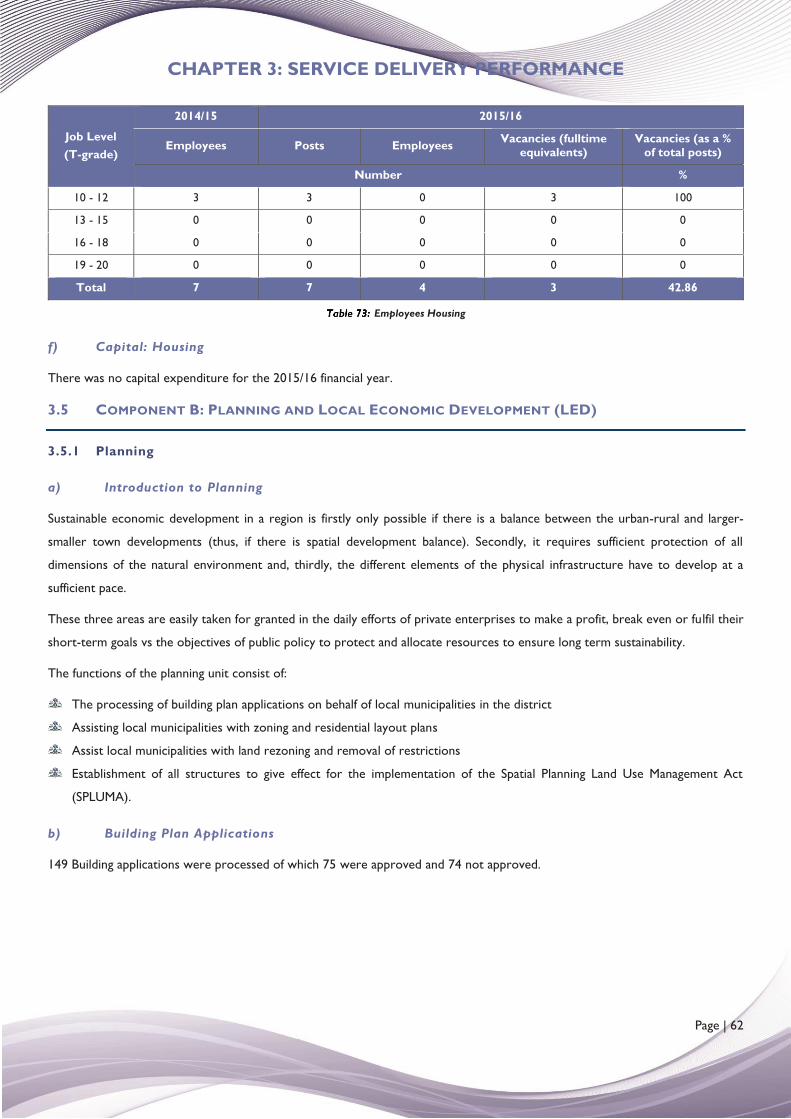
CHAPTER 3: SERVICE DELIVERY PERFORMANCE
Page | 62
Job Level (T-grade)
2014/15 2015/16
Employees Posts Employees Vacancies (fulltime equivalents)
Vacancies (as a % of total posts)
Number %
10 - 12 3 3 0 3 100
13 - 15 0 0 0 0 0
16 - 18 0 0 0 0 0
19 - 20 0 0 0 0 0
Total 7 7 4 3 42.86
Employees Housing
f) Capital: Housing
There was no capital expenditure for the 2015/16 financial year.
3.5 COMPONENT B: PLANNING AND LOCAL ECONOMIC DEVELOPMENT (LED)
3.5.1 Planning
a) Introduction to Planning
Sustainable economic development in a region is firstly only possible if there is a balance between the urban-rural and larger-
smaller town developments (thus, if there is spatial development balance). Secondly, it requires sufficient protection of all
dimensions of the natural environment and, thirdly, the different elements of the physical infrastructure have to develop at a
sufficient pace.
These three areas are easily taken for granted in the daily efforts of private enterprises to make a profit, break even or fulfil their
short-term goals vs the objectives of public policy to protect and allocate resources to ensure long term sustainability.
The functions of the planning unit consist of:
The processing of building plan applications on behalf of local municipalities in the district
Assisting local municipalities with zoning and residential layout plans
Assist local municipalities with land rezoning and removal of restrictions
Establishment of all structures to give effect for the implementation of the Spatial Planning Land Use Management Act
(SPLUMA).
b) Building Plan Applications
149 Building applications were processed of which 75 were approved and 74 not approved.
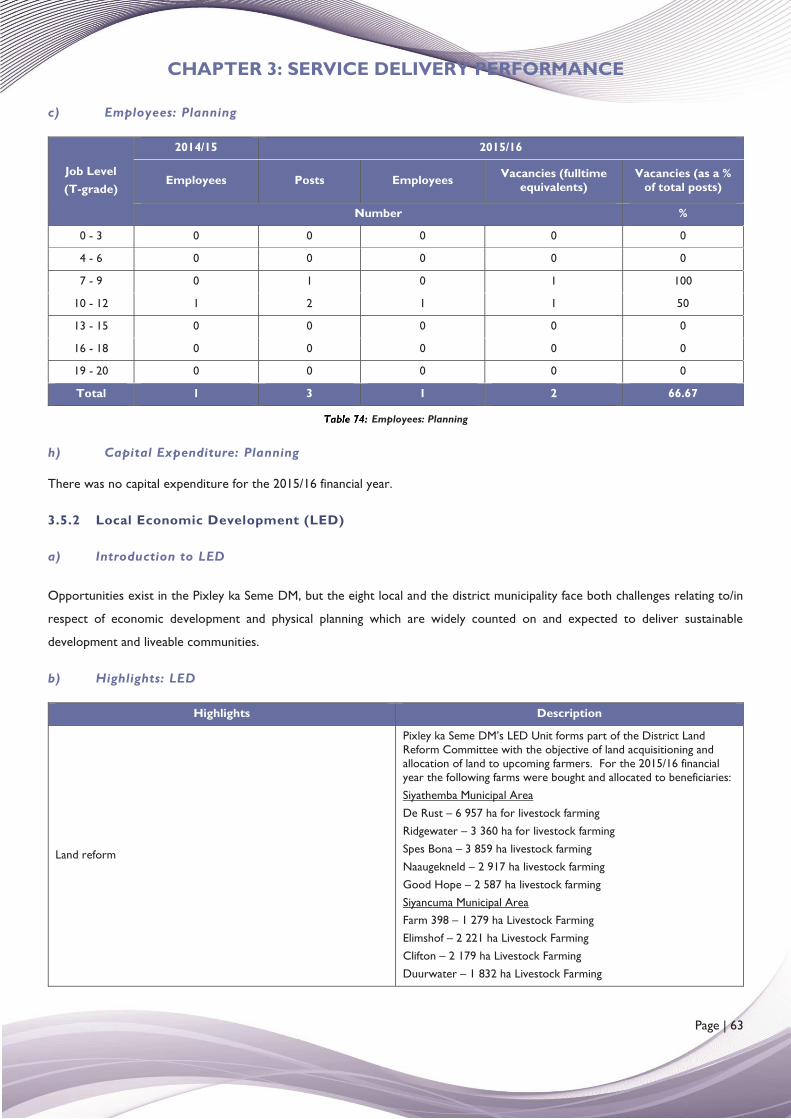
CHAPTER 3: SERVICE DELIVERY PERFORMANCE
Page | 63
c) Employees: Planning
Job Level (T-grade)
2014/15 2015/16
Employees Posts Employees Vacancies (fulltime equivalents)
Vacancies (as a % of total posts)
Number %
0 - 3 0 0 0 0 0
4 - 6 0 0 0 0 0
7 - 9 0 1 0 1 100
10 - 12 1 2 1 1 50
13 - 15 0 0 0 0 0
16 - 18 0 0 0 0 0
19 - 20 0 0 0 0 0
Total 1 3 1 2 66.67
Employees: Planning
h) Capital Expenditure: Planning
There was no capital expenditure for the 2015/16 financial year.
3.5.2 Local Economic Development (LED)
a) Introduction to LED
Opportunities exist in the Pixley ka Seme DM, but the eight local and the district municipality face both challenges relating to/in
respect of economic development and physical planning which are widely counted on and expected to deliver sustainable
development and liveable communities.
b) Highlights: LED
Highlights Description
Land reform
Pixley ka Seme DM’s LED Unit forms part of the District Land Reform Committee with the objective of land acquisitioning and allocation of land to upcoming farmers. For the 2015/16 financial year the following farms were bought and allocated to beneficiaries: Siyathemba Municipal Area De Rust – 6 957 ha for livestock farming Ridgewater – 3 360 ha for livestock farming Spes Bona – 3 859 ha livestock farming Naaugekneld – 2 917 ha livestock farming Good Hope – 2 587 ha livestock farming Siyancuma Municipal Area Farm 398 – 1 279 ha Livestock Farming Elimshof – 2 221 ha Livestock Farming Clifton – 2 179 ha Livestock Farming Duurwater – 1 832 ha Livestock Farming
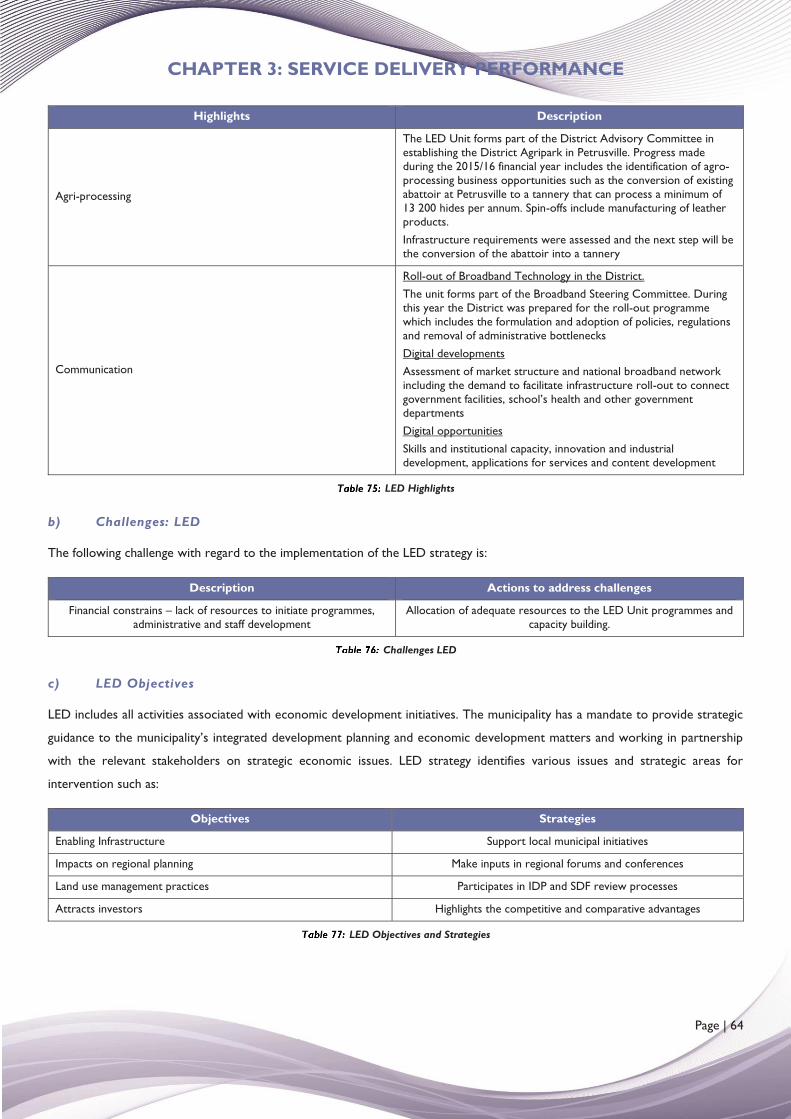
CHAPTER 3: SERVICE DELIVERY PERFORMANCE
Page | 64
Highlights Description
Agri-processing
The LED Unit forms part of the District Advisory Committee in establishing the District Agripark in Petrusville. Progress made during the 2015/16 financial year includes the identification of agro-processing business opportunities such as the conversion of existing abattoir at Petrusville to a tannery that can process a minimum of 13 200 hides per annum. Spin-offs include manufacturing of leather products. Infrastructure requirements were assessed and the next step will be the conversion of the abattoir into a tannery
Communication
Roll-out of Broadband Technology in the District. The unit forms part of the Broadband Steering Committee. During this year the District was prepared for the roll-out programme which includes the formulation and adoption of policies, regulations and removal of administrative bottlenecks Digital developments Assessment of market structure and national broadband network including the demand to facilitate infrastructure roll-out to connect government facilities, school’s health and other government departments Digital opportunities Skills and institutional capacity, innovation and industrial development, applications for services and content development
LED Highlights
b) Challenges: LED
The following challenge with regard to the implementation of the LED strategy is:
Description Actions to address challenges
Financial constrains – lack of resources to initiate programmes, administrative and staff development
Allocation of adequate resources to the LED Unit programmes and capacity building.
Challenges LED
c) LED Objectives
LED includes all activities associated with economic development initiatives. The municipality has a mandate to provide strategic
guidance to the municipality’s integrated development planning and economic development matters and working in partnership
with the relevant stakeholders on strategic economic issues. LED strategy identifies various issues and strategic areas for
intervention such as:
Objectives Strategies
Enabling Infrastructure Support local municipal initiatives
Impacts on regional planning Make inputs in regional forums and conferences
Land use management practices Participates in IDP and SDF review processes
Attracts investors Highlights the competitive and comparative advantages
LED Objectives and Strategies
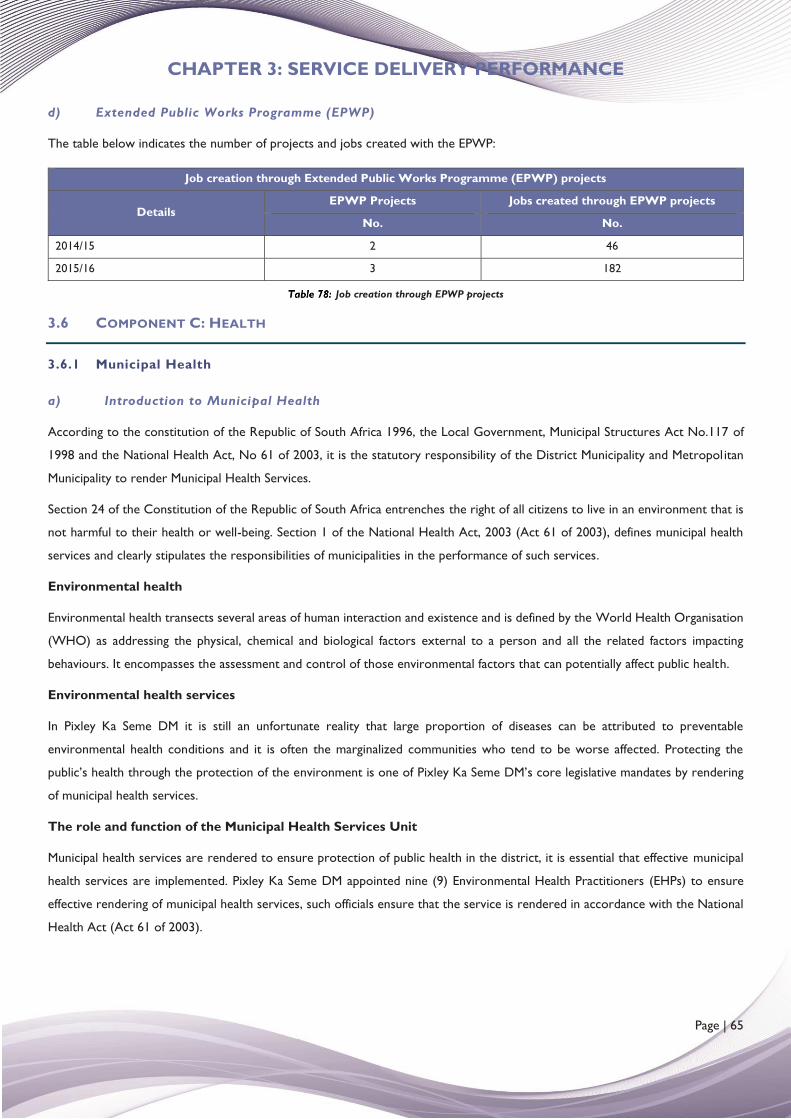
CHAPTER 3: SERVICE DELIVERY PERFORMANCE
Page | 65
d) Extended Public Works Programme (EPWP)
The table below indicates the number of projects and jobs created with the EPWP:
Job creation through Extended Public Works Programme (EPWP) projects
Details EPWP Projects Jobs created through EPWP projects
No. No.
2014/15 2 46
2015/16 3 182
Job creation through EPWP projects
3.6 COMPONENT C: HEALTH
3.6.1 Municipal Health
a) Introduction to Municipal Health
According to the constitution of the Republic of South Africa 1996, the Local Government, Municipal Structures Act No.117 of
1998 and the National Health Act, No 61 of 2003, it is the statutory responsibility of the District Municipality and Metropolitan
Municipality to render Municipal Health Services.
Section 24 of the Constitution of the Republic of South Africa entrenches the right of all citizens to live in an environment that is
not harmful to their health or well-being. Section 1 of the National Health Act, 2003 (Act 61 of 2003), defines municipal health
services and clearly stipulates the responsibilities of municipalities in the performance of such services.
Environmental health
Environmental health transects several areas of human interaction and existence and is defined by the World Health Organisation
(WHO) as addressing the physical, chemical and biological factors external to a person and all the related factors impacting
behaviours. It encompasses the assessment and control of those environmental factors that can potentially affect public health.
Environmental health services
In Pixley Ka Seme DM it is still an unfortunate reality that large proportion of diseases can be attributed to preventable
environmental health conditions and it is often the marginalized communities who tend to be worse affected. Protecting the
public’s health through the protection of the environment is one of Pixley Ka Seme DM’s core legislative mandates by rendering
of municipal health services.
The role and function of the Municipal Health Services Unit
Municipal health services are rendered to ensure protection of public health in the district, it is essential that effective municipal
health services are implemented. Pixley Ka Seme DM appointed nine (9) Environmental Health Practitioners (EHPs) to ensure
effective rendering of municipal health services, such officials ensure that the service is rendered in accordance with the National
Health Act (Act 61 of 2003).
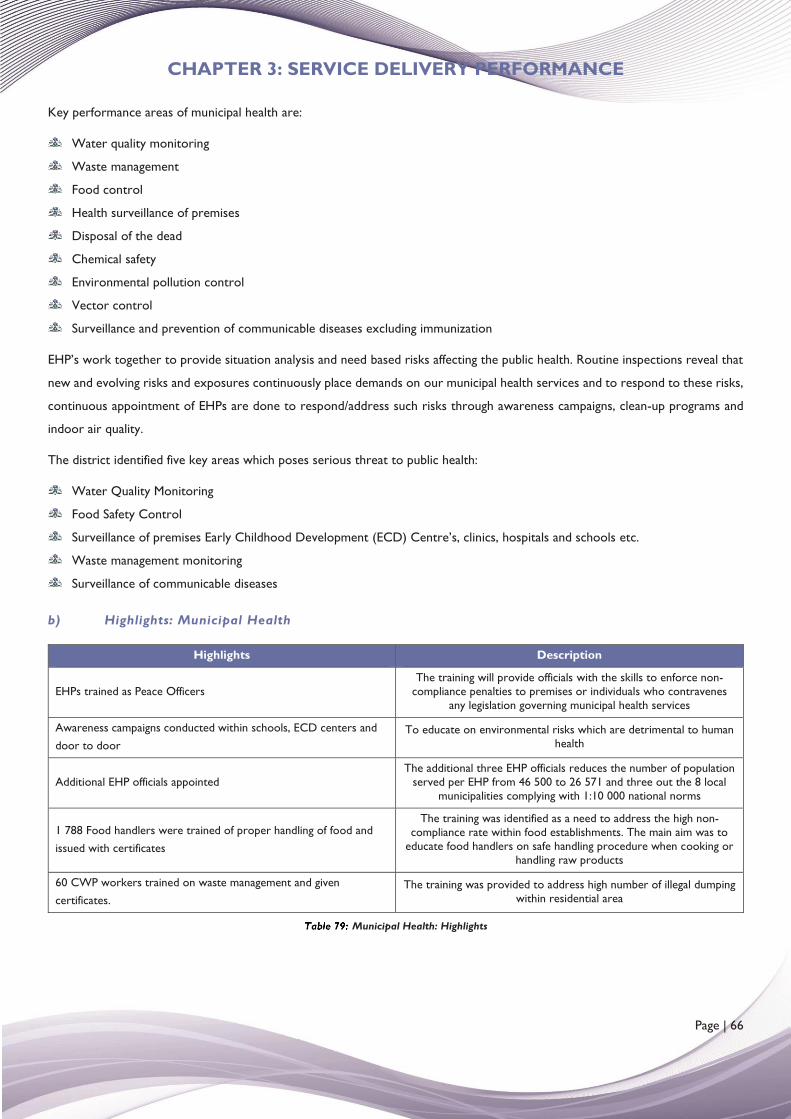
CHAPTER 3: SERVICE DELIVERY PERFORMANCE
Page | 66
Key performance areas of municipal health are:
Water quality monitoring
Waste management
Food control
Health surveillance of premises
Disposal of the dead
Chemical safety
Environmental pollution control
Vector control
Surveillance and prevention of communicable diseases excluding immunization
EHP’s work together to provide situation analysis and need based risks affecting the public health. Routine inspections reveal that
new and evolving risks and exposures continuously place demands on our municipal health services and to respond to these risks,
continuous appointment of EHPs are done to respond/address such risks through awareness campaigns, clean-up programs and
indoor air quality.
The district identified five key areas which poses serious threat to public health:
Water Quality Monitoring
Food Safety Control
Surveillance of premises Early Childhood Development (ECD) Centre’s, clinics, hospitals and schools etc.
Waste management monitoring
Surveillance of communicable diseases
b) Highlights: Municipal Health
Highlights Description
EHPs trained as Peace Officers The training will provide officials with the skills to enforce non-
compliance penalties to premises or individuals who contravenes any legislation governing municipal health services
Awareness campaigns conducted within schools, ECD centers and door to door
To educate on environmental risks which are detrimental to human health
Additional EHP officials appointed The additional three EHP officials reduces the number of population
served per EHP from 46 500 to 26 571 and three out the 8 local municipalities complying with 1:10 000 national norms
1 788 Food handlers were trained of proper handling of food and issued with certificates
The training was identified as a need to address the high non-compliance rate within food establishments. The main aim was to
educate food handlers on safe handling procedure when cooking or handling raw products
60 CWP workers trained on waste management and given certificates.
The training was provided to address high number of illegal dumping within residential area
Municipal Health: Highlights
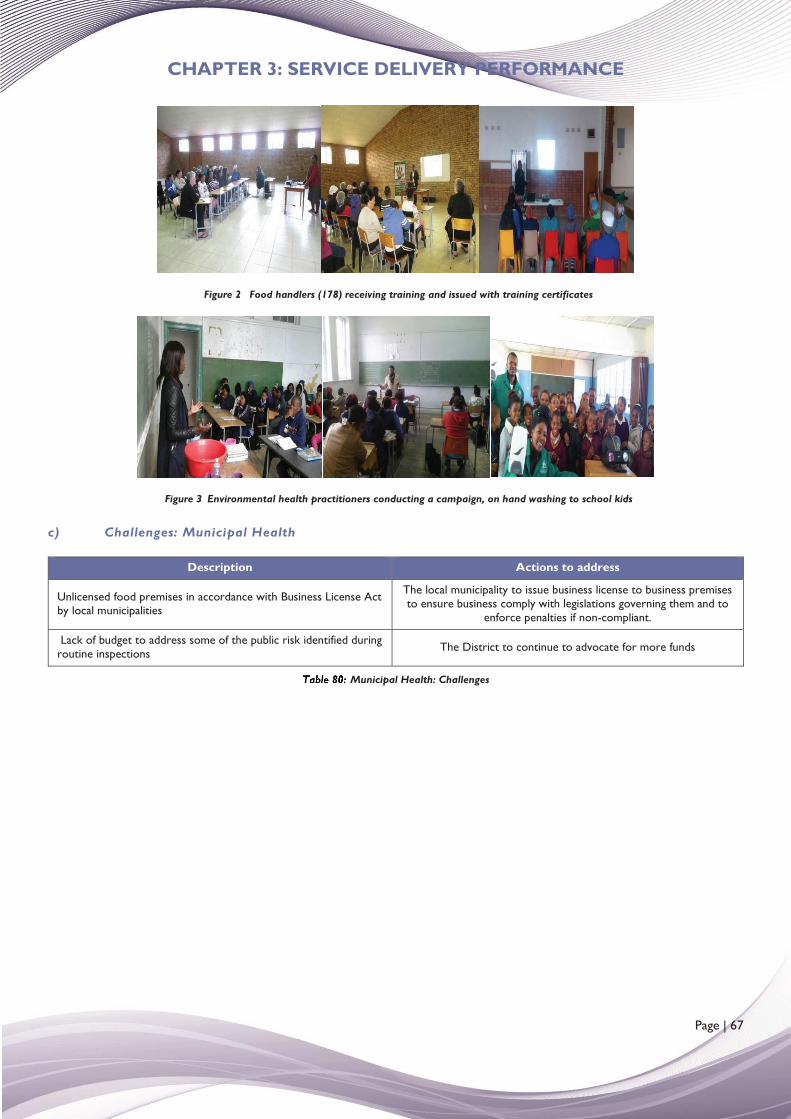
CHAPTER 3: SERVICE DELIVERY PERFORMANCE
Page | 67
Figure 2 Food handlers (178) receiving training and issued with training certificates
Figure 3 Environmental health practitioners conducting a campaign, on hand washing to school kids
c) Challenges: Municipal Health
Description Actions to address
Unlicensed food premises in accordance with Business License Act by local municipalities
The local municipality to issue business license to business premises to ensure business comply with legislations governing them and to
enforce penalties if non-compliant.
Lack of budget to address some of the public risk identified during routine inspections The District to continue to advocate for more funds
Municipal Health: Challenges
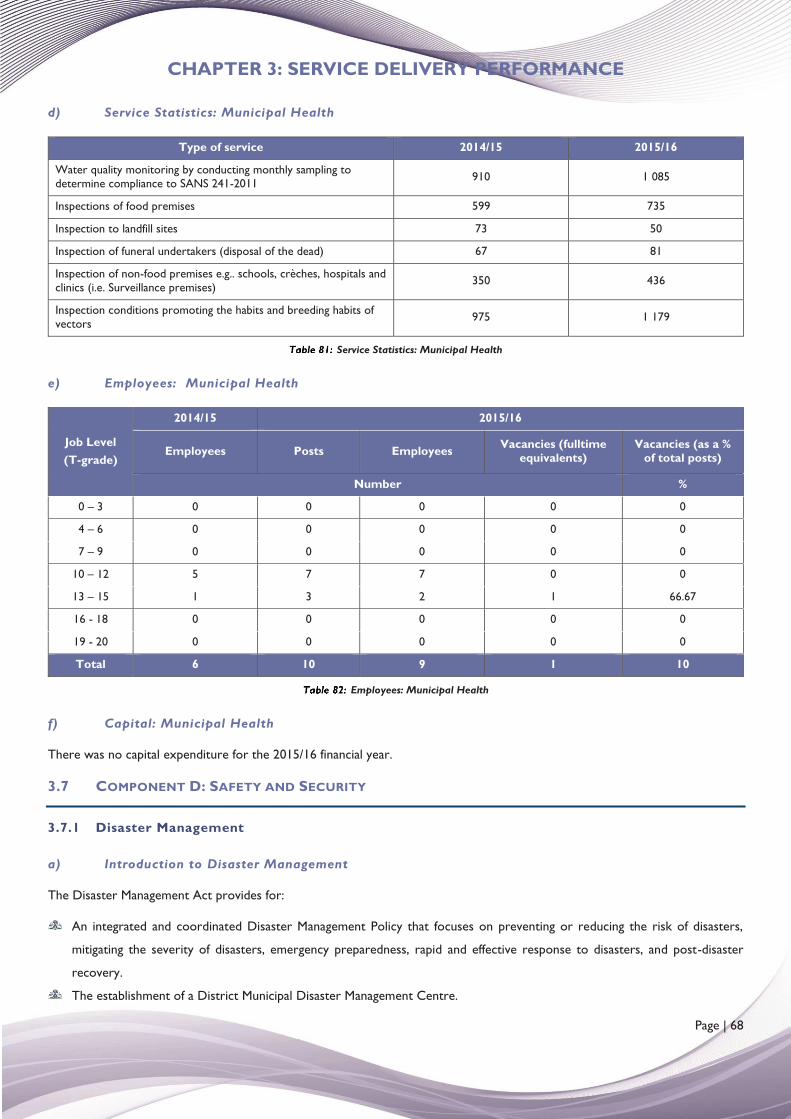
CHAPTER 3: SERVICE DELIVERY PERFORMANCE
Page | 68
d) Service Statistics: Municipal Health
Type of service 2014/15 2015/16
Water quality monitoring by conducting monthly sampling to determine compliance to SANS 241-2011 910 1 085
Inspections of food premises 599 735
Inspection to landfill sites 73 50
Inspection of funeral undertakers (disposal of the dead) 67 81
Inspection of non-food premises e.g.. schools, crèches, hospitals and clinics (i.e. Surveillance premises) 350 436
Inspection conditions promoting the habits and breeding habits of vectors 975 1 179
Service Statistics: Municipal Health
e) Employees: Municipal Health
Job Level (T-grade)
2014/15 2015/16
Employees Posts Employees Vacancies (fulltime equivalents)
Vacancies (as a % of total posts)
Number %
0 – 3 0 0 0 0 0
4 – 6 0 0 0 0 0
7 – 9 0 0 0 0 0
10 – 12 5 7 7 0 0
13 – 15 1 3 2 1 66.67
16 - 18 0 0 0 0 0
19 - 20 0 0 0 0 0
Total 6 10 9 1 10
Employees: Municipal Health
f) Capital: Municipal Health
There was no capital expenditure for the 2015/16 financial year.
3.7 COMPONENT D: SAFETY AND SECURITY
3.7.1 Disaster Management
a) Introduction to Disaster Management
The Disaster Management Act provides for:
An integrated and coordinated Disaster Management Policy that focuses on preventing or reducing the risk of disasters,
mitigating the severity of disasters, emergency preparedness, rapid and effective response to disasters, and post-disaster
recovery.
The establishment of a District Municipal Disaster Management Centre.
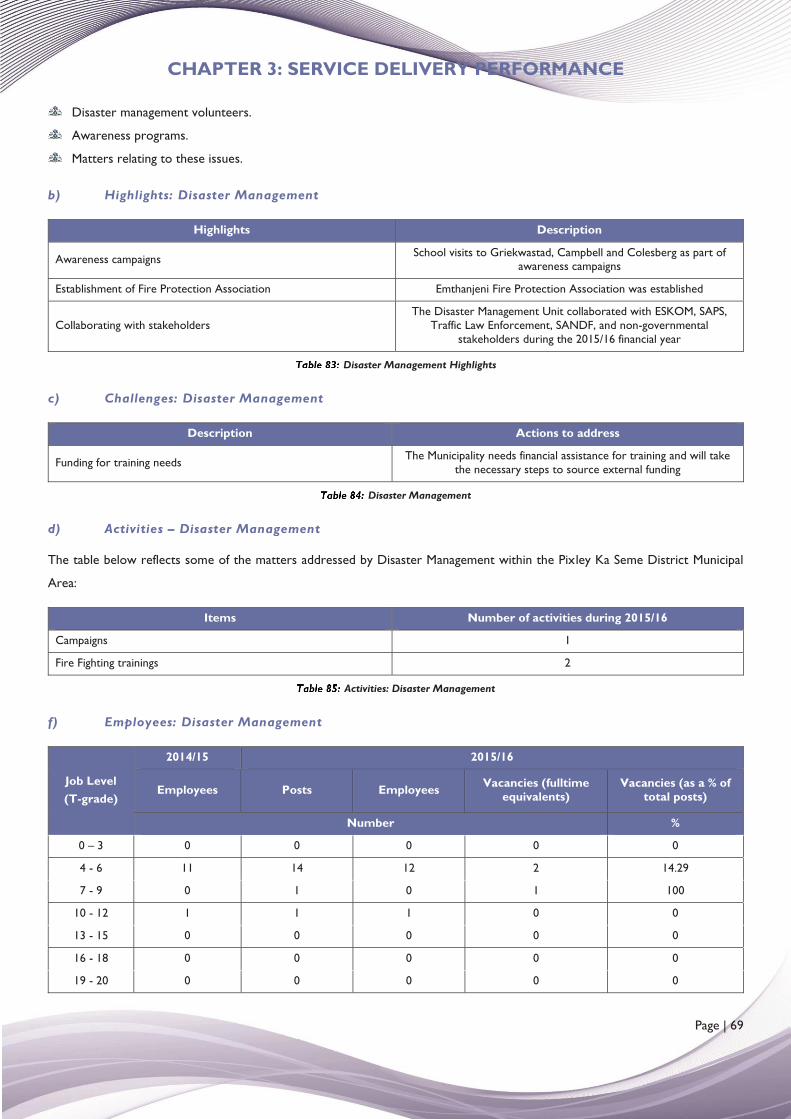
CHAPTER 3: SERVICE DELIVERY PERFORMANCE
Page | 69
Disaster management volunteers.
Awareness programs.
Matters relating to these issues.
b) Highlights: Disaster Management
Highlights Description
Awareness campaigns School visits to Griekwastad, Campbell and Colesberg as part of awareness campaigns
Establishment of Fire Protection Association Emthanjeni Fire Protection Association was established
Collaborating with stakeholders The Disaster Management Unit collaborated with ESKOM, SAPS,
Traffic Law Enforcement, SANDF, and non-governmental stakeholders during the 2015/16 financial year
Disaster Management Highlights
c) Challenges: Disaster Management
Description Actions to address
Funding for training needs The Municipality needs financial assistance for training and will take the necessary steps to source external funding
Disaster Management
d) Activities – Disaster Management
The table below reflects some of the matters addressed by Disaster Management within the Pixley Ka Seme District Municipal
Area:
Items Number of activities during 2015/16
Campaigns 1
Fire Fighting trainings 2
Activities: Disaster Management
f) Employees: Disaster Management
Job Level (T-grade)
2014/15 2015/16
Employees Posts Employees Vacancies (fulltime equivalents)
Vacancies (as a % of total posts)
Number %
0 – 3 0 0 0 0 0
4 - 6 11 14 12 2 14.29
7 - 9 0 1 0 1 100
10 - 12 1 1 1 0 0
13 - 15 0 0 0 0 0
16 - 18 0 0 0 0 0
19 - 20 0 0 0 0 0
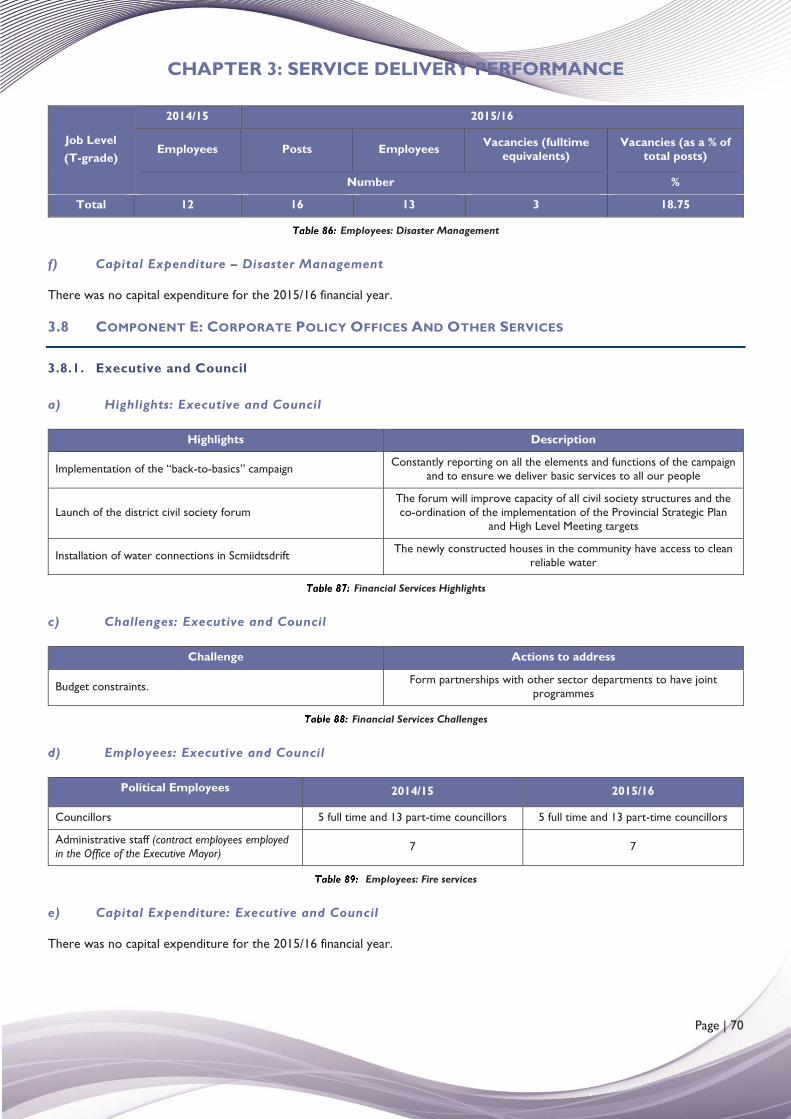
CHAPTER 3: SERVICE DELIVERY PERFORMANCE
Page | 70
Job Level (T-grade)
2014/15 2015/16
Employees Posts Employees Vacancies (fulltime equivalents)
Vacancies (as a % of total posts)
Number %
Total 12 16 13 3 18.75
Employees: Disaster Management
f) Capital Expenditure – Disaster Management
There was no capital expenditure for the 2015/16 financial year.
3.8 COMPONENT E: CORPORATE POLICY OFFICES AND OTHER SERVICES
3.8.1. Executive and Council
a) Highlights: Executive and Council
Highlights Description
Implementation of the “back-to-basics” campaign Constantly reporting on all the elements and functions of the campaign and to ensure we deliver basic services to all our people
Launch of the district civil society forum The forum will improve capacity of all civil society structures and the co-ordination of the implementation of the Provincial Strategic Plan
and High Level Meeting targets
Installation of water connections in Scmiidtsdrift The newly constructed houses in the community have access to clean reliable water
Financial Services Highlights
c) Challenges: Executive and Council
Challenge Actions to address
Budget constraints. Form partnerships with other sector departments to have joint programmes
Financial Services Challenges
d) Employees: Executive and Council
Political Employees 2014/15 2015/16
Councillors 5 full time and 13 part-time councillors 5 full time and 13 part-time councillors
Administrative staff (contract employees employed in the Office of the Executive Mayor) 7 7
Employees: Fire services
e) Capital Expenditure: Executive and Council
There was no capital expenditure for the 2015/16 financial year.
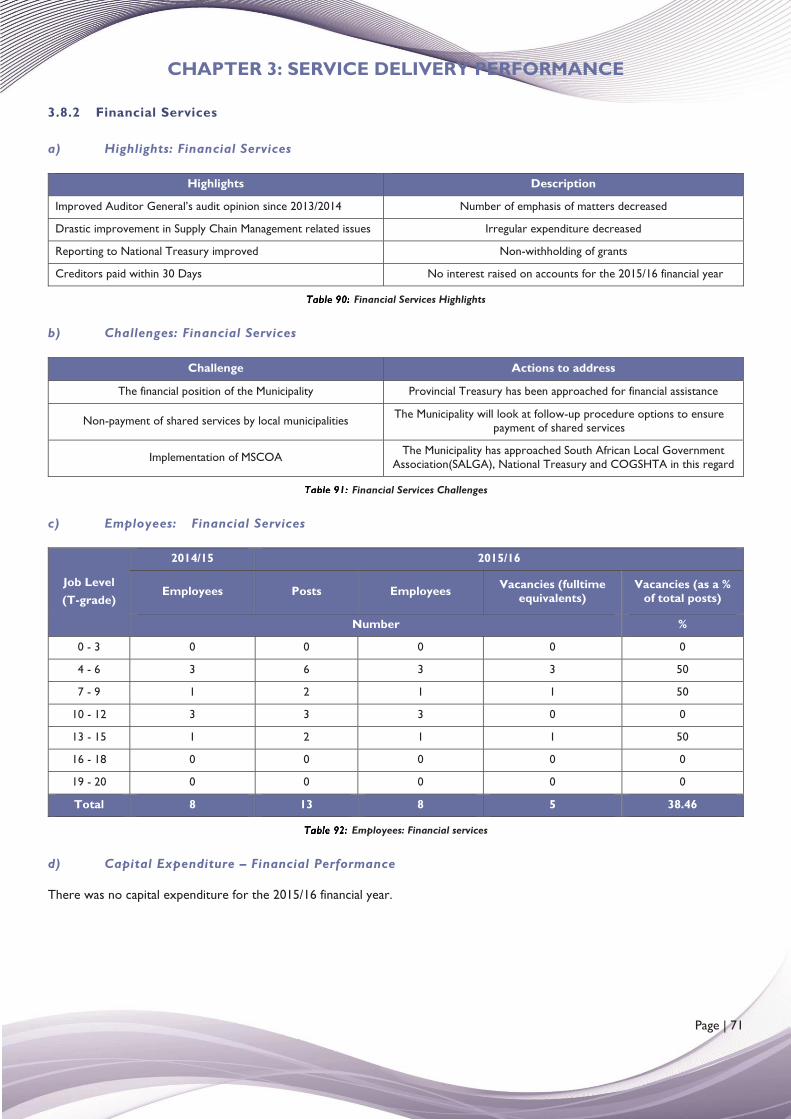
CHAPTER 3: SERVICE DELIVERY PERFORMANCE
Page | 71
3.8.2 Financial Services
a) Highlights: Financial Services
Highlights Description
Improved Auditor General’s audit opinion since 2013/2014 Number of emphasis of matters decreased
Drastic improvement in Supply Chain Management related issues Irregular expenditure decreased
Reporting to National Treasury improved Non-withholding of grants
Creditors paid within 30 Days No interest raised on accounts for the 2015/16 financial year
Financial Services Highlights
b) Challenges: Financial Services
Challenge Actions to address
The financial position of the Municipality Provincial Treasury has been approached for financial assistance
Non-payment of shared services by local municipalities The Municipality will look at follow-up procedure options to ensure payment of shared services
Implementation of MSCOA The Municipality has approached South African Local Government Association(SALGA), National Treasury and COGSHTA in this regard
Financial Services Challenges
c) Employees: Financial Services
Job Level (T-grade)
2014/15 2015/16
Employees Posts Employees Vacancies (fulltime equivalents)
Vacancies (as a % of total posts)
Number %
0 - 3 0 0 0 0 0
4 - 6 3 6 3 3 50
7 - 9 1 2 1 1 50
10 - 12 3 3 3 0 0
13 - 15 1 2 1 1 50
16 - 18 0 0 0 0 0
19 - 20 0 0 0 0 0
Total 8 13 8 5 38.46
Employees: Financial services
d) Capital Expenditure – Financial Performance
There was no capital expenditure for the 2015/16 financial year.
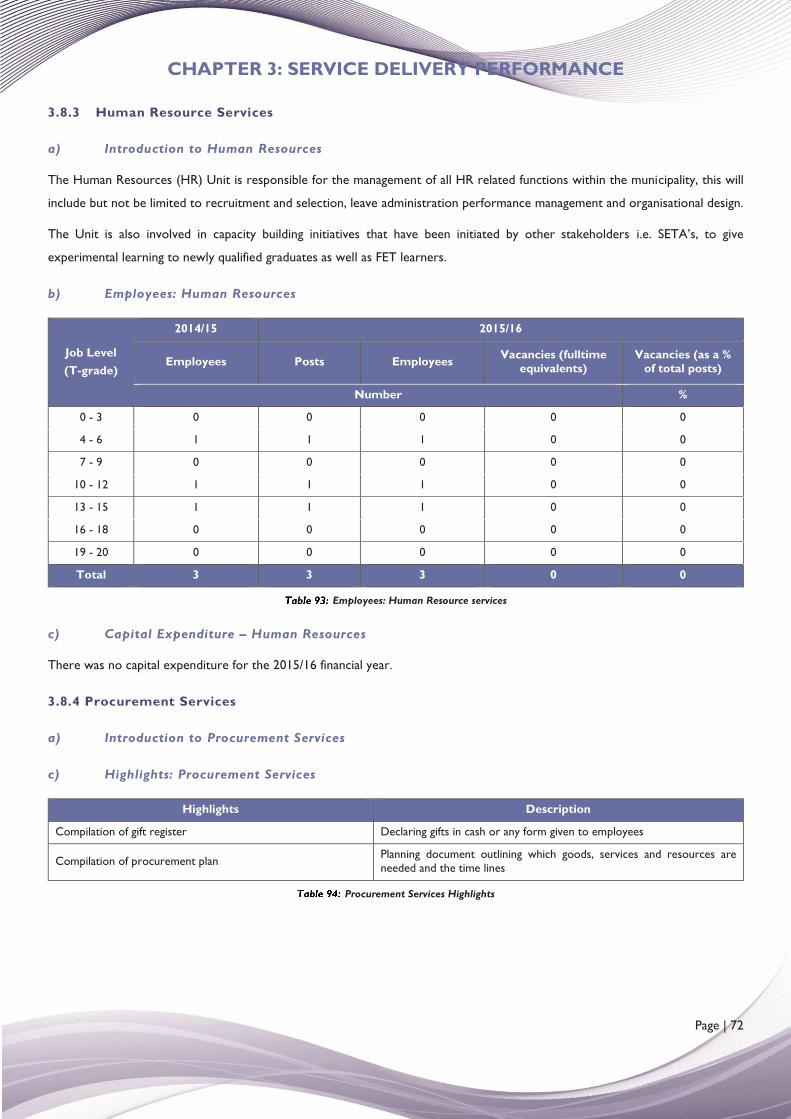
CHAPTER 3: SERVICE DELIVERY PERFORMANCE
Page | 72
3.8.3 Human Resource Services
a) Introduction to Human Resources
The Human Resources (HR) Unit is responsible for the management of all HR related functions within the municipality, this will
include but not be limited to recruitment and selection, leave administration performance management and organisational design.
The Unit is also involved in capacity building initiatives that have been initiated by other stakeholders i.e. SETA’s, to give
experimental learning to newly qualified graduates as well as FET learners.
b) Employees: Human Resources
Job Level (T-grade)
2014/15 2015/16
Employees Posts Employees Vacancies (fulltime equivalents)
Vacancies (as a % of total posts)
Number %
0 - 3 0 0 0 0 0
4 - 6 1 1 1 0 0
7 - 9 0 0 0 0 0
10 - 12 1 1 1 0 0
13 - 15 1 1 1 0 0
16 - 18 0 0 0 0 0
19 - 20 0 0 0 0 0
Total 3 3 3 0 0
Employees: Human Resource services
c) Capital Expenditure – Human Resources
There was no capital expenditure for the 2015/16 financial year.
3.8.4 Procurement Services
a) Introduction to Procurement Services
c) Highlights: Procurement Services
Highlights Description
Compilation of gift register Declaring gifts in cash or any form given to employees
Compilation of procurement plan Planning document outlining which goods, services and resources are needed and the time lines
Procurement Services Highlights
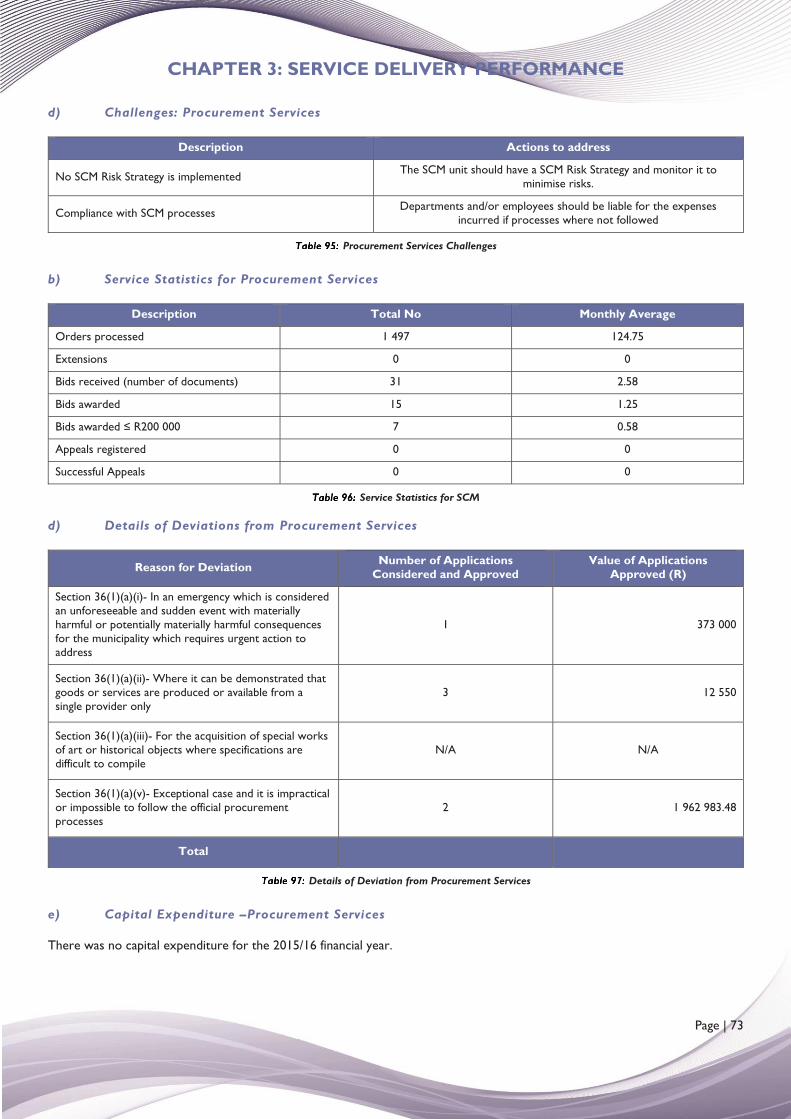
CHAPTER 3: SERVICE DELIVERY PERFORMANCE
Page | 73
d) Challenges: Procurement Services
Description Actions to address
No SCM Risk Strategy is implemented The SCM unit should have a SCM Risk Strategy and monitor it to minimise risks.
Compliance with SCM processes Departments and/or employees should be liable for the expenses incurred if processes where not followed
Procurement Services Challenges
b) Service Statistics for Procurement Services
Description Total No Monthly Average
Orders processed 1 497 124.75
Extensions 0 0
Bids received (number of documents) 31 2.58
Bids awarded 15 1.25
Bids awarded ≤ R200 000 7 0.58
Appeals registered 0 0
Successful Appeals 0 0
Service Statistics for SCM
d) Details of Deviations from Procurement Services
Reason for Deviation Number of Applications Considered and Approved
Value of Applications Approved (R)
Section 36(1)(a)(i)- In an emergency which is considered an unforeseeable and sudden event with materially harmful or potentially materially harmful consequences for the municipality which requires urgent action to address
1 373 000
Section 36(1)(a)(ii)- Where it can be demonstrated that goods or services are produced or available from a single provider only
3 12 550
Section 36(1)(a)(iii)- For the acquisition of special works of art or historical objects where specifications are difficult to compile
N/A N/A
Section 36(1)(a)(v)- Exceptional case and it is impractical or impossible to follow the official procurement processes
2 1 962 983.48
Total
Details of Deviation from Procurement Services
e) Capital Expenditure –Procurement Services
There was no capital expenditure for the 2015/16 financial year.
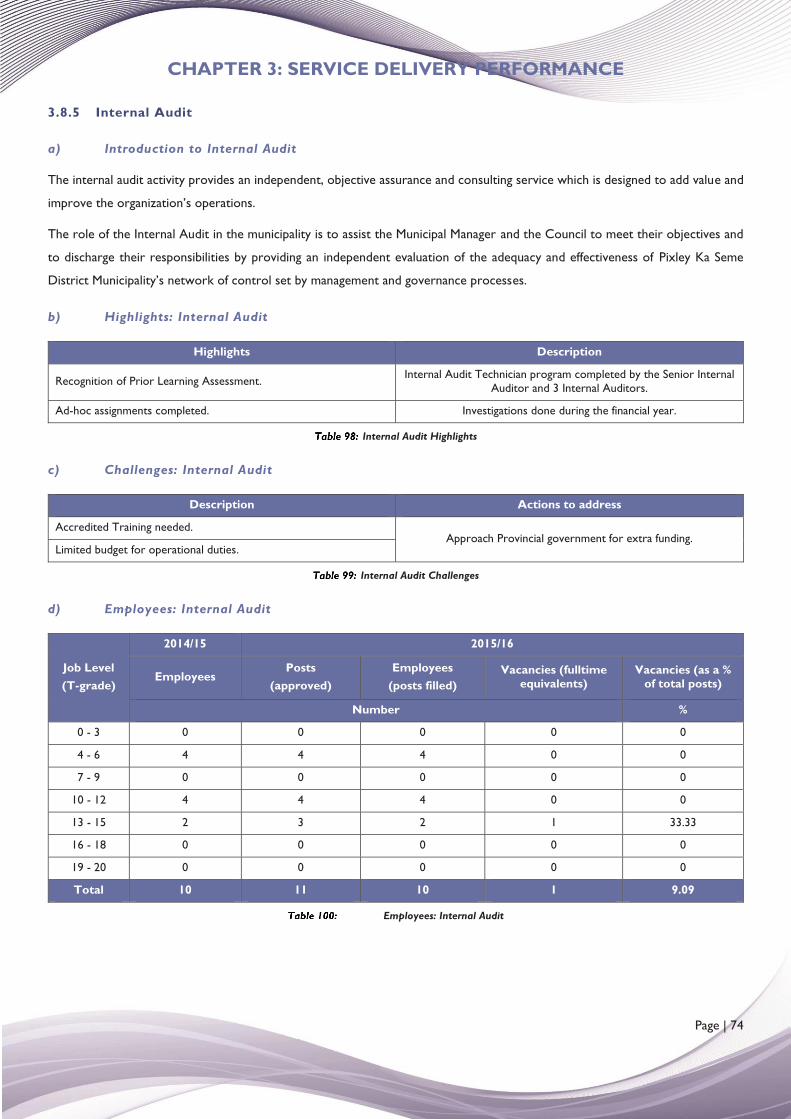
CHAPTER 3: SERVICE DELIVERY PERFORMANCE
Page | 74
3.8.5 Internal Audit
a) Introduction to Internal Audit
The internal audit activity provides an independent, objective assurance and consulting service which is designed to add value and
improve the organization’s operations.
The role of the Internal Audit in the municipality is to assist the Municipal Manager and the Council to meet their objectives and
to discharge their responsibilities by providing an independent evaluation of the adequacy and effectiveness of Pixley Ka Seme
District Municipality’s network of control set by management and governance processes.
b) Highlights: Internal Audit
Highlights Description
Recognition of Prior Learning Assessment. Internal Audit Technician program completed by the Senior Internal Auditor and 3 Internal Auditors.
Ad-hoc assignments completed. Investigations done during the financial year.
Internal Audit Highlights
c) Challenges: Internal Audit
Description Actions to address
Accredited Training needed. Approach Provincial government for extra funding.
Limited budget for operational duties.
Internal Audit Challenges
d) Employees: Internal Audit
Job Level (T-grade)
2014/15 2015/16
Employees Posts
(approved) Employees
(posts filled) Vacancies (fulltime
equivalents) Vacancies (as a %
of total posts)
Number %
0 - 3 0 0 0 0 0
4 - 6 4 4 4 0 0
7 - 9 0 0 0 0 0
10 - 12 4 4 4 0 0
13 - 15 2 3 2 1 33.33
16 - 18 0 0 0 0 0
19 - 20 0 0 0 0 0
Total 10 11 10 1 9.09
Employees: Internal Audit
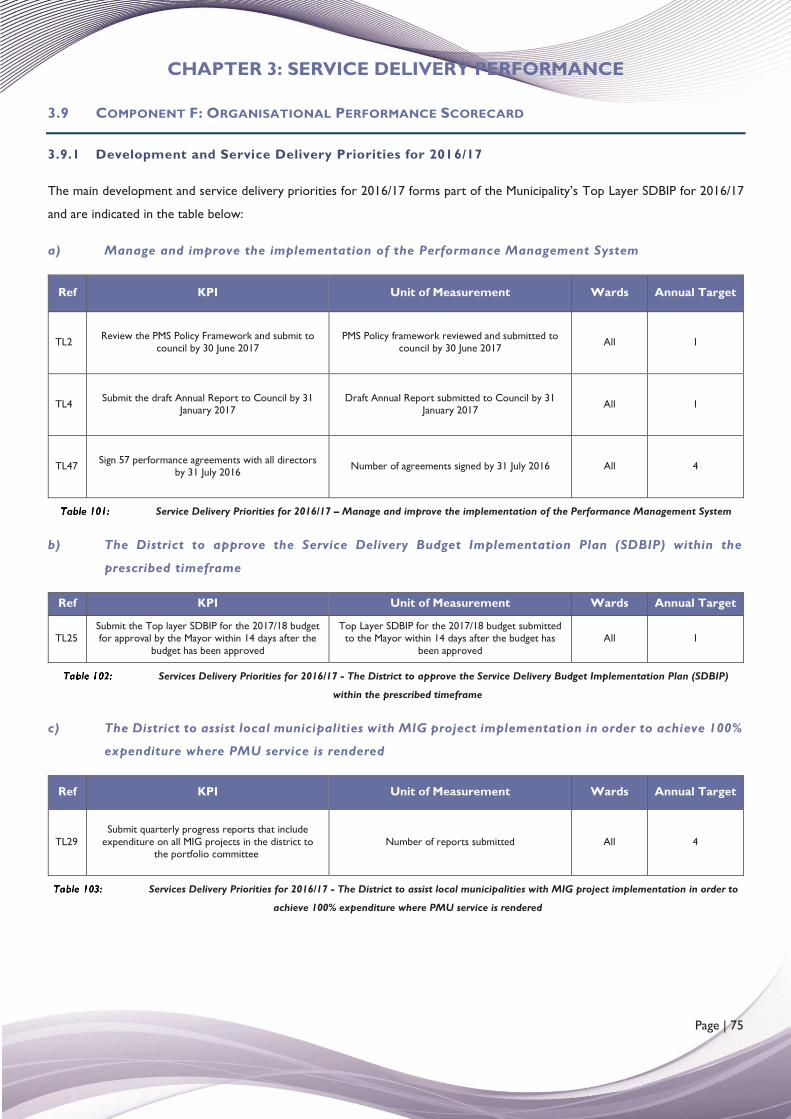
CHAPTER 3: SERVICE DELIVERY PERFORMANCE
Page | 75
3.9 COMPONENT F: ORGANISATIONAL PERFORMANCE SCORECARD
3.9.1 Development and Service Delivery Priorities for 2016/17
The main development and service delivery priorities for 2016/17 forms part of the Municipality’s Top Layer SDBIP for 2016/17
and are indicated in the table below:
a) Manage and improve the implementation of the Performance Management System
Ref KPI Unit of Measurement Wards Annual Target
TL2 Review the PMS Policy Framework and submit to council by 30 June 2017
PMS Policy framework reviewed and submitted to council by 30 June 2017 All 1
TL4 Submit the draft Annual Report to Council by 31 January 2017
Draft Annual Report submitted to Council by 31 January 2017 All 1
TL47 Sign 57 performance agreements with all directors by 31 July 2016 Number of agreements signed by 31 July 2016 All 4
Service Delivery Priorities for 2016/17 – Manage and improve the implementation of the Performance Management System
b) The District to approve the Service Delivery Budget Implementation Plan (SDBIP) within the
prescribed timeframe
Ref KPI Unit of Measurement Wards Annual Target
TL25 Submit the Top layer SDBIP for the 2017/18 budget for approval by the Mayor within 14 days after the
budget has been approved
Top Layer SDBIP for the 2017/18 budget submitted to the Mayor within 14 days after the budget has
been approved All 1
Services Delivery Priorities for 2016/17 - The District to approve the Service Delivery Budget Implementation Plan (SDBIP)
within the prescribed timeframe
c) The District to assist local municipalities with MIG project implementation in order to achieve 100%
expenditure where PMU service is rendered
Ref KPI Unit of Measurement Wards Annual Target
TL29 Submit quarterly progress reports that include
expenditure on all MIG projects in the district to the portfolio committee
Number of reports submitted All 4
Services Delivery Priorities for 2016/17 - The District to assist local municipalities with MIG project implementation in order to
achieve 100% expenditure where PMU service is rendered
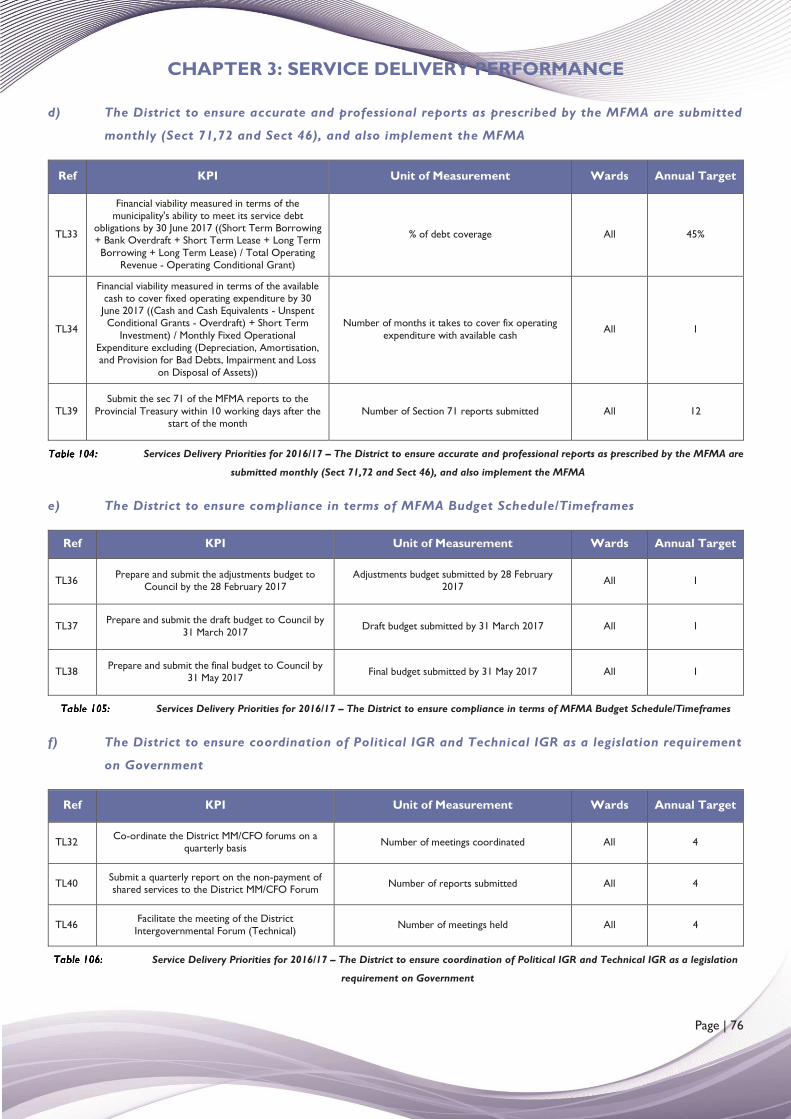
CHAPTER 3: SERVICE DELIVERY PERFORMANCE
Page | 76
d) The District to ensure accurate and professional reports as prescribed by the MFMA are submitted
monthly (Sect 71,72 and Sect 46), and also implement the MFMA
Ref KPI Unit of Measurement Wards Annual Target
TL33
Financial viability measured in terms of the municipality's ability to meet its service debt
obligations by 30 June 2017 ((Short Term Borrowing + Bank Overdraft + Short Term Lease + Long Term Borrowing + Long Term Lease) / Total Operating
Revenue - Operating Conditional Grant)
% of debt coverage All 45%
TL34
Financial viability measured in terms of the available cash to cover fixed operating expenditure by 30 June 2017 ((Cash and Cash Equivalents - Unspent Conditional Grants - Overdraft) + Short Term
Investment) / Monthly Fixed Operational Expenditure excluding (Depreciation, Amortisation, and Provision for Bad Debts, Impairment and Loss
on Disposal of Assets))
Number of months it takes to cover fix operating expenditure with available cash All 1
TL39 Submit the sec 71 of the MFMA reports to the
Provincial Treasury within 10 working days after the start of the month
Number of Section 71 reports submitted All 12
Services Delivery Priorities for 2016/17 – The District to ensure accurate and professional reports as prescribed by the MFMA are
submitted monthly (Sect 71,72 and Sect 46), and also implement the MFMA
e) The District to ensure compliance in terms of MFMA Budget Schedule/Timeframes
Ref KPI Unit of Measurement Wards Annual Target
TL36 Prepare and submit the adjustments budget to Council by the 28 February 2017
Adjustments budget submitted by 28 February 2017 All 1
TL37 Prepare and submit the draft budget to Council by 31 March 2017 Draft budget submitted by 31 March 2017 All 1
TL38 Prepare and submit the final budget to Council by 31 May 2017 Final budget submitted by 31 May 2017 All 1
Services Delivery Priorities for 2016/17 – The District to ensure compliance in terms of MFMA Budget Schedule/Timeframes
f) The District to ensure coordination of Political IGR and Technical IGR as a legislation requirement
on Government
Ref KPI Unit of Measurement Wards Annual Target
TL32 Co-ordinate the District MM/CFO forums on a quarterly basis Number of meetings coordinated All 4
TL40 Submit a quarterly report on the non-payment of shared services to the District MM/CFO Forum Number of reports submitted All 4
TL46 Facilitate the meeting of the District Intergovernmental Forum (Technical) Number of meetings held All 4
Service Delivery Priorities for 2016/17 – The District to ensure coordination of Political IGR and Technical IGR as a legislation
requirement on Government
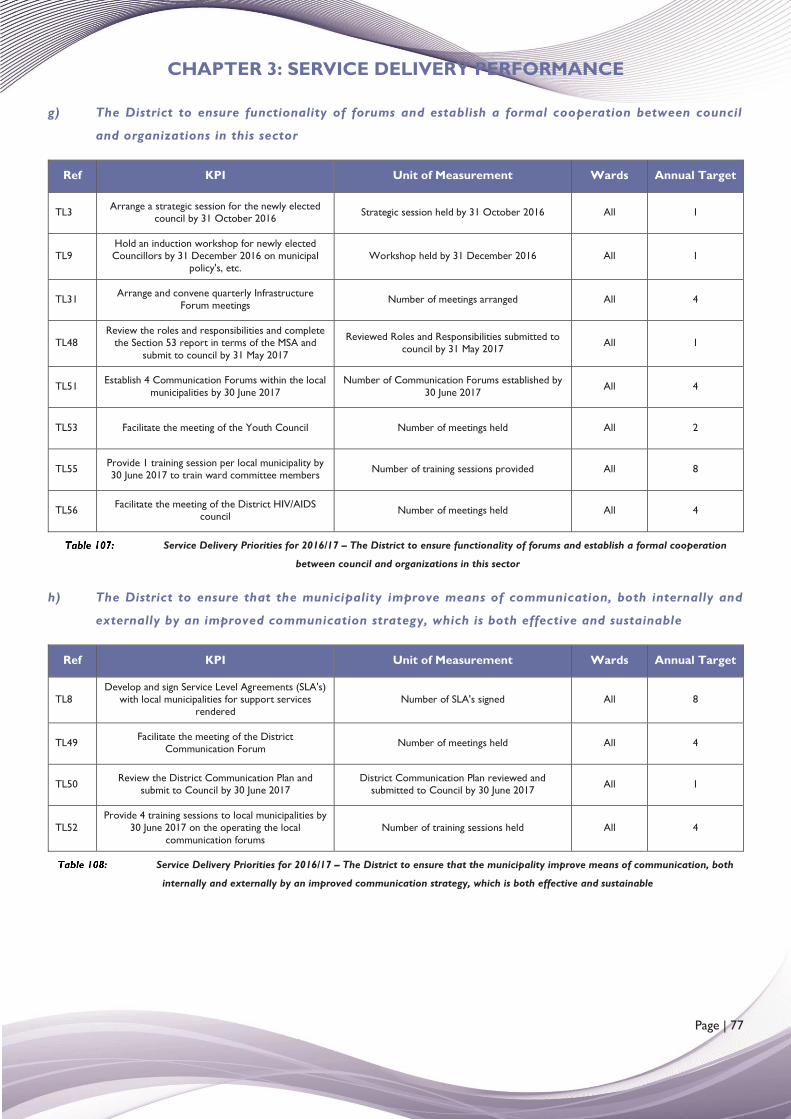
CHAPTER 3: SERVICE DELIVERY PERFORMANCE
Page | 77
g) The District to ensure functionality of forums and establish a formal cooperation between council
and organizations in this sector
Ref KPI Unit of Measurement Wards Annual Target
TL3 Arrange a strategic session for the newly elected council by 31 October 2016 Strategic session held by 31 October 2016 All 1
TL9 Hold an induction workshop for newly elected Councillors by 31 December 2016 on municipal
policy's, etc. Workshop held by 31 December 2016 All 1
TL31 Arrange and convene quarterly Infrastructure Forum meetings Number of meetings arranged All 4
TL48 Review the roles and responsibilities and complete
the Section 53 report in terms of the MSA and submit to council by 31 May 2017
Reviewed Roles and Responsibilities submitted to council by 31 May 2017 All 1
TL51 Establish 4 Communication Forums within the local municipalities by 30 June 2017
Number of Communication Forums established by 30 June 2017 All 4
TL53 Facilitate the meeting of the Youth Council Number of meetings held All 2
TL55 Provide 1 training session per local municipality by 30 June 2017 to train ward committee members Number of training sessions provided All 8
TL56 Facilitate the meeting of the District HIV/AIDS council Number of meetings held All 4
Service Delivery Priorities for 2016/17 – The District to ensure functionality of forums and establish a formal cooperation
between council and organizations in this sector
h) The District to ensure that the municipality improve means of communication, both internally and
externally by an improved communication strategy, which is both effective and sustainable
Ref KPI Unit of Measurement Wards Annual Target
TL8 Develop and sign Service Level Agreements (SLA's)
with local municipalities for support services rendered
Number of SLA's signed All 8
TL49 Facilitate the meeting of the District Communication Forum Number of meetings held All 4
TL50 Review the District Communication Plan and submit to Council by 30 June 2017
District Communication Plan reviewed and submitted to Council by 30 June 2017 All 1
TL52 Provide 4 training sessions to local municipalities by
30 June 2017 on the operating the local communication forums
Number of training sessions held All 4
Service Delivery Priorities for 2016/17 – The District to ensure that the municipality improve means of communication, both
internally and externally by an improved communication strategy, which is both effective and sustainable
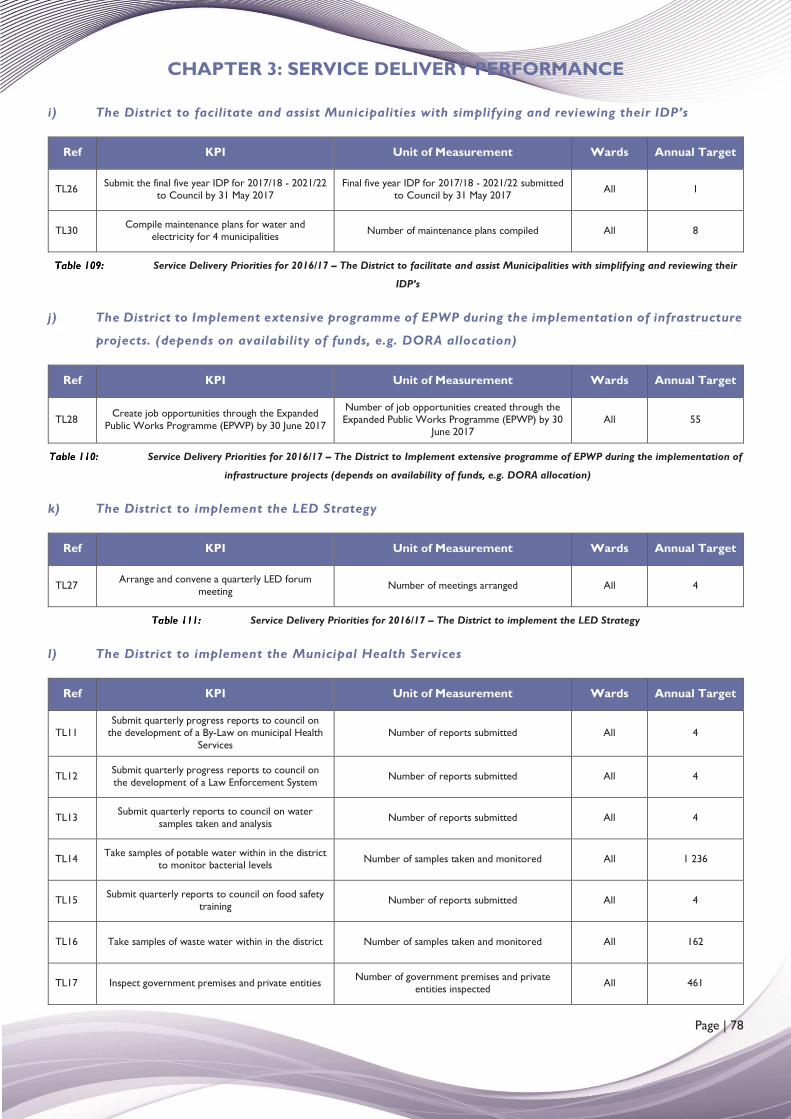
CHAPTER 3: SERVICE DELIVERY PERFORMANCE
Page | 78
i) The District to facilitate and assist Municipalities with simplifying and reviewing their IDP’s
Ref KPI Unit of Measurement Wards Annual Target
TL26 Submit the final five year IDP for 2017/18 - 2021/22 to Council by 31 May 2017
Final five year IDP for 2017/18 - 2021/22 submitted to Council by 31 May 2017 All 1
TL30 Compile maintenance plans for water and electricity for 4 municipalities Number of maintenance plans compiled All 8
Service Delivery Priorities for 2016/17 – The District to facilitate and assist Municipalities with simplifying and reviewing their
IDP’s
j) The District to Implement extensive programme of EPWP during the implementation of infrastructure
projects. (depends on availability of funds, e.g. DORA allocation)
Ref KPI Unit of Measurement Wards Annual Target
TL28 Create job opportunities through the Expanded Public Works Programme (EPWP) by 30 June 2017
Number of job opportunities created through the Expanded Public Works Programme (EPWP) by 30
June 2017 All 55
Service Delivery Priorities for 2016/17 – The District to Implement extensive programme of EPWP during the implementation of
infrastructure projects (depends on availability of funds, e.g. DORA allocation)
k) The District to implement the LED Strategy
Ref KPI Unit of Measurement Wards Annual Target
TL27 Arrange and convene a quarterly LED forum meeting Number of meetings arranged All 4
Service Delivery Priorities for 2016/17 – The District to implement the LED Strategy
l) The District to implement the Municipal Health Services
Ref KPI Unit of Measurement Wards Annual Target
TL11 Submit quarterly progress reports to council on
the development of a By-Law on municipal Health Services
Number of reports submitted All 4
TL12 Submit quarterly progress reports to council on the development of a Law Enforcement System Number of reports submitted All 4
TL13 Submit quarterly reports to council on water samples taken and analysis Number of reports submitted All 4
TL14 Take samples of potable water within in the district to monitor bacterial levels Number of samples taken and monitored All 1 236
TL15 Submit quarterly reports to council on food safety training Number of reports submitted All 4
TL16 Take samples of waste water within in the district Number of samples taken and monitored All 162
TL17 Inspect government premises and private entities Number of government premises and private entities inspected All 461
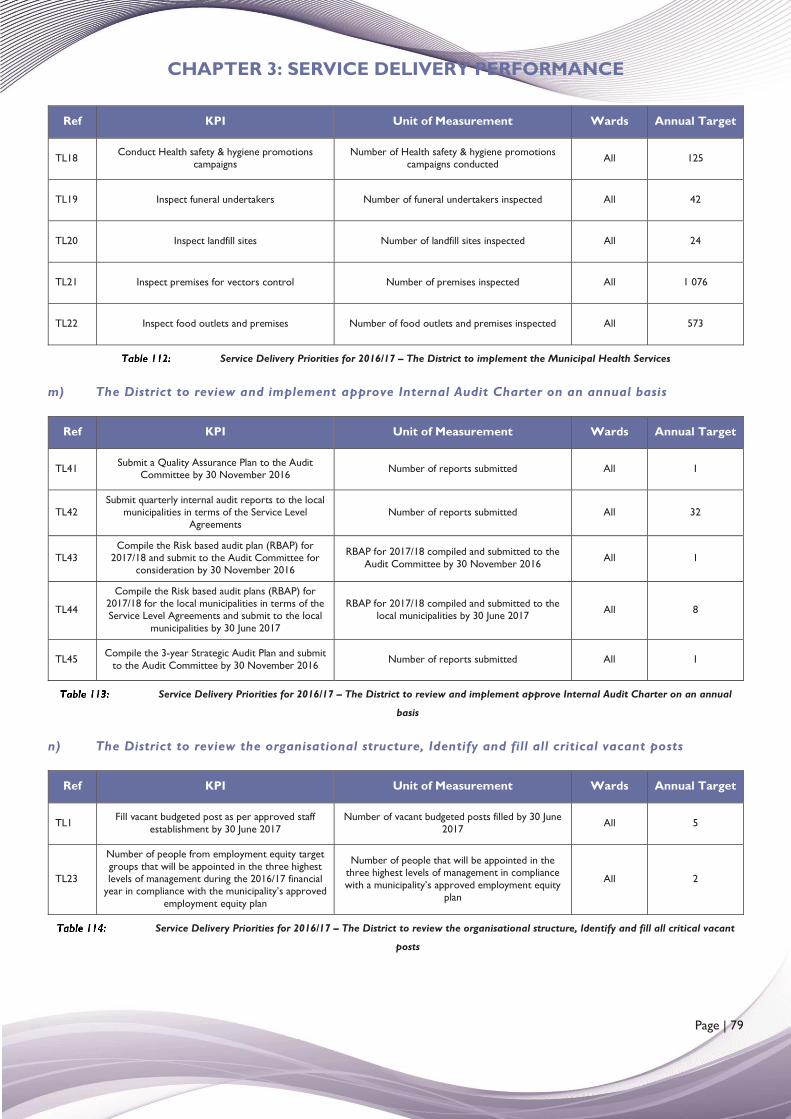
CHAPTER 3: SERVICE DELIVERY PERFORMANCE
Page | 79
Ref KPI Unit of Measurement Wards Annual Target
TL18 Conduct Health safety & hygiene promotions campaigns
Number of Health safety & hygiene promotions campaigns conducted All 125
TL19 Inspect funeral undertakers Number of funeral undertakers inspected All 42
TL20 Inspect landfill sites Number of landfill sites inspected All 24
TL21 Inspect premises for vectors control Number of premises inspected All 1 076
TL22 Inspect food outlets and premises Number of food outlets and premises inspected All 573
Service Delivery Priorities for 2016/17 – The District to implement the Municipal Health Services
m) The District to review and implement approve Internal Audit Charter on an annual basis
Ref KPI Unit of Measurement Wards Annual Target
TL41 Submit a Quality Assurance Plan to the Audit Committee by 30 November 2016 Number of reports submitted All 1
TL42 Submit quarterly internal audit reports to the local
municipalities in terms of the Service Level Agreements
Number of reports submitted All 32
TL43 Compile the Risk based audit plan (RBAP) for
2017/18 and submit to the Audit Committee for consideration by 30 November 2016
RBAP for 2017/18 compiled and submitted to the Audit Committee by 30 November 2016 All 1
TL44
Compile the Risk based audit plans (RBAP) for 2017/18 for the local municipalities in terms of the Service Level Agreements and submit to the local
municipalities by 30 June 2017
RBAP for 2017/18 compiled and submitted to the local municipalities by 30 June 2017 All 8
TL45 Compile the 3-year Strategic Audit Plan and submit to the Audit Committee by 30 November 2016 Number of reports submitted All 1
Service Delivery Priorities for 2016/17 – The District to review and implement approve Internal Audit Charter on an annual
basis
n) The District to review the organisational structure, Identify and fill all critical vacant posts
Ref KPI Unit of Measurement Wards Annual Target
TL1 Fill vacant budgeted post as per approved staff establishment by 30 June 2017
Number of vacant budgeted posts filled by 30 June 2017 All 5
TL23
Number of people from employment equity target groups that will be appointed in the three highest levels of management during the 2016/17 financial
year in compliance with the municipality’s approved employment equity plan
Number of people that will be appointed in the three highest levels of management in compliance with a municipality’s approved employment equity
plan
All 2
Service Delivery Priorities for 2016/17 – The District to review the organisational structure, Identify and fill all critical vacant
posts
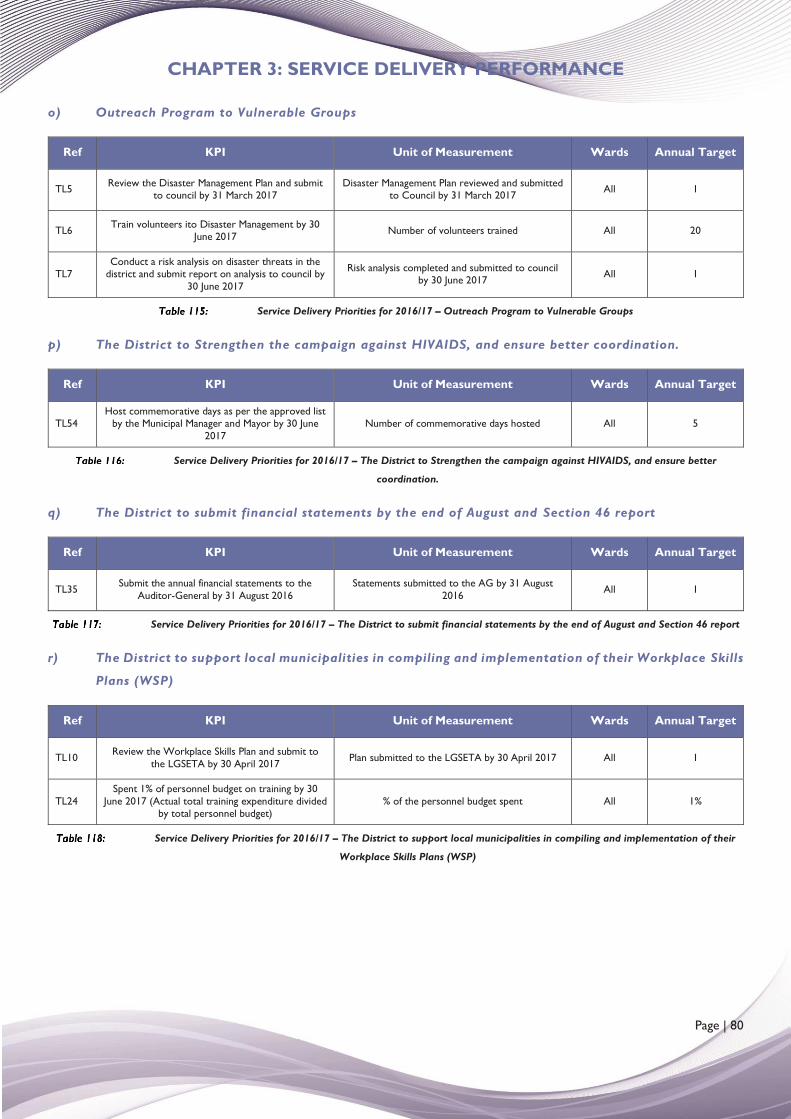
CHAPTER 3: SERVICE DELIVERY PERFORMANCE
Page | 80
o) Outreach Program to Vulnerable Groups
Ref KPI Unit of Measurement Wards Annual Target
TL5 Review the Disaster Management Plan and submit to council by 31 March 2017
Disaster Management Plan reviewed and submitted to Council by 31 March 2017 All 1
TL6 Train volunteers ito Disaster Management by 30 June 2017 Number of volunteers trained All 20
TL7 Conduct a risk analysis on disaster threats in the
district and submit report on analysis to council by 30 June 2017
Risk analysis completed and submitted to council by 30 June 2017 All 1
Service Delivery Priorities for 2016/17 – Outreach Program to Vulnerable Groups
p) The District to Strengthen the campaign against HIVAIDS, and ensure better coordination.
Ref KPI Unit of Measurement Wards Annual Target
TL54 Host commemorative days as per the approved list
by the Municipal Manager and Mayor by 30 June 2017
Number of commemorative days hosted All 5
Service Delivery Priorities for 2016/17 – The District to Strengthen the campaign against HIVAIDS, and ensure better
coordination.
q) The District to submit financial statements by the end of August and Section 46 report
Ref KPI Unit of Measurement Wards Annual Target
TL35 Submit the annual financial statements to the Auditor-General by 31 August 2016
Statements submitted to the AG by 31 August 2016 All 1
Service Delivery Priorities for 2016/17 – The District to submit financial statements by the end of August and Section 46 report
r) The District to support local municipalities in compiling and implementation of their Workplace Skills
Plans (WSP)
Ref KPI Unit of Measurement Wards Annual Target
TL10 Review the Workplace Skills Plan and submit to the LGSETA by 30 April 2017 Plan submitted to the LGSETA by 30 April 2017 All 1
TL24 Spent 1% of personnel budget on training by 30
June 2017 (Actual total training expenditure divided by total personnel budget)
% of the personnel budget spent All 1%
Service Delivery Priorities for 2016/17 – The District to support local municipalities in compiling and implementation of their
Workplace Skills Plans (WSP)
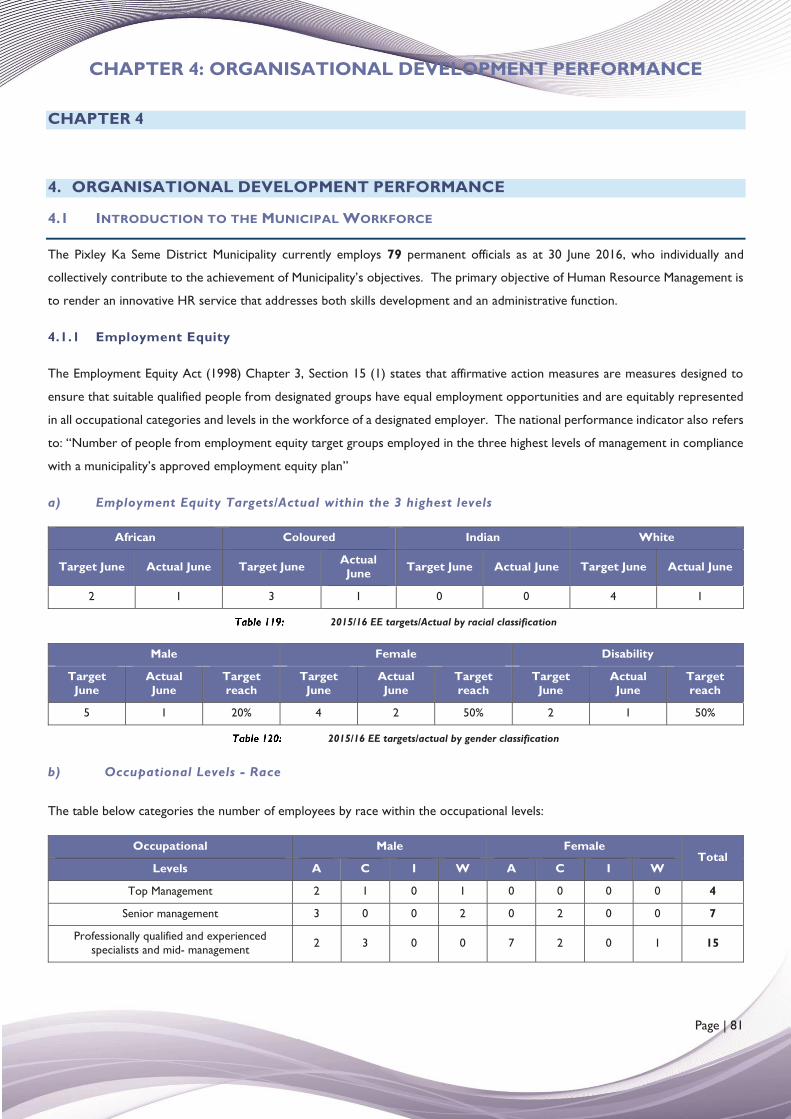
CHAPTER 4: ORGANISATIONAL DEVELOPMENT PERFORMANCE
Page | 81
CHAPTER 4
4. ORGANISATIONAL DEVELOPMENT PERFORMANCE
4.1 INTRODUCTION TO THE MUNICIPAL WORKFORCE
The Pixley Ka Seme District Municipality currently employs 79 permanent officials as at 30 June 2016, who individually and
collectively contribute to the achievement of Municipality’s objectives. The primary objective of Human Resource Management is
to render an innovative HR service that addresses both skills development and an administrative function.
4.1.1 Employment Equity
The Employment Equity Act (1998) Chapter 3, Section 15 (1) states that affirmative action measures are measures designed to
ensure that suitable qualified people from designated groups have equal employment opportunities and are equitably represented
in all occupational categories and levels in the workforce of a designated employer. The national performance indicator also refers
to: “Number of people from employment equity target groups employed in the three highest levels of management in compliance
with a municipality’s approved employment equity plan”
a) Employment Equity Targets/Actual within the 3 highest levels
African Coloured Indian White
Target June Actual June Target June Actual June Target June Actual June Target June Actual June
2 1 3 1 0 0 4 1
2015/16 EE targets/Actual by racial classification
Male Female Disability
Target June
Actual June
Target reach
Target June
Actual June
Target reach
Target June
Actual June
Target reach
5 1 20% 4 2 50% 2 1 50%
2015/16 EE targets/actual by gender classification
b) Occupational Levels - Race
The table below categories the number of employees by race within the occupational levels:
Occupational Male Female Total
Levels A C I W A C I W
Top Management 2 1 0 1 0 0 0 0 4
Senior management 3 0 0 2 0 2 0 0 7
Professionally qualified and experienced specialists and mid- management 2 3 0 0 7 2 0 1 15
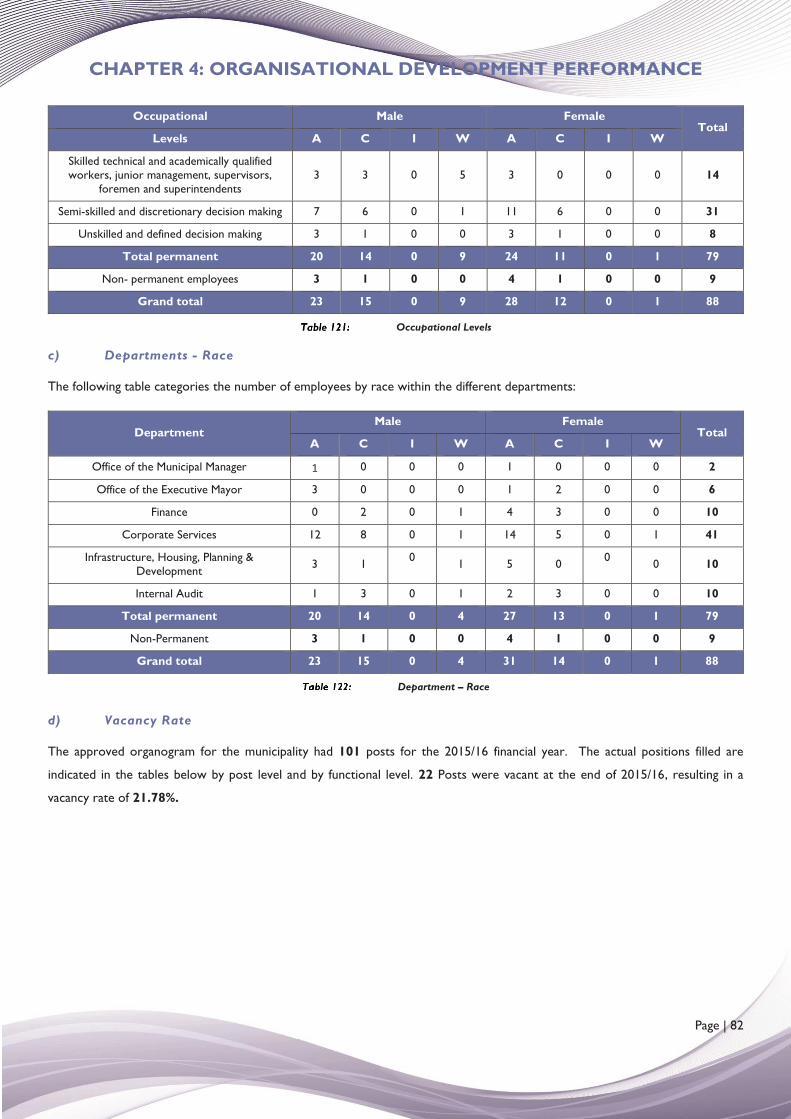
CHAPTER 4: ORGANISATIONAL DEVELOPMENT PERFORMANCE
Page | 82
Occupational Male Female Total
Levels A C I W A C I W
Skilled technical and academically qualified workers, junior management, supervisors,
foremen and superintendents 3 3 0 5 3 0 0 0 14
Semi-skilled and discretionary decision making 7 6 0 1 11 6 0 0 31
Unskilled and defined decision making 3 1 0 0 3 1 0 0 8
Total permanent 20 14 0 9 24 11 0 1 79
Non- permanent employees 3 1 0 0 4 1 0 0 9
Grand total 23 15 0 9 28 12 0 1 88
Occupational Levels
c) Departments - Race
The following table categories the number of employees by race within the different departments:
Department Male Female
Total A C I W A C I W
Office of the Municipal Manager 1 0 0 0 1 0 0 0 2
Office of the Executive Mayor 3 0 0 0 1 2 0 0 6
Finance 0 2 0 1 4 3 0 0 10
Corporate Services 12 8 0 1 14 5 0 1 41
Infrastructure, Housing, Planning & Development 3 1 0 1 5 0 0 0 10
Internal Audit 1 3 0 1 2 3 0 0 10
Total permanent 20 14 0 4 27 13 0 1 79
Non-Permanent 3 1 0 0 4 1 0 0 9
Grand total 23 15 0 4 31 14 0 1 88
Department – Race
d) Vacancy Rate
The approved organogram for the municipality had 101 posts for the 2015/16 financial year. The actual positions filled are
indicated in the tables below by post level and by functional level. 22 Posts were vacant at the end of 2015/16, resulting in a
vacancy rate of 21.78%.
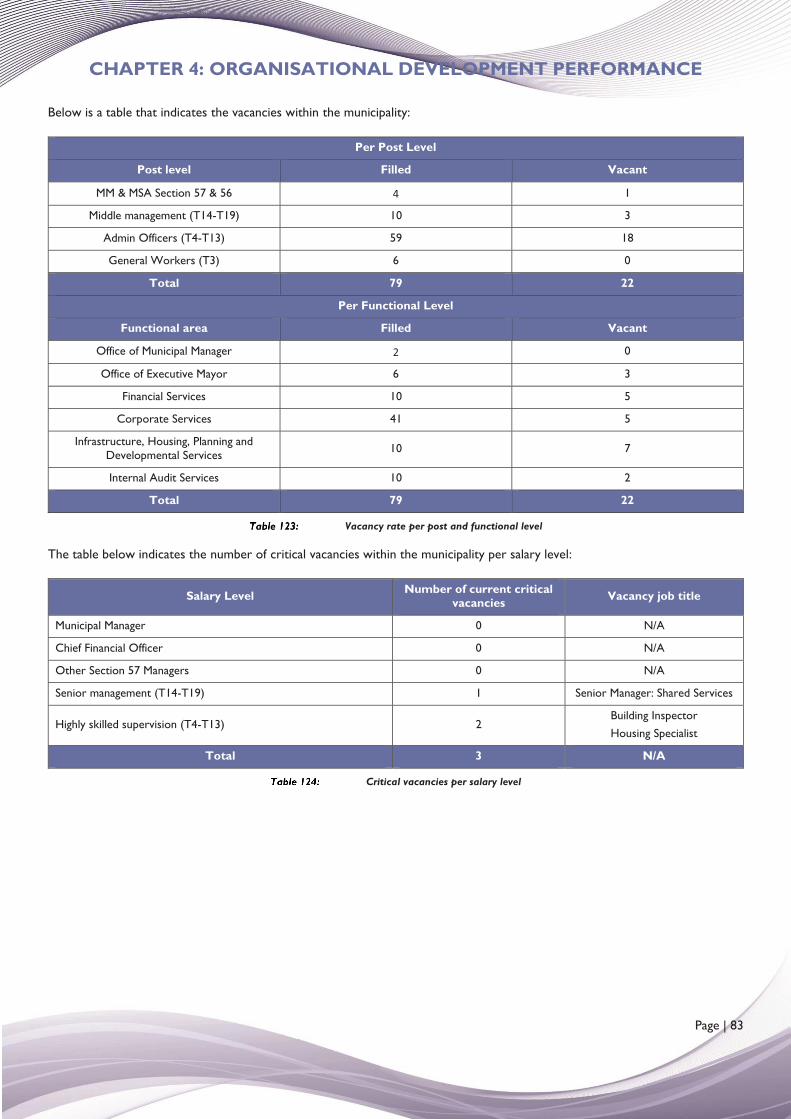
CHAPTER 4: ORGANISATIONAL DEVELOPMENT PERFORMANCE
Page | 83
Below is a table that indicates the vacancies within the municipality:
Per Post Level
Post level Filled Vacant
MM & MSA Section 57 & 56 4 1
Middle management (T14-T19) 10 3
Admin Officers (T4-T13) 59 18
General Workers (T3) 6 0
Total 79 22
Per Functional Level
Functional area Filled Vacant
Office of Municipal Manager 2 0
Office of Executive Mayor 6 3
Financial Services 10 5
Corporate Services 41 5
Infrastructure, Housing, Planning and Developmental Services 10 7
Internal Audit Services 10 2
Total 79 22
Vacancy rate per post and functional level
The table below indicates the number of critical vacancies within the municipality per salary level:
Salary Level Number of current critical vacancies Vacancy job title
Municipal Manager 0 N/A
Chief Financial Officer 0 N/A
Other Section 57 Managers 0 N/A
Senior management (T14-T19) 1 Senior Manager: Shared Services
Highly skilled supervision (T4-T13) 2 Building Inspector Housing Specialist
Total 3 N/A
Critical vacancies per salary level
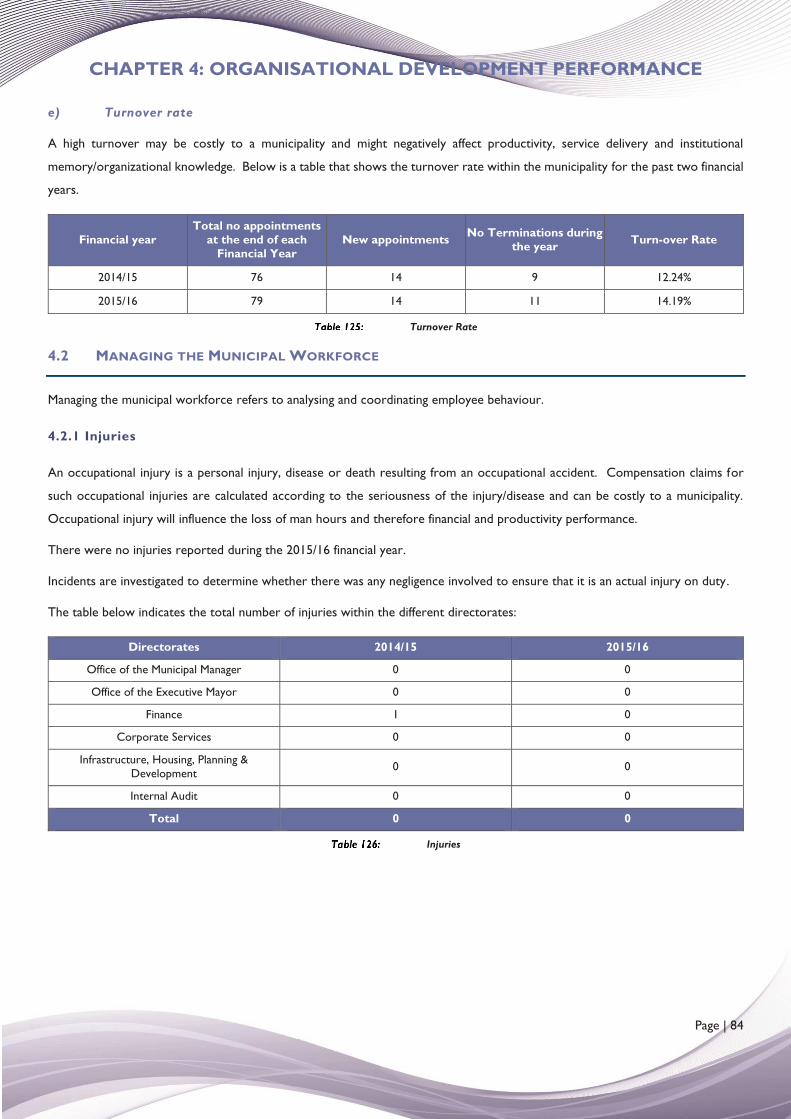
CHAPTER 4: ORGANISATIONAL DEVELOPMENT PERFORMANCE
Page | 84
e) Turnover rate
A high turnover may be costly to a municipality and might negatively affect productivity, service delivery and institutional
memory/organizational knowledge. Below is a table that shows the turnover rate within the municipality for the past two financial
years.
Financial year Total no appointments
at the end of each Financial Year
New appointments No Terminations during the year Turn-over Rate
2014/15 76 14 9 12.24%
2015/16 79 14 11 14.19%
Turnover Rate
4.2 MANAGING THE MUNICIPAL WORKFORCE
Managing the municipal workforce refers to analysing and coordinating employee behaviour.
4.2.1 Injuries
An occupational injury is a personal injury, disease or death resulting from an occupational accident. Compensation claims for
such occupational injuries are calculated according to the seriousness of the injury/disease and can be costly to a municipality.
Occupational injury will influence the loss of man hours and therefore financial and productivity performance.
There were no injuries reported during the 2015/16 financial year.
Incidents are investigated to determine whether there was any negligence involved to ensure that it is an actual injury on duty.
The table below indicates the total number of injuries within the different directorates:
Directorates 2014/15 2015/16
Office of the Municipal Manager 0 0
Office of the Executive Mayor 0 0
Finance 1 0
Corporate Services 0 0
Infrastructure, Housing, Planning & Development 0 0
Internal Audit 0 0
Total 0 0
Injuries
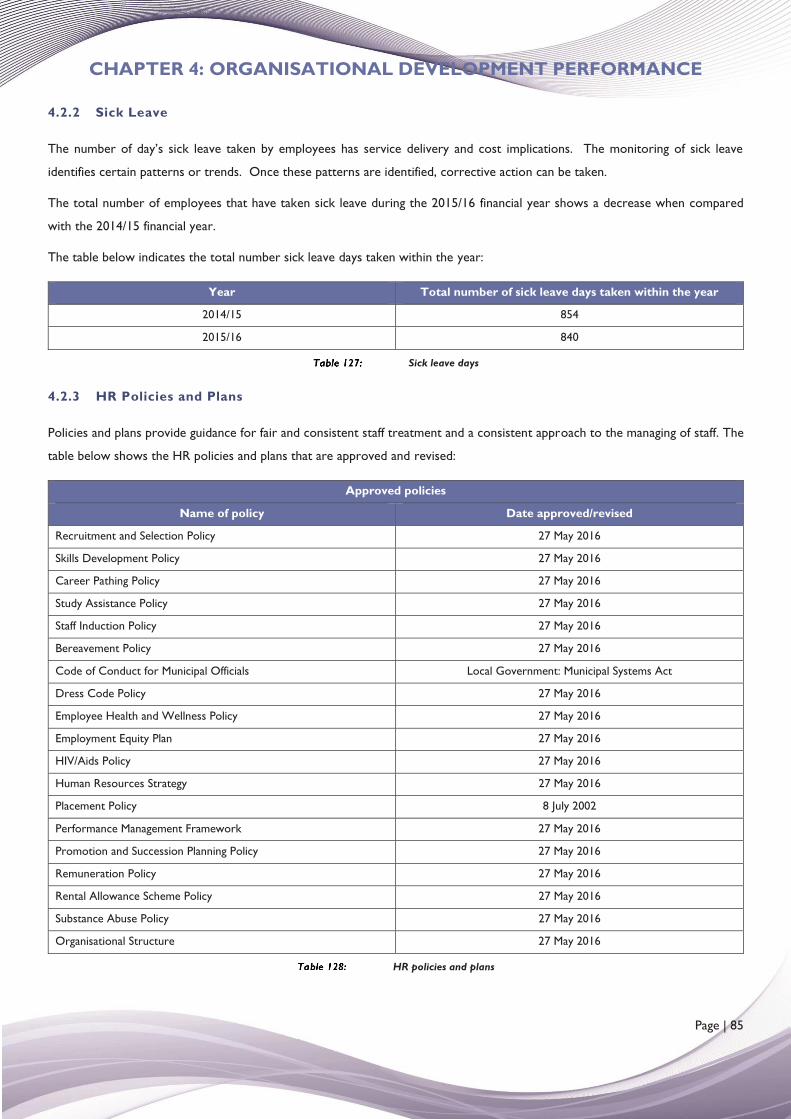
CHAPTER 4: ORGANISATIONAL DEVELOPMENT PERFORMANCE
Page | 85
4.2.2 Sick Leave
The number of day’s sick leave taken by employees has service delivery and cost implications. The monitoring of sick leave
identifies certain patterns or trends. Once these patterns are identified, corrective action can be taken.
The total number of employees that have taken sick leave during the 2015/16 financial year shows a decrease when compared
with the 2014/15 financial year.
The table below indicates the total number sick leave days taken within the year:
Year Total number of sick leave days taken within the year
2014/15 854
2015/16 840
Sick leave days
4.2.3 HR Policies and Plans
Policies and plans provide guidance for fair and consistent staff treatment and a consistent approach to the managing of staff. The
table below shows the HR policies and plans that are approved and revised:
Approved policies
Name of policy Date approved/revised
Recruitment and Selection Policy 27 May 2016
Skills Development Policy 27 May 2016
Career Pathing Policy 27 May 2016
Study Assistance Policy 27 May 2016
Staff Induction Policy 27 May 2016
Bereavement Policy 27 May 2016
Code of Conduct for Municipal Officials Local Government: Municipal Systems Act
Dress Code Policy 27 May 2016
Employee Health and Wellness Policy 27 May 2016
Employment Equity Plan 27 May 2016
HIV/Aids Policy 27 May 2016
Human Resources Strategy 27 May 2016
Placement Policy 8 July 2002
Performance Management Framework 27 May 2016
Promotion and Succession Planning Policy 27 May 2016
Remuneration Policy 27 May 2016
Rental Allowance Scheme Policy 27 May 2016
Substance Abuse Policy 27 May 2016
Organisational Structure 27 May 2016
HR policies and plans
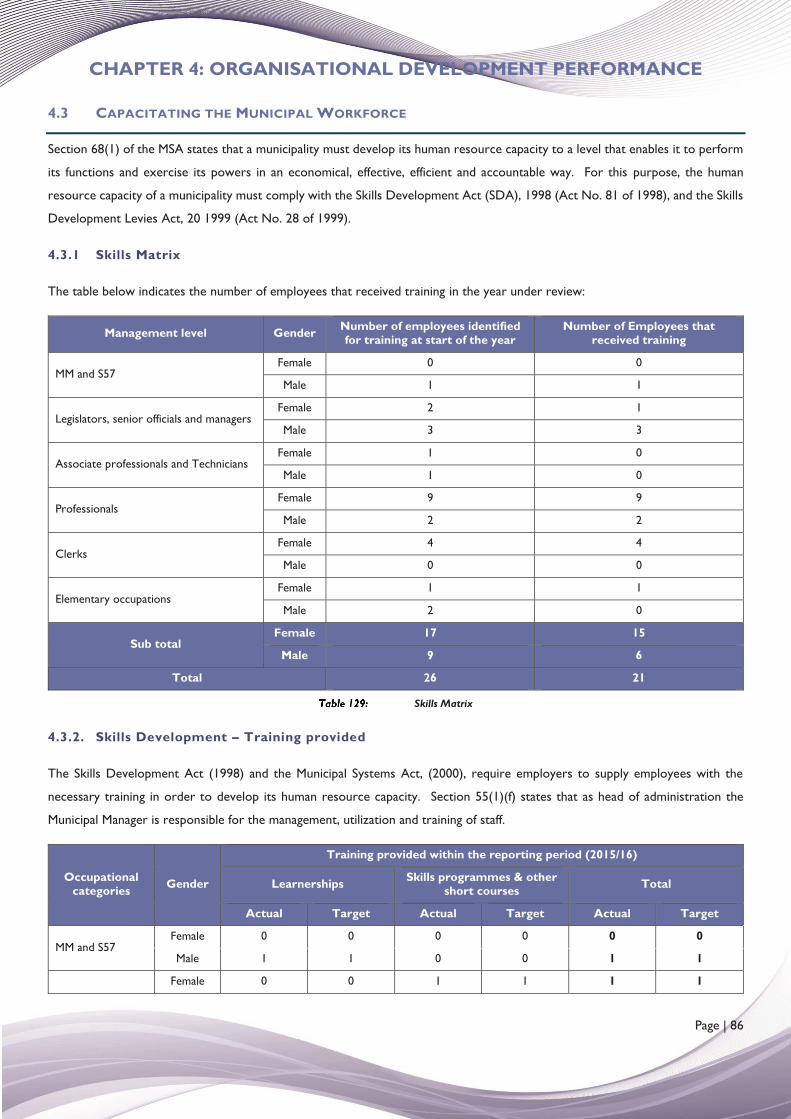
CHAPTER 4: ORGANISATIONAL DEVELOPMENT PERFORMANCE
Page | 86
4.3 CAPACITATING THE MUNICIPAL WORKFORCE
Section 68(1) of the MSA states that a municipality must develop its human resource capacity to a level that enables it to perform
its functions and exercise its powers in an economical, effective, efficient and accountable way. For this purpose, the human
resource capacity of a municipality must comply with the Skills Development Act (SDA), 1998 (Act No. 81 of 1998), and the Skills
Development Levies Act, 20 1999 (Act No. 28 of 1999).
4.3.1 Skills Matrix
The table below indicates the number of employees that received training in the year under review:
Management level Gender Number of employees identified for training at start of the year
Number of Employees that received training
MM and S57 Female 0 0
Male 1 1
Legislators, senior officials and managers Female 2 1
Male 3 3
Associate professionals and Technicians Female 1 0
Male 1 0
Professionals Female 9 9
Male 2 2
Clerks Female 4 4
Male 0 0
Elementary occupations Female 1 1
Male 2 0
Sub total Female 17 15
Male 9 6
Total 26 21
Skills Matrix
4.3.2. Skills Development – Training provided
The Skills Development Act (1998) and the Municipal Systems Act, (2000), require employers to supply employees with the
necessary training in order to develop its human resource capacity. Section 55(1)(f) states that as head of administration the
Municipal Manager is responsible for the management, utilization and training of staff.
Occupational categories Gender
Training provided within the reporting period (2015/16)
Learnerships Skills programmes & other short courses Total
Actual Target Actual Target Actual Target
MM and S57 Female 0 0 0 0 0 0
Male 1 1 0 0 1 1
Female 0 0 1 1 1 1
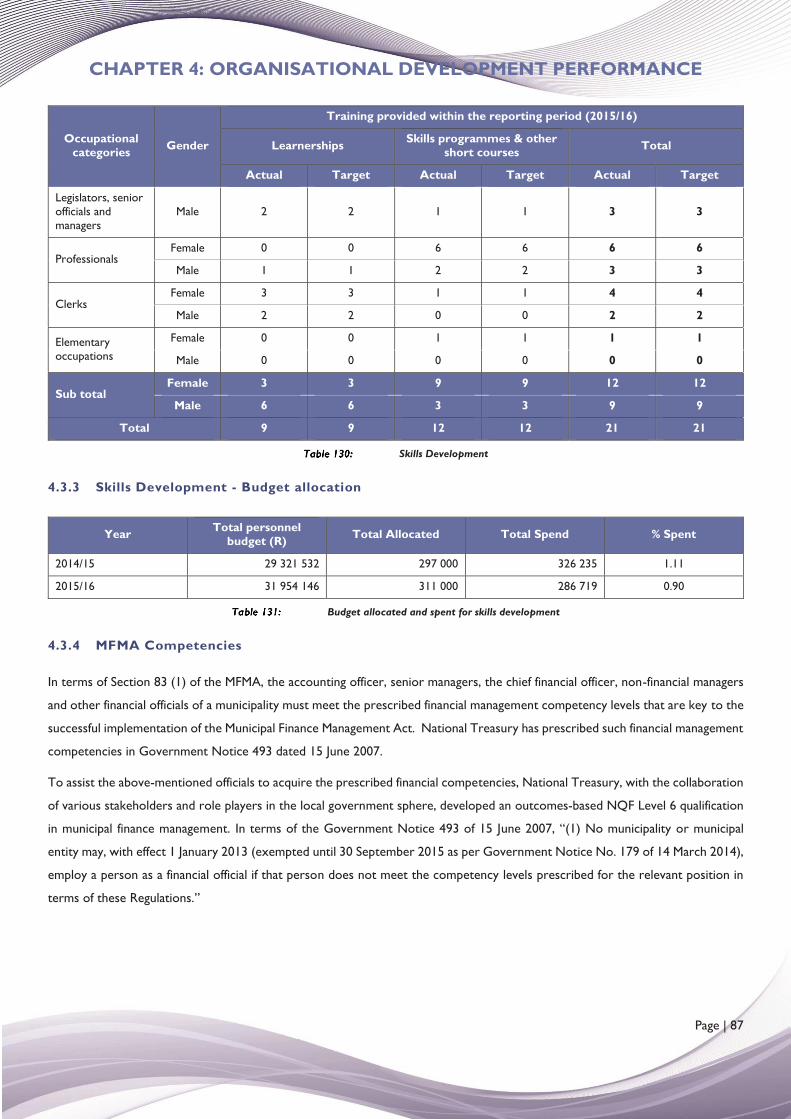
CHAPTER 4: ORGANISATIONAL DEVELOPMENT PERFORMANCE
Page | 87
Occupational categories Gender
Training provided within the reporting period (2015/16)
Learnerships Skills programmes & other short courses Total
Actual Target Actual Target Actual Target
Legislators, senior officials and managers
Male 2 2 1 1 3 3
Professionals Female 0 0 6 6 6 6
Male 1 1 2 2 3 3
Clerks Female 3 3 1 1 4 4
Male 2 2 0 0 2 2
Elementary occupations
Female 0 0 1 1 1 1
Male 0 0 0 0 0 0
Sub total Female 3 3 9 9 12 12
Male 6 6 3 3 9 9
Total 9 9 12 12 21 21
Skills Development
4.3.3 Skills Development - Budget allocation
Year Total personnel budget (R) Total Allocated Total Spend % Spent
2014/15 29 321 532 297 000 326 235 1.11
2015/16 31 954 146 311 000 286 719 0.90
Budget allocated and spent for skills development
4.3.4 MFMA Competencies
In terms of Section 83 (1) of the MFMA, the accounting officer, senior managers, the chief financial officer, non-financial managers
and other financial officials of a municipality must meet the prescribed financial management competency levels that are key to the
successful implementation of the Municipal Finance Management Act. National Treasury has prescribed such financial management
competencies in Government Notice 493 dated 15 June 2007.
To assist the above-mentioned officials to acquire the prescribed financial competencies, National Treasury, with the collaboration
of various stakeholders and role players in the local government sphere, developed an outcomes-based NQF Level 6 qualification
in municipal finance management. In terms of the Government Notice 493 of 15 June 2007, “(1) No municipality or municipal
entity may, with effect 1 January 2013 (exempted until 30 September 2015 as per Government Notice No. 179 of 14 March 2014),
employ a person as a financial official if that person does not meet the competency levels prescribed for the relevant position in
terms of these Regulations.”
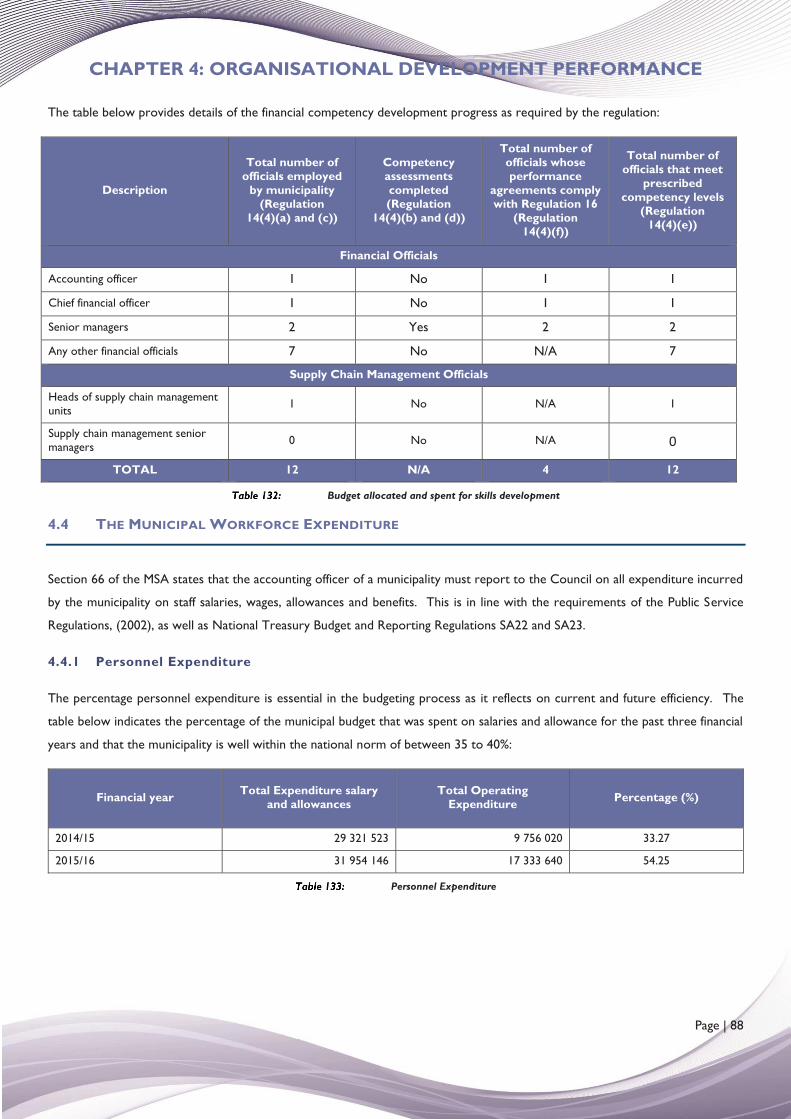
CHAPTER 4: ORGANISATIONAL DEVELOPMENT PERFORMANCE
Page | 88
The table below provides details of the financial competency development progress as required by the regulation:
Description
Total number of officials employed
by municipality (Regulation
14(4)(a) and (c))
Competency assessments completed (Regulation
14(4)(b) and (d))
Total number of officials whose performance
agreements comply with Regulation 16
(Regulation 14(4)(f))
Total number of officials that meet
prescribed competency levels
(Regulation 14(4)(e))
Financial Officials
Accounting officer 1 No 1 1
Chief financial officer 1 No 1 1
Senior managers 2 Yes 2 2
Any other financial officials 7 No N/A 7
Supply Chain Management Officials
Heads of supply chain management units 1 No N/A 1
Supply chain management senior managers 0 No N/A 0
TOTAL 12 N/A 4 12
Budget allocated and spent for skills development
4.4 THE MUNICIPAL WORKFORCE EXPENDITURE
Section 66 of the MSA states that the accounting officer of a municipality must report to the Council on all expenditure incurred
by the municipality on staff salaries, wages, allowances and benefits. This is in line with the requirements of the Public Service
Regulations, (2002), as well as National Treasury Budget and Reporting Regulations SA22 and SA23.
4.4.1 Personnel Expenditure
The percentage personnel expenditure is essential in the budgeting process as it reflects on current and future efficiency. The
table below indicates the percentage of the municipal budget that was spent on salaries and allowance for the past three financial
years and that the municipality is well within the national norm of between 35 to 40%:
Financial year Total Expenditure salary and allowances
Total Operating Expenditure Percentage (%)
2014/15 29 321 523 9 756 020 33.27
2015/16 31 954 146 17 333 640 54.25
Personnel Expenditure
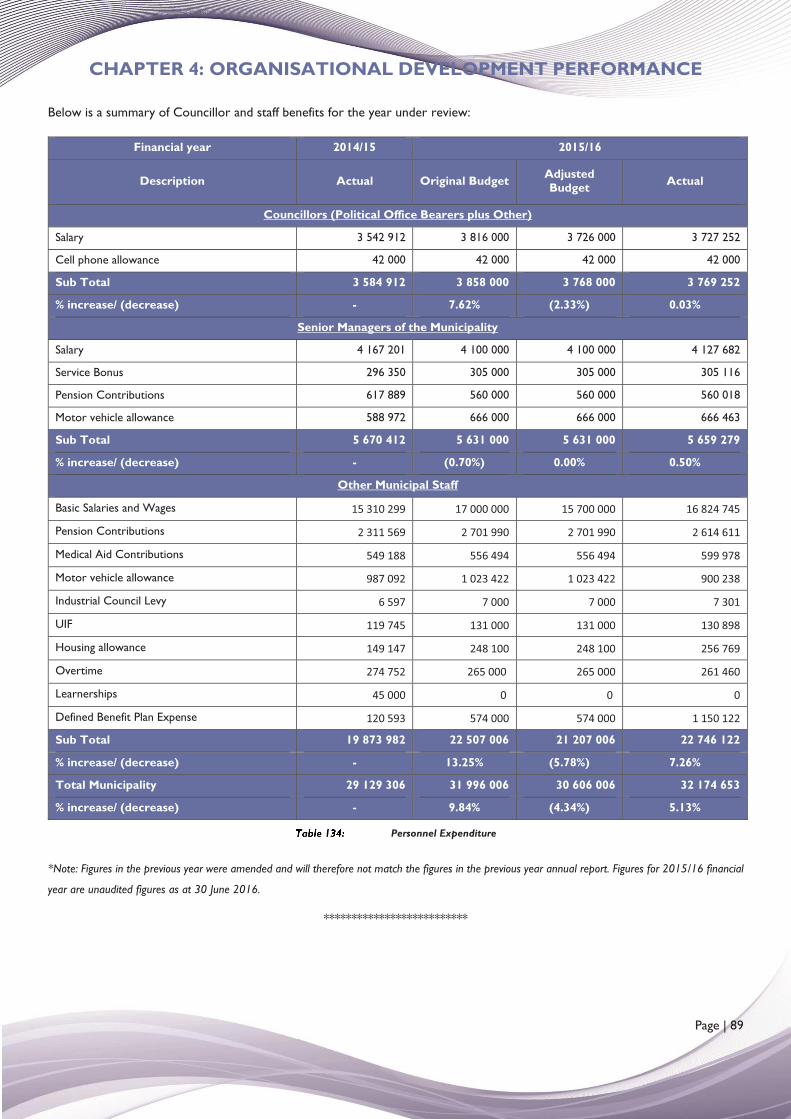
CHAPTER 4: ORGANISATIONAL DEVELOPMENT PERFORMANCE
Page | 89
Below is a summary of Councillor and staff benefits for the year under review:
Financial year 2014/15 2015/16
Description Actual Original Budget Adjusted Budget Actual
Councillors (Political Office Bearers plus Other)
Salary 3 542 912 3 816 000 3 726 000 3 727 252
Cell phone allowance 42 000 42 000 42 000 42 000
Sub Total 3 584 912 3 858 000 3 768 000 3 769 252
% increase/ (decrease) - 7.62% (2.33%) 0.03%
Senior Managers of the Municipality
Salary 4 167 201 4 100 000 4 100 000 4 127 682
Service Bonus 296 350 305 000 305 000 305 116
Pension Contributions 617 889 560 000 560 000 560 018
Motor vehicle allowance 588 972 666 000 666 000 666 463
Sub Total 5 670 412 5 631 000 5 631 000 5 659 279
% increase/ (decrease) - (0.70%) 0.00% 0.50%
Other Municipal Staff
Basic Salaries and Wages 15 310 299 17 000 000 15 700 000 16 824 745
Pension Contributions 2 311 569 2 701 990 2 701 990 2 614 611
Medical Aid Contributions 549 188 556 494 556 494 599 978
Motor vehicle allowance 987 092 1 023 422 1 023 422 900 238
Industrial Council Levy 6 597 7 000 7 000 7 301
UIF 119 745 131 000 131 000 130 898
Housing allowance 149 147 248 100 248 100 256 769
Overtime 274 752 265 000 265 000 261 460
Learnerships 45 000 0 0 0
Defined Benefit Plan Expense 120 593 574 000 574 000 1 150 122
Sub Total 19 873 982 22 507 006 21 207 006 22 746 122
% increase/ (decrease) - 13.25% (5.78%) 7.26%
Total Municipality 29 129 306 31 996 006 30 606 006 32 174 653
% increase/ (decrease) - 9.84% (4.34%) 5.13%
Personnel Expenditure
*Note: Figures in the previous year were amended and will therefore not match the figures in the previous year annual report. Figures for 2015/16 financial
year are unaudited figures as at 30 June 2016.
**************************
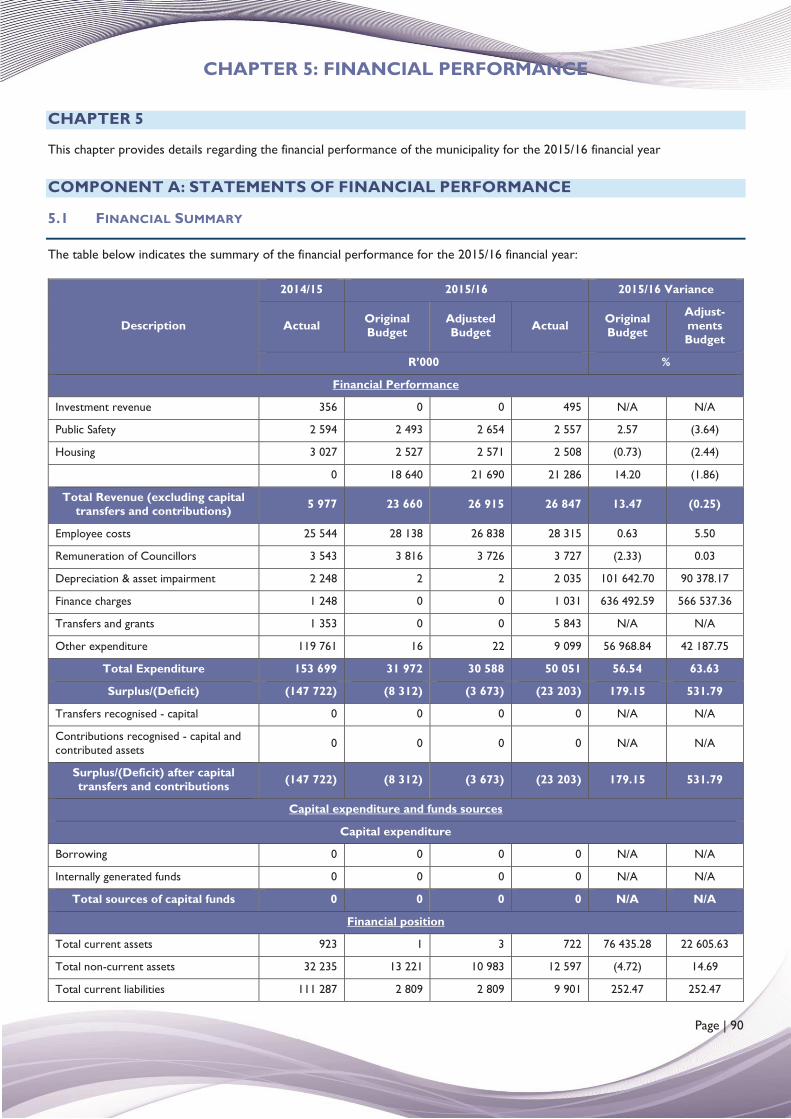
CHAPTER 5: FINANCIAL PERFORMANCE
Page | 90
CHAPTER 5
This chapter provides details regarding the financial performance of the municipality for the 2015/16 financial year
COMPONENT A: STATEMENTS OF FINANCIAL PERFORMANCE
5.1 FINANCIAL SUMMARY
The table below indicates the summary of the financial performance for the 2015/16 financial year:
Description
2014/15 2015/16 2015/16 Variance
Actual Original Budget
Adjusted Budget Actual Original
Budget
Adjust-ments Budget
R’000 %
Financial Performance
Investment revenue 356 0 0 495 N/A N/A
Public Safety 2 594 2 493 2 654 2 557 2.57 (3.64)
Housing 3 027 2 527 2 571 2 508 (0.73) (2.44)
0 18 640 21 690 21 286 14.20 (1.86)
Total Revenue (excluding capital transfers and contributions) 5 977 23 660 26 915 26 847 13.47 (0.25)
Employee costs 25 544 28 138 26 838 28 315 0.63 5.50
Remuneration of Councillors 3 543 3 816 3 726 3 727 (2.33) 0.03
Depreciation & asset impairment 2 248 2 2 2 035 101 642.70 90 378.17
Finance charges 1 248 0 0 1 031 636 492.59 566 537.36
Transfers and grants 1 353 0 0 5 843 N/A N/A
Other expenditure 119 761 16 22 9 099 56 968.84 42 187.75
Total Expenditure 153 699 31 972 30 588 50 051 56.54 63.63
Surplus/(Deficit) (147 722) (8 312) (3 673) (23 203) 179.15 531.79
Transfers recognised - capital 0 0 0 0 N/A N/A
Contributions recognised - capital and contributed assets 0 0 0 0 N/A N/A
Surplus/(Deficit) after capital transfers and contributions (147 722) (8 312) (3 673) (23 203) 179.15 531.79
Capital expenditure and funds sources
Capital expenditure
Borrowing 0 0 0 0 N/A N/A
Internally generated funds 0 0 0 0 N/A N/A
Total sources of capital funds 0 0 0 0 N/A N/A
Financial position
Total current assets 923 1 3 722 76 435.28 22 605.63
Total non-current assets 32 235 13 221 10 983 12 597 (4.72) 14.69
Total current liabilities 111 287 2 809 2 809 9 901 252.47 252.47
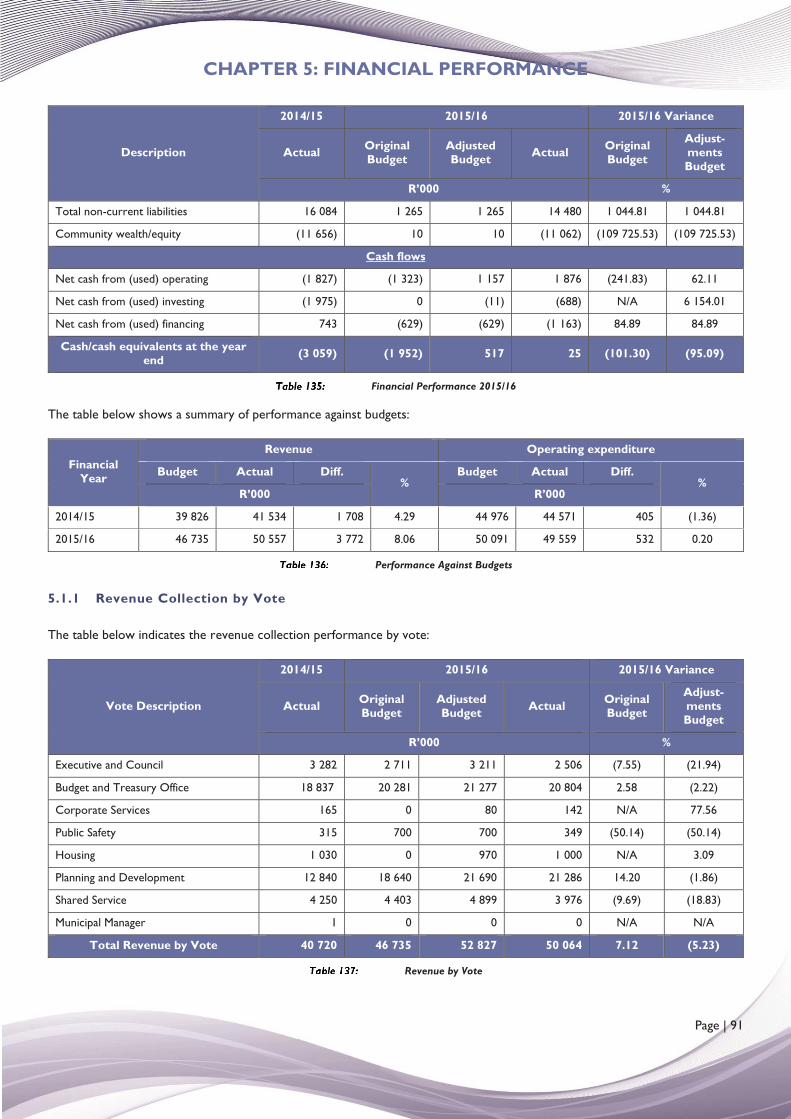
CHAPTER 5: FINANCIAL PERFORMANCE
Page | 91
Description
2014/15 2015/16 2015/16 Variance
Actual Original Budget
Adjusted Budget Actual Original
Budget
Adjust-ments Budget
R’000 %
Total non-current liabilities 16 084 1 265 1 265 14 480 1 044.81 1 044.81
Community wealth/equity (11 656) 10 10 (11 062) (109 725.53) (109 725.53)
Cash flows
Net cash from (used) operating (1 827) (1 323) 1 157 1 876 (241.83) 62.11
Net cash from (used) investing (1 975) 0 (11) (688) N/A 6 154.01
Net cash from (used) financing 743 (629) (629) (1 163) 84.89 84.89
Cash/cash equivalents at the year end (3 059) (1 952) 517 25 (101.30) (95.09)
Financial Performance 2015/16
The table below shows a summary of performance against budgets:
Financial Year
Revenue Operating expenditure
Budget Actual Diff. %
Budget Actual Diff. %
R’000 R’000
2014/15 39 826 41 534 1 708 4.29 44 976 44 571 405 (1.36)
2015/16 46 735 50 557 3 772 8.06 50 091 49 559 532 0.20
Performance Against Budgets
5.1.1 Revenue Collection by Vote
The table below indicates the revenue collection performance by vote:
Vote Description
2014/15 2015/16 2015/16 Variance
Actual Original Budget
Adjusted Budget Actual Original
Budget
Adjust-ments Budget
R’000 %
Executive and Council 3 282 2 711 3 211 2 506 (7.55) (21.94)
Budget and Treasury Office 18 837 20 281 21 277 20 804 2.58 (2.22)
Corporate Services 165 0 80 142 N/A 77.56
Public Safety 315 700 700 349 (50.14) (50.14)
Housing 1 030 0 970 1 000 N/A 3.09
Planning and Development 12 840 18 640 21 690 21 286 14.20 (1.86)
Shared Service 4 250 4 403 4 899 3 976 (9.69) (18.83)
Municipal Manager 1 0 0 0 N/A N/A
Total Revenue by Vote 40 720 46 735 52 827 50 064 7.12 (5.23)
Revenue by Vote
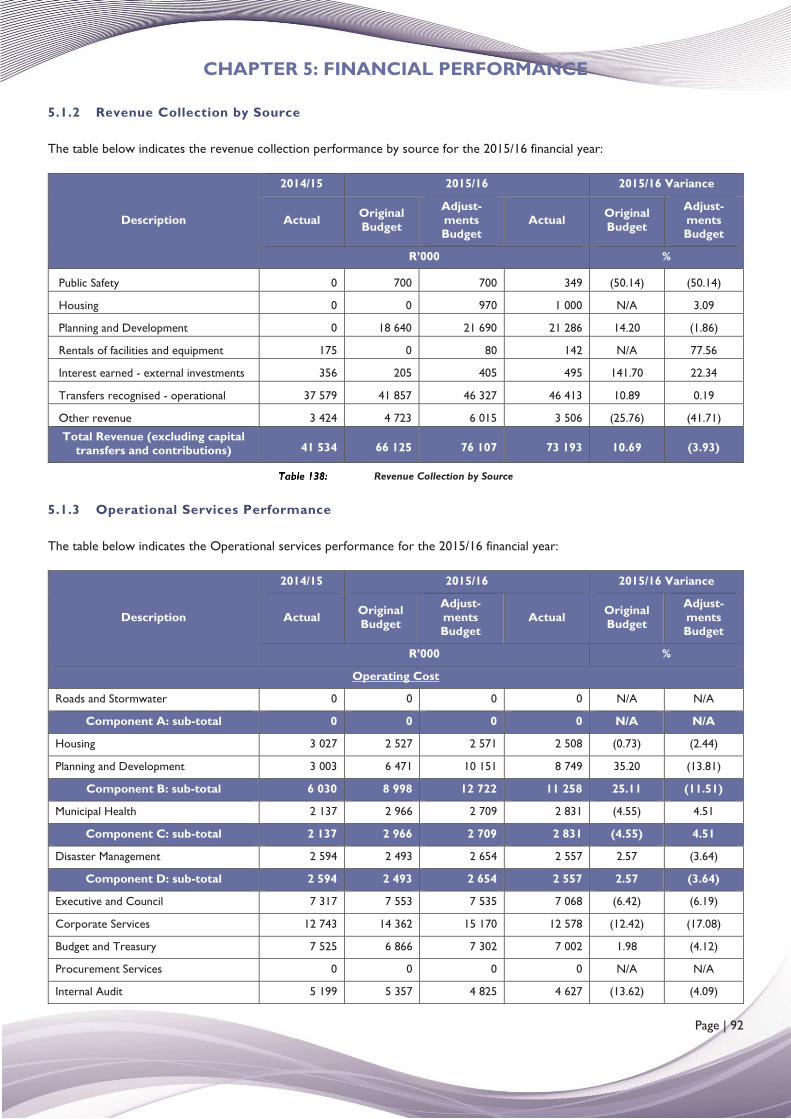
CHAPTER 5: FINANCIAL PERFORMANCE
Page | 92
5.1.2 Revenue Collection by Source
The table below indicates the revenue collection performance by source for the 2015/16 financial year:
Description
2014/15 2015/16 2015/16 Variance
Actual Original Budget
Adjust-ments Budget
Actual Original Budget
Adjust-ments Budget
R’000 %
Public Safety 0 700 700 349 (50.14) (50.14)
Housing 0 0 970 1 000 N/A 3.09
Planning and Development 0 18 640 21 690 21 286 14.20 (1.86)
Rentals of facilities and equipment 175 0 80 142 N/A 77.56
Interest earned - external investments 356 205 405 495 141.70 22.34
Transfers recognised - operational 37 579 41 857 46 327 46 413 10.89 0.19
Other revenue 3 424 4 723 6 015 3 506 (25.76) (41.71)
Total Revenue (excluding capital transfers and contributions) 41 534 66 125 76 107 73 193 10.69 (3.93)
Revenue Collection by Source
5.1.3 Operational Services Performance
The table below indicates the Operational services performance for the 2015/16 financial year:
Description
2014/15 2015/16 2015/16 Variance
Actual Original Budget
Adjust-ments Budget
Actual Original Budget
Adjust-ments Budget
R’000 %
Operating Cost
Roads and Stormwater 0 0 0 0 N/A N/A
Component A: sub-total 0 0 0 0 N/A N/A
Housing 3 027 2 527 2 571 2 508 (0.73) (2.44)
Planning and Development 3 003 6 471 10 151 8 749 35.20 (13.81)
Component B: sub-total 6 030 8 998 12 722 11 258 25.11 (11.51)
Municipal Health 2 137 2 966 2 709 2 831 (4.55) 4.51
Component C: sub-total 2 137 2 966 2 709 2 831 (4.55) 4.51
Disaster Management 2 594 2 493 2 654 2 557 2.57 (3.64)
Component D: sub-total 2 594 2 493 2 654 2 557 2.57 (3.64)
Executive and Council 7 317 7 553 7 535 7 068 (6.42) (6.19)
Corporate Services 12 743 14 362 15 170 12 578 (12.42) (17.08)
Budget and Treasury 7 525 6 866 7 302 7 002 1.98 (4.12)
Procurement Services 0 0 0 0 N/A N/A
Internal Audit 5 199 5 357 4 825 4 627 (13.62) (4.09)
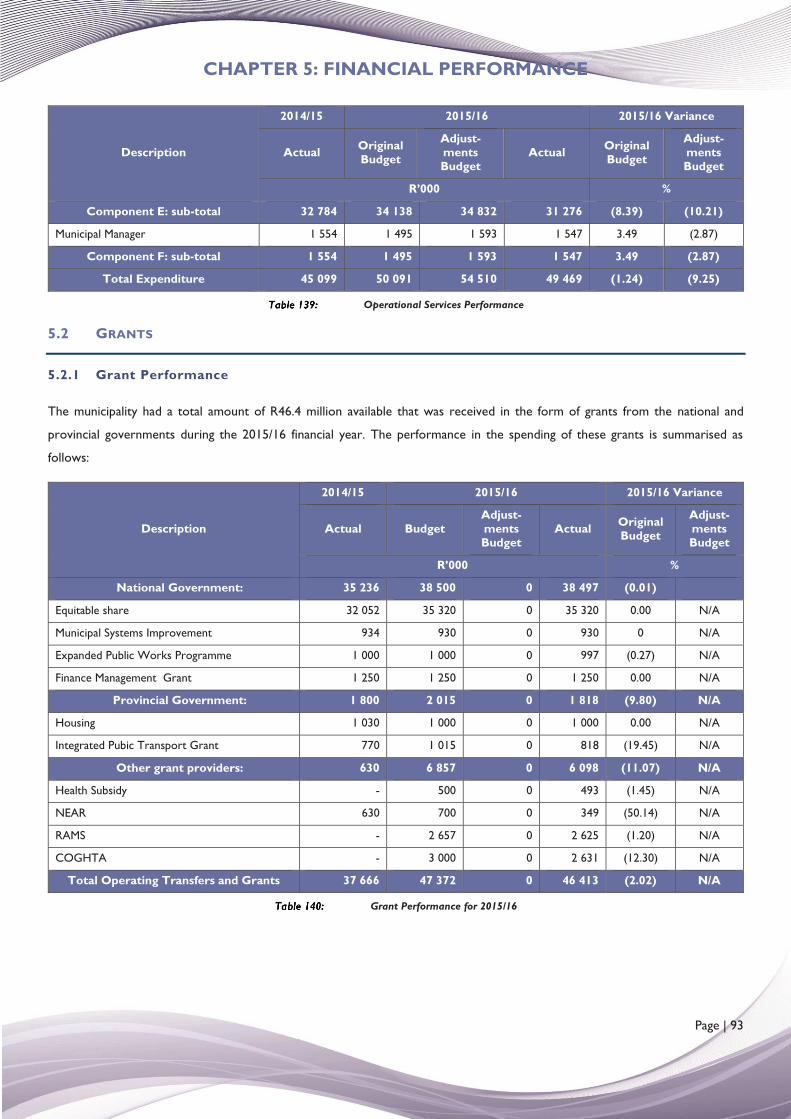
CHAPTER 5: FINANCIAL PERFORMANCE
Page | 93
Description
2014/15 2015/16 2015/16 Variance
Actual Original Budget
Adjust-ments Budget
Actual Original Budget
Adjust-ments Budget
R’000 %
Component E: sub-total 32 784 34 138 34 832 31 276 (8.39) (10.21)
Municipal Manager 1 554 1 495 1 593 1 547 3.49 (2.87)
Component F: sub-total 1 554 1 495 1 593 1 547 3.49 (2.87)
Total Expenditure 45 099 50 091 54 510 49 469 (1.24) (9.25)
Operational Services Performance
5.2 GRANTS
5.2.1 Grant Performance
The municipality had a total amount of R46.4 million available that was received in the form of grants from the national and
provincial governments during the 2015/16 financial year. The performance in the spending of these grants is summarised as
follows:
Description
2014/15 2015/16 2015/16 Variance
Actual Budget Adjust-ments Budget
Actual Original Budget
Adjust-ments Budget
R’000 %
National Government: 35 236 38 500 0 38 497 (0.01)
Equitable share 32 052 35 320 0 35 320 0.00 N/A
Municipal Systems Improvement 934 930 0 930 0 N/A
Expanded Public Works Programme 1 000 1 000 0 997 (0.27) N/A
Finance Management Grant 1 250 1 250 0 1 250 0.00 N/A
Provincial Government: 1 800 2 015 0 1 818 (9.80) N/A
Housing 1 030 1 000 0 1 000 0.00 N/A
Integrated Pubic Transport Grant 770 1 015 0 818 (19.45) N/A
Other grant providers: 630 6 857 0 6 098 (11.07) N/A
Health Subsidy - 500 0 493 (1.45) N/A
NEAR 630 700 0 349 (50.14) N/A
RAMS - 2 657 0 2 625 (1.20) N/A
COGHTA - 3 000 0 2 631 (12.30) N/A
Total Operating Transfers and Grants 37 666 47 372 0 46 413 (2.02) N/A
Grant Performance for 2015/16
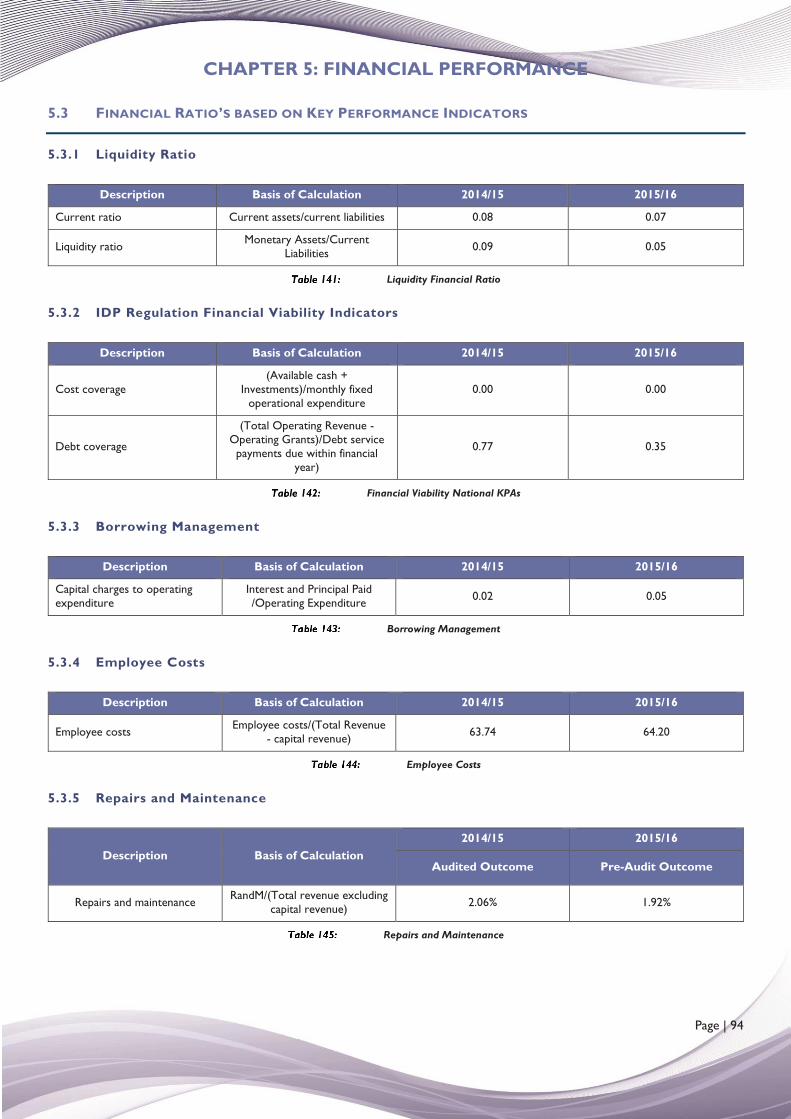
CHAPTER 5: FINANCIAL PERFORMANCE
Page | 94
5.3 FINANCIAL RATIO’S BASED ON KEY PERFORMANCE INDICATORS
5.3.1 Liquidity Ratio
Description Basis of Calculation 2014/15 2015/16
Current ratio Current assets/current liabilities 0.08 0.07
Liquidity ratio Monetary Assets/Current Liabilities 0.09 0.05
Liquidity Financial Ratio
5.3.2 IDP Regulation Financial Viability Indicators
Description Basis of Calculation 2014/15 2015/16
Cost coverage (Available cash +
Investments)/monthly fixed operational expenditure
0.00 0.00
Debt coverage
(Total Operating Revenue - Operating Grants)/Debt service payments due within financial
year)
0.77 0.35
Financial Viability National KPAs
5.3.3 Borrowing Management
Description Basis of Calculation 2014/15 2015/16
Capital charges to operating expenditure
Interest and Principal Paid /Operating Expenditure 0.02 0.05
Borrowing Management
5.3.4 Employee Costs
Description Basis of Calculation 2014/15 2015/16
Employee costs Employee costs/(Total Revenue - capital revenue) 63.74 64.20
Employee Costs
5.3.5 Repairs and Maintenance
Description Basis of Calculation 2014/15 2015/16
Audited Outcome Pre-Audit Outcome
Repairs and maintenance RandM/(Total revenue excluding capital revenue) 2.06% 1.92%
Repairs and Maintenance
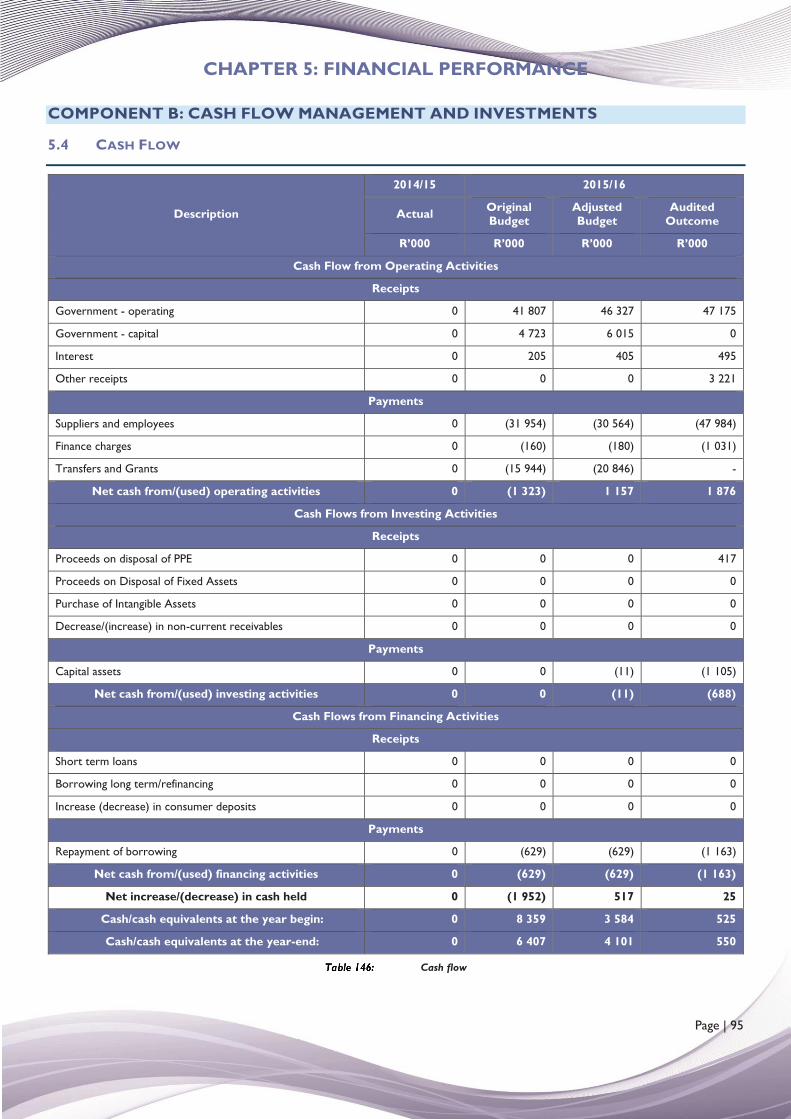
CHAPTER 5: FINANCIAL PERFORMANCE
Page | 95
COMPONENT B: CASH FLOW MANAGEMENT AND INVESTMENTS
5.4 CASH FLOW
Description
2014/15 2015/16
Actual Original Budget
Adjusted Budget
Audited Outcome
R’000 R’000 R’000 R’000
Cash Flow from Operating Activities
Receipts
Government - operating 0 41 807 46 327 47 175
Government - capital 0 4 723 6 015 0
Interest 0 205 405 495
Other receipts 0 0 0 3 221
Payments
Suppliers and employees 0 (31 954) (30 564) (47 984)
Finance charges 0 (160) (180) (1 031)
Transfers and Grants 0 (15 944) (20 846) -
Net cash from/(used) operating activities 0 (1 323) 1 157 1 876
Cash Flows from Investing Activities
Receipts
Proceeds on disposal of PPE 0 0 0 417
Proceeds on Disposal of Fixed Assets 0 0 0 0
Purchase of Intangible Assets 0 0 0 0
Decrease/(increase) in non-current receivables 0 0 0 0
Payments
Capital assets 0 0 (11) (1 105)
Net cash from/(used) investing activities 0 0 (11) (688)
Cash Flows from Financing Activities
Receipts
Short term loans 0 0 0 0
Borrowing long term/refinancing 0 0 0 0
Increase (decrease) in consumer deposits 0 0 0 0
Payments
Repayment of borrowing 0 (629) (629) (1 163)
Net cash from/(used) financing activities 0 (629) (629) (1 163)
Net increase/(decrease) in cash held 0 (1 952) 517 25
Cash/cash equivalents at the year begin: 0 8 359 3 584 525
Cash/cash equivalents at the year-end: 0 6 407 4 101 550
Cash flow
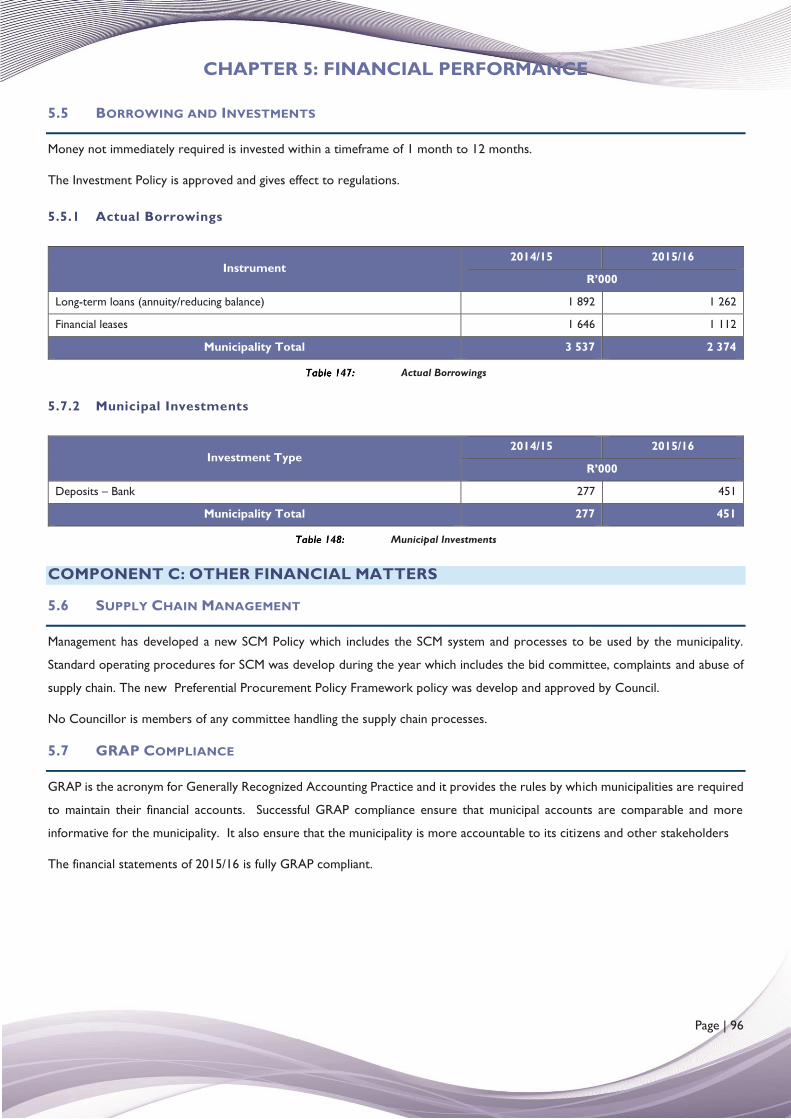
CHAPTER 5: FINANCIAL PERFORMANCE
Page | 96
5.5 BORROWING AND INVESTMENTS
Money not immediately required is invested within a timeframe of 1 month to 12 months.
The Investment Policy is approved and gives effect to regulations.
5.5.1 Actual Borrowings
Instrument 2014/15 2015/16
R’000
Long-term loans (annuity/reducing balance) 1 892 1 262
Financial leases 1 646 1 112
Municipality Total 3 537 2 374
Actual Borrowings
5.7.2 Municipal Investments
Investment Type 2014/15 2015/16
R’000
Deposits – Bank 277 451
Municipality Total 277 451
Municipal Investments
COMPONENT C: OTHER FINANCIAL MATTERS
5.6 SUPPLY CHAIN MANAGEMENT
Management has developed a new SCM Policy which includes the SCM system and processes to be used by the municipality.
Standard operating procedures for SCM was develop during the year which includes the bid committee, complaints and abuse of
supply chain. The new Preferential Procurement Policy Framework policy was develop and approved by Council.
No Councillor is members of any committee handling the supply chain processes.
5.7 GRAP COMPLIANCE
GRAP is the acronym for Generally Recognized Accounting Practice and it provides the rules by which municipalities are required
to maintain their financial accounts. Successful GRAP compliance ensure that municipal accounts are comparable and more
informative for the municipality. It also ensure that the municipality is more accountable to its citizens and other stakeholders
The financial statements of 2015/16 is fully GRAP compliant.
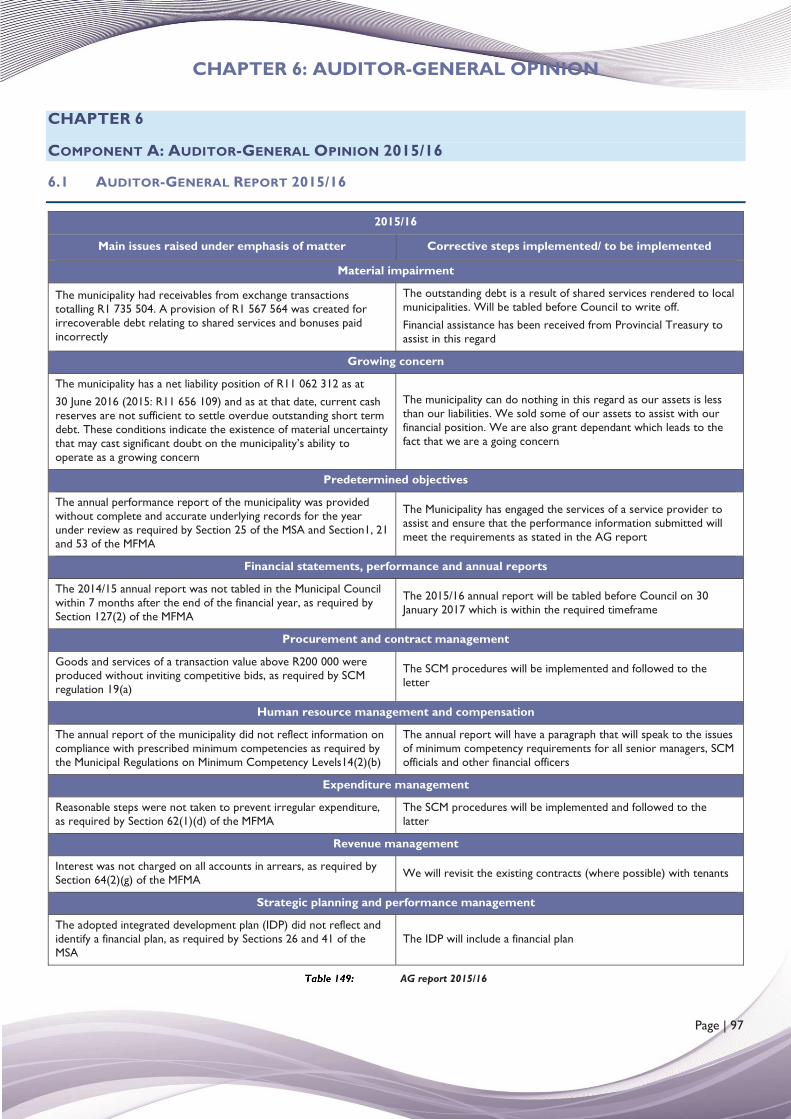
CHAPTER 6: AUDITOR-GENERAL OPINION
Page | 97
CHAPTER 6
COMPONENT A: AUDITOR-GENERAL OPINION 2015/16
6.1 AUDITOR-GENERAL REPORT 2015/16
2015/16
Main issues raised under emphasis of matter Corrective steps implemented/ to be implemented
Material impairment
The municipality had receivables from exchange transactions totalling R1 735 504. A provision of R1 567 564 was created for irrecoverable debt relating to shared services and bonuses paid incorrectly
The outstanding debt is a result of shared services rendered to local municipalities. Will be tabled before Council to write off. Financial assistance has been received from Provincial Treasury to assist in this regard
Growing concern
The municipality has a net liability position of R11 062 312 as at 30 June 2016 (2015: R11 656 109) and as at that date, current cash reserves are not sufficient to settle overdue outstanding short term debt. These conditions indicate the existence of material uncertainty that may cast significant doubt on the municipality’s ability to operate as a growing concern
The municipality can do nothing in this regard as our assets is less than our liabilities. We sold some of our assets to assist with our financial position. We are also grant dependant which leads to the fact that we are a going concern
Predetermined objectives
The annual performance report of the municipality was provided without complete and accurate underlying records for the year under review as required by Section 25 of the MSA and Section1, 21 and 53 of the MFMA
The Municipality has engaged the services of a service provider to assist and ensure that the performance information submitted will meet the requirements as stated in the AG report
Financial statements, performance and annual reports
The 2014/15 annual report was not tabled in the Municipal Council within 7 months after the end of the financial year, as required by Section 127(2) of the MFMA
The 2015/16 annual report will be tabled before Council on 30 January 2017 which is within the required timeframe
Procurement and contract management
Goods and services of a transaction value above R200 000 were produced without inviting competitive bids, as required by SCM regulation 19(a)
The SCM procedures will be implemented and followed to the letter
Human resource management and compensation
The annual report of the municipality did not reflect information on compliance with prescribed minimum competencies as required by the Municipal Regulations on Minimum Competency Levels14(2)(b)
The annual report will have a paragraph that will speak to the issues of minimum competency requirements for all senior managers, SCM officials and other financial officers
Expenditure management
Reasonable steps were not taken to prevent irregular expenditure, as required by Section 62(1)(d) of the MFMA
The SCM procedures will be implemented and followed to the latter
Revenue management
Interest was not charged on all accounts in arrears, as required by Section 64(2)(g) of the MFMA We will revisit the existing contracts (where possible) with tenants
Strategic planning and performance management
The adopted integrated development plan (IDP) did not reflect and identify a financial plan, as required by Sections 26 and 41 of the MSA
The IDP will include a financial plan
AG report 2015/16
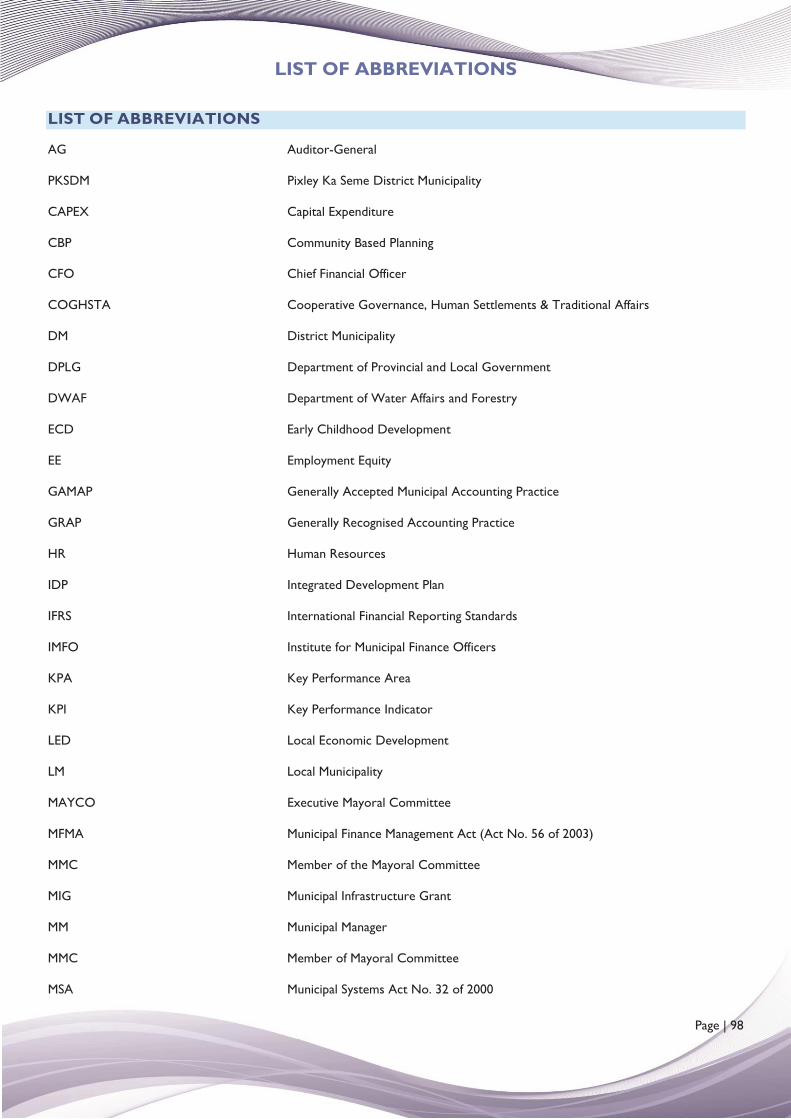
LIST OF ABBREVIATIONS
Page | 98
LIST OF ABBREVIATIONS
AG Auditor-General
PKSDM Pixley Ka Seme District Municipality
CAPEX Capital Expenditure
CBP Community Based Planning
CFO Chief Financial Officer
COGHSTA Cooperative Governance, Human Settlements & Traditional Affairs
DM District Municipality
DPLG Department of Provincial and Local Government
DWAF Department of Water Affairs and Forestry
ECD Early Childhood Development
EE Employment Equity
GAMAP Generally Accepted Municipal Accounting Practice
GRAP Generally Recognised Accounting Practice
HR Human Resources
IDP Integrated Development Plan
IFRS International Financial Reporting Standards
IMFO Institute for Municipal Finance Officers
KPA Key Performance Area
KPI Key Performance Indicator
LED Local Economic Development
LM Local Municipality
MAYCO Executive Mayoral Committee
MFMA Municipal Finance Management Act (Act No. 56 of 2003)
MMC Member of the Mayoral Committee
MIG Municipal Infrastructure Grant
MM Municipal Manager
MMC Member of Mayoral Committee
MSA Municipal Systems Act No. 32 of 2000
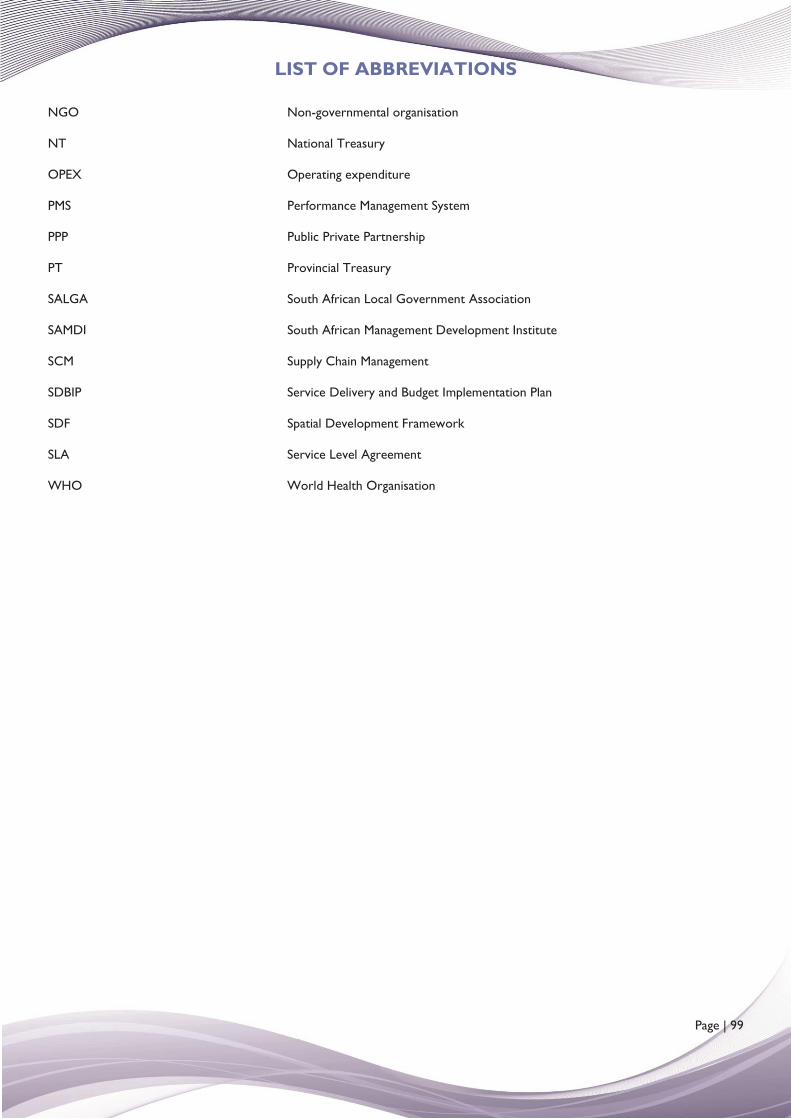
LIST OF ABBREVIATIONS
Page | 99
NGO Non-governmental organisation
NT National Treasury
OPEX Operating expenditure
PMS Performance Management System
PPP Public Private Partnership
PT Provincial Treasury
SALGA South African Local Government Association
SAMDI South African Management Development Institute
SCM Supply Chain Management
SDBIP Service Delivery and Budget Implementation Plan
SDF Spatial Development Framework
SLA Service Level Agreement
WHO World Health Organisation
ANNEXURE A: AUDITED
FINANCIAL STATEMENTS
PIXLEY-KA-SEME DISTRICT MUNICIPALITY
ANNUAL FINANCIAL STATEMENTSFOR THE YEAR ENDED
30 JUNE 2016
INDEX
Description Page No.
General Information 3
Approval 4
Accounting Officer's Report 5
Statement of Financial Position 13
Statement of Financial Performance 14
Statement of Changes in Net Assets 15
Cash Flow Statement 16
Statement of Comparison of Budget and Actual Amounts 17
Accounting Policies 24
Notes to the Financial Statements 40
The following appendices do not form part of the Annual Financial Statementsand are unaudited:
Appendix A 75
Appendix B 76
Appendix C 78
Appendix D 79
Appendix E 80
Appendix F 85
Appendix G 86
Appendix H 87
PIXLEY-KA-SEME DISTRICT MUNICIPALITYANNUAL FINANCIAL STATEMENTS
for the year ended 30 June 2016
GENERAL INFORMATION
Members of the Council:
JZ Lolwana MayorMT Kibi SpeakerUR Itumeleng MemberGL Nkumbi MemberTA Sintu MemberNS Thomas MemberKJ Arens MemberME Bitterbos MemberWJ du Plessis MemberA Fritz MemberJH George MemberJ Grobbelaar MemberDP Jason MemberP Louw MemberEL Schultz MemberPN Signeur MemberLC van Niekerk MemberFM van Wyk Member
Municipal Manager: RE Pieterse
Chief Financial Officer: BF James
Grading of Local Authority: Grade 3
Auditors: Auditor-General
Bankers: ABSA Bank Limited
Registered Office: Culvert RoadDe Aar7000
Physical Address: Culvert RoadDe Aar7000
Postal Address: Private Bag X1012De Aar7000
Telephone Number: (053) 632 0891
Fax Number: (053) 631 2529
PIXLEY-KA-SEME DISTRICT MUNICIPALITYANNUAL FINANCIAL STATEMENTS
for the year ended 30 June 2016
3

APPROVAL OF THE ANNUAL FINANCIAL STATEMENTS
Municipal Manager: RE Pieterse
31 August 2016
PIXLEY-KA-SEME DISTRICT MUNICIPALITYANNUAL FINANCIAL STATEMENTS
for the year ended 30 June 2016
I am responsible for the preparation of these annual financial statements, which are set out on pages 4 to 89,in terms of Section 126(1) of the Municipal Finance Management Act and which I have signed on behalf of theMunicipality.
I certify that the salaries, allowances and benefits of Councillors, loans made to Councillors, if any, andpayments made to Councillors for loss of office, if any, as disclosed in note 21 of these annual financialstatements are within the upper limits of the framework envisaged in Section 219 of the Constitution, read withthe Remuneration of Public Officer Bearers Act and the Minister of Provincial and Local Government’sdetermination in accordance with this Act.
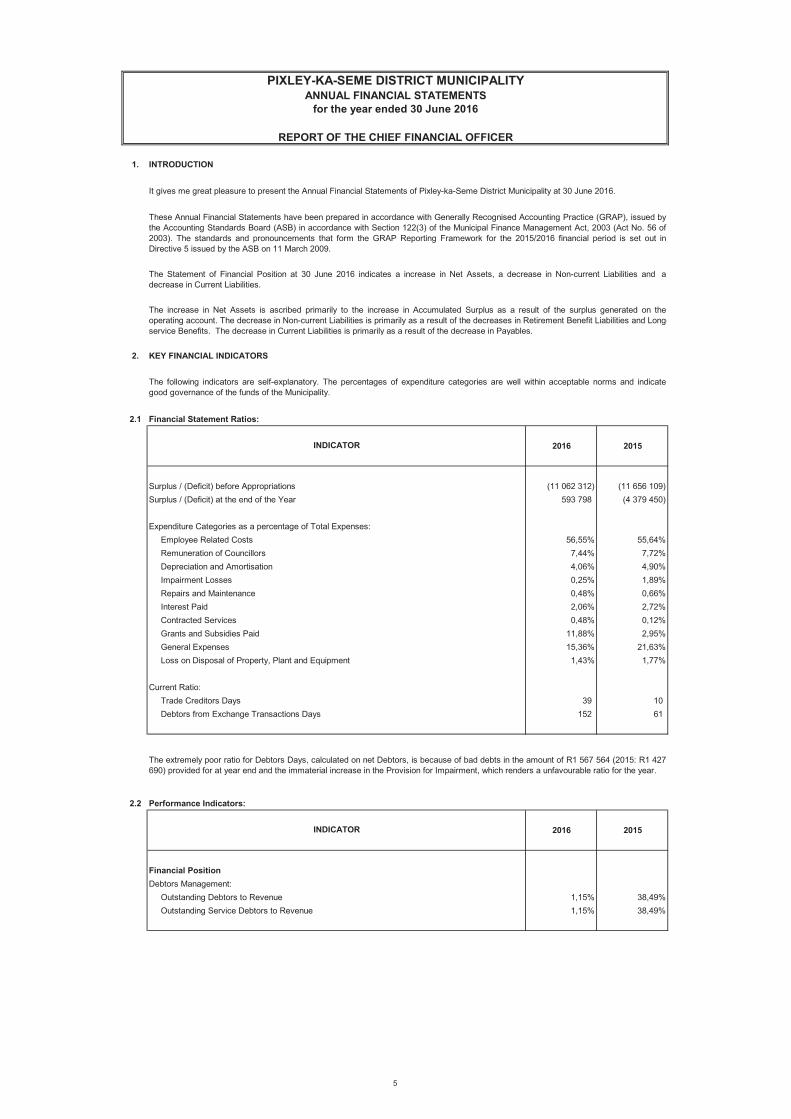
1. INTRODUCTION
2. KEY FINANCIAL INDICATORS
2.1 Financial Statement Ratios:
2016 2015
Surplus / (Deficit) before Appropriations (11 062 312) (11 656 109) Surplus / (Deficit) at the end of the Year 593 798 (4 379 450)
Expenditure Categories as a percentage of Total Expenses: Employee Related Costs 56,55% 55,64% Remuneration of Councillors 7,44% 7,72% Depreciation and Amortisation 4,06% 4,90% Impairment Losses 0,25% 1,89% Repairs and Maintenance 0,48% 0,66% Interest Paid 2,06% 2,72% Contracted Services 0,48% 0,12% Grants and Subsidies Paid 11,88% 2,95% General Expenses 15,36% 21,63% Loss on Disposal of Property, Plant and Equipment 1,43% 1,77%
Current Ratio: Trade Creditors Days 39 10 Debtors from Exchange Transactions Days 152 61
2.2 Performance Indicators:
2016 2015
Financial PositionDebtors Management: Outstanding Debtors to Revenue 1,15% 38,49% Outstanding Service Debtors to Revenue 1,15% 38,49%
The extremely poor ratio for Debtors Days, calculated on net Debtors, is because of bad debts in the amount of R1 567 564 (2015: R1 427690) provided for at year end and the immaterial increase in the Provision for Impairment, which renders a unfavourable ratio for the year.
INDICATOR
PIXLEY-KA-SEME DISTRICT MUNICIPALITY
for the year ended 30 June 2016
REPORT OF THE CHIEF FINANCIAL OFFICER
ANNUAL FINANCIAL STATEMENTS
It gives me great pleasure to present the Annual Financial Statements of Pixley-ka-Seme District Municipality at 30 June 2016.
The Statement of Financial Position at 30 June 2016 indicates a increase in Net Assets, a decrease in Non-current Liabilities and adecrease in Current Liabilities.
These Annual Financial Statements have been prepared in accordance with Generally Recognised Accounting Practice (GRAP), issued bythe Accounting Standards Board (ASB) in accordance with Section 122(3) of the Municipal Finance Management Act, 2003 (Act No. 56 of2003). The standards and pronouncements that form the GRAP Reporting Framework for the 2015/2016 financial period is set out inDirective 5 issued by the ASB on 11 March 2009.
The increase in Net Assets is ascribed primarily to the increase in Accumulated Surplus as a result of the surplus generated on theoperating account. The decrease in Non-current Liabilities is primarily as a result of the decreases in Retirement Benefit Liabilities and Long-service Benefits. The decrease in Current Liabilities is primarily as a result of the decrease in Payables.
The following indicators are self-explanatory. The percentages of expenditure categories are well within acceptable norms and indicategood governance of the funds of the Municipality.
INDICATOR
5
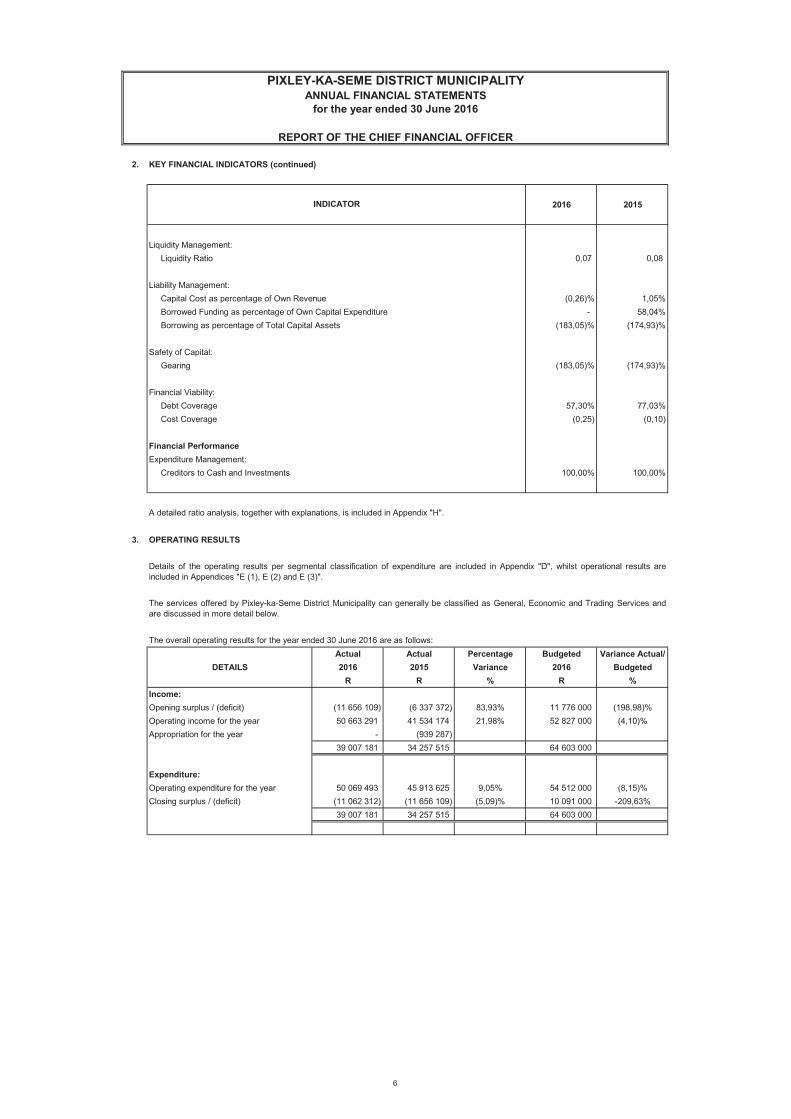
PIXLEY-KA-SEME DISTRICT MUNICIPALITY
for the year ended 30 June 2016
REPORT OF THE CHIEF FINANCIAL OFFICER
ANNUAL FINANCIAL STATEMENTS
2. KEY FINANCIAL INDICATORS (continued)
2016 2015
Liquidity Management: Liquidity Ratio 0,07 0,08
Liability Management: Capital Cost as percentage of Own Revenue (0,26)% 1,05% Borrowed Funding as percentage of Own Capital Expenditure - 58,04% Borrowing as percentage of Total Capital Assets (183,05)% (174,93)%
Safety of Capital: Gearing (183,05)% (174,93)%
Financial Viability: Debt Coverage 57,30% 77,03% Cost Coverage (0,25) (0,10)
Financial PerformanceExpenditure Management: Creditors to Cash and Investments 100,00% 100,00%
3. OPERATING RESULTS
Actual Actual Percentage Budgeted Variance Actual/DETAILS 2016 2015 Variance 2016 Budgeted
R R % R %Income:Opening surplus / (deficit) (11 656 109) (6 337 372) 83,93% 11 776 000 (198,98)%Operating income for the year 50 663 291 41 534 174 21,98% 52 827 000 (4,10)%Appropriation for the year - (939 287)
39 007 181 34 257 515 64 603 000
Expenditure:Operating expenditure for the year 50 069 493 45 913 625 9,05% 54 512 000 (8,15)%Closing surplus / (deficit) (11 062 312) (11 656 109) (5,09)% 10 091 000 -209,63%
39 007 181 34 257 515 64 603 000 - - -
The services offered by Pixley-ka-Seme District Municipality can generally be classified as General, Economic and Trading Services andare discussed in more detail below.
Details of the operating results per segmental classification of expenditure are included in Appendix "D", whilst operational results areincluded in Appendices "E (1), E (2) and E (3)".
A detailed ratio analysis, together with explanations, is included in Appendix "H".
INDICATOR
The overall operating results for the year ended 30 June 2016 are as follows:
6
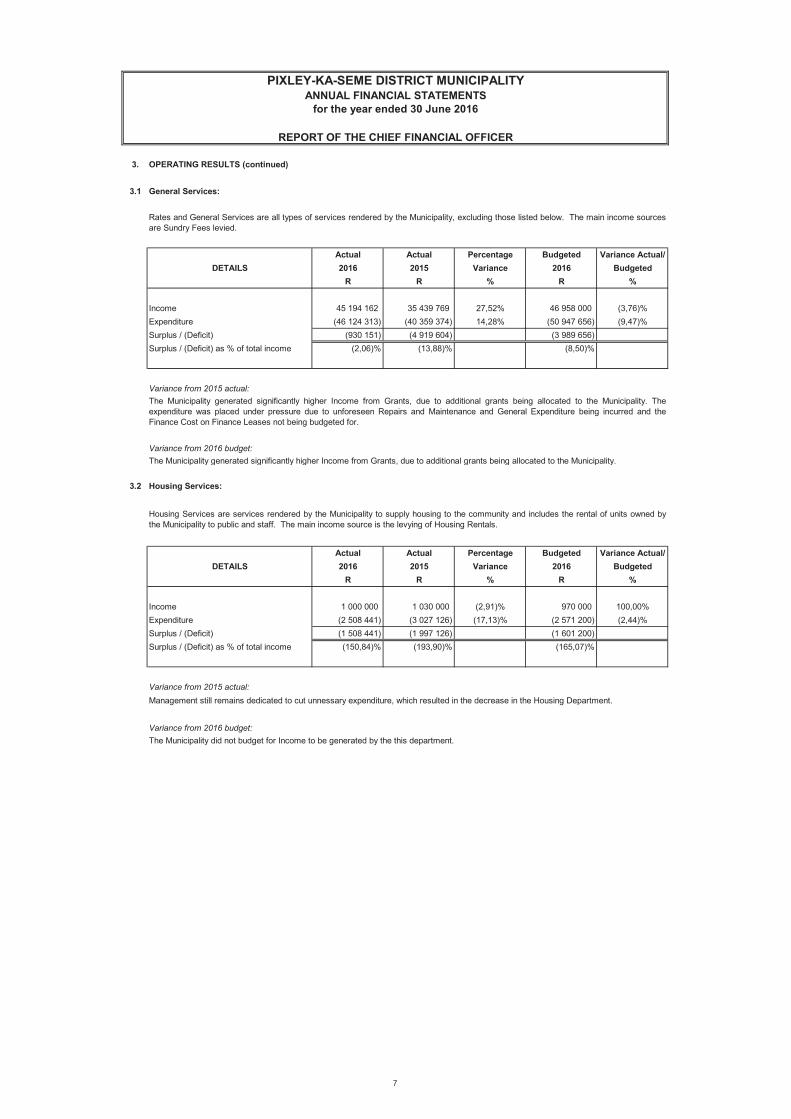
PIXLEY-KA-SEME DISTRICT MUNICIPALITY
for the year ended 30 June 2016
REPORT OF THE CHIEF FINANCIAL OFFICER
ANNUAL FINANCIAL STATEMENTS
3. OPERATING RESULTS (continued)
3.1 General Services:
Actual Actual Percentage Budgeted Variance Actual/DETAILS 2016 2015 Variance 2016 Budgeted
R R % R %
Income 45 194 162 35 439 769 27,52% 46 958 000 (3,76)%Expenditure (46 124 313) (40 359 374) 14,28% (50 947 656) (9,47)%Surplus / (Deficit) (930 151) (4 919 604) (3 989 656) Surplus / (Deficit) as % of total income (2,06)% (13,88)% (8,50)%
Variance from 2015 actual:
Variance from 2016 budget:
3.2 Housing Services:
Actual Actual Percentage Budgeted Variance Actual/DETAILS 2016 2015 Variance 2016 Budgeted
R R % R %
Income 1 000 000 1 030 000 (2,91)% 970 000 100,00%Expenditure (2 508 441) (3 027 126) (17,13)% (2 571 200) (2,44)%Surplus / (Deficit) (1 508 441) (1 997 126) (1 601 200) Surplus / (Deficit) as % of total income (150,84)% (193,90)% (165,07)%
Variance from 2015 actual:
Variance from 2016 budget:
Housing Services are services rendered by the Municipality to supply housing to the community and includes the rental of units owned bythe Municipality to public and staff. The main income source is the levying of Housing Rentals.
Management still remains dedicated to cut unnessary expenditure, which resulted in the decrease in the Housing Department.
The Municipality did not budget for Income to be generated by the this department.
Rates and General Services are all types of services rendered by the Municipality, excluding those listed below. The main income sourcesare Sundry Fees levied.
The Municipality generated significantly higher Income from Grants, due to additional grants being allocated to the Municipality. Theexpenditure was placed under pressure due to unforeseen Repairs and Maintenance and General Expenditure being incurred and theFinance Cost on Finance Leases not being budgeted for.
The Municipality generated significantly higher Income from Grants, due to additional grants being allocated to the Municipality.
7
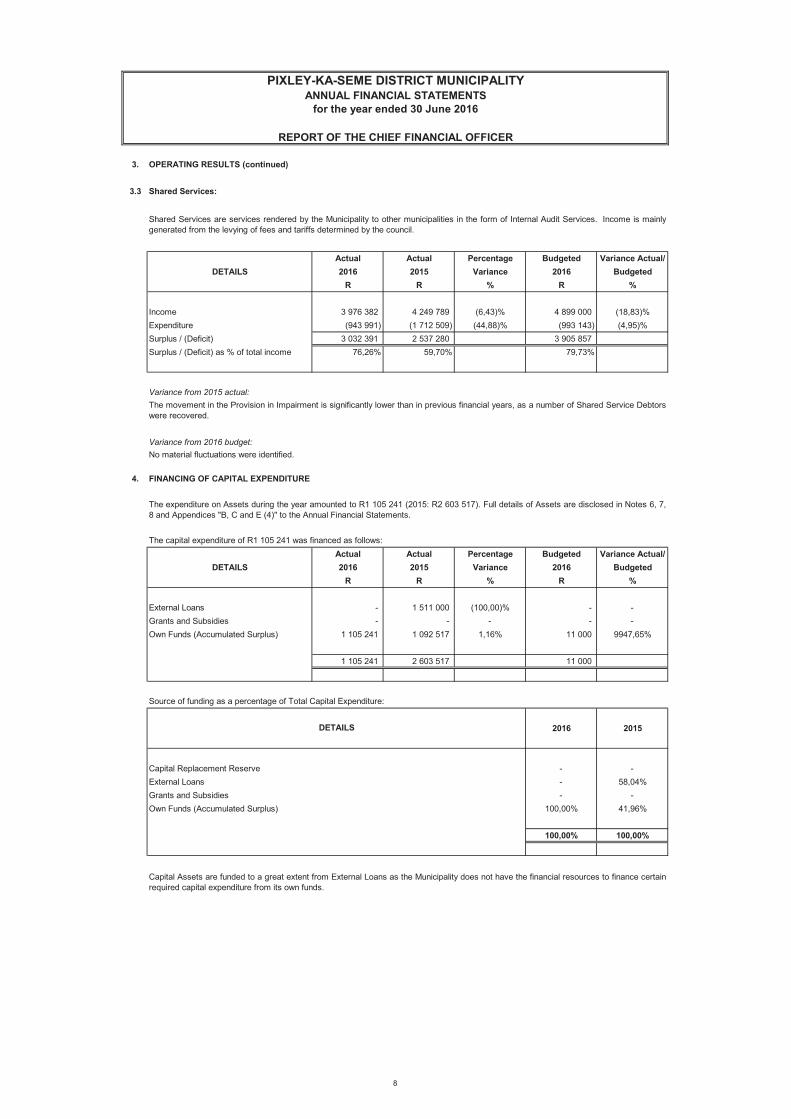
PIXLEY-KA-SEME DISTRICT MUNICIPALITY
for the year ended 30 June 2016
REPORT OF THE CHIEF FINANCIAL OFFICER
ANNUAL FINANCIAL STATEMENTS
3. OPERATING RESULTS (continued)
3.3 Shared Services:
Actual Actual Percentage Budgeted Variance Actual/DETAILS 2016 2015 Variance 2016 Budgeted
R R % R %
Income 3 976 382 4 249 789 (6,43)% 4 899 000 (18,83)%Expenditure (943 991) (1 712 509) (44,88)% (993 143) (4,95)%Surplus / (Deficit) 3 032 391 2 537 280 3 905 857 Surplus / (Deficit) as % of total income 76,26% 59,70% 79,73%
Variance from 2015 actual:
Variance from 2016 budget:
4. FINANCING OF CAPITAL EXPENDITURE
Actual Actual Percentage Budgeted Variance Actual/DETAILS 2016 2015 Variance 2016 Budgeted
R R % R %
External Loans - 1 511 000 (100,00)% - -Grants and Subsidies - - - - -Own Funds (Accumulated Surplus) 1 105 241 1 092 517 1,16% 11 000 9947,65%
1 105 241 2 603 517 11 000
2016 2015
Capital Replacement Reserve - -External Loans - 58,04%Grants and Subsidies - -Own Funds (Accumulated Surplus) 100,00% 41,96%
100,00% 100,00%
DETAILS
Capital Assets are funded to a great extent from External Loans as the Municipality does not have the financial resources to finance certainrequired capital expenditure from its own funds.
Shared Services are services rendered by the Municipality to other municipalities in the form of Internal Audit Services. Income is mainlygenerated from the levying of fees and tariffs determined by the council.
Source of funding as a percentage of Total Capital Expenditure:
The expenditure on Assets during the year amounted to R1 105 241 (2015: R2 603 517). Full details of Assets are disclosed in Notes 6, 7,8 and Appendices "B, C and E (4)" to the Annual Financial Statements.
The capital expenditure of R1 105 241 was financed as follows:
The movement in the Provision in Impairment is significantly lower than in previous financial years, as a number of Shared Service Debtorswere recovered.
No material fluctuations were identified.
8
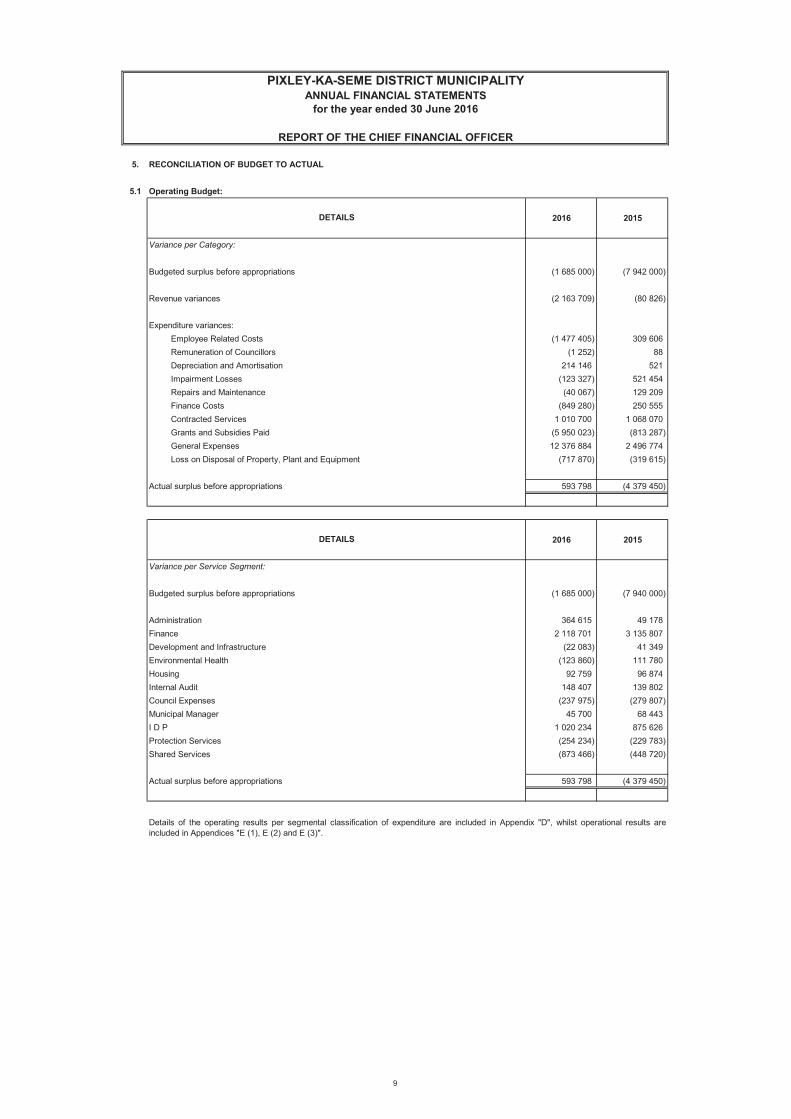
PIXLEY-KA-SEME DISTRICT MUNICIPALITY
for the year ended 30 June 2016
REPORT OF THE CHIEF FINANCIAL OFFICER
ANNUAL FINANCIAL STATEMENTS
5. RECONCILIATION OF BUDGET TO ACTUAL
5.1 Operating Budget:
2016 2015
Variance per Category:
Budgeted surplus before appropriations (1 685 000) (7 942 000)
Revenue variances (2 163 709) (80 826)
Expenditure variances:Employee Related Costs (1 477 405) 309 606 Remuneration of Councillors (1 252) 88 Depreciation and Amortisation 214 146 521 Impairment Losses (123 327) 521 454 Repairs and Maintenance (40 067) 129 209 Finance Costs (849 280) 250 555 Contracted Services 1 010 700 1 068 070 Grants and Subsidies Paid (5 950 023) (813 287) General Expenses 12 376 884 2 496 774 Loss on Disposal of Property, Plant and Equipment (717 870) (319 615)
Actual surplus before appropriations 593 798 (4 379 450) (0) -
2016 2015
Variance per Service Segment:
Budgeted surplus before appropriations (1 685 000) (7 940 000)
Administration 364 615 49 178 Finance 2 118 701 3 135 807 Development and Infrastructure (22 083) 41 349 Environmental Health (123 860) 111 780 Housing 92 759 96 874 Internal Audit 148 407 139 802 Council Expenses (237 975) (279 807) Municipal Manager 45 700 68 443 I D P 1 020 234 875 626 Protection Services (254 234) (229 783) Shared Services (873 466) (448 720)
Actual surplus before appropriations 593 798 (4 379 450)
Details of the operating results per segmental classification of expenditure are included in Appendix "D", whilst operational results areincluded in Appendices "E (1), E (2) and E (3)".
DETAILS
DETAILS
9
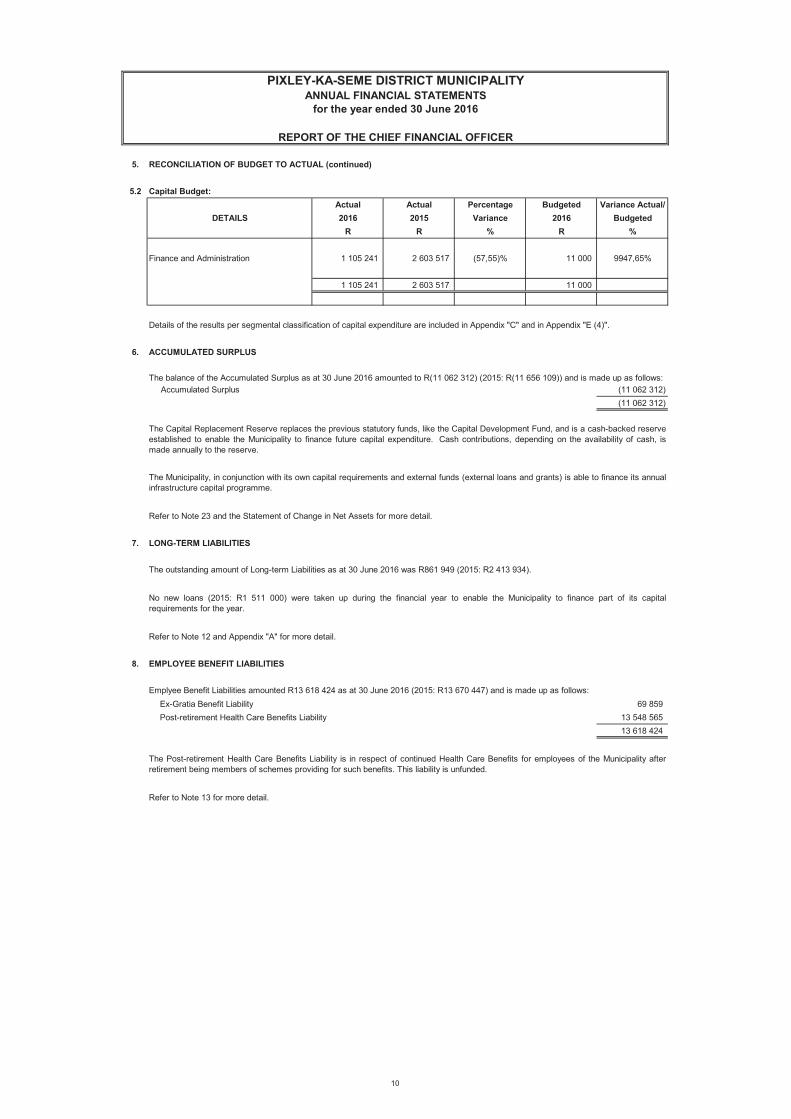
PIXLEY-KA-SEME DISTRICT MUNICIPALITY
for the year ended 30 June 2016
REPORT OF THE CHIEF FINANCIAL OFFICER
ANNUAL FINANCIAL STATEMENTS
5. RECONCILIATION OF BUDGET TO ACTUAL (continued)
5.2 Capital Budget:Actual Actual Percentage Budgeted Variance Actual/
DETAILS 2016 2015 Variance 2016 BudgetedR R % R %
Finance and Administration 1 105 241 2 603 517 (57,55)% 11 000 9947,65%
1 105 241 2 603 517 11 000
6. ACCUMULATED SURPLUS
Accumulated Surplus (11 062 312) (11 062 312)
7. LONG-TERM LIABILITIES
8. EMPLOYEE BENEFIT LIABILITIES
Ex-Gratia Benefit Liability 69 859 Post-retirement Health Care Benefits Liability 13 548 565
13 618 424
The outstanding amount of Long-term Liabilities as at 30 June 2016 was R861 949 (2015: R2 413 934).
Details of the results per segmental classification of capital expenditure are included in Appendix "C" and in Appendix "E (4)".
No new loans (2015: R1 511 000) were taken up during the financial year to enable the Municipality to finance part of its capitalrequirements for the year.
Emplyee Benefit Liabilities amounted R13 618 424 as at 30 June 2016 (2015: R13 670 447) and is made up as follows:
The Post-retirement Health Care Benefits Liability is in respect of continued Health Care Benefits for employees of the Municipality afterretirement being members of schemes providing for such benefits. This liability is unfunded.
Refer to Note 13 for more detail.
The balance of the Accumulated Surplus as at 30 June 2016 amounted to R(11 062 312) (2015: R(11 656 109)) and is made up as follows:
Refer to Note 12 and Appendix "A" for more detail.
The Capital Replacement Reserve replaces the previous statutory funds, like the Capital Development Fund, and is a cash-backed reserveestablished to enable the Municipality to finance future capital expenditure. Cash contributions, depending on the availability of cash, ismade annually to the reserve.
The Municipality, in conjunction with its own capital requirements and external funds (external loans and grants) is able to finance its annualinfrastructure capital programme.
Refer to Note 23 and the Statement of Change in Net Assets for more detail.
10
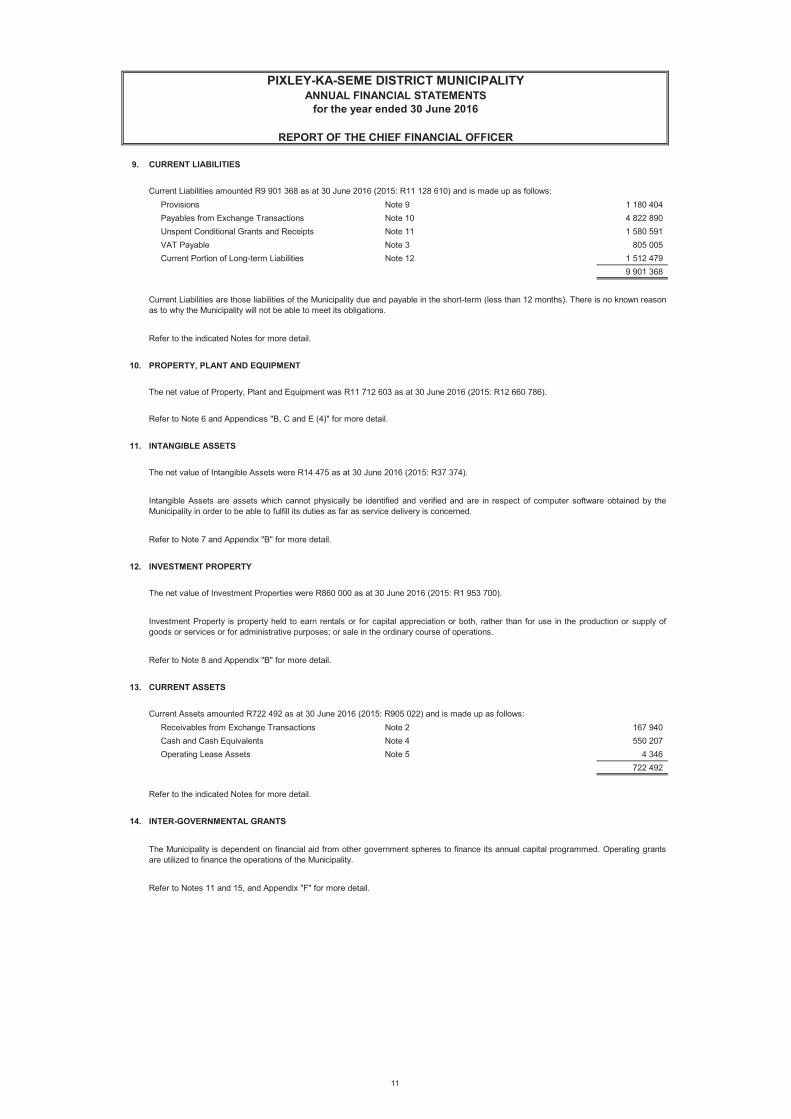
PIXLEY-KA-SEME DISTRICT MUNICIPALITY
for the year ended 30 June 2016
REPORT OF THE CHIEF FINANCIAL OFFICER
ANNUAL FINANCIAL STATEMENTS
9. CURRENT LIABILITIES
Provisions Note 9 1 180 404 Payables from Exchange Transactions Note 10 4 822 890 Unspent Conditional Grants and Receipts Note 11 1 580 591 VAT Payable Note 3 805 005 Current Portion of Long-term Liabilities Note 12 1 512 479
9 901 368
10. PROPERTY, PLANT AND EQUIPMENT
11. INTANGIBLE ASSETS
12. INVESTMENT PROPERTY
13. CURRENT ASSETS
Receivables from Exchange Transactions Note 2 167 940 Cash and Cash Equivalents Note 4 550 207 Operating Lease Assets Note 5 4 346
722 492
14. INTER-GOVERNMENTAL GRANTS
Refer to Note 6 and Appendices "B, C and E (4)" for more detail.
The net value of Intangible Assets were R14 475 as at 30 June 2016 (2015: R37 374).
Intangible Assets are assets which cannot physically be identified and verified and are in respect of computer software obtained by theMunicipality in order to be able to fulfill its duties as far as service delivery is concerned.
Refer to Note 8 and Appendix "B" for more detail.
Refer to Note 7 and Appendix "B" for more detail.
The net value of Investment Properties were R860 000 as at 30 June 2016 (2015: R1 953 700).
Investment Property is property held to earn rentals or for capital appreciation or both, rather than for use in the production or supply ofgoods or services or for administrative purposes; or sale in the ordinary course of operations.
Current Assets amounted R722 492 as at 30 June 2016 (2015: R905 022) and is made up as follows:
Refer to the indicated Notes for more detail.
The Municipality is dependent on financial aid from other government spheres to finance its annual capital programmed. Operating grantsare utilized to finance the operations of the Municipality.
Refer to Notes 11 and 15, and Appendix "F" for more detail.
The net value of Property, Plant and Equipment was R11 712 603 as at 30 June 2016 (2015: R12 660 786).
Current Liabilities are those liabilities of the Municipality due and payable in the short-term (less than 12 months). There is no known reasonas to why the Municipality will not be able to meet its obligations.
Refer to the indicated Notes for more detail.
Current Liabilities amounted R9 901 368 as at 30 June 2016 (2015: R11 128 610) and is made up as follows:
11
PIXLEY-KA-SEME DISTRICT MUNICIPALITY
for the year ended 30 June 2016
REPORT OF THE CHIEF FINANCIAL OFFICER
ANNUAL FINANCIAL STATEMENTS
15. EVENTS AFTER THE REPORTING DATE
16. EXPRESSION OF APPRECIATION
CHIEF FINANCIAL OFFICER31 August 2016
We are grateful to the Mayor, members of the Executive Committee, Councillors, the Municipal Manager and Heads of Departments for thesupport extended during the financial year. A special word of thanks to all staff in the Finance Department, for without their assistancethese Annual Financial Statements would not have been possible.
Full details of all known events, if any, after the reporting date are disclosed in Note 48.
12
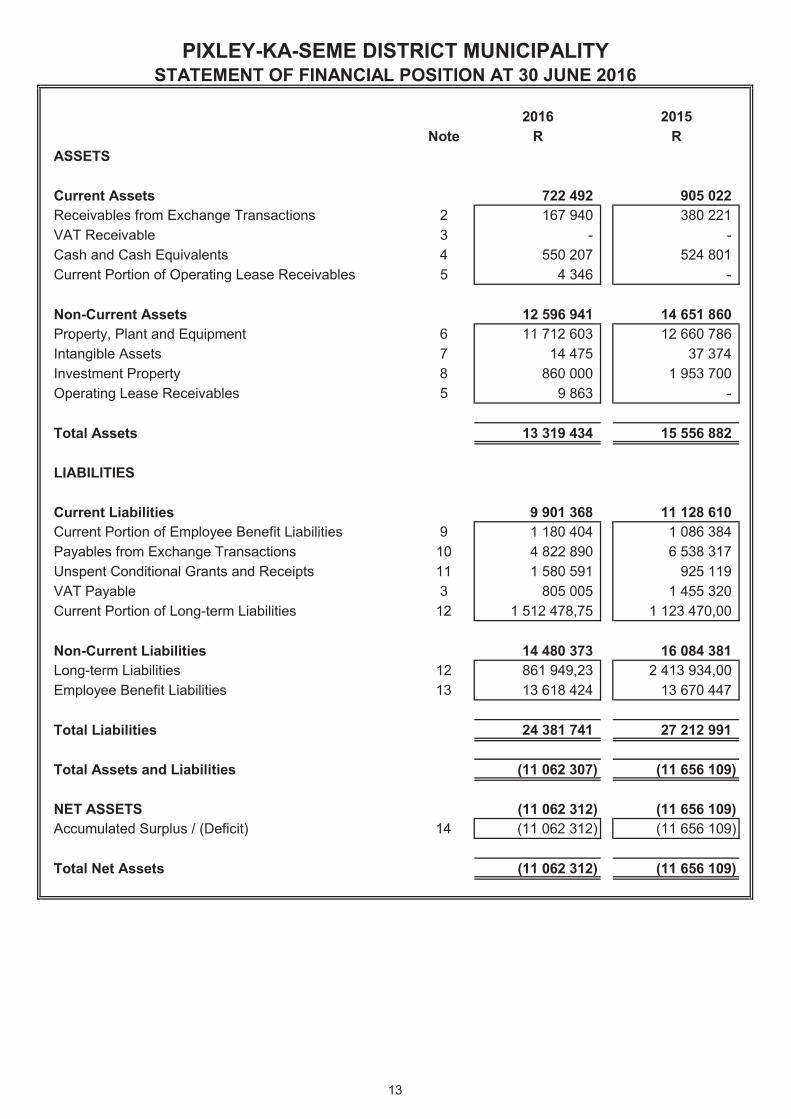
2016 2015Note R R
ASSETS
Current Assets 722 492 905 022 Receivables from Exchange Transactions 2 167 940 380 221 VAT Receivable 3 - - Cash and Cash Equivalents 4 550 207 524 801 Current Portion of Operating Lease Receivables 5 4 346 -
Non-Current Assets 12 596 941 14 651 860 Property, Plant and Equipment 6 11 712 603 12 660 786 Intangible Assets 7 14 475 37 374 Investment Property 8 860 000 1 953 700 Operating Lease Receivables 5 9 863 -
Total Assets 13 319 434 15 556 882
LIABILITIES
Current Liabilities 9 901 368 11 128 610 Current Portion of Employee Benefit Liabilities 9 1 180 404 1 086 384 Payables from Exchange Transactions 10 4 822 890 6 538 317 Unspent Conditional Grants and Receipts 11 1 580 591 925 119 VAT Payable 3 805 005 1 455 320 Current Portion of Long-term Liabilities 12 1 512 478,75 1 123 470,00
Non-Current Liabilities 14 480 373 16 084 381 Long-term Liabilities 12 861 949,23 2 413 934,00 Employee Benefit Liabilities 13 13 618 424 13 670 447
Total Liabilities 24 381 741 27 212 991
Total Assets and Liabilities (11 062 307) (11 656 109)
NET ASSETS (11 062 312) (11 656 109) Accumulated Surplus / (Deficit) 14 (11 062 312) (11 656 109)
Total Net Assets (11 062 312) (11 656 109)
PIXLEY-KA-SEME DISTRICT MUNICIPALITYSTATEMENT OF FINANCIAL POSITION AT 30 JUNE 2016
13
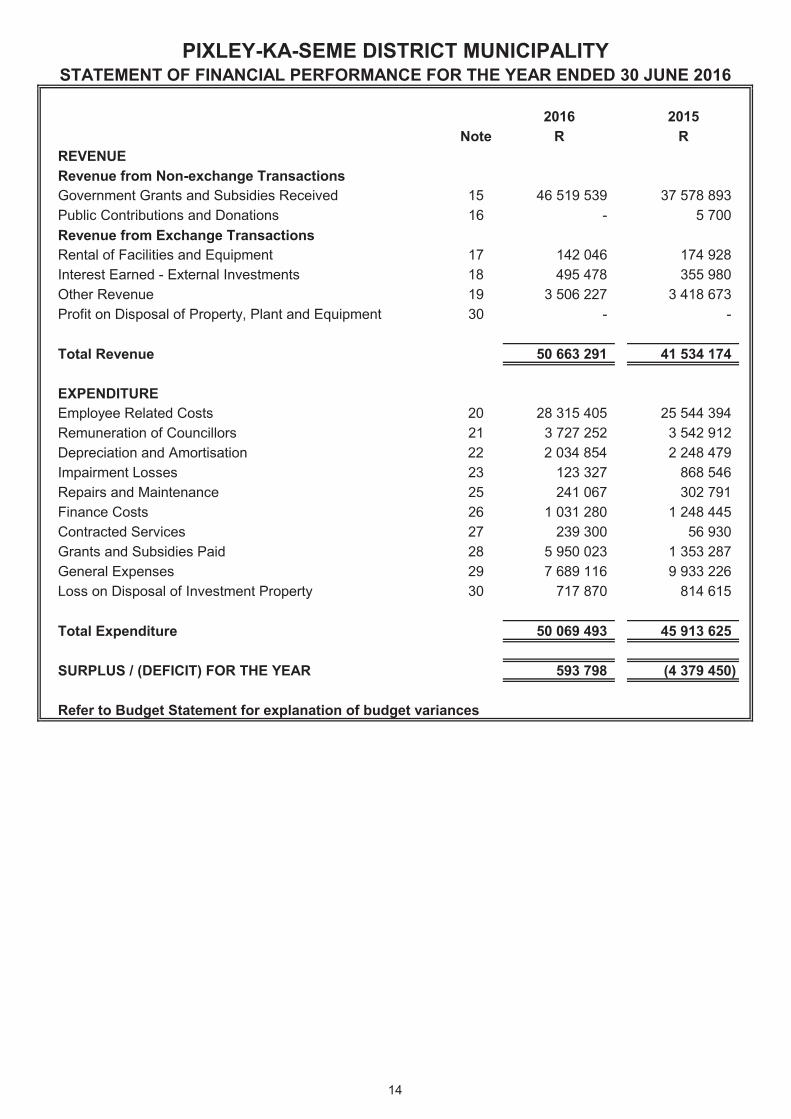
2016 2015Note R R
REVENUERevenue from Non-exchange TransactionsGovernment Grants and Subsidies Received 15 46 519 539 37 578 893 Public Contributions and Donations 16 - 5 700 Revenue from Exchange TransactionsRental of Facilities and Equipment 17 142 046 174 928 Interest Earned - External Investments 18 495 478 355 980 Other Revenue 19 3 506 227 3 418 673 Profit on Disposal of Property, Plant and Equipment 30 - -
Total Revenue 50 663 291 41 534 174
EXPENDITUREEmployee Related Costs 20 28 315 405 25 544 394 Remuneration of Councillors 21 3 727 252 3 542 912 Depreciation and Amortisation 22 2 034 854 2 248 479 Impairment Losses 23 123 327 868 546 Repairs and Maintenance 25 241 067 302 791 Finance Costs 26 1 031 280 1 248 445 Contracted Services 27 239 300 56 930 Grants and Subsidies Paid 28 5 950 023 1 353 287 General Expenses 29 7 689 116 9 933 226 Loss on Disposal of Investment Property 30 717 870 814 615
Total Expenditure 50 069 493 45 913 625
SURPLUS / (DEFICIT) FOR THE YEAR 593 798 (4 379 450)
Refer to Budget Statement for explanation of budget variances 0,00 0,00
PIXLEY-KA-SEME DISTRICT MUNICIPALITYSTATEMENT OF FINANCIAL PERFORMANCE FOR THE YEAR ENDED 30 JUNE 2016
14
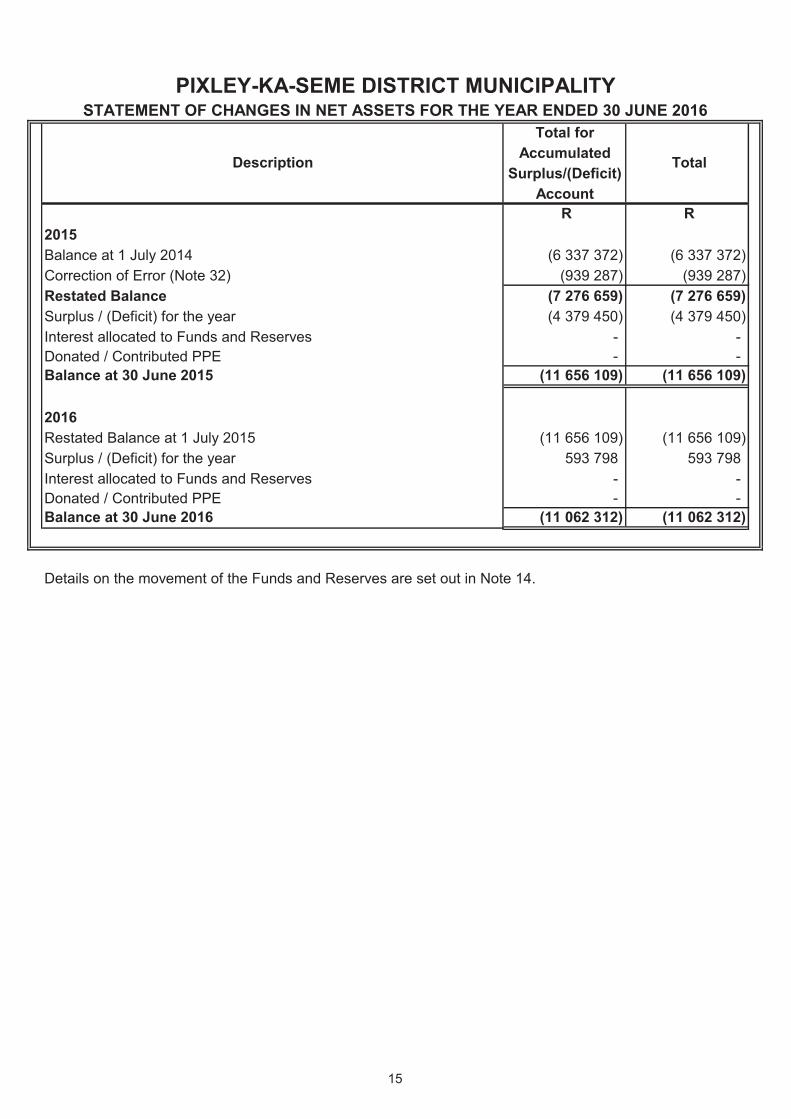
Total forAccumulated
Surplus/(Deficit)Account
R R 2015Balance at 1 July 2014 (6 337 372) (6 337 372) Correction of Error (Note 32) (939 287) (939 287) Restated Balance (7 276 659) (7 276 659) Surplus / (Deficit) for the year (4 379 450) (4 379 450) Interest allocated to Funds and Reserves - - Donated / Contributed PPE - - Balance at 30 June 2015 (11 656 109) (11 656 109)
2016Restated Balance at 1 July 2015 (11 656 109) (11 656 109) Surplus / (Deficit) for the year 593 798 593 798 Interest allocated to Funds and Reserves - - Donated / Contributed PPE - - Balance at 30 June 2016 (11 062 312) (11 062 312)
Details on the movement of the Funds and Reserves are set out in Note 14.
Description
PIXLEY-KA-SEME DISTRICT MUNICIPALITYSTATEMENT OF CHANGES IN NET ASSETS FOR THE YEAR ENDED 30 JUNE 2016
Total
15
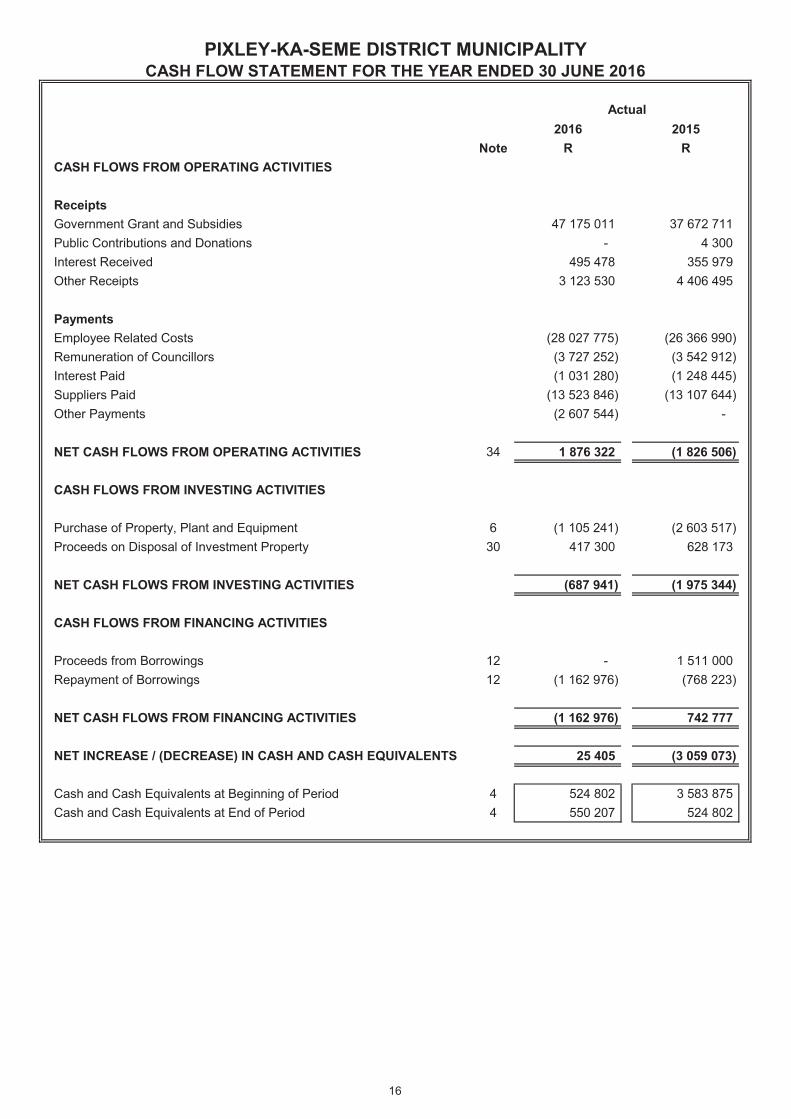
2016 2015Note R R
CASH FLOWS FROM OPERATING ACTIVITIES
ReceiptsGovernment Grant and Subsidies 47 175 011 37 672 711 Public Contributions and Donations - 4 300 Interest Received 495 478 355 979 Other Receipts 3 123 530 4 406 495
PaymentsEmployee Related Costs (28 027 775) (26 366 990) Remuneration of Councillors (3 727 252) (3 542 912) Interest Paid (1 031 280) (1 248 445) Suppliers Paid (13 523 846) (13 107 644) Other Payments (2 607 544) -
NET CASH FLOWS FROM OPERATING ACTIVITIES 34 1 876 322 (1 826 506)
CASH FLOWS FROM INVESTING ACTIVITIES
Purchase of Property, Plant and Equipment 6 (1 105 241) (2 603 517) Proceeds on Disposal of Investment Property 30 417 300 628 173
NET CASH FLOWS FROM INVESTING ACTIVITIES (687 941) (1 975 344)
CASH FLOWS FROM FINANCING ACTIVITIES
Proceeds from Borrowings 12 - 1 511 000 Repayment of Borrowings 12 (1 162 976) (768 223)
NET CASH FLOWS FROM FINANCING ACTIVITIES (1 162 976) 742 777
NET INCREASE / (DECREASE) IN CASH AND CASH EQUIVALENTS 25 405 (3 059 073)
Cash and Cash Equivalents at Beginning of Period 4 524 802 3 583 875 Cash and Cash Equivalents at End of Period 4 550 207 524 802
Actual
PIXLEY-KA-SEME DISTRICT MUNICIPALITYCASH FLOW STATEMENT FOR THE YEAR ENDED 30 JUNE 2016
16
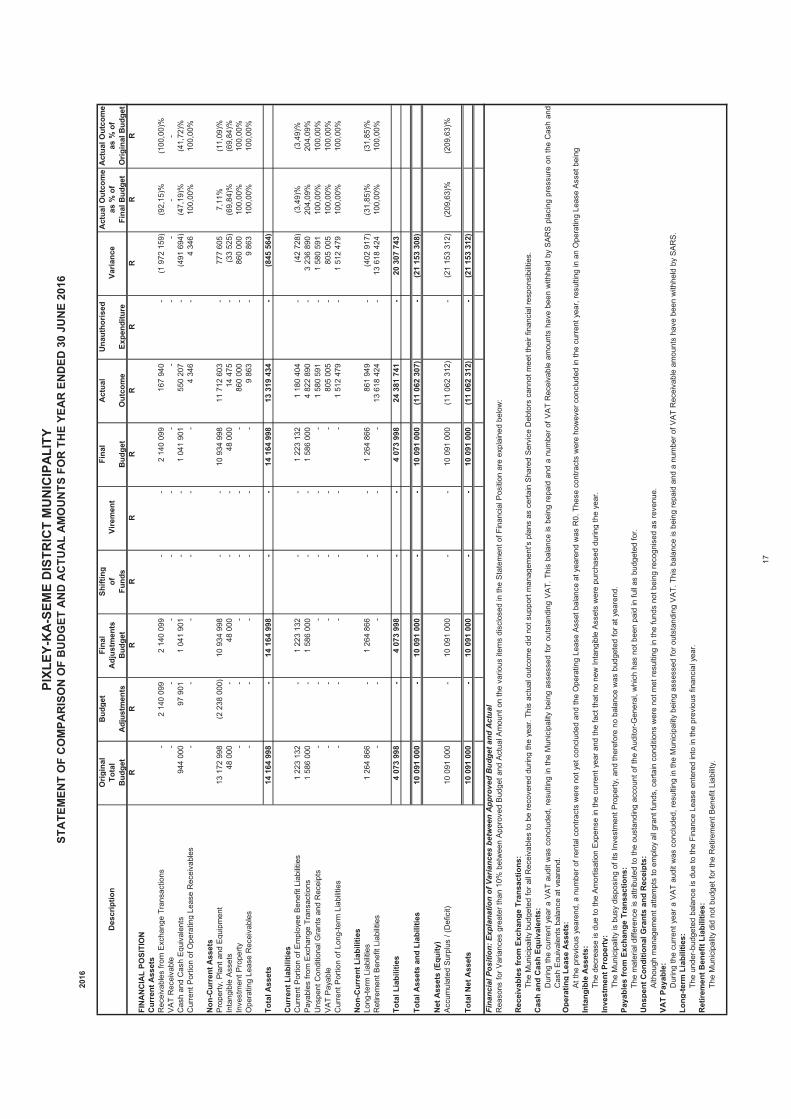
2016
Orig
inal
Bud
get
Fina
lSh
iftin
gFi
nal
Act
ual
Una
utho
rised
Act
ual O
utco
me
Act
ual O
utco
me
Tota
lA
djus
tmen
tsof
as %
of
as %
of
Bud
get
Adj
ustm
ents
Bud
get
Fund
sB
udge
tO
utco
me
Expe
nditu
reFi
nal B
udge
tO
rigin
al B
udge
tR
RR
RR
RR
RR
RR
FIN
AN
CIA
L PO
SITI
ON
Cur
rent
Ass
ets
Rec
eiva
bles
from
Exc
hang
e Tr
ansa
ctio
ns-
2 14
0 09
9
2
140
099
-
-
2 14
0 09
9
16
7 94
0
-
(1
972
159
)
(92,
15)%
(100
,00)
%V
AT
Rec
eiva
ble
-
-
-
-
-
-
-
-
-
-
-C
ash
and
Cas
h E
quiv
alen
ts94
4 00
0
97 9
01
1 04
1 90
1
-
-
1
041
901
550
207
-
(491
694
)
(4
7,19
)%(4
1,72
)%C
urre
nt P
ortio
n of
Ope
ratin
g Le
ase
Rec
eiva
bles
-
-
-
-
-
-
4 34
6
-
4 34
6
10
0,00
%10
0,00
%
Non
-Cur
rent
Ass
ets
Pro
perty
, Pla
nt a
nd E
quip
men
t13
172
998
(2
238
000
)
10 9
34 9
98
-
-
10 9
34 9
98
11 7
12 6
03
-
77
7 60
5
7,11
%(1
1,09
)%In
tang
ible
Ass
ets
48 0
00
-
48
000
-
-
48
000
14
475
-
(33
525)
(6
9,84
)%(6
9,84
)%In
vest
men
t Pro
perty
-
-
-
-
-
-
860
000
-
860
000
10
0,00
%10
0,00
%O
pera
ting
Leas
e R
ecei
vabl
es-
-
-
-
-
-
9
863
-
9
863
100,
00%
100,
00%
Tota
l Ass
ets
14 1
64 9
98
-
14
164
998
-
-
14
164
998
13
319
434
-
(845
564
)
Cur
rent
Lia
bilit
ies
Cur
rent
Por
tion
of E
mpl
oyee
Ben
efit
Liab
ilitie
s1
223
132
-
1
223
132
-
-
1 22
3 13
2
1
180
404
-
(4
2 72
8)
(3,4
9)%
(3,4
9)%
Pay
able
s fro
m E
xcha
nge
Tran
sact
ions
1 58
6 00
0
-
1 58
6 00
0
-
-
1
586
000
4 82
2 89
0
-
3 23
6 89
0
20
4,09
%20
4,09
%U
nspe
nt C
ondi
tiona
l Gra
nts
and
Rec
eipt
s-
-
-
-
-
-
1
580
591
-
1
580
591
100,
00%
100,
00%
VA
T P
ayab
le-
-
-
-
-
-
80
5 00
5
-
80
5 00
5
100,
00%
100,
00%
Cur
rent
Por
tion
of L
ong-
term
Lia
bilit
ies
-
-
-
-
-
-
1 51
2 47
9
-
1 51
2 47
9
10
0,00
%10
0,00
%
Non
-Cur
rent
Lia
bilit
ies
Long
-term
Lia
bilit
ies
1 26
4 86
6
-
1 26
4 86
6
-
-
1
264
866
861
949
-
(402
917
)
(3
1,85
)%(3
1,85
)%R
etire
men
t Ben
efit
Liab
ilitie
s-
-
-
-
-
-
13
618
424
-
13 6
18 4
24
100,
00%
100,
00%
Tota
l Lia
bilit
ies
4 07
3 99
8
-
4 07
3 99
8
-
-
4
073
998
24 3
81 7
41
-
20
307
743
Tota
l Ass
ets
and
Liab
ilitie
s10
091
000
-
10 0
91 0
00
-
-
10 0
91 0
00
(11
062
307)
-
(21
153
308)
Net
Ass
ets
(Equ
ity)
Acc
umul
ated
Sur
plus
/ (D
efic
it)10
091
000
-
10 0
91 0
00
-
-
10 0
91 0
00
(11
062
312)
-
(21
153
312)
(2
09,6
3)%
(209
,63)
%
Tota
l Net
Ass
ets
10 0
91 0
00
-
10
091
000
-
-
10
091
000
(1
1 06
2 31
2)
-
(2
1 15
3 31
2)
-
-
-
-
Fina
ncia
l Pos
ition
: Exp
lana
tion
of V
aria
nces
bet
wee
n A
ppro
ved
Bud
get a
nd A
ctua
l
Rec
eiva
bles
from
Exc
hang
e Tr
ansa
ctio
ns:
Cas
h an
d C
ash
Equi
vale
nts:
Ope
ratin
g Le
ase
Ass
ets:
Inta
ngib
le A
sset
s:
Inve
stm
ent P
rope
rty:
Paya
bles
from
Exc
hang
e Tr
ansa
ctio
ns:
Uns
pent
Con
ditio
nal G
rant
s an
d R
ecei
pts:
VAT
Paya
ble:
Long
-term
Lia
bilit
ies:
Ret
irem
ent B
enef
it Li
abili
ties:
The
Mun
icip
ality
did
not
bud
get f
or th
e R
etire
men
t Ben
efit
Liab
ility.
Dur
ing
the
curre
nt y
ear a
VA
T au
dit w
as c
oncl
uded
, res
ultin
g in
the
Mun
icip
ality
bei
ng a
sses
sed
for o
utst
andi
ng V
AT.
Thi
s ba
lanc
e is
bei
ng re
paid
and
a n
umbe
r of V
AT
Rec
eiva
ble
amou
nts
have
bee
n w
ithhe
ld b
y S
AR
S.
At t
he p
revi
ous
year
end,
a n
umbe
r of r
enta
l con
tract
s w
ere
not y
et c
oncl
uded
and
the
Ope
ratin
g Le
ase
Ass
et b
alan
ce a
t yea
rend
was
R0.
The
se c
ontra
cts
wer
e ho
wev
er c
oncl
uded
in th
e cu
rrent
yea
r, re
sulti
ng in
an
Ope
ratin
g Le
ase
Ass
et b
eing
The
decr
ease
is d
ue to
the
Am
ortis
atio
n E
xpen
se in
the
curre
nt y
ear a
nd th
e fa
ct th
at n
o ne
w In
tang
ible
Ass
ets
wer
e pu
rcha
sed
durin
g th
e ye
ar.
The
Mun
icip
ality
is b
usy
disp
osin
g of
its
Inve
stm
ent P
rope
rty, a
nd th
eref
ore
no b
alan
ce w
as b
udge
ted
for a
t yea
rend
.
The
mat
eria
l diff
eren
ce is
attr
ibut
ed to
the
oust
andi
ng a
ccou
nt o
f the
Aud
itor-G
ener
al, w
hich
has
not
bee
n pa
id in
full
as b
udge
ted
for.
Alth
ough
man
agem
ent a
ttem
pts
to e
mpl
oy a
ll gr
ant f
unds
, cer
tain
con
ditio
ns w
ere
not m
et re
sulti
ng in
the
fund
s no
t bei
ng re
cogn
ised
as
reve
nue.
The
unde
r-bud
gete
d ba
lanc
e is
due
to th
e Fi
nanc
e Le
ase
ente
red
into
in th
e pr
evio
us fi
nanc
ial y
ear.
Des
crip
tion
Vire
men
t V
aria
nce
Rea
sons
for V
aria
nces
gre
ater
than
10%
bet
wee
n A
ppro
ved
Bud
get a
nd A
ctua
l Am
ount
on
the
vario
us it
ems
disc
lose
d in
the
Sta
tem
ent o
f Fin
anci
al P
ositi
on a
re e
xpla
ined
bel
ow:
The
Mun
icip
ality
bud
gete
d fo
r all
Rec
eiva
bles
to b
e re
cove
red
durin
g th
e ye
ar. T
his
actu
al o
utco
me
did
not s
uppo
rt m
anag
emen
t's p
lans
as
certa
in S
hare
d S
ervi
ce D
ebto
rs c
anno
t mee
t the
ir fin
anci
al re
spon
sibi
litie
s.
Dur
ing
the
curre
ntye
ara
VA
Tau
ditw
asco
nclu
ded,
resu
lting
inth
eM
unic
ipal
itybe
ing
asse
ssed
foro
utst
andi
ngV
AT.
This
bala
nce
isbe
ing
repa
idan
da
num
bero
fVA
TR
ecei
vabl
eam
ount
sha
vebe
enw
ithhe
ldby
SA
RS
plac
ing
pres
sure
onth
eC
ash
and
Cas
h E
quiv
alen
ts b
alan
ce a
t yea
rend
.
STA
TEM
ENT
OF
CO
MPA
RIS
ON
OF
BU
DG
ET A
ND
AC
TUA
L A
MO
UN
TS F
OR
TH
E YE
AR
EN
DED
30
JUN
E 20
16PI
XLEY
-KA-
SEM
E D
ISTR
ICT
MU
NIC
IPAL
ITY
17
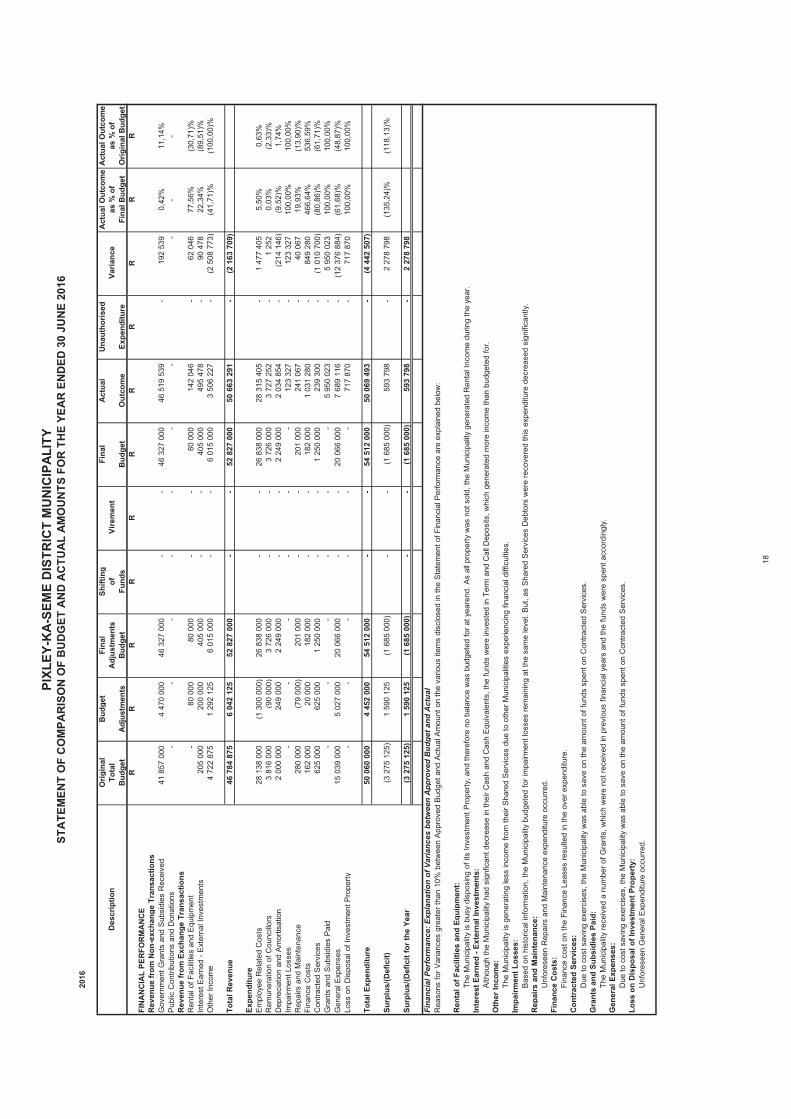
STA
TEM
ENT
OF
CO
MPA
RIS
ON
OF
BU
DG
ET A
ND
AC
TUA
L A
MO
UN
TS F
OR
TH
E YE
AR
EN
DED
30
JUN
E 20
16PI
XLEY
-KA-
SEM
E D
ISTR
ICT
MU
NIC
IPAL
ITY
2016
Orig
inal
Bud
get
Fina
lSh
iftin
gFi
nal
Act
ual
Una
utho
rised
Act
ual O
utco
me
Act
ual O
utco
me
Tota
lA
djus
tmen
tsof
as %
of
as %
of
Bud
get
Adj
ustm
ents
Bud
get
Fund
sB
udge
tO
utco
me
Expe
nditu
reFi
nal B
udge
tO
rigin
al B
udge
tR
RR
RR
RR
RR
RR
FIN
AN
CIA
L PE
RFO
RM
AN
CE
Rev
enue
from
Non
-exc
hang
e Tr
ansa
ctio
nsG
over
nmen
t Gra
nts
and
Sub
sidi
es R
ecei
ved
41 8
57 0
00
4 47
0 00
0
46
327
000
-
-
46
327
000
46
519
539
-
192
539
0,
42%
11,1
4%P
ublic
Con
tribu
tions
and
Don
atio
ns
-
-
-
-
-
-
-
-
--
Rev
enue
from
Exc
hang
e Tr
ansa
ctio
nsR
enta
l of F
acilit
ies
and
Equ
ipm
ent
-
80
000
80
000
-
-
80
000
14
2 04
6
-
62
046
77
,56%
(30,
71)%
Inte
rest
Ear
ned
- Ext
erna
l Inv
estm
ents
205
000
20
0 00
0
405
000
-
-
40
5 00
0
495
478
-
90 4
78
22,3
4%(8
9,51
)%O
ther
Inco
me
4 72
2 87
5
1
292
125
6 01
5 00
0
-
-
6
015
000
3 50
6 22
7
-
(2 5
08 7
73)
(4
1,71
)%(1
00,0
0)%
Tota
l Rev
enue
46 7
84 8
75
6 04
2 12
5
52
827
000
-
-
52
827
000
50
663
291
-
(2 1
63 7
09)
Expe
nditu
reE
mpl
oyee
Rel
ated
Cos
ts28
138
000
(1
300
000
)
26 8
38 0
00
-
-
26 8
38 0
00
28 3
15 4
05
-
1
477
405
5,50
%0,
63%
Rem
uner
atio
n of
Cou
ncillo
rs3
816
000
(90
000)
3
726
000
-
-
3 72
6 00
0
3
727
252
-
1
252
0,03
%(2
,33)
%D
epre
ciat
ion
and
Am
ortis
atio
n2
000
000
249
000
2
249
000
-
-
2 24
9 00
0
2
034
854
-
(2
14 1
46)
(9,5
2)%
1,74
%Im
pairm
ent L
osse
s-
-
-
-
-
-
12
3 32
7
-
12
3 32
7
100,
00%
100,
00%
Rep
airs
and
Mai
nten
ance
280
000
(7
9 00
0)
201
000
-
-
20
1 00
0
241
067
-
40 0
67
19,9
3%(1
3,90
)%Fi
nanc
e C
osts
162
000
20
000
18
2 00
0
-
-
182
000
1
031
280
-
84
9 28
0
466,
64%
536,
59%
Con
tract
ed S
ervi
ces
625
000
62
5 00
0
1 25
0 00
0
-
-
1
250
000
239
300
-
(1 0
10 7
00)
(8
0,86
)%(6
1,71
)%G
rant
s an
d S
ubsi
dies
Pai
d-
-
-
-
-
-
5
950
023
-
5
950
023
100,
00%
100,
00%
Gen
eral
Exp
ense
s 15
039
000
5
027
000
20 0
66 0
00
-
-
20 0
66 0
00
7 68
9 11
6
-
(12
376
884)
(6
1,68
)%(4
8,87
)%Lo
ss o
n D
ispo
sal o
f Inv
estm
ent P
rope
rty
-
-
-
-
-
-
717
870
-
717
870
10
0,00
%10
0,00
%
Tota
l Exp
endi
ture
50 0
60 0
00
4 45
2 00
0
54
512
000
-
-
54
512
000
50
069
493
-
(4 4
42 5
07)
Surp
lus/
(Def
icit)
(3 2
75 1
25)
1
590
125
(1 6
85 0
00)
-
-
(1
685
000
)
593
798
-
2 27
8 79
8
(1
35,2
4)%
(118
,13)
%
Surp
lus/
(Def
icit
for t
he Y
ear
(3 2
75 1
25)
1
590
125
(1 6
85 0
00)
-
-
(1
685
000
)
593
798
-
2 27
8 79
8
-
Fina
ncia
l Per
form
ance
: Exp
lana
tion
of V
aria
nces
bet
wee
n A
ppro
ved
Bud
get a
nd A
ctua
l
Ren
tal o
f Fac
ilitie
s an
d Eq
uipm
ent:
Inte
rest
Ear
ned
- Ext
erna
l Inv
estm
ents
:
Oth
er In
com
e:
Impa
irmen
t Los
ses:
Rep
airs
and
Mai
nten
ance
:
Fina
nce
Cos
ts:
Con
trac
ted
Serv
ices
:
Gra
nts
and
Subs
idie
s Pa
id:
Gen
eral
Exp
ense
s:
Loss
on
Dis
posa
l of I
nves
tmen
t Pro
pert
y:
Due
to c
ost s
avin
g ex
erci
ses,
the
Mun
icip
ality
was
abl
e to
sav
e on
the
amou
nt o
f fun
ds s
pent
on
Con
tract
ed S
ervi
ces.
The
Mun
icip
ality
rece
ived
a n
umbe
r of G
rant
s, w
hich
wer
e no
t rec
eive
d in
pre
viou
s fin
anci
al y
ears
and
the
fund
s w
ere
spen
t acc
ordi
ngly
.
Due
to c
ost s
avin
g ex
erci
ses,
the
Mun
icip
ality
was
abl
e to
sav
e on
the
amou
nt o
f fun
ds s
pent
on
Con
tract
ed S
ervi
ces.
Unf
ores
een
Gen
eral
Exp
endi
ture
occ
urre
d.
The
Mun
icip
ality
is b
usy
disp
osin
g of
its
Inve
stm
ent P
rope
rty, a
nd th
eref
ore
no b
alan
ce w
as b
udge
ted
for a
t yea
rend
. As
all p
rope
rty w
as n
ot s
old,
the
Mun
icip
ality
gen
erat
ed R
enta
l Inc
ome
durin
g th
e ye
ar.
Alth
ough
the
Mun
icip
ality
had
sig
nfic
ant d
ecre
ase
in th
eir C
ash
and
Cas
h E
quiv
alen
ts, t
he fu
nds
wer
e in
vest
ed in
Ter
m a
nd C
all D
epos
its, w
hich
gen
erat
ed m
ore
inco
me
than
bud
gete
d fo
r.
The
Mun
icip
ality
is g
ener
atin
g le
ss in
com
e fro
m th
eir S
hare
d S
ervi
ces
due
to o
ther
Mun
icip
aliti
es e
xper
ienc
ing
finan
cial
diff
icul
ties.
Bas
ed o
n hi
stor
ical
info
rmat
ion,
the
Mun
icip
ality
bud
gete
d fo
r im
pairm
ent l
osse
s re
mai
ning
at t
he s
ame
leve
l. B
ut, a
s S
hare
d S
ervi
ces
Deb
tors
wer
e re
cove
red
this
exp
endi
ture
dec
reas
ed s
igni
fican
tly.
Unf
ores
een
Rep
airs
and
Mai
nten
ance
exp
endi
ture
occ
urre
d.
Fina
nce
cost
on
the
Fina
nce
Leas
es re
sulte
d in
the
over
exp
endi
ture
.
Des
crip
tion
Vire
men
t V
aria
nce
Rea
sons
for V
aria
nces
gre
ater
than
10%
bet
wee
n A
ppro
ved
Bud
get a
nd A
ctua
l Am
ount
on
the
vario
us it
ems
disc
lose
d in
the
Sta
tem
ent o
f Fin
anci
al P
erfo
rman
ce a
re e
xpla
ined
bel
ow:
18
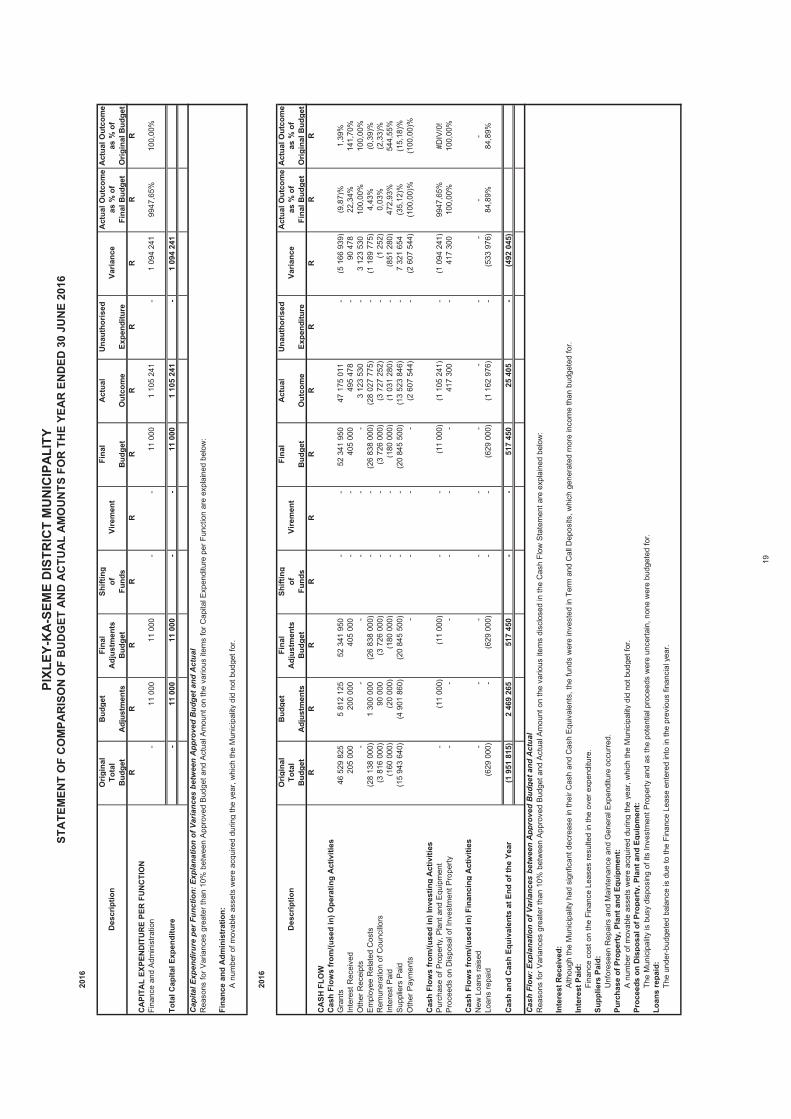
STA
TEM
ENT
OF
CO
MPA
RIS
ON
OF
BU
DG
ET A
ND
AC
TUA
L A
MO
UN
TS F
OR
TH
E YE
AR
EN
DED
30
JUN
E 20
16PI
XLEY
-KA-
SEM
E D
ISTR
ICT
MU
NIC
IPAL
ITY
2016
Orig
inal
Bud
get
Fina
lSh
iftin
gFi
nal
Act
ual
Una
utho
rised
Act
ual O
utco
me
Act
ual O
utco
me
Tota
lA
djus
tmen
tsof
as %
of
as %
of
Bud
get
Adj
ustm
ents
Bud
get
Fund
sB
udge
tO
utco
me
Expe
nditu
reFi
nal B
udge
tO
rigin
al B
udge
tR
RR
RR
RR
RR
RR
CA
PITA
L EX
PEN
DIT
UR
E PE
R F
UN
CTI
ON
Fina
nce
and
Adm
inis
tratio
n-
11 0
00
11 0
00
-
-
11 0
00
1 10
5 24
1
-
1 09
4 24
1
99
47,6
5%10
0,00
%
Tota
l Cap
ital E
xpen
ditu
re-
11 0
00
11 0
00
-
-
11 0
00
1 10
5 24
1
-
1 09
4 24
1
Cap
ital E
xpen
diru
re p
er F
unct
ion:
Exp
lana
tion
of V
aria
nces
bet
wee
n A
ppro
ved
Bud
get a
nd A
ctua
l
Fina
nce
and
Adm
inis
trat
ion:
2016
Orig
inal
Bud
get
Fina
lSh
iftin
gFi
nal
Act
ual
Una
utho
rised
Act
ual O
utco
me
Act
ual O
utco
me
Tota
lA
djus
tmen
tsof
as %
of
as %
of
Bud
get
Adj
ustm
ents
Bud
get
Fund
sB
udge
tO
utco
me
Expe
nditu
reFi
nal B
udge
tO
rigin
al B
udge
tR
RR
RR
RR
RR
RR
CA
SH F
LOW
Cas
h Fl
ows
from
/(use
d in
) Ope
ratin
g A
ctiv
ities
Gra
nts
46 5
29 8
25
5 81
2 12
5
52
341
950
-
-
52
341
950
47
175
011
-
(5 1
66 9
39)
(9
,87)
%1,
39%
Inte
rest
Rec
eive
d20
5 00
0
200
000
40
5 00
0
-
-
405
000
49
5 47
8
-
90
478
22
,34%
141,
70%
Oth
er R
ecei
pts
-
-
-
-
-
-
3 12
3 53
0
-
3 12
3 53
0
10
0,00
%10
0,00
%E
mpl
oyee
Rel
ated
Cos
ts(2
8 13
8 00
0)
1 30
0 00
0
(2
6 83
8 00
0)
-
-
(26
838
000)
(2
8 02
7 77
5)
-
(1
189
775
)
4,43
%(0
,39)
%R
emun
erat
ion
of C
ounc
illors
(3 8
16 0
00)
90
000
(3
726
000
)
-
-
(3 7
26 0
00)
(3
727
252
)
-
(1
252
)
0,03
%(2
,33)
%In
tere
st P
aid
(160
000
)
(2
0 00
0)
(180
000
)
-
-
(1
80 0
00)
(1 0
31 2
80)
-
(851
280
)
47
2,93
%54
4,55
%S
uppl
iers
Pai
d(1
5 94
3 64
0)
(4 9
01 8
60)
(2
0 84
5 50
0)
-
-
(20
845
500)
(1
3 52
3 84
6)
-
7
321
654
(35,
12)%
(15,
18)%
Oth
er P
aym
ents
-
-
-
-
(2 6
07 5
44)
-
(2 6
07 5
44)
(1
00,0
0)%
(100
,00)
%
Cas
h Fl
ows
from
/(use
d in
) Inv
estin
g A
ctiv
ities
Pur
chas
e of
Pro
perty
, Pla
nt a
nd E
quip
men
t-
(11
000)
(1
1 00
0)
-
-
(11
000)
(1
105
241
)
-
(1
094
241
)
9947
,65%
#DIV
/0!
Pro
ceed
s on
Dis
posa
l of I
nves
tmen
t Pro
perty
-
-
-
-
-
-
417
300
-
417
300
10
0,00
%10
0,00
%
Cas
h Fl
ows
from
/(use
d in
) Fin
anci
ng A
ctiv
ities
New
Loa
ns ra
ised
-
-
-
-
-
-
-
-
-
-
-Lo
ans
repa
id(6
29 0
00)
-
(6
29 0
00)
-
-
(629
000
)
(1
162
976
)
-
(5
33 9
76)
84,8
9%84
,89%
Cas
h an
d C
ash
Equi
vale
nts
at E
nd o
f the
Yea
r(1
951
815
)
2 46
9 26
5
51
7 45
0
-
-
517
450
25
405
-
(492
045
)
#R
EF!
Cas
h Fl
ow: E
xpla
natio
n of
Var
ianc
es b
etw
een
App
rove
d B
udge
t and
Act
ual
Inte
rest
Rec
eive
d:
Inte
rest
Pai
d:
Supp
liers
Pai
d:
Purc
hase
of P
rope
rty,
Pla
nt a
nd E
quip
men
t:
Proc
eeds
on
Dis
posa
l of P
rope
rty,
Pla
nt a
nd E
quip
men
t:
Loan
s re
paid
:Th
e M
unic
ipal
ity is
bus
y di
spos
ing
of it
s In
vest
men
t Pro
perty
and
as
the
pote
ntia
l pro
ceed
s w
ere
unce
rtain
, non
e w
ere
budg
eted
for.
The
unde
r-bud
gete
d ba
lanc
e is
due
to th
e Fi
nanc
e Le
ase
ente
red
into
in th
e pr
evio
us fi
nanc
ial y
ear.
Rea
sons
for V
aria
nces
gre
ater
than
10%
bet
wee
n A
ppro
ved
Bud
get a
nd A
ctua
l Am
ount
on
the
vario
us it
ems
disc
lose
d in
the
Cas
h Fl
ow S
tate
men
t are
exp
lain
ed b
elow
:
Alth
ough
the
Mun
icip
ality
had
sig
nfic
ant d
ecre
ase
in th
eir C
ash
and
Cas
h E
quiv
alen
ts, t
he fu
nds
wer
e in
vest
ed in
Ter
m a
nd C
all D
epos
its, w
hich
gen
erat
ed m
ore
inco
me
than
bud
gete
d fo
r.
Fina
nce
cost
on
the
Fina
nce
Leas
es re
sulte
d in
the
over
exp
endi
ture
.
Unf
ores
een
Rep
airs
and
Mai
nten
ance
and
Gen
eral
Exp
endi
ture
occ
urre
d.
Rea
sons
for V
aria
nces
gre
ater
than
10%
bet
wee
n A
ppro
ved
Bud
get a
nd A
ctua
l Am
ount
on
the
vario
us it
ems
for C
apita
l Exp
endi
ture
per
Fun
ctio
n ar
e ex
plai
ned
belo
w:
A n
umbe
r of m
ovab
le a
sset
s w
ere
acqu
ired
durin
g th
e ye
ar, w
hich
the
Mun
icip
ality
did
not
bud
get f
or.
Des
crip
tion
Vire
men
t V
aria
nce
A n
umbe
r of m
ovab
le a
sset
s w
ere
acqu
ired
durin
g th
e ye
ar, w
hich
the
Mun
icip
ality
did
not
bud
get f
or.
Des
crip
tion
Vire
men
t V
aria
nce
19
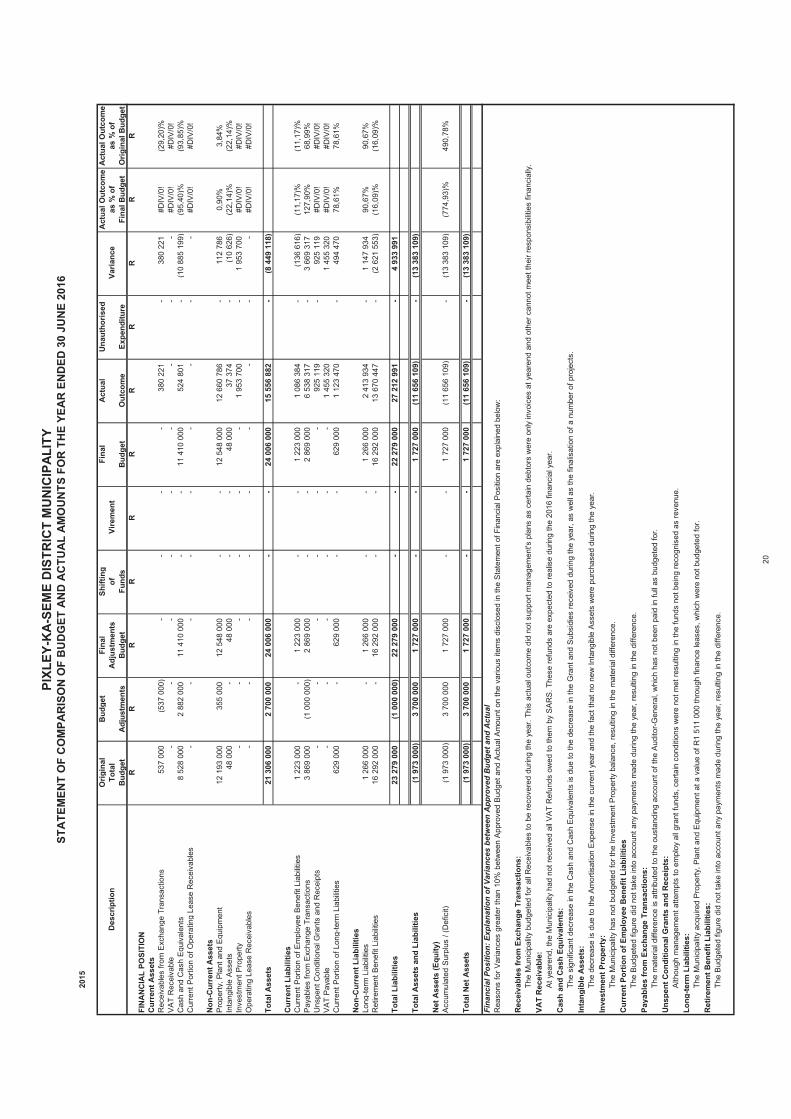
STA
TEM
ENT
OF
CO
MPA
RIS
ON
OF
BU
DG
ET A
ND
AC
TUA
L A
MO
UN
TS F
OR
TH
E YE
AR
EN
DED
30
JUN
E 20
16PI
XLEY
-KA-
SEM
E D
ISTR
ICT
MU
NIC
IPAL
ITY
2015
Orig
inal
Bud
get
Fina
lSh
iftin
gFi
nal
Act
ual
Una
utho
rised
Act
ual O
utco
me
Act
ual O
utco
me
Tota
lA
djus
tmen
tsof
as %
of
as %
of
Bud
get
Adj
ustm
ents
Bud
get
Fund
sB
udge
tO
utco
me
Expe
nditu
reFi
nal B
udge
tO
rigin
al B
udge
tR
RR
RR
RR
RR
RR
FIN
AN
CIA
L PO
SITI
ON
Cur
rent
Ass
ets
Rec
eiva
bles
from
Exc
hang
e Tr
ansa
ctio
ns53
7 00
0
(537
000
)
-
-
-
-
38
0 22
1
-
38
0 22
1
#DIV
/0!
(29,
20)%
VA
T R
ecei
vabl
e-
-
-
-
-
-
-
-
-
#DIV
/0!
#DIV
/0!
Cas
h an
d C
ash
Equ
ival
ents
8 52
8 00
0
2
882
000
11 4
10 0
00
-
-
11 4
10 0
00
524
801
-
(10
885
199)
(9
5,40
)%(9
3,85
)%C
urre
nt P
ortio
n of
Ope
ratin
g Le
ase
Rec
eiva
bles
-
-
-
-
-
-
-
-
-
#D
IV/0
!#D
IV/0
!
Non
-Cur
rent
Ass
ets
Pro
perty
, Pla
nt a
nd E
quip
men
t12
193
000
35
5 00
0
12 5
48 0
00
-
-
12 5
48 0
00
12 6
60 7
86
-
11
2 78
6
0,90
%3,
84%
Inta
ngib
le A
sset
s48
000
-
48 0
00
-
-
48 0
00
37 3
74
-
(1
0 62
6)
(22,
14)%
(22,
14)%
Inve
stm
ent P
rope
rty-
-
-
-
-
-
1
953
700
-
1
953
700
#DIV
/0!
#DIV
/0!
Ope
ratin
g Le
ase
Rec
eiva
bles
-
-
-
-
-
-
-
-
-
#D
IV/0
!#D
IV/0
!
Tota
l Ass
ets
21 3
06 0
00
2 70
0 00
0
24
006
000
-
-
24
006
000
15
556
882
-
(8 4
49 1
18)
Cur
rent
Lia
bilit
ies
Cur
rent
Por
tion
of E
mpl
oyee
Ben
efit
Liab
ilitie
s1
223
000
-
1
223
000
-
-
1 22
3 00
0
1
086
384
-
(1
36 6
16)
(11,
17)%
(11,
17)%
Pay
able
s fro
m E
xcha
nge
Tran
sact
ions
3 86
9 00
0
(1
000
000
)
2 86
9 00
0
-
-
2
869
000
6 53
8 31
7
-
3 66
9 31
7
12
7,90
%68
,99%
Uns
pent
Con
ditio
nal G
rant
s an
d R
ecei
pts
-
-
-
-
-
-
925
119
-
925
119
#D
IV/0
!#D
IV/0
!V
AT
Pay
able
-
-
-
-
-
-
1 45
5 32
0
1
455
320
#DIV
/0!
#DIV
/0!
Cur
rent
Por
tion
of L
ong-
term
Lia
bilit
ies
629
000
-
629
000
-
-
62
9 00
0
1 12
3 47
0
-
494
470
78
,61%
78,6
1%
Non
-Cur
rent
Lia
bilit
ies
Long
-term
Lia
bilit
ies
1 26
6 00
0
-
1 26
6 00
0
-
-
1
266
000
2 41
3 93
4
-
1 14
7 93
4
90
,67%
90,6
7%R
etire
men
t Ben
efit
Liab
ilitie
s16
292
000
-
16 2
92 0
00
-
-
16 2
92 0
00
13 6
70 4
47
-
(2
621
553
)
(16,
09)%
(16,
09)%
Tota
l Lia
bilit
ies
23 2
79 0
00
(1 0
00 0
00)
22
279
000
-
-
22
279
000
27
212
991
-
4 93
3 99
1
Tota
l Ass
ets
and
Liab
ilitie
s(1
973
000
)
3 70
0 00
0
1
727
000
-
-
1 72
7 00
0
(1
1 65
6 10
9)
-
(1
3 38
3 10
9)
Net
Ass
ets
(Equ
ity)
Acc
umul
ated
Sur
plus
/ (D
efic
it)(1
973
000
)
3 70
0 00
0
1
727
000
-
-
1 72
7 00
0
(1
1 65
6 10
9)
-
(1
3 38
3 10
9)
(774
,93)
%49
0,78
%
Tota
l Net
Ass
ets
(1 9
73 0
00)
3
700
000
1 72
7 00
0
-
-
1
727
000
(11
656
109)
-
(13
383
109)
-
-
-
-
-
-
-
Fina
ncia
l Pos
ition
: Exp
lana
tion
of V
aria
nces
bet
wee
n A
ppro
ved
Bud
get a
nd A
ctua
l
Rec
eiva
bles
from
Exc
hang
e Tr
ansa
ctio
ns:
VAT
Rec
eiva
ble:
Cas
h an
d C
ash
Equi
vale
nts:
Inta
ngib
le A
sset
s:
Inve
stm
ent P
rope
rty:
Cur
rent
Por
tion
of E
mpl
oyee
Ben
efit
Liab
ilitie
s
Paya
bles
from
Exc
hang
e Tr
ansa
ctio
ns:
Uns
pent
Con
ditio
nal G
rant
s an
d R
ecei
pts:
Long
-term
Lia
bilit
ies:
Ret
irem
ent B
enef
it Li
abili
ties:
The
Mun
icip
ality
has
not
bud
gete
d fo
r the
Inve
stm
ent P
rope
rty b
alan
ce, r
esul
ting
in th
e m
ater
ial d
iffer
ence
.
Des
crip
tion
Vire
men
t V
aria
nce
Rea
sons
for V
aria
nces
gre
ater
than
10%
bet
wee
n A
ppro
ved
Bud
get a
nd A
ctua
l Am
ount
on
the
vario
us it
ems
disc
lose
d in
the
Sta
tem
ent o
f Fin
anci
al P
ositi
on a
re e
xpla
ined
bel
ow:
The
decr
ease
is d
ue to
the
Am
ortis
atio
n E
xpen
se in
the
curre
nt y
ear a
nd th
e fa
ct th
at n
o ne
w In
tang
ible
Ass
ets
wer
e pu
rcha
sed
durin
g th
e ye
ar.
The
Mun
icip
ality
bud
gete
d fo
r all
Rec
eiva
bles
to b
e re
cove
red
durin
g th
e ye
ar. T
his
actu
al o
utco
me
did
not s
uppo
rt m
anag
emen
t's p
lans
as
certa
in d
ebto
rs w
ere
only
invo
ices
at y
eare
nd a
nd o
ther
can
not m
eet t
heir
resp
onsi
bilit
ies
finan
cial
ly.
At y
eare
nd, t
he M
unic
ipal
ity h
ad n
ot re
ceiv
ed a
ll V
AT
Ref
unds
ow
ed to
them
by
SA
RS
. The
se re
fund
s ar
e ex
pect
ed to
real
ise
durin
g th
e 20
16 fi
nanc
ial y
ear.
The
sign
ifica
nt d
ecre
ase
in th
e C
ash
and
Cas
h E
quiv
alen
ts is
due
to th
e de
crea
se in
the
Gra
nt a
nd S
ubsi
dies
rece
ived
dur
ing
the
year
, as
wel
l as
the
final
isat
ion
of a
num
ber o
f pro
ject
s.
The
Mun
icip
ality
acq
uire
d P
rope
rty, P
lant
and
Equ
ipm
ent a
t a v
alue
of R
1 51
1 00
0 th
roug
h fin
ance
leas
es, w
hich
wer
e no
t bud
gete
d fo
r.
The
Bud
gete
d fig
ure
did
not t
ake
into
acc
ount
any
pay
men
ts m
ade
durin
g th
e ye
ar, r
esul
ting
in th
e di
ffere
nce.
The
Bud
gete
d fig
ure
did
not t
ake
into
acc
ount
any
pay
men
ts m
ade
durin
g th
e ye
ar, r
esul
ting
in th
e di
ffere
nce.
The
mat
eria
l diff
eren
ce is
attr
ibut
ed to
the
oust
andi
ng a
ccou
nt o
f the
Aud
itor-G
ener
al, w
hich
has
not
bee
n pa
id in
full
as b
udge
ted
for.
Alth
ough
man
agem
ent a
ttem
pts
to e
mpl
oy a
ll gr
ant f
unds
, cer
tain
con
ditio
ns w
ere
not m
et re
sulti
ng in
the
fund
s no
t bei
ng re
cogn
ised
as
reve
nue.
20
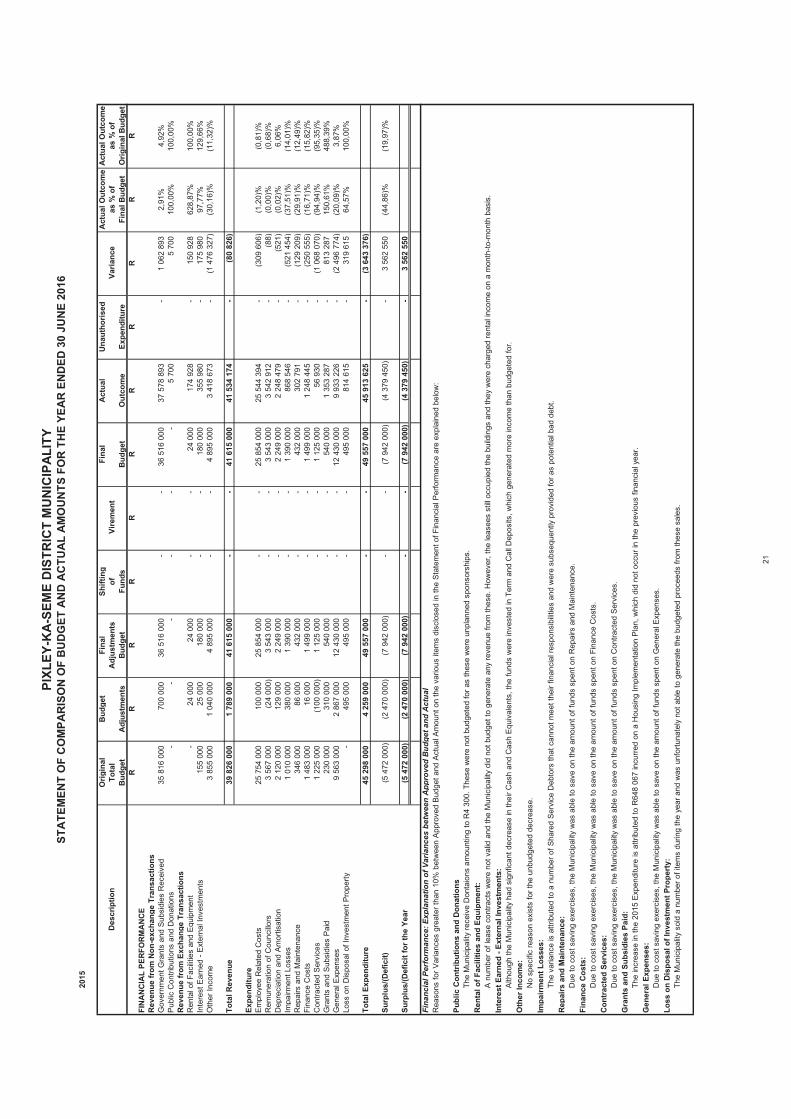
STA
TEM
ENT
OF
CO
MPA
RIS
ON
OF
BU
DG
ET A
ND
AC
TUA
L A
MO
UN
TS F
OR
TH
E YE
AR
EN
DED
30
JUN
E 20
16PI
XLEY
-KA-
SEM
E D
ISTR
ICT
MU
NIC
IPAL
ITY
2015
Orig
inal
Bud
get
Fina
lSh
iftin
gFi
nal
Act
ual
Una
utho
rised
Act
ual O
utco
me
Act
ual O
utco
me
Tota
lA
djus
tmen
tsof
as %
of
as %
of
Bud
get
Adj
ustm
ents
Bud
get
Fund
sB
udge
tO
utco
me
Expe
nditu
reFi
nal B
udge
tO
rigin
al B
udge
tR
RR
RR
RR
RR
RR
FIN
AN
CIA
L PE
RFO
RM
AN
CE
Rev
enue
from
Non
-exc
hang
e Tr
ansa
ctio
nsG
over
nmen
t Gra
nts
and
Sub
sidi
es R
ecei
ved
35 8
16 0
00
700
000
36
516
000
-
-
36
516
000
37
578
893
-
1 06
2 89
3
2,
91%
4,92
%P
ublic
Con
tribu
tions
and
Don
atio
ns
-
-
-
-
-
-
5 70
0
5
700
100,
00%
100,
00%
Rev
enue
from
Exc
hang
e Tr
ansa
ctio
nsR
enta
l of F
acilit
ies
and
Equ
ipm
ent
-
24
000
24
000
-
-
24
000
17
4 92
8
-
15
0 92
8
628,
87%
100,
00%
Inte
rest
Ear
ned
- Ext
erna
l Inv
estm
ents
155
000
25
000
18
0 00
0
-
-
180
000
35
5 98
0
-
17
5 98
0
97,7
7%12
9,66
%O
ther
Inco
me
3 85
5 00
0
1
040
000
4 89
5 00
0
-
-
4
895
000
3 41
8 67
3
-
(1 4
76 3
27)
(3
0,16
)%(1
1,32
)%
Tota
l Rev
enue
39 8
26 0
00
1 78
9 00
0
41
615
000
-
-
41
615
000
41
534
174
-
(80
826)
Expe
nditu
reE
mpl
oyee
Rel
ated
Cos
ts25
754
000
10
0 00
0
25 8
54 0
00
-
-
25 8
54 0
00
25 5
44 3
94
-
(3
09 6
06)
(1,2
0)%
(0,8
1)%
Rem
uner
atio
n of
Cou
ncillo
rs3
567
000
(24
000)
3
543
000
-
-
3 54
3 00
0
3
542
912
-
(8
8)
(0,0
0)%
(0,6
8)%
Dep
reci
atio
n an
d A
mor
tisat
ion
2 12
0 00
0
12
9 00
0
2 24
9 00
0
-
-
2
249
000
2 24
8 47
9
-
(521
)
(0
,02)
%6,
06%
Impa
irmen
t Los
ses
1 01
0 00
0
38
0 00
0
1 39
0 00
0
-
-
1
390
000
868
546
-
(521
454
)
(3
7,51
)%(1
4,01
)%R
epai
rs a
nd M
aint
enan
ce34
6 00
0
86 0
00
432
000
-
-
43
2 00
0
302
791
-
(129
209
)
(2
9,91
)%(1
2,49
)%Fi
nanc
e C
osts
1 48
3 00
0
16
000
1
499
000
-
-
1 49
9 00
0
1
248
445
-
(2
50 5
55)
(16,
71)%
(15,
82)%
Con
tract
ed S
ervi
ces
1 22
5 00
0
(1
00 0
00)
1 12
5 00
0
-
-
1
125
000
56 9
30
-
(1
068
070
)
(94,
94)%
(95,
35)%
Gra
nts
and
Sub
sidi
es P
aid
230
000
31
0 00
0
540
000
-
-
54
0 00
0
1 35
3 28
7
-
813
287
15
0,61
%48
8,39
%G
ener
al E
xpen
ses
9 56
3 00
0
2
867
000
12 4
30 0
00
-
-
12 4
30 0
00
9 93
3 22
6
-
(2 4
96 7
74)
(2
0,09
)%3,
87%
Loss
on
Dis
posa
l of I
nves
tmen
t Pro
perty
-
49
5 00
0
495
000
-
-
49
5 00
0
814
615
-
319
615
64
,57%
100,
00%
Tota
l Exp
endi
ture
45 2
98 0
00
4 25
9 00
0
49
557
000
-
-
49
557
000
45
913
625
-
(3 6
43 3
76)
-
Surp
lus/
(Def
icit)
(5 4
72 0
00)
(2
470
000
)
(7 9
42 0
00)
-
-
(7
942
000
)
(4 3
79 4
50)
-
3 56
2 55
0
(4
4,86
)%(1
9,97
)%
Surp
lus/
(Def
icit
for t
he Y
ear
(5 4
72 0
00)
(2
470
000
)
(7 9
42 0
00)
-
-
(7
942
000
)
(4 3
79 4
50)
-
3 56
2 55
0
-
Fina
ncia
l Per
form
ance
: Exp
lana
tion
of V
aria
nces
bet
wee
n A
ppro
ved
Bud
get a
nd A
ctua
l
Publ
ic C
ontr
ibut
ions
and
Don
atio
ns
Ren
tal o
f Fac
ilitie
s an
d Eq
uipm
ent:
Inte
rest
Ear
ned
- Ext
erna
l Inv
estm
ents
:
Oth
er In
com
e:
Impa
irmen
t Los
ses:
Rep
airs
and
Mai
nten
ance
:
Fina
nce
Cos
ts:
Con
trac
ted
Serv
ices
:
Gra
nts
and
Subs
idie
s Pa
id:
Gen
eral
Exp
ense
s:
Loss
on
Dis
posa
l of I
nves
tmen
t Pro
pert
y:Th
e M
unic
ipal
ity s
old
a nu
mbe
r of i
tem
s du
ring
the
year
and
was
unf
ortu
nate
ly n
ot a
ble
to g
ener
ate
the
budg
eted
pro
ceed
s fro
m th
ese
sale
s.
Var
ianc
e
Alth
ough
the
Mun
icip
ality
had
sig
nfic
ant d
ecre
ase
in th
eir C
ash
and
Cas
h E
quiv
alen
ts, t
he fu
nds
wer
e in
vest
ed in
Ter
m a
nd C
all D
epos
its, w
hich
gen
erat
ed m
ore
inco
me
than
bud
gete
d fo
r.
Due
to c
ost s
avin
g ex
erci
ses,
the
Mun
icip
ality
was
abl
e to
sav
e on
the
amou
nt o
f fun
ds s
pent
on
Con
tract
ed S
ervi
ces.
The
Mun
icip
ality
rece
ive
Don
taio
ns a
mou
ntin
g to
R4
300.
The
se w
ere
not b
udge
ted
for a
s th
ese
wer
e un
plan
ned
spon
sors
hips
.
A n
umbe
r of l
ease
con
tract
s w
ere
not v
alid
and
the
Mun
icip
ality
did
not
bud
get t
o ge
nera
te a
ny re
venu
e fro
m th
ese.
How
ever
, the
leas
ees
still
occu
pied
the
build
ings
and
they
wer
e ch
arge
d re
ntal
inco
me
on a
mon
th-to
-mon
th b
asis
.
Rea
sons
for V
aria
nces
gre
ater
than
10%
bet
wee
n A
ppro
ved
Bud
get a
nd A
ctua
l Am
ount
on
the
vario
us it
ems
disc
lose
d in
the
Sta
tem
ent o
f Fin
anci
al P
erfo
rman
ce a
re e
xpla
ined
bel
ow:
Des
crip
tion
Vire
men
t
Due
to c
ost s
avin
g ex
erci
ses,
the
Mun
icip
ality
was
abl
e to
sav
e on
the
amou
nt o
f fun
ds s
pent
on
Gen
eral
Exp
ense
s.
The
incr
ease
in th
e 20
15 E
xpen
ditu
re is
attr
ibut
ed to
R64
8 06
7 in
curre
d on
a H
ousi
ng Im
plem
enta
tion
Pla
n, w
hich
did
not
occ
ur in
the
prev
ious
fina
ncia
l yea
r.
No
spec
ific
reas
on e
xist
s fo
r the
unb
udge
ted
decr
ease
.
Due
to c
ost s
avin
g ex
erci
ses,
the
Mun
icip
ality
was
abl
e to
sav
e on
the
amou
nt o
f fun
ds s
pent
on
Rep
airs
and
Mai
nten
ance
.
Due
to c
ost s
avin
g ex
erci
ses,
the
Mun
icip
ality
was
abl
e to
sav
e on
the
amou
nt o
f fun
ds s
pent
on
Fina
nce
Cos
ts.
The
varia
nce
is a
ttrib
uted
to a
num
ber o
f Sha
red
Ser
vice
Deb
tors
that
can
not m
eet t
heir
finan
cial
resp
onsi
bilit
ies
and
wer
e su
bseq
uent
ly p
rovi
ded
for a
s po
tent
ial b
ad d
ebt.
21
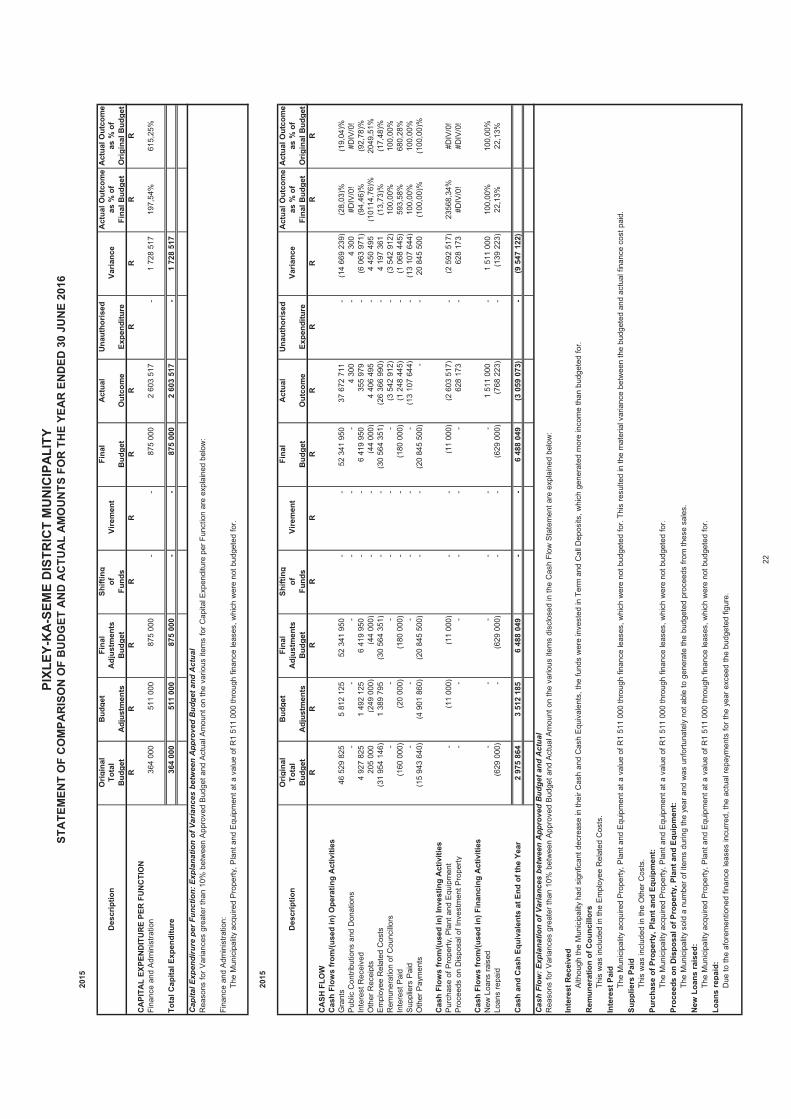
STA
TEM
ENT
OF
CO
MPA
RIS
ON
OF
BU
DG
ET A
ND
AC
TUA
L A
MO
UN
TS F
OR
TH
E YE
AR
EN
DED
30
JUN
E 20
16PI
XLEY
-KA-
SEM
E D
ISTR
ICT
MU
NIC
IPAL
ITY
2015
Orig
inal
Bud
get
Fina
lSh
iftin
gFi
nal
Act
ual
Una
utho
rised
Act
ual O
utco
me
Act
ual O
utco
me
Tota
lA
djus
tmen
tsof
as %
of
as %
of
Bud
get
Adj
ustm
ents
Bud
get
Fund
sB
udge
tO
utco
me
Expe
nditu
reFi
nal B
udge
tO
rigin
al B
udge
tR
RR
RR
RR
RR
RR
CA
PITA
L EX
PEN
DIT
UR
E PE
R F
UN
CTI
ON
Fina
nce
and
Adm
inis
tratio
n36
4 00
0
511
000
87
5 00
0
-
-
875
000
2
603
517
-
1
728
517
197,
54%
615,
25%
Tota
l Cap
ital E
xpen
ditu
re36
4 00
0
511
000
87
5 00
0
-
-
875
000
2
603
517
-
1
728
517
Cap
ital E
xpen
diru
re p
er F
unct
ion:
Exp
lana
tion
of V
aria
nces
bet
wee
n A
ppro
ved
Bud
get a
nd A
ctua
l
Fina
nce
and
Adm
inis
tratio
n:
2015
Orig
inal
Bud
get
Fina
lSh
iftin
gFi
nal
Act
ual
Una
utho
rised
Act
ual O
utco
me
Act
ual O
utco
me
Tota
lA
djus
tmen
tsof
as %
of
as %
of
Bud
get
Adj
ustm
ents
Bud
get
Fund
sB
udge
tO
utco
me
Expe
nditu
reFi
nal B
udge
tO
rigin
al B
udge
tR
RR
RR
RR
RR
RR
CA
SH F
LOW
Cas
h Fl
ows
from
/(use
d in
) Ope
ratin
g A
ctiv
ities
Gra
nts
46 5
29 8
25
5 81
2 12
5
52
341
950
-
-
52
341
950
37
672
711
-
(14
669
239)
(2
8,03
)%(1
9,04
)%P
ublic
Con
tribu
tions
and
Don
atio
ns-
-
-
-
-
-
4
300
-
4
300
#DIV
/0!
#DIV
/0!
Inte
rest
Rec
eive
d4
927
825
1 49
2 12
5
6
419
950
-
-
6 41
9 95
0
35
5 97
9
-
(6
063
971
)
(94,
46)%
(92,
78)%
Oth
er R
ecei
pts
205
000
(2
49 0
00)
(44
000)
-
-
(4
4 00
0)
4 40
6 49
5
-
4 45
0 49
5
(1
0114
,76)
%20
49,5
1%E
mpl
oyee
Rel
ated
Cos
ts(3
1 95
4 14
6)
1 38
9 79
5
(3
0 56
4 35
1)
-
-
(30
564
351)
(2
6 36
6 99
0)
-
4
197
361
(13,
73)%
(17,
48)%
Rem
uner
atio
n of
Cou
ncillo
rs-
-
-
-
-
-
(3
542
912
)
-
(3
542
912
)
100,
00%
100,
00%
Inte
rest
Pai
d(1
60 0
00)
(20
000)
(1
80 0
00)
-
-
(180
000
)
(1
248
445
)
-
(1
068
445
)
593,
58%
680,
28%
Sup
plie
rs P
aid
-
-
-
-
-
-
(13
107
644)
-
(13
107
644)
10
0,00
%10
0,00
%O
ther
Pay
men
ts(1
5 94
3 64
0)
(4 9
01 8
60)
(2
0 84
5 50
0)
-
-
(20
845
500)
-
-
20
845
500
(1
00,0
0)%
(100
,00)
%
Cas
h Fl
ows
from
/(use
d in
) Inv
estin
g A
ctiv
ities
Pur
chas
e of
Pro
perty
, Pla
nt a
nd E
quip
men
t-
(11
000)
(1
1 00
0)
-
-
(11
000)
(2
603
517
)
-
(2
592
517
)
2356
8,34
%#D
IV/0
!P
roce
eds
on D
ispo
sal o
f Inv
estm
ent P
rope
rty-
-
-
-
-
-
62
8 17
3
-
62
8 17
3
#DIV
/0!
#DIV
/0!
Cas
h Fl
ows
from
/(use
d in
) Fin
anci
ng A
ctiv
ities
New
Loa
ns ra
ised
-
-
-
-
-
-
1 51
1 00
0
-
1 51
1 00
0
10
0,00
%10
0,00
%Lo
ans
repa
id(6
29 0
00)
-
(6
29 0
00)
-
-
(629
000
)
(7
68 2
23)
-
(1
39 2
23)
22,1
3%22
,13%
Cas
h an
d C
ash
Equi
vale
nts
at E
nd o
f the
Yea
r2
975
864
3 51
2 18
5
6
488
049
-
-
6 48
8 04
9
(3
059
073
)
-
(9
547
122
)
(3 0
84 4
78)
C
ash
Flow
: Exp
lana
tion
of V
aria
nces
bet
wee
n A
ppro
ved
Bud
get a
nd A
ctua
l
Inte
rest
Rec
eive
d
Rem
uner
atio
n of
Cou
ncill
ors
Inte
rest
Pai
d
Supp
liers
Pai
d
Purc
hase
of P
rope
rty,
Pla
nt a
nd E
quip
men
t:
Proc
eeds
on
Dis
posa
l of P
rope
rty,
Pla
nt a
nd E
quip
men
t:
New
Loa
ns ra
ised
:
Loan
s re
paid
:
Vire
men
t V
aria
nce
Des
crip
tion
Rea
sons
for V
aria
nces
gre
ater
than
10%
bet
wee
n A
ppro
ved
Bud
get a
nd A
ctua
l Am
ount
on
the
vario
us it
ems
disc
lose
d in
the
Cas
h Fl
ow S
tate
men
t are
exp
lain
ed b
elow
:
The
Mun
icip
ality
acq
uire
d P
rope
rty, P
lant
and
Equ
ipm
ent a
t a v
alue
of R
1 51
1 00
0 th
roug
h fin
ance
leas
es, w
hich
wer
e no
t bud
gete
d fo
r. Th
is re
sulte
d in
the
mat
eria
l var
ianc
e be
twee
n th
e bu
dget
ed a
nd a
ctua
l fin
ance
cos
t pai
d.
Des
crip
tion
Vire
men
t V
aria
nce
The
Mun
icip
ality
acq
uire
d P
rope
rty, P
lant
and
Equ
ipm
ent a
t a v
alue
of R
1 51
1 00
0 th
roug
h fin
ance
leas
es, w
hich
wer
e no
t bud
gete
d fo
r.
The
Mun
icip
ality
sol
d a
num
ber o
f ite
ms
durin
g th
e ye
ar a
nd w
as u
nfor
tuna
tely
not
abl
e to
gen
erat
e th
e bu
dget
ed p
roce
eds
from
thes
e sa
les.
The
Mun
icip
ality
acq
uire
d P
rope
rty, P
lant
and
Equ
ipm
ent a
t a v
alue
of R
1 51
1 00
0 th
roug
h fin
ance
leas
es, w
hich
wer
e no
t bud
gete
d fo
r.
Rea
sons
for V
aria
nces
gre
ater
than
10%
bet
wee
n A
ppro
ved
Bud
get a
nd A
ctua
l Am
ount
on
the
vario
us it
ems
for C
apita
l Exp
endi
ture
per
Fun
ctio
n ar
e ex
plai
ned
belo
w:
This
was
incl
uded
in th
e O
ther
Cos
ts.
The
Mun
icip
ality
acq
uire
d P
rope
rty, P
lant
and
Equ
ipm
ent a
t a v
alue
of R
1 51
1 00
0 th
roug
h fin
ance
leas
es, w
hich
wer
e no
t bud
gete
d fo
r.
Due
to th
e af
orem
entio
ned
finan
ce le
ases
incu
rred,
the
actu
al re
paym
ents
for t
he y
ear e
xcee
d th
e bu
dget
ed fi
gure
.
Alth
ough
the
Mun
icip
ality
had
sig
nfic
ant d
ecre
ase
in th
eir C
ash
and
Cas
h E
quiv
alen
ts, t
he fu
nds
wer
e in
vest
ed in
Ter
m a
nd C
all D
epos
its, w
hich
gen
erat
ed m
ore
inco
me
than
bud
gete
d fo
r.
This
was
incl
uded
in th
e E
mpl
oyee
Rel
ated
Cos
ts.
22
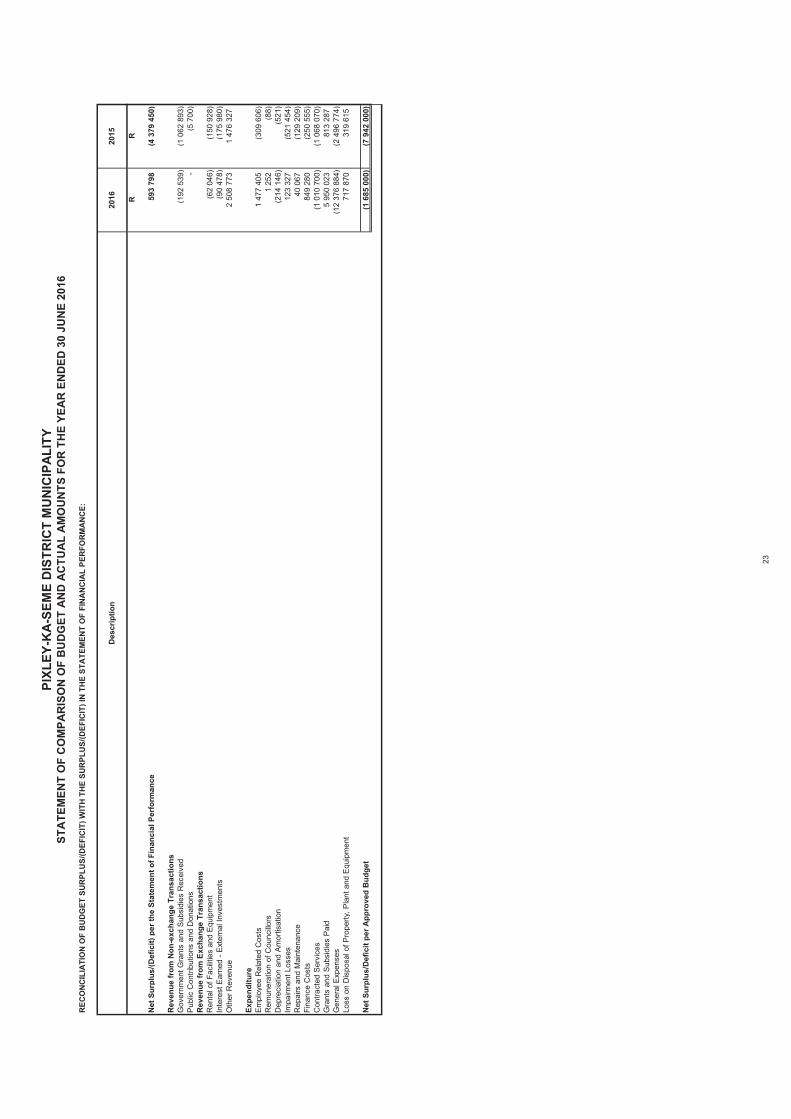
STA
TEM
ENT
OF
CO
MPA
RIS
ON
OF
BU
DG
ET A
ND
AC
TUA
L A
MO
UN
TS F
OR
TH
E YE
AR
EN
DED
30
JUN
E 20
16PI
XLEY
-KA-
SEM
E D
ISTR
ICT
MU
NIC
IPAL
ITY
REC
ON
CIL
IATI
ON
OF
BU
DG
ET S
UR
PLU
S/(D
EFIC
IT) W
ITH
TH
E SU
RPL
US/
(DEF
ICIT
) IN
TH
E ST
ATE
MEN
T O
F FI
NA
NC
IAL
PER
FOR
MA
NC
E:
RR
Net
Sur
plus
/(Def
icit)
per
the
Stat
emen
t of F
inan
cial
Per
form
ance
593
798
(4
379
450
)
Rev
enue
from
Non
-exc
hang
e Tr
ansa
ctio
nsG
over
nmen
t Gra
nts
and
Sub
sidi
es R
ecei
ved
(192
539
)
(1
062
893
)
Pub
lic C
ontri
butio
ns a
nd D
onat
ions
-
(5 7
00)
R
even
ue fr
om E
xcha
nge
Tran
sact
ions
Ren
tal o
f Fac
ilitie
s an
d E
quip
men
t(6
2 04
6)
(150
928
)
In
tere
st E
arne
d - E
xter
nal I
nves
tmen
ts(9
0 47
8)
(175
980
)
O
ther
Rev
enue
2 50
8 77
3
1
476
327
Expe
nditu
reE
mpl
oyee
Rel
ated
Cos
ts1
477
405
(309
606
)
R
emun
erat
ion
of C
ounc
illors
1 25
2
(8
8)
Dep
reci
atio
n an
d A
mor
tisat
ion
(214
146
)
(5
21)
Impa
irmen
t Los
ses
123
327
(5
21 4
54)
Rep
airs
and
Mai
nten
ance
40 0
67
(129
209
)
Fi
nanc
e C
osts
849
280
(2
50 5
55)
Con
tract
ed S
ervi
ces
(1 0
10 7
00)
(1
068
070
)
Gra
nts
and
Sub
sidi
es P
aid
5 95
0 02
3
81
3 28
7
Gen
eral
Exp
ense
s (1
2 37
6 88
4)
(2 4
96 7
74)
Lo
ss o
n D
ispo
sal o
f Pro
perty
, Pla
nt a
nd E
quip
men
t71
7 87
0
319
615
Net
Sur
plus
/Def
icit
per A
ppro
ved
Bud
get
(1 6
85 0
00)
(7
942
000
)
Des
crip
tion
2015
2016
23
1.
1.1 Changes In Accounting Policy And Comparability
Accounting Policy 8.2 on Revenue from Exchange Transactions and Accounting Policy 8.3 on Revenue from Non-exchangeTransactions describes the conditions under which revenue will be recorded by the management of the Municipality.
Accounting Policies have been consistently applied, except where otherwise indicated below:
For the years ended 30 June 2016 and 30 June 2015, the Municipality has adopted the accounting framework as set out inpoint 1 above. The details of any resulting changes in accounting policy and comparative restatements are set out below.
The Municipality changes an Accounting Policy only in the following instances:(a) if it is required by a Standard of GRAP; or(b) when it results in the financial statements providing reliable and more relevant information about the effects of transactions,other events or conditions on the entity’s financial position, financial performance or cash flow.
1.2 Critical Judgements, Estimations And Assumptions
PIXLEY-KA-SEME DISTRICT MUNICIPALITY
ACCOUNTING POLICIES TO THE ANNUAL FINANCIAL STATEMENTSFOR THE YEAR ENDED 30 JUNE 2016
The Annual Financial Statements have been prepared on an accrual basis of accounting and are in accordance with thehistorical cost convention, except where indicated otherwise.
The financial statements have been prepared in accordance with the effective Standards of Generally Recognised AccountingPractices (GRAP), as approved by the Minister of Finance, including any interpretations, guidelines and directives issued by theAccounting Standards Board and the Municipal Finance Management Act, 2003 (Act No. 56 of 2003).
BASIS OF PRESENTATION
In making their judgement, management considered the detailed criteria for the recognition of revenue as set out in GRAP 9:Revenue from Exchange Transactions and GRAP 23: Revenue from non-exchange transactions. In particular, whether theMunicipality, when goods are sold, had transferred to the buyer the significant risks and rewards of ownership of the goods andwhen services is rendered, whether the service has been rendered. Also of importance is the estimation process involved ininitially measuring revenue at the fair value thereof. Management of the Municipality is satisfied that recognition of the revenuein the current year is appropriate.
In the application of the Municipality's accounting policies, which are described below, management is required to makejudgements, estimates and assumptions about the carrying amounts of assets and liabilities that are not readily apparent fromother sources. The estimates and associated assumptions are based on historical experience and other factors that areconsidered to be reasonable under the circumstances, the results of which form the basis of making the judgements aboutcarrying values of assets and liabilities that are not readily apparent from other sources. Actual results may differ from theseestimates.
The classification of financial assets and liabilities, into categories, is based on judgement by management. Accounting Policy7.1 on Financial Assets Classification and Accounting Policy 7.2 on Financial Liabilities Classification describe the factors andcriteria considered by the management of the Municipality in the classification of financial assets and liabilities.
1.2.1 Revenue Recognition
1.2.2 Financial assets and liabilities
These estimates and underlying assumptions are reviewed on an ongoing basis. Revisions to accounting estimates arerecognised in the period in which the estimate is revised if the revision affects only that period, or in the period of the revisionand future periods if the revision affects both current and future periods.
The following are the critical judgements and estimations that management have made in the process of applying theMunicipality’s Accounting Policies and that have the most significant effect on the amounts recognised in Annual FinancialStatements:
In making the above-mentioned judgement, management considered the definition and recognition criteria for the classificationof financial instruments as set out in GRAP 104: Financial Instruments .
24
PIXLEY-KA-SEME DISTRICT MUNICIPALITY
ACCOUNTING POLICIES TO THE ANNUAL FINANCIAL STATEMENTSFOR THE YEAR ENDED 30 JUNE 2016
1.
Accounting Policy 6 on Impairment of assets describes the conditions under which non-financial assets are tested for potentialimpairment losses by the management of the Municipality. Significant estimates and judgements are made relating to property,plant and equipment impairment testing and Intangible assets impairment testing.
1.2.3 Impairment of Financial Assets
BASIS OF PRESENTATION (continued)
1.2.6 Defined Benefit Plan Liabilities
Deviations between budget and actual amounts are regarded as material differences when a 10% deviation exists. All materialdifferences are explained in the notes to the annual financial statements.
The Annual Financial Statements are presented in South African Rand, rounded off to the nearest Rand, which is theMunicipality's functional currency.
The Annual Financial Statements have been prepared on a going concern basis.
1.2.4 Useful lives of Property, Plant and Equipment, Intangible Assets and Investment Property
As described in Accounting Policy 10, the Municipality obtains actuarial valuations of its defined benefit plan liabilities. Thedefined benefit obligations of the Municipality that were identified are Post-retirement Health Benefit Obligations. The estimatedliabilities are recorded in accordance with the requirements of GRAP 25. Details of the liabilities and the key assumptions madeby the actuaries in estimating the liabilities are provided in Note 13 to the Annual Financial Statements.
In making the above-mentioned estimates and judgement, management considered the subsequent measurement criteria andindicators of potential impairment losses as set out in GRAP 21: Impairment of non-Cash generating Assets and GRAP 26:Impairment of Cash generating Assets. In particular, the calculation of the recoverable service amount for PPE and intangibleassets involves significant judgment by management. During the year the estimated impairments to property, plant andequipment made are disclosed in note 6 to the AFS, whilst no impairments were made to intangible assets.
Accounting Policy 7.4 on Impairment of Financial Assets describes the process followed to determine the value at whichfinancial assets should be impaired. In making the estimation of the impairment, the management of the Municipalityconsidered the detailed criteria of impairment of financial assets as set out in GRAP 104: Financial Instruments and used itsjudgement to select a variety of methods and make assumptions that are mainly based on market conditions existing at the endof the reporting period. The management of the Municipality is satisfied that the impairment of financial assets recorded duringthe year is appropriate.
The calculation in respect of the impairment of debtors is based on an assessment of the extent to which debtors havedefaulted on payments already due, and an assessment of their ability to make payments based on their creditworthiness. Thiswas performed per service-identifiable categories across all classes of debtors. The total increase in estimation of theimpairment of trade and other receivables from exchange transactions is disclosed in note 2 to the AFS.
As described in Accounting Policies 3.3, 4.2 and 5.2 the Municipality depreciates its property, plant and equipment andinvestment property, and amortises it's intangible assets over the estimated useful lives of the assets, taking into account theresidual values of the assets at the end of their useful lives, which is determined when the assets are available for use. Theuseful lives of assets are based on management’s estimation. Management considered the impact of technology, availability ofcapital funding, service requirements and required return on assets in order to determine the optimum useful life expectation,where appropriate.
The estimation of residual values of assets is based on management’s judgement as to whether the assets will be sold or usedto the end of their useful lives, and in what condition they will be at that time.
1.2.5 Impairment: Write down of Property, Plant and Equipment, Investment Property and Intangible Assets
Assets, liabilities, revenues and expenses have not been offset except when offsetting is required or permitted by a Standard ofGRAP.
1.2.8 Budget information
1.3 Presentation Currency
1.4 Going Concern Assumption
1.5 Offsetting
25
PIXLEY-KA-SEME DISTRICT MUNICIPALITY
ACCOUNTING POLICIES TO THE ANNUAL FINANCIAL STATEMENTSFOR THE YEAR ENDED 30 JUNE 2016
1.
2.
2.1
3.
BASIS OF PRESENTATION (continued)
GRAP 20 Related Party Disclosures (Revised)GRAP 32 Service Concession Arrangement Grantor
GRAP 18 Segment Reporting - issued March 2005
1.6 Standards, Amendments to Standards and Interpretations issued but not yet Effective
The following GRAP standards have been issued but are not yet effective and have not been early adopted by the Municipality:
The ASB Directive 5 paragraph 29 sets out the principles for the application of the GRAP 3 guidelines in the determination ofthe GRAP Reporting Framework hierarchy, as set out in the standard of GRAP 3 on Accounting Policies, Changes inAccounting Estimates and Errors.
Where a standard of GRAP is approved as effective, it replaces the equivalent statement of International Public SectorAccounting Standards Board, International Financial Reporting Standards or Generally Accepted Accounting Principles. Wherea standard of GRAP has been issued, but is not yet in effect, an entity may select to apply the principles established in thatstandard in developing an appropriate accounting policy dealing with a particular section or event before applying paragraph .12of the Standard of GRAP on Accounting Policies, Changes in Accounting Estimates and Errors.
GRAP 107 Mergers - issued November 2010
3.1 Initial Recognition
Accumulated Surplus
The Municipality applied the principles established in the following Standards of GRAP that have been issued, but is not yet ineffect, in developing an appropriate accounting policies dealing with the following transactions, but have not early adopted theseStandards:
Management has considered all of the above-mentioned GRAP standards issued but not yet effective and anticipates that theadoption of these standards will not have a significant impact on the financial position, financial performance or cash flows ofthe Municipality.
GRAP 105 Transfers between entities under common control - issued November 2010GRAP 106 Transfers between entities not under common control - issued November 2010
NETT ASSETS
Included in the nett assets of the Municipality, are the following reserves that are maintained in terms of specific requirements:
The Municipality creates and maintains reserves which form part of the Accumulated Surplus in terms of specific requirements.
GRAP 108 Statutory Receivables
The Minister of Finance announced that the application of GRAP 25 for period starting after 1 April 2013. All other standards aslisted above will only be effective when a date is announced by the Minister of Finance.
PROPERTY, PLANT AND EQUIPMENT
Property, plant and equipment are tangible non-current assets that are held for use in the production or supply of goods orservices, rental to others, or for administrative purposes, and are expected to be used during more than one year.
The cost of an item of property, plant and equipment is recognised as an asset if, and only if it is probable that future economicbenefits or service potential associated with the item will flow to the Municipality, and if the cost or fair value of the item can bemeasured reliably.
26
PIXLEY-KA-SEME DISTRICT MUNICIPALITY
ACCOUNTING POLICIES TO THE ANNUAL FINANCIAL STATEMENTSFOR THE YEAR ENDED 30 JUNE 2016
3.
Years30 - 100
5 - 205 - 103 - 77 - 10
PROPERTY, PLANT AND EQUIPMENT (continued)
OtherSpecialist VehiclesOther Vehicles
Subsequently all property plant and equipment are measured at cost, less accumulated depreciation and accumulatedimpairment losses.
Compensation from third parties for items of property, plant and equipment that were impaired, lost or given up is included inthe Statement of Financial Performance when the compensation becomes receivable.
Land is not depreciated as it is regarded as having an unlimited life. Depreciation on assets other than land is calculated oncost, using the straight line method, to allocate their cost or revalued amounts to their residual values over the estimated usefullives of the assets. The depreciation method used reflects the pattern in which the asset’s future economic benefits or servicepotential are expected to be consumed by the Municipality. Each part of an item of property, plant and equipment with a costthat is significant in relation to the total cost of the item shall be depreciated separately. The depreciation rates are based on thefollowing estimated useful lives.
3.2 Subsequent Measurement
Office Equipment
Property, plant and equipment are initially recognised at cost on its acquisition date or in the case of assets acquired by grant ordonation, deemed cost, being the fair value of the asset on initial recognition. The cost of an item of property, plant andequipment is the purchase price and other costs attributable to bring the asset to the location and condition necessary for it tobe capable of operating in the manner intended by the Municipality. Trade discounts and rebates are deducted in arriving at thecost. The cost also includes the necessary costs of dismantling and removing the asset and restoring the site on which it islocated.
When significant components of an item of property, plant and equipment have different useful lives, they are accounted for asseparate items (major components) of property, plant and equipment.
Where an asset is acquired by the Municipality for no or nominal consideration (i.e. a non-exchange transaction), the cost isdeemed to be equal to the fair value of that asset on the date acquired.
The cost of an item of property, plant and equipment acquired in exchange for a non-monetary assets or monetary assets, or acombination of monetary and non-monetary assets is measured at the fair value of the asset given up, unless the fair value ofthe asset received is more clearly evident. If the acquired item could not be measured at its fair value, its cost is measured atthe carrying amount of the asset given up.
Major spare parts and servicing equipment qualify as property, plant and equipment when the Municipality expects to use themduring more than one period. Similarly, if the major spare parts and servicing equipment can be used only in connection with anitem of property, plant and equipment, they are accounted for as property, plant and equipment.
Subsequent expenditure relating to property, plant and equipment is capitalised if it is probable that future economic benefits orpotential service delivery associated with the subsequent expenditure will flow to the entity and the cost or fair value of thesubsequent expenditure can be reliably measured. Subsequent expenditure incurred on an asset is only capitalised when itincreases the capacity or future economic benefits associated with the asset. Where the Municipality replaces parts of an asset,it derecognises the part of the asset being replaced and capitalises the new component.
Depreciation only commences when the asset is available for use, unless stated otherwise.
Buildings
3.3 Depreciation
The assets’ residual values, estimated useful lives and depreciation method are reviewed annually, and adjusted prospectively ifappropriate, at each reporting date.
Furniture and Fittings
27
PIXLEY-KA-SEME DISTRICT MUNICIPALITY
ACCOUNTING POLICIES TO THE ANNUAL FINANCIAL STATEMENTSFOR THE YEAR ENDED 30 JUNE 2016
4.
4.
▪▪▪▪▪
▪
3.4 Incomplete Construction Work
INTANGIBLE ASSETS (continued)
Land is not depreciated as it is deemed to have an indefinite useful life.
The carrying amount of an item of property, plant and equipment is derecognised on disposal, or when no future economicbenefits or service potential are expected from its use or disposal.
The gain or loss arising from the derecognition of an item of property, plant and equipment is included in the Statement ofFinancial Performance when the item is derecognised.
Gains or losses are calculated as the difference between the carrying value of assets (cost less accumulated depreciation andaccumulated impairment losses) and the disposal proceeds is included in the Statement of Financial Performance as a gain orloss on disposal of property, plant and equipment.
3.5 Finance Leases
the expenditure attributable to the intangible asset during its development can be reliably measured.
Internally generated intangible assets are subject to strict recognition criteria before they are capitalised. Research expenditureis recognised as an expense as it is incurred. Costs incurred on development projects (relating to the design and testing of newor improved products) are recognised as intangible assets when the following criteria are fulfilled:
adequate technical, financial and other resources to complete the development and to use or sell the intangible asset areavailable; and
Other development expenditures that do not meet these criteria are recognised as an expense as incurred. Development costspreviously recognised as an expense are not recognised as an asset in a subsequent period. Capitalised development costsare recorded as intangible assets and amortised from the point at which the asset is available for use. Development assets aretested for impairment annually, in accordance with GRAP 21 or GRAP 26.
it can be demonstrated how the intangible asset will generate probable future economic benefits;there is an ability to use or sell the intangible asset;
Reviewing the useful life of an asset on an annual basis does not require the entity to amend the previous estimate unlessexpectations differ from the previous estimate.
Incomplete construction work is stated at historical cost. Depreciation only commences when the asset is available for use.
Assets capitalised under finance leases are depreciated over their expected useful lives on the same basis as PPE controlledby the entity or where shorter, the term of the relevant lease if there is no reasonable certainty that the Municipality will obtainownership by the end of the lease term.
INTANGIBLE ASSETS
Identifiable non–monetary assets without physical substance are classified and recognised as intangible assets. TheMunicipality recognises an intangible asset in its Statement of Financial Position only when it is probable that the expectedfuture economic benefits or service potential that are attributable to the asset will flow to the Municipality and the cost or fairvalue of the asset can be measured reliably.
3.6 Land
3.7 Derecognition of property, plant and equipment
4.1 Initial Recognition
it is technically feasible to complete the intangible asset so that it will be available for use;management intends to complete the intangible asset and use or sell it;
28
PIXLEY-KA-SEME DISTRICT MUNICIPALITY
ACCOUNTING POLICIES TO THE ANNUAL FINANCIAL STATEMENTSFOR THE YEAR ENDED 30 JUNE 2016
Years3
5.
The estimated useful life, residual values and amortisation method are reviewed annually at the end of the financial year. Anyadjustments arising from the annual review are applied prospectively as a change in accounting estimate in the Statement ofFinancial Performance.
Intangible assets are derecognised when the asset is disposed of or when there are no further economic benefits or servicepotential expected from the use of the asset. The gain or loss arising on the disposal or retirement of an intangible asset isdetermined as the difference between the net disposals proceeds and the carrying value and is recognised in the Statement ofFinancial Performance.
The Municipality changed its accounting policy from GRAP 102 to GRAP 31 with no effect on the financial information disclosedpreviously.
INVESTMENT PROPERTY
Investment property includes property (land or a building, or part of a building, or both land and buildings held under a financelease) held to earn rentals and/or for capital appreciation, rather than held to meet service delivery objectives, the production orsupply of goods or services, or the sale of an asset in the ordinary course of operations.
4.2 Subsequent Measurement, Amortisation and Impairment
Expenditure on an intangible item that was initially recognised as an expense shall not be recognised as part of the cost of anintangible asset at a later date.
In terms of GRAP 31, intangible assets are distinguished between internally generated intangible assets and other intangibleassets. It is further distinguished between indefinite or finite useful lives. Amortisation is charged on a straight-line basis overthe intangible assets' useful lives (when the intangible asset is available for use), the residual value of assets with finite usefullives is zero, unless an active market exists. Where intangible assets are deemed to have an indefinite useful life, suchintangible assets are not amortised, however such intangible assets are subject to an annual impairment test. The useful livesper category of intangible assets are detailed below:
At initial recognition, the Municipality measures investment property at cost including transaction costs once it meets thedefinition of investment property. However, where an investment property was acquired through a non-exchange transaction(i.e. where it acquired the investment property for no or a nominal value), its cost is its fair value as at the date of acquisition.
4.3 Derecognition
5.1 Initial Recognition
Intangible assets are initially recognised at cost. The cost of an intangible asset is the purchase price and other costsattributable to bring the intangible asset to the location and condition necessary for it to be capable of operating in the mannerintended by the Municipality, or where an intangible asset is acquired at no cost, or for a nominal cost, the cost shall be its fairvalue as at the date of acquisition. Trade discounts and rebates are deducted in arriving at the cost. The cost of an intangibleasset acquired in exchange for a non-monetary assets or monetary assets, or a combination of monetary and non-monetaryassets is measured at the fair value of the asset given up, unless the fair value of the asset received is more clearly evident. Ifthe acquired item could not be measured at its fair value, its cost is measured at the carrying amount of the asset given up. Ifthe acquired item's fair value was not determinable, it's deemed cost is the carrying amount of the asset(s) given up.
After initial recognition, intangible assets are carried at its cost less any accumulated amortisation and any accumulatedimpairment losses.
After initial recognition, intangible assets are carried at a revalued amount, being its fair value at the date of the revaluation lessany subsequent accumulated amortisation and any subsequent accumulated impairment losses. If the intangible asset’scarrying amount is increased as a result of a revaluation, the increase is credited directly to the revaluation surplus. However,the increase is recognised in the Statement of Financial Performance to the extent that it reverses a revaluation decrease of thesame intangible asset previously recognised in the Statement of Financial Performance.
Intangible assetSoftware
Intangible assets are annually tested for impairment, including intangible assets not yet available for use, as per AccountingPolicy 8: Impairment of assets . Where items of intangible assets have been impaired, the carrying value is adjusted by theimpairment loss, which is recognised as an expense in the period that the impairment is identified except where the impairmentreverses a previous revaluation. The impairment loss is the difference between the carrying amount and the recoverableamount.
29
PIXLEY-KA-SEME DISTRICT MUNICIPALITY
ACCOUNTING POLICIES TO THE ANNUAL FINANCIAL STATEMENTSFOR THE YEAR ENDED 30 JUNE 2016
▪
▪
▪
▪
▪
6.
The cost of self-constructed investment property is the cost at date of completion.
Based on management's judgement, the following criteria have been applied to distinguish investment properties from owneroccupied property or property held for resale:
All properties held to earn market-related rentals or for capital appreciation or both and that are not used for administrativepurposes and that will not be sold within the next 12 months are classified as Investment Properties;
An investment property shall be derecognised (eliminated from the Statement of Financial Position) on disposal or when theinvestment property is permanently withdrawn from use and no future economic benefits or service potential are expected fromits disposal.
The entity classifies all assets held with the primary objective of generating a commercial return as cash-generating assets. Allother assets are classified as non-cash-generating assets.
IMPAIRMENT OF ASSETS
Land held for a currently undetermined future use. (If the Municipality has not determined that it will use the land as owner-occupied property or for short-term sale in the ordinary course of business, the land is regarded as held for capitalappreciation);A building owned by the entity (or held by the entity under a finance lease) and leased out under one or more operatingleases (this will include the property portfolio rented out by the Housing Board on a commercial basis on behalf of theMunicipality);A building that is vacant but is held to be leased out under one or more operating leases on a commercial basis to externalparties; and
The best evidence of fair value less cost to sell is the price in a binding sale agreement in an arm's length transaction, adjustedfor the incremental cost that would be directly attributable to the disposal of the asset.
Value in use of a cash-generating asset is the present value of the estimated future cash flows expected to be derived from thecontinuing use of an asset and from its disposal at the end of its useful life.
If the recoverable amount of an asset is less than its carrying amount, the carrying amount of the asset is reduced to itsrecoverable amount. That reduction is an impairment loss.
An impairment loss of assets carried at cost less any accumulated depreciation or amortisation is recognised immediately in theStatement of Financial Performance.
An impairment of assets carried at revalued amount in reduces the revaluation surplus for that asset. The decreaseshall be debited directly to a revaluation surplus to the extent of any credit balance existing in the revaluation surplus in respectof that asset.
Property that is being constructed or developed for future use as investment property;
5.2 Subsequent Measurement - Fair Value Model
5.3 Derecognition
Investment property is measured using the fair value model. Investment property is carried at fair value, representing openmarket value determined by external valuers at the date of the last general valuation. Fair value is based on active marketprices, adjusted, if necessary, for any difference in the nature, location or condition of the specific asset. A gain or loss arisingfrom a change in the fair value of investment property is included in the Statement of Financial Performance for the period inwhich it arises.
The Municipality assesses at each reporting date whether there is any indication that an asset may be impaired. If any suchindication exists, the Municipality estimates the recoverable amount of the individual asset.
If there is any indication that an asset may be impaired, the recoverable amount is estimated for the individual asset. If it is notpossible to estimate the recoverable amount of the individual asset, the recoverable amount of the cash-generating unit towhich the asset belongs is determined.
The recoverable amount of an asset or a cash-generating unit is the higher of its fair value less costs to sell and its value in use.
6.1 Impairment of Cash generating assets
30
PIXLEY-KA-SEME DISTRICT MUNICIPALITY
ACCOUNTING POLICIES TO THE ANNUAL FINANCIAL STATEMENTSFOR THE YEAR ENDED 30 JUNE 2016
7.
The Municipality assesses at each reporting date whether there is any indication that an asset may be impaired. If any suchindication exists, the Municipality estimates the recoverable service amount of the asset.
If there is any indication that an asset may be impaired, the recoverable service amount is estimated for the individual asset. Ifit is not possible to estimate the recoverable service amount of the individual asset, the recoverable service amount of the cash-generating unit to which the asset belongs is determined.
The recoverable service amount is the higher of a non-cash generating asset's fair value less costs to sell and its value in use.
An impairment loss is recognised for cash-generating units if the recoverable amount of the unit is less than the carryingamount of the unit. The impairment loss is allocated to reduce the carrying amount of the assets of the unit, pro rata on thebasis of the carrying amount of each asset in the unit.
The value in use for a non-cash generating asset is the present value of the asset’s remaining service potential.
Fair value less costs to sell is the amount obtainable from the sale of an asset in an arm’s length transaction betweenknowledgeable, willing parties, less the costs of disposal.
If the recoverable service amount of an asset is less than its carrying amount, the carrying amount of the asset is reduced to itsrecoverable service amount. That reduction is an impairment loss.
An impairment loss of assets carried at cost less any accumulated depreciation or amortisation is recognised immediately in theStatement of Financial Performance. Any impairment loss of a revalued asset is treated as a revaluation decrease.
An impairment loss is recognised for non-cash generating units if the recoverable service amount of the unit is less than thecarrying amount of the unit. The impairment loss is allocated to reduce the carrying amount of the assets of the unit as follows:(i) to the assets of the unit, pro rata on the basis of the carrying amount of each asset in the unit.
A Municipality assesses at each reporting date whether there is any indication that an impairment loss recognised in priorperiods for assets may no longer exist or may have decreased. If any such indication exists, the recoverable service amounts ofthose assets are estimated.
The increased carrying amount of an asset attributable to a reversal of an impairment loss does not exceed the carrying amountthat would have been determined had no impairment loss been recognised for the asset in prior periods.
A reversal of an impairment loss of assets carried at cost less accumulated depreciation or amortisation is recognisedimmediately in the Statement of Financial Performance. Any reversal of an impairment loss of a revalued asset is treated as arevaluation increase.
The Municipality has various types of financial instruments and these can be broadly categorised as either financial assets,financial liabilities or residual interests in accordance with the substance of the contractual agreement. The Municipality onlyrecognises a financial instrument when it becomes a party to the contractual provisions of the instrument.
Initial recognition
Financial assets and financial liabilities are recognised on the entity's Statement of Financial Position when the entity becomesparty to the contractual provisions of the instrument
The Entity does not offset a financial asset and a financial liability unless a legally enforceable right to set off the recognisedamounts currently exist; and the entity intends either to settle on a net basis, or to realise the asset and settle the liabilitysimultaneously.
FINANCIAL INSTRUMENTS
6.2 Impairment of Non-Cash generating assets
A Municipality assesses at each reporting date whether there is any indication that an impairment loss recognised in priorperiods for assets may no longer exist or may have decreased. If any such indication exists, the recoverable amounts of thoseassets are estimated.
The increased carrying amount of an asset attributable to a reversal of an impairment loss does not exceed the carrying amountthat would have been determined had no impairment loss been recognised for the asset in prior periods.
A reversal of an impairment loss of assets carried at cost less accumulated depreciation or amortisation is recognisedimmediately in the Statement of Financial Performance.
31
PIXLEY-KA-SEME DISTRICT MUNICIPALITY
ACCOUNTING POLICIES TO THE ANNUAL FINANCIAL STATEMENTSFOR THE YEAR ENDED 30 JUNE 2016
7.
(i)(ii)(iii)
FINANCIAL INSTRUMENTS (continued)
A financial asset is any asset that is cash, a contractual right to receive cash or another financial asset from another entity.
Long term Liabilities Financial liability at amortised cost Other Creditors Financial liability at amortised cost
Investments in Fixed Deposits Financial asset at amortised cost
Cash includes cash on hand (including petty cash) and cash with banks (including call deposits). Cash equivalents are short-term highly liquid investments, readily convertible into known amounts of cash that are held with registered banking institutionswith maturities of three months or less and are subject to an insignificant risk of change in value. For the purposes of the cashflow statement, cash and cash equivalents comprise cash on hand, deposits held on call with banks, net of bank overdrafts. TheMunicipality categorises cash and cash equivalents as financial assets: Financial asset at amortised cost.
A financial liability is a contractual obligation to deliver cash or another financial asset to another entity.
There are three main categories of Financial Liabilities , the classification determining how they are measured. Financialliabilities may be measured at:
The Municipality has the following types of financial liabilities as reflected on the face of the Statement of Financial Position or inthe notes thereto:
Type of Financial Liabilities Classification in terms of GRAP 104
7.1 Financial Assets - Classification
Type of Financial Asset
Financial liabilities that are measured at fair value financial liabilities that are essentially held for trading (i.e. purchased with theintention to sell or repurchase in the short term; derivatives other than hedging instruments or are part of a portfolio of financialinstruments where there is recent actual evidence of short-term profiteering or are derivatives).
Other Debtors Financial asset at amortised cost
In accordance with GRAP 104 the Financial Assets of the Municipality are classified as follows into the three categories allowedby this standard: - Financial Asset at fair value - Financial Asset at fair amortised cost - Financial Asset at cost
Financial asset at amortised cost are non-derivative financial assets with fixed or determinable payments that are not quoted inan active market. They are included in current assets, except for maturities greater than 12 months, which are classified as non-current assets. Financial asset at amortised cost are initially recognised at fair value plus transaction costs that are directlyattributable to the acquisition or issue of the financial asset. After initial recognition Financial Assets are measured at amortisedcost, using the effective interest rate method less a provision for impairment.
Financial assets measured at fair value are financial assets that meet either of the following conditions:(a) derivatives;(b) combined instruments that are designated at fair value(c) instruments held for trading. (d) non-derivative financial assets or financial liabilities with fixed or determinable payments that are designated at fair value atinitial recognition; or(e) financial instruments that do not meet the definition of financial instruments at amortised cost or financial instruments atcost.
Financial assets measured at cost are investments in residual interests that do not have a quoted market price in an activemarket, and whose fair value cannot be reliably measured.
The Municipality has the following types of financial assets as reflected on the face of the Statement of Financial Position or inthe notes thereto:
Classification in terms of GRAP 104
Current portion of Long-Term Liabilities Financial liability at amortised cost
7.2 Financial Liabilities - Classification
Financial liabilities measured at fair value orFinancial liabilities measured at amortised costFinancial liabilities measured at cost
Bank Balances and Cash Financial asset at amortised cost
32
PIXLEY-KA-SEME DISTRICT MUNICIPALITY
ACCOUNTING POLICIES TO THE ANNUAL FINANCIAL STATEMENTSFOR THE YEAR ENDED 30 JUNE 2016
7.
Prepayments are carried at cost less any accumulated impairment losses.
Financial Liabilities measured at amortised cost
Any other financial liabilities are classified as "Other financial liabilities" (All payables, loans and borrowings are classified asother liabilities) and are initially measured at fair value, net of transaction costs. Trade and other payables, interest bearing debtincluding finance lease liabilities, non-interest bearing debt and bank borrowings are subsequently measured at amortised costusing the effective interest rate method. Interest expense is recognised in the Statement of Financial Performance by applyingthe effective interest rate.
Bank borrowings, consisting of interest-bearing short-term bank loans, repayable on demand and overdrafts are recorded at theproceeds received. Finance costs are accounted for using the accrual basis and are added to the carrying amount of the bankborrowing to the extent that they are not settled in the period that they arise.
7.3.2 Financial Liabilities:
Bank overdrafts are recorded based on the facility utilised. Finance charges on bank overdrafts are expensed as incurred.
Financial asset at amortised cost are initially measured at fair value plus transaction costs that are directly attributable to theacquisition or issue of the financial asset. Subsequently, these assets are measured at amortised cost using the EffectiveInterest Method less any impairment, with interest recognised on an effective yield basis.
Trade and other receivables (excluding Value Added Taxation, prepayments and operating lease receivables), loans toMunicipality entities and loans that have fixed and determinable payments that are not quoted in an active market are classifiedas Financial asset at amortised cost.
Financial Assets measured at fair value are initially measured at fair value excluding directly attributable transaction costs. Theyare subsequently measured at fair value with unrealised gains or losses recognised directly in the Statement of FinancialPerformance.
7.3 Initial and Subsequent Measurement
7.3.1 Financial Assets:
FINANCIAL INSTRUMENTS (continued)
Fair value methods and assumptions
The fair values of financial instruments are determined as follows:
The fair values of quoted investments are based on current bid prices.
Financial liabilities measured at fair value
Financial liabilities measured at fair value are stated at fair value, with any resulted gain or loss recognised in the Statement ofFinancial Performance.
Financial assets, other than those measured at fair value, are assessed for indicators of impairment at the end of eachreporting period. Financial assets are impaired where there is objective evidence of impairment of Financial Assets (such as theprobability of insolvency or significant financial difficulties of the debtor). If there is such evidence the recoverable amount isestimated and an impairment loss is recognised in accordance with GRAP 104.
Financial assets carried at amortised cost
Accounts receivable encompasses long term debtors, consumer debtors and other debtors.
Initially Accounts Receivable are valued at fair value plus transaction costs and subsequently carried at amortised cost using theeffective interest rate method. An estimate is made for doubtful debt based on past default experience of all outstandingamounts at year-end. Bad debts are written off the year in which they are identified as irrecoverable. Amounts receivablewithin 12 months from the date of reporting are classified as current.
A provision for impairment of accounts receivables is established when there is objective evidence that the Municipality will notbe able to collect all amounts due according to the original terms of receivables. The provision is made in accordance withGRAP 104 whereby the recoverability of accounts receivable is assessed individually and then collectively after grouping theassets in financial assets with similar credit risk characteristics. The amount of the provision is the difference between thefinancial asset’s carrying amount and the present value of estimated future cash flows, discounted at the original effectiveinterest rate. Future cash flows in a group of financial assets that are collectively evaluated for impairment are estimated on thebasis of historical loss experience for assets with credit risk characteristics similar to those in the group. Cash flows relating toshort-term receivables are not discounted where the effect of discounting is immaterial.
7.4 Impairment of Financial Assets
The carrying amount of the financial asset is reduced by the impairment loss directly for all financial assets carried at amortisedcost with the exception of consumer debtors, where the carrying amount is reduced through the use of an allowance account.When a consumer debtor is considered uncollectible, it is written off against the allowance account. Subsequent recoveries ofamounts previously written off are credited against revenue. Changes in the carrying amount of the allowance account arerecognised in the Statement of Financial Performance.
33
PIXLEY-KA-SEME DISTRICT MUNICIPALITY
ACCOUNTING POLICIES TO THE ANNUAL FINANCIAL STATEMENTSFOR THE YEAR ENDED 30 JUNE 2016
7. FINANCIAL INSTRUMENTS (continued)
Impairment of Financial Assets measured at cost
If there is objective evidence that an impairment loss has been incurred on an investment in a residual interest that is notmeasured at fair value because its fair value cannot be measured reliably, the amount of the impairment loss is measured asthe difference between the carrying amount of the financial asset and the present value of estimated future cash flowsdiscounted at the current market rate of return for a similar financial asset. Such impairment losses shall not be reversed.
The Municipality derecognises Financial Assets only when the contractual rights to the cash flows from the asset expire or ittransfers the financial asset and substantially all the risks and rewards of ownership of the asset to another entity, except whenCouncil approves the write-off of Financial Assets due to non-recoverability.
7.5 Derecognition of Financial Assets
34
PIXLEY-KA-SEME DISTRICT MUNICIPALITY
ACCOUNTING POLICIES TO THE ANNUAL FINANCIAL STATEMENTSFOR THE YEAR ENDED 30 JUNE 2016
8.
9.
Revenue from exchange transactions refers to revenue that accrued to the Municipality directly in return for services rendered /goods sold, the value of which approximates the consideration received or receivable.
Revenue from non-exchange transactions refers to transactions where the Municipality received revenue from another entitywithout directly giving approximately equal value in exchange. Revenue from non-exchange transactions is generally recognisedto the extent that the related receipt or receivable qualifies for recognition as an asset and there is no liability to repay theamount.
9.1 General
The Municipality recognises revenue when the amount of revenue can be reliably measured, it is probable that future economicbenefits will flow to the Municipality and when specific criteria have been met for each of the municipalities’ activities asdescribed below. The amount of revenue is not considered to be reliably measurable until all contingencies relating to the salehave been resolved. The Municipality bases its estimates on historical results, taking into consideration the type of customer,the type of transaction and the specifics of each arrangement. Furthermore services rendered are recognised by reference tothe stage of completion of the transaction at the reporting date.
Revenue, excluding value-added taxation where applicable, is derived from a variety of sources which include grants from othertiers of government and revenue from trading activities and other services provided. Revenue is recognised when it is probablethat future economic benefits or service potential will flow to the Municipality and these benefits can be measured reliably,except when specifically stated otherwise.
Revenue comprises the fair value of the consideration received or receivable for the sale of goods and services in the ordinarycourse of the Municipality’s activities. Revenue is shown net of value-added tax, returns, rebates and discounts.
GRANTS AND RECEIPTS
Grants, transfers and donations received or receivable are recognised as assets when the resources that have been transferredto the Municipality, meet the definition and criteria for recognition of an asset.
A corresponding liability is recognised to the extent that the grant, transfer or donation recognised as an asset, is subject toconditions which require that the entity either consumes the future economic benefits or service potential of the asset asspecified or that in the event that the conditions are breached the entity returns such future economic benefits or servicepotential to the transferor. The liability is transferred to revenue when the conditions attached to the grants, transfers ordonations, are met. Grants, transfers or donations that are not subject to any conditions are recognised as revenue when theassets are initially recognised.
REVENUE RECOGNITION
If the Municipality neither transfers nor retains substantially all the risks and rewards of ownership and continues to control thetransferred asset, the Municipality recognises its retained interest in the asset and an associated liability for amounts it mayhave to pay. If the Municipality retains substantially all the risks and rewards of ownership of a transferred financial asset, theMunicipality continues to recognise the financial asset and also recognises a collateralised borrowing for the proceeds received.
The Municipality derecognises Financial Liabilities when, and only when, the Municipality's obligations are discharged, cancelledor they expire.
The Municipality recognises the difference between the carrying amount of the financial liability (or part of a financial liability)extinguished or transferred to another party and the consideration paid, including any non-cash assets transferred or liabilitiesassumed, in the Statement of Financial Performance.
7.6 Derecognition of Financial Liabilities
35
PIXLEY-KA-SEME DISTRICT MUNICIPALITY
ACCOUNTING POLICIES TO THE ANNUAL FINANCIAL STATEMENTSFOR THE YEAR ENDED 30 JUNE 2016
9. REVENUE RECOGNITION (continued)
Interest earned on investments is recognised in the Statement of Financial Performance on the time proportionate basis thattakes into account the effective yield on the investment.
Interest earned on the following investments is not recognised in the Statement of Financial Performance:▪ Interest earned on trust funds is allocated directly to the fund.▪ Interest earned on unutilised conditional grants is allocated directly to the creditor: unutilised conditional grants, if the grantconditions indicate that interest is payable to the funder.
Revenue arising from the application of the approved tariff of charges is recognised when the relevant service is rendered byapplying the relevant authorised tariff. This includes the issuing of licenses and permits.
9.2 Revenue from Exchange Transactions
9.2.1 Finance income
9.2.2 Tariff Charges
9.2.3 Rentals
Equitable share allocations are recognised in revenue at the start of the financial year if no time-based restrictions exist.
Conditional Grants and receipts
9.3.2 Revenue From Recovery Of Unauthorised, Irregular, Fruitless And Wasteful Expenditure
Revenue from the recovery of unauthorised, irregular, fruitless and wasteful expenditure is based on legislated procedures,including those set out in the Municipal Finance Management Act (Act No.56 of 2003) and is recognised when the recoverythereof from the responsible councillors or officials is virtually certain.
Revenue from the rental of facilities and equipment is recognised on a straight-line basis over the term of the lease agreement.
An inflow of resources from a non-exchange transaction, that meets the definition of an asset shall be recognised as an assetwhen it is probable that the future economic benefits or service potential associated with the asset will flow to the Municipalityand the fair value of the asset can be measured reliably. The asset shall be recognised as revenue, except to the extent that aliability is also recognised in respect of the same inflow.A present obligation arising from a non-exchange transaction that meets the definition of a liability will be recognised as aliability when it is probable that an outflow of economic benefit will be required to settle the obligation and a reliable estimate ofthe amount can be made.
Conditional grants, donations and funding are recognised as revenue to the extent that the Municipality has complied with anyof the criteria, conditions or obligations embodied in the agreement. Where the agreement contains a stipulation to return theasset, other future economic benefits or service potential, in the event of non-compliance to these stipulations and would beenforced by the transferor, a liability is recognised to the extent that the criteria, conditions or obligations have not been met.Where such requirements are not enforceable, or where past experience has indicated that the transferor has never enforcedthe requirement to return the transferred asset, other future economic benefits or service potential when breaches haveoccurred, the stipulation will be considered a restriction and is recognised as revenue.
Government grants that are receivable as compensation for expenses or losses already incurred or for the purpose of givingimmediate financial support to the Municipality with no future related costs are recognised in the Statement of FinancialPerformance in the period in which they become receivable.
Revenue is recognised when all conditions associated with the contribution have been met or where the contribution is tofinance property, plant and equipment, when such items of property, plant and equipment are brought into use.
9.3 Revenue from Non-exchange Transactions
9.3.1 Government Grants And Receipts
36
PIXLEY-KA-SEME DISTRICT MUNICIPALITY
ACCOUNTING POLICIES TO THE ANNUAL FINANCIAL STATEMENTSFOR THE YEAR ENDED 30 JUNE 2016
10.
10.
11.
PROVISIONS (continued)
The Municipality provides retirement benefits for its employees and councillors, and has both defined benefit and definedcontribution post-employment plans.
A defined contribution plan is a plan under which the Municipality pays fixed contributions into a separate entity. TheMunicipality has no legal or constructive obligation to pay further contributions if the fund does not hold sufficient assets to payall employees the benefits relating to service in the current or prior periods.
Provisions are reviewed at reporting date and the amount of a provision is the present value of the expenditure expected to berequired to settle the obligation. When the effect of discounting is material, provisions are determined by discounting theexpected future cash flows that reflect current market assessments of the time value of money. The impact of the periodicunwinding of the discount is recognised in the Statement of Financial Performance as a finance cost as it occurs.
Remuneration to employees is recognised in the Statement of Financial Performance as the services are rendered, except fornon-accumulating benefits, which are only recognised when the specific event occurs.
PROVISIONS
Provisions for legal claims are recognised when the Municipality has a present legal or constructive obligation as a result ofpast events, it is probable that an outflow of resources embodying economic benefits or service potential will be required tosettle the obligation and a reliable estimate can be made of the obligation.
The Municipality has an obligation to provide Post-retirement Health Care Benefits to certain of its retirees. According to therules of the Medical Aid Funds, with which the Municipality is associated, a member (who is on the current Conditions ofService), on retirement, is entitled to remain a continued member of the Medical Aid Fund, in which case the Municipality isliable for a certain portion of the medical aid membership fee.
11.3 Post-Retirement Health Care Benefits:
The Municipality treats its provision for leave pay as an accrual.
The best estimate of the expenditure required to settle the present obligation is the amount that an entity would rationally pay tosettle the obligation at the reporting date or to transfer it to a third party at that time and are determined by the judgment of themanagement of the entity, supplemented by experience of similar transactions and, in some cases, reports from independentexperts. The evidence considered includes any additional evidence provided by events after the reporting date. Uncertaintiessurrounding the amount to be recognised as a provision are dealt with by various means according to the circumstances,Where the provision being measured involves a large population of items, the obligation is estimated by weighting all possibleoutcomes by their associated probabilities.
Future events that may affect the amount required to settle an obligation are reflected in the amount of a provision where thereis sufficient objective evidence that they will occur. Gains from the expected disposal of assets are not taken into account inmeasuring a provision. Provisions are not recognised for future operating losses. The present obligation under an onerouscontract is recognised and measured as a provision. An onerous contract is a contract in which the unavoidable costs ofmeeting the obligations under the contract exceed the economic benefits expected to be received under it. The unavoidablecosts under a contract reflect the least net cost of exiting from the contract, which is the lower of the cost of fulfilling it and anycompensation or penalties arising from failure to fulfill it - this unavoidable cost resulting from the contract is the amount of theprovision to be recognised.
11.2 Post-Employment Benefits
11.1 Short-Term Employee Benefits
11.2.1 Defined Contribution Plans
11.2.2 Defined Benefit Plans
EMPLOYEE BENEFITS
The defined benefit liability is the aggregate of the present value of the defined benefit obligation and unrecognised actuarialgains and losses, reduced by unrecognised past service costs. The plan is unfunded. The present value of the defined benefitobligation is calculated using the projected unit credit method, incorporating actuarial assumptions and a discount rate based onthe government bond rate. Valuations of these obligations are carried out annually by independent qualified actuaries.
The costs of all short-term employee benefits such as leave pay, are recognised during the period in which the employeerenders the related service. The liability for leave pay is based on the total accrued leave days at year end and is shown as acreditor in the Statement of Financial Position. The Municipality recognises the expected cost of performance bonuses onlywhen the Municipality has a present legal or constructive obligation to make such payment and a reliable estimate can be made.
The Municipality’s contributions to the defined contribution funds are established in terms of the rules governing those plans.Contributions are recognised in the Statement of Financial Performance in the period in which the service is rendered by therelevant employees. The Municipality has no further payment obligations once the contributions have been paid. Thecontributions are recognised as employee benefit expense when they are due. Prepaid contributions are recognised as an assetto the extent that a cash refund or a reduction in the future payments is available.
A defined benefit plan is a post- employment benefit plan other than a defined contribution plan.
37

PIXLEY-KA-SEME DISTRICT MUNICIPALITY
ACCOUNTING POLICIES TO THE ANNUAL FINANCIAL STATEMENTSFOR THE YEAR ENDED 30 JUNE 2016
Actuarial gains or losses recognised immediately in the Statement of Financial Performance.
Past-service costs are recognised immediately in the Statement of Financial Performance.
38
PIXLEY-KA-SEME DISTRICT MUNICIPALITY
ACCOUNTING POLICIES TO THE ANNUAL FINANCIAL STATEMENTSFOR THE YEAR ENDED 30 JUNE 2016
11.
12.
EMPLOYEE BENEFITS (continued)
Leases are classified as finance leases where substantially all the risks and rewards associated with ownership of an asset aretransferred to the Municipality.
Leases of property, plant and equipment, in which a significant portion of the risks and rewards of ownership are retained by thelessor are classified as operating leases.
Finance leases
Operating leases
Where the Municipality enters into a finance lease, property, plant and equipment or intangible assets subject to finance leaseagreements are capitalised at amounts equal to the fair value of the leased asset or, if lower, the present value of the minimumlease payments, each determined at the inception of the lease. Corresponding liabilities are included in the Statement ofFinancial Position as Finance Lease Liabilities. The corresponding liabilities are initially recognised at the inception of the leaseand are measured as the sum of the minimum lease payments due in terms of the lease agreement, discounted for the effect ofinterest. In discounting the lease payments, the Municipality uses the interest rate that exactly discounts the lease paymentsand unguaranteed residual value to the fair value of the asset plus any direct costs incurred. Lease payments are allocatedbetween the lease finance cost and the capital repayment using the effective interest rate method. Lease finance costs areexpensed when incurred.
Subsequent to initial recognition, the leased assets are accounted for in accordance with the stated accounting policiesapplicable to property, plant, equipment or intangibles. The lease liability is reduced by the lease payments, which are allocatedbetween the lease finance cost and the capital repayment using the effective interest rate method. Lease finance costs areexpensed when incurred. The accounting policies relating to derecognition of financial instruments are applied to leasepayables. The lease asset is depreciated over the shorter of the asset's useful life or the lease term.
The liability recognised in the balance sheet in respect of defined benefit pension plans is the present value of the definedbenefit obligation at the end of the reporting period less the fair value of plan assets, together with adjustments for unrecognised past-service costs. The defined benefit obligation is calculated annually by independent actuaries using the projected unit creditmethod. The present value of the defined benefit obligation is determined by discounting the estimated future cash outflowsusing interest rates of high-quality corporate bonds that are denominated in the currency in which the benefits will be paid, andthat have terms to maturity approximating to the terms of the related pension liability.
Actuarial gains or losses recognised immediately in the Statement of Financial Performance.
Past-service costs are recognised immediately in the Statement of Financial Performance.
In the event that lease incentives are received to enter into operating leases, such incentives are recognised as a liability. Theaggregate benefit of incentives is recognised as a reduction of rental expense on a straight-line basis, except where anothersystematic basis is more representative of the time pattern in which economic benefits from the leased asset are consumed.
Amounts due from lessees under finance leases or installment sale agreements are recorded as receivables at the amount ofthe Municipality’s net investment in the leases. Finance lease or installment sale income is allocated to accounting periods soas to reflect a constant periodic rate of return on the Municipality’s net investment outstanding in respect of the leases orinstallment sale agreements.
The Municipality has an obligation to provide Post-retirement pension Benefits to certain of its retirees. Pension contributions inrespect of employees who were not members of a pension fund are recognised as an expense when incurred. Staff providentfunds are maintained to accommodate personnel who, due to age, cannot join or be part of the various pension funds. TheEntity contributes monthly to the funds.
12.2 The Municipality As Lessor
The Municipality recognises operating lease rentals as an expense in the Statement of Financial Performance on a straight-linebasis over the term of the relevant lease. The difference between the amounts recognised as an expense and the contractualpayments are recognised as an operating lease asset or liability.
Lease Classification
Operating lease rental income is recognised on a straight-line basis over the term of the relevant lease.
LEASES
12.1 The Municipality As Lessee
11.4 Defined Benefit Pension Plans
12.3 Determining Whether An Arrangement Contains A Lease
39
PIXLEY-KA-SEME DISTRICT MUNICIPALITY
ACCOUNTING POLICIES TO THE ANNUAL FINANCIAL STATEMENTSFOR THE YEAR ENDED 30 JUNE 2016
At inception of an arrangement, the Municipality determines whether such an arrangement is or contains a lease. A specificasset is the subject of a lease if fulfillment of the arrangement is dependent on the use of that specified asset. An arrangementconveys the right to use the asset if the arrangement conveys to the Municipality the right to control the use of the underlyingasset. At inception or upon reassessment of the arrangement, the Municipality separates payments and other considerationrequired by such an arrangement into those for the lease and those for other elements on the basis of their relative fair values.If the Municipality concludes for a finance lease that it is impracticable to separate the payments reliably, an asset and a liabilityare recognised at an amount equal to the fair value of the underlying asset. Subsequently the liability is reduced as paymentsare made and an imputed finance charge on the liability is recognised using the Municipality’s incremental borrowing rate.
40
PIXLEY-KA-SEME DISTRICT MUNICIPALITY
ACCOUNTING POLICIES TO THE ANNUAL FINANCIAL STATEMENTSFOR THE YEAR ENDED 30 JUNE 2016
13.
14.
▪▪▪
15.
16.
17.
18.
19.
FRUITLESS AND WASTEFUL EXPENDITURE
BORROWING COSTS
The Municipality capitalises borrowing costs incurred that are directly attributable to the acquisition, construction or productionof a qualifying asset as part of the cost of that asset only when the commencement date for capitalisation is on or after 1 July2008, while all other borrowing costs incurred (including borrowing cost incurred on qualifying assets where the commencementdate for capitalisation is prior to 1 July 2008) are recognised as an expense in the Statement of Financial Performance inaccordance with the requirements of GRAP 5. To the extent that an entity borrows funds generally and uses them for thepurpose of obtaining a qualifying asset, the entity shall determine the amount of borrowing costs eligible for capitalisation byapplying a capitalisation rate to the expenditure on that asset. The capitalisation rate shall be the weighted average of theborrowing costs applicable to the borrowings of the entity that are outstanding during the period, other than borrowings madespecifically for the purpose of obtaining a qualifying asset. The amount of borrowing costs that an entity capitalises during aperiod shall not exceed the amount of borrowing costs it incurred during that period.
The Municipality transfers money to individuals, organisations and other sectors of government from time to time. Whenmaking these transfers, the Municipality does not:
These transfers are recognised in the Statement of Financial Performance as expenses in the period that the events giving riseto the transfer occurred.
VALUE ADDED TAX
The Municipality is registered with SARS for VAT on the payments basis, in accordance with Section 15(2)(a) of the Value-Added Tax Act No 89 of 1991.
receive any goods or services directly in return, as would be expected in a purchase or sale transaction;expect to be repaid in future; or
Changes in accounting policies that are effected by management have been applied retrospectively in accordance with GRAP 3requirements, except to the extent that it is impracticable to determine the period-specific effects or the cumulative effect of thechange in policy. In such cases the Municipality shall restate the opening balances of assets, liabilities and net assets for theearliest period for which retrospective restatement is practicable. Refer to Note 31 for details of changes in accounting policies.
Changes in accounting estimates are applied prospectively in accordance with GRAP 3 requirements. Details of changes inestimates are disclosed in the notes to the annual financial statements where applicable.
Correction of errors is applied retrospectively in the period in which the error has occurred in accordance with GRAP 3requirements, except to the extent that it is impracticable to determine the period-specific effects or the cumulative effect of theerror. In such cases the Municipality shall restate the opening balances of assets, liabilities and net assets for the earliestperiod for which retrospective restatement is practicable. Refer to Note 32 to the Annual Financial Statements for details ofcorrections of errors recorded during the period under review.
The Municipality ceases to capitalise borrowing costs when substantially all the activities necessary to prepare the qualifyingassets for its intended use has been completed. Where the construction of the qualifying asset is completed in parts and eachpart is capable of being used while construction continues on other parts, the entity shall cease capitalising borrowing costswhen it completes substantially all the activities necessary to prepare that part.
GRANTS-IN-AID
expect a financial return, as would be expected from an investment.
IRREGULAR EXPENDITURE
Irregular expenditure is expenditure that is contrary to the Municipal Finance Management Act (Act No 56 of 2003), theMunicipal Systems Act (Act No 32 of 2000) and the Public Office Bearers Act (Act No 20 of 1998) or is in contravention of theMunicipality’s or Municipal Entities’ supply chain management policies. Irregular expenditure excludes unauthorisedexpenditure. Irregular expenditure is accounted for as an expense in the Statement of Financial Performance in the period itoccurred and where recovered, it is subsequently accounted for as revenue in the Statement of Financial Performance.
Fruitless and wasteful expenditure is expenditure that was made in vain and would have been avoided had reasonable carebeen exercised. All expenditure relating to fruitless and wasteful expenditure is recognised as an expense in the Statement ofFinancial Performance in the year that the expenditure was incurred. The expenditure is classified in accordance with the natureof the expense, and where recovered, it is subsequently accounted for as revenue in the Statement of Financial Performance.
UNAUTHORISED EXPENDITURE
Unauthorised expenditure is expenditure that has not been budgeted, expenditure that is not in terms of the conditions of anallocation received from another sphere of government, Municipality or organ of state and expenditure in the form of a grant that is not permitted in terms of the Municipal Finance Management Act (Act No 56 of 2003). All expenditure relating to unauthorisedexpenditure is recognised as an expense in the Statement of Financial Performance in the year that the expenditure wasincurred. The expenditure is classified in accordance with the nature of the expense, and where recovered, it is subsequentlyaccounted for as revenue in the Statement of Financial Performance.
CHANGES IN ACCOUNTING POLICIES, ESTIMATES AND ERRORS
41
PIXLEY-KA-SEME DISTRICT MUNICIPALITY
ACCOUNTING POLICIES TO THE ANNUAL FINANCIAL STATEMENTSFOR THE YEAR ENDED 30 JUNE 2016
20.
21.
22.
23.
24.
25.
Contingent liabilities represent a possible obligation that arises from past events and whose existence will be confirmed only byan occurrence or non-occurrence of one or more uncertain future events not wholly within the control of the entity.A contingent liability can also arise as a result of a present obligation that arises from past events but which is not recognised asa liability either because it is not probable that an outflow of resources embodying economic benefits will be required to settlethe obligation or the amount of the obligation cannot be measured with sufficient reliability.
Contingent assets represent possible assets that arise from past events and whose existence will be confirmed only by anoccurrence or non-occurrence of one or more uncertain future events not wholly within the control of the entity.
Contingent assets and contingent liabilities are not recognised. Contingencies are disclosed in the notes to the annual financialstatements.
23.1 Prior Year Comparatives
23.2 Budget Information
CONTINGENT ASSETS AND CONTINGENT LIABILITIES
The costs of internal support services are transferred to the various services and departments to whom resources are madeavailable.
Non-monetary items that are measured in terms of historical cost in a foreign currency are translated using the exchange rate atthe date of the transaction.
Cash flows arising from transactions in a foreign currency are recorded in Rand's by applying, to the foreign currency amount,the exchange rate between the Rand and the foreign currency at the date of the cash flow.
COMPARATIVE INFORMATION
When the presentation or classification of items in the Annual Financial Statements is amended, prior period comparativeamounts are reclassified. The nature and reasons for the reclassification are disclosed.
The annual budget figures have been prepared in accordance with the GRAP standard and are consistent with the accountingpolicies adopted by the Council for the preparation of these financial statements. The amounts are scheduled as a separateadditional financial statement, called the Statement of Comparison of Budget and Actual amounts. Explanatory comment isprovided in the notes to the annual financial statements giving firstly reasons for overall growth or decline in the budget andsecondly motivations for over- or under spending on line items. The annual budget figures included in the financial statementsare for the Municipality and do not include budget information relating to subsidiaries or associates. These figures are thoseapproved by the Council at the beginning and during the year following a period of consultation with the public as part of theIntegrated development plan. The budget is approved on an accrual basis by nature classification. The approved budget coversthe period from 1 July 2015 to 30 June 2016.
RELATED PARTIES
Individuals as well as their close family members, and/or entities are related parties if one party has the ability, directly orindirectly, to control or jointly control the other party or exercise significant influence over the other party in making financialand/or operating decisions. Management is regarded as a related party and comprises the councillors, Executive Mayor,Mayoral Committee members, Municipal Manager, executive directors and all other managers reporting directly to the MunicipalManager or as designated by the Municipal Manager.
TREATMENT OF ADMINISTRATION AND OTHER OVERHEAD EXPENSES
EVENTS AFTER THE REPORTING DATE
Events after the reporting date that are classified as adjusting events have been accounted for in the Annual FinancialStatements. The events after the reporting date that are classified as non-adjusting events after the reporting date have beendisclosed in the notes to the Annual Financial Statements.
Transactions in foreign currencies are translated to the functional currency of the entity at exchange rates at the dates of thetransactions.
Monetary assets and liabilities denominated in foreign currencies at the reporting date are retranslated to the functionalcurrency at the exchange rate at that date. The foreign currency gain or loss on monetary items is the difference betweenamortised cost and fair value in the functional currency at the beginning of the period, adjusted for effective interest andpayments during the period, and the amortised cost in foreign currency translated at the exchange rate at the end of thereporting period.
Non-monetary assets and liabilities denominated in foreign currencies that are measured at fair value are retranslated to thefunctional currency at the exchange rate at the date that the fair value was determined. Foreign currency differences arising onretranslation are recognised in the Statement of Financial Performance.
FOREIGN CURRENCIES
42
PIXLEY-KA-SEME DISTRICT MUNICIPALITY
ACCOUNTING POLICIES TO THE ANNUAL FINANCIAL STATEMENTSFOR THE YEAR ENDED 30 JUNE 2016
26.
27.
28.
▪
▪
The Municipality controls or regulates what services the private party must provide with the associated asset, to whom itmust provide them and at what price.
The Standard of GRAP on Revenue from Non-exchange Transactions (Taxes and Transfers) (GRAP 23) states that control ofan asset arises when the entity can use or otherwise benefit from the asset in pursuit of its objectives, and can exclude orotherwise regulate the access of others to that benefit. GRAP 23 requires that the ability to exclude or regulate the access ofothers to the benefits of an asset is an essential element of control that distinguishes an entity’s assets from those public goodsthat all entities have access to and from which they benefit.
Under the control approach, the Municipality uses the following criteria to determine whether it controls the use of the underlyingasset in the PPP agreement:
The Municipality controls - through ownership, beneficial entitlement or otherwise - any significant residual interest in theasset at the end of the agreement.
The control approach to assets that are developed, constructed, acquired or used in terms of PPP agreements. These assetsare used by the private party to perform part of an entity’s service delivery or administrative functions (institutional function).
The control approach is also applied to PPP agreements where the Municipality provides the private party with an existingasset, and the private party upgrades, operates and maintains the asset for a specified period of time. If the PPP agreementrequires the private party to use its own asset, the Municipality only recognises the asset in its financial statements if both thecontrol approach criteria are met.
IN-KIND DONATIONS AND CONTRIBUTIONS
In-kind Donations and Contributions are recognised when it is probable that future economic benefits or service potential willflow to the Municipality and these benefits can be measured reliably, except when specifically stated otherwise. In-kindDonations and Contributions are recognised at the fair value of the consideration received or receivable.
In the case of Donated Assets, the Donation is recognised at the fair value of the asset received.
PUBLIC PRIVATE PARTNERSHIPS
A PPP can generally be described as an agreement between a public sector entity (entity) and a private sector institution(private party). In terms of this the private party assumes some substantial financial, construction, technical and operationalrisks in the design, financing, building and operation of a project. It typically involves a private party that supplies an assetand/or services that previously were developed or provided by an entity. The private party provides a service to the public onbehalf of the entity through the use of assets and/or the management of such an asset. In return, the private party is rewardedthrough payments from the entity. Such payments are based on service outputs delivered to specification, charges to users ofsuch services, or a combination of these.
The definition of a PPP agreement in the MFMA identifies two broad categories of PPP agreements - one where the privateparty performs an institutional function on behalf of the entity, and the other where the private party acquires the use of stateproperty for its own commercial purposes. The PPP agreement can also be a combination of these.
CAPITAL COMMITMENTS
Items are classified as commitments where the Municipality commits itself to future transactions that will normally result in theoutflow of resources.
Capital commitments are not recognised in the Statement of Financial Position as a liability but are included in the disclosurenotes in the following cases: ▪ Approved and contracted commitments, where the expenditure has been approved and the contract has been awarded at thereporting date, where disclosure is required by a specific standard of GRAP.▪ Approved but not yet contracted commitments, where the expenditure has been approved and the contract has yet to beawarded or is awaiting finalisation at the reporting date.▪ Items are classified as commitments where the Municipality commits itself to future transactions that will normally result in theoutflow of resources.▪ Contracts that are entered into before the reporting date, but goods and services have not yet been received are disclosed inthe disclosure notes to the financial statements.▪ Other commitments for contracts are non-cancellable or only cancellable at significant cost contracts should relate tosomething other than the business of the Municipality.
43
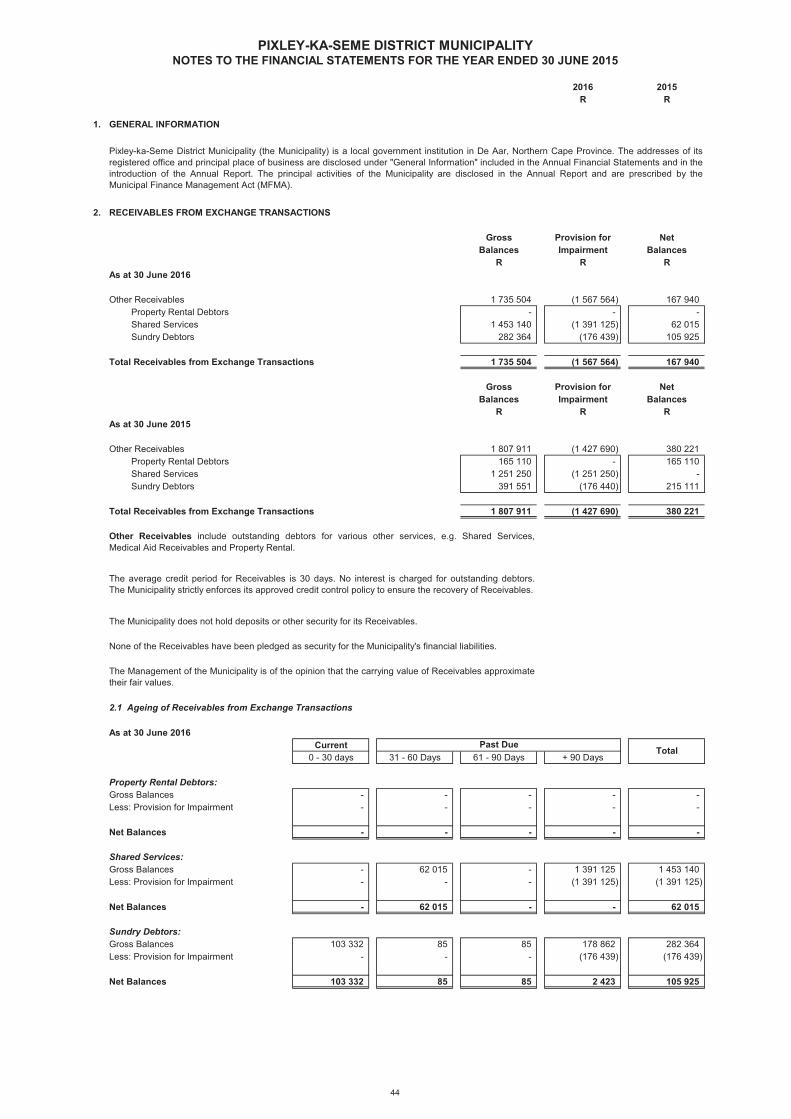
2016 2015R R
1. GENERAL INFORMATION
2. RECEIVABLES FROM EXCHANGE TRANSACTIONS
Gross Provision for NetBalances Impairment Balances
R R RAs at 30 June 2016
Other Receivables 1 735 504 (1 567 564) 167 940 Property Rental Debtors - - - Shared Services 1 453 140 (1 391 125) 62 015 Sundry Debtors 282 364 (176 439) 105 925
Total Receivables from Exchange Transactions 1 735 504 (1 567 564) 167 940 0,00 0,00 0,00
Gross Provision for NetBalances Impairment Balances
R R RAs at 30 June 2015
Other Receivables 1 807 911 (1 427 690) 380 221 Property Rental Debtors 165 110 - 165 110 Shared Services 1 251 250 (1 251 250) - Sundry Debtors 391 551 (176 440) 215 111
Total Receivables from Exchange Transactions 1 807 911 (1 427 690) 380 221 0,00 0,00 0,00
2.1 Ageing of Receivables from Exchange Transactions
As at 30 June 2016Current
0 - 30 days 31 - 60 Days 61 - 90 Days + 90 Days
Property Rental Debtors:Gross Balances - - - - - Less: Provision for Impairment - - - - -
Net Balances - - - - -
Shared Services:Gross Balances - 62 015 - 1 391 125 1 453 140 Less: Provision for Impairment - - - (1 391 125) (1 391 125)
Net Balances - 62 015 - - 62 015
Sundry Debtors:Gross Balances 103 332 85 85 178 862 282 364 Less: Provision for Impairment - - - (176 439) (176 439)
Net Balances 103 332 85 85 2 423 105 925
Other Receivables include outstanding debtors for various other services, e.g. Shared Services,Medical Aid Receivables and Property Rental.
The average credit period for Receivables is 30 days. No interest is charged for outstanding debtors.The Municipality strictly enforces its approved credit control policy to ensure the recovery of Receivables.
The Municipality does not hold deposits or other security for its Receivables.
None of the Receivables have been pledged as security for the Municipality's financial liabilities.
The Management of the Municipality is of the opinion that the carrying value of Receivables approximatetheir fair values.
Past Due
PIXLEY-KA-SEME DISTRICT MUNICIPALITYNOTES TO THE FINANCIAL STATEMENTS FOR THE YEAR ENDED 30 JUNE 2015
Pixley-ka-Seme District Municipality (the Municipality) is a local government institution in De Aar, Northern Cape Province. The addresses of itsregistered office and principal place of business are disclosed under "General Information" included in the Annual Financial Statements and in theintroduction of the Annual Report. The principal activities of the Municipality are disclosed in the Annual Report and are prescribed by theMunicipal Finance Management Act (MFMA).
Total
44
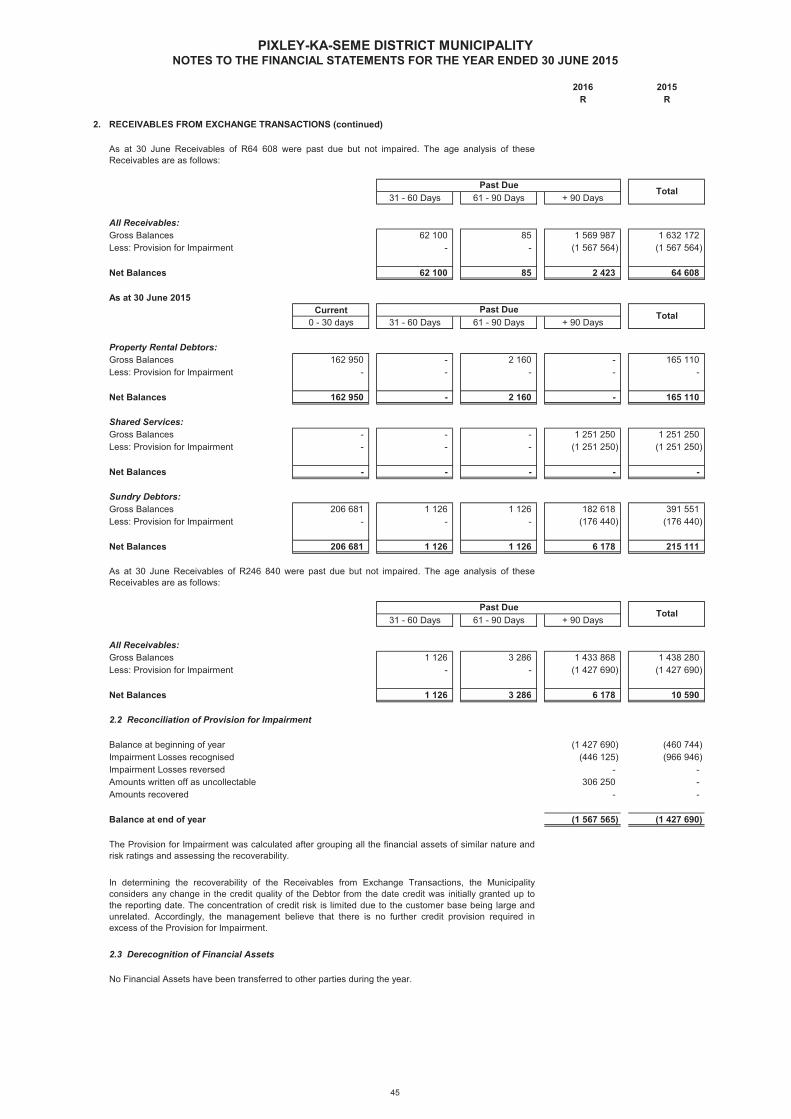
2016 2015R R
PIXLEY-KA-SEME DISTRICT MUNICIPALITYNOTES TO THE FINANCIAL STATEMENTS FOR THE YEAR ENDED 30 JUNE 2015
2. RECEIVABLES FROM EXCHANGE TRANSACTIONS (continued)
31 - 60 Days 61 - 90 Days + 90 Days
All Receivables:Gross Balances 62 100 85 1 569 987 1 632 172 Less: Provision for Impairment - - (1 567 564) (1 567 564)
Net Balances 62 100 85 2 423 64 608
As at 30 June 2015Current
0 - 30 days 31 - 60 Days 61 - 90 Days + 90 Days
Property Rental Debtors:Gross Balances 162 950 - 2 160 - 165 110 Less: Provision for Impairment - - - - -
Net Balances 162 950 - 2 160 - 165 110
Shared Services:Gross Balances - - - 1 251 250 1 251 250 Less: Provision for Impairment - - - (1 251 250) (1 251 250)
Net Balances - - - - -
Sundry Debtors:Gross Balances 206 681 1 126 1 126 182 618 391 551 Less: Provision for Impairment - - - (176 440) (176 440)
Net Balances 206 681 1 126 1 126 6 178 215 111
31 - 60 Days 61 - 90 Days + 90 Days
All Receivables:Gross Balances #REF! 1 126 3 286 1 433 868 1 438 280 Less: Provision for Impairment #REF! - - (1 427 690) (1 427 690)
Net Balances #REF! 1 126 3 286 6 178 10 590
Balance at beginning of year (1 427 690) (460 744) Impairment Losses recognised (446 125) (966 946) Impairment Losses reversed - - Amounts written off as uncollectable 306 250 - Amounts recovered - -
Balance at end of year (1 567 565) (1 427 690)
2.3 Derecognition of Financial Assets
Past Due
As at 30 June Receivables of R64 608 were past due but not impaired. The age analysis of theseReceivables are as follows:
In determining the recoverability of the Receivables from Exchange Transactions, the Municipalityconsiders any change in the credit quality of the Debtor from the date credit was initially granted up tothe reporting date. The concentration of credit risk is limited due to the customer base being large andunrelated. Accordingly, the management believe that there is no further credit provision required inexcess of the Provision for Impairment.
Past Due
As at 30 June Receivables of R246 840 were past due but not impaired. The age analysis of theseReceivables are as follows:
Total
Past Due
The Provision for Impairment was calculated after grouping all the financial assets of similar nature andrisk ratings and assessing the recoverability.
Total
No Financial Assets have been transferred to other parties during the year.
Total
2.2 Reconciliation of Provision for Impairment
45
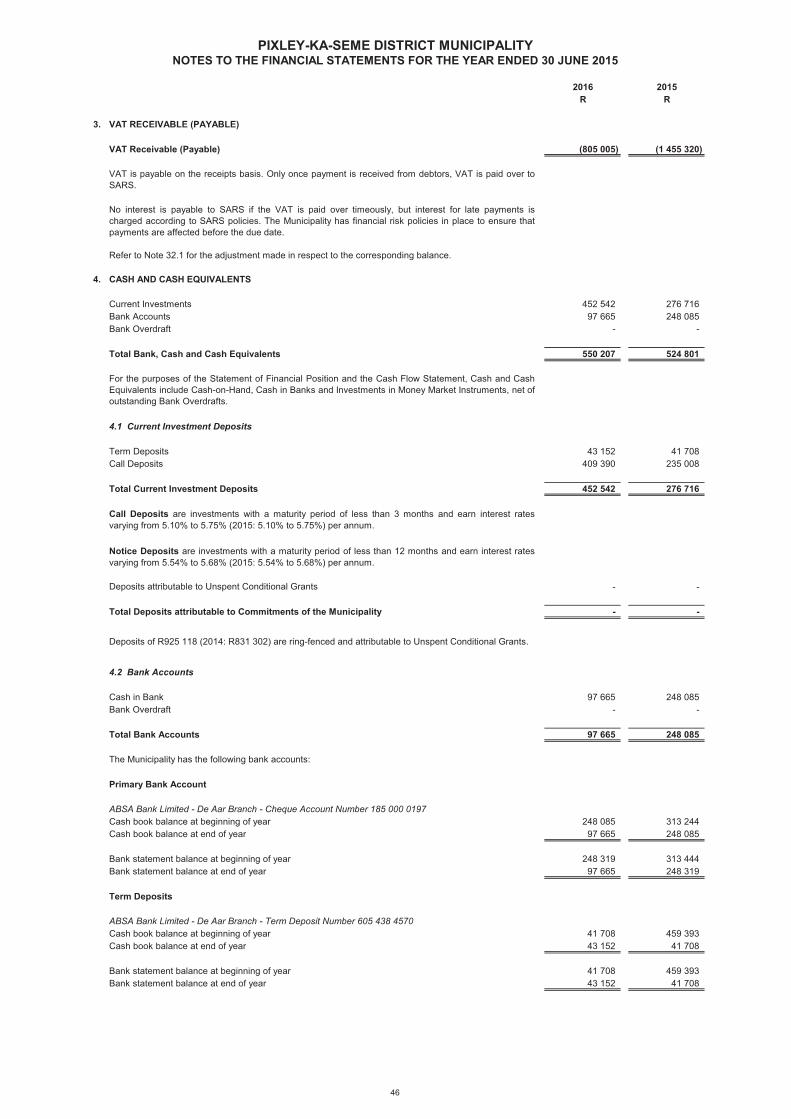
2016 2015R R
PIXLEY-KA-SEME DISTRICT MUNICIPALITYNOTES TO THE FINANCIAL STATEMENTS FOR THE YEAR ENDED 30 JUNE 2015
3. VAT RECEIVABLE (PAYABLE)
VAT Receivable (Payable) (805 005) (1 455 320) 0,00 0,00
4. CASH AND CASH EQUIVALENTS
Current Investments 452 542 276 716 Bank Accounts 97 665 248 085 Bank Overdraft - -
Total Bank, Cash and Cash Equivalents 550 207 524 801 - -
Term Deposits 43 152 41 708 Call Deposits 409 390 235 008
Total Current Investment Deposits 452 542 276 716 452 542 276 716
- -
Total Deposits attributable to Commitments of the Municipality - -
Cash in Bank 97 665 248 085 Bank Overdraft - -
Total Bank Accounts 97 665 248 085 - -
The Municipality has the following bank accounts:
Primary Bank Account
ABSA Bank Limited - De Aar Branch - Cheque Account Number 185 000 0197Cash book balance at beginning of year 248 085 313 244 Cash book balance at end of year 97 665 248 085
Bank statement balance at beginning of year 248 319 313 444 Bank statement balance at end of year 97 665 248 319
Term Deposits
ABSA Bank Limited - De Aar Branch - Term Deposit Number 605 438 4570Cash book balance at beginning of year 41 708 459 393 Cash book balance at end of year 43 152 41 708
Bank statement balance at beginning of year 41 708 459 393 Bank statement balance at end of year 43 152 41 708
4.2 Bank Accounts
Deposits attributable to Unspent Conditional Grants
Call Deposits are investments with a maturity period of less than 3 months and earn interest ratesvarying from 5.10% to 5.75% (2015: 5.10% to 5.75%) per annum.
For the purposes of the Statement of Financial Position and the Cash Flow Statement, Cash and CashEquivalents include Cash-on-Hand, Cash in Banks and Investments in Money Market Instruments, net ofoutstanding Bank Overdrafts.
VAT is payable on the receipts basis. Only once payment is received from debtors, VAT is paid over toSARS.
Deposits of R925 118 (2014: R831 302) are ring-fenced and attributable to Unspent Conditional Grants.
Notice Deposits are investments with a maturity period of less than 12 months and earn interest ratesvarying from 5.54% to 5.68% (2015: 5.54% to 5.68%) per annum.
4.1 Current Investment Deposits
No interest is payable to SARS if the VAT is paid over timeously, but interest for late payments ischarged according to SARS policies. The Municipality has financial risk policies in place to ensure thatpayments are affected before the due date.
Refer to Note 32.1 for the adjustment made in respect to the corresponding balance.
46
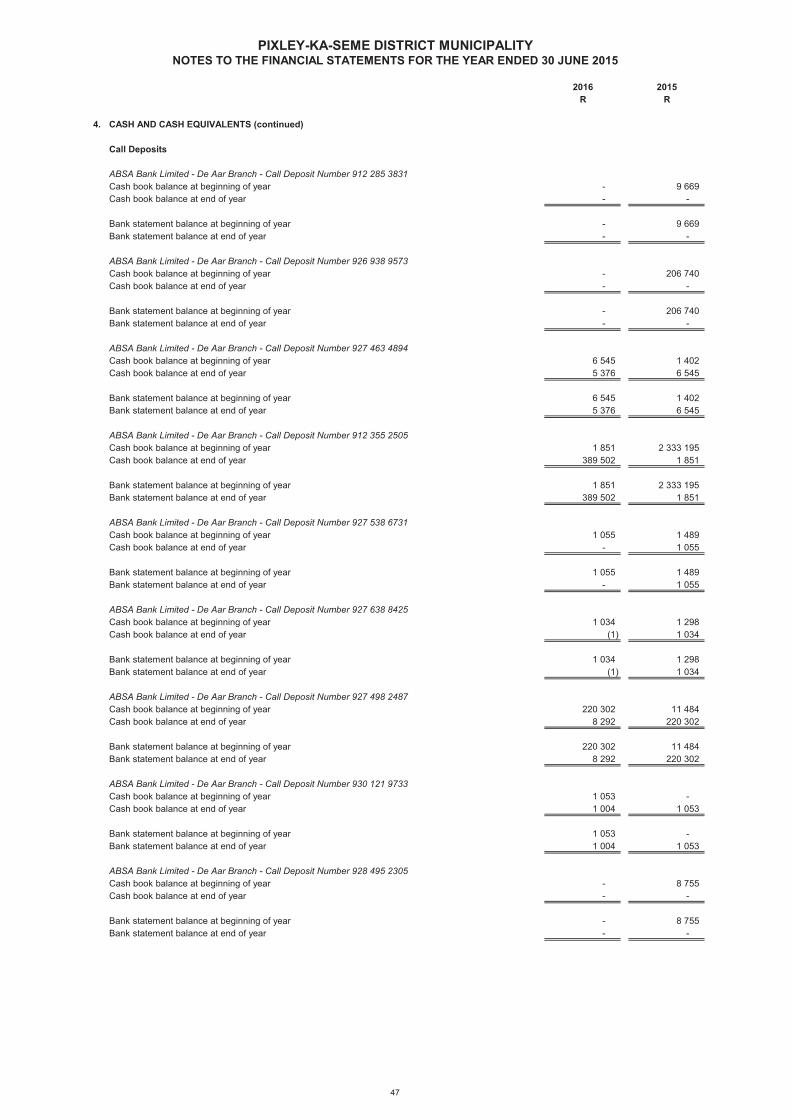
2016 2015R R
PIXLEY-KA-SEME DISTRICT MUNICIPALITYNOTES TO THE FINANCIAL STATEMENTS FOR THE YEAR ENDED 30 JUNE 2015
4. CASH AND CASH EQUIVALENTS (continued)
Call Deposits
ABSA Bank Limited - De Aar Branch - Call Deposit Number 912 285 3831Cash book balance at beginning of year - 9 669 Cash book balance at end of year - -
Bank statement balance at beginning of year - 9 669 Bank statement balance at end of year - -
ABSA Bank Limited - De Aar Branch - Call Deposit Number 926 938 9573Cash book balance at beginning of year - 206 740 Cash book balance at end of year - -
Bank statement balance at beginning of year - 206 740 Bank statement balance at end of year - -
ABSA Bank Limited - De Aar Branch - Call Deposit Number 927 463 4894Cash book balance at beginning of year 6 545 1 402 Cash book balance at end of year 5 376 6 545
Bank statement balance at beginning of year 6 545 1 402 Bank statement balance at end of year 5 376 6 545
ABSA Bank Limited - De Aar Branch - Call Deposit Number 912 355 2505Cash book balance at beginning of year 1 851 2 333 195 Cash book balance at end of year 389 502 1 851
Bank statement balance at beginning of year 1 851 2 333 195 Bank statement balance at end of year 389 502 1 851
ABSA Bank Limited - De Aar Branch - Call Deposit Number 927 538 6731Cash book balance at beginning of year 1 055 1 489 Cash book balance at end of year - 1 055
Bank statement balance at beginning of year 1 055 1 489 Bank statement balance at end of year - 1 055
ABSA Bank Limited - De Aar Branch - Call Deposit Number 927 638 8425Cash book balance at beginning of year 1 034 1 298 Cash book balance at end of year (1) 1 034
Bank statement balance at beginning of year 1 034 1 298 Bank statement balance at end of year (1) 1 034
ABSA Bank Limited - De Aar Branch - Call Deposit Number 927 498 2487Cash book balance at beginning of year 220 302 11 484 Cash book balance at end of year 8 292 220 302
Bank statement balance at beginning of year 220 302 11 484 Bank statement balance at end of year 8 292 220 302
ABSA Bank Limited - De Aar Branch - Call Deposit Number 930 121 9733Cash book balance at beginning of year 1 053 - Cash book balance at end of year 1 004 1 053
Bank statement balance at beginning of year 1 053 - Bank statement balance at end of year 1 004 1 053
ABSA Bank Limited - De Aar Branch - Call Deposit Number 928 495 2305Cash book balance at beginning of year - 8 755 Cash book balance at end of year - -
Bank statement balance at beginning of year - 8 755 Bank statement balance at end of year - -
47
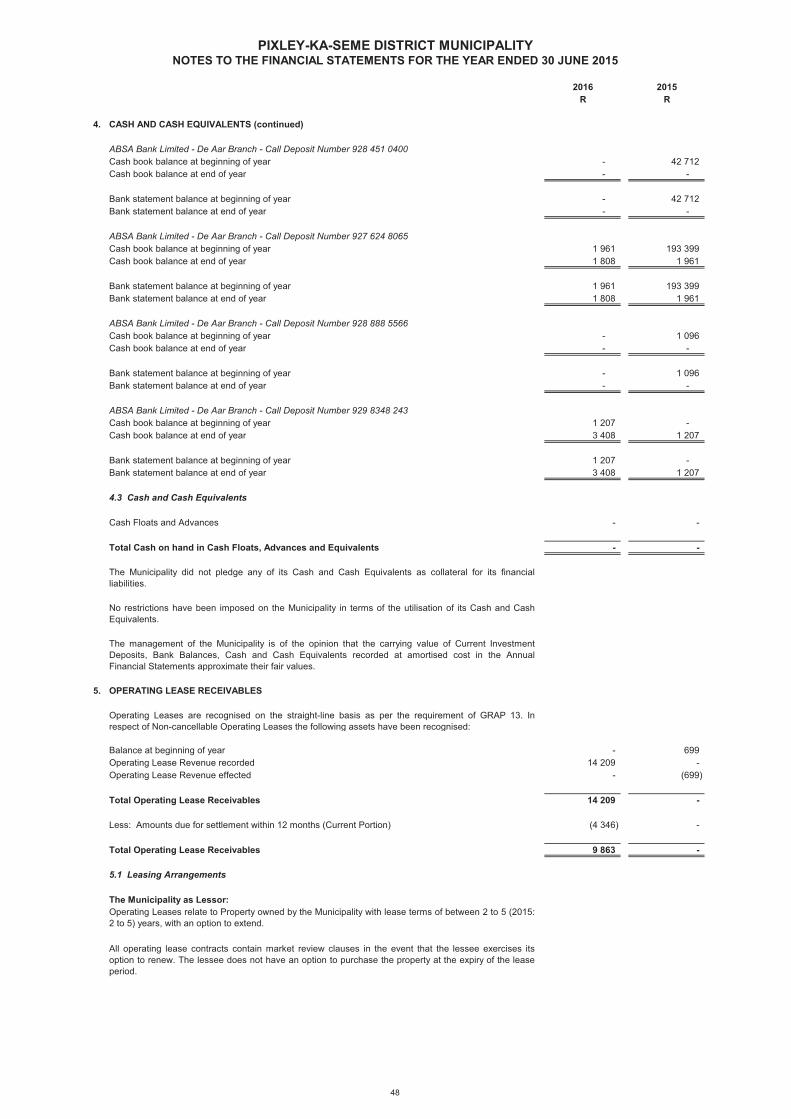
2016 2015R R
PIXLEY-KA-SEME DISTRICT MUNICIPALITYNOTES TO THE FINANCIAL STATEMENTS FOR THE YEAR ENDED 30 JUNE 2015
4. CASH AND CASH EQUIVALENTS (continued)
ABSA Bank Limited - De Aar Branch - Call Deposit Number 928 451 0400Cash book balance at beginning of year - 42 712 Cash book balance at end of year - -
Bank statement balance at beginning of year - 42 712 Bank statement balance at end of year - -
ABSA Bank Limited - De Aar Branch - Call Deposit Number 927 624 8065Cash book balance at beginning of year 1 961 193 399 Cash book balance at end of year 1 808 1 961
Bank statement balance at beginning of year 1 961 193 399 Bank statement balance at end of year 1 808 1 961
ABSA Bank Limited - De Aar Branch - Call Deposit Number 928 888 5566Cash book balance at beginning of year - 1 096 Cash book balance at end of year - -
Bank statement balance at beginning of year - 1 096 Bank statement balance at end of year - -
ABSA Bank Limited - De Aar Branch - Call Deposit Number 929 8348 243Cash book balance at beginning of year 1 207 - Cash book balance at end of year 3 408 1 207
Bank statement balance at beginning of year 1 207 - Bank statement balance at end of year 3 408 1 207
Cash Floats and Advances - -
Total Cash on hand in Cash Floats, Advances and Equivalents - - - -
5. OPERATING LEASE RECEIVABLES
Balance at beginning of year - 699 Operating Lease Revenue recorded 14 209 - Operating Lease Revenue effected - (699)
Total Operating Lease Receivables 14 209 -
Less: Amounts due for settlement within 12 months (Current Portion) (4 346) -
Total Operating Lease Receivables 9 863 - 0,00 0,00
5.1 Leasing Arrangements
The Municipality as Lessor:
No restrictions have been imposed on the Municipality in terms of the utilisation of its Cash and CashEquivalents.
Operating Leases relate to Property owned by the Municipality with lease terms of between 2 to 5 (2015:2 to 5) years, with an option to extend.
4.3 Cash and Cash Equivalents
The management of the Municipality is of the opinion that the carrying value of Current InvestmentDeposits, Bank Balances, Cash and Cash Equivalents recorded at amortised cost in the AnnualFinancial Statements approximate their fair values.
All operating lease contracts contain market review clauses in the event that the lessee exercises itsoption to renew. The lessee does not have an option to purchase the property at the expiry of the leaseperiod.
The Municipality did not pledge any of its Cash and Cash Equivalents as collateral for its financialliabilities.
Operating Leases are recognised on the straight-line basis as per the requirement of GRAP 13. Inrespect of Non-cancellable Operating Leases the following assets have been recognised:
48
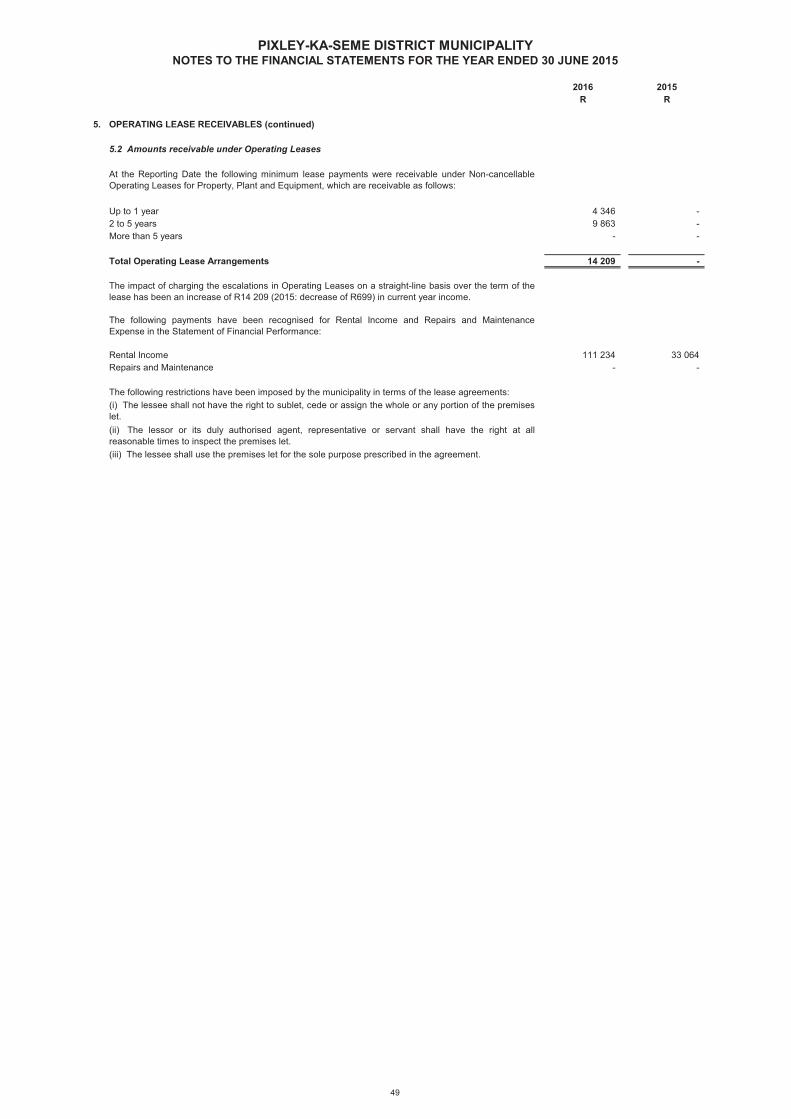
2016 2015R R
PIXLEY-KA-SEME DISTRICT MUNICIPALITYNOTES TO THE FINANCIAL STATEMENTS FOR THE YEAR ENDED 30 JUNE 2015
5. OPERATING LEASE RECEIVABLES (continued)
5.2 Amounts receivable under Operating Leases
Up to 1 year 4 346 - 2 to 5 years 9 863 - More than 5 years - -
Total Operating Lease Arrangements 14 209 -
Rental Income 111 234 33 064 Repairs and Maintenance - -
The following payments have been recognised for Rental Income and Repairs and MaintenanceExpense in the Statement of Financial Performance:
(iii) The lessee shall use the premises let for the sole purpose prescribed in the agreement.
(i) The lessee shall not have the right to sublet, cede or assign the whole or any portion of the premiseslet.(ii) The lessor or its duly authorised agent, representative or servant shall have the right at allreasonable times to inspect the premises let.
The following restrictions have been imposed by the municipality in terms of the lease agreements:
At the Reporting Date the following minimum lease payments were receivable under Non-cancellableOperating Leases for Property, Plant and Equipment, which are receivable as follows:
The impact of charging the escalations in Operating Leases on a straight-line basis over the term of thelease has been an increase of R14 209 (2015: decrease of R699) in current year income.
49
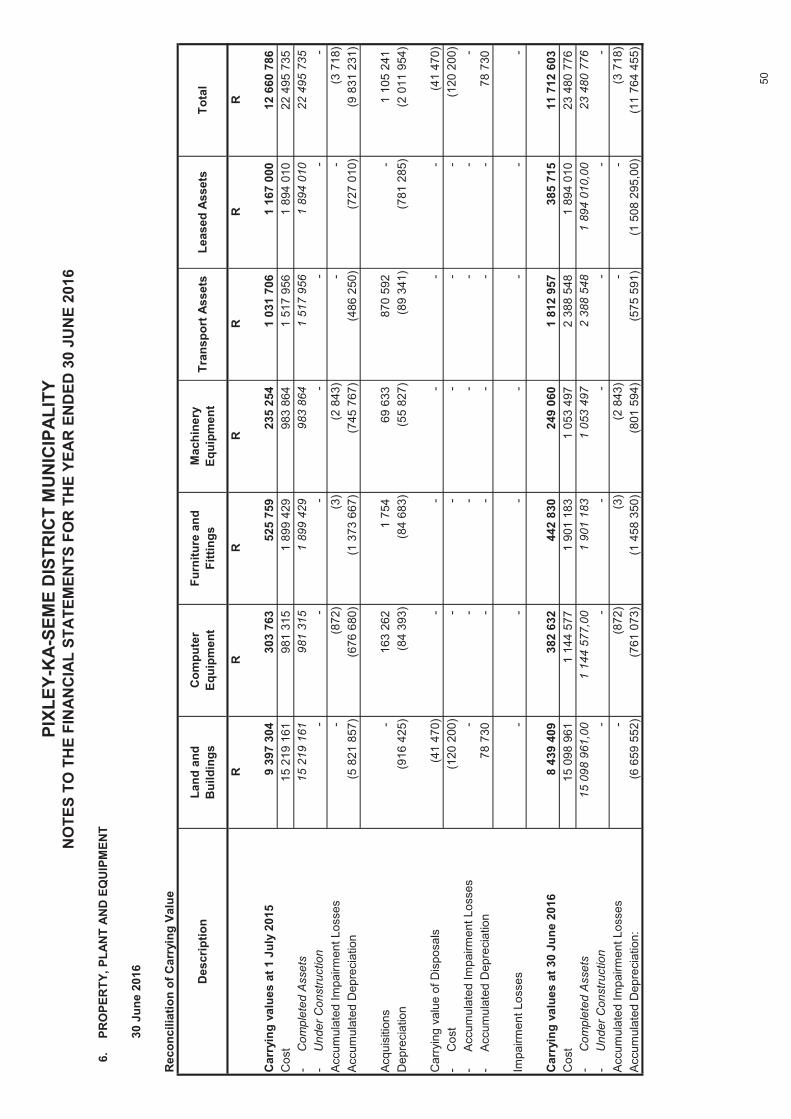
6.PR
OPE
RTY
, PLA
NT
AND
EQ
UIP
MEN
T
30 J
une
2016
Rec
onci
liatio
n of
Car
ryin
g Va
lue
RR
RR
RR
R
Car
ryin
g va
lues
at 1
Jul
y 20
159
397
304
30
3 76
3
52
5 75
9
23
5 25
4
1
031
706
1
167
000
12
660
786
C
ost
15 2
19 1
61
981
315
1 89
9 42
9
983
864
1 51
7 95
6
1 89
4 01
0
22 4
95 7
35
-
Com
plet
ed A
sset
s15
219
161
981
315
1 89
9 42
9
983
864
1 51
7 95
6
1 89
4 01
0
22 4
95 7
35
-
U
nder
Con
stru
ctio
n-
-
-
-
-
-
-
Acc
umul
ated
Impa
irmen
t Los
ses
-
(8
72)
(3)
(2
843
)
-
-
(3 7
18)
A
ccum
ulat
ed D
epre
ciat
ion
(5 8
21 8
57)
(6
76 6
80)
(1 3
73 6
67)
(7
45 7
67)
(486
250
)
(7
27 0
10)
(9 8
31 2
31)
Acqu
isiti
ons
-
16
3 26
2
1
754
69
633
87
0 59
2
-
1 10
5 24
1
Dep
reci
atio
n(9
16 4
25)
(84
393)
(84
683)
(55
827)
(89
341)
(781
285
)
(2
011
954
)
Car
ryin
g va
lue
of D
ispo
sals
(41
470)
-
-
-
-
-
(4
1 47
0)
-
C
ost
(120
200
)
-
-
-
-
-
(120
200
)
-
A
ccum
ulat
ed Im
pairm
ent L
osse
s-
-
-
-
-
-
-
-
Acc
umul
ated
Dep
reci
atio
n78
730
-
-
-
-
-
78 7
30
Impa
irmen
t Los
ses
-
-
-
-
-
-
-
Car
ryin
g va
lues
at 3
0 Ju
ne 2
016
8 43
9 40
9
382
632
442
830
249
060
1 81
2 95
7
385
715
11 7
12 6
03
Cos
t15
098
961
1
144
577
1
901
183
1
053
497
2
388
548
1
894
010
23
480
776
-
C
ompl
eted
Ass
ets
15 0
98 9
61,0
0
1 14
4 57
7,00
1
901
183
1
053
497
2
388
548
1
894
010,
00
23 4
80 7
76
-
U
nder
Con
stru
ctio
n-
-
-
-
-
-
-
Acc
umul
ated
Impa
irmen
t Los
ses
-
(8
72)
(3)
(2
843
)
-
-
(3 7
18)
A
ccum
ulat
ed D
epre
ciat
ion:
(6 6
59 5
52)
(7
61 0
73)
(1 4
58 3
50)
(8
01 5
94)
(575
591
)
(1
508
295
,00)
(1
1 76
4 45
5)
PIXL
EY-K
A-SE
ME
DIS
TRIC
T M
UN
ICIP
ALIT
YN
OTE
S TO
TH
E FI
NA
NC
IAL
STA
TEM
ENTS
FO
R T
HE
YEA
R E
ND
ED 3
0 JU
NE
2016
Land
and
B
uild
ings
Com
pute
r Eq
uipm
ent
Furn
iture
and
Fi
tting
sM
achi
nery
Eq
uipm
ent
Tran
spor
t Ass
ets
Leas
ed A
sset
sTo
tal
Des
crip
tion
50
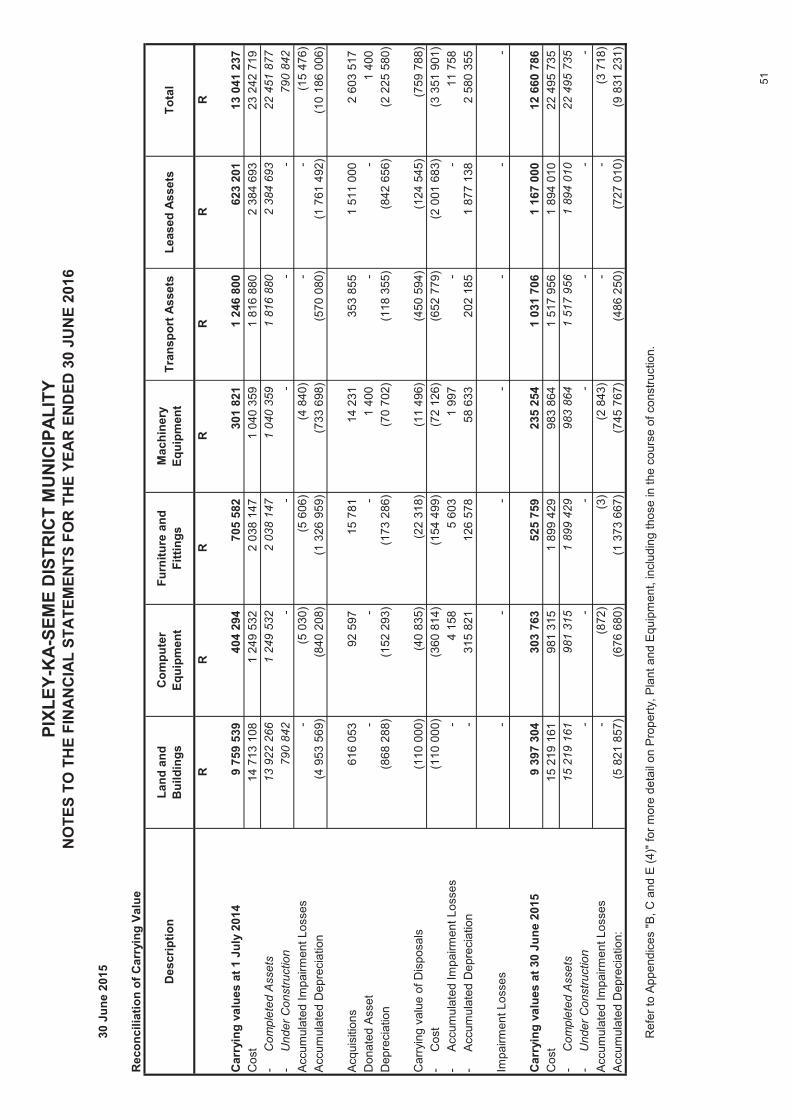
PIXL
EY-K
A-SE
ME
DIS
TRIC
T M
UN
ICIP
ALIT
YN
OTE
S TO
TH
E FI
NA
NC
IAL
STA
TEM
ENTS
FO
R T
HE
YEA
R E
ND
ED 3
0 JU
NE
2016
30 J
une
2015
Rec
onci
liatio
n of
Car
ryin
g Va
lue
RR
RR
RR
R
Car
ryin
g va
lues
at 1
Jul
y 20
149
759
539
40
4 29
4
70
5 58
2
30
1 82
1
1
246
800
62
3 20
1
13
041
237
C
ost
14 7
13 1
08
1 24
9 53
2
2 03
8 14
7
1 04
0 35
9
1 81
6 88
0
2 38
4 69
3
23 2
42 7
19
-
Com
plet
ed A
sset
s13
922
266
1 24
9 53
2
2 03
8 14
7
1 04
0 35
9
1 81
6 88
0
2 38
4 69
3
22 4
51 8
77
-
U
nder
Con
stru
ctio
n79
0 84
2
-
-
-
-
-
790
842
Acc
umul
ated
Impa
irmen
t Los
ses
-
(5
030
)
(5 6
06)
(4
840
)
-
-
(15
476)
Acc
umul
ated
Dep
reci
atio
n(4
953
569
)
(840
208
)
(1
326
959
)
(733
698
)
(5
70 0
80)
(1 7
61 4
92)
(1
0 18
6 00
6)
Acqu
isiti
ons
616
053
92 5
97
15 7
81
14 2
31
353
855
1 51
1 00
0
2 60
3 51
7
Don
ated
Ass
et-
-
-
1 40
0
-
-
1 40
0
Dep
reci
atio
n(8
68 2
88)
(152
293
)
(1
73 2
86)
(70
702)
(118
355
)
(8
42 6
56)
(2 2
25 5
80)
Car
ryin
g va
lue
of D
ispo
sals
(110
000
)
(4
0 83
5)
(2
2 31
8)
(1
1 49
6)
(4
50 5
94)
(124
545
)
(7
59 7
88)
-
Cos
t(1
10 0
00)
(360
814
)
(1
54 4
99)
(72
126)
(652
779
)
(2
001
683
)
(3 3
51 9
01)
-
A
ccum
ulat
ed Im
pairm
ent L
osse
s-
4 15
8
5 60
3
1 99
7
-
-
11 7
58
-
Acc
umul
ated
Dep
reci
atio
n-
315
821
126
578
58 6
33
202
185
1 87
7 13
8
2 58
0 35
5
Impa
irmen
t Los
ses
-
-
-
-
-
-
-
Car
ryin
g va
lues
at 3
0 Ju
ne 2
015
9 39
7 30
4
303
763
525
759
235
254
1 03
1 70
6
1 16
7 00
0
12 6
60 7
86
Cos
t15
219
161
98
1 31
5
1
899
429
98
3 86
4
1
517
956
1
894
010
22
495
735
-
C
ompl
eted
Ass
ets
15 2
19 1
61
98
1 31
5
1
899
429
98
3 86
4
1
517
956
1
894
010
22
495
735
-
Und
er C
onst
ruct
ion
-
-
-
-
-
-
-
A
ccum
ulat
ed Im
pairm
ent L
osse
s-
(872
)
(3
)
(2 8
43)
-
-
(3
718
)
Acc
umul
ated
Dep
reci
atio
n:(5
821
857
)
(676
680
)
(1
373
667
)
(745
767
)
(4
86 2
50)
(727
010
)
(9
831
231
)
Des
crip
tion
Land
and
B
uild
ings
Com
pute
r Eq
uipm
ent
Ref
er to
App
endi
ces
"B, C
and
E (4
)" fo
r mor
e de
tail
on P
rope
rty, P
lant
and
Equ
ipm
ent,
incl
udin
g th
ose
in th
e co
urse
of c
onst
ruct
ion.
Furn
iture
and
Fi
tting
sM
achi
nery
Eq
uipm
ent
Tran
spor
t Ass
ets
Leas
ed A
sset
sTo
tal 51
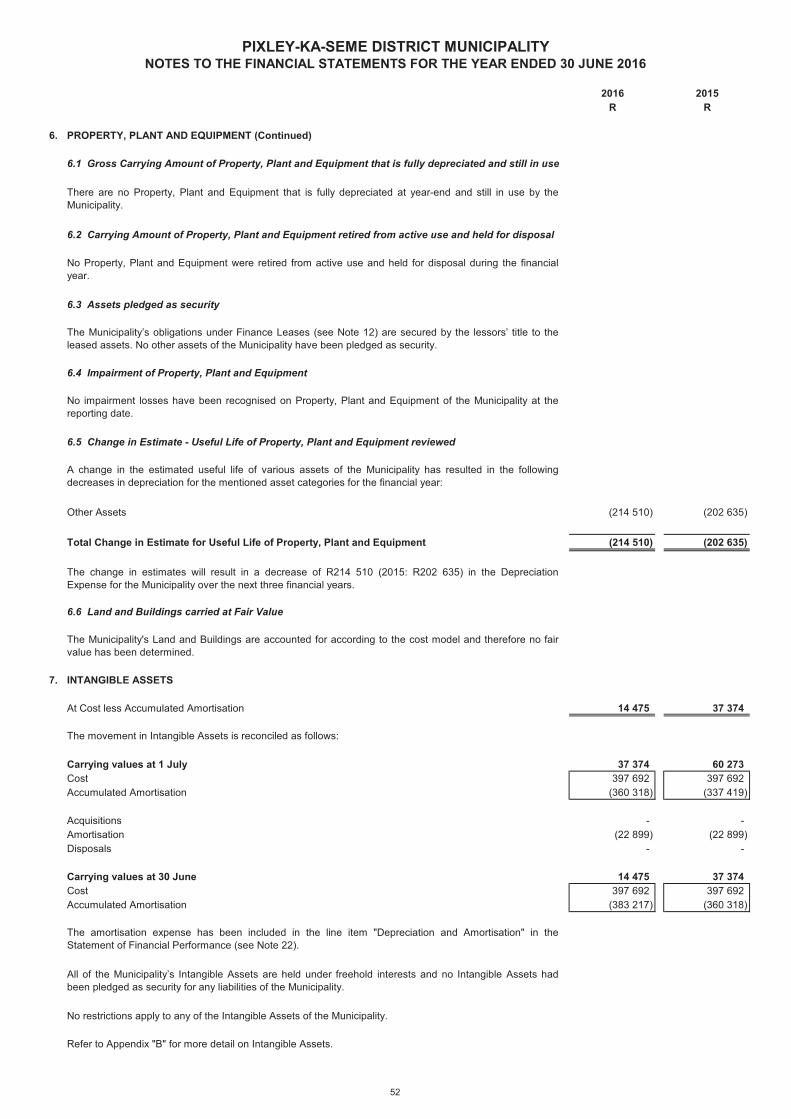
2016 2015R R
6. PROPERTY, PLANT AND EQUIPMENT (Continued)
6.1 Gross Carrying Amount of Property, Plant and Equipment that is fully depreciated and still in use
6.2 Carrying Amount of Property, Plant and Equipment retired from active use and held for disposal
6.3 Assets pledged as security
6.4 Impairment of Property, Plant and Equipment
6.5 Change in Estimate - Useful Life of Property, Plant and Equipment reviewed
Other Assets (214 510) (202 635)
Total Change in Estimate for Useful Life of Property, Plant and Equipment (214 510) (202 635)
6.6 Land and Buildings carried at Fair Value
7. INTANGIBLE ASSETS
At Cost less Accumulated Amortisation 14 475 37 374
Carrying values at 1 July 37 374 60 273 Cost 397 692 397 692 Accumulated Amortisation (360 318) (337 419)
Acquisitions - - Amortisation (22 899) (22 899) Disposals - -
Carrying values at 30 June 14 475 37 374 Cost 397 692 397 692 Accumulated Amortisation (383 217) (360 318)
0,00
No impairment losses have been recognised on Property, Plant and Equipment of the Municipality at thereporting date.
No restrictions apply to any of the Intangible Assets of the Municipality.
Refer to Appendix "B" for more detail on Intangible Assets.
The amortisation expense has been included in the line item "Depreciation and Amortisation" in theStatement of Financial Performance (see Note 22).
All of the Municipality’s Intangible Assets are held under freehold interests and no Intangible Assets hadbeen pledged as security for any liabilities of the Municipality.
The change in estimates will result in a decrease of R214 510 (2015: R202 635) in the DepreciationExpense for the Municipality over the next three financial years.
PIXLEY-KA-SEME DISTRICT MUNICIPALITYNOTES TO THE FINANCIAL STATEMENTS FOR THE YEAR ENDED 30 JUNE 2016
The Municipality’s obligations under Finance Leases (see Note 12) are secured by the lessors’ title to theleased assets. No other assets of the Municipality have been pledged as security.
There are no Property, Plant and Equipment that is fully depreciated at year-end and still in use by theMunicipality.
No Property, Plant and Equipment were retired from active use and held for disposal during the financialyear.
A change in the estimated useful life of various assets of the Municipality has resulted in the followingdecreases in depreciation for the mentioned asset categories for the financial year:
The movement in Intangible Assets is reconciled as follows:
The Municipality's Land and Buildings are accounted for according to the cost model and therefore no fairvalue has been determined.
52
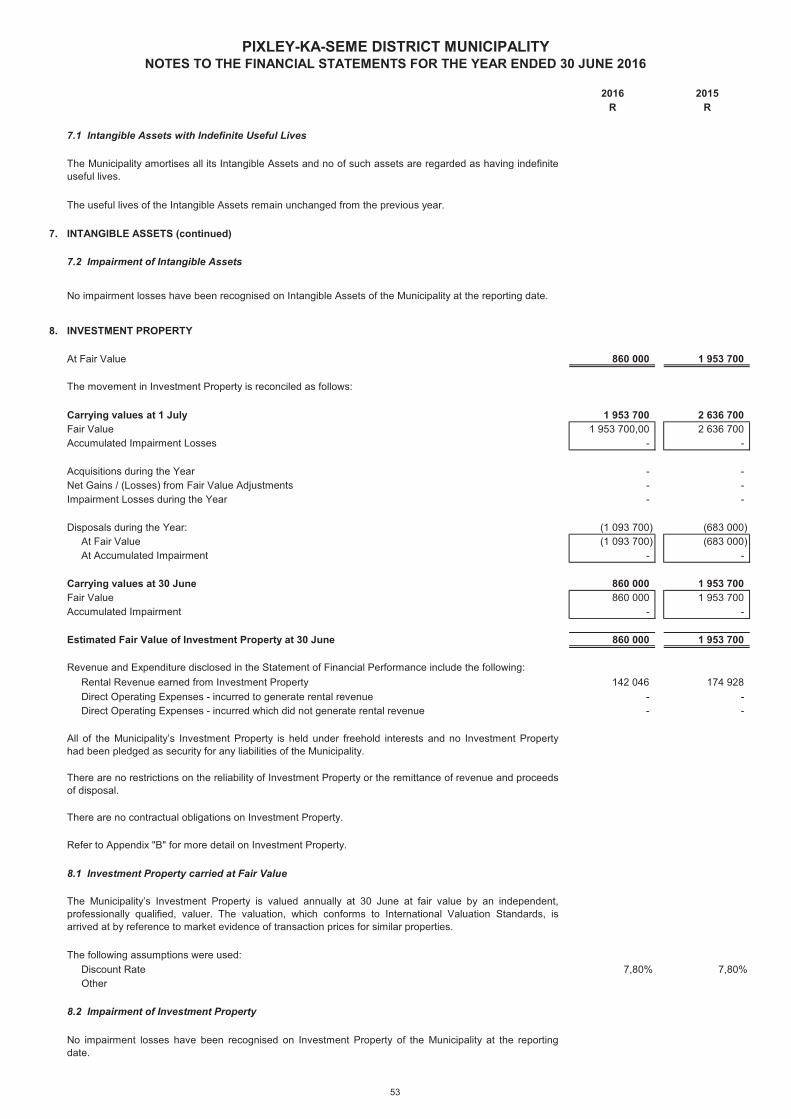
2016 2015R R
PIXLEY-KA-SEME DISTRICT MUNICIPALITYNOTES TO THE FINANCIAL STATEMENTS FOR THE YEAR ENDED 30 JUNE 2016
7.1 Intangible Assets with Indefinite Useful Lives
7. INTANGIBLE ASSETS (continued)
7.2 Impairment of Intangible Assets
8. INVESTMENT PROPERTY
At Fair Value 860 000 1 953 700
Carrying values at 1 July 1 953 700 2 636 700 Fair Value 1 953 700,00 2 636 700 Accumulated Impairment Losses - -
Acquisitions during the Year - - Net Gains / (Losses) from Fair Value Adjustments - - Impairment Losses during the Year - -
Disposals during the Year: (1 093 700) (683 000) At Fair Value (1 093 700) (683 000) At Accumulated Impairment - -
Carrying values at 30 June 860 000 1 953 700 Fair Value 860 000 1 953 700 Accumulated Impairment - -
0,00 0,00Estimated Fair Value of Investment Property at 30 June 860 000 1 953 700
Rental Revenue earned from Investment Property 142 046 174 928 Direct Operating Expenses - incurred to generate rental revenue - - Direct Operating Expenses - incurred which did not generate rental revenue - -
There are no contractual obligations on Investment Property.
8.1 Investment Property carried at Fair Value
Discount Rate 7,80% 7,80% Other
8.2 Impairment of Investment Property
The following assumptions were used:
The Municipality amortises all its Intangible Assets and no of such assets are regarded as having indefiniteuseful lives.
The useful lives of the Intangible Assets remain unchanged from the previous year.
The movement in Investment Property is reconciled as follows:
No impairment losses have been recognised on Intangible Assets of the Municipality at the reporting date.
Revenue and Expenditure disclosed in the Statement of Financial Performance include the following:
The Municipality’s Investment Property is valued annually at 30 June at fair value by an independent,professionally qualified, valuer. The valuation, which conforms to International Valuation Standards, isarrived at by reference to market evidence of transaction prices for similar properties.
There are no restrictions on the reliability of Investment Property or the remittance of revenue and proceedsof disposal.
All of the Municipality’s Investment Property is held under freehold interests and no Investment Propertyhad been pledged as security for any liabilities of the Municipality.
Refer to Appendix "B" for more detail on Investment Property.
No impairment losses have been recognised on Investment Property of the Municipality at the reportingdate.
53
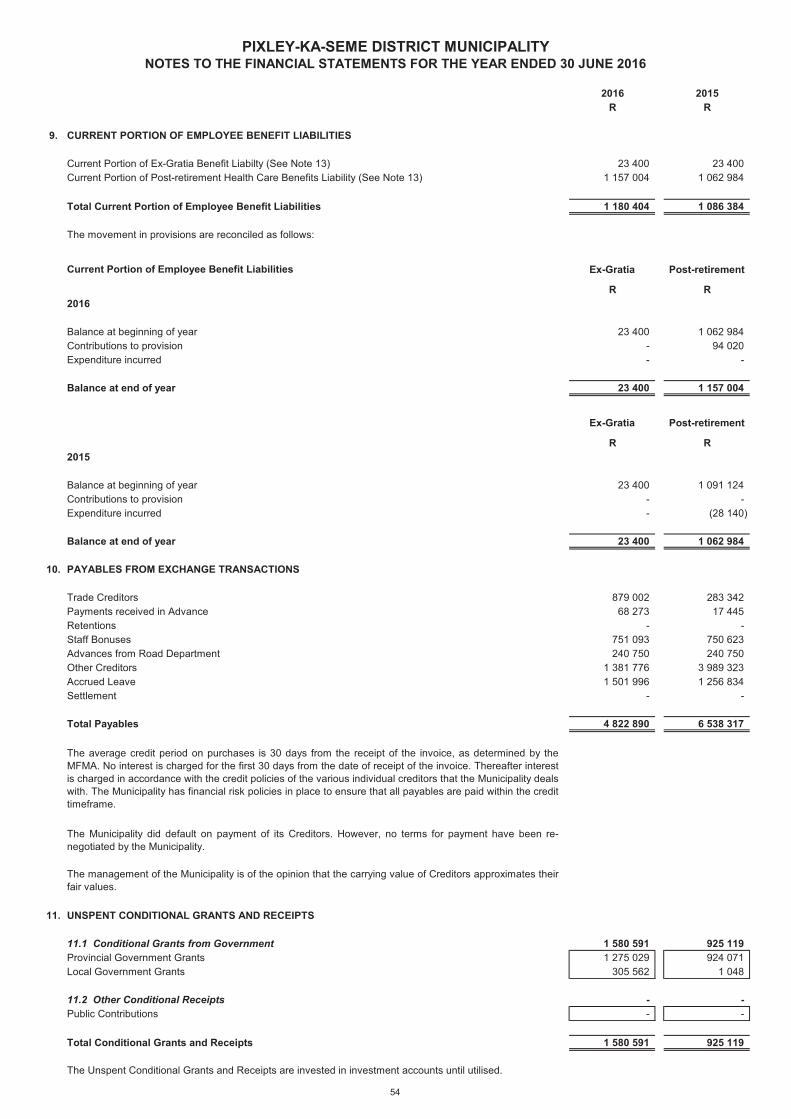
2016 2015R R
PIXLEY-KA-SEME DISTRICT MUNICIPALITYNOTES TO THE FINANCIAL STATEMENTS FOR THE YEAR ENDED 30 JUNE 2016
9. CURRENT PORTION OF EMPLOYEE BENEFIT LIABILITIES
Current Portion of Ex-Gratia Benefit Liabilty (See Note 13) 23 400 23 400 Current Portion of Post-retirement Health Care Benefits Liability (See Note 13) 1 157 004 1 062 984
Total Current Portion of Employee Benefit Liabilities 1 180 404 1 086 384 0,00 0,00
The movement in provisions are reconciled as follows:
Current Portion of Employee Benefit Liabilities Ex-Gratia Post-retirement
R R2016
Balance at beginning of year 23 400 1 062 984 Contributions to provision - 94 020 Expenditure incurred - -
Balance at end of year 23 400 1 157 004 0,00 0,00
Ex-Gratia Post-retirement
R R2015
Balance at beginning of year 23 400 1 091 124 Contributions to provision - - Expenditure incurred - (28 140)
Balance at end of year 23 400 1 062 984 0,00 0,00
10. PAYABLES FROM EXCHANGE TRANSACTIONS
Trade Creditors 879 002 283 342 Payments received in Advance 68 273 17 445 Retentions - - Staff Bonuses 751 093 750 623 Advances from Road Department 240 750 240 750 Other Creditors 1 381 776 3 989 323 Accrued Leave 1 501 996 1 256 834 Settlement - -
Total Payables 4 822 890 6 538 317 0,00 0,00
11. UNSPENT CONDITIONAL GRANTS AND RECEIPTS
11.1 Conditional Grants from Government 1 580 591 925 119 Provincial Government Grants 1 275 029 924 071 Local Government Grants 305 562 1 048
11.2 Other Conditional Receipts - - Public Contributions - -
Total Conditional Grants and Receipts 1 580 591 925 119 0,00 0,00
The management of the Municipality is of the opinion that the carrying value of Creditors approximates theirfair values.
The average credit period on purchases is 30 days from the receipt of the invoice, as determined by theMFMA. No interest is charged for the first 30 days from the date of receipt of the invoice. Thereafter interestis charged in accordance with the credit policies of the various individual creditors that the Municipality dealswith. The Municipality has financial risk policies in place to ensure that all payables are paid within the credittimeframe.
The Municipality did default on payment of its Creditors. However, no terms for payment have been re-negotiated by the Municipality.
The Unspent Conditional Grants and Receipts are invested in investment accounts until utilised.
54
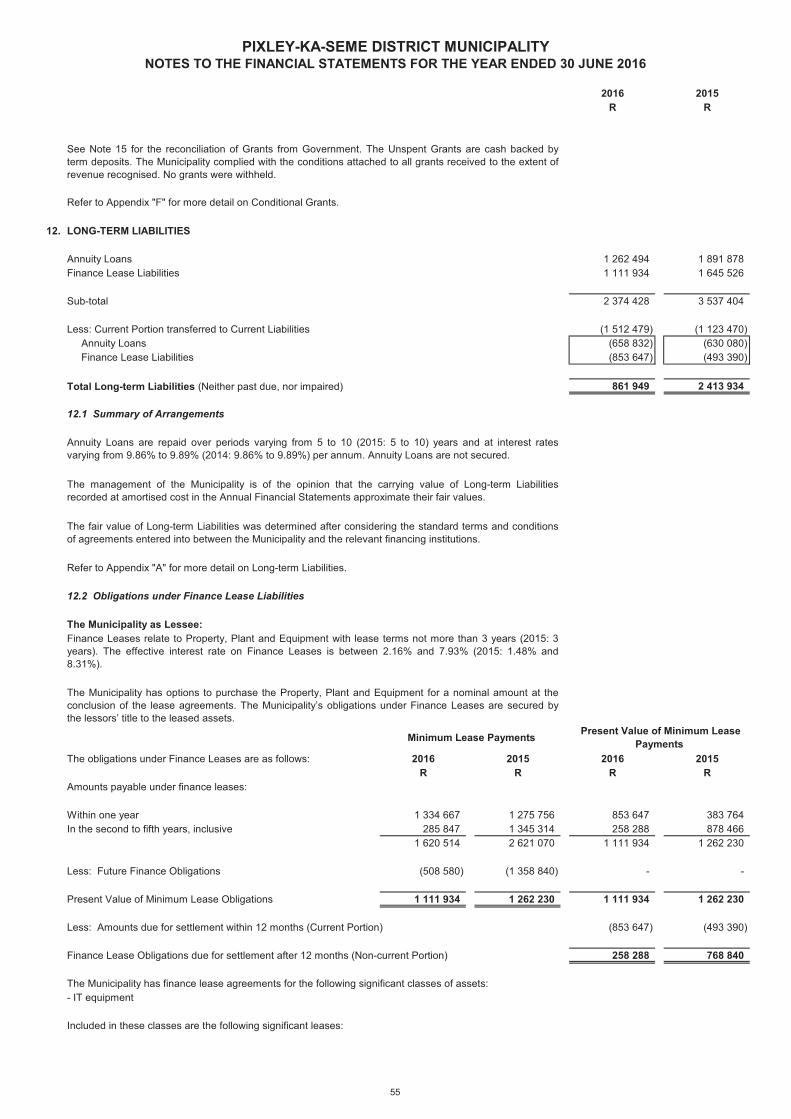
2016 2015R R
PIXLEY-KA-SEME DISTRICT MUNICIPALITYNOTES TO THE FINANCIAL STATEMENTS FOR THE YEAR ENDED 30 JUNE 2016
12. LONG-TERM LIABILITIES
Annuity Loans 1 262 494 1 891 878 Finance Lease Liabilities 1 111 934 1 645 526
Sub-total 2 374 428 3 537 404
Less: Current Portion transferred to Current Liabilities (1 512 479) (1 123 470) Annuity Loans (658 832) (630 080) Finance Lease Liabilities (853 647) (493 390)
Total Long-term Liabilities (Neither past due, nor impaired) 861 949 2 413 934
The obligations under Finance Leases are as follows: 2016 2015 2016 2015R R R R
Amounts payable under finance leases:
Within one year 1 334 667 1 275 756 853 647 383 764 In the second to fifth years, inclusive 285 847 1 345 314 258 288 878 466
1 620 514 2 621 070 1 111 934 1 262 230
Less: Future Finance Obligations (508 580) (1 358 840) - -
Present Value of Minimum Lease Obligations 1 111 934 1 262 230 1 111 934 1 262 230
Less: Amounts due for settlement within 12 months (Current Portion) (853 647) (493 390)
Finance Lease Obligations due for settlement after 12 months (Non-current Portion) 258 288 768 840
The Municipality has finance lease agreements for the following significant classes of assets:- IT equipment
Included in these classes are the following significant leases:
Refer to Appendix "F" for more detail on Conditional Grants.
See Note 15 for the reconciliation of Grants from Government. The Unspent Grants are cash backed byterm deposits. The Municipality complied with the conditions attached to all grants received to the extent ofrevenue recognised. No grants were withheld.
The management of the Municipality is of the opinion that the carrying value of Long-term Liabilitiesrecorded at amortised cost in the Annual Financial Statements approximate their fair values.
The fair value of Long-term Liabilities was determined after considering the standard terms and conditionsof agreements entered into between the Municipality and the relevant financing institutions.
Refer to Appendix "A" for more detail on Long-term Liabilities.
Annuity Loans are repaid over periods varying from 5 to 10 (2015: 5 to 10) years and at interest ratesvarying from 9.86% to 9.89% (2014: 9.86% to 9.89%) per annum. Annuity Loans are not secured.
12.1 Summary of Arrangements
12.2 Obligations under Finance Lease Liabilities
The Municipality as Lessee:Finance Leases relate to Property, Plant and Equipment with lease terms not more than 3 years (2015: 3years). The effective interest rate on Finance Leases is between 2.16% and 7.93% (2015: 1.48% and8.31%).
The Municipality has options to purchase the Property, Plant and Equipment for a nominal amount at theconclusion of the lease agreements. The Municipality’s obligations under Finance Leases are secured bythe lessors’ title to the leased assets.
Minimum Lease Payments Present Value of Minimum Lease Payments
55
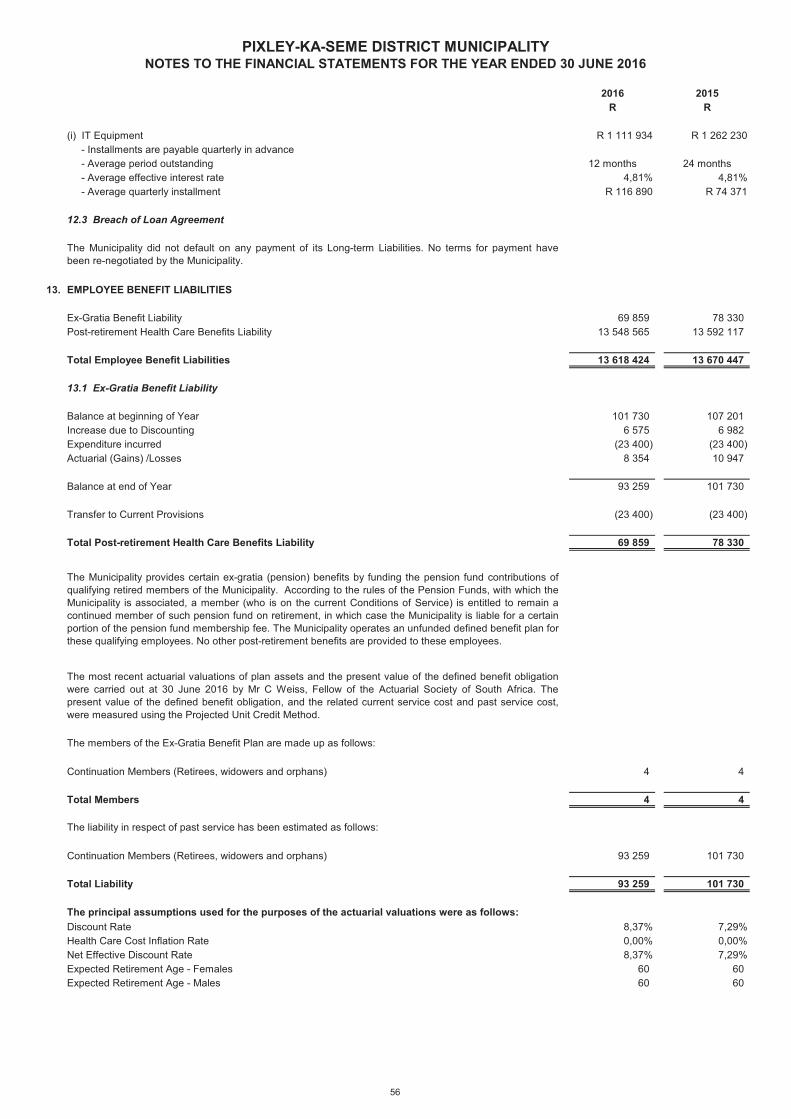
2016 2015R R
PIXLEY-KA-SEME DISTRICT MUNICIPALITYNOTES TO THE FINANCIAL STATEMENTS FOR THE YEAR ENDED 30 JUNE 2016
(i) IT Equipment R 1 111 934 R 1 262 230 - Installments are payable quarterly in advance - Average period outstanding 12 months 24 months - Average effective interest rate 4,81% 4,81% - Average quarterly installment R 116 890 R 74 371
12.3 Breach of Loan Agreement
13. EMPLOYEE BENEFIT LIABILITIES
Ex-Gratia Benefit Liability 69 859 78 330 Post-retirement Health Care Benefits Liability 13 548 565 13 592 117
Total Employee Benefit Liabilities 13 618 424 13 670 447 0,00 0,00
13.1 Ex-Gratia Benefit Liability
Balance at beginning of Year 101 730 107 201 Increase due to Discounting 6 575 6 982 Expenditure incurred (23 400) (23 400) Actuarial (Gains) /Losses 8 354 10 947
Balance at end of Year 93 259 101 730
Transfer to Current Provisions (23 400) (23 400)
Total Post-retirement Health Care Benefits Liability 69 859 78 330 0,00 0,00
Continuation Members (Retirees, widowers and orphans) 4 4
Total Members 4 4
Continuation Members (Retirees, widowers and orphans) 93 259 101 730
Total Liability 93 259 101 730 0,00 0,00
Discount Rate 8,37% 7,29%Health Care Cost Inflation Rate 0,00% 0,00%Net Effective Discount Rate 8,37% 7,29%Expected Retirement Age - Females 60 60 Expected Retirement Age - Males 60 60
The liability in respect of past service has been estimated as follows:
The Municipality did not default on any payment of its Long-term Liabilities. No terms for payment havebeen re-negotiated by the Municipality.
The most recent actuarial valuations of plan assets and the present value of the defined benefit obligationwere carried out at 30 June 2016 by Mr C Weiss, Fellow of the Actuarial Society of South Africa. Thepresent value of the defined benefit obligation, and the related current service cost and past service cost,were measured using the Projected Unit Credit Method.
The members of the Ex-Gratia Benefit Plan are made up as follows:
The principal assumptions used for the purposes of the actuarial valuations were as follows:
The Municipality provides certain ex-gratia (pension) benefits by funding the pension fund contributions ofqualifying retired members of the Municipality. According to the rules of the Pension Funds, with which theMunicipality is associated, a member (who is on the current Conditions of Service) is entitled to remain acontinued member of such pension fund on retirement, in which case the Municipality is liable for a certainportion of the pension fund membership fee. The Municipality operates an unfunded defined benefit plan forthese qualifying employees. No other post-retirement benefits are provided to these employees.
56
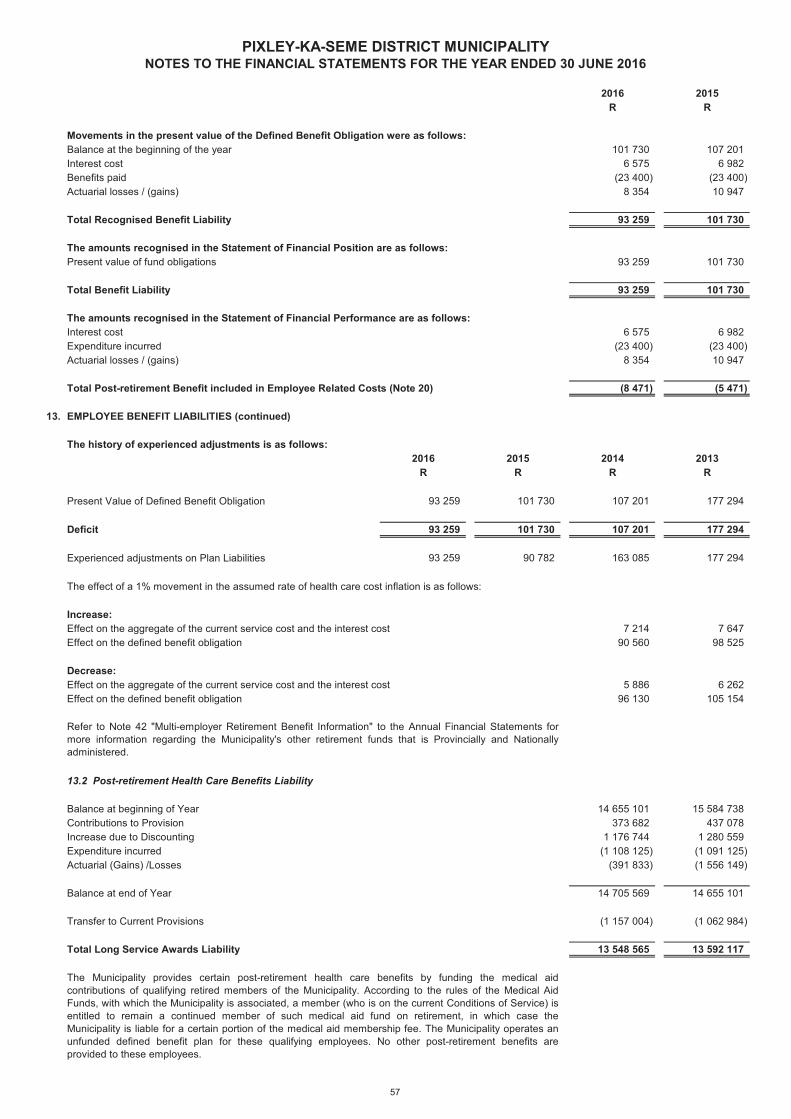
2016 2015R R
PIXLEY-KA-SEME DISTRICT MUNICIPALITYNOTES TO THE FINANCIAL STATEMENTS FOR THE YEAR ENDED 30 JUNE 2016
Movements in the present value of the Defined Benefit Obligation were as follows:Balance at the beginning of the year 101 730 107 201 Interest cost 6 575 6 982 Benefits paid (23 400) (23 400) Actuarial losses / (gains) 8 354 10 947
Total Recognised Benefit Liability 93 259 101 730 0,00 0,00
The amounts recognised in the Statement of Financial Position are as follows:Present value of fund obligations 93 259 101 730
Total Benefit Liability 93 259 101 730 0,00 0,00
The amounts recognised in the Statement of Financial Performance are as follows:Interest cost 6 575 6 982 Expenditure incurred (23 400) (23 400) Actuarial losses / (gains) 8 354 10 947
Total Post-retirement Benefit included in Employee Related Costs (Note 20) (8 471) (5 471)
13. EMPLOYEE BENEFIT LIABILITIES (continued)
2016 2015 2014 2013R R R R
Present Value of Defined Benefit Obligation 93 259 101 730 107 201 177 294
Deficit 93 259 101 730 107 201 177 294
Experienced adjustments on Plan Liabilities 93 259 90 782 163 085 177 294
The effect of a 1% movement in the assumed rate of health care cost inflation is as follows:
Increase:Effect on the aggregate of the current service cost and the interest cost 7 214 7 647 Effect on the defined benefit obligation 90 560 98 525
Decrease:Effect on the aggregate of the current service cost and the interest cost 5 886 6 262 Effect on the defined benefit obligation 96 130 105 154
13.2 Post-retirement Health Care Benefits Liability
Balance at beginning of Year 14 655 101 15 584 738 Contributions to Provision 373 682 437 078 Increase due to Discounting 1 176 744 1 280 559 Expenditure incurred (1 108 125) (1 091 125) Actuarial (Gains) /Losses (391 833) (1 556 149)
Balance at end of Year 14 705 569 14 655 101
Transfer to Current Provisions (1 157 004) (1 062 984)
Total Long Service Awards Liability 13 548 565 13 592 117 - -
The Municipality provides certain post-retirement health care benefits by funding the medical aidcontributions of qualifying retired members of the Municipality. According to the rules of the Medical AidFunds, with which the Municipality is associated, a member (who is on the current Conditions of Service) isentitled to remain a continued member of such medical aid fund on retirement, in which case theMunicipality is liable for a certain portion of the medical aid membership fee. The Municipality operates anunfunded defined benefit plan for these qualifying employees. No other post-retirement benefits areprovided to these employees.
Refer to Note 42 "Multi-employer Retirement Benefit Information" to the Annual Financial Statements formore information regarding the Municipality's other retirement funds that is Provincially and Nationallyadministered.
The history of experienced adjustments is as follows:
57
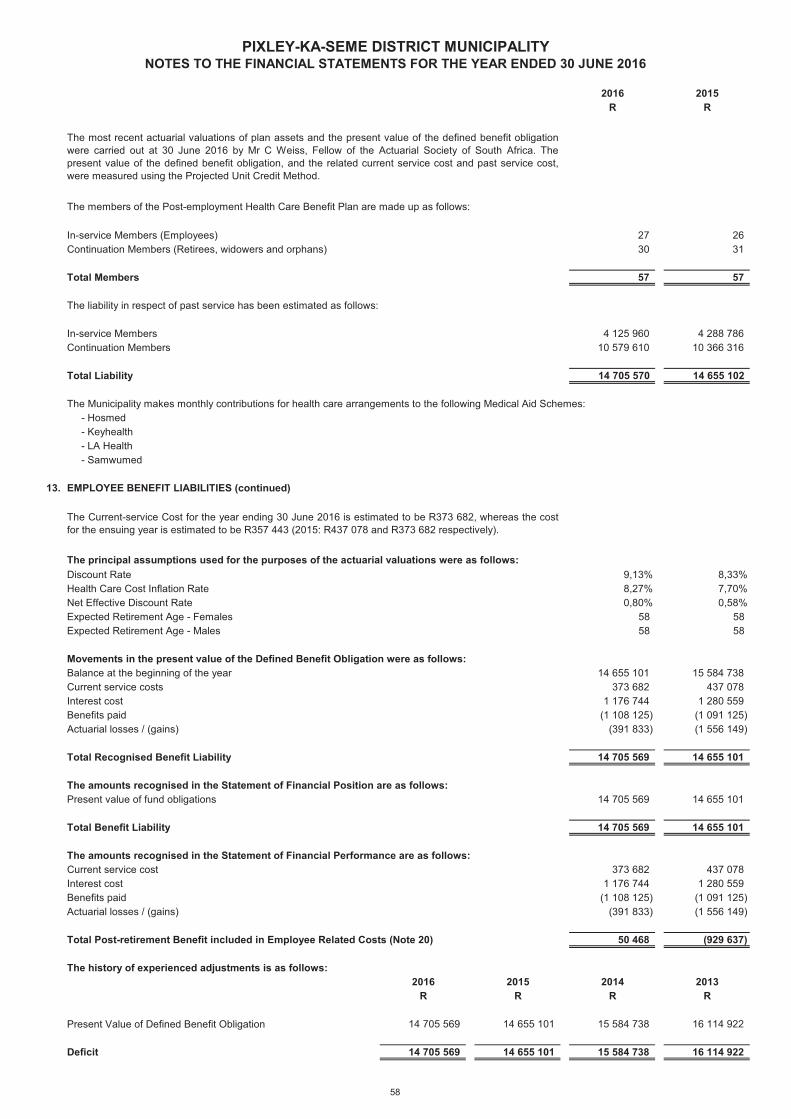
2016 2015R R
PIXLEY-KA-SEME DISTRICT MUNICIPALITYNOTES TO THE FINANCIAL STATEMENTS FOR THE YEAR ENDED 30 JUNE 2016
In-service Members (Employees) 27 26 Continuation Members (Retirees, widowers and orphans) 30 31
Total Members 57 57
The liability in respect of past service has been estimated as follows:
In-service Members 4 125 960 4 288 786 Continuation Members 10 579 610 10 366 316
Total Liability 14 705 570 14 655 102
The Municipality makes monthly contributions for health care arrangements to the following Medical Aid Schemes: - Hosmed - Keyhealth - LA Health - Samwumed
13. EMPLOYEE BENEFIT LIABILITIES (continued)
Discount Rate 9,13% 8,33%Health Care Cost Inflation Rate 8,27% 7,70%Net Effective Discount Rate 0,80% 0,58%Expected Retirement Age - Females 58 58 Expected Retirement Age - Males 58 58
Movements in the present value of the Defined Benefit Obligation were as follows:Balance at the beginning of the year 14 655 101 15 584 738 Current service costs 373 682 437 078 Interest cost 1 176 744 1 280 559 Benefits paid (1 108 125) (1 091 125) Actuarial losses / (gains) (391 833) (1 556 149)
Total Recognised Benefit Liability 14 705 569 14 655 101 0,00 0,00
The amounts recognised in the Statement of Financial Position are as follows:Present value of fund obligations 14 705 569 14 655 101
Total Benefit Liability 14 705 569 14 655 101
The amounts recognised in the Statement of Financial Performance are as follows:Current service cost 373 682 437 078 Interest cost 1 176 744 1 280 559 Benefits paid (1 108 125) (1 091 125) Actuarial losses / (gains) (391 833) (1 556 149)
Total Post-retirement Benefit included in Employee Related Costs (Note 20) 50 468 (929 637)
2016 2015 2014 2013R R R R
Present Value of Defined Benefit Obligation 14 705 569 14 655 101 15 584 738 16 114 922
Deficit 14 705 569 14 655 101 15 584 738 16 114 922
The Current-service Cost for the year ending 30 June 2016 is estimated to be R373 682, whereas the costfor the ensuing year is estimated to be R357 443 (2015: R437 078 and R373 682 respectively).
The most recent actuarial valuations of plan assets and the present value of the defined benefit obligationwere carried out at 30 June 2016 by Mr C Weiss, Fellow of the Actuarial Society of South Africa. Thepresent value of the defined benefit obligation, and the related current service cost and past service cost,were measured using the Projected Unit Credit Method.
The history of experienced adjustments is as follows:
The principal assumptions used for the purposes of the actuarial valuations were as follows:
The members of the Post-employment Health Care Benefit Plan are made up as follows:
58
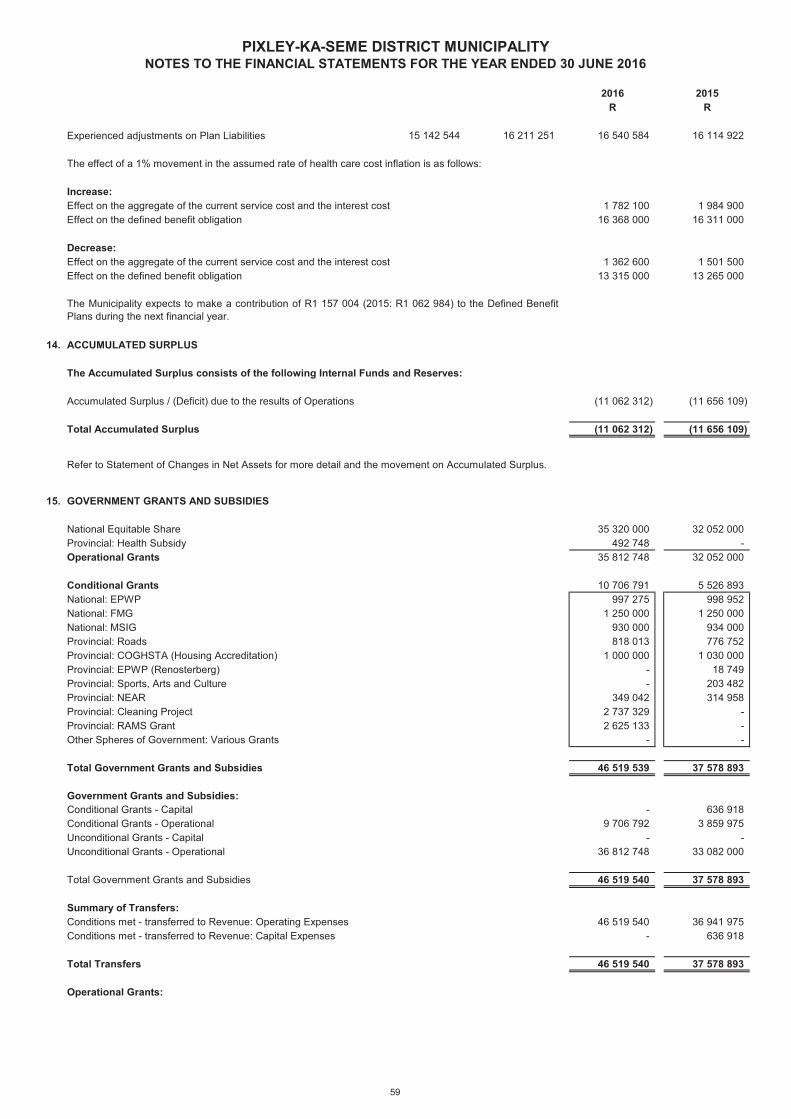
2016 2015R R
PIXLEY-KA-SEME DISTRICT MUNICIPALITYNOTES TO THE FINANCIAL STATEMENTS FOR THE YEAR ENDED 30 JUNE 2016
Experienced adjustments on Plan Liabilities 15 142 544 16 211 251 16 540 584 16 114 922
The effect of a 1% movement in the assumed rate of health care cost inflation is as follows:
Increase:Effect on the aggregate of the current service cost and the interest cost 1 782 100 1 984 900 Effect on the defined benefit obligation 16 368 000 16 311 000
Decrease:Effect on the aggregate of the current service cost and the interest cost 1 362 600 1 501 500 Effect on the defined benefit obligation 13 315 000 13 265 000
14. ACCUMULATED SURPLUS
The Accumulated Surplus consists of the following Internal Funds and Reserves:
Accumulated Surplus / (Deficit) due to the results of Operations (11 062 312) (11 656 109)
Total Accumulated Surplus (11 062 312) (11 656 109) 0,00 0,00
15. GOVERNMENT GRANTS AND SUBSIDIES
National Equitable Share 35 320 000 32 052 000 Provincial: Health Subsidy 492 748 - Operational Grants 35 812 748 32 052 000
Conditional Grants 10 706 791 5 526 893 National: EPWP 997 275 998 952 National: FMG 1 250 000 1 250 000 National: MSIG 930 000 934 000 Provincial: Roads 818 013 776 752 Provincial: COGHSTA (Housing Accreditation) 1 000 000 1 030 000 Provincial: EPWP (Renosterberg) - 18 749 Provincial: Sports, Arts and Culture - 203 482 Provincial: NEAR 349 042 314 958 Provincial: Cleaning Project 2 737 329 - Provincial: RAMS Grant 2 625 133 - Other Spheres of Government: Various Grants - -
Total Government Grants and Subsidies 46 519 539 37 578 893
Government Grants and Subsidies:Conditional Grants - Capital - 636 918 Conditional Grants - Operational 9 706 792 3 859 975 Unconditional Grants - Capital - - Unconditional Grants - Operational 36 812 748 33 082 000
Total Government Grants and Subsidies 46 519 540 37 578 893
Summary of Transfers:Conditions met - transferred to Revenue: Operating Expenses 46 519 540 36 941 975 Conditions met - transferred to Revenue: Capital Expenses - 636 918
Total Transfers 46 519 540 37 578 893
Operational Grants:
Refer to Statement of Changes in Net Assets for more detail and the movement on Accumulated Surplus.
The Municipality expects to make a contribution of R1 157 004 (2015: R1 062 984) to the Defined BenefitPlans during the next financial year.
59
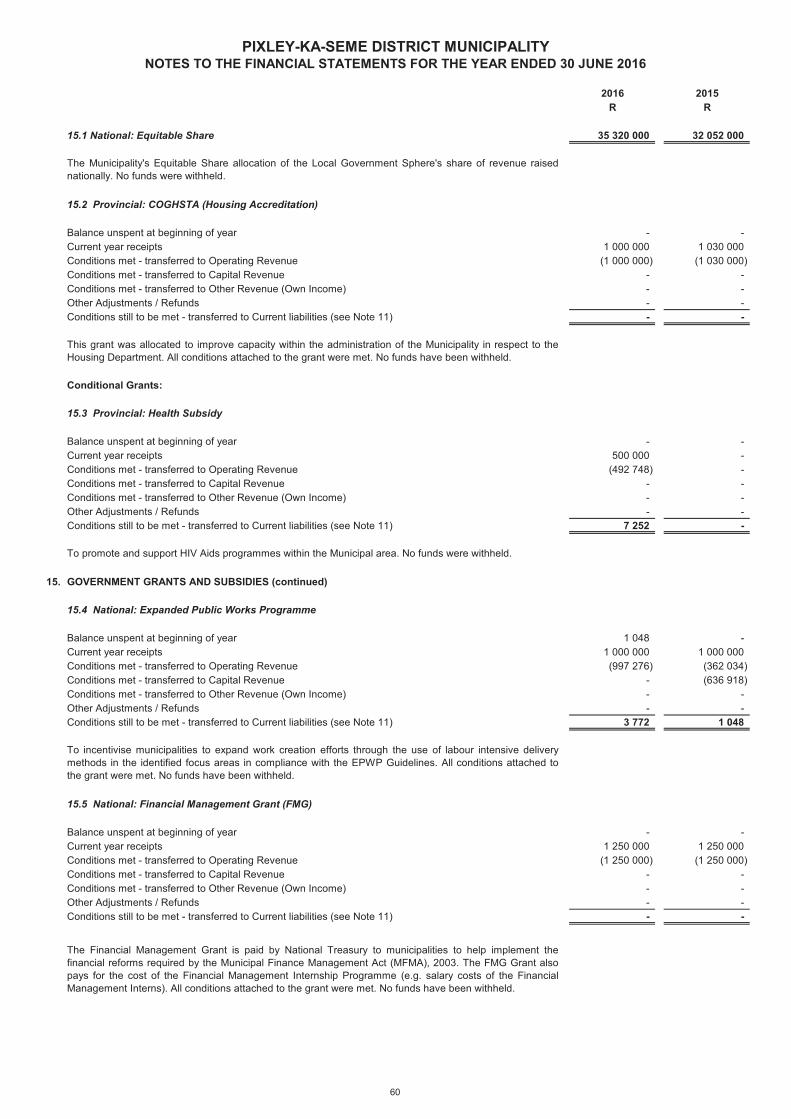
2016 2015R R
PIXLEY-KA-SEME DISTRICT MUNICIPALITYNOTES TO THE FINANCIAL STATEMENTS FOR THE YEAR ENDED 30 JUNE 2016
15.1 National: Equitable Share 35 320 000 32 052 000
15.2 Provincial: COGHSTA (Housing Accreditation)
Balance unspent at beginning of year - - Current year receipts 1 000 000 1 030 000 Conditions met - transferred to Operating Revenue (1 000 000) (1 030 000) Conditions met - transferred to Capital Revenue - - Conditions met - transferred to Other Revenue (Own Income) - - Other Adjustments / Refunds - - Conditions still to be met - transferred to Current liabilities (see Note 11) - -
Conditional Grants:
15.3 Provincial: Health Subsidy
Balance unspent at beginning of year - - Current year receipts 500 000 - Conditions met - transferred to Operating Revenue (492 748) - Conditions met - transferred to Capital Revenue - - Conditions met - transferred to Other Revenue (Own Income) - - Other Adjustments / Refunds - - Conditions still to be met - transferred to Current liabilities (see Note 11) 7 252 -
15. GOVERNMENT GRANTS AND SUBSIDIES (continued)
15.4 National: Expanded Public Works Programme
Balance unspent at beginning of year 1 048 - Current year receipts 1 000 000 1 000 000 Conditions met - transferred to Operating Revenue (997 276) (362 034) Conditions met - transferred to Capital Revenue - (636 918) Conditions met - transferred to Other Revenue (Own Income) - - Other Adjustments / Refunds - - Conditions still to be met - transferred to Current liabilities (see Note 11) 3 772 1 048
15.5 National: Financial Management Grant (FMG)
Balance unspent at beginning of year - - Current year receipts 1 250 000 1 250 000 Conditions met - transferred to Operating Revenue (1 250 000) (1 250 000) Conditions met - transferred to Capital Revenue - - Conditions met - transferred to Other Revenue (Own Income) - - Other Adjustments / Refunds - - Conditions still to be met - transferred to Current liabilities (see Note 11) - -
To incentivise municipalities to expand work creation efforts through the use of labour intensive deliverymethods in the identified focus areas in compliance with the EPWP Guidelines. All conditions attached tothe grant were met. No funds have been withheld.
The Financial Management Grant is paid by National Treasury to municipalities to help implement thefinancial reforms required by the Municipal Finance Management Act (MFMA), 2003. The FMG Grant alsopays for the cost of the Financial Management Internship Programme (e.g. salary costs of the FinancialManagement Interns). All conditions attached to the grant were met. No funds have been withheld.
The Municipality's Equitable Share allocation of the Local Government Sphere's share of revenue raisednationally. No funds were withheld.
To promote and support HIV Aids programmes within the Municipal area. No funds were withheld.
This grant was allocated to improve capacity within the administration of the Municipality in respect to theHousing Department. All conditions attached to the grant were met. No funds have been withheld.
60
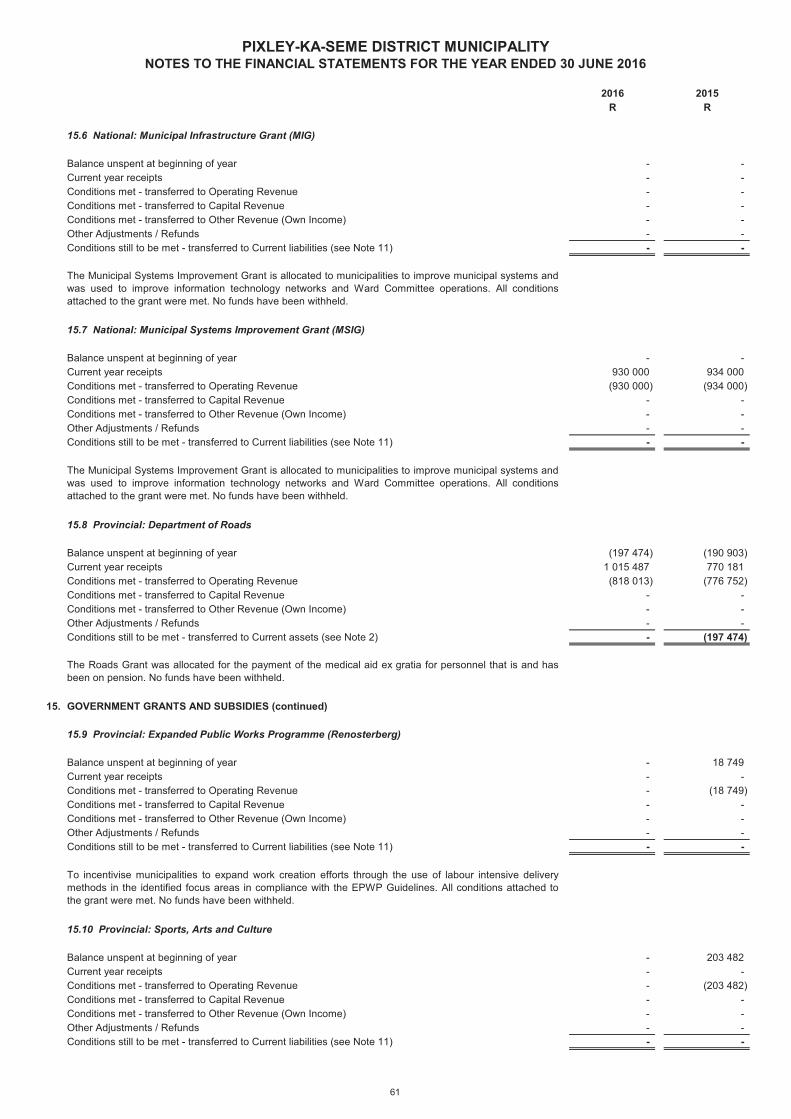
2016 2015R R
PIXLEY-KA-SEME DISTRICT MUNICIPALITYNOTES TO THE FINANCIAL STATEMENTS FOR THE YEAR ENDED 30 JUNE 2016
15.6 National: Municipal Infrastructure Grant (MIG)
Balance unspent at beginning of year - - Current year receipts - - Conditions met - transferred to Operating Revenue - - Conditions met - transferred to Capital Revenue - - Conditions met - transferred to Other Revenue (Own Income) - - Other Adjustments / Refunds - - Conditions still to be met - transferred to Current liabilities (see Note 11) - -
15.7 National: Municipal Systems Improvement Grant (MSIG)
Balance unspent at beginning of year - - Current year receipts 930 000 934 000 Conditions met - transferred to Operating Revenue (930 000) (934 000) Conditions met - transferred to Capital Revenue - - Conditions met - transferred to Other Revenue (Own Income) - - Other Adjustments / Refunds - - Conditions still to be met - transferred to Current liabilities (see Note 11) - -
15.8 Provincial: Department of Roads
Balance unspent at beginning of year (197 474) (190 903) Current year receipts 1 015 487 770 181 Conditions met - transferred to Operating Revenue (818 013) (776 752) Conditions met - transferred to Capital Revenue - - Conditions met - transferred to Other Revenue (Own Income) - - Other Adjustments / Refunds - - Conditions still to be met - transferred to Current assets (see Note 2) - (197 474)
15. GOVERNMENT GRANTS AND SUBSIDIES (continued)
15.9 Provincial: Expanded Public Works Programme (Renosterberg)
Balance unspent at beginning of year - 18 749 Current year receipts - - Conditions met - transferred to Operating Revenue - (18 749) Conditions met - transferred to Capital Revenue - - Conditions met - transferred to Other Revenue (Own Income) - - Other Adjustments / Refunds - - Conditions still to be met - transferred to Current liabilities (see Note 11) - -
15.10 Provincial: Sports, Arts and Culture
Balance unspent at beginning of year - 203 482 Current year receipts - - Conditions met - transferred to Operating Revenue - (203 482) Conditions met - transferred to Capital Revenue - - Conditions met - transferred to Other Revenue (Own Income) - - Other Adjustments / Refunds - - Conditions still to be met - transferred to Current liabilities (see Note 11) - -
The Roads Grant was allocated for the payment of the medical aid ex gratia for personnel that is and hasbeen on pension. No funds have been withheld.
The Municipal Systems Improvement Grant is allocated to municipalities to improve municipal systems andwas used to improve information technology networks and Ward Committee operations. All conditionsattached to the grant were met. No funds have been withheld.
The Municipal Systems Improvement Grant is allocated to municipalities to improve municipal systems andwas used to improve information technology networks and Ward Committee operations. All conditionsattached to the grant were met. No funds have been withheld.
To incentivise municipalities to expand work creation efforts through the use of labour intensive deliverymethods in the identified focus areas in compliance with the EPWP Guidelines. All conditions attached tothe grant were met. No funds have been withheld.
61
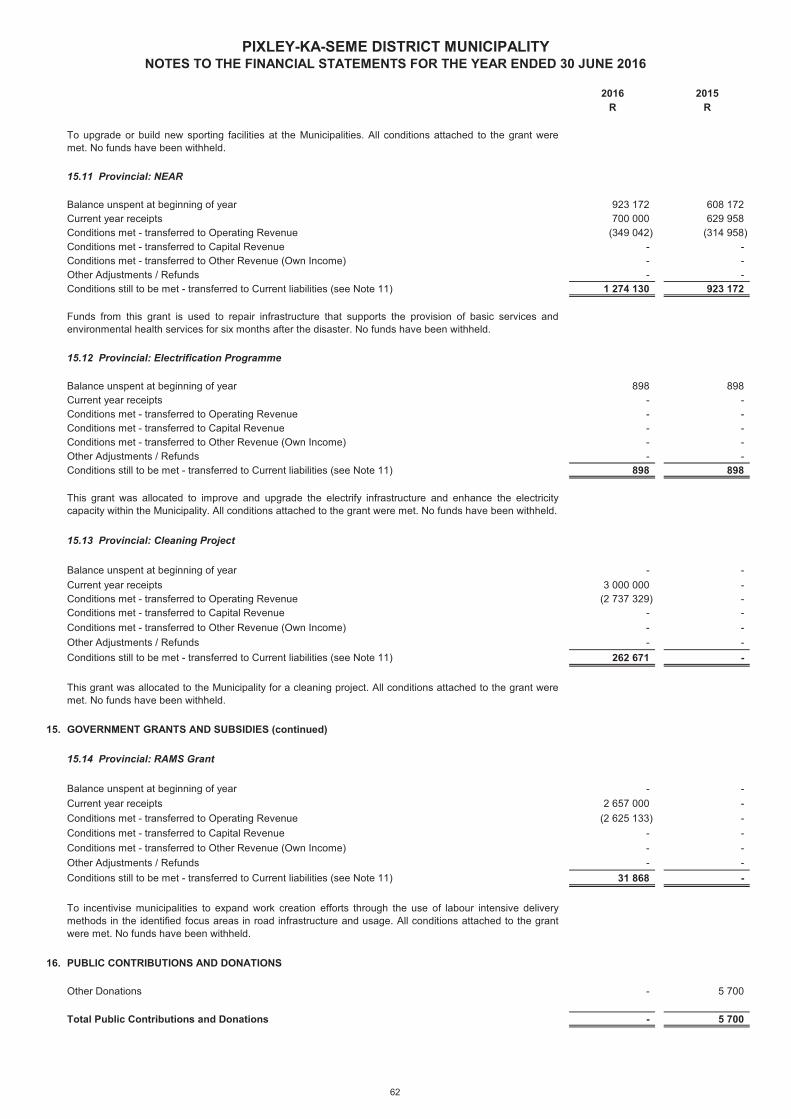
2016 2015R R
PIXLEY-KA-SEME DISTRICT MUNICIPALITYNOTES TO THE FINANCIAL STATEMENTS FOR THE YEAR ENDED 30 JUNE 2016
15.11 Provincial: NEAR
Balance unspent at beginning of year 923 172 608 172 Current year receipts 700 000 629 958 Conditions met - transferred to Operating Revenue (349 042) (314 958) Conditions met - transferred to Capital Revenue - - Conditions met - transferred to Other Revenue (Own Income) - - Other Adjustments / Refunds - - Conditions still to be met - transferred to Current liabilities (see Note 11) 1 274 130 923 172
15.12 Provincial: Electrification Programme
Balance unspent at beginning of year 898 898 Current year receipts - - Conditions met - transferred to Operating Revenue - - Conditions met - transferred to Capital Revenue - - Conditions met - transferred to Other Revenue (Own Income) - - Other Adjustments / Refunds - - Conditions still to be met - transferred to Current liabilities (see Note 11) 898 898
15.13 Provincial: Cleaning Project
Balance unspent at beginning of year - - Current year receipts 3 000 000 - Conditions met - transferred to Operating Revenue (2 737 329) - Conditions met - transferred to Capital Revenue - - Conditions met - transferred to Other Revenue (Own Income) - - Other Adjustments / Refunds - - Conditions still to be met - transferred to Current liabilities (see Note 11) 262 671 -
15. GOVERNMENT GRANTS AND SUBSIDIES (continued)
15.14 Provincial: RAMS Grant
Balance unspent at beginning of year - - Current year receipts 2 657 000 - Conditions met - transferred to Operating Revenue (2 625 133) - Conditions met - transferred to Capital Revenue - - Conditions met - transferred to Other Revenue (Own Income) - - Other Adjustments / Refunds - - Conditions still to be met - transferred to Current liabilities (see Note 11) 31 868 -
16. PUBLIC CONTRIBUTIONS AND DONATIONS
Other Donations - 5 700
Total Public Contributions and Donations - 5 700
This grant was allocated to improve and upgrade the electrify infrastructure and enhance the electricitycapacity within the Municipality. All conditions attached to the grant were met. No funds have been withheld.
To incentivise municipalities to expand work creation efforts through the use of labour intensive deliverymethods in the identified focus areas in road infrastructure and usage. All conditions attached to the grantwere met. No funds have been withheld.
This grant was allocated to the Municipality for a cleaning project. All conditions attached to the grant weremet. No funds have been withheld.
To upgrade or build new sporting facilities at the Municipalities. All conditions attached to the grant weremet. No funds have been withheld.
Funds from this grant is used to repair infrastructure that supports the provision of basic services andenvironmental health services for six months after the disaster. No funds have been withheld.
62
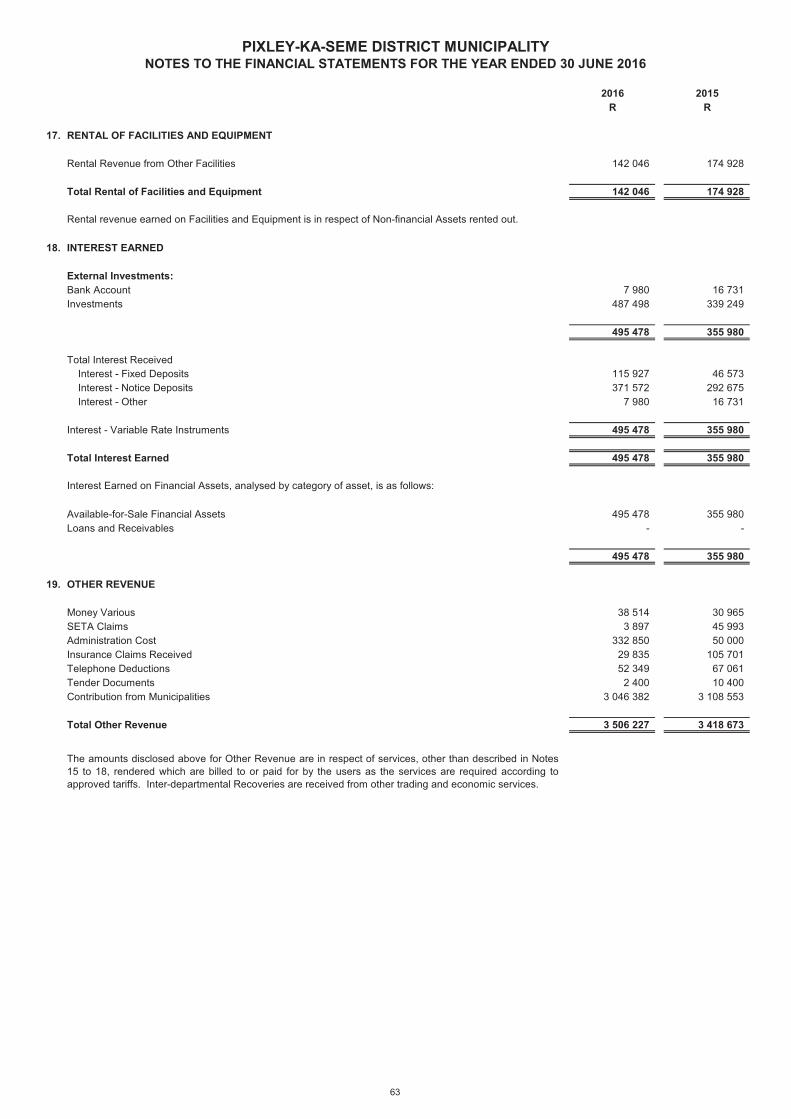
2016 2015R R
PIXLEY-KA-SEME DISTRICT MUNICIPALITYNOTES TO THE FINANCIAL STATEMENTS FOR THE YEAR ENDED 30 JUNE 2016
17. RENTAL OF FACILITIES AND EQUIPMENT
Rental Revenue from Other Facilities 142 046 174 928
Total Rental of Facilities and Equipment 142 046 174 928 0.00- 0.00-
18. INTEREST EARNED
External Investments:Bank Account 7 980 16 731 Investments 487 498 339 249
495 478 355 980
Total Interest ReceivedInterest - Fixed Deposits 115 927 46 573 Interest - Notice Deposits 371 572 292 675 Interest - Other 7 980 16 731
Interest - Variable Rate Instruments 495 478 355 980
Total Interest Earned 495 478 355 980
Available-for-Sale Financial Assets 495 478 355 980 Loans and Receivables - -
495 478 355 980 0.00- 0.00-
19. OTHER REVENUE
Money Various 38 514 30 965 SETA Claims 3 897 45 993 Administration Cost 332 850 50 000 Insurance Claims Received 29 835 105 701 Telephone Deductions 52 349 67 061 Tender Documents 2 400 10 400 Contribution from Municipalities 3 046 382 3 108 553
Total Other Revenue 3 506 227 3 418 673
Rental revenue earned on Facilities and Equipment is in respect of Non-financial Assets rented out.
Interest Earned on Financial Assets, analysed by category of asset, is as follows:
The amounts disclosed above for Other Revenue are in respect of services, other than described in Notes15 to 18, rendered which are billed to or paid for by the users as the services are required according toapproved tariffs. Inter-departmental Recoveries are received from other trading and economic services.
63
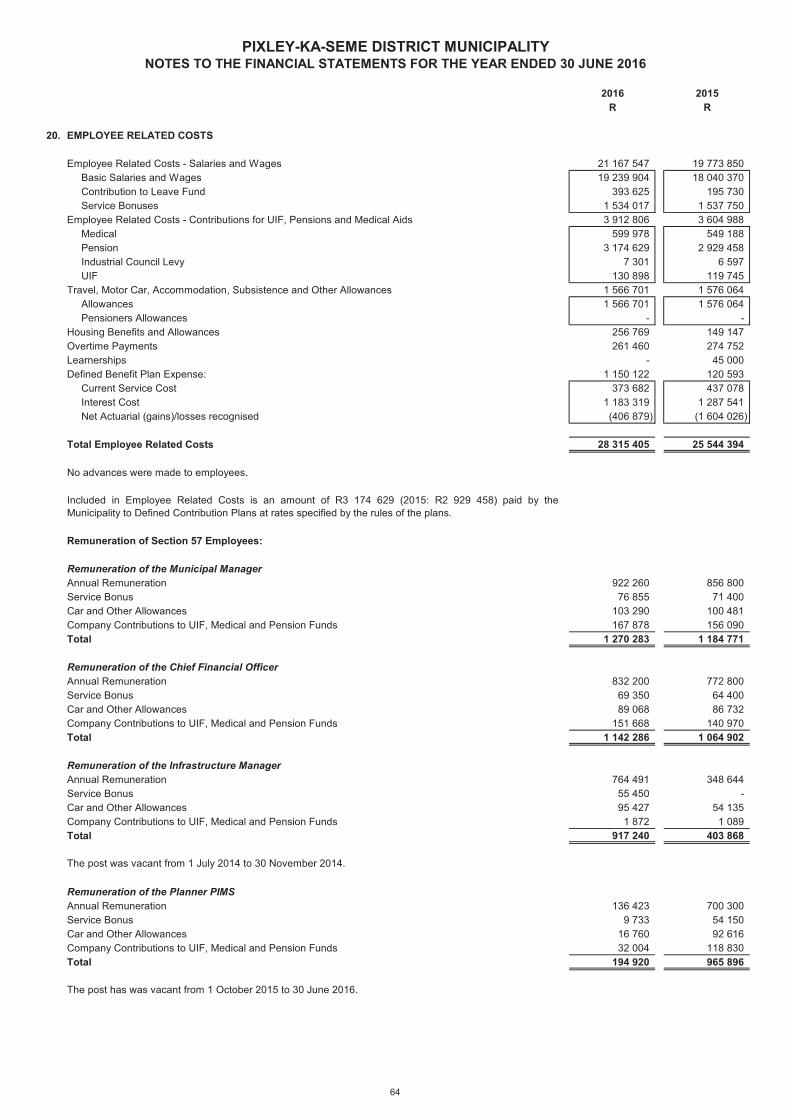
2016 2015R R
PIXLEY-KA-SEME DISTRICT MUNICIPALITYNOTES TO THE FINANCIAL STATEMENTS FOR THE YEAR ENDED 30 JUNE 2016
20. EMPLOYEE RELATED COSTS
Employee Related Costs - Salaries and Wages 21 167 547 19 773 850 Basic Salaries and Wages 19 239 904 18 040 370 Contribution to Leave Fund 393 625 195 730 Service Bonuses 1 534 017 1 537 750 Employee Related Costs - Contributions for UIF, Pensions and Medical Aids 3 912 806 3 604 988 Medical 599 978 549 188 Pension 3 174 629 2 929 458 Industrial Council Levy 7 301 6 597 UIF 130 898 119 745 Travel, Motor Car, Accommodation, Subsistence and Other Allowances 1 566 701 1 576 064 Allowances 1 566 701 1 576 064 Pensioners Allowances - - Housing Benefits and Allowances 256 769 149 147 Overtime Payments 261 460 274 752 Learnerships - 45 000 Defined Benefit Plan Expense: 1 150 122 120 593 Current Service Cost 373 682 437 078 Interest Cost 1 183 319 1 287 541 Net Actuarial (gains)/losses recognised (406 879) (1 604 026)
Total Employee Related Costs 28 315 405 25 544 394
No advances were made to employees.
Remuneration of Section 57 Employees:
Remuneration of the Municipal ManagerAnnual Remuneration 922 260 856 800 Service Bonus 76 855 71 400 Car and Other Allowances 103 290 100 481 Company Contributions to UIF, Medical and Pension Funds 167 878 156 090 Total 1 270 283 1 184 771
Remuneration of the Chief Financial OfficerAnnual Remuneration 832 200 772 800 Service Bonus 69 350 64 400 Car and Other Allowances 89 068 86 732 Company Contributions to UIF, Medical and Pension Funds 151 668 140 970 Total 1 142 286 1 064 902
Remuneration of the Infrastructure ManagerAnnual Remuneration 764 491 348 644 Service Bonus 55 450 - Car and Other Allowances 95 427 54 135 Company Contributions to UIF, Medical and Pension Funds 1 872 1 089 Total 917 240 403 868
Remuneration of the Planner PIMSAnnual Remuneration 136 423 700 300 Service Bonus 9 733 54 150 Car and Other Allowances 16 760 92 616 Company Contributions to UIF, Medical and Pension Funds 32 004 118 830 Total 194 920 965 896
The post has was vacant from 1 October 2015 to 30 June 2016.
The post was vacant from 1 July 2014 to 30 November 2014.
Included in Employee Related Costs is an amount of R3 174 629 (2015: R2 929 458) paid by theMunicipality to Defined Contribution Plans at rates specified by the rules of the plans.
64
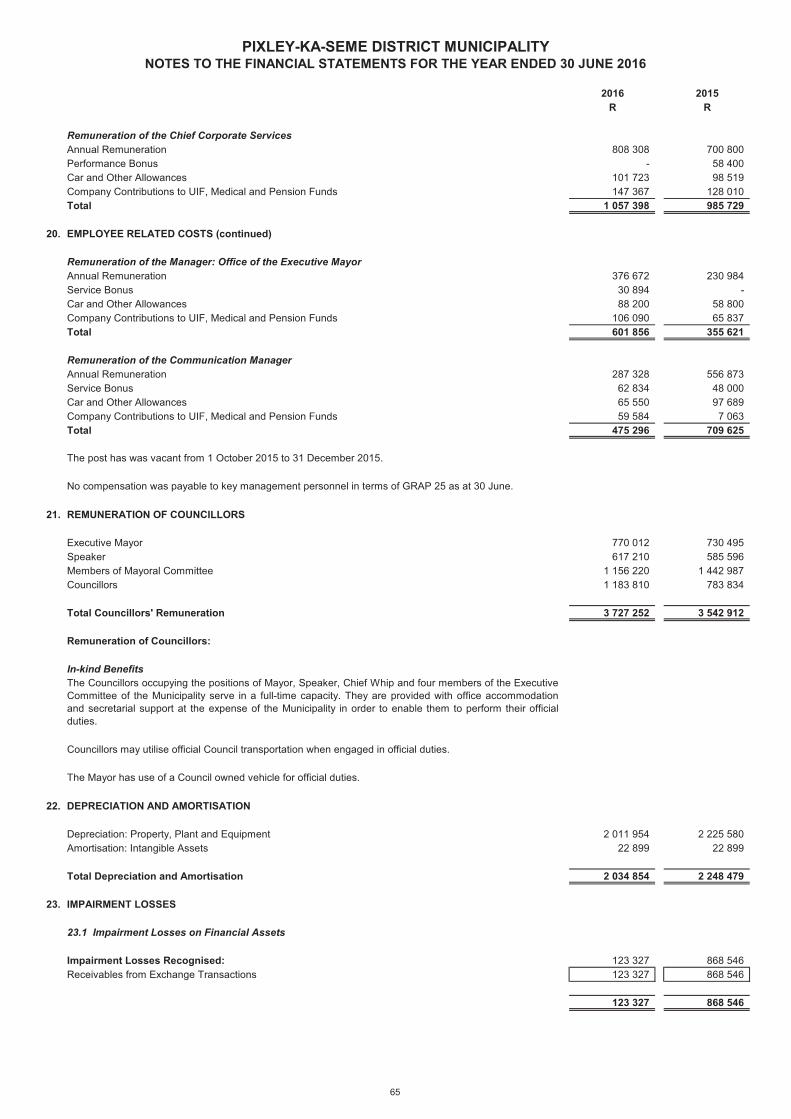
2016 2015R R
PIXLEY-KA-SEME DISTRICT MUNICIPALITYNOTES TO THE FINANCIAL STATEMENTS FOR THE YEAR ENDED 30 JUNE 2016
Remuneration of the Chief Corporate ServicesAnnual Remuneration 808 308 700 800 Performance Bonus - 58 400 Car and Other Allowances 101 723 98 519 Company Contributions to UIF, Medical and Pension Funds 147 367 128 010 Total 1 057 398 985 729
20. EMPLOYEE RELATED COSTS (continued)
Remuneration of the Manager: Office of the Executive MayorAnnual Remuneration 376 672 230 984 Service Bonus 30 894 - Car and Other Allowances 88 200 58 800 Company Contributions to UIF, Medical and Pension Funds 106 090 65 837 Total 601 856 355 621
Remuneration of the Communication ManagerAnnual Remuneration 287 328 556 873 Service Bonus 62 834 48 000 Car and Other Allowances 65 550 97 689 Company Contributions to UIF, Medical and Pension Funds 59 584 7 063 Total 475 296 709 625
21. REMUNERATION OF COUNCILLORS
Executive Mayor 770 012 730 495 Speaker 617 210 585 596 Members of Mayoral Committee 1 156 220 1 442 987 Councillors 1 183 810 783 834
Total Councillors' Remuneration 3 727 252 3 542 912
Remuneration of Councillors:
In-kind Benefits
22. DEPRECIATION AND AMORTISATION
Depreciation: Property, Plant and Equipment 2 011 954 2 225 580 Amortisation: Intangible Assets 22 899 22 899
Total Depreciation and Amortisation 2 034 854 2 248 479 0.00-
23. IMPAIRMENT LOSSES
23.1 Impairment Losses on Financial Assets
Impairment Losses Recognised: 123 327 868 546 Receivables from Exchange Transactions 123 327 868 546
123 327 868 546
The post has was vacant from 1 October 2015 to 31 December 2015.
No compensation was payable to key management personnel in terms of GRAP 25 as at 30 June.
Councillors may utilise official Council transportation when engaged in official duties.
The Mayor has use of a Council owned vehicle for official duties.
The Councillors occupying the positions of Mayor, Speaker, Chief Whip and four members of the ExecutiveCommittee of the Municipality serve in a full-time capacity. They are provided with office accommodationand secretarial support at the expense of the Municipality in order to enable them to perform their officialduties.
65
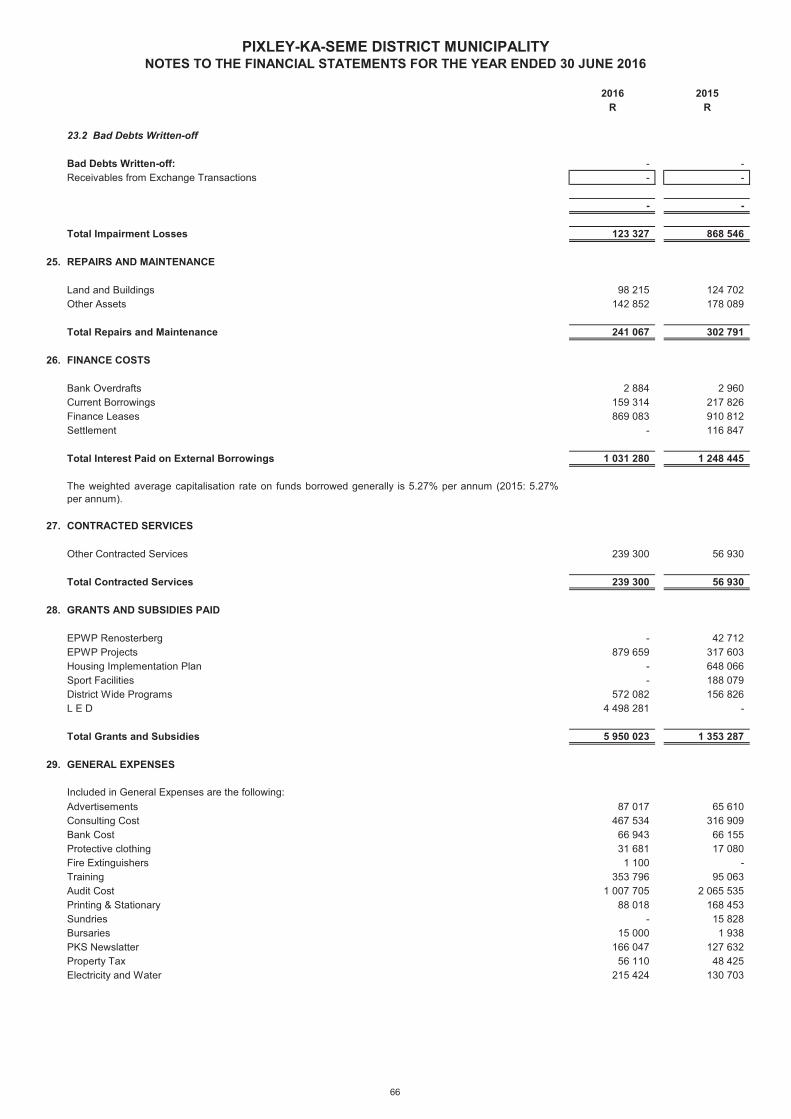
2016 2015R R
PIXLEY-KA-SEME DISTRICT MUNICIPALITYNOTES TO THE FINANCIAL STATEMENTS FOR THE YEAR ENDED 30 JUNE 2016
23.2 Bad Debts Written-off
Bad Debts Written-off: - - Receivables from Exchange Transactions - -
- -
Total Impairment Losses 123 327 868 546
25. REPAIRS AND MAINTENANCE
Land and Buildings 98 215 124 702 Other Assets 142 852 178 089
Total Repairs and Maintenance 241 067 302 791
26. FINANCE COSTS
Bank Overdrafts 2 884 2 960 Current Borrowings 159 314 217 826 Finance Leases 869 083 910 812 Settlement - 116 847
Total Interest Paid on External Borrowings 1 031 280 1 248 445
27. CONTRACTED SERVICES
Other Contracted Services 239 300 56 930
Total Contracted Services 239 300 56 930
28. GRANTS AND SUBSIDIES PAID
EPWP Renosterberg - 42 712 EPWP Projects 879 659 317 603 Housing Implementation Plan - 648 066 Sport Facilities - 188 079 District Wide Programs 572 082 156 826 L E D 4 498 281 -
Total Grants and Subsidies 5 950 023 1 353 287
29. GENERAL EXPENSES
Advertisements 87 017 65 610 Consulting Cost 467 534 316 909 Bank Cost 66 943 66 155 Protective clothing 31 681 17 080 Fire Extinguishers 1 100 - Training 353 796 95 063 Audit Cost 1 007 705 2 065 535 Printing & Stationary 88 018 168 453 Sundries - 15 828 Bursaries 15 000 1 938 PKS Newslatter 166 047 127 632 Property Tax 56 110 48 425 Electricity and Water 215 424 130 703
The weighted average capitalisation rate on funds borrowed generally is 5.27% per annum (2015: 5.27%per annum).
Included in General Expenses are the following:
66
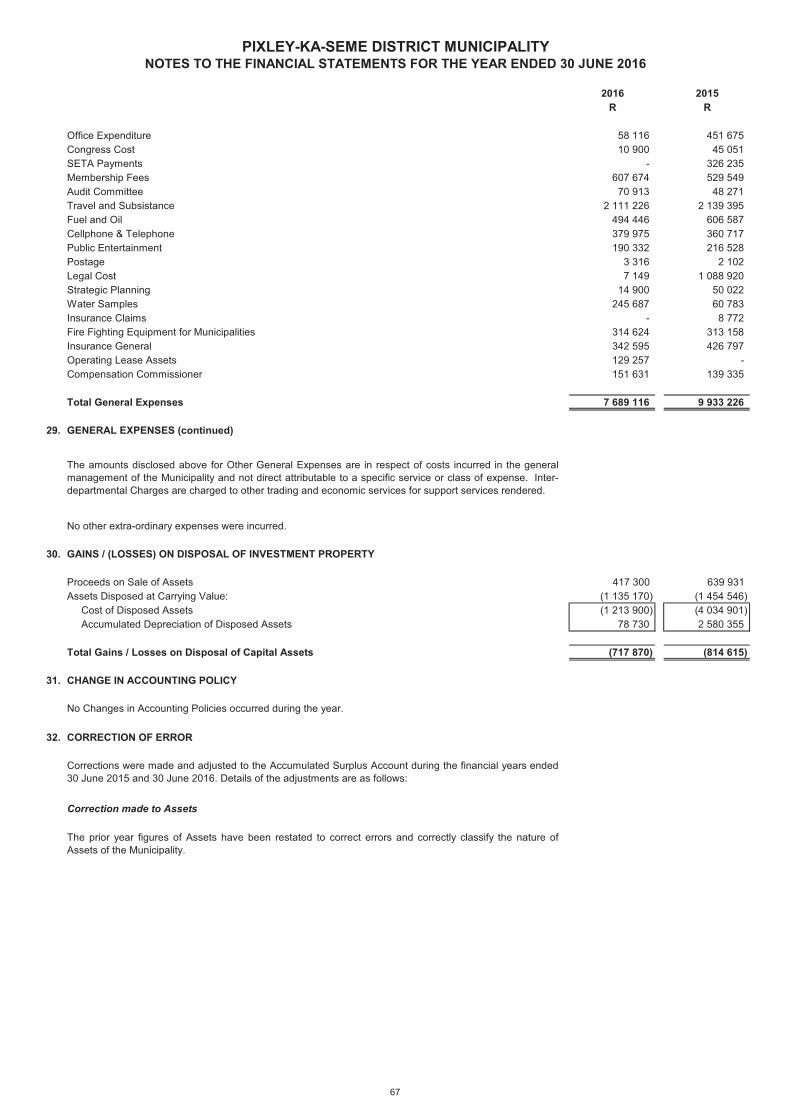
2016 2015R R
PIXLEY-KA-SEME DISTRICT MUNICIPALITYNOTES TO THE FINANCIAL STATEMENTS FOR THE YEAR ENDED 30 JUNE 2016
Office Expenditure 58 116 451 675 Congress Cost 10 900 45 051 SETA Payments - 326 235 Membership Fees 607 674 529 549 Audit Committee 70 913 48 271 Travel and Subsistance 2 111 226 2 139 395 Fuel and Oil 494 446 606 587 Cellphone & Telephone 379 975 360 717 Public Entertainment 190 332 216 528 Postage 3 316 2 102 Legal Cost 7 149 1 088 920 Strategic Planning 14 900 50 022 Water Samples 245 687 60 783 Insurance Claims - 8 772 Fire Fighting Equipment for Municipalities 314 624 313 158 Insurance General 342 595 426 797 Operating Lease Assets 129 257 - Compensation Commissioner 151 631 139 335
Total General Expenses 7 689 116 9 933 226
29. GENERAL EXPENSES (continued)
No other extra-ordinary expenses were incurred.
30. GAINS / (LOSSES) ON DISPOSAL OF INVESTMENT PROPERTY
Proceeds on Sale of Assets 417 300 639 931 Assets Disposed at Carrying Value: (1 135 170) (1 454 546) Cost of Disposed Assets (1 213 900) (4 034 901) Accumulated Depreciation of Disposed Assets 78 730 2 580 355
Total Gains / Losses on Disposal of Capital Assets (717 870) (814 615)
31. CHANGE IN ACCOUNTING POLICY
32. CORRECTION OF ERROR
Correction made to Assets
The amounts disclosed above for Other General Expenses are in respect of costs incurred in the generalmanagement of the Municipality and not direct attributable to a specific service or class of expense. Inter-departmental Charges are charged to other trading and economic services for support services rendered.
The prior year figures of Assets have been restated to correct errors and correctly classify the nature ofAssets of the Municipality.
Corrections were made and adjusted to the Accumulated Surplus Account during the financial years ended30 June 2015 and 30 June 2016. Details of the adjustments are as follows:
No Changes in Accounting Policies occurred during the year.
67
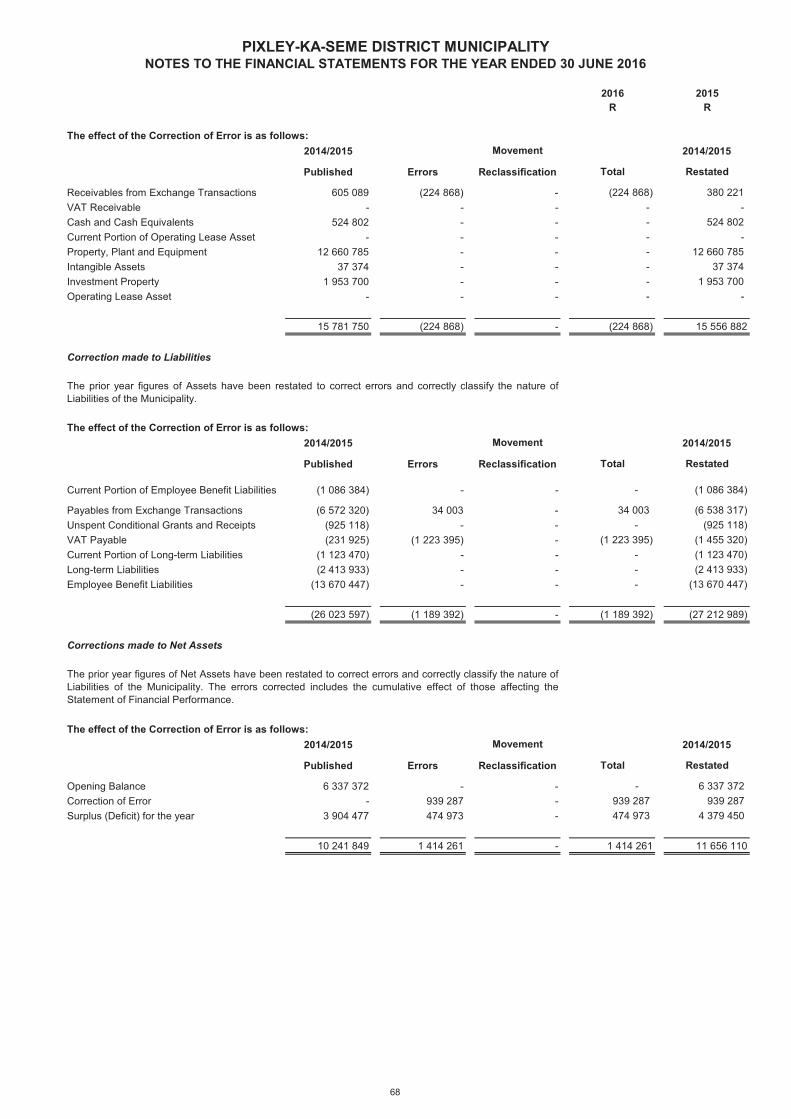
2016 2015R R
PIXLEY-KA-SEME DISTRICT MUNICIPALITYNOTES TO THE FINANCIAL STATEMENTS FOR THE YEAR ENDED 30 JUNE 2016
2014/2015 2014/2015
Published Errors Reclassification Total Restated
Receivables from Exchange Transactions 605 089 (224 868) - (224 868) 380 221 VAT Receivable - - - - - Cash and Cash Equivalents 524 802 - - - 524 802 Current Portion of Operating Lease Asset - - - - - Property, Plant and Equipment 12 660 785 - - - 12 660 785 Intangible Assets 37 374 - - - 37 374 Investment Property 1 953 700 - - - 1 953 700 Operating Lease Asset - - - - -
15 781 750 (224 868) - (224 868) 15 556 882
Correction made to Liabilities
2014/2015 2014/2015
Published Errors Reclassification Total Restated
Current Portion of Employee Benefit Liabilities (1 086 384) - - - (1 086 384)
Payables from Exchange Transactions (6 572 320) 34 003 - 34 003 (6 538 317) Unspent Conditional Grants and Receipts (925 118) - - - (925 118) VAT Payable (231 925) (1 223 395) - (1 223 395) (1 455 320) Current Portion of Long-term Liabilities (1 123 470) - - - (1 123 470) Long-term Liabilities (2 413 933) - - - (2 413 933) Employee Benefit Liabilities (13 670 447) - - - (13 670 447)
(26 023 597) (1 189 392) - (1 189 392) (27 212 989)
Corrections made to Net Assets
2014/2015 2014/2015
Published Errors Reclassification Total Restated
Opening Balance 6 337 372 - - - 6 337 372 Correction of Error - 939 287 - 939 287 939 287 Surplus (Deficit) for the year 3 904 477 474 973 - 474 973 4 379 450
10 241 849 1 414 261 - 1 414 261 11 656 110
MovementThe effect of the Correction of Error is as follows:
The effect of the Correction of Error is as follows:Movement
The prior year figures of Net Assets have been restated to correct errors and correctly classify the nature ofLiabilities of the Municipality. The errors corrected includes the cumulative effect of those affecting theStatement of Financial Performance.
The effect of the Correction of Error is as follows:Movement
The prior year figures of Assets have been restated to correct errors and correctly classify the nature ofLiabilities of the Municipality.
68
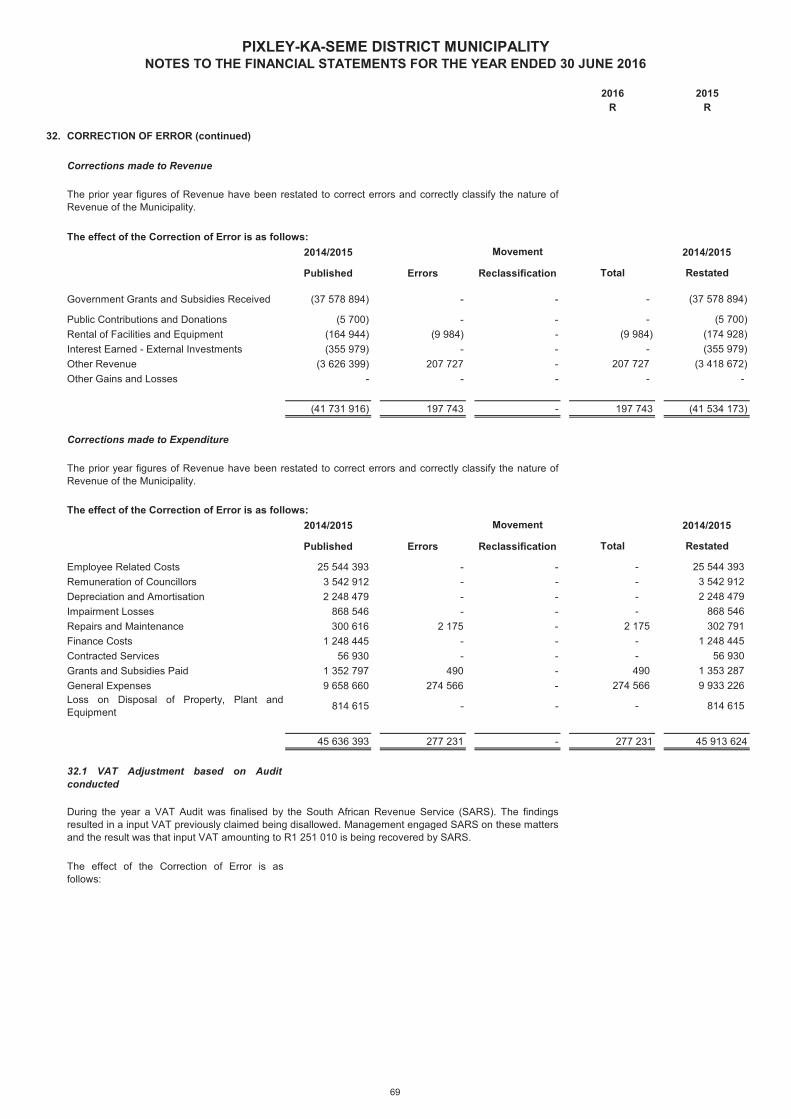
2016 2015R R
PIXLEY-KA-SEME DISTRICT MUNICIPALITYNOTES TO THE FINANCIAL STATEMENTS FOR THE YEAR ENDED 30 JUNE 2016
32. CORRECTION OF ERROR (continued)
Corrections made to Revenue
2014/2015 2014/2015
Published Errors Reclassification Total Restated
Government Grants and Subsidies Received (37 578 894) - - - (37 578 894)
Public Contributions and Donations (5 700) - - - (5 700) Rental of Facilities and Equipment (164 944) (9 984) - (9 984) (174 928) Interest Earned - External Investments (355 979) - - - (355 979) Other Revenue (3 626 399) 207 727 - 207 727 (3 418 672) Other Gains and Losses - - - - -
(41 731 916) 197 743 - 197 743 (41 534 173)
Corrections made to Expenditure
2014/2015 2014/2015
Published Errors Reclassification Total Restated
Employee Related Costs 25 544 393 - - - 25 544 393 Remuneration of Councillors 3 542 912 - - - 3 542 912 Depreciation and Amortisation 2 248 479 - - - 2 248 479 Impairment Losses 868 546 - - - 868 546 Repairs and Maintenance 300 616 2 175 - 2 175 302 791 Finance Costs 1 248 445 - - - 1 248 445 Contracted Services 56 930 - - - 56 930 Grants and Subsidies Paid 1 352 797 490 - 490 1 353 287 General Expenses 9 658 660 274 566 - 274 566 9 933 226 Loss on Disposal of Property, Plant andEquipment 814 615 - - - 814 615
45 636 393 277 231 - 277 231 45 913 624
32.1 VAT Adjustment based on Auditconducted
The effect of the Correction of Error is asfollows:
During the year a VAT Audit was finalised by the South African Revenue Service (SARS). The findingsresulted in a input VAT previously claimed being disallowed. Management engaged SARS on these mattersand the result was that input VAT amounting to R1 251 010 is being recovered by SARS.
The prior year figures of Revenue have been restated to correct errors and correctly classify the nature ofRevenue of the Municipality.
The effect of the Correction of Error is as follows:Movement
The prior year figures of Revenue have been restated to correct errors and correctly classify the nature ofRevenue of the Municipality.
The effect of the Correction of Error is as follows:Movement
69
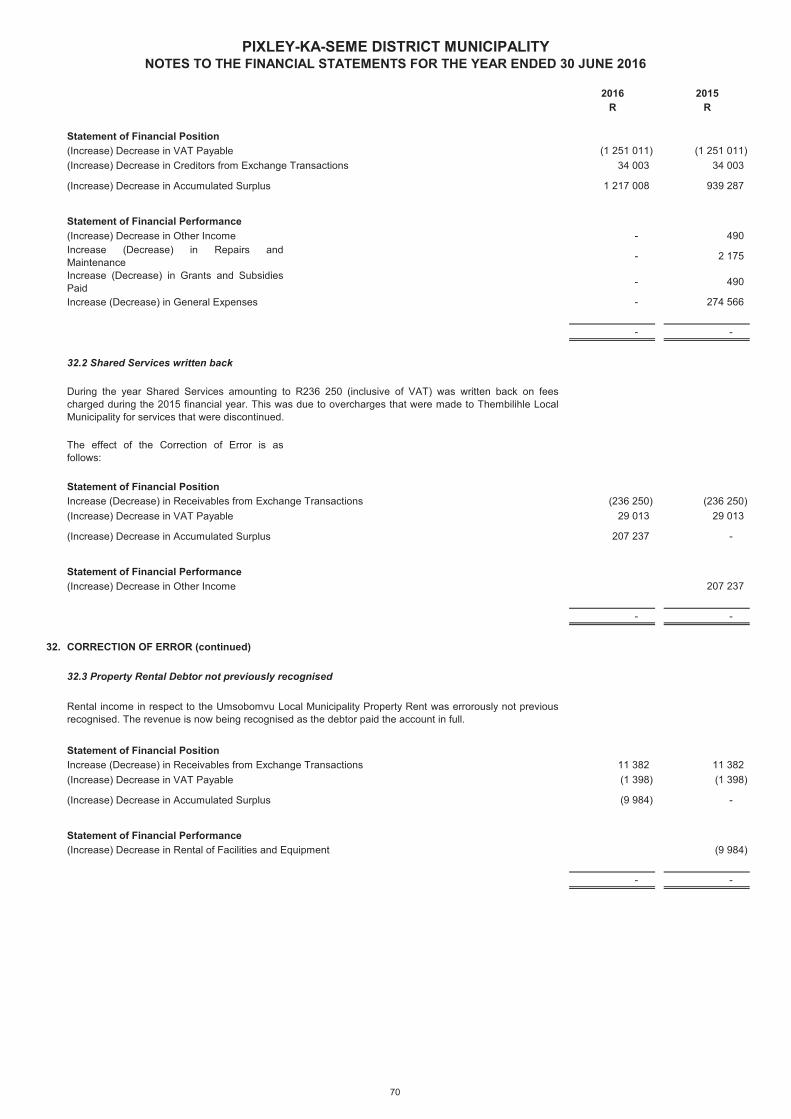
2016 2015R R
PIXLEY-KA-SEME DISTRICT MUNICIPALITYNOTES TO THE FINANCIAL STATEMENTS FOR THE YEAR ENDED 30 JUNE 2016
Statement of Financial Position(Increase) Decrease in VAT Payable (1 251 011) (1 251 011) (Increase) Decrease in Creditors from Exchange Transactions 34 003 34 003
(Increase) Decrease in Accumulated Surplus 1 217 008 939 287
Statement of Financial Performance(Increase) Decrease in Other Income - 490 Increase (Decrease) in Repairs andMaintenance - 2 175
Increase (Decrease) in Grants and SubsidiesPaid - 490
Increase (Decrease) in General Expenses - 274 566
- -
32.2 Shared Services written back
The effect of the Correction of Error is asfollows:
Statement of Financial PositionIncrease (Decrease) in Receivables from Exchange Transactions (236 250) (236 250) (Increase) Decrease in VAT Payable 29 013 29 013
(Increase) Decrease in Accumulated Surplus 207 237 -
Statement of Financial Performance(Increase) Decrease in Other Income 207 237
- -
32. CORRECTION OF ERROR (continued)
32.3 Property Rental Debtor not previously recognised
Statement of Financial PositionIncrease (Decrease) in Receivables from Exchange Transactions 11 382 11 382 (Increase) Decrease in VAT Payable (1 398) (1 398)
(Increase) Decrease in Accumulated Surplus (9 984) -
Statement of Financial Performance(Increase) Decrease in Rental of Facilities and Equipment (9 984)
- -
During the year Shared Services amounting to R236 250 (inclusive of VAT) was written back on feescharged during the 2015 financial year. This was due to overcharges that were made to Thembilihle LocalMunicipality for services that were discontinued.
Rental income in respect to the Umsobomvu Local Municipality Property Rent was errorously not previousrecognised. The revenue is now being recognised as the debtor paid the account in full.
70
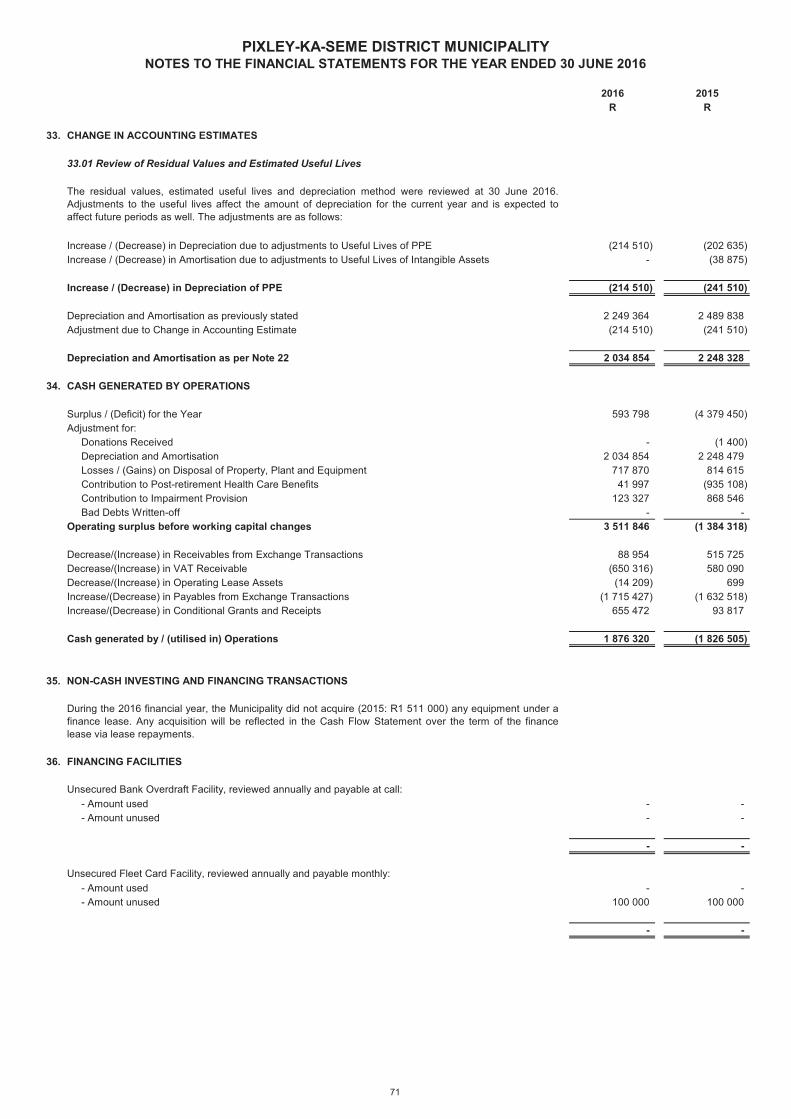
2016 2015R R
PIXLEY-KA-SEME DISTRICT MUNICIPALITYNOTES TO THE FINANCIAL STATEMENTS FOR THE YEAR ENDED 30 JUNE 2016
33. CHANGE IN ACCOUNTING ESTIMATES
33.01 Review of Residual Values and Estimated Useful Lives
Increase / (Decrease) in Depreciation due to adjustments to Useful Lives of PPE (214 510) (202 635) Increase / (Decrease) in Amortisation due to adjustments to Useful Lives of Intangible Assets - (38 875)
Increase / (Decrease) in Depreciation of PPE (214 510) (241 510)
Depreciation and Amortisation as previously stated 2 249 364 2 489 838 Adjustment due to Change in Accounting Estimate (214 510) (241 510)
Depreciation and Amortisation as per Note 22 2 034 854 2 248 328
34. CASH GENERATED BY OPERATIONS
Surplus / (Deficit) for the Year 593 798 (4 379 450) Adjustment for: Donations Received - (1 400) Depreciation and Amortisation 2 034 854 2 248 479 Losses / (Gains) on Disposal of Property, Plant and Equipment 717 870 814 615 Contribution to Post-retirement Health Care Benefits 41 997 (935 108) Contribution to Impairment Provision 123 327 868 546 Bad Debts Written-off - - Operating surplus before working capital changes 3 511 846 (1 384 318)
Decrease/(Increase) in Receivables from Exchange Transactions 88 954 515 725 Decrease/(Increase) in VAT Receivable (650 316) 580 090 Decrease/(Increase) in Operating Lease Assets (14 209) 699 Increase/(Decrease) in Payables from Exchange Transactions (1 715 427) (1 632 518) Increase/(Decrease) in Conditional Grants and Receipts 655 472 93 817
Cash generated by / (utilised in) Operations 1 876 320 (1 826 505)
35. NON-CASH INVESTING AND FINANCING TRANSACTIONS
36. FINANCING FACILITIES
- Amount used - - - Amount unused - -
- -
- Amount used - - - Amount unused 100 000 100 000
- -
Unsecured Bank Overdraft Facility, reviewed annually and payable at call:
Unsecured Fleet Card Facility, reviewed annually and payable monthly:
During the 2016 financial year, the Municipality did not acquire (2015: R1 511 000) any equipment under afinance lease. Any acquisition will be reflected in the Cash Flow Statement over the term of the financelease via lease repayments.
The residual values, estimated useful lives and depreciation method were reviewed at 30 June 2016.Adjustments to the useful lives affect the amount of depreciation for the current year and is expected toaffect future periods as well. The adjustments are as follows:
71
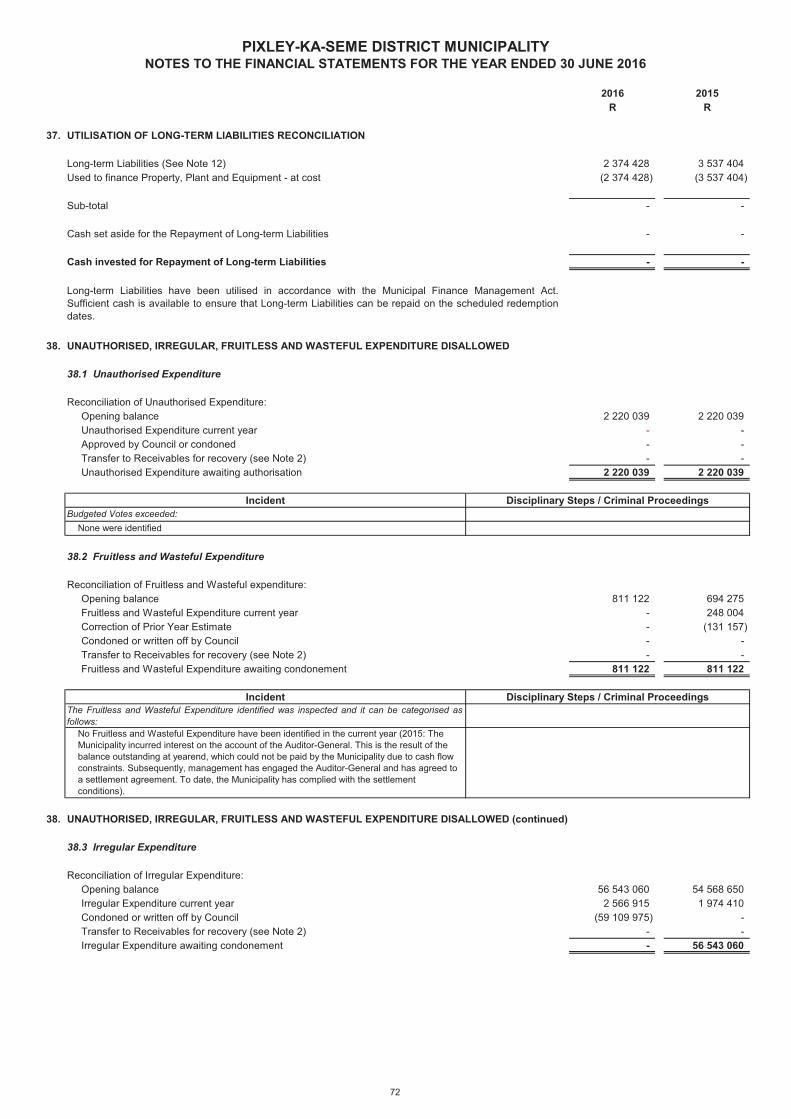
2016 2015R R
PIXLEY-KA-SEME DISTRICT MUNICIPALITYNOTES TO THE FINANCIAL STATEMENTS FOR THE YEAR ENDED 30 JUNE 2016
37. UTILISATION OF LONG-TERM LIABILITIES RECONCILIATION
Long-term Liabilities (See Note 12) 2 374 428 3 537 404 Used to finance Property, Plant and Equipment - at cost (2 374 428) (3 537 404)
Sub-total - -
Cash set aside for the Repayment of Long-term Liabilities - -
Cash invested for Repayment of Long-term Liabilities - -
38. UNAUTHORISED, IRREGULAR, FRUITLESS AND WASTEFUL EXPENDITURE DISALLOWED
38.1 Unauthorised Expenditure
Reconciliation of Unauthorised Expenditure: Opening balance 2 220 039 2 220 039 Unauthorised Expenditure current year - - Approved by Council or condoned - - Transfer to Receivables for recovery (see Note 2) - - Unauthorised Expenditure awaiting authorisation 2 220 039 2 220 039
38.2 Fruitless and Wasteful Expenditure
Reconciliation of Fruitless and Wasteful expenditure: Opening balance 811 122 694 275 Fruitless and Wasteful Expenditure current year - 248 004 Correction of Prior Year Estimate - (131 157) Condoned or written off by Council - - Transfer to Receivables for recovery (see Note 2) - - Fruitless and Wasteful Expenditure awaiting condonement 811 122 811 122
38. UNAUTHORISED, IRREGULAR, FRUITLESS AND WASTEFUL EXPENDITURE DISALLOWED (continued)
38.3 Irregular Expenditure
Reconciliation of Irregular Expenditure: Opening balance 56 543 060 54 568 650 Irregular Expenditure current year 2 566 915 1 974 410 Condoned or written off by Council (59 109 975) - Transfer to Receivables for recovery (see Note 2) - - Irregular Expenditure awaiting condonement - 56 543 060
The Fruitless and Wasteful Expenditure identified was inspected and it can be categorised asfollows:
No Fruitless and Wasteful Expenditure have been identified in the current year (2015: The Municipality incurred interest on the account of the Auditor-General. This is the result of the balance outstanding at yearend, which could not be paid by the Municipality due to cash flow constraints. Subsequently, management has engaged the Auditor-General and has agreed to a settlement agreement. To date, the Municipality has complied with the settlement conditions).
Incident Disciplinary Steps / Criminal Proceedings
None were identified
Long-term Liabilities have been utilised in accordance with the Municipal Finance Management Act.Sufficient cash is available to ensure that Long-term Liabilities can be repaid on the scheduled redemptiondates.
Incident Disciplinary Steps / Criminal ProceedingsBudgeted Votes exceeded:
72
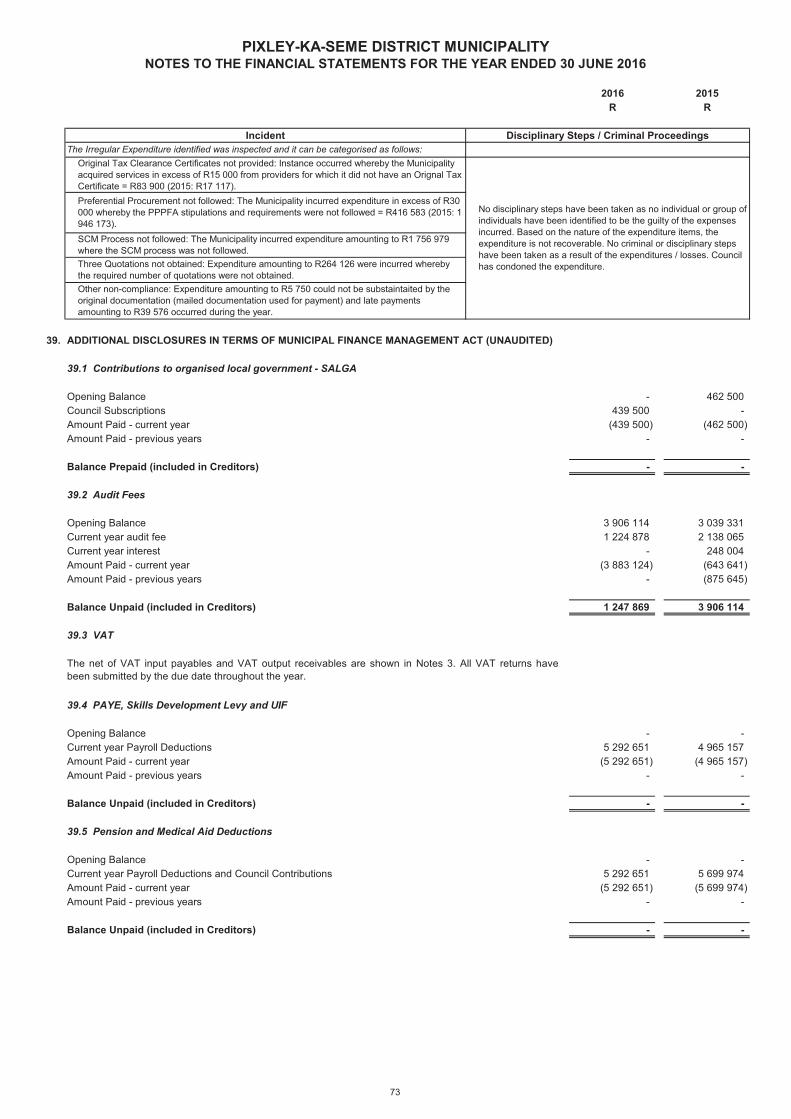
2016 2015R R
PIXLEY-KA-SEME DISTRICT MUNICIPALITYNOTES TO THE FINANCIAL STATEMENTS FOR THE YEAR ENDED 30 JUNE 2016
39. ADDITIONAL DISCLOSURES IN TERMS OF MUNICIPAL FINANCE MANAGEMENT ACT (UNAUDITED)
39.1 Contributions to organised local government - SALGA
Opening Balance - 462 500 Council Subscriptions 439 500 - Amount Paid - current year (439 500) (462 500) Amount Paid - previous years - -
Balance Prepaid (included in Creditors) - -
39.2 Audit Fees
Opening Balance 3 906 114 3 039 331 Current year audit fee 1 224 878 2 138 065 Current year interest - 248 004 Amount Paid - current year (3 883 124) (643 641) Amount Paid - previous years - (875 645)
Balance Unpaid (included in Creditors) 1 247 869 3 906 114
39.3 VAT
39.4 PAYE, Skills Development Levy and UIF
Opening Balance - - Current year Payroll Deductions 5 292 651 4 965 157 Amount Paid - current year (5 292 651) (4 965 157) Amount Paid - previous years - -
Balance Unpaid (included in Creditors) - -
39.5 Pension and Medical Aid Deductions
Opening Balance - - Current year Payroll Deductions and Council Contributions 5 292 651 5 699 974 Amount Paid - current year (5 292 651) (5 699 974) Amount Paid - previous years - -
Balance Unpaid (included in Creditors) - -
Original Tax Clearance Certificates not provided: Instance occurred whereby the Municipality acquired services in excess of R15 000 from providers for which it did not have an Orignal Tax Certificate = R83 900 (2015: R17 117).
SCM Process not followed: The Municipality incurred expenditure amounting to R1 756 979 where the SCM process was not followed.Three Quotations not obtained: Expenditure amounting to R264 126 were incurred whereby the required number of quotations were not obtained.
Disciplinary Steps / Criminal ProceedingsIncident
Preferential Procurement not followed: The Municipality incurred expenditure in excess of R30 000 whereby the PPPFA stipulations and requirements were not followed = R416 583 (2015: 1 946 173).
The net of VAT input payables and VAT output receivables are shown in Notes 3. All VAT returns havebeen submitted by the due date throughout the year.
No disciplinary steps have been taken as no individual or group of individuals have been identified to be the guilty of the expenses incurred. Based on the nature of the expenditure items, the expenditure is not recoverable. No criminal or disciplinary steps have been taken as a result of the expenditures / losses. Council has condoned the expenditure.
Other non-compliance: Expenditure amounting to R5 750 could not be substaintaited by the original documentation (mailed documentation used for payment) and late payments amounting to R39 576 occurred during the year.
The Irregular Expenditure identified was inspected and it can be categorised as follows:
73
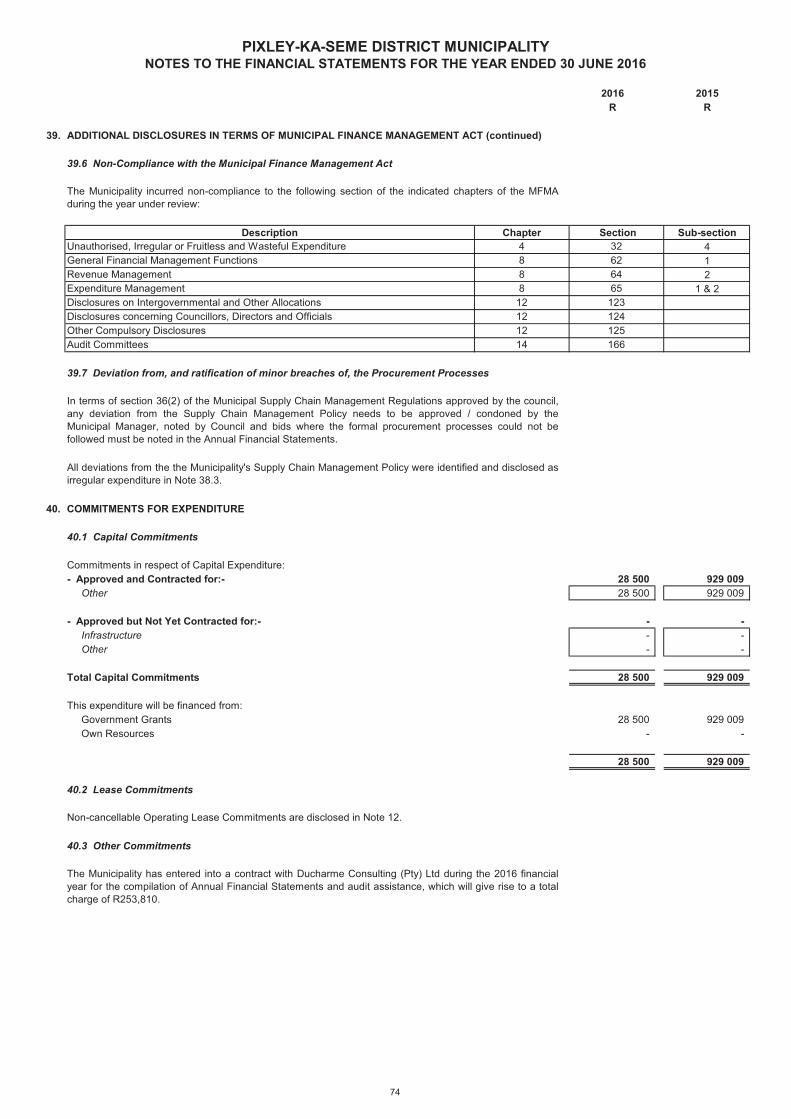
2016 2015R R
PIXLEY-KA-SEME DISTRICT MUNICIPALITYNOTES TO THE FINANCIAL STATEMENTS FOR THE YEAR ENDED 30 JUNE 2016
39. ADDITIONAL DISCLOSURES IN TERMS OF MUNICIPAL FINANCE MANAGEMENT ACT (continued)
39.6 Non-Compliance with the Municipal Finance Management Act
Sub-section412
1 & 2
39.7 Deviation from, and ratification of minor breaches of, the Procurement Processes
40. COMMITMENTS FOR EXPENDITURE
40.1 Capital Commitments
Commitments in respect of Capital Expenditure:- Approved and Contracted for:- 28 500 929 009 Other 28 500 929 009
- Approved but Not Yet Contracted for:- - - Infrastructure - - Other - -
Total Capital Commitments 28 500 929 009
This expenditure will be financed from: Government Grants 28 500 929 009 Own Resources - -
28 500 929 009
40.2 Lease Commitments
40.3 Other Commitments
The Municipality incurred non-compliance to the following section of the indicated chapters of the MFMAduring the year under review:
Description
General Financial Management Functions 8
Section
6232Unauthorised, Irregular or Fruitless and Wasteful Expenditure 4
Revenue Management
Disclosures concerning Councillors, Directors and Officials 12 124
8 64
The Municipality has entered into a contract with Ducharme Consulting (Pty) Ltd during the 2016 financialyear for the compilation of Annual Financial Statements and audit assistance, which will give rise to a totalcharge of R253,810.
Non-cancellable Operating Lease Commitments are disclosed in Note 12.
16614Audit Committees125
In terms of section 36(2) of the Municipal Supply Chain Management Regulations approved by the council,any deviation from the Supply Chain Management Policy needs to be approved / condoned by theMunicipal Manager, noted by Council and bids where the formal procurement processes could not befollowed must be noted in the Annual Financial Statements.
All deviations from the the Municipality's Supply Chain Management Policy were identified and disclosed asirregular expenditure in Note 38.3.
Other Compulsory Disclosures 12
Chapter
Disclosures on Intergovernmental and Other Allocations 12 123Expenditure Management 8 65
74
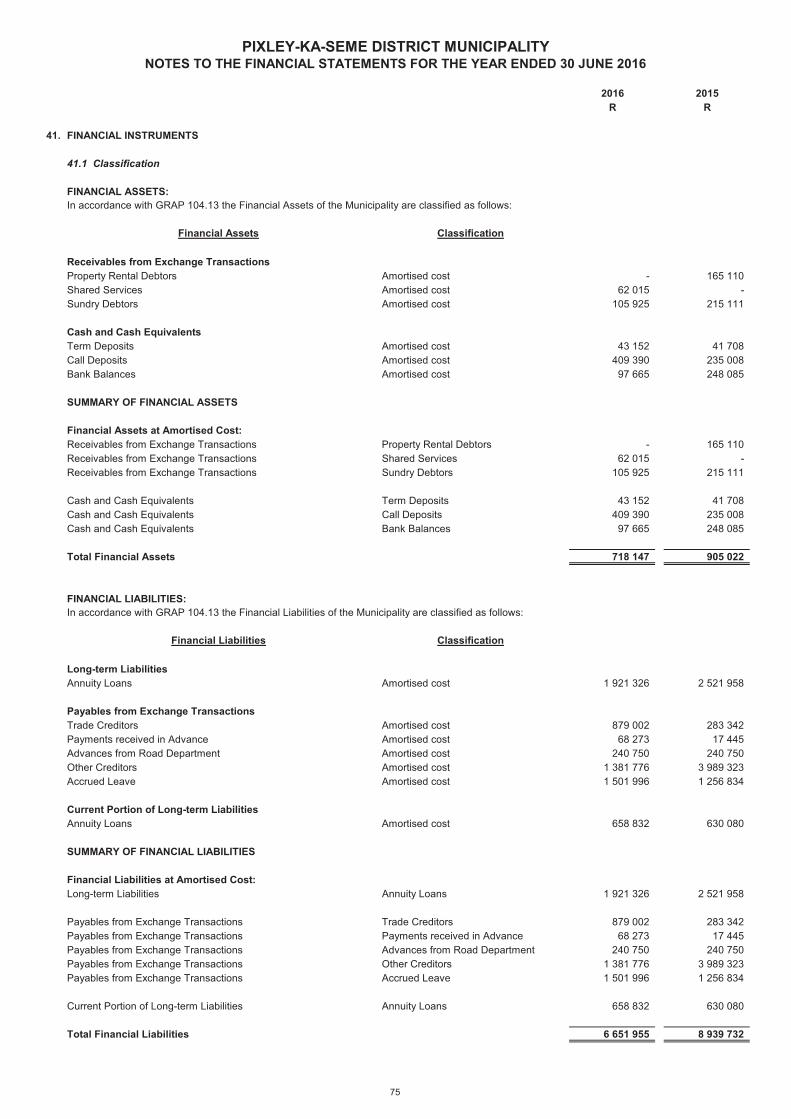
2016 2015R R
PIXLEY-KA-SEME DISTRICT MUNICIPALITYNOTES TO THE FINANCIAL STATEMENTS FOR THE YEAR ENDED 30 JUNE 2016
41. FINANCIAL INSTRUMENTS
41.1 Classification
FINANCIAL ASSETS:
Receivables from Exchange TransactionsProperty Rental Debtors Amortised cost - 165 110 Shared Services Amortised cost 62 015 - Sundry Debtors Amortised cost 105 925 215 111
Cash and Cash EquivalentsTerm Deposits Amortised cost 43 152 41 708 Call Deposits Amortised cost 409 390 235 008 Bank Balances Amortised cost 97 665 248 085
SUMMARY OF FINANCIAL ASSETS
Financial Assets at Amortised Cost:Receivables from Exchange Transactions Property Rental Debtors - 165 110 Receivables from Exchange Transactions Shared Services 62 015 - Receivables from Exchange Transactions Sundry Debtors 105 925 215 111
Cash and Cash Equivalents Term Deposits 43 152 41 708 Cash and Cash Equivalents Call Deposits 409 390 235 008 Cash and Cash Equivalents Bank Balances 97 665 248 085
Total Financial Assets 718 147 905 022
FINANCIAL LIABILITIES:
Long-term LiabilitiesAnnuity Loans Amortised cost 1 921 326 2 521 958
Payables from Exchange TransactionsTrade Creditors Amortised cost 879 002 283 342 Payments received in Advance Amortised cost 68 273 17 445 Advances from Road Department Amortised cost 240 750 240 750 Other Creditors Amortised cost 1 381 776 3 989 323 Accrued Leave Amortised cost 1 501 996 1 256 834
Current Portion of Long-term LiabilitiesAnnuity Loans Amortised cost 658 832 630 080
SUMMARY OF FINANCIAL LIABILITIES
Financial Liabilities at Amortised Cost:Long-term Liabilities Annuity Loans 1 921 326 2 521 958
Payables from Exchange Transactions Trade Creditors 879 002 283 342 Payables from Exchange Transactions Payments received in Advance 68 273 17 445 Payables from Exchange Transactions Advances from Road Department 240 750 240 750 Payables from Exchange Transactions Other Creditors 1 381 776 3 989 323 Payables from Exchange Transactions Accrued Leave 1 501 996 1 256 834
Current Portion of Long-term Liabilities Annuity Loans 658 832 630 080
Total Financial Liabilities 6 651 955 8 939 732 0.00- 0.00-
Classification
In accordance with GRAP 104.13 the Financial Assets of the Municipality are classified as follows:
Financial Assets
In accordance with GRAP 104.13 the Financial Liabilities of the Municipality are classified as follows:
Financial Liabilities Classification
75
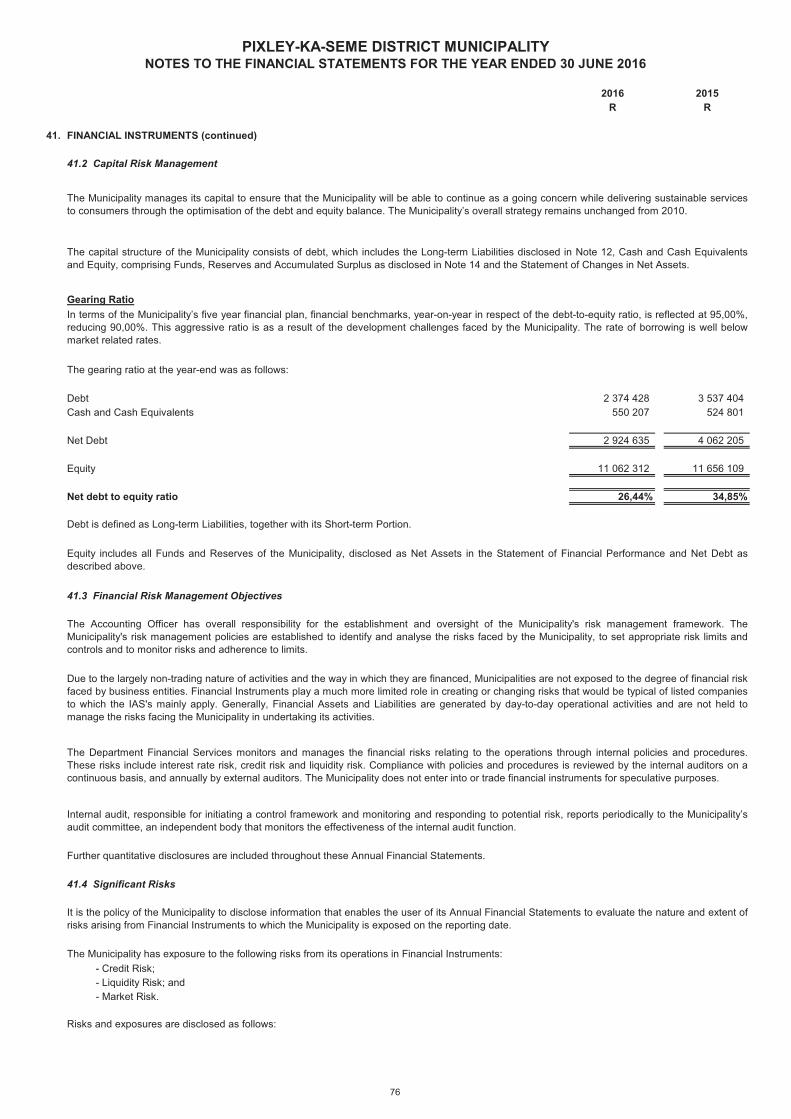
2016 2015R R
PIXLEY-KA-SEME DISTRICT MUNICIPALITYNOTES TO THE FINANCIAL STATEMENTS FOR THE YEAR ENDED 30 JUNE 2016
41. FINANCIAL INSTRUMENTS (continued)
41.2 Capital Risk Management
Gearing Ratio
Debt 2 374 428 3 537 404 Cash and Cash Equivalents 550 207 524 801
Net Debt 2 924 635 4 062 205
Equity 11 062 312 11 656 109
Net debt to equity ratio 26,44% 34,85%
41.3 Financial Risk Management Objectives
41.4 Significant Risks
- Credit Risk; - Liquidity Risk; and - Market Risk.
Due to the largely non-trading nature of activities and the way in which they are financed, Municipalities are not exposed to the degree of financial riskfaced by business entities. Financial Instruments play a much more limited role in creating or changing risks that would be typical of listed companiesto which the IAS's mainly apply. Generally, Financial Assets and Liabilities are generated by day-to-day operational activities and are not held tomanage the risks facing the Municipality in undertaking its activities.
Equity includes all Funds and Reserves of the Municipality, disclosed as Net Assets in the Statement of Financial Performance and Net Debt asdescribed above.
The Accounting Officer has overall responsibility for the establishment and oversight of the Municipality's risk management framework. TheMunicipality's risk management policies are established to identify and analyse the risks faced by the Municipality, to set appropriate risk limits andcontrols and to monitor risks and adherence to limits.
Further quantitative disclosures are included throughout these Annual Financial Statements.
In terms of the Municipality’s five year financial plan, financial benchmarks, year-on-year in respect of the debt-to-equity ratio, is reflected at 95,00%,reducing 90,00%. This aggressive ratio is as a result of the development challenges faced by the Municipality. The rate of borrowing is well belowmarket related rates.
It is the policy of the Municipality to disclose information that enables the user of its Annual Financial Statements to evaluate the nature and extent ofrisks arising from Financial Instruments to which the Municipality is exposed on the reporting date.
The Municipality has exposure to the following risks from its operations in Financial Instruments:
Risks and exposures are disclosed as follows:
The capital structure of the Municipality consists of debt, which includes the Long-term Liabilities disclosed in Note 12, Cash and Cash Equivalentsand Equity, comprising Funds, Reserves and Accumulated Surplus as disclosed in Note 14 and the Statement of Changes in Net Assets.
The Department Financial Services monitors and manages the financial risks relating to the operations through internal policies and procedures.These risks include interest rate risk, credit risk and liquidity risk. Compliance with policies and procedures is reviewed by the internal auditors on acontinuous basis, and annually by external auditors. The Municipality does not enter into or trade financial instruments for speculative purposes.
Internal audit, responsible for initiating a control framework and monitoring and responding to potential risk, reports periodically to the Municipality’saudit committee, an independent body that monitors the effectiveness of the internal audit function.
The Municipality manages its capital to ensure that the Municipality will be able to continue as a going concern while delivering sustainable servicesto consumers through the optimisation of the debt and equity balance. The Municipality’s overall strategy remains unchanged from 2010.
The gearing ratio at the year-end was as follows:
Debt is defined as Long-term Liabilities, together with its Short-term Portion.
76
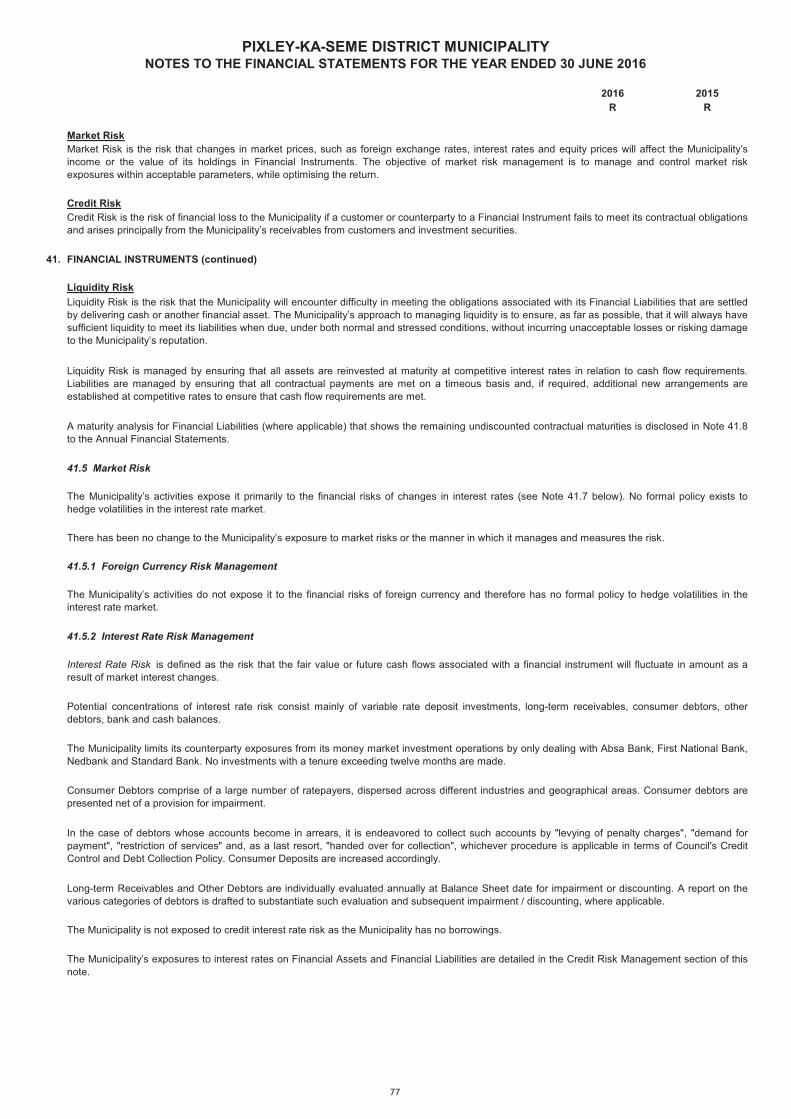
2016 2015R R
PIXLEY-KA-SEME DISTRICT MUNICIPALITYNOTES TO THE FINANCIAL STATEMENTS FOR THE YEAR ENDED 30 JUNE 2016
Market Risk
Credit Risk
41. FINANCIAL INSTRUMENTS (continued)
Liquidity Risk
41.5 Market Risk
41.5.1 Foreign Currency Risk Management
41.5.2 Interest Rate Risk Management
The Municipality’s activities do not expose it to the financial risks of foreign currency and therefore has no formal policy to hedge volatilities in theinterest rate market.
Interest Rate Risk is defined as the risk that the fair value or future cash flows associated with a financial instrument will fluctuate in amount as aresult of market interest changes.
Potential concentrations of interest rate risk consist mainly of variable rate deposit investments, long-term receivables, consumer debtors, otherdebtors, bank and cash balances.
The Municipality’s exposures to interest rates on Financial Assets and Financial Liabilities are detailed in the Credit Risk Management section of thisnote.
Long-term Receivables and Other Debtors are individually evaluated annually at Balance Sheet date for impairment or discounting. A report on thevarious categories of debtors is drafted to substantiate such evaluation and subsequent impairment / discounting, where applicable.
The Municipality is not exposed to credit interest rate risk as the Municipality has no borrowings.
Consumer Debtors comprise of a large number of ratepayers, dispersed across different industries and geographical areas. Consumer debtors arepresented net of a provision for impairment.
The Municipality’s activities expose it primarily to the financial risks of changes in interest rates (see Note 41.7 below). No formal policy exists tohedge volatilities in the interest rate market.
A maturity analysis for Financial Liabilities (where applicable) that shows the remaining undiscounted contractual maturities is disclosed in Note 41.8to the Annual Financial Statements.
There has been no change to the Municipality’s exposure to market risks or the manner in which it manages and measures the risk.
Liquidity Risk is the risk that the Municipality will encounter difficulty in meeting the obligations associated with its Financial Liabilities that are settledby delivering cash or another financial asset. The Municipality’s approach to managing liquidity is to ensure, as far as possible, that it will always havesufficient liquidity to meet its liabilities when due, under both normal and stressed conditions, without incurring unacceptable losses or risking damageto the Municipality’s reputation.
The Municipality limits its counterparty exposures from its money market investment operations by only dealing with Absa Bank, First National Bank,Nedbank and Standard Bank. No investments with a tenure exceeding twelve months are made.
In the case of debtors whose accounts become in arrears, it is endeavored to collect such accounts by "levying of penalty charges", "demand forpayment", "restriction of services" and, as a last resort, "handed over for collection", whichever procedure is applicable in terms of Council's CreditControl and Debt Collection Policy. Consumer Deposits are increased accordingly.
Market Risk is the risk that changes in market prices, such as foreign exchange rates, interest rates and equity prices will affect the Municipality’sincome or the value of its holdings in Financial Instruments. The objective of market risk management is to manage and control market riskexposures within acceptable parameters, while optimising the return.
Credit Risk is the risk of financial loss to the Municipality if a customer or counterparty to a Financial Instrument fails to meet its contractual obligationsand arises principally from the Municipality’s receivables from customers and investment securities.
Liquidity Risk is managed by ensuring that all assets are reinvested at maturity at competitive interest rates in relation to cash flow requirements.Liabilities are managed by ensuring that all contractual payments are met on a timeous basis and, if required, additional new arrangements areestablished at competitive rates to ensure that cash flow requirements are met.
77

2016 2015R R
PIXLEY-KA-SEME DISTRICT MUNICIPALITYNOTES TO THE FINANCIAL STATEMENTS FOR THE YEAR ENDED 30 JUNE 2016
Interest Rate Sensitivity Analysis
Cash and Cash Equivalents:
41.6 Credit Risk Management
41. FINANCIAL INSTRUMENTS (continued)
Investments/Bank, Cash and Cash Equivalents
Trade and Other Receivables
Receivables from Exchange Transactions 1 735 504 1 807 911 Bank, Cash and Cash Equivalents 550 207 524 801
Maximum Credit and Interest Risk Exposure 2 285 711 2 332 712
% %Other Debtors: - Other not Classified 100% 100%
Total Credit Risk 100% 100%
The Municipality limits its counterparty exposures from its money market investment operations (financial assets that are neither past due norimpaired) by only dealing with Absa Bank, First National Bank, Nedbank and Standard Bank. No investments with a tenure exceeding twelve monthsare made.
The sensitivity analysis has been determined based on the exposure to interest rates at the Statement of Financial Position date. The analysis isprepared by averaging the amount of the investment at the beginning of the financial year and the amount of the investment at the end of thefinancial year. A 100 basis point increase or decrease was used, which represents management’s assessment of the reasonably possible change ininterest rates. The short and long-term financial instruments at year-end with variable interest rates are set out in Note 56.8 below:
If interest rates had been 100 basis points higher / lower and all other variables were held constant, the Municipality’s:
Trade and Other Receivables are amounts owed by consumers and are presented net of impairment losses. The Municipality has a credit risk policyin place and the exposure to credit risk is monitored on an ongoing basis. The Municipality is compelled in terms of its constitutional mandate toprovide all its residents with basic minimum services without recourse to an assessment of creditworthiness.
Credit Risk refers to the risk that a counterparty will default on its contractual obligations resulting in financial loss to the Municipality. The Municipalityhas a sound credit control and debt collection policy and obtains sufficient collateral, where appropriate, as a means of mitigating the risk of financialloss from defaults. The Municipality uses its own trading records to assess its major customers. The Municipality’s exposure of its counterparties aremonitored regularly.
Potential concentrations of credit rate risk consist mainly of variable rate deposit investments, long-term receivables, consumer debtors, otherdebtors, bank and cash balances.
Surplus for the year ended 30 June 2016 would have decreased by R5 358 (2015: R8 925). This is mainly attributable to the Municipality’s exposure to interest rates on its variable rate investments.
Long-term Receivables and Other Debtors are individually evaluated annually at reporting date for impairment or discounting. A report on the variouscategories of debtors is drafted to substantiate such evaluation and subsequent impairment / discounting, where applicable.
The Municipality does not have any significant credit risk exposure to any single counterparty or any group of counterparties having similarcharacteristics. The Municipality defines counterparties as having similar characteristics if they are related entities. The credit risk on liquid funds islimited because the counterparties are banks with high credit-ratings.
There were no material changes in the exposure to credit risk and its objectives, policies and processes for managing and measuring the risk duringthe year under review. The Municipality’s maximum exposure to credit risk is represented by the carrying value of each financial asset in theStatement of Financial Position, without taking into account the value of any collateral obtained. The Municipality has no significant concentration ofcredit risk, with exposure spread over a large number of consumers, and is not concentrated in any particular sector or geographical area.
The maximum credit and interest risk exposure in respect of the relevant financial instruments is as follows:
The major concentrations of credit risk that arise from the Municipality's receivables in relation to customerclassification are as follows:
The Municipality establishes an allowance for impairment that represents its estimate of anticipated losses in respect of trade and other receivables.
Payment of accounts of consumer debtors, who are unable to pay, are renegotiated as an ongoing customer relationship in response to an adversechange in the circumstances of the customer in terms of the Credit Control and Debt Collection Policy.
78
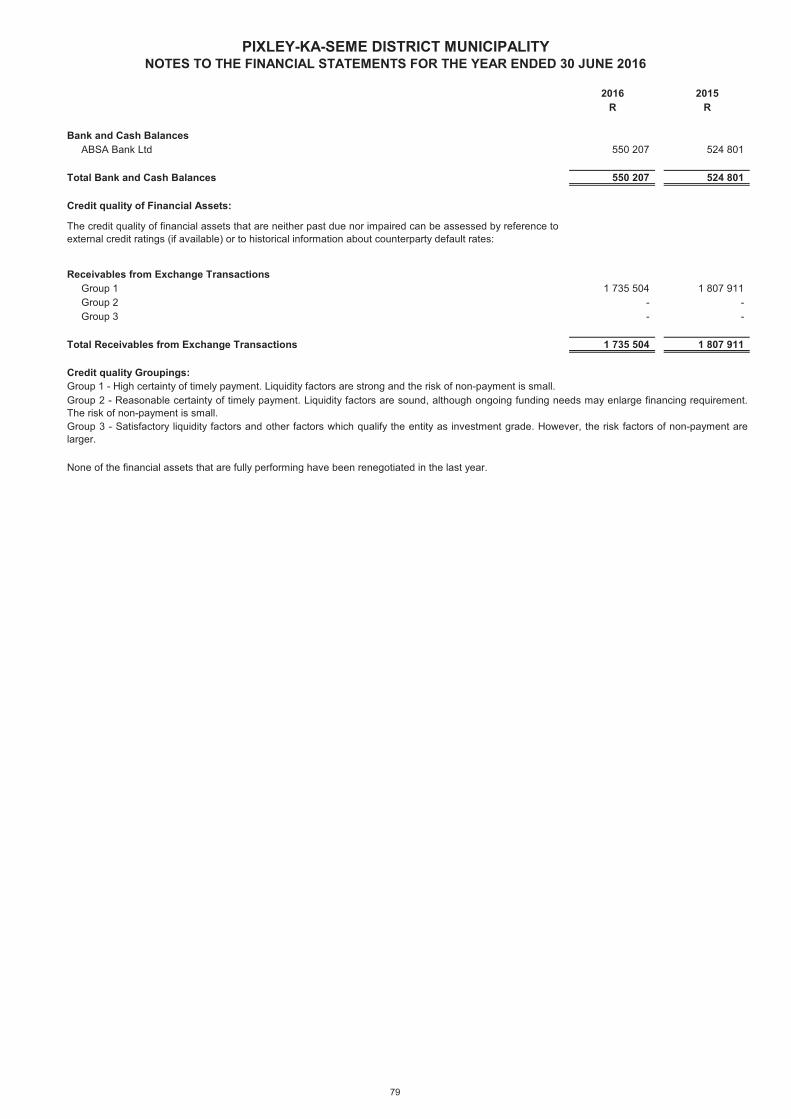
2016 2015R R
PIXLEY-KA-SEME DISTRICT MUNICIPALITYNOTES TO THE FINANCIAL STATEMENTS FOR THE YEAR ENDED 30 JUNE 2016
Bank and Cash Balances ABSA Bank Ltd 550 207 524 801
Total Bank and Cash Balances 550 207 524 801 - -
Credit quality of Financial Assets:
Receivables from Exchange Transactions Group 1 1 735 504 1 807 911 Group 2 - - Group 3 - -
Total Receivables from Exchange Transactions 1 735 504 1 807 911
Credit quality Groupings:
Group 2 - Reasonable certainty of timely payment. Liquidity factors are sound, although ongoing funding needs may enlarge financing requirement.The risk of non-payment is small.Group 3 - Satisfactory liquidity factors and other factors which qualify the entity as investment grade. However, the risk factors of non-payment arelarger.
None of the financial assets that are fully performing have been renegotiated in the last year.
The credit quality of financial assets that are neither past due nor impaired can be assessed by reference toexternal credit ratings (if available) or to historical information about counterparty default rates:
Group 1 - High certainty of timely payment. Liquidity factors are strong and the risk of non-payment is small.
79
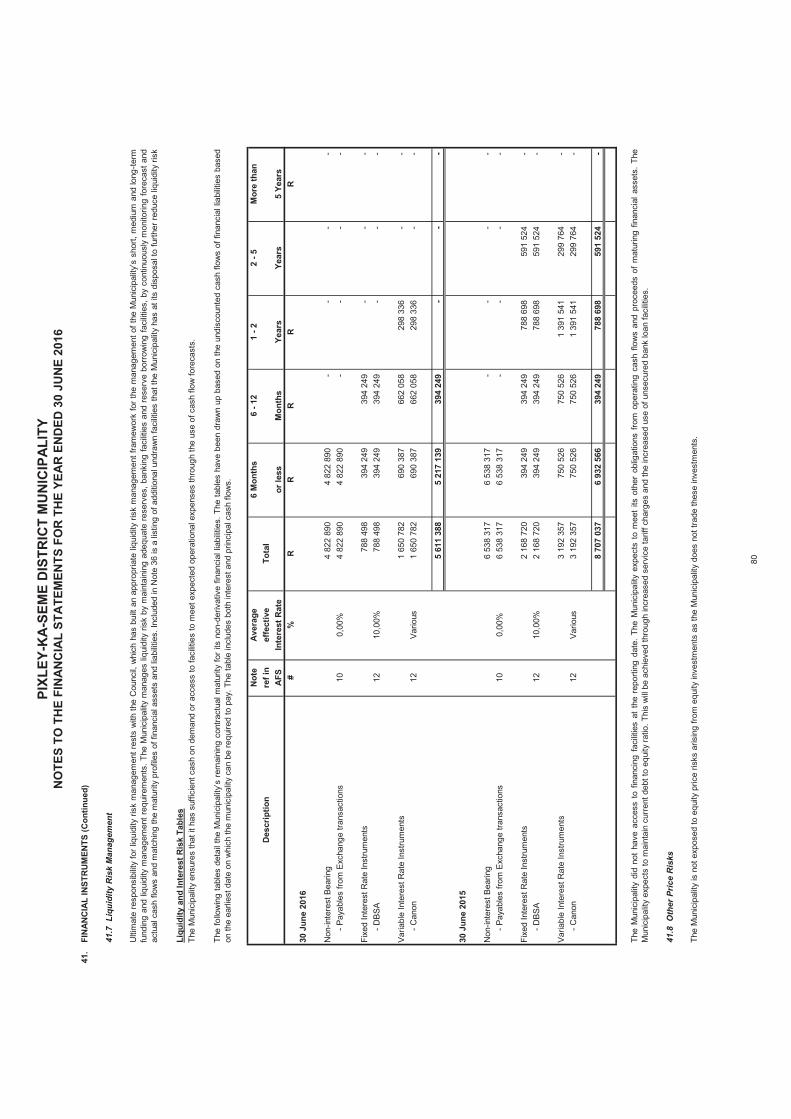
41.
FIN
AN
CIA
L IN
STR
UM
ENTS
(Con
tinue
d)
41.7
Liq
uidi
ty R
isk
Man
agem
ent
Liqu
idity
and
Inte
rest
Ris
k Ta
bles
Not
eA
vera
ge6
Mon
ths
6 - 1
21
- 22
- 5M
ore
than
Des
crip
tion
ref i
nef
fect
ive
Tota
lA
FSIn
tere
st R
ate
or le
ssM
onth
sYe
ars
Year
s5
Year
s#
%R
RR
RR
30 J
une
2016
Non
-inte
rest
Bea
ring
4 82
2 89
0
4
822
890
-
-
-
-
-
Pay
able
s fro
m E
xcha
nge
trans
actio
ns10
0,00
%4
822
890
4 82
2 89
0
-
-
-
-
Fixe
d In
tere
st R
ate
Inst
rum
ents
788
498
39
4 24
9
394
249
-
-
-
- D
BSA
1210
,00%
788
498
39
4 24
9
394
249
-
-
-
Varia
ble
Inte
rest
Rat
e In
stru
men
ts1
650
782
690
387
66
2 05
8
298
336
-
-
- C
anon
12Va
rious
1 65
0 78
2
69
0 38
7
662
058
29
8 33
6
-
-
5 61
1 38
8
5
217
139
394
249
-
-
-
30 J
une
2015
Non
-inte
rest
Bea
ring
6 53
8 31
7
6
538
317
-
-
-
-
-
Pay
able
s fro
m E
xcha
nge
trans
actio
ns10
0,00
%6
538
317
6 53
8 31
7
-
-
-
-
Fixe
d In
tere
st R
ate
Inst
rum
ents
2 16
8 72
0
39
4 24
9
394
249
78
8 69
8
591
524
-
- D
BSA
1210
,00%
2 16
8 72
0
39
4 24
9
394
249
78
8 69
8
591
524
-
Varia
ble
Inte
rest
Rat
e In
stru
men
ts3
192
357
750
526
75
0 52
6
1 39
1 54
1
29
9 76
4
-
-
Can
on12
Vario
us3
192
357
750
526
75
0 52
6
1 39
1 54
1
29
9 76
4
-
8 70
7 03
7
6
932
566
394
249
78
8 69
8
591
524
-
6
6
12
36
41.8
Oth
er P
rice
Ris
ks
The
Mun
icip
ality
is n
ot e
xpos
ed to
equ
ity p
rice
risks
aris
ing
from
equ
ity in
vest
men
ts a
s th
e M
unic
ipal
ity d
oes
not t
rade
thes
e in
vest
men
ts.
The
Mun
icip
ality
did
not
have
acce
ssto
finan
cing
faci
litie
sat
the
repo
rting
date
.The
Mun
icip
ality
expe
cts
tom
eet
itsot
her
oblig
atio
nsfro
mop
erat
ing
cash
flow
san
dpr
ocee
dsof
mat
urin
gfin
anci
alas
sets
.Th
eM
unic
ipal
ity e
xpec
ts to
mai
ntai
n cu
rren
t deb
t to
equi
ty ra
tio. T
his
will
be a
chie
ved
thro
ugh
incr
ease
d se
rvic
e ta
riff c
harg
es a
nd th
e in
crea
sed
use
of u
nsec
ured
ban
k lo
an fa
cilit
ies.
The
follo
win
gta
bles
deta
ilth
eM
unic
ipal
ity’s
rem
aini
ngco
ntra
ctua
lmat
urity
fori
tsno
n-de
rivat
ive
finan
cial
liabi
litie
s.Th
eta
bles
have
been
draw
nup
base
don
the
undi
scou
nted
cash
flow
sof
finan
cial
liabi
litie
sba
sed
on th
e ea
rlies
t dat
e on
whi
ch th
e m
unic
ipal
ity c
an b
e re
quire
d to
pay
. The
tabl
e in
clud
es b
oth
inte
rest
and
prin
cipa
l cas
h flo
ws.
PIXL
EY-K
A-SE
ME
DIS
TRIC
T M
UN
ICIP
ALIT
YN
OTE
S TO
TH
E FI
NA
NC
IAL
STA
TEM
ENTS
FO
R T
HE
YEA
R E
ND
ED 3
0 JU
NE
2016
Ulti
mat
ere
spon
sibi
lity
forl
iqui
dity
risk
man
agem
entr
ests
with
the
Cou
ncil,
whi
chha
sbu
iltan
appr
opria
teliq
uidi
tyris
km
anag
emen
tfra
mew
ork
fort
hem
anag
emen
toft
heM
unic
ipal
ity’s
shor
t,m
ediu
man
dlo
ng-te
rmfu
ndin
gan
dliq
uidi
tym
anag
emen
treq
uire
men
ts.T
heM
unic
ipal
itym
anag
esliq
uidi
tyris
kby
mai
ntai
ning
adeq
uate
rese
rves
,ban
king
faci
litie
san
dre
serv
ebo
rrow
ing
faci
litie
s,by
cont
inuo
usly
mon
itorin
gfo
reca
stan
dac
tual
cash
flow
san
dm
atch
ing
the
mat
urity
prof
iles
offin
anci
alas
sets
and
liabi
litie
s.In
clud
edin
Not
e36
isa
listin
gof
addi
tiona
lund
raw
nfa
cilit
ies
that
the
Mun
icip
ality
has
atits
disp
osal
tofu
rther
redu
celiq
uidi
tyris
k
The
Mun
icip
ality
ens
ures
that
it h
as s
uffic
ient
cas
h on
dem
and
or a
cces
s to
faci
litie
s to
mee
t exp
ecte
d op
erat
iona
l exp
ense
s th
roug
h th
e us
e of
cas
h flo
w fo
reca
sts.
80
2016 2015R R
42. MULTI-EMPLOYER RETIREMENT BENEFIT INFORMATION
DEFINED CONTRIBUTION SCHEMES
Cape Joint Retirement Fund:
43. RELATED PARTY TRANSACTIONS
43.1 Interest of Related Parties
No relationships have been identified.
43.2 Services rendered to Related Parties
43.3 Loans granted to Related Parties
43.4 Compensation of Related Parties
43.5 Purchases from Related Parties
The Retirement Funds have been valued by making use of the Discounted Cash Flow method of valuation.
The Municipality did not render any services during the year to anyone that can be considered as a relatedparty.
The scheme is subject to an annual actuarial valuation. The last statutory valuation was performed as at 30June 2013.
The statutory valuation performed as at 30 June 2013 revealed that the assets of the fund amounted toR31,425 (30 June 2012: R(7,980)) million, with funding levels of 100.2% and 105.1% (30 June 2012: 99.9%and 108.0%) for the Share Account and the Pensions Account respectively. The contribution rate paid bythe members (7,50%) and the municipalities (19,50%) is sufficient to fund the benefits accruing from thefund in the future.
In terms of the MFMA, the municipality may not grant loans to its Councillors, Management, Staff andPublic with effect from 1 July 2004. No such loans existed at yearend.
Compensation of Key Management Personnel and Councillors is set out in Appendix G, Statement ofRemuneration of Managment, to the Annual Financial Statements.
The Municipality did not buy goods from any companies which can be considered to be Related Parties.
All Related Party Transactions are conducted at arm's length, unless stated otherwise.
All councillors belong to the Pension Fund for Municipal Councillors.
Employees belong to a variety of approved Pension and Provident Funds as described below.
These funds are governed by the Pension Funds Act and include both defined benefit and definedcontribution schemes.
All of these afore-mentioned funds are multi-employer plans and are subject to either a tri-annual, bi-annualor annual actuarial valuation, details which are provided below.
Sufficient information is not available to use defined benefit accounting for the pension and retirementfunds, due to the following reasons:-(i) The assets of each fund are held in one portfolio and are not notionally allocated to each of theparticipating employers.
PIXLEY-KA-SEME DISTRICT MUNICIPALITYNOTES TO THE FINANCIAL STATEMENTS FOR THE YEAR ENDED 30 JUNE 2016
The Municipality makes provision for post-retirement benefits to eligible councillors and employees, whobelong to different pension schemes.
The only obligation of the Municipality with respect to the retirement benefit plans is to make the specifiedcontributions. Where councillors / employees leave the plans prior to full vesting of the contributions, thecontributions payable by the municipality are reduced by the amount of forfeited contributions.
The total expense recognised in the Statement of Financial Performance of R3 174 629 (2015: R2 929 458)represents contributions payable to these plans by the Municipality at rates specified in the rules of theplans. These contributions have been expensed.
(ii) One set of financial statements are compiled for each fund and financial statements are not drafted for each participating employer.(iii) The same rate of contribution applies to all participating employers and no regard is paid todifferences in the membership distribution of the participating employers.
It is therefore seen that each fund operates as a single entity and is not divided into sub-funds for eachparticipating employer.
81
2016 2015R R
PIXLEY-KA-SEME DISTRICT MUNICIPALITYNOTES TO THE FINANCIAL STATEMENTS FOR THE YEAR ENDED 30 JUNE 2016
44. CONTINGENT LIABILITIES
No Contingent Liabilities existed at yearend.
45. CONTINGENT ASSETS
46. IN-KIND DONATIONS AND ASSISTANCE
Increase / (Decrease) in Property Plant and Equipment - 1 249 (Increase) / Decrease in Donations Received - (1 400) Increase / (Decrease) in Depreciation Expense - 151
- -
47. PRIVATE PUBLIC PARTNERSHIPS
48. EVENTS AFTER THE REPORTING DATE
49. COMPARATIVE FIGURES
50. GOING CONCERN ASSESSMENT
Management considered the following matters relating to the Going Concern:
(i) On 1 May 2013 the Council adopted the 2013/14 to 2015/16 Budget. This three-year Medium TermRevenue and Expenditure Framework (MTREF) to support the ongoing delivery of Municipal services toresidents reflected that the Budget was cash-backed over the three-year period.
(ii) The Municipality’s Budget is subjected to a very rigorous independent assessment process to assessits cash-backing status before it is ultimately approved by Council.
(iii) Strict daily cash management processes are embedded in the municipality’s operations to manageand monitor all actual cash inflows and cash outflows in terms of the cash-flow forecast supporting theBudget. The cash management processes is complemented by monthly and quarterly reporting,highlighting the actual cash position, including the associated risks and remedial actions to be instituted.
(v) The unspent conditional grant balance is currently not cash-backed. Certain expenses were incurredduring the current and previous financial years, which did not meet the requirements of certain grants.These costs were reversed against the grant. The Municipality has begun to generate the shortfall within itsown operating budget.
The comparative figures were restated as a result of the effect of Changes in Accounting Policies (Note 31)and Prior Period Errors (Note 32).
Taking the aforementioned into account, management has prepared the Annual Financial Statements onthe Going Concern Basis.
No events having financial implications requiring disclosure occurred subsequent to 30 June 2016.
The Municipality was not a party to any Private Public Partnerships during the year under review.
The Municipality was not engaged in any transaction or event during the year under review involvingContingent Assets.
The Municipality did received In-kind Donations in the form of Donated Assets. The financial effect of theDonation is as follows:
No restrictions and / or conditions were attached to the donation.
(iv) As the Municipality has the power to levy fees, tariffs and charges, this will result in an ongoing inflowof revenue to support the ongoing delivery of municipal services. Certain key financial ratios, such asliquidity, cost coverage, debtors’ collection rates and creditors’ payment terms are closely monitored andthe necessary corrective actions instituted.
82
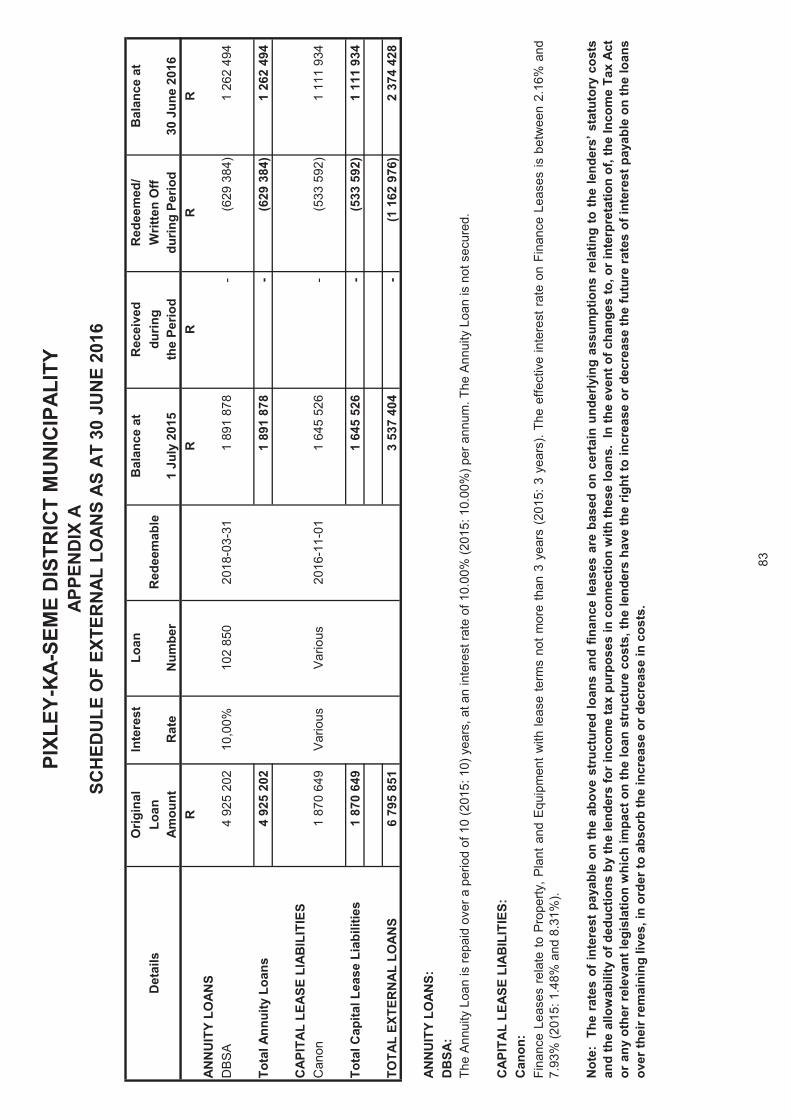
Orig
inal
Inte
rest
Loan
Bal
ance
at
Rec
eive
dR
edee
med
/B
alan
ce a
tD
etai
lsLo
anR
edee
mab
ledu
ring
Writ
ten
Off
Amou
ntR
ate
Num
ber
1 Ju
ly 2
015
the
Perio
ddu
ring
Perio
d30
Jun
e 20
16R
RR
RR
ANN
UIT
Y LO
ANS
DB
SA
4 92
5 20
2
10
,00%
102
850
2018
-03-
311
891
878
-
(629
384
)
1
262
494
Tota
l Ann
uity
Loa
ns4
925
202
1 89
1 87
8
-
(6
29 3
84)
1 26
2 49
4
CAP
ITAL
LEA
SE L
IAB
ILIT
IES
Can
on1
870
649
Var
ious
Var
ious
2016
-11-
011
645
526
-
(533
592
)
1
111
934
Tota
l Cap
ital L
ease
Lia
bilit
ies
1 87
0 64
9
1
645
526
-
(533
592
)
1
111
934
TOTA
L EX
TER
NAL
LO
ANS
6 79
5 85
1
3
537
404
-
(1 1
62 9
76)
2
374
428
0,
000,
00AN
NU
ITY
LOAN
S:D
BSA
:
CAP
ITAL
LEA
SE L
IAB
ILIT
IES:
Can
on:
Not
e:Th
era
tes
ofin
tere
stpa
yabl
eon
the
abov
est
ruct
ured
loan
san
dfin
ance
leas
esar
eba
sed
once
rtai
nun
derly
ing
assu
mpt
ions
rela
ting
toth
elenders’
stat
utor
yco
sts
and
the
allo
wab
ility
ofde
duct
ions
byth
ele
nder
sfo
rinc
ome
tax
purp
oses
inco
nnec
tion
with
thes
elo
ans.
Inth
eev
ento
fcha
nges
to,o
rint
erpr
etat
ion
of,t
heIn
com
eTa
xAc
tor
any
othe
rrel
evan
tleg
isla
tion
whi
chim
pact
onth
elo
anst
ruct
ure
cost
s,th
ele
nder
sha
veth
erig
htto
incr
ease
orde
crea
seth
efu
ture
rate
sof
inte
rest
paya
ble
onth
elo
ans
over
thei
r rem
aini
ng li
ves,
in o
rder
to a
bsor
b th
e in
crea
se o
r dec
reas
e in
cos
ts.
PIXL
EY-K
A-SE
ME
DIS
TRIC
T M
UN
ICIP
ALIT
Y
SCH
EDU
LE O
F EX
TER
NAL
LO
ANS
AS A
T 30
JU
NE
2016
The
Ann
uity
Loa
n is
repa
id o
ver a
per
iod
of 1
0 (2
015:
10)
yea
rs, a
t an
inte
rest
rate
of 1
0.00
% (2
015:
10.
00%
) per
ann
um. T
he A
nnui
ty L
oan
is n
ot s
ecur
ed.
APPE
ND
IX A
Fina
nce
Leas
esre
late
toP
rope
rty,P
lant
and
Equ
ipm
entw
ithle
ase
term
sno
tmor
eth
an3
year
s(2
015:
3ye
ars)
.The
effe
ctiv
ein
tere
stra
teon
Fina
nce
Leas
esis
betw
een
2.16
%an
d7.
93%
(201
5: 1
.48%
and
8.3
1%).
83
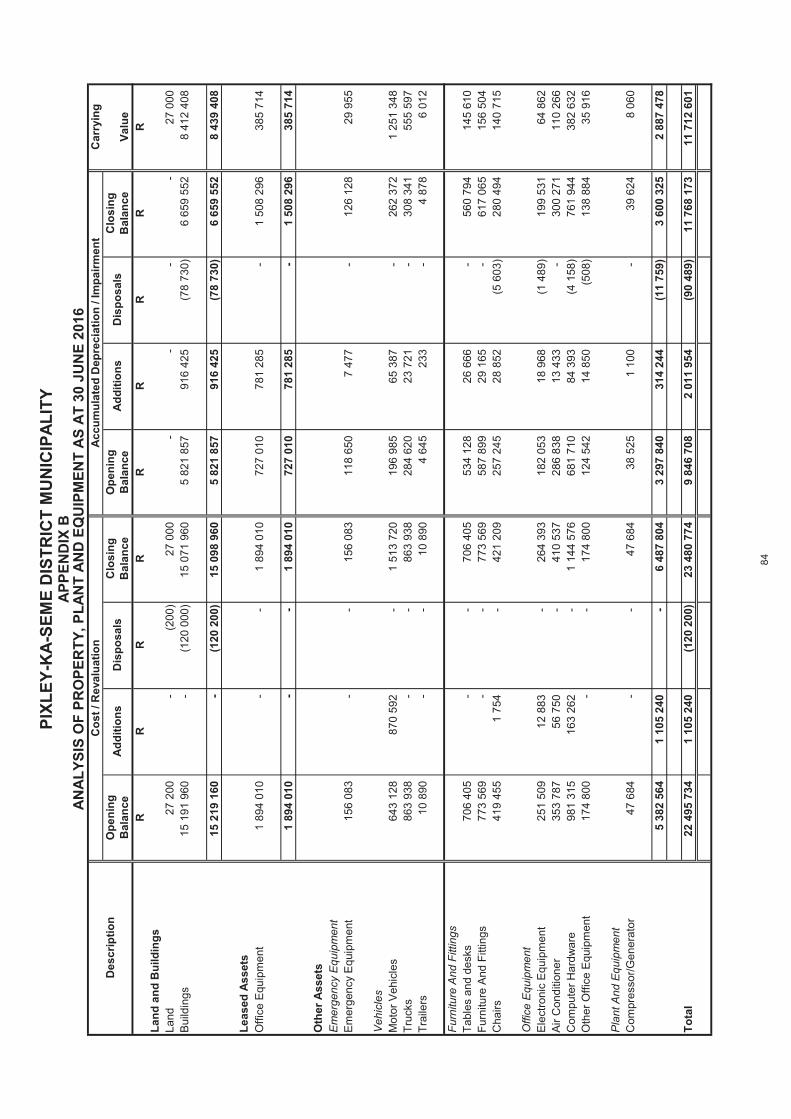
Car
ryin
gD
escr
iptio
nO
peni
ngC
losi
ngO
peni
ngC
losi
ngB
alan
ceB
alan
ceB
alan
ceB
alan
ceVa
lue
RR
RR
RR
RR
RLa
nd a
nd B
uild
ings
Land
27 2
00
-
(2
00)
27 0
00
-
-
-
-
27 0
00
Bui
ldin
gs15
191
960
-
(120
000
)
15
071
960
5
821
857
91
6 42
5
(7
8 73
0)
6 65
9 55
2
8 41
2 40
8
15 2
19 1
60
-
(1
20 2
00)
15 0
98 9
60
5 82
1 85
7
916
425
(78
730)
6
659
552
8
439
408
Leas
ed A
sset
sO
ffice
Equ
ipm
ent
1 89
4 01
0
-
-
1 89
4 01
0
727
010
781
285
-
1
508
296
38
5 71
4
1 89
4 01
0
-
-
1 89
4 01
0
727
010
781
285
-
1
508
296
38
5 71
4
Oth
er A
sset
sE
mer
genc
y E
quip
men
tE
mer
genc
y E
quip
men
t 15
6 08
3
-
-
15
6 08
3
11
8 65
0
7
477
-
12
6 12
8
29
955
Veh
icle
sM
otor
Veh
icle
s64
3 12
8
87
0 59
2
-
1 51
3 72
0
196
985
65 3
87
-
26
2 37
2
1
251
348
Tr
ucks
863
938
-
-
863
938
284
620
23 7
21
-
30
8 34
1
55
5 59
7
Tr
aile
rs10
890
-
-
10
890
4
645
233
-
4 87
8
6
012
Furn
iture
And
Fitt
ings
Tabl
es a
nd d
esks
706
405
-
-
706
405
534
128
26 6
66
-
56
0 79
4
14
5 61
0
Fu
rnitu
re A
nd F
ittin
gs77
3 56
9
-
-
77
3 56
9
58
7 89
9
29
165
-
617
065
156
504
Cha
irs41
9 45
5
1
754
-
42
1 20
9
25
7 24
5
28
852
(5
603
)
280
494
140
715
Offi
ce E
quip
men
tE
lect
roni
c E
quip
men
t25
1 50
9
12
883
-
264
393
182
053
18 9
68
(1 4
89)
19
9 53
1
64
862
A
ir C
ondi
tione
r35
3 78
7
56
750
-
410
537
286
838
13 4
33
-
30
0 27
1
11
0 26
6
C
ompu
ter H
ardw
are
981
315
163
262
-
1
144
576
68
1 71
0
84
393
(4
158
)
761
944
382
632
Oth
er O
ffice
Equ
ipm
ent
174
800
-
-
174
800
124
542
14 8
50
(508
)
13
8 88
4
35
916
Pla
nt A
nd E
quip
men
tC
ompr
esso
r/Gen
erat
or47
684
-
-
47
684
38
525
1
100
-
39
624
8
060
5 38
2 56
4
1 10
5 24
0
-
6
487
804
3
297
840
31
4 24
4
(1
1 75
9)
3 60
0 32
5
2 88
7 47
8
Tota
l22
495
734
1
105
240
(1
20 2
00)
23 4
80 7
74
9 84
6 70
8
2 01
1 95
4
(90
489)
11
768
173
11
712
601
Dis
posa
lsA
dditi
ons
PIXL
EY-K
A-SE
ME
DIS
TRIC
T M
UN
ICIP
ALIT
YA
PPEN
DIX
BA
NA
LYSI
S O
F PR
OPE
RTY
, PLA
NT
AN
D E
QU
IPM
ENT
AS
AT
30 J
UN
E 20
16C
ost /
Rev
alua
tion
Acc
umul
ated
Dep
reci
atio
n / I
mpa
irmen
t
Add
ition
sD
ispo
sals
84
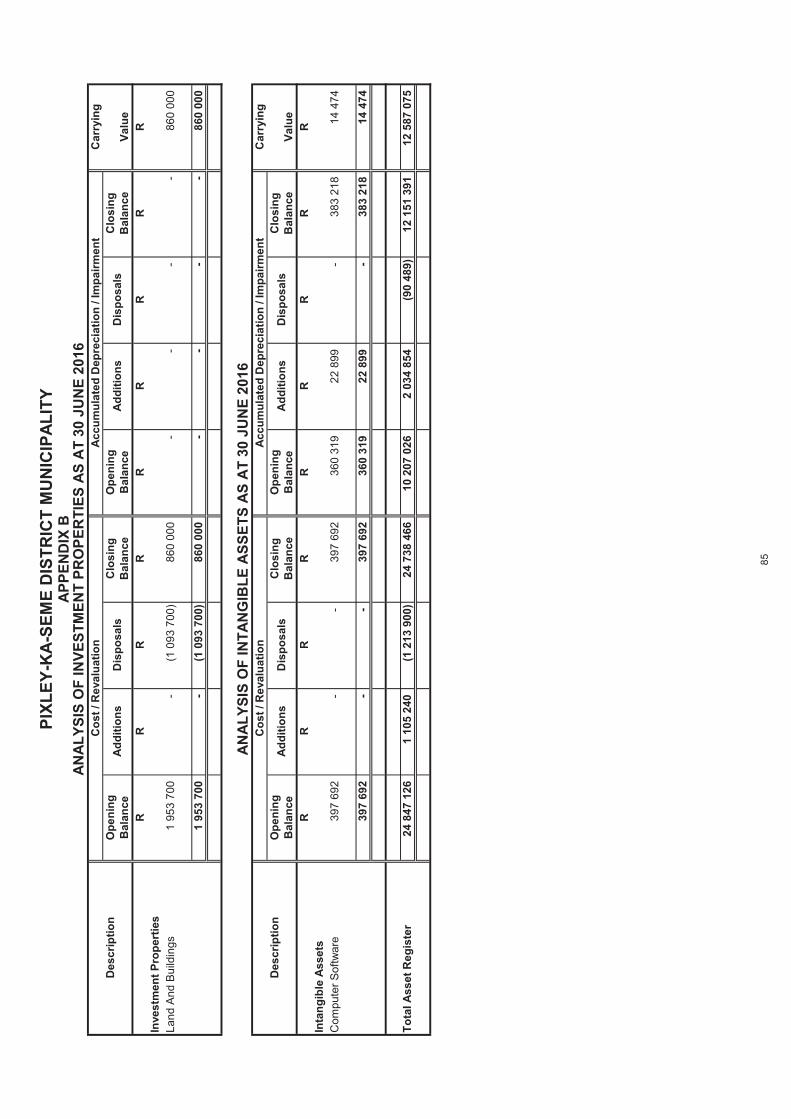
PIXL
EY-K
A-SE
ME
DIS
TRIC
T M
UN
ICIP
ALIT
Y
Car
ryin
gD
escr
iptio
nO
peni
ngC
losi
ngO
peni
ngC
losi
ngB
alan
ceB
alan
ceB
alan
ceB
alan
ceVa
lue
RR
RR
RR
RR
RIn
vest
men
t Pro
pert
ies
Land
And
Bui
ldin
gs1
953
700
-
(1 0
93 7
00)
86
0 00
0
-
-
-
-
86
0 00
0
1 95
3 70
0
-
(1
093
700
)
860
000
-
-
-
-
860
000
Car
ryin
gD
escr
iptio
nO
peni
ngC
losi
ngO
peni
ngC
losi
ngB
alan
ceB
alan
ceB
alan
ceB
alan
ceVa
lue
RR
RR
RR
RR
RIn
tang
ible
Ass
ets
Com
pute
r Sof
twar
e39
7 69
2
-
-
39
7 69
2
36
0 31
9
22
899
-
383
218
14 4
74
397
692
-
-
397
692
360
319
22 8
99
-
38
3 21
8
14
474
0,
000,
00-0
,00
Tota
l Ass
et R
egis
ter
24 8
47 1
26
1 10
5 24
0
(1 2
13 9
00)
24
738
466
10
207
026
2
034
854
(9
0 48
9)
12 1
51 3
91
12 5
87 0
75
Add
ition
sA
dditi
ons
Dis
posa
lsD
ispo
sals
Acc
umul
ated
Dep
reci
atio
n / I
mpa
irmen
tC
ost /
Rev
alua
tion
Cos
t / R
eval
uatio
n
Add
ition
sD
ispo
sals
AN
ALY
SIS
OF
INTA
NG
IBLE
ASS
ETS
AS
AT
30 J
UN
E 20
16
Dis
posa
lsA
dditi
ons
Acc
umul
ated
Dep
reci
atio
n / I
mpa
irmen
t
APP
END
IX B
AN
ALY
SIS
OF
INVE
STM
ENT
PRO
PER
TIES
AS
AT
30 J
UN
E 20
16
85
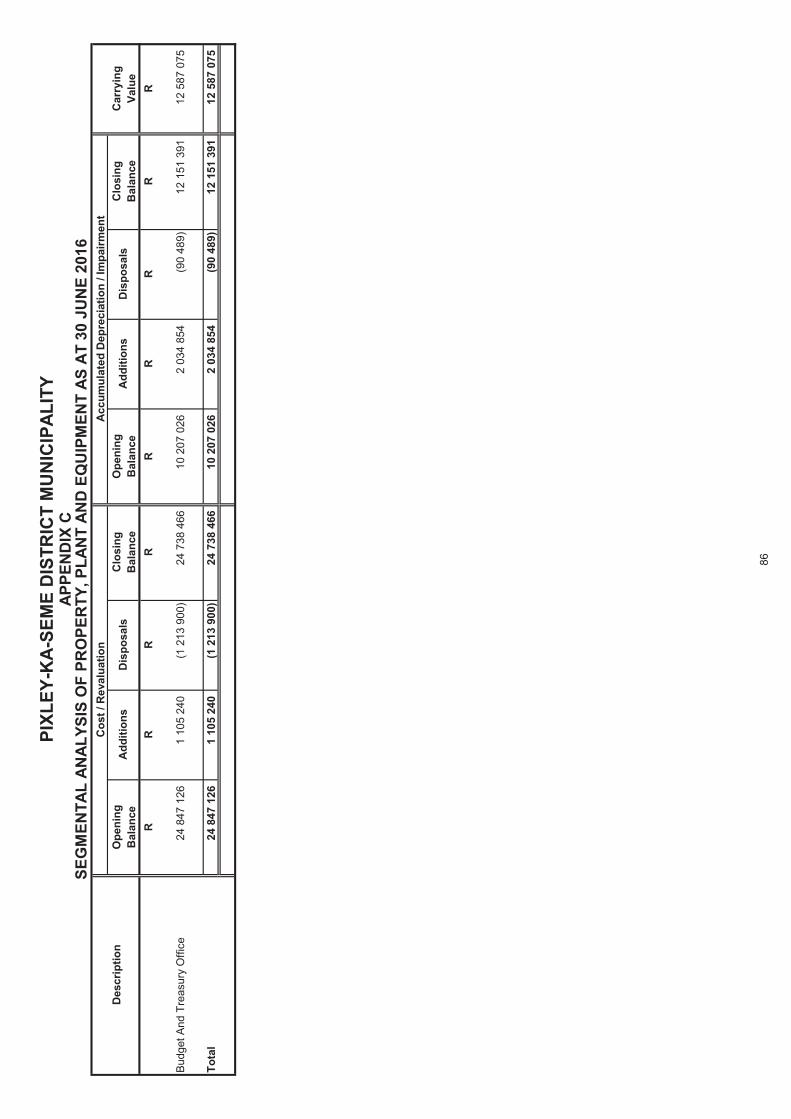
Des
crip
tion
Ope
ning
Clo
sing
Ope
ning
Clo
sing
Car
ryin
gB
alan
ceB
alan
ceB
alan
ceB
alan
ceVa
lue
RR
RR
RR
RR
R
Budg
et A
nd T
reas
ury
Offi
ce24
847
126
1 10
5 24
0
(1
213
900
)
24 7
38 4
66
10
207
026
2 03
4 85
4
(9
0 48
9)
12 1
51 3
91
12
587
075
Tota
l24
847
126
1 10
5 24
0
(1
213
900
)
24 7
38 4
66
10
207
026
2 03
4 85
4
(9
0 48
9)
12 1
51 3
91
12
587
075
PIXL
EY-K
A-SE
ME
DIS
TRIC
T M
UN
ICIP
ALIT
YAP
PEN
DIX
CSE
GM
ENTA
L AN
ALYS
IS O
F PR
OPE
RTY
, PLA
NT
AND
EQ
UIP
MEN
T AS
AT
30 J
UN
E 20
16C
ost /
Rev
alua
tion
Acc
umul
ated
Dep
reci
atio
n / I
mpa
irmen
t
Dis
posa
lsA
dditi
ons
Dis
posa
lsA
dditi
ons
86
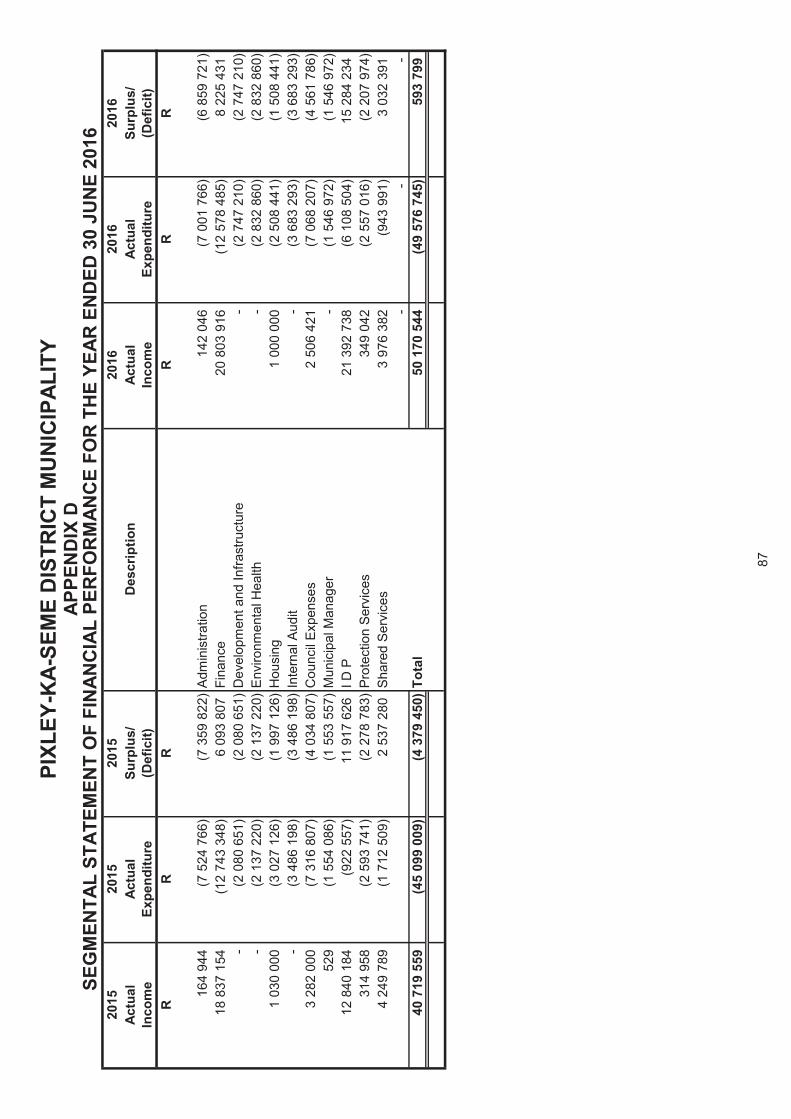
2015
2015
2015
2016
2016
2016
Actu
alAc
tual
Surp
lus/
Des
crip
tion
Actu
alAc
tual
Surp
lus/
Inco
me
Expe
nditu
re(D
efic
it)In
com
eEx
pend
iture
(Def
icit)
RR
RR
RR
164
944
(7 5
24 7
66)
(7
359
822
)
Adm
inis
tratio
n
142
046
(7 0
01 7
66)
(6
859
721
)
18 8
37 1
54
(12
743
348)
6 09
3 80
7
Fina
nce
20 8
03 9
16
(12
578
485)
8 22
5 43
1
-
(2
080
651
)
(2 0
80 6
51)
D
evel
opm
ent a
nd In
frast
ruct
ure
-
(2
747
210
)
(2 7
47 2
10)
-
(2 1
37 2
20)
(2
137
220
)
Env
ironm
enta
l Hea
lth-
(2 8
32 8
60)
(2
832
860
)
1 03
0 00
0
(3 0
27 1
26)
(1
997
126
)
Hou
sing
1 00
0 00
0
(2 5
08 4
41)
(1
508
441
)
-
(3
486
198
)
(3 4
86 1
98)
In
tern
al A
udit
-
(3
683
293
)
(3 6
83 2
93)
3
282
000
(7
316
807
)
(4 0
34 8
07)
C
ounc
il Ex
pens
es2
506
421
(7
068
207
)
(4 5
61 7
86)
52
9
(1 5
54 0
86)
(1
553
557
)
Mun
icip
al M
anag
er-
(1 5
46 9
72)
(1
546
972
)
12 8
40 1
84
(922
557
)
11
917
626
I D
P21
392
738
(6
108
504
)
15 2
84 2
34
314
958
(2 5
93 7
41)
(2
278
783
)
Prot
ectio
n Se
rvic
es34
9 04
2
(2
557
016
)
(2 2
07 9
74)
4
249
789
(1
712
509
)
2 53
7 28
0
Sha
red
Serv
ices
3 97
6 38
2
(943
991
)
3
032
391
-
-
-
40 7
19 5
59
(45
099
009)
(4 3
79 4
50)
To
tal
50 1
70 5
44
(49
576
745)
593
799
PIXL
EY-K
A-SE
ME
DIS
TRIC
T M
UN
ICIP
ALIT
Y
SEG
MEN
TAL
STAT
EMEN
T O
F FI
NAN
CIA
L PE
RFO
RM
ANC
E FO
R T
HE
YEAR
EN
DED
30
JUN
E 20
16AP
PEN
DIX
D
87
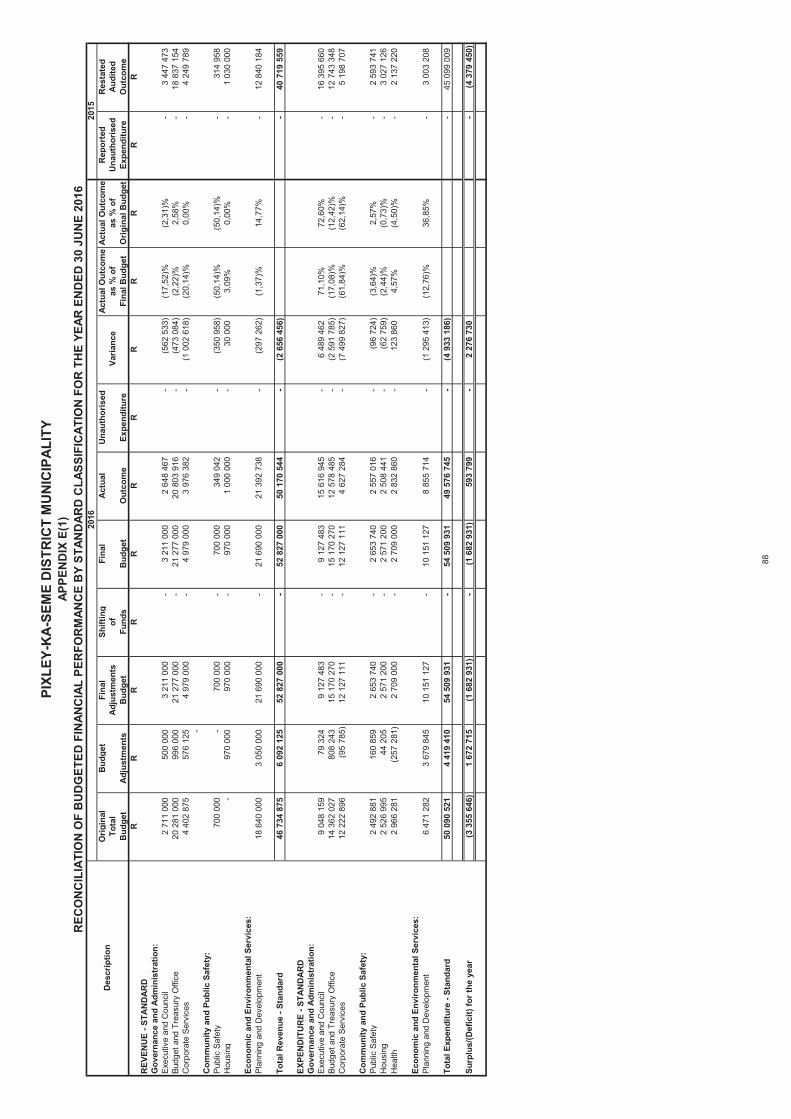
Orig
inal
Bud
get
Fina
lSh
iftin
gFi
nal
Act
ual
Una
utho
rised
Act
ual O
utco
me
Act
ual O
utco
me
Rep
orte
dR
esta
ted
Tota
lA
djus
tmen
tsof
as %
of
as %
of
Una
utho
rised
Aud
ited
Bud
get
Adj
ustm
ents
Bud
get
Fund
sB
udge
tO
utco
me
Expe
nditu
reFi
nal B
udge
tO
rigin
al B
udge
tEx
pend
iture
Out
com
eR
RR
RR
RR
RR
RR
RR
EVEN
UE
- STA
ND
AR
DG
over
nanc
e an
d A
dmin
istr
atio
n:Ex
ecut
ive
and
Cou
ncil
2 71
1 00
0
50
0 00
0
3 21
1 00
0
-
3 21
1 00
0
2
648
467
-
(5
62 5
33)
(17,
52)%
(2,3
1)%
-
3
447
473
Budg
et a
nd T
reas
ury
Offi
ce20
281
000
99
6 00
0
21 2
77 0
00
-
21
277
000
20
803
916
-
(473
084
)
(2
,22)
%2,
58%
-
18
837
154
C
orpo
rate
Ser
vice
s4
402
875
576
125
4
979
000
-
4
979
000
3 97
6 38
2
-
(1 0
02 6
18)
(2
0,14
)%0,
00%
-
4
249
789
-
C
omm
unity
and
Pub
lic S
afet
y:Pu
blic
Saf
ety
700
000
-
700
000
-
700
000
34
9 04
2
-
(3
50 9
58)
(50,
14)%
(50,
14)%
-
31
4 95
8
Hou
sing
-
97
0 00
0
970
000
-
970
000
1
000
000
-
30
000
3,
09%
0,00
%-
1 03
0 00
0
Econ
omic
and
Env
ironm
enta
l Ser
vice
s:Pl
anni
ng a
nd D
evel
opm
ent
18 6
40 0
00
3 05
0 00
0
21
690
000
-
21 6
90 0
00
21 3
92 7
38
-
(2
97 2
62)
(1,3
7)%
14,7
7%-
12 8
40 1
84
Tota
l Rev
enue
- St
anda
rd46
734
875
6
092
125
52 8
27 0
00
-
52
827
000
50
170
544
-
(2 6
56 4
56)
-
40 7
19 5
59
EXPE
ND
ITU
RE
- STA
ND
AR
DG
over
nanc
e an
d A
dmin
istr
atio
n:Ex
ecut
ive
and
Cou
ncil
9 04
8 15
9
79
324
9
127
483
-
9
127
483
15 6
16 9
45
-
6
489
462
71,1
0%72
,60%
-
16
395
660
Bu
dget
and
Tre
asur
y O
ffice
14 3
62 0
27
808
243
15
170
270
-
15 1
70 2
70
12 5
78 4
85
-
(2
591
785
)
(17,
08)%
(12,
42)%
-
12
743
348
C
orpo
rate
Ser
vice
s12
222
896
(9
5 78
5)
12 1
27 1
11
-
12
127
111
4
627
284
-
(7
499
827
)
(61,
84)%
(62,
14)%
-
5
198
707
Com
mun
ity a
nd P
ublic
Saf
ety:
Publ
ic S
afet
y2
492
881
160
859
2
653
740
-
2
653
740
2 55
7 01
6
-
(96
724)
(3
,64)
%2,
57%
-
2
593
741
Hou
sing
2 52
6 99
5
44
205
2
571
200
-
2
571
200
2 50
8 44
1
-
(62
759)
(2
,44)
%(0
,73)
%-
3 02
7 12
6
H
ealth
2 96
6 28
1
(2
57 2
81)
2 70
9 00
0
-
2 70
9 00
0
2
832
860
-
12
3 86
0
4,57
%(4
,50)
%-
2 13
7 22
0
Econ
omic
and
Env
ironm
enta
l Ser
vice
s:Pl
anni
ng a
nd D
evel
opm
ent
6 47
1 28
2
3
679
845
10 1
51 1
27
-
10
151
127
8
855
714
-
(1
295
413
)
(12,
76)%
36,8
5%-
3 00
3 20
8
Tota
l Exp
endi
ture
- St
anda
rd50
090
521
4
419
410
54 5
09 9
31
-
54
509
931
49
576
745
-
(4 9
33 1
86)
-
45 0
99 0
09
Surp
lus/
(Def
icit)
for t
he y
ear
(3 3
55 6
46)
1
672
715
(1 6
82 9
31)
-
(1 6
82 9
31)
59
3 79
9
-
2
276
730
-
(4
379
450
)
-
APPE
ND
IX E
(1)
2015
PIXL
EY-K
A-S
EME
DIS
TRIC
T M
UN
ICIP
ALI
TY
REC
ON
CIL
IATI
ON
OF
BU
DG
ETED
FIN
ANC
IAL
PER
FOR
MAN
CE
BY
STAN
DAR
D C
LASS
IFIC
ATIO
N F
OR
TH
E YE
AR E
ND
ED 3
0 JU
NE
2016
Var
ianc
e D
escr
iptio
n
2016
88
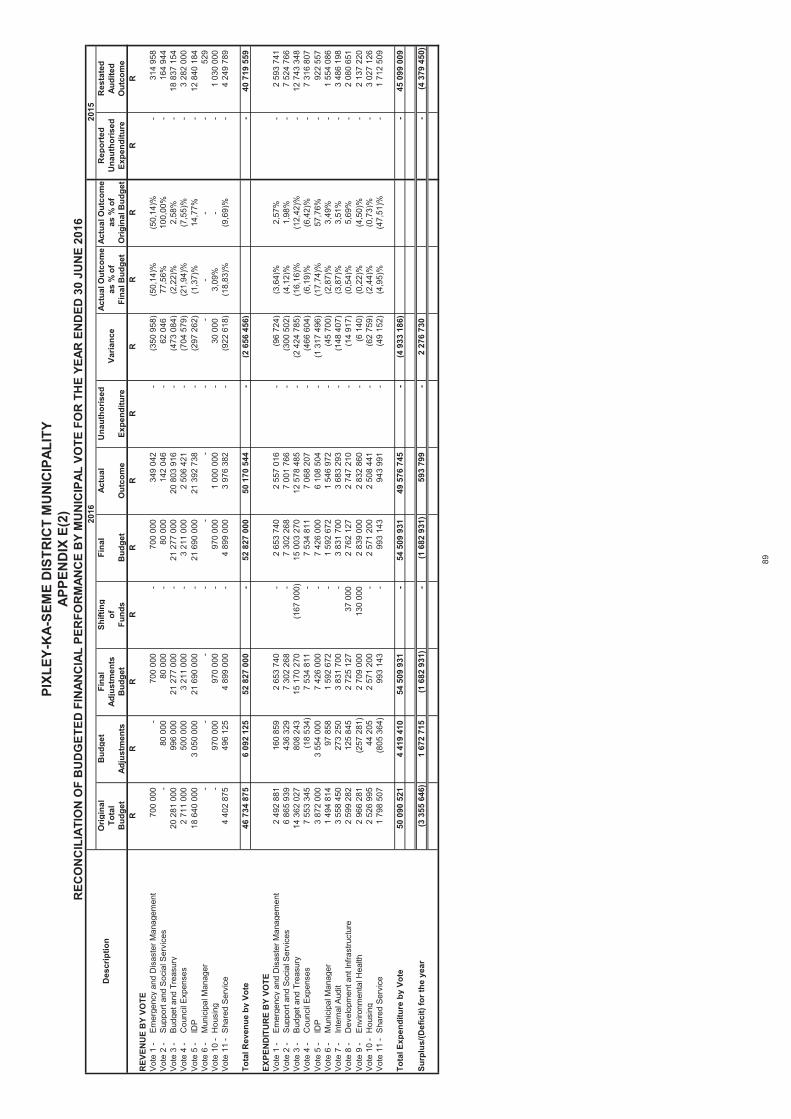
Orig
inal
Bud
get
Fina
lSh
iftin
gFi
nal
Actu
alU
naut
horis
edAc
tual
Out
com
eAc
tual
Out
com
eR
epor
ted
Res
tate
dTo
tal
Adju
stm
ents
ofas
% o
fas
% o
fU
naut
horis
edAu
dite
dB
udge
tAd
just
men
tsB
udge
tFu
nds
Bud
get
Out
com
eEx
pend
iture
Fina
l Bud
get
Orig
inal
Bud
get
Expe
nditu
reO
utco
me
RR
RR
RR
RR
RR
RR
REV
ENU
E B
Y VO
TEV
ote
1 -
Em
erge
ncy
and
Dis
aste
r Man
agem
ent
700
000
-
70
0 00
0
-
700
000
34
9 04
2
-
(350
958
)
(5
0,14
)%(5
0,14
)%-
31
4 95
8
Vot
e 2
-S
uppo
rt an
d S
ocia
l Ser
vice
s-
80
000
80
000
-
80
000
14
2 04
6
-
62 0
46
77,5
6%10
0,00
%-
16
4 94
4
Vot
e 3
-B
udge
t and
Tre
asur
y20
281
000
99
6 00
0
21 2
77 0
00
-
21 2
77 0
00
20 8
03 9
16
-
(473
084
)
(2
,22)
%2,
58%
-
18 8
37 1
54
Vot
e 4
-C
ounc
il E
xpen
ses
2 71
1 00
0
50
0 00
0
3 21
1 00
0
-
3
211
000
2 50
6 42
1
-
(7
04 5
79)
(21,
94)%
(7,5
5)%
-
3 28
2 00
0
V
ote
5 -
IDP
18 6
40 0
00
3 05
0 00
0
21
690
000
-
21
690
000
21
392
738
-
(2
97 2
62)
(1,3
7)%
14,7
7%-
12
840
184
V
ote
6 -
Mun
icip
al M
anag
er-
-
-
-
-
-
-
-
-
--
52
9
Vot
e 10
-H
ousi
ng-
97
0 00
0
970
000
-
97
0 00
0
1 00
0 00
0
-
30
000
3,
09%
--
1
030
000
Vot
e 11
-S
hare
d S
ervi
ce4
402
875
496
125
4
899
000
-
4 89
9 00
0
3
976
382
-
(922
618
)
(1
8,83
)%(9
,69)
%-
4
249
789
Tota
l Rev
enue
by
Vote
46 7
34 8
75
6 09
2 12
5
52
827
000
-
52
827
000
50
170
544
-
(2
656
456
)
-
40 7
19 5
59
EXPE
ND
ITU
RE
BY
VOTE
Vot
e 1
-E
mer
genc
y an
d D
isas
ter M
anag
emen
t2
492
881
160
859
2
653
740
-
2 65
3 74
0
2
557
016
-
(96
724)
(3
,64)
%2,
57%
-
2 59
3 74
1
V
ote
2 -
Sup
port
and
Soc
ial S
ervi
ces
6 86
5 93
9
43
6 32
9
7 30
2 26
8
-
7
302
268
7 00
1 76
6
-
(3
00 5
02)
(4,1
2)%
1,98
%-
7
524
766
Vot
e 3
-B
udge
t and
Tre
asur
y14
362
027
80
8 24
3
15 1
70 2
70
(167
000
)
15
003
270
12
578
485
-
(2
424
785
)
(16,
16)%
(12,
42)%
-
12 7
43 3
48
Vot
e 4
-C
ounc
il E
xpen
ses
7 55
3 34
5
(1
8 53
4)
7 53
4 81
1
-
7
534
811
7 06
8 20
7
-
(4
66 6
04)
(6,1
9)%
(6,4
2)%
-
7 31
6 80
7
V
ote
5 -
IDP
3 87
2 00
0
3
554
000
7 42
6 00
0
-
7
426
000
6 10
8 50
4
-
(1
317
496
)
(17,
74)%
57,7
6%-
92
2 55
7
Vot
e 6
-M
unic
ipal
Man
ager
1 49
4 81
4
97
858
1
592
672
-
1 59
2 67
2
1
546
972
-
(45
700)
(2
,87)
%3,
49%
-
1 55
4 08
6
V
ote
7 -
Inte
rnal
Aud
it3
558
450
273
250
3
831
700
-
3 83
1 70
0
3
683
293
-
(148
407
)
(3
,87)
%3,
51%
-
3 48
6 19
8
V
ote
8 -
Dev
elop
men
t ant
Infra
stru
ctur
e2
599
282
125
845
2
725
127
37 0
00
2 76
2 12
7
2
747
210
-
(14
917)
(0
,54)
%5,
69%
-
2 08
0 65
1
V
ote
9 -
Env
ironm
enta
l Hea
lth2
966
281
(257
281
)
2
709
000
130
000
2
839
000
2 83
2 86
0
-
(6
140
)
(0
,22)
%(4
,50)
%-
2
137
220
Vot
e 10
-H
ousi
ng2
526
995
44 2
05
2 57
1 20
0
-
2
571
200
2 50
8 44
1
-
(6
2 75
9)
(2,4
4)%
(0,7
3)%
-
3 02
7 12
6
V
ote
11 -
Sha
red
Ser
vice
1 79
8 50
7
(8
05 3
64)
993
143
-
99
3 14
3
943
991
-
(4
9 15
2)
(4,9
5)%
(47,
51)%
-
1 71
2 50
9
Tota
l Exp
endi
ture
by
Vote
50 0
90 5
21
4 41
9 41
0
54
509
931
-
54
509
931
49
576
745
-
(4
933
186
)
-
45 0
99 0
09
Surp
lus/
(Def
icit)
for t
he y
ear
(3 3
55 6
46)
1
672
715
(1 6
82 9
31)
-
(1
682
931
)
593
799
-
2
276
730
-
(4 3
79 4
50)
-
2015
Var
ianc
e
PIXL
EY-K
A-SE
ME
DIS
TRIC
T M
UN
ICIP
ALIT
Y
REC
ON
CIL
IATI
ON
OF
BU
DG
ETED
FIN
ANC
IAL
PER
FOR
MAN
CE
BY
MU
NIC
IPAL
VO
TE F
OR
TH
E YE
AR E
ND
ED 3
0 JU
NE
2016
Des
crip
tion
2016
APPE
ND
IX E
(2)
89
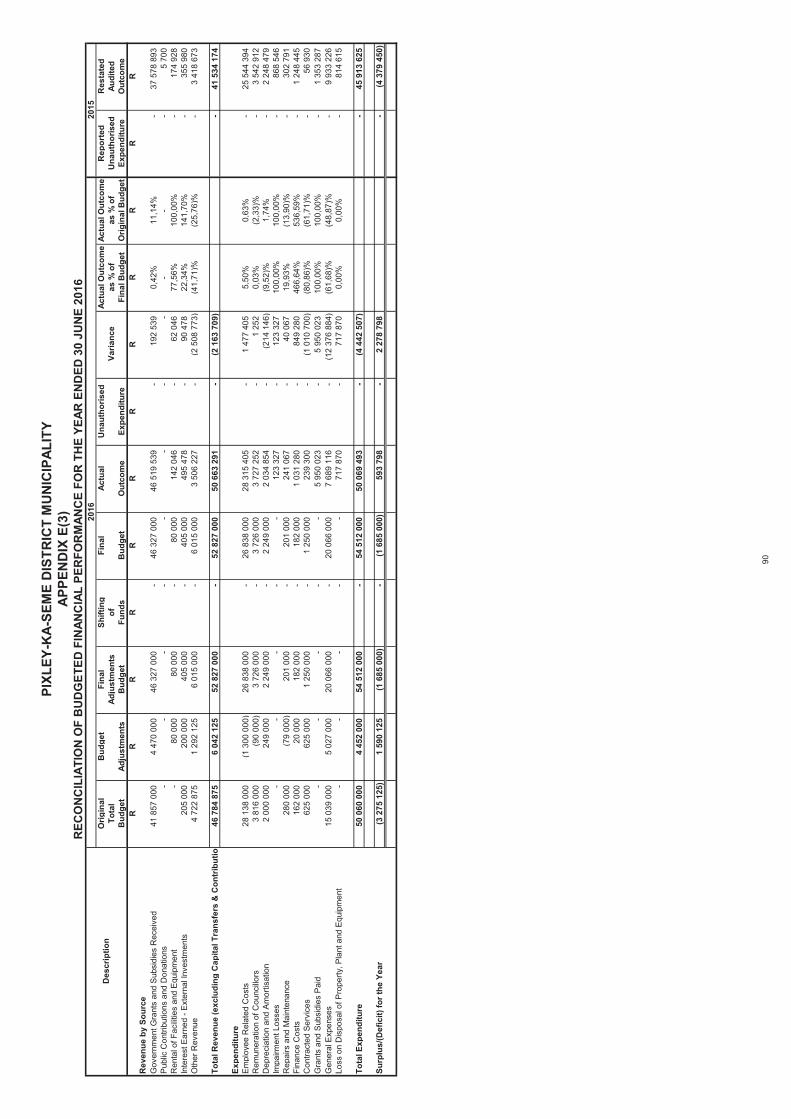
Orig
inal
Bud
get
Fina
lSh
iftin
gFi
nal
Actu
alU
naut
horis
edAc
tual
Out
com
eAc
tual
Out
com
eR
epor
ted
Res
tate
dTo
tal
Adju
stm
ents
ofas
% o
fas
% o
fU
naut
horis
edAu
dite
dB
udge
tAd
just
men
tsB
udge
tFu
nds
Bud
get
Out
com
eEx
pend
iture
Fina
l Bud
get
Orig
inal
Bud
get
Expe
nditu
reO
utco
me
RR
RR
RR
RR
RR
RR
Rev
enue
by
Sour
ceG
over
nmen
t Gra
nts
and
Sub
sidi
es R
ecei
ved
41 8
57 0
00
4 47
0 00
0
46
327
000
-
46
327
000
46
519
539
-
19
2 53
9
0,42
%11
,14%
-
37 5
78 8
93
Pub
lic C
ontri
butio
ns a
nd D
onat
ions
-
-
-
-
-
-
-
-
--
-
5 70
0
R
enta
l of F
acilit
ies
and
Equ
ipm
ent
-
80 0
00
80 0
00
-
80 0
00
142
046
-
62
046
77
,56%
100,
00%
-
174
928
In
tere
st E
arne
d - E
xter
nal I
nves
tmen
ts20
5 00
0
200
000
40
5 00
0
-
405
000
49
5 47
8
-
90 4
78
22,3
4%14
1,70
%-
35
5 98
0
Oth
er R
even
ue4
722
875
1 29
2 12
5
6
015
000
-
6 01
5 00
0
3
506
227
-
(2 5
08 7
73)
(4
1,71
)%(2
5,76
)%-
3
418
673
Tota
l Rev
enue
(exc
ludi
ng C
apita
l Tra
nsfe
rs &
Con
trib
utio
46 7
84 8
75
6 04
2 12
5
52
827
000
-
52
827
000
50
663
291
-
(2
163
709
)
-
41 5
34 1
74
Expe
nditu
reE
mpl
oyee
Rel
ated
Cos
ts28
138
000
(1
300
000
)
26 8
38 0
00
-
26 8
38 0
00
28 3
15 4
05
-
1 47
7 40
5
5,
50%
0,63
%-
25
544
394
R
emun
erat
ion
of C
ounc
illors
3 81
6 00
0
(9
0 00
0)
3 72
6 00
0
-
3
726
000
3 72
7 25
2
-
1
252
0,03
%(2
,33)
%-
3
542
912
Dep
reci
atio
n an
d A
mor
tisat
ion
2 00
0 00
0
24
9 00
0
2 24
9 00
0
-
2
249
000
2 03
4 85
4
-
(2
14 1
46)
(9,5
2)%
1,74
%-
2
248
479
Impa
irmen
t Los
ses
-
-
-
-
-
123
327
-
12
3 32
7
100,
00%
100,
00%
-
868
546
R
epai
rs a
nd M
aint
enan
ce28
0 00
0
(79
000)
20
1 00
0
-
201
000
24
1 06
7
-
40 0
67
19,9
3%(1
3,90
)%-
30
2 79
1
Fina
nce
Cos
ts16
2 00
0
20 0
00
182
000
-
18
2 00
0
1 03
1 28
0
-
84
9 28
0
466,
64%
536,
59%
-
1 24
8 44
5
C
ontra
cted
Ser
vice
s62
5 00
0
625
000
1
250
000
-
1 25
0 00
0
23
9 30
0
-
(1 0
10 7
00)
(8
0,86
)%(6
1,71
)%-
56
930
G
rant
s an
d S
ubsi
dies
Pai
d-
-
-
-
-
5
950
023
-
5 95
0 02
3
10
0,00
%10
0,00
%-
1
353
287
Gen
eral
Exp
ense
s 15
039
000
5
027
000
20 0
66 0
00
-
20 0
66 0
00
7 68
9 11
6
-
(1
2 37
6 88
4)
(61,
68)%
(48,
87)%
-
9 93
3 22
6
Lo
ss o
n D
ispo
sal o
f Pro
perty
, Pla
nt a
nd E
quip
men
t-
-
-
-
-
71
7 87
0
-
717
870
0,
00%
0,00
%-
81
4 61
5
Tota
l Exp
endi
ture
50 0
60 0
00
4 45
2 00
0
54
512
000
-
54
512
000
50
069
493
-
(4
442
507
)
-
45 9
13 6
25
-
-
Surp
lus/
(Def
icit)
for t
he Y
ear
(3 2
75 1
25)
1
590
125
(1 6
85 0
00)
-
(1
685
000
)
593
798
-
2
278
798
-
(4 3
79 4
50)
-
-
PIXL
EY-K
A-SE
ME
DIS
TRIC
T M
UN
ICIP
ALIT
Y
REC
ON
CIL
IATI
ON
OF
BU
DG
ETED
FIN
ANC
IAL
PER
FOR
MAN
CE
FOR
TH
E YE
AR E
ND
ED 3
0 JU
NE
2016
Des
crip
tion
2016
2015
Var
ianc
e
APPE
ND
IX E
(3)
90
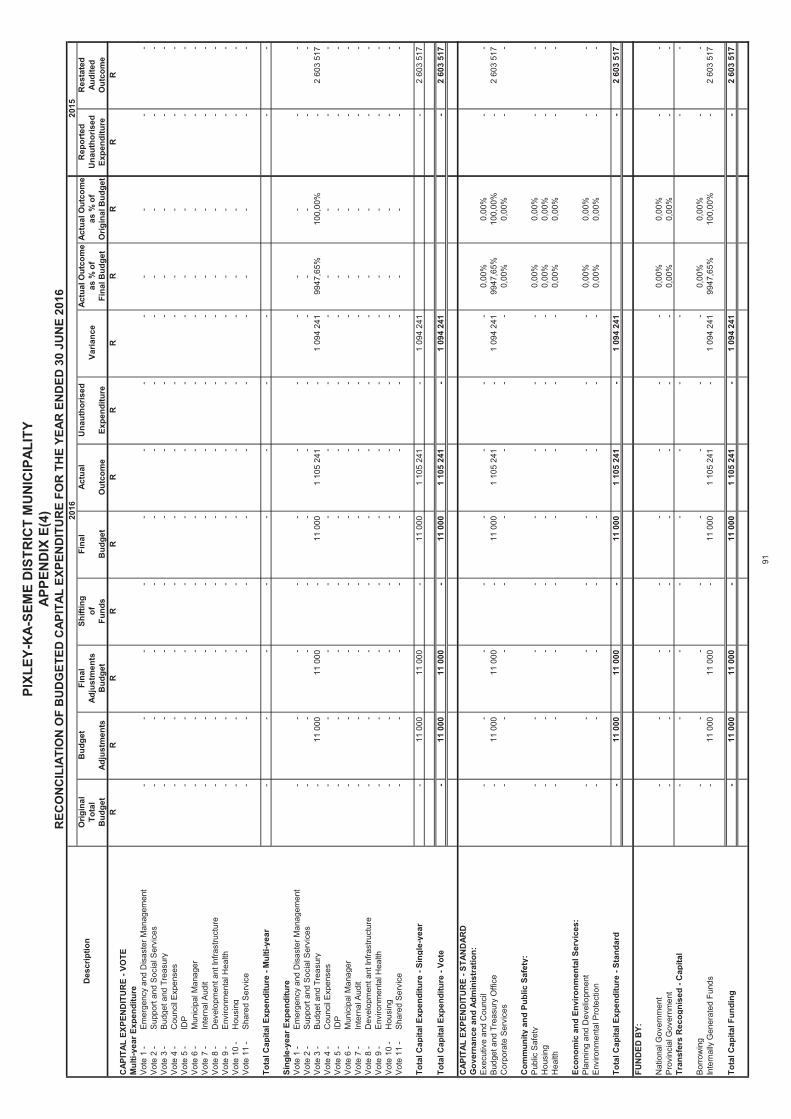
Orig
inal
Bud
get
Fina
lSh
iftin
gFi
nal
Actu
alU
naut
horis
edAc
tual
Out
com
eAc
tual
Out
com
eR
epor
ted
Res
tate
dTo
tal
Adju
stm
ents
ofas
% o
fas
% o
fU
naut
horis
edAu
dite
dB
udge
tAd
just
men
tsB
udge
tFu
nds
Bud
get
Out
com
eEx
pend
iture
Fina
l Bud
get
Orig
inal
Bud
get
Expe
nditu
reO
utco
me
RR
RR
RR
RR
RR
RR
CAP
ITAL
EXP
END
ITU
RE
- VO
TEM
ulti-
year
Exp
endi
ture
Vot
e 1
-E
mer
genc
y an
d D
isas
ter M
anag
emen
t-
-
-
-
-
-
-
-
-
--
-
V
ote
2 -
Sup
port
and
Soc
ial S
ervi
ces
-
-
-
-
-
-
-
-
--
-
-
Vot
e 3
-B
udge
t and
Tre
asur
y-
-
-
-
-
-
-
-
-
--
-
V
ote
4 -
Cou
ncil
Exp
ense
s-
-
-
-
-
-
-
-
-
--
-
V
ote
5 -
IDP
-
-
-
-
-
-
-
-
--
-
-
Vot
e 6
-M
unic
ipal
Man
ager
-
-
-
-
-
-
-
-
--
-
-
Vot
e 7
-In
tern
al A
udit
-
-
-
-
-
-
-
-
--
-
-
Vot
e 8
-D
evel
opm
ent a
nt In
frast
ruct
ure
-
-
-
-
-
-
-
-
--
-
-
Vot
e 9
-E
nviro
nmen
tal H
ealth
-
-
-
-
-
-
-
-
--
-
-
Vot
e 10
-H
ousi
ng-
-
-
-
-
-
-
-
-
--
-
V
ote
11 -
Sha
red
Ser
vice
-
-
-
-
-
-
-
-
--
-
-
Tota
l Cap
ital E
xpen
ditu
re -
Mul
ti-ye
ar-
-
-
-
-
-
-
-
-
-
Sing
le-y
ear E
xpen
ditu
reV
ote
1 -
Em
erge
ncy
and
Dis
aste
r Man
agem
ent
-
-
-
-
-
-
-
-
--
-
-
Vot
e 2
-S
uppo
rt an
d S
ocia
l Ser
vice
s-
-
-
-
-
-
-
-
-
--
-
V
ote
3 -
Bud
get a
nd T
reas
ury
-
11 0
00
11 0
00
-
11 0
00
1 10
5 24
1
-
1
094
241
9947
,65%
100,
00%
-
2 60
3 51
7
V
ote
4 -
Cou
ncil
Exp
ense
s-
-
-
-
-
-
-
-
-
--
-
V
ote
5 -
IDP
-
-
-
-
-
-
-
-
--
-
-
Vot
e 6
-M
unic
ipal
Man
ager
-
-
-
-
-
-
-
-
--
-
-
Vot
e 7
-In
tern
al A
udit
-
-
-
-
-
-
-
-
--
-
-
Vot
e 8
-D
evel
opm
ent a
nt In
frast
ruct
ure
-
-
-
-
-
-
-
-
--
-
-
Vot
e 9
-E
nviro
nmen
tal H
ealth
-
-
-
-
-
-
-
-
--
-
-
Vot
e 10
-H
ousi
ng-
-
-
-
-
-
-
-
-
--
-
V
ote
11 -
Sha
red
Ser
vice
-
-
-
-
-
-
-
-
--
-
-
Tota
l Cap
ital E
xpen
ditu
re -
Sing
le-y
ear
-
11 0
00
11 0
00
-
11 0
00
1 10
5 24
1
-
1
094
241
-
2 60
3 51
7
Tota
l Cap
ital E
xpen
ditu
re -
Vote
-
11 0
00
11 0
00
-
11 0
00
1 10
5 24
1
-
1
094
241
-
2 60
3 51
7
-
C
APIT
AL E
XPEN
DIT
UR
E - S
TAN
DAR
DG
over
nanc
e an
d Ad
min
istr
atio
n:E
xecu
tive
and
Cou
ncil
-
-
-
-
-
-
-
-
0,00
%0,
00%
-
-
Bud
get a
nd T
reas
ury
Offi
ce-
11
000
11
000
-
11
000
1
105
241
-
1 09
4 24
1
99
47,6
5%10
0,00
%-
2
603
517
Cor
pora
te S
ervi
ces
-
-
-
-
-
-
-
-
0,00
%0,
00%
-
-
Com
mun
ity a
nd P
ublic
Saf
ety:
Pub
lic S
afet
y-
-
-
-
-
-
-
-
0,
00%
0,00
%-
-
H
ousi
ng-
-
-
-
-
-
-
-
0,
00%
0,00
%-
-
H
ealth
-
-
-
-
-
-
-
-
0,00
%0,
00%
-
-
Econ
omic
and
Env
ironm
enta
l Ser
vice
s:P
lann
ing
and
Dev
elio
pmen
t-
-
-
-
-
-
-
-
0,
00%
0,00
%-
-
E
nviro
nmen
tal P
rote
ctio
n-
-
-
-
-
-
-
-
0,
00%
0,00
%-
-
Tota
l Cap
ital E
xpen
ditu
re -
Stan
dard
-
11 0
00
11 0
00
-
11 0
00
1 10
5 24
1
-
1
094
241
-
2 60
3 51
7
-
FU
ND
ED B
Y:
Nat
iona
l Gov
ernm
ent
-
-
-
-
-
-
-
-
0,00
%0,
00%
-
-
Pro
vinc
ial G
over
nmen
t-
-
-
-
-
-
-
-
0,
00%
0,00
%-
-
Tr
ansf
ers
Rec
ogni
sed
- Cap
ital
-
-
-
-
-
-
-
-
-
-
Bor
row
ing
-
-
-
-
-
-
-
-
0,00
%0,
00%
-
-
Inte
rnal
ly G
ener
ated
Fun
ds-
11
000
11
000
-
11
000
1
105
241
-
1 09
4 24
1
99
47,6
5%10
0,00
%-
2
603
517
Tota
l Cap
ital F
undi
ng-
11
000
11
000
-
11
000
1
105
241
-
1 09
4 24
1
-
2
603
517
-
PIXL
EY-K
A-SE
ME
DIS
TRIC
T M
UN
ICIP
ALIT
Y
REC
ON
CIL
IATI
ON
OF
BU
DG
ETED
CAP
ITAL
EXP
END
ITU
RE
FOR
TH
E YE
AR E
ND
ED 3
0 JU
NE
2016
2016
2015
Var
ianc
e D
escr
iptio
n
APPE
ND
IX E
(4)
91
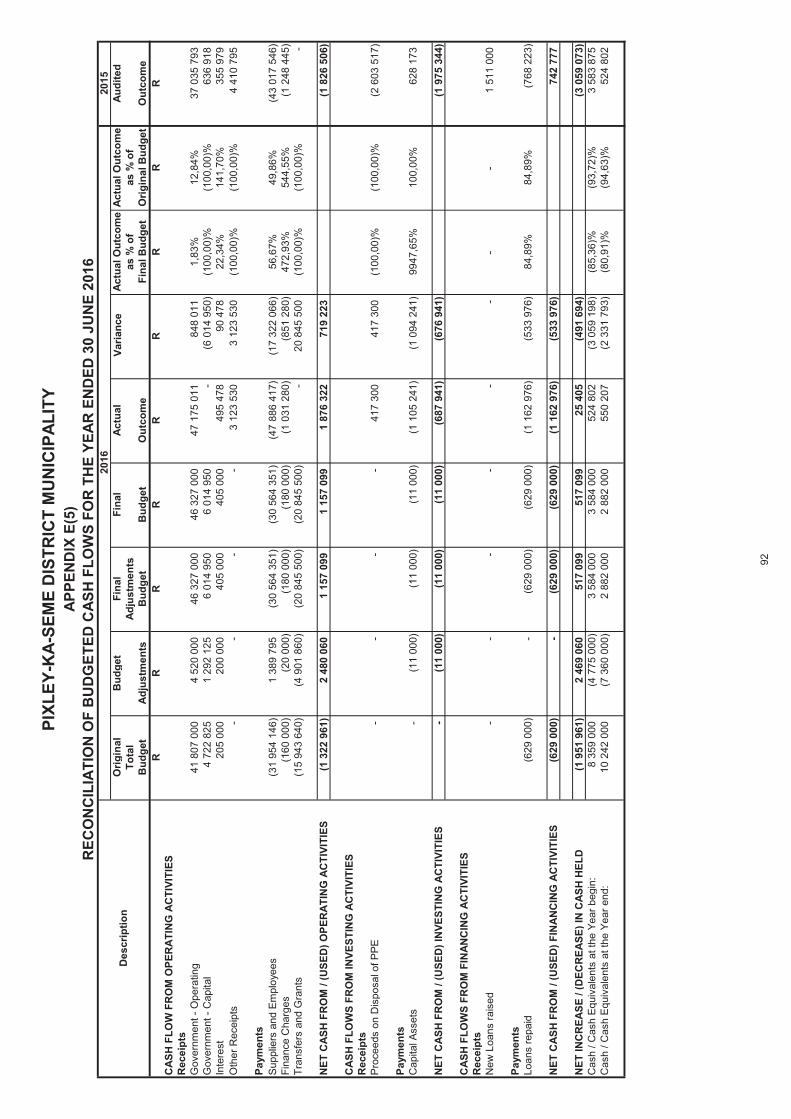
2015
Orig
inal
Bud
get
Fina
lFi
nal
Actu
al V
aria
nce
Actu
al O
utco
me
Actu
al O
utco
me
Audi
ted
Tota
lAd
just
men
tsas
% o
fas
% o
fB
udge
tAd
just
men
tsB
udge
tB
udge
tO
utco
me
Fina
l Bud
get
Orig
inal
Bud
get
Out
com
eR
RR
RR
RR
RR
CAS
H F
LOW
FR
OM
OPE
RAT
ING
AC
TIVI
TIES
Rec
eipt
sG
over
nmen
t - O
pera
ting
41 8
07 0
00
4 52
0 00
0
46
327
000
46
327
000
47
175
011
84
8 01
1
1,83
%12
,84%
37 0
35 7
93
Gov
ernm
ent -
Cap
ital
4 72
2 82
5
1
292
125
6 01
4 95
0
6
014
950
-
(6 0
14 9
50)
(1
00,0
0)%
(100
,00)
%63
6 91
8
Inte
rest
205
000
20
0 00
0
405
000
40
5 00
0
495
478
90
478
22
,34%
141,
70%
355
979
O
ther
Rec
eipt
s-
-
-
-
3
123
530
3 12
3 53
0
(1
00,0
0)%
(100
,00)
%4
410
795
Paym
ents
Supp
liers
and
Em
ploy
ees
(31
954
146)
1
389
795
(30
564
351)
(3
0 56
4 35
1)
(47
886
417)
(1
7 32
2 06
6)
56,6
7%49
,86%
(43
017
546)
Fi
nanc
e C
harg
es(1
60 0
00)
(20
000)
(1
80 0
00)
(180
000
)
(1
031
280
)
(851
280
)
47
2,93
%54
4,55
%(1
248
445
)
Tran
sfer
s an
d G
rant
s(1
5 94
3 64
0)
(4 9
01 8
60)
(2
0 84
5 50
0)
(20
845
500)
-
20
845
500
(1
00,0
0)%
(100
,00)
%-
NET
CAS
H F
RO
M /
(USE
D) O
PER
ATIN
G A
CTI
VITI
ES(1
322
961
)
2 48
0 06
0
1
157
099
1 15
7 09
9
1
876
322
719
223
(1
826
506
)
CAS
H F
LOW
S FR
OM
INVE
STIN
G A
CTI
VITI
ESR
ecei
pts
Pro
ceed
s on
Dis
posa
l of P
PE-
-
-
-
41
7 30
0
417
300
(1
00,0
0)%
(100
,00)
%(2
603
517
)
Paym
ents
Cap
ital A
sset
s-
(1
1 00
0)
(11
000)
(1
1 00
0)
(1 1
05 2
41)
(1
094
241
)
9947
,65%
100,
00%
628
173
NET
CAS
H F
RO
M /
(USE
D) I
NVE
STIN
G A
CTI
VITI
ES-
(1
1 00
0)
(11
000)
(1
1 00
0)
(687
941
)
(6
76 9
41)
(1 9
75 3
44)
CAS
H F
LOW
S FR
OM
FIN
ANC
ING
AC
TIVI
TIES
Rec
eipt
sN
ew L
oans
rais
ed-
-
-
-
-
-
-
-1
511
000
Paym
ents
Loan
s re
paid
(629
000
)
-
(6
29 0
00)
(629
000
)
(1
162
976
)
(533
976
)
84
,89%
84,8
9%(7
68 2
23)
NET
CAS
H F
RO
M /
(USE
D) F
INAN
CIN
G A
CTI
VITI
ES(6
29 0
00)
-
(629
000
)
(6
29 0
00)
(1 1
62 9
76)
(5
33 9
76)
742
777
NET
INC
REA
SE /
(DEC
REA
SE) I
N C
ASH
HEL
D(1
951
961
)
2 46
9 06
0
51
7 09
9
517
099
25
405
(4
91 6
94)
(3 0
59 0
73)
C
ash
/ Cas
h Eq
uiva
lent
s at
the
Year
beg
in:
8 35
9 00
0
(4
775
000
)
3 58
4 00
0
3
584
000
524
802
(3
059
198
)
(85,
36)%
(93,
72)%
3 58
3 87
5
C
ash
/ Cas
h Eq
uiva
lent
s at
the
Year
end
:10
242
000
(7
360
000
)
2 88
2 00
0
2
882
000
550
207
(2
331
793
)
(80,
91)%
(94,
63)%
524
802
PIXL
EY-K
A-SE
ME
DIS
TRIC
T M
UN
ICIP
ALIT
Y
REC
ON
CIL
IATI
ON
OF
BU
DG
ETED
CAS
H F
LOW
S FO
R T
HE
YEAR
EN
DED
30
JUN
E 20
16
Des
crip
tion
2016
APPE
ND
IX E
(5)
92
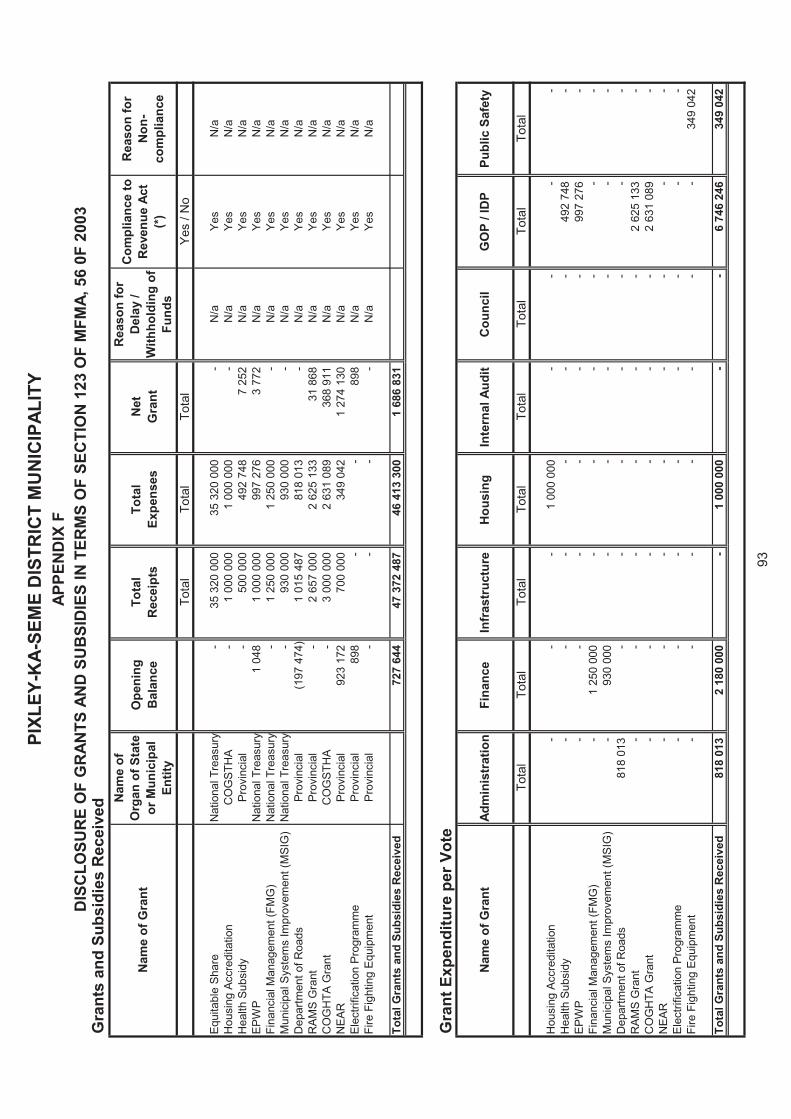
Gra
nts
and
Subs
idie
s R
ecei
ved
Ope
ning
Tota
lTo
tal
Net
Bal
ance
Rec
eipt
sEx
pens
esG
rant
Tota
lTo
tal
Tota
lYe
s / N
o
Equi
tabl
e Sh
are
Nat
iona
l Tre
asur
y-
35
320
000
35
320
000
-
N
/aYe
sN
/aH
ousi
ng A
ccre
dita
tion
CO
GST
HA
-
1 00
0 00
0
1
000
000
-
N/a
Yes
N/a
Hea
lth S
ubsi
dyPr
ovin
cial
-
500
000
49
2 74
8
7 25
2
N
/aYe
sN
/aEP
WP
Nat
iona
l Tre
asur
y1
048
1 00
0 00
0
99
7 27
6
3 77
2
N
/aYe
sN
/aFi
nanc
ial M
anag
emen
t (FM
G)
Nat
iona
l Tre
asur
y-
1
250
000
1 25
0 00
0
-
N
/aYe
sN
/aM
unic
ipal
Sys
tem
s Im
prov
emen
t (M
SIG
)N
atio
nal T
reas
ury
-
930
000
93
0 00
0
-
N/a
Yes
N/a
Dep
artm
ent o
f Roa
dsPr
ovin
cial
(197
474
)
1
015
487
818
013
-
N
/aYe
sN
/aR
AMS
Gra
ntPr
ovin
cial
-
2 65
7 00
0
2
625
133
31 8
68
N/a
Yes
N/a
CO
GH
TA G
rant
CO
GST
HA
-
3 00
0 00
0
2
631
089
368
911
N
/aYe
sN
/aN
EAR
Prov
inci
al92
3 17
2
700
000
34
9 04
2
1 27
4 13
0
N
/aYe
sN
/aEl
ectri
ficat
ion
Prog
ram
me
Prov
inci
al89
8
-
-
898
N
/aYe
sN
/aFi
re F
ight
ing
Equi
pmen
tPr
ovin
cial
-
-
-
-
N/a
Yes
N/a
Tota
l Gra
nts
and
Subs
idie
s R
ecei
ved
727
644
47
372
487
46
413
300
1
686
831
Gra
nt E
xpen
ditu
re p
er V
ote
Tota
lTo
tal
Tota
lTo
tal
Tota
lTo
tal
Tota
lTo
tal
Hou
sing
Acc
redi
tatio
n-
-
-
1
000
000
-
-
-
-
Hea
lth S
ubsi
dy-
-
-
-
-
-
49
2 74
8
-
EPW
P-
-
-
-
-
-
99
7 27
6
-
Fina
ncia
l Man
agem
ent (
FMG
)-
1
250
000
-
-
-
-
-
-
Mun
icip
al S
yste
ms
Impr
ovem
ent (
MSI
G)
-
930
000
-
-
-
-
-
-
D
epar
tmen
t of R
oads
818
013
-
-
-
-
-
-
-
R
AMS
Gra
nt-
-
-
-
-
-
2
625
133
-
CO
GH
TA G
rant
-
-
-
-
-
-
2 63
1 08
9
-
N
EAR
-
-
-
-
-
-
-
-
Elec
trific
atio
n Pr
ogra
mm
e-
-
-
-
-
-
-
-
Fi
re F
ight
ing
Equi
pmen
t-
-
-
-
-
-
-
34
9 04
2
Tota
l Gra
nts
and
Subs
idie
s R
ecei
ved
818
013
2
180
000
-
1 00
0 00
0
-
-
6
746
246
349
042
Nam
e of
Gra
nt
APPE
ND
IX F
DIS
CLO
SUR
E O
F G
RAN
TS A
ND
SU
BSI
DIE
S IN
TER
MS
OF
SEC
TIO
N 1
23 O
F M
FMA,
56
0F 2
003
Rea
son
for
Non
- co
mpl
ianc
e
Nam
e of
Gra
ntAd
min
istr
atio
nPIXL
EY-K
A-SE
ME
DIS
TRIC
T M
UN
ICIP
ALIT
Y
Nam
e of
O
rgan
of S
tate
or
Mun
icip
al
Entit
y
Rea
son
for
Del
ay /
With
hold
ing
of
Fund
s
Com
plia
nce
to
Rev
enue
Act
(*
)
Cou
ncil
GO
P / I
DP
Publ
ic S
afet
y
Fina
nce
Infr
astr
uctu
reH
ousi
ngIn
tern
al A
udit
93
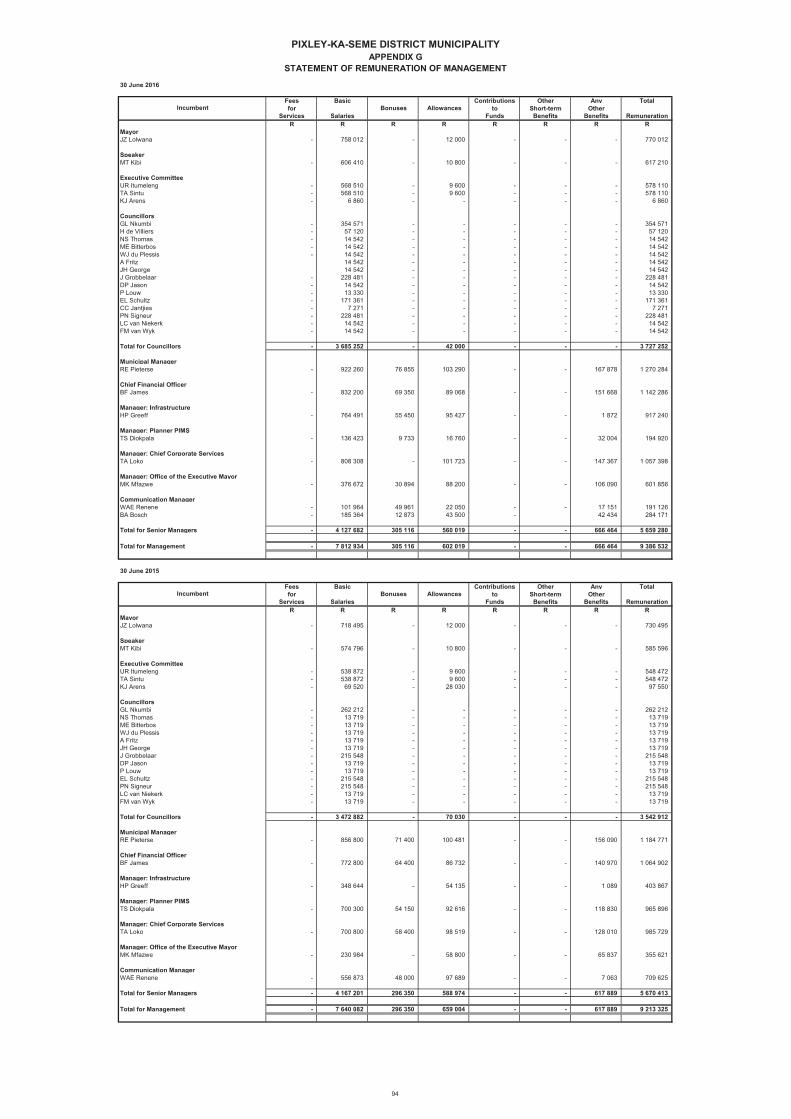
30 June 2016
Fees Basic Contributions Other Any Totalfor to Short-term Other
Services Salaries Funds Benefits Benefits RemunerationR R R R R R R R
MayorJZ Lolwana - 758 012 - 12 000 - - - 770 012
SpeakerMT Kibi - 606 410 - 10 800 - - - 617 210
Executive CommitteeUR Itumeleng - 568 510 - 9 600 - - - 578 110 TA Sintu - 568 510 - 9 600 - - - 578 110 KJ Arens - 6 860 - - - - - 6 860
CouncillorsGL Nkumbi - 354 571 - - - - - 354 571 H de Villiers - 57 120 - - - - - 57 120 NS Thomas - 14 542 - - - - - 14 542 ME Bitterbos - 14 542 - - - - - 14 542 WJ du Plessis - 14 542 - - - - - 14 542 A Fritz 14 542 - - - - - 14 542 JH George 14 542 - - - - - 14 542 J Grobbelaar - 228 481 - - - - - 228 481 DP Jason - 14 542 - - - - - 14 542 P Louw - 13 330 - - - - - 13 330 EL Schultz - 171 361 - - - - - 171 361 CC Jantjies - 7 271 - - - - - 7 271 PN Signeur - 228 481 - - - - - 228 481 LC van Niekerk - 14 542 - - - - - 14 542 FM van Wyk - 14 542 - - - - - 14 542
Total for Councillors - 3 685 252 - 42 000 - - - 3 727 252
Municipal ManagerRE Pieterse - 922 260 76 855 103 290 - - 167 878 1 270 284
Chief Financial OfficerBF James - 832 200 69 350 89 068 - - 151 668 1 142 286
Manager: InfrastructureHP Greeff - 764 491 55 450 95 427 - - 1 872 917 240
Manager: Planner PIMSTS Diokpala - 136 423 9 733 16 760 - - 32 004 194 920
Manager: Chief Corporate ServicesTA Loko - 808 308 - 101 723 - - 147 367 1 057 398
Manager: Office of the Executive MayorMK Mfazwe - 376 672 30 894 88 200 - - 106 090 601 856
Communication ManagerWAE Renene - 101 964 49 961 22 050 - - 17 151 191 126 BA Bosch - 185 364 12 873 43 500 - 42 434 284 171
Total for Senior Managers - 4 127 682 305 116 560 019 - - 666 464 5 659 280
Total for Management - 7 812 934 305 116 602 019 - - 666 464 9 386 532
30 June 2015
Fees Basic Contributions Other Any Totalfor to Short-term Other
Services Salaries Funds Benefits Benefits RemunerationR R R R R R R R
MayorJZ Lolwana - 718 495 - 12 000 - - - 730 495
SpeakerMT Kibi - 574 796 - 10 800 - - - 585 596
Executive CommitteeUR Itumeleng - 538 872 - 9 600 - - - 548 472 TA Sintu - 538 872 - 9 600 - - - 548 472 KJ Arens - 69 520 - 28 030 - - - 97 550
CouncillorsGL Nkumbi - 262 212 - - - - - 262 212 NS Thomas - 13 719 - - - - - 13 719 ME Bitterbos - 13 719 - - - - - 13 719 WJ du Plessis - 13 719 - - - - - 13 719 A Fritz - 13 719 - - - - - 13 719 JH George - 13 719 - - - - - 13 719 J Grobbelaar - 215 548 - - - - - 215 548 DP Jason - 13 719 - - - - - 13 719 P Louw - 13 719 - - - - - 13 719 EL Schultz - 215 548 - - - - - 215 548 PN Signeur - 215 548 - - - - - 215 548 LC van Niekerk - 13 719 - - - - - 13 719 FM van Wyk - 13 719 - - - - - 13 719
Total for Councillors - 3 472 882 - 70 030 - - - 3 542 912
Municipal ManagerRE Pieterse - 856 800 71 400 100 481 - - 156 090 1 184 771
Chief Financial OfficerBF James - 772 800 64 400 86 732 - - 140 970 1 064 902
Manager: InfrastructureHP Greeff - 348 644 - 54 135 - - 1 089 403 867
Manager: Planner PIMSTS Diokpala - 700 300 54 150 92 616 - - 118 830 965 896
Manager: Chief Corporate ServicesTA Loko - 700 800 58 400 98 519 - - 128 010 985 729
Manager: Office of the Executive MayorMK Mfazwe - 230 984 - 58 800 - - 65 837 355 621
Communication ManagerWAE Renene - 556 873 48 000 97 689 - - 7 063 709 625
Total for Senior Managers - 4 167 201 296 350 588 974 - - 617 889 5 670 413
Total for Management - 7 640 082 296 350 659 004 - - 617 889 9 213 325
PIXLEY-KA-SEME DISTRICT MUNICIPALITYAPPENDIX G
STATEMENT OF REMUNERATION OF MANAGEMENT
Incumbent Bonuses Allowances
Incumbent Bonuses Allowances
94
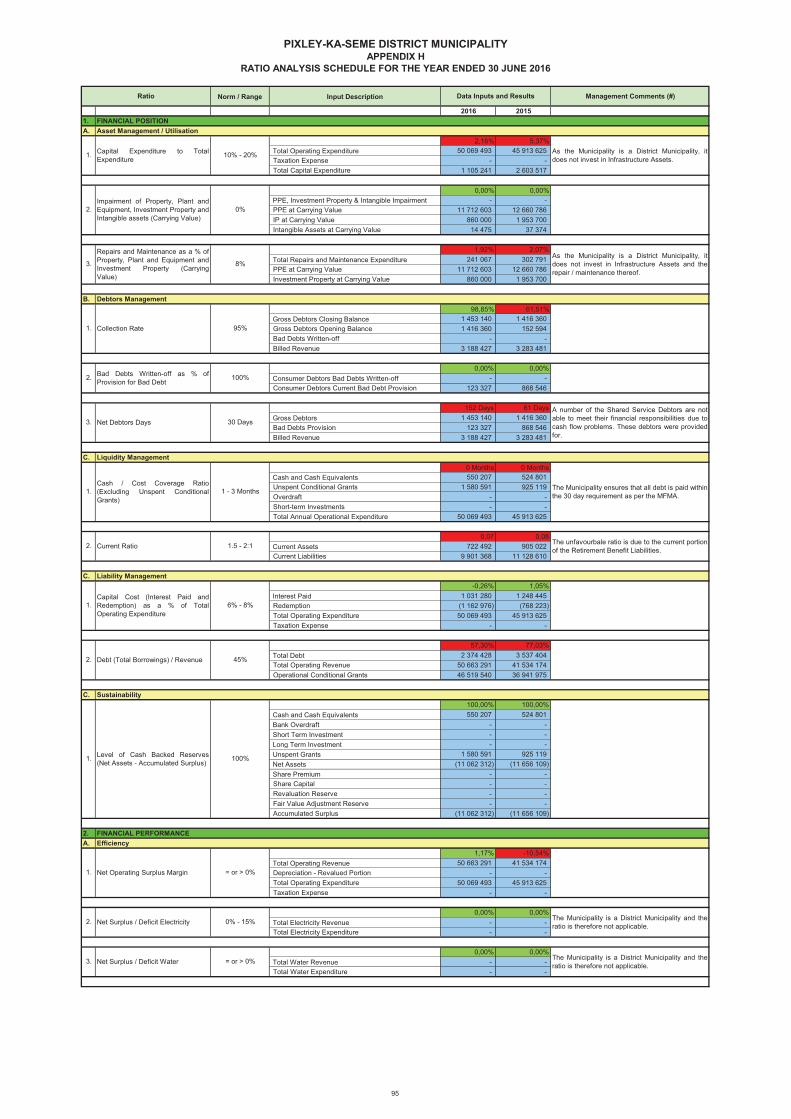
Norm / Range Input Description Management Comments (#)
2016 20151. FINANCIAL POSITIONA. Asset Management / Utilisation
2,16% 5,37% Total Operating Expenditure 50 069 493 45 913 625 Taxation Expense - - Total Capital Expenditure 1 105 241 2 603 517
0,00% 0,00% PPE, Investment Property & Intangible Impairment - - PPE at Carrying Value 11 712 603 12 660 786 IP at Carrying Value 860 000 1 953 700 Intangible Assets at Carrying Value 14 475 37 374
1,92% 2,07% Total Repairs and Maintenance Expenditure 241 067 302 791 PPE at Carrying Value 11 712 603 12 660 786 Investment Property at Carrying Value 860 000 1 953 700
B. Debtors Management98,85% 61,51%
Gross Debtors Closing Balance 1 453 140 1 416 360 Gross Debtors Opening Balance 1 416 360 152 594 Bad Debts Written-off - - Billed Revenue 3 188 427 3 283 481
0,00% 0,00% Consumer Debtors Bad Debts Written-off - - Consumer Debtors Current Bad Debt Provision 123 327 868 546
152 Days 61 Days Gross Debtors 1 453 140 1 416 360 Bad Debts Provision 123 327 868 546 Billed Revenue 3 188 427 3 283 481
C. Liquidity Management0 Months 0 Months
Cash and Cash Equivalents 550 207 524 801 Unspent Conditional Grants 1 580 591 925 119 Overdraft - - Short-term Investments - - Total Annual Operational Expenditure 50 069 493 45 913 625
0,07 0,08 Current Assets 722 492 905 022 Current Liabilities 9 901 368 11 128 610
C. Liability Management-0,26% 1,05%
Interest Paid 1 031 280 1 248 445 Redemption (1 162 976) (768 223) Total Operating Expenditure 50 069 493 45 913 625 Taxation Expense - -
57,30% 77,03% Total Debt 2 374 428 3 537 404 Total Operating Revenue 50 663 291 41 534 174 Operational Conditional Grants 46 519 540 36 941 975
C. Sustainability100,00% 100,00%
Cash and Cash Equivalents 550 207 524 801 Bank Overdraft - - Short Term Investment - - Long Term Investment - - Unspent Grants 1 580 591 925 119 Net Assets (11 062 312) (11 656 109) Share Premium - - Share Capital - - Revaluation Reserve - - Fair Value Adjustment Reserve - - Accumulated Surplus (11 062 312) (11 656 109)
2. FINANCIAL PERFORMANCEA. Efficiency
1,17% -10,54% Total Operating Revenue 50 663 291 41 534 174 Depreciation - Revalued Portion - - Total Operating Expenditure 50 069 493 45 913 625 Taxation Expense - -
0,00% 0,00% Total Electricity Revenue - - Total Electricity Expenditure - -
0,00% 0,00% Total Water Revenue - - Total Water Expenditure - -
3. Net Debtors Days 30 Days
1 - 3 Months1.Cash / Cost Coverage Ratio(Excluding Unspent ConditionalGrants)
2. Bad Debts Written-off as % ofProvision for Bad Debt
100%
8%
1. Collection Rate
3.
Repairs and Maintenance as a % ofProperty, Plant and Equipment andInvestment Property (CarryingValue)
As the Municipality is a District Municipality, itdoes not invest in Infrastructure Assets and therepair / maintenance thereof.
As the Municipality is a District Municipality, itdoes not invest in Infrastructure Assets.
95%
A number of the Shared Service Debtors are notable to meet their financial responsibilities due tocash flow problems. These debtors were providedfor.
Ratio
1. Capital Expenditure to TotalExpenditure
Data Inputs and Results
2.Impairment of Property, Plant andEquipment, Investment Property andIntangible assets (Carrying Value)
0%
The Municipality ensures that all debt is paid withinthe 30 day requirement as per the MFMA.
PIXLEY-KA-SEME DISTRICT MUNICIPALITYAPPENDIX H
RATIO ANALYSIS SCHEDULE FOR THE YEAR ENDED 30 JUNE 2016
10% - 20%
The unfavourbale ratio is due to the current portionof the Retirement Benefit Liabilities.
1.Capital Cost (Interest Paid andRedemption) as a % of TotalOperating Expenditure
6% - 8%
2. Current Ratio
2. Debt (Total Borrowings) / Revenue 45%
1.5 - 2:1
1. Level of Cash Backed Reserves(Net Assets - Accumulated Surplus)
100%
Net Operating Surplus Margin = or > 0%1.
The Municipality is a District Municipality and theratio is therefore not applicable.
2.
Net Surplus / Deficit Water
The Municipality is a District Municipality and theratio is therefore not applicable.Net Surplus / Deficit Electricity 0% - 15%
= or > 0%3.
95
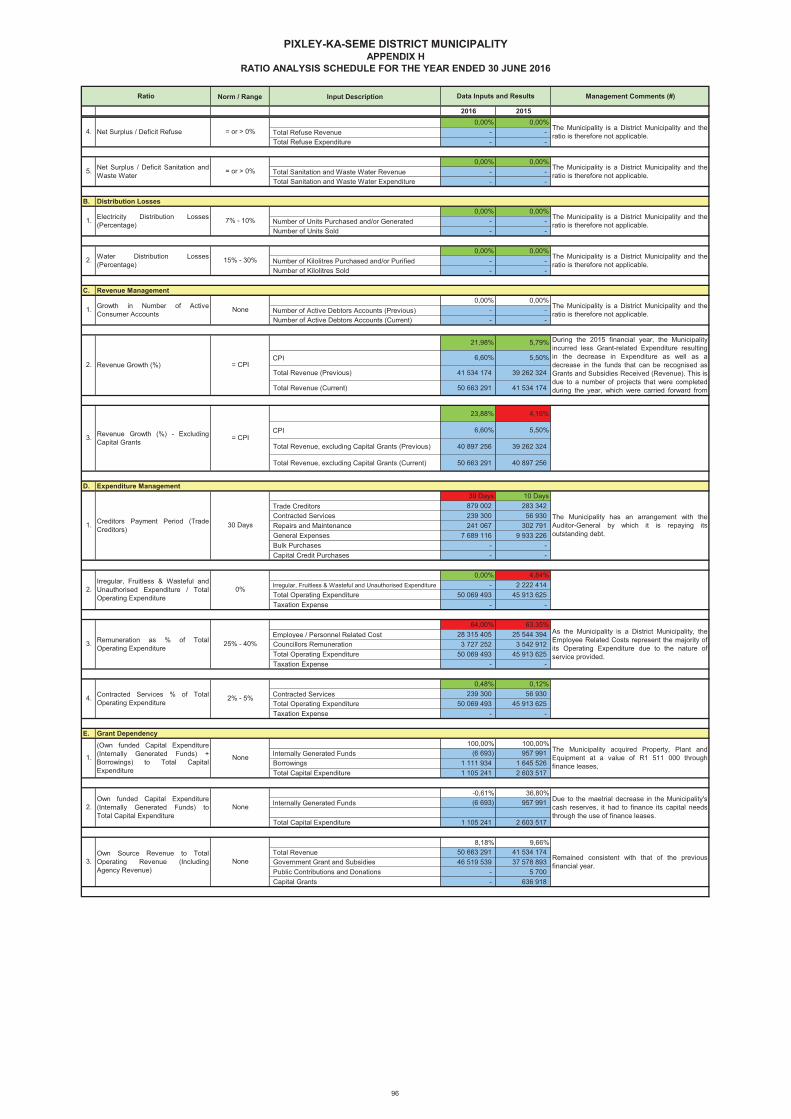
Norm / Range Input Description Management Comments (#)
2016 2015
Ratio Data Inputs and Results
PIXLEY-KA-SEME DISTRICT MUNICIPALITYAPPENDIX H
RATIO ANALYSIS SCHEDULE FOR THE YEAR ENDED 30 JUNE 2016
0,00% 0,00% Total Refuse Revenue - - Total Refuse Expenditure - -
0,00% 0,00% Total Sanitation and Waste Water Revenue - - Total Sanitation and Waste Water Expenditure - -
B. Distribution Losses0,00% 0,00%
Number of Units Purchased and/or Generated - - Number of Units Sold - -
0,00% 0,00% Number of Kilolitres Purchased and/or Purified - - Number of Kilolitres Sold - -
C. Revenue Management0,00% 0,00%
Number of Active Debtors Accounts (Previous) - - Number of Active Debtors Accounts (Current) - -
21,98% 5,79%
CPI 6,60% 5,50%
Total Revenue (Previous) 41 534 174 39 262 324
Total Revenue (Current) 50 663 291 41 534 174
23,88% 4,16%
CPI 6,60% 5,50%
Total Revenue, excluding Capital Grants (Previous) 40 897 256 39 262 324
Total Revenue, excluding Capital Grants (Current) 50 663 291 40 897 256
D. Expenditure Management39 Days 10 Days
Trade Creditors 879 002 283 342 Contracted Services 239 300 56 930 Repairs and Maintenance 241 067 302 791 General Expenses 7 689 116 9 933 226 Bulk Purchases - - Capital Credit Purchases - -
0,00% 4,84% Irregular, Fruitless & Wasteful and Unauthorised Expenditure - 2 222 414 Total Operating Expenditure 50 069 493 45 913 625 Taxation Expense - -
64,00% 63,35% Employee / Personnel Related Cost 28 315 405 25 544 394 Councillors Remuneration 3 727 252 3 542 912 Total Operating Expenditure 50 069 493 45 913 625 Taxation Expense - -
0,48% 0,12% Contracted Services 239 300 56 930 Total Operating Expenditure 50 069 493 45 913 625 Taxation Expense - -
E. Grant Dependency100,00% 100,00%
Internally Generated Funds (6 693) 957 991 Borrowings 1 111 934 1 645 526 Total Capital Expenditure 1 105 241 2 603 517
-0,61% 36,80% Internally Generated Funds (6 693) 957 991
Total Capital Expenditure 1 105 241 2 603 517
8,18% 9,66% Total Revenue 50 663 291 41 534 174 Government Grant and Subsidies 46 519 539 37 578 893 Public Contributions and Donations - 5 700 Capital Grants - 636 918
4. Net Surplus / Deficit Refuse = or > 0% The Municipality is a District Municipality and theratio is therefore not applicable.
5. Net Surplus / Deficit Sanitation andWaste Water
1. Electricity Distribution Losses(Percentage)
7% - 10%
Water Distribution Losses(Percentage)
15% - 30%
= or > 0% The Municipality is a District Municipality and theratio is therefore not applicable.
The Municipality is a District Municipality and theratio is therefore not applicable.
The Municipality is a District Municipality and theratio is therefore not applicable.
1. Growth in Number of ActiveConsumer Accounts
None The Municipality is a District Municipality and theratio is therefore not applicable.
2.
2. Revenue Growth (%) = CPI
The Municipality has an arrangement with theAuditor-General by which it is repaying itsoutstanding debt.
During the 2015 financial year, the Municipalityincurred less Grant-related Expenditure resultingin the decrease in Expenditure as well as adecrease in the funds that can be recognised asGrants and Subsidies Received (Revenue). This isdue to a number of projects that were completedduring the year, which were carried forward from
3. Revenue Growth (%) - ExcludingCapital Grants
= CPI
2.Irregular, Fruitless & Wasteful andUnauthorised Expenditure / TotalOperating Expenditure
0%
1. Creditors Payment Period (TradeCreditors)
30 Days
3. Remuneration as % of TotalOperating Expenditure
25% - 40%
Contracted Services % of TotalOperating Expenditure
2% - 5%
As the Municipality is a District Municipality, theEmployee Related Costs represent the majority ofits Operating Expenditure due to the nature ofservice provided.
1.
(Own funded Capital Expenditure(Internally Generated Funds) +Borrowings) to Total CapitalExpenditure
NoneThe Municipality acquired Property, Plant andEquipment at a value of R1 511 000 throughfinance leases,
4.
Due to the maetrial decrease in the Municipality'scash reserves, it had to finance its capital needsthrough the use of finance leases.
3.Own Source Revenue to TotalOperating Revenue (IncludingAgency Revenue)
None Remained consistent with that of the previousfinancial year.
2.Own funded Capital Expenditure(Internally Generated Funds) toTotal Capital Expenditure
None
96
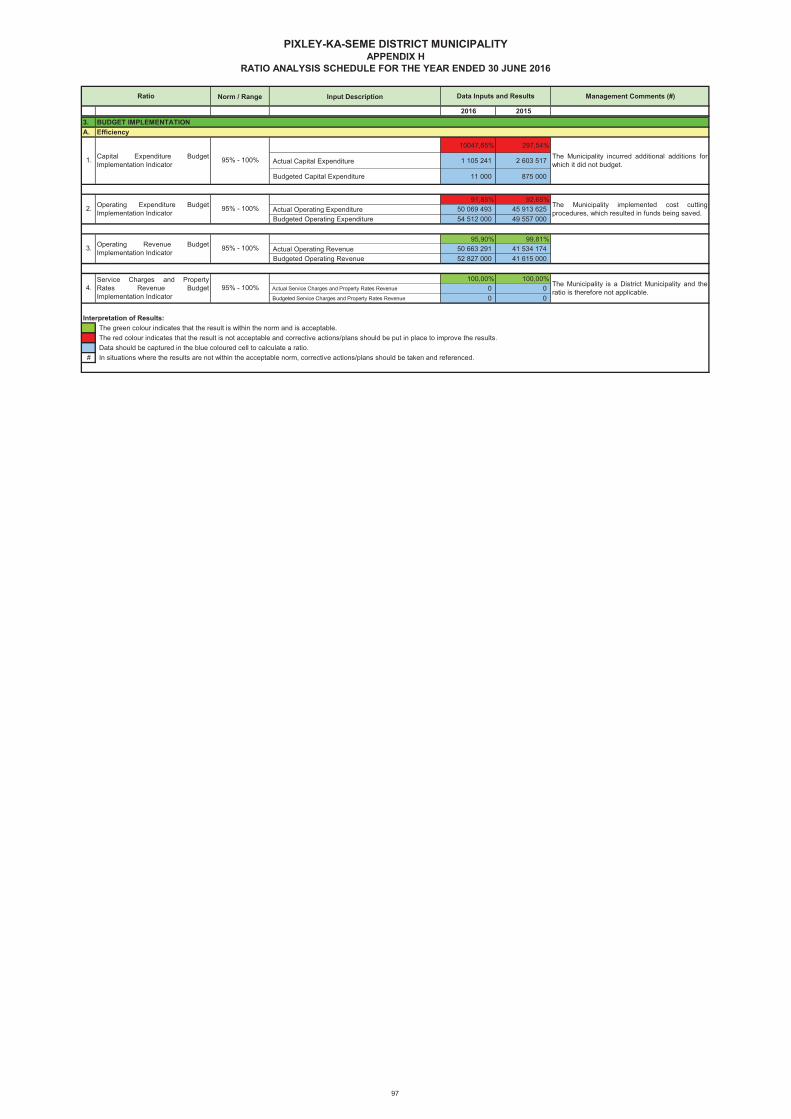
Norm / Range Input Description Management Comments (#)
2016 2015
Ratio Data Inputs and Results
PIXLEY-KA-SEME DISTRICT MUNICIPALITYAPPENDIX H
RATIO ANALYSIS SCHEDULE FOR THE YEAR ENDED 30 JUNE 2016
3. BUDGET IMPLEMENTATIONA. Efficiency
10047,65% 297,54%
Actual Capital Expenditure 1 105 241 2 603 517
Budgeted Capital Expenditure 11 000 875 000
91,85% 92,65% Actual Operating Expenditure 50 069 493 45 913 625 Budgeted Operating Expenditure 54 512 000 49 557 000
95,90% 99,81% Actual Operating Revenue 50 663 291 41 534 174 Budgeted Operating Revenue 52 827 000 41 615 000
100,00% 100,00% Actual Service Charges and Property Rates Revenue 0 0 Budgeted Service Charges and Property Rates Revenue 0 0
Interpretation of Results:The green colour indicates that the result is within the norm and is acceptable.The red colour indicates that the result is not acceptable and corrective actions/plans should be put in place to improve the results.Data should be captured in the blue coloured cell to calculate a ratio.
# In situations where the results are not within the acceptable norm, corrective actions/plans should be taken and referenced.
2. Operating Expenditure BudgetImplementation Indicator
95% - 100%
1. Capital Expenditure BudgetImplementation Indicator
95% - 100%
95% - 100%
Operating Revenue BudgetImplementation Indicator
95% - 100%
The Municipality is a District Municipality and theratio is therefore not applicable.
3.
The Municipality incurred additional additions forwhich it did not budget.
The Municipality implemented cost cuttingprocedures, which resulted in funds being saved.
4.Service Charges and PropertyRates Revenue BudgetImplementation Indicator
97
ANNEXURE B: AUDITOR GENERAL REPORT