Embed Size (px)
Citation preview

Annual report 2010One century, one goal, one planet


One Draka
In 2010, Draka celebrated its 100th anniversary. Over the decades, the company grew
from a small but ambitious Amsterdam manufacturer of copper wire into a world leader
in innovative cable technology. A company which owes much of its success to a strong
local presence in over 30 countries, ensuring that customers throughout the world
benefit from reliable solutions tailored to local circumstances.
Yet, this would be impossible without the mutual support and interconnectedness of
the worldwide Draka community. In this annual report, we focus on what binds Draka’s
people around the world. We share the firm belief that success depends on our passion
for the customer’s needs. The recognition that in economically challenging times,
innovation is more important than ever. And the knowledge that real value for customers
results from a commitment to socially and environmentally responsible solutions as well
as to overall sustainable performance. In short: one century, one goal, one planet.

4 | Draka Holding
Highlights 2010 Q1Launch of the renewed Draka visual identity. The look is open and stylish and builds on Draka’s 100 year old foundations at the same time.
Q1Draka Energy & Infrastructure Asia Pacific opens its second factory in Malaysia, Draka Sdn Bhd.
Q2Draka celebrates its 100th anniversary of cable solutions in the Netherlands, and a century of innovation.
Energy & Infrastructure
36
Industry & Specialty
39
Communications
45

Draka Holding | 5Contents
Contents
Core competences & core activities, core values, mission 6
Strategic & financial goals 7
Company profile 8
Organisation chart 10
2010 in a glance 11
Key figures 2010 12
Letter from the Chairman 15
Report of the Supervisory Board 18
Report of the Board of Management 21
Review of Energy & Infrastructure, Industry & Specialty and Communications 35
Main subsidiaries, associates and joint ventures 49
Risk management 54
Corporate governance 59
Remuneration report 64
Share information 68
Financial statements 73
• Consolidated statement of income and consolidated statement of comprehensive income 74
• Consolidated balance sheet 75
• Consolidated statement of cash flows 76
• Consolidated statement of changes in total equity 77
• Notes to the consolidated financial statements 78
• Company financial statements 126
• Notes to the company financial statements 127
Other information 136
• Appropriation of result as provided for by the Articles of Association 136
• Proposed appropriation of result 137
• Independent auditor’s report 138
• Trustee report 139
Ten years of Draka Holding N.V. 140
Q2As part of Draka’s 100th anniver sary the Innovation Centre opens its doors in Amsterdam: an inter active showcase for innovations from all parts of the organisation.
Q2Draka Cableteq USA acquires PTM (New Jersey, USA). A company specialised in the development of a new generation of cable, fiber optic and tubing technologies to meet the world’s growing energy needs.
Q4The Offshore division is awarded the array cabling contract for the Baltic 2 offshore wind farm (located in the Western Baltic Sea). The contract is valued at approximately € 23 million.
Q4Draka and Prysmian combine to form the world’s global leader in the cable industry.

6 | Draka Holding Core compentences & core activities, core values and mission
Core competences & core activitiesDraka’s core competences are the development, production and sale of cable. Since the company’s inception over a century ago,
it has consistently responded to its customers’ ever-changing needs. Draka’s current portfolio comprises:
Cable material semi-manufactures (copper drawing, compounding, optical fiber production);
Cable products cable as end-product;
Cable systems/concepts cable as part of a system/project, kit concept and/or turnkey project.
As a global manufacturer of wire and cable, Draka is able to offer extensive competences in materials development, production technology,
marketing and logistics. Draka’s product portfolio covers all mechanical, electrical and environmental requirements. These varied require-
ments have led to an outstanding range of customised products and established Draka’s name as a specialist for challenging applications.
Core valuesDraka’s Code of Conduct defines its core values of respect, integrity, accountability and discipline. As well as delineating Draka’s personality as
an organisation, the Code sets out in detail the high standards Draka demands of all its staff and the principles of ethical conduct with which they
are required to comply at all times. Draka’s employees are bound by the Code of Conduct, which is based on the following shared core values:
MissionDraka’s mission is to be one of the world’s leading cable manufacturers in all its selected product/market segments, with a sound financial
base, a balanced geographical spread and an extensive, technologically advanced product portfolio. To that end, Draka’s focus is on quality,
growth and profitability. Draka aims in this way to be an attractive partner for all its stake holders: customers, employees, shareholders,
financiers and suppliers. At the same time, Draka takes its social obligations seriously by investing in sustainable technologies.
Respect
• For the individual, irrespective
of nationality, race, origin or
disability
• For our customers,
suppliers and colleagues
• For the environment
• For the communities in
which we are active
Integrity
• In all our relationships, based
on and sustained by trust
• In complying with the law
• Expressed in our ethical
behaviour in everything we do
• In making the right choices
Accountability
• Our actions are compatible
with our responsibilities
• Accountable to our sharehol-
ders, customers, colleagues
and suppliers
• Committed to providing the
highest possible standard
of service to our customers
• For our personal growth and
our personal contri bution to
Draka’s success
• For our results
Discipline
• In implementing our corporate
plans, processes and procedures
• In developing and defining
best practices in the sector
and implementing them
without delay

Draka Holding | 7Strategic & financial goals
Strategic & financial goalsDraka has committed itself to achieving the following medium-term
strategic and financial goals:
• Increasing the scale in the special-purpose cable segment within
the cable market, through organic growth and acquisitions;
• Geographical increase in scale, through organic growth and
acquisitions, particularly in regions such as Asia, Eastern Europe,
North America and emerging markets such as Brazil, Russia, India
and China;
• Increasing revenues in Draka’s special-purpose cable segments
and geographical regions to about 60% of total revenues (2010:
approximately 53%);
• Organic strengthening of Draka’s existing position in continental
Europe;
• Capitalising on Draka’s strong sales and marketing position, creating
value by grasping market opportunities and responding to customer
requirements at an early stage;
• Extending Draka’s current range of products and services by
expanding the core activities and continuing to invest in innovation
in the field of new technologies and application engineering;
• Continuing the process of optimisation of the organisation, this
may include reorganisations and disposal of non-core activities;
• Ongoing improvement in profitability through a combination of
organic growth, cost-reduction programmes and acquisitions.
Despite a good spread of activities over the different customer
groups, Draka’s profitability in any given year is determined partly
by economic developments at that time. Draka does not therefore
set itself a medium-term target, but expects an average operating
margin 1 over the economic cycle (of 6–7 years) of more than 5%;
• Regular maintenance and replacement investments in intangible
assets, property, plant and equipment will equal amortization and
depreciation. Consistent with Draka’s strategic principles, investments
in growth markets (special-purpose cable segment and emerging
markets) may result in total investment exceeding amortisation and
depreciation in a particular year.
1 Operating result as a percentage of revenues at constant copper prices (€ 4.40/kg).

8 | Draka Holding
Draka is active worldwide in the development, production and sale of all kinds of cable solutions for a
wide diversity of customers. Draka’s products are used in aircraft, trains and cars, in ships, on offshore
rigs, in lifts and wind turbines, in homes and offices and in many more applications. With cables ranging
in size from the minutely small to diameters measured in tens of centimetres, Draka has a solution for
every application in its targeted markets.
Draka has subdivided its activities into three groups: Energy & Infrastructure, which is responsible
for the low-voltage and instrumentation cable activities, Industry & Specialty, which takes care of the
specialty cable operations, and Communications, which handles the communication cable activities.
Energy & InfrastructureDIvIsIOn MARket POsItIOn
europe Top 3 position in Europe as supplier of cable for construction, industrial and infrastructure
applications
Asia-Pacific Supplier of cable for construction, industrial and infrastructure projects; no. 1 in Singapore
and Hong Kong; growing in rest of Asia
Industry & SpecialtyDIvIsIOn MARket POsItIOn
Automotive & Aviation World no. 1 independent supplier of advanced automotive cables; key position in standard
cable; principal supplier to Airbus
Cableteq UsA Top 3 position in cable market niches such as defence, irrigation systems and oil and gas in
the USA
elevator Products Market leader in lift cables in North America; strong position in Europe; growing in Asia
Offshore Growing position in subsea cable and leading position in cable for offshore oil and gas
industry in North America and Far East
Renewable energy Global market leader in cable for wind turbines; prominent position in cable for solar energy
CommunicationsDIvIsIOn MARket POsItIOn
telecom solutions Optical fiber cable: no. 1 in Europe and China and no. 4 in USA; Outdoor copper cable:
no. 3 in EMEA
Multimedia & specials Data communication cable: no. 1 in Europe; Mobile network cable: no. 4 worldwide
Optical Fiber Multimode optical fiber: no. 1 worldwide; Single mode optical fiber: no. 2 worldwide
Company profile
Company profile
Draka Holding n.v.

Draka Holding | 9
• Argentina
• Australia
• Austria
• Belgium
• Brazil
• Canada
• Czech Republic
• Denmark
• Estonia
• Finland
• France
• Germany
• India
• Italy
• Japan
• Malaysia
• Mexico
• Netherlands
• Norway
• People’s Republic of China
• Philippines
• Russia
• Singapore
• Slovakia
• Spain
• Sweden
• Sultanate of Oman
• Thailand
• Turkey
• United Kingdom
• United States
Company profile
Operating in 31 countries
Worldwide the Draka companies have 9,377 employees. Draka Holding N.V., the head office,
is established in Amsterdam. Draka has 68 operating companies in 31 countries throughout
Europe, North and South America, Asia and Australia.

10 | Draka Holding Organisation chart
Organisation chartDraka’s organisational structure as from 1 January 2011
energy & Infrastructure
Ruud Majenburg
Industry & specialty
André Surchat
Communications
Phil Edwards
Asia-Pacific
Kian Cheng Wong
europe
Ruud Majenburg
Aerospace
Alain Jeanguillaume
Automotive
Hubert Eisengarten
engineered specialties
John Chrupcala
Renewable energy
Yves Pollé
telecom solutions
Jan-Willem Leclercq
Jürgen Glässner
Americas
Bill Dungan
Allen Griser
Multimedia & specials
Mika Höijer
Anton Obermeyer
Optical Fiber
Philippe Vanhille
elevator
Sterrett Lloyd
Offshore
Frédéric Grosse
Draka Holding n.v.Frank Dorjee (CEO)

Draka Holding | 112010 in a glance
2010 in a glance
Market conditions improved slightly, due mainly to positive developments in the second half of 2010. Draka derived maximum benefit from this upturn, with higher profit driven by volume growth and a further reduction in the cost base.
• Global cable market picked up in 2010 after the substantial decline in 2009. Global volume growth of around 7%; Western Europe and North America reported slower growth of 4-6%.
• Draka maintained market share in various sub-segments: all of its 4% volume growth was generated in the second half, matching the growth in its principal markets.
• Sustained focus on reducing cost base pays off: additional cost savings of € 30 million in 2010, on top of € 30 million savings in 2009. New initiatives are expected to lower the cost base by around € 10 million in 2011.
• Operating result (excluding non-recurring items) amounted to € 85.4 million (+13%) at an operating margin of 3.7% (+20 basis points). Competitive market conditions and higher raw material prices were offset by the positive effects of volume growth, cost savings and an improved product mix.
• Higher operating result driven entirely by strong growth in Communications Group. Lower results for Energy & Infrastructure and Industry & Specialty, but both groups performed better in the second half of 2010 compared with the same period in 2009.
• Result for the year attributable to shareholders was € 60.5 million (2009: € 48.3 million) and earnings per share amounted to € 1.13 (2009: € 1.01), both excluding non-recurring items. Proposal is not to declare a dividend on ordinary shares in respect of 2010 since the bid of Prysmian for Draka is cum dividend.
• Non-recurring items were € 56.8 million negative and related mainly to the provision for and current expense of (overhead) cost-reduction measures and Triple S projects.
• Operating working capital ratio remained at a historically low 12.9% (2009: 13.7%) despite the sharply higher copper price. Increase in working capital, due to increased volume, an appreciable increase in the price of copper and currency effects, was met by free cash flow. Net debt position approximately 4% lower than at year-end 2009 and strong balance sheet ratios maintained.
• Acquisition of Draka by Prysmian, finalised in February 2011. A bid of € 17.20 per share, 50% in cash and 50% in Prysmian shares, declared unconditional on 8 February 2011. Unanimous approval of the Board of Management and Supervisory Board. The process of integration is expected to take around three years, yielding potential synergistic gains of approximately € 100 million. The new business combination will be market leader in the global cable industry, with the two companies being largely complementary, forming an excellent base for the further expansion of the leading position in the future.
€
€
€
€
€
€
€€
€
€
2010
Europe 1,326
North America 361
Asia 511
Rest of the world 230
2,428
2009
Europe 1,129
North America 287
Asia 437
Rest of the world 195
2,048
2008
Europe 1,760
North America 304
Asia 450
Rest of the world 315
2,829

12 | Draka Holding Key figures 2010
Key figures 2010
2010 2009
Results (x € million)
Revenue 2,427.8 2,048.3
EBITDA (excluding non-recurring items) 148.1 138.2
EBITDA 91.3 71.7
Operating result (excluding non-recurring items) 85.4 75.3
Operating result 28.6 8.8
Result before income tax (excluding non-recurring items) 64.2 49.1
Result before income tax 4.7 (17.4)
Result for the year (excluding non-recurring items) 60.5 48.3
Result for the year 4.6 (18.2)
Balance sheet (x € million)
Shareholders’ equity 589.8 549.5
Guarantee capital 1 606.7 568.5
Total assets 1,826.7 1,589.3
Current assets -/- non-interest bearing current liabilities 365.5 293.0
Investments, amortisation, depreciation and impairment (x € million)
Investments in intangible assets 4.4 6.9
Investments in property, plant and equipment 34.7 35.4
Amortisation, depreciation and impairment 63.1 67.0
Investments in subsidiaries and equity accounted investees 3.0 7.2
Result for the year (excluding non-recurring items) + amortisation, depreciation and impairment 123.2 111.2
Personnel
Number of employees at year-end (permanent and temporary) 9,377 9,599
Ratios (in %)
Operating result (excluding non-recurring items) / Revenue 3.5 3.7
Operating result / Revenue 1.2 0.4
ROTA (excluding non-recurring items) 2 3.8 3.0
ROTA 2 0.3 (1.1)
Guarantee capital 1 / Total assets 33.2 35.8
Per ordinary share (x € 1)
Shareholders’ equity (excluding preference shares) 10.52 9.69
Result for the year after dividend on preference shares (excluding non-recurring items) + amortisation, depreciation and impairment 2.42 2.50
Result for the year after dividend on preference shares (excluding non-recurring items) 1.13 1.01
Result for the year after dividend on preference shares (0.02) (0.56)
Result for the year (fully diluted) 3 (0.02) (0.56)
Proposed dividend - -
1 Shareholders’ equity, provision for deferred taxation and long-term part of convertible subordinated bond and other subordinated loans.2 Result before income tax / Average total assets. 3 The calculation takes into account the interest charge on the convertible subordinated bond.

Draka Holding | 13Key figures 2010
Key figures 2010
€
€
€
€
€
€
€
€
€
€
€
€
€
€
€
€
€
€
€
€
€
€
€
€
€
€
€
€
€
€

14 | Draka Holding Letter from the Chairman
Frank Dorjee, Chairman and Chief Executive Officer

Draka Holding | 15Letter from the Chairman
2010 has been an exceptional year in many respects. It is precisely 100 years since Draka was founded.
In the intervening period we have grown from a small but ambitious Amsterdam manufacturer
of copper wire to a leading global developer of innovative cable technology. In 2011, Draka enters
a new stage by joining forces with the Italian company Prysmian, making the combined business
the biggest player in the cable market worldwide.
In operational terms, 2010 was a year of transition for Draka, with a more definite shift in focus towards
growth during the year. There were signs of improvement in economic conditions around the globe
towards the end of 2009. In the course of 2010 we were able to profit from the tentative recovery
in our most important end-markets. Revenue increased by 19% in 2010, with the operating result
(excluding exceptionals) rising by 13%, to € 85 million. The improvement in results was partly brought
about by the ongoing refinement of the organisation. Another important factor is and remains the
achievement and maintenance of cost leadership. In that context we again achieved cost savings of
€ 30 million during the year and made good progress with further strengthening our competitiveness.
Following an unsolicited approach from the French company Nexans in October with an indicative
takeover bid for Draka, we began actively exploring and evaluating all our strategic options, looking
at the possibility of continuing on an independent footing as well as examining other possibilities
for the long term. At the heart of the considerations and decisions concerning the future of Draka
were the interests of all the stakeholders. This process ultimately led to a combination with Prysmian
in February 2011, bringing to an end the independent existence of Draka as a listed company.
Simultaneously we are embarking on a new stage. The new business combination creates the world’s
largest cable manufacturer, with sites in more than 50 countries, with around 90 separate plants and
employing more than 20,000 people. Together we will be able to strengthen our competitive position,
continue growing and look forward to the next 100 years.
2010 marked by ongoing improvement in competitiveness
Many of the activities engaged by us in 2010 were connected with the ongoing improvement in our
competitive position. The Triple S ‘Stop, Swap and Share’ programme was launched back in 2005
with the object of producing an increasingly efficient and dynamic organisation through ongoing
efforts. Further initiatives under this programme were implemented in 2010 and cost savings were
again made, resulting from a further reduction of 3% in the workforce. The number of employees
was reduced by 300 compared with year-end 2009 by cutting overheads in various divisions and
closing plants in Oudenbosch (Netherlands), Ystad (Sweden) and Årnes (Norway). On top of the
€ 30 million already saved in 2009, the actions taken in 2010 produced savings of another € 30 million,
as projected. In the second half of 2010, new projects were launched, leading to estimated additional
savings based on current programmes of € 10 million for 2011.
Good working capital control and sound financial position retained in 2010
In 2010, Draka generated a free cash flow of approximately € 29 million compared with around € 160
million in 2009. The lower figure was entirely attributable to the increase in working capital due to the
Letter from the Chairman

16 | Draka Holding
rise in the price of copper coupled with volume growth. However, owing to the ongoing focus on the
control of working capital, we were able to keep working capital as a percentage of revenue at a his-
torically low level despite this. The free cash flow generated also made possible a further reduction in
the net debt position as well as an increase in equity by 7% in 2010. Draka’s sound financial position
remained as strong as ever in 2010.
new growth initiatives in attractive and high-value market segments
In addition to our consistent pursuit of the cost-cutting programmes in 2010, given the more favour-
able global economic climate, we have also been focusing more emphatically on the implementation
of new growth initiatives. For instance, we have been concentrating on the supply of total cable
pro duct packages for industrial projects large and small and for railways and other infrastructure
works in Europe to drive our growth. These initiatives are expected to start contributing to profits
from 2011 onwards. We have also been making targeted investments in the expansion of capacity in
several segments of the specialty cables market. In 2010, we once again succeeded in expanding our
position in the emerging markets and specialty cable segment. This was largely organic growth due to
increased orders but the acquisition of the American company Pressure Tube Manufacturing (PTM)
also contributed to this success. The acquisition will enable us to accelerate the development of a new
generation of cable, optical fibre and pipeline technologies to meet growing world demand for energy.
The important and prestigious contracts secured in 2010 for submarine cable for offshore wind farms
will also contribute to the further strengthening of our position in specialty cables. In particular, we
won orders for the Baltic 2 and Gwynt y Môr offshore wind farms, both worth around € 25 million.
Focus on Corporate social Responsibility
In 2010 we have reinforced our focus on Corporate Social Responsibility (CSR). Our CSR strategy is
based on four strategic goals: encouraging eco solutions, ensuring safety of Draka operations and
cable solutions, improving resource efficiency in all Draka business processes, and caring for people
in Draka’s environment. In the past year, we have defined specific objectives on occupational safety
and developed other KPIs to further improve our CSR performance. This way, we are better prepared
for environmental and social changes and can be more pro-active towards our customers who
increasingly value CSR.
Joining forces with Prysmian heralds a new epoch for Draka
Talks with Prysmian on a possible merger had already been conducted in 2009. When they were
abandoned we consciously set about pursuing our own strategy with renewed vigour, continuing
to focus on improving competitiveness and on growing organically, helped by takeovers in the
specialty cable segment and emerging markets where relevant.
Then, in October 2010, Nexans made an unsolicited initial takeover bid of € 15 per ordinary share
for Draka. After careful consideration we came to the conclusion that the indicative Nexans offer
substantially undervalued Draka and did not do proper justice to the position and interests of all
the stakeholders. We also took the view that the transaction, as proposed by Nexans, represented a
substantial execution risk. For those reasons we accordingly rejected the approach. In the following
period, we again, in close consultation with our Supervisory Board, actively examined and evaluated
our strategic options, including that of continued independence.
We noted the intention of Flint Beheer, an important, major shareholder since 1985, to run down its
stake in the company. An evaluation of all the options, and the way in which the interests of all the
Letter from the Chairman

Draka Holding | 17
stakeholders were served by them, led in November 2010 to an agreement with Prysmian on a bid by
Prysmian for all issued shares of Draka which was substantially higher than the offer made by Nexans.
Convinced that the Prysmian bid afforded real value for shareholders and represented an excellent
opportunity for Draka and all its stakeholders to preserve the company’s history, legacy and culture,
we as Board of Management and Supervisory Board recommended this offer to our shareholders.
During the same period, the Chinese company Xinmao indicated an interest in acquiring Draka. The
indicative and highly conditional offer of Xinmao was higher than the offer from Prysmian but con-
tained a lot of uncertainties. The lack of comfort regarding the financing arrangements and obtaining
the necessary approvals from the Chinese authorities, plus the execution risk associated with this
indicative offer, meant that the Prysmian bid was considered superior. As Prysmian continued with
its offer, time pressures increased and Xinmao conceded in January 2011 that the chance of its bid
succeeding was small because it would not be able to satisfy the conditions within the applicable
timescale, and withdrew.
In February 2011 the combination with Prysmian was completed. In Prysmian we have a partner of our
own choosing with which we will be strong and will be able to play a leading role in the consolidation
of our industry. Both Draka and Prysmian have ample experience with integration processes and we
are accordingly confident that the combination of the two businesses will be smoothly accomplished.
This, too, was an important consideration in the decision in favour of Prysmian – joining forces with a
world-class player in a smooth transaction so that the duration of any uncertainty for employees and
customers can be kept as short as possible.
We share the conviction that success hinges on our commitment to the customer, and the knowledge
that real value for customers results from Draka’s sustainable performance. A crucial factor here is
the interconnectedness of the worldwide Draka community. That is why we have adopted ‘One Draka’
as the theme for this annual report, with examples of how we put the customer first throughout its
pages. We are convinced that this culture will be preserved and will flourish as part of Prysmian.
This is one of the main reasons why we are full of confidence with regard to a healthy future for
our business in the new constellation in partnership with Prysmian.
A word of thanks is due to the Central Works Council and the local Works Councils, who were called
upon in 2010 to give careful consideration to a number of necessary and far-reaching decisions and
in particular to Draka’s acquisition by Prysmian. In all cases they took a critical and constructive
approach to their tasks. In conclusion, I would like to thank all our staff for their hard work and
commitment in what proved to be a historic and highly eventful year for Draka.
Frank Dorjee
Chairman and Chief Executive Officer
“ We share the conviction that success hinges on our commitment to the customer, and the knowledge that real value for customers results from Draka’s sustainable performance.”
Letter from the Chairman

18 | Draka Holding
Report of the Supervisory Board
Financial statements and dividend
The Board of Management has submitted the financial statements
for the 2010 financial year to the Supervisory Board. These state-
ments, included on pages 73 to 137 of this report, have been audited
by Deloitte Accountants B.V. The auditor’s report can be found on
page 138. The Supervisory Board recommends the General Meeting
of Shareholders (hereinafter referred to as the ‘General Meeting’)
to adopt these financial statements in accordance with the propo sal
of the Board of Management, including a dividend of € 5.4 million
on preference shares and no dividend on ordinary shares since the
bid of Prysmian for Draka is cum dividend. We also invite the General
Meeting to approve and discharge each of the members of the Board
of Management of liability for their management and each of the
members of the Supervisory Board of liability for their supervision
thereof.
Activities of the supervisory Board
The Supervisory Board held 19 meetings in 2010 which were attend-
ed by the Board of Management. Among the important matters dis-
cussed at these meetings were the non-binding proposal by Nexans
to make a bid of € 15.00 per ordinary share, payable entirely in cash,
for all the issued and outstanding ordinary shares of the Company,
the bid from Prysmian of € 17.20 per ordinary share, payable partly
in cash and partly in shares, for all the issued and outstanding ordi-
nary shares of the Company and the non-binding proposal by Xinmao
Group to make a bid of € 20.50 per ordinary share, payable entirely
in cash, for all the issued and outstanding ordinary shares of the
Company. The Supervisory Board also discussed the additional
operational restructuring measures, the strategy and growth of
the organisation, both organically and by acquisition, the progress
of the cost-control programs within the scope of the Triple S project,
the Company’s profit performance, the general and financial risks to
which the Company is exposed, the configuration and functioning of
the internal risk management and control systems, acquisition policy,
the annual report and financial statements, corporate governance,
compliance and press releases.
To avoid a (potential) conflict of interest, Annemiek Fentener van
Vlissingen and Harold Fentener van Vlissingen did not participate in
the meetings of or decision-making by the Supervisory Board on the
non-binding proposal by Nexans to make a bid for all the issued and
outstanding ordinary shares of the Company, the bid from Prysmian
for all the issued and outstanding ordinary shares of the Company
and the non-binding proposal by Xinmao Group to make a bid for all
the issued and outstanding shares of the Company and received no
information relating to the three (proposed) bids.
The Supervisory Board also held four meetings in the absence of
the Board of Management in 2010, at which it discussed its own
functioning, the functioning of its committees and the expertise of
its individual members, the composition of and succession within the
Supervisory Board, its relationship with the Board of Management,
the composition of the Board of Management and the performance
and remuneration of the members of the Board of Management. The
evaluation of the Supervisory Board, its committees and its individu-
al members was done by means of a detailed questionnaire, which
the Chairman sent to the members of the Supervisory Board in ad-
vance of the meeting. Their respon ses to the questions were
summarized and the questionnaire and summary were then
discussed at length at the meeting. In the context of this evaluation,
the Chairman of the Supervisory Board also interviewed each
member of the Supervisory Board individually.
There was frequent contact outside meetings between individual
members of the Supervisory Board and members of the Board
of Management on matters relating to the Company.
Committees of the supervisory Board
The Supervisory Board has three committees: the Audit & Governance
Committee, the Remuneration & Nomination Committee and the
Strategy Committee. Each committee has a charter defining its tasks,
responsibilities and procedures. The charters and membership of the
committees are posted on the Company’s website.
Audit & Governance Committee
The Audit & Governance Committee consists of Rob van Oordt
(chairman), Annemiek Fentener van Vlissingen (until 19 February 2010)
and Harold Fentener van Vlissingen, Fritz Fröhlich and Maarten
Schönfeld (members).
The Audit & Governance Committee held seven meetings in 2010
in the presence of the Board of Management. Among the matters
discussed were profit performance, the Company’s financial reports
and publications, the management letter and the role of the auditors,
corporate governance matters, risk management and internal
control procedures, legal matters, the 2011 audit plan, corporate
financing and press releases.
Various aspects of corporate governance are discussed on pages
59 and 60.
Remuneration & nomination Committee
The Remuneration & Nomination Committee consists of
Fritz Fröhlich (chairman), Annemiek Fentener van Vlissingen,
Ludo van Halderen and Rob van Oordt (members).
The Remuneration & Nomination Committee held three meetings
in 2010. The main subjects addressed at the meetings were the
functioning and composition of the Board of Management, the
remuneration, pension schemes and contractual arrangements
of the members of the Board of Management, the 2011 bonus
targets for the Board of Management, the assessment of and
succession planning for senior executives and succession planning
for the Board of Management and Supervisory Board.
strategy Committee
The Strategy Committee consists of Ludo van Halderen (chairman) and
Bernard Dijkhuizen, Harold Fentener van Vlissingen and Aad Veenman
(members).
The Strategy Committee held two meetings in 2010. While super vision
of corporate strategy remains the responsibility of the full Supervisory
Board, the task of the Strategy Committee is to study specific strategic
issues and proposals by the Board of Management in depth and provide
Report of the Supervisory Board

Draka Holding | 19
supervisory Board
The Supervisory Board of Draka Holding consists of
the following members:
Fritz Fröhlich (Chairman) (1942) 2, 3
nationality Germansupervisory Board Randstad Holding N.V. (Chairman) memberships Altana AG (Chairman) Allianz Nederland Groep N.V. ASML Holding N.V. Rexel S.A.First appointed 1999Current term 2007–2011
Annemiek Fentener van vlissingen (Deputy Chairman) (1961) 4
nationality Dutchsupervisory Board SHV Holdings N.V. (Chairman) memberships De Nederlandsche Bank N.V. Flint Holding N.V. Heineken N.V. First appointed 2001Current term 2009–2013
Bernard Dijkhuizen (1949) 6
nationality Dutchsupervisory Board VNO-NCW memberships WENb NLKabelFirst appointed 2010Current term 2010-2014
Harold Fentener van vlissingen (1968) 2, 6
nationality Dutchsupervisory Board Diamond Tools Group B.V. (Chairman) memberships Flint Holding N.V. Precision Tools Holding B.V. (Director)First appointed 2006Current term 2010–2014
Ludo van Halderen (1946) 4, 6
nationality Dutchsupervisory Board Rabobank IJsseldelta (Chairman) memberships Rabo Vastgoedgroep Holding N.V. Smit Transformatoren B.V. Van Gelder Groep B.V.First appointed 2006Current term 2010–2014
Rob van Oordt (1936) 1, 4
nationality Dutchsupervisory Board Unibail-Rodamco S.E. memberships (Chairman; France)First appointed 1999Current term 2007–2011
Maarten schönfeld (1949) 2
nationality Dutchsupervisory Board Arcadis N.V. memberships S&B Industrials Minerals S.A. (Greece)First appointed 2010Current term 2010–2014
Aad veenman (1947) 6
nationality Dutchsupervisory Board TenneT B.V. memberships GVB Amsterdam B.V. Woonbron SPF Beheer B.V. Eureko B.V. (Achmea)First appointed 2010
Current term 2010–2014
input to the Supervisory Board when these issues are on the agenda
for discussion and decision -making by the full Supervisory Board.
Important issues addressed at the meetings included the Company’s
short-term and long- term strategy, innovation, possible acquisitions
and divestments and the Company’s minority interests.
Remuneration report in outline
The Company’s remuneration policy, which was adopted by the
General Meeting on 11 May 2007, is discussed in detail in the section
entitled ‘Remuneration report’. The aim of the remuneration policy
is to enable the Company to attract and retain qualified and expert
Board of Management members. The remuneration package for
the members of the Board of Management comprises a base
salary, a bonus, a long-term incentive and a pension plan.
Composition of the supervisory Board
There were changes in the composition of the Supervisory Board
in 2010. Harold Fentener van Vlissingen and Ludo van Halderen were
reappointed to the Supervisory Board by the General Meeting on
20 April 2010. Annemieke Roobeek and Graham Sharman
retired by rotation at the General Meeting of 20 April 2010. Bernard
Dijkhuizen, Maarten Schönfeld and Aad Veenman were appointed
to the Supervisory Board at the General Meeting of 20 April 2010.
Composition of the supervisory Board after 14 February 2011
On 26 January 2011 the Company held an Extraordinary General
Meeting of Shareholders (“EGM”) to discuss the offer of Prysmian
S.p.A. During this EGM the shareholders adopted, a.o., the following
resolutions:
• Resignation of Annemiek Fentener van Vlissingen, Fritz Fröhlich,
Bernard Dijkhuizen, Harold Fentener van Vlissingen,
Rob van Oordt and Maarten Schönfeld as members of the
Supervisory Board per settlement date.
• Appointment of Massimo Battaini, Francesco Facchini
and Fabio Romeo as members of the Supervisory Board
per settlement date.
As from 22 February 2011, the date of settlement, the Supervisory
Board consists of Massimo Battaini, Francesco Facchini, Ludo van
Halderen, Fabio Romeo and Aad Veenman.
A word of thanks
The Supervisory Board thanks the Board of Management and all the
staff for their commitment and hard work on behalf of the Company
in 2010, especially during the last quarter of 2010.
Amsterdam, 14 February 2011
Fritz Fröhlich, Chairman
Annemiek Fentener van Vlissingen, Deputy Chairman
Bernard Dijkhuizen
Harold Fentener van Vlissingen
Ludo van Halderen
Rob van Oordt
Maarten Schönfeld
Aad Veenman
1 Chairman of the Audit & Governance Committee. 2 Member of the Audit & Governance Committee. 3 Chairman of the Remuneration & Nomination Committee.4 Member of the Remuneration & Nomination Committee.5 Chairman of the Strategy Committee.6 Member of the Strategy Committee.
Report of the Supervisory Board

20 | Draka Holding

Draka Holding | 21Report of the Board of Management
Report of the Board of Management
Main developments in 2010
Global cable market
After the sharp fall in demand in 2009 in the wake of the global
financial crisis, the world cable market recovered significantly in
2010. Recovery was driven mainly by improving economic conditions
in the developed countries, coupled with continuing growth in the
emerging markets which started in the second half of 2009. The
recovery was slow in the first six months of 2010, but gained momen-
tum in the second half and delivered volume growth of about 7%
over the year.
The growth in global cable market volume was powered by strong
demand in the emerging markets. Growth in China, Brazil and Russia
was very rapid at 10–15%, but far more modest in North America
and Western Europe at only 4–6%, most of which was generated
in the second half. This slower growth rate mainly reflected the low
level of construction activity in those regions.
Within the cable market, the data communication cable segment
(copper and optical fiber) showed the fastest growth, with demand
up more than 9%. The picture in the rest of the communication
cable segment was mixed, with demand for optical fiber telecom-
munication cable holding firm at the high level of 2009 and a further
substantial fall (–10%) in demand for copper telecommunication
cable. In the energy cable segment, demand for medium-voltage
and high-voltage cable (Draka is not active in high-voltage cable)
grew at around 6%, in line with demand for low-voltage cable.
The special-purpose cable segment performed slightly better,
with growth of about 7%.
Raw material prices
The prices of the raw materials that are relevant to the cable industry
continued to rise in 2010. Some, such as copper and PVC, returned
to the historically high levels reached in 2006–2007. Among the
metals, the average copper price increased by around 55% in
2010 compared with year-end 2009, while the average aluminium
price rose less sharply, at about 35%. Polymer prices were some
15% higher, reflecting the higher oil prices.
Copper price development (euros) over the period 2000-2010
Draka in general
Draka marked its centenary in 2010. It was precisely a hundred
years ago that the company was founded in Amsterdam by Jan
Teewis Duyvis. This milestone was celebrated with employees
and customers during the Sail 2010 event in Amsterdam.
Operationally, 2010 was a year of transition for Draka, during
which the management increasingly shifted the focus towards
growth, in response to the improvement in the global economic
climate since the second half of 2009. Draka implemented several
new growth initiatives, such as positioning itself as a supplier of
total cable product packages for major industrial, rail and infra-
structure projects, while continuing to pursue its cost-reduction
plans with undiminished vigour. On the basis of careful market
analysis and research, these growth initiatives were embedded
in the organisation in the second half of 2010 and are expected
to make a positive contribution to results from 2011 onwards.
Thanks to its policy of responding actively to the still fragile
recovery of the cable market while continuing to lower its cost
base, Draka posted a good result, with a 50% increase in operating
profit in the second half. This improvement confirms that Draka is
right to continue on the path on which it has embarked. It also
reflects the further strengthening and professionalisation of the
organisational structure, which in 2010 saw investment in new
senior management and expansion of Draka’s expertise in lean
manufacturing. Draka expects this investment to bring dividends
in the coming years.
talks with nexans/Prysmian/Xinmao
In October 2010, Nexans made an unsolicited initial takeover bid
of € 15 per ordinary share for Draka. After careful consideration
Draka concluded that the indicative Nexans offer substantially
undervalued Draka and did not do proper justice to the position
and interests of all the stakeholders. The approach was accordingly
rejected, following which Draka re-examined its strategic options,
bearing in mind the intention of Flint Beheer to run down its stake
in the company. This led in November 2010 to an agreement with
Prysmian on a bid by Prysmian for all issued ordinary shares of
Draka, 50% in cash and 50% in Prysmian shares, valuing Draka
at € 17.20 per share at that time, which was substantially higher
than the offer made by Nexans. During the same period, the
Chinese company Xinmao indicated an interest in acquiring Draka.
The terms of the Xinmao bid were better than the offer from
Prysmian but contained a lot of uncertainties regarding the finan-
cing arrangements and obtaining the necessary approvals from
the Chinese authorities. As Prysmian continued with its offer,
Xinmao dropped its indicative bid in January 2011. In February
2011 the transaction with Prysmian was completed.
Optimisation
Draka continued to focus closely on further optimisation of its
organisation. Securing and maintaining cost leadership is crucially
important and is one of the company’s strategic objectives. The
‘Stop, Swap and Share’ (or ‘Triple S’) programme, which was
launched in 2005, is an ongoing process designed to make the
organisation more efficient and effective.
The action taken by Draka in 2010, to which all the groups
contributed, included completion of the closure of the plants in
Oudenbosch (Netherlands), Ystad (Sweden) and Årnes (Norway)
and reductions in overhead costs in several divisions. These actions
had consequences for staffing levels, reducing the headcount by
around 300 in 2010. The savings achieved in 2010 were in line
with expectations, amounting to € 30 million.

22 | Draka Holding Report of the Board of Management
New projects launched in the second half of 2010 which are
intended to further reduce overhead costs and achieve operational
excellence cover all three Draka groups and are scheduled for
completion in 2011. The savings to be made in 2011 as a result
of the current cost-reduction programmes are estimated at
approximately € 10 million.
Investments
In addition to the regular maintenance and replacement invest-
ments which Draka makes every year to keep its production
facilities up to date, the company is also investing in expanding
capacity in several special-purpose cable segments. These invest-
ment projects are consistent with Draka’s strategic objectives
and, because they are being undertaken in fast-growing cable
segments, there is no disturbance of the market.
Since the completion of the investment project to establish initial
production capacity for submarine cable in 2009, Draka has under-
taken no further investment in capacity expansion. Capital expen-
diture has consequently been confined to replacement investment.
Draka’s share of the special-purpose cable market
One of Draka’s strategic objectives is to advance its position in
the special-purpose cable segment and in the emerging markets
through organic growth and selective acquisitions. Draka again
succeeded in 2010 in increasing the revenue from special-purpose
cable, to around 53% of its total revenues compared with 51% in
2009. Most of this growth was organic, because demand in the
special-purpose cable segment and in the emerging markets grew
faster than Draka’s total volume. The acquisition of Pressure Tube
Manufacturing (USA) in the first half of 2010 also contributed to the
growth of the special-purpose cable segment and will continue to
do so in 2011, when it will be included in the consolidation for a full
year. The investment in initial submarine-cable production capacity
will also help to drive the growth in the share of special-purpose
cable in total volume, thanks to the acquisition in 2010 of large and
prestigious contracts for submarine cable for wind farms. These
include contracts for the Baltic 2 and Gwynt y Môr offshore wind
farms, each worth some € 25 million.
Acquisition
In April 2010, Draka announced its acquisition of Pressure Tube
Manufacturing (PTM), a specialty tubing manufacturer located in
New Jersey, USA. PTM manufactures small-diameter corrosion-
resistant tubing used in a range of applications, from the control
of hydraulic safety valves on oil wells to chemical injection in
natural gas wells. In 2010, the company generated revenues of
around € 8 million with a workforce of about 45. The purchase
price was paid in cash and PTM has been included in the consoli-
dation since June 2010.
The acquisition of PTM means that Draka can increase the pace
of development of a new generation of cable, optical fiber and
tubing technologies to meet the growing world demand for energy.
It also strengthens Draka’s leading position in the special-purpose
cable segment of the USA oil and gas market, consistent with its
strategy of focusing on its core growth markets.
Financial results
Draka benefited from the recovery of the cable market in the
second half of 2010. Revenues were 18.5% higher, on volume
growth of 3.5%. The higher average copper price accounted for
12.4 percentage points of the increase in revenues. Partly due to
the higher volume, the operating result excluding non-recurring
items turned out at € 85.4 million, up 13.4% compared with 2009.
As well as the higher volume and hence higher capacity utilisation
at Draka’s plants, the various cost-saving programmes also
made a positive contribution to the result (some € 30 million).
The result was, however, adversely affected by the unrelenting
competitive pressure. The result for the year attributable to
shareholders, excluding non-recurring items, was € 60.5 million
(2009: € 48.3 million), or € 1.13 per ordinary share (2009: € 1.01).
Cash flow
Draka generated free cash flow of € 28.8 million (€ 0.59 per
ordinary share) in 2010, which was 82.0% lower than in 2009.
All of this shortfall can be attributed to the increase in operating
working capital in absolute terms (€ 12.6 million), which was due
to the substantial 55% rise in the copper price compared with
year-end 2009 and the volume growth achieved in the second
half of 2010. The operating working capital in absolute terms
in 2009 was € 143.4 million lower, amongst others due to the
18% reduction in volume.
Thanks to the sustained focus on working capital management,
the operating working capital as a percentage of revenues
remained at a historically low 12.9%, compared with 13.7% as
at year-end 2009. The target of a stable operating working
capital ratio of 15–17% was therefore again exceeded in 2010.
Restricting investments in intangible assets and property,
plant and equipment to € 39.1 million, which was less than the
amorti sation and depreciation charge of € 62.7 million, also
made a positive contribution to the free cash flow.
Financial position
Draka’s financial position remained strong last year. The free cash
flow enabled Draka to reduce net debt by € 11.6 million to € 283.4
million as at year-end 2010. Shareholders’ equity increased to
€ 589.8 million in the past financial year, € 40.3 million higher
than at year-end 2009. This further improved the ratio of net
debt to shareholders’ equity to 48.1% (2009: 53.7%).
Progress towards strategic objectives
Objectives Medium term 2010 2009
Specialty profile as
% of revenues 60% 53% 51%
Continuous optimisation Cost € 30 million € 30 million
of organisation leadership cost savings cost savings
Operating margin over
economic cycle 1 > 5% 3.7% 3.5%
Operating working capital
as % of revenues 15-17% 12.9% 13.7%
Free cash flow optimum € 29 million € 161 million
1 Operating result as a percentage of revenues at constant copper prices (€ 4.40/kg).

Draka Holding | 23Report of the Board of Management
Financial targets
Draka’s strategic focus is on increasing profitability by responsibly
allocating the available free cash flow (defined as cash flow gene-
rated from ordinary operations taking account of a required level
of investment) and strengthening its balance sheet position. In the
medium term, Draka aims for ongoing improvement in profitability
through a combination of organic growth, focused acquisitions,
productivity enhancements and cost-reduction programmes.
Despite a good spread of activities over the different customer
groups, Draka’s profitability in any given year is determined partly
by current economic developments. Draka does not, therefore, set
itself a given medium-term target, but expects an average operat-
ing margin over the economic cycle (of 6–7 years) of more than 5%.
Other important financial objectives for the medium term:
• Regular maintenance and replacement investments in intangible
assets and property, plant and equipment matching amortisation
and depreciation. In line with Draka’s strategic principles, invest-
ments may be undertaken in growth markets (special-purpose
cable segment and emerging markets) which could result in
total investment exceeding depreciation in any given year.
• Healthy balance sheet ratios, implying:
• leverage ratio (net debt / EBITDA) < 3.5 (2010: 1.9);
• interest coverage ratio (EBITDA / interest) > 3.5 (2010: 6.7);
• solvency (guarantee capital / balance sheet total) > 30.0%
(2010: 33.2%).
• Stabilisation of operating working capital (defined as inventories
plus trade receivables minus trade payables) at 15–17% of reve-
nues (2010: 12.9%).
Financial results
General
In its reporting over 2010, Draka has reported revenues as usual
on the basis of the current copper price and, in a new departure,
on the basis of a constant copper price of € 4.40/kg, which was the
price on 1 January 2007. Reporting on the basis of constant copper
prices provides a clearer view of revenue and margin development.
Another change in 2010 was the reclassification of OEM revenue
between the Energy & Infrastructure and Industry & Specialty
groups. Revenues in 2009 have been restated to facilitate compa-
rison, involving an increase in Energy & Infrastructure’s revenues
by € 30.1 million and a decrease in Industry & Specialty’s revenues
by the same amount.
Revenues
At current copper prices, revenues in 2010 were 18.5% higher at
€ 2,427.8 million. The effect of higher copper prices on revenues
was 12.4 percentage points positive, due to passing on changes in
the copper price in the price of cable products.
At constant copper prices, revenues were 6.1% higher compared
with 2009, at € 2,299.5 million. This increase was the result of a
combination of volume growth (3.5 percentage points) and positive
exchange-rate effects (3.8 percentage points), in particular the
strengthening of the dollar against the euro. The volume growth
was due principally to the strong recovery in demand for special-
purpose cable in the second half of the year. In the first six months
of 2010, Draka reported negative volume growth (–0.6 percentage
points), which can be partly attributed to the hard winter in Europe.
The net effect on revenues of acquisitions and disposals was 1.2
percentage points negative. The acquisition was Pressure Tube
Manufacturing (USA), which has been included in the consolidation
since June 2010 and contributed approximately € 8 million to
Draka’s revenues in 2010 (0.4 percentage points). The impact of
disposals was -1.6 percentage points and comprised the sale of
Draka’s OPGW activities (Germany) in June 2009 and the 55%
interest in Draka Comteq SDGI Co Ltd (China) in December 2009.
Revenues by group (x € million) 2010 2009
Energy & Infrastructure 854.0 694.4
Industry & Specialty 744.5 617.7
Communications 829.3 736.2
total 2,427.8 2,048.3
total, at constant copper prices 2,299.5 2,167.8
• Draka Energy & Infrastructure’s revenues in 2010 were 23.0%
higher at € 854.0 million, due primarily to the positive effect of
higher average copper prices. Volume was 0.4% higher, mainly
reflecting recovery in demand in the Scandinavian countries with-
in the division Europe in the second half of 2010. In contrast, the
Asia-Pacific division reported falling demand in the second half.
• Industry & Specialty’s revenues were 20.5% higher in 2010 at
€ 744.5 million. The contributory factors in this increase were
the higher copper price and the slight increase in volume. All of
the 0.4% growth in volume was generated in the last six months
of 2010, reflecting good performance by the Automotive &
Aviation, Cableteq USA and Renewable Energy divisions.
The acquisition of Pressure Tube Manufacturing had a 1.3
percentage point positive effect on revenues.
• Revenues in the Communications group in 2010 were 12.6%
higher at € 829.3 million, mainly due to the volume growth of
9.6%. The Multimedia & Specials division in particular reported
a substantial recovery in its revenues after the sharp fall in 2009.
The Optical Fiber division and Draka’s joint ventures in China and
Brazil continued to perform well. The sale of the OPGW activities
in Germany (June 2009) and the 55% interest in Draka Comteq
SDGI Co Ltd in China (December 2009) had a 4.6 percentage point
negative effect on revenues.
Operating result
Draka’s operating result in 2010 was € 28.6 million, compared with
€ 8.8 million in 2009. On a like-for-like basis – excluding non-recur-
ring items – the operating result was € 85.4 million, compared with
€ 75.3 million in 2009. All of the improvement in the underlying
result, which was driven by volume growth, was achieved in the
second half. The result for the last six months was 49.9% higher,
compared with a 17.1% fall in the first half of 2010.

24 | Draka Holding Report of the Board of Management
The non-recurring charges of € 56.8 million related mainly to a
provision for and current costs of overhead reduction and Triple S
projects within Draka’s three groups. Total non-recurring charges
in 2009 were € 66.5 million.
Operating margin
The operating margin – the operating result excluding non-recur -
ring items as a percentage of revenues at constant copper prices –
turned out at 3.7% compared with 3.5% in 2009. The improvement
was driven by volume growth, which translated into higher capacity
utilisation rates at Draka’s plants, cost savings (around € 30 million)
and an improved product mix. Negative factors affecting the margin
were the competitive market conditions and the higher raw material
prices (especially polymers) which could not be passed on fully in
selling prices.
Operating result by group (x € million) 2010 2009
Energy & Infrastructure 29.2 31.8
Industry & Specialty 28.2 33.4
Communications 45.2 26.7
Not attributed (17.2) (16.6)
total operating result (excluding non-recurring items) 85.4 75.3
Energy & Infrastructure (14.4) (13.8)
Industry & Specialty (12.4) (31.6)
Communications (22.3) (17.7)
Not attributed (7.7) (3.4)
total non-recurring items (56.8) (66.5)
Operating result 28.6 8.8
Operating margin 1 (excluding non-recurring items) 3.7% 3.5%
1 Operating result as a percentage of revenues at constant copper prices (€ 4.40/kg).
• The Energy & Infrastructure group’s operating result, excluding
non-recurring items, declined to € 29.2 million (–8.2%). The
decline reflects the slightly lower market prices and increase
in raw material prices. These negative factors were partly offset
by a further improvement in the product mix and additional cost
savings of some € 10 million.
• The Industry & Specialty group’s operating result, excluding non-
recurring items, was € 28.2 million, or 15.6% lower than in 2009
(€ 33.4 million). After declining 43.7% in the first six months of
2010, the result made a strong recovery of 30.1% in the second
half, driven partly by improved performance in the Automotive &
Aviation, Cableteq USA and Renewable Energy divisions. Cost
reductions also contributed positively to the result and amounted
to € 9 million in 2010.
• The Communications group’s operating result, excluding non-
recurring items, was € 45.2 million, up 69.3% compared with
2009. The improvement was due to a combination of volume
growth, most notably in the Multimedia & Specials and Optical
Fiber divisions, additional cost savings of approximately € 11 million
and good performance by Draka’s joint ventures in China and
Brazil. The group achieved this result in the face of constant
pressure on selling prices.
• The result not attributed to groups, such as the costs of the
holding company and other unattributable expenses, increased
slightly to € 17.2 million negative.
Other financial items
Net finance expense amounted to € 31.9 million, up 2.2% compared
with 2009 (€ 31.2 million). This increase was fully driven by non-
recurring items such as an impairment loss on a promissory note
(Optelecom), net foreign exchange losses and fee expenses relating
to Draka’s syndicated loan. The interest expense showed an under-
lying decline of 22.9% reflecting the reduction in average net debt
which resulted partly from the € 100 million share issue in October
2009. The taxation item was € 1.8 million positive, including the
tax effect on the non-recurring items of € 3.6 million. Excluding
this effect, the effective tax rate was 3.2% (2009: -4.3%).
The share in the profit of equity-accounted investees amounted to
€ 8.0 million, compared with € 5.0 million in 2009. A significantly
higher profit at Draka’s associate Oman Cable Industry in Oman
(OCI) was largely responsible for this increase.
Other items and result for the year (x € million) 2010 1 2009 1
Operating result 28.6 8.8
Non-recurring items (56.8) (66.5)
Operating result (excluding non-recurring items) 85.4 75.3
Net finance expense (29.2) (31.2)
Result before income tax 56.2 44.1
Income tax expense (1.8) 1.9
Share of results of equity-accounted investees 8.0 5.0
Result for the year 62.4 51.0
Minority interests (1.9) (2.7)
Result for the year attributable to shareholders 60.5 48.3
Preference dividend 5.4 5.4
earnings per share (in euros) 1.13 1.01
1 Excluding non-recurring items.
Result for the year
The result for the year attributable to shareholders was € 4.6 million
positive, compared with € 18.2 million negative in 2009. Excluding
non-recurring items, the result was € 60.5 million, an increase of
25.3% compared with 2009 (€ 48.3 million).
Basic earnings per share
After appropriation of the preference dividend (€ 5.4 million),
basic earnings per ordinary share amounted to € 0.02 negative,
compared with € 0.56 negative in 2009. Excluding non-recurring
items, basic earnings per ordinary share amounted to € 1.13, which
was up 11.9% compared with 2009 (€ 1.01). This improvement was
partly tempered by a 15.0% increase in the average number of
ordinary shares in issue.
As at year-end 2010, there were 48,736,597 ordinary shares in
issue, unchanged from the position as at year-end 2009. The
average number of ordinary shares in issue was 48,711,439,
an increase of 15.0% compared with 2009 (42,349,572) due
to the share issue in October 2009.
Draka Holding | 25Report of the Board of Management
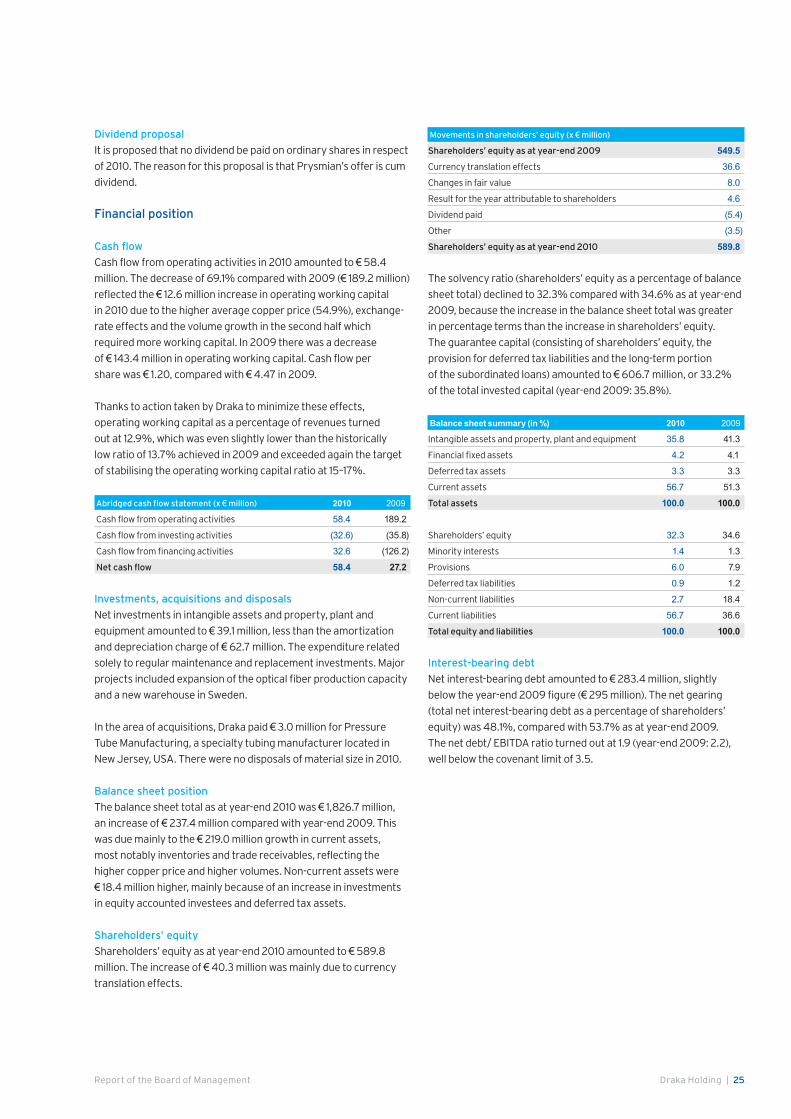
Dividend proposal
It is proposed that no dividend be paid on ordinary shares in respect
of 2010. The reason for this proposal is that Prysmian’s offer is cum
dividend.
Financial position
Cash flow
Cash flow from operating activities in 2010 amounted to € 58.4
million. The decrease of 69.1% compared with 2009 (€ 189.2 million)
reflected the € 12.6 million increase in operating working capital
in 2010 due to the higher average copper price (54.9%), exchange-
rate effects and the volume growth in the second half which
required more working capital. In 2009 there was a decrease
of € 143.4 million in operating working capital. Cash flow per
share was € 1.20, compared with € 4.47 in 2009.
Thanks to action taken by Draka to minimize these effects,
operating working capital as a percentage of revenues turned
out at 12.9%, which was even slightly lower than the historically
low ratio of 13.7% achieved in 2009 and exceeded again the target
of stabilising the operating working capital ratio at 15–17%.
Abridged cash flow statement (x € million) 2010 2009
Cash flow from operating activities 58.4 189.2
Cash flow from investing activities (32.6) (35.8)
Cash flow from financing activities 32.6 (126.2)
net cash flow 58.4 27.2
Investments, acquisitions and disposals
Net investments in intangible assets and property, plant and
equipment amounted to € 39.1 million, less than the amortization
and depreciation charge of € 62.7 million. The expenditure related
solely to regular maintenance and replacement investments. Major
projects included expansion of the optical fiber production capacity
and a new warehouse in Sweden.
In the area of acquisitions, Draka paid € 3.0 million for Pressure
Tube Manufacturing, a specialty tubing manufacturer located in
New Jersey, USA. There were no disposals of material size in 2010.
Balance sheet position
The balance sheet total as at year-end 2010 was € 1,826.7 million,
an increase of € 237.4 million compared with year-end 2009. This
was due mainly to the € 219.0 million growth in current assets,
most notably inventories and trade receivables, reflecting the
higher copper price and higher volumes. Non-current assets were
€ 18.4 million higher, mainly because of an increase in investments
in equity accounted investees and deferred tax assets.
shareholders’ equity
Shareholders’ equity as at year-end 2010 amounted to € 589.8
million. The increase of € 40.3 million was mainly due to currency
translation effects.
Movements in shareholders’ equity (x € million)
shareholders’ equity as at year-end 2009 549.5
Currency translation effects 36.6
Changes in fair value 8.0
Result for the year attributable to shareholders 4.6
Dividend paid (5.4)
Other (3.5)
shareholders’ equity as at year-end 2010 589.8
The solvency ratio (shareholders’ equity as a percentage of balance
sheet total) declined to 32.3% compared with 34.6% as at year-end
2009, because the increase in the balance sheet total was greater
in percentage terms than the increase in shareholders’ equity.
The guarantee capital (consisting of shareholders’ equity, the
provision for deferred tax liabilities and the long-term portion
of the subordinated loans) amounted to € 606.7 million, or 33.2%
of the total invested capital (year-end 2009: 35.8%).
Balance sheet summary (in %) 2010 2009
Intangible assets and property, plant and equipment 35.8 41.3
Financial fixed assets 4.2 4.1
Deferred tax assets 3.3 3.3
Current assets 56.7 51.3
total assets 100.0 100.0
Shareholders’ equity 32.3 34.6
Minority interests 1.4 1.3
Provisions 6.0 7.9
Deferred tax liabilities 0.9 1.2
Non-current liabilities 2.7 18.4
Current liabilities 56.7 36.6
total equity and liabilities 100.0 100.0
Interest-bearing debt
Net interest-bearing debt amounted to € 283.4 million, slightly
below the year-end 2009 figure (€ 295 million). The net gearing
(total net interest-bearing debt as a percentage of shareholders’
equity) was 48.1%, compared with 53.7% as at year-end 2009.
The net debt/ EBITDA ratio turned out at 1.9 (year-end 2009: 2.2),
well below the covenant limit of 3.5.

26 | Draka Holding Report of the Board of Management
Information and Communication technology
Draka’s ICT strategy is designed to support the business in terms of
reducing costs, improving efficiency and providing better services
to its customers by:
• providing robust ICT services with the right cost/quality ratio;
• building ICT solutions that add value and support the business
objectives;
• developing an ICT community of people who can translate the
business needs into reliable services and fit-for-purpose solutions.
Infrastructure shared services (Iss)
A standardised international communication network, e-mail and
network security environment has been operational at most Draka
locations for two years. It is based on a shared-services concept
that is centrally managed and supported in close cooperation with
Draka’s partner, AtosOrigin/Verizon. The ICT policies and proce-
dures developed to ensure the security and integrity of ISS are
audited annually at the various Draka locations. By centralizing
these services, Draka can reduce the cost of several of these
elements.
Draka continued in 2010 to roll out the standard EDI (Electronic
Data Interchange) system that provides a cost-effective method
of setting up automatic transaction services (for example relating
to orders) with customers and suppliers. A structure has been
designed which uses SAP PI as a standard integration platform to
enable efficient linking of the different ERP systems within Draka.
Central hosting of SAP has been transferred to a COD (computing
on demand) service, based on a ‘pay as you use’ concept, which
will reduce total costs in 2011. The business-continuity aspect of
this important service has also been enhanced with the provision
of a dual data centre facility.
supply chain planning
A study of the effectivity of the IT solutions for supply chain plan-
ning has been completed, looking at how sales and operations
planning, production planning and production scheduling operate
within the various departments and what kinds of IT solution are
employed. The industry-specific ‘length-based’ planning aspects
play a particularly important role here. It has been decided both
to further upgrade the supply chain planning functionality within
the Draka SAP template and to examine a number of ‘best of breed’
solutions that can add value to the business.
Business applications
After the addition of more standard solutions to the Draka enter-
prise application landscape in 2009, the following projects have
been implemented within the three groups with the support of the
central competence centres:
• ERP - Draka SAP template: Draka Elevator has completed the
roll-out of SAP to its Italian operating company. A start has been
made on the development of a core system for the optical fiber
plants that will be connected in 2011/2012 to the SAP system
already in use for sales, distribution, inventory management,
and finance and control within the Communications group. In
Wuppertal, Suzhou and Santander, business cases are being
compiled within Energy & Infrastructure Europe in preparation
for the possible implementation of the Draka SAP template in the
coming years.
• CRM – Salesforce.com: A global CRM programme has been set up
to strengthen Draka’s sales and customer service organisation.
Following the first successful Salesforce.com implementation at
Draka in the Czech Republic, a start has been made on further
roll-out within the Communications group, which will take until the
end of 2011. Implementation within in the Industry & Specialty
group is planned for 2012.
• Business intelligence - QlikView: There is a growing need for analy-
sis of data from various ERP applications, such as sales margins,
order book and supply chain efficiency across various product
groups and divisions. Following the successful implementation
of QlikView in the Communications group, which has eliminated
time-consuming analysis work, this cost-effective and user-friend-
ly application will be rolled out more extensively within Draka.
ICt organisation and governance
The ICT organisation and ICT governance within Draka have been
given a full redesign in the past year. A single functional ICT orga-
nisation has been created, in which each group has a director who
bears full responsibility for ICT. Within the groups, ICT has been
split into an ICT Services department, whose object is to achieve
operational excellence in all ICT services, and a Business Solution
department, which is dedicated fully to applications that add value
and support improvements in business processes. The ICT function
has been further strengthened with the appointment of senior
ICT managers and experts in Draka’s standard applications and
architecture. The quality of the ICT community will be further
enhanced, principally by implementing business ICT expertise
and sharing specific high-grade competences across the various
divisions. The new ICT organisation will be better equipped to
meet the needs of the business and Draka’s customers and
achieve further cost savings.

Draka Holding | 27Report of the Board of Management
Innovation
Draka considers innovation to be a critical success factor. Through
continuous assessment of and prompt response to the customer’s
wishes and requirements, Draka is continuing to build on its promi-
nent market position. The company constantly explores ways of
further broadening and improving the services it offers. Draka also
sees research and development (R&D) as an important instrument
for meeting the company’s obligations to society. Draka spends a
significant part of its revenues on R&D, with particular emphasis on
application engineering and the further improvement of materials
and production processes.
In recent years, Draka’s R&D activities have been directed largely
towards reducing the cost of manufacturing existing products and
improving production processes. As materials are a major cost
component in almost all divisions, Draka searches constantly for
potential savings and ways of substituting environmentally
hazardous materials.
All divisions continued to focus on stimulating innovation in 2010.
Further progress was made in building a worldwide R&D community,
which is now an integral part of the Draka organisation. Regular
meetings were held by technical working groups on horizontally
applicable topics such as compounds and new cable concepts.
Partly as a result of this development, an innovation mindset
has been instilled throughout the Draka organisation. The
objectives for the medium term are:
• to have a clear view of the future of the various segments of
the cable industry;
• to develop the skills and competences needed to meet future
challenges;
• to create intelligent product platforms from which completely
new product families can be generated;
• to stay focused on product and service improvements.
In addition, Draka has shifted the innovation focus to exploration
of external trends and closer cooperation with external partners.
This has created opportunities to develop cross-divisional coope-
ration throughout the company and established a reliable route
for the circulation of innovative ideas.
In 2010, Draka acknowledged the need to target R&D projects more
closely on future profitability. This is measured by calculating the
net present value of the estimated costs and benefits of each R&D
project and regularly recalculating the NPV during the course of the
project.
Going forward, Draka intends to maintain and increase the flow of
new ideas throughout the organisation. For example, as part of the
policy of fostering innovation in all sectors of the company, Draka
initiated an Innovation Award in 2009, through which it expresses its
gratitude to the most innovative individuals and/or teams within the
company. No fewer than 35 innovations qualified in 2010. From these,
a selection committee consisting of business leaders and scientific
staff within Draka chose the nine recipients of the Innovation Award.
Corporate social Responsibility strategy
Draka’s Corporate Social Responsibility (CSR) mission is simple and
straightforward. It’s a clear recognition that CSR should be fully in-
tegrated into Draka’s business model, enabling the company to take
a conscious and responsible approach towards its role in society.
Draka’s CSR strategy is based on four strategic goals:
• Encouraging eco solutions;
• Ensuring safety of cable solutions and Draka operations;
• Improving resource efficiency in all Draka business processes, and
• Caring for people in Draka’s environment.
These goals are the outcome of regular contact with various stake-
holders and the global commitment to sustainable performance.
Throughout the organisation, Draka has defined quantitative and
qualitative objectives to meet the strategic goals and to improve the
environmental and social performance of cable solutions, as well as
to introduce continuous improvements in the company’s processes.
Draka strives to:
• Execute safety leadership programmes for top management
and all operational leaders in safety;
• Manufacture cable solutions with reduced environmental
footprint, cable solutions for renewable energy markets
and smart cable systems for improved energy efficiency;
• Manufacture increasingly safe cable solutions for safety
in the supply chain;
• Continue with improvement programmes relating to resource
efficiency, and
• Increase transparency of HR and social performance data.
Specific environmental and social key performance indicators
(see also ‘Personnel and Organisation’):
KPI 2010 Target 2010 Target 2011
% ISO 14001-certified
production facilities 99% 100% 100%
tCO2 emissions 206,854 Local Local
targets targets
Kg CO2 emissions per Euro revenues 96 - Translate local
targets in
corporate target
OSHA Lost Work Time Accidents rate 1 1.9 2.0 1.5
Diversity According
% Female 19% - to local
% Male 81% - policies
Training hours per employee 18 - -
% Employees that received
performance review 61% - 70%
1 OSHA Lost Work Time Accident rate is an international accepted indicator which
relates the number of accidents resulting in work disability in the next shift to the
number of working hours per 100 employees.
The Draka website provides more information about the CSR per-
formance, such as an indicator table, the Global Reporting Initiative
reporting principles used, and a GRI matrix (www.draka.com/csr).

28 | Draka Holding Report of the Board of Management
CsR Governance
Final responsibility for Draka’s CSR strategy lies with the CEO.
The Corporate Manager Safety, Health and Environment (SHE)
is responsible for the execution. The Board of Management and the
Corporate Manager SHE regularly consult on CSR. In addition,
there is frequent contact between the Corporate Manager SHE and
local subsidiaries. The Corporate Manager SHE also has contact
with the other staff departments about CSR related topics. At
corporate level so-called ‘Champions’ have been identified to
take responsibility for the below-mentioned strategic CSR goals:
• Vice-President Technology & Development: ‘Encouraging eco
solutions’ and ‘Ensuring safety’;
• Corporate HR Director and Corporate Manager SHE: ‘Caring for
people’;
• Senior Vice President Operations: ‘Improving resource efficiency’.
Draka’s CsR model
Draka’s CSR strategy is expressed by the model shown above,
which maps out the journey towards sustainable performance, and
ultimately more stakeholder value. The Draka CSR model consists
of four strategic goals, integrated in every aspect of the value chain,
and driven by management, communication and innovation.
CsR drivers
Management: Focus on continuous improvement
Draka’s commitment to sustainable performance can be found in
all aspects of the value chain. Every aspect, from raw materials to
packaging, must comply with strict safety, health and environmen-
tal rules and regulations.
At the start of the value chain, in Sales & Marketing, close coope-
ration with customers results in solutions with long-term sustain-
ability that meet the customer’s needs while at the same time
increasing eco-efficiency. Together with R&D departments,
alternatives to existing products are developed, or new products
with lower environmental impact, by applying new materials,
secondary materials, designs and constructions.
Environmental and social standards are also increasingly inte-
grated into the company’s sourcing processes, most notably the
purcha sing of copper, tin, rubber, plastics and other raw materials.
The social and environmental aspects of the metal production
and waste handling require explicit attention in the sourcing
process and continuous communication with suppliers. For
example, Draka does not use copper from sensitive countries,
and critically reviews the supply chain for CSR-related issues.

Draka Holding | 29Report of the Board of Management
1 New companies receive time to meet the corporate standards.
Draka understands its obligations, as downstream user, regarding
regulated substances (ROHS, REACH) and takes any actions re-
quired to comply with these regulations. Additionally, efforts are
made to increase the amounts of purchased ‘green’ electricity
and self-generated renewable energy. From 2011, the Dutch plants
will only source electricity from renewable sources, and for several
years now the Nürnberg plant has been generating its own solar
electricity. Environmental and social standards have been inte gra-
ted in supplier contracts, and the goal is to further develop and
enforce supply chain CSR programmes in the coming five years.
Through the manufacturing processes, Draka creates a positive
relationship between the cables’ effectiveness and reduced environ-
mental impact. Manufacturing processes are therefore continuously
improved by focusing on efficient use of resources, and implement-
ing scrap reduction through re-use, sophisticated new manufac-
turing and recycling techniques and working methods.
Logistics is another focal area for the company. Draka is always look-
ing for ways to optimise logistics with innovations that contri bute to
lower CO2 emissions. In Europe an analysis of all forms of transpor-
tation used is the starting point for optimisation and reduction of
fuel consumption and costs. Optimisation and re-use of packaging
also receives constant attention, and has for example resulted in the
re-use of 59% of the optical fiber bobbins. In the coming years,
Draka will continue with improvement programmes relating to
resource efficiency in its operational excellence programme,
aimed at standardising operational processes across the group.
In recent years Draka has invested in the environmental mana-
gement systems of its production sites. Practically all production
sites1 are now ISO 14001 certified, and the goal for 2012 is that all
production facilities have a OHSAS 18001 certificate for safety and
health management. Some of the facilities had already achieved
this target by 2010, and others have certification programmes in
place. The company is proud to comply with these international
environmental standards and regulations, which enables Draka
to guarantee that internal environmental goals and objectives
are properly managed and implemented, and that the environ-
mental and social aspects of business processes are the subjects
of continuous improvement.
Communication: Interaction for future value
Through dialogue with internal and external stakeholders, Draka
is finding new ways of working that will help to create value for the
future. Close contact with customers is an important source of in-
spiration for innovation. By exchanging experience, knowledge and
ideas, Draka works to improve and develop sustainable solutions.
In discussions with customers, the goal is not only to advise on the
best cabling to use based on technical specifications, but also to
make recommendations which take environmental issues into
account.
Draka encourages employees to think of ways to integrate environ-
mental and social improvement opportunities in the development
and manufacturing of cable solutions. To this end, a platform has
been created for innovation and alternative thinking within the
company, sharing the knowledge that is needed to create sustain-
able technology. Furthermore, safety programmes are designed
to encourage employees to play an active role in the implemen-
tation, based on their own knowledge of safety needs. By increasing
individual perception of safety awareness and responsibility regula-
tions, every Draka employee has the opportunity to make a positive
contribution to the creation of a safer workplace.
On several occasions Draka entered into dialogue with NGO’s
on matters such as the mining of copper and tin. By questioning
suppliers, the company also encourages the use of working
methods with reduced environmental impact. Draka intends to
be among the front-runners in the industry in terms of CSR practices
and thought leadership, and is continuously talking to relevant ex-
ternal parties about leading CSR issues. Three Draka companies
are members of the United Nations Global Compact. Furthermore,
Draka has since 2007 been a participant in the Carbon Disclosure
Project and received recognition for its environmental efforts by
its inclusion in the CDP leadership index on transparency. Also,
Draka is a founding member of the association of the electrical and
electronic equipment supply chain in France. This PEP association
aims at standardisation of environmental product declarations
based on life cycle analysis investigation.
Innovation: A mindset for sustainable performance
Innovation is central to Draka’s CSR strategy, which rests on the firm
conviction that technological solutions for sustainable development
result from an innovative mindset. Draka works with customers,
suppliers and scientific partners to improve and develop sustainable
performance throughout the company. One of the initiatives rea-
lised in 2010 to promote an innovative mindset was the opening of
the Innovation Centre, an interactive showcase for innovations from
all parts of the organisation (see page 34). Furthermore, to highlight
the importance of innovation and to recognise the efforts of its
employees in creating an innovative workplace, Draka organises
the Innovation Awards competition. Environment and safety are
among the evaluation criteria. The awards are presented annually
to employees who have created the most outstanding product inno-
vations, new and different processes and cutting-edge services.
CsR goals
encouraging eco solutions
Translating environmental performance challenges over the cable
life cycle into new product opportunities is a priority for both cus-
tomers and Draka companies. Innovative cable solutions leading
to sustainable cable applications as well as economic synergies can
be expedited and supported in this way. Many Draka products con-
tribute to enhanced environmental performance, and the company
provides solutions for innovative markets such as renewable ener-
gy, fiber to the home and smart grids. Also, customers are provided
with the tools they need to evaluate the environmental performance
of cables. These tools are based on facts resulting from life cycle
analyses complying with international standards. Draka’s ambition
is to set targets and criteria for eco-design to better integrate
environmental aspects in the innovation process.

30 | Draka Holding Report of the Board of Management
1 OSHA Lost Work Time Accident rate is an international accepted indicator which
relates the number of accidents resulting in work disability in the next shift to the
number of working hours per 100 employees.
ensuring safety
Safety is of the utmost importance for everyone connected to the
company. The goal is to provide a safe environment for all those
who work at Draka’s sites and under its responsibility, as well as
those who work with Draka’s products.
The OSHA Lost Work Time Accident (LTA) rate1 has been defined
as key performance indicator (KPI), including targets for subse-
quent years since 2008. With the LTA rate of 1.9, the target of 2010,
2, was met. The target for 2011 is 1.5 and in 2012 Draka aims to be
stable below a LTA rate of 1. In 2011 more leading indicators for
safety performance will be introduced.
Customers using Draka’s cable solutions must also be assured of the
highest safety and health performance possible. Draka companies
produce cables for critical applications in fire protection, oil pipeline
safety, elevator and escalator safety to name but a few. R&D teams
are continuously seeking viable and sustainable alternatives for safe
cable solutions.
As well as providing cables that maximise safety in their application
areas, Draka also contributes to the safety campaigns of customers.
The objective is to increase the market volume of safety-related
cable solutions to ensure safety in the supply chain. Safety, in
short, is a top priority at Draka – for employees, customers and
end-users.
Improving resource efficiency
Efficient use of resources benefits not only the environment, but
also the financial bottom line. Draka has invested a great deal of
time and resources in environmentally enhanced production pro-
cesses. This results in reductions of raw material and scrap waste,
energy bills and carbon emissions. A key focal point is the efficient
use and re-use of input materials. Several cable solutions with bet-
ter environmental performance were introduced in 2010, such as
raw material input of cables for wind power turbines. Draka also
uses recycled input materials for the production of its cables. It is
generally known that copper, the main raw material, has a global
recycled rate of well over 80%. The recycled copper rate in cable
applications is not exactly known. In Sweden Draka participates
in a project with competitors and recycling companies to further
improve the recycled rate of cable waste and find new technologies
for the recycling of the plastics fraction, with a focus on the
recycling of cross-linked polyethylens.
Another goal for the coming years is to further reduce the direct
and indirect CO2 emissions of operations. The focus is on reducing
electricity consumption through increased efficiency of processes
and logistics and green energy sourcing.
Caring for people
The active involvement, professionalism and knowledge of
employees operating in a positive working climate are crucial
for the company’s success. Draka therefore actively promotes
the values and ethical behaviour embodied in its Code of Conduct.
Draka facilitates employability by creating equal opportunities
for personal development, and communication of company
and personal objectives in an open atmosphere. The company
encourages individual and team performance through recognition
and award schemes. In 2010, a new goal was set to be more
transparent about the results of the company’s people strategy,
by further increasing the transparency of HR performance data.
Draka reports on HR indicators such as diversity, training hours,
training costs, and percentage of employees who receive a
performance review for the first time this year. Draka-specific
objectives for these indicators will be developed in 2011 (see also
’Personnel and organisation’).
Personnel and organisation
Draka retains its leading position in the cable industry by paying
careful attention to the needs, responsibilities and aspirations of
the people employed at all levels of the organisation.
Personnel and organisation
Draka believes that the commitment, involvement and quality
of its personnel are key to the achievement of its corporate
objectives. Draka’s human resources strategy is therefore to
recruit new talent and develop, train, motivate and retain the
existing talent. This strategy is consistent with Draka’s core
values and code of conduct. Draka has launched several initiatives
in recent years to improve its human resources systems and pro-
cesses and will continue to develop them in the years ahead.
Restructuring and optimisation
One of Draka’s strategic principles is the continuing optimisation
of the organisation. To that end, Draka launched the Triple S
project in 2005, which aims at:
1) stopping production of cable products that do not enhance
the product mix;
2) swapping cable production within the divisions, in order to
achieve an portfolio of products created with maximum
efficiency in focused factories;
3) sharing best practices within and among divisions in fields
such as production, compounding, logistics and marketing.
The closure of three plants was completed in 2010. Plants were
closed in the Netherlands (Oudenbosch) and Sweden (Ystad)
following announcements made in the last quarter of 2009.
In January 2010, the closure of a plant in Norway (Årnes) was
announced, agreement subsequently being reached with all
the employees’ organisations concerned. The closure of these
plants has resulted in the loss of more than 200 jobs.
As well as cuts in the number of direct jobs at the plants, consi-
derable attention has also focused on optimizing the number
of indirect jobs (overhead) and further reductions have been
made. The measures taken started to benefit the operating
result in 2010 and will continue to contribute to the structural
improvement of Draka’s profitability in 2011.

Draka Holding | 31Report of the Board of Management
The restructuring projects are severely testing the organisation and
all Draka’s employees worldwide. The Board of Management takes
this opportunity to thank all concerned for the commitment they
have shown and their cooperation in the actions Draka has taken.
number of employees
As a result of all the actions referred to above, the average number
of full-time equivalents fell to 9,410 in 2010, down 6.5% compared
with 2009. The acquisition of Pressure Tube Manufacturing (USA)
led to an increase of 45 in the number of employees. The number
of employees at year-end 2010 was 9,377, an overall decrease of
2.3% compared with year-end 2009.
Long-term incentive plan
In 2010, Draka management was once again able to participate in
the long-term incentive plan introduced in 2002. Participation in the
plan means that Draka managers (excluding members of the Board
of Management, see ‘Remuneration report’ on page 64) can use
part of their net bonus to acquire Draka shares or Draka options.
Information on the number of shares or options allocated and at
what price can be found under ‘Share information’ on page 68.
Works Councils
Consistent with Draka’s belief that the active and positive involve-
ment of all its employees worldwide is a significant factor in the
achievement of its objectives, high priority was again given to inter-
nal communication in 2010. In connection with the plant closures
announced and the reduction in overheads, it was essential to in-
volve the workforce as closely as possible in the necessary changes
taking place within the organisation. Extra attention also had to be
paid to internal communication regarding the talks on a possible
combination with Italian cable producer Prysmian and the possible
bids by the French company Nexans and the Chinese company
Xinmao.
The formal staff representation bodies play a key role in com-
plementing the direct communication between company and
employee. Alongside the local Works Councils, Draka’s Central
Works Council and the European Works Council form an important
link between the Board of Management, the local management
teams and the employees in the different countries. Three plenary
meetings were held with the European Works Council in 2010 and
there was regular consultation in the interim with the Select
Committee on various matters, at which Draka’s financial results
and corporate objectives were discussed. The third, specially
convened meeting discussed the situation surrounding a possible
combination with Prysmian and the possible bid by Xinmao.
There was intensive consultation with the Central Works Council
relating to the Council’s formal recommendations on the possible
combination with Prysmian and the situation surrounding the
Xinmao bid. Clear agreements were ultimately arrived at between
the Central Works Council, the Draka Board of Management and the
Prysmian Executive Board concerning job continuity and ongoing
investment as well as the future R&D organisation and management
structure and worker participation during a future integration
exercise.
The Board of Management thanks all concerned for their contribu-
tions to constructive consultation in 2010.
Ambitions for 2011With the Prysmian merger going ahead, 2011 will be dominated
by the integration of Draka and Prysmian. Human Resources will
accordingly be concentrating on good internal communication and
also on retaining talent within the organisation. At the same time,
proper attention will continue to be paid to day-to-day operations
to safeguard continuity as far as possible.

32 | Draka Holding One century
One century
“ An eye to the future”, as the central theme
For the past century, Draka’s people have been going the extra mile to ensure customers benefit from durable, safe, innovative cable technology, tailored to their specific needs. Appropriately, the company’s 100th anniversary in 2010 was marked by the opening of the Innovation Centre, located on the same factory site in Amsterdam where the first cables were produced in 1910. After all, Draka’s sustained success is based not only on a strong heritage, but also on a future-oriented mindset.

Draka Holding | 33One century
An eye to the future
Draka has been growing and innovating for 100 years,
meeting economic developments and societal needs,
including the increasing demand for sustainable
solutions. It started in 1910 with the founding of the
Hollandsche Draad- en Kabelfabriek by Jan Teeuwis
Duyvis. He was inspired by the availability of metal
wire, together with a drastic fall in the price of elec-
tricity. Duyvis predicted that these developments
would lead to a strong increase in the demand for
electricity.
Innovative mindset
An eye to the future and a determination to set the
standard for reliable cabling has always formed the
basis for the company’s success. Throughout Draka’s
history, its people have nurtured the ability to adopt
fresh perspectives, taking a fresh look at customers’
needs and acting on these insights. This commitment
has led to unique cable technologies for applications
such as space rockets, luxury cars, the Airbus aircraft,
optical fiber networks and the London Underground.
Investing in breakthroughs
The step from metal wire to space rocket wiring
wasn’t taken in just one day. Daring to invest and
innovate in tough times has always been one of
Draka’s strengths. For example, even during the
difficult economic times of the 1930s Duyvis
con tinued to invest in Research & Development.
This led to important breakthroughs, like a new,
heat -resistant insulating material that improved
the safety and reliability of cables. Draka also
increased producti vity in its factory by introducing
the American Bedeaux system, which rewarded
workers for higher productivity.
turning challenges into opportunities
After the Second World War, Draka continued to turn
challenges into growth opportunities. When rubber
supplies were threatened by the decolonisation of the
1958Merger with the Nederlandsche Kabelfabriek (NKF).
In the 1970s, Draka’s guiding principle was the belief
that standing still means going backward. Continued
investments proved to be a catalyst for further growth.
1910Jan Teeuwis Duyvis founds the Neder-landsche Draad- en Kabelfabriek in Amsterdam North.
1919Record dividend: 68%. Employees are offered the opportunity to parti-cipate in the company.
1930Visit by Queen Wilhelmina to the Draka factory.
1942Draka is one of the first companies at which work is stopped to protest against the raids on Jews.
1954Production reaches 100,000 kilometres of cable.
Dutch East Indies, Draka invested in the development
of plastic insulating materials. The company became
a leading player in this market, with new and acquired
factories making a wide range of plastic products,
from garden hoses to the vinyl used to produce life
rafts. Draka also continued to anticipate develop-
ments in other areas. For example, before the start
of the European Economic Community, which led to
stronger foreign competition from 1958 onwards,
Draka announced a merger with the Nederlandsche
Kabelfabriek in 1957.
International markets
In the 1970s, Draka broadened its scope to include
international markets. Thanks to the initiative and
efforts of its people, new sales opportunities were
created and within just a few years the share of
exports increased from between 10 and 15% to almost
50%. After 1985, an ambitious strategy was adopted
aiming at worldwide growth through acquisitions.
With a balanced portfolio serving a range of indus-
tries, Draka reduced its sensitivity to variations in
the economic cycle and positioned itself at the fore-
front of new market segments like optical fiber. By
fostering close, international cooperation between
its people, across divisions, groups and countries,
Draka grew into a world leader that continues to
set new standards for reliable, sustainable cabling.

34 | Draka Holding One century
1969First computer enters service after an internal rebuilding.
1970Draka/NKF is acquired by Philips N.V. and becomes part of its Wire & Cable division.
1986 Draka again becomes independent, after a buy-out financed by Parcom and Flint Beheer.
1990Draka Kabel becomes Draka Holding.
1991Draka is listed on the Amsterdam Euronext Stock Exchange.
2010Draka has operations in more than 30 coun-tries and celebrates a century of innovation.
The Innovation Centre shows that
Draka is constantly innovating.
From cables bringing power to
households, right through to
innovative wiring for space rockets
and geothermal energy wells.
As part of its centenary celebrations in 2010, Draka
opened its Innovation Centre: an interactive showcase
for innovations from all parts of the organisation. The
centre, located on the Draka premises in Amsterdam,
consists of separate themed areas, dedicated to inno-
vations in sustainability, (fire) safety, data and energy
transport and faster cable production.
Customers can experience Draka innovations for
themselves in the Innovation Centre. It strengthens
the innovative image of Draka, and demonstrates
that the total organisation is more than the sum of
the parts. Jacques Blanc, Vice-President Technology
& Development, emphasises how important this is.
“Innovation has always been one of the core values of
Draka, but it hasn’t always been visible to customers.
They’re usually only familiar with the end-product
that they have ordered, and don’t realise the many
other things that Draka can offer.”
Additionally, the company’s own organisation also
benefits from the Innovation Centre, Jacques empha-
sises. It provides a great opportunity for the divisions
to share their knowledge and successes with each
other. “Since 2002 we’ve focused strongly on bringing
together ideas from the whole organisation. The
Innovation Centre proves that we are in fact One
Draka, and I hope it will inspire the groups, divisions
and countries to work together even more.”
The Innovation Centre
An interactive showcase of innovations

Draka Holding | 35Report of the groups
Report of the groups
energy & InfrastructureDraka Energy & Infrastructure comprises all low-voltage and medium-voltage cable
activities, including installation cable, instrumentation cable, fire-resistant cable and
halogen-free cable. The group designs, manufactures and sells a wide range of cable
products for residential, infrastructural, commercial and industrial applications.
Draka’s product portfolio covers all mechanical, electrical and environmental
requirements. The varied requirements have led to an outstanding range of customized
products and established Draka’s name as a specialist for challenging applications.
Draka is the third largest producer of low-voltage and special-purpose cable in Europe
and has a strong position in market niches elsewhere. The Energy & Infrastructure
group generates around 35% (or € 855 million in 2010) of Draka’s total revenues.
Industry & specialtyDraka Industry & Specialty is a diverse group that specializes in the development and
manufacture of innovative solutions. Its five divisions – Automotive & Aviation, Cableteq
USA, Elevator Products, Offshore and Renewable Energy – operate globally offering a
comprehensive range of products, services and applications. The products are used
just about everywhere: from aircraft and oil platforms to wind farms and elevators.
Every aspect of Industry & Specialty is focused on the customer. Solutions can be
based on logistics, project management, customer service, innovative new products
or simply doing what the customer expects and trusts Draka to do.
The Industry & Specialty group generates around 31% (or € 745 million in 2010) of
Draka’s total revenues.
CommunicationsDraka Communications is a global leader in optical fiber technology and cabling solutions
(telecommunications and data communications) for a great number of market segments.
The group serves the global markets for telecommunication and data communications
through four divisions – Telecom Solutions, Multimedia & Specials, Americas and Optical
Fiber – offering customers a complete product range. The Americas and Telecom
Solutions divisions are taken together in the review presented in this annual report.
Draka not only manufactures the exact cable required for the job, it also helps customers
identify their precise requirements and works with them to design a suitable solution.
Draka can also specify and source the required connectivity products, handle the
logistics and manage the implementation and testing of their network.
The Communications group generates around 34% (some € 830 million in 2010) of
Draka’s revenues.
Energy & Infrastructure
EuropeAsia-Pacific
Industry & Specialty
Automotive & AviationCableteq USA Elevator ProductsOffshoreRenewable Energy
Communications
Telecom SolutionsMultimedia & SpecialsOptical Fiber

36 | Draka Holding Draka Energy & Infrastructure
Financial results
Following the sharp decline in construction activity in 2009, market
conditions in 2010 were less challenging. Various geographical
markets in which the Energy & Infrastructure group operates
showed a slight recovery in demand. The ongoing competitive
market, however, led to slightly lower market prices, which had
a negative effect on operating margins. Despite this, the group
still achieved a satisfactory result, and the recovery seen in the
second six months bodes well for future profitability.
Results (x € million) 2010 2009
Revenues 1 854.0 694.4
Revenues at constant copper prices 1 782.9 750.8
Operating result 2 29.2 31.8
Operating margin as % of revenue 3 3.7% 4.2%
Capital expenditure 7.6 10.4
Depreciation and amortisation 17.9 17.3
1 Due to reclassification of (OEM) revenues as between Energy & Infrastructure and
Industry & Specialty, the revenues in 2009 have been restated to facilitate comparison
(€ 30.1 million positive).2 Excluding non-recurring items. There was a non-recurring charge of € 14.4 million
in 2010 relating to the closure of the plant in Ystad (Sweden) and other restructuring
exercises. Non-recurring items in 2009 were € 13.8 million negative.3 Operating result as a percentage of revenues at constant copper prices.
Energy & Infrastructure reported an 23.0% increase in revenue
in 2010, to € 854.0 million, mainly lifted by the higher average
copper prices passed on in sales (18.1 percentage points) and
gains on exchange (4.5 percentage points). Volume growth
amounted to 0.4% and was entirely seen in the second half
of the year.
Headlines in 2010
• In most European countries there was little or no growth but
the bottom appears to have been reached
• Recovery in most Asian markets over 2009 levels, with
increasing project activity
• Economic recovery in China has led the growth in other
Asian economies
• Volume-driven recovery in Energy & Infrastructure results
in second half year
• Efficiency and supply chain optimisation to further reduce
cost base and improve logistics performance
• Focus on service and support to strengthen partnerships
with wholesale channel
The Draka Energy & Infrastructure group consists of two divisions: Europe and Asia-Pacific. Energy & Infrastructure is responsible
for all low-voltage, instrumentation and signal cable activities. The group designs, manufactures and sells a wide range of cable
products, both standard and customer-specific, for residential, infrastructure, commercial and industrial applications. The portfolio
also includes medium-voltage utility cable.
Draka Energy & Infrastructure
“ The group achieved a satisfactory result, and the recovery seen in the second six months bodes well for future profitability.”
Ruud Majenburg, president Draka Energy & Infrastructure
The operating result, excluding non-recurring items, fell to
€ 29.2 million, compared with € 31.8 million in 2009, chiefly
owing to the slightly lower market prices resulting from the
continued competitiveness of the market. Both the further
improvement in the product mix and additional cost savings
boosted the result (approximately € 10 million) but were not
enough to compensate fully for the adverse effects. In the
second half, the operating result was up by 14.8% compared
with the corresponding period in 2009, representing an
improvement of 13.1% on the first six months of 2010.
€€€€ €€
€€€€ €€

Draka Holding | 37Draka Energy & Infrastructure
EuropeDivision
Products Low- and medium-voltage cables, ranging from medium voltage
power and installation to instrumentation and control cables
Market segments Construction (residential and commercial), industry,
infrastructure, electrical applications
Growth driver Construction market in general, investments by industry
and in infrastructure
Market position No. 3 in Europe
Establishments Belgium, Bulgaria, Czech Republic, Denmark, Estonia, Finland,
France, Hungary, Ireland, Italy, Latvia, Lithuania, Netherlands,
Norway, Poland, Romania, Russia, Slovakia, Spain, Sweden and UK
Employees Around 1,765
Customers Construction and installation companies, electrical
wholesalers such as Edmundson Electrical (UK),
Onninen (Finland), Rexel (France) and Sonepar (France)
Profile
The Europe division within the Energy & Infrastructure group
develops, produces and sells low- and medium-voltage cables.
The portfolio covers the entire range, from installation cables and
flexible PVC cables to instrumentation cables. The division also
produces special-purpose products such as halogen-free cable
with low smoke emissions and fire-resistant cable. With advanced
production facilities and local sales teams, the division operates
on the basis of the ‘global-for-local’ concept. The products are
distributed mainly via technical wholesalers. The division works
closely with these distribution houses in the fields of logistics
and other services. For example by means of engineering support
and training for sales teams and their customers (construction
and installation companies) it can provide added-value support
for installers.
Market developments
The division continues to feel the effects of the downturn, affecting
building and infrastructure projects. Successes were achieved with
products offering better margins together with a strong focus on
service and support. This allowed market share to be increased in
a number of countries. New building in Spain is still far below the
2006/2007 peak, with market overcapacity. The same applies to
industry and infrastructure, although the market has stabilised
with market share maintained or even increased. Business in
France benefited from the strong position in energy distribution,
with increased sales to EDF, utilities and contractors through local
distributors. This success is based on a dedicated portfolio with
new products such as lead-free low-voltage underground cables
plus strong customer service. The UK residential market has
reached a stable although low level, and despite strong competition
the position was maintained by focusing on areas with better
margins. Supplies continued for the major London Underground
upgrade project. The market in Ireland was flat, with very low
housing activity. However supplies to Dublin Airport were extended
by the addition of medium-voltage cables. The division maintained
its strong position in the Benelux, although the market was down
by 10-15% because of lower commercial and residential building
activity. Here too the market has now probably reached the low
point in the present cycle. In the Nordic region, where the effects
of the crisis differed from country to country, markets began to
show some improvement in the second half. The division benefited
from the slight upturn due to a strengthened position with key
wholesalers. The local sales teams established during 2009 in the
Eastern European countries are showing positive results, although
market conditions vary greatly between countries. Thanks to this
new approach, sales are gaining ground in both traditional and new
segments. The Baltic countries showed a somewhat better picture
with slight market growth and improvement of the division’s share.
Developments in the division
Efficiency optimisation efforts continued, resulting in further
cost reductions of around 8%. Closure of the Ystad (Sweden)
factory was completed in mid-2010, with production transferred
to other locations. Attention was given to supply chain optimisation
together with distributors to improve logistics performance. Late
order changes can always be expected, so excellent logistics are a
key distinguishing factor. The same applies to customer service in
partnership with wholesalers, for example with products cut to
length, labelled for time-saving installation and delivered on-site,
all within 24 hours. Innovations continue to play an important role,
for example the award-winning Clixys total solution with pre-as-
sembled sockets, connectors and switches developed with ABB.
Also important are low fire hazard, halogen-free cables developed
for the building industry. High flexibility simplifies the installer’s
work, for example with Evolution® which is successful on the
Spanish market. Further developments include improved aging
performance and UV resistance. A service innovation is ECO
Advice, an online design tool that supports designers and engi-
neers in saving energy, reducing CO2 emissions and cost. Customer
partnerships in the Netherlands were further strengthened by
visits to the Draka Innovation Centre, where some 1,500 installers
saw a wide range of developments (see also page 34). This formed
part of the efforts to strengthen wholesaler partnerships, including
marketing and logistics support, training and joint activities aimed
at installers. The company’s 100th anniversary in the Netherlands
was marked at SAIL Amsterdam, visited by well over 1,000 cus-
tomers. Similar wholesaler partnerships have been started in
Spain, with regional tours of distributors and joint installer training.
The success of customer collaboration in Nordic was underlined by
the Supplier of Year award in Norway from the biggest electrical
wholesaler Elektroskandia for the third year in a row. The division
aims to strengthen its market position in industrial installations like
power and (petro)chemical plants, with an international sales and
marketing organisation, a dedicated portfolio, improved logistics
cooperation and alignment of sales and operations.
Headlines in 2010
• Markets in most European countries showed little or no growth; bottom appears to have been reached
• Focus on service and support to strengthen partnerships with wholesale channel
• Efficiency and supply chain optimisation to further reduce cost base and improve logistics performance
Energy & infrastructureEuropeAsia-Pacific

38 | Draka Holding Draka Energy & Infrastructure
Asia-PacificDivision
Products Low-voltage cables, ranging from installation to instrumentation
and control cables
Market segments Construction, industrial, infrastructure and petrochemicals
Growth driver Construction market in general
Market position Market leader in Singapore and Hong Kong while growing in other
Asian countries
Establishments Australia, China, Hong Kong, Indonesia, Malaysia, Singapore,
Thailand and Vietnam
Employees Around 450
Customers Construction and installation companies, government authorities,
Engineering Procurement Contractors and wholesalers
Profile
The Asia Pacific division develops, produces and sells low-voltage
cables. The portfolio covers the entire range, from installation
cables and flexible PVC cables to instrumentation cables. The
division also produces special-purpose products such as fire
performance halogen-free cable with low smoke emissions and
the environment-friendly Alupac instrumentation cables. Its
advanced production facilities, local sales teams and excellent
logistics enable the division to effectively serve customers
throughout this large region. Most sales in Asia-Pacific are for
major commercial, industrial and infrastructural projects, either
directly to the customers concerned or through the partnerships
with major Mechanical and Electrical Contractors and Engineering
Procurement Contractors (EPCs) handling these contracts.
Market developments
Most markets in the region showed a cautious recovery in 2010,
and although cable supplies lag the economy by six to nine months
more project activity is now being seen. However industry over-
capacity remains an issue, and pressure on prices continues
even though sales have picked up somewhat. Overall many
projects are expected to start in the near future, for example
in areas such as urban mass transit, tunnels, railway and petro-
chemical expansion. The market in Australia was particularly
strong, led by high activity levels in energy and resources.
For example there have been sales successes in the oil & gas
industry, including a number of new LNG projects.
Recovery is also being seen in Indonesia, with growth at around
8-9% following the downturn in 2009. The same applies in
Malaysia, where project activity has benefited from continuing
investments by the government and private sector. The govern-
ment has initiated a 350 billion dollar Economic Transformation
Programme over the next 10 years, starting from 2011, to propel
Malaysia into a high income economy. Growth of around 4% was
seen in Thailand despite the country’s political turmoil, although
some major infrastructure projects have been delayed. Sales
there were at about the same level as in 2009, although margins
improved somewhat due to increased activity in communications
projects involving higher-margin products. As in other countries in
the region, strong activity was also seen in petrochemical projects.
Business in China was up from 2009, with strong support from
government spending on rail network upgrading and other
infrastructure projects. However this stimulus spending could
be withdrawn in the near future as the government seeks to
contain credit and achieve balanced growth. Building activity
continued at a high level, although this sector is subject to
intense price pressure for standard product types. Efforts
are therefore being made to target the industrial, infrastructure
and OEM markets with higher-margin products. The market in
Hong Kong was relatively stable with continued support from
the financial and tourism industries. Sales showed an upturn in
the second half of the year in both the building and infrastructure
sectors. Work on the long delayed casino project in Macao has
now restarted, with cable supplies expected to resume in the
near future.
Developments in the division
The new factory in Malaysia was officially opened in February
2010 and is now fully operational, providing valuable extra capa-
city in time for the emerging economic recovery across the region.
This is the division’s largest Asia-Pacific facility, and produces
mainly instrumentation and control cables for Malaysia, Singapore
and export markets. Overall, production is returning to full 3-shift
operation, following the cutbacks in late 2009. Increases in the
numbers of production staff are planned for the first quarter
of 2011 as new projects start to come on-stream. The former
joint venture in India has now been taken over completely under
Draka management, as part of the plans to expand operations
and benefit from the booming market in India. Growth is strong
across the board, but especially in the oil & gas industry. As in
other markets emphasis is being placed on innovative, higher-
margin products in which the division has a unique position,
for example field bus cables for control and instrumen tation
appli cations. The present efforts to gain a strong position in
India are expected to pay dividends particularly in the coming
years because of the country’s continuing strong economic
growth. In Vietnam plans are being made to upgrade the present
representative office to a full Foreign Investment Enterprise
in 2011. This is to allow sales and marketing activities directly
instead of only through agents as at present. In the meantime
contacts with customers and consultants are being streng -
th ened, and efforts are being made to gain a presence in
some of the high profile projects scheduled in Vietnam.
Headlines in 2010
• Recovery in most Asian markets over 2009 levels, with increasing project activity
• Economic recovery in China has led the growth in Asia’s economies
• Business in Malaysia up thanks to government spending; petrochemical and infrastructure activities at a high level
Energy & infrastructureEuropeAsia-Pacific

Draka Holding | 39Draka Industry & Specialty
Headlines in 2010
• Industry & Specialty’s profitability was under pressure from
lower results, especially from Elevator Products in the first
six months; strong profit recovery for Industry & Specialty in
second half
• Automotive & Aviation profited from strong growth in the
automotive sector
• Acquisition of PTM, a specialised tubing manufacturer,
strengthens position in global oil and gas industry and lifted
results at Cableteq USA
• Elevator Products benefits from continuing growth of Chinese
market
• Offshore profiting from orders in Europe for offshore wind
farms and wave and tidal energy projects
• Prospects for Renewable Energy improving after downturns in
2009 and first six months of 2010
The Industry & Specialty group consists of five divisions: Automotive & Aviation, Cableteq USA, Elevator Products, Offshore
and Renewable Energy. Industry & Specialty encompasses a broad range of activities and specializes in the development and
production of innovative solutions for a global customer base. The five divisions are active worldwide with an extensive portfolio
of products and services for many applications. Draka products can be found in planes and cars, on cruise ships and naval
vessels, on oil platforms and in wind turbines, mines, construction equipment and elevators, to mention just a few examples.
Draka Industry & Specialty
Financial results
After a difficult first half, with profits under considerable pres-
sure, the Industry & Specialty group benefited from improved
market conditions in the second six months, especially for the
Automotive & Aviation, Cableteq USA and Renewable Energy
divisions.
Results (x € million) 2010 2009
Revenues 1 744.5 617.7
Revenues at constant copper prices 1 703.9 665.8
Operating result 2 28.2 33.4
Operating margin as % of revenue 3 4.0% 5.0%
Capital expenditure 7.9 20.2
Depreciation and amortisation 15.7 15.5
1 Reclassification of OEM revenue from Industry & Specialty to Energy & Infrastructure.
For comparison purposes, the 2009 figure has been restated (reduction of € 30.1 million).2 Excluding non-recurring items. There was a non-recurring charge of € 12.4 million in 2010
relating to the closure of the plant in Ystad (Sweden) and other restructurings.
Non-recurring items in 2009 were € 31.6 million negative.3 Operating result as a percentage of revenue at constant copper prices.
Industry & Specialty group revenues in 2010 were up by 20.5%,
at € 744.5 million, mainly on the back of the higher average cop-
per prices passed on in sales (14.2 percentage points) and gains
on exchange (4.6 percentage points). Volume growth amounted
to 0.4% and was mainly driven by demand for automotive cable,
cable for wind turbines and specialty cables. The acquisition of
PTM (USA) contributed 1.3 percentage points to the revenues.
“ The group benefited from improved market conditions in the second six months, especially for the Automotive & Aviation, Cableteq USA and Renewable Energy divisions.”
André Surchat, president Draka Industry & Specialty
€€€€ €€
€€€€ €€
The operating result, excluding non-recurring items, was down
15.6%, at € 28.2 million. With the exception of Automotive &
Aviation and Cableteq USA, all divisions reported lower results.
There has, however, been an underlying improvement in results
since Q2 2010, driven by volume growth. The cost savings came
in at approximately € 9 million.

40 | Draka Holding Draka Industry & Specialty
Profile
The Automotive & Aviation division covers all cable product
activities related to the ‘people-moving’ industry. This primarily
involves cables for applications in passenger cars, commercial
vehicles and aircraft. The product portfolio, with an extensive
range of client-specific products, meets all mechanical, electrical
and environmental requirements. The division’s long experience
and proven competencies are reflected in various patents. In the
fields of material development and cable design, the research
teams are valued partners in OEM development centres, system
suppliers and harness makers. The division’s international struc-
ture is consistent with the global organisation of the automotive
industry, and with the increasingly global trend in aerospace.
Market developments Automotive
Strong demand in emerging markets and inventory replenishment
are responsible for the strong growth of automotive production
in 2010, eclipsing the 2007 pre-crisis high point. Rebalancing
inventory as car manufacturers cut back aggressively in the first
half of 2009 and strong performance of the BRIC countries (Brazil,
Russia, India and China) drove recovery in 2010. In contrast to the
industry’s last peak in 2007, when BRIC countries accounted for
19% of global output, these markets accounted for over 30% of
global automotive assembly estimated at 70 million units in 2010.
In the developed economies government incentives and scrappage
schemes implemented during 2009 ended in all major markets,
and had limited impact in 2010. The trend is towards smaller cars
in emerging markets and increased functionalities in the developed
markets. The global industry continues to pursue higher fuel effi-
ciency, weight reduction and new technologies, primarily hybrid,
electric and fuel cell.
Developments in the division Automotive
The division is working to strengthen its position by rethinking the
customer and product portfolio. An extensive analysis was imple-
mented to review the manufacturing locations to provide better
long-term customer support. Cost-saving measures to address
the 2009 crisis were implemented to improve competitive
strength. A plan to optimise fixed asset utilisation was implemented
to support growing markets, for example by expanding capacity
in Mexico. Customers are increasingly seeking localisation, better
value solutions and lower risk, with globally standardised products
and suppliers with a proven track record. The division is well placed
to meet these demands with its broad base of technology and
application knowledge. The same applies to the shift from North
American to European automotive specifications, for example
metric wires. Specific innovation areas are small-cross-section
wires, halogen-free cables, lightweight aluminium cables and spe-
cialty automotive cables for power distribution at higher voltages.
Market developments Aerospace
Aviation business is back to growth since mid-2010 after the crisis
starting a year earlier. For example Airbus forecasts 34 A320
aircraft per month, increasing to 40 during 2011. Airbus also has
a substantial order book up to 2012 and 2013, which provides a
useful buffer. However the rest of the aviation and aerospace
business is still at a low level. The competitive position towards
Boeing is adversely affected by the largely euro cost base,
although this is expected to improve with the ramp-up of the
Durango facility in Mexico.
Defence sales are declining because of budget cuts by major
countries such as Germany and the UK. European projects such
as Eurofighter, Rafale and military helicopters have not gained
significant export orders and volumes are low. However the
downturn in defence sales is partly compensated by the good
commercial business, which involves much larger cable volumes.
Developments in the division Aerospace
Ramp-up of the new Durango facility in Mexico will continue during
2011 and 2012 with the intention of handling most of the ‘high
runner’ products. This plant benefits from dollar-based production
together with low labour costs, and is close to the main customer
Labinal in Chihuahua, which is a major Tier 1 supplier to Aerospace
including Airbus. An opportunity for business with Boeing may
arise in new in-flight entertainment systems, which require specific
high-speed copper and fiber-based data cables. Efforts are being
made to leverage Draka’s fiber knowledge and innovative products
such as the Bendbright bend-insensitive fiber, which is an advan-
tage in this field.
Efficiency-optimising measures continued in 2010, focusing mainly
on restructuring and downsizing of manufacturing in France. The
aim is to concentrate all high-end products at this location, such as
data communication, fire-resistant and other special cables, with
the high volume products gradually being transferred to Durango.
Headlines in 2010
• Strong growth of automotive production; BRIC countries now account for over 30% of global assembly
• Aviation sector back to growth after one year of crisis; commercial aircraft volumes up but defence sales at low level
• Progressive ramp-up of Durango facility in Mexico; dollar-based production will strengthen competitive position on North American market
Automotive & AviationDivision
Industry & specialtyAutomotive & AviationCableteq USA Elevator ProductsOffshoreRenewable Energy
Products Cables and wires for applications in cars, trucks, aircraft,
helicopters, launchers and satellites
Market segments Automotive, truck and aerospace markets
Growth driver Production in the automotive, truck, aircraft and aerospace
industries; additionally, the functionality drive in cars,
trucks and aircraft
Market position European market leader for special automotive cables and one
of the largest suppliers to the North American automotive
market; second supplier to the European aerospace industry
Establishments China, Czech Republic, France, Germany, Mexico and Philippines
Employees Around 900
Customers Automotive Tier 1 harness suppliers such as Yazaki (Japan),
Lear (USA), Delphi (USA), and Dräxlmaier (Germany); Airbus,
Eurocopter (France/Germany), Asstrium, Eurofighter, Dassault,
Labinal, Latelec and Fokker for aerospace cable

Draka Holding | 41Draka Industry & Specialty
Profile
Draka Cableteq USA provides innovative custom-engineered wire,
fluid and fiber conductor solutions to a wide range of markets
including industrial, defence, medical, water, utility, fire protection,
roadway & runway lighting, transit, mining, crane and material
handling, and for oil & gas exploration & production.
60% of products are custom-engineered for harsh environmental
or high performance specifications. These include cables that
operate without failure for extended periods of time in harsh
environments such as sulphuric acid and oxidizing gas mixtures,
1,000°C fires, deep underground or on containers of molten
steel and in naval warfare.
The division provides customers with comprehensive, end-to-end
solutions, based on a full range of power, control, signal, fiber
optic and instrumentation cables, 2-hour fire rated emergency
cable, corrosion resistant small-diameter alloy tubing and specialty
silicone rubber compounds. Draka Cableteq USA offers customers
in-depth knowledge of virtually all applications, and has extensive
testing and validation facilities to ensure that custom designs meet
the required quality and performance specifications.
Market developments
The diversified and specialised markets served by Draka Cableteq
USA again helped it to maintain a stable performance, while the
strong focus on specialty and custom engineered products allowed
margins to be maintained at a good level.
Business in the oil & gas sector was good, and benefited from
the acquisition in the first half of the year of Pressure Tube Manu-
facturing (PTM) in New Jersey, which supplies corrosion-resistant
tubing. Exploration and production were positively affected by the
improving outlook in these markets and the introduction of specia-
lised small-diameter tubing for chemical injection into gas wells.
Sales of specialised metal tube encapsulated sensing cables used to
monitor conditions in oil wells and geothermal reservoirs improved
with new product introductions for hotter and deeper wells.
The water market began to recover to sustainable levels, driven
by concern about worldwide droughts and regional crop failures.
Mining saw recovery in the Czech Republic, Russia and Australia.
The utilities market was affected as regional investor-owned utilities
scaled back new construction in the face of a drop in demand for
electricity, and as new competitors entered the markets.
The defence market is showing signs of softening, with layoffs
announced at Boeing, Raytheon and Lockheed Martin. However
increasing market share in defence fiber optic products partially
covered the decline in projects in 2010. The crane market was
impacted by the global shipping slowdown, but is now showing
signs of recovery.
Mass transit and subways are benefiting from government stimulus
programmes, with major projects in New York City involving
trackside power, control, instrumentation and fiber cables. Further
major projects in this market are expected in 2011. Another positive
niche market is special lighting for roadways and airports, with
government spending continuing in 2011. Fire protection cables are
used for systems such as alarms, fans and pumps whose functions
must be assured in emergencies. Fire protection cable sales for new
commercial construction projects were down sharply this year,
although growth is anticipated in new applications areas such
as tunnels and fire-hardened elevator refits.
Developments in the division
The cost-reduction and efficiency programmes initiated in 2008
and 2009 were continued, with a shift in emphasis during 2010
to continuous improvement projects. The emphasis in 2011 will
be on organic growth to capture global opportunities, aiming to
take advantage of the efficiency and productivity gains that have
now been realised.
In marketing, the focus is now on global niche opportunities for
specialty compounds, corrosion-resistant tubing, and high per -
for mance fiber cable. New products developed under the US
Department of Energy grant for high temperature, hydrogen-
resistant fiber, and copper cables, developed in conjunction with
the Communications group, are now being brought to market.
Innovation is regarded as core to the division’s business, with a
25% product turnover rate every four years, and is constantly
being emphasised to provide unique solutions for specialized
application demands.
Cableteq USADivision
Industry & specialtyAutomotive & AviationCableteq USA Elevator ProductsOffshoreRenewable Energy
Headlines in 2010
• Acquisition of specialty tubing company PTM strengthened position in global oil & gas exploration and production
• Market downturn and price erosion largely compensated by stable sales and margins in unaffected sectors
• Infrastructure-related markets benefited from government stimulus programmes
Products Specialty composite cables consisting of copper, tubing and fiber
conductors, low- and medium-voltage cables, ranging from power
and control, signal and instrumentation cables; corrosion-
resistant specialty tubing; and specialty silicone rubber
compounds employing nanotechnologies
Market segments Defence, industry, energy, infrastructure, mining, water
management, and construction (commercial and industrial)
Market position Top 3 position in market niches in USA
Establishments USA (Massachusetts, New Jersey, Pennsylvania, North Carolina),
Canada, Brazil, Germany
Employees Around 450
Customers OEMs such as Reinke and Valmont for irrigation systems,
major global seaports for material handling, Schlumberger
within the oil & gas industry, local government for fire-resistant
cable, transit systems, roadway and runway lighting and defence
industryGrowth drivers Global basic needs such as food, water, energy and security: Invest-
ments in infrastructure and energy, oil & gas exploration and produc-
tion, water & agriculture, defence & security, resource extraction

42 | Draka Holding Draka Industry & Specialty
Profile
Elevator Products offers the global lift and escalator industry a
growing range of products and special services aimed at the
highest level of customer satisfaction with the widest reach of
distribution in the industry. The division distributes more than
30,000 parts and components for all international lift and escala-
tor companies. In addition to lift cables and cable accessories the
product line consists of lift and escalator components and systems
that include wire rope, electrical items, specialty electronics and
replacement parts. Key to the division’s success is its ability to
offer ‘parts kitting’ to manufacturers and installers of lifts and
escalators. Customers can also rely on support and advice from
expert and committed engineers for installation, maintenance,
new product development and repair work.
Market developments
With the exception of China, sales in all regions were flat in 2010
and remained at or near the 2009 levels. In Europe project activity
was low because of the depressed new building market, while in
the USA business was stable but still at a low level. However some
growth was seen in Brazil, where building and renovation activity
is picking up. The picture in China continued last year’s positive
trend, with growth maintained and even increasing slightly.
Maintenance and renovation activity in particular is expected
to continue this growth trend, with large numbers of high-rise
buildings there that will require modernisation in the coming
years.
Overall, to counter the economic slowdown in new elevator
construction the division is shifting its focus to this aftermarket
business, which formerly only accounted for 20% of the total
business volume but is now at around 50%. In the USA the new
over-the-counter retail operations started in 2009 in New York
City, Los Angeles, Chicago and Houston have proved to be a
success, offering installers and contractors a fast, walk-in service
for all the replacement parts and kits they need. This new concept
is enabling the division to maintain a good level of business in a
difficult market, and even to win market share from competitors.
One of today’s biggest challenges is the trend among major OEMs
to cut back on their purchasing programmes in today’s difficult
market conditions. To combat this trend and defend sales, the
‘visible price model’ has been introduced. This gives OEMs a
transparent price calculation that clearly shows the benefits of
sourcing their components and subsystems from Draka, rather
than going back to in-house production. Thanks to this informa-
tion, some success has been booked in retaining this business.
New business was also gained with the new rope brake introduced
in 2009 in the USA, which has been well received in the market.
Developments in the division
In Europe the operations were restructured in 2010 to build
further on the earlier cost-saving measures. The European ope-
rations were consolidated and moved to a new and larger facility
in Milan, with reduced total numbers of employees but higher
efficiency to prepare the organisation for a market upturn. The
over-the-counter retail model first introduced in the USA has now
also been rolled out in China to benefit from the demand for new
and replacement parts and kits which is expected to show strong
growth in the coming years. Further investments in China are
planned for 2011 to increase production capacity and strengthen
customer service, for example with new distribution centres in
the northern and southern regions. China is also becoming
increasingly important as major European OEMs such as Kone
and Schindler relocate their purchasing operations to China. To
maintain the positions with these OEMs the division has assigned
key account managers, to work with them and develop a single
global sourcing concept. This takes maximum advantage of
Draka’s global footprint, allowing customers to conveniently
source the same products at all their production locations
around the world.
To increase both customer service capacity and efficiency
in Brazil the new facilities in São Paulo and Londrina offer
over- the-counter retail sales to provide installers with a quick,
convenient service for spare parts and kits.
Elevator ProductsDivision
Industry & specialtyAutomotive & AviationCableteq USA Elevator ProductsOffshoreRenewable Energy
Headlines in 2010
• Business in Europe and USA flat; remains at or near second half 2009 levels
• Growth trend continues in China; strong demand from high-rise modernisation and renovation projects expected in coming years
• MRO business grows to 50% of total; over-the-counter retail operations rolled-out in China and Brazil following success in USA
Products Wide range of products for the lift and escalator industry
Market segments Lift and escalator industry
Growth driver Construction market in general, including maintenance and repair
of lifts and escalators
Market position Global presence; no. 1 in USA, strong in Europe and growing in Asia
Establishments Brazil, China, Czech Republic, Hong Kong, Italy, Malaysia,
Netherlands, Singapore, Spain and USA
Employees Around 650
Customers Lift manufacturers such as Kone (Finland), Otis (USA),
Schindler (Switzerland) and ThyssenKrupp (Germany)

Draka Holding | 43Draka Industry & Specialty
Profile
The division offers advanced, cost-effective cable solutions for the
shipbuilding, oil & gas and offshore renewable energy industries.
These solutions meet strict industry safety standards and ensure
that vessels and drilling rigs can be used reliably for long periods.
The division’s products include halogenfree, flame-retardant
cables with excellent physical and electrical properties, including
resistance to fire, dust, oil, wear and tear and (petro-) chemicals.
Flexible, rubber-insulated cables are produced to international
specifications and customer-specific designs for power, control
and instrumentation applications. During 2010 Draka Offshore
launched its own line of accessories and assemblies adding value
to its product portfolio. In addition, the product portfolio for
offshore wind farm and oil & gas applications has been completed
by the addition of medium-voltage subsea cables, accessories and
systems.
Market developments
The level of business varied greatly in the division’s three sectors:
marine, oil & gas and offshore renewable. Business in the marine
sector remained depressed, with most shipbuilding activity
currently taking place in China and Korea. Many new shipbuilding
projects have been postponed or cancelled awaiting an upturn in
the global economy.
In the oil & gas sector, new construction or conversion projects
remained at around the same relatively low level as in 2009.
However MRO (maintenance, repair and overhaul) activity was
somewhat stronger under the influence of the rebound in oil prices
during 2010. The new range of engineered cable packages com-
plete with connectors and terminations was well received. Draka
is regarded as technical leader in this market, and the benefits of
this new value-added product line are expected to be felt in 2011.
Subsea cable sales were still well below earlier expectations.
However the offshore wind energy market showed some recovery
following last year’s strong downturn, which saw some projects
delayed because of financing difficulties. Signs are positive for a
continuing recovery in 2011 and the following years. Plans are now
under way for major offshore wind farm projects to be realised in
the coming three to four years, for example in Belgium, Germany,
the Netherlands and the UK. Draka has already secured three
major orders for offshore wind farms and has been selected as
cable development partner for a fourth project. The increasing
activity level is driven by better availability of financing, govern-
ment stimulation programmes and better rates paid for the power
generated, together with international treaties to reduce the
carbon emissions associated with fossil fuels.
Developments in the division
The marine activities are currently subject to an ongoing restruc-
turing programme to increase their competitiveness against the
background of the continuing depressed level of business in this
sector. In both the oil & gas and subsea sectors work continued on
rolling-out the division’s business model of value-added products
and services that contribute to reduced equipment downtime and
time-saving installation. The subsea products for the renewable
energy grid include highly engineered cables and systems with
connectors, terminations and other accessories. Draka’s design
and engineering skills are valuable assets as products usually have
to be customised for specific applications. Similar developments
have been made in the oil & gas sector with fully terminated cables
ready for fast ‘drop-in’ fitting, such as those for drilling rig service
and repairs. Time savings are vital in this market due to the very
high leasing costs of drilling rigs and the costs of lost production.
In this area the Offshore division is able to offer complete technical
expertise to users by drawing on the resources of the other Draka
divisions.
A major recent investment was the expansion of the factory in
Drammen, Norway, which was completed in late 2009. This plant
is now capable of supplying long lengths of cable for the offshore
renewable grid market, with direct load-out of cable onto laying
vessels. These cables, which also include optical fiber units, are
used to interconnect the turbines to the transformer platform.
OffshoreDivision
Industry & specialtyAutomotive & AviationCableteq USA Elevator ProductsOffshoreRenewable Energy
Headlines in 2010
• Marine business still depressed as shipping market awaits global upturn
• MRO activity in oil & gas sector stronger as oil price rebounds; new construction and conversion projects still at a low level
• Offshore drilling in the Gulf of Mexico halted due to the BP disaster
• Offshore wind farm installations affected by recession; large orders secured for offshore wind farms and wave and tidal installation in Europe
Products Flexible, rubber- and plastic-insulated low- and medium-voltage
cables according to most relevant international standards,
client-specific designs and strict industry standards; subsea
cables; cable accessories and systems
Market segments Oil & gas industry; marine; offshore renewable energy
Growth driver Investments and maintenance by oil industry; investments in wind
farms, wave and tidal installations; investments in ships
Market position No. 2 in Europe in oil & gas, prominent in North America and Far
East; no. 3 in Europe in subsea cables
Establishments Brazil, China, Netherlands, Norway, Russia, Scotland, Singapore
and USA
Employees Around 300
Customers Oil & gas offshore industry; shipyards and ship owners; public
utilities, private developers

44 | Draka Holding Draka Industry & Specialty
Profile
The division offers advanced, cost-effective cable solutions that
include halogen-free, flame-retardant cables with excellent
physical and electrical properties, including resistance to fire,
dust, oil, wear and tear and (petro-)chemicals. Flexible, rubber-
insulated cables are produced to international specifications and
customer-specific designs, mainly for low- and medium-voltage
applications in wind turbines and photovoltaic plants.
Market developments
Following financing delays experienced in 2009 many new wind
farm projects are now starting to be realised around the world,
and as market leader in wind turbine internal cables Draka is
starting to benefit from this growth. At 5 to 10% growth is below
earlier expectations, but still shows a positive overall picture.
The major European turbine OEMs have strong order books, and
growth is expected to increase further in the coming years. The
downturn has in many cases led to a reappraisal of the financial
viability of proposed new projects, and ‘bankability’ has become
a more important criterion than ever. Draka’s proven expertise
and in many cases unique products enable the division to maintain
its strong position with the OEMs. Asian players are also starting
to enter the export market for wind turbines, including Chinese
state-owned companies, and Draka’s global strategy with a local
presence in the region is a good fit for the needs of these new
customers. In the Americas growth is strong in Brazil, with major
government-funded programmes, although wind farm activity in
the USA is below expectations due partly to the current low price
of natural gas.
Exceptional growth continued in the solar power market, for
example with major projects in Central Europe based on strong
government support to meet the European goal of 20% renewable
energy by 2020. German governmental support by the well-known
Energy Feed-in Law continued in 2010, although the price level
for renewable energy will be reduced progressively in the coming
years to maintain the balance with cost reduction of the techno-
logy. Solar power is currently receiving a lot of attention in China
as the main players in the market have established large, modern
manufacturing facilities. Overall growth is currently in the range
of 20-30% per year as solar energy becomes a mature technology.
As well as rooftop installations, the trend is to larger photovoltaic
farms directly integrated in the MV power grid.
Developments in the division
The ongoing programme of cost-reduction measures was contin-
ued, for example with attention to the compounding processes in
which significant savings have been made. New product introduc-
tions and innovations are continuing in the wind turbine field, and
the division is now able to offer a complete portfolio of wind turbine
internals. This includes a new LED-based lighting system used
during maintenance activities, which is easy to install and offers
significant cost savings. The system’s robust construction increas-
es reliability and eliminates the former problem of lamps breaking
during transport to the tower site. The range also includes service
lifts which OEMs can easily integrate in their designs. In the photo-
voltaic field a major development is a new collection and distribu-
tion system with cables that are ready for use with connectors
allowing simpler, time-saving installation on site.
Renewable EnergyDivision
Industry & specialtyAutomotive & AviationCableteq USA Elevator ProductsOffshoreRenewable Energy
Headlines in 2010
• Wind farm activity stabilised after downturn and postponements in 2009; growth around 15 to 20% foreseen for the coming years
• Exceptionally strong growth in solar energy activities, with major projects in Central Europe based on strong government support and CO2
reduction targets
• Continued focus on complete product range of wind turbine internals, including value-added concept with ready-to-fit cable sets and tower internals
Products Wind turbine cables, cable sets and tower internals, cables
for connection of solar power photovoltaic modules for
greenfield and rooftop installations, and installation services
for solar power plants
Market segments Wind and solar power business
Growth driver Investments in renewable energy, particularly wind and solar
power plants
Market position Global market leader in cables for wind turbines
Establishments Australia, Brazil, China, Denmark, Germany, Netherlands,
Spain and USA
Employees Around 750
Customers Industrial equipment manufacturers such as wind turbine
manufacturers, tower manufacturers, distributors and installers
of photovoltaic equipment and project developers of solar
power plants

Draka Holding | 45Draka Communications
The Communications group consists of four divisions: Telecom Solutions, Multimedia & Specials, Americas and Optical Fiber. Draka
Communications is the world leader in optical fiber technology and cable solutions (telecommunication and data communication)
in many market segments. The group’s market-driven cable solutions include innovative applications and project management
services and expertise for broadband and mobile network infrastructures. The Americas and Telecom Solutions divisions are taken
together in this review of the group’s performance in 2010.
Draka Communications
Headlines in 2010
• Strong performance by Communications, thanks
to continuing strong demand for optical fiber, data
communication cable and rigorous cost cutting
• Recovery in level of investment by telecom companies
in Europe in second half year, following financial stimulus
by governments and EU
• Strong sales figures and growing market share for high-
end data communication cables in France and Germany
• Demand for optical fiber declined slightly in China (after
explosive growth in 2009) but effect offset by strong
sales figures in Europe and North America
• Strong demand for high-end optical fiber products for
enterprise networks and data centres
Financial results
Communications results increased sharply, thanks in part to the
improved market conditions in Europe, the group’s most impor-
tant market, and the strong performance of Draka’s joint ven-
tures in China and Brazil. The implemented cost savings also
contributed to the good performance.
Results (x € million) 2010 2009
Revenues 829.3 736.2
Revenues at constant copper prices 812.7 751.2
Operating result 1 45.2 26.7
Operating margin as % of revenue 2 5.6% 3.6%
Capital expenditure 23.1 10.8
Depreciation and amortisation 28.2 29.3
1 Excluding non-recurring items. There was a non-recurring charge of € 22.3 million in 2010
relating to the closure of the plant in Årnes (Norway) and to various efficiency projects.
Non-recurring items in 2009 amounted to € 17.7 million negative.2 Operating result as a percentage of revenues at constant copper prices.
The Communications group generated revenue growth of 12.6%,
to € 829.3 million in 2010. This increase is attributable to volume
growth (9.5 percentage points), the effect of the increased price
of copper passed on in sales (3.7 percentage points) and gains
on exchange (4.0 percentage points). The sale of the OPGW
activities in Germany (June 2009) and Draka Comteq SDGI Co
Ltd in China (55%) in December 2009 had the effect of
depressing revenue by 4.6 percentage points.
“ Results of the group improved sharply in 2010 thanks in part to the improved market conditions in Europe and additional cost savings.”
Phil Edwards, president Draka Communications
The operating result came in at € 45.2 million, an increase
of 69.3% compared with 2009. The increase was driven by
volume growth, chiefly in the Optical Fiber division, additional
cost savings (approximately € 11 million) and the good progress
made by Draka’s joint ventures in China and Brazil. Set against
that, the pressure on selling prices remained as high as ever.
€€€€ €€
€€€€ €€

46 | Draka Holding Draka Communications
Profile
Within the telecommunications market segment, Draka
Communications concentrates on copper and indoor and outdoor
optical fiber cable solutions, project services and turnkey solutions.
Its solutions for large and small networks enable the growing
demand for greater bandwidth to be met, while it also provides
long distance cables for telecommunication networks. Apart from
the development, production and delivery of cable solutions,
Draka Communications concentrates on the realisation of complete
network projects in partnership with installation companies.
Experienced project managers, engineers and support workers
take responsibility for the design, engineering or even manage-
ment of the complete installation or expansion of telecommuni-
cation networks.
Market developments
Investments in the European telecom market picked up strongly
in the second half of 2010, after a slow start in the first half. Much
of the strong order intake was due to government- or EU-funded
programs. These led to accelerated investment programmes,
for example with new FTTH projects in a number of countries
such as France, Spain and Portugal. In France business benefited
from the government plan to ensure nationwide 100 MB/s network
coverage within 10 years. This led to an overall increase in orders,
especially from Free and France Telecom. Europe-wide, the
recommendation on third-party competitive access to high-speed
broadband networks under the EU’s Digital Agenda are leading to
increased investments, especially in premium, high-fiber-count
cables which can command higher fees for capacity rental. This
effect is supported by the emerging economic recovery, and with
it better availability of financing.
In the USA fiber sales showed a modest increase, but are not yet
back to the pre-downturn level of 2008. The main growth driver
is rural projects under the government’s stimulus programmes.
Aimed specifically at the smaller operators, these investments
are designed to drive fiber deeper into the network footprints
and should sustain growth over the next few years. After that
investments are expected to continue, for example in private
network infrastructure for 3G/4G expansion projects. Another
growth driver is the trend to network sharing, with networks
being built specifically for rental of capacity. Growth in Brazil
was far stronger than in the USA, almost exceeding supply,
and the division is working to increase local capacity because
of the high tariffs faced by cable imports.
Developments in the division
The stronger focus on high-end products with more attractive
margins is continuing in Europe, especially with the declining
share of traditional copper cable in favour of high-speed fiber.
Good successes were achieved with the pre connectorised FTTH
riser cables for use inside buildings, which offer fast, ‘plug & play’
installation. The cost-reduction programme in the organisation is
continuing, although the same rapid pace of gains as in the past
years cannot be maintained. Attention was given to a further
rationalisation of production, and more efficient use of labour.
Fixed costs were reduced by a further 10% under the focused
factory programme. In the coming year a strong focus will be
maintained on improving logistics processes and working capital
reduction.
The strategy in the USA is to broaden the product offering and
provide users with value-added solutions wherever possible. The
range is designed to cover the different worlds of outdoor (the
core business of big, high-fiber-count cables) and indoor (many
different cable requirements with lower fiber count for access
solutions near and inside buildings). The wide product range also
opens the door to new, non-telecom applications in fields such
as data centres, industry, nuclear, oil & gas and mass transit.
In manufacturing, efforts are continuing to optimise the cost
structure to address the cost pressure in the market, as well
as to reduce labour costs, redesign products for more efficient
production and further optimise procurement of materials such
as commodity-based plastics.
Telecom Solutions (including Americas)
Division
CommunicationsTelecom Solutions Multimedia & SpecialsOptical Fiber
Headlines in 2010
• Strong recovery in European telecom investments from second half, influenced by government and EU programmes
• Modest increase in activity in USA, especially by smaller operators; demand in Brazil rises rapidly
• Continuing focus on high-end products and value-added solutions; broadening of product offering to cover non-telecom applications
Products Full range of copper and optical fiber telecommunication cables,
connectivity and services
Market segments Telecommunication, cable networks
Growth driver Investments by telecom operators driven by growing demand for
greater bandwidth
Market position Optical fiber cable: no. 1 in Europe and China and no. 4 in USA;
Outdoor copper cable: no. 3 in EMEA
Establishments Brazil, China, France, Germany, Netherlands, Russia, Spain,
Denmark and USA
Employees Around 1,450
Customers Telecom operators such as Telefónica, KPN, Deutsche Telekom,
France Telecom, Free, Telia/Sonera, Swisscom, Telecom Italia,
AT&T, Verizon, China Telecom, Alcatel, Siemens and alternative
operators

Draka Holding | 47
Profile
With a wide product range and the ability to provide solutions
for all forms of communication, the Multimedia & Specials division
specialises in cables for mobile networks, data communications,
broadcasting and railway signalling applications. It is one of
the leading producers of mobile network cable, supplying the
complete Draka Antenna Line Products for all today’s mobile
tele communication applications. For data communications the
division provides copper and optical fiber cable solutions for all
kinds of data transmission requirements in both office and home
environments. It also offers unique specialty cables for high-per-
formance broadcast applications including HDTV camera systems
and other specialised OEM products. All cables are produced to
the highest quality and strict environmental standards. Multimedia
& Specials works according to the one-stop-shop principle,
allowing customers to rely on fast delivery and service.
Market developments
The level of market recovery in 2010 varied greatly from country
to country. Business was particularly strong in France and Germany
from the second quarter onwards. The division’s sales were helped
by its leadership position in the high-end copper and fiber data
communication cables, which are needed in the increasing num-
bers of high-bandwidth networks. The strong sales in these coun-
tries were accompanied by higher market shares, especially in
Germany and France due to the aggressive marketing approach.
The market in Spain is still strongly affected by the recession
and resulting low level of building activity. There is much more
emphasis on low-end products, which are subject to strong
price competition from manufacturers in the Far East. However
the continuing low level of activity in Spain was compensated by
the good business in Central Europe.
The highlight of the division’s business continues to be in the fast-
growing data centres market. This is benefiting from the trend
towards concentration in bigger centres, driven by the structural
and strong increase in demand for bandwidth. Another important
driver for this business is the trend to ‘cloud computing’, which
is further increasing the demand for remote storage and with it
for high-end cables and related products. The outlook in this
segment continues to be very promising, with a steadily expanding
customer base.
The close cooperation with leading data communication OEMs
and wholesalers was responsible for increased sales. Sales in the
railway signalling niche market strengthened, especially in the
Middle East where the division has a strong foothold. The position
in this market continues to grow, with particularly good sales in
Turkey and Saudi Arabia. Business was also good in the studio and
broadcast markets, especially under the influence of the European
Football Championship, to be held in 2012 in Poland and Ukraine.
Developments in the division
The closure of the factory in Årnes (Norway) was almost completed
by the end of 2010, with capacity transferred to other European
facilities such as that in Slovakia. The closure is part of the continu-
ing programme to rationalise manufacturing, reduce the cost base
and improve efficiency, while the move to Eastern Europe also
allows labour costs to be reduced.
Product innovations have been made in cooperation with the
Optical Fiber division, for example by the use of that division’s
Bendbright bend-insensitive fiber in data cables. This innovative
product speeds and simplifies installation in buildings, saving time
for installers and reducing the margin erosion suffered by standard
products. A new total connectivity cable range was launched in
2010 in the UK under the complete solutions concept developed
by Multimedia & Specials.
The division’s focus on finding new applications outside its
traditional areas is underlined by the railway signalling business,
which is based on the former copper telecom cables activities.
Similar products are now being successfully applied in this niche
market with its combination of telecom, data communication,
mobile network and fiber cables.
Multimedia & SpecialsDivision
CommunicationsTelecom Solutions Multimedia & SpecialsOptical Fiber
Headlines in 2010
• Strong sales and higher market share in France and Germany with high-end data communication cables
• Successful business in the fast-growing data centres market, driven by ‘cloud computing’ trend
• Strong sales in railway signalling in Middle East and Central Europe
• Continuing rationalisation of manufacturing to reduce cost base and improve efficiency
Products Copper and optical fiber cable solutions for applications in
the data, communication and industrial markets, and specialty
cables for broadcast / HDTV, RF and OEM applications; complete
cable solutions for mobile network base stations
Market segments Data communication, broadcast, mobile telecommunication,
industry automation and instrumentation and railway signalling
Growth driver Investments in mobile telecom networks, IT and LANs driven by
growing demand for greater bandwidth
Market position No. 1 in Europe for data communication; no. 4 globally in mobile
networks
Establishments Brazil, China, Denmark, Finland, Germany, Netherlands,Singapore,
Slovakia, UK and USA
Employees Around 900
Customers Electrical wholesalers, distributors, OEMs, system providers and
mobile telecom suppliers and operators
Draka Communications

48 | Draka Holding Draka Communications
Profile
In the optical fiber market Draka Communications develops and
manufactures fiber products to service single mode optical fiber
(for telecommunication) and multimode optical fiber (for data
communication) and specialty fibers for tailored solutions. These
products support both internal use and sales to third parties.
The production of preforms and optical fiber (‘drawn’ from the
preforms) takes place in Draka Communications. The optical fiber
is manufactured using Draka’s own Plasma-activated Chemical
Vapour Deposition (PCVD) and Furnace-Chemical Vapour
Deposition (FCVD) processes, which enable the core of the optical
fiber to be produced with high efficiency. These are combined with
the Advanced Plasma Vapour Deposition (APVD) process, a highly
efficient method for manufacturing the overcladding of the optical
fiber. Draka Communications owns the intellectual property rights
to its processes (PCVD, FCVD and APVD).
Market developments
Both North America and Europe saw strong increases in demand
for fiber in 2010, while the Chinese market declined somewhat
following the explosive increase in volume in 2009. While sales
in past years benefited fully from the strong demand as capacity
of the local joint ventures had to be supplemented by imports,
this effect disappeared in 2010 as demand normalised. However
this was more than compensated by the increase in other
regions.
In North America the effects of government stimulus spending
started to be felt, and demand returned to around the same level
as at the beginning of 2009. Growth was stronger in Europe
following the steep decline of around 25% in 2009, as major
telecom operators returned to the market with new projects.
Demand also benefited from investments in fiber networks by
institutional investors.
Countries such as Italy and Spain that were most severely impacted
by the downturn showed the strongest return to growth in 2010,
with around half of the 2009 decline being recovered. Business
was also good in Brazil, with a market growth of around 20%.
Plans are in hand to further develop the relatively small manu-
facturing base there, which can also serve as a hub for sales in
the surrounding countries. Sales to third-party manufacturers
were at a good level. Opportunities to sell fiber to local cable manu-
facturers also arose in Eastern Europe and the Middle East, with
applications ranging from basic infrastructure to FTTH.
Outside the traditional telecom market sales of multimode fiber
for enterprise networks and data centres were strong, driven by
the increasing demand for these premium, high-bandwidth fibers.
There was also increasing activity in other applications in the indus-
trial, energy, scientific and medical fields. These typically require
cables with specialised properties such as the ability to resist high
temperatures and pressures in mines and geothermal energy wells.
The expertise of other Draka divisions is an important factor in
meeting these widely differing requirements.
Developments in the division
Rationalisation of the activities in China included the sale of a
majority shareholding of Draka Comteq SDGi to YOFC, Draka’s
joint venture partner, with the aim of a uniform brand presentation
to the market. However the Chinese joint ventures, as well as that
in Brazil, are continuing to make a strong bottom-line contribution,
as well as generating dividend and royalty revenues.
Production overall came close to 100% utilisation in 2010, but at
the same time it was possible to reduce flexible labour through
efficiency improvements. Continuing investments were made to
achieve industrial excellence, for example by increasing the robust-
ness of processes and further reducing both fixed and unit costs to
maintain the division’s cost leadership. The global manufacturing
base demands excellence in logistics, and this is another area
receiving specific attention to ensure world-class performance.
Product development focused on high-end fibers for data
communication and FTTH applications, as well as on the wide
range of custom-engineered speciality products. Strong
marketing efforts continued in the highly successful multimode
fibers for which the division is world market leader.
Optical FiberDivision
CommunicationsTelecom Solutions Multimedia & SpecialsOptical Fiber
Headlines in 2010
• Demand in China normalises following explosive growth in 2009; decline compensated by strong sales in Europe and North America
• Major European telecom operators return to the market, with support from institutional investors
• Strong demand for high-end fiber products for enterprise networks and data centres; increasing attention for specialised non-telecom applications
Products Single mode and multimode optical fiber, tailored fiber solutions
(Specials), preforms
Market segments Telecommunications, data communications, transport and
industrial
Growth driver Investments by telecom operators (including FTTH), IT
investments, extension of fiber application portfolio
Market position No. 2 worldwide in single mode optical fiber; no. 1 worldwide in
multimode optical fiber
Establishments Brazil, China, France, Netherlands and USA
Employees 1,300
Customers Cable makers for telecommunications and data communications
applications

Draka Holding | 49Main subsidiaries, associates and joint ventures
Main subsidiaries, associates and joint ventures(100% owned by Draka Holding N.V, unless otherwise indicated, situation as of 14 February 2011)
CommunicationsAsia
Japan Precision Fiber Optics Ltd (50%)
People’s Republic Yangtze Optical Fibre & Cable Co Ltd (37.5%)
of China Yangtze Optical Fibre & Cable (Shanghai) Co Ltd (53.1%)
NK Wuhan Cable Co. Ltd (67.5%)
Singapore Draka Comteq Singapore Pte Ltd
europe
Austria Draka Austria Cable GmbH
Denmark Draka Comteq Denmark A/S
Finland Draka Comteq Finland Ltd
France Draka Comteq France SAS
Germany Draka Comteq Germany GmbH & Co KG
Draka Comteq Berlin GmbH & Co KG
Netherlands Draka Comteq BV
Draka Comteq Cable Solutions BV
Draka Comteq Fibre BV
Draka Comteq Telecom BV
Norway Draka Comteq Norway AS
Russia Neva Cables AO (75%)
Slovakia Draka Comteq Slovakia sro
Spain Draka Comteq Spain SL
Draka Comteq Iberica SL
Sweden Draka Comteq Sweden AB
Turkey Draka Comteq Kablo Ltd Sti
United Kingdom Draka Comteq UK Ltd
north America
United States Draka Communication Americas INC
south America
Argentina Cables Opticos y Metalicos para
Telecommunicationes Telcon Srl (49%)
Brazil Draka Comteq Cabos Brasil SA
Draktel Optical Fibre SA (70%)
Telcon Fios e Cabos Para Telecominicacoes SA (50%)
energy & InfrastructureAsia
India Associated Cables Pvt Ltd (60%)
Malaysia Sindutch Cable Manufacturers Sdn Bhd
People’s Republic Suzhou Draka Cable Co Ltd
of China Draka Cables (Hong Kong) Ltd
Singapore Draka Cableteq Asia Pacific Holding Pte Ltd
Singapore Cables Manufacturers Pte Ltd
Sultanate of Oman Oman Cables Industry SAOG (34.8%)
Thailand MCI-Draka Cable Co Ltd (70.3%)
Australia
Australia Draka Cableteq Australia Pvt Ltd
europe
Belgium Draka Belgium NV-SA
Czech Republic Draka Kabely sro
Denmark Draka Denmark Copper Cable A/S
Estonia Draka Keila Cables Ltd (66%)
Finland Draka NK Cables Ltd
France Draka France SAS
Draka Paricable SAS
Netherlands Kabelbedrijven Draka Nederland BV
Draka Nederland BV
Norway Draka Norsk Kabel AS
Russia Elkat Ltd (40%)
Spain Draka Cables Industrial SA
Sweden Draka Kabel Sverige AB
United Kingdom Draka UK Ltd
Industry & specialtyAsia
People’s Republic Suzhou Draka Cable Co Ltd
of China Nantong Haixun Draka Elevator Products
Co Ltd (75%)
Zhongyao Draka Elevator Products Co Ltd (75%)
Draka Shanghai Optical & Electrical Cable
Co Ltd (55%)
Philippines Draka Philippines Inc
Singapore Draka Offshore Far East Pte Ltd
Singapore Cables Manufacturers Pte Ltd
europe
Czech Republic Draka Kabely sro
Denmark Draka Denmark Copper Cable A/S
France Draka Fileca SAS
Germany Draka Deutschland GmbH
Höhn GmbH
Draka Industrial Cable GmbH
Draka Automotive GmbH
Draka Kabeltechnik GmbH
Italy D.B. Lift Draka Elevator Products Srl
Netherlands Draka Elevator Products BV
White Holding BV
White Products BV
Norway Draka Norsk Kabel AS
Russia Draka Industrial Cable Russia LLC
Spain Draka Elevator Products Spain SL
Draka Industry & Specialty SL
Sweden Draka Kabel Sverige AB
Turkey Draka Istanbul Asansor Ihracaat Ithalat Uretim Ltd Sti
Wagner Kablo Ltd Sti (9%)
north America
Canada Draka Elevator Products INC
Mexico Draka Durango S de RL de CV
United States Draka Marine, Oil & Gas International LLC
Draka Cableteq Holdings INC
Draka Cableteq USA INC
Draka Elevator Products INC
south America
Brazil Draka Cableteq Brasil Ltda (99%)

50 | Draka Holding One goal
One goal
“ Be passionate about your customers’ needs and success will follow”
Draka literally keeps today’s world turning. From optical fiber cable networks to traffic control centres, and from power supplies to the many kilometres of cable in an aircraft: cable technology connects and powers the world. That’s why Draka’s people are focused on delivering innovative, durable cable solutions.
This commitment forms the bedrock of Draka’s sustainable performance. Technological, economic, and societal trends place increasing – but also changing – demands on cable technology. Specialists from different groups, divisions and countries are working closely together to meet these various requirements. Driven by the same goal: exceeding the expectations of customers by anti cipating and meeting their future needs.

Draka Holding | 51One goal
new life for drilling rigs
One of those needs is the fast, flexible supply of
reliable cables for the renovation of offshore oil
rigs. “Renewable energy sources are gaining ground,
but oil will still be essential in the coming decades”,
says Klees Verkuil, Business Manager Industry &
Infra. Many European offshore platforms are now
approaching end-of-life, which is usually a period of
around 20 years. But thanks to new technology,
these platforms can be kept in service for another
20 years after a thorough renovation.
That’s an attractive option for the owner/operator,
provided one vital condition is met: the downtime
of the platform during renovation must be kept to
a minimum. “Operating an offshore platform is
extremely costly”, Klees emphasises. “If it’s out of
production for just one day, it can be a financial
disaster for the customer.” Which not only means
all the components must be of the highest quality,
but also that it’s vital for delivery times to be as
short as possible. That’s a big challenge, as the
renovation of a large oil production complex for
BP on the Valhall oilfield in the North Sea shows.
Draka is supplying all the cables, for various con-
tractors in the USA, Norway, the Netherlands and
the UK. A complicating factor is that the demand
for cables is changing all the time. “Designers are
constantly finetuning their plans. Ten to twenty
per cent of the cables are only ordered at the last
possible moment.”
Thanks to Draka’s global coverage the Offshore
divi sion was able to participate actively in the entire
development process. “Our people in the USA are
working together with the overall designers, while
in the Netherlands we’re working closely together
with the builders of the platform. Colleagues from
Aberdeen maintain contact with the company that
is building the living accommodation, and Draka
colleagues in Norway are advising BP. Two of our
production facilities and a large distribution centre in
Scotland are also involved. Thanks to this spread, the
flexibility in production and the dedicated efforts of
all the local Draka teams, we were even able to reduce
the standard delivery time of ten weeks by half.”
Thanks to new
technology, drilling
rigs can be kept in
service for another
20 years after a
thorough renovation.

52 | Draka Holding One goal
Optical fiber in aviation
To meet customers’ needs, collaboration may be
needed that extends not only across national borders
but also across different Draka groups. The Auto-
motive & Aviation division (Industry & Specialty
group), for example, approached the Optical Fiber
division (Communications group) to jointly develop an
optical fiber cable solution for use in defence aircraft
and helicopters. “These carry increasingly advanced
equipment “, says Mark Teunissen (Automotive &
Aviation). “Optical fiber offers the required bandwith.
Additional advantages are that optical fiber cables are
light and – highly important – very reliable because
they’re insensitive to electromagnetic interference.”
In 2005 the UK government together with manufac-
turers and suppliers started a research project that
led to a European initiative to define a standard for
optical fiber cables in aviation. The standard is being
developed in close collaboration between manufac-
turers and suppliers, including Draka. The UK-Italian
helicopter manufacturer AgustaWestland intends
from 2011 to use optical fiber cables meeting the
new specifications, and has asked Draka to develop
this cable. That’s no small task, because optical fiber
cable for defence aviation applications has to meet
very specific demands, in terms of robustness and
compatibility with older optical fiber technology,
as well as in its processing characteristics during
production.
“One big advantage for us is that we have access to
the state-of-the-art expertise of our colleagues at
the Optical Fiber division”, says Mark. At the same
time the collaboration also required an explicit joint
commitment. “Compared with the millions of kilo-
metres of fiber that Optical Fiber usually supplies,
this project involves relatively small quantities. And
in our market the development times and life cycles
are also much longer. In other words, this project
is not so much about quickly generating ROI. The
important thing is meeting the needs of the customer,
which will also provide us with a strong strategic
starting position for the long term. We’re convinced
that optical fiber cable will experience tremendous
growth in the aviation industry, for both defence
and – in the longer term – commercial applications.
By investing together in next-generation technology
for the customer, we’re also ideally placed to benefit
from that growth.”
Defence aircraft
and helicopters
carry increasingly
advanced equip-
ment, which creates
a growing demand
for bandwidth.

Draka Holding | 53One goal
Intelligent cable for geothermal energy wells
Another area with a large potential for growth is
the technology needed for providing additional clean,
renewable energy sources. In the USA, for example,
Draka is involved in the development of breakthrough
solutions such as Enhanced Geothermal Systems
(EGS). In this technology, cold water is injected into
deep, high-temperature rock layers. The water is
heated and used to generate electricity, for example
by steam turbines. Geothermal heat is a potentially
huge source of clean energy which, unlike fluctuating
energy sources such as wind and solar power, is con-
stantly available. The strategy of the United States
Department of Energy is aimed at meeting 20% of
American electricity needs from geothermal energy
within ten years.
For EGS it’s essential to be able to monitor the tem-
perature at all points in the injection well. “But the
problem is that at present no cables are available
on the market that can withstand the high tempera-
tures of 300°C and more for longer than a few days”,
says Jay Monahan of Draka’s Cableteq USA division.
A challenge that looks as though it was made for the
division. “It’s our ambition to make the cables that
our competitors can’t supply”, says Jay. Together
with Mark Lowell, Vice President of Innovation at
Draka Cableteq USA, he submitted a research pro-
posal to the Department of Energy. The department
then awarded Draka a 3.2 million dollar subsidy to
develop optical fiber cables that will ultimately even
be able to survive the optimum EGS temperature
of 374°C. “As well as that, we’re talking about an
intelligent cable that itself acts as a sensor”, says
Mark. “That means you can use it to measure the
temperature at thousands of points in the well.”
According to Jay the project demands an unprece-
dented level of collaboration between specialists
from both the Industrial and Communications groups.
“Six Draka locations were involved, spread across the
USA, France and the Netherlands, as well as a private
research & development company in North Carolina
and the US Department of Energy’s Sandia National
Laboratory in New Mexico.” Mark says the project is
on schedule for field trials in 2011 and delivery of the
end-product in 2012. “The partnership is perfect. I’m
very impressed by the enthusiasm and speed with
which colleagues in other divisions and countries are
making their contributions to finding a solution for
the customer. This project proves that the reorganisa-
tion and strategy in recent years is delivering results.”
Geothermal energy
demands cables
that can withstand
temperatures of
300°C and higher.

54 | Draka Holding Risk management
Risk management
In the conduct of its operations, Draka is exposed to a number of
business risks. The object of the company’s risk management poli-
cy is to permanently control the various actual and potential risks
to Draka’s business in the long term and to limit and hedge those
risks where possible. Despite the priority given to the control of
those risks and the management and control procedures in place,
risks can never be eliminated completely. Given the wide diversity
of markets, customers and geographical areas served by Draka,
they are an inherent part of doing business. Draka’s long-term
risks are limited by:
• the great diversity of the markets in which it operates (both
geographically and in terms of clients);
• the fact that no client accounts for more than 6% of
Draka’s worldwide sales;
• the wide spread of suppliers;
• the fact that movements in the prices of important raw
materials (copper, aluminium and polymers) can be passed
on within a reasonable period;
• its state-of-the-art process technologies, many developed
in-house;
• its informative, compliant and transparent reporting systems;
• its highly skilled workforce;
• a proactive, responsible management style.
Given the diversity of the markets, customers and regions served
by Draka and the breadth of its portfolio of activities, it is virtually
impossible to quantify all the risks that may be relevant to the
company as a whole. Where those risks can be measured, however,
they are quantified as accurately as possible. The risks described
below do not represent an exhaustive list, but are a selection of
the most important risk factors.
Operational risks
Risks relating to litigation and claims
The nature of Draka’s business exposes it to product liability risk,
in the form of claims for harm caused by its products to people
or property. The operating companies have stringent quality
procedures in place to limit product liability risk. Many of Draka’s
operating companies are ISO 9001 certified, which requires
them to have appropriate quality-management systems. Where
possible, Draka minimizes product liability when negotiating
sales contracts with customers. Draka’s sales teams may involve
the company’s legal departments in more complex contractual
negotiations.
Draka also has product liability insurance, which is arranged
centrally at a level which it considers appropriate given the nature
and scale of its operations. Under its supply contracts, Draka may
be held liable for failure to deliver products or perform services
in accordance with the contract terms, even if such failure is
attributable to acts or omissions of third parties.
Individual contracts may contain penalty and/or liability clauses
that apply if Draka fails to comply with the delivery schedule
and/or the agreed quality requirements. Draka also warrants
the performance of its products. Warranties given to Draka under
contracts for the supply of materials and components used in its
products may be less extensive than the warranties Draka gives
its customers.
A successful product liability or other claim against Draka could
have an adverse impact on its financial position and/or operating
results. Management is not aware of any product liability claims
of which the materiality has been sufficiently quantified and
substantiated.
Risks relating to cyclical movements in economic activity
Draka operates in markets which are sensitive to cyclical move-
ments in economic activity, changes in economic growth rates
and fluctuations in supply and demand. Demand for Draka’s
products typically mirrors changes in the economic growth rates
of the countries in which it is active. Demand for the products of
the various divisions is also dependent on developments in the
industries for which such cables are designed (for example, the
construction, marine, oil and gas and transport industries) and
levels of investment in those industries. There are different
growth drivers for different parts of Draka’s business: for example,
energy prices affect the Renewable Energy and Offshore divisions
and developments in the construction market affect the Energy &
Infrastructure group. The Communications group is also subject
to fluctuations in supply and demand in response to the level of
investment in the telecommunications industry. The profitability
of cable manufacturers, including Draka, is severely impacted by
such factors.
Geographically, Europe is Draka’s most important market,
accounting for approximately 55% of its revenue in 2010. North
America and Asia are also important markets for Draka, account-
ing for approximately 15% and 21% of its 2010 revenues, respec-
tively. As such, the company is particularly affected by the level
of economic activity in these three regions.
Portfolio diversity, in terms both of type of business and geo-
graphical region, spreads Draka’s business risk and protects
the company’s profitability and financial position against nega-
tive developments in any one factor or region. Draka’s financial
position and/or operating results may, however, be adversely
affected by a decline in demand for its products and services as a
result of a cyclical downturn or by sustained pressure on prices.
Risks relating to dependence on customers
Draka’s activities are spread across many sectors (including
construction, telecommunications and energy) and many diffe-
rent types of end-customer (including wholesalers, distributors,
equipment manufacturers and industrial users). This diversity
serves as a safeguard for the company as a whole and no one
customer accounts for more than 6% of total net revenue.
Certain customers may, however, represent a significant portion
of a division’s business and the loss of such customers may have
a significant impact on the division’s operations, financial position
and performance. Risks relating to creditor concentration are
discussed on page 95.

Draka Holding | 55Risk management
Risks relating to raw materials and supplies
Copper, preforms for optical fiber, aluminium, PVC, polyethylene
and other polymers are raw materials that Draka needs for its
manufacturing processes and its business is therefore exposed to
fluctuations in their prices and availability. In 2010, raw materials
accounted for approximately 75% of Draka’s total operating costs.
Shortage of raw materials can adversely impact the company’s
results. Non-ferrous raw materials (including copper and alumini-
um) are purchased centrally by Corporate Procurement at Draka
Holding, based on requirements reported by the local operating
companies. Lead buyers have been designated for the different
divisions (groups) who are responsible for central procurement of
other raw materials. Draka ensures a constant supply on the best
possible terms by centralizing procurement, combining buying
power and using diverse sources of supply. To limit the risk of raw
material shortages, Draka has set up a sophisticated forecasting
process and takes full advantage of the scale of its operations and
its optimized value chain, with plants concentrating on product
families. Internal controls are also an integral part of contractual
arrangements with suppliers, including clauses governing the
volume, performance, quality and supply flexibility of raw
materials.
In particular, the company is exposed to fluctuations in the price
of copper on the commodity exchanges. Copper accounted for
approximately 60% of Draka’s total operating costs in 2010.
Changes in the copper price have a significant effect on Draka’s
revenue, working capital requirements, cost of sales, debt position
and financing costs.
Copper price movements are generally passed on to the custo-
mers. Where Draka uses price lists, the prices are adjusted when
copper moves outside the set tolerances defined in the price list.
The copper price can also be fixed contractually, in which case it
changes on the basis of agreed indicators or over a predefined
period. In the case of projects where the copper price is fixed
for a given future date, price exposure is hedged with derivatives
contracts. Hedging is organised centrally by the Central
Procurement department at Draka Holding.
To mitigate exposure to inventory risk from changes in copper
prices, Draka includes copper price escalation clauses in sales
contracts with customers, tailored to the specific situation, and
has working capital management procedures in place. Draka also
continuously monitors its economic position to assess potential
exposure to copper price movements and takes pre-emptive
action if necessary. Based on the economic position as at 31
December 2010, a change of € 0.10 in the copper price would
have a theoretical impact on the company’s operating result
of around € 0.8 million. The actual impact depends on factors
such as the period over which the fluctuation takes place and
the inventory turnover rate.
Risks relating to inventory
Draka holds stocks to meet the needs of specific client groups for
delivery on demand of the full product range within certain cable
segments. Stockholding impacts the company’s working capital
and has to be financed. Stockholding exposes Draka to the risk
of complete or partial product obsolescence and the risk of
pressure on margins from lower underlying selling prices.
The internal controls to mitigate these risks include an effective
forecasting process, an optimized value chain with plants concen-
trating on product families and effective inventory management
which seeks to minimize stock levels while holding a full product
range. Internal controls are also embedded in the contractual
arrangements with suppliers and customers, such as price
agreements.
Risks relating to the technologies employed
Draka’s products are used in a wide variety of applications.
The regular introduction of ever more advanced products,
particularly in the specialty cable segment, is a feature of the
cable industry. Draka has so far been successful in introducing
new generations of improved products. Its future operating results
will depend to a large extent on its ability to continue introducing
new and improved products and applications that offer value for
Draka’s customers. Because it competes in a number of constantly
evolving industries, Draka is under constant pressure to innovate
in order to satisfy its customers’ changing demands.
Draka believes that many of its products are technological leaders
in their markets and it will continue to identify, develop and market
innovative replacements for existing products in order to maintain
its competitive advantage. In this way, Draka seeks to eliminate
the risk of other players developing products or technologies that
render its own obsolete or uncompetitive.
If Draka does not keep pace with the technological advances in
its markets, it may lose market share and sustain harm to its
reputation and position as a leader in technology in its markets
that may adversely affect its business, its operating results and
its financial position.
Draka is occasionally involved in patent infringement claims filed
either by the company against other parties or by competitors
against the company. The financial consequences have not
hitherto been material to the company. Management is not
aware of any current patent infringement claims against Draka.
Risks relating to increasingly stringent environmental
regulations
Draka is subject to numerous environmental regulations in
the various jurisdictions in which it operates, including legislation
and regulations governing the handling, transportation, disposal
and emission of hazardous waste and materials.
While Draka believes that it complies with current environmental
legislation and regulations, the possibility of the company being
required to incur significant environment-related expense in
the future cannot be excluded. This may be the result of existing
or future legislation and regulations or of its own operations
or those of its partners or businesses which Draka acquires.
Such expense could have an adverse impact on Draka’s
financial position and/or operating results.

56 | Draka Holding
Risks relating to pensions
Draka operates defined-benefit schemes in nine countries, the
most important being the Netherlands, France, the United King-
dom and Germany. The company operates defined-contribution
plans in several other countries. A significant part of the compa-
ny’s defined-benefit plans is funded with plan assets that have
either been segregated from the company and placed in indepen-
dent pension funds or trusts or insured to provide for the pension
benefits even in difficult times. The company’s net obligations
with respect to the defined-benefit schemes are calculated
separately for each plan on the basis of actuarial calculations.
In the Netherlands, Draka participates in a multi-employer pension
plan which is externally funded. Because the assets and liabilities
of this multi-employer pension plan cannot be allocated to the
employees, the plan is treated as a defined-contribution plan.
The company is under no obligation to fund any deficits and is
not entitled to any surpluses. The financial treatment of the
pension funds is explained in note 24 (page 117) of the financial
statements.
Risks relating to economic slowdown
Draka’s financing depends on borrowed capital as well as equity
so the company has a significant level of debt. As at 31 December
2010, Draka had outstanding debt of around € 283 million. Further
information on Draka’s capital structure is given in ‘Capital risk
management’ (page 98).
Draka believes that its expected cash flows, together with avail-
able borrowings, will be adequate to meet its anticipated financial
needs. However, Draka’s ability to repay or refinance its debt and
fund working capital requirements, capital expenditure or busi-
ness opportunities that may arise, such as acquisitions of other
businesses, will depend on its future operating performance
and ability to generate cash. This will depend to some extent
on general economic, financial, competitive, market and other
factors, many of which are beyond Draka’s control. If Draka’s
future cash flows from operations and other capital resources
are insufficient to pay its debts as they mature or to fund its
liquidity needs, the company may be obliged to:
• reduce or postpone business activities and capital expenditure;
• sell assets;
• raise additional debt or equity capital;
• restructure or refinance some or all of its debt on or before
maturity; or
• forego opportunities (e.g. deferring acquisitions).
Draka cannot give any assurances that it would be able to imple-
ment any of these alternatives in time or on satisfactory terms,
if at all. The terms of the company’s existing and future debt and
its syndicated loan may limit its ability to pursue any of these
alternatives.
Financial risks
The financial risks to which Draka is exposed are:
• counterparty credit risk
• debtor risk
• foreign-exchange risk
• interest-rate risk
• liquidity risk
• metal and other price risks
All these risks are described in detail in notes 4 and 27 to the
consolidated financial statements (pages 94 and 121), including
a sensitivity analysis.
Risk management and internal control
The Board of Management, under the supervision of the
Supervisory Board, is responsible for the proper functioning
of the company’s risk management and internal control systems.
Risk management is an integral part of business management.
The objective of Draka’s risk management and internal control
systems is to provide reasonable assurance that the company’s
objectives are met, ensure compliance with legal requirements
and safeguard the integrity of the company’s financial reporting
and related disclosures.
Draka’s risk management approach is embedded in its governance
structure, its risk-based framework of policies and procedures and
its periodic business planning and review cycles.
Risk management process
In an increasingly dynamic business environment, the risks Draka
faces are becoming more complex and extensive. Managing these
risks is part of the company’s day-to-day activities and intelligent
management of these risks contributes to the continued success
of the business. The level of control is also affected by the global
reduction in Draka’s headcount.
Risk management provides assurance, transparency and insight
in relation to the management of Draka’s business risks on behalf
of its internal and external stakeholders, based on structured and
thorough risk management procedures. A risk workshop was
organised to increase understanding of the main business risks
to which Draka is exposed and improve awareness of the risk
management and control systems at senior management level.
The risk management process consisted of two parts:
• Interviews: Before the workshop, interviews were held with
the key players within the organisation at which they were asked
to identify the most important business risks that potentially
threaten Draka’s strategy and objectives, the key incidents
that occurred during the past year and the day-to-day activities
designed to manage these risks.
• Risk workshop: The results of the interviews were collated and
used as the starting point for the workshop. At the workshop,
Risk management

Draka Holding | 57
Draka’s major risks were identified and assessed by senior
management through a combination of presentations,
discussions and voting. Risks were assessed on the basis
of the likelihood of occurrence and their impact. It was
decided at the workshop to conduct a survey among a
larger population and include more potential business risks.
The web questionnaire was circulated to all those involved
in the interviews and risk workshop, who were invited to
assess additional risks on the basis of likelihood and impact.
The findings of the survey were presented to the Board of
Management. A risk owner was explicitly nominated for the
two main risks.
The following next steps were identified:
• organise an additional risk workshop at divisional level;
• assemble a risk task group with experts in the most significant
risks;
• identify the current overall projects, activities relating to these
most significant risks;
• perform a causal analysis, focusing on both financial and non-
financial aspects;
• identify the control measures and management information
relating to the risk;
• identify potential gaps in management information and in the
design and operational effectiveness of control measures;
• close the gaps that have been identified and verify that the
risk is adequately managed;
• embed periodic discussion of the risks in the business reviews
and management information.
Corporate governance
Corporate governance is the system of management and
supervision by which a company is controlled. Draka believes
that proper corporate governance is crucial to business success.
The key elements of good corporate governance are effective
internal controls and high ethical standards.
The Audit and Governance Committee (A&GC) met on seven
occasions in 2010. One of the A&GC’s main responsibilities is
to oversee proper financial reporting and compliance with
the company’s internal risk control system.
An internal code of conduct, which reflects the company’s
standards and values, has been implemented by the Board of
Management and communicated to the employees. As part
of the code of conduct, the company has also implemented a
whistleblower’s policy. Clear internal rules have been formulated
and a clear reporting structure has been developed, to serve
as the basis for reporting of potential violations of the internal
code. The Company Secretary acts as Compliance Officer.
One complaint was reported to the Compliance Officer and
the A&GC in 2010 and has been resolved.
A more detailed description of the company’s corporate
governance model can be found on page 59.
Risk-based framework of policies and procedures
The Board of Management has implemented an internal control
framework defining the group’s main policies, procedures and
risks. The internal authority matrix, which defines approval autho-
risation at different levels in the company, was revised by the
Board of Management in 2009 and further improved in 2010.
The Operational Audit department continued its review of
operating companies in 2010, as part of the audit plan to review
all major subsidiaries within a three-year period. The Operational
Audit department also carried out ad hoc assignments on specific
topics. The findings and recommendations of all reviews have
been discussed with the responsible management and reported to
the Board of Management and the A&GC. The recommendations
are used to further strengthen the internal controls.
The Board of Management has also improved standard mana-
gement reporting for each activity by introducing additional
KPIs and benchmarking the company’s performance against
that of its competitors. This enables Corporate Control to
analyse the company’s financial performance in these activities
and place it in a wider context.
Business planning and review
The company’s budgeting and internal reporting processes are
subject to fixed procedures and detailed guidelines. The Board
of Management periodically discusses the financial performance
and operational and financial risks of its activities with divisional
management in the course of business reviews. The division’s
financial performance is evaluated and measured against
approved budgets, historical performance, market developments
and the competitive environment. Forecasts are evaluated quar-
terly and updated where necessary. The company has clearly
defined procedures and authorisation levels for approval of capital
expenditure. The Capex Committee is responsible for reviewing
and approving all capital expenditure above € 100,000. This has
been incorporated into the internal authority matrix.
Management statements
In control statement
In the light of the foregoing, the Board of Management believes
that, with regard to financial reporting risks, the company’s risk
management and internal control systems functioned properly
in 2010 and provide a reasonable degree of certainty that the
consolidated financial statements are free from material mis-
statement. The Board of Management has no reason to assume
that these systems will not function properly in 2011.
This does not imply that these systems and procedures provide
any assurance that the company’s operational and financial
objectives will be met, nor can they prevent any misstatements,
inaccuracies, fraud or non-compliance with rules and regulations.
The actual effectiveness of this process can only be assessed on
the basis of the results over a longer period. In a rapidly changing
world in which new challenges constantly arise, ever-increasing
demands are being placed on the internal risk management
Risk management

58 | Draka Holding Risk management
process. These processes therefore have to be reviewed and
updated regularly.
The Board of Management remains focused on continuous
assessment and improvement of the company’s risk manage-
ment systems. The process and its monitoring are periodically
discussed by the Board of Management with the Audit & Gover-
nance Committee and the Supervisory Board.
Responsibilities relating to the financial statements and
annual report
The Board of Management is responsible for preparing the
financial statements and the annual report in accordance with
the applicable laws of the Netherlands and the International
Financial Reporting Standards (IFRS) which have been adopted
by the European Union (EU).
The Board of Management is required to prepare financial state-
ments for each financial year which give a true and fair view of
the assets, liabilities, financial position and profit or loss of the
companies included in the consolidation. They are responsible
for maintaining proper accounting records, safeguarding their
assets and taking reasonable steps to prevent and detect fraud
and other irregularities. The Board of Management is responsi-
ble for selecting suitable accounting policies and applying them
on a consistent basis, making judgements and estimates that are
prudent and reasonable. Applicable accounting standards have
been followed and Draka’s financial statements, which are the
responsibility of the Board of Management, are prepared using
accounting policies which comply with IFRS.
In accordance with section 5:25c(2)(c) of the Dutch Financial
Supervision Act (Wet op het Financieel Toezicht) and on the
basis of the foregoing, the Board of Management confirms that
to the best of its knowledge:
• the financial statements give a true and fair view of the assets,
liabilities, financial position and profit or loss of Draka Holding
N.V. and its consolidated companies;
• the annual report gives a true and fair view of the position at
the balance sheet date and the course of business during the
financial year of Draka Holding N.V. and its group companies
included in the annual financial statements and describes the
principal risks to which Draka Holding N.V. is exposed.
Amsterdam, 14 February 2011
Board of Management
Frank Dorjee, Chairman and CEO

Draka Holding | 59Corporate governance
Corporate governance
General
Draka Holding N.V. is a public limited liability company incorpora-
ted under the laws of the Netherlands with its registered office in
Amsterdam. Draka has a two-tier management structure, with a
Board of Management and a separate Supervisory Board. The
Board of Management and Supervisory Board are independent
of one another. Both bodies render account for the performance
of their tasks to the General Meeting of Shareholders (the ‘General
Meeting’).
Draka’s Board of Management and Supervisory Board endorse
the principle embodied in the Dutch Corporate Governance Code
(the ‘Code’) that the Company is a long-term form of collaboration
between the various parties involved. They recognize their
integral responsibility for correctly balancing all the interests
concerned while safeguarding the continuity of the business.
The aim of the Company is to create long-term shareholder
value. Unless stated otherwise, Draka complies with the Code’s
best-practice provisions. Departures from those provisions are
discussed in this chapter.
Any substantial changes in Draka’s corporate governance
structure or in the manner in which Draka complies with this
Code will be presented to the General Meeting for discussion.
Board of Management
The Board of Management is responsible for the management
of the Company and its operating companies, which means inter
alia that it defines the strategic direction, establishes the policies
and manages the Company’s day to day operations. The Board
of Management is responsible for the Company’s results and the
achievement of its objectives.
The members of the Board of Management are appointed by the
General Meeting, upon nomination by the Supervisory Board.
The General Meeting may suspend or dismiss Board of Mana-
gement members at any time. A resolution to dismiss a Board
of Management member, other than on the proposal by the
Supervisory Board, can only be carried by an absolute majority
of the votes cast by a quorum of shareholders representing more
than one-third of the capital in issue.
In the event of a conflict of interest between the Company and
a member of the Board of Management, Draka will be represented
by a member of the Board of Management or Supervisory Board
who has been designated by the Supervisory Board for that
purpose.
The Board of Management of Draka consisted of two members
in 2010: Frank Dorjee, Chairman of the Board of Management
and Chief Executive Officer, and Okke Koo, Chief Operating
Officer. Representative authority is vested both in the Board of
Management and in each member of the Board of Management
acting individually.
Okke Koo has resigned from the Board of Management at his
request with effect from 31 December 2010. The Board of
Management now consists only of Frank Dorjee. In the light of
developments with regard to the Company in the last quarter
of 2010, the Supervisory Board has decided (for the time being)
not to seek a successor to Okke Koo as a member of the Board of
Management.
supervisory Board
The Supervisory Board is responsible for supervising the policy
of the Board of Management and the general course of affairs of
the Company and its related enterprise and supporting the Board
of Management with advice. The Supervisory Board is guided in
the performance of its task by the interests of the Company and
its related entities. The Board of Management provides the Super-
visory Board in good time with all information needed to perform
its task. The responsibilities, duties and procedures of the Super-
visory Board are defined in Draka’s Articles of Association and
in the charters of the Supervisory Board and its committees.
Members of the Supervisory Board are appointed by the General
Meeting on the recommendation of the Supervisory Board.
The General Meeting and Central Works Council may nominate
candidates for appointment to the Supervisory Board. It has been
agreed with the Central Works Council that one candidate for
appointment to the Supervisory Board will be nominated by the
Central Works Council. The Supervisory Board will place the Cen-
tral Works Council’s nominee on the list of candidates unless the
Supervisory Board objects to that nomination on the grounds
that the nominee would not, in its view, be capable of properly
performing the duties of a member of the Supervisory Board or if,
as a result of the nominee’s appointment, the Supervisory Board
would no longer have the desired composition.
The composition of the Supervisory Board takes into account
the nature of the Company and its activities, its shareholders
and the expertise and background required of its members. The
resignation schedule for members of the Supervisory Board has
been determined in accordance with the principles of the Code
and avoids too many Supervisory Board members resigning at
the same time. Draka’s Supervisory Board currently consists of
eight members.
In view of the scale, diversity and complexity of the matters to
be discussed, the Supervisory Board has established three
committees – the Audit & Governance Committee, the Remunera-
tion & Nomination Committee and the Strategy Committee –
which contribute to more effective decision-making by the
Supervisory Board. The roles, responsibilities, composition,
tasks and procedures of the committees are laid down in charters.
The Supervisory Board profile (included in the Supervisory
Board’s charter), the resignation schedule and the charters and
composition of the Supervisory Board and its committees have
been adopted by the Supervisory Board and can be viewed at
the company’s website (www.draka.com).
General Meeting
The annual General Meeting is held within six months of the end
of the previous financial year. The notice of the General Meeting
shall be published on the Company’s website, in a national news-

60 | Draka Holding
paper and in the Official List. The agenda of the General Meeting,
together with the explanatory notes and other documents relating
to the agenda, are made available in advance of the meeting and
are posted on the company’s website (www.draka.com). The
General Meeting discusses the annual report, adopts the financial
statements, declares the dividend, decides on discharge of the
members of the Board of Management and Supervisory Board of
liability for their management and supervision and appoints the
auditors.
The General Meeting appoints and may suspend or dismiss the
members of the Board of Management and the members of the
Supervisory Board. On the proposal of the Supervisory Board,
the General Meeting adopts the remuneration policy for the Board
of Management and the remuneration of the Supervisory Board.
Decisions of the Board of Management and Supervisory Board
relating to a significant change in the identity or character of
Draka or its operations are also subject to the approval of the
General Meeting.
The General Meeting is the body authorized to decide on the
issue of new shares, but may delegate this authority to another
corporate body. This authority to issue (and grant rights to sub-
scribe for) new shares is currently vested in the Board of Mana-
gement, subject to approval by the Supervisory Board, for a period
of eighteen months commencing on 20 April 2010, the date of the
General Meeting. This authority is limited to a maximum of 10%
of the total issued share capital on 20 April 2010. This restriction
does not apply to any issue of class B protective preference shares.
Draka has three classes of shares: ordinary shares, financing
preference shares and class B protective preference shares.
No class B protective preference shares have so far been issued.
The General Meeting also has powers of decision on the acquisition
of shares in its own capital.
Departures from the best-practice provisions of the Code
While Draka endorses the principles of the Code, it does not
comply with the following best-practice provisions of the Code:
The variable element of the remuneration of the Board of
Mana gement is not yet linked to non-financial indicators,
which is inconsistent with best-practice provision II.2.3. Draka
decided to continue in 2010 with the remuneration policy as
revised at the General Meeting of 11 May 2007. The remuneration
policy will be reviewed to determine whether it requires
amendment for next year.
Two members of the Supervisory Board, Annemiek Fentener van
Vlissingen and Harold Fentener van Vlissingen, did not qualify as
independent during the 2010 financial year, which is inconsistent
with best-practice provision III 2.1.
The Supervisory Board has not set a maximum term of office
for its members because Draka prefers to secure long-term
access to the required expertise. This is inconsistent with best-
practice provision III 3.5.
Draka’s Supervisory Board has a combined Remuneration &
Nomination Committee. Because Draka attaches great impor-
tance to the coordinating role of the Chairman of the Supervisory
Board, particularly in the process of selection and nomination
of candidates for appointment to the Supervisory Board and
Board of Management, the Chairman of the Supervisory Board
is also Chairman of the Remuneration & Nomination Committee,
which is inconsistent with best-practice provision III 5.11.
Fundamental changes in the shareholdings in Draka may
necessitate further departures from the Code. Where appli-
cable, information will be posted on the company’s website
(www.draka.com).
Code of Conduct and whistleblower policy
In the interests of good corporate governance, Draka’s Board
of Management and Supervisory Board introduced a Code of
Conduct in 2007 which defines Draka’s core values and standards
and includes a mission statement for all the group’s employees.
This Code of Conduct applies to Draka and all companies affiliated
with Draka. The Code has been disseminated throughout the
Group in the form of a brochure in seventeen languages and is
posted on the corporate website. A whistleblower procedure has
also been introduced to protect individuals who report irregulari-
ties within the organization. Suspected irregularities can be
reported to the Company’s Compliance Officer. The personnel’s
awareness of the principles embodied in the Code of Conduct was
raised in 2008 by running an online training course. The Code of
Conduct has been an integral part of the employment contracts of
new employees since then. All new employees are also given an
online training course.
Internal insider trading rules
The Board of Management of Draka has formulated a set of rules
regarding price-sensitive information. Under these rules, any
Draka employee who is in possession of information that may
reasonably be expected to influence the price of the securities
may not engage in transactions in Draka Holding securities or
recommend a third party to engage in transactions in Draka
Holding securities. It is likewise forbidden to communicate price-
sensitive information to a third party and engage in transactions
during a closed period. These rules also apply to the members
of the Board of Management and Supervisory Board and other
designated individuals.
Corporate governance

Draka Holding | 61
One planet
“ A conscious and responsible approach towards our role in society”
From: brochure ‘Draka Corporate Social Responsibility’
Draka is – rightly - expected to conduct its business in a socially and environmentally responsible way. To ensure sustainable performance, in every sense of the term, Corporate Social Responsibility (CSR) principles should be fully integrated in our business model. This, in a nutshell, is Draka’s CSR mission.
One planet

62 | Draka Holding One planet
Throughout the organisation, Draka’s people are
aware that investing in CSR means investing in the
company’s sustained growth, its people’s future
and the quality of the environment. Their efforts in
this regard are focused by a clear CSR strategy,
which consists of:
• Encouraging eco solutions;
• Ensuring safety;
• Improving resource efficiency;
• Caring for people.
Putting these principles into practice requires the
commitment of the whole organisation. It also calls
for an innovative mindset, continually looking for
ways to improve our products and the way we work.
These pages illustrate how in each of these four areas,
Draka’s people are contributing to the future of both
planet and society.
Encouraging eco solutions
Many of our products contribute significantly to
enhanced environmental performance. Draka faci-
litates energy management, helping customers to
assess the environmental footprint of different types
of cable. Draka also uses new materials and manu-
facturing processes to design energy-efficient alterna-
tives for existing cables and invests in the development
of the cable technology needed for renewable energy
sources, such as solar and wind power.
Two forms of renewable energy that so far have not
been harnessed to their full potential, are wave power
and tidal power. However, the European Marine Energy
Centre (EMEC) is currently undertaking ambitious
research at a test site near the Scottish Orkney Islands.
A crucial factor in this is the quality of cables used to
collect and transport power. EMEC, one of Europe’s
leading test and research institutes, asked Draka to
supply 15 kilometres of subsea power cable. The cable,
which connects a series of tidal wave generators
at the bottom of the sea, presented a unique R&D
challenge. Draka rose to this challenge and developed
a 33,000 volts power cable, which incorporates optic
fiber communication and copper control cables and
which, with its two layers of thick steel wire insulation,
is easy to handle and at the same time is sturdy
enough to brave the elements for years to come.
Ensuring safety
Draka provides cable solutions that maximise the
safety of installers and end-users, for example in the
oil & gas, fire protection, elevator, and geothermal
industries. However, safe cable technology also
requires that Draka gives top priority to the occupa-
tional safety and health of its own employees.
Some cables may literally save lives. For example,
in case of a fire Draka’s Low Smoke Zero Halogen
(LS0H) cables retain their function for longer periods
of time than existing regulations demand. This keeps
crucial systems like lighting, alarm systems and power
circuits up and running. The cables also emit low levels
of smoke and no halogen gas at all, thus facilitating
evacuation procedures. In Spain (as in many other
countries) legislation requires that only LS0H cables
are used in public buildings. A drawback, from the
installers’ point of view, is that these cables are gene-
rally less flexible and take longer to install. However,
Draka specialists came up with a LS0H cable for
the Spanish market which is highly flexible, reducing
installation time by 30 % compared to other types of
LS0H cable.
Safety should also be the guiding principle on the
factory floors where Draka’s cables are made.
Draka’s ultimate goal is zero accidents. Instead of
submerging people in safety rules, Draka has invested
in behavioural changes through the ‘Working together
safely’ programme. Employees are trained by their
own colleagues, in sessions that draw on the experi-
ence and convictions of both trainer and trainees. This
has proved very successful: it has demonstrated a real
willingness to change and improve among employees,
and has helped foster genuine safety consciousness.
Improving resource efficiency
Seemingly small efficiency improvements in Draka’s
production processes can yield substantial benefits,
both in terms of the environment and the financial
bottom line. Draka invests time and energy in the
reduction of scrap waste, carbon emissions and
energy bills. Ways to achieve this include the
The first Oyster wave
energy device began
operating at sea
in november 2009
at the European
Marine Energy Centre
(EMEC) in Orkney. A
crucial factor in this
is the Draka cable
used to collect and
transport power.

Draka Holding | 63
inte gration of environmental standards into sourcing
and logistics processes and efficient use and re-use of
raw materials.
For example, an innovation in the way single mode
fiber optics are produced has enabled Draka to make
more fiber out of the same quantity of glass. In the
Draka-patented Plasma activated Chemical Vapour
Deposition Process (PCVD), high-purity glass is
deposited layer by layer inside a glass tube. This
process results in a so-called ‘core rod’. This core
rod is covered with inexpensive, lower purity glass,
resulting in a ‘preform’ from which optical fibers are
drawn. An isolation layer inside the core rod shields
the high-quality glass from the low-purity outer layer
of the preform.
To make the fiber-drawing process more efficient,
Draka engineers wanted to increase the amount of
high-quality optical glass in the core rod. This, how-
ever, meant that the isolation layer between the high-
purity glass in the core rod and the low-purity outer
layer would become thinner, compromising the fiber’s
quality. To counter this, an extra step was introduced
in the process, by which the core rod is first sleeved
with a high-purity tube and only then covered with
low-purity glass. Using this ‘gap-jacketing process’,
20% to 40% more fiber can be made from a single
preform, saving both raw materials and energy.
Caring for people
The key to sustainable performance is the continued
commitment and enthusiasm of Draka’s people.
Draka’s human resources strategy is to develop,
train, motivate and retain people, helping them to
derive maximum benefit from their potential.
Particular attention is given to providing the next
generation of professionals with opportunities to
develop their potential. One Draka facility that has
attracted attention because of its efforts in this area,
is Draka Wuppertal (Germany). Here, more than 120
apprentices have been trained over the last decade,
as part of the German Dual Education system: a com-
bination of training at vocational schools and gaining
hands-on experience in a real working environment.
At Draka Wuppertal, apprentices are given duties
and responsibilities early on during their apprentice-
ship. Job rotation enables them to work in various
departments, helping them to accumulate valuable
experience. Three times during the last five years,
Draka Wuppertal received an award for its outstan-
ding commitment to creating and safeguarding
training positions, and for its efforts to develop new
ideas to increase the quality and attractiveness of
dual education. Another award praised the company
for its “voluntary involvement in enriching economic
development and social cohesion”.
One planet

64 | Draka Holding Remuneration report
Remuneration report
This report describes the remuneration policies for the Board of
Management and the Supervisory Board of Draka Holding N.V.
as applied in 2010 and to be applied in 2011.
This remuneration report is in three sections. The first section
describes the remuneration policy applied to the Board of
Management in 2010 and the remuneration structure for
the Board of Management. The second section covers the
remuneration received by the Board of Management in 2010
and briefly discusses the remuneration policy to be applied to
the Board of Management in 2011. The third section describes
the remune ration policy for and remuneration received by the
Supervisory Board in 2010 and the remuneration policy to be
applied in 2011.
This remuneration report is available on Draka’s website at
www.draka.com
Board of Management remuneration policy in 2010
General
The remuneration policy for the Board of Management, as revised
by the General Meeting on 11 May 2007, continued to apply
throughout 2010. The aim of the Company’s remuneration policy
is to ensure that the Company is able to attract, motivate and
retain qualified and expert Board of Management members.
The underlying principle of the remuneration policy for 2010 and
subsequent years is that the total remuneration of the Board of
Management should be in line with a labour market peer group
of companies which engage in comparable activities and/or are
similar in terms of size and/or complexity. The composition of the
total shareholder return peer group remained unchanged in 2010.
The Remuneration & Nomination Committee consults indepen-
dent remuneration advisors, who use statistical models to gear
the remuneration data for the peer group companies to Draka’s
size. Draka’s labour market peer group consists of the following
companies:
Draka’s labour market peer group
Bekaert (Belgium) Leoni (Germany)
Daetwyler (Switzerland) Nexans (France)
Fugro (Netherlands) NKT Holding (Denmark)
Heijmans (Netherlands) Oce (Netherlands)
Imtech (Netherlands) Prysmian (Italy)
Legrand (France) SBM Offshore (Netherlands)
Leoni (Germany)
Nexans (France)
NKT Holding (Denmark)
Oce (Netherlands)
Prysmian (Italy)
SBM Offshore (Netherlands)
The remuneration of the members of the Board of Management
has been aligned with this European labour market peer group.
Remuneration structure
The total remuneration package of the members of the Board of
Management consists of:
• base salary;
• short-term incentive;
• long-term incentive;
• pension plan.
Base salary
The base salaries are in line with the median market level for
Draka’s European labour market peer group.
short-term incentive (bonus)
The short-term incentive is based on the following performance
criteria:
• one-third based on the Company’s earnings before interest, tax,
depreciation of assets, write-downs on loans and amortisation
of goodwill (EBITDA);
• one-third based on the Company’s average net working capital
as a percentage of annual revenue;
• one-third based on the discretionary judgment of and the
Remuneration & Nomination Committee’s proposals to the
Supervisory Board, related to certain ‘milestones’ and applying
a reasonableness test. For 2010, these targets were related
partly to the achievement of certain results in the context of
the Operation Excellence programme.
If the predetermined targets for 2010 are met, the members of
the Board of Management will receive a bonus of 60% of base
salary. If outstanding performance is achieved, a bonus of up to
90% of base salary may be granted to the members of the Board
of Management. If performance is below a given threshold, no
bonus will be paid.
Draka regards this combination of performance criteria as a good
indicator of the Company’s short-term operational performance.
The financial statements and financial reports can be used to
determine whether the predetermined performance targets have
been met. The specific details of the targets are not disclosed
because they qualify as competition-sensitive and hence commer-
cially confidential information. On the advice of its Remuneration
& Nomination Committee, the Supervisory Board reviews the
short-term incentive targets each year to ensure that they are
challenging, realistic and consistent with Draka’s strategy.
Long-term incentive
The long-term incentive consists of an annual conditional grant
of performance shares. Depending on Draka’s total shareholder
return (TSR), the performance shares may vest (i.e. become
unconditional) after three years.

Draka Holding | 65Remuneration report
Draka’s TSR are measured against those of the following listed
companies (principal listing):
Draka’s tsR performance peer group
Belden CDT NYSE
Commscope NYSE
Daetwyler Swiss Stock Exchange
Fugro Euronext Amsterdam
Fujikura Tokyo Stock Exchange
General Cable Corp NYSE
Imtech Euronext Amsterdam/Dow Jones
Leoni Frankfurt Stock Exchange
Nexans Euronext Paris
Océ Euronext Amsterdam
Prysmian Milan Stock Exchange
SBM Offshore Euronext Amsterdam
The table below shows the number of shares – as a percentage of
the number of shares conditionally granted– that will vest for each
position within the peer group after the three-year performance
measurement period. Consistent with the principles of the Dutch
Corporate Governance Code, vested shares must be held
for a further two years after vesting.
Position number of shares vesting
(as a percentage of the number of shares conditionally granted)
1 200%
2 166 2/3%
3 133 1/3%
4 100%
5 83 1/3%
6 66 2/3%
7 50%
8–14 0%
The annual grant of conditional performance shares is equivalent
to 55% of base salary. The Supervisory Board has authority to
grant additional performance shares in exceptional circumstances.
Pension plan
Pension plans are in principle based on the median level for the
labour market in the country of origin of each member of the
Board of Management.
Loans
No loans, guarantees or the like are provided to/for members
of the Board of Management of Draka.
Board of Management remuneration in 2010
In accordance with best-practice provision II.2.1, the Remuneration
& Nomination Committee of the Supervisory Board analysed
the outcome of the variable remuneration elements and their
consequences for the remuneration of the members of the
Board of Management before determining the remuneration of
the individual members of the Board of Management, so called
scenario analysis.
Base salary
The base salary of Frank Dorjee has been adjusted in 2010 in
relation with his new function as CEO and Chairman of the Board
of Management. The salary of Okke Koo was determined at his
entrance into office in January 2010.
short-term incentive
On the basis of the financial targets, the short-term incentive
bonus for 2010 will be 50% of base salary. As regards the discre-
tionary element, the Supervisory Board has decided to pay to
Frank Dorjee 30% of his base salary. The Supervisory Board has
thus decided to pay a total bonus of 80% (compared with the
maximum of 90%) of base salary for 2010 to Frank Dorjee.
The Supervisory Board has decided to pay to Okke Koo a bonus
of 60% of his base salary.
An additional bonus of € 300.000 has been granted to Frank
Dorjee in 2010 as compensation for the period in 2009 when
he took over the position of CEO in combination with his function
as CFO as well as the period in 2010 when he acted as the sole
member of the Board of Management and ensured the proper
functioning of the Board of Management. The bonus payments
for the 2010 financial year are shown in the remuneration table
on page 66.
Long-term incentive
The members of the Board of Management, consistent with
this policy, have been awarded conditional performance shares
to the value of 55% of base salary in respect of 2010.
Pensions
Frank Dorjee has a defined-contribution pension plan, for which
the contributions have been structured as follows since 1 January
2006:
• from 1 January 2006 to age 54 23.0% of base salary
• age 55–59 28.6% of base salary
• from age 60 36.1% of base salary
The contribution to Frank Dorjee’s pension plan is based on his
base salary in excess of the threshold (amounting to € 12,673 in
2010).
Okke Koo has a defined-contribution pension plan, for which the
contributions have been structured as follows since 1 January
2010:
• from 1 January 2006 to age 54 23.0% of base salary
• age 55–59 28.6% of base salary
The contribution to Okke Koo’s pension plan is based on his base
salary in excess of the threshold (amounting to € 12,673 in 2010).
Overview
The table on page 66 shows the expense incurred by the Company
in respect of remuneration of the members of the Board of
Management in 2010.

66 | Draka Holding Remuneration report
The long-term incentive reflects the market value of shares
(conditionally) granted to the members of the Board of Mana-
gement. The actual grant of shares depends on the Company’s
future performance compared with the peer group.
The members of the Board of Management currently hold no
options on ordinary Draka Holding N.V. shares.
The number of shares held by the members of Board of Mana-
gement since their appointment as at 31 December of each
calendar year was as follows:
number of shares value of shares in euros
Frank Dorjee
31-12-2005 - -
31-12-2006 4,737 122,215
31-12-2007 9,940 228,620
31-12-2008 9,940 65,008
31-12-2009 9,940 133,792
31-12-2010 9,940 189,854
Okke koo
31-12-2010 - -
number of
conditionally value on granted value on date value on date date shares performance of grant of vesting became freely shares in euros in euros disposable
Frank Dorjee
31-12-2005 - - - -
31-12-2006 - - - -
31-12-2007 24,788 702,740 n/a n/a
31-12-2008 44,582 944,029 n/a n/a
31-12-2009 99,834 1,163,379 n/a n/a
31-12-2010 95,267 763,145 n/a n/a
Okke koo
31-12-2010 5,821 87,082 n/a n/a
employment contracts
The members of the Board of Management have been appointed
for a determinate period.
Frank Dorjee’s employment contract was entered into on 1 June
2007 for a period of four years and will therefore expire on 31 May
2011. The employment contract provides for a notice period of
three months in the case of termination by Frank Dorjee and six
months in the case of termination by the Company. An exit
arrangement had been agreed with Frank Dorjee which provided
for payment of one full year’s base salary plus a one-year bonus
equal to the average bonus received in the previous three years in
the event of the employment contract being terminated other
than for cause before 31 May 2011.
Frank Dorjee’s employment contract has been revised in connec-
tion with his appointment as Chairman of the Board of Manage-
ment and Chief Executive Officer with effect from 1 January 2010.
The exit arrangements under this revised employment contract
comply with best-practice provision II.2.8 of the Code. The exit
payment will now be one year’s base salary in the event of the
employment contract being terminated other than for cause
before 31 May 2011. A clawback clause in accordance with best-
practice provision II.2.11 of the Code is also included, which makes
provision for the recovery of variable remuneration awarded on
the basis of incorrect (financial) information.
Okke Koo’s employment contract was entered into on 1 January
2010 for a period of four years and will therefore expire on
31 December 2013. The employment contract provided for a
notice period of three months in the case of termination by
Okke Koo and six months in the case of termination by the
Company. An exit arrangement had been agreed with Okke Koo
which provided for payment of one year’s base salary in the
event of the employment contract being terminated other than
for cause before the end of the period. Okke Koo has prematurely
terminated his employment contract as of 31 December 2010.
Board of Management remuneration in 2011
The remuneration policy for the members of the Board of Mana-
gement, as adopted by the General Meeting in 2007, will continue
to apply in 2011. Consistent with this policy, Frank Dorjee’s base
salary in his position as Chairman of the Board of Management
and Chief Executive Officer is € 561,000 gross.
supervisory Board remuneration policy
The remuneration policy for the members of the Supervisory
Board is based on the median level of Draka’s European labour
market peer group, which is the same as the European labour
market peer group used for the members of the Board of
Management.
Consistent with the Dutch Corporate Governance Code, the
remuneration of the members of the Supervisory Board is not
dependent on the Company’s results. Consequently, neither
stock options nor performance shares are granted to Supervisory
Board members by way of remuneration. Any shares in Draka
held by Supervisory Board members should be held as a long-
term investment. The Company does not grant loans to members
of the Supervisory Board.
Regulations are in place governing the holding of and transactions
in securities by members of the Supervisory Board other than
securities issued by Draka.
In thousands of euro total
salary Paid out short-term Allowances total cash Pension Long-term total employer’s remuneration
holiday incentive remuneration charges incentive remuneration expense expense
Frank Dorjee 550 34 740 3 1,327 130 293 1,750 7 1,757
Okke Koo 475 - 285 6 766 109 87 962 7 969

Draka Holding | 67Remuneration report
The following remuneration is received by the members of the
Supervisory Board and its separate committees:
Chairman Deputy Chairman Members
Supervisory Board € 70,000 € 55,000 € 50,000
Audit & Governance Committee € 10,000 € 6,000
Remuneration & Nomination
Committee € 7,500 € 5,000
Strategy Committee € 7,500 € 5,000
In addition to the fixed remuneration, members of the Supervisory
Board are entitled to an expense allowance of € 1,000 per year.
The Chairman’s expense allowance is € 1,250 per year. The
members of the Supervisory Board are reimbursed for travel
and accommodation expenses.
supervisory Board remuneration in 2010
The following remuneration was received by the Supervisory
Board members in 2010 and 2009:
2010 2009
Fritz Fröhlich (Chairman) € 83,500 € 83,500
Annemiek Fentener van Vlissingen
(Deputy Chairman) € 61,500 € 66,000
Bernard Dijkhuizen 1 € 36,667 -
Harold Fentener van Vlissingen € 61,000 € 56,000
Ludo van Halderen € 61,650 € 60,000
Rob van Oordt € 65,000 € 65,000
Annemieke Roobeek 2 € 18,333 € 55,000
Maarten Schönfeld 1 € 37,333 -
Graham Sharman 2 € 21,167 € 63,500
Aad Veenman 1 € 37,333 -
1 As from 20 April 2010.
2 Until 20 April 2010.
supervisory Board remuneration in 2011
No change in the remuneration of the Supervisory Board is
proposed for 2011.

68 | Draka Holding Share information
Share information
stock exchange listing
Draka Holding N.V. shares have been listed on NYSE Euronext Amsterdam since 1991. In March 2001, the share
was included for the first time in the Next150 index (symbol: DRAK, stock code: 34781, ISIN code: NL0000347813).
Draka is included in NYSE Euronext’s AMX (Amsterdam Midkap) index. Draka’s market capitalization as at year-end
2010 amounted to approximately € 930 million.
Options on Draka shares have been traded on NYSE Liffe in Amsterdam since July 2002.
Draka Holding n.v. share price performance (October 1991–February 2011)
Capital and shares
The authorised capital of Draka Holding N.V. is composed as follows (all shares have a nominal value of € 0.50):
2010 Authorised Issued
Ordinary bearer shares and registered shares 58,000,000 48,736,597
Registered preference shares 1 12,000,000 5,754,657
Class B preference shares 1, 2 70,000,000 -
Authorised capital 140,000,000 54,491,254
1 Not tradable on the Amsterdam stock exchange.2 No class B preference shares have been issued so far.
As at 31 December 2010, there were 54,491,254 fully paid-up shares in issue, representing an amount of
€ 27,245,627. There was thus no change from the position as at 31 December 2009.

Draka Holding | 69Share information
Repayment of subordinated convertible loan 2010
The € 100 million 4% subordinated convertible bond loan was repaid in full at par on 22 September 2010.
Of the € 100 million of bonds issued originally in 2005, bonds to the value of € 25,715,000 remained in
issue following Draka’s combined bid of cash and shares on 8 December 2008. The remaining bonds
were repaid at par from Draka’s available funds.
notifications of substantial holdings
Under the Financial Supervision Act (WFT) which has been introduced in the Netherlands, shareholders
are required to disclose their holding if it represents 5% or more of the issued shares. The following holders
of ordinary shares and preference shares which qualify under WFT (most recent notification dated
11 January 2011) are known:
Ordinary Preference
Interest shares shares 1
Flint Investments B.V. 43.9% x
Fortis Utrecht N.V. 6.8% x
Ducatus N.V. 5.2% x
1 Not tradable on the Amsterdam stock exchange.
In addition to these large shareholders, substantial blocks of shares (less than 5%) are held by foreign institutional
investors, mainly in the United Kingdom and the United States. Draka estimates that the free float of its ordinary
shares traded on the stock exchange has shown little change over the past year, remaining at approximately 50%.
Dividend policy
On its ordinary shares, Draka aims to distribute a dividend equal to 30% of the result for the year attributable to
shareholders (excluding non-recurring items) after the dividend on the preference shares.
It is proposed that no dividend be paid on ordinary shares in respect of 2010. The reason for this proposal is that
Prysmian’s offer is cum dividend. No dividend was distributed in respect of 2009 either.
A dividend of approximately 7.1% is paid to the holders of the preference shares in issue. The total 2010 dividend
on the preference shares amounts to € 5.4 million.
Liquidity provider
Draka has appointed two liquidity providers, Royal Bank of Scotland Group and Rabo Securities N.V., to ensure
orderly and increasing trade in its shares. A total of 183,271 trades in Draka shares were executed in 2010, up
17.0% compared with 2009. Some 68.2 million (+25%) shares, or 140% of the average number of ordinary shares
in issue, were traded.
share and option plan
The long-term incentive plan, which Draka introduced in June 2002, comprises a share plan and an option plan.
Qualifying senior managers – with the exception of members of the Board of Management which has its own
long-term incentive plan (see ‘Remuneration report’) – are granted options and stock appreciation rights (SARs)
on Draka ordinary shares or are allowed to buy Draka ordinary shares as part of their regular net bonus. Both
the shares and the options/SARs are subject to an initial three-year lock-up period during which they cannot
be traded or exercised. Under the share plan, Draka will double the number of shares after the three-year period.
The options/SARs are granted for eight years.

70 | Draka Holding
As at 31 December 2010, there were 717,383 outstanding options/SARs and 26,706 assigned shares. The option/
SAR exercise prices and share allocation prices since 2002 have been as follows:
number of shares number of options/sARs exercise price
2003 – 5,007 € 7.42
2004 – 16,789 € 11.63
2005 – 43,399 € 10.05
2006 – 84,372 € 13.51
2007 – 102,722 € 28.02
2008 4,706 126,267 € 23.44
2009 14,301 190,020 € 7.93
2010 7,699 148,807 € 14.41
total 26,706 717,383
General Meeting of shareholders
The General Meeting of Shareholders held on 20 April 2010, at which 61.1% of the total shares in issue were
represented, adopted the following resolutions:
• adoption of the 2009 financial statements and dividend;
• ratification of the actions of the Board of Management and the Supervisory Board with regard to their
management and supervision, respectively, in 2009;
• approval of the appointment of Okke Koo as a member of the Board of Management with effect from
20 April 2010;
• approval of the reappointment of Ludo van Halderen and Harold Fentener van Vlissingen and appointment
of Maarten Schönfeld, Aad Veenman and Bernard Dijkhuizen as members of the Supervisory Board;
• approval of the proposal to fix the number of members of the Supervisory Board at eight;
• approval and adoption of the proposal by the Board of Management and the Supervisory Board to appoint
Deloitte Accountants B.V. as the auditors for the 2010 financial year;
• designation of the Board of Management as the body authorised to resolve, subject to the approval of
the Supervisory Board, to issue shares or to grant rights to subscribe for shares for a period ending on
20 October 2011;
• designation of the Board of Management as the body authorised to resolve, subject to the approval of the
Supervisory Board, to restrict or exclude statutory pre-emptive rights for a period ending on 20 October 2011.
• authorization of the Board of Management to acquire the company’s own shares, up to maximum of 10% of the
issued capital at that time, for a period ending on 20 October 2010.
extraordinary General Meeting of shareholders
On 26 January 2011 the Company held an Extraordinary General Meeting of Shareholders to discuss the offer of
Prysmian S.p.A. During this Extraordinary General Meeting of Shareholders, at which 73.2% of the total shares in
issue were represented, the following resolutions were adopted:
• amendment of the articles of association of the Company in accordance with the proposals made by the Board
of Management of the Company as per the date of settlement of the offer;
• ratification of the actions of the Supervisory Board with regard to their supervision in 2010;
• approval of the appointment of Massimo Battaini, Francesco Facchini and Fabio Romeo as members of the
Supervisory Board as per the date of settlement of the offer;
• approval of the resignation of Annemiek Fentener van Vlissingen, Fritz Fröhlich, Bernard Dijkhuizen, Harold
Fentener van Vlissingen, Rob van Oordt and Maarten Schönfeld as members of the Supervisory Board as per
the date of settlement of the offer.
Investor relations
Draka is committed to maintaining a continuous dialogue with all stakeholders by pursuing an open and active
communication policy. Draka aims to communicate as transparently as possible about its activities in order to
provide insights into its strategy, objectives, product and market developments and financial results.
Draka published information on its performance on four occasions last year. In addition to its full-year figures
for 2009 and interim figures for 2010, Draka also released two trading updates, in May and November. When
announcing the full-year figures for 2009 and the interim figures for 2010, meetings were organised for
Share information

Draka Holding | 71
journalists and analysts to provide further background to the results and give those present an opportunity
to ask questions. A webcast was also organised on these two occasions and on publication of the 2010 trading
updates, enabling interested parties who were unable to attend to listen to the discussions on the full-year
figures for 2009, the interim figures for 2010 and the 2010 trading updates.
As in previous years, Draka conducted an active investor relations policy in 2010, with the members of the Board
of Management giving briefings on Draka’s strategy, activities and results. Draka management met with a large
number of investors in various financial centres in Europe and North America throughout the year and especially
after the publication of the full-year figures for 2009 and the interim figures for 2010. Institutional investors
exhibited significantly greater enthusiasm last year than the year before: some 200 one-on-one meetings were
held with investors in 2010, compared with 150 in 2009. In conjunction with NCVB (Dutch Central Association
for Capital Growth and Investment Education), Draka also gave two presentations to groups of private investors,
followed by a guided tour of the plant and the innovation centre in Amsterdam-Noord.
Investor relations rankings
For the fourth year in succession, Draka’s annual report for 2009 was awarded a certificate of transparency by
the Scenter research bureau. This award gives an indication of the transparency in terms of policy and strategy
against seven criteria.
Other information
Specific information for investors can be found on the website www.draka.com which, as well as the latest share
data, provides comprehensive information on Draka’s activities, strategy, objectives and outlook. Also posted on
the website is an interactive version of the annual report, which includes a comprehensive search function, and
detailed information from the analysts who follow Draka and their assessments of and recommendations for the
share. Draka’s Director Investor Relations, Michael Bosman can be contacted on +31 20 568 9805 or by e-mail to
key figures per ordinary share (x € 1) 2010 2009 2008 2007 2006
Shareholders’ equity (excluding preference shares) 10.52 9.69 8.96 9.11 9.85
Result for the year after dividend on preference shares (0.02) (0.56) 1.78 2.46 0.57
Dividend 0.00 0.00 0.00 0.68 0.37
Pay-out 0% 0% 0% 30%1 30%1
Share price, high 20.06 14.26 25.20 42.20 26.60
Share price, low 9.95 4.17 5.97 19.75 11.70
Year-end share price 19.10 13.46 6.54 23.00 25.80
Price/earnings ratio based on year-end price n/a n/a 3.7 9.3 54.9
1 Based on earnings per share excluding non-recurring items.
Financial calendar (provisional)
9 May 2011 : Annual General Meeting of Shareholders at Draka’s head office in Amsterdam
12 May 2011 : Publication of first quarter 2011 results
26 August 2011 : Publication of first-half results for 2011
10 November 2011 : Publication of third quarter 2011 results
Share information


Financial statements 2010

74 | Draka Holding Financial statements 2010
In millions of euro Note* 2010 2009
Revenue 6) 2,427.8 2,048.3
Cost of sales (2,211.7) (1,855.2)
Gross profit 216.1 193.1
Selling and distribution expenses (133.8) (124.8)
Other income and expenses 7) (53.7) (59.5)
Operating result 28.6 8.8
Finance income 3.1 3.7
Finance expense (35.0) (34.9)
Net finance expense 12) (31.9) (31.2)
Share of profit of equity accounted investees (net of income tax) 16) 8.0 5.0
Result before income tax 4.7 (17.4)
Income tax benefit 13) 1.8 1.9
Result for the year 6.5 (15.5)
Attributable to:
Equity holders of the company 4.6 (18.2)
Minority interests 1.9 2.7
Result for the year 6.5 (15.5)
Basic earnings per share (euro) 22) (0.02) (0.56)
Diluted earnings per share (euro) 22) (0.02) (0.56)
Consolidated statement of incomeFor the year ended 31 December
Consolidated statement of comprehensive incomeFor the year ended 31 December
In millions of euro 2010 2009
Result for the year 6.5 (15.5)
Foreign exchange translation differences 38.7 6.2
Effective portion of fair value changes of cash flow hedges (net of income tax) 8.5 23.3
Share of other comprehensive income of equity accounted investees (0.5) 2.6
Other comprehensive income for the year 46.7 32.1
Total comprehensive income for the year 53.2 16.6
Attributable to:
Equity holders of the company 49.2 14.5
Minority interests 4.0 2.1
Total comprehensive income for the year 53.2 16.6
* The notes to the consolidated financial statements on pages 78 to 125 are an integral part of these consolidated financial statements.

Draka Holding | 75Financial statements 2010
In millions of euro Note* 2010 2009
Assets
Non-current assets
Property, plant and equipment 14) 540.2 541.7
Intangible assets 15) 113.5 114.3
Investments in equity accounted investees 16) 58.8 49.7
Deferred tax assets 13) 60.9 51.9
Derivative financial instruments 28) 3.8 0.6
Other non-current financial assets 17) 14.4 15.0
Total non-current assets 791.6 773.2
Current assets
Inventories 18) 399.8 350.3
Trade and other receivables 19) 485.3 381.4
Derivative financial instruments 28) 8.9 9.5
Income tax receivable 2.4 0.9
Cash and cash equivalents 20) 138.7 74.0
Total current assets 1,035.1 816.1
Total assets 1,826.7 1,589.3
Equity
Shareholders’ equity
Share capital 27.2 27.2
Share premium 457.5 457.5
Retained earnings 80.0 84.5
Other reserves 25.1 (19.7)
Total equity attributable to equity holders of the company 589.8 549.5
Minority interests 25.0 21.0
Total equity 21, 37) 614.8 570.5
Liabilities
Non-current liabilities
Interest-bearing loans and borrowings 23) 44.1 286.8
Provision for employee benefits 24) 81.6 82.7
Derivative financial instruments 28) 5.3 5.6
Other provisions 25) 16.4 20.0
Deferred tax liabilities 13) 16.9 19.0
Total non-current liabilities 164.3 414.1
Current liabilities
Bank overdrafts 20) 9.8 6.9
Interest-bearing loans and borrowings 23) 368.2 74.7
Derivative financial instruments 28) 5.9 5.0
Trade and other payables 26) 645.2 489.3
Income tax payable 6.9 6.3
Other provisions 25) 11.6 22.5
Total current liabilities 1,047.6 604.7
Total liabilities 1,211.9 1,018.8
Total equity and liabilities 1,826.7 1,589.3
Consolidated balance sheetAs at 31 December
* The notes to the consolidated financial statements on pages 78 to 125 are an integral part of these consolidated financial statements.

76 | Draka Holding
Consolidated statement of cash flowsFor the year ended 31 December
In millions of euro Note* 2010 2009
Result for the year 6.5 (15.5)
Adjustments for:
Depreciation 14) 55.8 56.6
Amortisation 15) 6.9 6.3
Impairments 14) 0.4 4.1
Finance income 12) (3.1) (3.7)
Finance expense 12) 35.0 34.9
Share of profit of equity accounted investees 16) (8.0) (5.0)
Equity-settled share-based payments 11) 1.3 2.4
Income tax benefit 13) (1.8) (1.9)
93.0 78.2
Changes in inventories 18) (34.3) 26.7
Changes in trade receivables 19) (83.2) 43.6
Changes in trade payables 26) 104.9 73.1
Changes in other working capital 31.0 3.0
Changes in provisions 19.5 30.1
Other 2.9 (1.6)
133.8 253.1
Interest received 1.9 2.4
Interest paid (25.7) (40.9)
Income tax paid (13.3) (6.8)
Application of provisions 24, 25) (38.3) (18.6)
Net cash from operating activities 58.4 189.2
Dividends received 16) 2.8 2.2
Proceeds from sale of property, plant and equipment and intangible assets 6.7 4.6
Disposal of subsidiaries and associates, net of cash disposed - 6.9
Acquisition of subsidiaries and associates, net of cash acquired (3.0) (7.2)
Acquisition of intangible assets 15) (4.4) (6.9)
Acquisition of property, plant and equipment 14) (34.7) (35.4)
Net cash used in investing activities (32.6) (35.8)
Issue of shares - 98.7
Dividends paid (preference shares) (5.4) (5.4)
Convertible subordinated bond redeemed (25.7) -
Movement in multicurrency facility 54.5 (241.0)
Shares acquired under long-term incentive plans (0.2) (1.7)
Shares delivered under long-term incentive plans 0.6 0.9
Movements in other bank loans 8.8 22.3
Net cash from financing activities 32.6 (126.2)
Net increase in cash and cash equivalents 58.4 27.2
Cash and cash equivalents at 1 January (net of bank overdrafts) 67.1 41.2
Exchange rate fluctuations on cash and cash equivalents 3.4 (1.3)
Cash and cash equivalents at 31 December (net of bank overdrafts) 20) 128.9 67.1
* The notes to the consolidated financial statements on pages 78 to 125 are an integral part of these consolidated financial statements.
Financial statements 2010

Draka Holding | 77
Consolidated statement of changes in total equity*
In millions of euro Reserve Preference for shares Share- Share Share Translation Hedging treasury dividend Retained holders’ Minority Total capital premium reserve reserve shares reserve earnings equity Interests equity
Balance as at 31 December 2008 22.8 360.9 (29.6) (27.8) (0.1) 5.4 108.8 440.4 25.4 465.8
Foreign exchange translation differences - - 6.8 - - - - 6.8 (0.6) 6.2
Effective portion of fair value changes
of cash flow hedges (net of income tax) - - - 25.9 - - - 25.9 - 25.9
Total income and expenses recognised
directly in equity - - 6.8 25.9 - - - 32.7 (0.6) 32.1
Result for the year - - - - - 5.4 (23.6) (18.2) 2.7 (15.5)
Total recognised income and expense - - 6.8 25.9 - 5.4 (23.6) 14.5 2.1 16.6
Issue of shares 4.4 96.6 - - - - (2.3) 98.7 - 98.7
Share-based payments - - - - - 2.4 2.4 - 2.4
Shares acquired under long term incentive plans - - - - (1.7) - - (1.7) - (1.7)
Shares delivered under long-term incentive plans - - - - 1.4 - (0.5) 0.9 - 0.9
Dividends paid - - - - - (5.4) - (5.4) - (5.4)
Effect of acquisition minority interest - - - - - - (0.3) (0.3) - (0.3)
Effect of acquisitions and divestments - - - - - - - - (6.5) (6.5)
Total direct changes in equity 4.4 96.6 - - (0.3) (5.4) (0.7) 94.6 (6.5) 88.1
Balance as at 31 December 2009 27.2 457.5 (22.8) (1.9) (0.4) 5.4 84.5 549.5 21.0 570.5
Foreign exchange translation differences - - 36.6 - - - - 36.6 2.1 38.7
Effective portion of fair value changes of
cash flow hedges (net of income tax) - - - 8.0 - - - 8.0 - 8.0
Total income and expenses recognised
directly in equity - - 36.6 8.0 - - - 44.6 2.1 46.7
Result for the year - - - - - 5.4 (0.8) 4.6 1.9 6.5
Total recognised income and expense - - 36.6 8.0 - 5.4 (0.8) 49.2 4.0 53.2
Share-based payments - - - - - - 1.3 1.3 - 1.3
Shares acquired under long-term incentive plans - - - - (0.2) - - (0.2) - (0.2)
Shares delivered under long-term incentive plans - - - - 0.4 - 0.2 0.6 - 0.6
Dividends paid - - - - - (5.4) - (5.4) - (5.4)
Reclassification long-term incentive plans to
current liabilities due to modification from
equity-settled in cash-settled - - - - - - (5.2) (5.2) - (5.2)
Total direct changes in equity - - - - 0.2 (5.4) (3.7) (8.9) - (8.9)
Balance as at 31 December 2010 27.2 457.5 13.8 6.1 (0.2) 5.4 80.0 589.8 25.0 614.8
* The notes to the consolidated financial statements on pages 78 to 125 are an integral part of these consolidated financial statements.
Financial statements 2010

78 | Draka Holding Notes to the consolidated financial statements 2010
Notes to the consolidated financial statementsContents
1. General 79
2. Significant accounting policies 79
3. Acquisitions and divestments of subsidiaries 93
4. Financial risk management 94
5. Critical accounting estimates and assumptions 99
6. Segment reporting 101
7. Other income and expenses 102
8. Non-GAAP financial measures (non-recurring items) 102
9. Employee benefit expense 103
10. Remuneration of the Board of Management and Supervisory Board 103
11. Share-based payments 103
12. Net finance expense 106
13. Taxes 107
14. Property, plant and equipment 110
15. Intangible assets 111
16. Investments in equity accounted investees and joint ventures 113
17. Other non-current financial assets 114
18. Inventories 114
19. Trade and other receivables 114
20. Cash and cash equivalents 115
21. Total equity 115
22. Earnings per share 115
23. Interest-bearing loans and borrowings 116
24. Provision for employee benefits 117
25. Other provisions 120
26. Trade and other payables 120
27. Financial instruments 121
28. Derivative financial instruments 124
29. Commitments and contingent liabilities 125
30. Related parties 125
31. Events after the balance sheet date 125

Draka Holding | 79Notes to the consolidated financial statements 2010
1. GeneralDraka Holding N.V. (“the Company”) is a company domiciled in Amsterdam, The Netherlands and is
engaged worldwide in the development, production and sale of cable and cable systems. Our activities
are subdivided into three groups: Draka Energy and Infrastructure, which develops, produces and sells
the full range of cable products for the domestic, infrastructural and industrial applications, Draka Industry
and Specialty, which is responsible for all special-purpose cable activities, and Draka Communications,
which handles the communication cable activities. The consolidated financial statements of the Company
for the year ended 31 December 2010 comprise the Company and its subsidiaries (together referred to as
“the Group”) and the Group’s interest in associates and jointly controlled entities.
A summary of the main subsidiaries is included on page 49 of this Annual report.
The financial statements were authorised for issue by the Board of Management on 14 February 2011.
The financial statements are tabled for adoption by the Annual General Meeting of Shareholders.
The information concerning the subsidiaries that are included in the consolidated financial
statements which is required under article 414 of Part 9, Book 2, of the Netherlands Civil Code, is filed
at the trade register of the Chamber of Commerce in Amsterdam. The income statement included in the
Company financial statements have been drawn up in accordance with article 402, Part 9, Book 2 of the
Netherlands Civil Code, which allows a simplified income statement in the Company financial statements
in the event that a comprehensive income statement is included in the consolidated financial statements.
These consolidated financial statements serve as exemption regarding the otherwise obligatory filing
pursuant to § 264b HGB of the German Commercial Code (“Handelsgesetzbuch”) for the statutory
financial statements of Draka Comteq Berlin GmbH & Co. KG and Draka Comteq Germany GmbH & Co. KG.
2. Significant accounting policies(a) Statement of complianceThe consolidated financial statements have been prepared in accordance with International Financial
Reporting Standards (“IFRS”) as adopted by the European Union (“EU”) and in accordance with Part 9
of Book 2 of the Netherlands Civil Code.
IFRS includes the application of International Financial Reporting Standards including International
Accounting Standards (IAS) and related Interpretations of the International Financial Reporting Inter-
pretations Committee (IFRIC) and Interpretations of the Standing Interpretations Committee (SIC).
Impact acquisition Draka by Prysmian
On 22 November 2010, Prysmian S.p.A. (“Prysmian”) and Draka Holding N.V. (‘Draka”) jointly announced
they reached a conditional agreement in connection with a public offer by Prysmian for all issued
and outstanding ordinary shares of Draka at an offer price of € 8.60 in cash plus 0.6595 newly issued
Prysmian ordinary shares for each Draka ordinary share. On 3 February 2011, 44,064,748 Shares
have been tendered for acceptance under the Offer, representing around 90.4% of Draka’s issued
and outstanding ordinary share capital (excluding any Shares held by Draka). On 8 February 2011,
Prysmian declared the public offer for all Shares in Draka unconditional.
Based on the above, Management’s current expectation is that the public offer will succeed, which triggers
several change of control and transaction related items that have been accounted for in the consolidated
financial statements as per 31 December 2010 in accordance with the applicable IFRS standard. The items
with the most significant impact are discussed below:
• Share based payments
In case of a change of control, all incentive plans will be settled in cash. This leads to a modification of the
equity settled incentive plans into cash settled incentive plans. To calculate the amount that needed to be
reclassified from equity to liabilities, the fair value at the expected date of settlement (1 March 2011) was
used as best estimate of the fair value at the date of modification (31 December 2010). The reclassification
from equity to liabilities amounts to € 5.2 million. The total liability as at 31 December 2010 equal to the
expected cash out at 1 March 2011, amounts to € 5.8 million.

80 | Draka Holding Notes to the consolidated financial statements 2010
• Multicurrency revolving credit facility (RCF)
In case of a change of control, the lenders of the multicurrency revolving credit facility (RCF) have
the right to cancel the facility. Therefore the RCF, with an original maturity date of December 2012, has
been reclassified to the current portion of interest bearing loans and borrowings. Furthermore the at
31 December 2010 remaining fees in the amount of € 1.8 million, originally to be amortized until 2012,
were fully charged to the 2010 statement of income.
• Success fees and other to be incurred expenses
Several success fees are payable upon successful completion of the take over. A total amount of
€ 6.0 million has been provided for in the consolidated financial statements as per 31 December 2010.
(I) Standards, amendment and interpretations effective in 2010 relevant to the Group:
• On January 1, 2010, the Company applied IFRS 3 ‘Business Combinations’ (revised standard 2008)
in accounting for business combinations. The revised standard has been applied prospectively; the
change did not have a material impact on the Company’s consolidated financial statements. For
acquisitions on or after January 1, 2010, the contingent consideration transferred is valued at fair
value; changes after initial recognition are recorded in the profit and loss account. Transaction costs,
other than those associated with the issue of debt or equity securities, which the Company incurs in
connection with a business combination, are expensed as incurred.
Other IFRS standards and interpretations effective from January 1, 2010 did not have a material impact
on the Company.
(II) Standards, amendments to and interpretations of existing standards that are relevant to the
Group that are not yet effective and have not been early adopted by the Group:
The following standards, amendments to and interpretations of existing standards have been published
and are mandatory for the Group’s accounting periods beginning on or after 1 January 2011 or later
periods. The Group has not early adopted them:
• IFRS 9, ‘Financial instruments’, issued in December 2009. This addresses the classification and
measurement of financial assets and is likely to affect the Group’s accounting for its financial assets.
The standard is not applicable until 1 January 2013 and has not yet been endorsed by the European
Union. The Group is yet to assess IFRS 9’s full impact. The Group has not yet decided when to adopt
IFRS 9.
• Revised IAS 24, ‘Related party disclosures’, issued in November 2009. It supersedes IAS 24, ‘Related
party disclosures’, issued in 2003. The revised IAS 24 is required to be applied from 1 January 2011.
Earlier application, in whole or in part, is permitted.
• ‘Prepayments of a minimum funding requirement’ (Amendments to IFRIC 14), issued in November
2009. The amendments correct an unintended consequence of IFRIC 14, ‘IAS 19 – The limit on a defined
benefit asset, minimum funding requirements and their interaction’. Without the amendments, entities
are not permitted to recognise as an asset some voluntary prepayments for minimum funding contribu-
tions. This was not intended when IFRIC 14 was issued, and the amendments correct the problem. The
amendments are effective for annual periods beginning 1 January 2011. Earlier application is permitted.
The amendments should be applied retrospectively to the earliest comparative period presented.
The Group does not expect this amendment to have a significant impact.
• IFRIC 19, ‘Extinguishing financial liabilities with equity instruments’. This clarifies the requirements of
IFRSs when an entity renegotiates the terms of a financial liability with its creditor and the creditor
agrees to accept the entity’s shares or other equity instruments to settle the financial liability fully or
partially. The interpretation is effective for annual periods beginning on or after 1 July 2010. Earlier
application is permitted. The Group does not expect this amendment to have a significant impact.
• Improvements to International Financial Reporting Standards 2010 were issued in May 2010. The
effective dates vary standard by standard but most are effective 1 January 2011. The Group does
not expect this amendment to have a significant impact.

Draka Holding | 81Notes to the consolidated financial statements 2010
(b) Basis of preparationUnless indicated otherwise, all amounts in the financial statements are reported in millions of Euros. They
are prepared on the historical cost basis except that the following assets and liabilities are stated at their
fair value: derivative financial instruments, financial instruments held for trading and financial instruments
classified as available for sale. Non-current assets and disposal groups held for sale are stated at the lower
of their carrying amount and fair value less costs to sell.
The preparation of financial statements in conformity with IFRS requires management to make judge-
ments, estimates and assumptions that affect the application of policies and reported amounts of assets
and liabilities, income and expenses. The estimates and associated assumptions are based on historical
experience and various other factors that are believed to be reasonable under the circumstances, the
results of which form the basis of making the judgements about carrying values of assets and liabilities
that are not readily apparent from other sources. Actual results may differ from these estimates.
The estimates and underlying assumptions are reviewed on an ongoing basis. Revisions to accounting
estimates are recognised in the period in which the estimate is revised if the revision affects only that period,
or in the period of the revision and future periods if the revision affects both current and future periods.
Judgements made by management in the application of IFRS that have a significant effect on the financial
statements and estimates with a significant risk of material adjustment in the next year are discussed in
note 5.
(c) Basis of consolidation(I) Subsidiaries
Subsidiaries are entities controlled by the Company. Control exists when the Company has the power,
directly or indirectly, to govern the financial and operating policies of an entity so as to obtain benefits
from its activities. In assessing control, potential voting rights that presently are exercisable or convertible
are taken into account. The financial statements of subsidiaries are included in the consolidated financial
statements from the date that control commences until the date that control ceases.
(II) Equity accounted investees
Associates, included in equity accounted investees on the balance sheet, are those entities over which
the Group has the ability to exercise significant influence, but not control, over the financial and operating
policies. The consolidated financial statements include the Group’s share of the total recognised gains
and losses of associates on an equity accounted basis, from the date that significant influence commences
until the date that significant influence ceases. When the Group’s share of losses exceeds its interest in an
associate, the Group’s carrying amount is reduced to nil and recognition of further losses is discontinued
except to the extent that the Group has incurred legal or constructive obligations or made payments on
behalf of an associate.
(III) Joint ventures
Joint ventures are those entities over whose activities the Group has joint control, established by
contractual agreement. Joint venture arrangements that involve the establishment of a separate entity
in which each venturer has an interest are referred to as jointly controlled entities. The Group reports its
interests in jointly controlled entities using proportionate consolidation, except when the investment is
classified as held for sale, in which case it is accounted for in accordance with IFRS 5 Non-current Assets
Held for Sale and Discontinued Operations. The Group’s share of the assets, liabilities, income and
expenses of jointly controlled entities is combined with the equivalent items in the consolidated
financial statements on a line-by-line basis.
(IV) Other investments
Other investments are financial interests over whose activities the Group has no significant influence,
and has no control. These investments are carried at fair value and changes are recognised in the income
statement. Furthermore dividends are accounted for in the income statement when these become due.
If an equity investment does not have a quoted market price in an active market and other methods of
determining fair value do not result in a reasonable estimate, the investment is measured at cost less
impairment losses.

82 | Draka Holding Notes to the consolidated financial statements 2010
(V) Transactions eliminated on consolidation
Intragroup balances and any unrealised gains and losses or income and expenses arising from intragroup
transactions, are eliminated in preparing the consolidated financial statements.
Unrealised gains arising from transactions with associates and jointly controlled entities are eliminated
to the extent of the Group’s interest in the entity. Unrealised losses are eliminated in the same way as
unrealised gains, but only to the extent that there is no evidence of impairment.
(VI) Business combinations
Acquisitions of businesses are accounted for using the acquisition method. The consideration transferred
in a business combination is measured at fair value, which is calculated as the sum of the acquisition-date
fair values of the assets transferred by the Group, liabilities incurred by the Group to the former owners
of the acquiree and the equity interests issued by the Group in exchange for control of the acquiree.
Acquisition-related costs are generally recognised in profit or loss as incurred.
At the acquisition date, the identifiable assets acquired and the liabilities assumed are recognised at
their fair value at the acquisition date, except that:
• deferred tax assets or liabilities and liabilities or assets related to employee benefit arrangements
are recognised and measured in accordance with IAS 12 ‘Income Taxes’ and IAS 19 ‘Employee Benefits’
respectively;
• liabilities or equity instruments related to share-based payment arrangements of the acquiree or
share-based payment arrangements of the Group entered into to replace share-based payment
arrangements of the acquiree are measured in accordance with IFRS 2 ‘Share-based Payment’ at
the acquisition date and
• assets (or disposal groups) that are classified as held for sale in accordance with IFRS 5 ‘Non-current
Assets Held for Sale and Discontinued Operations’ are measured in accordance with that Standard.
Goodwill is measured as the excess of the sum of the consideration transferred, the amount of any non-
controlling interests in the acquiree, and the fair value of the acquirer’s previously held equity interest in
the acquiree (if any) over the net of the acquisition-date amounts of the identifiable assets acquired and
the liabilities assumed. If, after reassessment, the net of the acquisition-date amounts of the identifiable
assets acquired and liabilities assumed exceeds the sum of the consideration transferred, the amount of
any non-controlling interests in the acquiree and the fair value of the acquirer’s previously held interest in
the acquiree (if any), the excess is recognised immediately in profit or loss as a bargain purchase gain.
Non-controlling interests that are present ownership interests and entitle their holders to a proportionate
share of the entity’s net assets in the event of liquidation may be initially measured either at fair value or at
the non-controlling interests’ proportionate share of the recognised amounts of the acquiree’s identifiable
net assets. The choice of measurement basis is made on a transaction-by-transaction basis. Other types of
non-controlling interests are measured at fair value or, when applicable, on the basis specified in another
IFRS.
When the consideration transferred by the Group in a business combination includes assets or liabilities
resulting from a contingent consideration arrangement, the contingent consideration is measured at its
acquisition-date fair value and included as part of the consideration transferred in a business combination.
Changes in the fair value of the contingent consideration that qualify as measurement period adjustments
are adjusted retrospectively, with corresponding adjustments against goodwill. Measurement period adjust-
ments are adjustments that arise from additional information obtained during the ‘measurement period’
(which cannot exceed one year from the acquisition date) about facts and circumstances that existed at the
acquisition date.
The subsequent accounting for changes in the fair value of the contingent consideration that do not
qualify as measurement period adjustments depends on how the contingent consideration is classified.
Contingent consideration that is classified as equity is not remeasured at subsequent reporting dates and

Draka Holding | 83Notes to the consolidated financial statements 2010
its subsequent settlement is accounted for within equity. Contingent consideration that is classified as
an asset or a liability is remeasured at subsequent reporting dates in accordance with IAS 39, or IAS 37
‘Provisions, Contingent Liabilities and Contingent Assets’, as appropriate, with the corresponding gain or
loss being recognised in profit or loss.
When a business combination is achieved in stages, the Group’s previously held equity interest in the
acquiree is remeasured to fair value at the acquisition date (i.e. the date when the Group obtains control)
and the resulting gain or loss, if any, is recognised in profit or loss. Amounts arising from interests in the
acquiree prior to the acquisition date that have previously been recognised in other comprehensive income
are reclassified to profit or loss where such treatment would be appropriate if that interest were disposed of.
If the initial accounting for a business combination is incomplete by the end of the reporting period in which
the combination occurs, the Group reports provisional amounts for the items for which the accounting is
incomplete. Those provisional amounts are adjusted during the measurement period (see above), or addi-
tional assets or liabilities are recognised, to reflect new information obtained about facts and circumstances
that existed at the acquisition date that, if known, would have affected the amounts recognised at that date.
Business combinations that took place prior to 1 January 2010 were accounted for in accordance with the
previous version of IFRS 3.
(d) Foreign currency(I) Foreign currency transactions
Transactions in foreign currencies are translated to the respective functional currencies of Group entities
at the exchange rates at the dates of the transactions. Monetary assets and liabilities denominated in
foreign currencies at the balance sheet date are translated at the exchange rate at that date. Foreign
exchange differences arising on translation of monetary items are recognised in the income statement.
Non-monetary assets and liabilities that are measured in terms of historical cost in a foreign currency
are translated using the exchange rate at the date of the transaction. Non-monetary assets and liabilities
denominated in foreign currencies that are stated at fair value are translated to euro at foreign exchange
rates at the dates the fair value was determined.
(II) Foreign operations
The assets and liabilities of foreign operations, including goodwill and fair value adjustments arising on
consolidation as from 1 January 2004, are translated to euro at foreign exchange rates at the balance
sheet date. Goodwill and fair value adjustments arising on consolidation relating to acquisitions from
before 1 January 2004 are denominated in euro. The revenues and expenses of foreign operations are
translated to euro at rates approximating the foreign exchange rates at the dates of the transactions.
As from 1 January 2004 foreign exchange differences arising from the translation of the net investment in
foreign operations, and of related hedges are taken to translation reserve, a separate component of equity.
When a foreign operation is disposed of, in part or in full, the relating accumulated translation differences
are transferred to profit or loss as part of the gain or loss on disposal. Foreign exchange gains and losses
arising from a monetary item receivable from or payable to a foreign operation, the settlement of which
is neither planned nor likely to occur in the foreseeable future, are considered to form part of a net
investment in a foreign operation and are recognised directly in the translation reserve.
(e) Derivative financial instrumentsThe Group uses derivative financial instruments to hedge its exposure to copper, foreign exchange and
interest rate risks arising from operational, financing and investment activities. In accordance with its risk
management policy, the Group does not hold or issues material derivative financial instruments for trading
purposes. However, derivatives that do not qualify for hedge accounting are accounted for as trading
instruments.
Derivative financial instruments are initially recognised at fair value. Subsequent to initial recognition,
derivative financial instruments are stated at fair value. The gain or loss on remeasurement to fair value
is recognised immediately in profit or loss. However, where derivatives qualify for hedge accounting,
recognition of any resultant gain or loss depends on the nature of the item being hedged (see accounting
policy f).

84 | Draka Holding Notes to the consolidated financial statements 2010
The fair value of interest rate swaps is the estimated amount that the Group would receive or pay to
terminate the swap at the balance sheet date, taking into account current interest rates and the current
creditworthiness of the swap counterparties. The fair value of forward contracts is their quoted market
price at the balance sheet date.
The fair value of metal derivative contracts is determined by using the prices at the balance sheet date
of the same strategic metals quoted on the London Metal Exchange (“LME”).
(f) HedgingThe fair values of various derivative instruments used for hedging purposes are disclosed in note 28.
Movements on the hedging reserve in shareholders’ equity are presented net and shown in note 37.
(I) Cash flow hedges
Where a derivative financial instrument is designated as a hedge of the variability in cash flows
of a recognised asset or liability, or a highly probable forecasted transaction, the effective part of
any gain or loss on the derivative financial instrument is recognised directly in equity. When the
forecasted transaction subsequently results in the recognition of a non-financial asset or non-
financial liability, or the forecast transaction for a non-financial asset or non-financial liability,
the associated cumulative gain or loss is removed from equity and included in the initial cost or
other carrying amount of the non-financial asset or liability. If a hedge of a forecasted transaction
subsequently results in the recognition of a financial asset or a financial liability, the associated
gains and losses that were recognised directly in equity are reclassified into profit or loss in the
same period or periods during which the asset acquired or liability assumed affects profit or loss.
For cash flow hedges, other than those covered by the preceding two policy statements, the
associated cumulative gain or loss is removed from equity and recognised in the income statement
in the same period or periods during which the hedged forecast transaction affects profit or loss.
The ineffective part of any gain or loss is recognised immediately in the income statement.
When a hedging instrument expires or is sold, terminated or exercised, or the entity revokes designation
of the hedge relationship but the hedged forecast transaction is still expected to occur, the cumulative
gain or loss at that point remains in equity and is recognised in accordance with the above policy when
the transaction occurs. If the hedged transaction is no longer expected to take place, the cumulative
unrealised gain or loss recognised in equity is recognised immediately in the income statement.
(II) Fair value hedges
Changes in the fair value of derivatives that are designated and qualify as fair value hedges are recor-
ded in the income statement, together with any changes in the fair value of the hedged asset or liability
that are attributable to the hedged risk. In 2009 and 2010 the Group did not have any fair value hedges
in place.
(III) Hedge of monetary assets and liabilities
Where a derivative financial instrument is used to hedge economically the foreign exchange exposure of a
recognised monetary asset or liability, no hedge accounting is applied and any gain or loss on the hedging
instrument is recognised in the income statement.
(g) Property, plant and equipment(I) Owned assets
Items of property, plant and equipment are stated at cost less accumulated depreciation (see below) and
impairment losses (see accounting policy m). Self constructed assets are stated at cost. Depreciation on
these assets starts upon usage.
Where components of an item of property, plant and equipment have different useful lives, they are
accounted for as separate items of property, plant and equipment.
(II) Leased assets
Leases in terms of which the Group assumes substantially all the risks and rewards of ownership are
classified as finance leases. Assets acquired by way of finance lease are stated at an amount equal to

Draka Holding | 85Notes to the consolidated financial statements 2010
the lower of its fair value and the present value of the minimum lease payments at inception of the lease,
less accumulated depreciation (see below) and impairment losses (see accounting policy m). Lease pay-
ments are accounted for as described in accounting policy w.
(III) Subsequent expenditure
The costs of replacing part of an item of property, plant and equipment is recognised in the carrying
amount of the item if it is probable that the future economic benefits embodied within the part will flow to
the Group and its cost can be measured reliably. All other costs are recognised in the income statement as
an expense as incurred.
(IV) Disposal
Gains and losses on disposal of an item of property, plant and equipment are determined by comparing the
proceeds from disposal with the carrying amount of property, plant and equipment and are recognised net
within other income in profit or loss.
(V) Depreciation
Depreciation is charged to the income statement on a straight-line basis over the estimated useful
lives of each component of an item of property, plant and equipment. Land is not depreciated.
The estimated useful lives are as follows:
• buildings 30 - 50 years
• plant and equipment 8 - 20 years
• fixtures and fittings 3 - 10 years
The depreciation methods, useful lives and residual values are reassessed annually.
(h) Intangible assets(I) Goodwill
All business combinations are accounted for by applying the purchase method. Goodwill represents
amounts arising on acquisition of subsidiaries and is determined as the difference between the cost
of the acquisition and the fair value of the net identifiable assets acquired. Goodwill in respect of
acquisitions that occurred before January 1, 2001 has been written-off to equity.
Goodwill is stated at cost less any accumulated impairment losses. Goodwill is allocated to cash generating
units and is not amortised but is tested annually for impairment (see accounting policy m). In respect of
equity accounted investees, the carrying amount of goodwill is included in the carrying amount of the
investment in the equity accounted investee. Negative goodwill arising on an acquisition is recognised
directly in the income statement.
(II) Research and development
Expenditure on research activities, undertaken with the prospect of gaining new scientific or technical
knowledge and understanding, is recognised in the income statement as an expense as incurred.
Expenditure on development activities, whereby research findings are applied to a plan or design for
the production of new or substantially improved products and processes, is capitalised if the product
or process is technically and commercially feasible and the Group has sufficient resources to complete
development. The expenditure capitalised includes the cost of materials, direct labour and an appropriate
proportion of overheads. Other development expenditure is recognised in the income statement as an
expense as incurred. Capitalised development expenditure is stated at cost less accumulated amortisation
(see below) and impairment losses (see accounting policy m).
(III) Other intangible assets
Other intangible assets that are acquired by the Group are stated at cost less accumulated amortisation
(see below) and impairment losses (see accounting policy m). Expenditure on internally generated goodwill
and brands is recognised in the income statement as an expense when incurred.

86 | Draka Holding Notes to the consolidated financial statements 2010
(IV) Subsequent expenditure
Subsequent expenditure on capitalised intangible assets is capitalised only when it increases the future
economic benefits embodied in the specific asset to which it relates. All other expenditure is expensed as
incurred.
(V) Amortisation
Amortisation is charged to the income statement on a straight-line basis over the estimated useful lives
of intangible assets unless such lives are indefinite. Goodwill and intangible assets with an indefinite useful
life are systematically tested for impairment at each balance sheet date.
Other intangible assets are amortised from the date they are available for use. The estimated
useful lives are as follows:
• patents and licenses 3 - 15 years
• development costs 5 years
• software 3 years
• other 5 - 7 years
The amortisation methods, useful lives and residual values are reassessed annually.
(i) Financial assets The Group classifies its financial assets in the following categories: at fair value through profit or loss, loans
and receivables, and available for sale. The classification depends on the purpose for which the financial
assets were acquired. Management determines the classification of its financial assets at initial recognition.
(I) Financial assets at fair value through profit or loss
Financial assets at fair value through profit or loss are financial assets held for trading. A financial asset
is classified in this category if acquired principally for the purpose of selling in the short-term. Derivatives
are also categorised as held for trading unless they are designated as hedges. Assets in this category are
classified as current assets.
(II) Loans and receivables
Loans and receivables are non-derivative financial assets with fixed or determinable payments that are not
quoted in an active market. They are included in current assets, except for maturities greater than 12 months
after the balance sheet date. These are classified as non-current assets. The Group’s loans and receivables
comprise loans presented as non-current financial assets, trade and other receivables and cash and cash
equivalents in the balance sheet (see accounting policy k and l).
(III) Available-for-sale financial assets
Available-for-sale financial assets are non-derivatives that are either designated in this category or not
classified in any of the other categories. They are included in non-current assets unless management
intends to dispose of the investment within 12 months of the balance sheet date. In 2009 and 2010 the
Group did not have any available-for-sale financial assets.
Investments are initially recognised at fair value plus transaction costs for all financial assets not carried
at fair value through profit or loss. Financial assets carried at fair value through profit or loss are initially
recognised at fair value and transaction costs are expensed in the income statement. Financial assets are
derecognised when the rights to receive cash flows from the investments have expired or have been trans-
ferred and the Group has transferred substantially all risks and rewards of ownership. Available-for-sale
financial assets and financial assets at fair value through profit or loss are subsequently carried at fair
value. Changes in the fair value of financial assets classified as available-for-sale are recognised in equity.
When securities classified as available for sale are sold or impaired, the accumulated fair value adjustments
recognised in equity are included in the income statement. Loans and receivables are carried at amortised
cost using the effective interest method.
The fair values of quoted investments are based on current bid prices. If the market for a financial asset
is not active (and for unlisted securities), the Group establishes fair value by using valuation techniques.
These include the use of recent arm’s length transactions, reference to other instruments that are
substantially the same and discounted cash flow analysis.

Draka Holding | 87Notes to the consolidated financial statements 2010
(j) InventoriesInventories are stated at the lower of cost and net realisable value. Net realisable value is the estimated
selling price in the ordinary course of business, less the estimated costs of completion and selling
expenses, taking into account the allowance for risk of obsolete inventory.
The cost of inventories is determined using the first-in, first-out (FIFO) method. The cost of finished
goods and work in progress includes expenditure incurred in acquiring the inventories and bringing them
to their existing location and condition. In the case of manufactured inventories as finished goods and
work in progress, cost includes an appropriate share of overheads based on normal operating capacity.
(k) Trade and other receivables Trade and other receivables are stated at amortised cost less impairment losses (see accounting policy m).
(l) Cash and cash equivalentsCash and cash equivalents comprise cash balances and call deposits. Bank overdrafts that are repayable
on demand and form an integral part of the Group’s cash management are included as a component of
cash and cash equivalents for the purpose of the statement of cash flows.
(m) ImpairmentThe carrying amounts of the Group’s assets other than inventories (see accounting policy j) and deferred
tax assets (see accounting policy w), are reviewed at each reporting date to determine whether there is
any indication of impairment. If any such indication exists, the asset’s recoverable amount is estimated
(see accounting policy m(I)).
For goodwill, assets that have an indefinite useful life and intangible assets that are not yet available for
use, the recoverable amount is estimated annually at 31 December of each year. An impairment loss is
recognised whenever the carrying amount of an asset or its cash-generating unit exceeds its recoverable
amount. Impairment losses are recognised in the income statement.
Impairment losses recognised in respect of cash-generating units are allocated first to reduce the
carrying amount of any goodwill allocated to cash-generating units (group of units) and then, to reduce
the carrying amount of the other assets in the unit (group of units) on a pro rata basis.
(I) Calculation of recoverable amount
The recoverable amount of receivables carried at amortised cost is calculated as the present value of
estimated future cash flows, discounted at the original effective interest rate (i.e., the effective interest
rate computed at initial recognition of these financial assets). Receivables with a short duration are not
discounted.
The recoverable amount of other assets is the greater of their fair value less costs to sell and value in
use. In assessing value in use, the estimated future cash flows are discounted to their present value using
a pre-tax discount rate that reflects current market assessments of the time value of money and the risks
specific to the asset. For an asset that does not generate largely independent cash inflows, the recoverable
amount is determined for the cash-generating unit to which the asset belongs.
(II) Reversals of impairment
An impairment loss in respect of receivables carried at amortised cost is reversed if the subsequent
increase in recoverable amount can be related objectively to an event occurring after the impairment
loss was recognised.
An impairment loss in respect of an investment in an equity instrument classified as available for sale is
not reversed through profit or loss. If the fair value of a debt instrument classified as available-for-sale
increases and the increase can be objectively related to an event occurring after the impairment loss
was recognised in profit or loss, the impairment loss shall be reversed, with the amount of the reversal
recognised in profit or loss.
An impairment loss in respect of goodwill is not reversed.

88 | Draka Holding Notes to the consolidated financial statements 2010
In respect of other assets, an impairment loss is reversed if there is an indication that the impairment
loss may no longer exist and there has been a change in the estimates used to determine the recoverable
amount.
An impairment loss is reversed only to the extent that the asset’s carrying amount does not exceed the
carrying amount that would have been determined, net of depreciation or amortisation, if no impairment
loss had been recognised.
(n) Share capital(I) Preference share capital
Preference share capital is classified as equity if it is non-redeemable and any dividends are discretionary,
or is redeemable but only at the Company’s option. Dividends on preference share capital classified as
equity are recognised as distributions within equity.
Preference share capital is classified as a liability if it is redeemable on a specific date or at the option of
the shareholders or if dividend payments are not discretionary. Dividends thereon are recognised in the
income statement as interest expense on an accrual basis.
(II) Repurchase of share capital
When share capital recognised as equity is repurchased, the amount of the consideration paid, including
directly attributable costs, is recognised as a change in equity. Repurchased shares are classified as
treasury shares and presented as a deduction from total equity. When treasury shares are sold or reissued
subsequently, the shares are removed from the reserve for treasury shares on a FIFO basis. The amount
received is recognised as an increase in equity, and the resulting surplus or deficit on the transaction is
transferred to / from retained earnings.
(III) Dividends
Dividends are recognised as a reduction in equity in the period in which they are declared.
(o) Convertible subordinated bondsConvertible subordinated bonds that can be converted to share capital at the option of the holder, where the
number of shares issued does not vary with changes in their fair value, are accounted for as compound finan-
cial instruments. Transaction costs that relate to the issue of a compound financial instrument are allocated
to the liability and equity components in proportion to the allocation of proceeds. The equity component is
recognised initially at the difference between the fair value of the compound instruments as a whole and the
fair value of the liability component. Subsequent measurement of the liability component is amortised cost
by using the effective interest method. The equity element is not remeasured subsequent to initial recogni-
tion. The repurchase price of convertible subordinated bonds is allocated to the liability and equity compo-
nent. This allocation is based on a non-convertible debt the Group could have issued at repurchase date.
(p) Interest-bearing borrowingsInterest-bearing borrowings are recognised initially at fair value less attributable transaction costs.
Subsequent to initial recognition, interest-bearing borrowings are stated at amortised cost using the
effective interest method.
(q) Employee benefits(I) Defined contribution plans
A defined contribution plan is a post-employment benefit plan under which an entity pays fixed contributions
into a separate entity and will have no legal or constructive obligation to pay further amounts. Obligations
for contributions to defined contribution pension plans are recognised as an expense in the income
statement as incurred.
(II) Defined benefit plans
A defined benefit plan is a post-employment benefit plan other than a defined contribution plan.
A significant part of the Group’s defined benefit plans are funded with plan assets that have been
segregated and restricted in pension funds, trusts or have been insured to provide for the pension
benefits to which the Group has committed itself.

Draka Holding | 89Notes to the consolidated financial statements 2010
The Group’s net obligation in respect of defined benefit pension plans is calculated separately for each
plan by estimating the amount of future benefit that employees have earned in return for their service
in the current and prior periods; that benefit is discounted to determine its present value, and the fair
value of any plan assets is deducted. The discount rate is the yield at the balance sheet date on high
quality government or corporate bonds that have maturity dates approximating to the terms of the Group’s
obligations. The calculation is performed by a qualified actuary using the projected unit credit method.
Pension costs in respect of defined benefit plans primarily represent the increase in the actuarial present
value of the obligation for pension benefits based on the employee service during the year and the interest
on this obligation in respect of employee service in previous years, net of the expected return on plan
assets.
When the benefits of a plan are improved, the portion of the increased benefit relating to past service by
employees is recognised as an expense in the income statement on a straight-line basis over the average
period until the benefits become vested. To the extent that the benefits vest immediately, the expense is
recognised immediately in the income statement.
All actuarial gains and losses as at 1 January 2004, the date of transition to IFRS, were recognised. In
respect of actuarial gains and losses that arise subsequent to 1 January 2004 in calculating the Group’s
obligation in respect of a plan, to the extent that any cumulative unrecognized actuarial gain or loss
exceeds 10 per cent of the greater of the present value of the defined benefit obligation and the fair
value of plan assets, that portion is recognised in the income statement over the expected average
remaining working lives of the employees participating in the plan. Otherwise, the actuarial gain or
loss is not recognised. Where the calculation results in a benefit to the Group, the recognised asset
is limited to the net total of any unrecognised actuarial losses and past service costs and the present
value of any future refunds from the plan or reductions in future contributions to the plan.
(III) Long-term service benefits
The Group’s net obligation in respect of long-term service benefits, other than pension plans, is the amount
of future benefit that employees have earned in return for their service in the current and prior periods.
The obligation is calculated using the projected unit credit method and is discounted to its present value
and the fair value of any related assets is deducted. The discount rate is the yield at the balance sheet
date on high quality government or corporate bonds that have maturity dates approximating to the
terms of the Group’s obligations.
(IV) Share-based payment transactions
The Group has a stock option and matching shares plan that conditionally allows certain employees to
acquire Draka Holding N.V. common shares. These options and matching shares generally vest in three
years. In addition, the Group has a performance share plan for members of the Board of Management
under which shares are conditionally granted. These performance-related shares might vest in three
years depending on Draka’s Total Shareholder Return (“TSR”) performance relative to a performance
peer group.
The fair value of options and shares granted that are equity settled, is recognised as an employee benefit
expense with a corresponding increase in equity. The fair value is measured at grant date and spread
over the period during which the employees become unconditionally entitled (the vesting period). At
each balance sheet date, the company revises its estimates of the number of options and shares that
are expected to vest. It recognises the impact of the revision of original estimates, if any, in the income
statement, with a corresponding adjustment to equity. The fair value of the options granted is measured
using a binomial option pricing model, taking into account the terms and conditions upon which the
options were granted. The fair value of the performance shares granted to the Board of Management
is measured using the Monte Carlo approach. The amount recognized as an expense is adjusted to
reflect the actual number of options or (performance) shares that vest, except where forfeiture or
extra vesting of performance shares is due to a TSR performance that differs from the performance
anticipated at the grant of the performance shares.

90 | Draka Holding Notes to the consolidated financial statements 2010
The fair value of the amount payable to employees in respect of stock appreciation rights (SARs), which
are settled in cash, is recognized as an expense, with a corresponding increase in liabilities, over the
period that the employees become unconditionally entitled to payment. The liability is remeasured at
each reporting date and at settlement date. Any changes in the fair value of the liability are recognised
as employee benefit expense in the income statement.
(r) ProvisionsA provision is recognised in the balance sheet if, as a result of a past event, the Group has a present
legal or constructive obligation, and it is probable that an outflow of economic benefits will be required
to settle the obligation, and such outflow can be estimated reliably. If the effect is material, provisions are
determined by discounting the expected future cash flows at a pre-tax rate that reflects current market
assessments of the time value of money and, where appropriate, the risks specific to the liability.
(I) Warranties
A provision for warranties is recognised when the underlying products or services are sold. The provision
is based on historical warranty data and a weighting of all possible outcomes against their associated
probabilities.
(II) Restructuring
A provision for restructuring is recognised when the Group has approved a detailed and formal
restructuring plan, and the restructuring has either commenced or has been announced publicly.
Future operating costs are not provided for.
(III) Onerous contracts
A provision for onerous contracts is recognised when the expected benefits to be derived by the Group
from a contract are lower than the unavoidable cost of meeting its obligations under the contract.
(s) Trade and other payablesTrade and other payables are stated at amortised cost.
(t) Revenue recognitionRevenue is measured at the fair value of the consideration received or receivable. Revenue is reduced for
estimated customer returns, rebates and other similar allowances.
(I) Sale of goods
Revenue from the sale of goods is recognised when all the following conditions are satisfied:
• the Group has transferred to the buyer the significant risks and rewards of ownership of the goods;
• the Group retains neither continuing managerial involvement to the degree usually associated with
ownership nor effective control over the goods sold;
• the amount of revenue can be measured reliably;
• it is probable that the economic benefits associated with the transaction will flow to the entity; and
• the costs incurred or to be incurred in respect of the transaction can be measured reliably.
(II) Rendering of services
Revenue from a contract to provide services is recognised by reference to the stage of completion of the
contract. The stage of completion of the contract is determined as follows:
• installation fees are recognised by reference to the stage of completion of the installation, determined
as the proportion of the total cost expected to install that has been occurred at the end of the reporting
period;
• servicing fees included in the price of products sold are recognised by reference to the proportion of
the total cost of providing the servicing for the product sold, taking into account historical trends in
the number of services actually provided on past goods sold; and
• revenue from time and material contracts is recognised at the contractual rates as labour hours are
delivered and direct expenses are incurred.

Draka Holding | 91Notes to the consolidated financial statements 2010
Where the outcome of a construction contract can be estimated reliably, revenue and costs are recognised
by reference to the stage of completion of the contract activity at the end of the reporting period, measured
based on the proportion of contract costs incurred for work performed to date relative to the estimated
total contract costs, except where this would not be representative of the stage of completion. Variations in
contract work, claims and incentive payments are included to the extent that the amount can be measured
reliably and its receipt is considered probable.
Where the outcome of a construction contract cannot be estimated reliably, contract revenue is recognised
to the extent of contract costs incurred for which it is probable that they will be recoverable. Contract
costs are recognised as expenses in the period in which they are incurred.
When it is probable that total contract costs will exceed total contract revenue, the expected loss is
recognised as an expense immediately.
(u) Government grantsGovernment grants are recognised in the balance sheet initially as deferred income when there is
reasonable assurance that they will be received and that the Group will comply with the conditions
attached to them. Grants that compensate the Group for expenses incurred are recognised in the
income statement on a systematic basis in the same periods in which the expenses are incurred.
Grants that compensate the Group for the cost of an asset are recognised in the income statement
as cost of sales on a systematic basis over the useful life of the asset.
(v) Borrowing costsBorrowing costs directly attributable to the acquisition, construction or production of qualifying assets,
which are assets that necessarily take a substantial period of time to get ready for their intended use or
sale, are added to the cost of those assets, until such time as the assets are ready for their intended use
or sale.
Investment income earned on the temporary investment of specific borrowings pending their expenditure
on qualifying assets is deducted from the borrowing costs eligible for capitalisation.
All other borrowing costs are recognised in profit or loss in the period in which they are incurred.
(w) Expenses(I) Operating lease payment
Payments made under operating leases are recognised in the income statement on a straight-line basis
over the term of the lease. Lease incentives received are recognised in the income statement as an integral
part of the total lease expense.
(II) Finance lease payments
Minimum lease payments are apportioned between the finance charge and the reduction of the out-
standing liability. The finance charge is allocated to each period during the lease term so as to produce
a constant periodic rate of interest on the remaining balance of the liability.
(III) Finance income and expense
Finance income and expense comprise interest expense on borrowings calculated using the effective
interest method, dividends on preference shares classified as liabilities, interest receivable on funds
invested, dividend income, foreign exchange gains and losses, and gains and losses on hedging instruments
that are recognised in the income statement (see accounting policy f). Further, this caption includes fair
value adjustments of the financial liability arising from the put option to acquire a minority interest.
Interest income is recognised in the income statement as it accrues, using the effective interest method.
Dividend income is recognised in the income statement on the date the entity’s right to receive payments is
established which in the case of quoted securities is the ex-dividend date. The interest expense component
of finance lease payments is recognised in the income statement using the effective interest rate method.
Foreign currency gains and losses are reported on a net basis.

92 | Draka Holding Notes to the consolidated financial statements 2010
(x) Income taxIncome tax on the profit or loss for the year comprise current and deferred tax. Income tax is recognised
in the income statement except to the extent that it relates to items recognised directly in equity, in which
case it is recognised in equity.
Current tax is the expected tax payable on the taxable income for the year, using tax rates enacted or
substantively enacted at the balance sheet date applicable in the several jurisdictions in which the Group
operates, and any adjustment to tax payable in respect of previous years.
Deferred tax is provided using the balance sheet liability method, providing for temporary differences
between the carrying amounts of assets and liabilities for financial reporting purposes and the amounts
used for taxation purposes. Deferred tax is measured at the tax rates that are expected to be applied to
the temporary differences when they reverse, based on the laws that have been enacted or substantively
enacted at the balance sheet date. A change in tax rates is reflected in the period in which the change has
been enacted or substantively enacted.
The following temporary differences are not provided for: the initial recognition of assets or liabilities that
affect neither accounting nor taxable profit, and differences relating to investments in subsidiaries to the
extent that they will probably not reverse in the foreseeable future, and the Company is able to control the
timing of the reversal. In addition, deferred tax is not recognised for taxable temporary differences arising
on the initial recognition of goodwill.
A deferred tax asset, including assets arising from tax loss carry forwards, is recognised only to the
extent that it is probable that future taxable profits will be available against which the asset can be utilised.
Deferred tax assets are reduced to the extent that it is no longer probable that the related tax benefit will
be realised. Deferred tax assets and liabilities are not discounted.
(y) Earnings per shareBasic earnings per share (“EPS”) are calculated by dividing the profit or loss attributable to holders of
ordinary shares of the Group by the weighted average number of ordinary shares outstanding during the
period. In order to calculate diluted EPS, profit or loss attributable to holders of ordinary shares, and the
weighted number of shares outstanding, are adjusted for the effects of all dilutive potential ordinary shares.
Potential ordinary shares are treated as dilutive when, and only when, their conversion to ordinary shares
decrease the calculated earnings per share or increase the calculated loss per share.
(z) Consolidated statement of cash flowsThe consolidated statement of cash flows is prepared using the indirect method, in which the movement
of cash and cash equivalents, net of bank overdrafts, is based on net result as presented in the consolidated
statement of income. Foreign currency cash flows are translated at the exchange rate at the date of the
cash flow or using appropriate averages. Changes that have not resulted in cash flows such as translation
differences, business combinations, financial leases, fair value changes, conversions of debt to equity,
equity settled share based payments etc., have been eliminated for the purpose of preparing this statement.
Dividends paid to ordinary shareholders are included in financing activities. Dividends received are classified
as investing activities. Interest paid is included in operating activities. Bank overdrafts that are repayable
on demand and form an integral part of the Group’s cash management are included as a component of
cash and cash equivalents for the purpose of the statement of cash flows.
(aa) Segment reportingManagement has determined the operating segments bases on the reports reviewed by the chief operating
decision maker in order to allocate resources to the segments and to assess their performance.
A segment is a distinguishable component of the Group that is engaged either in providing products or
services (business segment), or in providing products or services within a particular economic environment
(geographical segment), which is subject to risks and rewards that are different from those of other
segments.
Inter-segment pricing is determined on an arm’s length basis.

Draka Holding | 93Notes to the consolidated financial statements 2010
Segment results, assets and liabilities include items directly attributable to a segment as well as those
that can be allocated on a reasonable basis. Unallocated items comprise mainly corporate assets and
expenses, such as loans and borrowings and income tax assets and liabilities.
Segment capital expenditure is the total cost incurred during the period to acquire segment
assets that are expected to be used for more than one period.
The Group comprise the following main operating segments:
• Draka Energy and Infrastructure develops, produces and sells the full range of cable products for the
domestic, infrastructural and industrial applications.
• Draka Industry and Specialty is responsible for all special-purpose cable activities.
• Draka Communications develops, produces and sells optical fiber, optical fiber cables and copper cables
to the telecommunications and data communications markets.
The entities’ operating segments are organised on the basis of differences in related products and services.
The segments are managed on a worldwide basis, but operate in seven principal geographical areas;
The Netherlands, United Kingdom, Scandinavia, Germany, Rest of Europe, North America and Asia.
In presenting information on the basis of geographical segments, segment revenue is based on the
geographical location of customers. Segment assets are based on the geographical location of the
assets.
(ab) Non-current assets held for sale and discontinued operationsNon-current assets and disposal groups are classified as held for sale if their carrying amount will be
recovered principally through a sale transaction rather than through continuing use. This condition is
regarded as met only when the sale is highly probable and the asset (or disposal group) is available for
immediate sale in its present condition. Management must be committed to the sale, which should be
expected to qualify for recognition as a completed sale within one year from the date of classification.
Immediately before classification as held for sale, the measurement of the assets (and all assets and
liabilities in a disposal group) is brought up-to-date in accordance with applicable IFRSs. Then, on initial
classification as held for sale, non-current assets and disposal groups are recognised at the lower of
carrying amount and fair value less costs to sell.
Impairment losses on initial classification as held for sale are included in the income statement, even
when there is a revaluation. The same applies to gains and losses on subsequent remeasurement.
A discontinued operation is a component of the Group’s business that represents a separate major line of
business or geographical area of operations or is a subsidiary acquired exclusively with a view to resale.
Classification as a discontinued operation occurs upon disposal or when the operation meets the criteria
to be classified as held for sale, if earlier. A disposal group that is to be abandoned may also qualify.
3. Acquisitions and divestments of subsidiaries
Acquisitions of subsidiariesPressure Tube Manufacturing
On April 27, 2010, the Company announced that it has reached an agreement to acquire Pressure Tube
Manufacturing (PTM), a specialty tubing manufacturer located in New Jersey, USA. The acquisition of
PTM enables Draka to enhance its already leading position in the specialty cable segment of the oil &
gas market in the USA. The total acquisition price amounts to approximately $ 8.5 million, of which
$ 4 million is paid in the first half of 2010. The remaining part will be paid in 2 tranches in 2011 and 2012.
Acquisition related costs of $ 0.2 million have been recognised as an expense.

94 | Draka Holding Notes to the consolidated financial statements 2010
Consideration transferred In millions of euro
Cash 3.0
Remaining part of the consideration payable 3.4
Total 6.4
Assets acquired and liabilities recognised at the date of acquisition In millions of euro
Current assets
Inventories 1.1
Trade and other receivables 2.0
Non-current assets
Plant and equipment 3.0
Current liabilities
Trade and other payables (2.6)
Non-current liabilities
Other non-current liabilities (1.5)
2.0
Goodwill arising on acquisition In millions of euro
Consideration transferred 6.4
Less: Fair value of identifiable net assets acquired (5.4)
Goodwill arising on acquisition 1.0
Goodwill arose in the acquisition of PTM because the consideration paid for the combination effectively
included amounts in relation to the benefit of expected synergies, revenue growth and future market
development. The goodwill arising on the acquisition is expected to be deductible for tax purposes.
The entity has increased Group’s revenue by approximately € 8.2 million and € 1.8 million on the Group’s
operating result for the year.
Had the business combination been effected at 1 January 2010, the revenue of the Group would have
been increased by € 14.0 million, and the operating profit for the year would have been increased by
approximately € 3.1 million.
4. Financial risk management
4.1 Financial risk factorsThe Group has exposure to the following risks from its use of financial instruments:
(a) Credit risk(b) Liquidity risk(c) Market risk
(I) Currency risk
(II) Interest rate risk
(III) Price risk
(IV) Other market risk
This note presents information about the Group’s exposure to each of the above risks, its objectives,
policies and procedures for measuring and managing risk, and its management of capital. Further
quantitative disclosures are included throughout these consolidated financial statements.

Draka Holding | 95Notes to the consolidated financial statements 2010
The Board of Management has overall responsibility for the establishment and oversight of the Group’s
risk management and control system. Risk management forms an integral part of business management.
The Board has implemented a group wide, risk based internal control system, which was approved by the
Supervisory Board. The management of risks from use of financial instruments that are strongly related
to the Group’s operations is carried out by the operational Group entities within the authority and limits
set by the Board of Management. Certain risks are consolidated and mitigated through hedge transactions
with external parties by central functions, such as Group treasury and the Group procurement department.
The Group’s risk management policies are established to identify and monitor the risks faced by the
Group. Furthermore appropriate risk limits and controls are set, risks are monitored and adherence to
limits is monitored in order to minimise potential adverse effects on the Group’s financial performance.
Risk management policies and systems are reviewed and updated regularly to reflect changes in market
conditions, in the Group’s activities and in order to improve the risk management system. The Group,
through its training, management standards and procedures, aims to develop a disciplined and
constructive control environment in which all employees understand their roles and obligations.
The Audit and Governance Committee oversees how management monitors compliance with the Group’s
risk management policies and procedures and reviews the adequacy of the risk management control
system in relation to the risks faced by the Group. The operational audit department that was established
early 2007, assists the Committee in its oversight role. The operational audit department systematically
reviews the effectiveness of the internal control system at the different layers within the Group, the results
of which are reported to the Board of Management, the Audit and Governance Committee and, as the case
may be, to the Supervisory Board.
(a) Credit riskCredit risk is the risk of financial loss to the Group if a customer or counterparty to a financial instrument
fails to meet its contractual obligations.
Trade receivables
The Group’s exposure to credit risk mainly arises from its trade receivables. Draka’s trade receivable
position accounted for approximately 22.7 % of the balance sheet total in 2010 (2009: 19.6%), with an
average credit term of approximately 62 days (2009: 55 days). This relatively long credit term is explained
by the Group’s activities in Asia and Southern Europe, where long payment terms are common.
The credit risk in respect of trade receivables is managed and mitigated through alert and active policies.
An important element is the insurance of trade receivables through an ‘A-‘-rated insurance company.
Management of Draka decided to insure its exposure to credit risk (including political risk) on trade
receivables. In general, for each customer with forecasted outstanding receivables in excess of € 5,000
(or the equivalent thereof) a limit is requested from the insurance company. By agreement with the insurer,
certain customers, governmental or such related public customers, representing a zero risk of default are
exempted from the credit insurance policy. As part of its insurance coverage, the insurer provides Draka
with access to a database concerning the credit risk associated with each customer. This enables each
business unit to manage its risk by monitoring customer receivables against the insurance credit limits.
Trade receivables in excess of the amounts covered by the insurance policy are subject to periodic review
by the business unit’s management and financial control. If receivables are past due in excess of 90 days,
the receivable is taken over by the insurance company; 180 days after original due dates or - immediately
if default is established to be irrevocable - Draka receives payment under the insurance policy. The
indemnity under the insurance policy is 90% for default risk and 95% for political risk. The maximum
indemnification per annum under the insurance policy is € 30 million.
Excluded from the insurance policy are those trade receivables that originated in periods before the
insurance policy was implemented. Furthermore the insurance policy does not cover every country yet.
The exposure to credit risk on these receivables is monitored on an ongoing basis, with credit evaluations
and approval procedures performed on all customers requiring credit over a certain amount.
At 31 December 2010 an amount of € 208.5 million (44.3% of the total trade receivables) is considered at
risk (2009: € 158.4 million; 50.9%), of which € 83.0 million (2009: € 65.0 million) is at debtors of which the

96 | Draka Holding Notes to the consolidated financial statements 2010
credit limit application is still pending or was denied by the credit insurer and € 125.5 million (2009: € 93.4
million) are debtors in countries where the credit insurance program was not yet implemented or where the
insurer is not licensed.
Non-current financial assets and Cash and cash equivalents
Managing these types of risks is set out in the Treasury Charter drawn up by the Board of Management.
Counterparty risk on borrowing money is limited. The assessment criteria formulated in the Treasury
Charter are taken into account when lending money. The Treasury Charter stipulates that a counterparty
should have a credit rating at least equal to ‘A+’ (Standard & Poor’s) or ‘A1’ (Moody’s). Counterparty risk
is further reduced by dispersion across a number of parties, predetermined limits for each counterparty
and maximum lending terms. The counterparty risk for financial instruments (swap contracts) is limited by:
• The use of framework agreements on ISDA terms,
• Procedures based on regular assessment of counterparty risk.
Guarantees
At 31 December 2010, € 50.7 million guarantees were outstanding: € 20.7 million in relation to outstanding
performance bonds and guarantees of € 30.0 million to ING Bank in relation to cash pooling agreements.
(b) Liquidity risk Liquidity risk is the risk that the Group will not be able to meet its financial obligations as they fall due.
Prudent liquidity risk management implies monitoring the debt maturity profile, maintaining sufficient
cash and cash equivalents and having the availability and flexibility of funding through an adequate
amount of (committed) credit facilities. The Group aims to have its debt mature in a controlled and
gradual way, so as to minimize the refinancing risk. Further, management aims to stabilize operating
working capital (definition: inventories plus trade receivables minus trade payables) at 15-17% of
revenues in order to control the cash flow. Management uses forecasts of cash flows to manage its
cash and liquidity position.
Furthermore, the Group focuses within its cash management system on the coverage of potential growth
and the compliance with debt covenants, both financial and non-financial.
The Group maintains the following lines of credit:
• A committed multicurrency revolving credit facility of € 675 million for general corporate purposes
and the execution of the Group strategy;
• For the purpose of financing working capital the Group has an additional € 38.8 million in short term
bank credit lines available. Furthermore, local subsidiaries of the Group have worldwide € 39.0 million
in bank overdraft provided by local banks.
For the committed multicurrency revolving credit facility (RCF), interest is payable at the relevant inter-
bank interest rate plus 75 basis points (based on the situation at 31 December 2010). This margin varies
with the ratio senior net debt divided by EBITDA. For undrawn portions of the facility a commitment fee
of 35% of the applicable margin per annum is payable.
The credit facility agreement includes financial covenants and includes a change of ownership clause
in respect of significant parts of the Group.
The following covenants are applicable:
• Leverage ratio < 3.5
• Interest coverage ratio > 3.5
• Solvency > 30.0%
The leverage ratio is calculated as the net debt divided by EBITDA (earnings before interest, tax, deprecia-
tion and amortisation, on a 12 months rolling forward basis), based on the net debt and EBITDA definitions
mutually agreed upon with the group of banks. The interest coverage ratio is calculated as the EBITDA
divided by the interest expenses. Solvency is calculated as the guarantee capital divided by the balance
sheet total. The definitions used as agreed upon with the banks have undergone a number of adjustments.

Draka Holding | 97Notes to the consolidated financial statements 2010
In case of a change of control, the lenders of the multicurrency revolving credit facility (RCF) have the
right to cancel the facility. Therefore the RCF, with an original maturity date of December 2012, has been
reclassified to the current portion of interest bearing loans and borrowings.
In 2010 and 2009 the Group complied with all covenants for the RCF.
(c) Market riskMarket risk is the risk that changes in market prices, such as foreign exchange rates, interest rates,
commodities and equity prices will affect the Group’s income or the value of its financial instruments.
The object of market risk management is to manage and control market risk exposures within acceptable
parameters, while optimising the return.
(I) Currency risk
The Group operates internationally and is exposed to currency risk arising from various currency expo-
sures. Currency risk is the exposure to value changes of financial instruments arising from changes in
exchange rates. Currency risk arises from net investments in foreign operations and from monetary
financial instruments and forecasted sales and purchases that are denominated in a currency other than
the respective functional currencies of the Group entities, primarily the euro (€), Pound Sterling (GBP)
and U.S. dollar (USD). The currencies in which these balances and forecasted transactions are primarily
denominated are euro, GBP and USD.
The Group’s investments in subsidiaries having a functional currency other than the euro are in principle
not hedged, unless cash in- and outflows related to these investments are assessed to have an unaccept-
able effect on the Group’s liquidity position as a result of payments in respect of borrowings and equity
being primarily denominated in euro’s.
Management has set up a policy to require Group companies to manage their currency risk against their
functional currency. Group companies are required to hedge their entire currency exposure in respect
of cash, trade receivables and trade payables denominated in a foreign currency. Upon contracting sales
orders, the Group also hedges its estimated foreign currency exposure in respect of forecasted sales and
purchases. To manage their currency risk arising from future commercial transactions and recognised
monetary financial instruments, entities in the Group use forward contracts, transacted with Corporate
Treasury.
In respect of other monetary assets and liabilities denominated in foreign currencies, the Group ensures
that its net exposure is kept at an acceptable level by buying or selling foreign currencies at spot rates
when necessary to address short-term imbalances.
Corporate Treasury consolidates the Group’s currency risk and enters into forward exchange contracts
with external parties to ensure the Group’s exposure is kept within the limits set by the Board of Mana-
gement. Corporate Treasury uses forward exchange contracts to hedge the Group’s foreign currency
risk. Most of the forward exchange contracts have maturities of less than one year after the balance
sheet date. When necessary, the forward exchange contracts are rolled over at maturity.
Certain external forward exchange contracts are entered into as an economic hedge of the Group’s
currency exposure on future firm transactions denominated in foreign currencies. Hedge accounting
is not applied for these instruments. All fair value changes arising on these instruments are recognised
in the income statement.
(II) Interest rate risk
Interest rate risk is the exposure to value changes in financial instruments arising from changes in market
interest rates. It is the Group’s policy to ensure that its long-term commitments are not exposed to changes
in interest rates. Short-term liabilities are in principle on a floating interest basis. To reduce the interest
exposure of its long-term commitments the Group enters into derivative contracts like interest rate swaps
and options. The Group aims to keep the ratio between debt with fixed and debt with variable interest rates
between 60:40 and 80:20.

98 | Draka Holding Notes to the consolidated financial statements 2010
(III) Price risk
In its manufacturing process the Group uses raw materials, like copper, preforms for optical fiber, alumini-
um, pvc and other polymers. These raw materials account for approximately 70% of total operating costs.
In particular, the Group is exposed to fluctuations in the price of copper. Copper prices have recently been
very volatile. A change in price of these materials may alter the operating margin of the Group and impact
working capital requirements. The risks related to copper price fluctuations might impact operating profit.
To reduce these risks to an acceptable level, taking into account the position at risk and the commercial
structures in place for price setting applicable to the individual business units, the Group enters into
derivative contracts through the London Metal Exchange (‘LME’). At 31 December 2010 the fair value
of these derivatives amounts to an asset of € 11.4 million (2009: asset of € 9.5 million).
The Group does not enter into material commodity contracts other than to meet the Group’s expected
usage and sale requirements.
(IV) Other market risk
Equity price risk arises from securities held for meeting the Group’s defined benefit pension obligations.
These funds are managed through external pension funds. Further reference is made to note 24.
4.2 Capital risk managementThe Group’s objective when managing capital is in the first place to safeguard the Group’s ability to
continue as a going concern in order to provide returns to shareholders and benefits for other stake-
holders. In addition the Group wants to maintain an optimal capital structure to reduce the cost of capital,
maintain investor, creditor and market confidence and sustain future development of the business.
The Group sets the amount of capital in proportion to risk. The Group manages the capital structure and
makes adjustments to it in the light of changes in economic conditions and the risk characteristics of the
underlying assets. Assets with a long-term life are financed via equity and long-term funding; working
capital needs via a mix of medium term and short term funding. In order to maintain or adjust the
capital structure, the Group may adjust the amount of dividends paid to shareholders, return capital
to shareholders, issue new shares or sell assets to reduce debt.
For capital risk management the Group focuses on guarantee capital, consisting of shareholders’ equity,
the provision for deferred tax liabilities and the long-term part of the subordinated convertible bonds.
At 31 December 2010 the guarantee capital amounts to € 606.7 million (2009: € 568.5 million). Based
on the nature of the underlying assets and similar financial covenants included in the Group’s debt
arrangements, the Group’s target is to achieve a ratio for guarantee capital as a percentage of total
invested capital in excess of 30.0%. In 2010, guarantee capital as a percentage of total invested capital
was 33.2% (2009: 35.8%)
With regard to the Company’s ordinary shares, management aims to distribute a dividend equal to 30%
of the net income (excluding non-recurring items) after preference dividend. For 2010 it is proposed not
to pay any dividend on ordinary shares in 2011. In 2010 no dividend was paid out on ordinary shares in
relation to 2009 net income.
Another important financial objective in respect of capital risk management for the medium term is to
establish healthy interest coverage, implying EBITDA (excluding non-recurring items) / interest (excluding
non-cash marked to market adjustments) to exceed a ratio of 3.5. In 2010 interest coverage as defined
was 6.7 (2009: 4.9).
In principle, the Group purchases its own shares on the market to satisfy its obligation under its employee
share and share option plans. The shares are bought at dates approximating the actual exercise date of the
share options or the delivery date of shares under the existing share plans. The Group does not have a
defined share buy back plan.
In September 2009 Draka entered into a standby arrangement with ING Commercial Finance, part of
ING Group. The arrangement offers Draka the opportunity to sell accounts receivable without recourse

Draka Holding | 99Notes to the consolidated financial statements 2010
of several of its European entities to ING Commercial Finance with a maximum of € 50 million. Draka
activated the arrangement, which runs for at least 24 months, in September 2009.
5. Critical accounting estimates and assumptions
The estimates and assumptions that have a significant risk of causing a material adjustment to the
carrying amounts of assets and liabilities within the next financial year are discussed below.
(a) Estimated impairment of goodwillThe Group tests annually and whenever events or changes in circumstances indicate that the carrying
value may not be recoverable, whether goodwill has suffered any impairment, in accordance with the
accounting policy stated in note m. In determining the recoverable amount of cash generating units, the
Group uses standard valuation techniques, such as the market comparison approach and the income
approach. The market comparison approach is based upon a comparison of the cash-generating unit to
similar entities engaged in an actual merger or acquisition or to public companies whose shares are
actively traded. The income approach involves estimating the present value of the future cash flows of
the cash generating unit by using projections of cash flows that the business is expected to generate,
and discounting these cash flows at a given rate of return. Each of these methodologies requires the use
of management estimates and assumptions, such as growth rates for revenues, expenses, effective tax
rates, returns on working capital and capital expenditure, among others. The Group also estimates a
discount rate and a terminal growth rate in the calculations. We refer for further explanation on the
carrying amount of goodwill to note 15.
The Group performs the required impairment test at 31 December of each year or when events or circum-
stances indicate impairment may be necessary. No impairments for goodwill were recognised in 2010 and
2009.
(b) Property, plant and equipmentProperty, plant and equipment is valued at historical cost, less depreciation or at the recoverable amount
whenever impairment has taken place. Depreciation is calculated using the straight-line method based on
the estimated useful life, taking into account any residual value. The assets’ residual values and useful lives
are based on best estimates, and adjusted if appropriate, at each balance sheet date. We refer for further
explanation on the carrying amount of property, plant and equipment to note 14.
(c) Deferred income tax assetsSeveral of the Group’s subsidiaries have significant carried forward tax losses and deductible temporary
differences between book and tax balances. The majority of the deferred income tax assets relating to
carried forward tax losses were not recognised as at 31 December 2010. These deferred income tax
assets were not recognised based on management’s assessment of the probability criteria as stated in
the applicable accounting standard in light of the multiple years of tax losses incurred in the relevant
tax jurisdictions. Future utilization of the carried forward tax losses and deductible temporary differences
will be dependent on the Group’s ability to successfully generate taxable income in the carry forward
period. The remaining term of usage of the carried forward tax losses are disclosed in note 13.
Recognition of such deferred tax assets in the future may result in material tax benefits in the period in
which such determination is made. We refer for further explanation on the carrying amount of deferred
income tax assets to note 13.
(d) Income taxesThe Group is subject to income taxes in numerous jurisdictions. Significant judgment is required in
determining the worldwide provision for income taxes. There are many transactions and calculations
for which the ultimate tax determination is uncertain during the ordinary course of business. The Group
recognises liabilities for anticipated tax audit issues based on estimates of whether additional taxes will
be due. Where the final tax outcome of these matters is different from the amounts that were initially
recorded, such differences will impact the income tax and deferred tax provisions in the period in which
such determination is made. We refer for further explanation on income taxes to note 13.

100 | Draka Holding Notes to the consolidated financial statements 2010
(e) Provision for employee benefitsThe consolidated balance sheet includes liabilities with respect to defined benefit pension plans and other
long-term benefits. The pension and post-retirement benefit costs and credits are based on actuarial
calculations carried out by an independent consultant. Inherent in these calculations are assumptions,
including discount rates, rate of salary increase and expected return on plan assets. Changes in pension
and post-retirement costs may occur in the future as a consequence of changes in interest rates,
expected return on assets or other assumptions.
The discount rate is based on the return of high-quality fixed-income corporate bonds, using an index,
based on stated bonds. This index is marked up taking into account that corporate bonds bear an additional
risk and the fact that pension liabilities have a longer duration than the state bonds. Based on the available
information the discount rate as per 31 December 2010 was set at 5.0% (2009: 5.3%). A change of 50
basis points to the discount rate applied would not increase or decrease the employee benefit expense
significantly.
For a detailed discussion of the other underlying assumptions, expected future funding obligations and
expected future payments, see note 24 to the consolidated financial statements. It is expected that the
future payments will have no material impact on future cash flows and that there is no material uncertainty
in the funding of the obligation itself.
(f) Other provisionsThe Group recognised provisions regarding restructuring, warranties and onerous contracts. Significant
judgement is required in the determination of these provisions such as outcome of legislation and the
assumptions underlying the determination. We refer for further explanation on the carrying amount of
other provisions to note 25.
(g) Financial instrumentsThe determination of the fair value of certain financial instruments requires significant judgement of
management regarding underlying assumptions and estimates like discount rates, credit risks and yield
curves. We refer for further explanation to note 23.

Draka Holding | 101Notes to the consolidated financial statements 2010
6. Segment reporting
Operating segments
In millions of euro Energy & Industry & Communications Not allocated to Consolidated
Infrastructure Specialty segments / eliminations
2010 20091 2010 20091 2010 2009 2010 2009 2010 2009
Revenue from external customers 854.0 694.4 744.5 617.7 829.3 736.2 - - 2,427.8 2,048.3
Intersegment transactions 59.7 42.3 18.3 11.4 37.9 30.6 (115.9) (84.3) - -
Revenue 913.7 736.7 762.8 629.1 867.2 766.8 (115.9) (84.3) 2,427.8 2,048.3
Operating result (excluding non-recurring items) 29.2 31.8 28.2 33.4 45.2 26.7 (17.2) (16.6) 85.4 75.3
Non-recurring items (14.4) (13.8) (12.4) (31.6) (22.3) (17.7) (7.7) (3.4) (56.8) (66.5)
Operating result 14.8 18.0 15.8 1.8 22.9 9.0 (24.9) (20.0) 28.6 8.8
Net finance expense (31.9) (31.2)
Share of profit of equity accounted investees 2.4 1.6 3.2 2.0 2.4 1.4 - - 8.0 5.0
Income tax benefit 1.8 1.9
Result for the year 6.5 (15.5)
Capital expenditure 7.6 10.4 7.9 20.2 23.1 10.8 0.5 0.9 39.1 42.3
Depreciation and amortisation 17.9 17.3 15.7 15.5 28.2 29.3 0.9 0.8 62.7 62.9
Impairments - 2.5 0.4 1.1 - 0.5 - - 0.4 4.1
Segment operating liabilities 201.2 187.2 269.1 228.7 401.8 228.4 339.8 374.5 1,211.9 1,018.8
Segment non-current assets 181.3 192.1 242.6 234.8 519.6 313.2 (210.7) (16.6) 732.8 723.5
Investments in equity accounted investees 16.2 14.4 21.6 17.7 21.0 17.6 - - 58.8 49.7
Segment current assets 468.3 347.8 626.5 425.0 407.3 356.4 (467.0) (313.1) 1,035.1 816.1
Total assets 665.8 554.3 890.7 677.5 947.9 687.2 (677.7) (329.7) 1,826.7 1,589.3
1 Due to reclassification of (OEM) revenues between Energy & Infrastructure and Industry & Specialty, the revenues in 2009 have been restated to facilitate comparison.
Geographical segmentsIn millions of euro The Netherlands United Kingdom Scandinavia Germany
2010 2009 2010 2009 2010 2009 2010 2009
Revenue from external customers 186.2 176.6 145.2 118.5 295.6 258.0 205.9 149.4
Total non-current assets * 220.6 223.1 10.2 10.3 67.7 75.1 75.6 77.9
Total assets 401.5 345.3 38.6 38.0 197.9 188.4 188.5 157.7
Capital expenditure 4.3 6.3 0.8 1.1 3.5 10.9 3.3 4.3
In millions of euro Rest of Europe North America Asia Other regions
2010 2009 2010 2009 2010 2009 2010 2009
Revenue from external customers 493.3 427.0 360.7 286.7 510.9 437.3 230.0 194.8
Total non-current assets * 159.1 161.7 56.6 53.1 112.9 96.7 24.2 22.8
Total assets 383.8 343.6 175.1 148.8 363.8 296.9 77.5 70.6
Capital expenditure 10.2 7.5 2.7 3.7 12.4 5.5 1.9 3.0
In millions of euro Consolidated
2010 2009
Revenue from external customers 2,427.8 2,048.3
Total non-current assets * 726.9 720.7
Total assets 1,826.7 1,589.3
Capital expenditure 39.1 42.3
* Non-current assets are excluding financial instruments and deferred tax assets.

102 | Draka Holding Notes to the consolidated financial statements 2010
7. Other income and expenses
In millions of euro Note 2010 2009
Increase in provision in relation to restructurings within the Group (21.5) (31.7)
Increase in other provisions (3.8) (3.3)
Increase in provisions 25) (25.3) (35.0)
Release of unused provisions and other 25) 6.5 6.2
Expenses as incurred in relation to restructurings within the Group and other non-recurring items (34.9) (30.7)
(53.7) (59.5)
8. Non-GAAP financial measures (non-recurring items)
In millions of euro 2010 2009
Operating result 28.6 8.8
Non-recurring items:
Restructurings within Energy & Infrastructure 14.4 13.8
Restructurings within Industry & Specialty 12.4 31.6
Restructurings within Communications 22.3 17.7
Other non-recurring items Holding 7.7 3.4
56.8 66.5
Operating result excluding non-recurring items 85.4 75.3
Total non-recurring items in 2010 amount to € 56.8 million. Various restructuring plans have been executed
throughout the Group to further reduce the Group’s cost structure. The total amount related to these re-
structurings amount to € 49.1 million. The restructuring costs include severance costs, impairment charges,
onerous contracts and the costs of moving certain activities. The impairment charge in 2010 of € 0.4 million
is included in the cost of sales (see note 14). The nature of the impairment charge is also explained in this
note.
The non-recurring items also include € 7.7 million costs (mainly advisory fees) relating to the offer from
Prysmian on Draka.
In the Energy & Infrastructure Group the closure of the plant in Ystad was completed and several other
programs were launched to reduce overhead costs. The total reduction in employees in 2010 was 100 and
the savings realised in 2010 are approximately € 10 million.
The measures in the Industry & Specialty Group focused in particular on further downsizing the automotive
cable production in several countries and on the downsizing of the Wire & Cable Assemblies activities. The
total reduction in employees in 2010 was 80 and the savings realised in 2010 are approximately € 9 million.
In the Communications Group the closure of the plant in Arness (Norway) and a range of further cost-saving
measures were implemented. The main purpose of these measures is to reduce fixed costs (overhead) and
direct costs. The total reduction in employees in 2010 was 110 and the savings realised in 2010 are approxi-
mately € 11 million.
Total non-recurring items in 2009 amounted to € 66.5 million. These restructuring costs related to the
implementation and intensification of Triple S projects and other cost-saving measures across the entire
organisation, in response to the challenging market conditions. Furthermore at Holding level non-recurring
advisory fees were incurred in relation to the discussions with Prysmian about a possible merger between
the two companies.
The impairment charge in 2009 of € 4.1 million in relation to the closure of the plant in Ystad (Sweden), the
winding-down of automotive cable production in the Czech Republic and on leasehold improvements as a result
of efficiency measures taken in the Communications Group, was included in the cost of sales (see note 14).

Draka Holding | 103Notes to the consolidated financial statements 2010
9. Employee benefit expense
In millions of euro Note 2010 2009
Wages and salaries 298.7 295.0
Social security charges 57.2 58.0
Contributions to defined contribution plans 24) 12.2 12.4
Expenses related to defined benefit plans 24) 3.0 2.7
Share-based payments 11) 1.7 2.5
372.8 370.6
During 2010, the average number of employees (permanent and temporary) was 9,410 (2009: 10,059).
The number of employees (permanent and temporary) at 31 December 2010 was 9,377 (31 December 2009:
9,599), of which 1,013 were employed by Dutch Group companies (985 in 2009).
10. Remuneration of the Board of Management and Supervisory BoardThe remuneration of the current and former members of the Board of Management in 2010 amounted
to € 2.7 million (2009: € 3.1 million) and the remuneration of the Supervisory Board in 2010 amounted
to € 0.5 million (2009: € 0.4 million). See note 41 for additional details on remuneration.
11. Share-based paymentsIn June 2002 Draka Holding N.V. introduced a long-term incentive plan. This plan is divided into an option
plan and a share plan. In May 2007 the option plan was amended. Certain employees will no longer receive
stock option grants, but stock appreciation rights (SARs) instead that entitles these employees to a cash
payment. The amount of the cash payment is determined based on the increase in the share price between
grant date and vesting date.
In May 2006 Draka Holding N.V. introduced a share plan for the Board of Management. This plan was
refined in May 2007 by disentangling the short-term and long-term incentive plan. Prior to 2006,
members of the Board of Management participated in the general incentive plan.
Share optionsUnder the option plan, the Company has granted share options on its ordinary shares to qualifying
members of senior management. The options are granted for eight years (contractual life of the options),
with a three-year vesting period during which they cannot be exercised. The Board of Management must
approve any exceptions to this policy.

104 | Draka Holding Notes to the consolidated financial statements 2010
The following table summarizes option activity for the year ended 31 December 2010:
Weighted Weighted average
Number of average remaining contractual
options exercise price life in years Range of exercise prices
Outstanding at 31 December 2009 371,631 € 10.09 5.6 € 7.42 € 13.51
Outstanding at 31 December 2009 233,355 € 25.47 5.8 € 23.44 € 28.02
Forfeited during the period (20,664) € 12.25 4.7 € 7.42 € 14.41
Forfeited / expired during the period (47,672) € 25.38 4.2 € 23.44 € 28.02
Exercised during the period (47,129) € 9.85 4.2 € 7.42 € 14.41
Granted during the period 116,303 € 14.41 7.5 € 14.41 € 14.41
Outstanding at 31 December 2010 420,141 € 11.21 5.5 € 7.42 € 14.41
Outstanding at 31 December 2010 185,683 € 25.49 5.1 € 23.44 € 28.02
Total outstanding at 31 December 2010 605,824 € 15.58 5.4 € 7.42 € 28.02
Exercisable options at 31 December 2010 232,849 € 17.79 3.5 € 7.42 € 28.02
The following table summarizes option activity for the year ended 31 December 2009:
Weighted Weighted average
Number of average remaining contractual
options exercise price life in years Range of exercise prices
Outstanding at 31 December 2008 239,374 € 11.96 4.9 € 7.42 € 13.51
Outstanding at 31 December 2008 291,327 € 25.38 6.8 € 23.44 € 28.02
Forfeited during the period (20,860) € 13.51 5.0 € 7.42 € 13.51
Forfeited during the period (57,972) € 25.00 6.6 € 23.44 € 28.02
Exercised during the period (85,676) € 8.46 7.0 € 7.42 € 13.51
Granted during the period 238,793 € 7.93 7.5 € 7.93 € 7.93
Outstanding at 31 December 2009 371,631 € 10.09 5.6 € 7.42 € 13.51
Outstanding at 31 December 2009 233,355 € 25.47 5.8 € 23.44 € 28.02
Total outstanding at 31 December 2009 604,986 € 16.02 5.6 € 7.42 € 28.02
Exercisable options at 31 December 2009 230,381 € 13.52 3.9 € 7.42 € 24.26
The weighted average share price at the date of exercise, for share options exercised in 2010 was € 13.96
(2009: € 12.51).
The fair value of the services received in return for share options granted are measured by reference to
the fair value of share options granted. The estimate of the fair value of the services received is measured
based on a binomial option pricing model. Expectations of early exercise are incorporated into the binomial
option pricing model. The assumptions used for determination of the fair value of options granted in 2010
and 2009 were as follows:
Fair value of share options and assumptions at measurement date 2010 2009
Fair value at measurement date € 5.34 € 3.39
Share price € 14.41 € 7.93
Exercise price € 14.41 € 7.93
Assumptions used:
Expected volatility (expressed as weighted average volatility used
in the modelling under binomial option pricing model) 43.85% 42.3%
Option term 8 years 8 years
Expected dividends 1.77% -
Risk-free interest rate (based on national government bonds) 2.18% 2.78%

Draka Holding | 105Notes to the consolidated financial statements 2010
The expected volatility is based on the historic volatility (calculation based on the weighted average
remaining life of the share options), adjusted for any expected changes to future volatility due to public
available information.
Share options are granted under a service condition with no market or other performance conditions
associated with the share option grants.
Share plansMatching shares
Under the share plan, Draka Holding N.V. has granted qualifying members of its senior management the
right to use part of their regular bonus to acquire ordinary Draka Holding N.V. shares. The shares cannot
be transferred for an initial period of three years. If the employee remains employed during this three year
period (the vesting period), the Company will double the number of shares. The fair value of the 2010 grant
of matching shares amounts to € 13.66 (grant 2009: € 7.93), which is equal to the share price at the date of
the bonus conversion discounted for forfeited dividend. At the end of 2010 the number of matching shares
outstanding to senior management was 26,706 (2009: 27,549).
Share plans Board of Management
Under the share plan, as approved by the General Meeting of Shareholders in 2006, Draka Holding N.V.
has granted members of the Board of Management the right to use part of their regular bonus to acquire
ordinary Draka Holding N.V. shares. The shares cannot be transferred for an initial period of three years.
After three years the Company will multiply the number of shares, based on Draka’s Total Shareholder
Return (“TSR”) compared to a peer group. 2007 was the last year in which shares under this plan were
granted. Draka’s performance over the period 2007 to 2009 resulted in an eight position within the
ranking of the peer group companies. Consequently, the final vesting percentage of the 2007 grant
equalled 0 percent, resulting in no grant of shares to members of the Board of Management.
At the end of 2010 the number of shares outstanding under this plan was nil (2009: 5,203).
The long term incentive plan was disentangled from the short term incentive plan after approval by the
General Meeting of Shareholders in May 2007 and consists of an annual conditional grant of performance
shares which equals 55% of base salary. After a three year period, these performance shares might vest
based on Draka’s TSR performance measured against a peer group. Draka’s performance over the period
2007 to 2009 resulted in a ninth position within the ranking of the peer group companies. Consequently,
the final vesting percentage of the 2007 grant equalled 0 percent, resulting in no grant of shares to
members of the Board of Management. In 2010 68,933 performance shares were conditionally granted
to (former) members of the Board of Management. The fair value of the shares at measurement date
amounted to € 14.96 (grant 2009: € 3.97).
The estimate of the fair value of the shares received for all share plans of the Board of Management is
measured based on the Monte Carlo approach. At the end of 2010 the total number of shares (conditionally
issued or issuable) under all share plans with the Board of Management was 200,890 (2009: 286,634).
See note 41 for additional details on options and shares of the Board of Management.
The following table summarizes matching and performance shares activity for senior management and
(former) members of the Board of Management:
Number of shares Number of shares Number of shares (former) members Number of shares (former) members senior management Board of Management senior management Board of Management 2010 2010 2009 2009
Outstanding at 1 January 27,549 286,634 19,322 139,925
Forfeited during the period (1,921) (154,677) (1,548) (10,983)
Vested during the period (6,621) - (7,267) -
Granted during the period 7,699 68,933 17,042 157,692
Total outstanding at 31 December 26,706 200,890 27,549 286,634

106 | Draka Holding Notes to the consolidated financial statements 2010
Stock Appreciation Rights (SARs)
Under this plan, the Company has granted SARs on its ordinary shares to certain members of senior
management. The SARs are granted for eight years (contractual life of the SARs), with a three-year
vesting period during which they cannot be exercised. The Board of Management must approve any
exceptions to this policy. SARs are granted under a service condition with no market or performance
conditions associated. In 2010 32,504 SARs were granted to senior management.
The fair value of SARs at grant date is determined using the binomial option pricing model with the same
assumptions used as for the determination of the fair value of the options granted. (see page 104 for
further details). The fair value of the liability is remeasured at each reporting date and at settlement date.
The following table summarizes SARs activity for senior management:
Number of SARs Number of SARs senior management senior management
2010 2009
Outstanding at 1 January 92,463 53,025
Forfeited during the period (5,561) (4,158)
Exercised during the period (7,847) -
Granted during the period 32,504 43,596
Total outstanding at 31 December 111,559 92,463
Employee benefit expense related to share-based payments:
In millions of euro Note 2010 2009
Share options and (performance) shares granted 1.3 2.4
Expense arising from SARs (grant and remeasurement) 0.4 0.1
Total expense recognised as employee benefit expense 9) 1.7 2.5
Total carrying amount of liabilities for cash-settled arrangements 5.8 0.1
In case of a change of control, all incentive plans will be settled in cash. This leads to a modification of the
equity settled incentive plans into cash settled incentive plans. To calculate the amount that needed to be
reclassified from equity to liabilities, the fair value at the expected date of settlement (1 March 2011) was
used as best estimate of the fair value at the date of modification (31 December 2010). The reclassification
from equity to liabilities amounts to € 5.2 million. The total liability as at 31 December 2010 equal to the
expected cash out at 1 March 2011, amounts to € 5.8 million.
12. Net finance expense
Recognised in the income statementIn millions of euro 2010 2009
Interest income (1.9) (2.4)
Net foreign exchange gain - (1.3)
Net gain on remeasurement of derivatives through the income statement (1.2) -
Finance income (3.1) (3.7)
Interest expense 24.4 31.6
Fee expenses 4.6 2.5
Impairment loss promissory note Optelecom 2.7 -
Net foreign exchange loss 3.3 -
Net loss on remeasurement of derivatives through the income statement - 0.8
Finance expense 35.0 34.9
Net finance expense 31.9 31.2

Draka Holding | 107Notes to the consolidated financial statements 2010
In the fee expenses of 2010 a one-off charge is included in relation to the revolving credit facility (RCF).
As a result of the change of control the RCF lenders have the right to cancel the facility. Therefore the at
31 December 2010 remaining fees in the amount of € 1.8 million, originally to be amortized until 2012,
were fully charged to the 2010 statement of income.
In November 2010 the TKH Group announced to acquire Optelecom-NKF. Part of the agreement was a
restructuring of Optelecom-NKF’s debt. In connection with this restructuring, Draka Holding N.V. as its
largest lender agreed to a reduction of € 2.7 million of the promissory note, which is recognised as an
impairment loss in the 2010 finance expense. The remaining outstanding balance of the promissory note
in the amount of € 6.4 million was received in January 2011.
13. Taxes
Total income tax recognised in the income statement amounted to a benefit of € 1.8 million in 2010
(2009: benefit of € 1.9 million). The components of income taxes are as follows:
Recognised in the income statementIn millions of euro 2010 2009
Current income tax (expense) / benefit
Current year (11.5) (13.4)
Prior periods (0.7) 6.4
Total current income tax (expense) / benefit (12.2) (7.0)
Deferred income tax benefit
Origination and reversal of temporary differences (4.4) (6.5)
Origination and reversal of tax losses carry forward 13.6 31.1
Temporary differences not recognised 0.5 (1.0)
Tax losses carry forward not recognised (14.4) (19.3)
Prior periods for temporary differences 1.0 6.5
Prior periods for tax losses carry forward 17.7 (1.9)
Total deferred income tax benefit 14.0 8.9
Total income tax benefit 1.8 1.9
In 2010 the Group benefitted from various legal restructurings following the acquisition of the remaining
49.9% of Comteq in 2007. As a result it became probable that the results of future operations in certain
countries will now generate sufficient taxable profits to utilize deferred tax assets. This resulted in a benefit
of € 17.7 million of tax losses carry forward previously not recognised.
Reconciliation of effective tax rate
In millions of euro 2010 2010 in % 2009 2009 in %
Result for the year 6.5 (15.5)
Total income tax benefit (1.8) (1.9)
Result before tax 4.7 100% (17.4) 100%
Income tax calculated at tax rates applicable in
the respective tax jurisdictions 4.3 92% (6.4) 37%
Non-tax deductible expenses 4.0 85% 2.6 (15%)
Tax exempt income (7.2) (153%) (7.2) 42%
Temporary differences not recognised (0.5) (11%) 1.0 (6%)
Tax losses carry forward not recognised 14.4 306% 19.3 (111%)
Prior periods for current tax 0.7 15% (6.4) 37%
Prior periods for temporary differences (1.0) (21%) (6.5) 37%
Prior periods for tax losses carry forward (17.7) (377%) 1.9 (11%)
Other 1.2 26% (0.2) 1%
(1.8) (38%) (1.9) 11%

108 | Draka Holding Notes to the consolidated financial statements 2010
The weighted average applicable tax rate increased from 37% in 2009 to 92% in 2010 due to a change in
the country mix of income tax rates and a change of the mix of profits and losses in the various countries
of the Group.
The effective income tax rate in 2010 is lower than the weighted average applicable rate, mainly due to
benefits from tax losses carry forward previously not recognised. These are partly offset by new losses
carry forward not recognised in other countries since it is not probable that these can be realised in a
foreseeable future, given the uncertain economic situation in these countries. The item other primarily
relates to withholding tax on received dividends and royalties.
Recognised directly in equity
The deferred income tax expense recognised directly in shareholders’ equity during the year amounted
to € 2.5 million (2009: € 8.7 million).
Deferred income tax
Deferred income tax assets and liabilities are offset when there is a legally enforceable right to offset current
tax assets against current tax liabilities and when the deferred income taxes relate to the same fiscal authority.
Deferred tax assets and liabilities relate to the following balance sheet captions, of which the movements in tempo-
rary differences during the year are as follows (without taking into consideration the offsetting of balances):
In millions of euro Balance Recognised in Recognised in Effects of movements Balance
31/12/2008 income statement shareholders’ equity in foreign exchange 31/12/2009
Property, plant and equipment (30.8) 2.3 - (0.4) (28.9)
Intangible assets 5.5 (3.3) - - 2.2
Financial fixed assets - 0.1 - - 0.1
Receivables (1.4) (0.1) - 0.1 (1.4)
Inventories 4.7 (2.5) - 0.1 2.3
Interest-bearing loans and borrowings 12.6 3.0 - - 15.6
Employee benefits 4.1 0.2 - 0.1 4.4
Provisions 0.6 0.9 - - 1.5
Other current liabilities 11.7 (1.1) (8.7) - 1.9
Tax value of loss carry-forwards recognised 25.8 9.4 - - 35.2
32.8 8.9 (8.7) (0.1) 32.9
Deferred tax assets 58.0 51.9
Deferred tax liabilities 25.2 19.0
Net deferred tax position 32.8 32.9
Recognised Recognised Effects of Derecognised in in movements on disposal Balance income shareholders in foreign of a Balance 31/12/2009 statement equity exchange subsidiary 31/12/2010
Property, plant and equipment (28.9) 5.9 - (1.2) - (24.2)
Intangible assets 2.2 (0.6) - 0.1 - 1.7
Financial fixed assets 0.1 (0.1) - - - -
Receivables (1.4) 1.0 (2.9) 0.1 - (3.2)
Inventories 2.3 (1.1) - 0.2 - 1.4
Interest-bearing loans and borrowings 15.6 (2.8) - - - 12.8
Employee benefits 4.4 (0.7) - 0.1 - 3.8
Provisions 1.5 (0.5) - 0.1 - 1.1
Other current liabilities 1.9 0.5 0.4 0.3 - 3.1
Tax value of loss carry-forwards recognised 35.2 12.4 - 0.7 (0.8) 47.5
32.9 14.0 (2.5) 0.4 (0.8) 44.0
Deferred tax assets 51.9 60.9
Deferred tax liabilities 19.0 16.9
Net deferred tax position 32.9 44.0

Draka Holding | 109Notes to the consolidated financial statements 2010
Deferred income tax assets are recognised for temporary tax deductible differences and tax loss carry-
forwards to the extent that the Group has sufficient temporary taxable differences relating to the same
tax authority and the same taxable entity, which will result in taxable amounts against which the tempo rary
tax deductible differences and unused tax losses can be utilized before they expire or that the realization
of the related tax benefit through future taxable profits is probable. Management considers tax strategies
in making this assessment.
Unrecognised deferred tax assetsDeferred tax assets have not been recognised in respect of the following items:
In millions of euro 2010 2009
Deductible temporary differences 206.8 248.2
Tax losses 709.5 740.1
916.3 988.3
Deferred tax assets have not been recognised in respect of these items because it is not probable that
in the foreseeable future taxable profit will be available against which the Group can utilise the benefits
thereof.
The expiration of total tax losses is presented in the table below:
In millions of euro 2010 2009
Within 1 year 7.0 9.4
Within 2 - 5 years 127.6 91.1
After 5 years and thereafter 257.5 270.9
Indefinite 507.8 512.8
899.9 884.2
The amounts included in the tables above are partly based on internal calculations in the absence of final
tax assessments (see note 5(d)).

110 | Draka Holding Notes to the consolidated financial statements 2010
14. Property, plant and equipment
In millions of euro Land and Plant and Fixtures Under
buildings equipment and fittings construction Total
Balance as at 31 December 2008
Cost 454.9 1,014.0 108.9 24.6 1,602.4
Accumulated depreciation and impairments (242.6) (726.7) (69.8) (1.1) (1,040.2)
Carrying amount 212.3 287.3 39.1 23.5 562.2
Acquisitions - 0.5 - - 0.5
Capital expenditure 1.6 10.6 6.5 16.7 35.4
Depreciation charge for the year (8.8) (43.4) (4.4) - (56.6)
Impairment losses (2.5) (1.1) (0.5) - (4.1)
Reclassification 2.2 18.0 0.6 (16.4) 4.4
Disposals (1.9) (1.7) (0.8) (0.1) (4.5)
Derecognised on disposal of a subsidiary (1.0) (2.7) (0.5) - (4.2)
Effect of movements in foreign exchange 2.1 5.4 (0.2) 1.3 8.6
Total changes (8.3) (14.4) 0.7 1.5 (20.5)
Balance as at 31 December 2009
Cost 458.6 1,042.7 108.1 27.8 1,637.2
Accumulated depreciation and impairments (254.6) (769.8) (68.3) (2.8) (1,095.5)
Carrying amount 204.0 272.9 39.8 25.0 541.7
Acquisition - 2.8 - - 2.8
Capital expenditure 5.9 16.6 5.3 6.9 34.7
Depreciation charge for the year (9.6) (42.1) (4.1) - (55.8)
Impairment losses - - - (0.4) (0.4)
Reclassification 6.8 29.7 (13.5) (23.0) -
Disposals (5.5) (0.6) (0.3) (0.2) (6.6)
Derecognised on disposal of a subsidiary (0.3) - - - (0.3)
Effect of movements in foreign exchange 8.1 13.8 1.2 1.0 24.1
Total changes 5.4 20.2 (11.4) (15.7) (1.5)
Balance as at 31 December 2010
Cost 459.8 1,092.9 101.8 12.4 1,666.9
Accumulated depreciation and impairments (250.4) (799.8) (73.4) (3.1) (1,126.7)
Carrying amount 209.4 293.1 28.4 9.3 540.2
In 2009 € 4.4 million was reclassified from trade and other receivables to property, plant and equipment
in relation to in 2008 prepaid capital expenditures for the submarine-cable capacity in Norway.
Depreciation and impairment lossesThe depreciation and impairment charge for an amount of € 56.2 million (2009: € 60.7 million) is
recognised in the income statement as cost of sales.
In 2010 the Group incurred an impairment loss of € 0.4 million in relation to the further winding-down
of automotive cable production in the Czech Republic (Industry & Specialty Group), which resulted in
equipment under construction becoming idle.
In 2009 the Group incurred an impairment loss of in total € 4.1 million in relation to the closure of the
plant in Ystad (Sweden), jointly managed by the Europe division (Energy & Infrastructure Group) and the
Industrial division (Industry & Specialty Group), the winding-down of automotive cable production in the
Czech Republic (Industry & Specialty Group) and on leasehold improvements as a result of efficiency
measures taken in the Communications Group.
The Group has not reversed any impairment loss in 2010 and 2009.

Draka Holding | 111Notes to the consolidated financial statements 2010
Leased property, plant and equipmentThe Group leases land, buildings, plant and equipment under a number of finance lease-agreements.
At 31 December 2010, the net carrying amount of leased property, plant and equipment was € 20.4 million
(2009: € 18.7 million). The leased land, buildings, plant and equipment secures lease obligations (see note 23).
SecurityAt 31 December 2010, mortgages have been granted as security for debts to credit institutions of
€ 0.7 million (2009: € 5.3 million) (see note 23).
Property, plant and equipment under constructionThe balance mainly represents equipment under construction for own use.
15. Intangible assets
In millions of euro Patents and Development
Goodwill licences costs Software Other Total
Balance as at 31 December 2008
Cost 80.5 28.4 1.9 38.7 2.6 152.1
Accumulated amortisation and impairments (0.4) (8.4) (1.5) (27.5) (0.8) (38.6)
Carrying amount 80.1 20.0 0.4 11.2 1.8 113.5
Acquisitions 0.1 - - - 0.3 0.4
Additions - 1.9 0.2 4.6 0.2 6.9
Amortisation charge for the year - (2.1) (0.3) (3.6) (0.3) (6.3)
Reclassification - - - 0.6 (0.6) -
Disposals - - - (0.1) - (0.1)
Effect of movements in foreign exchange - (0.1) 0.1 (0.1) - (0.1)
Total changes 0.1 (0.3) - 1.4 (0.4) 0.8
Balance as at 31 December 2009
Cost 80.7 30.2 1.6 43.0 2.5 158.0
Accumulated amortisation and impairments (0.5) (10.5) (1.2) (30.4) (1.1) (43.7)
Carrying amount 80.2 19.7 0.4 12.6 1.4 114.3
Acquisitions 0.4 - - - - 0.4
Additions - 2.4 0.5 1.5 - 4.4
Amortisation charge for the year - (2.0) (0.1) (4.5) (0.3) (6.9)
Disposals - - - (0.1) - (0.1)
Effect of movements in foreign exchange 0.6 0.2 - 0.5 0.1 1.4
Total changes 1.0 0.6 0.4 (2.6) (0.2) (0.8)
Balance as at 31 December 2010
Cost 81.7 32.9 2.2 45.3 2.6 164.7
Accumulated amortisation and impairments (0.5) (12.6) (1.4) (35.3) (1.4) (51.2)
Carrying amount 81.2 20.3 0.8 10.0 1.2 113.5

112 | Draka Holding Notes to the consolidated financial statements 2010
GoodwillAcquisitions include goodwill arising from acquisitions in subsidiaries (as stated in note 3).
An acquisition of € 1.0 million relates to Pressure Tube Manufacturing (PTM).
In earlier years the Group acquired 100% of the shares of DeBiase Lift Components S.R.L. As part of the
purchase price consideration, the Group agreed an earn-out arrangement with the prior shareholders.
The value of the corresponding liability depended on the performance of the company in the five
years after acquisition. In 2010 the Group adjusted the estimate of the company’s future performance
downwards. The corresponding decrease in the liability of € 0.6 million is recognised in goodwill.
In accordance with the revised IFRS 3 standards, for all new acquisitions where this is applicable, the
contingent consideration will be measured at fair value at the time of the business combination. If the
amount of contingent consideration changes as a result of a post-acquisition event (such as meeting an
earnings target), accounting for the change in consideration depends on whether the additional conside-
ration is an equity instrument or cash or other assets paid or owed. If it is equity, the original amount is
not remeasured. If the additional consideration is cash or other assets paid or owed, the changed amount
is recognised in profit or loss. If the amount of consideration changes because of new information about
the fair value of the amount of consideration at acquisition date (rather than because of a post-acquisition
event) then retrospective restatement is required.
The acquisition of € 0.1 million in 2009 related to Hickory Wire Inc.
Amortisation The amortisation charge for an amount of € 6.9 million (2009: € 6.3 million) is recognised in the income
statement as cost of sales.
Impairment loss and subsequent reversalThe Group has not incurred nor reversed any impairment losses in 2010 and 2009.
Impairment tests for cash-generating units containing goodwillThe carrying amount of goodwill relates to:
In millions of euro 2010 2009
Communications 64.3 64.3
Industry and Specialty 15.6 15.7
Energy and Infrastructure 1.3 0.2
Total 81.2 80.2
It is the Group’s policy to carry out an impairment test in the fourth quarter of each year on the goodwill
of cash generating units. The valuation is based on the actual results and the five year plan of the
management. For the period after five years, a growth rate of 2% has been used.
The pre-tax discount factor used is 11% (2009: 11%). The carrying amount of the units remains below its
recoverable amount determined as value in use and therefore no impairment losses were recognised.
Patents and licencesPatents and licences include intellectual property rights relating to the business. At 31 December 2010
the carrying amount of these rights is € 10.1 million (2009: € 11.2 million) and the remaining useful live is
approximately 9 years.

Draka Holding | 113Notes to the consolidated financial statements 2010
16. Investments in equity accounted investees and joint ventures
The Group has the following significant investments in equity accounted investees and joint ventures:
Ownership Ownership
Country 2010 2009
Oman Cables Industry (SAOG) Associate Oman 34.8% 34.8%
Elkat Ltd. Associate Russia 40.0% 40.0%
Telcon Fios e Cabos Para Telecomunicações Joint venture Brazil 50.0% 50.0%
Yangtze Optical Fibre & Cable Co. Ltd. Joint venture China 37.5% 37.5%
Precision Fiber Optics Ltd. Joint venture Japan 50.0% 50.0%
Jiangsu YOFC Zhongli Fiber and Cable Co.,Ltd. Associate China 19.1% 19.1%
Yangtze Optical Fiber and Cable Sichuan Co.,Ltd. Associate China 19.1% 19.1%
Draka Comteq SDGI Co. Ltd. Associate China 18.4% 18.4%
Tianjin YOFC XMKJ Optical Communications Co., Ltd. Associate China 18.4% 18.4%
Shantou Hi-tech Zone Aoxing Optical Communication Equipment Co.,Ltd. Associate China 15.7% 15.7%
Yangtze (Wuhan) Optical System Co.,Ltd. Associate China 11.3% 11.3%
Tianjin YOFC XMKJ Optical Cable Co., Ltd. Associate China 7.5% 7.5%
The Group’s share of result in equity accounted investees for the year ended 31 December 2010 was
€ 8.0 million (2009: € 5.0 million). During the year 2010 the Group received dividends from equity
accounted investees for an amount of € 2.8 million (2009: € 2.2 million). Oman Cables Industry (SAOG)
is listed on public stock exchange markets. Based on the stock price at 31 December 2010, the fair value
of the investment in Oman Cable Industry (SAOG) amounts to € 71.4 million (31 December 2009: € 80.8
million). Summary financial information of equity accounted investees and joint ventures at 100 per cent
based on 31 December 2010 and 2009 available information:
In millions of euro Current Non-current Total Current Non-current Total Revenue Expenses Result for
assets assets assets liabilities liabilities liabilities the year
2010
Oman Cables Industry (SAOG) 187.3 69.1 256.4 143.9 21.5 165.4 394.7 378.7 16.0
Elkat Ltd. 21.6 5.1 26.7 0.6 0.1 0.7 246.5 245.4 1.1
Telcon Fios e Cabos Para Telecomunicações 48.7 19.0 67.7 25.1 8.5 33.6 93.8 86.5 7.3
Yangtze Optical Fibre & Cable Co. Ltd. 220.7 151.4 372.1 175.2 58.3 233.5 437.6 405.6 32.0
Precision Fiber Optics Ltd. 3.3 - 3.3 1.2 - 1.2 4.6 3.3 1.3
Jiangsu YOFC Zhongli Fiber and Cable Co. Ltd. 27.9 3.4 31.3 15.2 - 15.2 48.0 43.9 4.1
Yangtze Optical Fiber and Cable Sichuan Co. Ltd. 17.7 4.0 21.7 12.2 - 12.2 26.5 25.1 1.4
Draka Comteq SDGI Co. Ltd. 17.2 3.4 20.6 3.2 - 3.2 15.5 15.3 0.2
Tianjin YOFC XMKJ Optical Communications Co. Ltd. 15.7 24.3 40.0 11.5 - 11.5 32.7 30.4 2.3
Shantou Hi-tech Zone Aoxing Optical
Communication Equipment Co. Ltd. 22.0 8.2 30.2 5.9 - 5.9 47.9 44.3 3.6
Yangtze (Wuhan) Optical System Co. Ltd. 10.2 0.6 10.8 2.5 - 2.5 10.5 9.0 1.5
Tianjin YOFC XMKJ Optical Cable Co.. Ltd. 18.0 9.3 27.3 16.3 - 16.3 20.9 20.8 0.1
2009
Oman Cables Industry (SAOG) 126.4 54.2 180.6 91.9 13.8 105.7 291.4 278.9 12.5
Elkat Ltd. 19.7 5.6 25.3 0.5 0.2 0.7 120.5 123.5 (3.0)
Telcon Fios e Cabos Para Telecomunicações 30.9 17.0 47.9 15.3 6.7 22.0 59.6 56.7 2.9
Yangtze Optical Fibre & Cable Co. Ltd. 163.4 112.0 275.4 125.8 30.6 156.4 387.3 357.4 29.9
Precision Fiber Optics Ltd. 2.2 0.1 2.3 1.2 - 1.2 3.9 3.8 0.1
Jiangsu YOFC Zhongli Fiber and Cable Co. Ltd. 18.6 2.7 21.3 9.8 - 9.8 37.5 35.4 2.1
Yangtze Optical Fiber and Cable Sichuan Co. Ltd. 11.7 1.9 13.6 7.3 - 7.3 20.9 19.9 1.0
Draka Comteq SDGI Co. Ltd. 14.0 3.2 17.2 3.0 - 3.0 14.6 13.0 1.6
Tianjin YOFC XMKJ Optical Communications Co. Ltd. 9.9 19.5 29.4 6.2 - 6.2 11.6 10.7 0.9
Shantou Hi-tech Zone Aoxing Optical
Communication Equipment Co. Ltd. 19.3 7.9 27.2 6.1 - 6.1 37.4 34.6 2.8
Yangtze (Wuhan) Optical System Co. Ltd. 7.7 0.4 8.1 2.2 - 2.2 7.6 5.8 1.8

114 | Draka Holding Notes to the consolidated financial statements 2010
17. Other non-current financial assets
In millions of euro 2010 2009
Receivables 11.4 12.3
Other investments 3.0 2.7
14.4 15.0
The fair value of the other non-current financial assets cannot be determined reliably because there are no
observable market prices for these assets. Therefore, a valuation technique has been used. The fair value
does not differ significantly from the carrying amounts.
18. Inventories
In millions of euro 2010 2009
Raw materials and consumables 106.3 85.7
Work in progress 40.7 35.9
Semi finished goods 46.6 29.0
Finished goods 206.2 199.7
399.8 350.3
In 2010 raw materials and consumables and changes in work in progress, semi finished goods and finished
goods recognised as cost of sales amounted to € 1,594.9 million (2009: € 1,247.1 million). In 2010 the
additions to allowances for obsolete stock amounted to € 13.1 million (2009: € 11.9 million). The additions
are included in cost of sales.
At 31 December 2010, no inventories have been pledged (2009: nil).
19. Trade and other receivables
In millions of euro 2010 2009
Trade receivables 414.6 309.2
Trade receivables due from associates - 2.1
Other current receivables and prepayments 70.7 70.1
485.3 381.4
At 31 December 2010, other current receivables include retentions of € 1.2 million (2009: € 0.3 million)
relating to construction contracts in progress.
Trade receivables are shown net of impairment losses. The Group established an allowance for impairment
that represents its estimate of incurred losses in respect of trade and other receivables and investments.
The impairment loss amounted to € 9.9 million at 31 December 2010, representing 2.3% of trade receiva-
bles (2009: € 11.9 million or 3.7%). In 2010, expenses relating to the impairment of trade receivables of
€ 2.9 million were recognised in the consolidated statement of income, representing 0.12% of revenue
(2009: € 6.0 million, or 0.29% of revenue).
The Group’s exposure to credit and currency risks and impairment losses related to trade and other
receivables are disclosed in notes 4 and 27.
In September 2009 Draka entered into a standby arrangement with ING Commercial Finance, part of
ING Group. The arrangement offers Draka the opportunity to sell accounts receivable of several of its
European entities to ING Commercial Finance with a maximum of € 50 million. Draka activated the
arrangement, which runs for at least 24 months, in September 2009.
As part of this arrangement the Group has factored trade receivables without recourse in 2010. These
receivables are derecognised from the balance sheet because all their related risks and rewards are
transferred under such transactions to the factor. The amount of receivables factored but not yet paid
by customers was the maximum amount of € 50 million at 31 December 2010 (2009: € 31.2 million).

Draka Holding | 115Notes to the consolidated financial statements 2010
20. Cash and cash equivalents
In millions of euro 2010 2009
Cash and cash equivalents 138.7 74.0
Bank overdrafts (9.8) (6.9)
Cash and cash equivalents in the statement of cash flows 128.9 67.1
Cash and cash equivalents are freely available.
21. Total equity
Total equity consists of shareholders’ equity attributable to the equity holders of the Company of
€ 589.8 million (2009: € 549.5 million) and minority interests of € 25.0 million (2009: € 21.0 million).
In October 2009 the company issued 8,119,370 ordinary and 708,400 preference shares. Net proceeds
after deduction of directly attributable costs of € 2.3 million, amounted to € 98.7 million.
See note 37 for additional details on shareholders’ equity.
22. Earnings per share
Basic earnings per shareBasic earnings per share is calculated by dividing the profit attributable to ordinary equity holders of the
Company by the weighted average number of ordinary shares during the year excluding ordinary shares
purchased by the company and held as treasury shares.
Result attributable to ordinary equity holders In millions of euro 2010 2009
Result for the year 4.6 (18.2)
Dividends on redeemable cumulative preference shares (5.4) (5.4)
Result attributable to ordinary equity holders (0.8) (23.6)
Weighted average number of ordinary shares
In thousands of shares 2010 2009
Issued common shares as at 1 January 48,736 40,617
Effect of treasury shares held (25) (13)
Issue of shares - 1,746
Weighted average number of ordinary shares at 31 December 48,711 42,350
Basic earnings per share (euro)
Basic earnings per share (0.02) (0.56)
Diluted earnings per shareDiluted earnings per share is calculated by adjusting the weighted average number of ordinary shares
outstanding to assume conversion of all dilutive potential ordinary shares. The Company has two cate-
gories of dilutive potential ordinary shares: convertible subordinated bonds notes and share options and
shares under the long-term incentive plan.
Result attributable to ordinary equity holders (diluted)In millions of euro 2010 2009
Result attributable to ordinary equity holders (0.8) (23.6)
After-tax effect of interest on convertible subordinated bond notes 1.0 1.3
Result attributable to ordinary equity holders (diluted) 0.2 (22.3)

116 | Draka Holding Notes to the consolidated financial statements 2010
Weighted average number of ordinary shares (diluted) In thousands of shares 2010 2009
Weighted average number of ordinary shares (basic) 48,711 42,350
Effect of long-term incentive plans 218 191
Effect of conversion of convertible subordinated bond notes 1,691 1,748
Weighted average number of ordinary shares (diluted) at 31 December 50,620 44,289
Diluted earnings per share (euro) Diluted earnings per share (0.02) (0.56)
The average market value of the Company’s ordinary shares for purposes of calculating the dilutive effect
of share options and shares was based on quoted market prices for the period that the options and shares
were outstanding.
The estimated number of shares that were issuable in respect of the convertible arrangements and the
long-term incentive plans for the year 2010 and 2009 are not included in the diluted earnings per share
for that year, as these instruments had an antidilutive impact on the reported earnings attributable to
ordinary equity holders.
23. Interest-bearing loans and borrowings
In millions of euro 2010 2010 2009 2009 Carrying Fair Carrying Fair amount value amount value
Non-current liabilities
Bank facilities and loans 29.4 29.4 269.9 269.9
Finance leases 14.7 14.7 16.9 16.9
44.1 44.1 286.8 286.8
Current liabilities
Convertible subordinated bonds - - 25.1 25.2
Bank facilities and loans 365.5 365.5 46.4 46.4
Current portion of finance leases 2.7 2.7 3.2 3.2
368.2 368.2 74.7 74.8
Total interest-bearing loans and borrowings 412.3 412.3 361.5 361.6
In millions of euro Bank Finance Total facilities Leases and loans
Effective interest rate 1.6% 9.6%
Due in 2011 365.5 2.7 368.2
Due between 2012 - 2015 26.3 7.1 33.4
Due after 2015 3.1 7.6 10.7
Total interest-bearing loans and borrowings 394.9 17.4 412.3
Of which included in non-current 29.4 14.7 44.1
Of which included in current 365.5 2.7 368.2
Total interest-bearing loans and borrowings 394.9 17.4 412.3
The effective interest rates as stated in the table above, excludes the impact of interest rate swaps.
The fair value of interest-bearing loans and borrowings has been estimated by calculating the discounted
value of the loan and borrowings portfolio using an estimated yield curve, appropriated for the contract
terms in effect at the end of the year. The carrying amounts of current portion of interest-bearing loans
and borrowings approximate their fair value. Quoted market prices and interest rates prevailing on the
balances sheet date were used in determining fair values.

Draka Holding | 117Notes to the consolidated financial statements 2010
The Group has hedged the interest rate risk on part of the multicurrency revolving credit facility. More infor-
mation about the Group’s exposure to interest rate and foreign currency risk has been disclosed in note 27.
4 per cent Convertible Subordinated Bonds due 2010
In millions of euro 2010 2009
Balance at 1 January 25.1 24.3
Amortisation of interest expense 0.6 0.8
Redemption at face value (25.7) -
Carrying amount of liability at 31 December - 25.1
In September 2010 the 4% convertible subordinated bond was redeemed at face value of € 25.7 million.
Bank facilities and loansThe bank facilities and loans comprise a combination of a committed multicurrency revolving credit
facility of € 675 million and various bilateral facilities on Group level as well as local facilities to various
subsidiaries. The multicurrency facility expires in 2012.
In case of a change of control, the lenders of the multicurrency revolving credit facility (RCF) have the
right to cancel the facility. Therefore the RCF, with an original maturity date of December 2012, has been
reclassified to the current portion of interest bearing loans and borrowings.
The interest-bearing liabilities, except the convertible subordinated bonds, relate to various credit facilities
from (a syndicate of) financial institutions. The interest payable of the multicurrency revolving credit
facility is variable and based on the relevant interbank interest rate plus a mark-up of 75 basis points.
If certain conditions are not met, the loans become payable on demand. See note 4b.
Certain bank loans are secured over land and buildings with a carrying amount of € 0.7 million
(2009: € 5.3 million) (see note 14).
Finance lease liabilitiesFinance lease liabilities are payable as follows:
In millions of euro Future Present value Future Present value minimum of minimum minimum of minimum lease payments Interest lease payments lease payments Interest lease payments 2010 2010 2010 2009 2009 2009
Less than one year 4.3 1.6 2.7 4.9 1.7 3.2
Between one and five years 12.5 5.4 7.1 13.4 5.9 7.5
More than five years 9.6 2.0 7.6 12.3 2.9 9.4
26.4 9.0 17.4 30.6 10.5 20.1
Under the terms of the lease agreements, no contingent rents are payable.
24. Provision for employee benefits
Defined benefit plansEmployee benefit plans have been established in many countries in accordance with the legal require-
ments, customs and the local situation in the country involved. In Europe a significant part of the employ-
ees are covered by defined benefit plans. The benefits provided by these plans are based on employees
service years and compensation levels. The measurement date for all defined benefit plans is 31 December.
Contributions are made by the Group, as necessary, to provide assets to meet the benefits payable to
defined benefit pension plan participants. These contributions are based on various factors including
funded status, legal and tax considerations as well as local customs.

118 | Draka Holding Notes to the consolidated financial statements 2010
In the Netherlands the Group participates in a multi-employer pension plan. This pension plan is externally
funded in PME, the Dutch industry wide pension fund for the Metalelektro. In accordance with IAS 19 the
related pension scheme should be treated as a defined benefit plan. Since the assets and liabilities of this
multi-employer plan can not be allocated in a systematic way to the employers, the Group applies the
exemption mentioned in paragraph 19.30 of IAS and treats the scheme as a defined contribution plan.
The pension fund has a deficit. The coverage ratio per 31 December 2010 on the basis of the actual market
interest rate was 96% (2009: 99%). The Group has no obligation to fund any deficits and is not entitled to
any surpluses.
In millions of euro 2010 2009
Present value of unfunded obligations 60.4 59.8
Present value of funded obligations 181.5 170.5
Fair value of plan assets (169.8) (152.4)
Present value of net obligations 72.1 77.9
Unrecognised actuarial gains and (losses) (1.4) (6.0)
Recognised liability for defined benefit obligations 70.7 71.9
Liability for long-service leave 10.2 10.8
Restrictions on assets recognised 0.7 -
Total employee benefits 81.6 82.7
Actual return on plan assets 18.4 17.0
The 2010 contribution to the Group’s multi employer plan (PME) amounted to € 6.5 million (2009: € 6.5 million).
Movement in the liability for defined benefit obligations
In millions of euro 2010 2009
Liability for defined benefit obligations at 1 January 230.3 223.4
Benefits paid by the plan (8.2) (9.4)
Current service costs 2.9 2.9
Interest on obligation 12.0 12.4
Actuarial losses or (gains) 3.6 (1.6)
Benefits paid by the employer (3.3) (3.2)
Employee contributions 0.8 0.8
Liabilities extinguished on settlements (1.2) (2.6)
Effect of movements in foreign exchange 5.0 7.6
Liability for defined benefit obligations at 31 December 241.9 230.3
Movement in plan assets In millions of euro 2010 2009
Fair value of plan assets at 1 January 152.4 133.2
Benefits paid by the plan (8.2) (9.1)
Employer contribution 3.9 5.0
Employee contribution 0.8 0.8
Expected return on plan assets 9.8 8.3
Actuarial (losses) or gains 8.6 8.7
Effect of movements in foreign exchange 2.5 5.5
Fair value of plan assets at 31 December 169.8 152.4
Expense recognised in the statement of income In millions of euro 2010 2009
Interest on obligation (12.0) (12.4)
Current service costs (2.9) (2.9)
Expected return on plan assets 9.8 8.3
Curtailment 1.2 -
Amortization unrecognised net gain or loss (0.6) 0.2
Adjustment for restrictions on defined benefit assets (0.7) -
(5.2) (6.8)

Draka Holding | 119Notes to the consolidated financial statements 2010
The 2011 expense is not expected to differ significantly from the 2010 expense recognised in the income statement.
The expected return on plan assets is based on actual historical weighted returns.
The Group also sponsors defined contributions and similar types of plans for a significant number of salaried
employees. The total costs amounted to € 12.2 million (2009: € 12.4 million).
Actuarial assumptionsPrincipal weighted average actuarial assumptions at the balance sheet date:
2010 2009 2008
Discount rate at 31 December 5.0% 5.3% 5.6%
Expected return on plan assets at 31 December 5.0% 5.8% 5.6%
Future salary increases 2.5% 2.5% 2.5%
Future pension increases 1.0% 1.8% 1.9%
The plan assets consist primarily of bonds, listed shares and related instruments. The majority of these
plan assets relate to pension plans in the Netherlands. The allocation of the investments per asset category
for the pension plans in the Netherlands at 31 December 2010 and 2009 is approximately as follows:
2010 2009
Shares and related instruments 35% 34%
Bonds 63% 61%
Other 2% 5%
Historical informationIn millions of euro 2010 2009 2008 2007 2006
Present value of the defined benefit obligation 241.9 230.3 223.4 306.0 330.1
Fair value of plan assets 169.8 152.4 133.2 256.2 259.4
Deficit in plan (72.1) (77.9) (90.2) (49.8) (70.7)
Experience adjustments arising on plan liabilities (0.8) 1.9 (2.2) (2.5) 0.1
Experience adjustments arising on plan assets 8.2 8.7 (36.4) (1.5) 5.5
Other employee benefit provisionsIn several countries the Group established jubilee and long service plans in accordance with local customs.
The provision resulting from these plans is recognised under other employee benefits. The Group has
applied the same actuarial assumptions as those used in the actuarial calculation of the defined benefit
post retirement plans. All actuarial gains or losses have been recognised in the income statement.

120 | Draka Holding Notes to the consolidated financial statements 2010
25. Other provisions
In millions of euro Warranties Restructuring Onerous contracts Other Total
Balance at 1 January 2009 3.8 6.5 1.3 17.7 29.3
Provisions made during the year 0.9 31.7 0.1 2.3 35.0
Provisions used during the year (0.3) (14.8) (0.2) (1.3) (16.6)
Provisions reversed during the year (1.6) (0.3) (0.1) (4.2) (6.2)
Reclassifications - (0.1) - 0.1 -
Derecognised on disposal of a subsidiary - (0.4) - - (0.4)
Effect of movements in foreign exchange - 0.3 - 1.1 1.4
Balance at 31 December 2009 2.8 22.9 1.1 15.7 42.5
Provisions made during the year 1.5 21.5 0.9 1.4 25.3
Provisions used during the year (0.8) (31.2) (0.4) (3.0) (35.4)
Provisions reversed during the year (0.9) - - (5.6) (6.5)
Reclassifications 0.3 - - (0.3) -
Effect of movements in foreign exchange 0.1 1.0 - 1.0 2.1
Balance at 31 December 2010 3.0 14.2 1.6 9.2 28.0
Non-current 2.8 4.9 - 8.7 16.4
Current 0.2 9.3 1.6 0.5 11.6
WarrantiesThe provision for product warranty reflects the estimated costs of replacement and free-of-charge
services that will be incurred by the Group with respect to products sold. The Group expects to incur
most of the liability within the time frame of 4 years.
RestructuringIn 2010 Draka continued several cost saving measures across the entire organisation. The closure of the
plants in Arness (Norway) and Ystad (Sweden) were completed in the second half of 2010 and further
efficiency measures are proceeding according to plan. As a result hereof a total restructuring provision
of € 21.5 was made of which € 11.3 million was used in 2010. The majority of the restructuring in relation
to these plans is expected to be completed in 2011.
In 2009 the Group announced to close its factories in Ystad and Arness, started with further downsizing
of the Automotive cable production operations in several countries and took efficiency measures within
the Communications Group. In relation to this a provision of € 31.7 million was made, of which € 11.8 million
has been used in 2009. In 2010 the remaining amount of € 19.9 million was used.
Onerous contractsThe Group has non-cancellable leases for facilities which are no longer used due to changes in activities.
The facilities are (partly) sublet where possible, but rental income is lower than the rental expense. The
net obligation under the contracts was provided for.
Other provisionsOther provisions include among other things, expected losses on projects and provisions for plant
dismantling and removal costs. The Group expects to incur most of the liability within the time frame
of 4 years.
26. Trade and other payables
In millions of euro 2010 2009
Trade payables 501.4 380.5
Non-trade payables and accrued expenses 143.8 108.8
645.2 489.3

Draka Holding | 121Notes to the consolidated financial statements 2010
27. Financial instruments
Credit riskExposure to credit risk
The carrying amount of financial assets represents the maximum credit exposure. The maximum exposure
to credit risk at the reporting date was:
In millions of euro Carrying amount
Note 2010 2009
Receivables 17) 11.4 12.3
Promissory note 6.4 9.0
Other investments 17) 3.0 2.7
Trade receivables 19) 414.6 309.2
Trade receivables due from associates 19) - 2.1
Other receivables 48.6 43.4
Fair value derivatives 28) 12.7 10.1
Cash and cash equivalents 20) 138.7 74.0
635.4 462.8
The Group has insured part of its exposure to credit risk (including political risk) on trade receivables;
further reference is made to note 4.
Impairment losses
The aging of trade receivables at the reporting date was:
In millions of euro Gross Impairment Gross Impairment
2010 2010 2009 2009
Not past due 344.2 0.7 268.2 0.2
Past due 0-30 35.0 0.1 24.0 -
Past due 31-90 18.1 0.5 12.8 0.3
Past due 91-365 18.7 3.4 7.5 2.4
More than one year 8.5 5.2 10.7 9.0
424.5 9.9 323.2 11.9
The movement in the allowance for impairment in respect of trade receivables during the year was as follows:
In millions of euro Carrying amount
2010 2009
Balance at 1 January 11.9 9.6
Impairment loss recognised 2.9 6.0
Write off against financial asset (3.3) (1.4)
Reversal of impairment loss (1.9) (2.1)
Translation differences 0.5 0.1
Derecognised on disposal of a subsidiary (0.2) (0.3)
Balance at 31 December 9.9 11.9
The allowance account in respect of trade receivables is used to record impairment losses unless the
Group is satisfied that no recovery of the amount owing is possible; at that point the amounts considered
irrevocable are written off against the financial asset directly.

122 | Draka Holding Notes to the consolidated financial statements 2010
Liquidity riskThe following are the contractual maturities of financial liabilities at 31 December 2010:
In millions of euro Contractual cash flows Carrying (principal Less than More than amount values) 6 months 6-12 months 1-2 years 2-5 years 5 years
Non-derivative financial liabilities
Bank facilities and loans 394.9 (394.9) (349.9) (15.6) (4.0) (22.3) (3.1)
Finance lease liabilities 17.4 (26.4) (2.1) (2.2) (3.4) (9.1) (9.6)
Trade and other payables 645.2 (645.2) (645.2) - - - -
Bank overdrafts 9.8 (9.8) (9.8) - - - -
Derivative financial liabilities
Interest rate derivatives 9.6 (9.7) (2.3) (2.1) (3.2) (2.1) -
Foreign exchange derivatives 1.6 (1.6) (1.7) 0.2 (0.1) - -
The Multicurrency facility expires in 2012. Drawings under this facility typically have a tenor of one or
three months.
In case of a change of control, the lenders of the multicurrency revolving credit facility (RCF) have the
right to cancel the facility. Therefore the RCF, with an original maturity date of December 2012, has been
reclassified to the current portion of interest bearing loans and borrowings.
The following are the contractual maturities of financial liabilities at 31 December 2009:
In millions of euro Contractual cash flows Carrying (principal Less than More than amount values) 6 months 6-12 months 1-2 years 2-5 years 5 years
Non-derivative financial liabilities
Convertible subordinated debt 25.1 (25.7) - (25.7) - - -
Bank facilities and loans 316.3 (316.3) (25.7) (20.7) (12.2) (257.7) -
Finance lease liabilities 20.1 (30.6) (2.5) (2.5) (3.3) (10.1) (12.2)
Trade and other payables 489.3 (489.3) (489.3) - - - -
Bank overdrafts 6.9 (6.9) (6.9) - - - -
Derivative financial liabilities
Interest rate derivatives 10.3 (10.7) (3.2) (1.6) (2.8) (3.1) -
Foreign exchange derivatives 0.3 (0.3) - (0.2) (0.1) - -
Currency riskThe following significant exchange rates applied during the year:
Average rate Reporting date spot rate
2010 2009 2010 2009
Euro 1.00 1.00 1.00 1.00
USD 0.76 0.72 0.75 0.69
GBP 1.17 1.12 1.16 1.13
Sensitivity analysis
A 10 per cent strengthening or weakening of the euro against the aforementioned currencies at 31 December
2010 would have changed equity and profit or loss in the range of € 0.5 to € 1.0 million. This analysis assumes
all other variables remain constant and excludes the effect of translating financial data denominated in
a functional currency other than the euro – the reporting currency of the Group. The forward exchange
contracts have been included in this estimation.

Draka Holding | 123Notes to the consolidated financial statements 2010
Interest rate riskAt the reporting date the interest rate profile of the Group’s interest-bearing financial instruments was:
In millions of euro Carrying amount
2010 2009
Fixed rate instruments
Financial assets 6.4 9.0
Financial liabilities 17.4 45.2
Floating rate instruments
Financial assets 138.7 74.0
Financial liabilities 404.7 323.2
Fair value sensitivity analysis for fixed rate instruments
The Group does not account for any fixed rate financial assets and liabilities at fair value through profit
or loss, and the Group does not designate derivatives (interest rate swaps) as hedging instruments under
a fair value hedge accounting model. Therefore a change in interest rates at the reporting date would not
affect profit or loss.
Cash flow sensitivity analysis for variable rate instruments
A change of 100 basis points in interest rates at the reporting date would have increased (decreased)
equity and profit or loss by the amounts shown below. This analysis assumes that all other variables,
in particular foreign currency rates, remain constant.
In millions of euro Profit or loss Equity
100 bp increase 100 bp decrease 100 bp increase 100 bp decrease
31 December 2010
Variable rate instruments (2.7) 2.7 - -
Interest rate derivatives 2.5 (2.5) 5.9 (6.7)
Cash flow sensitivity net (0.2) 0.2 5.9 (6.7)
31 December 2009
Variable rate instruments (2.5) 2.5 - -
Interest rate derivatives 2.0 (2.0) 8.3 (6.1)
Cash flow sensitivity net (0.5) 0.5 8.3 (6.1)
Price riskIn the ordinary course of its business the Company has an exposure of a portion of its inventory (core
inventory). Based on the economic position as per 31 December 2010, a change of € 0.10 in copper price
will have a theoretical impact on the Company’s operating result of around € 0.8 million. The actual impact
depends on factors such as the period over which the fluctuation takes place, turnover speed of the inven-
tory, and others.
For further information on financial instruments reference is made to note 4 financial risk management.
Fair value of financial instrumentsThe following table provides an analysis of financial instruments that are measured subsequent to initial
recognition at fair value, grouped into Levels 1 to 3 based on the degree to which the fair value is observable.
• Level 1 fair value measurements are those derived from quoted prices (unadjusted) in active markets
for identical assets or liabilities.
• Level 2 fair value measurements are those derived from inputs other than quoted prices included
within Level 1 that are observable for the asset or liability, either directly (i.e. as prices) or indirectly
(i.e. derived from prices).]
• Level 3 fair value measurements are those derived from valuation techniques that include inputs for
the asset or liability that are based on observable market data (unobservable inputs).

124 | Draka Holding Notes to the consolidated financial statements 2010
In millions of euro Level 1 Level 2 Level 3 Total
31 December 2010
Financial assets:
Derivative financial instruments - cash flow hedges - 11.4 - 11.4
Derivative financial instruments - fair value through profit or loss - 1.3 - 1.3
Total - 12.7 - 12.7
Financial liabilities:
Derivative financial instruments - cash flow hedges - 9.6 - 9.6
Derivative financial instruments - fair value through profit or loss - 1.6 - 1.6
Total - 11.2 - 11.2
31 December 2009
Financial assets:
Derivative financial instruments - cash flow hedges - 9.5 - 9.5
Derivative financial instruments - fair value through profit or loss - 0.6 - 0.6
Total - 10.1 - 10.1
Financial liabilities:
Derivative financial instruments - cash flow hedges - 10.3 - 10.3
Derivative financial instruments - fair value through profit or loss - 0.3 - 0.3
Total - 10.6 - 10.6
28. Derivative financial instruments
Derivative financial instruments comprise:
In millions of euro 2010 2009
Assets Liabilities Assets Liabilities
Interest rate derivatives - cash flow hedges - 9.6 - 10.3
Forward foreign exchange contracts - fair value through profit or loss 1.3 1.6 0.6 0.3
Forward copper contracts - cash flow hedges 11.4 - 9.5 -
Total 12.7 11.2 10.1 10.6
The following tables indicate the periods in which the cash flows associated with derivatives that are cash
flow hedges are expected to occur and are expected to impact profit or loss:
In millions of euro Carrying Expected Less than More than
amount cash flows 6 months 6-12 months 1-2 years 2-5 years 5 years
31 December 2010
Interest rate derivatives
Liabilities:
cash flow hedges 9.6 (9.7) (2.3) (2.1) (3.2) (2.1) -
Forward copper contracts (commodities)
Assets:
cash flow hedges 11.4 11.4 5.2 3.6 2.2 0.4 -
In millions of euro Carrying Expected Less than More than
amount cash flows 6 months 6-12 months 1-2 years 2-5 years 5 years
31 December 2009
Interest rate derivatives
Liabilities:
cash flow hedges 10.3 (10.7) (3.2) (1.6) (2.8) (3.1) -
Forward copper contracts (commodities)
Assets:
cash flow hedges 9.5 9.5 6.4 2.5 0.5 0.1 -

Draka Holding | 125Notes to the consolidated financial statements 2010
29. Commitments and contingent liabilities
Investment and supplier commitmentsAs at 31 December 2010, the Group entered into contracts to purchase property, plant and equipment for
an amount of € 2.2 million (2009: € 0.3 million). These commitments are expected to be settled in 2011.
Commitments under rental and lease agreementsLeases as lessee
Non-cancellable operating lease rentals are payable as follows:
In millions of euro 2010 2009
Less than one year 10.2 10.2
Between one and five years 35.1 29.6
More than five years 13.5 19.4
58.8 59.2
The Group leases factories, warehouse facilities, machinery and equipment under operating leases.
These leases expire at various dates during the next 20 years, with an option to renew the lease after
expiry date. The leases do not include any significant contingent rentals.
Some of the leased properties have been sublet by the Group. Sublease payments of € 0.1 million
(2009: € 1.0 million) are expected to be received until expiry date. The Group has recognised a provision
of € 1.6 million (2009: € 1.0 million) in respect of two leases (see note 25).
During the year ended 31 December 2010, € 11.5 million (2009: € 12.3 million) was recognised as an
expense in the income statement in respect of operating leases. An amount of € 0.2 million was
recognised as income in the income statement in respect of subleases (2009: € 0.3 million).
GuaranteesAt 31 December 2010, € 50.7 million guarantees were outstanding: € 20.7 million in relation to outstanding
performance bonds and guarantees of € 30.0 million to ING Bank in relation to cash pooling agreements.
30. Related parties Identity of related partiesThe Group has a related party relationship with its subsidiaries. associates and joint ventures. In addition.
for an overview of important shareholders in the Group reference is made to Share Information. Disclosure
of Major Holdings in Listed Companies Act in this Annual report. For an overview of the remuneration of
the Board of Management and Supervisory Board. reference is made to note 41.
Transactions with associates and joint ventures (equity accounted investees)
In millions of euro 2010 2009
Sale of goods to related parties 72.0 80.2
Purchase of goods from related parties 5.0 7.3
Amounts owed by related parties 4.5 13.2
Amounts owed to related parties 3.8 4.9
Dividend received from related parties 15.1 11.5
31. Events after the balance sheet date
We refer for further explanation on the events after the balance sheet date to the section Other information
included in the Company financial statements.

126 | Draka Holding Company financial statements 2010
In millions of euro Note* 2010 2009
Assets
Non-current assets
Intangible fixed assets 34) 1.5 1.5
Tangible fixed assets 1.0 1.4
Derivative financial instruments 2.6 0.6
Financial fixed assets 35) 1,241.2 1,050.9
Total non-current assets 1,246.3 1,054.4
Current assets
Derivative financial instruments 10.5 8.9
Trade and other receivables 36) 128.7 87.9
Cash in bank and in hand 28.4 44.5
Total current assets 167.6 141.3
Total assets 1,413.9 1,195.7
Equity
Shareholders’ equity
Share capital 27.2 27.2
Share premium 457.5 457.5
Translation reserve 13.8 (22.8)
Hedging reserve 6.1 (1.9)
Reserve for equity accounted investees 42.1 36.9
Reserve for treasury shares (0.2) (0.4)
Retained earnings 38.7 71.2
Unappropriated result for the year (0.8) (23.6)
Preference shares dividend reserve 5.4 5.4
Total shareholders’ equity 37) 589.8 549.5
Provision for employee benefits 0.9 1.2
Liabilities
Non-current liabilities
Interest-bearing loans and borrowings 38) 121.4 293.1
Derivative financial instruments 5.2 5.6
Deferred tax liability 2.9 3.5
Total non-current liabilities 129.5 302.2
Current liabilities
Interest-bearing loans and borrowings 38) 310.4 25.1
Other provisions 1.4 2.3
Derivative financial instruments 4.4 5.0
Trade and other payables 39) 377.5 310.4
Total current liabilities 693.7 342.8
Total liabilities 824.1 646.2
Total equity and liabilities 1,413.9 1,195.7
Statement of income for the years ended 31 December
Income after taxes from investments in group companies 35) 25.4 5.5
Other income after taxes (20.8) (23.7)
Result attributable to the shareholders 4.6 (18.2)
Company financial statementsCompany balance sheet as at 31 December (before appropriation of the result)
* The notes to the company financial statements on pages 127 to 135 are an integral part of these company financial statements.

Draka Holding | 127Notes to the company financial statements
Notes to the company financial statementsContents
32. General 128
33. Principles for the measurement of assets and liabilities and the determination of the result 128
34. Intangible fixed assets 128
35. Financial fixed assets 128
36. Trade and other receivables 129
37. Shareholders’ equity 129
38. Interest-bearing loans and borrowings 132
39. Trade and other payables 132
40. Financial instruments 132
41. Remuneration of the Board of Management and Supervisory Board 133
42. Audit fees 135
43. Commitments and contingent liabilities 135

128 | Draka Holding
32. General
The company financial statements (hereinafter also referred to as the ‘statutory financial statements
of the Company’) are part of the 2010 financial statements of Draka Holding N.V. and are prepared in
compliance with the legal requirements of Part 9, Book 2, of the Netherlands Civil Code.
With respect to the company statement of income, the Company made use of the exemption provided
under section 2:402 of the Netherlands Civil Code, which allows the Company to present only the profit
from Group companies after income tax and other income and expenses after income tax.
33. Principles for the measurement of assets and liabilities and the determination of the result
Draka Holding N.V. has applied the option in section 2:362 (8) of the Netherlands Civil Code to use the
same principles of valuation and determination of result for the statutory financial statements as those
applied for the consolidated financial statements. Unless otherwise described in the notes to the statutory
financial statements, reference should be made to the notes to the consolidated financial statements for
details of the accounting principles adopted in these statutory financial statements.
34. Intangible fixed assets
In millions of euro Goodwill Software Total
Balance as at 31 December 2009
Cost 0.7 1.8 2.5
Accumulated amortisation - (1.0) (1.0)
Carrying amount 0.7 0.8 1.5
Additions - 0.4 0.4
Amortisation charge for the year - (0.4) (0.4)
Total changes - - -
Balance as at 31 December 2010
Cost 0.7 2.2 2.9
Accumulated amortisation - (1.4) (1.4)
Book value 0.7 0.8 1.5
GoodwillGoodwill is determined based on the accounting principles applied in the consolidated financial statements
(note 2 (h-I)). Goodwill acquired through a direct investment in Group companies is presented in the
statutory balance sheet of the Company. The goodwill arising on direct investments prior to 1 January
2001 was written off the reserves. Goodwill acquired through indirect investments in Group companies
is capitalised within the carrying value of the entities that have directly acquired these investments.
35. Financial fixed assets
Group companies or ‘subsidiaries’ are all entities (including special purpose entities) over which the
Company has the power to govern the financial and operating policies, generally accompanying a
shareholding of more than one half of the voting rights. The existence and effect of potential voting
rights that are currently exercisable or convertible are considered when assessing whether the Company
controls another entity.
Investments in Group companies are measured using the net asset value method. The net asset value
and results of Group companies are determined on the basis of the accounting policies that are applied
in the consolidated financial statements. The accounting policies of Group companies are changed where
necessary to ensure consistency with the policies adopted by the Company.
Notes to the company financial statements

Draka Holding | 129
If losses of Group companies that are allocable to the Company exceed the carrying value of the interest
in the Group company (including separately presented goodwill, if any, and including other non-secured
receivables), further losses are not recognised unless the Company has incurred obligations or made
payments on behalf of the Group company to satisfy obligations of the Group company. In such a situation,
the Company recognises a provision up to the extent of this obligation.
Unrealised gains and losses on transactions between Group companies, if any, are eliminated.
In millions of euro Investments in Investments in equity Amounts from group
group companies accounted investees companies and other Total
Balance as at 31 December 2009 727.7 25.3 297.9 1,050.9
Share in result 19.8 5.6 - 25.4
Additions 193.3 - - 193.3
Dividend received (56.0) (1.9) - (57.9)
Disposals (15.7) - - (15.7)
Financing and other movements 7.2 (0.5) 1.9 8.6
Effect of movements in foreign exchange 34.7 1.9 - 36.6
Balance as at 31 December 2010 911.0 30.4 299.8 1,241.2
Draka Holding N.V. is at the head of the Group and has capital interests in subsidiaries, associates and joint
ventures presented on page 49.
36. Trade and other receivables
In millions of euro 2010 2009
Receivables from group companies 114.0 70.2
Other receivables and prepayments 14.7 17.7
128.7 87.9
Receivables from Group companies and other receivables are mainly due within 1 year.
37. Shareholders’ equity
For both the years ended 31 December 2010 and 31 December 2009, the total of capital and reserves that
are attributable to the Company’s equity holders included in the statutory financial statements is equal
to the capital and reserves attributable to the Company’s equity holders as presented in the consolidated
financial statements. Certain reserves have been presented separately in the Company balance sheet,
whereas for consolidated purposes these have been summarised as retained earnings and other reserves.
Authorised and issued share capitalAt 31 December 2010, the authorised and issued share capital consisted of:
• 58,000,000 ordinary registered or bearer shares with a nominal value of € 0.50 each, of which
48,736,597 were issued and fully paid (2009: 48,736,597). Excluding the number of shares that
have been repurchased, the number of ordinary shares issued and outstanding is 48,719,418
(31 December 2009: 48,705,966);
• 82,000,000 preference shares with a par value each of € 0.50 per share, of which
2,925,000 preference shares held by ASR were issued and fully paid (2009: 2,925,000) and of which
2,829,657 preference shares held by Kempen were issued and fully paid (2009: 2,829,657).
On 2 October 2009 the Company has placed 4,057,654 new ordinary shares at a price of € 12.40 per share
through an accelerated bookbuild offering. On 22 October 2009, the general meeting of shareholders of
Draka Holding N.V. (“Draka”) approved the private placement of 4,061,716 ordinary shares to Flint Beheer
B.V. at a price of € 12.40 per ordinary share and the issue of 708,400 preference shares to the two holders
of Draka’s preference shares that held more than 5% of Draka’s issued share capital allowing such holders
to maintain their holdings above 5%. On 20 October 2009 one bond with a nominal value of € 1,000 was
converted into 67 additional ordinary shares.
Notes to the company financial statements

130 | Draka Holding
The holders of ordinary and preference shares are entitled to receive dividends as declared from time
to time and are entitled to vote at meetings of the Company. All shares rank equally with regard to the
Company’s residual assets, except that preference shareholders participate only to the extent of the face
value of the shares adjusted for any dividends in arrears. In respect of the Company’s shares that are held
by the Group (see below), all rights are suspended until those shares are reissued.
All current preference shares are held by two banks, ASR and Kempen. The preference shares have a
remaining interest term of 2 years with annual dividends of 7.12% for the preference shares held by
ASR and 7.06% for the preference shares held by Kempen.
All 5,754,657 preference shares will be acquired by Prysmian from ASR and Kempen on 1 March 2011.
Treasury sharesThe Company acquires ordinary shares to cover obligations under its long-term incentive plans. Shares
are generally acquired just prior to employees exercising their options or when shares are to be delivered.
The acquired shares are subsequently delivered to the eligible employees. At 31 December 2010 the
Company owns 17,179 shares (2009: 30,631) and the amount paid to acquire the shares was € 195,860
(2009: € 384,344) (see note 2 (n)).
Movements in the number of shares in 2009 and 2010 that are issued and fully paid are as follows:
In numbers of shares Ordinary Treasury Preference
shares shares shares
Balance at 31 December 2008 40,611,393 5,767 5,046,257
Issue of shares 8,119,370 - 708,400
Conversion of convertible subordinated bond notes 67 - -
Movement in own shares (24,864) 24,864 -
Balance at 31 December 2009 48,705,966 30,631 5,754,657
Movement in own shares 13,452 (13,452) -
Balance at 31 December 2010 48,719,418 17,179 5,754,657
The maximum increase in the number of ordinary shares due to the conversion of the convertible bonds in
2009 was 1,748,130, corresponding to 3.6% of the ordinary shares as at 31 December 2009.
Notes to the company financial statements

Draka Holding | 131
In millions of euro Ordinary shares Preference shares Reserve Preference Reserve Unapprop- Trans- for shares for equity riated Share Share Share Share lation treasury Hedging dividend accounted Retained result for capital premium capital premium reserve shares reserve reserve investees earnings the year Total
Balance as at 31 December 2008 20.3 286.8 2.5 74.1 (29.6) (0.1) (27.8) 5.4 36.3 8.6 63.9 440.4
Appropriation of the result 2008 - - - - - - - - - 63.9 (63.9) -
Foreign exchange translation differences - - - - 6.8 - - - - - - 6.8
Effective portion of fair value changes
of cash flow hedges (net of income tax) - - - - - - 25.9 - - - - 25.9
Issue of shares 4.0 96.6 0.4 - - - - - - (2.3) - 98.7
Dividends paid - - - - - - - (5.4) - - - (5.4)
Result for the year - - - - - - - 5.4 2.8 (2.8) (23.6) (18.2)
Reclassification - - - - - - - - (2.2) 2.2 - -
Effect of acquisition minority interest - - - - - - - - - (0.3) - (0.3)
Share based payments - - - - - - - - - 2.4 - 2.4
Shares acquired under long term
incentive plans - - - - - (1.7) - - - - - (1.7)
Shares delivered under long term
incentive plans - - - - - 1.4 - - - (0.5) - 0.9
Balance as at 31 December 2009 24.3 383.4 2.9 74.1 (22.8) (0.4) (1.9) 5.4 36.9 71.2 (23.6) 549.5
Appropriation of the result 2009 - - - - - - - - - (23.6) 23.6 -
Foreign exchange translation differences - - - - 36.6 - - - - - - 36.6
Effective portion of fair value changes
of cash flow hedges (net of income tax) - - - - - - 8.0 - - - - 8.0
Dividends paid - - - - - - - (5.4) - - - (5.4)
Result for the year - - - - - - - 5.4 5.2 (5.2) (0.8) 4.6
Share based payments - - - - - - - - - 1.3 - 1.3
Shares acquired under long term
incentive plans - - - - - (0.2) - - - - - (0.2)
Shares delivered under long term
incentive plans - - - - - 0.4 - - - 0.2 - 0.6
Reclassification long-term incentive
plans to current liabilities due to
modification from equity-settled
in cash-settled - - - - - - - - (5.2) - (5.2)
Balance as at 31 December 2010 24.3 383.4 2.9 74.1 13.8 (0.2) 6.1 5.4 42.1 38.7 (0.8) 589.8
Translation reserveThe translation reserve comprises all foreign exchange differences arising since 1 January 2004 from
the translation of the financial statements of foreign operations as well as from the translation of inter-
company loans with a permanent nature. The reserve is not available for distribution to shareholders.
To the extent the translation reserve is negative, it reduces the amount that can be freely distributed
out of reserves.
Hedging reserveThe hedging reserve is not available for distribution to shareholders. To the extent the hedging reserve
is negative, it reduces the amount that can be freely distributed out of reserves.
Reserves for equity accounted investeesThe reserve for equity accounted investees amounting to € 42.1 million (2009: € 36.9 million), relates to the
Company’s share in their result that has not been distributed as dividend. In 2009 an amount of € 2.2 million
was reclassified to retained earnings, mainly caused by the sale of Oakwell Engineering Ltd. and the propor-
tionate consolidation as of 1 January 2009 of its joint ventures Telcon Fios e Cabos Para Telecommunicações,
Yangtze Optical Fibre & Cable Co. Ltd. and Precision Fiber Optics Ltd. instead of using the equity method.
Notes to the company financial statements
The movement schedule of capital and reserves attributable to the shareholders of the Company in 2009 and 2010
is presented below:

132 | Draka Holding
Legal reservesThe legal reserves of the Company comprise the translation reserve, the hedging reserve and the reserves
for equity accounted investees and are not available for distribution to shareholders. Furthermore the
retained earnings include a legal reserve of € 65.9 million (2009: € 63.6 million) in relation the Company’s
cumulative share in result less distributed dividend of the joint ventures Telcon Fios e Cabos Para
Telecommunicações, Yangtze Optical Fibre & Cable Co. Ltd., Yangtze Optical Fibre & Cable (Shanghai) Co.
Ltd. and Precision Fiber Optics Ltd., since these amounts cannot be repatriated to the Netherlands without
restriction.
DividendsA proposal will be made to the Annual General Meeting of Shareholders to pay a dividend on redeemable
preference shares for an amount of € 5.4 million. The remainder will be added to retained earnings.
38. Interest-bearing loans and borrowings
In millions of euro Note 2010 2009
Non-current liabilities
Bank facilities and loans - 254.0
Group companies 121.4 39.1
121.4 293.1
Current liabilities
Convertible subordinated bonds 23) - 25.1
Bank facilities and loans 310.4 -
310.4 25.1
39. Trade and other payables
In millions of euro 2010 2009
Trade creditors 153.9 97.7
Payables to group companies 196.5 204.8
Other current liabilities. accruals and deferred income 27.1 7.9
377.5 310.4
Trade and other payables are mainly due within 1 year.
40. Financial instruments
Credit riskExposure to credit risk
The carrying amount of financial assets represents the maximum credit exposure. The maximum exposure
to credit risk at the reporting date was:
In millions of euro Carrying amount
2010 2009
Investments in group companies and equity accounted investees 941.4 753.0
Amounts from group companies 293.6 291.8
Promissory note 6.4 9.0
Other investments 0.3 0.3
Receivables from group companies 114.0 70.2
Other receivables 1.4 4.1
Fair value derivatives 13.1 9.5
Cash and cash equivalents 28.4 44.5
1,398.6 1,182.4
Notes to the company financial statements

Draka Holding | 133
Liquidity riskThe following are the contractual maturities of financial liabilities at 31 December 2010:
In millions of euro Carrying Contractual
amount cash flows Less than More than
(principal values) 6 months 6-12 months 1-2 years 2-5 years 5 years
Non-derivative financial liabilities
Bank facilities and loans 310.4 (310.4) (310.4) - - - -
Loans from group companies 121.4 (121.4) - - - - (121.4)
Trade and other payables 377.5 (377.5) (377.5) - - - -
Derivative financial liabilities
Interest rate swaps 9.6 (9.7) (2.3) (2.1) (3.2) (2.1) -
In case of a change of control, the lenders of the multicurrency revolving credit facility (RCF) have the
right to cancel the facility. Therefore the RCF, with an original maturity date of December 2012, has been
reclassified to the current portion of interest bearing loans and borrowings.
The following are the contractual maturities of financial liabilities at 31 December 2009:
In millions of euro Carrying Contractual
amount cash flows Less than More than
(principal values) 6 months 6-12 months 1-2 years 2-5 years 5 years
Non-derivative financial liabilities
Convertible subordinated debt 25.1 (25.7) - (25.7) - - -
Bank facilities and loans 254.0 (254.0) - - - (254.0) -
Loans from group companies 39.1 (39.1) - - - - (39.1)
Trade and other payables 310.4 (310.4) (310.4) - - - -
Derivative financial liabilities
Interest rate swaps 10.3 (10.7) (3.2) (1.6) (2.8) (3.1) -
Foreign exchange derivatives 0.3 (0.3) (0.3) - - - -
41. Remuneration of the Board of Management and Supervisory Board
Board of ManagementThe remuneration of members of the Board of Management is determined by the Supervisory Board.
The Company’s policy concerning remuneration is designed to ensure that the Company is able to attract
and retain suitable qualified members of the Board of Management. The remuneration package consists
of a base salary, a short-term incentive (bonus) payment and a long-term incentive in the form of shares.
In addition, individual pension schemes are in place for the members of the Board of Management.
The remuneration is determined annually in light of the tasks and responsibilities of the individual mem-
bers of the Board of Management. Based on pre set targets, the levels of the bonus payments made to
members of the Board of Management are determined annually by the Supervisory Board after the end of
the financial year. In addition to the financial targets, the Supervisory Board has set discretionary targets
for the individual members of the Board of Management on the basis of which the bonus is calculated.
Notes to the company financial statements

134 | Draka Holding
The remuneration paid to the current and former members of Draka’s Board of Management in 2010 and
2009 was as follows:
The long-term incentive reflects the fair value of shares (conditionally) granted to members of the Board
of Management and relate to the expenses following IFRS 2. The actual grant of shares depends on the
Company’s future performance in relation to the peer group.
The number of ordinary shares owned by and conditionally granted to members of the Board of
Management on 31 December 2010 and 2009 was as follows:
Number of shares owned 2010 2009
Frank Dorjee 9,940 9,940
Number of conditionally granted performance shares 2010 2009
Frank Dorjee 95,267 99,834
Okke Koo 5,821 -
The shares of all Board of Management members have been granted as part of the long-term incentive plan
as detailed in note 11.
Supervisory BoardThe remuneration of the members of the Supervisory Board is fixed and independent of the Company’s
financial results. Members of the Supervisory Board are also entitled to reimbursement of incurred costs.
The remuneration of the members of the Supervisory Board was as follows:
In thousands of euro 2010 2009
Bernard Dijkhuizen 2 36.7 -
Fritz Fröhlich 83.5 83.5
Annemiek Fentener van Vlissingen 61.5 66.0
Harold Fentener van Vlissingen 61.0 56.0
Ludo van Halderen 61.7 60.0
Rob van Oordt 65.0 65.0
Annemieke Roobeek 1 18.3 55.0
Maarten Schönfeld 2 37.3 -
Graham Sharman 1 21.2 63.5
Aad Veenman 2 37.3 -
483.5 449.0
1 Stepped down at the Annual General Meeting of Shareholders held on 20 April 2010.
2 Appointed at the Annual General Meeting of Shareholders held on 20 April 2010.
Notes to the company financial statements
In thousands of euro Total Total
Paid out Short-term Allowances Total cash Pension Long-term remun- Employer’s remuneration
Salary holiday incentive remuneration charges incentive eration expense expense
2010
Frank Dorjee 550 34 740 3 1,327 130 293 1,750 7 1,757
Okke Koo 475 - 285 6 766 109 87 962 7 969
1,025 34 1,025 9 2,093 239 380 2,712 14 2,726
2009
Sandy Lyons 532 - 319 254 1,105 457 181 1,743 215 1,958
Frank Dorjee 452 19 294 3 768 90 478 1,336 7 1,343
984 19 613 257 1,873 547 659 3,079 222 3,301

Draka Holding | 135
42. Audit fees
Fees paid to the Group’s auditor for 2010 and 2009 (Deloitte Accountants B.V.) can be broken down into
the following components:
• Audit fees, which include fees for auditing the statutory and consolidated financial statements;
• Audit-related fees, which include fees for work performed on prospectuses, non-standard auditing
and advisory services not related to statutory auditing;
• Fees for tax advice;
• Other non-audit fees, which include fees for support and advice on acquisitions.
The breakdown of the audit fees for the year ended 31 December is as follows:
In millions of euro 2010 2009
Deloitte Deloitte Deloitte Deloitte
Accountants BV Touche Tohmatsu Total Accountants BV Touche Tohmatsu Total
Audit fees 0.5 1.3 1.8 0.5 1.2 1.7
Audit-related fees 0.1 0.2 0.3 0.2 0.4 0.6
Fees for tax advice 0.1 - 0.1 - - -
Other non-audit fees - - - - 0.4 0.4
0.7 1.5 2.2 0.7 2.0 2.7
43. Commitments and contingent liabilities
The Company has assumed joint and several liabilities for debts arising from legal actions of its Dutch
subsidiaries, in accordance with Article 403, section 1, Part 9, Book 2 of the Netherlands Civil Code.
The debts of these subsidiaries amounted to € 38.4 million (2009: € 30.2 million).
Draka Holding N.V. forms a fiscal unity with several Dutch Group companies for the Dutch income tax.
Consequently Draka Holding is jointly and severally liable for any debts arising from the fiscal unity.
The Company has issued guarantees in respect of credit facilities granted to subsidiaries of € 38.3 million
(2009: € 36.0 million) and guarantees of € 30.0 million to ING Bank in relation to cash pooling agreements.
Amsterdam, 14 February 2011
Board of Management
Frank Dorjee, Chairman and CEO
Supervisory Board
Fritz Fröhlich, Chairman
Annemiek Fentener van Vlissingen, Deputy Chairman
Bernard Dijkhuizen
Harold Fentener van Vlissingen
Ludo van Halderen
Rob van Oordt
Maarten Schönfeld
Aad Veenman
Notes to the company financial statements

136 | Draka Holding Other information
Other information
Appropriation of result as provided for by the Articles of Association
Article 31 (1-12) of the Articles of Association states:
1. The profit evidenced by the annual accounts, as adopted and approved, shall be used first of all to
pay the holders of Class B preference shares a dividend the percentage of which shall be equal to the
average interest on deposits applied by the European Central Bank plus two and a half, increased by
the debit interest surcharge commonly applied by the large banks in the Netherlands, weighted by the
number of days to which the dividend payment relates. The amount of dividend is calculated on the
basis of the paid-up portion of the nominal value. If any profit distribution referred to in the previous
sentences cannot be made, whether in full or in part, on the grounds that the profit does not permit
any such distribution, the deficit shall be charged against the distributable part of the Company’s
equity.
2. Subsequently, a dividend is paid on each preference share of a specific class. The amount and method
of adopting the dividend shall be determined with the issue of the relevant class by the body authorised
to issue the shares in question, all of this subject to the Supervisory Board’s approval. The dividend
shall be expressed as a percentage of the yield basis for the preference shares of the relevant class, as
referred to in Article 8 paragraph 2 sub b. The resolution to issue preference shares of a specific class
may provide:
• that the dividend will be amended and readopted in accordance with the previous two sentences on
the dates set out in the resolution (the “Dividend Review Dates”);
• that any deficit arising from the fact that the profit realised in a given year is insufficient to allow
for payment of the full dividend on preference shares of the relevant class shall be charged against
the profit of the next financial year(s) in which the profit is sufficient to allow for any such payment;
• that any deficit arising from the fact that the profit realised in a given year is insufficient to allow
for payment of the full dividend on preference shares of the relevant class shall be charged, where
possible, against the Company’s freely distributable reserves;
• that the dividend to be paid on the relevant preference shares shall be subordinated to the dividend
to be paid on preference shares of any other class or classes.
3. The Board of Management shall annually decide, subject to approval by the Supervisory Board,
which portion of the distributable profit after application of paragraphs 1 and 2 of this Article is to
be reserved.
4. The portion of the profit which remains after payment of dividends on the preference shares and
retention in any reserve shall be distributed as dividend to the ordinary shareholders.
5. The Board of Management may resolve to pay interim distributions, if the Supervisory Board so
approves.
6. The Company may only distribute profit to its shareholders up to the distributable portion of the
Company’s equity.
7. Deficits may only be charged against the statutory reserves in so far as permitted by statute.
8. The profit shall be distributed after adoption of the annual accounts which confirm the lawfulness
of the distribution.

Draka Holding | 137Other information
9. Interim dividends may be paid only if it is evident from the interim financial accounts that the
requirement of paragraph 6 of this Article is satisfied. The interim financial accounts must depict
the Company’s financial position no earlier than as at the first day of the third month prior to that in
which the resolution to pay an interim dividend is made public. The interim accounts shall be prepared
with due observance of generally accepted principles of valuation. The amounts to be reserved by
statute shall be included in the financial accounts, which are to be signed by the members of the
Board of Management. If the signature of any of these members is missing, this fact and the underlying
reason shall be duly reported. The interim financial accounts shall be deposited at the office of the
Commercial Register within eight days of the date on which the resolution to distribute an interim
dividend is announced.
10. The shares held by the Company in its own capital shall be counted in the calculation of the profit
distribution.
11. Resolutions to pay interim dividends and other distributions shall be made public without delay.
12. Any claims by shareholders for payment of dividends shall lapse after five years.
Proposed appropriation of resultThe following proposal will be presented to the shareholders for adoption at the Annual General Meeting of
Shareholders.
The result for the year 2010 will be appropriated as follows (including comparative amounts):
In millions of euro 2010 2009
Reserve for equity accounted investees 5.2 2.8
Dividend preference shares 5.4 5.4
Other reserves (6.0) (26.4)
4.6 (18.2)
EmployeesDuring 2010, the average number of employees employed by the Company (permanent and temporary)
was 79 (2009: 80). The number of employees (permanent and temporary) employed by the Company
at 31 December 2010 was 84 (31 December 2009: 77).
Events after the balance sheet dateOn 22 November 2010, Prysmian S.p.A. (“Prysmian”) and Draka Holding N.V. (“Draka”) jointly announced
they reached a conditional agreement in connection with a public offer by Prysmian for all issued and
outstanding ordinary shares of Draka at an offer price of €8.60 in cash plus 0.6595 newly issued Prysmian
ordinary shares for each Draka ordinary share. On 3 February 2011, 44,064,748 Shares have been tendered
for acceptance under the Offer, representing around 90.4% of Draka’s issued and outstanding ordinary share
capital (excluding any Shares held by Draka). On 8 February 2011, Prysmian declared the public offer for all
Shares in Draka unconditional.
An estimate of the financial effect, except as described in section 2, cannot be made.

138 | Draka Holding Independent auditor’s report
Independent auditor’s report
To: The general meeting of shareholders of Draka Holding N.V.
Report on the financial statementsWe have audited the accompanying financial statements 2010 of Draka Holding N.V., Amsterdam. The financial
statements include the consolidated financial statements and the company financial statements. The consolidated
financial statements comprise the consolidated balance sheet as at December 31, 2010, the consolidated statement
of income, the consolidated statement of comprehensive income, consolidated statement of cash flows and consolidated
statement of changes in total equity for the year then ended, and notes, comprising a summary of the significant
accounting policies and other explanatory information. The company financial statements comprise the company
balance sheet as at December 31, 2010, the company profit and loss account for the year then ended and the notes,
comprising a summary of the accounting policies and other explanatory information.
Management’s responsibilityManagement is responsible for the preparation and fair presentation of these financial statements in accordance with
International Financial Reporting Standards as adopted by the European Union and with Part 9 of Book 2 of the Dutch
Civil Code, and for the preparation of the Report of the Board of Management in accordance with Part 9 of Book 2 of
the Dutch Civil Code. Furthermore management is responsible for such internal control as it determines is necessary
to enable the preparation of the financial statements that are free from material misstatement, whether due to fraud or
error.
Auditor’s responsibilityOur responsibility is to express an opinion on these financial statements based on our audit. We conducted our audit
in accordance with Dutch law, including the Dutch Standards on Auditing. This requires that we comply with ethical
requirements and plan and perform the audit to obtain reasonable assurance about whether the financial statements
are free from material misstatement. An audit involves performing procedures to obtain audit evidence about the
amounts and disclosures in the financial statements. The procedures selected depend on the auditor’s judgment,
including the assessment of the risks of material misstatement of the financial statements, whether due to fraud or
error.
In making those risk assessments, the auditor considers internal control relevant to the entity’s preparation and fair
presentation of the financial statements in order to design audit procedures that are appropriate in the circumstances,
but not for the purpose of expressing an opinion on the effectiveness of the entity’s internal control. An audit also
includes evaluating the appropriateness of accounting policies used and the reasonableness of accounting estimates
made by management, as well as evaluating the overall presentation of the financial statements. We believe that the
audit evidence we have obtained is sufficient and appropriate to provide a basis for our audit opinion.
Opinion with respect to the consolidated financial statementsIn our opinion, the consolidated financial statements give a true and fair view of the financial position of Draka Holding
N.V. as at December 31, 2010 and of its result and its cash flows for the year then ended in accordance with International
Financial Reporting Standards as adopted by the European Union and with Part 9 of Book 2 of the Dutch Civil Code.
Opinion with respect to the company financial statementsIn our opinion, the company financial statements give a true and fair view of the financial position of Draka Holding N.V.
as at December 31, 2010 and of its result for the year then ended in accordance with Part 9 of Book 2 of the Dutch Civil
Code.
Report on other legal and regulatory requirementsPursuant to the legal requirement under Section 2:393 sub 5 at e and f of the Dutch Civil Code, we have no deficiencies
to report as a result of our examination whether the Report of the Board of Management, to the extent we can assess,
has been prepared in accordance with Part 9 of Book 2 of this Code, and whether the information as required under
Section 2:392 sub 1 at b-h has been annexed. Further we report that Report of the Board of Management, to the extent
we can assess, is consistent with the financial statements as required by Section 2:391 sub 4 of the Dutch Civil Code.
Amsterdam, February 14, 2011
Deloitte Accountants B.V.
P.J. Bommel

Draka Holding | 139Trustee report
Trustee report
4 % Convertible Subordinated Bonds 2005 due 2010 with principal amount of € 100,000,000
of Draka Holding N.V.
In compliance with the provisions of article 17, b, 2 of the trust deed executed before
Mr. R.J.J. Lijdsman on September 22, 2005, we report as follows.
On September 22, 2010 the remaining amount of the loan was redeemed by Draka Holding N.V.
From the € 100,000,000.- of bonds initially issued an amount of € 25,715,000,- was still outstanding
at the time of redemption.
During the year no bonds of € 1,000.-- have been offered for conversion.
Amsterdam, January 11, 2011
ANT Trust & Corporate Services N.V.
L.J.J.M. Lutz

140 | Draka Holding Ten years of Draka Holding N.V.
2010 4 2009 4 2008 2,4 2007 2,4 2006 4 2005 4 2004 4 2003 2002 2001
Results (x € million)
Revenue 2,428 2,048 2,829 2,816 2,529 1,879 1,684 1,420 1,499 1,917
EBITDA 91 72 156 198 112 89 56 103 53 250
Operating result 29 9 95 146 58 31 (4) 42 (10) 189
Result before income tax 5 (17) 63 116 32 (8) (36) 8 (49) 153
Result for the year (equity holders) 5 (18) 69 93 22 4 (9) 11 (25) 118
Balance sheet (x € million)
Shareholders’ equity 590 550 440 401 427 360 445 362 383 430
Guarantee capital 1 607 569 490 523 620 702 624 563 618 556
Total assets 1,827 1,589 1,703 1,799 1,745 1,638 1,604 1,279 1,386 1,549
Current assets -/- non-interest
bearing current liabilities 366 293 415 415 280 302 380 355 402 455
Per ordinary share (x € 1)
Shareholders’ equity (excluding preference shares) 10.52 9.69 8.96 9.11 9.85 10.13 8.84 11.16 12.13 14.98
Result for the year after dividend on preference shares (0.02) (0.56) 1.78 2.46 0.57 0.12 (0.67) 0.12 (1.62) 5.43
Proposed dividend - - - 0.68 0.37 - - 0.10 - 1.63
Pay-out - - - 30% 30% - - 83% - 30%
Highest share price 20.06 14.26 25.20 42.20 26.60 14.30 20.90 16.85 45.71 67.35
Lowest share price 9.95 4.17 5.97 19.75 11.70 9.95 8.75 4.10 7.15 36.35
Market price at year end 19.10 13.46 6.54 23.00 25.80 13.23 10.70 15.60 9.45 39.50
Price / Earnings ratio on basis of price at year end (1,163) (24.2) 3.7 9.3 45.0 110.3 (16.0) 130.0 (5.8) 7.3
Price of convertible subordinated bond 2010 at year end - 101% 74% 156% 168% 103% - - - -
Ratios (in %)
Operating result / Revenue 1.2 0.4 3.4 5.2 2.3 1.6 (0.3) 3.0 (0.7) 9.9
ROTA 3 0.3 (1.1) 3.6 6.5 1.9 (0.5) (2.5) 0.7 (3.4) 10.6
Result for the year / Revenue 0.2 (0.9) 2.4 3.3 0.9 0.2 (0.5) 0.8 (1.7) 6.1
Result for the year / Average shareholders’
equity (excluding preference shares) 0.9 (4.6) 21.4 27.6 6.1 1.3 (2.4) 3.0 (6.2) 30.5
Shareholders’ equity / Total assets 32.3 34.6 25.9 22.3 24.5 22.0 27.7 28.3 27.6 27.8
Guarantee capital / Total assets 33.2 35.8 28.8 29.1 35.5 42.8 38.9 44.0 44.6 35.9
Other ratios
Current ratio 1.0 1.3 1.6 1.4 1.2 1.4 1.4 1.5 1.3 1.1
Quick ratio 0.6 0.8 0.9 0.8 0.7 0.8 0.8 0.8 0.7 0.6
Revenue of total assets 1.3 1.3 1.7 1.6 1.5 1.1 1.0 1.1 1.1 1.2
1 Shareholders’ equity, provision for deferred taxation and long-term part of convertible subordinated bond and other subordinated loans.2 Changed for comparison purposes. 3 Result before income tax / Average total assets (prior years are changed accordingly). 4 IFRS.
Ten years of Draka Holding N.V.

This page is intentionally left blank.

This page is intentionally left blank.

Colophon
PublicationDraka Holding N.V.
Design and productionCommond - Content for brandswww.commond.nl
PhotographyJohan van der HornBP OilAugusta WestlandAquamarine PowerDraka HoldingGetty ImagesCorbisiStockphoto

Draka Holding N.V.
De Boelelaan 7
Building ‘Officia I’
1083 HJ Amsterdam
P.O. Box 75979
1070 AZ Amsterdam
The Netherlands
t +31 (0)20 568 98 65
f +31 (0)20 568 98 99
i www.draka.com