Embed Size (px)
Citation preview

Annual Report 2006
P E R F O R M A N C E A N D G R O W T H

Contents
Product and Geographic Spread inside cover
Financial Trends 2002 – 2006 1
2006 Highlights 1
A Tried and Tested Strategy 2
Measured Performance and Exceptional Growth 4
Chairman’s Statement 6
Chief Executive’s Review 9
Operations Reviews 13
Finance Review 32
Corporate Social Responsibility 37
Board of Directors 42
Corporate Governance 44
Directors’ Report 48
Report on Directors’ Remuneration 50
Statement of Directors’ Responsibilities 58
Independent Auditors’ Report 59
Financial Statements 60
Accounting Policies 63
Notes on Financial Statements 71
Additional Information for United States Investors 116
Group Financial Summary 122
Shareholder Information 124
Management 126
Principal Subsidiary Undertakings 128
Principal Joint Venture and Associated Undertakings 132
Index 133
Notice of Meeting 135
CRH’s strategic vision is clear and consistent –
be a responsible international leader in building materials delivering superior performance and growth
Preston quarry in Fort Smith, Arkansas, operated by the Arkhola Division of APAC, is one of the largest stone quarries in northwest Arkansas supplying 1.4 million tonnes of stone to the local market. Also located on the site is a 500 tonne-per-hour asphalt plant, a recent winner of the National Asphalt and Paving As-sociation (NAPA) ecological award for the best environmental and aesthetic performance. The Arkhola division operates five quarries, two sand dredging operations, four asphalt plants and eleven readymixed concrete plants in western Arkansas and eastern Oklahoma.

CRH plc, headquartered in Ireland, has operations in 27 countries employing approximately 80,000 people at over 3,300 locations. Our operations focus on three closely-related core businesses:
BRITISH COLUMBIA
ALBERTA
WASHINGTON
OREGON
NEVADA
CALIFORNIA
IDAHO
UTAH
ARIZONA
MONTANA
COLORADO
NEW MEXICO
SOUTH DAKOTA
NEBRASKA
KANSAS
OKLAHOMA
TEXAS
MINNESOTA
IOWA
MISSOURI
ARKANSAS
LOUISIANA
WISCONSIN
ILLINOIS
MISSISSIPPI
MICHIGAN
INDIANA
KENTUCKY
TENNESSEE
ALABAMA
GEORGIA
NJ
ONTARIO
QUEBEC
OHIO
MAINE
NEW HAMPSHIRE
VERMONT
MANEW YORK RICT
PENNSYLVANIA
MDDE
WEST VIRGINIA
NORTHCAROLINA
VIRGINIA
WYOMING
FLORIDA
SOUTHCAROLINA
ARGENTINA
CHILE
Primary Materials
Annualised production volumes
Cement 13.9m tonnes
Aggregates 262.0m tonnes
Asphalt & surfacing 65.4m tonnes
Readymixed concrete 21.8m cubic metres
Agricultural & chemical lime 1.7m tonnes
Value-added Building Products
Annualised production volumes
Precast concrete products 9.5m tonnes
Other concrete products 34.3m tonnes
(Block, masonry, patio products,
pavers, prepackaged concrete
mixes, rooftiles, sand-lime
elements, bricks)
Clay bricks, pavers, tiles 4.5m tonnes
Insulation products 6.3m cubic metres
Security gates & fencing 19.3m lineal metres
Glass fabrication, rooflights 14.5m sq. metres
HAWAIIALASKA
NORTH DAKOTA

CRH shares are listed on the Irish and London Stock Exchanges and on the New York Stock Exchange (NYSE) in the form of American Deposi-tary Receipts (ADRs).
The Group has consistently delivered superior long-term growth in total shareholder return, averaging 20% per annum since the Group was formed in 1970.
NETHERLANDS
BELGIUM
SWITZERLAND
DENMARK
GERMANY
AUSTRIA
SWEDEN
POLAND
SLOVAKIA
FINLAND
ESTONIARUSSIA
LATVIA
UKRAINE
TUNISIA
ITALY
UK
IRELAND
FRANCE
SPAIN
PORTUGAL
CHINA
HEILONGJIANG
s
s
s
s
s
s
Building Materials Distribution
Outlets
DIY 206 stores
Builders merchants 511 stores

1CRH
Financial Trends 2002 – 2006 2006 Highlights
“Sales and profits moved forward to new record levels in 2006, with the Group’s consistent strategy and relentless focus on operations delivering the 14th consecutive year of increased profits. It was also a very successful year on the development front with acquisition spend across the world exceeding §2 billion for the first time.”
Liam O’Mahony
§ million
Sales Revenue 18,737 +30%
EBITDA 2,456 +25%
Operating Profit 1,767 +27%
Profit Before Tax 1,602 +25%
Basic Earnings per Share 224.3c +20%
Cash Earnings per Share 352.1c +20%
Dividend per Share 52.0c +33%
Dividend Cover (times) 4.3
EBITDA Interest Cover (times) 9.7
EBIT Interest Cover (times) 7.0
* 2004, 2005 and 2006 under IFRS 2002 – 2004 under Irish GAAP with operating profit and
earnings per share stated before goodwill amortisation

2 CRH
A Tried and Tested Strategy
CRH was founded in 1970 following the merger of two major Irish companies, Irish Cement and Roadstone. This newly-formed business, operating in a cyclical industry, was highly exposed to a single core business in a single economy.
Shortly thereafter, the Board set a clear strategy for the development of the Group: to seek new geographic platforms in its core businesses and to take advantage of complementary product opportunities in order to achieve strategic balance and to establish multiple platforms from which to deliver performance and growth.
While this strategy has evolved over the years, the broad thrust is still applicable today as the Group continues to expand from its current base in three core businesses across 27 countries.
In delivering this strategy, CRH sticks to core businesses in building materials; develops regional market leadership positions; reinvests in existing assets and people; acquires well-run, value-creating businesses and seeks exposure to new development opportunities, in order to maintain and develop a balanced portfolio, while creating horizons for future growth.
North America
N O 3
A G G R E G A T E S
N O 1
A S P H A L T
T O P 1 0
R E A D Y M I X E D
C O N C R E T E
N O 1
C O N C R E T E
P R O D U C T S
N O 1
A R C H I T E C T U R A L
G L A S S
S U P P L I E R
T O P 3
R O O F I N G / S I D I N G
D I S T R I B U T O R
Regional and product balance
CRH’s unique geographic and product balance, across its three core businesses, smooths the effects of varying economic conditions and provides greater opportunities for growth.
Delivering a balanced business
Through the implementation of this strategy, CRH has achieved international leadership positions by building a business with a balanced geographical and product base.
Geographic
Americas 52%
48% Europe
Segmental
Materials41%
Products36%
23% Distribution
Leadership

3CRH
Strong corporate culture and identity
Local autonomy
Experienced operational management are given a high degree of individual autonomy and responsibility to accommodate national and cultural needs and to leverage local market knowledge.
Dual citizenship
Strong management commitment to both the local company and to the CRH Group, supported by best practice teams that share experience and know-how across products and regions.
Mix of skills
CRH’s market-driven approach attracts, retains and motivates exceptional management including internally developed operational managers, highly qualified business professionals and owner-entrepreneurs. This provides a healthy mix and depth of skills with many managers having managed through previous economic cycles. Our succession planning focuses on sharing this wealth of experience with the next generation of CRH management.
Lean Group centre
Guidance, support, functional expertise and control, as appropriate, is provided in the areas of performance measurement, financial reporting, cash management, strategic planning, business development, human resources, environment and health & safety.
Europe
T O P 1 0
C E M E N T
L E A D I N G
N A T I O N A L
P O S I T I O N S
A G G R E G A T E S &
R E A D Y M I X E D
C O N C R E T E
N O 1
C O N C R E T E
P R O D U C T S
N O 1
C O N S T R U C T I O N
A C C E S S O R I E S
T O P 3
B U I L D I N G
M A T E R I A L S
D I S T R I B U T O R
Sectoral balance
CRH seeks to reduce the effects of varying demand patterns across building and construction end-use sectors by maintaining a balanced portfolio of products serving a broad customer base.
Product end-use
Residential40%
Non-residential30%
30% Infrastructure
New 55%
45% RMI
positions

4 CRH
Creating shareholder valueMeasurement
Key performance metrics are consistently applied across the Group. Financial control is exercised through rigorous annual budgeting and timely monthly reporting processes. Full-year performance is regularly re-forecast under prudent accounting policies, vetted by Divisional management and critically reviewed by Group Finance.
Operational excellence
The Group’s size and structure is leveraged to drive margin improvement and earnings growth. With a strong culture of achievement, the businesses drive excellence in performance through continuous investment, efficiency-delivering projects and sustained best practice initiatives across their operations.
A Focus on Measured Performance
CRH has delivered a 19.7% compound annual growth in Total Shareholder Return from 1970 to 2006.
A shareholder who invested the equivalent of §100 in 1970 and re-invested gross dividends would hold shares valued at §65,429 based on a share price of §31.54 at 31st December 2006.

5CRH
A proven track record Acquisitions
Value-creating acquisition opportunities are sourced, evaluated, negotiated and integrated by regional and product group managers supported by teams comprising development professionals and experienced operational management. Traditionally, CRH has targeted mid-sized companies with deal flow augmented from time to time by larger transactions.
Organic
Organic growth is achieved by investing to improve capacity, quality and efficiency, developing new and innovative products and services, expanding the customer base through new channels and leveraging our brands locally and regionally.
Exceptional Growth
2006 is the twenty-third consecutive year of dividend increase.
CRH operates a progressive dividend policy which has consistently moved dividends ahead achieving a compound annual growth rate of 14% over the past 23 years and a 33% increase in 2006.

6 CRH
Chairman’s Statement
Strong Growth Continues
Once again, the Group delivered an outstanding set of results for 2006. Profit before tax of §1.6 billion and earnings per share of 224.3 cent, represented increases of 25% and 20% respectively. The trading environment posed particular challenges, not least of which were the escalation of energy costs and the decline in United States residential construction. Nevertheless, CRH produced record full year organic growth, and a significant incremental contribution from acquisition activity. Management and staff throughout the Group are to be commended for their unrelenting focus on input cost recovery and for their commitment which translated into these excellent financial outcomes.
Details of the performances of the Group’s separate Divisions are given in the Chief Executive’s review and the Operations and Finance Reviews which follow.
Profitability and Earnings
Profit before tax increased by 25% to §1.6 billion. Earnings per share increased by 20% to 224.3 cent. Cash earnings per share were 352.1 cent, compared with 292.5 cent in the preceding year. The Board regards this as a very satisfactory set of results. As can be seen from the Finance Review on page 34, earnings per share over the past five years have grown by 12% on an annualised basis. The consistent growth achieved by the Group is very gratifying – particularly in the context of the challenging conditions (currency impacts, energy costs, varying rates of economic growth) which were encountered during that period.
Dividend
CRH has a strong dividend history both over the long term, delivering twenty-two
consecutive years of dividend growth at a compound annual rate of 12.9% up to and including 2005, and over the short term with dividend increases of 17.4% for 2004 and 18.2% for 2005. With dividend cover of 4.8 times for the 2005 financial year and with further strong growth in earnings and cash flow in 2006 the Board believes that it is now appropriate to move in a phased manner towards a higher payout ratio and reduced level of dividend cover over the three financial years 2006 to 2008. Accordingly, a final dividend of 38.5 cent per share (2005 : 27.75 cent per share) is now being recommended by the Board. This, if approved by the Annual General Meeting on 9th May next, will result in a total dividend for 2006 of 52.0 cent, an increase of 33% over 2005, and 2006 dividend cover of 4.3 times. This significant 2006 increase reflects the first step in a phased reduction in dividend cover which, subject as always to changes in market conditions, aims to achieve dividend cover of the order of 3.5 times for the 2008 financial year.
Development Activity
Development momentum in 2006 was very strong and net acquisition spend for the year amounted to a record §2.1 billion. This compares with amounts of approximately §1 billion and §1.3 billion in 2004 and 2005 respectively. The extent and quality of these investments will be an important element in delivering further growth for the Group over the years ahead.
A total of 69 acquisitions was concluded, including Ashland Paving And Construction (APAC), the acquisition of which for US$1.3 billion (§1.0 billion) was announced on 21st August 2006. This was the largest single transaction yet completed by the Group, and involved the subsequent disposal, in six separate transactions, of certain
APAC construction and asphalt businesses for approximately US$0.2 billion.
Apart from APAC, the most significant transactions in 2006 were:
the acquisition, announced on 26th April 2006, of MMI Products, Inc., a leading US manufacturer and distributor of building products used by the residential, non-residential and infrastructure construction sectors, for a cash consideration, including debt acquired, of approximately US$350 million.
the acquisition of Halfen-Deha Group (Halfen), a European producer of metal construction accessories for a cash consideration, including debt acquired, of approximately §170 million, as announced on 2nd May 2006.
Other noteworthy development initiatives, all in the cement sector, were:
the acquisition of a 50% equity stake in Florida-based American Cement Company, for a cash consideration of US$50 million, which was announced on 1st August 2006.
the announcement, on 10th October 2006, of an agreement to acquire the assets of a cement plant in Heilongjiang Province, Northeast China which was completed in February 2007.
the decision to commence a §200 million project to modernise the Platin cement factory near Drogheda, Ireland, as announced on 21st December 2006.
In addition to being well spread in terms of geographical location and product grouping, many of these investments provide new platforms for growth through
!
!
!
!
!
“Once again our management and staff’s commitment and unrelenting focus on input cost recovery translated into another record year for CRH.”
Pat Molloy

7CRH
accessing new markets and new product categories. The pace of development activity in 2006 is also further evidence of the Group’s continuing ability to identify and execute significant volumes of value-adding transactions in our target markets.
Financing Operations
The Group’s strong internal cash flow gives it the financial capacity to support its acquisition ambitions. In the year 2006, operating cash flow amounted to §715 million.
In September, we announced the completion of a US$1.75 billion Global Bond Issue. This consisted of US$1.25 billion ten-year notes, and US$500 million five-year notes. Both transactions were priced very competitively, and they enabled the Group to extend its debt maturity profile and to expand its investor base.
Corporate Governance
A detailed statement setting out CRH’s key governance principles and practices is provided on pages 44 to 47. The Board and Management of CRH are committed to achieving the highest standards of Corporate Governance and ethical business conduct, and are satisfied that appropriate systems of internal control are in place throughout the Group.
Board and Senior Management
John Wittstock, who had been an executive Director since January 2002 and Managing Director Europe Products & Distribution, decided for personal reasons to return to the United States, and accordingly he resigned from the Board on 26th April 2006. I thank John for his contribution to the Board, and am very pleased that he will remain with CRH to head up MMI Products, the acquisition of which was announced in April 2006.
Following the Annual General Meeting on 3rd May 2006, Tony O’Brien, our Senior Independent Director, retired, and my state-ment covering 2005 paid tribute to him. Once again, I thank Tony for his exceptional contribution to the governance of CRH over a period of service spanning 14 years.
Declan Doyle, who is Managing Director, CRH Europe Materials, will retire from his executive role and from the Board on 30th June 2007. Declan has played a major part in the development of this §3 billion business and the Board greatly appreciates his contributions to CRH as an executive and as a member of the Board since 2004.
In the course of 2006 we recruited two new non-executive Directors – Dan O’Connor, who was co-opted to the Board on 28th June, and Bill Egan, who joined us with effect from 1st January 2007. Dan O’Connor had been President and Chief Executive Officer of GE Consumer Finance - Europe and a Senior Vice-President of GE, and is a Fellow of the Institute of Chartered Accountants in Ireland. Bill Egan, who is a United States citizen, is a founder and general partner of Alta Communications, a venture capital company headquartered in Boston. Each of these individuals brings valuable experience to the Board and their appointments continue the process of Board renewal at a pace which is consistent with the maintenance of the Board’s teamwork and core values.
As provided in the Company’s Articles of Association, Dan O’Connor and Bill Egan are proposed for re-election at the Annual General Meeting on 9th May. Also, in accordance with the Articles of Association and best practice in relation to the re-election of Directors, Terry Neill, Liam O’Mahony and David Kennedy will retire from the
Board and seek re-election at the Annual General Meeting. I have conducted my annual formal evaluation of the performances of all Directors and can confirm that each of the Directors who is proposed for re-election continues to perform effectively and to demonstrate commitment to the role. Notwithstanding David Kennedy’s long service as a non-executive Director, the Board considers him to be independent. In forming this view, the Board has reviewed rigorously his performance on the Board, on the Committees on which he serves and as Senior Independent Director since May 2006. Based on this review, and on its direct experience of his active, questioning and challenging disposition, the Board is satisfied that David’s ability to exercise independent judgment and to act in the best interests of the Group is in no way compromised by his length of service. I recommend strongly that Dan O’Connor, Bill Egan, Terry Neill, Liam O’Mahony and David Kennedy be re-elected to the Board.
At the conclusion of the Annual General Meeting on 9th May 2007, I will step down as Chairman and from the Board. I would like to express my personal appreciation to my colleagues on the Board, to our shareholders, to management and to the staff of CRH for the support and goodwill they have extended to me since I joined the Board in 1997, and particularly since I became Chairman in 2000. I consider myself as very fortunate in having had the company of such outstanding people and the opportunity to be part of such an exceptional company.
I am particularly happy that the Board has chosen Kieran McGowan to succeed me as Chairman. His capabilities, experience and commitment to the core values of CRH will ensure that the Board continues to lead and encourage the Company
to achieve ongoing success in the years ahead.
Management and Staff
The achievements and success of CRH are founded on the exceptional commitment and capability of the people who lead, manage and work in its businesses throughout the world. CRH’s ability to attract, develop, motivate and retain talented people is its most critical competence. There is a unique culture of performance and achievement throughout the Group, and this will ensure that, whatever the economic circumstances, CRH has the motivation and the capacity to deliver superior operational performance and growth. On behalf of the Board, I thank Liam O’Mahony and all CRH employees for their commitment and contributions to the success of the Group, and I congratulate them on another outstanding set of achievements in 2006.
Conclusion
Management’s views on the outlook for 2007 are set out more comprehensively in the Chief Executive’s Review and the various Operations Reviews. As always, there are challenges and uncertainties: the decline in new residential construction in the United States will affect overall construction demand, and the weakness of the US$ is likely to have an impact. Nevertheless, the on-going focus on price and cost effectiveness across our operations, the benefits of our record 2006 acquisition spend, and our sustained focus on development will, we expect, enable the Group to deliver further progress in the current year.
8 CRH
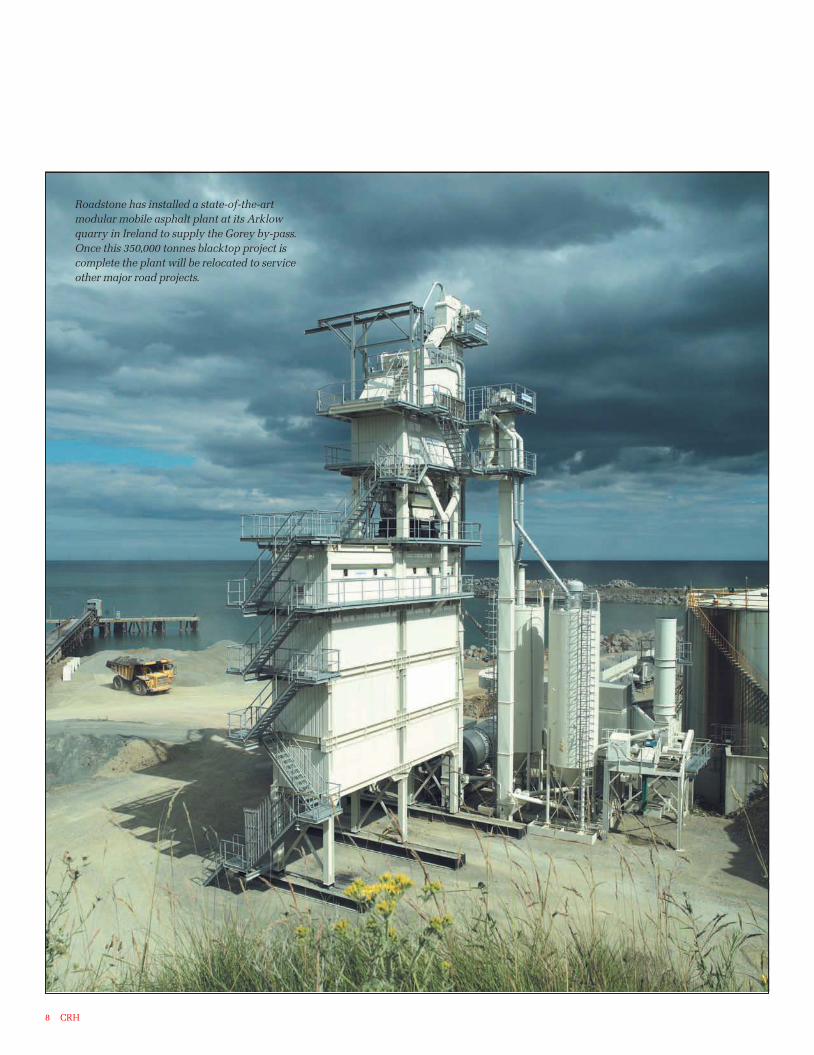
Roadstone has installed a state-of-the-art
modular mobile asphalt plant at its Arklow
quarry in Ireland to supply the Gorey by-pass.
Once this 350,000 tonnes blacktop project is
complete the plant will be relocated to service
other major road projects.

9CRH
Overview
2006 was a further year of considerable success, with CRH again achieving strong performance and growth. Sales and profits moved forward to new record levels, with the Group’s consistent strategy and relentless focus on operations delivering the 14th consecutive year of increased profits. It was also a very successful year on the development front with acquisition spend across the world exceeding §2 billion for the first time.
The economic backdrop to the year was on balance reasonable, although as always it varied somewhat by region and sector. The much anticipated slowdown in United States housing started to bite in the second half of the year, although this was largely offset by continued strength in non-residential building and publicly-funded infrastructure work. Core Eurozone economic growth continued to pick up, although at a more moderate pace than might have been expected, while growth remained strong in most of the countries on the periphery of the continent. Energy and other input costs increased further, but our team built on the successes of recent years in dealing with this continued challenge. With little movement in average exchange rates over the year, there was no material currency translation impact on the overall results. Against this background, the Group advanced on many fronts in 2006:
Sales up 30% to §18.7 billion
Profit before tax up 25% to §1.6 billion, substantially the result of organic growth together with incremental contributions from 2005/2006 acquisitions
Earnings per share up 20% to 224.3c
!
!
!
Dividend per share up 33% to 52.0c. This is the 23rd consecutive year of dividend increase, and continues the strong annual increases of recent years.
Return on average capital employed (Operating Profit/Net Assets) up almost a full percentage point to 15.4%.
Record net acquisition activity of §2.1 billion, bringing spend over the past 18 months to §3.3 billion. A particular highlight was the acquisition of Ashland Paving And Construction (APAC), at §1.0 billion (§0.85 billion after selective disposal of non-core activities) the largest single transaction completed by the Group to date. This strong development spend will be an important factor in further driving future growth across our Divisions.
Announcement of major cement expansion projects in Ireland, the United States and China.
Despite this record development activity, CRH’s strong cash flow led to a comfortable year-end EBITDA/Interest cover of 9.7 times, allowing substantial capacity for continued developmental growth.
Thanks to everyone on the 80,000 strong worldwide CRH team who played their part in delivering this very satisfactory outcome.
2006 Operations
It was a strong year for our businesses across the board, with significant profit advances delivered by each of the Group’s major Divisions – Europe Materials, Europe Products & Distribution, Americas Materials and Americas Products & Distribution. The individual Divisional Operating Reviews
!
!
!
!
!
elsewhere in this Report cover this in some detail.
Europe Materials businesses are largely located in countries on the periphery of Europe – Ireland, Finland and the Baltics, Poland and Ukraine, Switzerland and the Iberian Peninsula. With the exception of Portugal, economies and building materials demand were relatively robust across the region. Returns in our businesses in Finland and Poland continued to improve, while activity in Ireland and Spain remained at high levels. Ukraine and Switzerland each showed profit gains, while Portugal disappointed. Overall the Division produced another strong year with a very satisfactory growth in profitability.
Although Europe Products & Distribution has had considerable geographic expansion in recent years, the core Eurozone countries still represent a significant proportion of its business. Here construction activity continued its gradual pick up, gathering momentum throughout the year. Dutch housing experienced ongoing recovery although DIY was somewhat flat. Belgium, France and the Alpine and Nordic countries all showed growth; UK housing was difficult; while Germany finally saw signs of a nascent recovery. The Distribution, Concrete and Building Products groups all delivered a significantly higher outcome with Clay being similar to 2005. The overall substantial increase in profitability for the Division came from a combination of good organic growth and acquisition contributions.
Americas Materials successfully met the challenge of recovering further energy and input cost increases, and with a strong pricing environment, rigorous cost control and good incremental
Chief Executive’s Review “2006 was another year of delivery by CRH both in2006 was another year of delivery by CRH both in development, with a record acquisition spend, and operationally, with record organic growth and strong improvements in all key financial performance measures.””
Liam O’Mahony

10 CRH
acquisition contributions, profits were well up. In the key highway sector funding was strong, but volumes were slightly reduced as a result of the impact of the higher product prices necessary to recover the increased energy and other input costs. Private sector activity was good, with continuing growth in non-residential construction more than offsetting weaker new housing. Geographically the West remained strongest, while good improvements were recorded in the Mid-West and New York/New Jersey regions. In New England general market strength offset weaker highway activity in Connecticut and Maine. APAC performed to expectations in its first four months with the Group.
Americas Products & Distribution sells mainly to the residential and non-residential sectors. A very strong first half, coupled with a second half where non-residential growth contrasted with a decline in new housing, together with the benefits of 2005/2006 acquisitions, led to a substantial overall profit increase. Precast, Glass and Distribution all performed well ahead of 2005, while the Architectural Products Group (APG) had a good result despite being the worst affected by the housing slowdown. The new platform, MMI, acquired in April, performed satisfactorily. Our South American businesses, located in Argentina and Chile, turned in a very strong performance.
Development
CRH achieved record acquisition success in 2006, with a net §2.1 billion spent on 69 acquisitions throughout the year.
The highlight was CRH’s largest acquisition to date, the §1 billion ($1.3 billion) purchase in August of APAC, an integrated aggregates and asphalt business
in the Mid-West and South regions of the United States. Following the disposal of selected non-core activities, this netted down to §0.85 billion. APAC uniquely complements our existing Materials businesses in the North, Mid-West and West, offers significant opportunities for synergistic performance improvements, and provides a platform for further growth. The acquisition consolidates CRH’s position as the number one asphalt manufacturer and one of the leading aggregates players within the United States.
Building on our existing European success in construction accessories and metal products, during the year we acquired Europe’s leading construction accessories company Halfen, and MMI, a major United States industry operator in construction accessories plus wire reinforcement and fencing, for a combined consideration of §450 million. These acquisitions greatly enhance our world-wide footprint in this product category.
The primary focus of the remaining acquisitions was on small to mid-sized transactions which complement and add value to our existing operations, or expand them into adjacent territories. These were effected across all Divisions and major geographies.
On the development front, there were some important initiatives on the cement side. We invested $50 million (§39 million) to take a 50% stake in the greenfield American Cement Company, our first venture into cement in the United States. Later in the year we announced agreements in relation to two potential ventures which would take us into China for the first time; we have completed one of these, Harbin Sanling Cement Company, thus far in 2007. In addition two
significant investments, a new high efficiency precalciner kiln at our Lappeenranta plant (Finland) and a new coal mill at Podilsky (Ukraine) were completed and will be fully operational this year. Finally we committed to a major replacement/expansion project at our existing Platin (Ireland) cement plant at a total cost (not included above) of §200 million. This will be built to BAT (best available technology) standards, will greatly reduce specific CO2
emissions, and enable us to effectively serve the Irish market into the future.
These developments in total underline CRH’s commitment to ongoing prudent expansion,
Chief Executive’s Review continued
and will contribute greatly to the future progress and profitability of the Group.
People
The senior CRH organisation has continued to evolve, with a number of planned changes in personnel and structure being put into place.
Following the mid-year retirement of Joe McCullough, Chief Executive Americas Products & Distribution, Tom Hill was appointed Chief Executive Americas, with responsibility for all of CRH’s American activities. Tom was succeeded as Chief Executive Americas Materials by Mark Towe.

11CRH
Máirtín Clarke was appointed Managing Director Europe Products and Distribution, succeeding John Wittstock who for personal reasons relocated back to the United States to take charge of our new MMI platform. Liam Hughes, who temporarily took over as Acting Managing Director in John’s absence, moved to Group head quarters as Business Support Director.
In Europe Materials, Albert Manifold was appointed Managing Director Designate and Henry Morris Chief Operating Officer, succeeding Declan Doyle and Tony O’Loghlen respectively who will retire in 2007.
We thank all our retiring colleagues for their outstanding contributions to the performance and growth of CRH over their
long careers within the Group. Their successors and the entire CRH team have very strong track records over many years and are well equipped to build on their legacies as they take on these new roles.
As CRH continues to grow, we actively focus on attracting, motivating, challenging, developing and retaining talented leaders at all levels of the organisation. Our formal in-house personal development programmes broaden perspectives and deepen skills; taking these together with challenging executive roles in a growing Group, we are working to meet our ongoing leadership requirements in a planned way.
Corporate Social Responsibility
A strong positive commitment to Corporate Social Responsibility (CSR) lies at the heart of CRH’s philosophy and management approach. We strive to operate to best international practice in the areas of corporate governance, environment, health and safety and social policy. We continue to be recognised as a sector leader in this regard by the leading Socially Responsible Investment Agencies including Vigeo, Innovest, FTSE4 Good and the Dow Jones World and STOXX sustainability indexes.
As in previous years, we set out our approach under the various CSR headings elsewhere in this Report with further detail provided on our website, www.crh.com. The keys to success, in common with most aspects of our business, are clear policies, management commitment and responsibility, together with effective implementation and review. We regard the active embedding of CSR throughout our organisation as fundamental to achieving our
vision of being “a responsible international leader in building materials delivering superior performance and growth”.
CRH is among world cement industry leaders in tackling the challenges of climate change. As core members of the Cement Sustainability Initiative, a voluntary initiative by leading cement producers in conjunction with the World Business Council for Sustainable Development, we are focused on increasing sustainability across our cement operations. We have committed to a 15% reduction in specific CO2
emissions from a 1990 base by 2015, and this is supported by significant ongoing investment such as the Lappeenranta and Platin cement plant upgrades.
Outlook 2007
2006 was another year of delivery by CRH both in development, with a record acquisition spend, and operationally, with record organic growth and strong improvements in all key financial performance measures. Cash generation remains robust and with comfortable interest cover the Group can accommodate a higher level of dividend payout while continuing to take advantage of a strong development pipeline. With an ongoing focus on price and cost effectiveness across our operations, further benefits from the record 2006 acquisition spend and a sustained emphasis on development, we expect to achieve further progress in the year ahead.
Nationally recognised for its innovative design, Rhythm City Skybridge
is quickly becoming a landmark in Davenport, Iowa. MontageJ Visual
Effects Glass, an Oldcastle Glass7 exclusive with its bold colours and
unique patterns, is a defining feature of the dramatic glass bridge.
Spanning nearly 600 feet and sitting 50 feet in the air, the bridge also
features tempered, silk-screened and laminated glass, all custom-
manufactured by Oldcastle Glass7.

12 CRH
2006 Results – Europe
Chief Executive
Europe Materials
Materials
Europe Products & Distribution
Products Distribution
Declan DoyleManaging Director
Europe Materials
Máirtín ClarkeManaging Director
Europe Products & Distribution
Products ANALYSIS OF CHANGE Non- % of Exchange 2005 2006s Recurring 2006 Change Group§ million 2005 Translation Acquisitions Acquisitions Items* Organic
Sales 2,533 +4 +245 +276 - +128 3,186 +653 17
Operating Profit 176 - +25 +20 -31 +31 221 +45 12
Average Net Assets 1,790 2,081
Operating Profit Margin 6.9% 6.9%
Excluding non-recurring 7.9%
Distribution ANALYSIS OF CHANGE Non- % of Exchange 2005 2006 Recurring Organic 2006 Change Group§ million 2005 Translation Acquisitions Acquisitions Items*
Sales 2,193 -6 +418 +65 - +116 2,786 +593 15
Operating Profit 123 - +12 +4 +19 +14 172 +49 10
Average Net Assets 916 1,014
Operating Profit Margin 5.6% 6.2%
Excluding non-recurring 5.5%
Materials ANALYSIS OF CHANGE Exchange 2005 2006 % of§ million 2005 Translation Acquisitions Acquisitions Organic 2006 Change Group
Sales 2,646 +5 +21 +33 +262 2,967 +321 16
Operating Profit 377 +1 +2 +5 +36 421 +44 24
Average Net Assets 2,000 2,125
Operating Profit Margin 14.2% 14.2%
*Details of non-recurring items are disclosed in the Finance Review on page 33
*Details of non-recurring items are disclosed in the Finance Review on page 33

13CRH
2006 Overview
Europe Materials benefited from generally better economic conditions in most of its major countries of operation and delivered a very satisfactory profit advance for 2006. Ireland enjoyed further construction growth, with ongoing strong residential demand and good levels of activity in both non-residential and infrastructure segments. Finland performed well with volume advances for all major products, and the developing Baltic regions including St. Petersburg also delivered a better outcome. Poland continued to build on the growth evident in the second half of 2005 and all activities experienced strong demand right through to year-end. In Switzerland, our downstream operations benefited from generally better markets which offset the anticipated reduction in cement sales following the completion of the Lötschberg tunnel project. Spanish construction activity remained at a high level although pressure on margins resulted in a similar profit outcome. Secil’s cement sales in Portugal fell in line with a reduction in construction activity as the government cut back on spending to reduce the public sector expenditure deficit. In response, the company increased exports and maintained overall sales in line with 2005.
Against this backdrop, with a tight focus on cost control and pricing policy, the Division delivered yet another record year with sales and operating profit ahead by 12%.
The Division continued to implement its strategy of developing and consolidating leadership positions with a number of strategically important bolt-on acquisitions; by investing to increase fuel flexibility and efficiency in its energy-intensive businesses; and by continuing to seek growth platforms in developing markets.
Ireland
We had another good year in Ireland in 2006 with further growth in overall construction output leading to an increase of approximately 3% in our total cement volumes. In the Republic of Ireland, the strong residential market was again the main driver with home completions of 88,000 ahead of expectations. The commercial and industrial sectors remained strong while the National Development Plan continued to deliver good activity in the roads and infrastructure
sector. In Northern Ireland, while the roads programme suffered a serious decline, the housing and commercial sectors were strong and as a result our construction business had a very successful year.
In cement, both the Platin and Limerick plants operated at full capacity and we continued to import substantial quantities of cement and clinker to satisfy demand. Investment continued in efficiency and environmental improvement programmes at both plants with excellent results. At the end of December, we announced plans to invest §200 million in a new 1.3 million tonne per annum clinker kiln at Platin to replace the older of the two existing kilns and to ensure that adequate supplies of domestically produced cement using best available technology are available in Ireland for the future. This new kiln is planned to come on-line towards the end of 2008.
The concrete products and aggregates businesses performed well in very competitive markets and further investments were made in aggregate reserves and new high-efficiency plant and equipment. Significant input cost increases were recovered in selling prices and profit margins were maintained.
Overall, 2006 saw another strong performance from our Irish operations with profits ahead of 2005.
Finland/Baltics
The Finnish economy grew by an estimated 4.5% in 2006 and construction output kept pace. Housing grew by about 5% with 34,500 units completed. There was a strong increase in commercial and industrial construction including the construction of a new nuclear power plant. Ongoing construction of the Helsinki to Turku motorway and the new Helsinki container port at
Operations ReviewEurope Materials
“With a focus on tight cost control and pricing policy the Division delivered record sales and operating profit with organic operating profit growth of approximately 10% for the third consecutive year.”
Declan Doyle
Finnsementti recently
commissioned a 1,600 tonne per
day kiln at the Lappeenranta
cement plant in eastern Finland.
This new line will add to capacity
while reducing specific CO2
emissions and enhancing overall
energy efficiency.

14 CRH
The Europe Materials Division is a major producer of primary materials and value-added manufactured products operating in 15 countries and is also actively involved in the Group’s development efforts in Asia. In Ireland, Finland, Poland and Switzerland, CRH is a leading vertically integrated producer of cement, aggregates and readymixed concrete. In Spain, CRH has leading regional positions in aggregates, readymixed concrete and precast concrete products and has a 26.3% stake in a major cement producer. Through Secil, CRH is a leading cement, aggre-gates and readymixed concrete producer in Portugal and is a leading cement producer in Tunisia. In total, the Division employs approximately 12,000 people at over 470 locations.
Vuosarri, two major infrastructure projects with significant cement, readymixed concrete and concrete products requirements, continue to underpin demand.
The cement market grew by about 8% and our aggregates and readymixed concrete businesses also enjoyed good demand. The new clinker line at the Lappeenranta plant will come on-stream as planned in the first half of 2007, giving a much needed boost to production capacity.
Sales volumes in the Baltic region and St. Petersburg operations were well ahead of 2005 levels due to increased construction activity underpinned by strong local economies. Our newly-acquired concrete products company in Estonia performed well.
Overall, good volume increases and better pricing delivered improved profitability in the Finland/Baltic region in 2006.
Central Eastern Europe
The Polish economy expanded at a faster rate than in 2005 with GDP growth at 5.3%. Inflation remained low at 1.2% and unemployment declined to its lowest level for five years although still high at 15.5%. Construction output increased by approximately 10% with strong growth in all segments particularly infrastructure.
After a number of years of flat demand, a rapid recovery in activity following a weather-affected start and unusually mild weather at the end of the year led to sustained demand with cement volumes up 29% for the year. Increased capacity utilisation at our Oz. arów cement plant, in which we invested significantly in the late 1990s, proved especially rewarding. The aggregates and blacktop businesses were particularly busy benefiting from increased road construction with the availability of European Union funding. The concrete products businesses performed very well with increased volumes in readymixed concrete, pavers and aerated concrete. Against the background of a growing market, lime volumes were up 12% and we commenced investment in a new lime kiln and additional concrete, paver, and blacktop capacity to meet demand.
Overall, profits in Poland improved significantly on 2005 levels.
In Ukraine, GDP grew by 6% with increased demand for cement.
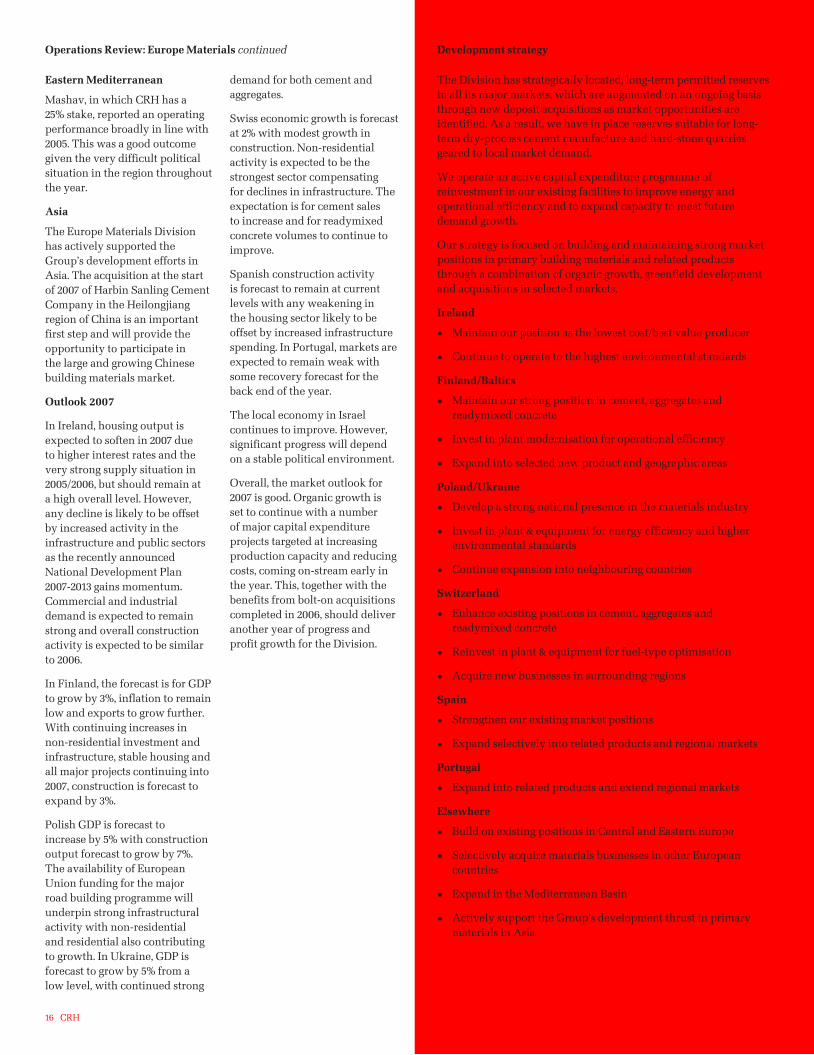
Operations Review: Europe Materials continued
Blacktop machine and crew at
work on the Gorey by-pass in
southeast Ireland. Roadstone
won the contract to supply and
lay all blacktop for this major 23
kilometre motorway.
Annualised production volumes*
13.9m tonnes**
81.3m tonnes
4.0m tonnes
13.4m cubic metres**
1.7m tonnes
8.3m tonnes
*CRH share
**Excludes CRH share of Uniland in Spain (26.3%) and Mashav in Israel (25%). CRH’s share of annualised production volumes for these businesses amounts to approximately 3.0m tonnes of cement and 0.8m cubic metres of readymixed concrete.
Activities
Cement China, Finland, Ireland, Poland, Portugal (49%), Switzerland, Tunisia (49%), Ukraine
Aggregates Estonia, Finland, Ireland, Latvia, Poland, Portugal (49%), Slovakia, Spain, Switzerland
Asphalt Finland, Ireland, Poland, Switzerland
Readymixed concrete Estonia, Finland, Ireland, Latvia, Poland, Portugal (49%), Russia, Spain, Switzerland, Tunisia (49%)
Agriculture & chemical lime Ireland, Poland, Switzerland
Concrete products Estonia, Finland, Ireland, Poland, Portugal (49%), Spain, Tunisia (49%)
Product end-use
Residential45%
Non-residential25%
30% Infrastructure
New 80%
20% RMI

15CRH
Better volumes, efficiency gains and improved pricing more than offset the impact of severe gas cost increases and resulted in a higher operating profit for the year. A new coal mill was installed at our cement plant to reduce dependence on high-priced gas and will be fully operational in 2007. Two newly-acquired aggregates operations performed well in their first year of ownership.
Switzerland
The Swiss economy grew again in 2006. Strong exports, a stable exchange rate and low inflation helped to increase economic activity and improve public finances. Construction grew by about 2% with all sectors bar infrastructure showing some increase over 2005.
As expected, the completion of the concrete-intensive stages of the major Lötschberg alpine tunnel led to a reduction of approximately 10% in our cement volumes. However, with better cement prices and a good advance in profitability in downstream
Bashkim Asllani at Jura Cement’s
Wildegg plant uses a pressurised
lance to remove build-up in the
kiln preheater. This modern
high performance kiln uses 60%
alternative fuel.
readymixed concrete, aggregates and asphalt operations, overall results were ahead of 2005.
Iberia
While our Spanish readymixed concrete and concrete products operations had healthy volume increases due to strong residential and infrastructure demand, higher input costs and increased competition put pressure on margins resulting in a profit outcome broadly similar to 2005. The Group’s 26.3% associate stake in Spanish cement producer Corporación Uniland is accounted for using the equity method in reporting 2006 results.
In Portugal, the economy is going through a difficult period with construction down approximately 7% in 2006, reflecting reduced activity in housing and a significant reduction in public capital expenditure. However, all three cement plants operated at full capacity taking advantage of strong export markets. Investment in efficiency and environmental improvement programmes, to offset higher input costs and improve performance, continued at all locations. Overall, while cement volumes in its domestic markets declined, Secil had a satisfactory year helped by strong demand in export markets and tight cost control.
Market leadership positions
No. 1 in Finland, Ireland and Ukraine No. 2 in Portugal and Switzerland No. 3 in Poland
No. 1 in Finland and Ireland
No. 1 in Ireland
No. 1 in Finland and Ireland No. 2 in Portugal and Switzerland
No. 1 in Ireland No. 2 in Poland
No. 1 block and rooftile producer in Ireland
16 CRH
The Division has strategically located, long-term permitted reserves in all its major markets, which are augmented on an ongoing basis through new deposit acquisitions as market opportunities are identified. As a result, we have in place reserves suitable for long-term dry-process cement manufacture and hard-stone quarries geared to local market demand.
We operate an active capital expenditure programme of reinvestment in our existing facilities to improve energy and operational efficiency and to expand capacity to meet future demand growth.
Our strategy is focused on building and maintaining strong market positions in primary building materials and related products through a combination of organic growth, greenfield development and acquisitions in selected markets.
Ireland
Maintain our position as the lowest cost/best value producer
Continue to operate to the highest environmental standards
Finland/Baltics
Maintain our strong position in cement, aggregates and readymixed concrete
Invest in plant modernisation for operational efficiency
Expand into selected new product and geographic areas
Poland/Ukraine
Develop a strong national presence in the materials industry
Invest in plant & equipment for energy efficiency and higher environmental standards
Continue expansion into neighbouring countries
Switzerland
Enhance existing positions in cement, aggregates and readymixed concrete
Reinvest in plant & equipment for fuel-type optimisation
Acquire new businesses in surrounding regions
Spain
Strengthen our existing market positions
Expand selectively into related products and regional markets
Portugal
Expand into related products and extend regional markets
Elsewhere
Build on existing positions in Central and Eastern Europe
Selectively acquire materials businesses in other European countries
Expand in the Mediterranean Basin
Actively support the Group’s development thrust in primary materials in Asia
!
!
!
!
!
!
!
!
!
!
!
!
!
!
!
!
!
!
Operations Review: Europe Materials continued
Eastern Mediterranean
Mashav, in which CRH has a 25% stake, reported an operating performance broadly in line with 2005. This was a good outcome given the very difficult political situation in the region throughout the year.
Asia
The Europe Materials Division has actively supported the Group’s development efforts in Asia. The acquisition at the start of 2007 of Harbin Sanling Cement Company in the Heilongjiang region of China is an important first step and will provide the opportunity to participate in the large and growing Chinese building materials market.
Outlook 2007
In Ireland, housing output is expected to soften in 2007 due to higher interest rates and the very strong supply situation in 2005/2006, but should remain at a high overall level. However, any decline is likely to be offset by increased activity in the infrastructure and public sectors as the recently announced National Development Plan 2007-2013 gains momentum. Commercial and industrial demand is expected to remain strong and overall construction activity is expected to be similar to 2006.
In Finland, the forecast is for GDP to grow by 3%, inflation to remain low and exports to grow further. With continuing increases in non-residential investment and infrastructure, stable housing and all major projects continuing into 2007, construction is forecast to expand by 3%.
Polish GDP is forecast to increase by 5% with construction output forecast to grow by 7%. The availability of European Union funding for the major road building programme will underpin strong infrastructural activity with non-residential and residential also contributing to growth. In Ukraine, GDP is forecast to grow by 5% from a low level, with continued strong
demand for both cement and aggregates.
Swiss economic growth is forecast at 2% with modest growth in construction. Non-residential activity is expected to be the strongest sector compensating for declines in infrastructure. The expectation is for cement sales to increase and for readymixed concrete volumes to continue to improve.
Spanish construction activity is forecast to remain at current levels with any weakening in the housing sector likely to be offset by increased infrastructure spending. In Portugal, markets are expected to remain weak with some recovery forecast for the back end of the year.
The local economy in Israel continues to improve. However, significant progress will depend on a stable political environment.
Overall, the market outlook for 2007 is good. Organic growth is set to continue with a number of major capital expenditure projects targeted at increasing production capacity and reducing costs, coming on-stream early in the year. This, together with the benefits from bolt-on acquisitions completed in 2006, should deliver another year of progress and profit growth for the Division.
Development strategy

17CRH
the comments below do not reflect these items.
Concrete Products
This group manufactures concrete products for two principal end-uses: pavers and tiles/blocks for architectural use, and floor/wall elements, beams, and vaults for structural use. In addition, it manufactures sand-lime bricks for the residential market and is involved in materials trading and readymixed concrete through its 45% Cementbouw joint venture.
2006 was an eventful year with eight acquisitions which served to consolidate further our positions in existing markets and establish new positions in Italy and Switzerland. The group reported a strong profit advance with good contributions from acquisitions and solid organic growth from the legacy businesses.
Architectural
Despite a slow start due to unfavourable weather conditions, this group performed well
ahead of last year, with strong advances in Belgium, Denmark and Slovakia and a full year’s contribution in France from Stradal which was acquired in August 2005. Continued price competition in the Netherlands due to market over-capacity, and difficult market conditions in the UK, had an adverse impact on performance, though this was more than compensated by other regions. In Germany, internal improvements and a strong focus on sales prices resulted in a better performance. During the year, the group acquired Record, a leading Italian landscaping products business and a new platform for growth, two businesses in France and one in Germany.
Structural
Our structural concrete operations delivered excellent results driven by tight operational control and strong markets in the Netherlands, Belgium, France, Denmark and Poland. Our sand-lime brick business improved
its performance through growth from new products and better operating efficiencies. During the year, the group acquired and merged two Swiss businesses bringing a strong market position in this new region, expanded its UK presence with the acquisition of Supreme, a leading fencing and lintel producer, and completed other acquisitions in Belgium.
Cementbouw joint venture
Our materials trading and readymixed concrete joint venture in the Netherlands continued to experience difficult trading conditions.
Clay Products
In Mainland Europe overall profitability improved despite further energy cost increases and planned stock reduction. Clay brick and block markets in Poland strengthened following a late spring and the long-standing weak German brick market showed some very early signs of recovery in the final quarter. Our Benelux
2006 Overview
Trading conditions improved in the core European markets with a welcome upturn in new housing demand in the Netherlands and early signs of recovery in the German construction market. France, Belgium, Switzerland and the Nordic region remained positive and the UK stabilised after a difficult first quarter which saw significant volatility in energy costs.
Against this backdrop, the Division continued to implement its strategy of building leadership positions in its targeted European markets, seeking new product and geographic growth platforms and investing for continuous improvement in its businesses. In 2006, we invested §383 million in 19 acquisitions comprising Halfen, a significant addition to our European Construction Accessories business, our first move in Italy through Record, a leading concrete paving company, and a number of other strategically important bolt-on acquisitions across Europe.
Despite a slow start following a prolonged winter and sharp increases in input costs, the Division delivered significant sales and profit growth due to stronger second half trading, price improvements, tight cost control and good contributions from acquisitions.
As disclosed on page 12 reported 2006 results were affected by some non-recurring items. These are outlined fully in the Finance Review on page 33, and therefore
Operations ReviewEurope Products & Distribution
“Combined with substantial development success in 2006, our Products businesses achieved a welcome return to good organic growth and a step-up in operating margin. Our Distribution operations had a record year, with excellent improvements in both sales and profits driven by significant acquisition contributions and good recovery in our markets.”
Máirtín Clarke
Dycore is the largest prefabricated
flooring company in the
Netherlands. Its highly efficient
and automated Oosterhout hollow
core plant is seeing a growth
in demand as a result of the
strengthening Dutch residential
and non-residential construction
sectors.

18 CRH
The Products & Distribution Division in Europe is organised as three groups of related manufacturing businesses and a distribution group. The manufacturing groups are involved in concrete, clay and other building products. Distribution encompasses professional builders merchants and “do-it-yourself ” (DIY) stores. The Division operates in 17 European countries with the Netherlands, Belgium, UK, Germany, France and Switzerland being our major markets. Europe Products & Distribution seeks leadership positions in the markets and sectors in which it operates and employs more than 26,000 people at over 1,200 locations.
activities advanced and were strengthened with the acquisition of Nuth, a specialist facing brick manufacturer.
In the UK, brick industry volumes declined further in 2006 due to the current trend towards smaller, less brick-intensive dwellings and a slowing of activity in the RMI sector. Energy prices increased significantly in the first half of the year with some moderation in the last quarter. The benefits from price increases, good cost control and energy saving projects were not enough to offset the impact of reduced volumes.
Overall, the Clay Products group delivered a comparable performance to 2005 as the decline
in UK profitability was offset by a better outcome from our Mainland European operations.
Building Products
The Building Products group comprises three broad product segments: Construction Access-ories, Insulation, and the strategically linked Fencing
Operations Review: Europe Products & Distribution continued
Geoquip, our UK-based electronic
perimeter security systems
company, is recognised as a world
leader in the design, development
and manufacture of intruder
detection systems on all types of
boundaries, such as fences, walls
and open spaces that separate
secure areas from general access
areas.
Activities
Concrete blocks & pavers Benelux, Denmark, France, Germany, Italy, Slovakia, UK
Precast concrete products Benelux, Denmark, France, Poland, Switzerland, UK
Clay bricks, pavers, rooftiles & blocks Benelux, Germany, Poland, UK
Insulation products Benelux, Denmark, Estonia, Finland, Germany, Ireland, Poland, Sweden, UK
Fencing & Security Benelux, France, Germany, UK
Daylight & Ventilation Benelux, France, Germany, Ireland, UK
Construction accessories Benelux, France, Germany, Ireland, Italy, Poland, Spain, Switzerland, Sweden, UK
Professional builders merchants Austria, France, Germany, Netherlands, Switzerland
DIY stores Benelux, Germany, Portugal
New 60%
Residential60%
Non-residential30%
10% Infrastructure
4 0 % R M I
Product end-use
Annualised production volumes*
11.4m tonnes
6.3m tonnes
3.0m tonnes
6.3m cubic metres
3.0m lineal metres
1.2m square metres
n/a
331 branches
206 stores
*CRH share

19CRH
& Security (F&S), Daylight & Ventilation (D&V), and Roller Shutters & Awnings (RSA) businesses.
Market conditions were generally positive, with the difficult German market showing the first signs of pick-up in the latter half of the year. All businesses, with the exception of D&V which remained flat, delivered organic improvement complemented by strong acquisitive growth in Construction Accessories.
Construction Accessories
Our heritage operations achieved profit improvement due to strong market conditions in Belgium, France and Spain, and an improving German market. The business was significantly enlarged by the acquisition of Halfen, the leading European producer of metal construction accessories used in commercial, civil engineering and residential construction. CRH is now the market leader in Construction Accessories in Europe.
Insulation
This business has strong market positions in the UK, Ireland, Benelux, Germany, Poland and the Nordic region. Although our operations continued to suffer from severe volatility in raw material costs, a strong improvement in sales and operating profit was realised due to volume and price improvements, benefits from restructuring initiatives and further good cost control.
F& S, D& V and RSA
Fencing & Security had another year of good progress despite stronger competition and increasing steel and zinc prices. In the UK, solid results were achieved for the third consecutive year due to additional government spending and good operational control, while our business in Germany delivered improved profits.
Overall profitability was maintained in Daylight & Ventilation despite increasing
input costs and a continuing competitive backdrop.
The acquisition in August of AVZ, the leading designer and distributor of awning systems and roller shutters in the Netherlands, was a first step in a promising new product segment. Performance to date has been above expectations.
Distribution
2006 was a record year with excellent improvements in both sales and profits. This improvement was driven by a good recovery in our markets, especially in the Dutch housing sector, and by significant contributions from 2005 acquisitions and the six acquisitions completed in 2006.
Professional Builders Merchants
CRH Europe Distribution currently operates 331 professional builders merchants locations in five different countries: Austria, France, Germany, the Netherlands and Switzerland.
The Netherlands: The construction sector grew strongly, benefiting from a marked recovery in new residential construction with the number of completions up 12% to approximately 75,000. Our Dutch builders merchants activities benefited from the more positive market conditions and reported solid sales growth. This, together with a continued focus on margins and costs, resulted in a substantial improvement in operating profit. During 2006 two acquisitions were completed, adding two locations to our distribution network. In addition three new greenfield branches were opened.
France: Business in France saw significant improvement in sales and operating profit due to better market conditions and benefits from profit improvement measures of recent years. An acquisition in August added one location to our network.
Switzerland: Good market conditions led to another record
Market leadership positions
No. 1 paving products in Benelux, France and Slovakia No. 1 paving/landscape walling in Germany No. 1 architectural masonry in the UK No. 2 paving products in Denmark
No. 1 precast flooring in Benelux Joint No. 1 precast architectural concrete in Denmark No. 1 utility precast in France No. 1 precast structural elements in Switzerland No. 1 concrete fencing and lintels in the UK
No. 1 facing bricks in the UK No. 2 facing bricks, pavers & blocks in Europe
No. 1 EPS in Ireland, Netherlands, Poland and Nordic region Joint No. 1 XPS in Germany (50%) No. 1 XPE in Germany No. 1 PUR/PIR in Netherlands
No. 1 security fencing and perimeter protection in Europe
Joint No. 1 in Europe in glass structures, plastic rooflights, natural ventilation and smoke exhaust systems
No. 1 in western Europe
No. 1 in Netherlands, No. 1 in Burgundy, Rhône-Alps and Franche-Comté in France, No. 1 in German-speaking Switzerland, No. 1 in Sachsen-Anwalt, Niedersachsen and northern Nord Rhein Westfalen, No. 1 in Austria, No. 2 in Ile-de-France
Member of Gamma franchise, No. 1 in Netherlands, No. 2 in Belgium Member of Hagebau franchise, No. 5 in Germany (48%) Joint No. 2 in Portugal (50%)

20 CRH
Build leadership positions in targeted European markets in the manufacture and distribution of building products through organic investment and acquisition; continuously improve our businesses with state-of-the-art IT, exchange of process and product know-how, and active best practice programmes.
Concrete Products
Architectural: Consolidate and extract synergies from market-leading positions in Germany, France and Benelux; accelerate growth from our existing platforms in Central Europe, Nordics and Italy, and establish a further foothold in the Mediterranean; intensify support from mature regions to developing regions by transferring technology, product assortment, logistics and marketing skills
Structural: Continue to optimise Benelux, Danish and Swiss structural operations and develop complementary presence in adjacent regions; establish new development platforms in Central Europe and the Mediterranean; utilise engineering, project management and logistics skills to add more value to customers
Utility: Develop the utility products group (transport/water/energy networks) throughout Europe using presence and knowledge transfer from current businesses
Sand-lime brick: Build on capabilities of Dutch sand-lime operations and offer solutions using other structural concrete products; develop and support new platforms throughout Europe
Clay Products
Improve returns from our assets across Europe through optimising capacity utilisation, cost efficiencies, best practice and continuous improvement
Selective plant investments to improve energy efficiency, reduce unit costs and enhance process and product flexibility
Strengthen market leadership positions in UK and Netherlands and further develop expanding presence in Poland
Building Products
Insulation: Continue profit recovery programme and further build upon our leading positions across a range of foam insulation materials in Europe. Develop improved insulation systems and actively exchange product and process know-how among our group companies; selective greenfielding and acquisitions in niche sectors
Fencing & Security: Grow security fencing and perimeter protection from current strong base in Germany, Netherlands and UK; develop further in perimeter security and access control systems
Daylight & Ventilation: Continue to focus on organic profit improvement and develop further in new areas
Construction Accessories: Build further and expand our pan-European presence
Roller Shutters and Awnings: Build on leading position in the Netherlands and expand to other European countries
Distribution
DIY: Continue to grow our successful chains in the Benelux and Portugal via greenfield investments and acquisitions
Builders merchants: Build upon our strong leadership positions in Austria, France, Germany, Netherlands and Switzerland and expand into neighbouring countries
New regions: Develop new regions both in builders merchants and DIY
Continue to realise operational excellence from expanded network
!
!
!
!
!
!
!
!
!
!
!
!
!
!
!
!
Operations Review: Europe Products & Distribution continued
year for our operations with profits advancing significantly. Two acquisitions were completed, adding seven locations to our network in the German-speaking part of Switzerland.
Germany: Bauking, our 48% joint venture acquired in December 2005, had a very successful first year within the Group. Aided by rigorous cost control and some uplift in the German market, results exceeded expectations.
Austria: Quester, acquired in October 2005, had a disappointing start to the year. However, following first-half re-organisation measures the business delivered a much improved performance in the second half.
DIY
CRH Europe Distribution currently operates 206 DIY stores in the Benelux, Germany and Portugal.
Benelux: Despite improved consumer confidence, the DIY market in the Benelux showed only moderate growth for 2006 as a whole. Against this backdrop, our branch network reported another satisfactory year with improved profitability. In 2006 two stores were added in Belgium in one acquisition, and four greenfield stores were opened in the Netherlands.
Germany: Our Bauking joint venture operates a DIY business under the Hagebau brand which delivered sales and profits in line with expectations in a very competitive market.
Portugal: Sales at our DIY joint venture advanced, with the opening of one new location in 2006 following five such openings in 2005.
Outlook
Overall forecasts for the construction industry in our key markets show further growth in 2007, particularly in the Netherlands where consumer confidence continues to strengthen and new residential and non-residential markets continue to improve.
In Belgium, activity is expected to remain close to the high levels of recent years with a stable residential market and modest declines in non-residential and infrastructure.
We anticipate continued strength in the French new residential market together with moderate growth in non-residential and infrastructure demand.
In Germany, we see an increase in construction activity. The new residential sector appears to have bottomed while other construction segments are showing clear signs of recovery.
The outlook in our Swiss residential and non-residential markets remains attractive while in Austria we expect a much improved performance from our operations.
Although, the UK housing market is expected to moderate in 2007 as a result of recent interest rate increases and brick volumes should stabilise.
Building on the success of 2006, ongoing margin improvement, through a combination of price recovery and cost reduction, remains the key focus of our management teams. The search for acquisition opportunities in Europe across our full range of activities continues. We look to further success on the development and operational front in 2007 leading to continued profit progress.
Development strategy

21CRH
The newly aquired BauBedarf
branch in Winterthur-Dattnau.
Following two acquisitions in
2006, which added seven new
outlets to its network, BauBedarf
has become the largest builders
merchant in the German-speaking
part of Switzerland.
A section of a new six kilometre
concrete road being laid by Grupa
Oz. arów for the town council for the town council
in OzOz. arów. Concrete is seen. Concrete is seen
increasingly as a cost-effective
alternative for local roads in
Poland.
Uni-Plan Plus self-supporting
insulation sandwich roofing
elements are manufactured in
the Netherlands by Unidek.
Fitted on roof beams, these
innovative elements remove
the need for the traditional roof
tile support system used in
conventional pitched roof
construction, reducing building
time with considerable savings
on building costs.

22 CRH
Tom HillChief Executive Officer
Oldcastle Inc.
2006 Results – Americas
Chief Executive
Materials
Americas
Products Distribution
Materials ANALYSIS OF CHANGE Exchange 2005 2006 % of§ million 2005 Translation Acquisitions Acquisitions Organic 2006 Change Group
Sales 3,165 -30 +186 +904 +553 4,778 +1,613 25
Operating Profit 328 -3 +27 +45 +78 475 +147 27
Average Net Assets 2,805 3,671
Operating Profit Margin 10.4% 9.9%
Excluding APAC 11.2%
Products ANALYSIS OF CHANGE Exchange 2005 2006 % of§ million 2005 Translation Acquisitions Acquisitions Organic 2006 Change Group
Sales 2,756 -16 +113 +492 +227 3,572 +816 19
Operating Profit 308 -1 +3 +22 +43 375 +67 21
Average Net Assets 1,449 1,764
Operating Profit Margin 11.2% 10.5%
Excluding MMI 11.3%
Distribution ANALYSIS OF CHANGE Exchange 2005 2006 % of§ million 2005 Translation Acquisitions Acquisitions Organic 2006 Change Group
Sales 1,156 -11 +125 +137 +41 1,448 +292 8
Operating Profit 80 -1 +13 +12 -1 103 +23 6
Average Net Assets 262 362
Operating Profit Margin 7.0% 7.1%

23CRH
2006 Overview
Americas Materials had an excellent year achieving significant success in recovering higher energy and other input costs and delivering a strong improvement in heritage operating profit margin for the second consecutive year. This combined with a record net acquisition spend of §1.1 billion (US$1.4 billion), which included the purchase of APAC, resulted in record sales and operating profit for the Division.
Bitumen costs increased for the fifth consecutive year, rising 50% despite a very successful winter-fill programme. Energy used at our asphalt plants, consisting of fuel oil, recycled oil and natural gas, had a composite cost increase of 10%. The cost of diesel fuel and gasoline used to power our mobile fleet increased by 14%. Against this backdrop, overall prices
increased 10% for aggregates, 15% for readymixed concrete and 27% for asphalt, the product most impacted by input cost increases.
Non-residential demand continued to improve and more than offset the decline in new residential construction. Overall funding available for highway projects showed a satisfactory improvement on 2005 levels. However, as anticipated, with relatively fixed highway budgets, the volume of activity was impacted by the strong price increases necessary to recover higher input costs and the margin declines experienced in 2003 and 2004. Total volumes, including acquisition effects, increased 10% for aggregates, 20% for readymixed concrete and 27% for asphalt. Heritage volumes were flat for readymixed concrete, declined 2% for aggregates, and 3% for asphalt.
The overall 2006 Divisional margin of 9.9% (2005 : 10.4%) reflected the dampening effect of APAC’s profitable but lower margin business mix combined with once-off APAC integration costs. APAC recorded sales of §761 million and operating profit of §26 million in the last four months of the year. The operating margin excluding APAC advanced strongly to 11.2%.
The highlight of the record 2006 development spend was the acquisition in August of APAC for a total consideration of §1.0 billion (US$1.3 billion). Subsequent selective disposals prior to year-end of non-core asphalt and highway construction units in line with the re-focusing of APAC’s activities reduced the net outlay to §0.85 billion (US$1.1 billion). Another notable development occurred in August with the announcement of our
entry into the North American cement market through a joint venture to develop a 1.1 million-tonne greenfield cement plant in central Florida, close to Tampa and Orlando. We also completed 19 other transactions, which comprised a range of value-adding bolt-on acquisitions and new sector entries in many regional markets across the Division.
Operations ReviewAmericas Materials
“2006 was an excellent year for Americas Materials with significant success in the recovery of higher energy and input costs and a strong improvement in organic operating profit margin. It was also a record year for development activity, the highlight being the purchase of APAC, CRH’s largest ever transaction.”
Tom Hill
Icon Materials produced and placed 96,590 tonnes of hot mix asphalt during a 460-hour milling and paving window at the Seattle, Washington, King County International Airport (Boeing Field). In addition to the milling and paving, the renovation included complete updates to the runway electrical systems, total reconstruction of five taxiways and the installation of an extensive edge drain system to bring the pavement design up to current federal aviation standards.

24 CRH
The Americas Materials Division operates in 42 states in the United States through five regional business units. CRH is the third largest aggregates producer, the largest asphalt producer and a top 10 readymixed concrete producer in the United States. It owns integrated aggregates and asphalt operations throughout the United States with strategically located long-term aggregates reserves. Integrated readymixed concrete operations are spread throughout the West and in Connecticut, Delaware, New Hampshire, New York and Pennsylvania in the Northeast. The Division is currently developing a greenfield joint venture cement plant in Florida. Americas Materials employs approximately 19,000 people at over 1,100 locations.
New England
In 2006, New Hampshire and Vermont enjoyed better trading in improving markets. Massachu-setts had another excellent year with solid demand and a positive pricing environment. The states of Maine and Connecticut both reduced highway spending and higher prices impacted volumes at the municipal and local level re-sulting in profit declines. In devel-opment, we successfully entered the readymixed concrete business in Vermont, New Hampshire and Maine with the acquisition of Bissonette, and trading to date has exceeded expectations. Overall, profits improved.
New York/New Jersey
Our New York/New Jersey businesses had record results reflecting stable demand, real price increases and internal cost
efficiencies. Our large quarries in New York and New Jersey, which service the greater New York Metro area, improved their operational performance while also concentrating on successful delivery of several large capital projects. We have commenced a major project to double aggregates production capacity at our key West Nyack quarry, just north of New York City, which will further enhance our ability to service the New York Metro market. In Upstate New York, our Albany operations once again increased profits in good markets. Recent years have seen significant contraction in the Rochester region with many large local employers continuing to scale back their activities. However, 2006 brought some improvement in local demand and our Rochester operations reported improved profits after
Operations Review: Americas Materials continued
Southcentral Pennsylvannia’s leading supplier of
aggregates, concrete and asphalt, Pennsy Supply,
played a central role in constructing the PA
Turnpike Bridge spanning the Susquehanna River
in Harrisburg.
Activities
Aggregates United States
Asphalt United States
Readymixed concrete United States
Annualised production volumes
180.7m tonnes
61.4m tonnes
8.4m cubic metres
Residential15%
Non-residential25%
60% Infrastructure
7 0 % R M I
Product end-use
New 30%

25CRH
United Companies completed a
US$3.1 million contract for the
Colorado Department of Transport,
paving 17 miles of State Highway 65
over the Grand Mesa, Colorado.
declines in 2004 and 2005. On the development front, we significantly expanded our construction debris recycling activities in the New York Metro area with the acquisition of Bedrock Recycling.
Central
The Central region delivered record results with strong price improvements, contributions from acquisitions and benefits from its winter-fill programme. Our bitumen storage capacity in this region mitigated significant bitumen cost increases during the busy highway paving season. Michigan continued to suffer in poor public and private markets. Ohio had a strong year with healthy highway markets and improved pricing especially in aggregates. Pennsylvania and Delaware continued to improve with internal cost efficiencies
and steady markets. Our Kentucky and West Virginia operations, acquired in 2005, had a satisfactory year, with improved pricing offsetting lower volumes. In development, we completed five bolt-on acquisitions in Ohio, expanding our readymixed concrete, aggregates and asphalt operations in what is the Division’s largest individual state ranked by turnover. In addition, we completed one bolt-on readymixed concrete acquisition in Delaware, and two bolt-on deals to our Industrial Mineral business.
West
Our West region had another excellent year. Local economies remained strong overall with solid non-residential and highway markets offsetting softening residential demand. Once again, Utah and Idaho saw
Market leadership positions
No. 3 national producer
No. 1 national producer
Top 10 in the United States
26 CRH
Improve upon our excellent environmental and safety records
Leverage our existing strong reserves positions near major metropolitan areas
Invest in value-adding organic capital projects
Pursue new growth opportunities
Maintain strategy of bolt-on acquisitions to existing market positions
New England
Further vertical integration of operations in New Hampshire, Maine and Vermont
Expand our readymixed concrete operations
New York/New Jersey
Expand New Jersey business through bolt-on acquisitions
Improve our bitumen winter-fill capacity
Invest in existing aggregates facilities to increase capacity and reduce costs
Central
Continue vertical integration opportunities in Michigan, Ohio and West Virginia through selective bolt-on acquisitions
Seek add-on acquisitions and greenfield opportunities to augment our strong positions in Pennsylvania and Delaware
Continue to develop our recent entry into Kentucky and Virginia
West
Selective add-on acquisitions to expand our vertically integrated positions in the mountain regions
Develop existing operations in the Northwest, Iowa and Minnesota
APAC
Complete integration process and leverage best practice opportunities
Develop materials focus of existing APAC operations
Pursue bolt-on acquisition opportunities across this new development platform
!
!
!
!
!
!
!
!
!
!
!
!
!
!
!
!
!
!
significant profit gains due to a better pricing environment in generally buoyant markets for all products. In Washington, results improved significantly. Our operations in Wyoming, Montana, South Dakota, Colorado, and New Mexico had another record year despite increased readymixed concrete competition. Our heritage Iowa operations suffered profit declines as a result of weak residential demand and several new readymixed concrete entrants in the Des Moines area. Southern Minnesota Construction, the aggregates and asphalt supplier in the south-central region of the state acquired in 2005, met expectations and provided a platform for further expansion in southern Minnesota and northern Iowa with three bolt-on acquisitions completed during the year. Six other bolt-on acquisitions strengthened our existing activities throughout the region.
APAC
APAC represents a major expansion for the Division into new markets in the mid-western and southern US states and adds a fifth operating region to the Americas Materials Division. It significantly increases our position as a leading US aggregates and asphalt producer and provides increased exposure to United States infrastructure spending. With operations in 14 states, this acquisition brings a development platform for future growth. We are gaining significant synergies through overhead reductions and by shifting the business emphasis from construction to materials. In this regard, in December we announced six separate disposals of certain APAC contracting and asphalt activities in Georgia, North and South Carolina, Texas and Virginia.
Although APAC’s structurally lower margins (due to higher revenue, lower margin construction sales) and integration
costs impacted the Division’s overall operating margin in 2006, underlying trading in the business for our first four months of ownership was in line with expectations. The integration programme is on schedule and we look to a strong performance from APAC in 2007.
Outlook 2007
From an underlying demand viewpoint, our current overall outlook is for stable to slightly declining volumes for Americas Materials as a whole. Infrastructure is the key end-use for this Division and while funding for highway projects is forecast to increase further in 2007, volumes and activity levels will continue to be influenced by input cost movements and associated product pricing trends. Though there are regional variances, further improvement in non-residential markets is expected to offset residential declines.
Our priority for 2007 is to continue the improving underlying trend in operating profit margin evident in our 2005 and 2006 performance, through the ongoing achievement of efficiency gains, cost reduction, and additional price improvements.
With a continuing favourable pricing environment, a sustained focus on operating efficiency and with benefits from our record 2006 development spend we look forward to another year of significant progress for this Division.
Operations Review: Americas Materials continued Development strategy

27CRH
is also a regional leader in clay brick. Packaged decorative stone, mulches and soils, Sakrete7 dry-mixes, bulk lightweight aggregates and manufactured countertops are important product lines that complement the group’s core businesses.
APG faced tougher residential markets but delivered a robust performance for 2006 as a whole. Price increases, and the benefit of acquisition contributions, helped to once again deliver double-digit percentage growth in sales and operating profit for the year.
Regionally, the West and South enjoyed strong markets, the Midwest performed well despite softer commercial and residential activity, while the Northeast suffered in a poor market with increased competition. Glen-Gery performed satisfactorily in weakening markets. Bagged soil and mulch activities had a
disappointing performance in a very difficult pricing environment and management actions have been taken to improve the business going forward.
APG continued to add new plant capacity in 2006 to support geographic expansion of its retail customer base, core masonry business and in particular its Belgard7 professional hardscape line. A new block plant and paver plant were added to the fast-growing south region and another block plant began operation in Arizona. Six additional greenfield expansions are currently under construction and will begin operation during 2007 sustaining a strong internal growth strategy.
APG completed three acquisitions in 2006. These included the purchase of the Sakrete7 brand name as part of our national growth strategy in dry mix product lines; a bolt-on in the
south to supplement block and brick distribution in a high growth market; and a further bolt-on expanding the APG product offerings in the Des Moines, Iowa market.
Precast
The Precast group is a leading manufacturer of precast, prestressed and polymer concrete products and concrete pipe in North America. The group operates from 77 locations in 25 states and the province of Québec.
The continued strength of the residential construction sector during the first half of the year, along with growth in non-residential, commercial and infrastructure construction markets, resulted in a second consecutive year of record volumes from our legacy operations. Good cost control and effective price management led to margin improvements and
Operations Review:Americas Products & Distribution
“Strong non-residential markets combined with stable repair, maintenance and improvement expenditures resulted in another record year for Products & Distribution, despite higher input prices and a decline in residential construction.”
Tom Hill
2006 Overview
Following a very strong first half, the demand backdrop and underlying growth rates for our Americas Products & Distribution operations moderated through the second half of the year. However, overall second half demand remained broadly positive helped by strong and growing non-residential markets which offset the ongoing residential decline. Regionally, our operations in the western and southeastern states performed particularly well in strong markets; the midwest operations improved on 2005, while results from northeastern operations were weaker. Overall, Products & Distribution had an excellent year with a 28% improvement in sales and a 23% increase in operating profit.
2006 also marked the creation of a new product group with the acquisition of MMI Products, Inc. (MMI) in April. MMI is a leading US manufacturer and distributor of mainly non-residential oriented building products, with operations in three distinct product segments: construction accessories, wire products and fencing products. MMI is a leader in each of these segments.
Architectural Products (APG)
APG, with 209 locations in 38 states and two Canadian provinces, is the leading North American producer of concrete products for three large and growing markets; commercial masonry, professional landscaping and consumer DIY. The group
Northfield Block has played a
large part in shaping Chicago’s
famous downtown area by
supplying architectural block to
give the city its unique and distinct
character.

28 CRH
another year of record profits for the group. Backlog volumes and margins held steady throughout 2006. Management focus on internal improvements and an improving non-residential sector should see further progress in 2007.
Internal developments completed during 2006 included the commission- ing of a new manufacturing facility in California, expanding capacity to service the fast-growing California Central Valley; commencement of construction of a precast and concrete pipe plant in the high growth Florida panhandle region, and a major expansion of our concrete pipe plant in eastern Pennsylvannia, which will result in increased capacity and lower costs for our northeast concrete pipe operations.
The pick-up in acquisition activity experienced in 2005 continued in 2006 with four acquisitions completed during the year. The purchase of a concrete pipe and precast manufacturer in Denver, Colorado and of a precast drainage and manhole producer close to Atlanta, Georgia complement and expand our existing market positions in these states. The acquisition of a utility vault and telecommunications structures producer in Indiana provided an important addition to our national telecommunications products business. A fourth transaction in northern California extended our national leadership position in small concrete and polymer boxes.
Glass
The Glass group custom manu-factures architectural glass and high-performance, engineered aluminium glazing systems for multi-storey commercial, institutional and residential construction. With 49 locations in 22 states and four Canadian provinces, the group is the largest supplier of high-performance
Utility Vault, Fontana, California,
(a division of the Precast group)
built these Trus-Channel concrete
floating docks. The modules are 8
feet wide by 60 feet long weighing
45,000 pounds. A total of 11
sections were made and delivered
to Glenn Canyon, Arizona.
Operations Review: Americas Products & Distribution continued
Activities
Concrete masonry, patio products, pavers, rooftilesCanada, United States
Prepackaged concrete mixes United States
Clay bricks, pavers and tiles Argentina, United States
Precast concrete products Canada, United States
Glass fabrication Argentina, Canada, Chile, United States
Construction accessories United States
Welded wire reinforcementUnited States
Fencing products United States
Roofing/Siding, Interior products United States
Annualised production volumes*
13.0m tonnes
2.3m tonnes
1.5m tonnes
2.5m tonnes
13.3m square metres
n/a
n/a
16.3m lineal metres
133 branches 47 branches
*CRH share
The Americas Products & Distribution Division operates primarily in the United States and has a significant presence in Canada. Its product groups – Architectural Products, Precast, Glass, MMI and Distribution – all have leading positions in national and regional markets. The Division is also a leading producer of clay tile products in Argentina and operates glass fabrication businesses in Argentina and Chile. Employees total approximately 23,000 at over 550 locations.
Product end-use
Residential45%
Non-residential45%
10% Infrastructure
New 50%
50% RMI

29CRH
glazing products and services in North America.
In 2006, the group achieved record results with good growth in both sales and operating profit. Strong markets produced robust demand for energy-efficient architectural glass products and high-performance laminated products such as hurricane-resistant and blast-resistant architectural glass. In addition, the group launched its exclusive energy-efficient architectural glass, SunGlassJ, designed to control solar heat gain and therefore reduce annual energy costs in buildings.
In June, the group completed the acquisition of an architectural glass manufacturer in Miami, Florida to provide additional capacity for larger, complex architectural projects that incorporate hurricane-resistant laminated glass.
In January, the group expanded its position in high-performance, engineered aluminium glazing systems with the acquisition of Texas Wall Systems, a leading regional manufacturer of custom-
engineered curtain wall and window wall systems located in Dallas, Texas.
In August, the group acquired Antamex, a supplier of high-performance curtain wall systems and engineering design services for commercial, institutional and multi-storey residential construction markets. Headquartered in Toronto, Canada, Antamex has operations in Toronto, Montreal and Vancouver.
M M I
MMI, acquired in April, has operations in 30 states from 79 locations with a mainly non-residential oriented product focus. Although somewhat affected in 2006 by weakness
MMI’s Meadow Burke division
offers a well-developed line of
anchors for handling and erecting
large structural elements. Shown
here is a wall panel being lifted
into place with the use of Meadow
Burke anchors embedded in the
panel, and braces positioned to
support the erected wall.
Market leadership positions
No. 1 in masonry, paving and patio in United States No. 1 paving and patio in Canada
No. 2 in United States
No. 1 brick producer in northeast and midwest United StatesNo. 1 rooftiles in ArgentinaNo. 3 wall and floor tiles in Argentina
No. 1 in United States
No. 1 architectural glass fabricator in United States
No. 2 in United States
No. 1 in United States
No. 2 fencing distributor and manufacturer
No. 3 roofing/siding distributor No. 3 interior products distributor

30 CRH
Expand current strong positions in all product groups through acquisition and appropriate greenfield development. Use scale, best practices and product/process innovation to create competitive advantage and to improve margins in the face of rising input costs.
Architectural Products
Grow a strong national position in masonry, leveraging a robust R&D capability into the development of related value added products
Enhance our retail channels with an expansion of complementary offerings of lawn, garden, patio and building products distributed through a balanced mix of national, regional and local builders merchants
Utilise and grow our national coverage of production capabilities, centralised R&D and integrated logistics to significantly increase the market penetration of our nationally branded product programmes such as Belgard7, Sakrete7 and Trenwyth7
Precast
In-fill geographic coverage through acquisition or greenfield
Pursue new product and new region opportunities
Leverage our nationwide coverage using existing facilities to support & develop national products
Glass
Edge expansion through new architectural products, services and regions
Manage industry trends through technology upgrades, cost control, organic growth and superior customer service
MMI
Expand geographic markets for construction accessories by providing innovative new products and engineered solutions
Increase penetration of concrete reinforcement market through new products, enhanced services, and improved cost position
Grow fencing margins through improved processes and product mix
Distribution
Grow core businesses by acquisition and greenfield investment largely in major metropolitan areas
Identify opportunities to invest in other attractive segments of building materials distribution
Use organisational initiatives and best-in-class IT to grow margins
South America
Use upgraded manufacturing capabilities for cost efficiency and product development
Continue to expand export business
Grow through selective acquisitions and plant expansions as regional economies improve
!
!
!
!
!
!
!
!
!
!
!
!
!
!
!
!
!
in its less significant residential product segment, MMI delivered a satisfactory performance in its first eight months with the Group and integration of the business continues apace. Due to its particular business mix, MMI’s operating profit margin is much lower than in our existing APG, Precast, and Glass activities, with a consequent effect on the overall Products operating profit margin.
Distribution
Oldcastle Distribution, trading primarily as Allied Building Products (Allied), has 180 branches in 29 US states, focused on major metropolitan areas. It comprises two divisions which supply specialist contractor groups: Roofing/Siding and Interior Products (wallboard, steel studs and acoustical ceiling systems).
Roofing/Siding is the group’s traditional business and Allied is one of the top distributors in this segment in the United States. In 2005, our distribution team organised its fast-growing interior products operations into a separate division, which now accounts for approximately one-third of annualised Distribution sales, and in which it is now the third largest distributor in the United States. Key to Oldcastle Distribution’s success is its well-trained, highly motivated workforce and strategically-focused organisational structure, supported by superior IT.
While the latter months of the year saw declining demand in the new-build segment, 2006 was another year of growth for Americas Distribution with good performances from both heritage and acquired businesses. Roofing/Siding demand is largely influenced by residential replacement activity with the key products having an average life span of roughly 20 years. Demand remained generally robust throughout the year, although Florida experienced a second half decline, following 24 months of unusually high activity generated by extensive storm
damage during the 2004 and 2005 hurricane seasons. The Interior Products division is focused equally on the commercial and residential construction markets. Over the last two years, we have significantly expanded this segment and in 2006 it delivered excellent incremental sales and operating profit contributions.
The group invested US$168 million on the completion of six acquisitions during the year; five in Interior Products and one in Roofing/Siding.
Against this generally positive backdrop, full year operating profit was ahead by 28% with margins similar to the excellent level achieved in 2005.
South America
Our operations in Argentina and Chile had a record year against an improved regional economic background. In Argentina, strong sales and profits in our ceramic tile business were partly offset by slightly lower profits in our glass operations. Our Chilean glass business performed well.
Outlook 2007
New residential construction markets in the United States declined steadily through the second half of 2006 and are expected to show continued weakness into mid-2007, with recovery expected to commence later in the year. However, residential repair, maintenance and improvement expenditures, which have historically been less cyclical, should remain at or close to 2006 levels while non-residential demand, which saw good improvement in 2006, is expected to maintain momentum into 2007. With its balanced geographic, product and end-use diversity, and with new US residential construction accounting for approximately 25% of Divisional end-use demand - and less than 10% of the CRH Group overall - the Division looks to another good year in 2007.
Operations Review: Americas Products & Distribution continued Development strategy

31CRH
Buffalo, Wyoming has experienced
significant economic growth
from natural gas development
in the Powder River Basin. As a
result, the existing infrastructure
now needs to be upgraded.
Intermountain Construction
& Materials, part of Americas
Materials’ Rocky Mountain
Group, has participated in the
improvements by constructing
a huge water storage tank. The
project was also assisted by
Hills Materials, another group
company.
With consistent economic growth
in the Oregon and southwest
Washington markets, Utility
Vault’s Wilsonville, Oregon, plant
now designs and produces larger
precast underground structures
to meet customer required
specifications, manufacturing
needs and shipping restrictions.
This sectional vault (10’x 24’)
was built for Clark County Public
Utility District in southwest
Washington.
On the Hawaiian island of Maui
the Interior Products division
of Americas Distribution does
business as RME. A forklift loads
gypsum wallboard on an RME
truck at their yard in Kahului,
Maui.

32 CRH
Results
CRH performed strongly in 2006 delivering growth in reported sales of 30%, in operating profit of 27% and in pre-tax profit of 25%. The key components of 2006 performance are analysed in Table 1.
Exchange translation effects
The average US$/euro rate of 1.2556 for 2006 was little changed compared with 2005 (1.2438) while average exchange rates for the Group’s other major operating currencies also showed little movement. Combined these resulted in a modest adverse translation impact of §4 million at profit before tax level. The average and year-end exchange rates used in the preparation of our financial statements are included under Accounting Policies on page 65 of this Report.
Incremental impact of 2005
acquisitions
2005 acquisitions contributed incremental sales of §1,108 million and operating profit of §82 million in 2006, an effective operating profit margin of 7.4%.
In Europe, 2005 acquisitions generated an incremental §684 million in sales and §39 million in operating profit, giving a margin of approximately 6%. Acquisitions in concrete products, in particular Stradal in France acquired in August 2005, and in construction accessories, including the acquisition of Syncotec in October 2005, delivered strongly. This resulted in a combined operating profit margin of 10% from 2005 acquisitions in the Europe Products segment. The incremental operating profit contribution from lower-margin, less capital-intensive Distribution activities was impacted somewhat by a poor first half contribution from Quester in Austria, which was acquired in October 2005. However, an improved second half performance from Quester and a good full year performance from distribution joint venture Bauking, acquired in December 2005, resulted in an operating profit margin of approximately 3% on incremental turnover.
In the Americas, 2005 acquisitions contributed an incremental §424 million in sales and §43
million in operating profit, with an operating profit margin of approximately 10%. Materials Division acquisitions delivered a margin of 14.5%, helped by a strong seasonal contribution from Mountain Companies in the Appalachian region which joined the Division in late October 2005. The operating profit margin in the Americas Products segment at approximately 3% was impacted by a disappointing performance in competitive markets from acquisitions completed in late-2005 as part of the expansion of APG’s lawn and garden products offering to large homecenter chains. In contrast, 2005 Americas Distribution acquisitions delivered strongly generating an operating profit margin of just over 10% on incremental turnover.
The Group’s 26.3% associate stake in Spanish cement producer Corporación Uniland has been accounted for using the equity method in reporting 2006 results.
Incremental impact of 2006
acquisitions
The incremental impact from 2006 acquisition activity amounted to
Finance Review “CRH has once again performed strongly in 2006 to deliver record full year organic growth, a significant incremental contribution from acquisition activity and further robust increases in earnings and dividend. Interest cover remains comfortable and the Group continues to seek value-enhancing development opportunities to deploy effectively its significant cash flow and balance sheet capacity.”
Myles Lee
Table 1 Key Components of 2006 Performance
Operating Profit on Trading Finance Associates’ Pre-tax§ million Revenue profit disposals profit costs PAT profit
2005 as reported 14,449 1,392 20 1,412 (159) 26 1,279
Exchange effects (54) (4) - (4) - - (4)
2005 at 2006 exchange rates 14,395 1,388 20 1,408 (159) 26 1,275
Incremental impact in 2006 of:
- 2005 acquisitions 1,108 82 - 82 (40) 18 60
- 2006 acquisitions 1,907 108 - 108 (56) - 52
Non-recurring items - (12) - (12) - - (12)
Ongoing operations 1,327 201 20 221 3 3 227
2006 as reported 18,737 1,767 40 1,807 (252) 47 1,602
% change as reported +30% +27% +28% +25%

33CRH
§1,907 million in sales and §108 million in operating profit, an effective operating profit margin of 5.7%.
In Europe, 2006 acquisitions contributed an incremental §374 million in sales and §29 million in operating profit, an effective margin of approximately 8%. This primarily arose in the Products segments and mainly reflected the Halfen construction accessories acquisition completed in May together with eight acquisitions in concrete products spread throughout the year.
In the Americas, 2006 acquisitions contributed an incremental §1,533 million in sales and §79 million in operating profit with the overall operating profit margin of approximately 5% reflecting inherently low operating profit margins in both APAC, acquired by Americas Materials in August, and in our new products platform MMI acquired in April. The first-time contribution from APAC was also impacted by restructuring charges of §21 million associated with its integration. 2006 Americas Distribution acquisitions performed strongly with a combined incremental operating profit margin of approximately 9%.
CRH’s 2007 results are expected to reflect a significant incremental impact from 2006 acquisitions which combined, net of APAC 2006 disposals, added annual sales of approximately §3.5 billion.
Non-recurring items
The 2006 results reflect two non-recurring items which taken together had an adverse impact of §12.3 million on reported profits.
In accordance with International Accounting Standard 36 Impairment of Assets, goodwill arising on business combinations is subject to annual impairment
testing. The Group’s 2006 impairment testing has resulted in a §50.0 million write-down of goodwill relating to its 45% Cementbouw joint venture. This joint venture was established in 2003 in a leveraged buyout of Cementbouw’s materials trading and readymixed concrete operations in the Netherlands, undertaken in conjunction with CRH’s 100% purchase of Cementbouw’s distribution, concrete and clay products activities. A significant proportion of the financing for the joint venture was provided in the form of non-recourse debt. The joint venture has experienced difficult trading in recent years and is currently in discussions with its banking group. This write-down has been charged against Europe Products in reporting operating profit by business segment.
During 2006, in response to legislative changes in the Netherlands, CRH reached agreement with its employees in the Netherlands on changes to certain pension arrangements which altered their basis under International Financial Reporting Standards (IFRS) from defined benefit to defined contribution. This resulted in the elimination of certain defined benefit obligations from the Group’s Balance Sheet with a resultant pre-tax gain of §37.7 million which has been reflected in arriving at operating profit for 2006. Of this §18.9 million has been credited to Europe Products and §18.8 million to Europe Distribution in reporting operating profit by business segment.
Ongoing operations
2006 organic growth in sales amounted to §1,327 million, a growth rate of 9% compared with 5% in 2005. Total underlying growth in operating profit was
§201 million giving an effective margin of 15%.
In Europe, our operations generated underlying sales growth of §506 million for the year, an increase of approximately 7%. Underlying operating profit growth of §81 million gave an effective margin of 16%. Europe Materials saw stronger momentum in the more profitable second half and recorded an underlying operating profit increase of §36 million. After a lacklustre first half, Europe Products also enjoyed stronger second half trading and delivered a §31 million increase in underlying operating profit. In Europe Distribution, underlying operating profit growth amounted to §14 million.
Our operations in the Americas generated underlying sales growth of §821 million, an increase of almost 12%, with underlying operating profit growth of §120 million giving an effective margin of just under 15%. The Americas Materials Division achieved significant success in recovering higher energy and other input costs and reported
an excellent §78 million advance in underlying operating profit. Following a very strong first half, growth rates for our Americas Products operations moderated through the second half as residential construction declined. Nevertheless these operations delivered a §43 million increase in underlying operating profit for 2006 as a whole. Underlying full year operating profit for Americas Distribution was §1 million lower due to a second half decline. This principally reflected a reduction in Florida roofing/siding demand following 24 months of unusually high activity generated by extensive storm damage during the 2004 and 2005 hurricane seasons.
Operating profit margins
Structurally low operating margins in both APAC and MMI, together with restructuring charges at APAC plus the impact of the non-recurring items outlined above, affected reported Group and segmental operating profit margins for 2006. Table 2 above compares the reported 2006 and 2005 operating profit margins with 2006 margins
Table 2 Operating Profit Margin Data
2006 2006 2005 Reported Excluding Reported APAC/MMI/ Non-recurring Items
Europe Materials 14.2% 14.2% 14.2%
Europe Products 6.9% 7.9% 6.9%
Europe Distribution 6.2% 5.5% 5.6%
Americas Materials 9.9% 11.2% 10.4%
Americas Products 10.5% 11.3% 11.2%
Americas Distribution 7.1% 7.1% 7.0%
Group 9.4% 9.9% 9.6%

34 CRH
excluding APAC, MMI and the non-recurring items in order to provide a fuller appreciation of CRH’s 2006 operating performance.
Finance Costs, Taxation,
Earnings per Share, Dividend
The timing of acquisitions in 2005, with the bulk of the §1.3 billion spend falling in the second half of that year, gave rise to an additional §40 million financing cost impact in 2006, while financing costs associated with 2006’s §2.1 billion net acquisition outlay added a further §56 million. While the Group’s free cash flow remained strong, sharply higher interest rates on the floating rate element of our underlying net debt resulted in only a modest §3 million reduction in finance costs from ongoing operations. As a result, 2006 net finance costs of §252 million showed a significant increase on 2005 (§159 million).
Reported 2006 profit before tax of §1,602 million includes the Group’s share of associates’ after tax profits of §47 million. The taxation charge of §378 million in respect of subsidiaries and joint ventures gives an effective tax rate of 23.6% on reported profit before tax compared with 21.3% in 2005.
Earnings per share grew by 20%. Cash earnings per share were ahead by 20%. The total dividend for the year increased by 33.3% to 52.0c (2005 : 39.0c) and was covered 4.3 times (2005 : 4.8 times).
The strong growth in sales, earnings before interest, tax, depreciation and amortisation (EBITDA), earnings per share and cash earnings per share and net dividend, over a five-year and ten-year period, are highlighted in Table 3.
Financial Performance Indicators
Some key financial performance indicators which, taken together, are a measure of performance and financial strength are set out in Table 4.
Higher financing costs associated with record development spend resulted in a reduction in interest cover measures. However, these measures remain very comfortable with 2006 EBITDA/net interest cover of 9.7 times more than double the 4.5 times minimum provided for in our banking covenants.
Year-end net debt of §4,492 million was §1,044 million higher than end-2005 resulting in an increase in the percentage of net debt to total equity. However, with a higher market capitalisation, the debt to market capitalisation ratio showed little change.
Overall Group return on average capital employed increased by almost a full percentage point to 15.4%.
The §3.3 billion acquisition spend of the previous 18 months made greater use of the Group’s significant debt capacity contributing to an improvement in the Group’s return on equity to 18.4%.
Cash generation
While spending a net total of almost §2.9 billion on acquisitions, investments and capital projects, the strong cash generation characteristics of the Group limited the increase in net debt to approximately §1 billion, helped by a positive translation adjustment of almost §0.2 billion. Table 5 summarises CRH’s cash flows for 2006 and 2005.
The §2,311 million acquisitions and investments spend total
in Table 5 reflects the gross US$1.3 billion consideration for APAC while the §252 million for disposals includes subsequent selective APAC asset disposals of approximately US$0.2 billion.
The increased charges for depreciation and amortisation of intangible assets mainly reflect the impact of acquisitions completed in 2005 and 2006.
Taxation payments were higher than in 2005 reflecting both
improved Group profitability and the impact of acquisitions.
The increase in dividend cost reflects the 18.6% increase in the final 2005 dividend and the 20% increase in the interim 2006 dividend both of which were paid during the course of 2006.
Capital expenditure of §832 million represented 4.4% of Group turnover (2005 : 4.5%) and amounted to 1.25 times depreciation (2005 : 1.17 times).
Table 3 Compound Average Growth Rates
5-year 10-year
Sales* 12% 19%
EBITDA* 11% 20%
Earnings per share* 12% 17%
Cash earnings per share* 11% 17%
Net dividend 18% 16%
* Due to the implementation of IFRS these percentage increases have been calculated by combining earlier percentage increases computed under Irish GAAP with the relevant 2005 and 2006 percentage increases computed under IFRS.
Table 4 Key Financial Performance Indicators
2006 2005
Interest cover, excluding joint ventures
- EBITDA basis (times) 9.7 12.3
- EBIT basis (times) 7.0 8.8
Net debt as a percentage of total equity (%) 63.2 55.3
Net debt as a percentage of year-end
market capitalisation (%) 26.2 25.9
Effective tax rate (%) 23.6 21.3
Return on average capital employed (%) 15.4 14.5
Return on average equity (%) 18.4 17.9
EBITDA - earnings before finance costs, tax, depreciation and intangible asset amortisation
EBIT - earnings before finance costs and tax (trading profit)
Finance Review continued

35CRH
Of the total capital expenditure, 46% was invested in Europe with 54% in the Americas.
Good working capital control limited the outflow for the year to §75 million.
The caption denoted “Other” mainly reflects the elimination of non-cash income items – such as share of associates’ profits and profit on disposals of fixed assets – and non-cash expense items – such as the IFRS
share-based compensation expense – which are included in arriving at profit before tax.
Proceeds from share issues principally reflect issues under Group share option and share participation schemes (§87 million), augmented by the take-up of shares in lieu of dividends under the Company’s scrip dividend scheme (§25 million).
Exchange rate movements during 2006 reduced the euro amount of
net foreign currency debt by §188 million principally due to the 12% revaluation of the euro against the US Dollar from 1.1797 at end-2005 to 1.3170 at end-2006. The adverse translation adjustment in 2005 reflected a 13% devaluation of the euro versus the US Dollar from 1.3621 at end-2004 to 1.1797 at end-2005.
Year-end net debt of §4,492 million (2005 : §3,448 million) includes §248 million (2005 : §271 million) in respect of the Group’s proportionate share of net debt in joint venture undertakings, principally Secil in Portugal, Cementbouw in the Netherlands and Bauking in Germany.
Employee benefits
In compliance with IFRS, the net assets and actuarial liabilities (excluding related deferred taxation) of the defined benefit pension schemes operated by various Group companies, computed in accordance with IAS 19, have been included on the face of the Group Balance Sheet under retirement benefit obligations. At end-2006, retirement benefit obligations amounted to §261 million (2005 : §451 million); after deducting deferred tax, the net liability amounted to §177 million (2005 : §324 million). The net liability represented 1.0% of CRH’s year-end 2006 market capitalisation (2005 : 2.4%).
Share price
The Company’s Ordinary Shares traded in the range §22.65 to §31.82 during 2006. The year-end share price was §31.54 (2005 : §24.85). Shareholders recorded a gross return of +29% (dividends and capital appreciation) during 2006 following returns of +28% in 2005 and +23% in 2004.
CRH is one of six building materials companies included in the FTSE Eurotop 300, a market-
capitalisation-weighted index of Europe’s largest 300 companies. At year-end 2006, CRH’s market capitalisation of §17.1 billion (2004 : §13.3 billion) placed it among the top five building materials companies world-wide.
Insurance
Group headquarters advises management on different aspects of risk and monitors overall safety and loss prevention performance; operational management is responsible for the day-to-day management of business risks. Insurance cover is held for all significant insurable risks and against major catastrophe. For any such events, the Group generally bears an initial cost before external cover begins.
Legal proceedings
Group companies are parties to various legal proceedings, including some in which claims for damages have been asserted against the companies. The final outcome of all the legal proceedings to which Group companies are party cannot be accurately forecast. However, having taken appropriate advice, we believe that the aggregate outcome of such proceedings will not have a material effect on the Group’s financial condition, results of operations or liquidity.
Financial risk management
The Board of Directors sets the treasury policies and objectives of the Group, which include controls over the procedures used to manage financial market risks. These are set out in detail in note 23 to the financial statements.
Interest rate and debt/liquidity
management
In September 2006, the Group completed a US$1.75 billion Global Bond Issue, which substantially extended the maturity profile of
Table 5 Cash Flow
§ million 2006 2005
Inflows
Profit before tax 1,602 1,279
Depreciation 664 556
Amortisation of intangibles 25 9
2,291 1,844
Outflows
Taxation (378) (260)
Dividends (222) (185)
Capital expenditure (832) (652)
Working capital (75) (119)
Other (69) (19)
(1,576) (1,235)
Operating cash flow 715 609
Acquisitions & investments (2,311) (1,298)
Disposals 252 103
Share issues (net of expenses) 112 61
Translation adjustment 188 (165)
Increase in net debt (1,044) (690)
Opening net debt (3,448) (2,758)
Closing net debt (4,492) (3,448)

36 CRH
the Group’s net debt. The issue raised US$500 million of 5-year money and US$1,250 million due for repayment in 10 years. This Bond Issue, which is rated BBB+/Baa1/BBB+, was significantly over-subscribed and broadly distributed to over 120 investors. The issue followed two previous US$1 billion issues in September 2003 and March 2002.
At the end of 2006, 50% of the Group’s net debt was at interest rates, which were fixed for an average period of 5.1 years. The euro accounted for approximately 39% of net debt at the end of 2006 and 47% of the euro component of net debt was at fixed rates. The US Dollar accounted for approximately 51% of net debt at the end of 2006 and 56% of the Dollar component of net debt was at fixed rates.
The Group finished the year in a very strong financial position with 97% of the Group’s gross debt drawn under committed term facilities, 92% of which mature after more than one year. In addition, at year-end the Group held §427 million of undrawn committed facilities, which had an average maturity of 2.6 years.
At year-end 2006, 86% of the Group’s cash, short-term deposits and liquid resources had a maturity of six months or less.
Based on the level and composition of year-end 2006 net debt, an increase in average interest rates of one per cent per annum would result in a decrease in future earnings, before tax, of §22.3 million per annum (2005 : §18.5 million).
Currency management
The bulk of the Group’s net worth is denominated in the world’s two largest currencies - the US Dollar and the euro - which accounted
for 47% and 38% respectively of the Group’s net worth at end-2006.
2006 saw a negative §371 million currency translation effect on foreign currency net worth mainly arising on US Dollar net assets. This negative effect is stated net of a §188 million positive translation impact on net foreign currency debt.
A strengthening of the euro by 10% against all the other currencies the Group operates in would, when reported in euro, reduce the Group’s year-end 2006 net worth by an estimated §401 million and year-end 2006 net debt by §248 million.
Sarbanes-Oxley Act
As a result of its public listing in the United States, CRH is subject to the provisions of Section 404 of the Sarbanes-Oxley Act of 2002 which requires management to perform an assessment of the effectiveness of internal control over financial reporting as of 31st December 2006 and to report its conclusions in the Company’s Annual Report on Form 20-F, filed with the Securities and Exchange Commission. Management’s assessment and the auditors’ report thereon will be included in the 2006 Annual Report on Form 20-F which will be filed later in the year.
Finance Review continued
Calduran’s Kloosterhaar sand-lime
brick and block plant is located
between two nature reserves,
one in the Netherlands, the
other across the nearby border
in Germany. The extraction of
raw material has made possible
the creation of a lake which
will in time form a third unique
ecosystem connecting the two
existing reserves.

37CRH
Corporate Social Responsibility
CRH’s strategic vision is to be a responsible international leader in building materials delivering superior performance and growth. This vision is implemented through our ongoing dedication to an active Corporate Social Responsibility (CSR) programme throughout the Group.
CSR embraces four key aspects of our business, namely corporate governance, environment, heath & safety and social performance. We are actively addressing climate change through upgrading investments in our cement, lime and clay brick plants. We also see climate change as an innovative driving force in all our activities, as the associated challenges can become our future opportunities.
Corporate governance is addressed in detail on pages 44 to 47, while the pages that follow provide a brief overview of our environmental, health & safety and social performances. In each of these areas, we have clearly defined Group policies, implementation programmes, objectives, review procedures, feedback and reporting mechanisms. Full details are published in our CSR Reports. The 2006 CSR Report will be published mid-2007.
The positive commitment to CSR is a defining characteristic of manage-ment in CRH. Much progress has been made, but more remains to be done as we strive to meet the ever-increasing expectations of all our stakeholders. We believe that meeting these expectations will be positive for our businesses.

38 CRH
Policy
Our environmental policy, applied across all Group companies, is to:
comply, at a minimum, with all applicable environmental legis-lation and to continually improve our environmental stewardship towards industry best practice
ensure that our employees and contractors respect their environmental responsibilities
optimise our use of energy and resources through efficiency gains and recycling
proactively address the challenges and opportunities of Climate Change
promote environmentally-driven product innovation and new business opportunities
be good neighbours in the many communities in which we operate
Delivery
Achieving our environmental policy objectives at all our locations is a management imperative; this line responsibility continues right up to CRH Board level. Daily responsibility for ensuring that the Group’s environmental policy is effectively implemented lies with individual location managers, assisted by a network of Environmental Liaison Officers (ELOs). At each year-end, the ELOs assist the Group Technical Advisor in carrying out a detailed assessment of Group environmental performance, which is reviewed by the CRH Board.
Environmental performance
The recent Board review confirmed continuously improving environmental performance throughout the Group, including recent acquisitions, as is our universal objective. In 2006, we spent over §50 million on further environmental upgrades. This sustained investment programme continues to reduce our environmental footprint, effectively bringing our 3,300 locations towards best industry practice.
!
!
!
!
!
!
Many companies reduced air emissions, increased recycling of water, increased the use of secondary materials and achieved further process and energy efficiency gains, with direct economic as well as environmental benefits. We continued restoration of worked-out quarries and pits, and fostered biodiversity where it exists: over 85% of all our quarries and pits now have restoration plans, and this increases year-on-year.
Addressing climate change
CRH recognises that climate change is a major challenge facing humanity, and is committed to playing its part in developing practical solutions. CRH is a core member of the Cement Sustainability Initiative (CSI). The CSI is a voluntary initiative by 18 of the world’s major cement producers, promoting greater sustainability in the cement industry in co-operation with the World Business Council for Sustainable Development (WBCSD) and independent stakeholders.
CRH is now committing to a 15% reduction in its specific CO2 cement
plant emissions by 2015 compared with the 1990 specific emissions for the same portfolio of plants. This reduction is being achieved through major modernisations of several plants, such as in Lappeenranta in Finland, as well as moving towards the use of alternative materials and fuels at all our cement plants, where specifically permitted.
CRH is operating overall within the National Allocation Plans under the European Emissions Trading Scheme for the period 2005-2007, and is in active discussions on the Plans for the period 2008-2012. For its plants outside the European Union, CRH is seeking to participate in the flexible CO2
trading mechanisms under the Kyoto Protocol, which help justify plant upgrading investments that would otherwise be uneconomic.
Environment
Telluride Gravel, part of Americas
Materials West Division, is involved
in the San Migues River Restora-
tion project on behalf of the Town
of Telluride. Activities include the
removal of sediment, construction of
fish habitats, river bank restoration
and re-vegetation, erosion control
through use of natural materials,
and construction of various access
points for recreational activities.

39CRH
Health & Safety
Policy
Our health & safety policy, applied across all Group companies, is to:
comply, at a minimum, with all applicable legislation and continually improve our health & safety stewardship towards industry best practice
ensure that our employees and contractors respect the Group’s health & safety imperatives
ensure that our companies provide a healthy and safe workplace for our employees and contractors, and take due care of customers and visitors at our locations
require our employees and contractors to work in a safe manner as mandated by law and industry best practice
Delivery
Health & safety management is a daily priority of line management. Safety results for the entire Group are closely monitored by senior management and are reported to the Board on a monthly basis. At the end of each year, the safety officers assist the Group Technical Advisor in carrying out a detailed safety performance review of all Group companies, the results of which are reviewed by the Board.
Where accidents occur, these are investigated and corrective action is taken to avoid a recurrence. Lessons learned are actively shared via Safety Best Practice groups and a Safety intranet. Safety best practice is also shared through the CSI Health & Safety Task Force: CRH continues to chair Task Force 3 on Employee Health & Safety.
Safety performance
Through ongoing intensive focus on safety across the Group, we achieved a further 20% reduction in 2006 in accident frequency and severity rates compared to 2005. This progress encourages us to even better performance in the years ahead.
!
!
!
!
Our goal is zero fatalities and zero accidents. Due to the nature, size and continued growth of our businesses, this is an extremely challenging task. Over 75% of our locations were accident-free in 2006 and we continuously strive to improve this figure through ongoing intensive safety management and training across all our locations. There is a particular focus, where necessary, on bringing acquisitions quickly up to Group safety standards.
Despite all the very considerable ongoing focus on safety, we deeply regret that there were four employee and two contractor fatalities in 2006 across our operations in Ukraine, Poland, Northern Ireland and the United States. There were also two contractor fatalities in our Secil joint venture, in Tunisia. Every fatality is a tragedy too many, and we continue to do our utmost to avoid recurrences.
Health performance
We continue to monitor scientific developments and evolving legislation relating to application of our products. Our products, when properly used, present negligible health risks and, where appropriate, Materials Safety Data Sheets advising on optimal application procedures, are available to our customers.
We also carry out workplace hygiene monitoring, particularly in the context of ambient noise and dust exposure, as required by national legislations and international agreements. Occupational health claims remain at a low level across the Group. Modernisation investments across the Group continue to improve workplace conditions and ergonomics towards industry best practice.
A supervisor at Jura Cement
in Switzerland gives training
on the correct use of fall arrest
equipment, particularly important
for working at heights.

40 CRH
Policy
Our social policy, applied across all Group companies, is to:
comply, at a minimum, with all applicable legislation and to ensure that our social stewardship moves towards industry best practice
manage our businesses in a fair and equitable manner, meeting our social responsibilities both as a direct and indirect employer
apply the principle of equal opportunity, valuing diversity regardless of age, gender, disability, creed, ethnic origin or sexual orientation, while insisting that merit is the ultimate basis for recruitment and selection decisions
ensure that we deal responsibly with our suppliers and customers in accordance with our Code of Business Conduct and proper business practice.
Delivery
Implementing our social policy is a daily responsibility of our line managers. They are supported by a network of Human Resource Managers in all our regions and companies, who liaise regularly with the Group Human Resources Director. Successful implementation of our social policy is fundamental to achieving the Group Performance and Growth objectives.
Training and development of our employees receives ongoing attention, with an average of over 18 hours of training per employee in 2006. We seek to provide career development opportunities to employees who have the initiative and ability to progress.
In parallel, leadership development programmes were run in all Divisions in order to foster and develop our world-class management.
!
!
!
!
CRH continues to attract high-calibre managers through three distinct routes: promotion from within, development of people who join us through acquisition, and recruitment of new talent. At all levels in its organisation, CRH seeks to be an employer of choice, which is our ongoing objective.
Our companies have strong traditions of open communication with their employees. Each year, we hold a European Works Council meeting, where employees and management discuss common trans-national developments.
The Code of Business Conduct, published on our website, www.crh.com, has been issued to relevant senior employees. The Code contains several provisions aimed at ensuring that the Group conducts its business activities with its supply chain and customer base responsibly. Responsibility for adherence with the Code is monitored by senior management.
Performance
Employee satisfaction indicators are monitored annually at Group level. In 2006, our companies were again characterised by low absenteeism as well as good industrial relations. An employee “hotline” has now been rolled-out across almost all Group companies; other companies are continuing implementation. Issues reported during 2006 were investigated and resolved, and were monitored by Internal Audit: none of any significance was reported.
Responsibility for ensuring customer satisfaction lies with the individual operating companies which conduct a variety of feedback processes to ensure that this is maintained effectively at the requisite high level. Relationships with our suppliers are generally also the responsibility of company management, who are required to conduct these on a competitive and professional basis.
Social & Community

41CRH
CRH continues to be ranked among the sector leaders by all the leading Socially Responsible Investment (SRI) rating agencies.
In September 2006, CRH continued in both the Dow Jones World and STOXX Sustainability Indexes, as assessed by SAM (Zürich), which noted that:
“CRH continues to demonstrate strong commitment in addressing
key corporate sustainability challenges. The strong efforts in reducing
the environmental footprint of its business activities and continued
dedication to safety improvement, combined with best in class human
resources management, make CRH a CSR reference company for the
building materials sector.”
In March 2006, CRH became a constituent member of the FTSE4Good (London) index, with the comment that:
“FTSE Group is delighted to confirm that CRH has
been independently assessed according to the
FTSE4Good criteria, and has satisfied the require-
ments to become a constituent of the FTSE4Good
Index Series.”
In June 2006, Innovest (London) raised CRH to an “AA” rating, stating that:
“CRH has made significant improvements in
addressing its key corporate responsibility
risks. The company demonstrates its aware-
ness of the strategic profit opportunities
that can be derived from environmentally
beneficial products, and intends to incrementally progress towards
reporting in accordance with the Global Reporting Initiative (GRI)
guidelines by 2007.”
In January 2006, Vigeo (Paris) indicated in its sector review that:
“CRH’s performance on CSR issues is in the top three performers.
It demonstrates positive and stable performances for customers
and suppliers, human rights, community
involvement, corporate governance and
human resources, and an improved rating
for environmental issues compared to its
2004 rating.”
Additionally, our companies won over 300 national and regional industry accolades for excellence in environmental and safety performance. All these recognitions and awards encourage us to strive for even greater success in the years ahead.
Stakeholder communication
CRH has an open-door policy on communications with key stakeholder groups concerning our CSR performance. At Group level, we discuss our performance with the investment community, third-party survey and assessment organisations and other interested parties. At company level, we are in regular dialogue with local communities, authorities and permitting agencies, underlining our commitment to operate as a good neighbour.
More details on our environmental, health & safety, and social performances are available in our CSR Report, which may be downloaded from our website, www.crh.com, and we welcome your feedback. The 2005 CSR Report was independently verified by Det Norske Veritas. CRH is among the first in its sector to achieve full independent verification. The 2006 CSR Report will be published mid-2007.
Recognitions
Right: Once a year, APG’s Akron
Brick and Block plays host to
architectural students from Kent
State University near Cleveland,
Ohio. In addition to the plant tour
they receive ‘hands-on’ instruction
outlining the benefits of Belgard7
pavers, segmental retaining
walls and guidelines on masonry
installation.
Left: The CRH Euroforum provides
a regular opportunity for employee
representatives from the European
Union to discuss a wide range of
business and social issues with
company management. The
recent forum, held in the UK,
hosted employees representing 10
European countries in which CRH
has a significant presence.

42 CRH
Board of Directors
Left to right:
T.V. Neill* MA, MSc
Terry Neill became a non-executive Director in January 2004. He was, until August 2001, Senior Partner in Accenture and had been Chairman of Accenture/Andersen Consulting’s global board. He is a member of the Court of Bank of Ireland and Chair-man of Meridea Financial Software Oy. He is a member of the Governing Body of the London Business School, where he is Chair of the Finance Committee, and of the Trinity Foundation Board. (Aged 61).
J.M. de Jong*
Jan Maarten de Jong, a Dutch national, became a non-executive Director in January 2004. He is Vice Chairman of the Supervisory Board of Heineken N.V. He is a former member of the Managing Board of ABN Amro Bank N.V. and continued to be a Special Advisor to the board of that company until April 2006. He also holds a number of other directorships of European companies including Cementbouw bv, in which CRH acquired 45% of the equity as part of the Cementbouw transaction in 2003. (Aged 61).
D.W. Doyle BE, MIEManaging Director CRH Europe Materials
Declan Doyle joined CRH in 1968 and has held a number of senior management positions within the Group’s European materials businesses, including Managing Director of Irish Cement Limited and Roadstone-Wood and Regional Director with responsibility for Poland and Ukraine. He was appointed Managing Director CRH Europe Materials in January 2003
and became a CRH Board Director in January 2004. (Aged 60).
J.M.C. O’Connor* B.Soc. Sc., M.Soc. Sc., PhD
Joyce O’Connor became a non-executive Director in June 2004. She retired as President of the National College of Ireland in February 2007. She currently chairs the Digital Hub Development Agency, the National Guidance Forum and the Dublin Inner City Partnership. She is a board member of the National Centre for Partnership and Perform-ance, a Council Member of the Dublin Chamber of Commerce and an Eisenhower Fellow. (Aged 59).
M. Lee BE, FCA Finance Director
Myles Lee joined CRH in 1982. Prior to this he worked in a professional accountancy practice and in the oil industry. He was appointed General Manager Finance in 1988 and became Finance Director in November 2003. (Aged 53).
W.I. O’Mahony BE, BL, MBA, FIEI Chief Executive
Liam O’Mahony joined CRH in 1971. He has held senior management positions including Chief Operating Officer of the United States operations and Managing Director, Republic of Ireland and UK Group companies. He joined the CRH Board in 1992, was appointed Chief Executive, Oldcastle, Inc. in November 1994 and became Group Chief Executive in January 2000. He is a member of The Irish Manage-ment Institute Council and of the Harvard Business School European Advisory Board. (Aged 60).
K. McGowan* Chairman Designate
Kieran McGowan became a non-executive Director in 1998. He retired as Chief Executive of IDA Ireland in December 1998. He is a director of a number of companies including Elan Corporation plc, Enterprise Ireland, Irish Life & Permanent plc and United Drug plc. He is also Chairman of the Governing Authority of University College Dublin. (Aged 63).
T.W. Hill BA, MBA Chief Executive Officer Oldcastle, Inc.
Tom Hill joined CRH in 1980. He was appointed President of Oldcastle Materials, Inc. in 1991 and became its Chief Executive Officer in January 2000. He was appointed to his current position with effect from July 2006. A United States citizen, he is responsible for the Group’s materials, products and distribution businesses in the Americas. He was appointed a CRH Board Director in January 2002. (Aged 50).
D.M. Kennedy* MSc
David Kennedy became a non-executive Director in 1989. He is a director of a number of companies in Ireland and overseas, including The Manchester Airport Group plc, Bon Secours Health System Limited, Drury Communications Limited and Pimco Funds Global Investors Series plc. He was formerly Chief Execu-tive of Aer Lingus plc. (Aged 68).

43CRH
N. Hartery* CEng, FIEI, MBA
Nicky Hartery became a non-executive Director in June 2004. He is Vice President of Manufacturing, Business Operations and Customer Experience for Dell Europe, the Middle East and Africa. Prior to joining Dell, he was Executive Vice President at Eastman Kodak and previously held the position of President and CEO at Verbatim Corporation, based in the United States. (Aged 55).
P.J. Molloy* Chairman
Pat Molloy became Chairman of CRH in 2000 having been a non-executive Director since 1997. He is Chairman of the Blackrock Clinic and Enterprise Ireland and a director of Waterford Wedgwood plc. He retired as Group Chief Executive of Bank of Ireland in January 1998. (Aged 68).
D.N. O’Connor* BComm, FCA
Dan O’Connor became a non-executive Director in June 2006. He was, until March 2006, President and Chief Executive Officer of GE Consumer Finance - Europe and a Senior Vice-President of GE. He is a director of Allied Irish Banks, p.l.c. (Aged 47).
W.P. Egan*
Bill Egan was appointed a CRH Board Director with effect from 1st January 2007. He is founder and general partner of Alta Commun-ications, a venture capital company headquartered in Boston. He is Past President and Chairman of the National Venture Capital Association and is a trustee of the University of Pennsylvania and a member of the board of overseers of the Wharton School of Finance at the University of Pennsylvania. He is a director of Cephalon, Inc., the Irish venture capital company Delta Partners Limited and also serves on the boards of several privately held communications, cable and information technology companies. (Aged 61).
Board Committees 2006
AcquisitionsP.J. Molloy, ChairmanM. LeeK. McGowanD.N. O’ConnorW.I. O’Mahony
AuditK. McGowan, ChairmanJ.M. de JongD.N. O’ConnorJ.M.C. O’Connor
FinanceP.J. Molloy, ChairmanD.M. KennedyM. LeeW.I. O’Mahony
NominationP.J. Molloy, ChairmanN. HarteryD.M. KennedyT.V. NeillW.I. O’Mahony
RemunerationD.M. Kennedy, ChairmanN. HarteryT.V. Neill
Senior Independent
DirectorD.M. Kennedy
Pictured during a visit to Europe
Products & Distribution’s Ergon
plant in June 2006.
* Non-executive

44 CRH
Corporate Governance
CRH has primary listings on the Irish and London Stock Exchanges and its ADRs are listed on the New York Stock Exchange (NYSE).
The Directors are committed to maintaining the highest standards of corporate governance and this statement describes how CRH applies the main and supporting principles of section 1 of The Combined Code on Corporate Governance (June 2006) published by the Financial Reporting Council in the UK.
Board of Directors
Role
The Board is responsible for the leadership and control of the Company. There is a formal schedule of matters reserved to the Board for consideration and decision. This includes Board appointments, approval of strategic plans for the Group, approval of financial statements, the annual budget, major acquisitions and significant capital expenditure, and review of the Group’s system of internal controls.
The Board has delegated responsibility for the management of the Group, through the Chief Executive, to executive management. The roles of Chairman and Chief Executive are not combined and there is a clear division of responsibilities between them, which is set out in writing and has been approved by the Board. The Chief Executive is accountable to the Board for all authority delegated to executive management.
The Board has also delegated some of its responsibilities to Committees of the Board. Individual Directors may seek independent professional advice, at the expense of the Company, in the furtherance of their duties as a Director.
The Group has a policy in place which indemnifies the Directors in respect of legal action taken against them.
Membership
It is the practice of CRH that a majority of the Board comprises non-executive Directors and that the Chairman be non-executive. At present, there are four executive and nine non-executive Directors. Biographical details are set out on pages 42 and 43 . The Board considers that, between them, the Directors bring the range of skills, knowledge and experience, including international experience, necessary to lead the Company.
Directors are appointed for specified terms and subject to the Memorandum and Articles of Association of the Company.
All of the Directors bring independent judgement to bear on issues of strategy, performance, resources, key appointments and standards. The Board has determined that each of the non-executive Directors is independent. In reaching that conclusion, the Board considered the principles relating to independence contained in the Combined Code and the guidance provided by a number of shareholder voting agencies. Those principles and guidance address a number of factors that might appear to affect the independence of Directors, including former service as an executive, extended service on the Board and cross-directorships. However, they also make clear that a Director may be considered independent notwithstanding the presence of one or more of these factors. This reflects the Board’s view that independence is determined by a Director’s character, objectivity and integrity. Where relevant, the Board took account of these factors and in each case was satisfied that the Director’s independence was not compromised.
Chairman
Mr. Pat Molloy, who has been Chairman of the Group since May 2000, will retire at the
conclusion of the Annual General Meeting on 9th May 2007. He will be succeeded by Mr. Kieran McGowan, who has been a member of the Board since 1998.
The Chairman is responsible for the efficient and effective working of the Board. He ensures that Board agendas cover the key strategic issues confronting the Group; that the Board reviews and approves management’s plans for the Group; and that Directors receive accurate, timely, clear and relevant information. While Mr. Molloy and Mr. McGowan hold a number of other directorships (see details on pages 42 and 43), the Board considers that these do not interfere with the discharge of their duties to CRH.
Senior Independent Director
The Board has appointed Mr. David Kennedy as the Senior Independent Director. As commented on in the Chairman’s Statement, although Mr. Kennedy has served on the Board for more than nine years, the Board is satisfied that this does not compromise his independence. Mr. Kennedy is available to shareholders who have concerns that cannot be addressed through the Chairman, Chief Executive or Finance Director.
Company Secretary
The appointment and removal of the Company Secretary is a matter for the Board. All Directors have access to the advice and services of the Company Secretary, who is responsible to the Board for ensuring that Board procedures are complied with.
Terms of appointment
The standard terms of the letter of appointment of non-executive Directors is available, on request, from the Company Secretary.
Induction and development
New Directors are provided with extensive briefing materials on the Group and its operations. Directors meet with key executives and, in the course of twice-yearly visits by the
Board to Group locations, see the businesses at first hand and meet with local management teams.
Remuneration
Details of remuneration paid to the Directors (executive and non-executive) are set out in the Report on Directors’ Remuneration on pages 50 to 57.
Share ownership and dealing
Details of the shares held by Directors are set out on page 57.
CRH has a policy on dealings in securities that applies to Directors and senior management. Under the policy, Directors are required to obtain clearance from the Chairman and Chief Executive before dealing in CRH shares. Directors and senior management are prohibited from dealing in CRH shares during designated prohibited periods and at any time at which the individual is in possession of price-sensitive information. The policy adopts the terms of the Model Code, as set out in the Listing Rules published by the UK Listing Authority and the Irish Stock Exchange.
Performance appraisal
The Senior Independent Director conducts an annual review of corporate governance, the operation and performance of the Board and its Committees and the performance of the Chairman. This is achieved through discussion with each Director.
A review of individual Directors’ performance is conducted by the Chairman and each Director is provided with feedback gathered from other members of the Board. Performance is assessed against a number of measures, including the ability of the Director to contribute to the development of strategy, to understand the major risks affecting the Group, to contribute to the cohesion of the Board, to commit the time required to fulfil the role, and to listen to and respect the views of other Directors and the management team.

45CRH
Directors’ retirement and re-election
The Board has determined that when a non-executive Director has served on the Board for more than nine years, that Director will be subject to annual re-election. Of the remaining Directors, at least one-third retire at each Annual General Meeting and Directors must submit themselves to shareholders for re-election every three years. Re-appointment is not automatic. Directors who are seeking re-election are subject to a performance appraisal, which is overseen by the Nomination Committee.
Directors appointed by the Board must submit themselves to shareholders for election at the Annual General Meeting following their appointment.
Board succession planning
The Board plans for its own succession with the assistance of the Nomination Committee. In so doing, the Board considers the skill, knowledge and experience necessary to allow it to meet the strategic vision for the Group.
The Board engages the services of independent consultants to undertake a search for suitable candidates to serve as non-executive Directors.
Meetings
There were eight full meetings of the Board during 2006. Details of Directors’ attendance at those meetings are set out in the table on page 47. The Chairman sets the agenda for each meeting, in consultation with the Chief Executive and Company Secretary. Two visits are made each year by the Board to Group operations; one in Europe and one in North America. Each visit lasts between three and five days and incorporates a scheduled Board meeting. In 2006, these visits were to Belgium and to North Carolina, New Hampshire and Massachusetts in the United States. Additional meetings, to consider specific matters, are held when and if required. Board
papers are circulated to Directors in advance of meetings.
The non-executive Directors met three times during 2006 without executives being present.
Committees
The Board has established five permanent Committees to assist in the execution of its responsibilities. These are the Acquisitions Committee, the Audit Committee, the Finance Committee, the Nomination Committee and the Remuneration Committee. Ad hoc committees are formed from time to time to deal with specific matters.
Each of the permanent Committees has terms of reference, under which authority is delegated to them by the Board. The terms of reference are available on the Group’s website, www.crh.com. The Chairman of each Committee reports to the Board on its deliberations and minutes of all Committee meetings are circulated to all Directors.
The current membership of each Committee is set out on page 43. Attendance at meetings held in 2006 is set out in the table on page 47.
Chairmen of the Committees attend the Annual General Meeting and are available to answer questions from shareholders.
During the year each of the relevant Committees reviewed its performance and terms of reference.
The role of the Acquisitions Committee is to approve acquisitions and capital expenditure projects within limits agreed by the Board.
The Audit Committee consists of four non-executive Directors, considered by the Board to be independent. The Board has determined that Mr. Jan Maarten de Jong and Mr. Dan O’Connor are the Committee’s financial experts.
It will be seen from the Directors’ biographical details, appearing on pages 42 and 43, that the members of the Committee bring to it a wide range of experience and expertise.
The Committee met twelve times during the year under review. The Finance Director and the Head of Internal Audit normally attend meetings of the Committee, while the Chief Executive and other executive Directors attend when necessary. The external auditors attend as required and have direct access to the Committee Chairman at all times.
The main role and responsibilities are set out in written terms of reference and include:
monitoring the integrity of the Group’s financial statements and reviewing significant financial reporting issues and judgements contained therein;
reviewing the effectiveness of the Group’s internal financial controls;
monitoring and reviewing the effectiveness of the Group’s internal auditors;
making recommendations to the Board on the appointment and removal of the external auditors and approving their remuneration and terms of engagement; and
monitoring and reviewing the external auditors’ independence, objectivity and effectiveness, taking into account professional and regulatory requirements.
These responsibilities are discharged as follows:
the Committee reviews the trading statements issued by the Company in January and July;
at a meeting in February, the Committee reviews the Company’s preliminary results announcement/Annual Report and accounts. The Committee receives reports at that meeting from the external auditors
!
!
!
!
!
!
!
identifying any accounting or judgemental issues requiring its attention;
the Committee also meets with the external auditors to review the Annual Report on Form 20-F, which is filed annually with the United States Securities and Exchange Commission;
in August, the Committee reviews the interim report;
the external auditors present their audit plans in advance to the Committee;
the Committee approves the annual internal audit plan;
regular reports are received from the Head of Internal Audit on reviews carried out; and
the Head of Internal Audit also reports to the Committee on other issues including, in the year under review, progress on the implementation of Section 404 of the Sarbanes-Oxley Act 2002 and the arrangements in place to enable employees to raise concerns, in confidence, in relation to possible wrongdoing in financial reporting or other matters.
As noted above, one of the duties of the Audit Committee is to make recommendations to the Board in relation to the appointment of the external auditors. A number of factors are taken into account by the Committee in assessing whether to recommend the auditors for re-appointment. These include:
the quality of reports provided to the Audit Committee and the Board, and the quality of advice given;
the level of understanding demonstrated of the Group’s business and industry; and
the objectivity of the auditors’ views on the financial controls around the Group and their ability to co-ordinate a global audit, working to tight deadlines.
!
!
!
!
!
!
!
!
!

46 CRH
Corporate Governance continued
The Committee has put in place safeguards to ensure that the independence of the audit is not compromised. Such safeguards include:
seeking confirmation that the auditors are, in their professional judgement, independent from the Group;
obtaining from the external auditors an account of all relationships between the auditors and the Group;
monitoring the number of former employees of the external auditors currently employed in senior positions in the Group and assessing whether those appointments impair, or appear to impair, the auditors’ judgement or independence;
considering whether, taken as a whole, the various relationships between the Group and the external auditors impair, or appear to impair, the auditors’ judgement or independence; and
reviewing the economic importance of the Group to the external auditors and assessing whether that importance impairs, or appears to impair, the external auditors’ judgement or independence.
The Group has a policy governing the conduct of non-audit work by the auditors. Under that policy, the auditors are prohibited from performing services where the auditors:
may be required to audit their own work;
participate in activities that would normally be undertaken by management;
are remunerated through a ‘success fee’ structure, where success is dependent on the audit; or
act in an advocacy role for the Group.
Other than the above, the Group does not impose an automatic ban on the Group auditors
!
!
!
!
!
!
!
!
!
undertaking non-audit work. The auditors are permitted to provide non-audit services that are not, or are not perceived to be, in conflict with auditor independence, providing they have the skill, competence and integrity to carry out the work and are considered by the Committee to be the most appropriate to undertake such work in the best interests of the Group. The engagement of the external auditors to provide any non-audit services must be pre-approved by the Audit Committee or entered into pursuant to pre-approval policies and procedures established by the Committee.
The Group audit engagement partner rotates every five years. Details of the amounts paid to the external auditors during the year for audit and other services are set out in note 4 to the financial statements on page 75.
The Finance Committee advises the Board on the financial requirements of the Group and on appropriate funding arrangements.
The Nomination Committee assists the Board in ensuring that the composition of the Board and its Committees is appropriate to the needs of the Group by:
assessing the skills, knowledge, experience and diversity required on the Board and the extent to which each are represented;
establishing processes for the identification of suitable candidates for appointment to the Board; and
overseeing succession planning for the Board and senior management.
To facilitate the search for suitable candidates to serve as non-executive Directors, the Committee uses the services of independent consultants.
During 2006, the Committee identified, and recommended to the Board, a number of suitable candidates for appointment as
!
!
!
non-executive Directors, resulting in the appointment of one Director in June 2006 and another with effect from January 2007. The Committee also reviewed succession planning at senior management level in the four operating Divisions.
The Remuneration Committee, which consists solely of non-executive Directors considered by the Board to be independent:
determines the Group’s policy on executive remuneration;
determines the remuneration of the executive Directors;
monitors the level and structure of remuneration for senior management; and
reviews and approves the design of all share incentive plans.
The Committee receives advice from leading independent firms of compensation and benefit consultants when necessary and the Chief Executive is fully consulted about remuneration proposals. The Committee oversees the preparation of the Report on Directors’ Remuneration.
In 2006, the Committee determined the salaries of the executive Directors and awards under the performance-related incentive plans; set the remuneration of the Chairman; and reviewed the remuneration of senior management. It also approved the award of share options to the executive Directors and key management and oversaw the introduction of the Performance Share Plan approved by shareholders at the Annual General Meeting in May.
Corporate Social Responsibility
Corporate Social Responsibility is embedded in all CRH operations and activities. Excellence in environmental, health, safety and social performance is a daily key priority of line management. Group policies and implementation systems are summarised on pages 37 to 41
!
!
!
!
and are described in detail in the CSR Report on the Group’s website, www.crh.com. During 2006, CRH was again recognised by several key rating agencies as being among the leaders in its sector in respect of sustainability performance.
Code of Business Conduct
The CRH Code of Business Conduct is applicable to all Group employees and is supplemented by local codes throughout the Group’s operations. The Code is available on the Group’s website, www.crh.com. Regional hotline facilities are in place, to enable employees to report suspected breaches of the Code.
Communications with
shareholders
Communications with shareholders are given high priority and there is regular dialogue with institutional shareholders, as well as presentations at the time of the release of the annual and interim results. Conference calls are held following the issuance of trading statements and major announcements by the Group, which afford Directors the opportunity to hear investors’ reactions to the announcements and their views on other issues.
Trading statements are issued in January and July. Major acquisitions are notified to the Stock Exchanges in accordance with the requirements of the Listing Rules. In addition, development updates, giving details of other acquisitions completed and major capital expenditure projects, are issued in January and July each year.
During 2006, an independent survey of major institutional investors was commissioned, the results of which have been reported to the Board. The Board also received reports from management on the issues raised by investors in the course of presentations following the annual and interim results.

47CRH
The Group’s website, www.crh.com, provides the full text of the Annual and Interim Reports, the Annual Report on Form 20-F, which is filed annually with the United States Securities and Exchange Commission, trading statements and copies of presentations to analysts and investors. News releases are made available in the News & Media section of the website immediately after release to the Stock Exchanges.
The Company’s Annual General Meeting affords individual shareholders the opportunity to question the Chairman and the Board. Notice of the Annual General Meeting is sent to shareholders at least 20 working days before the meeting. At the meeting, after each resolution has been dealt with, details are given of the level of proxy votes lodged, the balance for and against that resolution and the number of abstentions. This information is made available on the Company’s website following the meeting.
In addition, the Company responds throughout the year to numerous letters from shareholders on a wide range of issues.
Internal control
The Directors have overall responsibility for the Group’s system of internal control and for reviewing its effectiveness. Such a system is designed to manage rather than eliminate the risk of failure to achieve business objectives and can provide only reasonable and not absolute assurance against material misstatement or loss.
The Directors confirm that the Group’s ongoing process for identifying, evaluating and managing its significant risks is in accordance with the updated Turnbull guidance (Internal
Control: Revised Guidance for
Directors on the Combined Code) published in October 2005. The process has been in place
throughout the accounting period and up to the date of approval of the Annual Report and financial statements and is regularly reviewed by the Board.
Group management has responsibility for major strategic development and financing decisions. Responsibility for operational issues is devolved, subject to limits of authority, to product group and operating company management. Management at all levels is responsible for internal control over the respective business functions that have been delegated. This embedding of the system of internal control throughout the Group’s operations ensures that the organisation is capable of responding quickly to evolving business risks, and that significant internal control issues, should they arise, are reported promptly to appropriate levels of management.
The Board receives, on a regular basis, reports on the key risks to the business and the steps being taken to manage such risks. It considers whether the significant
risks faced by the Group are being identified, evaluated and appropriately managed, having regard to the balance of risk, cost and opportunity. In addition, the Audit Committee meets with internal auditors on a regular basis and satisfies itself as to the adequacy of the Group’s internal control system. The Audit Committee also meets with and receives reports from the external auditors. The Chairman of the Audit Committee reports to the Board on all significant issues considered by the Committee and the minutes of its meetings are circulated to all Directors.
The Directors confirm that they have conducted an annual review of the effectiveness of the system of internal control up to and including the date of approval of the financial statements. This had regard to the material risks that could affect the Group’s business (as outlined in the Directors’ Report on pages 48 and 49), the methods of managing those risks, the controls that are in place to contain them and the procedures to monitor them.
Going concern
After making enquiries, the Directors have a reasonable expectation that the Company, and the Group as a whole, have adequate resources to continue in operational existence for the foreseeable future. For this reason, they continue to adopt the going concern basis in preparing the financial statements.
Compliance
In the period under review, CRH complied with the provisions set out in section 1 of the 2003 Combined Code on Corporate Governance and, where possible, with the amendments to that Code which are effective for accounting periods beginning on or after 1st November 2006. The Company also complied with the rules issued by the United States Securities and Exchange Commission to implement the Sarbanes-Oxley Act 2002, in so far as they apply to the Group.
Attendance at Board and Board Committee meetings during the year ended 31st December 2006
Board Acquisitions Audit Finance Nomination Remuneration
A B A B A B A B A B A B
D.W. Doyle 8 8
N. Hartery 8 7 5 4 9 8
T.W. Hill 8 6
J.M. de Jong 8 8 12 12
D.M. Kennedy 8 8 1 1 8 8 2 2 3 3 5 5
M. Lee 8 8 1 1 3 3
K. McGowan 8 7 1 1 12 12
P.J. Molloy 8 8 1 1 3 3 5 5
T.V. Neill 8 8 5 5 9 9
A. O’Brien*** 2 2 1 1 2 2 4 4
D.N. O’Connor* 4 4 4 4
J.M.C. O’Connor 8 8 12 10
W.I. O’Mahony 8 8 1 1 3 3 5 5
J.L. Wittstock** 2 0
Column A - indicates the number of meetings held during the period the Director was a member of the Board and/or Committee.
Column B - indicates the number of meetings attended during the period the Director was a member of the Board and/or
Committee.
* Appointed 28th June 2006
** Resigned 26th April 2006
*** Retired 3rd May 2006

48 CRH
Directors’ Report
The Directors submit their Report and Financial Statements for the year ended 31st December 2006.
Accounts and dividends
Sales revenue at §18,737 million was 30% higher than in 2005. Profit before tax amounted to §1,602 million, an increase of §323 million (25%) on the previ-ous year. After providing for tax, Group profit for the financial year amounted to §1,224 million (2005 : §1,006 million). Basic earnings per share amounted to 224.3c compared with 186.7c in the previous year, an increase of 20%.
An interim dividend of 13.5c (2005 : 11.25c) per share was paid in No-vember 2006. It is proposed to pay a final dividend of 38.5c per share on 14th May 2007 to sharehold-ers registered at close of business on 16th March 2007. The total dividend of 52.0c compares with a dividend of 39.0c for 2005, an increase of 33%. Shareholders will have the option of receiving new shares in lieu of cash dividends.
Other net expense recognised directly within equity in the year amounted to §232.7 million (2005 : net income of §363.3 million).
Some key financial perform-ance indicators are set out in the Finance Review on pages 32 to 36. The financial statements for the year ended 31st December 2006 are set out in detail on pages 60 to 115.
Books and records
The Directors are responsible for ensuring that proper books and accounting records, as outlined in Section 202 of the Companies Act, 1990, are kept by the Company. The Directors have appointed ap-propriate accounting personnel, including a professionally quali-fied Finance Director, in order to ensure that those requirements are met.
The books and accounting records of the Company are maintained at the principal executive offices located at Belgard Castle, Clondalkin, Dublin 22.
Business review
Full year net acquisition spend amounted to approximately §2.1 billion. This was ahead of the §1.3 billion expenditure in 2005.
CRH completed its largest acquisi-tion to date during 2006, with the §1 billion ($1.3 billion) purchase in August of APAC, an integrated aggregates and asphalt business in the Mid-West and South regions of the United States. The Group also expanded its construction accessories and metal products op-erations during 2006 with the §280 million purchase in April of MMI, a leading United States manufac-turer and distributor of building products used by the residential, non-residential and infrastructure construction sectors, followed in May by the acquisition of Europe’s leading construction accessories company Halfen for §170 million. In addition to these major transac-tions, the Group invested in a total of 66 other acquisitions during 2006. These investments were well spread in terms of geographic loca-tion and product grouping and will further consolidate the strength of CRH’s position in key markets, while providing some extensions of existing markets.
All four of the Group’s Divisions achieved significant profit ad-vances in 2006, with strong organic growth and significant contribu-tions from acquisitions. Compre-hensive reviews of the develop-ment and financial and operating performance of the Group during 2006 are set out in the Chief Ex-ecutive’s Review on pages 9 to 11, the separate Operations Reviews for each of the Divisions on pages 12 to 31 and the Finance Review on pages 32 to 36 (including Key Financial Performance Indicators on page 34). The treasury policy and objectives of the Group are set out in note 23 to the financial statements.
The Group is fully committed to operating ethically and respon-sibly in all aspects of its business relating to employees, customers, neighbours and other stakeholders.
The Corporate Responsibility report on pages 37 to 41 sets out the Group’s policies and performance in 2006 relating to the Environ-ment, Health & Safety and Social & Community matters.
Outlook 2007
2006 was another year of delivery by CRH both in development, with a record acquisition spend, and operationally, with record organic growth and strong im-provements in all key financial performance measures. Cash gen-eration remains robust and with comfortable interest cover the Group can accommodate a higher level of dividend payout while continuing to take advantage of a strong development pipeline. With an ongoing focus on price and cost effectiveness across our operations, further benefits from the record 2006 acquisition spend and a sustained emphasis on de-velopment, we expect to achieve further progress in the year ahead.
Principal risks and uncertainties
Under Irish company law (Regulation 37 of the European Communities (Companies: Group Accounts) Regulations 1992, as amended) the Group is required to give a description of the principal risks and uncertainties which it faces. These principal risks are set out below.
CRH operates in cyclical in-dustries which are affected by factors beyond Group control such as the level of construc-tion activity, fuel and raw ma-terial prices, which are in turn affected by the performance of national economies, the imple-mentation of economic policies by sovereign governments and political developments.
The onset of a cycle of reduced economic growth in the countries in which CRH has significant operations or the implementation of unfavour-able governmental policies could adversely affect Group revenues and operating margins.
!
!
CRH pursues a strategy of growth through acquisitions. CRH may not be able to continue to grow as contem-plated in its business plan if it is unable to identify attractive targets, complete the acquisi-tion transactions and integrate the operations of the acquired businesses.
CRH faces strong competition in its various markets, and if CRH fails to compete suc-cessfully, market share may decline.
Existing products may be re-placed by substitute products which CRH does not produce and, as a result, CRH may lose market share in the markets for these products.
Severe weather can reduce construction activity and lead to a decrease in demand for Group products in areas affected by adverse weather conditions.
CRH is subject to stringent environmental and health and safety laws, regulations and standards which could result in costs related to compliance and remediation efforts that may adversely affect Group results of operations and finan-cial condition.
CRH may be adversely affected by governmental regulations.
Many of CRH’s subsidiaries op-erate in currencies other than the euro, and adverse changes in foreign exchange rates relative to the euro could ad-versely affect Group reported earnings and cash flow.
The Group has long experience of coping with these risks while delivering superior performance and strong Total Shareholder Return.
Board of Directors
Mr. J.L. Wittstock resigned from the Board on 26th April 2006. Mr. A. O’Brien retired from the Board on 3rd May 2006.
!
!
!
!
!
!
!

49CRH
Mr. P.J. Molloy retires from the Board by rotation and does not seek re-election. Mr. T.V. Neill and Mr. W.I. O’Mahony retire from the Board by rotation and, being eligible, offer themselves for re-election.
Mr. D.N. O’Connor was appointed to the Board on 28th June 2006 and Mr. W.P. Egan was appointed to the Board with effect from 1st January 2007. In accordance with the provisions of Article 109, they retire and, being eligible, offer themselves for re-election.
To comply with the provision of the Combined Code on Corporate Governance (June 2006) that non-executive directors may serve more than nine years, subject to annual re-election, Mr. D.M. Kennedy retires and, being eligi-ble, offers himself for re-election.
Disapplication of pre-emption
rights
A special resolution will be proposed at the Annual General Meeting to renew the Directors’ authority to disapply statutory pre-emption rights in relation to allotments of shares for cash. In respect of allotments other than for rights issues to ordinary share-holders and employees’ share schemes, the authority is limited to Ordinary/Income Shares hav-ing a nominal value of §9,228,000, representing 5% approximately of the issued Ordinary/Income share capital at 5th March 2007. This authority will expire on the earlier of the date of the Annual General Meeting in 2008 or 8th August 2008.
Purchase of own shares
Special resolutions will be proposed at the Annual General Meeting to renew the author-ity of the Company, or any of its subsidiaries, to purchase up to 10% of the Company’s Ordinary/In-come Shares in issue at the date of the Annual General Meeting and in relation to the maximum and minimum prices at which treasury shares (effectively shares purchased and not cancelled) may
be re-issued off-market by the Company. If granted, the authori-ties will expire on the earlier of the date of the Annual General Meet-ing in 2008 or 8th August 2008.
The minimum price which may be paid for shares purchased by the Company shall not be less than the nominal value of the shares and the maximum price will be 105% of the average mar-ket price of such shares over the preceding five days. Options to subscribe for a total of 24,995,867 Ordinary/Income Shares are outstanding, representing 4.60% of the issued Ordinary/Income share capital. If the authority to purchase Ordinary/Income Shares was used in full, the op-tions would represent 5.12%.
A change is being proposed to the Articles of Association of the Company to provide for the re-issue of treasury shares where options are exercised under the Group’s option schemes. If shares are re-issued under the option schemes which have been approved by shareholders in General Meeting, the price will be determined by the rules of such schemes. If shares are re-issued in any other circumstances the price may not be more than 5% below or 20% above the average price of the shares on the Irish Stock Exchange for the previous five business days.
The Directors do not have any current intention of exercising the power to purchase the Company’s own shares other than to match exercises of share options under the Group’s option schemes over the course of the year, if appro-priate. The Directors will only exercise the power to purchase shares if they consider it to be in the best interests of the Company and its shareholders. The author-ity granted at the Annual General Meeting in 2006 to purchase up to 53,942,547 of the Company’s Ordinary/Income Shares has not been exercised.
Corporate governance
Statements by the Directors in relation to the Company’s ap-pliance of corporate governance principles, compliance with the provisions of section 1 of The Combined Code on Corporate Governance (June 2006), the Group’s system of internal con-trols and the adoption of the going concern basis in the preparation of the financial statements are set out on pages 44 to 47.
The Report on Directors’ Remuner-ation is set out on pages 50 to 57.
Subsidiary, joint venture and
associated undertakings
The Group has over 950 subsidi-ary, joint venture and associated undertakings. The principal ones as at 31st December 2006 are listed on pages 128 to 132.
Auditors
The Auditors, Ernst & Young, Chartered Accountants, are will-ing to continue in office and a resolution authorising the Directors to fix their remunera-tion will be submitted to the Annual General Meeting.
Annual General Meeting
Your attention is drawn to the Notice of Meeting set out on pages 135 and 136.
Your Directors believe that the Resolutions to be proposed at the Meeting are in the best interests of the Company and its shareholders as a whole and, therefore, recom-mend you to vote in favour of the Resolutions. Your Directors intend to vote in favour of the Resolu-tions in respect of their own bene-ficial holdings of Ordinary Shares, amounting in total, on 5th March 2007, to 1,317,181 Ordinary Shares, representing approximately 0.24% of the issued Ordinary share capital of your Company.
On behalf of the Board, P.J. Molloy, W.I. O’Mahony, Directors 5th March 2007
Substantial holdings
As at 5th March 2007, the Company had received notification of the following interests in its Ordinary share capital:
Name Holding %
Bank of Ireland Asset Management Limited 37,933,084 6.98
The Capital Group Companies, Inc. and its affiliates 26,314,940 4.84
UBS AG 26,380,604 4.86
Bank of Ireland Asset Management Limited and The Capital Group Companies, Inc. and its affiliates state that these shares are not beneficially owned by them.

50 CRH
Report on Directors’ Remuneration
The Remuneration Committee
The Remuneration Committee of the Board consists of non-executive Directors of the Company. The terms of reference for the Remuneration Committee are to determine the Group’s policy on executive remuneration and to consider and approve salaries and other terms of the remuneration packages for the executive Directors. The Committee receives advice from leading independent firms of compensation and benefit consultants when necessary and the Chairman of the Board and the Chief Executive attend meetings except when their own remuneration is being discussed. Membership of the Remuneration
Committee is set out on page 43.
Remuneration policy
CRH is an international group of companies, with activities in 27 countries. Our policy on Directors’ remuneration is designed to attract and retain Directors of the highest calibre who can bring their experience and independent views to the policy, strategic decisions and governance of CRH.
In setting remuneration levels, the Remuneration Committee takes into consideration the remuneration practices of other international companies of similar size and scope. Executive Directors must be properly rewarded and motivated to perform in the best interest of the shareholders. The spread of the Group’s operations requires that the remuneration packages in place in each geographical area are appropriate and competitive for that area.
Performance-related rewards, based on measured targets, are a key component of remuneration. CRH’s strategy of fostering entrepreneurship in its regional companies requires well designed incentive plans that reward the creation of shareholder value through organic and acquisitive growth. The typical elements of the
remuneration package for executive Directors have been basic salary and benefits, a performance-related incentive plan, a contributory pension scheme and participation in the share option plan. It is policy to grant options to key management to encourage identification with shareholders’ interests and to create a community of interest among different regions and nationalities.
The Group also operates share participation plans and savings-related share option schemes for eligible employees in all regions where the regulations permit the operation of such plans. In total there are approximately 6,500 employees of all categories who are shareholders in the Group.
Review of compensation
arrangements
During 2005, the Remuneration
Committee, with the assistance of external advisers, undertook a thorough review of the Group’s compensation arrangements for executive Directors and senior managers, the structure of which had been largely unchanged since the 1990s. The review took account of the global nature of the Group’s business; the success of the Group in continuing its record of performance and growth as a world industry leader; the need to have competitive compensation packages which will attract and retain international managers of the highest calibre; changes in the accounting treatment of long-term incentive schemes and developments in market practice in relation to these schemes.
Arising from this review, the Remuneration Committee agreed changes to the executive Directors’ performance-related incentive plan and concluded that the Group should introduce a Performance Share Plan, which was approved by shareholders at the Annual General Meeting in May 2006. Details of the new performance-related incentive plan and the Performance Share Plan are provided below.
Executive Directors’
remuneration
Basic salary and benefits
The basic salaries of executive Directors are reviewed annually having regard to personal performance, company performance, step changes in responsibilities and competitive market practice in the area of operation. Employment-related benefits relate principally to the use of company cars and medical/life assurance. No fees are payable to executive Directors.
Performance-related
incentive plan
Under the provisions of the 2005 performance-related incentive plan, cash bonuses could be paid of up to a maximum of 75% and 90% of basic salary for European and US participants respectively for meeting clearly defined and stretch profit targets and strategic goals. This plan comprised five separate components based on annual and rolling three-year performance targets and all earnings under the plan were paid out when earned.
With effect for 2006 and subsequent years, the performance-related incentive plan is totally based on achieving clearly defined and stretch annual profit targets and strategic goals with an approximate weighting of 80% for profits and 20% for personal and strategic goals. At target performance payout is 80% of basic salary for Europe-based participants and 90% of basic salary for US-based participants. A maximum payout of 1.5 times these levels is payable for a level of performance well in excess of target.
The three components of the plan are:
(i) Individual performance.
(ii) Earnings per share growth targets.
(iii) Return on net assets targets.
In view of the increased potential awards, the Remuneration
Committee has decided that going forward up to one-third of the
earned bonus in each year should be receivable in CRH shares and deferred for a period of three years, with forfeiture in the event of departure from the Group in certain circumstances during that time period.
In addition, the Chief Executive had a special long-term incentive plan incorporating targets set for the two-year period 2005-2006. This has now been amended to apply for the four-year period 2005-2008 as a result of the Chief Executive agreeing, at the request of the Board, to continue in office until 2008. The plan incorporates challenging goals in respect of Total Shareholder Return by comparison with a peer group, growth in earnings per share and the strategic development of the Group, with a total maximum earnings potential of 40% of aggregate basic salary. While accruals are made on an annual basis, there is no commitment to any payment until the end of the period. Details of the manner in which earnings are provided for under the plan are set out in note 2 to Directors’ remuneration on page 52.
Performance Share Plan/Share
Option Scheme
Long-term incentive plans involving conditional awards of shares are now a common part of executive remuneration packages, motivating high performance and aligning the interests of executives and shareholders. The Performance Share Plan approved by shareholders in May 2006 is tied to Total Shareholder Return (TSR). Half of the award is assessed against TSR for a group of global building materials companies and the other half against TSR for the constituents of the Eurofirst 300 Index. An earnings per share growth underpin of the Irish Consumer Price Index plus 5% per annum is also applied.
The maximum award under the Performance Share Plan is 150%

51CRH
of basic salary per annum in the form of conditional shares and the vesting period is three years. The awards lapse if over the three-year period CRH’s TSR is below the median of the peer group/index; 30% of the award vests if CRH’s performance is equal to the median while 100% vests if CRH’s performance is equal to or greater than the 75th percentile; for TSR performance between the 50th and the 75th percentiles, between 30% and 100% of the award vests on a straight-line basis. Participants in the Plan are not entitled to any dividends (or other distributions made) and have no right to vote in respect of the shares subject to the award, until such time as the shares vest.
The first awards under the Performance Share Plan were made in June 2006 following approval of the Plan by shareholders. Details of the awards to Directors are provided on page 54. It is intended that future awards will be granted annually in April of each year.
The Remuneration Committee believes that the introduction of the Performance Share Plan, to reflect changing market practices for companies of a similar size and complexity with large operations in Europe and the United States, will ensure that CRH can continue to recruit, retain and motivate high quality executives across its global areas of operation.
Under the terms of the share option scheme approved by shareholders on 3rd May 2000, two tiers of options have been available subject to different performance conditions as set out below:
(i) Exercisable only when earnings per share (EPS) growth exceeds the growth of the Irish Consumer Price Index by 5% compounded over a period of at least three years subsequent to the granting of the options (Basic Tier).
(ii) Exercisable, if over a period of at least five years subsequent to the granting of the options, the growth in EPS exceeds the growth of the Irish Consumer Price Index by 10% compounded and places the Company in the top 25% of EPS performance of a peer group of international building materials companies. If below the 75th percentile, these options are not exercisable (Second Tier).
In the light of the introduction of the Performance Share Plan, the Remuneration Committee has decided that no further Second Tier share options will be granted under the existing share option scheme; however, Basic Tier options will continue to be issued. Subject to satisfactory performance, options are expected to be awarded annually, ensuring a smooth progression over the life of the share option scheme. Grants of share options are at the market price of the Company’s shares at the time of grant, and are made after the final results announcement ensuring transparency.
The percentage of share capital which can be issued under the Performance Share Plan and share option schemes, and individual share option grant limits, comply with institutional guidelines.
Non-executive Directors’
remuneration
The remuneration of non-executive Directors, including that of the Chairman, is determined by the Board of Directors as a whole. The fees paid to the Chairman and non-executive Directors are set at a level which will attract individuals with the necessary experience and ability to make a substantial contribution to the Company’s affairs and reflect the time and travel demands of their Board duties. They do not participate in any of the Company’s performance-related incentive plans or share schemes.
Pensions
The Irish-based executive Directors participate in a contributory defined benefit plan based on an accrual rate of 1/60th of pensionable salary for each year of pensionable service and is designed to provide two-thirds of salary at retirement for full service. There is provision for Mr. Doyle and Mr. Lee to retire at 60 years of age, while Mr. O’Mahony’s pension is fully funded, under arrangements which provided for his retirement on two-thirds salary at completion of five years in the role of Chief Executive at end 2004.
The Irish Finance Act 2006 effectively established a cap on pension provision by introducing a penalty tax charge on pension assets in excess of the higher of §5 million or the value of individual prospective pension entitlements as at 7th December 2005. As a result of these legislative changes, the Remuneration Committee has decided that Irish-based executive Directors should have the option of continuing to accrue pension benefits as previously, or of choosing an alternative arrangement – by accepting pension benefits limited by the cap – with a similar overall cost to Group. The three Irish-based executive Directors have chosen to opt for the alternative arrangement which involves capping their pensions in line with the provisions of the Finance Act and receiving a supplementary taxable non-pensionable cash allowance in lieu of prospective pension benefits foregone. These allowances are similar in value to the reduction in the Company’s liability represented by the pension benefits foregone. They are calculated based on actuarial advice as the equivalent of the reduction in the Company’s liability to each individual and spread over the term to retirement as annual compensation allowances. The allowances for 2006 are detailed in note (ii) on page 53.
Mr. Hill participates in a defined contribution retirement plan in respect of basic salary; he also participates in an unfunded defined contribution Supplemental Executive Retirement Plan (SERP) also in respect of basic salary, to which contributions are made at an agreed rate, offset by contributions made to the other retirement plan.
Since 1991, it has been your Board’s policy that non-executive Directors do not receive pensions. A defined benefit scheme was in operation prior to 1991 in which one current non-executive Director still participates.
Directors’ Service Contracts
No executive Director has a service contract extending beyond twelve months.
Directors’ Remuneration and
Interests in Share Capital
Details of Directors’ remuneration charged against profit in the year are given on page 52. Details of individual remuneration and pension benefits for the year ended 31st December 2006 are given on page 53. Directors’ share options and shareholdings are shown on page 55 and page 57 respectively.

52 CRH
Report on Directors’ Remuneration continued
Directors’ Remuneration 2006 2005Notes §000 §000 Executive Directors Basic salary 3,306 3,473 Performance-related incentive plan - cash element 2,669 2,220 - deferred shares element 905 - Retirement benefits expense 497 508 Other remuneration 43 130 Benefits 104 115
1 7,524 6,446 2 Provision for Chief Executive long-term incentive plan 496 462
Total executive Directors’ remuneration 8,020 6,908
Average number of executive Directors 4.32 5.00
Non-executive Directors Fees 455 417 Other remuneration 501 474
1 Total non-executive Directors’ remuneration 956 891
Average number of non-executive Directors 7.85 8.34
3 Payments to former Directors 95 127
Total Directors’ remuneration 9,071 7,926
Notes to Directors’ remuneration
1 See analysis of 2006 remuneration by individual on page 53.
2 As set out on page 50, the Chief Executive has a special long-term incentive plan tied to the achievement of exceptional growth and key strategic goals for the four-year period 2005 to 2008 with a total maximum earnings potential of 40% of aggregate basic salary. While accruals are made on an annual basis, there is no commitment to any payment until the end of the four-year period.
3 Consulting and other fees paid to a number of former directors.

53CRH
Individual remuneration for the year ended 31st December 2006
Incentive Plan Retirement Basic salary Cash Deferred benefits Other and fees element shares expense Remuneration Benefits Total Total (i) (i) (ii) (iii) (iv) 2006 2005 §000 §000 §000 §000 §000 §000 §000 §000Executive DirectorsD. W. Doyle 575 641 - 104 - 24 1,344 1,029 T.W. Hill 733 638 288 147 - 19 1,825 1,272 M. Lee 560 430 187 209 - 25 1,411 993 W. I. O’Mahony 1,240 960 430 - - 26 2,656 1,925 J.L. Wittstock (v) 198 - - 37 43 10 288 1,227
3,306 2,669 905 497 43 104 7,524 6,446
Non-executive Directors N. Hartery 58 - - - 17 - 75 65 J.M. de Jong 58 - - - 17 - 75 65 D. M. Kennedy 58 - - - 45 - 103 74 K. McGowan 58 - - - 46 - 104 90 P. J. Molloy 58 - - - 317 - 375 350 T. V. Neill 58 - - - 17 - 75 65 A. O’Brien (vi) 20 - - - 16 - 36 90 D.N. O’Connor (vii) 29 - - - 9 - 38 - J.M.C. O’Connor 58 - - - 17 - 75 65 W. P. Roef (viii) - - - - - - - 27
455 - - - 501 - 956 891
(i) Performance-related Incentive Plan Under the executive Directors’ incentive plan for 2006, a bonus is payable for meeting clearly defined and stretch profit targets and strategic goals. The structure of the 2006 incentive plan is set out on page 50 and includes a cash element paid out when earned and an element receivable in CRH shares deferred for a period of three years, with forfeiture in the event of departure from the Group in certain circumstances during that time period.
(ii) Retirement benefits expense The Irish Finance Act 2006 effectively established a cap on pension provision by introducing a penalty tax charge on pension assets in excess of the higher of §5 million or the value of individual prospective pension entitlements as at 7th December 2005. As a result of these legislative changes, the Remuneration Committee has decided that Irish-based executive Directors should have the option of continuing to accrue pension benefits as previously, or of choosing an alternative arrangement - by accepting pension benefits limited by the cap - with a similar overall cost to the Group. The three Irish-based executive Directors have chosen to opt for the alternative arrangement which involves capping their pensions in line with the provisions of the Finance Act and receiving a supplementary taxable non-pensionable cash allowance, in lieu of prospective pension benefits foregone. These allowances are similar in value to the reduction in the Company’s liability represented by the pension benefit foregone. They are calculated based on actuarial advice as the equivalent of the reduction in the Company’s liability to each individual and spread over the term to retirement as annual compensation allowances. For 2006 the compensation allowances amount to §104,000 for Mr. Doyle; §209,000 for Mr. Lee and §680,000 for Mr. O’Mahony. Mr. O’Mahony has waived his right to equivalent prospective benefit entitlements from his benefit plan arrangements, which were fully funded at end-2004, and as a result no net pension-related expense arises in his respect.
(iii) Other Remuneration Executive Director: Expatriate and housing allowance for Mr. Wittstock. Non-executive Directors: Includes remuneration for Chairman and for Board Committee work.
(iv) Benefits These relate principally to the use of company cars and medical/life assurance.
(v) Mr. J.L. Wittstock resigned on 26th April 2006.
(vi) Mr. A. O’Brien retired on 3rd May 2006.
(vii) Mr. D.N. O’Connor became a a Director on 28th June 2006.
(viii) Mr. W.P. Roef retired on 4th May 2005.

54 CRH
Report on Directors’ Remuneration continued
Pension entitlements - defined benefit Increase in Transfer value Total accrued accrued of increase in personal personal pension dependents’ pension at during 2006 pension year-end (i) (i) (ii)Executive Directors §000 §000 §000D. W. Doyle - 53 349M. Lee - 41 241W. I. O’Mahony - - 770
Non-executive DirectorD. M. Kennedy 1 10 21
(i) As noted on page 53, the pensions of Mr. Doyle, Mr. Lee and Mr. O’Mahony have been capped in line with the provisions of the Finance Act 2006 and Mr. O’Mahony’s pension arrangements were fully funded as at end-2004. As a result no further personal pension benefit accrues other than in respect of the transfer value of increases in dependents’ pensions in the case of Mr. Doyle and Mr. Lee.
These transfer values have been calculated on the basis of actuarial advice. These transfer values do not represent sums paid or due, but are the amounts that the pension scheme would transfer to another pension scheme in relation to the benefits accrued in 2006 in the event of the member leaving service.
(ii) Accrued pension shown is that which would be paid annually on normal retirement date and is unchanged from year-end 2005.
Pension entitlements - defined contribution
The accumulated liability related to the unfunded Supplemental Executive Retirement Plan for Mr. T.W. Hill and Mr. J.L. Wittstock is as follows:
As at 31st 2006 As at 31st December 2006 notional Translation December 2005 contribution interest adjustment 2006
§000 §000 §000 §000 §000Executive Directors (iii) T.W. Hill 753 123 46 (86) 836J.L. Wittstock (iv) 793 32 16 (86) 755
(iii) Notional interest, which is calculated based on the average bid yields of United States Treasury fixed-coupon securities with remaining terms to maturity of approximately 20 years, plus 1.5%, is credited to the individual accounts each year.
(iv) Mr. J.L. Wittstock resigned on 26th April 2006. The balance of §755,000 above reflects the accumulated liability as at that date.
Directors’ awards under the Performance Share Plan (v)
Initial Market Number at allocation price in euro Number at 1st January shares on award Performance Release 31st December 2006 during 2006 date period date 2006
Executive Directors (vi)D. W. Doyle - - - - - -T.W. Hill - 30,000 24.82 01/01/06 - 31/12/08 March 2009 30,000 M. Lee - 20,000 24.82 01/01/06 - 31/12/08 March 2009 20,000 W. I. O’Mahony - 60,000 24.82 01/01/06 - 31/12/08 March 2009 60,000
- 110,000 24.82 110,000
(v) Performance Share Plan This is a long-term share incentive plan under which share awards are granted in the form of a provisional
allocation of shares for which no exercise price is payable. The shares are scheduled for release in March 2009 to the extent that the relative TSR performance conditions are achieved. The structure of the Performance Share Plan is set out on pages 50 and 51.
(vi) The Trustees of the CRH plc Employee Benefit Trust purchased Ordinary Shares at §24.82 per share on 21st June 2006 in respect of the above allocation. No dividends are payable on these shares until such time as they are released to plan participants.

55CRH
Directors’ interestsThe Company’s Register of Directors’ Interests contains full details of Directors’ shareholdings and options to subscribe for shares.
Directors’ share optionsDetails of movements on outstanding options and those exercised during the year are set out in the table below:
Options exercised during 2006
Weighted average Weighted Weighted option price at average average market 31st December Granted Exercised 31st December 31st December exercise price at date 2005 in 2006 in 2006 2006 2006 price of exercise § § §
D.W. Doyle 77,943 - 16,467 61,476 (a) 15.48 7.09 27.90 79,042 - 32,934 46,108 (b) 15.66 7.09 27.90 185,000 - - 185,000 (c) 15.90 56,000 - - 56,000 (d) 19.28 1,128 - 1,128 - (e) 10.63 26.74 T.W. Hill 54,890 - 54,890 - (a) 18.01 26.95 82,335 - - 82,335 (b) 18.01 230,000 50,000 110,000 170,000 (c) 22.07 16.00 27.11 195,000 - - 195,000 (d) 17.07 M. Lee 67,899 - 27,445 40,454 (a) 17.26 13.80 26.95 70,863 - 57,635 13,228 (b) 17.26 10.98 26.95 175,000 30,000 10,000 195,000 (c) 19.68 13.15 29.31 125,000 - - 125,000 (d) 16.48 1,211 - - 1,211 (e) 16.09 W.I. O’Mahony 285,428 - 82,335 203,093 (a) 14.77 6.53 28.16 323,851 - 82,335 241,516 (b) 13.07 6.53 28.16 320,000 200,000 - 520,000 (c) 20.30 250,000 - - 250,000 (d) 18.84
2,580,590 280,000 475,169 2,385,421

56 CRH
Report on Directors’ Remuneration continued
Options by price
31st December Granted Exercised 31st December Earliest § 2005 in 2006 in 2006 2006 exercise date Expiry date
6.5347 82,335 - 82,335 - (a) 6.5347 82,335 - 82,335 - (b) 7.0899 16,467 - 16,467 - (a) 7.0899 54,890 - 54,890 - (b) 7.1015 27,445 - - 27,445 (a) March 2007 April 2007 7.1015 54,890 - - 54,890 (b) March 2007 April 2007 12.6416 53,792 - 10,978 42,814 (a) March 2007 April 2008 12.6416 84,531 - 21,956 62,575 (b) March 2007 April 2008 14.5652 30,738 - 16,467 14,271 (a) March 2007 April 2009 14.5652 27,994 - 13,723 14,271 (b) March 2007 April 2009 14.6563 38,423 - - 38,423 (a) March 2007 April 2009 14.6563 76,846 - - 76,846 (b) March 2007 April 2009 17.2615 182,070 - - 182,070 (a) March 2007 April 2010 17.2615 92,270 - - 92,270 (b) April 2010 18.0084 54,890 - 54,890 - (a) 18.0084 82,335 - - 82,335 (b) April 2010 18.28 235,000 - 60,000 175,000 (c) March 2007 April 2011 18.28 251,000 - - 251,000 (d) April 2011 19.68 195,000 - 195,000 (c) March 2007 April 2012 19.68 215,000 - - 215,000 (d) April 2012 13.15 180,000 - 10,000 170,000 (c) March 2007 April 2013 13.15 40,000 - - 40,000 (d) April 2013 13.26 50,000 - 50,000 - (c) March 2007 April 2013 13.26 50,000 - - 50,000 (d) April 2013 16.71 130,000 - - 130,000 (c) April 2007 April 2014 16.71 35,000 - - 35,000 (d) April 2014 16.73 35,000 - - 35,000 (c) April 2007 April 2014 16.73 35,000 - - 35,000 (d) April 2014 20.79 50,000 - - 50,000 (c) April 2015 20.91 35,000 - - 35,000 (c) April 2015 29.00 - 80,000 - 80,000 (c) April 2016 24.83 - 200,000 - 200,000 (c) June 2016 16.09 1,211 - - 1,211 (e) June 2007 November 2007 10.63 1,128 - 1,128 - (e)
2,580,590 280,000 475,169 2,385,421
No options lapsed during the year.
The market price of the Company’s shares at 31st December 2006 was §31.54 and the range during 2006 was §22.65 to §31.82.
Mr. J.L. Wittstock resigned from the Board on 26th April 2006. His options have, therefore, been omitted from the table above.
(a) Granted under the 1990 share option scheme, these options are only exercisable when earnings per share (EPS) growth exceeds the growth of the Irish Consumer Price Index over a period of at least three years subsequent to the granting of the options.
(b) Granted under the 1990 share option scheme, these options are only exercisable if, over a period of at least five years subsequent to the granting of the options, the growth in EPS would place the Company in the top 25% of the companies listed in the FTSE 100 Stock Exchange Equity Index.
(c) Granted under the 2000 share option scheme, these options are only exercisable when EPS growth exceeds the growth of the Irish Consumer Price Index by 5% compounded over a period of at least three years subsequent to the granting of the options.
(d) Granted under the 2000 share option scheme, these options are only exercisable if, over a period of at least five years subsequent to the granting of the options, the growth in EPS exceeds the growth of the Irish Consumer Price Index by 10% compounded and places the Company in the top 25% of EPS performance of a peer group of international building materials companies. If below the 75th percentile, these options are not exercisable.
(e) Granted under the 2000 savings-related share option scheme.

57CRH
Directors’ interests in share capital at 31st December 2006
The interests of the Directors and Secretary in the shares of the Company as at 31st December 2006, which are beneficial unless otherwise indicated, are shown below. The Directors and Secretary have no beneficial interests in any of the Group’s subsidiary, joint venture or associated undertakings.
Ordinary Shares 31st December 31st December 2006 2005Directors D.W. Doyle 190,317 183,649N. Hartery 1,000 1,000T.W. Hill 78,744 * 72,183 *J.M. de Jong 3,084 3,049D.M. Kennedy 57,388 55,925- Non-beneficial 9,250 9,250M. Lee 225,904 205,428K. McGowan 7,915 7,822P.J. Molloy 13,347 13,191T.V. Neill 59,031 51,031D.N. O’Connor 7,278 - **J.M.C. O’Connor 1,000 1,000W.I. O’Mahony 662,173 497,004SecretaryA. Malone 28,463 27,654
1,344,894 1,128,186
There were no transactions in the above Directors’ and Secretary’s interests between 31st December 2006 and 5th March 2007.
Mr. W.P. Egan became a Director on 1st January 2007 and his holding at that date is set out below. There were no transactions between 1st January and 5th March 2007.
1st January 2007W.P. Egan 10,000 ***
* Mr. T.W. Hill’s shareholding as at 31st December 2006 and 31st December 2005 includes 21,726 shares which are held in the form of American Depository Receipts (ADRs). One ADR represents one Ordinary Share of the Company.
** Mr. D.N. O’Connor’s holding at the date of his appointment was 7,253 shares.
*** Mr. Egan’s shareholding as at 1st January 2007 includes 5,000 shares which are held in the form of ADRs.

58 CRH
Company law in the Republic of Ireland requires the Directors to prepare financial statements for each financial year which give a true and fair view of the state of affairs of the Parent Company and of the Group and of the profit or loss of the Group for that period.
In preparing the financial statements of the Group, the Directors are required to:
select suitable accounting policies and then apply them consistently;
make judgements and estimates that are reasonable and prudent;
comply with applicable International Financial Reporting Standards as adopted by the European Union, subject to any material departures disclosed and explained in the financial statements; and
prepare the financial statements on the going concern basis unless it is inappropriate to presume that the Group will continue in business.
The considerations set out above for the Group are also required to be addressed by the Directors in preparing the financial statements of the Parent Company (which are set out on pages 113 to 115), in respect of which the applicable accounting standards are those which are generally accepted in the Republic of Ireland.
The Directors have elected to prepare the Parent Company’s financial statements in accordance with generally accepted accounting practice in Ireland (Irish GAAP) comprising the financial reporting standards issued by the Accounting Standards Board and published by the Institute of Chartered Accountants in Ireland, together with the Companies Acts, 1963 to 2006.
The Directors are responsible for keeping proper books of account which disclose with reasonable accuracy at any time the financial position of the Parent Company and which enable them to ensure that the financial statements of the Group are prepared in accordance with applicable International Financial Reporting Standards as adopted by the European Union and comply with the provisions of the Companies Acts, 1963 to 2006, and Article 4 of the IAS Regulation. They are also responsible for safeguarding the assets of the Group and hence for taking reasonable steps for the prevention and detection of fraud and other irregularities.
!
!
!
!
Statement of Directors’ Responsibilitiesin respect of the financial statements
59CRH
We have audited the Group and Parent Company (“Company”) finan-cial statements (the “financial statements”) of CRH plc for the year ended 31st December 2006 which comprise the Group Income State-ment, the Group Statement of Recognised Income and Expense, the Group and Company Balance Sheets, the Group Cash Flow State-ment, the related notes 1 to 35 (Group) and the related notes 1 to 9 (Company). These financial statements have been prepared under the accounting policies set out therein.
This Report is made solely to the Company’s members, as a body, in accordance with section 193 of the Companies Act, 1990. Our audit work has been undertaken so that we might state to the Company’s members those matters we are required to state to them in an audi-tors’ report and for no other purpose. To the fullest extent permitted by law, we do not accept or assume responsibility to anyone other than the Company and the Company’s members as a body, for our audit work, for this Report, or for the opinions we have formed.
Respective responsibilities of Directors and Auditors
The Directors are responsible for the preparation of the Group finan-cial statements in accordance with applicable Irish law and Inter-national Financial Reporting Standards (IFRSs) as adopted by the European Union, and for the preparation of the Company financial statements in accordance with applicable Irish law and Accounting Standards issued by the Accounting Standards Board and promul-gated by the Institute of Chartered Accountants in Ireland (“Generally Accepted Accounting Practice in Ireland”) as set out in the Statement of Directors’ Responsibilities.
Our responsibility is to audit the financial statements in accordance with relevant legal and regulatory requirements and International Standards on Auditing (UK and Ireland).
We report to you our opinion as to whether the financial statements give a true and fair view and have been properly prepared in accord-ance with the Companies Acts, 1963 to 2006 and whether, in addi-tion, the Group financial statements have been properly prepared in accordance with Article 4 of the IAS Regulation. We also report to you our opinion as to: whether proper books of account have been kept by the Company; whether, at the balance sheet date, there exists a finan-cial situation which may require the convening of an extraordinary general meeting of the Company; and whether the information given in the Directors’ Report is consistent with the financial statements. In addition, we state whether we have obtained all the information and explanations necessary for the purposes of our audit and whether the Company Balance Sheet is in agreement with the books of account.
We also report to you if, in our opinion, any information specified by law or the Listing Rules of the Irish Stock Exchange regarding direc-tors’ remuneration and other transactions is not disclosed and, where practicable, include such information in our Report.
We review whether the Corporate Governance Statement reflects the Company’s compliance with the nine provisions of the 2003 Finan-cial Reporting Council’s Combined Code specified for our review by the Listing Rules of the Irish Stock Exchange, and we report if it does not. We are not required to consider whether the Board’s statements on internal control cover all risks and controls, or form an opinion on the effectiveness of the Group’s corporate governance procedures or its risk and control procedures.
We read other information contained in the Annual Report and con-sider whether it is consistent with the audited financial statements. The other information comprises only the Directors’ Report, the Chair-man’s Statement, Chief Executive’s Review, Operations Reviews, Finance Review and the Corporate Governance Statement. We con-sider the implications for our Report if we become aware of any appar-ent misstatements or material inconsistencies with the financial state-ments. Our responsibilities do not extend to any other information.
Basis of Audit Opinion
We conducted our audit in accordance with International Standards on Auditing (UK and Ireland) issued by the Auditing Practices Board. An audit includes examination, on a test basis, of evidence relevant to the amounts and disclosures in the financial statements. It also includes an assessment of the significant estimates and judgements made by the Directors in the preparation of the financial statements, and of whether the accounting policies are appropriate to the Group’s and Company’s circumstances, consistently applied and adequately disclosed.
We planned and performed our audit so as to obtain all the informa-tion and explanations which we considered necessary in order to pro-vide us with sufficient evidence to give reasonable assurance that the financial statements are free from material misstatement, whether caused by fraud or other irregularity or error. In forming our opinion, we also evaluated the overall adequacy of the presentation of infor-mation in the financial statements.
Opinion
In our opinion the Group financial statements give a true and fair view, in accordance with IFRSs as adopted by the European Union, of the state of affairs of the Group as at 31st December 2006 and of its profit for the year then ended and have been properly prepared in accordance with the Companies Acts, 1963 to 2006 and Article 4 of the IAS Regulation.
In our opinion the Company financial statements give a true and fair view, in accordance with Generally Accepted Accounting Practice in Ireland, of the state of affairs of the Company as at 31st December 2006 and have been properly prepared in accordance with the Companies Acts, 1963 to 2006.
We have obtained all the information and explanations we consider necessary for the purposes of our audit. In our opinion proper books of account have been kept by the Company. The Company Balance Sheet is in agreement with the books of account.
In our opinion the information given in the Directors’ Report is con-sistent with the financial statements.
In our opinion, the Company Balance Sheet does not disclose a finan-cial situation which under section 40(1) of the Companies (Amend-ment) Act, 1983 would require the convening of an extraordinary general meeting of the Company.
Ernst & Young Registered Auditors Dublin 5th March 2007
Independent Auditors’ Reportto the members of CRH public limited company

60 CRH
Group Income Statement
for the financial year ended 31st December 2006
2006 2005Notes §m §m
1 Revenue 18,737.4 14,449.3 Cost of sales (13,123.8) (9,901.7)
Gross profit 5,613.6 4,547.6 3 Operating costs (3,846.8) (3,155.3)
1, 4, 5 Group operating profit 1,766.8 1,392.3 1 Profit on disposal of fixed assets 40.5 19.8
1 Profit before finance costs 1,807.3 1,412.1 8 Finance costs (407.3) (297.4) 8 Finance revenue 155.2 138.3 9 Group share of associates’ profit after tax 47.2 25.9
Profit before tax 1,602.4 1,278.9 10 Income tax expense (378.2) (272.6)
Group profit for the financial year 1,224.2 1,006.3
Profit attributable to: Equity holders of the Company 1,210.2 997.9 31 Minority interest 14.0 8.4
Group profit for the financial year 1,224.2 1,006.3
12 Basic earnings per Ordinary Share 224.3c 186.7c
12 Diluted earnings per Ordinary Share 222.4c 185.2c
Group Statement of Recognised Income and Expense
for the financial year ended 31st December 2006
2006 2005Notes §m §m Items of income and expense recognised directly within equity 30 Currency translation effects (371.1) 413.4 27 Actuarial gain/(loss) on Group defined benefit pension obligations 155.1 (86.1) 10 Movement in deferred tax asset on Group defined benefit pension obligations (41.4) 21.7 10 Movement in deferred tax asset on share-based payments 26.7 12.3 30 Gains/(losses) relating to cash flow hedges (2.4) 2.7 10 Movement in deferred tax liability on cash flow hedges 0.4 (0.7)
Net income/(expense) recognised directly within equity (232.7) 363.3 Group profit for the financial year 1,224.2 1,006.3
Total recognised income and expense for the financial year 991.5 1,369.6
Attributable to: Equity holders of the Company 978.8 1,360.4 Minority interest 12.7 9.2
Total recognised income and expense for the financial year 991.5 1,369.6
P.J. Molloy, W.I. O’Mahony, Directors

61CRH
Group Balance Sheet
as at 31st December 2006 2006 2005 Notes §m §m ASSETS Non-current assets 13 Property, plant and equipment 7,479.5 6,823.5 14 Intangible assets 2,966.0 2,252.5 15 Investments in associates 554.3 527.6 15 Other financial assets 96.5 106.9 23 Derivative financial instruments 74.0 154.8 26 Deferred income tax assets 489.2 466.5
Total non-current assets 11,659.5 10,331.8
Current assets 17 Inventories 2,036.4 1,722.6 18 Trade and other receivables 3,171.7 2,476.4 23 Derivative financial instruments 5.3 30.7 21 Liquid investments 370.5 342.5 21 Cash and cash equivalents 1,101.6 1,148.6
Total current assets 6,685.5 5,720.8
Total assets 18,345.0 16,052.6
EQUITY Capital and reserves attributable to the Company’s equity holders 29 Equity share capital 184.5 182.3 29 Preference share capital 1.2 1.2 29 Treasury shares (14.4) - 30 Share premium account 2,317.8 2,208.3 30 Other reserves 52.1 37.4 30 Foreign currency translation reserve (137.6) 233.5 30 Retained income 4,658.9 3,532.7
7,062.5 6,195.4 31 Minority interest 41.8 38.3
Total equity 7,104.3 6,233.7
LIABILITIES Non-current liabilities 22 Interest-bearing loans and borrowings 5,312.9 4,524.5 23 Derivative financial instruments 47.0 13.5 26 Deferred income tax liabilities 1,301.2 1,184.5 19 Trade and other payables 159.4 187.6 27 Retirement benefit obligations 261.4 450.5 25 Provisions for liabilities 320.0 223.0 28 Capital grants 10.4 12.1
Total non-current liabilities 7,412.3 6,595.7
Current liabilities 19 Trade and other payables 2,788.4 2,254.4 Current income tax liabilities 215.7 271.5 22 Interest-bearing loans and borrowings 645.4 582.3 23 Derivative financial instruments 38.1 4.6 25 Provisions for liabilities 140.8 110.4
Total current liabilities 3,828.4 3,223.2
Total liabilities 11,240.7 9,818.9
Total equity and liabilities 18,345.0 16,052.6
P.J. Molloy, W.I. O’Mahony, Directors

62 CRH
for the financial year ended 31st December 2006 2006 2005Notes §m §m Cash flows from operating activities Profit before tax 1,602.4 1,278.9 Finance costs (net) 252.1 159.1 Group share of associates’ profit after tax (47.2) (25.9) Profit on disposal of fixed assets (40.5) (19.8)
Group operating profit 1,766.8 1,392.3 13 Depreciation charge 663.7 555.8 7 Share-based payments 16.0 13.9 14 Amortisation of intangible assets 25.3 9.1 Net movement on provisions 11.5 11.8 20 Increase in working capital (132.0) (149.4) 28 Amortisation of capital grants (2.0) (2.0) Other non-cash movements 8.4 2.9
Cash generated from operations 2,357.7 1,834.4 Interest paid (including finance leases) (252.7) (184.0) Irish corporation tax paid (20.0) (13.3) Overseas corporation tax paid (357.7) (246.2)
Net cash inflow from operating activities 1,727.3 1,390.9
Cash flows from investing activities Inflows
16 Proceeds from disposal of fixed assets 252.4 102.8 Interest received 46.0 43.4 28 Capital grants received 0.4 1.5 Dividends received from associates 21.8 14.2
320.6 161.9
Outflows
13 Purchase of property, plant and equipment (832.3) (652.1) 33 Acquisition of subsidiaries and joint ventures (1,978.4) (808.3) 15 Investments in and advances to associates (7.4) (298.9) 15 Advances to joint ventures and purchase of trade investments (12.7) (7.7) 20 Deferred and contingent acquisition consideration paid (73.5) (45.3)
(2,904.3) (1,812.3)
Net cash outflow from investing activities (2,583.7) (1,650.4)
Cash flows from financing activities Inflows
Proceeds from issue of shares 87.2 39.5 31 Shares issued to minority interests 3.1 0.3 Increase in interest-bearing loans and borrowings 1,708.5 796.8 Increase in finance lease liabilities 3.4 6.5
1,802.2 843.1
Outflows
30 Expenses paid in respect of share issues - (0.2) 29 Ordinary Shares purchased under Performance Share Plan (15.7) - 24 Increase in liquid investments (34.1) (15.0) Repayment of interest-bearing loans and borrowings (656.0) (250.0) Repayment of finance lease liabilities (12.9) (12.9) 24 Net cash movement in derivative financial instruments (29.8) (102.8) 11 Dividends paid to equity holders of the Company (197.9) (164.2) 11, 31 Dividends paid to minority interests (11.9) (9.4)
(958.3) (554.5)
Net cash inflow from financing activities 843.9 288.6
(Decrease)/increase in cash and cash equivalents (12.5) 29.1 Reconciliation of opening to closing cash and cash equivalents 24 Cash and cash equivalents at 1st January 1,148.6 1,072.0 24 Translation adjustment (34.5) 47.5 (Decrease)/increase in cash and cash equivalents (12.5) 29.1
24 Cash and cash equivalents at 31st December 1,101.6 1,148.6
A reconciliation of cash and cash equivalents to net debt is presented in note 24 to the financial statements.
P.J. Molloy, W.I. O’Mahony, Directors
Group Cash Flow Statement

63CRH
Accounting Policies
Statement of compliance
The consolidated financial statements of CRH plc have been prepared in accordance with International Financial Reporting Standards (IFRS) as adopted by the European Union, which com-prise standards and interpretations approved by the International Accounting Standards Board (IASB) and International Account-ing Standards and interpretations approved by the predecessor International Accounting Standards Committee that have been sub-sequently authorised by the IASB and remain in effect.
IFRS as adopted by the European Union differ in certain respects from IFRS as issued by the IASB. However, the consolidated finan-cial statements for the financial years presented would be no different had IFRS as issued by the IASB been applied. References to IFRS hereafter should be construed as references to IFRS as adopted by the European Union.
Basis of preparation
The consolidated financial statements, which are presented in euro millions to one decimal place, have been prepared under the histori-cal cost convention and the measurement at fair value of share-based payments and certain financial assets and liabilities including deriv-ative financial instruments. The carrying values of recognised assets and liabilities that are hedged are adjusted to record changes in the fair values attributable to the risks that are being hedged.
The accounting policies set out below have been applied consist-ently by all the Group’s subsidiaries, joint ventures and associates to all periods presented in these consolidated financial statements.
The preparation of financial statements in conformity with IFRS requires the use of certain critical accounting estimates. In addi-tion, it requires management to exercise judgement in the process of applying the Company’s accounting policies. The areas involving a high degree of judgement or complexity, or areas where assump-tions and estimates are significant to the consolidated financial statements, relate primarily to accounting for defined benefit pension schemes, financial instruments, share-based payments, pro-visions, property, plant and equipment, intangible assets, goodwill impairment and deferred tax and are documented in the relevant accounting policies below.
The financial year-ends of the Group’s subsidiaries, joint ventures and associates are co-terminous.
Adoption of IFRS and International Financial Reporting Interpretations Committee (IFRIC) Interpretations
IFRS and IFRIC Interpretations adopted during the financial yearThe Group adopted the following standards and interpretations during the financial year: IFRS 6 Exploration for and Evaluation of Mineral Resources; Amendment to IAS 39 Cash Flow Hedge Account-ing of Forecast Intragroup Transactions; Amendment to IAS 39 The Fair Value Option; Amendment to IAS 39 Transition and Initial Rec-ognition of Financial Assets and Financial Liabilities; Amendment to IAS 39 and IFRS 4 Financial Guarantee Contracts; IFRIC Interpreta-tion 4 Determining whether an Arrangement Contains a Lease; and IFRIC Interpretation 5 Rights to Interests arising from Decommis-sioning, Restoration and Environmental Rehabilitation Funds. None
of the above standards or interpretations has had, or is expected to have, a material impact on the Group financial statements.
IFRS and IFRIC Interpretations which are not yet effectiveThe Group has not applied the following standards and interpreta-tions that have been issued but are not yet effective:
IFRS 7 Financial Instruments: Disclosures (effective date: financial year beginning 1st January 2007);
IFRS 8 Operating Segments (effective date: financial periods beginning on or after 1st January 2009);
Amendment to IAS 1 Capital Disclosures (effective date: financial year beginning 1st January 2007);
IFRIC Interpretation 8 Scope of IFRS 2 (effective date: financial year beginning 1st January 2007);
IFRIC Interpretation 9 Reassessment of Embedded Derivatives (effective date: financial year beginning 1st January 2007);
IFRIC Interpretation 10 Interim Financial Reporting and Impairment (effective date: financial year beginning 1st January 2007);
IFRIC Interpretation 11 Group and Treasury Share Transactions (effective date: financial year beginning 1st January 2008); and
IFRIC Interpretation 12 Service Concession Arrangements (effective date: financial year beginning 1st January 2008).
The standards and interpretations addressed above will be applied for the purposes of the Group financial statements with effect from the dates listed.
Whilst the application of IFRS 7 and IFRS 8 will result in amend-ments to the financial instruments and segment information notes accompanying the Group financial statements, these amendments will not be of a recognition and measurement nature given the dis-closure focus of both IFRSs.
The application of IFRIC Interpretation 11 to the treasury shares held on foot of the Performance Share Plan will not result in any change in accounting in the Group financial statements given that the related share awards are currently regarded as equity-settled under IFRS 2 Share-based Payment. The Amendment to IAS 1 and IFRIC Interpretations 8, 9, 10 and 12 are not applicable in the context of the Group’s activities.
Basis of consolidation
The consolidated financial statements include the financial state-ments of the Company and all subsidiaries, joint ventures and associates, drawn up to 31st December each year.
SubsidiariesThe financial statements of subsidiaries are included in the consoli-dated financial statements from the date on which control over the operating and financial decisions is obtained and cease to be con-solidated from the date on which control is transferred out of the Group. Control exists when the Company has the power, directly or indirectly, to govern the financial and operating policies of an entity so as to obtain economic benefits from its activities. The existence
−
−
−
−
−
−
−
−

64 CRH
and effect of potential voting rights that are currently exercisable or convertible are considered in determining the existence or other-wise of control.
Joint venturesIn line with IAS 31 Interests in Joint Ventures, the Group’s share of results and net assets of joint ventures (jointly controlled entities), which are entities in which the Group holds an interest on a long-term basis and which are jointly controlled by the Group and one or more other venturers under a contractual arrangement, are accounted for on the basis of proportionate consolidation from the date on which the contractual agreements stipulating joint control are finalised and derecognised when joint control ceases. The Group combines its share of the joint ventures’ individual income and expenses, assets and liabilities and cash flows on a line-by-line basis with similar items in the Group’s consolidated financial statements.
Loans to joint ventures are classified as loans and receivables within financial assets and are recorded at amortised cost.
Associates
Entities other than subsidiaries and joint ventures in which the Group has a participating interest, and over whose operating and financial policies the Group is in a position to exercise significant influence, are accounted for as associates using the equity method and are included in the consolidated financial statements from the date on which significant influence is deemed to arise until the date on which such influence ceases to exist. If the Group’s share of losses exceeds the carrying amount of an associate, the carrying amount is reduced to nil and recognition of further losses is discon-tinued except to the extent that the Group has incurred obligations in respect of the associate.
Equity method
Under the equity method, which is used in respect of accounting for the Group’s investments in associates, the Group Income Statement reflects the Group’s share of profit after tax of the related associates. Investments in associates are carried in the Group Balance Sheet at cost adjusted in respect of post-acquisition changes in the Group’s share of net assets, less any impairment in value. Where indicators of impairment arise in accordance with the requirements of IAS 39 Financial Instruments: Recognition and Measurement, the carrying amount of the investment is tested for impairment by comparing its recoverable amount with its carrying amount.
Transactions eliminated on consolidation
Intra-group balances and transactions, and any unrealised gains arising from such transactions, are eliminated in preparing the consolidated financial statements. Unrealised gains arising from transactions with joint ventures and associates are eliminated to the extent of the Group’s interest in the entity. Unrealised losses are eliminated in the same manner as unrealised gains, but only to the extent that there is no evidence of impairment in the Group’s inter-est in the entity.
Revenue recognition
Revenue represents the value of goods and services supplied to external customers and excludes intercompany sales, trade dis-counts and value added tax/sales tax. Other than in the case of
long-term contracts, revenue is recognised to the extent that it is subject to reliable measurement, that it is probable that economic benefits will flow to the Group and that the significant risks and rewards of ownership have passed to the buyer. Revenue on long-term contracts is recognised in accordance with the percent-age-of-completion method with the completion percentage being computed on an input cost basis. No revenue is recognised if there is uncertainty at the outset of the transaction regarding recovery of the consideration due, associated costs or the possible return of goods.
Contract costs are recognised as incurred. When the outcome of a construction contract cannot be estimated reliably, contract revenue is recognised only to the extent of contract costs incurred that are likely to be recoverable. When the outcome of a construction con-tract can be estimated reliably and it is probable that the contract will be profitable, contract revenue is recognised over the period of the contract. When it is probable that total contract costs will exceed total contract revenue, the expected loss is immediately recognised as an expense. The percentage-of-completion method is used to determine the appropriate amount to recognise in a particular reporting period with the stage of completion assessed by reference to the proportion that contract costs incurred at the balance sheet date bear to the total estimated cost of the contract.
Segment reporting
A segment is a distinguishable component of the Group that is engaged either in providing products or services (business segment), or in providing products or services within a particular economic environment (geographical segment), which is subject to risks and returns different to those of other segments. Based on the Group’s internal organisational and management structure and its system of internal financial reporting, segmentation by business is regarded as being the predominant source and nature of the risks and returns facing the Group and is thus the primary segment under IAS 14 Segment Reporting. Geographical segmentation is therefore the sec-ondary segment.
Foreign currency translation
Items included in the financial statements of each of the Group’s entities are measured using the currency of the primary economic environment in which the entity operates (“the functional cur-rency”). The consolidated financial statements are presented in euro, which is the presentation currency of the Group and the func-tional currency of the Company.
Transactions in foreign currencies are recorded at the rate ruling at the date of the transaction. Monetary assets and liabilities denomi-nated in foreign currencies are retranslated at the rate of exchange ruling at the balance sheet date. All currency translation differ-ences are taken to the Group Income Statement with the exception of differences on foreign currency borrowings; to the extent that such borrowings are used to provide a hedge against foreign equity investments, the translation differences are taken directly to equity together with the translation differences on the carrying amount of the related investments. Translation differences applicable to foreign currency borrowings are taken directly to equity until dis-posal of the net investment, at which time they are recycled through the Group Income Statement.
Accounting Policies continued

65CRH
Results and cash flows of subsidiaries, joint ventures and associ-ates based in non-euro countries have been translated into euro at average exchange rates for the year, and the related balance sheets have been translated at the rates of exchange ruling at the balance sheet date. Adjustments arising on translation of the results of non-euro subsidiaries, joint ventures and associates at average rates, and on restatement of the opening net assets at closing rates, are dealt with in a separate translation reserve within equity, net of differences on related currency borrowings. All other translation differences are taken to the Group Income Statement.
On disposal of a foreign operation, accumulated currency transla-tion differences are recognised in the Group Income Statement as part of the overall gain or loss on disposal; the cumulative cur-rency translation differences arising prior to 1st January 2004 (the transition date to IFRS) have been set to zero for the purposes of ascertaining the gain or loss on disposal of a foreign operation sub-sequent to that date. Goodwill and fair value adjustments arising on acquisition of a foreign operation are regarded as assets and liabilities of the foreign operation, are expressed in the functional currency of the foreign operation, are recorded in euro at the exchange rate at the date of the transaction and are subsequently retranslated at the applicable closing rates.
Translation differences arising after 1st January 2004 are presented as a separate component of equity in the foreign currency transla-tion reserve in the Group Balance Sheet.
The principal exchange rates used for the translation of results, cash flows and balance sheets into euro were as follows:
Average Year-endeuro 1 = 2006 2005 2006 2005
US Dollar 1.2556 1.2438 1.3170 1.1797Pound Sterling 0.6817 0.6838 0.6715 0.6853Polish Zloty 3.8959 4.0224 3.8310 3.8600Swiss Franc 1.5729 1.5483 1.6069 1.5551Canadian Dollar 1.4237 1.5082 1.5281 1.3725Argentine Peso 3.8623 3.6356 4.0373 3.5868Israeli Shekel 5.5928 5.5781 5.5623 5.4503
Retirement benefit obligations
The Group operates defined contribution and defined benefit pension schemes in a number of its operating areas. In addition, the Group has also undertaken to provide certain additional post-employment healthcare and life assurance benefits, which are unfunded, to certain current and former employees in the United States.
Costs arising in respect of the Group’s defined contribution pension schemes are charged to the Group Income Statement in the period in which they are incurred. Under these schemes, the Group has no obligation, either legal or constructive, to pay further contributions in the event that the fund does not hold sufficient assets to meet its benefit commitments.
The liabilities and costs associated with the Group’s defined benefit pension schemes (both funded and unfunded) are assessed on the basis of the projected unit credit method by professionally qualified
actuaries and are arrived at using actuarial assumptions based on market expectations at the balance sheet date. The discount rates employed in determining the present value of the schemes’ liabili-ties are determined by reference to market yields at the balance sheet date on high-quality corporate bonds of a currency and term consistent with the currency and term of the associated post-employment benefit obligations. When the benefits of a defined benefit scheme are improved, the portion of the increased benefit relating to past service by employees is recognised as an expense in the Group Income Statement on a straight-line basis over the average period until the benefits become vested. To the extent that the enhanced benefits vest immediately, the related expense is recognised immediately in the Group Income Statement. The net surplus or deficit arising on the Group’s defined benefit pension schemes, together with the liabilities associated with the unfunded schemes, are shown either within non-current assets or non-current liabilities on the face of the Group Balance Sheet. The deferred tax impact of pension scheme surpluses and deficits is disclosed sepa-rately within deferred tax assets or liabilities, as appropriate. The Group has elected to avail of the Amendment to IAS 19 Actuarial Gains and Losses, Group Plans and Disclosures to recognise post transition date actuarial gains and losses immediately in the State-ment of Recognised Income and Expense.
In relation to the Group’s defined benefit pension schemes, a full actuarial valuation is undertaken on an annual basis where local requirements mandate that this be done and at triennial intervals at a maximum in all other cases.
The defined benefit pension asset or liability in the Group Balance Sheet comprises the total for each plan of the present value of the defined benefit obligation (using a discount rate based on high-quality corporate bonds) less any past service cost not yet rec-ognised and less the fair value of plan assets (measured at bid value) out of which the obligations are to be settled directly.
The Group’s obligation in respect of post-employment healthcare and life assurance benefits represents the amount of future benefit that employees have earned in return for service in the current and prior periods. The obligation is computed on the basis of the pro-jected unit credit method and is discounted to present value using a discount rate equating to the market yield at the balance sheet date on high-quality corporate bonds of a currency and term consist-ent with the currency and estimated term of the post-employment obligations.
Share-based payments
The Group operates both share option schemes and a Performance Share Plan. Its policy in relation to the granting of share options and the granting of awards under the Performance Share Plan together with the nature of the underlying market and non-market perform-ance and other vesting conditions are addressed in the Report on Directors’ Remuneration on pages 50 and 51.
Share options
For equity-settled share-based payment transactions (i.e. the issuance of share options), the Group measures the services received and the corresponding increase in equity at fair value at the measurement date (which is the grant date) using a recognised valuation methodol-ogy for the pricing of financial instruments (i.e. the trinomial model).

66 CRH
Given that the share options granted do not vest until the comple-tion of a specified period of service and are subject to the realisation of demanding performance conditions, the fair value is determined on the basis that the services to be rendered by employees as con-sideration for the granting of share options will be received over the vesting period, which is assessed as at the grant date.
The share options granted by the Company are not subject to market-based vesting conditions as defined in IFRS 2 Share-based Payment. Non-market vesting conditions are not taken into account when estimating the fair value of share options as at the grant date; such conditions are taken into account through adjusting the number of equity instruments included in the measurement of the transaction amount so that, ultimately, the amount recognised equates to the number of equity instruments that actually vest. The expense in the Group Income Statement in relation to share options represents the product of the total number of options anticipated to vest and the fair value of those options; this amount is allocated to accounting periods on a straight-line basis over the vesting period. The cumulative charge to the Group Income Statement is reversed only where the performance condition is not met or where an employee in receipt of share options relinquishes service prior to completion of the expected vesting period.
The proceeds received net of any directly attributable transac-tion costs are credited to share capital (nominal value) and share premium when the options are exercised.
The measurement requirements of IFRS 2 have been implemented in respect of share options that were granted after 7th November 2002. In accordance with the standard, the disclosure requirements of IFRS 2 have been applied in relation to all outstanding share-based payments regardless of their grant date.
To the extent that the Group receives a tax deduction relating to the services paid in shares, deferred tax in respect of share options is provided on the basis of the difference between the market price of the underlying equity as at the date of the financial statements and the exercise price of the option; as a result, the deferred tax impact of share options will not directly correlate with the expense reported in the Group Income Statement.
The Group has no exposure in respect of cash-settled share-based payment transactions and share-based payment transactions with cash alternatives as defined in IFRS 2.
Awards under the Performance Share PlanThe fair value of shares awarded under the Performance Share Plan is determined using a Monte Carlo simulation technique. The Performance Share Plan contains inter alia a TSR-based (and hence market-based) vesting condition, and accordingly, the fair value assigned to the related equity instruments on initial application of IFRS 2 is adjusted so as to reflect the anticipated likelihood as at the grant date of achieving the market-based vesting condition.
Property, plant and equipment
With the exception of the one-time revaluation of land and build-ings noted below, items of property, plant and equipment are stated at historical cost less any accumulated depreciation and any accu-mulated impairments.
Depreciation and depletion
Depreciation is calculated to write off the book value of each item of property, plant and equipment over its useful economic life on a straight-line basis at the following rates:
Land and buildings: The book value of mineral-bearing land, less an estimate of its residual value, is depleted over the period of the mineral extraction in the proportion which production for the year bears to the latest estimates of mineral reserves. Land other than mineral-bearing land is not depreciated. In general, buildings are depreciated at 2.5% per annum (“p.a.”).
Plant and machinery: These are depreciated at rates ranging from 3.3% p.a. to 20% p.a. depending on the type of asset.
Transport: On average, transport equipment is depreciated at 20% p.a.
Certain items of property, plant and equipment that had been revalued to fair value prior to the date of transition to IFRS (1st January 2004) are measured on the basis of deemed cost, being the revalued amount as at the date the revaluation was performed.
The residual values and useful lives of property, plant and equip-ment are reviewed, and adjusted if appropriate, at each balance sheet date.
Impairment of property, plant and equipmentIn accordance with IAS 36 Impairment of Assets, the carrying values of items of property, plant and equipment are reviewed for impair-ment at each reporting date and are subject to impairment testing when events or changes in circumstances indicate that the carrying values may not be recoverable. Where the carrying values exceed the estimated recoverable amount (being the greater of fair value less costs to sell and value-in-use), the assets or cash-generating units are written-down to their recoverable amount. Fair value less costs to sell is defined as the amount obtainable from the sale of an asset or cash-generating unit in an arm’s length transaction between knowledgeable and willing parties, less the costs which would be incurred in disposal. Value-in-use is defined as the present value of the future cash flows expected to be derived through the continued use of an asset or cash-generating unit including those anticipated to be realised on its eventual disposal. In assessing value-in-use, the estimated future cash flows are discounted to their present value using a pre-tax discount rate that reflects current market assess-ments of the time value of money and the risks specific to the asset for which the future cash flow estimates have not been adjusted. The estimates of future cash flows exclude cash inflows or outflows attributable to financing activities and income tax. For an asset that does not generate largely independent cash inflows, the recoverable amount is determined by reference to the cash-generating unit to which the asset belongs.
Repair and maintenance expenditureRepair and maintenance expenditure is included in an asset’s car-rying amount or recognised as a separate asset, as appropriate, only when it is probable that future economic benefits associated with the item will flow to the Group and the cost of the item can be measured reliably. All other repair and maintenance expenditure is charged to the Group Income Statement during the financial period in which it is incurred.
Accounting Policies continued

67CRH
Borrowing costsBorrowing costs incurred in the construction of major assets which take a substantial period of time to complete are capitalised in the financial period in which they are incurred.
Business combinations
The purchase method of accounting is employed in accounting for the acquisition of subsidiaries, joint ventures and associates by the Group.
The Group elected to avail of the exemption under IFRS 1 First-time Adoption of International Financial Reporting Standards whereby business combinations prior to the transition date (1st January 2004) were not restated. IFRS 3 Business Combinations was therefore applied with effect from the transition date and goodwill amortisa-tion ceased as at that date.
The cost of a business combination is measured as the aggregate of the fair values at the date of exchange of assets given, liabilities incurred or assumed and equity instruments issued in exchange for control together with any directly attributable expenses. To the extent that settlement of all or any part of a business combination is deferred, the fair value of the deferred component is determined through discounting the amounts payable to their present value at the date of exchange. The discount component is unwound as an interest charge in the Group Income Statement over the life of the obligation.
Where a business combination agreement provides for an adjust-ment to the cost of the combination contingent on future events, the amount of the adjustment is included in the cost at the acquisition date if the adjustment is probable and can be reliably measured. Contingent consideration is included in the acquisition balance sheet on a discounted basis.
The assets and liabilities and contingent liabilities of a subsidiary are measured at their fair values at the date of acquisition. In the case of a business combination which is completed in stages, the fair values of the identifiable assets, liabilities and contingent liabilities are determined at the date of each exchange transaction.
When the initial accounting for a business combination is deter-mined provisionally, any adjustments to the provisional values allocated to the identifiable assets, liabilities and contingent liabili-ties are made within twelve months of the acquisition date.
The interest of minority shareholders is stated at the minority’s proportion of the fair values of the assets and liabilities recognised; goodwill is not allocated to the minority interest. Subsequently, any losses applicable to the minority interest in excess of the minority interest are allocated against the interests of the parent.
Goodwill
Goodwill is the excess of the consideration paid over the fair value of the identifiable assets, liabilities and contingent liabilities in a business combination and relates to the future economic benefits arising from assets which are not capable of being individually iden-tified and separately recognised.
On transition to IFRS, the deemed cost of goodwill in the Group Balance Sheet at 1st January 2004 equated to the net book value
recorded under Irish GAAP. In line with the provisions applicable to a first-time adopter under IFRS 3, goodwill amortisation ceased with effect from the transition date.
The carrying amount of goodwill in respect of associates is included in investments in associates under the equity method in the Group Balance Sheet. Goodwill applicable to jointly controlled entities is accounted for on the basis of proportionate consolidation and is therefore included in the goodwill caption in the Group Balance Sheet, net of any impairments assessed in accordance with the methodology discussed below.
Where a subsidiary is disposed of or terminated through closure, the carrying value of any goodwill which arose on acquisition of that subsidiary, net of any impairments, is included in the determination of the net profit or loss on disposal/termination.
To the extent that the Group’s interest in the net fair value of the identifiable assets, liabilities and contingent liabilities acquired exceeds the cost of a business combination, the identification and measurement of the related assets, liabilities and contingent lia-bilities are revisited and the cost is reassessed and any remaining balance is recognised immediately in the Group Income Statement.
Goodwill acquired in a business combination is allocated, from the acquisition date, to the cash-generating units that are anticipated to benefit from the combination’s synergies. Following initial recogni-tion, goodwill is measured at cost less any accumulated impairment losses. The cash-generating units represent the lowest level within the Group at which goodwill is monitored for internal management purposes and these units are not larger than the primary and sec-ondary reporting segments determined in accordance with IAS 14 Segment Reporting. Goodwill is subject to impairment testing on an annual basis and at any time during the year if an indicator of impairment is considered to exist. In the year in which a business combination is effected, and where some or all of the goodwill allo-cated to a particular cash-generating unit arose in respect of that combination, the cash-generating unit is tested for impairment prior to the end of the relevant annual period. Impairment is determined by assessing the recoverable amount of the cash-generating unit to which the goodwill relates. Where the recoverable amount of the cash-generating unit is less than the carrying amount, an impair-ment loss is recognised. Impairment losses arising in respect of goodwill are not reversed once recognised.
When an operation within a cash-generating unit is disposed of, any goodwill associated with that operation is included in the car-rying amount of the operation when determining the gain or loss on disposal. Goodwill disposed of in this circumstance is measured on the basis of the relative values of the operation disposed of and the portion of the cash-generating unit retained.
Intangible assets (other than goodwill) arising on business combinations
An intangible asset, which is an identifiable non-monetary asset without physical substance, is capitalised separately from goodwill as part of a business combination to the extent that it is probable that the expected future economic benefits attributable to the asset will flow to the Group and that its cost can be measured reli-ably. The asset is deemed to be identifiable when it is separable (i.e. capable of being divided from the entity and sold, transferred,

68 CRH
licensed, rented or exchanged, either individually or together with a related contract, asset or liability) or when it arises from contrac-tual or other legal rights, regardless of whether those rights are transferable or separable from the Group or from other rights and obligations.
Subsequent to initial recognition, intangible assets are carried at cost less any accumulated amortisation and any accumulated impairment losses. The carrying values of definite-lived intangible assets are reviewed for indicators of impairment at each reporting date and are subject to impairment testing when events or changes in circumstances indicate that the carrying values may not be recoverable.
The amortisation of intangible assets is calculated to write-off the book value of definite-lived intangible assets over their useful lives on a straight-line basis on the assumption of zero residual value. In general, definite-lived intangible assets are amortised over periods ranging from one to ten years, depending on the nature of the intan-gible asset.
Investments
All investments are initially recognised at the fair value of the consid-eration given net of any acquisition charges arising.
Where investments are actively traded in organised financial markets, fair value is determined by reference to Stock Exchange quoted market bid prices at the close of business on the balance sheet date. Where it is impracticable to determine fair value in accordance with IAS 39, unquoted equity investments are recorded at historical cost and are included within financial assets in the Group Balance Sheet.
Leases
Assets held under finance leases, which are leases where sub-stantially all the risks and rewards of ownership of the asset have transferred to the Group, and hire purchase contracts are capitalised in the Group Balance Sheet and are depreciated over their useful lives with any impairment being recognised in accumulated depre-ciation. The asset is recorded at an amount equal to the lower of its fair value and the present value of the minimum lease payments at the inception of the finance lease. The capital elements of future obligations under leases and hire purchase contracts are included in liabilities in the Group Balance Sheet and analysed between current and non-current amounts. The interest elements of the rental obli-gations are charged to the Group Income Statement over the periods of the relevant agreements and represent a constant proportion of the balance of capital repayments outstanding in line with the effec-tive interest methodology.
Leases where the lessor retains substantially all the risks and rewards of ownership are classified as operating leases. Operat-ing lease rentals are charged to the Group Income Statement on a straight-line basis over the lease term.
Inventories and construction contracts
Inventories are stated at the lower of cost and net realisable value. Cost is based on the first-in, first-out principle (and weighted average, where appropriate) and includes all expenditure incurred in acquiring the inventories and bringing them to their present location and condition. Raw materials are valued on the basis of purchase cost on a first-in, first-out basis. In the case of finished
goods and work-in-progress, cost includes direct materials, direct labour and attributable overheads based on normal operating capacity and excludes borrowing costs. Net realisable value is the estimated proceeds of sale less all further costs to completion, and less all costs to be incurred in marketing, selling and distribution.
Amounts recoverable on construction contracts, which are included in debtors, are stated at the net sales value of the work done less amounts received as progress payments on account. Cumulative costs incurred, net of amounts transferred to cost of sales, after deducting foreseeable losses, provision for contingencies and pay-ments on account not matched with revenue, are included as construction contract balances in inventories. Cost includes all expenditure related directly to specific projects and an allocation of fixed and variable overheads incurred in the Group’s contract activities based on normal operating capacity.
Trade and other receivables and payables
Trade and other receivables and payables are stated at cost, which approximates fair value given the short-dated nature of these assets and liabilities.
Trade receivables are carried at original invoice amount less an allowance for potentially uncollectible debts. Provision is made when there is objective evidence that the Group will not be in a position to collect the associated debts. Bad debts are written-off in the Group Income Statement on identification.
Cash and cash equivalents
Cash and cash equivalents comprise cash balances held for the pur-poses of meeting short-term cash commitments and investments which are readily convertible to a known amount of cash and are subject to an insignificant risk of changes in value. Where invest-ments are categorised as cash equivalents, the related balances have a maturity of three months or less from the date of acquisition. Bank overdrafts are included within current interest-bearing loans and borrowings in the Group Balance Sheet. Where the overdrafts are repayable on demand and form an integral part of cash manage-ment, they are netted against cash and cash equivalents.
Liquid investments
Liquid investments comprise short-term deposits and current asset investments which are held as readily disposable stores of value and include investments in government gilts and commercial paper and deposits of less than one year in duration. The maturity of these investments falls outside the three months timeframe for classifica-tion as cash and cash equivalents under IAS 7 Cash Flow Statements, and accordingly these investments are treated as financial assets and are categorised as either “fair value through profit and loss” or “loans and receivables”.
Derivative financial instruments
The Group employs derivative financial instruments (principally interest rate and currency swaps and forward foreign exchange contracts) to manage interest rate risks and to realise the desired currency profile of borrowings. In accordance with its treasury policy, the Group does not trade in financial instruments nor does it enter into leveraged derivative transactions.
At the inception of a transaction entailing the usage of derivatives, the Group documents the relationship between the hedged item
Accounting Policies continued

69CRH
and the hedging instrument together with its risk management objective and the strategy underlying the proposed transaction. The Group also documents its assessment, both at the inception of the hedging relationship and subsequently on an ongoing basis, of the effectiveness of the hedge in offsetting movements in the fair values or cash flows of the hedged items.
Derivative financial instruments are stated at fair value. Where derivatives do not fulfil the criteria for hedge accounting, they are classified as held-for-trading and changes in fair values are reported in the Group Income Statement. The fair value of interest rate and currency swaps is the estimated amount the Group would pay or receive to terminate the swap at the balance sheet date taking into account current interest and currency rates and the creditworthi-ness of the swap counterparties. The fair value of forward exchange contracts is calculated by reference to current forward exchange rates for contracts with similar maturity profiles and equates to the quoted market price at the balance sheet date (being the present value of the quoted forward price).
Hedging
Fair value and cash flow hedgesThe Group uses fair value hedges and cash flow hedges in its treasury activities. For the purposes of hedge accounting, hedges are classified either as fair value hedges (which entail hedging the exposure to movements in the fair value of a recognised asset or liability) or cash flow hedges (which hedge exposure to fluctuations in future cash flows derived from a particular risk associated with a recognised asset or liability, a firm commitment or a highly prob-able forecast transaction).
In the case of fair value hedges which satisfy the conditions for hedge accounting, any gain or loss stemming from the re-meas-urement of the hedging instrument to fair value is reported in the Group Income Statement. In addition, any gain or loss on the hedged item which is attributable to the hedged risk is adjusted against the carrying amount of the hedged item and reflected in the Group Income Statement. Where the adjustment is to the carrying amount of a hedged interest-bearing financial instrument, the adjustment is amortised to the Group Income Statement with the objective of achieving full amortisation by maturity.
Where a derivative financial instrument is designated as a hedge of the variability in cash flows of a recognised liability or a highly probable forecasted transaction, the effective part of any gain or loss on the derivative financial instrument is recognised as a separate component of equity with the ineffective portion being reported in the Group Income Statement. The associated gains or losses that had previously been recognised in equity are transferred to the Group Income Statement contemporaneously with the materialisa-tion of the hedged transaction. Any gain or loss arising in respect of changes in the time value of the derivative financial instrument is excluded from the measurement of hedge effectiveness and is rec-ognised immediately in the Group Income Statement.
Hedge accounting is discontinued when the hedging instrument expires or is sold, terminated or exercised, or no longer qualifies for hedge accounting. At that point in time, any cumulative gain or loss on the hedging instrument recognised as a separate component of equity remains in equity until the forecast transaction occurs. If a hedged transaction is no longer anticipated to occur, the net
cumulative gain or loss recognised in equity is transferred to the Group Income Statement in the period.
Hedges of monetary assets and liabilitiesWhere a derivative financial instrument is used to hedge economi-cally the foreign exchange exposure of a recognised monetary asset or liability, hedge accounting is not applied and any gain or loss accruing on the hedging instrument is recognised in the Group Income Statement.
Net investment hedgesWhere foreign currency borrowings provide a hedge against a net investment in a foreign operation, foreign exchange differences are taken directly to a foreign currency translation reserve (being a sep-arate component of equity). Cumulative gains and losses remain in equity until disposal of the net investment in the foreign operation at which point the related differences are transferred to the Group Income Statement as part of the overall gain or loss on sale.
Interest-bearing loans and borrowings
All loans and borrowings are initially recorded at cost being the fair value of the consideration received net of attributable transaction costs.
Subsequent to initial recognition, current and non-current inter-est-bearing loans and borrowings are measured at amortised cost employing the effective interest yield methodology. The computa-tion of amortised cost includes any issue costs and any discount or premium materialising on settlement. Borrowings are classified as current liabilities unless the Group has an unconditional right to defer settlement of the liability for at least 12 months after the balance sheet date.
Gains and losses are recognised in the Group Income Statement through amortisation on the basis of the period of the loans and bor-rowings and/or on impairment and derecognition of the associated loans and borrowings.
Borrowing costs arising on financial instruments are recognised as an expense in the period in which they are incurred.
Provisions for liabilities
A provision is recognised on a discounted basis when the Group has a present obligation (either legal or constructive) as a result of a past event; it is probable that a transfer of economic benefits will be required to settle the obligation; and a reliable estimate can be made of the amount of the obligation. Where the Group anticipates that a provision will be reimbursed, the reimbursement is recognised as a separate asset when it is virtually certain that the reimbursement will arise. Provisions are not recognised in respect of future operat-ing losses.
Provisions arising on business combination activity are accord-ingly recognised only to the extent that they would have qualified for recognition in the financial statements of the acquiree prior to acquisition.
Tax (current and deferred)
Current tax represents the expected tax payable (or recoverable) on the taxable profit for the year using tax rates enacted or substantively

70 CRH
enacted at the balance sheet date and taking into account any adjustments stemming from prior years.
Deferred tax is provided on the basis of the balance sheet liabil-ity method on all temporary differences at the balance sheet date. Temporary differences are defined as the difference between the tax bases of assets and liabilities and their carrying amounts in the financial statements. Deferred tax assets and liabilities are not subject to discounting and are measured at the tax rates that are anticipated to apply in the period in which the asset is realised or the liability is settled based on tax rates and tax laws that have been enacted or substantively enacted at the balance sheet date.
Deferred tax liabilities are recognised for all taxable temporary dif-ferences (i.e. differences that will result in taxable amounts in future periods when the carrying amount of the asset or liability is recov-ered or settled) with the exception of the following:
where the deferred tax liability arises from the initial recognition of goodwill or the initial recognition of an asset or a liability in a transaction that is not a business combination and affects neither the accounting profit nor the taxable profit or loss at the time of the transaction; and
where, in respect of taxable temporary differences associated with investments in subsidiaries and joint ventures, the timing of the reversal of the temporary difference is subject to control by the Group and it is probable that reversal will not materialise in the foreseeable future.
Deferred tax assets are recognised in respect of all deductible tem-porary differences (i.e. differences that give rise to amounts which are deductible in determining taxable profits in future periods when the carrying amount of the asset or liability is recovered or settled), carry-forward of unused tax credits and unused tax losses to the extent that it is probable that taxable profits will be available against which to offset these items. The following exceptions apply in this instance:
where the deferred tax asset arises from the initial recognition of an asset or a liability in a transaction that is not a business combination and affects neither the accounting profit nor the taxable profit or loss at the time of the transaction; and
where, in respect of deductible temporary differences associated with investments in subsidiaries, joint ventures and associates, a deferred tax asset is recognised only if it is probable that the deductible temporary difference will reverse in the foreseeable future and that sufficient taxable profits will be available against which the temporary difference can be utilised.
The carrying amounts of deferred tax assets are subject to review at each balance sheet date and are reduced to the extent that future taxable profits are considered to be inadequate to allow all or part of any deferred tax asset to be utilised.
!
!
!
!
Where items are accounted for directly through equity (for example, in the context of certain derivative financial instruments and actu-arial gains and losses on defined benefit pension schemes and share-based payments), the related income tax is charged or cred-ited to equity. In all other circumstances, income tax is recognised in the Group Income Statement.
Capital grants
Capital grants are recognised at their fair value where there is rea-sonable assurance that the grant will be received and all attaching conditions have been complied with. When the grant relates to an expense item, it is recognised as income over the periods neces-sary to match the grant on a systematic basis to the costs that it is intended to compensate. Where the grant relates to an asset, the fair value is treated as a deferred credit and is released to the Group Income Statement over the expected useful life of the relevant asset through equal annual instalments.
Share capital
Treasury sharesOrdinary Shares purchased by the Company under the terms of the Performance Share Plan are accounted for as treasury shares and recorded as a deduction from equity on the face of the Group Balance Sheet.
DividendsDividends on Ordinary Shares are recognised as a liability in the Group’s financial statements in the period in which they are declared by the Company.
Emission rights
Emission rights are accounted for such that a liability is recognised only in circumstances where emission rights have been exceeded from the perspective of the Group as a whole and the differential between actual and permitted emissions will have to be remedied through the purchase of the required additional rights at fair value; assets and liabilities arising in respect of under and over-utilisation of emission credits respectively are accordingly netted against one another in the preparation of the consolidated financial statements.
Accounting Policies continued

71CRH
Notes on Financial Statements
1. Segment Information
Analysis by class of business and by geographyThe Group is organised into four Divisions, two in Europe: Materials and Products & Distribution; and two in the Americas: Materials in the United States and Products & Distribution in the United States, Canada, Argentina and Chile. These activities comprise three reporting business segments as follows:
Materials businesses are involved in the production of cement, aggregates, asphalt and readymixed concrete.Products businesses are involved in the production of concrete products and a range of construction-related products and services.Distribution businesses are engaged in the marketing and sale of builders’ supplies to the construction industry and of materials and products for the DIY market.
Intersegment revenue is not material.
Group Income Statement Continuing operations - year ended 31st December Total Products & Materials Products Distribution Distribution Total Group
2006 2005 2006 2005 2006 2005 2006 2005 2006 2005 §m §m §m §m §m §m §m §m §m §mSegment revenueEurope 2,966.9 2,646.2 3,185.8 2,533.4 2,786.0 2,192.9 5,971.8 4,726.3 8,938.7 7,372.5 Americas 4,778.3 3,164.7 3,572.7 2,755.9 1,447.7 1,156.2 5,020.4 3,912.1 9,798.7 7,076.8
7,745.2 5,810.9 6,758.5 5,289.3 4,233.7 3,349.1 10,992.2 8,638.4 18,737.4 14,449.3
Segment revenue includes §3,065.2 million (2005 : §2,014.0 million) in respect of revenue applicable to construction contracts.
Group operating profit before depreciation and amortisation (EBITDA) (i)
Europe 564.3 506.0 361.0 303.9 209.6 155.4 570.6 459.3 1,134.9 965.3 Americas 695.1 493.0 505.7 406.8 120.1 92.1 625.8 498.9 1,320.9 991.9
1,259.4 999.0 866.7 710.7 329.7 247.5 1,196.4 958.2 2,455.8 1,957.2
Depreciation Europe 143.1 129.0 134.1 126.8 37.1 31.6 171.2 158.4 314.3 287.4 Americas 219.9 164.8 116.3 93.4 13.2 10.2 129.5 103.6 349.4 268.4
363.0 293.8 250.4 220.2 50.3 41.8 300.7 262.0 663.7 555.8
Amortisation of intangible assets Europe 0.3 - 5.8 1.5 0.5 0.4 6.3 1.9 6.6 1.9 Americas 0.1 - 14.9 5.8 3.7 1.4 18.6 7.2 18.7 7.2
0.4 - 20.7 7.3 4.2 1.8 24.9 9.1 25.3 9.1
Group operating profit (i) Europe 420.9 377.0 221.1 175.6 172.0 123.4 393.1 299.0 814.0 676.0 Americas 475.1 328.2 374.5 307.6 103.2 80.5 477.7 388.1 952.8 716.3
896.0 705.2 595.6 483.2 275.2 203.9 870.8 687.1 1,766.8 1,392.3
Profit/(loss) on disposal of fixed assets Europe 28.3 8.8 2.5 1.8 3.9 (0.8) 6.4 1.0 34.7 9.8 Americas 1.5 9.7 2.9 (0.1) 1.4 0.4 4.3 0.3 5.8 10.0
29.8 18.5 5.4 1.7 5.3 (0.4) 10.7 1.3 40.5 19.8
Segment result (profit before finance costs) (i) Europe 449.2 385.8 223.6 177.4 175.9 122.6 399.5 300.0 848.7 685.8 Americas 476.6 337.9 377.4 307.5 104.6 80.9 482.0 388.4 958.6 726.3
925.8 723.7 601.0 484.9 280.5 203.5 881.5 688.4 1,807.3 1,412.1
Finance costs (net) (252.1) (159.1)Group share of associates’ profit after tax (note 9) 47.2 25.9
Profit before tax 1,602.4 1,278.9 Income tax expense (378.2) (272.6)
Group profit for the financial year 1,224.2 1,006.3
(i) EBITDA and operating profit for Europe Products includes a goodwill impairment loss of §50.0 million relating to the Cementbouw bv joint venture (see note 14). In addition, segment profit for Europe Products includes §18.9 million of the total §37.7 million gain arising on deconsolidation of certain pension schemes in the Netherlands (see note 27). The remaining §18.8 million of this deconsolidation gain has been included in the segment profit for Europe Distribution.

72 CRH
1. Segment Information continued
Group Balance Sheet Continuing operations - year ended 31st December Total Products & Materials Products Distribution Distribution Total Group
2006 2005 2006 2005 2006 2005 2006 2005 2006 2005Segment assets §m §m §m §m §m §m §m §m §m §m
Europe 2,981.7 2,768.1 3,141.7 2,689.0 1,375.5 1,332.1 4,517.2 4,021.1 7,498.9 6,789.2 Americas 5,067.1 3,806.4 2,511.4 2,187.0 576.2 492.4 3,087.6 2,679.4 8,154.7 6,485.8
8,048.8 6,574.5 5,653.1 4,876.0 1,951.7 1,824.5 7,604.8 6,700.5 15,653.6 13,275.0
Reconciliation to total assets as reported in the Group Balance Sheet Investments in associates 554.3 527.6 Other financial assets 96.5 106.9 Derivative financial instruments (current and non-current) 79.3 185.5 Deferred income tax assets 489.2 466.5 Liquid investments 370.5 342.5 Cash and cash equivalents 1,101.6 1,148.6
Total assets as reported in the Group Balance Sheet 18,345.0 16,052.6
Segment liabilities Europe 752.0 748.5 877.2 791.8 336.6 343.5 1,213.8 1,135.3 1,965.8 1,883.8 Americas 900.9 630.6 642.8 527.1 160.5 184.4 803.3 711.5 1,704.2 1,342.1
1,652.9 1,379.1 1,520.0 1,318.9 497.1 527.9 2,017.1 1,846.8 3,670.0 3,225.9
Reconciliation to total liabilities as reported in the Group Balance Sheet Interest-bearing loans and borrowings (current and non-current) 5,958.3 5,106.8 Derivative financial instruments (current and non-current) 85.1 18.1 Income tax liabilities (current and deferred) 1,516.9 1,456.0 Capital grants 10.4 12.1
Total liabilities as reported in the Group Balance Sheet 11,240.7 9,818.9
Notes on Financial Statements

73CRH
1. Segment Information continued
Geographical analysis
The following is a geographical analysis of the segmental data presented above with Ireland (including Northern Ireland) and the Benelux (which comprises Belgium, the Netherlands and Luxembourg) separately analysed on the basis of the aggregation thresholds contained in IAS 14:
Group Income Statement Continuing operations - year ended 31st December Ireland Benelux Rest of Europe Americas Total Group
2006 2005 2006 2005 2006 2005 2006 2005 2006 2005 §m §m §m §m §m §m §m §m §m §m
Segment revenue 1,250.9 1,164.1 2,628.4 2,468.6 5,057.7 3,733.8 9,800.4 7,082.8 18,737.4 14,449.3
Group EBITDA 209.2 192.9 300.9 266.3 624.1 505.3 1,321.6 992.7 2,455.8 1,957.2 Depreciation 51.6 44.5 80.9 78.9 181.8 164.0 349.4 268.4 663.7 555.8 Amortisation of intangible assets 0.2 - 1.6 1.2 4.8 0.7 18.7 7.2 25.3 9.1
Group operating profit 157.4 148.4 218.4 186.2 437.5 340.6 953.5 717.1 1,766.8 1,392.3 Profit/(loss) on disposal of fixed assets 23.2 8.1 3.3 0.4 8.2 1.3 5.8 10.0 40.5 19.8
Segment result (profit before finance costs) 180.6 156.5 221.7 186.6 445.7 341.9 959.3 727.1 1,807.3 1,412.1
Group Balance Sheet Segment assets 829.9 741.7 2,100.8 2,029.0 4,562.4 4,018.9 8,160.5 6,485.4 15,653.6 13,275.0
Segment liabilities 288.7 313.8 484.8 469.3 1,194.1 1,100.7 1,702.4 1,342.1 3,670.0 3,225.9
Other segment information - capital expenditure Continuing operations - year ended 31st December Total Products & Materials Products Distribution Distribution Total Group
2006 2005 2006 2005 2006 2005 2006 2005 2006 2005 §m §m §m §m §m §m §m §m §m §mBy business segment Europe 213.0 156.8 122.7 113.2 46.4 40.2 169.1 153.4 382.1 310.2 Americas 288.7 176.7 141.9 145.5 19.6 19.7 161.5 165.2 450.2 341.9
501.7 333.5 264.6 258.7 66.0 59.9 330.6 318.6 832.3 652.1
Geographical analysis Ireland 78.2 55.9 Benelux 79.4 72.3 Rest of Europe 224.5 182.1 Americas 450.2 341.8
832.3 652.1

74 CRH
2. Proportionate Consolidation of Joint Ventures Year ended 31st December
2006 2005 Impact on Group Income Statement §m §m
Group share of:Revenue 900.9 617.8Cost of sales (628.0) (392.8)
Gross profit 272.9 225.0Operating costs (179.9) (143.6)Impairment of Cementbouw bv goodwill (note 14) (50.0) -
Operating profit 43.0 81.4Profit on disposal of fixed assets 4.7 0.8
Profit before finance costs 47.7 82.2Finance costs (net) (16.4) (13.6)
Profit before tax 31.3 68.6Income tax expense (18.2) (18.9)
Group profit for the financial year 13.1 49.7
Depreciation 36.9 30.6
Impact on Group Balance Sheet
Group share of:Non-current assets 806.0 826.3Current assets 289.0 311.4
Total assets 1,095.0 1,137.7
Total equity 553.1 535.6
Non-current liabilities 273.2 380.6 Current liabilities 268.7 221.5
Total liabilities 541.9 602.1
Total equity and liabilities 1,095.0 1,137.7
Net debt included above (247.9) (271.2)
Impact on Group Cash Flow Statement
Group share of:Net cash inflow from operating activities 86.7 77.0Net cash outflow from investing activities (74.5) (127.6)Net cash (outflow)/inflow from financing activities (34.2) 62.2
Net (decrease)/increase in cash and cash equivalents (22.0) 11.6Cash and cash equivalents at 1st January 73.5 61.3Translation adjustment (0.2) 0.6
Cash and cash equivalents at 31st December 51.3 73.5
Reconciliation of cash and cash equivalents to net debtCash and cash equivalents as above 51.3 73.5Derivative financial instruments (current and non-current) 0.7 -Interest-bearing loans and borrowings (current and non-current) (299.9) (344.7)
Net debt at 31st December (247.9) (271.2)
The Group’s share of net debt in joint ventures is non-recourse to the Group.
Notes on Financial Statements

75CRH
3. Operating Costs 2006 2005 §m §m (i)Selling and distribution costs 2,495.6 1,969.6Administrative expenses 1,267.3 1,173.5Other operating expenses 95.8 23.1Other operating income (11.9) (10.9)
Total 3,846.8 3,155.3
(i) Certain prior year amounts have been reclassified to conform to current year presentation.
Other operating expenses and income comprise the following charges/(credits):
Other operating expensesShare-based payments expense (note 7) 16.0 13.9Amortisation of intangible assets (note 14) 25.3 9.1Goodwill impairment loss (note 14) 50.0 -Mark-to-market of undesignated derivative financial instruments:- energy hedges 4.5 -- forward foreign currency contracts - 0.1
Total 95.8 23.1
Other operating incomeExcess of fair value of identifiable net assets over consideration paid (note 33) (6.8) (4.3)Mark-to-market of undesignated derivative financial instruments:- energy hedges (1.1) (1.1)- forward foreign currency contracts (0.2) (0.1)Income from financial assets (1.8) (3.4)Capital grants released (note 28) (2.0) (2.0)
Total (11.9) (10.9)
4. Group Operating Profit
Group operating profit has been arrived at after charging/(crediting) the following amounts (including the Group’s proportionate share of amounts in joint ventures): 2006 2005 §m §mDepreciation- included in cost of sales 413.5 329.7- included in operating costs 250.2 226.1
Total 663.7 555.8
Foreign exchange gains and losses (net)- included in cost of sales 0.7 0.1- included in operating costs (0.2) (0.5)
Total 0.5 (0.4)
Operating lease rentals- hire of plant and machinery 82.1 49.6- land and buildings 98.4 79.3- other operating leases 40.1 35.8
Total 220.6 164.7
Auditors’ remuneration (included in administrative expenses)Audit fees, including Sarbanes-Oxley attestation 16.8 9.1Non-audit services comprising the following:- Sarbanes-Oxley Section 404 preparatory work - 0.5- taxation advice and compliance 0.4 0.6- acquisition-related financial due diligence (i) 0.6 0.1 - other advice 0.3 0.2
(i) In addition to the due diligence fees expensed in the Group Income Statement, further due diligence fees of §0.3 million (2005 : §0.7 million) paid to the auditors have been included in the fair value of purchase consideration of business combinations for the respective periods.

76 CRH
5. Directors’ Emoluments and Interests
Directors’ emoluments and interests (which are included in administrative expenses in note 3) are given in the Report on Directors’ Remuneration on pages 50 to 57 of this Annual Report.
6. Employment
The average number of employees (including CRH’s proportionate share of employees in joint ventures) is as follows:
Year ended 31st December 2006 Total Products & Total Materials Products Distribution Distribution GroupEurope 12,221 17,705 8,420 26,125 38,346Americas 18,856 18,867 3,491 22,358 41,214
Total 31,077 36,572 11,911 48,483 79,560
Year ended 31st December 2005
Europe 11,605 14,579 6,497 21,076 32,681Americas 14,493 16,339 2,953 19,292 33,785
Total 26,098 30,918 9,450 40,368 66,466
Employment costs charged in the Group Income Statement (including the Group’s proportionate share of joint ventures’ costs) are analysed as follows: 2006 2005 §m §m
Wages and salaries 2,688.7 2,222.9Social welfare costs 336.8 278.5Other employment-related costs 348.9 262.1Share-based payment expense (note 7) 16.0 13.9Total pension costs (note 27) 139.6 163.2
Total 3,530.0 2,940.6
Total charge analysed between:Cost of sales 1,657.6 1,383.3Operating costs 1,884.5 1,562.7Finance costs (net) - defined benefit pension schemes (note 8) (12.1) (5.4)
Total 3,530.0 2,940.6
7. Share-based Payments 2006 2005 §m §m
Share option expense 14.7 13.9Performance Share Plan expense 1.3 -
16.0 13.9
§1.1 million (2005 : §0.9 million) of the total expense reported in the Group Income Statement relates to the Directors.
Notes on Financial Statements

77CRH
7. Share-based Payments continued
Share Option Schemes
The Group operates share option schemes, which were approved by shareholders in May 2000 (replacing the schemes which were approved in May 1990), and savings-related share option schemes, also approved by shareholders in May 2000. The general terms and conditions applicable to the share options granted by CRH under these schemes are set out in the Report on Directors’ Remuneration on pages 50 to 57.
The Group’s employee share options are equity-settled share-based payments as defined in IFRS 2 Share-based Payment. The IFRS requires that a recognised valuation methodology be employed to determine the fair value of share options granted and stipulates that this methodology should be consistent with methodologies used for the pricing of financial instruments. The expense of §14.7 million (2005 : §13.9 million) reported in the Group Income Statement has been arrived at through applying the trinomial model, which is a lattice option-pricing model.
Impact on Group Income Statement
The measurement requirements of IFRS 2 have been implemented in respect of share options that were granted after 7th November 2002. As options to acquire Ordinary Shares in the Company are traditionally granted in April of each year, the expense disclosed in the Group Income Statement relates to options granted in April 2003 and in the subsequent periods.
The total share option expense is analysed as follows: Expense in Group Duration Weighted Income Statement Grant of vesting Number of average 2006 2005 price period options fair value §m §mGranted in 2003Share option schemes §13.15 / §13.26 / Stg£9.06 3 and 5 years 4,303,500 §3.63 1.6 4.5Savings-related share option schemes §10.63 / Stg£7.18 3 and 5 years 773,380 §3.73 0.2 0.8 Granted in 2004Share option schemes §16.71 / §16.73 / Stg£11.13 3 and 5 years 4,486,240 §4.37 4.6 5.5Savings-related share option schemes §14.45 / Stg£9.66 3 and 5 years 225,336 §4.67 0.2 0.3
Granted in 2005Share option schemes §20.79 / §20.91 / Stg£14.37 3 years 2,429,950 §4.32 3.4 2.6 Savings-related share option schemes §17.99 / Stg£12.38 3 and 5 years 174,984 §5.41 0.2 0.2 Granted in 2006 Share option schemes §29.00 / §24.83 / Stg£19.99 3 years 2,604,243 §6.39 4.0 -Savings-related share option schemes §23.16 / Stg£15.68 3 and 5 years 350,140 §7.12 0.5 -
14.7 13.9
Details of options granted under the share option schemes
A summary of activity under the Company’s share option schemes in the two years ended 31st December 2006 and 31st December 2005 together with the weighted average exercise price of the share options is as follows:
Weighted average Number of Weighted average Number of exercise price options exercise price optionsShare options 2006 2005Outstanding at beginning of year §16.75 / Stg£11.32 26,434,144 §16.11 / Stg£10.11 26,687,557 Granted (a) §28.68 / Stg£19.99 2,618,400 §20.85 / Stg£14.37 2,484,300 Exercised §15.28 / Stg£10.35 (4,886,939) §13.51 / Stg£8.25 (2,246,031)Lapsed §18.00 / Stg£13.93 (380,237) §17.11 / Stg£11.24 (491,682)
Outstanding at end of year §18.33 / Stg£13.85 23,785,368 §16.75 / Stg£11.32 26,434,144
Exercisable at end of year §16.02 / Stg£11.16 7,270,476 §14.41 / Stg£9.31 5,614,157
(a) Pursuant to the 2000 share option schemes, employees were granted options over 2,618,400 (2005 : 2,484,300) of the Company’s Ordinary Shares on 10th April 2006 (2,418,400) and 21st June 2006 (200,000) respectively. These options may be exercised after the expiration of three years from their date of grant, subject to specified EPS growth targets being achieved. All options granted have a life of ten years.

78 CRH
7. Share-based Payments continued
Analysis of share options - outstanding at end of year 31st December 2006 31st December 2005
Actual Actual Exercise Number remaining Number remaining prices of options life of options lifeOptions by exercise price § options §6.53 - - 307,714 0.3 §7.09 39,192 0.3 148,973 1.3 §7.10 258,532 0.3 410,616 1.3 §12.64 549,639 1.3 878,537 2.3 §14.57 319,714 2.3 543,256 3.3 §14.66 571,149 2.3 875,772 3.3 §17.26 1,810,775 3.3 2,222,394 4.3 §18.01 1,621,136 3.3 2,178,620 4.3 §18.28 2,561,178 4.3 3,429,399 5.3 §19.68 3,139,102 5.3 3,896,179 6.3 §13.15 1,793,707 6.3 2,297,968 7.3 §13.26 1,577,980 6.3 1,983,500 7.3 §16.71 2,517,799 7.3 2,600,199 8.3 §16.73 1,910,500 7.3 1,986,000 8.3 §20.79 1,292,640 8.3 1,320,990 9.3 §20.91 1,095,000 8.3 1,121,000 9.3 §24.83 200,000 9.5 - - §29.00 2,370,711 9.3 - -Stg£ options Stg£5.33 - - 16,467 0.3 Stg£8.22 975 1.3 1,825 2.3 Stg£10.99 18,497 3.3 40,105 4.3 Stg£11.16 20,426 4.3 54,601 5.3 Stg£12.04 22,880 5.3 53,546 6.3 Stg£9.06 6,853 6.3 12,732 7.3 Stg£11.13 14,441 7.3 14,441 8.3 Stg£14.37 39,010 8.3 39,310 9.3 Stg£19.99 33,532 9.3 - -
Total outstanding as at 31st December 23,785,368 26,434,144
Analysis of share options - exercisable at end of year
Options by exercise price § options §6.53 - - 307,714 0.3 §7.09 39,192 0.3 148,973 1.3 §7.10 258,532 0.3 410,616 1.3 §12.64 549,639 1.3 878,537 2.3 §14.57 319,714 2.3 543,256 3.3 §14.66 571,149 2.3 875,772 3.3 §17.26 776,045 3.3 1,123,991 4.3 §18.01 764,307 3.3 1,266,901 4.3 §18.28 1,184,178 4.3 - - §19.68 1,283,502 5.3 - - §13.15 785,607 6.3 - - §13.26 668,980 6.3 - -Stg£ options Stg£5.33 - - 16,467 0.3 Stg£8.22 975 1.3 1,825 2.3 Stg£10.99 18,497 3.3 40,105 4.3 Stg£11.16 20,426 4.3 - - Stg£12.04 22,880 5.3 - - Stg£9.06 6,853 6.3 - -
Total exercisable as at 31st December 7,270,476 5,614,157
Notes on Financial Statements

79CRH
7. Share-based Payments continued
The weighted average fair values assigned to options granted under the Company’s 2000 share option schemes, which were computed in accordance with the trinomial valuation methodology, were as follows: Denominated in
§ § Stg£* Stg£* 3-year 5-year 3-year 5-yearGranted during 2006 (amounts in §) 6.39 n/a 6.49 n/aGranted during 2005 (amounts in §) 4.32 n/a 4.31 n/a
* § equivalents at the date of grant
The fair values of these options were determined using the following assumptions: 2006 2005 3-year 5-year 3-year 5-yearWeighted average exercise price (amounts in §) 28.68 n/a 20.85 n/aRisk-free interest rate (%) 3.64 / 3.77 n/a 3.03 n/aExpected dividend payments over the expected life (§ cent) 324.62 n/a 260.74 n/aExpected volatility (%) 23.2 / 22.4 n/a 23.3 n/aExpected life in years 5 n/a 5 n/a
The expected volatility was determined using an historical sample of 61 month-end CRH share prices in respect of the three-year share options. Share options are granted at market value at the date of grant. The expected lives of the options are based on historical data and are therefore not necessarily indicative of exercise patterns that may materialise.
Other than the assumptions listed above, no other features of options grants were factored into the determination of fair value.
The terms of the options granted under the share option scheme do not contain any market conditions within the meaning of IFRS 2.
No modifications were effected to the share option schemes during the course of 2006 or 2005.
Details of options granted under the savings-related share option schemes
Weighted Weighted average Number of average Number of exercise price options exercise price optionsSavings-related share options 2006 2005
Outstanding at beginning of year §12.71 / Stg£8.76 1,434,061 §12.20 / Stg£8.30 1,503,969 Granted (a) §23.16 / Stg£15.68 358,986 §17.99 / Stg£12.38 201,077Exercised §12.40 / Stg£7.62 (450,229) §14.57 / Stg£9.07 (181,944)Lapsed §14.35 / Stg£10.41 (79,196) §12.16 / Stg£9.43 (89,041)
Outstanding at end of year §15.85 / Stg£10.97 1,263,622 §12.71 / Stg£8.76 1,434,061
Exercisable at end of year §15.39 / Stg£7.18 1,948 Stg£8.79 55,011
(a) Pursuant to the savings-related share option schemes operated by the Company in the Republic of Ireland and the United Kingdom, employees were granted options over 358,986 of the Company’s Ordinary Shares on 7th April 2006 (2005 : 201,077 share options on 1st April 2005). This figure comprises options over 202,624 (2005 : 113,330) shares and 156,362 (2005 : 87,747) shares which are normally exercisable within a period of six months after the third or the fifth anniversary of the contract, whichever is applicable, and are not subject to specified EPS growth targets being achieved. The exercise price at which the options are granted under the schemes represents a discount of 15% to the market price on the date of grant.

80 CRH
7. Share-based Payments continued
Analysis of savings-related share options - outstanding at end of year 31st December 2006 31st December 2005
Weighted Weighted average average remaining remaining Exercise Number contractual Number contractualOptions by exercise price prices of options life (years) of options life (years)
§ options §15.39 871 0.1 82,286 0.9 §16.09 19,782 0.9 20,508 1.9 §10.63 200,447 1.9 336,165 2.2 §14.45 61,952 1.8 65,151 2.9 §17.99 50,573 3.0 56,028 4.0 §23.16 139,361 3.9 - -Stg£ options Stg£8.77 - - 54,409 0.4 Stg£10.08 56,166 0.9 59,096 1.9 Stg£7.18 239,310 1.9 455,912 2.0 Stg£9.66 160,229 1.7 169,451 2.7 Stg£12.38 124,152 2.7 135,055 3.7 Stg£15.68 210,779 3.7 - -
Total outstanding as at 31st December 1,263,622 1,434,061
As at 31st December 2006, 1,948 (2005 : 55,011) options were exercisable under the savings-related share option schemes.
The weighted average fair values assigned to options issued under the savings-related share option schemes, which were computed in accordance with the trinomial valuation methodology, were as follows: Denominated in
§ § Stg£* Stg£* 3-year 5-year 3-year 5-yearGranted during 2006 (amounts in §) 6.54 7.88 6.54 7.88Granted during 2005 (amounts in §) 5.08 5.83 5.08 5.83
* § equivalents at the date of grant
The fair values of these options were determined using the following assumptions: 2006 2005 3-year 5-year 3-year 5-yearWeighted average exercise price (amounts in §) 23.16 23.16 17.99 17.99Risk-free interest rate (%) 3.43 3.64 2.67 3.03Expected dividend payments over the expected life (§ cent) 162.94 324.62 134.29 260.74Expected volatility (%) 20.8 23.2 23.4 23.3Expected life in years 3 5 3 5
The expected volatility was determined using an historical sample of 37 month-end CRH share prices in respect of the three-year savings-related share options and 61 month-end share prices in respect of the five-year savings-related share options. The expected lives of the options are based on historical data and are therefore not necessarily indicative of exercise patterns that may materialise.
Other than the assumptions listed above, no other features of options grants were factored into the determination of fair value.
The terms of the options issued under the savings-related share option schemes do not contain any market conditions within the meaning of IFRS 2.
No modifications were effected to the savings-related share option schemes during the course of 2006 or 2005.
Notes on Financial Statements

81CRH
7. Share-based Payments continued
Performance Share Plan
The Group operates a Performance Share Plan which was approved by shareholders in May 2006. The general terms and conditions applicable to shares awarded by CRH under this Plan are set out in the Report on Directors’ Remuneration on pages 50 to 57.
Shares awarded under the Group’s Performance Share Plan are equity-settled share-based payments as defined in IFRS 2 Share-based Payment. The IFRS requires that a recognised valuation methodology be employed to determine the fair value of shares awarded and stipulates that this methodology should be consistent with methodologies used for the pricing of financial instruments. The expense of §1.3 million (2005 : nil) reported in the Group Income Statement has been arrived at through applying a Monte Carlo simulation technique to model the combination of market and non-market based performance conditions in the Plan.
Impact on Group Income Statement
The first award of shares under the Plan was in June 2006 when a total of 627,750 shares were awarded.
The total expense is analysed as follows: Expense in Group Income Statement Period to Share price earliest Number Fair 2006 2005Granted in 2006 at date of award release date of shares value §m §m
Performance Share Plan §24.82 3 years 627,750 §12.11 1.3 -
The fair value of the shares awarded were determined using a Monte Carlo simulation technique taking account of peer group total shareholder return volatilities and correlations, together with the following assumptions:
Risk-free interest rate (%) 3.77 n/aExpected volatility (%) 20.0 n/a
The expected volatility was determined using an historical sample of 37 month-end CRH share prices.
Impact on Group Balance Sheet
In accordance with the terms of the Performance Share Plan, following the award of 627,750 shares in June 2006, the same number of Ordinary Shares was purchased by the Trustees of the Plan at a total cost of §15.7 million. These shares are accounted for as treasury shares in the Group Balance Sheet (see note 29), and are stated net of the IFRS 2 expense of §1.3 million charged in the Group Income Statement.

82 CRH
8. Finance Costs and Finance Revenue 2006 2005 §m §mFinance costs Interest payable on bank loans and overdrafts repayable wholly within five years:- by instalments 17.7 9.5- not by instalments 154.4 93.3Interest payable under finance leases and hire purchase contracts 3.2 2.5Interest payable on other borrowings 108.8 93.1
284.1 198.4Unwinding of discount element of provisions for liabilities (note 25) 19.3 9.1Unwinding of discount applicable to deferred and contingent acquisition consideration 8.1 6.5Mark-to-market of designated fair value hedges and related debt and ineffectiveness of net investment hedges:- interest rate swaps (i) 42.2 85.9- currency swaps and forward contracts 3.0 (5.7)- gross hedged fixed rate debt (i) (42.1) (85.1)Interest cost on defined benefit pension scheme liabilities 92.7 88.3
Total finance costs 407.3 297.4
Finance revenueInterest receivable on loans to joint ventures and associates (5.1) (4.1)Other interest receivable (45.3) (40.5)
(50.4) (44.6)Expected return on defined benefit pension scheme assets (104.8) (93.7)
Total finance revenue (155.2) (138.3)
Finance costs (net) 252.1 159.1
(i) The Group uses interest rate swaps to convert fixed rate debt to floating rate. Fixed rate debt, which has been converted to floating rate through the use of interest rate swaps, is stated in the Group Balance Sheet at adjusted fair value to reflect movements in underlying fixed rates. The movement on this adjustment, together with the offsetting movement in the fair value of the related interest rate swaps, is taken to income in each reporting period.
9. Group Share of Associates’ Profit after Tax
The Group’s share of associates’ profit after tax is equity-accounted and is presented as a single-line item in the Group Income Statement. The Group’s share of profit after tax generated by associates is analysed as follows between the principal Group Income Statement captions: 2006 2005 §m §m Group share of:Revenue 772.9 560.9
Profit before finance costs 71.8 37.6Finance costs (net) (1.4) (2.8)
Profit before tax 70.4 34.8Income tax expense (23.2) (8.9)
Profit after tax (i) 47.2 25.9
(i) The Group’s share of associates’ profit after tax comprises §36.1 million (2005 : §17.8 million) in Europe Materials, §2.3 million (2005 : §0.3 million) in Europe Products, §6.8 million (2005 : §7.4 million) in Europe Distribution and §2.0 million (2005 : §0.4 million) in Americas Materials.
The aggregated balance sheet data (analysed between current and non-current assets and liabilities) in respect of the Group’s investments in associates is presented in note 15.
Notes on Financial Statements

83CRH
10. Income Tax Expense 2006 2005 §m §mCurrent tax IrelandCorporation tax at 12.5% (2005 : 12.5%) 22.6 16.2 Less: manufacturing relief (4.2) (3.3)
18.4 12.9Overseas tax 297.6 213.0Tax on disposal of fixed assets 12.0 4.6
Total current tax 328.0 230.5
Deferred taxOrigination and reversal of temporary differences: Defined benefit pension obligations 10.1 5.8Share-based payments 3.3 (1.6)Derivative financial instruments 0.1 0.2Other items 36.7 37.7
Total deferred tax 50.2 42.1
Income tax expense 378.2 272.6
Reconciliation of applicable tax rate to effective tax rateProfit before tax (§m) 1,602.4 1,278.9Tax charge expressed as a percentage of profit before tax (effective tax rate): - current tax expense only 20.5% 18.0%- total income tax expense (current and deferred) 23.6% 21.3%
The following table reconciles the applicable Republic of Ireland statutory tax rate to the effective tax rate (current and deferred) of the Group:
% of profit before tax
Irish corporation tax rate 12.5 12.5Manufacturing relief in the Republic of Ireland (0.3) (0.3)Higher tax rates on overseas earnings 12.9 14.9Other items (comprising items not chargeable to tax/expenses not deductible for tax) (1.5) (5.8)
Total effective tax rate 23.6 21.3
Deferred tax movements applicable to items recognised directly within equity §m §m
Defined benefit pension obligations (41.4) 21.7Share-based payments 26.7 12.3 Cash flow hedges 0.4 (0.7)
Total (14.3) 33.3

84 CRH
10. Income Tax Expense continued
Factors that may affect future tax charges and other disclosure requirements
Excess of capital allowances over depreciationBased on current capital investment plans, the Group expects to continue to be in a position to claim capital allowances in excess of depreciation in future years.
Unremitted earnings in subsidiaries, joint ventures and associatesNo provision has been recognised in respect of the unremitted earnings of subsidiaries and joint ventures as there is no commitment to remit earnings. A deferred tax liability has been recognised in relation to unremitted earnings of associates on the basis that the exercise of significant influence would not necessarily prevent earnings being remitted by other shareholders in the undertaking.
Investments in subsidiaries and associates and interests in joint venturesNo provision has been made for temporary differences applicable to investments in subsidiaries and interests in joint ventures as the Group is in a position to control the timing of reversal of the temporary difference and it is probable that the temporary difference will not reverse in the foreseeable future. Due to the absence of control in the context of associates, deferred tax liabilities are recognised where appropriate in respect of CRH’s investments in these entities. Given that participation exemptions and tax credits would be available in the context of the Group’s investments in subsidiaries and joint ventures in the majority of the jurisdictions in which the Group operates, the aggregate amount of temporary differences in respect of which deferred tax liabilities have not been recognised would be immaterial.
Other considerationsThe total tax charge in future periods will be affected by any changes to the corporation tax rates in force in the countries in which the Group operates. The current tax charge will also be impacted by changes in the excess of tax depreciation (capital allowances) over accounting depreciation and the use of tax credits.
11. Dividends
As shown in note 29, the Company has various classes of share capital in issue comprising Ordinary Shares, 5% Cumulative Preference Shares and 7% ‘A’ Cumulative Preference Shares. The dividends paid and proposed in respect of these classes of share capital are as follows: 2006 2005 Dividends to shareholders §m §m Preference 5% Cumulative Preference Shares §3,175 (2005 : §3,175) - - 7% ‘A’ Cumulative Preference Shares §77,521 (2005 : §77,521) 0.1 0.1EquityFinal - paid 27.75c per Ordinary Share in May 2006 (23.40c paid in May 2005) 149.3 124.8Interim - paid 13.50c per Ordinary Share (2005 : 11.25c) 73.0 60.3
Total 222.4 185.2
Dividends proposed (memorandum disclosure)EquityFinal 2006 - proposed 38.50c per Ordinary Share (2005 : 27.75c) 208.7 148.8
Reconciliation to Cash Flow StatementDividends to shareholders 222.4 185.2Less: issue of shares in lieu of dividend (i) (24.5) (21.0)
Dividends paid to equity holders of the Company 197.9 164.2Dividends paid by subsidiaries to minority interests (note 31) 11.9 9.4
Total dividends paid 209.8 173.6
(i) In accordance with the scrip dividend scheme, shares to the value of §24.5 million (2005 : §21.0 million) were issued in lieu of dividends.
Notes on Financial Statements

85CRH
12. Earnings per Ordinary Share 2006 2005 §m §mThe computation of basic and diluted earnings per Ordinary Share is set out below:
Numerator computations - basic and diluted earnings per Ordinary ShareGroup profit for the financial year 1,224.2 1,006.3Profit attributable to minority interest (14.0) (8.4)
Profit attributable to equity holders of the Company 1,210.2 997.9Preference dividends (0.1) (0.1)
Profit attributable to ordinary equity holders of the Company 1,210.1 997.8Amortisation of intangible assets 25.3 9.1
Profit attributable to ordinary equity holders of the Company excluding amortisation of intangible assets 1,235.4 1,006.9Depreciation 663.7 555.8
Numerator for “cash” earnings per Ordinary Share (ii) 1,899.1 1,562.7
Denominator computationsDenominator for basic earnings per Ordinary ShareWeighted average number of Ordinary Shares (millions) outstanding for the year 539.4 534.3Effect of dilutive potential Ordinary Shares (employee share options) (i) 4.7 4.4
Denominator for diluted earnings per Ordinary Share 544.1 538.7
Basic earnings per Ordinary Share- including amortisation of intangible assets 224.3c 186.7c
- excluding amortisation of intangible assets 229.0c 188.5c
Diluted earnings per Ordinary Share- including amortisation of intangible assets 222.4c 185.2c
- excluding amortisation of intangible assets 227.1c 186.9c
“Cash” earnings per Ordinary Share (ii) 352.1c 292.5c
(i) In accordance with IAS 33 Earnings per Share, the issue of certain Ordinary Shares in respect of employee share options is contingent upon satisfaction of specified performance conditions in addition to the passage of time. These contingently issuable Ordinary Shares (totalling 16,514,892 at 31st December 2006 and 14,314,762 at 31st December 2005) are excluded from the computation of diluted earnings per Ordinary Share where the conditions governing exercisability have not been satisfied as at the end of the reporting period. Vesting of shares awarded under the Performance Share Plan is also contingent upon satisfaction of specified performance conditions and these shares have also been excluded from the computation of diluted earnings.
(ii) “Cash” earnings per Ordinary Share, a non-GAAP measure computed through adding amortisation of intangible assets and depreciation to profit attributable to ordinary equity holders of the Company, is presented here for information as management believes it is a useful indicator of the Group’s ability to generate cash from operations.

86 CRH
13. Property, Plant and Equipment Assets in Land and Plant and course of buildings machinery Transport construction Total31st December 2006 §m §m §m §m §m At 1st January, net of accumulated depreciation 3,678.7 2,599.1 256.8 288.9 6,823.5 Translation adjustment (212.8) (156.2) (23.4) (14.9) (407.3) Reclassifications of assets in course of construction 66.8 80.7 65.5 (213.0) - Additions at cost 91.8 428.4 87.2 224.9 832.3 Arising on acquisition (note 33) 413.7 633.0 21.1 15.8 1,083.6 Disposals (46.4) (118.7) (23.8) - (188.9) Depreciation charge for year (135.6) (455.8) (72.3) - (663.7)
At 31st December, net of accumulated depreciation 3,856.2 3,010.5 311.1 301.7 7,479.5
At 31st December 2006 Cost/deemed cost 4,688.7 5,675.0 656.1 301.7 11,321.5 Accumulated depreciation (832.5) (2,664.5) (345.0) - (3,842.0)
Net carrying amount 3,856.2 3,010.5 311.1 301.7 7,479.5
The equivalent disclosure for the prior year is as follows:
31st December 2005 At 1st January, net of accumulated depreciation 3,185.6 2,221.6 203.8 219.6 5,830.6 Translation adjustment 232.0 191.3 23.2 20.3 466.8 Reclassifications of assets in course of construction 49.9 48.9 2.1 (100.9) - Additions at cost 95.7 352.6 61.9 141.9 652.1 Arising on acquisition (note 33) 284.1 182.5 27.8 8.0 502.4 Disposals (51.3) (17.0) (4.3) - (72.6)Depreciation charge for year (117.3) (380.8) (57.7) - (555.8)
At 31st December, net of accumulated depreciation 3,678.7 2,599.1 256.8 288.9 6,823.5
At 31st December 2005 Cost/deemed cost 4,389.0 4,932.7 578.9 288.9 10,189.5 Accumulated depreciation (710.3) (2,333.6) (322.1) - (3,366.0)
Net carrying amount 3,678.7 2,599.1 256.8 288.9 6,823.5
The carrying value of mineral-bearing land included in the land and buildings category above amounted to §1,792.5 million at the balance sheet date (2005 : §1,812.2 million).
Borrowing costs capitalised during the financial year were not material.
Revaluation of land and buildings
Land and buildings purchased since 31st December 1980 are reflected at cost. Land and buildings (excluding buildings of a specialised nature) purchased prior to 31st December 1980 were revalued by professional valuers at that date on an existing use basis; this revaluation was carried forward as deemed cost under the transitional provisions of IFRS 1 First-time Adoption of International Financial Reporting Standards. Other than the aforementioned revaluation, all items of property, plant and equipment are recorded at cost.
The original historical cost of revalued assets cannot be obtained without unreasonable expense. The analysis of land and buildings assets held at deemed cost and at cost is as follows: 2006 2005 §m §m
At deemed cost as at 31st December 1980 56.0 56.7 At cost post 31st December 1980 4,632.7 4,332.3
Total 4,688.7 4,389.0
Notes on Financial Statements
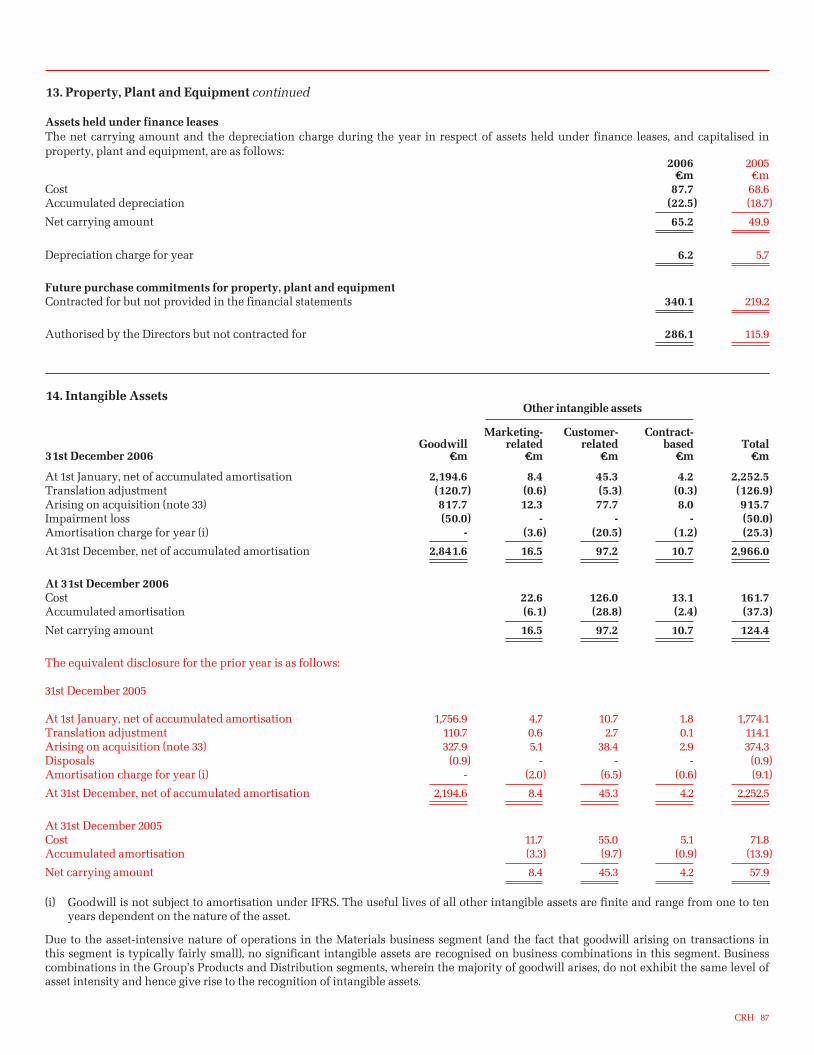
87CRH
13. Property, Plant and Equipment continued
Assets held under finance leasesThe net carrying amount and the depreciation charge during the year in respect of assets held under finance leases, and capitalised in property, plant and equipment, are as follows: 2006 2005 §m §mCost 87.7 68.6Accumulated depreciation (22.5) (18.7)
Net carrying amount 65.2 49.9
Depreciation charge for year 6.2 5.7
Future purchase commitments for property, plant and equipmentContracted for but not provided in the financial statements 340.1 219.2
Authorised by the Directors but not contracted for 286.1 115.9
14. Intangible Assets Other intangible assets Marketing- Customer- Contract- Goodwill related related based Total31st December 2006 §m §m §m §m §m
At 1st January, net of accumulated amortisation 2,194.6 8.4 45.3 4.2 2,252.5 Translation adjustment (120.7) (0.6) (5.3) (0.3) (126.9) Arising on acquisition (note 33) 817.7 12.3 77.7 8.0 915.7 Impairment loss (50.0) - - - (50.0) Amortisation charge for year (i) - (3.6) (20.5) (1.2) (25.3)
At 31st December, net of accumulated amortisation 2,841.6 16.5 97.2 10.7 2,966.0
At 31st December 2006Cost 22.6 126.0 13.1 161.7 Accumulated amortisation (6.1) (28.8) (2.4) (37.3)
Net carrying amount 16.5 97.2 10.7 124.4
The equivalent disclosure for the prior year is as follows: 31st December 2005
At 1st January, net of accumulated amortisation 1,756.9 4.7 10.7 1.8 1,774.1 Translation adjustment 110.7 0.6 2.7 0.1 114.1 Arising on acquisition (note 33) 327.9 5.1 38.4 2.9 374.3 Disposals (0.9) - - - (0.9) Amortisation charge for year (i) - (2.0) (6.5) (0.6) (9.1)
At 31st December, net of accumulated amortisation 2,194.6 8.4 45.3 4.2 2,252.5
At 31st December 2005 Cost 11.7 55.0 5.1 71.8 Accumulated amortisation (3.3) (9.7) (0.9) (13.9)
Net carrying amount 8.4 45.3 4.2 57.9
(i) Goodwill is not subject to amortisation under IFRS. The useful lives of all other intangible assets are finite and range from one to ten years dependent on the nature of the asset.
Due to the asset-intensive nature of operations in the Materials business segment (and the fact that goodwill arising on transactions in this segment is typically fairly small), no significant intangible assets are recognised on business combinations in this segment. Business combinations in the Group’s Products and Distribution segments, wherein the majority of goodwill arises, do not exhibit the same level of asset intensity and hence give rise to the recognition of intangible assets.

88 CRH
14. Intangible Assets continued
GoodwillThe goodwill balances disclosed above include goodwill arising on the acquisition of joint ventures which are accounted for on the basis of proportionate consolidation. Goodwill arising in respect of investments in associates is included in investments in associates in the Group Balance Sheet (see note 15).
The net book value of goodwill capitalised under previous GAAP (Irish GAAP) as at the transition date to IFRS (1st January 2004) has been treated as deemed cost. Goodwill arising on acquisition since that date is capitalised at cost.
Impairment testing Goodwill is subject to impairment testing on an annual basis. Testing in 2006 identified an impairment in respect of the Group’s share of goodwill in the Cementbouw bv joint venture which was established in 2003 in a leveraged buyout of Cementbouw’s materials trading and readymixed concrete operations in the Netherlands, undertaken in conjunction with CRH’s 100% purchase of Cementbouw’s distribution, concrete and clay products activities. A significant portion of the financing for the joint venture was provided in the form of non-recourse debt. The joint venture has experienced difficult trading in recent years and is currently in discussions with its banking group. An impairment loss of §50.0 million has been recognised in the Group Income Statement, and is reflected in the segment result for Europe Products (note 1).
No impairment losses were recognised by the Group in 2005.
Cash-generating unitsGoodwill acquired through business combination activity has been allocated to cash-generating units for the purposes of impairment testing based on the business segment into which the business combination will be assimilated. The cash-generating units represent the lowest level within the Group at which the associated goodwill is monitored for internal management purposes and are not larger than the primary and secondary segments determined in accordance with IAS 14 Segment Reporting. A total of 22 cash-generating units has been identified and these are analysed as follows between the six business segment in the Group.
Cash-generating unitsEurope Materials 7Europe Products 5Europe Distribution 1Americas Materials 4Americas Products 4Americas Distribution 1
Total cash-generating units 22
Impairment testing methodology and resultsThe recoverable amount of each of the 22 cash-generating units is determined based on a value-in-use computation. The cash flow forecasts employed for the value-in-use computation are extracted from a five-year strategic plan document formally approved by senior management and the Board of Directors and specifically exclude incremental profits and other cash flows stemming from future acquisition activity. The five-year cash flows obtained from this document are projected forward for an additional five years using the lower of historical compound annual growth and anticipated inflation as the relevant general growth factor. A 20-year annuity-based terminal value is calculated using the average of the last five years’ cash flows adjusted to take account of cumulative inflation to year 10 (being the end of the projection period); the terminal value specifically excludes any underlying growth assumption. The recoverable amount stemming from this exercise represents the present value of the future cash flows, including the terminal value, discounted at a before-tax weighted average cost of capital appropriate to the cash-generating unit being assessed for impairment; the before-tax discount rates range from 7.4% to 10.6% (2005 : 7.4% to 10.8%). The average before-tax discount rate represents a premium of circa 0.5 percentage points on the Group’s estimated before-tax weighted average cost of capital.
Key assumptions include management’s estimates of future profitability, replacement capital expenditure requirements, trade working capital investment needs and tax considerations. The duration of the discounted cash flow model is a significant factor in determining the fair value of the cash-generating units and has been arrived at taking account of the Group’s strong financial position, its established history of earnings growth and cash flow generation, its proven ability to pursue and integrate value-enhancing acquisitions and the nature of the building materials industry where product obsolescence risk is very low.
Additional disclosures - significant goodwill amountsThe goodwill allocated to each of the 22 cash-generating units accounts for between 10% and 20% of the total carrying amount of §2,841.6 million (2005 : §2,194.6 million) in one instance and less than 10% of the total carrying amount in all other cases. The additional disclosures required under IAS 36 Impairment of Assets in relation to significant goodwill amounts arising in this cash-generating unit (Europe Distribution within the Europe Products & Distribution Division) are as follows: Europe DistributionCarrying amount of goodwill allocated to the cash-generating unit §334.4mCarrying amount of indefinite-lived intangible assets allocated to the cash-generating unit NilBasis on which recoverable amount of the cash-generating unit has been assessed Value-in-useDiscount rate applied to the cash flow projections (real before-tax) 9.4%Excess of value-in-use over carrying amount §395.5m
Notes on Financial Statements

89CRH
14. Intangible Assets continued
The key assumptions used for the value-in-use computation for this cash-generating unit are in line with those addressed above. The values applied to each of the key assumptions are derived from a combination of internal and external factors based on historical experience and take into account the stability of cash flows typically associated with this business.
The cash flows for the cash-generating unit have been projected in line with the methodology disclosed above with the cash flows arising after the five-year period in the strategic plan document being projected forward for an additional five years using inflation as the relevant growth factor.
Given the magnitude of the excess of value-in-use over carrying amount, and the reasonableness of the key assumptions employed, no further disclosures relating to sensitivity of the value-in-use computations are required.
15. Financial Assets Investments in associates Total Share of financial net assets Goodwill Loans Total Other (i) assets31st December 2006 §m §m §m §m §m §m
At 1st January 415.7 109.0 2.9 527.6 106.9 634.5 Translation adjustment (4.3) (2.2) - (6.5) (0.7) (7.2) Arising on acquisition (note 33) 0.8 - - 0.8 0.2 1.0 Investments and advances 6.9 - 0.5 7.4 12.7 20.1 Disposals - - (0.4) (0.4) (22.6) (23.0) Retained profit less dividends paid 25.4 - - 25.4 - 25.4
At 31st December 444.5 106.8 3.0 554.3 96.5 650.8
The equivalent disclosure for the prior year is as follows:
31st December 2005 At 1st January 157.1 18.5 3.2 178.8 113.2 292.0 Translation adjustment 9.6 2.9 0.1 12.6 0.4 13.0 Reclassifications 17.0 - - 17.0 (17.0) - Arising on acquisition (note 33) 10.6 - 1.3 11.9 9.0 20.9 Investments and advances 211.3 87.6 - 298.9 7.7 306.6 Disposals (1.4) - (1.7) (3.1) (6.4) (9.5)Retained profit less dividends paid 11.5 - - 11.5 - 11.5
At 31st December 415.7 109.0 2.9 527.6 106.9 634.5
The investment in associates (including goodwill and loans payable) is analysed as follows: 2006 2005 §m §m
Non-current assets 599.9 602.9 Current assets 321.7 272.8 Non-current liabilities (including loans payable) (204.9) (179.1)Current liabilities (162.4) (169.0)
Net assets 554.3 527.6
The Group holds a 21.66% stake (2005 : 23.39%) in Groupe SAMSE, a publicly-quoted distributor of building materials to the merchanting sector in France which is accounted for as an associate investment above. The fair value of this investment as at the balance sheet date amounted to §59.7 million (2005 : §48.8 million).
(i) Other financial assets comprise trade investments carried at historical cost together with quoted investments at fair value and loans extended by the Group to joint ventures (which are treated as loans and receivables under IAS 39 Financial Instruments: Recognition and Measurement and are included within financial assets at historical cost). The balance as at 31st December 2006 comprises §14.1 million in respect of trade and quoted investments and §82.4 million in respect of loans to joint ventures (2005 : §22.0 million and §84.9 million respectively).

90 CRH
16. Disposal of Fixed Assets 2006 2005 §m §mFixed assets disposed of at net carrying amount:- property, plant and equipment (note 13) 188.9 72.6 - intangible assets (note 14) - 0.9 - financial assets (note 15) 23.0 9.5
Total 211.9 83.0 Profit on disposal of fixed assets 40.5 19.8
Proceeds from disposal of fixed assets - Group Cash Flow Statement 252.4 102.8
17. Inventories 2006 2005 §m §m
Raw materials 624.3 408.2 Work-in-progress (i) 73.0 112.6 Finished goods 1,339.1 1,201.8
Total inventories at the lower of cost and net realisable value 2,036.4 1,722.6
(i) Work-in-progress includes §17.4 million (2005 : §64.0 million) in respect of the cumulative costs incurred, net of amounts transferred to cost of sales under percentage-of-completion accounting, for construction contracts in progress at the balance sheet date.
Write-downs of inventories recognised as an expense within cost of sales amounted to §24.2 million (2005 : §16.5 million).
None of the above carrying amounts has been pledged as security for liabilities entered into by the Group.
18. Trade and Other Receivables 2006 2005 §m §mAll currentTrade receivables 2,220.1 1,924.8 Amounts receivable in respect of construction contracts (i) 428.7 170.7 Other receivables (ii) 339.6 226.4 Amounts receivable from associates 2.2 4.3 Prepayments and accrued income 181.1 150.2
Total 3,171.7 2,476.4
(i) Unbilled revenue at the balance sheet date in respect of construction contracts amounted to §109.2 million (2005 : nil).
(ii) Retentions held by customers at the balance sheet date amounted to §105.4 million (2005 : §35.4 million).
Notes on Financial Statements

91CRH
19. Trade and Other Payables 2006 2005 §m §mCurrentTrade payables 1,399.2 1,204.7 Irish employment-related taxes 4.6 4.9 Other employment-related taxes 51.1 42.4 Value added tax 92.1 72.6 Deferred and contingent acquisition consideration 109.8 72.5 Other payables (i) 383.4 242.6 Accruals and deferred income 719.3 589.5 Amounts payable to associates 28.9 25.2
Subtotal - current 2,788.4 2,254.4
Non-currentOther payables 23.5 25.1 Deferred and contingent acquisition consideration (stated at net present cost) due as follows:- between one and two years 29.3 38.7 - between two and five years 62.8 78.2 - after five years 43.8 45.6
Subtotal - non-current 159.4 187.6
Total 2,947.8 2,442.0
(i) Billings in excess of costs incurred together with advances received from customers in respect of work to be performed under construction contracts amounted to §187.8 million at the balance sheet date (2005 : §40.8 million).
20. Movement in Working Capital Trade and Trade and other other Inventories receivables payables Total31st December 2006 §m §m §m §m
At 1st January 1,722.6 2,476.4 (2,442.0) 1,757.0 Translation adjustment (100.7) (137.9) 125.2 (113.4) Arising on acquisition (note 33) 363.0 615.4 (438.3) 540.1 Deferred and contingent acquisition consideration: - arising on acquisitions during the year (note 33) - - (97.5) (97.5) - paid during the year - - 73.5 73.5 Interest accruals - 4.4 (39.5) (35.1) Reclassifications - - 3.7 3.7 Increase/(decrease) in working capital 51.5 213.4 (132.9) 132.0
At 31st December 2,036.4 3,171.7 (2,947.8) 2,260.3
The equivalent disclosure for the prior year is as follows:
31st December 2005
At 1st January 1,308.9 1,973.1 (1,864.1) 1,417.9 Translation adjustment 101.4 145.5 (151.3) 95.6 Arising on acquisition (note 33) 190.3 247.5 (228.4) 209.4 Deferred and contingent acquisition consideration: - arising on acquisitions during the year (note 33) - - (123.2) (123.2)- paid during the year - - 45.3 45.3 Interest accruals - 1.2 (20.9) (19.7)Reclassifications - - (17.7) (17.7)Increase/(decrease) in working capital 122.0 109.1 (81.7) 149.4
At 31st December 1,722.6 2,476.4 (2,442.0) 1,757.0

92 CRH
21. Liquid Investments and Cash and Cash Equivalents
Liquid investmentsLiquid investments comprise short-term deposits and current asset investments which are held as readily disposable stores of value and include investments in government gilts and commercial paper and deposits of less than one year in duration. The maturity of these investments falls outside the three months timeframe for classification as cash and cash equivalents under IAS 7 Cash Flow Statements, and accordingly, the related balances have been separately reported in the Group Balance Sheet and have been categorised as either “fair value through profit and loss” or “loans and receivables” in the table below. The credit risk attaching to these items is documented in note 23.
2006 2005 §m §m
Fair value through profit and loss 365.9 342.2 Loans and receivables 4.6 0.3
Total 370.5 342.5
Cash and cash equivalentsIn accordance with IAS 7, cash and cash equivalents comprise cash balances held for the purposes of meeting short-term cash commitments and investments which are readily convertible to a known amount of cash and are subject to an insignificant risk of change in value. Where investments are categorised as cash equivalents, the related balances have a maturity of three months or less from the date of investment. Bank overdrafts are included within current interest-bearing loans and borrowings in the Group Balance Sheet.
Cash and cash equivalents are reported at fair value and are analysed as follows: 2006 2005 §m §m
Cash at bank and in hand 718.6 294.0 Investments (short-term deposits) 383.0 854.6
Included in Group Balance Sheet and Group Cash Flow Statement 1,101.6 1,148.6
Cash at bank earns interest at floating rates based on daily deposit bank rates. Short-term deposits are made for varying periods of between one day and three months depending on the immediate cash requirements of the Group, and earn interest at the respective short-term deposit rates.
22. Interest-bearing Loans and Borrowings 2006 2005 §m §mBank loans and overdrafts: - unsecured 1,548.9 1,506.5 - secured * 39.8 42.8 Other term loans: - unsecured 4,034.2 3,167.4 - secured * 35.5 45.4
Group share of joint ventures’ interest-bearing loans and borrowings (non-current and current) 299.9 344.7
Interest-bearing loans and borrowings (non-current and current) 5,958.3 5,106.8
Included in current liabilities in the Group Balance Sheet: - loans repayable within one year (i) (449.1) (436.0)- bank overdrafts (196.3) (146.3)
Current interest-bearing loans and borrowings (645.4) (582.3)
Non-current interest-bearing loans and borrowings 5,312.9 4,524.5
* Secured on specific property, plant and equipment (i) Loans repayable within one year at 31st December 2006 include §86.2 million representing the Group’s 45% share of bank debt due by
the Cementbouw bv joint venture in the Netherlands. At the balance sheet date, Cementbouw bv was in breach of financial covenants on this debt due to a lower-than-permitted ratio of EBITDA to net debt. Cementbouw bv and its advisors are continuing to work to resolve this situation but, at the date of approval of these financial statements, the covenant breach remains unresolved. None of Cementbouw bv’s debt has any form of guarantee from, or other recourse to, CRH plc or any of its subsidiaries.
Notes on Financial Statements

93CRH
22. Interest-bearing Loans and Borrowings continued 2006 2005 §m §mRepayment scheduleWithin one year 645.4 582.3Between one and two years 239.7 332.0Between two and three years 1,201.2 236.8Between three and four years 227.7 1,272.1Between four and five years 762.2 244.3After five years 2,882.1 2,439.3
5,958.3 5,106.8
Instalment paymentsLoans fully repayable within five years:- not by instalments 2,845.9 2,348.0 - by instalments 201.7 247.9
Subtotal 3,047.6 2,595.9
Loans fully repayable in more than five years: - not by instalments 2,862.4 2,373.4 - by instalments** 48.3 137.5
Subtotal 2,910.7 2,510.9
Interest-bearing loans and borrowings (non-current and current) 5,958.3 5,106.8
** §19.7 million (2005 : §65.9 million) falls due for repayment after five years
Obligations under finance leasesObligations under finance leases included above (net of interest) are due as follows:
Within one year 16.8 13.3 Between one and two years 16.6 11.8 Between two and five years 13.7 18.3 After five years 6.7 6.0
53.8 49.4
Borrowing facilitiesVarious borrowing facilities are available to the Group. The undrawn committed facilities available as at 31st December 2006 and 31st December 2005, in respect of which all conditions precedent had been met, mature as follows:
Within one year 37.3 89.4 Between one and two years 77.2 12.3 Between two and five years 309.0 178.1 After five years 3.9 -
427.4 279.8
Included in the figures above is an amount of §137.1 million in respect of the Group’s share of facilities available to joint ventures (2005 : §91.7 million).
GuaranteesThe Company has given letters of guarantee to secure obligations of subsidiary undertakings as follows: §5,535.6 million in respect of loans, bank advances, derivative obligations and future lease obligations (2005 : §4,587.2 million), §10.7 million in respect of deferred and contingent acquisition consideration (2005 : §23.1 million), §204.6 million in respect of letters of credit (2005 : §186.4 million) and §14.2 million in respect of other obligations (2005 : §14.2 million).
Pursuant to the provisions of Section 17, Companies (Amendment) Act, 1986, the Company has guaranteed the liabilities of certain of its subsidiary undertakings and of a general partnership in the Republic of Ireland for the financial year ended 31st December 2006 and, as a result, such subsidiary undertakings and the general partnership have been exempted from the filing provisions of Section 7, Companies (Amendment) Act, 1986 and Regulation 20 of the European Communities (Accounts Regulations), 1993 respectively.
The Company has not guaranteed any debt or other obligations of joint ventures or associates.
Lender covenantsThe Group’s major bank facilities and debt issued pursuant to Note Purchase Agreements in private placements require the Group to maintain its consolidated EBITDA/net interest cover (excluding share of joint ventures) at no lower than 4.5 times for twelve-month periods ending 30th June and 31st December. Non-compliance with financial covenants would give the relevant lenders the right to demand early repayment of the related debt thus impacting the maturity profile of the Group’s debt and the Group’s liquidity.

94 CRH
23. Derivative Financial Instruments
Derivative financial instruments recognised as assets and liabilities in the Group Balance Sheet are analysed as follows: 2006 2005 §m §mNon-current assets Fair value hedges 71.3 135.2 Cash flow hedges 2.7 - Net investment hedges - 19.6
74.0 154.8
Current assets Fair value hedges - 4.8 Cash flow hedges 1.1 2.7 Net investment hedges 3.4 20.2 Not designated as hedges 0.8 3.0
5.3 30.7
Total assets 79.3 185.5
Non-current liabilities Fair value hedges (31.3) (12.7)Cash flow hedges (1.9) (0.8)Net investment hedges (13.8) -
(47.0) (13.5)
Current liabilities Fair value hedges (5.4) (1.3)Cash flow hedges (2.5) (0.1)Net investment hedges (26.2) (1.4)Not designated as hedges (4.0) (1.8)
(38.1) (4.6)
Total liabilities (85.1) (18.1)
Net (liability)/asset arising on derivative financial instruments (5.8) 167.4
Financial risk management objectives and policiesThe Group uses financial instruments throughout its businesses: interest-bearing loans and borrowings, cash and cash equivalents, short-dated liquid investments and finance leases are used to finance the Group’s operations; trade receivables and trade payables arise directly from operations; and derivatives, principally interest rate and currency swaps and forward foreign exchange contracts, are used to manage interest rate risks and currency exposures and to achieve the desired profile of borrowings. The Group does not trade in financial instruments nor does it enter into any leveraged derivative transactions.
Fair value hedges consist of cross currency interest rate swaps and single currency interest rate swaps. Cash flow hedges consist of interest rate swaps, commodity swaps and forward foreign exchange deals. Net investment hedges consist of foreign exchange swaps and cross currency interest rate swaps.
The main risks attaching to the Group’s financial instruments are interest rate risk, foreign currency risk, credit risk and liquidity risk. Commodity price risk is of minimal relevance given that exposure is confined to a small number of contracts entered into for the purpose of hedging future movements in energy costs. The Board reviews and agrees policies for the prudent management of each of these risks as documented below.
Interest rate risk The Group’s exposure to market risk for changes in interest rates stems predominantly from its long-term debt obligations. Interest cost is managed by a centrally-controlled treasury function using a mix of fixed and floating rate debt; in recent years, the Group’s target has been to fix interest rates on approximately 50% of net debt as at the period-end. With the objective of managing this mix in a cost-efficient manner, the Group enters into interest rate swaps, under which the Group contracts to exchange, at predetermined intervals, the difference between fixed and variable interest amounts calculated by reference to a pre-agreed notional principal.
Notes on Financial Statements

95CRH
23. Derivative Financial Instruments continued
The majority of these swaps are designated under IAS 39 to hedge underlying debt obligations; undesignated financial instruments are termed “not designated as hedges” in the preceding analysis of derivative financial instruments in the Group Balance Sheet.
Foreign currency riskDue to the nature of building materials, which in general exhibit a low value-to-weight ratio, CRH’s activities are conducted primarily in the local currency of the country of operation resulting in low levels of foreign currency transaction risk; variances arising in this regard are reflected in operating costs or cost of sales in the Group Income Statement in the period in which they arise.
Given its presence in 27 countries worldwide, the principal foreign exchange risk is translation-related arising from fluctuations in the euro value of the Group’s net investment in currencies other than the euro. The Group’s established policy is to spread its net worth across the currencies of its various operations with the objective of limiting its exposure to individual currencies and thus promoting consistency with the geographical balance of its operations. In order to achieve this objective, the Group manages its borrowings, where practicable and cost effective, partially to hedge its foreign currency assets. Hedging is done using currency borrowings in the same currency as the assets being hedged or through the use of other hedging methods such as currency swaps.
Credit riskIn addition to cash at bank and in hand, the Group holds significant cash balances which are invested on a short-term basis and are classified as either cash equivalents or liquid investments as discussed in note 21. These deposits and other financial instruments (principally certain derivatives and loans and receivables included within financial assets) give rise to credit risk on amounts due from counterparties. Credit risk is managed by limiting the aggregate amount and duration of exposure to any one counterparty primarily depending on its credit rating and by regular review of these ratings. The maximum exposure arising in the event of default on the part of the counterparty is the carrying value of the relevant financial instrument.
Credit risk arising in the context of the Group’s operations is not significant. Customers who wish to trade on credit terms are subject to strict verification procedures prior to credit being advanced and are subject to continued monitoring at operating company level.
Liquidity riskThe Group is exposed to liquidity risk which arises primarily from the maturing of short-term and long-term debt obligations and derivative transactions. The Group’s policy is to ensure that sufficient resources are available either from cash balances, cash flows or undrawn committed bank facilities, to ensure all obligations can be met as they fall due. To achieve this objective, the Group:- maintains cash balances and liquid investments with highly-rated counterparties; - limits the maturity of cash balances; and- borrows the bulk of its debt needs under committed bank lines or other term financing.
Commodity price riskThe Group’s exposure to price risk in this regard is minimal with the fair value of derivatives used to hedge future energy costs being §4.2 million unfavourable as at the balance sheet date (2005 : §1.5 million favourable).

96 CRH
24. Analysis of Net Debt
Components of and reconciliation of opening to closing net debtNet debt comprises cash and cash equivalents, liquid investments, derivative financial instrument assets and liabilities and current and non-current interest-bearing loans and borrowings. At 1st Cash Acqui- Mark-to- Translation At 31st At 31st January flow sitions market adjustment December December Book value Fair value §m §m §m §m §m §m §m
31st December 2006Cash and cash equivalents (note 21) 1,148.6 (81.8) 69.3 - (34.5) 1,101.6 1,101.6 Liquid investments (note 21) 342.5 34.1 - - (6.1) 370.5 370.5 Interest-bearing loans and borrowings (note 22) (5,106.8) (1,043.0) (239.0) 42.1 388.4 (5,958.3) (6,017.0) Derivative financial instruments (net) (note 23) 167.4 29.8 - (42.9) (160.1) (5.8) (5.8)
Group net debt (including share of non-recourse debt in joint ventures) (3,448.3) (1,060.9) (169.7) (0.8) 187.7 (4,492.0) (4,550.7)
Group net debt excluding proportionately consolidated joint ventures (3,177.1) (1,081.5) (171.0) (1.5) 187.0 (4,244.1) (4,302.8)
The equivalent disclosure for the prior year is as follows:
31st December 2005 Cash and cash equivalents (note 21) 1,072.0 (28.9) 58.0 - 47.5 1,148.6 1,148.6Liquid investments (note 21) 311.7 15.0 - - 15.8 342.5 342.5 Interest-bearing loans and borrowings (note 22) (4,053.8) (540.4) (137.6) 85.1 (460.1) (5,106.8) (5,203.9)Derivative financial instruments (net) (note 23) (88.0) 102.8 - (79.2) 231.8 167.4 167.4
Group net debt (including share of non-recourse debt in joint ventures) (2,758.1) (451.5) (79.6) 5.9 (165.0) (3,448.3) (3,545.4)
Group net debt excluding proportionately consolidated joint ventures (2,501.1) (436.0) (80.9) 6.1 (165.2) (3,177.1) (3,274.2)
Interest rate and currency profileThe interest rate and currency profile of the Group’s net debt and net worth (capital and reserves attributable to the Company’s equity holders) as at 31st December 2006 is as follows: US Pound Swiss euro Dollar Sterling Franc Other Total §m §m §m §m §m §m
Cash and cash equivalents - floating rate 483.8 324.0 48.3 104.9 140.6 1,101.6 Liquid investments - floating rate 91.7 95.4 183.4 - - 370.5 Interest-bearing loans and borrowings - fixed rate (205.4) (3,875.2) (17.2) (9.1) (3.1) (4,110.0) Interest-bearing loans and borrowings - floating rate (1,011.6) (270.4) (406.7) (8.3) (151.3) (1,848.3)
Net (debt)/cash by major currency excluding derivative financial instruments (641.5) (3,726.2) (192.2) 87.5 (13.8) (4,486.2) Derivative financial instruments (including mark-to-market) (1,126.9) 1,437.5 172.1 (260.2) (228.3) (5.8)
Net debt by major currency including derivative financial instruments (1,768.4) (2,288.7) (20.1) (172.7) (242.1) (4,492.0)
Non-debt assets and liabilities analysed as follows: Non-current assets 4,209.7 5,680.9 534.1 376.0 784.8 11,585.5 Current assets 1,931.9 2,528.0 266.1 174.7 307.4 5,208.1 Non-current liabilities (405.3) (1,220.0) (289.9) (77.6) (59.6) (2,052.4)Current liabilities (1,292.9) (1,377.1) (211.3) (91.7) (171.9) (3,144.9) Minority interest (22.7) (5.1) - (7.9) (6.1) (41.8)
Capital and reserves attributable to the Company’s equity holders 2,652.3 3,318.0 278.9 200.8 612.5 7,062.5
Interest-bearing loans and borrowings - fixed rateThe fixed rate interest-bearing loans and borrowings including the impact of derivative financial instruments (interest rate and cross-currency swaps) as at 31st December 2006 are as follows:
Interest-bearing loans and borrowings - fixed rate as above (205.4) (3,875.2) (17.2) (9.1) (3.1) (4,110.0) Impact of derivative financial instruments on fixed rate debt (629.9) 2,602.9 (22.4) (31.7) (75.7) 1,843.2
Net fixed rate interest-bearing loans and borrowings (835.3) (1,272.3) (39.6) (40.8) (78.8) (2,266.8)
Weighted average fixed interest rates 3.5% 6.9% 5.0% 1.7% 5.3% 5.5%Weighted average fixed periods - years 2.4 7.4 1.5 1.2 1.8 5.1
Notes on Financial Statements

97CRH
24. Analysis of Net Debt continued US Pound Swiss euro Dollar Sterling Franc Other Total §m §m §m §m §m §mGross debt by major currency - analysis of effective interest rates - excluding derivative financial instruments 3.8% 6.5% 5.5% 3.5% 5.1% 5.8%- gross debt excluding derivative financial instruments (1,217.0) (4,145.6) (423.9) (17.4) (154.4) (5,958.3) - including derivative financial instruments 3.7% 6.9% 5.6% 2.1% 5.0% 5.2%- gross debt including derivative financial instruments (2,343.9) (2,708.1) (251.8) (277.6) (382.7) (5,964.1)
Floating rate debt comprises bank borrowings and finance leases bearing interest at rates set in advance for periods ranging from overnight to less than one year largely by reference to inter-bank interest rates (US$ LIBOR, Sterling LIBOR, Swiss Franc LIBOR and Euribor).
Gains and losses arising on the re-translation of net worth are dealt with in the Statement of Recognised Income and Expense. Transactional currency exposures arise in a number of the Group’s operations and these result in net currency gains and losses which are recognised in the Group Income Statement and are disclosed in note 4. As at 31st December 2006 and 2005, these exposures were not material.
The corresponding interest rate and currency profile of the Group’s net debt and net worth as at 31st December 2005 is as follows:
Cash and cash equivalents - floating rate 562.5 235.0 86.4 188.8 75.9 1,148.6 Liquid investments - floating rate 85.5 84.5 172.5 - - 342.5 Interest-bearing loans and borrowings - fixed rate (221.1) (3,007.3) (24.1) (20.5) (41.4) (3,314.4)Interest-bearing loans and borrowings - floating rate (1,116.4) (193.2) (379.0) (0.1) (103.7) (1,792.4)
Net (debt)/cash by major currency excluding derivative financial instruments (689.5) (2,881.0) (144.2) 168.2 (69.2) (3,615.7)Derivative financial instruments (including mark-to-market) (1,017.6) 1,676.7 125.5 (360.8) (256.4) 167.4
Net debt by major currency including derivative financial instruments (1,707.1) (1,204.3) (18.7) (192.6) (325.6) (3,448.3)Non-debt assets and liabilities analysed as follows: Non-current assets 3,943.5 4,632.7 510.2 365.7 724.9 10,177.0 Current assets 1,692.5 1,876.9 225.3 147.7 256.6 4,199.0 Non-current liabilities (486.7) (1,096.7) (333.9) (87.0) (53.4) (2,057.7)Current liabilities (1,161.6) (1,084.5) (163.9) (80.7) (145.6) (2,636.3)Minority interest (23.6) (2.6) - (7.3) (4.8) (38.3)
Capital and reserves attributable to the Company’s equity holders 2,257.0 3,121.5 219.0 145.8 452.1 6,195.4
Interest-bearing loans and borrowings - fixed rateThe fixed rate interest-bearing loans and borrowings including the impact of derivative financial instruments (interest rate and cross-currency swaps) as at 31st December 2005 are as follows:
Interest-bearing loans and borrowings - fixed rate as above (221.1) (3,007.3) (24.1) (20.5) (41.4) (3,314.4)Impact of derivative financial instruments on fixed rate debt (562.9) 2,430.6 (21.9) (32.8) (94.6) 1,718.4
Net fixed rate interest-bearing loans and borrowings (784.0) (576.7) (46.0) (53.3) (136.0) (1,596.0)
Weighted average fixed interest rates 3.4% 7.4% 5.0% 2.5% 5.1% 5.0%Weighted average fixed periods - years 2.1 6.4 2.4 2.3 1.7 3.7 Gross debt by major currency - analysis of effective interest rates - excluding derivative financial instruments 3.3% 6.8% 4.9% 4.2% 4.2% 5.7%- gross debt excluding derivative financial instruments (1,337.5) (3,200.5) (403.1) (20.6) (145.1) (5,106.8)- including derivative financial instruments 3.0% 6.8% 5.0% 1.4% 5.0% 4.3%- gross debt including derivative financial instruments (2,355.1) (1,523.8) (277.6) (381.4) (401.5) (4,939.4)

98 CRH
25. Provisions for Liabilities Provided Utilised At 1st Translation Arising on during during Reversed Reclass- Discount At 31st January adjustment acquisition year year unused ifications* unwinding DecemberNet present cost §m §m §m §m §m §m §m §m §m
31st December 2006
Insurance (i) 147.0 (13.9) 75.1 103.6 (91.8) (0.3) 2.2 11.5 233.4 Guarantees and warranties (ii) 31.1 (1.0) 1.1 6.4 (9.2) (2.3) (2.1) 1.1 25.1 Rationalisation and redundancy (iii) 16.2 (0.4) 3.7 14.8 (11.9) (1.6) 0.9 1.1 22.8 Environment and remediation (iv) 79.3 (2.9) 6.9 6.0 (17.2) (1.9) 0.8 2.2 73.2 Other 59.8 (1.0) 25.3 52.3 (33.9) (1.5) 1.9 3.4 106.3
Total 333.4 (19.2) 112.1 183.1 (164.0) (7.6) 3.7 19.3 460.8
Analysed as: Non-current liabilities 223.0 320.0 Current liabilities 110.4 140.8
Total 333.4 460.8
The equivalent disclosure for the prior year is as follows:
31st December 2005 Insurance (i) 127.8 14.2 1.6 66.1 (60.7) (0.2) (6.1) 4.3 147.0 Guarantees and warranties (ii) 29.6 1.1 0.9 6.0 (7.7) (1.2) 1.5 0.9 31.1 Rationalisation and redundancy (iii) 10.5 0.3 0.9 13.5 (8.0) (0.3) (1.1) 0.4 16.2 Environment and remediation (iv) 61.1 1.6 0.8 17.8 (5.0) (0.4) 0.5 2.9 79.3 Other 49.4 0.6 9.6 9.4 (14.2) (3.3) 7.7 0.6 59.8
Total 278.4 17.8 13.8 112.8 (95.6) (5.4) 2.5 9.1 333.4
Analysed as: Non-current liabilities 182.3 223.0 Current liabilities 96.1 110.4
Total 278.4 333.4
* Reclassifications (to)/from payables and retirement benefit obligations
(i) InsuranceThis provision relates to workers’ compensation (employers’ liability) and third-party liabilities or claims covered under the Group’s self-insurance schemes. Reflecting the operation of these self-insurance schemes, a substantial portion of the total provision relates to claims which are classified as incurred but not reported in respect of which the Group will bear an excess which will not be recoverable from insurers. In addition, due to the extended time frame which is typically involved in such claims, a significant component of the total provision is subject to actuarial valuation. Where actuarial valuation is either inappropriate or impractical, other external assessments are made.
(ii) Guarantees and warrantiesSome of the products sold by Group companies (subsidiaries and joint ventures) carry formal guarantees in relation to satisfactory performance spanning varying periods subsequent to purchase. Provision is accordingly made on a net present cost basis for the anticipated cost of honouring such guarantees and warranties at each balance sheet date. Although the expected timing of any payments is uncertain, best estimates have been made in determining a likely cash profile for the purposes of discounting using past experience as a guide.
(iii) Rationalisation and redundancyThese provisions relate to irrevocable commitments under various rationalisation and redundancy programmes throughout the Group, none of which is individually material. The Group expects that these provisions will be utilised within three years of the balance sheet date.
(iv) Environment and remediationThis provision comprises obligations governing site remediation and improvement costs to be incurred in compliance with either local or national environmental regulations together with constructive obligations stemming from established best practice. Whilst a significant element of the total provision will reverse in the medium-term (two to ten years), the majority of the legal and constructive obligations applicable to long-lived assets (principally mineral-bearing land and buildings) will unwind over a 30-year timeframe. In discounting the related obligations, expected future cash outflows have been determined with due regard to extraction status and anticipated remaining life.
Notes on Financial Statements

99CRH
26. Deferred Income Tax
The deductible and taxable temporary differences at the balance sheet date in respect of which deferred tax has been recognised are analysed as follows: 2006 2005 §m §mDeferred income tax assets (deductible temporary differences) Deficits on Group defined benefit pension obligations (note 27) 87.8 126.5 Revaluation of derivative financial instruments to fair value 0.2 0.9 Employee share options 55.8 32.4 Other deductible temporary differences (i) 345.4 306.7
Total 489.2 466.5
(i) These items relate principally to deferred tax assets arising on deferred and contingent acquisition consideration and provisions for liabilities.
Deferred income tax assets have been recognised in respect of all deductible temporary differences.
Deferred income tax liabilities (taxable temporary differences) Taxable temporary differences principally attributable to accelerated tax depreciation and fair value adjustments arising on acquisition 1,267.6 1,150.9 Surpluses on Group defined benefit pension obligations (note 27) 3.4 - Revaluation of derivative financial instruments to fair value 1.2 1.7 Rolled-over capital gains 29.0 31.9
Total 1,301.2 1,184.5
Movement in net deferred income tax liabilityAt 1st January 718.0 652.1 Translation adjustment (62.6) 65.1 Net charge/(credit) for the year (note 10) 50.2 42.1 Arising on acquisition (note 33) 92.1 12.2 Movement in deferred tax asset on Group defined benefit pension obligations 41.4 (21.7)Movement in deferred tax asset on share-based payments (26.7) (12.3)Movement in deferred tax liability on cash flow hedges (0.4) 0.7 Reclassification - (20.2)
At 31st December 812.0 718.0
27. Retirement Benefit Obligations
The Group operates either defined benefit or defined contribution pension schemes in all of its principal operating areas. Scheme assets are held in separate trustee administered funds.
At the year-end, §52.0 million (2005 : §43.4 million) was included in other payables in respect of defined contribution pension liabilities and §0.3 million (2005 : §0.8 million) was included in other receivables in respect of defined contribution pension prepayments.
The Group operates defined benefit pension schemes in the Republic of Ireland, Britain and Northern Ireland, the Netherlands, Belgium, Germany, Portugal, Switzerland and the United States; for the purposes of the disclosures which follow, the schemes in the Republic of Ireland, the Netherlands, Belgium, Germany and Portugal (49% joint venture) have been aggregated into a “Eurozone” category on the basis of common currency and financial assumptions. In line with the principle of proportionate consolidation, the assets, liabilities, income and expenses attaching to defined benefit pension schemes in joint ventures are reflected in the figures below on the basis of the Group’s share of these entities. The majority of the defined benefit pension schemes operated by the Group are funded as disclosed in the analysis of the defined benefit obligation presented below with unfunded schemes restricted to one scheme in each of Portugal and the United States and three schemes in Germany.
In addition to the aforementioned defined benefit pension schemes, provision has been made in the financial statements for post-retirement healthcare obligations in respect of certain current and former employees principally in the United States and in Portugal and for long-term service commitments in respect of certain employees in the Eurozone, Britain and Northern Ireland and Switzerland. These obligations are unfunded in nature and the required disclosures are set out below.
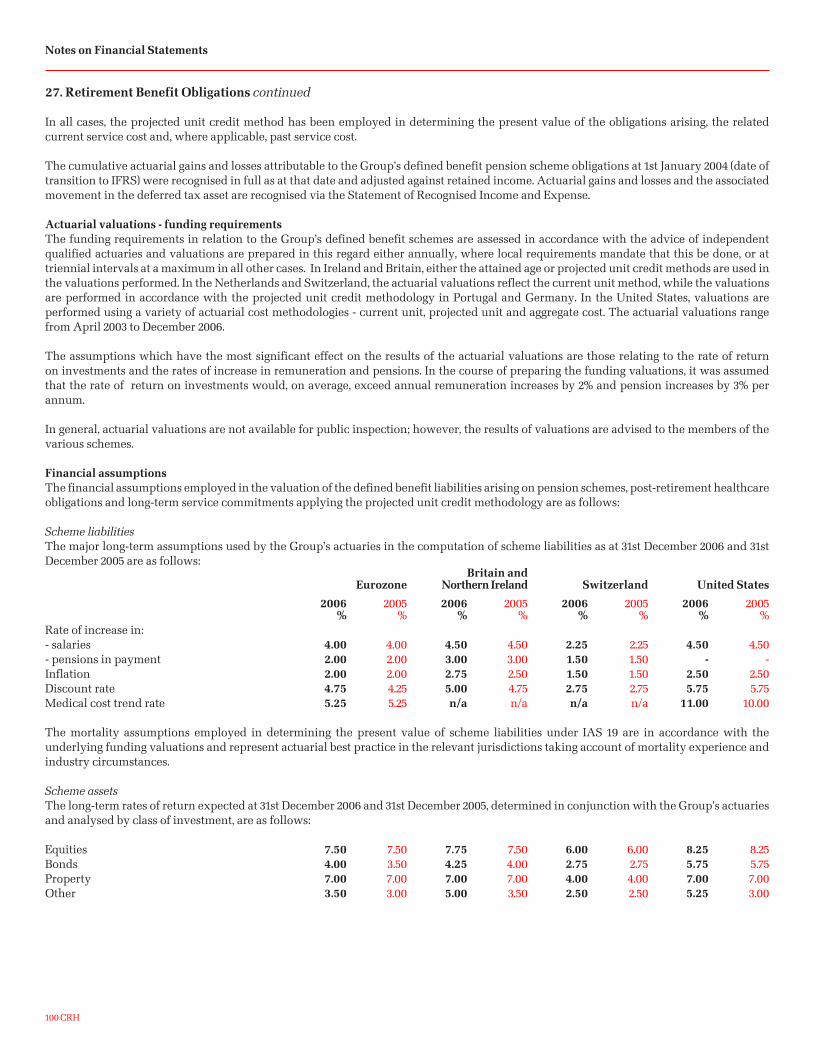
100 CRH
27. Retirement Benefit Obligations continued
In all cases, the projected unit credit method has been employed in determining the present value of the obligations arising, the related current service cost and, where applicable, past service cost.
The cumulative actuarial gains and losses attributable to the Group’s defined benefit pension scheme obligations at 1st January 2004 (date of transition to IFRS) were recognised in full as at that date and adjusted against retained income. Actuarial gains and losses and the associated movement in the deferred tax asset are recognised via the Statement of Recognised Income and Expense.
Actuarial valuations - funding requirementsThe funding requirements in relation to the Group’s defined benefit schemes are assessed in accordance with the advice of independent qualified actuaries and valuations are prepared in this regard either annually, where local requirements mandate that this be done, or at triennial intervals at a maximum in all other cases. In Ireland and Britain, either the attained age or projected unit credit methods are used in the valuations performed. In the Netherlands and Switzerland, the actuarial valuations reflect the current unit method, while the valuations are performed in accordance with the projected unit credit methodology in Portugal and Germany. In the United States, valuations are performed using a variety of actuarial cost methodologies - current unit, projected unit and aggregate cost. The actuarial valuations range from April 2003 to December 2006.
The assumptions which have the most significant effect on the results of the actuarial valuations are those relating to the rate of return on investments and the rates of increase in remuneration and pensions. In the course of preparing the funding valuations, it was assumed that the rate of return on investments would, on average, exceed annual remuneration increases by 2% and pension increases by 3% per annum.
In general, actuarial valuations are not available for public inspection; however, the results of valuations are advised to the members of the various schemes.
Financial assumptionsThe financial assumptions employed in the valuation of the defined benefit liabilities arising on pension schemes, post-retirement healthcare obligations and long-term service commitments applying the projected unit credit methodology are as follows:
Scheme liabilitiesThe major long-term assumptions used by the Group’s actuaries in the computation of scheme liabilities as at 31st December 2006 and 31st December 2005 are as follows: Britain and Eurozone Northern Ireland Switzerland United States
2006 2005 2006 2005 2006 2005 2006 2005 % % % % % % % %Rate of increase in: - salaries 4.00 4.00 4.50 4.50 2.25 2.25 4.50 4.50 - pensions in payment 2.00 2.00 3.00 3.00 1.50 1.50 - - Inflation 2.00 2.00 2.75 2.50 1.50 1.50 2.50 2.50 Discount rate 4.75 4.25 5.00 4.75 2.75 2.75 5.75 5.75 Medical cost trend rate 5.25 5.25 n/a n/a n/a n/a 11.00 10.00
The mortality assumptions employed in determining the present value of scheme liabilities under IAS 19 are in accordance with the underlying funding valuations and represent actuarial best practice in the relevant jurisdictions taking account of mortality experience and industry circumstances.
Scheme assetsThe long-term rates of return expected at 31st December 2006 and 31st December 2005, determined in conjunction with the Group’s actuaries and analysed by class of investment, are as follows:
Equities 7.50 7.50 7.75 7.50 6.00 6.00 8.25 8.25 Bonds 4.00 3.50 4.25 4.00 2.75 2.75 5.75 5.75 Property 7.00 7.00 7.00 7.00 4.00 4.00 7.00 7.00 Other 3.50 3.00 5.00 3.50 2.50 2.50 5.25 3.00
Notes on Financial Statements

101CRH
27. Retirement Benefit Obligations continued
(a) Impact on Group Income Statement
The total expense charged to the Group Income Statement in respect of defined contribution and defined benefit pension schemes, post-retirement healthcare obligations and long-term service commitments is as follows: 2006 2005 §m §m
Total defined contribution pension expense 117.0 99.3
Defined benefit Pension schemes (funded and unfunded) 22.7 57.3 Post-retirement healthcare schemes (unfunded) 1.7 1.3 Long-term service commitments (unfunded) (1.8) 5.3
Total defined benefit expense 22.6 63.9
Total expense in Group Income Statement 139.6 163.2
Analysis of defined benefit expenseThe total defined benefit expense (comprising funded and unfunded defined benefit pension schemes and unfunded post-retirement healthcare obligations and long-term service commitments) is analysed as follows:
Britain and Eurozone Northern Ireland Switzerland United States Total Group
2006 2005 2006 2005 2006 2005 2006 2005 2006 2005 §m §m §m §m §m §m §m §m §m §mCharged in arriving at Group operating profitCurrent service cost 32.7 35.0 17.7 15.8 11.6 10.5 7.7 6.5 69.7 67.8 Past service cost: benefit enhancements/ (curtailments) 3.2 1.5 - - (0.5) - - - 2.7 1.5 Deconsolidation of defined benefit pension schemes (i) (37.7) - - - - - - - (37.7) -
Subtotal (1.8) 36.5 17.7 15.8 11.1 10.5 7.7 6.5 34.7 69.3
Included in finance revenue and finance costs respectively Expected return on scheme assets (55.3) (51.3) (27.1) (23.2) (12.8) (9.8) (9.6) (9.4) (104.8) (93.7)Interest cost on scheme liabilities 42.3 43.7 31.4 27.1 8.5 7.6 10.5 9.9 92.7 88.3
Subtotal (13.0) (7.6) 4.3 3.9 (4.3) (2.2) 0.9 0.5 (12.1) (5.4)
Net charge to Group Income Statement (14.8) 28.9 22.0 19.7 6.8 8.3 8.6 7.0 22.6 63.9
Actual return on pension scheme assets 79.3 166.7 33.0 64.2 22.2 33.6 15.4 6.5 149.9 271.0
No reimbursement rights have been recognised as assets in accordance with IAS 19 Employee Benefits.
(i) During 2006, in response to legislative changes implemented in the Netherlands, the Group reached agreement with its employees in the Netherlands on changes to certain pension arrangements which altered their basis under IFRS from defined benefit to defined contribution. This resulted in the elimination of certain defined benefit obligations from the Group Balance Sheet with a resultant gain of §37.7 million which has been reflected in arriving at Group operating profit for 2006.

102 CRH
27. Retirement Benefit Obligations continued
(b) Impact on Group Balance Sheet
The net pension liability (comprising funded and unfunded defined benefit pension schemes and unfunded post-retirement healthcare obligations and long-term service commitments) as at 31st December 2006 is analysed as follows:
Britain and Eurozone Northern Ireland Switzerland United States Total Group
2006 2005 2006 2005 2006 2005 2006 2005 2006 2005 §m §m §m §m §m §m §m §m §m §m
Equities 498.7 559.3 299.4 266.6 108.1 97.0 90.9 90.9 997.1 1,013.8 Bonds 188.2 290.3 167.9 151.2 109.6 99.9 48.7 41.1 514.4 582.5 Property 80.6 64.2 3.6 3.1 78.5 57.6 - 1.5 162.7 126.4 Other 17.2 20.3 8.8 0.9 36.1 22.4 3.0 4.7 65.1 48.3
Bid value of assets 784.7 934.1 479.7 421.8 332.3 276.9 142.6 138.2 1,739.3 1,771.0 Actuarial value of liabilities (present value) (816.5) (1,092.3) (662.1) (651.2) (328.2) (276.9) (193.9) (201.1) (2,000.7) (2,221.5)
Recoverable deficit in schemes (31.8) (158.2) (182.4) (229.4) 4.1 - (51.3) (62.9) (261.4) (450.5)Related deferred income tax asset 10.6 35.5 54.7 68.8 (1.0) - 20.1 22.2 84.4 126.5
Net pension liability (21.2) (122.7) (127.7) (160.6) 3.1 - (31.2) (40.7) (177.0) (324.0)
Analysis of liabilities - funded and unfunded Funded Defined benefit pension schemes (782.3) (1,065.0) (662.1) (649.9) (325.4) (272.9) (181.7) (189.5) (1,951.5) (2,177.3)Unfunded Defined benefit pension schemes (19.9) (11.8) - - - - (4.1) (4.3) (24.0) (16.1)
Total - defined benefit pension schemes (802.2) (1,076.8) (662.1) (649.9) (325.4) (272.9) (185.8) (193.8) (1,975.5) (2,193.4)Post-retirement healthcare obligations (unfunded) (7.7) (8.6) - - - - (8.1) (7.3) (15.8) (15.9)Long-term service commitments (unfunded) (6.6) (6.9) - (1.3) (2.8) (4.0) - - (9.4) (12.2)
Actuarial value of liabilities (present value) (816.5) (1,092.3) (662.1) (651.2) (328.2) (276.9) (193.9) (201.1) (2,000.7) (2,221.5)
Split of asset values % % % % % % % % % %Equities 63.5 59.9 62.4 63.2 32.5 35.0 63.7 65.8 57.3 57.3 Bonds 24.0 31.1 35.0 35.9 33.0 36.1 34.2 29.7 29.6 32.9 Property 10.3 6.9 0.8 0.7 23.6 20.8 - 1.1 9.4 7.1 Other 2.2 2.1 1.8 0.2 10.9 8.1 2.1 3.4 3.7 2.7
Total 100 100 100 100 100 100 100 100 100 100
The asset values above include §11.1 million in respect of investment in Ordinary Shares of the Company as at 31st December 2006 (2005 : §9.3 million).
Analysis of amount included in the Statement of Recognised Income and Expense (SORIE)
Actual return less expected return on scheme assets 24.0 115.4 5.9 41.0 9.4 23.8 5.8 (2.9) 45.1 177.3
Experience (loss)/gain arising on scheme liabilities (present value) (19.4) 29.9 19.3 3.3 (3.8) 5.5 (2.2) 3.5 (6.1) 42.2
Assumptions gain/(loss) arising on scheme liabilities (present value) 88.8 (177.1) 27.3 (105.2) - (23.3) - - 116.1 (305.6)
Actuarial gain/(loss) recognised in SORIE 93.4 (31.8) 52.5 (60.9) 5.6 6.0 3.6 0.6 155.1 (86.1)
Notes on Financial Statements

103CRH
27. Retirement Benefit Obligations continued
Actuarial gains and losses and percentages of scheme assets and liabilities
Britain and Eurozone Northern Ireland Switzerland United States Total Group
2006 2005 2006 2005 2006 2005 2006 2005 2006 2005 §m §m §m §m §m §m §m §m §m §mActual return less expected return on scheme assets 24.0 115.4 5.9 41.0 9.4 23.8 5.8 (2.9) 45.1 177.3 % of scheme assets 3.1% 12.4% 1.2% 9.7% 2.8% 8.6% 4.1% (2.1%) 2.6% 10.0%
Experience (loss)/gain arising on scheme liabilities (present value) (19.4) 29.9 19.3 3.3 (3.8) 5.5 (2.2) 3.5 (6.1) 42.2 % of scheme liabilities (present value) 2.4% (2.7%) (2.9%) (0.5%) 1.2% (2.0%) 1.1% (1.7%) 0.3% (1.9%)
Actuarial gain/(loss) recognised in SORIE 93.4 (31.8) 52.5 (60.9) 5.6 6.0 3.6 0.6 155.1 (86.1)% of scheme liabilities (present value) (11.4%) 2.9% (7.9%) 9.4% (1.7%) (2.2%) (1.9%) (0.3%) (7.8%) 3.9%
Following transition to IFRS on 1st January 2004, the cumulative actuarial loss recognised in the SORIE is as follows: 2006 §mRecognised in 2004 financial year (119.2)Recognised in 2005 financial year (86.1)Recognised in 2006 financial year 155.1
Cumulative actuarial loss recognised in SORIE (50.2)
Reconciliation of scheme assets (bid value)At 1st January 934.1 763.7 421.8 339.1 276.9 243.3 138.2 118.5 1,771.0 1,464.6 Movement in year Translation adjustment - - 9.5 9.6 (10.9) (2.1) (15.4) 18.4 (16.8) 25.9 Arising on acquisition (note 33) 2.2 - 5.9 - 44.7 0.6 1.0 - 53.8 0.6 Employer contributions paid 27.4 34.8 20.4 17.1 8.4 6.9 11.0 2.5 67.2 61.3 Contributions paid by plan participants 6.7 8.2 4.6 4.5 6.0 4.8 - - 17.3 17.5 Benefit payments (34.4) (39.3) (15.5) (12.7) (15.0) (10.2) (7.6) (7.7) (72.5) (69.9)Actual return on scheme assets 79.3 166.7 33.0 64.2 22.2 33.6 15.4 6.5 149.9 271.0 Deconsolidation adjustment (230.6) - - - - - - - (230.6) -
At 31st December 784.7 934.1 479.7 421.8 332.3 276.9 142.6 138.2 1,739.3 1,771.0
Reconciliation of actuarial value of liabilities At 1st January (1,092.3) (895.8) (651.2) (500.5) (276.9) (247.8) (201.1) (170.2) (2,221.5) (1,814.3)Movement in year Translation adjustment - - (13.4) (14.1) 11.8 2.1 21.8 (25.7) 20.2 (37.7)Arising on acquisition (note 33) (11.4) (0.2) (5.9) - (48.7) (0.7) (1.8) - (67.8) (0.9)Current service cost (32.7) (35.0) (17.7) (15.8) (11.6) (10.5) (7.7) (6.5) (69.7) (67.8)Contributions paid by plan participants (6.7) (8.2) (4.6) (4.5) (6.0) (4.8) - - (17.3) (17.5)Benefit payments 34.4 39.3 15.5 12.7 15.0 10.2 7.6 7.7 72.5 69.9 Past service cost: benefit enhancements (3.2) (1.5) - - 0.5 - - - (2.7) (1.5)Interest cost on scheme liabilities (42.3) (43.7) (31.4) (27.1) (8.5) (7.6) (10.5) (9.9) (92.7) (88.3)Actuarial gain/(loss) arising on: - experience variations (19.4) 29.9 19.3 3.3 (3.8) 5.5 (2.2) 3.5 (6.1) 42.2 - changes in assumptions 88.8 (177.1) 27.3 (105.2) - (23.3) - - 116.1 (305.6)Deconsolidation adjustment 268.3 - - - - - - - 268.3 -
At 31st December (816.5) (1,092.3) (662.1) (651.2) (328.2) (276.9) (193.9) (201.1) (2,000.7) (2,221.5)
Anticipated employer contributions payable in the 2007 financial year (expressed using average exchange rates for 2006) amount to §54.5 million in aggregate.
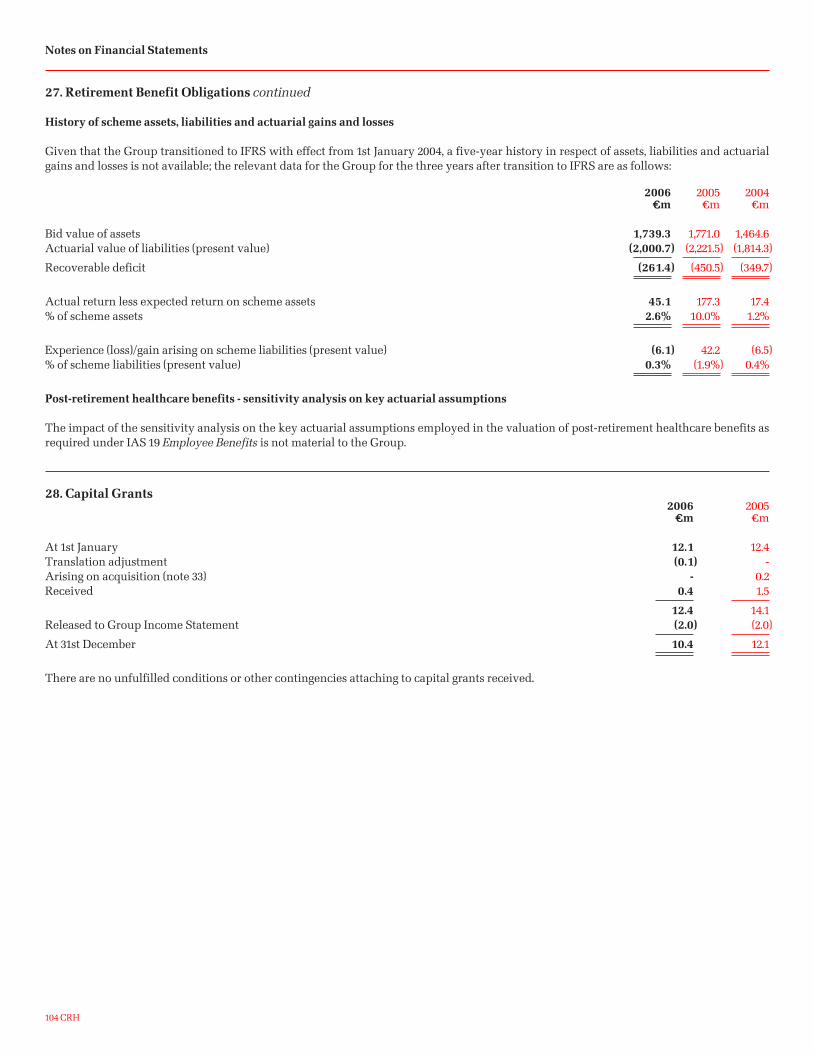
104 CRH
27. Retirement Benefit Obligations continued
History of scheme assets, liabilities and actuarial gains and losses
Given that the Group transitioned to IFRS with effect from 1st January 2004, a five-year history in respect of assets, liabilities and actuarial gains and losses is not available; the relevant data for the Group for the three years after transition to IFRS are as follows:
2006 2005 2004 §m §m §m
Bid value of assets 1,739.3 1,771.0 1,464.6 Actuarial value of liabilities (present value) (2,000.7) (2,221.5) (1,814.3)
Recoverable deficit (261.4) (450.5) (349.7)
Actual return less expected return on scheme assets 45.1 177.3 17.4 % of scheme assets 2.6% 10.0% 1.2%
Experience (loss)/gain arising on scheme liabilities (present value) (6.1) 42.2 (6.5)% of scheme liabilities (present value) 0.3% (1.9%) 0.4%
Post-retirement healthcare benefits - sensitivity analysis on key actuarial assumptions
The impact of the sensitivity analysis on the key actuarial assumptions employed in the valuation of post-retirement healthcare benefits as required under IAS 19 Employee Benefits is not material to the Group.
28. Capital Grants 2006 2005 §m §m
At 1st January 12.1 12.4 Translation adjustment (0.1) - Arising on acquisition (note 33) - 0.2 Received 0.4 1.5
12.4 14.1 Released to Group Income Statement (2.0) (2.0)
At 31st December 10.4 12.1
There are no unfulfilled conditions or other contingencies attaching to capital grants received.
Notes on Financial Statements

105CRH
29. Share Capital - Equity and Preference Equity Preference 5% 7% ‘A’ Cumulative Cumulative Ordinary Income Preference Preference Shares of Shares of Shares of Shares of Treasury §0.32 each §0.02 each §1.27 each §1.27 each shares (i) (ii) (iii) (vi)31st December 2006 §m §m §m §m §m
AuthorisedAt 1st January and 31st December 235.2 14.7 0.2 1.1 n/a
Number of Shares (000s) 735,000 735,000 150 872 n/a
Allotted, called-up and fully paidAt 1st January 171.6 10.7 0.1 1.1 -Share options and share participation schemes (iv) 1.7 0.2 - - -Shares issued in lieu of dividends (v) 0.3 - - - -Shares acquired by Employee Benefit Trust (vi) - - - - (15.7)Charged under IFRS 2 (note 7) - - - - 1.3
At 31st December 173.6 10.9 0.1 1.1 (14.4)
Number of Shares (000s) 542,790 542,790 50 872 (628)
The corresponding disclosure in respect of the year ended 31st December 2005 is as follows:
AuthorisedAt 1st January and 31st December 235.2 14.7 0.2 1.1 n/a
Number of Shares (000s) 735,000 735,000 150 872 n/a
Allotted, called-up and fully paidAt 1st January 170.3 10.7 0.1 1.1 n/aShare options and share participation schemes (iv) 1.0 - - - n/aShares issued in lieu of dividends (v) 0.3 - - - n/a
At 31st December 171.6 10.7 0.1 1.1 n/a
Number of Shares (000s) 536,324 536,324 50 872 n/a
(i) Income Shares The Income Shares were created on 29th August 1988 for the express purpose of giving shareholders the choice of receiving dividends on either their Ordinary Shares or on their Income Shares (by notice of election to the Company). The Income Shares carried a different tax credit to the Ordinary Shares. The creation of the Income Shares was achieved by the allotment of fully paid Income Shares to each shareholder equal to his/her holding of Ordinary Shares but the shareholder is not entitled to an Income Share certificate, as a certificate for Ordinary Shares is deemed to include an equal number of Income Shares and a shareholder may only sell, transfer or transmit Income Shares with an equivalent number of Ordinary Shares. Income Shares carry no voting rights. Due to changes in Irish tax legislation since the creation of the Income Shares, dividends on the Company’s shares no longer carry a tax credit. As elections made by shareholders to receive dividends on their holding of Income Shares were no longer relevant, the Articles of Association were amended on 8th May 2002 to cancel such elections.
(ii) 5% Cumulative Preference Shares The holders of the 5% Cumulative Preference Shares are entitled to a fixed cumulative preferential dividend at a rate of 5% per annum and priority in a winding-up to repayment of capital, but have no further right to participate in profits or assets and are not entitled to be present or vote at general meetings unless their dividend is in arrears. Dividends on the 5% Cumulative Preference Shares are payable half-yearly on 15th April and 15th October in each year.
(iii) 7% ‘A’ Cumulative Preference Shares The holders of the 7% ‘A’ Cumulative Preference Shares are entitled to a fixed cumulative preference dividend at a rate of 7% per annum, and subject to the rights of the holders of the 5% Cumulative Preference Shares, priority in a winding-up to repayment of capital but have no further right to participate in profits or assets and are not entitled to be present or vote at general meetings unless their dividend is in arrears. Dividends on the 7% ‘A’ Cumulative Preference Shares are payable half-yearly on 5th April and 5th October in each year.
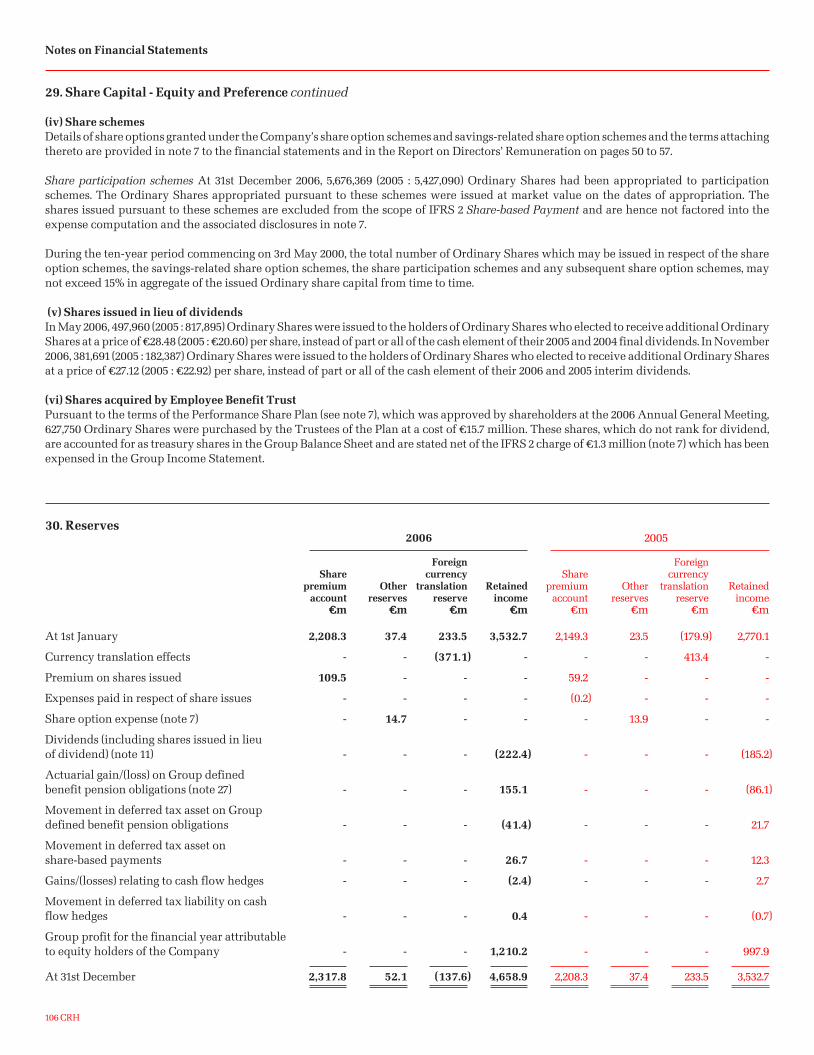
106 CRH
29. Share Capital - Equity and Preference continued
(iv) Share schemes Details of share options granted under the Company’s share option schemes and savings-related share option schemes and the terms attaching thereto are provided in note 7 to the financial statements and in the Report on Directors’ Remuneration on pages 50 to 57.
Share participation schemes At 31st December 2006, 5,676,369 (2005 : 5,427,090) Ordinary Shares had been appropriated to participation schemes. The Ordinary Shares appropriated pursuant to these schemes were issued at market value on the dates of appropriation. The shares issued pursuant to these schemes are excluded from the scope of IFRS 2 Share-based Payment and are hence not factored into the expense computation and the associated disclosures in note 7.
During the ten-year period commencing on 3rd May 2000, the total number of Ordinary Shares which may be issued in respect of the share option schemes, the savings-related share option schemes, the share participation schemes and any subsequent share option schemes, may not exceed 15% in aggregate of the issued Ordinary share capital from time to time.
(v) Shares issued in lieu of dividendsIn May 2006, 497,960 (2005 : 817,895) Ordinary Shares were issued to the holders of Ordinary Shares who elected to receive additional Ordinary Shares at a price of §28.48 (2005 : §20.60) per share, instead of part or all of the cash element of their 2005 and 2004 final dividends. In November 2006, 381,691 (2005 : 182,387) Ordinary Shares were issued to the holders of Ordinary Shares who elected to receive additional Ordinary Shares at a price of §27.12 (2005 : §22.92) per share, instead of part or all of the cash element of their 2006 and 2005 interim dividends.
(vi) Shares acquired by Employee Benefit Trust Pursuant to the terms of the Performance Share Plan (see note 7), which was approved by shareholders at the 2006 Annual General Meeting, 627,750 Ordinary Shares were purchased by the Trustees of the Plan at a cost of §15.7 million. These shares, which do not rank for dividend, are accounted for as treasury shares in the Group Balance Sheet and are stated net of the IFRS 2 charge of §1.3 million (note 7) which has been expensed in the Group Income Statement.
30. Reserves 2006 2005
Foreign Foreign Share currency Share currency premium Other translation Retained premium Other translation Retained account reserves reserve income account reserves reserve income §m §m §m §m §m §m §m §m
At 1st January 2,208.3 37.4 233.5 3,532.7 2,149.3 23.5 (179.9) 2,770.1
Currency translation effects - - (371.1) - - - 413.4 -
Premium on shares issued 109.5 - - - 59.2 - - -
Expenses paid in respect of share issues - - - - (0.2) - - -
Share option expense (note 7) - 14.7 - - - 13.9 - -
Dividends (including shares issued in lieu of dividend) (note 11) - - - (222.4) - - - (185.2)
Actuarial gain/(loss) on Group defined benefit pension obligations (note 27) - - - 155.1 - - - (86.1)
Movement in deferred tax asset on Group defined benefit pension obligations - - - (41.4) - - - 21.7
Movement in deferred tax asset on share-based payments - - - 26.7 - - - 12.3
Gains/(losses) relating to cash flow hedges - - - (2.4) - - - 2.7
Movement in deferred tax liability on cash flow hedges - - - 0.4 - - - (0.7)
Group profit for the financial year attributable to equity holders of the Company - - - 1,210.2 - - - 997.9
At 31st December 2,317.8 52.1 (137.6) 4,658.9 2,208.3 37.4 233.5 3,532.7
Notes on Financial Statements

107CRH
30. Reserves continued
Reconciliation of shares issued to proceeds shown in Group Cash Flow Statement 2006 2005 §m §mShares issued at nominal amount (note 29):- share options and share participation schemes 1.9 1.0 - shares issued in lieu of dividends 0.3 0.3 Premium on shares issued 109.5 59.2
Total value of shares issued 111.7 60.5 Shares issued in lieu of dividends (24.5) (21.0)
Proceeds from issue of shares - Group Cash Flow Statement 87.2 39.5
31. Minority Interest 2006 2005 §m §m
At 1st January 38.3 34.2 Translation adjustment (1.3) 0.8 Profit after tax (less attributable to associates) 14.0 8.2 Dividends paid by subsidiaries to minority interests (11.9) (9.4)Arising on acquisition (note 33) (0.4) 4.2 Shares issued to minority interests 3.1 0.3
At 31st December 41.8 38.3
32. Commitments under Operating and Finance Leases
Operating leasesFuture minimum rentals payable under non-cancellable operating leases at 31st December are as follows: 2006 2005 §m §m
Within one year 198.8 152.3 After one year but not more than five years 425.8 344.9 More than five years 286.3 187.8
910.9 685.0
Finance leasesFuture minimum lease payments under finance leases together with the present value of the net minimum lease payments are as follows:
2006 2005 Present Present Minimum value of Minimum value of payments payments payments payments §m §m §m §m
Within one year 19.9 16.8 15.2 13.3 After one year but not more than five years 36.4 30.3 34.9 30.1 More than five years 8.0 6.7 7.1 6.0
Total minimum lease payments 64.3 57.2 Less: amounts allocated to future finance costs (10.5) (7.8)
Present value of minimum lease payments 53.8 53.8 49.4 49.4

108 CRH
33. Acquisition of Subsidiaries and Joint Ventures
The principal business combinations completed during the year ended 31st December 2006 by reporting segment, together with the completion dates, were as follows; these transactions entailed the acquisition of a 100% stake where not indicated to the contrary:
Europe MaterialsEstonia: Kehra (2nd January); Ireland: Salmor (30th June) and a 50% joint venture stake in bitumen storage facilities (1st December); Poland: Pater Firm Bruk Company (23rd May), three Jadar concrete paving plants (18th July) and a minority stake in Grupa Silikaty (28th June); Portugal: Sicobetão (31st March) and Ecorresiduos (30th September); Slovakia: Kamenolomy (24th January); Switzerland: Frenke Beton (20th January); Ukraine: Popelniansky (20th February) and Bekhovsky (12th July).
Europe ProductsBelgium: Vibrobeton (10th March) and Oeterbeton (7th July); France: ATA (9th March) and Chapron Leroy (31st August); Germany: Halfen -Deha Group (2nd May) and Rhebau (2nd June); Ireland: Construction Accessories (19th July); Italy: Record (30th October); the Netherlands: Nuth (2nd June) and AVZ (2nd August); Switzerland: Element (12th January) and Prebeton (1st February); United Kingdom: Supreme Concrete (12th April) and TangoRail (4th September).
Europe DistributionBelgium: GAMMA Schelle & GAMMA Dendermonde (22nd February); France: Etrechy Matériaux (31st August); the Netherlands: Kalkmortelcentrale (27th January) and Kachelhuus (30th June); Switzerland: “Triple B” - BAW Baustoffe, BAB Baustoffe and BAF Baustoffe (23rd February) and BMH Hägendorf and Dennler (4th July).
Americas MaterialsSubstantial acquisition: Ashland Paving And Construction (“APAC”) (28th August), headquartered in Atlanta, Georgia, with extensive operations in 14 mid-western and southern US states.
Colorado: Gosney & Sons (25th September); Delaware: Pioneer Concrete (3rd February); Florida: 50% of American Cement Company (30th June); Georgia: H&S Whiting (11th October); Idaho: Summit Stone and Consolidated Concrete (5th October); Minnesota: Emmetsburg Readymix (16th January), Owatonna Construction (17th February) and Central Concrete (24th February); Montana: Goose Bay Equipment (2nd June); New Hampshire: Bissonette Redimix (12th January); New Jersey: Bedrock (17th February); Nevada: Boehler Construction (23rd June); North Carolina: Fletcher Limestone (13th October); Ohio: Stansley Readymix (17th February), Miller Companies (14th April), Apache Aggregate and Paving (27th April), Tri-Son Concrete (31st August) and Baird Concrete Products (18th August); Oregon: J.C. Compton (23rd June) and Egge Sand & Gravel (20th October).
Americas ProductsCalifornia: BES Concrete Products (15th December); Colorado: Foothills Concrete Pipe and Products (13th January); Florida: U.S. Global Glass (2nd June); Georgia: McArthur Concrete Products (31st August); Illinois, Indiana, Kentucky and Ohio: Sakrete7 trademark and territory rights (6th January); Indiana: Hartford Concrete Products (1st June); Iowa: Rhino Block & Materials (5th July); North Carolina: W.P. Rose Supply (7th August); Texas: Texas Wall Systems (6th January) and MMI Products (28th April); Toronto: Antamex (8th August).
Americas DistributionFlorida: Osprey Building Materials (24th April), Lakehill Ventures (30th October) and All Star Building Supplies (5th October); Hawaii: RRS (1st November); Texas: Builders Gypsum Supply (3rd October); Virginia and the Carolinas: Interior Distributors (1st June).
Notes on Financial Statements

109CRH
33. Acquisition of Subsidiaries and Joint Ventures continued
2006 Other 2005 APAC acquisitions Total TotalIdentifiable net assets acquired (excluding net debt assumed) §m §m §m §mAssets Non-current assets Property, plant and equipment (note 13) 620.4 463.2 1,083.6 502.4 Intangible assets: - goodwill (note 14) 328.5 489.2 817.7 327.9 - excess of fair value of identifiable net assets over consideration paid - (6.8) (6.8) (4.3) - other intangible assets (note 14) - 98.0 98.0 46.4Investments in associates (note 15) - 0.8 0.8 11.9 Other financial assets (note 15) - 0.2 0.2 9.0 Deferred income tax assets (note 26) - 11.4 11.4 11.9
Total non-current assets 948.9 1,056.0 2,004.9 905.2
Current assets - Inventories (note 20) 134.8 228.2 363.0 190.3 Trade and other receivables (note 20) 320.2 295.2 615.4 247.5
Total current assets 455.0 523.4 978.4 437.8
Equity Minority interest (note 31) - 0.4 0.4 (4.2)
Total equity - 0.4 0.4 (4.2)
Liabilities Non-current liabilities Deferred income tax liabilities (note 26) (48.6) (54.9) (103.5) (24.1)Retirement benefit obligations - (14.0) (14.0) (0.3)Provisions for liabilities (stated at net present cost - note 25) (78.2) (3.6) (81.8) (13.8)Capital grants (note 28) - - - (0.2)
Total non-current liabilities (126.8) (72.5) (199.3) (38.4)
Current liabilities Trade and other payables (note 20) (223.6) (214.7) (438.3) (228.4)Current income tax liabilities - (0.9) (0.9) (2.9)Provisions for liabilities (stated at net present cost - note 25) (24.4) (5.9) (30.3) -
Total current liabilities (248.0) (221.5) (469.5) (231.3)
Total consideration (enterprise value) 1,029.1 1,285.8 2,314.9 1,069.1
Satisfied by Cash payments 1,023.7 1,004.7 2,028.4 860.1 Professional fees incurred on business combinations 5.4 13.9 19.3 6.2 Cash and cash equivalents acquired on acquisition (note 24) - (69.3) (69.3) (58.0)
Net cash outflow 1,029.1 949.3 1,978.4 808.3 Net debt (other than cash and cash equivalents) assumed on acquisition: - non-current interest-bearing loans and borrowings and finance leases (note 24) - 6.8 6.8 28.0 - current interest-bearing loans and borrowings and finance leases (note 24) - 232.2 232.2 109.6 Deferred and contingent acquisition consideration (stated at net present cost - note 20) - 97.5 97.5 123.2
Total consideration (enterprise value) 1,029.1 1,285.8 2,314.9 1,069.1

110 CRH
33. Acquisition of Subsidiaries and Joint Ventures continued
The acquisition of APAC has been deemed to be a substantial transaction and separate disclosure of the fair values of the identifiable assets and liabilities has therefore been made. None of the remaining business combinations completed during the financial year was considered sufficiently material to warrant separate disclosure of the fair values attributable to those combinations.
An excess in the fair value of identifiable net assets acquired over consideration paid arose during the period in respect of certain of the business combinations quoted above. This amount of §6.8 million (2005 : §4.3 million) has been recognised immediately in the Group Income Statement as a component of other operating income as disclosed in note 3.
No contingent liabilities were recognised on the business combinations completed during the financial period.
The principal factor contributing to the recognition of goodwill on business combinations entered into by the Group is the realisation of cost savings and synergies with existing entities in the Group.
The carrying amounts of the assets and liabilities acquired determined in accordance with IFRS before completion of the combination together with the adjustments made to those carrying values to arrive at the fair values disclosed above were as follows:
Accounting Book Fair value policy Fair values adjustments alignments value §m §m §m §mAPACNon-current assets (excluding goodwill) 452.4 168.0 - 620.4 Current assets 453.1 1.9 - 455.0 Non-current liabilities (85.9) (40.9) - (126.8) Current liabilities (248.0) - - (248.0)
Identifiable net assets acquired (excluding goodwill and net debt assumed) 571.6 129.0 - 700.6 Goodwill arising on acquisition 457.5 (129.0) 328.5
Total consideration (enterprise value) 1,029.1 - - 1,029.1
Other acquisitions Non-current assets (excluding goodwill) 361.2 212.4 - 573.6 Current assets 504.3 20.1 (1.0) 523.4 Non-current liabilities (46.4) (26.0) (0.1) (72.5) Current liabilities (202.6) (14.3) (4.6) (221.5)Minority interest 0.4 - - 0.4
Identifiable net assets acquired (excluding goodwill and net debt assumed) 616.9 192.2 (5.7) 803.4 Goodwill arising on acquisition 668.9 (192.2) 5.7 482.4
Total consideration (enterprise value) 1,285.8 - - 1,285.8
Total consideration (enterprise value) 2,314.9 - - 2,314.9
The initial assignment of fair values to identifiable net assets acquired has been performed on a provisional basis in respect of a number of the business combinations disclosed above given the timing of closure of these deals; any amendments to these fair values made during the subsequent reporting window (within the twelve-month timeframe from the acquisition date imposed by IFRS 3) will be subject to disclosure in the 2007 Annual Report. The total adjustments processed to the fair values of business combinations completed during 2005 where those fair values were not readily or practicably determinable as at 31st December 2005 were as follows: Initial Adjustments fair value to provisional Revised assigned fair values fair value §m §m §m
Non-current assets (excluding goodwill) 371.9 3.3 375.2 Current assets 177.5 (9.7) 167.8 Non-current liabilities (12.0) (2.9) (14.9) Current liabilities (76.7) 4.3 (72.4)Minority interest (2.0) (0.1) (2.1)
Identifiable net assets acquired (excluding goodwill and net debt assumed) 458.7 (5.1) 453.6 Goodwill arising on acquisition 114.2 5.3 119.5
Total consideration (enterprise value) 572.9 0.2 573.1
Notes on Financial Statements

111CRH
33. Acquisition of Subsidiaries and Joint Ventures continued
The post-acquisition impact of business combinations completed during the year on Group profit for the financial year was as follows:
2006 Other 2005 APAC acquisitions Total Total §m §m §m §m
Revenue 761.5 1,145.5 1,907.0 448.3 Cost of sales (621.1) (834.1) (1,455.2) (345.3)
Gross profit 140.4 311.4 451.8 103.0 Operating costs (114.2) (228.9) (343.1) (84.7)
Group operating profit 26.2 82.5 108.7 18.3 Profit on disposal of fixed assets - - - 0.2
Profit before finance costs 26.2 82.5 108.7 18.5 Finance costs (net) (21.7) (34.3) (56.0) (6.9)
Profit before tax 4.5 48.2 52.7 11.6 Income tax expense (1.5) (11.5) (13.0) (2.5)
Group profit for the financial year 3.0 36.7 39.7 9.1
The revenue and profit of the Group for the financial year determined in accordance with IFRS as though the acquisition date for all business combinations effected during the year had been the beginning of that year would be as follows: Pro-forma 2006 CRH Group excluding Pro-forma Other 2006 consolidated Pro-forma APAC acquisitions acquisitions Group 2005 §m §m §m §m §m
Revenue 1,969.7 1,918.4 16,830.4 20,718.5 15,593.8
Group profit for the financial year 1.1 53.6 1,184.5 1,239.2 1,030.2
A number of business combinations have been completed subsequent to the balance sheet date. None of these combinations is individually material to the Group thereby requiring disclosure under either IFRS 3 or IAS 10 Events after the Balance Sheet Date. Development updates, giving details of acquisitions which do not require separate disclosure, are published in January and July each year.

112 CRH
34. Related Party Transactions
The principal related party relationships requiring disclosure in the consolidated financial statements of the Group under IAS 24 Related Party Disclosures pertain to: the existence of subsidiaries, joint ventures and associates; transactions with these entities entered into by the Group; and the identification and compensation of key management personnel.
Subsidiaries, joint ventures and associatesThe consolidated financial statements include the financial statements of the Company (CRH plc, the ultimate parent) and its subsidiaries, joint ventures and associates as documented in the accounting policies on pages 63 to 70. A listing of the principal subsidiaries, joint ventures and associates is provided on pages 128 to 132 of this Annual Report.
Sales to and purchases from, together with outstanding payables to and receivables from, subsidiaries and joint ventures are eliminated in the preparation of the consolidated financial statements in accordance with IAS 27 Consolidated and Separate Financial Statements. Loans extended by the Group to joint ventures and associates are included in financial assets (whilst the Group’s share of the corresponding loans payable by joint ventures are included in interest-bearing loans and borrowings due to the application of proportionate consolidation in accounting for the Group’s interests in these entities). Sales to and purchases from associates during the financial year ended 31st December 2006 amounted to §17.1 million and §437.9 million respectively. Amounts receivable from and payable to associates (arising from the aforementioned sales and purchases transactions) as at the balance sheet date are included as separate line items in notes 18 and 19 to the consolidated financial statements.
Terms and conditions of transactions with subsidiaries, joint ventures and associatesIn general, the transfer pricing policy implemented by the Group across its subsidiaries is market-based. Sales to and purchases from other related parties (being joint ventures and associates) are conducted in the ordinary course of business and on terms equivalent to those that prevail in arm’s-length transactions. The outstanding balances included in receivables and payables as at the balance sheet date in respect of transactions with associates are unsecured and settlement arises in cash. No guarantees have been either requested or provided in relation to related party receivables and payables. Loans to joint ventures and associates (the respective amounts being disclosed in note 15) are extended on normal commercial terms with interest accruing and, in general, paid to the Group at predetermined intervals.
Key management personnelFor the purposes of the disclosure requirements of IAS 24, the term “key management personnel” (i.e. those persons having authority and responsibility for planning, directing and controlling the activities of the Company) comprises the Board of Directors which manages the business and affairs of the Company. As identified in the Report on Directors’ Remuneration on pages 50 to 57, the Directors, other than the non-executive Directors, serve as executive officers of the Company. Full disclosure in relation to the compensation entitlements of the Board of Directors is provided in the Report on Directors’ Remuneration on pages 50 to 57 of this Annual Report.
35. Board Approval
The Board of Directors approved and authorised for issue the financial statements on pages 60 to 112 in respect of the year ended 31st December 2006 on 5th March 2007.
Notes on Financial Statements

113CRH
Company Balance Sheet
2006 2005Notes §m §m Fixed assets 2 Financial assets 1,074.0 1,065.8
Current assets 3 Debtors 3,683.2 3,803.8 Cash 54.8 55.0
3,738.0 3,858.8
Creditors (amounts falling due within one year) 4 Trade and other creditors 1,386.1 1,422.7 Bank loans and overdrafts 1.2 3.3
1,387.3 1,426.0 Net current assets 2,350.7 2,432.8
Total assets less current liabilities 3,424.7 3,498.6
Creditors (amounts falling due after more than one year) Interest-bearing loans and borrowings 18.7 -
3,406.0 3,498.6
Capital and reserves 6 Called-up share capital 184.5 182.3 6 Preference share capital 1.2 1.2 6 Treasury shares (14.4) - 7 Share premium 2,321.9 2,212.4 7 Revaluation reserve 41.5 41.5 7 Other reserves 557.2 747.5 7 Profit and loss account 314.1 313.7
Shareholders’ funds 3,406.0 3,498.6
as at 31st December 2006
P.J. Molloy, W.I. O’Mahony, Directors

114 CRH
1. Accounting Policies
Basis of accountingThe financial statements have been prepared under the historical cost convention in accordance with the Companies Acts, 1963 to 2006 and Generally Accepted Accounting Practice in the Republic of Ireland (Irish GAAP). The following paragraphs describe the principal accounting policies under Irish GAAP, which have been applied consistently.
InvestmentsFixed asset investments, including investments in subsidiaries, are stated at cost (and at valuation at 31st December 1980 for those investments in existence at that date) and are reviewed for impairment if there are indications that the carrying value may not be recoverable.
Foreign currenciesThe reporting currency of the Company is euro. Transactions in foreign currencies are translated at the rates of exchange ruling at the transaction date. Monetary assets and liabilities denominated in foreign currencies are translated into euro at the rates of exchange ruling at the balance sheet date, with a corresponding charge or credit to the profit and loss account.
Share issue expenses and share premium accountCosts of share issues are written-off against the premium arising on issues of share capital.
Share-based paymentsThe Company has applied the requirements of FRS 20 Share-based Payment.
The accounting policy applicable to share-based payments is consistent with that applied under IFRS and is accordingly addressed in detail on pages 65 and 66 of the Group financial statements.
Certain prior year amounts have been reclassified to conform to current year presentation.
2. Financial Assets
The Company’s investment in its subsidiaries is as follows: Shares (i) Other Total 31st December 2006 §m §m §m
At 1st January at cost/valuation 1,038.3 27.5 1,065.8Disposals (7.8) - (7.8)Capital contribution in respect of employee share options expense - 14.7 14.7Capital contribution in respect of Performance Share Plan expense - 1.3 1.3
At 31st December at cost/valuation 1,030.5 43.5 1,074.0
The equivalent disclosure for the prior year is as follows:
31st December 2005 At 1st January at cost/valuation 861.0 - 861.0 Additions 177.3 - 177.3 Capital contribution in respect of employee share options - 27.5 27.5
At 31st December at cost/valuation 1,038.3 27.5 1,065.8
(i) The Company’s investment in shares in its subsidiaries was revalued at 31st December 1980 to reflect the surplus on revaluation of certain property, plant and equipment (land and buildings) of subsidiaries. The original historical cost of the shares equated to approximately §9.1 million. The analysis of the closing balance between amounts carried at valuation and at cost is as follows:
2006 2005 §m §m
At valuation 31st December 1980 46.7 46.7 At cost post 31st December 1980 983.8 991.6
Total 1,030.5 1,038.3
3. Debtors 2006 2005 §m §m
Amounts owed by subsidiary undertakings 3,680.7 3,802.7 Other debtors 2.5 1.1
3,683.2 3,803.8
Notes to the Company Balance Sheet

115CRH
4. Trade and Other Creditors 2006 2005 §m §mAmounts falling due within one year Amounts owed to subsidiary undertakings 1,385.3 1,422.0Other creditors 0.8 0.7
1,386.1 1,422.7
5. Dividends Proposed
Dividends declared after the balance sheet date are not reported as a liability.
Details in respect of dividends proposed of §208.7 million (2005 : §148.8 million) are presented in the dividends note (note 11) on page 84 of the notes to the Group IFRS financial statements.
6. Called-up Share Capital
Details in respect of called-up share capital are presented in the share capital note (note 29) on page 105 of the notes to the Group financial statements.
7. Movement in Shareholders’ Funds
2006 2005 Share Re- Profit and Share Re- Profit and premium valuation Other loss premium valuation Other loss account reserve reserves account account reserve reserve account §m §m §m §m §m §m §m §m
At 1st January 2,212.4 41.5 747.5 313.7 2,153.4 41.5 - 73.0 Currency translation effects - - - (1.2) - - - - Premium on shares issued 109.5 - - - 59.2 - - - Expenses paid in respect of share issues - - - - (0.2) - - - Transfer to profit and loss account - - (205.0) 205.0 - - - - Profit before tax and dividends - - - 19.0 - - - 1.1 Employee share options - - 14.7 - - - 27.5 - Dividends received from subsidiaries - - - - - - 720.0 300.0 Dividends (including shares issued in lieu of dividend) - - - (222.4) - - - (60.4)
At 31st December 2,321.9 41.5 557.2 314.1 2,212.4 41.5 747.5 313.7
In accordance with Section 148(8) of the Companies Act, 1963 and Section 7(1A) of the Companies (Amendment) Act, 1986, the Company is availing of the exemption from presenting its individual profit and loss account to the Annual General Meeting and from filing it with the Registrar of Companies.
8. Share-based Payments
The total expense of §16.0 million reflected in note 7 to the Group financial statements attributable to employee share options and the Performance Share Plan has been included as a capital contribution in financial assets (note 2).
9. Approval by Board
The Board of Directors approved and authorised for issue the Company financial statements on pages 113 to 115 in respect of the year ended 31st December 2006 on 5th March 2007.

116 CRH
Additional Information for United States Investors
CRH shares are traded on the New York Stock Exchange in the form of American Deposi-tary Shares (ADSs) and held in the form of American Deposi-tary Receipts (ADRs). The ticker symbol is CRH. The adminis-tration of the ADRs is handled by Bank of New York. Each ADS represents one Ordinary Share of the Company. Prior to March 31, 2006, CRH shares had been traded in the United States since 1989 on the National Association of Securities Dealers Automated Quotation System (NASDAQ).
CRH will be filing an Annual Report on Form 20-F in respect of the year ended December 31, 2006 with the Securities and Exchange Commission (SEC). This Report will be available to shareholders when filed and copies will be supplied on application to the Secretary.
The consolidated financial statements of CRH plc have been prepared in accordance with International Financial Reporting Standards (IFRS) as adopted by the European Union.
IFRS differ in certain signifi-cant respects from Generally Accepted Accounting Practice in the United States (US GAAP). The adjustments necessary to state net income and share-holders’ equity under US GAAP are shown in the table on page 121 and are addressed and quantified below.
(i) Provisions (including environmental rehabilitation obligations) and deferred and contingent acquisition consideration
Statement of Financial Ac-counting Standards (SFAS) 143 Accounting for Asset Retirement Obligations (SFAS 143) requires companies to record liabilities equal to the fair value of their asset retirement obligations (ARO) when they are incurred. Over time, the ARO liability is accreted for the change in
its present value each period. While IFRS similarly requires such liabilities to be recognized as provisions, the detailed computations required by SFAS 143 result in differences between IFRS and US GAAP; the adjustments under US GAAP are described below.
The Group’s liability for restora-tion of quarry assets arises over a number of reporting periods and is directly related to the degree of extraction performed. Under both IFRS and US GAAP, the Group has adopted an incremental provisioning meth-odology in order to recognize asset retirement obligations in line with extraction. Incre-mental liabilities incurred in subsequent reporting periods are considered to be an ad-ditional layer of the original liability and are calculated using assumptions applicable in those subsequent periods.
Provisions and deferred and contingent acquisition consideration are subject to discounting under IFRS where the time value of money is deemed to be material. Under US GAAP discounting is only permitted when the timing and the amounts of the associated future cash flows are either fixed or reliably determinable; this criterion is satisfied only in the context of deferred acquisi-tion consideration where the future payments are contractu-ally agreed and not subject to fluctuation. The discounting of provisions and contingent acquisition consideration under IFRS is therefore reversed in the accompanying reconciliation.
Under IFRS, contingent acquisition consideration is provided on a discounted basis in acquisition balance sheets to the extent that the future payment is probable and the liability is reliably measurable at the acquisition date. Under US GAAP, contingent con-sideration is only recognized
at the acquisition date when the amounts are determinable beyond a reasonable doubt; as a result, under US GAAP, contingent consideration is not discounted and is recorded when the contingency is resolved and the consideration is issued or becomes issuable.
The credit adjustment of §3.3 million (2005 : charge of §0.1 million) against income comprises a long-lived asset de-preciation expense of §5.2 million (2005 : §3.7 million) together with an accretion expense of §1.5 million (2005 : §1.4 million) on the total ARO liability; the adjustment is stated net of the §1.8 million (2005 : §0.7 million) already charged to net income under IFRS relating to quarry assets in environmental reme-diation provisions and net of a credit of §8.2 million (2005 : §4.3 million) relating to discounting of provisions and contingent acqui-sition consideration under IFRS reversed in the reconciliation.
(ii) Accounting for interest-bearing loans and borrowings, derivative financial instruments and hedging activities
The accounting policies under IFRS for interest-bearing loans and borrowings, derivative financial instruments and hedging activities are outlined on pages 68 and 69 of this Annual Report. Derivative financial instruments are stated at fair value. Where deriva-tives do not fulfil the criteria for hedge accounting, they are classified as held-for-trading and changes in fair values are reported in the Group Income Statement. The fair value of interest rate and currency swaps is the estimated amount the Group would pay or receive to terminate the swap at the balance sheet date taking into account current interest and currency rates and the credit-worthiness of the swap coun-terparties. The fair value of forward exchange contracts
is calculated by reference to current forward exchange rates for contracts with similar maturity profiles and equates to the quoted market price at the balance sheet date (being the present value of the quoted forward price). All loans and borrowings are initially recorded at cost being the fair value of the consideration received net of attributable transaction costs. Subsequent to initial recognition, current and non-current interest-bearing loans and borrowings are measured at amortized cost employing the effective interest yield methodology.
Under US GAAP, if a derivative is a hedge, depending on the nature of the hedge, changes in the fair value of the deriva-tive are either offset against the change in fair value of the hedged item through income, or recognized in the statement of other comprehensive income until the hedged item is recog-nized in income. The ineffec-tive portion of a derivative’s change in fair value is immedi-ately recognized in income. The short-cut methodology under SFAS 133 Accounting for Deriva-tive Instruments and Hedging Activities, which exempts an entity from conducting detailed effectiveness testing where the critical terms of the hedging instrument and of the entire hedged asset or liability are the same, is applied, where relevant, for the purposes of US GAAP accounting. Given that the cash flow hedges in existence pertain to items of income and expense and are hence included in net income, no GAAP difference arises when the forecasted transaction results in the recognition of a non-financial asset or liability.
Although fair valuation of derivative financial instruments is required under both IFRS and US GAAP, differences in the re-quirements governing qualifica-tion for hedge accounting

117CRH
result in certain derivative financial instruments quali-fying for hedge accounting under IFRS but not under US GAAP. The net Group Income Statement charge of §6.3 million (2005 : credit of §6.0 million) arising from the fair valuation of derivative financial instru-ments under IFRS is replaced by a charge of §7.0 million (2005 : credit of §9.9 million) under US GAAP, giving rise to an addi-tional net charge of §0.7 million to net income under US GAAP (2005 : net credit of §3.9 million).
(iii) Stock-based employee compensation expense
In December 2004, the Financial Accounting Standards Board (FASB) in the United States issued SFAS 123 (revised 2004) Share-Based Payment (SFAS 123(R)), which is a revision of SFAS 123 Accounting for Stock-Based Compensation. SFAS 123(R) supersedes APB Opinion 25 (APB 25) Ac-counting for Stock Issued to Employees, and amends SFAS 95 Statement of Cash Flows. As a result, following the introduction of SFAS 123(R), the application of APB 25 in the US GAAP reconcilia-tion together with pro-forma disclosure of the impact on net income of applying SFAS 123 is no longer permitted (please see the ensuing paragraph wherein the provisions of APB 25 are summarized). Pro-forma disclosures are, however, reported for the prior period as previously required by SFAS 123 as amended by SFAS 148 Accounting for Stock-Based Compensation – Transition and Disclosure – an Amendment of FASB Statement No. 123.
Prior to transition to SFAS 123(R), the Group elected, as permitted by SFAS 123, to follow the intrinsic value method of accounting for share options as set out in APB 25. Under this methodology, compensation expense was booked to income
in each period from the date of grant, or the date on which achievement of the EPS growth targets was deemed probable, if later, to the “date of meas-urement” (i.e. the first date on which the relevant EPS growth targets were achieved), based on the difference between the option price and the quoted market price of the shares at the end of each of the relevant reporting periods.
Under the terms of the Group’s employee share option schemes (excluding savings-related share option schemes), as described in notes 7 and 29 to the IFRS financial statements, share options can only be exercised after the expiration of at least three years or five years from the dates of grant and after specific EPS growth targets have been achieved. As the share options are indexed to a factor in addition to the entity’s share price which is not a market, per-formance or service condition, the share options granted under the 2000 share option scheme are classified as liability awards under SFAS 123(R). Awards made under the Performance Share Plan are similarly classi-fied as liability awards for the purposes of SFAS 123(R). The accompanying Reconciliation to US GAAP reflects adjustments to both net income and equity stemming from the above.
Options granted under the savings-related share option schemes are accounted for as equity awards under SFAS 123(R). Compensation costs arising in respect of these awards prior to the effective date of SFAS 123(R) (but sub-sequent to the effective date of SFAS 123) are accounted for in accordance with the latter standard where the related awards remain unvested as at the effective date of SFAS 123(R) (i.e. January 1, 2006).
The Group adopted SFAS 123(R) on January 1, 2006 for the
purposes of reporting under US GAAP and elected to avail of the “modified prospective” meth-odology governing transition to reporting under SFAS 123(R). Given that options granted to employees under the 2000 share option scheme are classified as liability awards, compensation costs arising in respect of share-based payment awards prior to the effective date of SFAS 123(R) are accounted for in accordance with SFAS 123(R) where the related awards remain unvested as at the effective date of SFAS 123(R) (i.e. January 1, 2006). By virtue of the election to apply the modified prospective transi-tion methodology, the figures reported in the Reconciliation to US GAAP for the prior financial year (i.e. 2005) are computed in accordance with APB 25.
SFAS 123(R) requires companies to adopt a fair value approach to valuing share options that requires compensation cost to be recognized based on the fair value of share options granted. Where awards are classified as liabilities under SFAS 123(R), in addition to recognizing a balance sheet liability, compensation expense is booked to income each period from the date of grant to the date of measurement based on the fair value of the share options calculated using a recognized stock option-pricing model. Under US GAAP, the income statement charge in respect of liability awards only for each reporting period prior to the date of measurement is deter-mined through re-computing the fair value of each award at each reporting date. CRH employs a lattice-pricing model to perform the required computations under both IFRS and US GAAP. Under IFRS, all share-based payments are equity-settled (as defined in IFRS 2 Share-based Payment) and a balance sheet liability is accordingly not recognized in respect of these arrangements. The share-based payments expense in the Group Income
Statement under IFRS is based on grant date fair value meas-urement in respect of awards granted after November 7, 2002 and unvested as at January 1, 2005, allocated to accounting periods over the vesting period.
Application of SFAS 123(R) under US GAAP results in the recognition of an incremental expense of §72.6 million (2005 – APB 25 : §51.6 million) representing the difference between the expense of §16.0 million (2005 : §13.9 million) recorded under IFRS and a charge of §88.6 million (2005 - APB 25 : §65.5 million) under US GAAP; §93.9 million of the total charge under US GAAP relates to liability awards with the balancing credit of §5.3 million pertaining to equity awards. As required by SFAS 123(R), the fair value of the liability at transition is recognized firstly by reducing equity to the extent of previously recognized compensation cost (in the amount of §73.2 million), and secondly, by recognizing the remainder as a cumulative effect of a change in accounting principle. The cumulative effect of the change in accounting principle on transition to SFAS 123(R) amounted to §1.2 million (stated net of tax of §0.2 million); in accordance with the modified prospective transition methodology, this amount is reflected as an adjustment to net income in the Reconciliation to US GAAP. The impact of transition to SFAS 123(R) in respect of equity awards amounted to §6.8 million and has been recognized as a debit in additional paid-in capital.
In addition to the above movements in equity, a credit totaling §14.7 million has been recognized comprising §13.2 million pertaining to the exercise of share options classified as liability awards and §1.5 million in respect of equity awards.

118 CRH
(iv) Goodwill and intangible assets
Under previous (i.e. Irish) GAAP, with effect from January 1, 1998, goodwill, which repre-sented the difference between the consideration paid and the fair value of the net identifiable assets at the date of acquisition of subsidiaries, joint ventures and associates, was capitalized, and related amortization based on a presumed maximum useful life of 20 years was charged against operating income in the Group Income Statement on a straight-line basis from the date of initial recognition. Goodwill was stated at cost less accumulated amortization and any impairment in value.
In addition, under previous GAAP, goodwill arising on business combination activity prior to January 1, 1998 was written-off immediately against reserves; this goodwill was not reinstated on transition to IFRS. This distinction between capi-talized goodwill and goodwill written-off against equity reserves was not recognized under US GAAP and an adjust-ment was therefore required to capitalize all goodwill written-off against equity reserves.
Under US GAAP in effect until January 1, 2002, capital-ized goodwill was amortized to income over its estimated useful life; for the purposes of the US GAAP recon-ciliation, a useful life of 40 years had been adopted.
Under IFRS, intangible assets acquired as part of a business combination are capitalized separately from goodwill if the intangible asset meets the defi-nition of an asset and the fair value can be reliably measured on initial recognition. Subse-quent to initial recognition, intangible assets are carried at cost less any accumulated am-ortization and any accumulated impairment losses. The carrying values of definite-lived intangi-
ble assets are reviewed for in-dicators of impairment at each reporting date and are subject to impairment testing when events or changes in circumstances indicate that the carrying values may not be recoverable. Furthermore, IFRS requires the immediate recognition in the Group Income Statement of any excess of fair value of identifi-able net assets over considera-tion paid (commonly termed “negative goodwill”) arising on acquisitions during the year.
Under SFAS 141 Business Com-binations and SFAS 142 Goodwill and Other Intangible Assets, goodwill is no longer amortized, but is subject to annual impair-ment testing. Any negative goodwill arising during the year is amortized to income over the average life of the assets to which the negative goodwill is allocated. In addition, impair-ment tests are also required at other dates if indicators of im-pairment are present. The Group applied SFAS 141 and SFAS 142 in accounting for goodwill and other intangible assets beginning January 1, 2002 and performed the first of the required annual impairment tests of goodwill as of that date. The US GAAP and IFRS impairment tests performed in respect of the 2005 financial year indicated that no impairment of goodwill had occurred. An impairment loss amounting to §50.0 million was recognized in 2006 under both IAS 36 Impairment of Assets and APB 18 The Equity Method of Accounting for Investments in Common Stock in respect of the Group’s investment in Cementbouw bv, a joint venture engaged in materials trading and readymixed concrete.
The IFRS intangible asset amor-tization expense of §25.3 million for the year ended December 31, 2006 (2005 : §9.1 million) and the negative goodwill credit of §6.8 million (2005 : §4.3 million) is eliminated under US GAAP and replaced by a net expense
of §47.8 million (2005 : §33.1 million), comprising acquisi-tion-related payments of §6.3 million (2005 : §5.8 million) included in goodwill under IFRS and expensed under US GAAP, a charge of §44.1 million (2005 : §29.3 million) in respect of intangible asset amortization under US GAAP, and other credits of §2.6 million (2005 : §2.0 million).
The difference between the intangible asset amortization figure under IFRS and US GAAP of §18.8 million (2005 : §20.2 million) (excluding the aforementioned acquisi-tion-related payments and the other credits) is attribut-able to the fact that IFRS 3 Business Combinations was applied prospectively with effect from the transition date to IFRS (January 1, 2004) and therefore does not mirror the application date for SFAS 141 and SFAS 142 under US GAAP, which have been applied with effect from January 1, 2002.
(v) Property revaluations
Under previous (i.e. Irish) GAAP, it was permitted to restate property assets on the basis of appraised values in financial statements prepared in all other respects in accord-ance with the historical cost convention. On transition to IFRS, the revalued amounts were regarded as deemed cost. Such restatements are not permitted under US GAAP, and accordingly, adjustments to net income and shareholders’ equity are required to eliminate the effect of such restatements.
(vi) Impairment of long-lived assets (other than goodwill)
In accordance with IAS 36 Impairment of Assets, the carrying values of items of property, plant and equipment are reviewed for impairment at each reporting date and are subject to impairment testing when events or changes in
circumstances indicate that the carrying values may not be recoverable. Where the carrying values exceed the estimated recoverable amount (being the greater of fair value less costs to sell and value-in-use), the assets or cash-generating units are written-down to their recover-able amount. Under US GAAP, an asset held-for-use is deemed to be impaired if the sum of the expected future cash flows (un-discounted and before interest charges) is less than the carrying value. If the latter criterion is satisfied, the quantum of impairment is determined by comparing the carrying value of the asset against its fair value. Such impairment reviews are only performed if indicators of impairment exist. No asset impairments were incurred under either IFRS or US GAAP in the years ended December 31, 2006 and December 31, 2005.
(vii) Retirement benefit obligations
Under IFRS, the liabilities and costs associated with the Group’s defined benefit pension schemes and post-retirement healthcare obligations (both funded and unfunded) are assessed on the basis of the projected unit credit method by professionally qualified actuaries and are arrived at using actuarial assumptions based on market expectations at the balance sheet date. The discount rates employed in determining the present value of the schemes’ liabilities are de-termined by reference to market yields at the balance sheet date on high-quality corporate bonds of a currency and term consist-ent with the currency and term of the associated post-retire-ment benefit obligations. When the benefits of a defined benefit scheme are improved, the portion of the increased benefit relating to past service by employees is recognized as an expense in the Group Income Statement on a straight-line
Additional Information for United States Investors continued

119CRH
basis over the average period until the benefits become vested. To the extent that the enhanced benefits vest imme-diately, the related expense is recognized immediately in the Group Income Statement. The net surplus or deficit arising on the Group’s defined benefit pension schemes, together with the liabilities associated with the unfunded schemes, are shown either within non-current assets or liabilities on the face of the Group Balance Sheet. The deferred tax impact of pension scheme surpluses and deficits is disclosed sepa-rately within deferred tax assets or liabilities, as appropriate. The Group has elected to avail of the Amendment to IAS 19 Actuarial Gains and Losses, Group Plans and Disclosures to recognize post transition date actuarial gains and losses immediately in the Statement of Recog-nized Income and Expense.
In addition, under IFRS, the defined benefit pension asset or liability in the Group Balance Sheet comprises the total for each scheme of the present value of the defined benefit obligation (using a discount rate based on high-quality corporate bonds) less any past service cost not yet recognized and less the fair value of plan assets (measured at bid value) out of which the obligations are to be settled directly.
Prior to the introduction of SFAS 158 Employers’ Account-ing for Defined Benefit Pension and Other Postretirement Plans — an Amendment of FASB State-ments No. 87, 88, 106 and 132(R), the balance sheet treatment of defined benefit pension schemes under IFRS con-trasted with US GAAP where the corridor methodology was employed impacting both the net income and sharehold-ers’ equity reconciliations. In summary, the corridor method-ology under US GAAP, which is a permitted alternative
under IAS 19 Employee Benefits, requires that any gain or loss which exceeds 10% of the greater of the actuarial value of the liabilities and the fair value of the schemes’ assets be amortized to net income on a periodic basis over the average remaining working lives of the active participants in the schemes. In line with the provisions governing transition to SFAS 158, the adjustments reflected in the Reconciliation to US GAAP for the preceding financial year remain as reported in the 2005 Annual Report on Form 20-F.
SFAS 158, which is effective as of December 31, 2006, requires the recognition of the over-funded or under-funded status of a defined benefit post-retire-ment plan as an asset or liability in the statement of financial position and the recognition of changes in that funded status in the year in which the changes occur through the statement of comprehensive income. In addition to the above, SFAS 158 also requires the following:
Recognition, on a net of tax basis, as a component of accumulated other comprehensive income of the actuarial gains and losses and any prior service costs or credits which arise during the period but which, pursuant to SFAS 87 and SFAS 106, are not recognized as components of net periodic benefit cost. Amounts recognized in accumulated other comprehensive income are adjusted as they are subsequently recognized as components of net periodic benefit cost pursuant to the recognition provisions of SFAS 87 and SFAS 106. The recognition requirements pertaining to unrecognized actuarial gains and losses eliminate the concept of minimum pension liability under SFAS 87 (i.e. the
!
excess of any unfunded accumulated benefit obligation over unrecognized prior service cost) and the inclusion of such within accumulated other comprehensive income.
Recognition as an adjustment to retained income, net of tax, of any transition asset or transition obligation remaining from the initial application of SFAS 87 or SFAS 106. To the extent that these amounts arise, they are no longer amortized as a component of net periodic benefit cost following the introduction of SFAS 158.
Under IFRS, the interest cost on defined benefit pension scheme liabilities and the expected return on defined benefit pension scheme assets are included as components of total finance costs and finance revenue respectively. For the purposes of US GAAP, these items are treated as part of the net pension cost in arriving at operating income.
Application of SFAS 158 results in the following adjust-ments in the Reconciliation to US GAAP on page 121:
Recognition of an incremental cost of §57.7 million (2005 – SFAS 87 : §18.8 million) representing the difference between the expense recorded under IFRS and that recorded under US GAAP.
Recognition of an incremental retirement benefit liability of §30.9 million (2005 : asset of §466.0 million) reflecting the continuation of defined benefit accounting under US GAAP of the two schemes in the Netherlands deconsolidated under IFRS on the basis of classification as collective defined contribution; the difference between the credit of
!
!
!
§37.7 million recorded under IFRS and reversed under US GAAP and the figure of §30.9 million above arises from the fact that one of the aforementioned schemes was deconsolidated under IFRS with effect from January 1, 2006 and the other as at December 31, 2006. These schemes do not possess individual accounts in respect of each of the members and accordingly do not qualify as defined contribution schemes under US GAAP.
A §247.5 million debit to accumulated other comprehensive income reflecting the inclusion of the cumulative actuarial losses arising on transition to SFAS 158 and the related net deferred tax asset together with the elimination of the additional minimum liability no longer permitted under SFAS 158.
(viii) Debt issue expenses
Prior to 2002, costs relating to the issue of debt securities were expensed under Irish GAAP in the period in which the costs were incurred. With effect from January 1, 2002 the Group has amortized such expenses to income over the life of the debt, which is consistent with US GAAP.
Debt issue expenses amounting to §17.4 million (2005 : nil) were incurred during 2006 in the marketing of a Public Bond Issue. In accordance with IFRS, the total costs incurred have been netted against the related interest-bearing loans and borrowings; under US GAAP, this amount would be classified within receiva-bles but would not give rise to any difference in equity as reported in the accompanying Reconciliation to US GAAP.
!

120 CRH
(ix) Deferred tax and mineral reserves
Under IFRS, the Group has fully provided in its financial statements for deferred tax on all temporary differences. This is consistent with SFAS 109 Accounting for Income Taxes other than in respect of share-based payments and intangible assets where differences exist between IFRS and US GAAP in the methodologies employed for the computation of deferred tax.
The adjustments to net income under US GAAP referred to above give rise to movements in deferred tax which are shown separately in the Reconcilia-tion to US GAAP on page 121.
Prior to IFRS transition, and in accordance with Irish GAAP, deferred tax liabilities were not recorded in respect of the uplift in mineral reserves acquired in business combinations. Such deferred tax liabilities were recorded on transition to IFRS, with a corresponding adjustment to retained income. Accordingly, a reconciling item exists in shareholders’ equity in respect of the unamortized balance of mineral reserves as-sociated with the recognition of the deferred tax liabilities under US GAAP. The mineral reserves depletion charge in respect of these balances amounted to §7.1 million (2005 : §7.0 million).
(x) Consolidation method – joint ventures
In line with the benchmark accounting methodology in IAS 31 Interests in Joint Ventures, the Group’s share of results and net assets of joint ventures, which are entities in which the Group holds an interest on a long-term basis and which are jointly con-trolled by the Group and one or more other venturers under a contractual arrangement, are accounted for on the basis of proportionate consolidation from the date on which the con-tractual agreements stipulating joint control are finalized and are derecognized when
joint control ceases. All of the Group’s joint ventures are jointly controlled entities within the meaning of IAS 31. The Group combines its share of the joint ventures’ individual income and expenses, assets and liabilities and cash flows on a line-by-line basis with similar items in the Group’s financial statements.
Under US GAAP, joint ventures must be accounted for under the equity method. This would not result in any difference in the net income of the Group, but the proportionate consolidation of the assets and liabilities of the joint ventures on a line-by-line basis with similar items in the IFRS Group Balance Sheet would be eliminated and shown as an investment in joint ventures under US GAAP. The resultant reclassifications (including the aforementioned impairment of the Group’s investment in Cementbouw bv – see (iv) above) would not give rise to any differ-ence in shareholders’ equity.
(xi) Currency translation adjustment
Under both IFRS and US GAAP, items included in the financial statements of each of the Group’s entities are measured using the currency of the primary economic environment in which the entity operates (“the func-tional currency”). The consoli-dated financial statements are presented in euro, which is the presentation currency of the Group and the functional currency of the Company.
Adjustments arising on transla-tion of the results of non-euro subsidiaries, joint ventures and associates at average rates, and on restatement of the opening net assets at closing rates, are dealt with in Accumulated Other Comprehensive Income under US GAAP. The currency translation adjustment included in comprehensive income on page 121 also includes
the translation impact of the adjustments to net income under US GAAP for each year.
(xii) Variable Interest Entities (VIEs)
Where control is realized through means other than voting rights, the relevant US GAAP Interpretation (namely FIN 46(R)) requires that entities fulfilling the definition of VIEs are consolidated in the financial statements of the primary ben-eficiary of the variable interests. No circumstances exist in any of the joint ventures (which are proportionately consolidated subject to joint control) or associates (which are equity-accounted on the basis of significant influence) in which the Group participates which would give rise to these entities being classified as VIEs in accordance with FIN 46(R).
(xiii) Minority interests - preferred stock
In the Group Balance Sheet, non-recourse preference capital funding pertaining to the Group’s investment in its associate in Israel is classified under non-current interest-bearing loans and borrowings. The related interest costs are recorded within finance costs in the Group Income Statement.
Under US GAAP, this funding is included within minority interest classified outside of shareholders’ equity in the statement of financial position and the related contractu-ally required payments are included within minority interest as an additional charge against income. As the con-tractually required payments are deducted to arrive at the Group’s net income attributable to ordinary shareholders and classified outside of equity for both IFRS and US GAAP in the Group Balance Sheet, there are no reconciling entries to net income or shareholders’ equity for this item.
Additional Information for United States Investors continued

121CRH
2006 2005 Effect on net income §m §m
Net income (Group profit for the financial year) as reported in the Group Income Statement 1,224.2 1,006.3 Minority interest (14.0) (8.4)Preference dividends (0.1) (0.1)
Net income for the year attributable to ordinary equity holders of the Company 1,210.1 997.8
US GAAP adjustmentsProvisions and deferred and contingent acquisition consideration (i) 3.3 (0.1)(Loss)/profit on derivative instruments (ii) (0.7) 3.9 Stock-based employee compensation (iii) (71.2) (51.6)Amortization of intangible assets and adjustments to goodwill (iv) (29.3) (28.3)Elimination of revaluation surplus (v) 0.3 0.8 Retirement benefit obligations (vii) (57.7) (18.8)Amortization of debt issue expenses (viii) (0.3) (0.3)Mineral reserves depletion (ix) (7.1) (7.0)Deferred tax- temporary differences (ix) 14.5 13.3
Net income attributable to ordinary shareholders under US GAAP before cumulative effect of SFAS 123(R) 1,061.9 909.7Cumulative effect of change in accounting principle on adoption of SFAS 123(R), net of tax (1.2) -
Net income attributable to ordinary shareholders under US GAAP after cumulative effect of SFAS 123(R) 1,060.7 909.7
Net income per shareBasic net income per Ordinary Share/ADS under US GAAP before cumulative effect of SFAS 123(R) 196.9c 170.3cCumulative effect of change in accounting principle on adoption of SFAS 123(R), net of tax (0.3c) n/a
Basic net income per Ordinary Share/ADS under US GAAP after cumulative effect of SFAS 123(R) 196.6c 170.3c
Operating income (see footnote) under US GAAP amounted to §1,598.9 million (2005 : §1,215.7 million).
Cumulative effect on shareholders’ equity
Total equity as reported in the Group Balance Sheet 7,104.3 6,233.7 Minority interest (41.8) (38.3)
Shareholders’ equity as reported in the Group Balance Sheet 7,062.5 6,195.4
US GAAP adjustmentsProvisions and deferred and contingent acquisition consideration (i) (14.6) (59.4)Hedging instruments - fair value adjustments (ii) (0.2) (1.5)Stock-based employee compensation (iii) (153.9) -Amortization of intangible assets and adjustments to goodwill (iv) 437.6 392.1 Elimination of revaluation surplus (v) (26.6) (26.8)Retirement benefit obligations (vii) (30.9) 466.0 Debt issue expenses prepaid (viii) 0.7 1.0 Unamortized cumulative uplift in mineral reserves (ix) 247.8 284.2 Deferred tax - temporary differences (ix) (178.5) (149.1)
Shareholders’ equity under US GAAP 7,343.9 7,101.9
Statement of Comprehensive Income
Comprehensive income under US GAAP is as follows:
Net income attributable to ordinary shareholders under US GAAP 1,060.7 909.7
Other comprehensive income:- currency translation adjustment (xi) (418.4) 469.2 - derivative instruments - fair value adjustments (ii) 6.4 (4.6)- movement in minimum liability on retirement benefit obligations (vii) 14.8 0.7
(397.2) 465.3
Comprehensive income 663.5 1,375.0
Accumulated other comprehensive income as at December 31
Accumulated foreign currency translation (xi) (868.3) (449.9)Cumulative fair value adjustment on derivatives (ii) 43.4 37.0 Additional minimum liability on retirement benefit obligations (vii) - (34.4)Adoption of SFAS 158 (including elimination of additional minimum liability) (vii) (247.5) -
(1,072.4) (447.3)
Reconciliation to US GAAP
Note: Operating income under US GAAP reflects profit before finance costs of §1,807.3 million under IFRS adjusted to (i) include the net income reconciling items above to the extent that they impact operating income; (ii) exclude proportionately consolidated operating income of joint ventures; and (iii) reclassify the expected return on scheme assets and the interest cost on scheme liabilities (net of amounts applicable to joint ventures) from finance revenue and finance costs to operating income.

122 CRH
(Figures prepared in accordance with Irish GAAP)
1995 1996 1997 1998 1999 2000 2001 2002 2003 2004 §m §m §m §m §m §m §m §m §m §m
Turnover including share of joint ventures 2,520.0 3,354.1 4,234.3 5,210.9 6,733.8 8,869.8 10,443.5 10,794.1 11,079.8 12,819.7 Less share of joint ventures 92.9 152.0 154.7 176.6 134.4 168.0 236.7 276.9 305.5 539.6
2,427.1 3,202.1 4,079.6 5,034.3 6,599.4 8,701.8 10,206.8 10,517.2 10,774.3 12,280.1
Group operating profit 223.2 282.7 348.5 441.9 676.0 918.5 1,020.1 1,048.1 1,044.7 1,247.0 Goodwill amortisation - - - (1.3) (19.7) (43.7) (60.6) (69.6) (75.5) (101.4)Profit on disposal of fixed assets 1.4 0.8 9.2 11.2 7.1 12.8 16.7 15.7 13.0 11.3 Exceptional items - - - - 64.2 - - - - -
Profit on ordinary activities before interest 224.6 283.5 357.7 451.8 727.6 887.6 976.2 994.2 982.2 1,156.9 Net interest payable - Group (19.1) (24.3) (32.1) (37.5) (91.8) (190.0) (169.7) (131.4) (112.8) (126.0)- share of joint ventures and associates (1.6) (3.3) (4.1) (5.4) (0.9) (0.9) (3.6) (7.1) (5.2) (13.9)
Profit on ordinary activities before tax 203.9 255.9 321.5 408.9 634.9 696.7 802.9 855.7 864.2 1,017.0 Tax on profit on ordinary activities (41.8) (58.3) (75.7) (99.9) (152.0) (193.7) (217.0) (226.8) (217.6) (247.1)Tax on exceptional items - - - - (25.7) - - - - -
Profit on ordinary activies after tax 162.1 197.6 245.8 309.0 457.2 503.0 585.9 628.9 646.6 769.9
Employment of capital Fixed assets - Tangible assets 895.2 1,235.5 1,518.8 2,287.6 3,225.8 4,550.9 5,150.5 5,004.4 5,145.4 5,319.9 - Intangible asset - goodwill - - - 138.2 629.2 954.6 1,153.5 1,154.1 1,474.5 1,443.5 - Financial assets 118.2 127.3 131.5 52.6 66.6 104.0 315.8 274.8 348.7 702.4 Net current assets (a) 132.9 255.3 313.4 512.5 607.9 915.1 1,039.8 1,078.4 1,116.2 1,243.7 Other liabilities (b) (13.0) (25.0) (60.8) (286.3) (430.3) (469.8) (479.3) (443.4) (428.9) (429.1)
Total 1,133.3 1,593.1 1,902.9 2,704.6 4,099.2 6,054.8 7,180.3 7,068.3 7,655.9 8,280.4
Financed as follows Equity shareholders’ funds 868.2 1,055.8 1,308.4 1,552.8 2,200.5 3,073.9 4,734.2 4,746.7 4,757.7 5,216.6 Preference share capital 1.2 1.2 1.2 1.2 1.2 1.2 1.2 1.2 1.2 1.2 Minority shareholders’ equity interest 11.7 12.5 13.7 285.3 37.0 35.7 135.1 110.9 90.6 82.6 Capital grants 12.1 11.1 10.4 19.9 18.8 17.3 15.7 14.6 12.7 11.0 Deferred tax 48.9 70.3 104.0 115.9 172.4 306.9 400.4 485.0 485.6 528.3 Net debt (c) 189.3 442.2 465.2 729.5 1,669.3 2,619.8 1,893.7 1,709.9 2,308.1 2,440.7 Convertible capital bonds (d) 1.9 - - - - - - - - -
1,133.3 1,593.1 1,902.9 2,704.6 4,099.2 6,054.8 7,180.3 7,068.3 7,655.9 8,280.4
Purchase of tangible assets 109.2 150.0 147.3 232.1 360.1 429.5 452.3 367.4 402.0 520.2 Acquisitions and investments 164.3 532.2 240.5 603.8 1,420.7 1,605.1 1,080.1 991.8 1,615.3 921.8
Total capital expenditure 273.5 682.2 387.8 835.9 1,780.8 2,034.6 1,532.4 1,359.2 2,017.3 1,442.0
Depreciation and goodwill amortisation 81.1 103.6 129.1 165.9 275.1 395.4 496.7 525.9 533.7 595.8
Earnings per share after goodwill amortisation (cent) (e) 41.1 48.7 58.1 72.1 97.0 113.8 115.3 119.2 121.9 143.9 Earnings per share before goodwill amortisation (cent) (e) 41.1 48.7 58.1 72.4 101.6 123.8 127.3 132.5 136.2 163.1 Dividend per share (cent) 10.52 11.80 13.54 15.61 18.22 20.77 23.00 25.40 28.10 33.00 Cash earnings per share (cent) (f) 62.00 74.4 88.9 111.2 161.2 204.1 213.7 219.8 223.4 256.4 Dividend cover (times) (e) 3.87 4.02 4.27 4.59 5.29 5.34 4.85 4.68 4.32 4.34
Notes to Irish GAAP financial summary data
(a) Excluding bank advances and cash and liquid investments which are included under net debt (see note (c) below).
(b) Including deferred and contingent acquisition consideration due after more than one year and provisions for liabilities and excluding deferred tax.
(c) Net debt represents the sum of loans (including finance leases) and overdrafts falling due within one year, bank loans (including finance leases) falling due after more than one year less cash and liquid investments.
(d) Including supplemental interest.
(e) Excluding exceptional net gains in 1999.
(f) Cash earnings per share equals the sum of profit for the year attributable to ordinary shareholders, depreciation and goodwill amortisation divided by the average number of Ordinary Shares outstanding for the year.
Group Financial Summary

123CRH
(Figures prepared in accordance with IFRS)
Restated 2004 2005 2006 §m §m §m
Revenue 12,754.5 14,449.3 18,737.4
Group operating profit 1,220.2 1,392.3 1,766.8 Profit on disposal of fixed assets 10.8 19.8 40.5
Profit before finance costs 1,231.0 1,412.1 1,807.3 Finance costs (264.3) (297.4) (407.3)Finance revenue 117.9 138.3 155.2 Group share of associates’ profit after tax 19.4 25.9 47.2
Profit before tax 1,104.0 1,278.9 1,602.4 Income tax expense (232.2) (272.6) (378.2)
Group profit for the financial year 871.8 1,006.3 1,224.2
Employment of capital Property, plant and equipment 5,830.6 6,823.5 7,479.5 Intangible assets 1,774.1 2,252.5 2,966.0 Investments in associates/other financial assets 292.0 634.5 650.8 Net working capital (g) 1,539.9 1,944.6 2,419.7 Other liabilities - current and non-current (h) (1,034.6) (1,243.0) (1,097.3)
Total 8,402.0 10,412.1 12,418.7
Financed as followsCapital and reserves excluding preference share capital 4,944.0 6,194.2 7,061.3 Preference share capital 1.2 1.2 1.2 Minority interest 34.2 38.3 41.8 Capital grants 12.4 12.1 10.4 Net deferred income tax liability 652.1 718.0 812.0 Net debt (i) 2,758.1 3,448.3 4,492.0
Total 8,402.0 10,412.1 12,418.7
Purchase of property, plant and equipment 550.7 652.1 832.3 Acquisition of subsidiaries and joint ventures 1,019.4 1,297.8 2,311.0
Total capital expenditure 1,570.1 1,949.9 3,143.3
Depreciation of property, plant and equipment 515.9 555.8 663.7 Amortisation of intangible assets 4.1 9.1 25.3 Earnings per share after amortisation of intangible assets (cent) 163.6 186.7 224.3 Earnings per share before amortisation of intangible assets (cent) 164.3 188.5 229.0 Dividend per share (cent) 33.00 39.00 52.00 Cash earnings per share (cent) (j) 261.8 292.5 352.1 Dividend cover (times) (k) 4.96 4.79 4.31
Notes to IFRS financial summary data
(g) Represents the sum of inventories and trade and other receivables (included in current assets) less trade and other payables (included in current liabilities).
(h) Represents the sum of current income tax liabilities, current and non-current provisions for liabilities, non-current trade and other payables and retirement benefit obligations.
(i) Represents the sum of current and non-current interest-bearing loans and borrowings and derivative financial instruments liabilities less the sum of liquid investments, cash and cash equivalents and current and non-current derivative financial instruments assets.
(j) Cash earnings per share represents profit attributable to equity holders of the Company less preference dividends paid plus depreciation of property, plant and equipment and amortisation of intangible assets divided by the average number of Ordinary Shares outstanding for the year.
(k) Represents earnings per Ordinary Share 224.3c (2005 : 186.7c) divided by dividends per Ordinary Share of 52.0c (2005 : 39.0c).

124 CRH
Shareholder Information
Dividend payments
An interim dividend of 13.50c, with scrip alternative, was paid in respect of Ordinary Shares on 3rd November 2006.
A final dividend of 38.50c, if approved, will be paid in respect of Ordinary Shares on 14th May 2007. A scrip alternative will be offered to shareholders.
Dividend Withholding Tax (DWT) must be deducted from dividends paid by an Irish resident company, unless a shareholder is entitled to an exemption and has submitted a properly completed exemption form to the Company’s Registrars, Capita Registrars. DWT applies to dividends paid by way of cash or by way of shares under a scrip dividend scheme and is deducted at the standard rate of Income Tax (currently 20%). Non-resident shareholders and certain Irish companies, trusts, pension schemes, investment undertakings and charities may be entitled to claim exemption from DWT and have been sent the relevant form. Further copies of the form may be obtained from the Company’s Registrars. Shareholders should note that DWT will be deducted from dividends in cases where a properly completed form has not been received by the record date for a dividend. Individuals who are resident in Ireland for tax purposes are not entitled to an exemption.
Shareholders who wish to have their dividend paid direct to a bank account, by electronic funds transfer, should contact the Company’s Registrars to obtain a mandate form. Tax vouchers will be sent to the shareholder’s registered address under this arrangement.
Dividends are paid in euro. In order to avoid costs to shareholders, dividends are paid in Sterling and US Dollars to shareholders whose address according to the Share Register is in the UK and the United States respectively, unless they require otherwise.
Dividends in respect of 5% Cumulative Preference Shares are paid half-yearly on 15th April and 15th October.
Dividends in respect of 7% ‘A’ Cumulative Preference Shares are paid half-yearly on 5th April and 5th October.

125CRH
CREST
Transfer of the Company’s shares takes place through the CREST settlement system. Shareholders have the choice of holding their shares in electronic form or in the form of share certificates.
Share price data 2006 2005 § §
Share price at 31st December 31.54 24.85Market capitalisation 17.1bn 13.3bnShare price movementduring the year: - high 31.82 24.85 - low 22.65 18.87
Shareholdings as at 31st December 2006
Ownership of Ordinary Shares Number of % ofGeographic location* shares held total ‘000
Ireland 102,300 19United Kingdom 92,456 17United States 170,018 31Europe/Other 104,135 19Retail 73,881 14 542,790 100
*This represents a best estimate of the number of shares controlled by fund managers resident in the geographic regions indicated. Private shareholders are classified as retail above.
Holdings Number of % of Number of % of shareholders total shares held total ‘000
1 - 1,000 15,432 58.92 5,747 1.061,001 - 10,000 9,086 34.69 27,055 4.9810,001 - 100,000 1,346 5.14 36,385 6.70100,001 - 1,000,000 256 0.98 80,214 14.78Over 1,000,000 72 0.27 393,389 72.48 26,192 100 542,790 100
Stock Exchange listings
CRH has primary listings on the Irish and London Stock Exchanges. The Group’s ADRs are quoted on the New York Stock Exchange (NYSE) in the United States.
Financial calendar
Announcement of final results for 2006 6th March 2007Ex-dividend date 14th March 2007Record date for dividend 16th March 2007Latest date for receipt of scrip forms 27th April 2007Annual General Meeting 9th May 2007
Dividend payment date and first day of dealingin scrip dividend shares 14th May 2007Trading update statement 5th July 2007Announcement of interim results for 2007 28th August 2007
Website
The Group’s website, www.crh.com, provides the full text of the Annual and Interim Reports, the Annual Report on Form 20-F, which is filed annually with the United States Securities and Exchange Commission, trading statements and copies of presentations to analysts and investors. News releases are made available, in the News & Media section of the website, immediately after release to the Stock Exchanges.
Registrars
Enquiries concerning shareholdings should be addressed to:
Capita Registrars,P.O. Box 7117, Dublin 2.Telephone: +353 (0) 1 810 2400Fax: +353 (0) 1 810 2422
Shareholders with access to the internet may check their accounts either by accessing CRH’s website and selecting “Registrars” under “Shareholder Services” in the Investor Relations section or by accessing the Registrars’ website, www.capitaregistrars.ie. This facility allows shareholders to check their shareholdings and to download standard forms required to initiate changes in details held by the Registrars.
American Depositary Receipts
The ADR programme is administered by the Bank of New York and enquiries regarding ADRs should be addressed to:
The Bank of New YorkInvestor ServicesP.O. Box 11258Church Street StationNew York, NY 10286-1258Telephone: Toll Free Number (United States residents): 1-888-269 2377International: +1 212-815-3700Email: [email protected]: http://www.stockbny.com
Electronic proxy voting
Shareholders may lodge a proxy form for the 2007 Annual GeneralMeeting electronically. Shareholders who wish to submit proxies via the internet may do so by accessing CRH’s, or the Registrars’, website as described above. Shareholders must register for this service on-line before the electronic proxy service can be used. Instructions on using the service are sent to shareholders with their proxy form.
CREST members wishing to appoint a proxy via the CREST systemshould refer to the CREST Manual and the notes to the Notice of theAnnual General Meeting.

126 CRH
Management
Liam O’Mahony Chief Executive Officer
Myles Lee Finance Director
Angela Malone Company Secretary
Albert Manifold Group Development Director
Jack Golden Human Resources Director
Liam Hughes Business Support Director
Paul Barry Head of Internal Audit
Maeve Carton Group Controller
Rossa McCann Group Treasurer
Jim O’Brien Group Technical Advisor
Éimear O’Flynn Head of Investor Relations
Pat O’Shea Group Taxation Director
Materials
Declan Doyle Managing Director
Albert Manifold Managing Director Designate
Henry Morris Chief Operating Officer
Alan Connolly Finance Director
Frank Heisterkamp Business Development Director
Eamon Geraghty Technical Director
Tony Macken Business Development Manager
Ireland
Jim Nolan Managing Director Cement and Lime Division
Ken McKnight Managing Director Irish Cement
Leo Grogan Managing Director Premier Periclase
Donal Dempsey Managing Director Roadstone-Wood & Northstone Group
Jim Farrell Managing Director Roadstone Dublin
Frank Byrne Managing Director Roadstone Provinces
John Hogan Managing Director John A. Wood
Noel Quinn Managing Director Northstone
Finland/Switzerland
Henry Morris Regional Director Switzerland & Finland
Eero Laatio Managing Director Finnsementti
Kalervo Matikainen Managing Director Lohja Rudus
Urs Sandmeier Managing Director Jura Cement
Martin Glarner Managing Director Jura Aggregates & Readymix
Central Eastern Europe
Declan Maguire Regional Director Central Eastern Europe
Owen Rowley Country Manager Poland
Andrzej Ptak President Grupa OzOz
. a rów
Aleksander Szyszko Country Manager Ukraine
Spain
Sebastia Alegre Managing Director CRH Spain
Josep Masana Chief Financial Officer CRH Spain
Josep Perxas Divisional Director CRH Spain
Senior Group Staff Europe
Tom Hill Chief Executive Officer
Michael O’Driscoll Chief Financial Officer
Gary Hickman Senior Vice President Tax & Risk Management
Materials
Mark Towe Chief Executive Officer
Doug Black President & Chief Operating Officer
Glenn Culpepper Chief Financial Officer
Don Eshleman Executive Vice President
Charles Brown Vice President Finance
John Hay Vice President Government Relations
Michael Brady Senior Vice President Development
New England
John Keating President New England Division
Christian Zimmerman President Pike
Jim Reger President P.J. Keating
Rick Mergens President Tilcon Connecticut
New York/New Jersey
Chris Madden President New York/New Jersey Division
Ciaran Brennan President Callanan Industries
John Cooney President Tilcon NY
John Odenbach President Dolomite Group
George Thompson President Tilcon NJ
Central
Dan Montgomery President Central Division
John Powers President Shelly
Dan Cooperrider President Appalachian Mountain Group
Mid-Atlantic
Randy Lake President Mid-Atlantic Division
Dennis Rickard President Michigan Paving & Materials
West
John Parson President West Division
Jeff Schaffer President Northwest Group
Scott Parson President Staker-Parson Group
Shane Evans President Rocky Mountain Group
Jim Gauger President Iowa Group
APAC
Kirk Randolph President APAC Division
Products & Distribution
Architectural Products
Bill Sandbrook Chief Executive Officer
Paul Valentine EVP, Finance & Administration
Ted Kozikowski President Masonry
The Americas

127CRH
Products & Distribution
Máirtín Clarke Group Managing Director
Peter Erkamp Finance Director
Michael Stirling Human Resources Director
Concrete Products
Rudy Aertgeerts Product Group Director
Kees Verburg Finance/Development Director
Edwin van den Berg Managing Director Architectural Products Benelux
Mark van Loon Managing Director Structural Concrete Benelux
Claus Bering Managing Director Scandinavia and Eastern Europe
Jean-Paul Gelly Managing Director Architectural Products France
Hans-Josef Münch Managing Director EHL
Shaun Gray Managing Director Forticrete
Richard Lee Managing Director Supreme
Clay Products
Wayne Sheppard Product Group Director & Managing Director Ibstock Brick
Geoff Bull Product Group Finance Director
Jan van Ommen Managing Director Clay Mainland-Europe
Claus Arntjen Managing Director AKA Ziegelwerke
Joanna Stelmasiak Managing Director CRH Klinkier
Building Products
Marc St. Nicolaas Product Group Director
Erwin Thys Finance/Development Director
Kees-Jan van’t Westeinde Development Director
Gerben Stilma Managing Director Insulation
Frank Boekholtz Finance/Development Director Insulation
John Nash Development Director Insulation
Geert-Jan van Schijndel Managing Director Fencing & Security
Ton van Gerwen Managing Director Daylight & Ventilation
Dirk Vael Managing Director Construction Accessories
Distribution
Erik Bax Product Group Director
Kees van der Drift Finance/Development Director
Philippe Denécé Development Director France
Anton Huizing Development Director Spain
René Doors Managing Director Builders Merchants Netherlands
Harry Bosshardt Managing Director Builders Merchants Switzerland
Louis Bruzi Managing Director Builders Merchants Ile-de-France
Christian Klemm Managing Director Builders Merchants Austria
Emiel Hopmans Managing Director DIY Europe
Jos de Nijs Managing Director Roofing Materials Netherlands
Kelly Elliott Chief Financial Officer
Damian Burke VP Development
John Kemp Vice President Marketing
Bertin Castonguay Director Research & Development
Georges Archambault President APG Canada
Steve Matsick President Glen-Gery
Wade Ficklin President APG West
Pete Kelly President APG Northeast
Tom Conroy President APG South
Marcia Gibson President APG Midwest
Keith Haas President APG Retail
David Maske President Bonsal American
Precast
Mark Schack Chief Executive Officer
Bob Quinn Chief Financial Officer
Dave Steevens Vice President Development
Bob Kramer President Northeast Precast Division
Jan Olsen President Southeast Division
Ray Rhees President Central Division
Mike Scott President Western Division
George Hand President Eastern Pipe Division
Donna Reuter President Building Systems Division
David Shedd President National Products Division
Glass
Ted Hathaway Chief Executive Officer
Dominic Maggiano Chief Financial Officer
Daipayan Bhattacharya Vice President Development & Technology
Jim Avanzini President Western Group
Bob Berleth President Eastern Group
Roy Orr President Central Group
MMI
John Wittstock Chief Executive Officer
Bob Tenczar Chief Financial Officer
David Clark Executive Vice President
Lyle Bumgarner President ADC Manufacturing
Walter Berner, Jr. President Construction Accessories
Mike McCall President Wire Products
Paul Harrison President Fencing
Distribution
Michael Lynch Chief Executive Officer
Robert Feury Jr. Chief Operating Officer
Greg Bloom John McLaughlin Ron Pilla Donald Toth Vice Presidents
Brian Reilly Chief Financial Officer
Dave Jenkins Development Director
South America
Juan Carlos Girotti Managing Director CRH Sudamericana Canteras Cerro Negro
Alejandro Javier Bertrán Business Development Manager
Benjamin Fernandez Business Development Manager
Argentina
Carlos Val Managing Director Superglass
Chile
Bernardo Alamos Managing Director Vidrios Dell Orto

128 CRH
Principal Subsidiary Undertakings
Incorporated and operating in % held Products and services
Europe Materials
Britain & Northern Ireland
Northstone (NI) Limited 100 Aggregates, readymixed concrete, (including Farrans, Ready Use mortar, coated macadam, rooftiles, Concrete, R.J. Maxwell & Son, building and civil engineering Scott) contracting
Premier Cement Limited 100 Marketing and distribution of cement
T.B.F. Thompson (Properties) Limited 100 Property development
Finland
Finnsementti Oy 100 Cement
Lohja Rudus Oy Ab 100 Aggregates and readymixed concrete
Ireland
Irish Cement Limited 100 Cement
Premier Periclase Limited 100 High quality seawater magnesia
Roadstone-Wood Group
Clogrennane Lime Limited 100 Burnt and hydrated lime
John A. Wood Limited 100 Aggregates, readymixed concrete, concrete blocks and pipes, asphalt, agricultural and chemical limestone and contract surfacing
Ormonde Brick Limited 100 Clay brick
Roadstone Dublin Limited 100 Aggregates, readymixed concrete, mortar, coated macadam, asphalt, contract surfacing and concrete blocks
Roadstone Provinces Limited 100 Aggregates, readymixed concrete, mortar, coated macadam, asphalt, contract surfacing, concrete blocks and rooftiles
Poland
Bosta Beton Sp. z o.o.* 90.3 Readymixed concrete
Cementownia Rejowiec S.A. 100 Cement
Drogomex Sp. z o.o.* 99.94 Asphalt and contract surfacing
Faelbud S.A.* 100 Readymixed concrete, concrete products and concrete paving
Grupa OzOz. a rów S.A. S.A. 100 Cement
Grupa Prefabet S.A.* 100 Concrete products
Kujawy Wapno Sp. z o.o.* 99.95 Production of lime and lime products
Masfalt Sp. z o.o.* 100 Asphalt and contract surfacing
O.K.S.M. 99.91 Aggregates
Polbet B-Complex S.A.* 100 Readymixed concrete and concrete paving
ZPW Trzuskawica S.A. 99.95 Production of lime and lime products
Spain
Beton Catalan Group
Beton Catalan s.a. 100 Readymixed concrete
Cabi s.a. 99.99 Cementitious materials
Cantera de Aridos Puig Broca s.a. 99.81 Aggregates
Explotacion de Aridos Calizos s.a. 100 Aggregates
Formigo i Bigues s.a. 99.81 Aggregates
Formigons Girona s.a. 100 Readymixed concrete and precast concrete products
Suberolita s.a. 100 Readymixed concrete and precast concrete products
Tamuz s.a. 100 Aggregates
Switzerland
JURA-Holding 100 Cement, aggregates and readymixed concrete
Ukraine
Podilsky Cement 98.88 Cement
Incorporated and operating in % held Products and services
Europe Products & Distribution
Austria
Quester Baustoffhandel GmbH 100 Builders merchants
Belgium
Concrete Products
Douterloigne nv 100 Concrete floor elements, pavers and blocks
Ergon nv 100 Precast concrete structural elements
Klaps nv 100 Concrete paving, sewerage and water treatment
Marlux nv 100 Decorative concrete paving
Oeterbeton nv 100 Precast concrete
Omnidal nv 100 Precast concrete structural elements
Remacle sa 100 Precast concrete products
Schelfhout nv 100 Precast concrete wall elements
Building Products
Plakabeton nv 100 Construction accessories
Portal sa 100 Glass roof structures
Distribution
Van Neerbos Bouwmarkten nv 100 DIY stores
Clay Products
Steenhandel J. De Saegher nv 100 Clay brick factors
Britain & Northern Ireland
Concrete Products
Forticrete Limited 100 Concrete masonry products and rooftiles
Supreme Concrete Limited 100 Concrete fencing, lintels and floor beams
Clay Products
Ibstock Brick Limited 100 Clay brick manufacturer
Kevington Building Products Limited 100 Specialist brick fabricator
Manchester Brick & Precast 100 Brick-clad precast components
Building Products
Airvent Systems Services Limited 100 Smoke ventilation systems and services
Broughton Controls Limited 100 Access control systems
Cox Building Products Limited 100 Domelights, ventilation systems and continuous rooflights
CRH Fencing Limited 100 Security fencing
EcoTherm Insulations Limited 100 PUR/PIR insulation
Geoquip Limited 100 Perimeter intrusion detection systems
Springvale EPS Limited 100 EPS insulation and packaging
TangoRail Limited 100 Non-welded railing systems
Denmark
Betonelement A/S 100 Precast concrete structural elements
Betongruppen RBR 100 Paving Manufacturer
ThermiSol A/S 100 EPS insulation
Estonia
ThermiSol OÜ 100 EPS insulation
Finland
ThermiSol Oy 100 EPS insulation
France
Concrete Products
BMI sa 99.91 Precast concrete products
Chapron Leroy sas 100 Utility products
Stradal sas 100 Landscape, utility and infrastructural concrete products

129CRH
Incorporated and operating in % held Products and services
Building Products
Heda sa 100 Security fencing
Heras Clôture sarl 100 Temporary fencing
Laubeuf sas 100 Glass roof structures
Plakabeton sa 100 Construction accessories
Distribution
Buscaglia sas* 100 Builders merchants
Doras sa* 57.85 Builders merchants
Etrechy Matériaux sas 100 Builders merchants
Matériaux Service sas 100 Builders merchants
Raboni sas* 100 Builders merchants
Germany
Concrete Products
EHL AG 100 Concrete paving and landscape walling products
Rhebau GmbH 100 Water treatment and sewerage products
Clay Products
AKA Ziegelgruppe GmbH 100 Clay brick, pavers and rooftiles
Building Products
Adronit GmbH 100 Security fencing and access control
Brakel Aero GmbH 100 Rooflights, glass roof structures and ventilation systems
EcoTherm GmbH 100 PUR/PIR insulation
Gefinex GmbH 100 XPE insulation
Greschalux GmbH 100 Domelights and ventilation systems
Halfen GmbH 100 Metal construction accessories
Heras SKS GmbH 100 Security fencing
JET Tageslicht und RWA GmbH 100 Domelights, ventilation systems and continuous rooflights
Magnetic Autocontrol GmbH 100 Vehicle and pedestrian access control systems
Syncotec GmbH 100 Construction accessories
Unidek GmbH 100 EPS insulation
Ireland
Building Products
Aerobord Limited 100 EPS insulation and packaging
Construction Accessories Limited 100 Metal and plastic construction accessories
Italy
Record S.p.A. 100 Concrete landscaping
Netherlands
Concrete Products
Alvon Bouwsystemen bv 100 Precast concrete structural elements
Calduran bv 100 Sand-lime bricks and building elements
Dycore bv 100 Concrete flooring elements
Heembeton bv 100 Precast concrete structural elements
Kellen bv 100 Concrete paving products
Struyk Verwo bv 100 Concrete paving products
Clay Products
Kleiwarenfabriek Buggenum bv 100 Clay brick manufacturer
Kleiwarenfabriek De Bylandt bv 100 Clay paver manufacturer
Kleiwarenfabriek De Waalwaard bv 100 Clay brick manufacturer
Kleiwarenfabriek Façade Beek bv 100 Clay brick manufacturer
Kleiwarenfabriek Joosten Kessel bv 100 Clay brick manufacturer
Kleiwarenfabriek Joosten Wessem bv 100 Clay brick manufacturer
Incorporated and operating in % held Products and services
Kooy Bilthoven bv 100 Clay brick factors
Leebo bv 100 Designer, manufacturer and installer of façade and roofing systems
Steenfabriek Nuth bv 100 Clay brick manufacturer
Building Products
Arfman Hekwerk bv 100 Producer and installer of fauna and railway fencing solutions
Aluminium Verkoop Zuid bv 100 Roller shutter and awning systems
BIK Bouwprodukten bv 100 Domelights and continuous rooflights
Brakel Atmos bv 100 Glass roof structures, continuous rooflights and ventilation systems
EcoTherm bv 100 PUR/PIR insulation
Heras Nederland bv 100 Security fencing and perimeter protection
Mavotrans bv 100 Construction accessories
Unidek Group bv 100 EPS insulation
Unipol bv 100 EPS granulates
Vaculux bv 100 Domelights
Distribution
CRH Bouwmaterialenhandel bv 100 Builders merchants
CRH Roofing Materials bv 100 Roofing materials merchant
Garfield Aluminium bv 100 Aluminium stockholding
NVB Vermeulen Bouwstoffen bv 100 Builders merchants
Stoel van Klaveren Bouwstoffen bv 100 Builders merchants
Syntec bv 100 Ironmongery merchants
Ubbens Bouwmaterialen bv 100 Builders merchants
Van Neerbos Bouwmarkten bv 100 DIY stores
Van Neerbos Bouwmarkten
Exploitatie bv 100 DIY stores
Van Neerbos Bouwmaten bv 100 Cash & Carry building materials
Van Neerbos Bouwmaterialen bv 100 Builders merchants
Poland
Clay Products
CERG Sp. z o.o. 67.55 Clay brick manufacturer
Cerpol Kozlowice Sp. z o.o. 99.60 Clay brick manufacturer
CRH Klinkier Sp. z o.o. 100 Clay brick manufacturer
Gozdnickie Zaklady Ceramiki 100 Clay brick manufacturer Budowlanej Sp. z o.o.*
Patoka Industries Limited Sp. z o.o.* 99.19 Clay brick manufacturer
Termo Organika Sp. z o.o. 100 EPS insulation
Slovakia
Premac Spol. s r.o. 100 Concrete paving and floor elements
Spain
Plakabeton sa 100 Accessories for construction and precast concrete
Sweden
ThermiSol AB 100 EPS insulation
Switzerland
Aschwanden AG 100 Construction accessories
Baubedarf 100 Builders merchants
Element AG 100 Prefabricated structural concrete elements
Richner 100 Sanitary ware and ceramic tiles

130 CRH
Principal Subsidiary Undertakings continued
Incorporated and operating in % held Products and services
Americas Materials
United States
APAC, Inc. 100 Aggregates, asphalt, readymixed concrete and related construction activities
Callanan Industries, Inc. 100 Aggregates, asphalt, readymixed concrete and related construction activities
CPM Development Corporation 100 Aggregates, asphalt, readymixed concrete, prestressed concrete and related construction activities
Des Moines Asphalt & Paving, Co. 100 Asphalt and related construction activities
Dolomite Products Company, Inc. 100 Aggregates, asphalt and readymixed concrete
Evans Construction Company 100 Aggregates, asphalt, readymixed concrete and related construction activities
Hallett Construction Company 100 Aggregates
Hills Materials Company 100 Aggregates, asphalt, readymixed concrete and related construction activities
Michigan Paving and Materials 100 Aggregates, asphalt and related Company construction activities
Mountain Enterprises, Inc. 100 Aggregates, asphalt and related construction activities
Nuckolls Concrete Services, Inc. 100 Readymixed concrete and related construction activities
Oldcastle Industrial Minerals, Inc. 100 Mining and crushing of high calcium limestone
Oldcastle Materials, Inc. 100 Holding company
Oldcastle Materials Southeast, Inc. 100 Aggregates
Oldcastle SW Group, Inc. 100 Aggregates, asphalt, readymixed concrete and related construction activities
Pennsy Supply, Inc. 100 Aggregates, asphalt, readymixed concrete and related construction activities
Pike Industries, Inc. 100 Aggregates, asphalt and related construction activities
P.J. Keating Company 100 Aggregates, asphalt and related construction activities
Staker & Parson Companies 100 Aggregates, asphalt, readymixed concrete and related construction activities
Stoneco, Inc. 100 Aggregates
Texas Asphalt Refining Company, LLC 60 Refining and sale of liquid asphalt
The Shelly Company 100 Aggregates, asphalt and related construction activities
Tilcon Connecticut, Inc. 100 Aggregates, asphalt, readymixed concrete and related construction activities
Tilcon New York, Inc. 100 Aggregates, asphalt, and related construction activities
Incorporated and operating in % held Products and services
Americas Products & Distribution
Argentina
Canteras Cerro Negro S.A. 99.98 Clay rooftiles, wall tiles and floor tiles
CRH Sudamericana S.A. 100 Holding company
Superglass S.A. 100 Fabricated and tempered glass products
Canada
Antamex International, Inc. 100 Curtain wall manufacturer
Fulton Industries, Inc. 100 Architectural-rated operable window and curtain wall manufacturer
Oldcastle Building Products 100 Masonry, paving and retaining Canada, Inc. walls, utility boxes and trenches (trading as April Industries, and custom-fabricated and Décor Precast, Groupe Permacon, tempered glass products Oldcastle Glass and Synertech Moulded Products)
Chile
Vidrios Dell Orto, S.A. 99.9 Fabricated and tempered glass products
United States
CRH America, Inc. 100 Holding company
Oldcastle, Inc. 100 Holding company
Oldcastle Building Products, Inc. 100 Holding company
Architectural Products Group
Akron Brick and Block, Inc. 100 Specialty masonry, hardscape and patio products
Anchor Concrete Products, Inc. 100 Specialty masonry and hardscape products
Bend Industries, Inc. 100 Concrete, brick and stone products
Big River Industries, Inc. 100 Lightweight aggregate and fly-ash
Bonsal American, Inc. 100 Pre-mixed products and specialty stone products
Custom Surfaces, Inc. 80 Custom fabrication and installation of countertops
Dixie Cut Stone & Marble, Inc. 100 Distributor and fabricator of specialty stone products
Glen-Gery Corporation 100 Clay brick
Northfield Block Company 100 Specialty masonry, hardscape and patio products
Oldcastle Architectural, Inc. 100 Holding company
Oldcastle APG Midwest, Inc. 100 Specialty masonry, hardscape and (trading as 4D, Miller Material Co., patio products Oldcastle Sheffield, Schuster’s Building Products)
Oldcastle APG Northeast, Inc. 100 Specialty masonry, hardscape and (trading as Arthur Whitcomb, Balcon, patio products Betco Block, Betco Supreme, Domine Builders Supply, Foster-Southeastern, Oldcastle Easton, Trenwyth Industries)
Oldcastle APG South, Inc. 100 Specialty masonry, hardscape and (trading as Adams Products, Big Rock patio products Building Products, Bosse Concrete Products, Georgia Masonry, Goria Enterprises, The Keystone Group)

131CRH
Incorporated and operating in % held Products and services
Oldcastle APG Texas, Inc. 100 Specialty masonry and stone (trading as Custom-Crete, products, hardscape and patio
Custom Stone Supply, products Eagle-Cordell Concrete Products, Jewell Concrete Products)
Oldcastle APG West, Inc. 100 Specialty masonry, hardscape and (trading as Amcor Masonry Products, patio products Central Pre-Mix Concrete Products, Oldcastle Stockton, Sierra Building Products, Superlite Block, Young Block)
Oldcastle Concrete Designs, Inc. 100 Specialty concrete products
Oldcastle Lawn & Garden, Inc. 100 Patio products, bagged stone, mulch and stone
Oldcastle Coastal, Inc. 100 Patio products
Oldcastle Retail, Inc. 100 Sales and marketing of lawn and garden products
Oldcastle Westile, Inc. 100 Concrete rooftile and pavers
Paver Systems, LLC 50 Hardscape products
Sakrete of North America, LLC 80 Holding company
Distribution Group
Allied Building Products Corp. 100 Distribution of roofing, siding and related products, wallboard, metal studs, acoustical tile and grid
A.L.L. Roofing & Building 100 Distribution of roofing and related Materials Corp. products
Arzee Supply Corp. of New Jersey 100 Distribution of siding, roofing and related products
Mahalo Acquisition Corp (trading as G. W. Killebrew) 100 Holding company
Oldcastle Distribution, Inc. 100 Holding company
Glass Group
Oldcastle Glass, Inc. 100 Custom fabricated and tempered glass products
Southwest Aluminum Systems, Inc. 100 Architectural aluminium store fronts and doors
Texas Wall Systems, Inc. 100 Curtain wall manufacturer
Construction Accessories and Fencing
Merchants Metals Holding Company 100 Holding company
MMI Products, Inc. 100 Fabrication and distribution of metal products including fencing, welded wire reinforcement and concrete accessories; distribution of plastic, lumber and other metal products
Ivy Steel & Wire, Inc. 100 Welded wire reinforcement manufacturer
MMI StrandCo LP, LLC 100 PC strand
Precast Group
Oldcastle Precast, Inc. 100 Precast concrete products, concrete (trading as AFCO Precast, Amcor pipe, prestressed plank and structural Precast, BES Concrete Products, elements Brooks Products, Cayuga & Kerr Concrete Pipe, Chase Precast, Christy Concrete Products, Cloud Concrete, Contractors Engineers Supply, McArthur Concrete, Mega Cast, NC Products, Packaged Systems, Rotondo Precast, Superior Concrete, Utility Vault, Vanguard Precast, White Supply)
Hartford Concrete Products, Inc. 100 Precast concrete products and concrete pipe
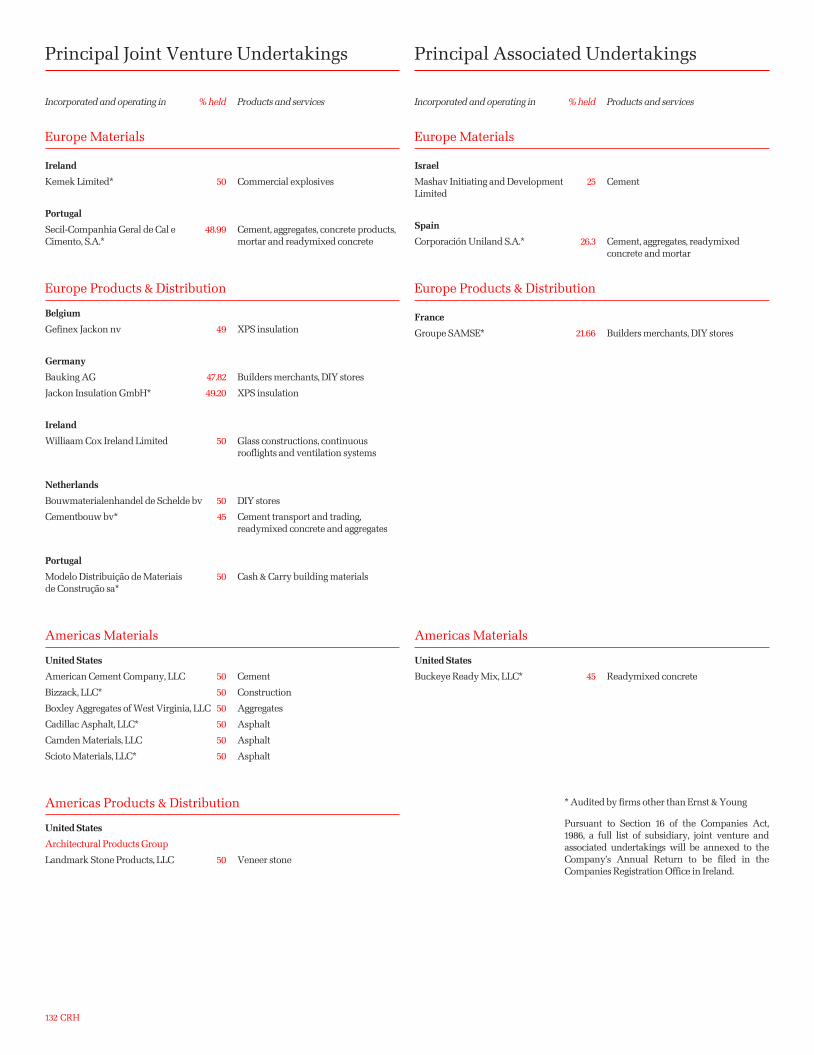
132 CRH
Incorporated and operating in % held Products and services
Europe Materials
Ireland
Kemek Limited* 50 Commercial explosives
Portugal
Secil-Companhia Geral de Cal e 48.99 Cement, aggregates, concrete products, Cimento, S.A.* mortar and readymixed concrete
Europe Products & Distribution
Belgium
Gefinex Jackon nv 49 XPS insulation
Germany
Bauking AG 47.82 Builders merchants, DIY stores
Jackon Insulation GmbH* 49.20 XPS insulation
Ireland
Williaam Cox Ireland Limited 50 Glass constructions, continuous rooflights and ventilation systems
Netherlands
Bouwmaterialenhandel de Schelde bv 50 DIY stores
Cementbouw bv* 45 Cement transport and trading, readymixed concrete and aggregates
Portugal
Modelo Distribuição de Materiais 50 Cash & Carry building materials de Construção sa*
Americas Materials
United States
American Cement Company, LLC 50 Cement
Bizzack, LLC* 50 Construction
Boxley Aggregates of West Virginia, LLC 50 Aggregates
Cadillac Asphalt, LLC* 50 Asphalt
Camden Materials, LLC 50 Asphalt
Scioto Materials, LLC* 50 Asphalt
Americas Products & Distribution
United States
Architectural Products Group
Landmark Stone Products, LLC 50 Veneer stone
Principal Joint Venture Undertakings
Incorporated and operating in % held Products and services
Europe Materials
Israel
Mashav Initiating and Development 25 Cement Limited
Spain
Corporación Uniland S.A.* 26.3 Cement, aggregates, readymixed concrete and mortar
Europe Products & Distribution
France
Groupe SAMSE* 21.66 Builders merchants, DIY stores
Americas Materials
United States
Buckeye Ready Mix, LLC* 45 Readymixed concrete
Principal Associated Undertakings
* Audited by firms other than Ernst & Young
Pursuant to Section 16 of the Companies Act, 1986, a full list of subsidiary, joint venture and associated undertakings will be annexed to the Company’s Annual Return to be filed in the Companies Registration Office in Ireland.

133CRH
Index
A
Accounting policies 63
Acquisition of subsidiaries and joint ventures (note 33) 108
Acquisitions Committee 43, 45
American Depositary Receipts 125
Americas - 2006 Results 22
Americas Materials - Operations Review 23
Americas Products & Distribution - Operations Review 27
Amortisation of intangible assets - Geographical analysis (note 1) 73 - Operating costs (note 3) 75 - Segmental analysis (note 1) 71
Annual General Meeting 49
Associated undertakings, principal 132
Associates’ profit after tax, Group share of (note 9) 82
Audit Committee 43, 45
Auditors, Report of Independent 59
Auditors’ remuneration 75
B
Balance sheet - Company 113 - Group 61
Balance: regional, product, sectoral 2
Board approval of financial statements (note 35) 112
Board Committees 43, 45
Board of Directors 42
C
Capital grants (note 28) 104
Cash and cash equivalents (note 21) 92
Cash flow statement, Group 62
Cash flow - summary 35
Chairman’s Statement 6
Chief Executive’s Review 9
Climate change 38
Code of business conduct 46
Compound average growth rates 34
Corporate culture and identity 3
Corporate governance 44
Corporate social responsibility 37
CREST 125
D
Debt, analysis of net (note 24) 96
Deferred acquisition consideration payable (note 19) 91
Deferred income tax - Expense (note 10) 83 - Assets and liabilities (note 26) 99
Depreciation, Group operating profit (note 4) 75
Derivative financial instruments (note 23) 94
Development activity 5, 6, 10
Directors’ emoluments and interests (note 5) 76
Directors’ interests in share capital 51
Directors’ interests - share options 55
Directors’ remuneration, Report on 50
Directors’ Report 48
Directors’ responsibilities, Statement of 58
Disposal of fixed assets (note 16) 90
Dividend payments (shareholder information) 124
Dividends (note 11) 84
Dow Jones Sustainability Index 41
E
Earnings per Ordinary Share (note 12) 85
Employees, average numbers (note 6) 76
Employment costs (note 6) 76
End-use - Americas Materials 24 - Americas Products & Distribution 28 - Europe Materials 14 - Europe Products & Distribution 18 - Group 3
Environment 38
Europe - 2006 Results 12
Europe Materials - Operations Review 13
Europe Products & Distribution - Operations review 17
Exchange rates 65
F
Finance Committee 43, 46
Finance costs and revenue (note 8) 82
Finance leases (note 32) 107
Finance Review 32
Financial assets (note 15) 89
Financial calendar 125
Financial summary, Group (1995-2006) 122
Financial trends 2002-2006 1
FTSE4Good 41
G
Geographic and product spread inside cover
Group profile inside cover
Growth 5
Guarantees (note 25) 98
H
Health & safety 39
Highlights (financial) 1
Page Page

134 CRH
Index continued
I
Income Statement, Group 60
Income tax expenses (note 10) 83
Innovest 41
Intangible assets (note 14) 87
Internal control 47
Inventories (note 17) 90
J
Joint venture undertakings, principal 132
Joint venture, proportionate
consolidation (note 2) 74
K
Key components of 2006 performance 32
Key financial performance indicators 34
L
Leases, commitments under operating and finance (note 32) 107
Liquid investments (note 21) 92
Loans and borrowing, interest-bearing (note 22) 92
M
Management 126
Minority interest (note 31) 107
N
Nomination Committee 43, 46
Notes on financial statements 71
Notice of Meeting 135
O
Operating costs (note 3) 75
Operating leases (note 32) 107
Operating profit, Group (note 4) 75
Operations reviews - Americas Materials 23 - Americas Products & Distribution 27 - Europe Materials 13 - Europe Products & Distribution 17
P
Payments, share - based (note 7) 76
Pensions, retirement benefit obligations (note 27) 99
Performance 4
Property, plant and equipment (note 13) 86
Provisions for liabilities (note 25) 98
Proxy voting, electronic 125
R
Reconciliation to United States GAAP 121
Registrars 125
Related party transactions (note 34) 112
Remuneration Committee 46
Reserves, share premium account, other, foreign currency translation and retained income (note 30) 106
Retirement benefit obligations (note 27) 99
S
Segmental information (note 1) 71
Senior Independent Director 43, 44
Share - based Payments (note 7) 76
Share capital, equity and preference (note 29) 105
Share options - Directors 55 - Employees 77
Share premium (note 30) 106
Share price data 125
Shareholder information 124
Shareholder value 4
Shareholdings as at 31st December 2006 125
Social & community 40
Statement of Directors’ responsibilities 58
Statement of recognised income and expense, Group 60
Stock Exchange listings 125
Stakeholder communication 41
Strategic vision inside cover Strategy inside cover - Development 16, 20, 26, 30 - Group 2
Subsidiary undertakings, principal 128
T
Total Shareholder Return 4
Trade and other payables (note 19) 91
Trade and other receivables (note 18) 90
Treasury information (note 24) 96
U
United States investors, additional information 116
US GAAP, reconciliation to 121
V
Volumes, annualised production - Americas Materials 24 - Americas Products & Distribution 28 - Europe Materials 14 - Europe Products & Distribution 18 - Group inside cover
W
Website 125
Working capital, movement during year (note 20) 91
Page Page

135CRH
The Annual General Meeting of CRH plc will be held at the Jurys Hotel, Ballsbridge, Dublin at 3 p.m. on Wednesday, 9th May 2007 for the following purposes:
1. To consider the Company’s financial statements and the Reports of the Directors and Auditors for the year ended 31st December 2006.
2. To declare a dividend on the Ordinary Shares.
3. To re-elect the following Directors:
Mr. D.M. Kennedy
Mr. T.V. Neill
Mr. W.I. O’Mahony in accordance with Article 103
Mr. W.P. Egan
Mr. D.N. O’Connor in accordance with Article 109.
4. To authorise the Directors to fix the remuneration of the Auditors.
5. To consider and, if thought fit, to pass as a Special Resolution:
That in accordance with the powers, provisions and limitations of Article 11(e) of the Articles of Association of the Company, the Directors be and they are hereby empowered to allot equity securities for cash and in respect of sub-paragraph (iii) thereof up to an aggregate nominal value of §9,228,000. This authority shall expire at the close of business on the earlier of the date of the Annual General Meeting in 2008 or 8th August 2008.
6. To consider and, if thought fit, to pass as a Special Resolution:
That the Company be and is hereby authorised to purchase Ordinary Shares on the market (as defined in Section 212 of the Companies Act, 1990), in the manner provided for in Article 8A of the Articles of Association of the Company, up to a maximum of 10% of the Ordinary Shares in issue at the date of the passing of this Resolution. This authority shall expire at the close of business on the earlier of the date of the Annual General Meeting in 2008 or 8th August 2008.
7. To consider and, if thought fit, to pass as a Special Resolution:
That, subject to the passing of Resolutions 5 and 9 at this meeting, for the purposes of Section 209 of the Companies Act, 1990, the price range within which any treasury share (as defined therein) for the time being held by the Company may be re-issued off-market shall be as follows:
(a) the maximum price shall be an amount equal to 120 per cent of the Appropriate Price (as defined in paragraph (c)); and
(b) the minimum price shall be:
(i) in the case of an Option Scheme (as defined in paragraph (d) below), an amount equal to the option price as provided for in such Option Scheme, or
(ii) in all other cases and circumstances where treasury shares are re-issued off-market, an amount equal to 95% of the Appropriate Price (as defined in paragraph (c)); and
(c) “Appropriate Price” means the average of the five amounts resulting from determining whichever of the following ((i), (ii) or (iii) specified below) in relation to shares of the class
of which such treasury share is to be re-issued shall be appropriate in respect of each of the five business days immediately preceding the day on which the treasury share is re-issued, as determined from information published by or under the authority of The Irish Stock Exchange Limited reporting the business done on each of those five business days:
(i) if there shall be more than one dealing reported for the day, the average of the prices at which such dealings took place; or
(ii) if there shall be only one dealing reported for the day, the price at which such dealing took place; or
(iii) if there shall not be any dealing reported for the day, the average of the closing bid and offer prices for the day;
and if there shall be only a bid (but not an offer) or an offer (but not a bid) price reported, or if there shall not be any bid or offer price reported for any particular day, then that day shall not count as one of the said five business days for the purposes of determining the Appropriate Price; if the means of providing the foregoing information as to dealings and prices by reference to which the Appropriate Price is to be determined is altered or is replaced by some other means, then the Appropriate Price shall be determined on the basis of the equivalent information published by the relevant authority in relation to dealings on The Irish Stock Exchange Limited or its equivalent; and
(d) “Option Scheme” means any scheme or plan which involves the issue of options to acquire Ordinary Shares in the Company and which has been approved by the Company’s shareholders in General Meeting.
8. To consider and, if thought fit, to pass as a Special Resolution:
That Article 8B of the Company’s Articles of Association be amended by the deletion of paragraphs (a) and (b) thereof and the substitution therefor of paragraphs (a), (b), (c) and (d) of Resolution 7.
9. To consider and, if thought fit, to pass as a Special Resolution:
That the Company be and is hereby authorised to re-issue treasury shares (as defined in Section 209 of the Companies Act, 1990), in the manner provided for in Article 8B of the Articles of Association of the Company. This authority shall expire at the close of business on the earlier of the date of the Annual General Meeting in 2008 or 8th August 2008.
Resolutions 1 to 6 and 9 are Ordinary Business of the meeting. Resolutions 7 and 8 are Special Business.
For the Board, A. Malone, Secretary,42 Fitzwilliam Square, Dublin 2.4th April 2007
See detailed notes overleaf
Notice of Meeting

136 CRH
Notes
(1) The final dividend, if approved, will be paid on the Ordinary Shares on 14th May 2007.
(2) Any member entitled to attend and vote at this Meeting may appoint a proxy who need not be a member of the Company.
(3) Shareholders who wish to submit proxies via the internet may do so by accessing either CRH’s website and selecting “Registrars” under “Shareholder Services” in the Investor Relations section or by accessing the Registrars’ website, www.capitaregistrars.ie and selecting “login to Shareholder Services” under “On-line Services”. To submit a proxy on-line shareholders are initially required to register for the service.
(4) CREST members who wish to appoint a proxy through the CREST electronic appointment service may do so for the Annual General Meeting and any adjournment(s) thereof by using the procedures described in the CREST Manual. CREST Personal Members or other CREST sponsored members, and those CREST members who have appointed a voting service provider(s), should refer to their CREST sponsor or voting service provider(s), who will be able to take the appropriate action on their behalf. In order for a proxy appointment or instruction given using the CREST service to be valid, the appropriate CREST message (a “CREST Proxy Instruction”) must be properly authenticated in accordance with CRESTCo’s specifications and must contain the information required for such instructions, as described in the CREST Manual. The message, regardless of whether it constitutes the appointment of a proxy or an amendment to the instruction given to a previously appointed proxy must, in order to be valid, be transmitted so as to be received by the Registrars (ID 7RA08) not later than 3 p.m. on 7th May 2007. For this purpose, the time of receipt will be taken to be the time (as determined by the timestamp applied to the message by the CREST Applications Host) from which the Registrars are able to retrieve the message by enquiry to CREST in the manner prescribed by CREST. After this time any change of instructions to proxies appointed through CREST should be communicated to the appointee through other means. CREST members and, where applicable, their CREST sponsors or voting service providers should note that CRESTCo does not make available special procedures in CREST for any particular messages. Normal system timings and limitations will therefore apply in relation to the input of CREST Proxy Instructions. It is the responsibility of the CREST member concerned to take (or, if the CREST member is a CREST Personal Member or sponsored member, or has appointed a voting service provider(s), to procure that his CREST sponsor or voting service provider(s) take(s)) such action as shall be necessary to ensure that a message is transmitted by means of the CREST system by any particular time. In this connection, CREST members and, where applicable, their CREST sponsors or voting service provider(s) are referred, in particular, to those sections of the CREST Manual concerning practical limitations of the CREST system and timings. The Company may treat as invalid a CREST Proxy Instruction in the circumstances set out in Regulation 35(5)(a) of the Companies Act, 1990 (Uncertificated Securities) Regulations, 1996.
(5) Pursuant to Regulation 14 of the Companies Act, 1990 (Uncertificated Securities) Regulations, 1996, the Company hereby specifies that only those shareholders registered in the Register of Members of the Company as at 6 p.m. on Monday, 7th May 2007 shall be entitled to attend or vote at the Annual General Meeting in respect of the number of shares registered in their name at that time.
(6) The holders of preference shares, although entitled to receive copies of the reports and financial statements, are not entitled to attend and vote at this Meeting in respect of their holdings of such shares.
Notice of Meeting continued

This report is printed on paper manufactured to the highest environmental
standards. The wood pulp comes from forests that are being continuously replanted.
Designed and produced by Lunt McIntyrePrinted by The Printed Image
CRH7 is a registered trade mark of CRH plc

The International Building Materials Group
CRH plc
Belgard Castle Clondalkin Dublin 22 Ireland
Telephone: +353.1.404 1000 Fax: +353.1.404 1007 E-mail: [email protected]
Website: www.crh.com
Registered Office 42 Fitzwilliam Square Dublin 2 Ireland
Telephone: +353.1.634 4340 Fax: +353.1.676 5013 E-mail: [email protected]