Embed Size (px)
Citation preview
Measure Your Plan's E�ectiveness.
Evaluate & Compare Plan Features, Utilization, Investments, & Fees.
Minimize Your Fiduciary Risk.
Annual Plan ReviewBenchmarking Report
ABC 401(k) PROFIT SHARING PLAN
Powered by:
For Period Ending June 30, 2013
SAMPLE
Copyright © 2013 The Advisor Lab, LLC | 1-877-5-THE LAB | www.theadvisorlab.com | For Advisor Use Only For Period Ending June 30, 2013 1
Table of Contents
Executive Summary 4
Benchmarking Your Plan 30
Fiduciary/Compliance Review 28
Service Metrics 26
Investments 10
Participation 24
SAMPLE
Copyright © 2013 The Advisor Lab, LLC | 1-877-5-THE LAB | www.theadvisorlab.com | For Advisor Use Only For Period Ending June 30, 2013 2
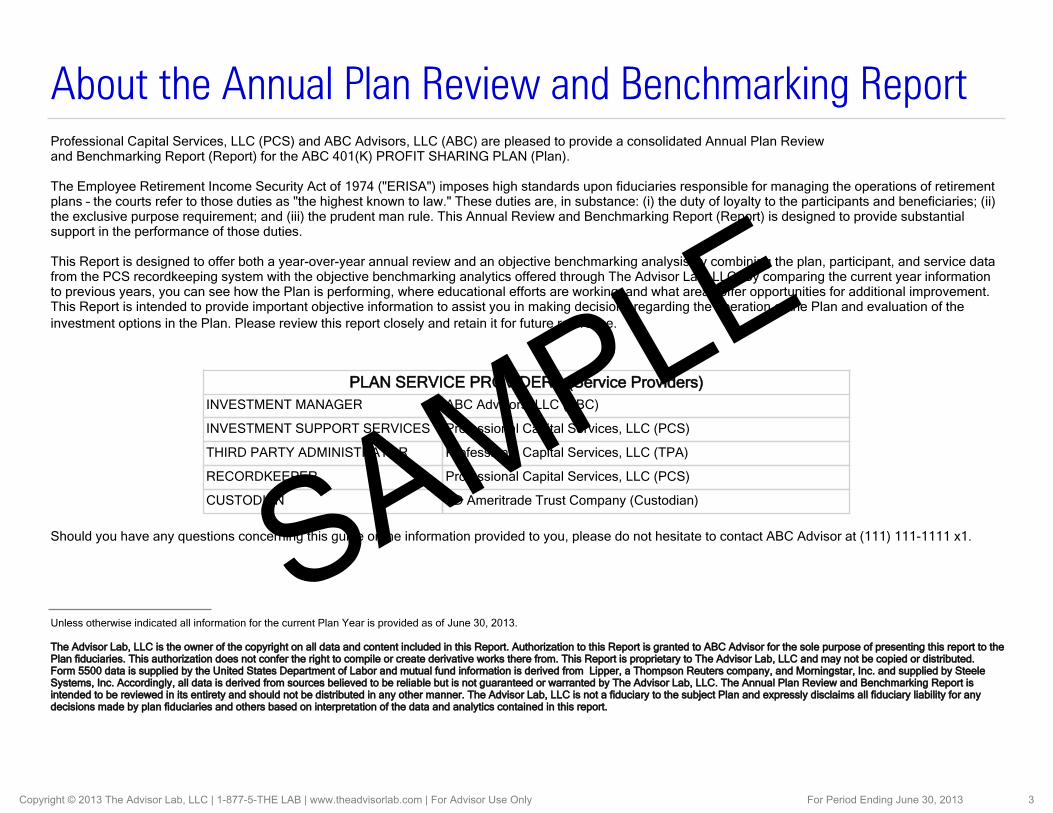
Should you have any questions concerning this guide or the information provided to you, please do not hesitate to contact ABC Advisor at (111) 111-1111 x1.
ABC Advisors, LLC (ABC) INVESTMENT MANAGER
TD Ameritrade Trust Company (Custodian)
Professional Capital Services, LLC (PCS)
Professional Capital Services, LLC (PCS)
Professional Capital Services, LLC (TPA)
CUSTODIAN
RECORDKEEPER
THIRD PARTY ADMINISTRATOR
INVESTMENT SUPPORT SERVICES
PLAN SERVICE PROVIDERS (Service Providers)
Unless otherwise indicated all information for the current Plan Year is provided as of June 30, 2013.
The Advisor Lab, LLC is the owner of the copyright on all data and content included in this Report. Authorization to this Report is granted to ABC Advisor for the sole purpose of presenting this report to the Plan fiduciaries. This authorization does not confer the right to compile or create derivative works there from. This Report is proprietary to The Advisor Lab, LLC and may not be copied or distributed. Form 5500 data is supplied by the United States Department of Labor and mutual fund information is derived from Lipper, a Thompson Reuters company, and Morningstar, Inc. and supplied by Steele Systems, Inc. Accordingly, all data is derived from sources believed to be reliable but is not guaranteed or warranted by The Advisor Lab, LLC. The Annual Plan Review and Benchmarking Report is intended to be reviewed in its entirety and should not be distributed in any other manner. The Advisor Lab, LLC is not a fiduciary to the subject Plan and expressly disclaims all fiduciary liability for any decisions made by plan fiduciaries and others based on interpretation of the data and analytics contained in this report.
About the Annual Plan Review and Benchmarking ReportProfessional Capital Services, LLC (PCS) and ABC Advisors, LLC (ABC) are pleased to provide a consolidated Annual Plan Review and Benchmarking Report (Report) for the ABC 401(K) PROFIT SHARING PLAN (Plan).
The Employee Retirement Income Security Act of 1974 ("ERISA") imposes high standards upon fiduciaries responsible for managing the operations of retirement plans – the courts refer to those duties as "the highest known to law." These duties are, in substance: (i) the duty of loyalty to the participants and beneficiaries; (ii) the exclusive purpose requirement; and (iii) the prudent man rule. This Annual Review and Benchmarking Report (Report) is designed to provide substantial support in the performance of those duties. This Report is designed to offer both a year-over-year annual review and an objective benchmarking analysis by combining the plan, participant, and service data from the PCS recordkeeping system with the objective benchmarking analytics offered through The Advisor Lab, LLC. By comparing the current year information to previous years, you can see how the Plan is performing, where educational efforts are working, and what areas offer opportunities for additional improvement. This Report is intended to provide important objective information to assist you in making decisions regarding the operation of the Plan and evaluation of the investment options in the Plan. Please review this report closely and retain it for future reference.
SAMPLE
Copyright © 2013 The Advisor Lab, LLC | 1-877-5-THE LAB | www.theadvisorlab.com | For Advisor Use Only For Period Ending June 30, 2013 3
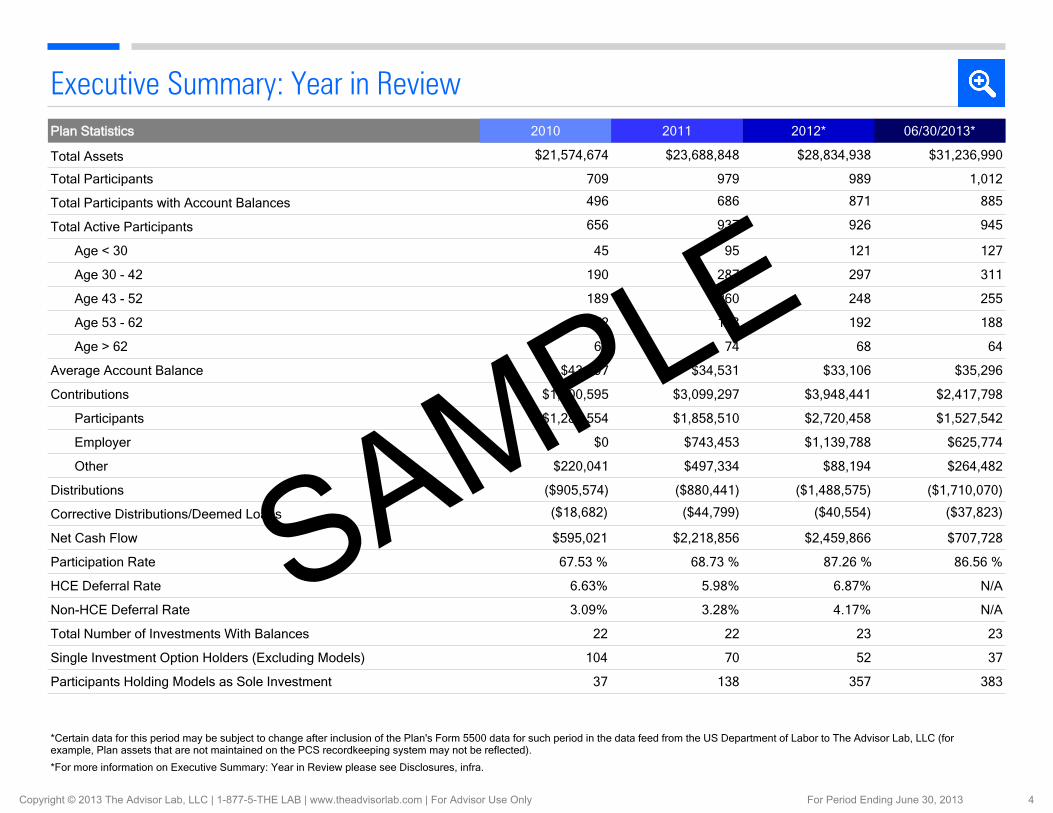
Executive Summary: Year in Review
Age > 62
Age 53 - 62
Age 43 - 52
Age 30 - 42
Age < 30
Total Active Participants
Non-HCE Deferral Rate
Net Cash Flow
Participation Rate
HCE Deferral Rate
Total Number of Investments With Balances
Single Investment Option Holders (Excluding Models)
Participants Holding Models as Sole Investment
Corrective Distributions/Deemed Loans
Plan Statistics
$31,236,990
1,012
$35,296
$2,417,798
$1,527,542
$625,774
($1,710,070)
$707,728
86.56 %
127
311
255
188
64
N/A
23
37
383
885
$264,482
N/A
945
06/30/2013*
($37,823)
$21,574,674
709
$43,497
$1,500,595
$1,280,554
$0
($905,574)
$595,021
67.53 %
45
190
189
172
62
6.63%
22
104
37
496
$220,041
3.09%
656
2010
($18,682)
$23,688,848
979
$34,531
$3,099,297
$1,858,510
$743,453
($880,441)
$2,218,856
68.73 %
95
287
260
198
74
5.98%
22
70
138
686
$497,334
3.28%
937
2011
($44,799)
$28,834,938
989
$33,106
$3,948,441
$2,720,458
$1,139,788
($1,488,575)
$2,459,866
87.26 %
121
297
248
192
68
6.87%
23
52
357
871
$88,194
4.17%
926
2012*
($40,554)
Total Assets
Total Participants
Total Participants with Account Balances
Average Account Balance
Contributions
Participants
Employer
Distributions
Other
*Certain data for this period may be subject to change after inclusion of the Plan's Form 5500 data for such period in the data feed from the US Department of Labor to The Advisor Lab, LLC (for example, Plan assets that are not maintained on the PCS recordkeeping system may not be reflected).
*For more information on Executive Summary: Year in Review please see Disclosures, infra.
SAMPLE
Copyright © 2013 The Advisor Lab, LLC | 1-877-5-THE LAB | www.theadvisorlab.com | For Advisor Use Only For Period Ending June 30, 2013 4
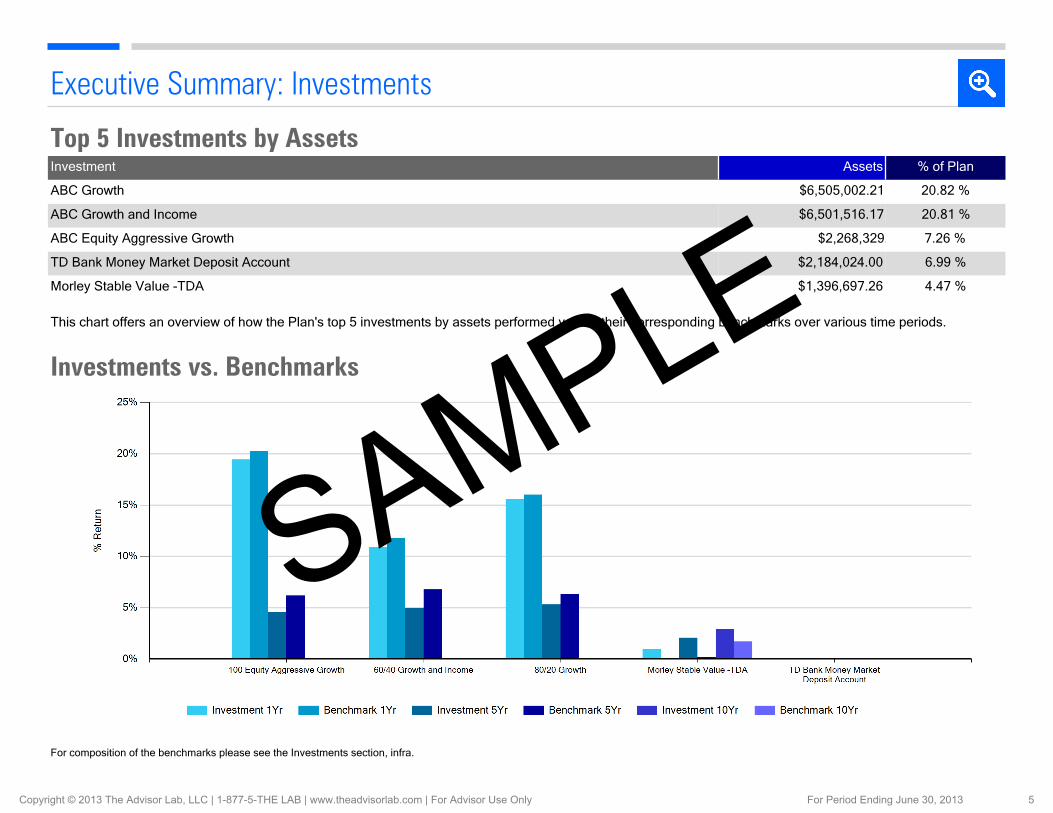
Top 5 Investments by Assets
This chart offers an overview of how the Plan's top 5 investments by assets performed versus their corresponding benchmarks over various time periods.
Investments vs. Benchmarks
Executive Summary: Investments
Investment Assets % of Plan
ABC Growth $6,505,002.21 20.82 %
ABC Growth and Income $6,501,516.17 20.81 %
ABC Equity Aggressive Growth $2,268,329.60 7.26 %
TD Bank Money Market Deposit Account $2,184,024.00 6.99 %
Morley Stable Value -TDA $1,396,697.26 4.47 %
For composition of the benchmarks please see the Investments section, infra.
SAMPLE
Copyright © 2013 The Advisor Lab, LLC | 1-877-5-THE LAB | www.theadvisorlab.com | For Advisor Use Only For Period Ending June 30, 2013 5
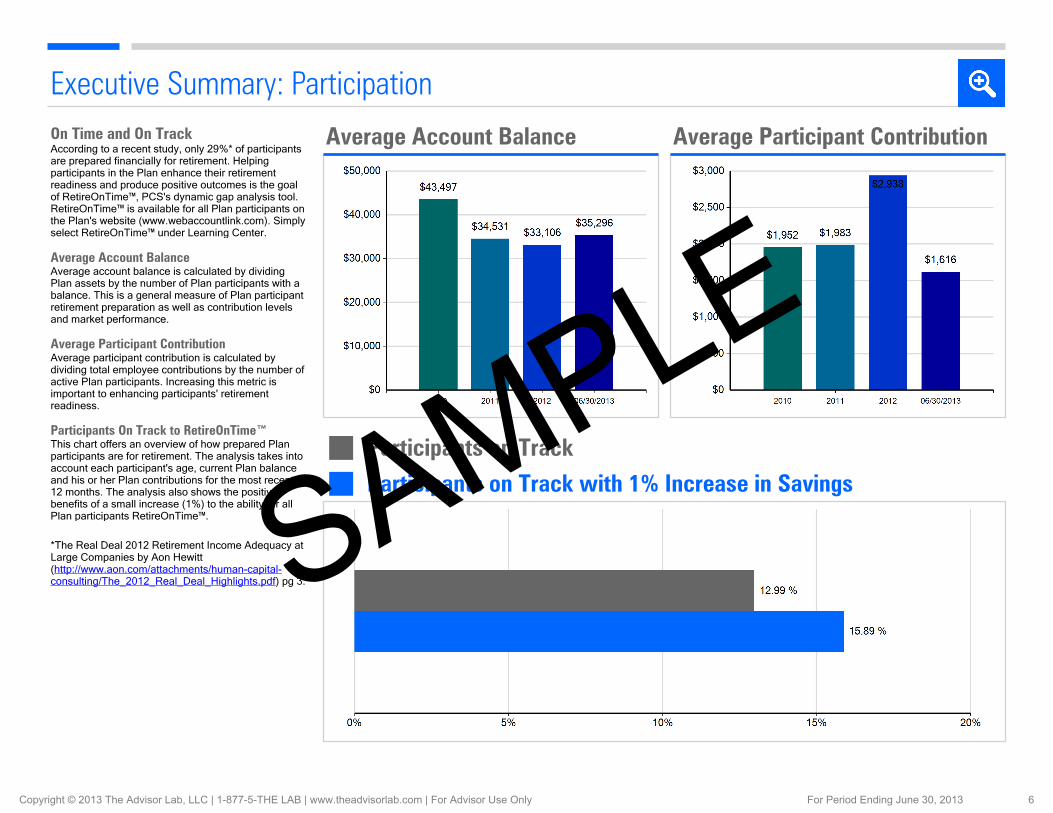
According to a recent study, only 29%* of participants are prepared financially for retirement. Helping participants in the Plan enhance their retirement readiness and produce positive outcomes is the goal of RetireOnTime™, PCS's dynamic gap analysis tool. RetireOnTime™ is available for all Plan participants on the Plan's website (www.webaccountlink.com). Simply select RetireOnTime™ under Learning Center.
On Time and On Track
Average Participant ContributionAverage participant contribution is calculated by dividing total employee contributions by the number of active Plan participants. Increasing this metric is important to enhancing participants' retirement readiness.
Average Account Balance
Participants On Track to RetireOnTime™
Average account balance is calculated by dividing Plan assets by the number of Plan participants with a balance. This is a general measure of Plan participant retirement preparation as well as contribution levels and market performance.
This chart offers an overview of how prepared Plan participants are for retirement. The analysis takes into account each participant's age, current Plan balance and his or her Plan contributions for the most recent 12 months. The analysis also shows the positive benefits of a small increase (1%) to the ability for all Plan participants RetireOnTime™.
*The Real Deal 2012 Retirement Income Adequacy at Large Companies by Aon Hewitt (http://www.aon.com/attachments/human-capital-consulting/The_2012_Real_Deal_Highlights.pdf) pg 3.
Executive Summary: Participation
Average Account Balance Average Participant Contribution
Participants on Track
Participants on Track with 1% Increase in Savings
SAMPLE
Copyright © 2013 The Advisor Lab, LLC | 1-877-5-THE LAB | www.theadvisorlab.com | For Advisor Use Only For Period Ending June 30, 2013 6
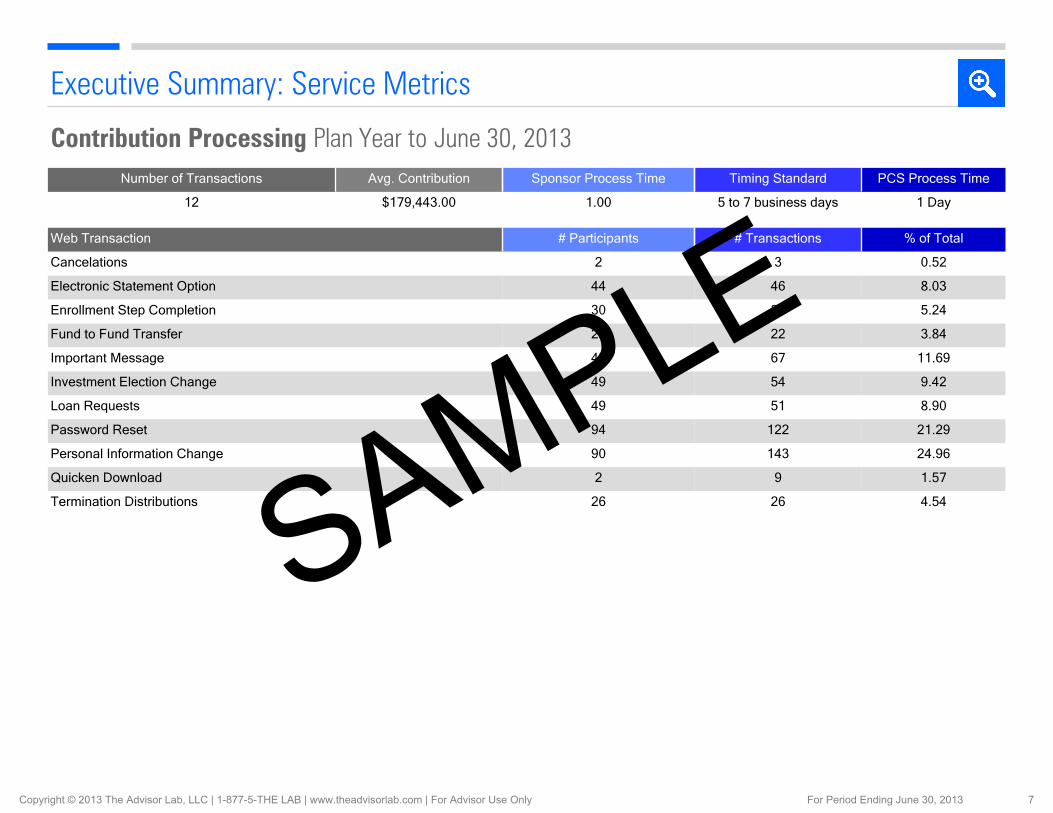
Contribution Processing Plan Year to June 30, 2013Number of Transactions Avg. Contribution Sponsor Process Time Timing Standard PCS Process Time
12 $179,443.00 1.00 5 to 7 business days 1 Day
Web Transaction # Participants # Transactions % of Total
Cancelations 2 3 0.52
Electronic Statement Option 44 46 8.03
Enrollment Step Completion 30 30 5.24
Fund to Fund Transfer 20 22 3.84
Important Message 45 67 11.69
Investment Election Change 49 54 9.42
Loan Requests 49 51 8.90
Password Reset 94 122 21.29
Personal Information Change 90 143 24.96
Quicken Download 2 9 1.57
Termination Distributions 26 26 4.54
Executive Summary: Service Metrics
SAMPLE
Copyright © 2013 The Advisor Lab, LLC | 1-877-5-THE LAB | www.theadvisorlab.com | For Advisor Use Only For Period Ending June 30, 2013 7
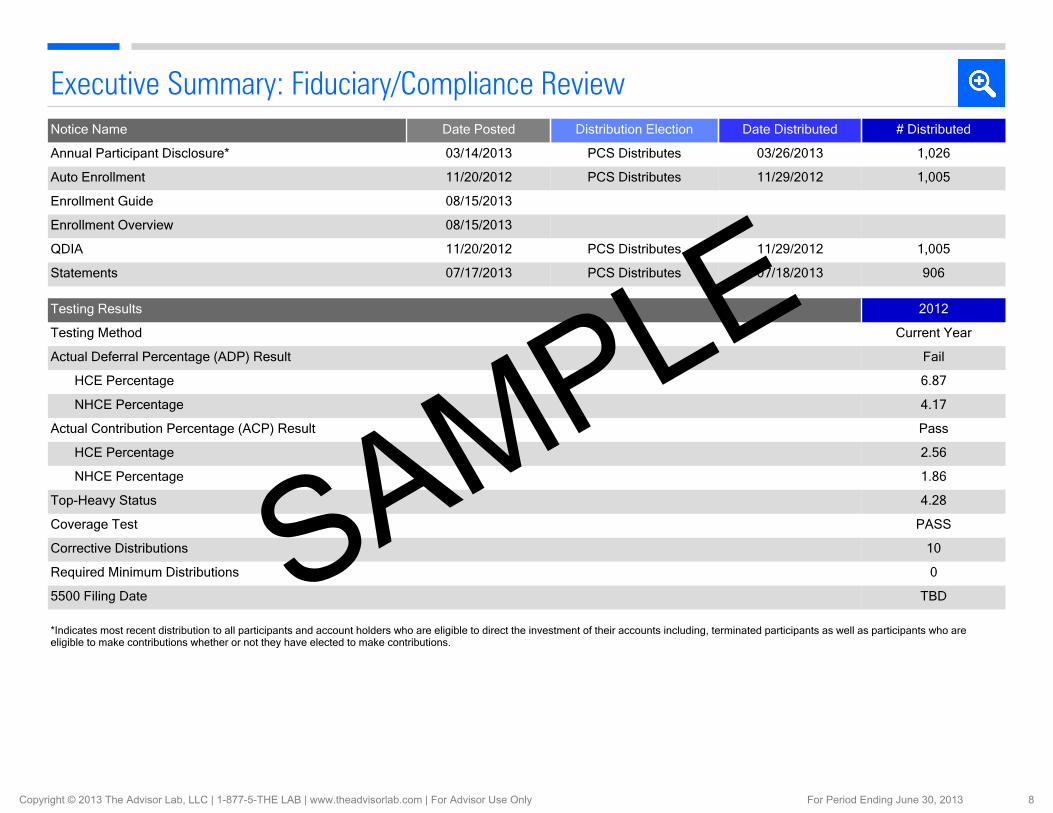
Notice Name Date Posted Distribution Election Date Distributed # Distributed
Annual Participant Disclosure* 03/14/2013 PCS Distributes 03/26/2013 1,026
Auto Enrollment 11/20/2012 PCS Distributes 11/29/2012 1,005
Enrollment Guide 08/15/2013
Enrollment Overview 08/15/2013
QDIA 11/20/2012 PCS Distributes 11/29/2012 1,005
Statements 07/17/2013 PCS Distributes 07/18/2013 906
Testing Results 2012
Testing Method Current Year
Actual Deferral Percentage (ADP) Result Fail
HCE Percentage 6.87
NHCE Percentage 4.17
Actual Contribution Percentage (ACP) Result Pass
HCE Percentage 2.56
NHCE Percentage 1.86
Top-Heavy Status 4.28
Coverage Test PASS
Corrective Distributions 10
Required Minimum Distributions 0
5500 Filing Date TBD
Executive Summary: Fiduciary/Compliance Review
*Indicates most recent distribution to all participants and account holders who are eligible to direct the investment of their accounts including, terminated participants as well as participants who are eligible to make contributions whether or not they have elected to make contributions.
SAMPLE
Copyright © 2013 The Advisor Lab, LLC | 1-877-5-THE LAB | www.theadvisorlab.com | For Advisor Use Only For Period Ending June 30, 2013 8
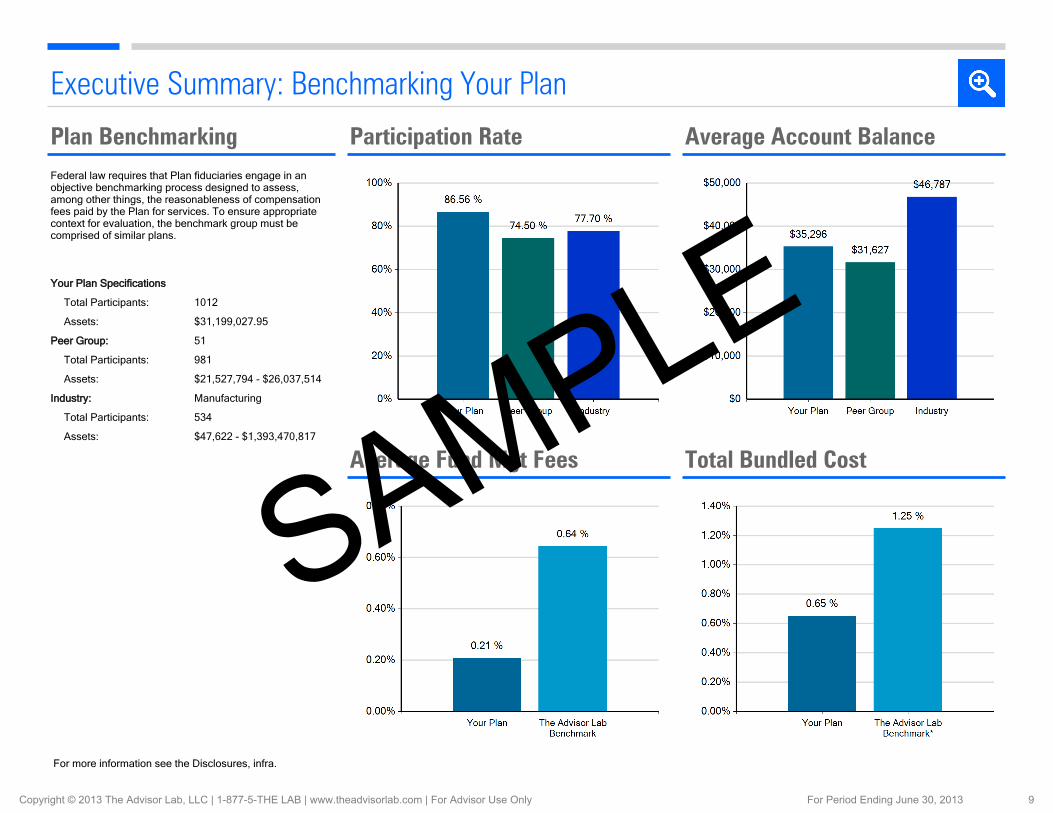
Your Plan Specifications
Total Participants: 1012
Assets: $31,199,027.95
Peer Group: 51
Total Participants: 981
Assets: $21,527,794 - $26,037,514
Industry: Manufacturing
Total Participants: 534
Assets: $47,622 - $1,393,470,817
Federal law requires that Plan fiduciaries engage in an objective benchmarking process designed to assess, among other things, the reasonableness of compensation fees paid by the Plan for services. To ensure appropriate context for evaluation, the benchmark group must be comprised of similar plans.
Plan Benchmarking
Executive Summary: Benchmarking Your Plan
Participation Rate Average Account Balance
Average Fund Mgt Fees Total Bundled Cost
For more information see the Disclosures, infra.
SAMPLE
Copyright © 2013 The Advisor Lab, LLC | 1-877-5-THE LAB | www.theadvisorlab.com | For Advisor Use Only For Period Ending June 30, 2013 9
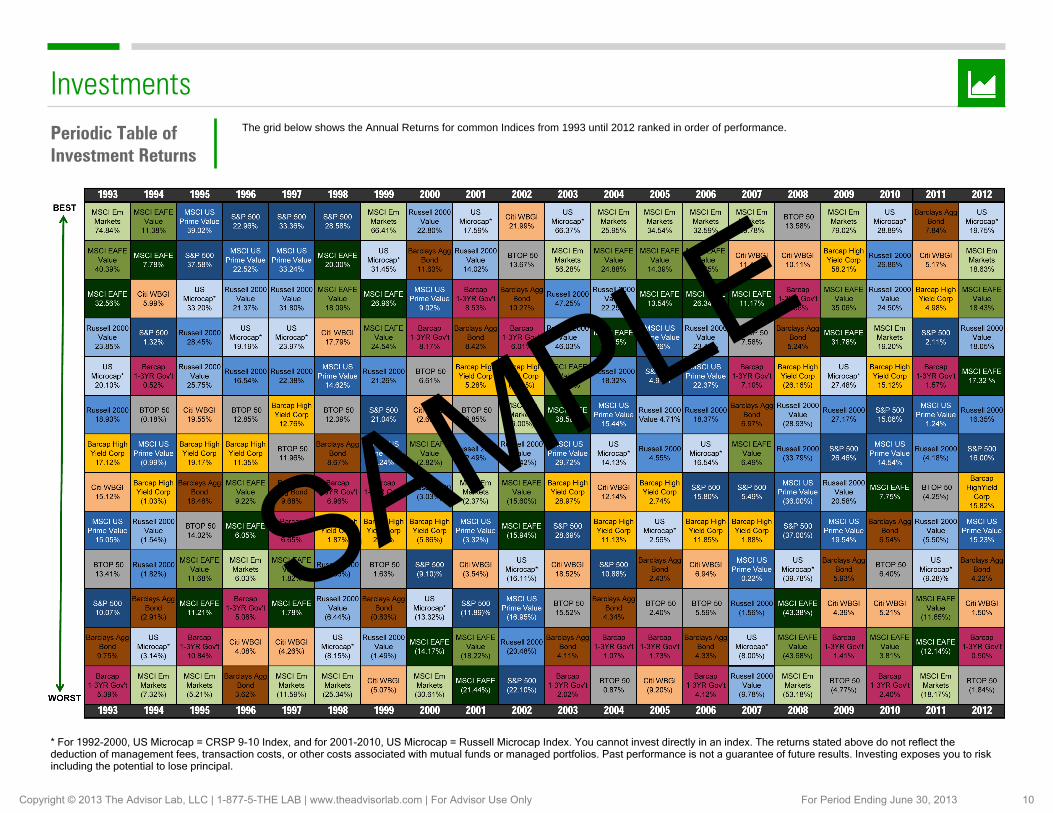
InvestmentsPeriodic Table of Investment Returns
The grid below shows the Annual Returns for common Indices from 1993 until 2012 ranked in order of performance.
* For 1992-2000, US Microcap = CRSP 9-10 Index, and for 2001-2010, US Microcap = Russell Microcap Index. You cannot invest directly in an index. The returns stated above do not reflect the deduction of management fees, transaction costs, or other costs associated with mutual funds or managed portfolios. Past performance is not a guarantee of future results. Investing exposes you to risk including the potential to lose principal.
SAMPLE
Copyright © 2013 The Advisor Lab, LLC | 1-877-5-THE LAB | www.theadvisorlab.com | For Advisor Use Only For Period Ending June 30, 2013 10
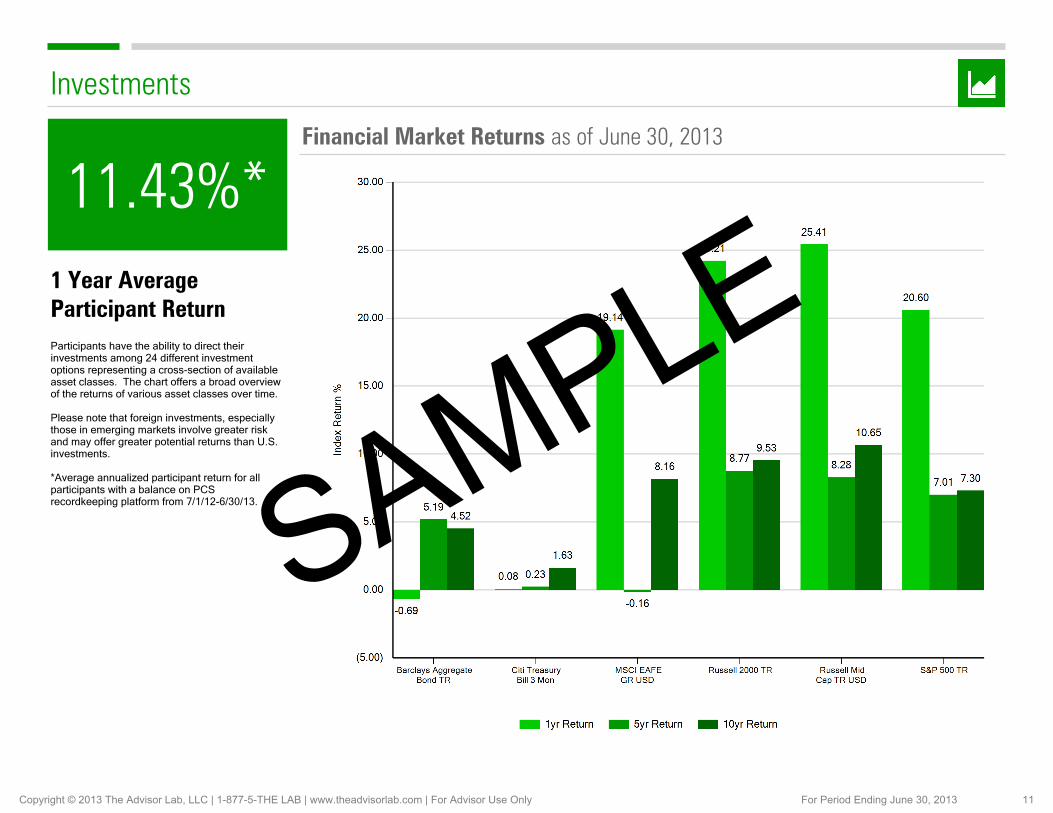
Financial Market Returns as of June 30, 2013
11.43%*1 Year Average Participant ReturnParticipants have the ability to direct their investments among 24 different investment options representing a cross-section of available asset classes. The chart offers a broad overview of the returns of various asset classes over time.
Please note that foreign investments, especially those in emerging markets involve greater risk and may offer greater potential returns than U.S. investments.
*Average annualized participant return for all participants with a balance on PCS recordkeeping platform from 7/1/12-6/30/13.
Investments
SAMPLE
Copyright © 2013 The Advisor Lab, LLC | 1-877-5-THE LAB | www.theadvisorlab.com | For Advisor Use Only For Period Ending June 30, 2013 11
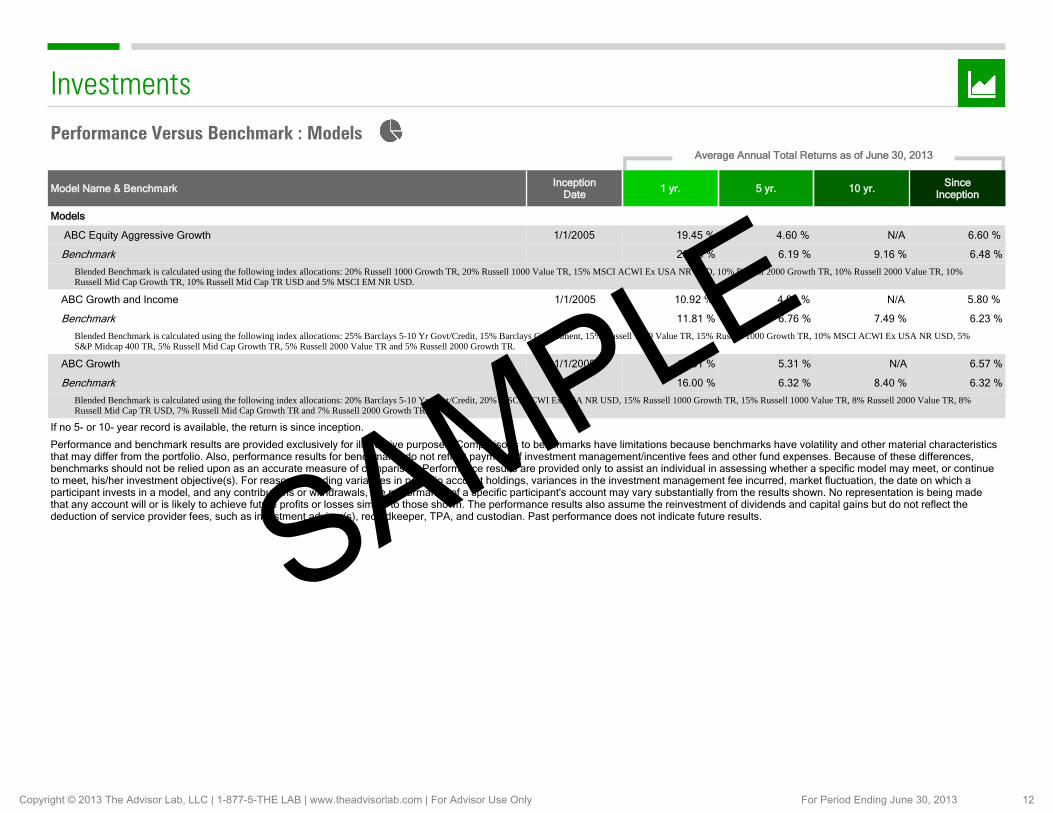
InvestmentsPerformance Versus Benchmark : Models
Average Annual Total Returns as of June 30, 2013
Model Name & Benchmark InceptionDate 1 yr. 5 yr. 10 yr. Since
Inception
Models
ABC Equity Aggressive Growth 1/1/2005 19.45 % 4.60 % N/A 6.60 %
Benchmark 20.28 % 6.19 % 9.16 % 6.48 %
Blended Benchmark is calculated using the following index allocations: 20% Russell 1000 Growth TR, 20% Russell 1000 Value TR, 15% MSCI ACWI Ex USA NR USD, 10% Russell 2000 Growth TR, 10% Russell 2000 Value TR, 10% Russell Mid Cap Growth TR, 10% Russell Mid Cap TR USD and 5% MSCI EM NR USD.
ABC Growth and Income 1/1/2005 10.92 % 4.92 % N/A 5.80 %
Benchmark 11.81 % 6.76 % 7.49 % 6.23 %
Blended Benchmark is calculated using the following index allocations: 25% Barclays 5-10 Yr Govt/Credit, 15% Barclays Government, 15% Russell 1000 Value TR, 15% Russell 1000 Growth TR, 10% MSCI ACWI Ex USA NR USD, 5% S&P Midcap 400 TR, 5% Russell Mid Cap Growth TR, 5% Russell 2000 Value TR and 5% Russell 2000 Growth TR.
ABC Growth 1/1/2005 15.61 % 5.31 % N/A 6.57 %
Benchmark 16.00 % 6.32 % 8.40 % 6.32 %
Blended Benchmark is calculated using the following index allocations: 20% Barclays 5-10 Yr Govt/Credit, 20% MSCI ACWI Ex USA NR USD, 15% Russell 1000 Growth TR, 15% Russell 1000 Value TR, 8% Russell 2000 Value TR, 8% Russell Mid Cap TR USD, 7% Russell Mid Cap Growth TR and 7% Russell 2000 Growth TR.
If no 5- or 10- year record is available, the return is since inception.
Performance and benchmark results are provided exclusively for illustrative purposes. Comparisons to benchmarks have limitations because benchmarks have volatility and other material characteristics that may differ from the portfolio. Also, performance results for benchmarks do not reflect payment of investment management/incentive fees and other fund expenses. Because of these differences, benchmarks should not be relied upon as an accurate measure of comparison. Performance results are provided only to assist an individual in assessing whether a specific model may meet, or continue to meet, his/her investment objective(s). For reasons including variances in portfolio account holdings, variances in the investment management fee incurred, market fluctuation, the date on which a participant invests in a model, and any contributions or withdrawals, the performance of a specific participant's account may vary substantially from the results shown. No representation is being made that any account will or is likely to achieve future profits or losses similar to those shown. The performance results also assume the reinvestment of dividends and capital gains but do not reflect the deduction of service provider fees, such as investment advisor(s), recordkeeper, TPA, and custodian. Past performance does not indicate future results.SAMPLE
Copyright © 2013 The Advisor Lab, LLC | 1-877-5-THE LAB | www.theadvisorlab.com | For Advisor Use Only For Period Ending June 30, 2013 12
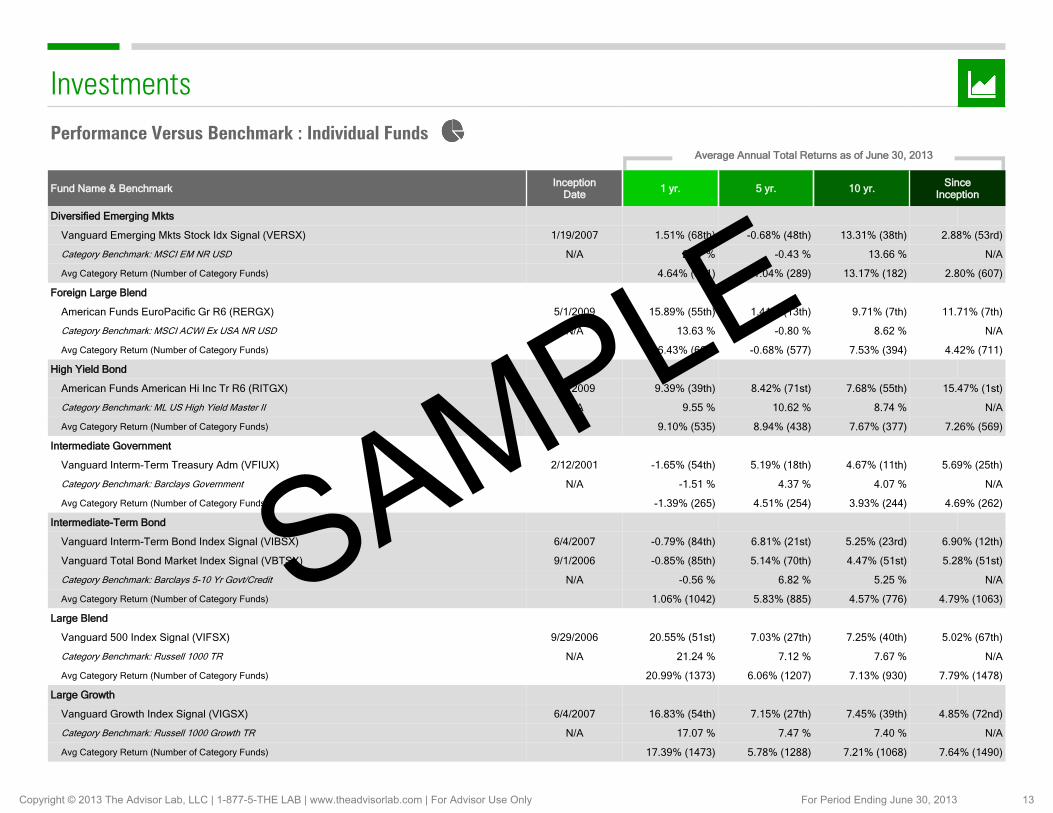
InvestmentsPerformance Versus Benchmark : Individual Funds
Average Annual Total Returns as of June 30, 2013
Fund Name & Benchmark InceptionDate 1 yr. 5 yr. 10 yr. Since
Inception
Diversified Emerging Mkts
Vanguard Emerging Mkts Stock Idx Signal (VERSX) 1/19/2007 1.51% (68th) -0.68% (48th) 13.31% (38th) 2.88% (53rd)
Category Benchmark: MSCI EM NR USD N/A 2.87 % -0.43 % 13.66 % N/A
Avg Category Return (Number of Category Funds) 4.64% (551) -1.04% (289) 13.17% (182) 2.80% (607)
Foreign Large Blend
American Funds EuroPacific Gr R6 (RERGX) 5/1/2009 15.89% (55th) 1.41% (13th) 9.71% (7th) 11.71% (7th)
Category Benchmark: MSCI ACWI Ex USA NR USD N/A 13.63 % -0.80 % 8.62 % N/A
Avg Category Return (Number of Category Funds) 16.43% (668) -0.68% (577) 7.53% (394) 4.42% (711)
High Yield Bond
American Funds American Hi Inc Tr R6 (RITGX) 5/1/2009 9.39% (39th) 8.42% (71st) 7.68% (55th) 15.47% (1st)
Category Benchmark: ML US High Yield Master II N/A 9.55 % 10.62 % 8.74 % N/A
Avg Category Return (Number of Category Funds) 9.10% (535) 8.94% (438) 7.67% (377) 7.26% (569)
Intermediate Government
Vanguard Interm-Term Treasury Adm (VFIUX) 2/12/2001 -1.65% (54th) 5.19% (18th) 4.67% (11th) 5.69% (25th)
Category Benchmark: Barclays Government N/A -1.51 % 4.37 % 4.07 % N/A
Avg Category Return (Number of Category Funds) -1.39% (265) 4.51% (254) 3.93% (244) 4.69% (262)
Intermediate-Term Bond
Vanguard Interm-Term Bond Index Signal (VIBSX) 6/4/2007 -0.79% (84th) 6.81% (21st) 5.25% (23rd) 6.90% (12th)
Vanguard Total Bond Market Index Signal (VBTSX) 9/1/2006 -0.85% (85th) 5.14% (70th) 4.47% (51st) 5.28% (51st)
Category Benchmark: Barclays 5-10 Yr Govt/Credit N/A -0.56 % 6.82 % 5.25 % N/A
Avg Category Return (Number of Category Funds) 1.06% (1042) 5.83% (885) 4.57% (776) 4.79% (1063)
Large Blend
Vanguard 500 Index Signal (VIFSX) 9/29/2006 20.55% (51st) 7.03% (27th) 7.25% (40th) 5.02% (67th)
Category Benchmark: Russell 1000 TR N/A 21.24 % 7.12 % 7.67 % N/A
Avg Category Return (Number of Category Funds) 20.99% (1373) 6.06% (1207) 7.13% (930) 7.79% (1478)
Large Growth
Vanguard Growth Index Signal (VIGSX) 6/4/2007 16.83% (54th) 7.15% (27th) 7.45% (39th) 4.85% (72nd)
Category Benchmark: Russell 1000 Growth TR N/A 17.07 % 7.47 % 7.40 % N/A
Avg Category Return (Number of Category Funds) 17.39% (1473) 5.78% (1288) 7.21% (1068) 7.64% (1490)
SAMPLE
Copyright © 2013 The Advisor Lab, LLC | 1-877-5-THE LAB | www.theadvisorlab.com | For Advisor Use Only For Period Ending June 30, 2013 13
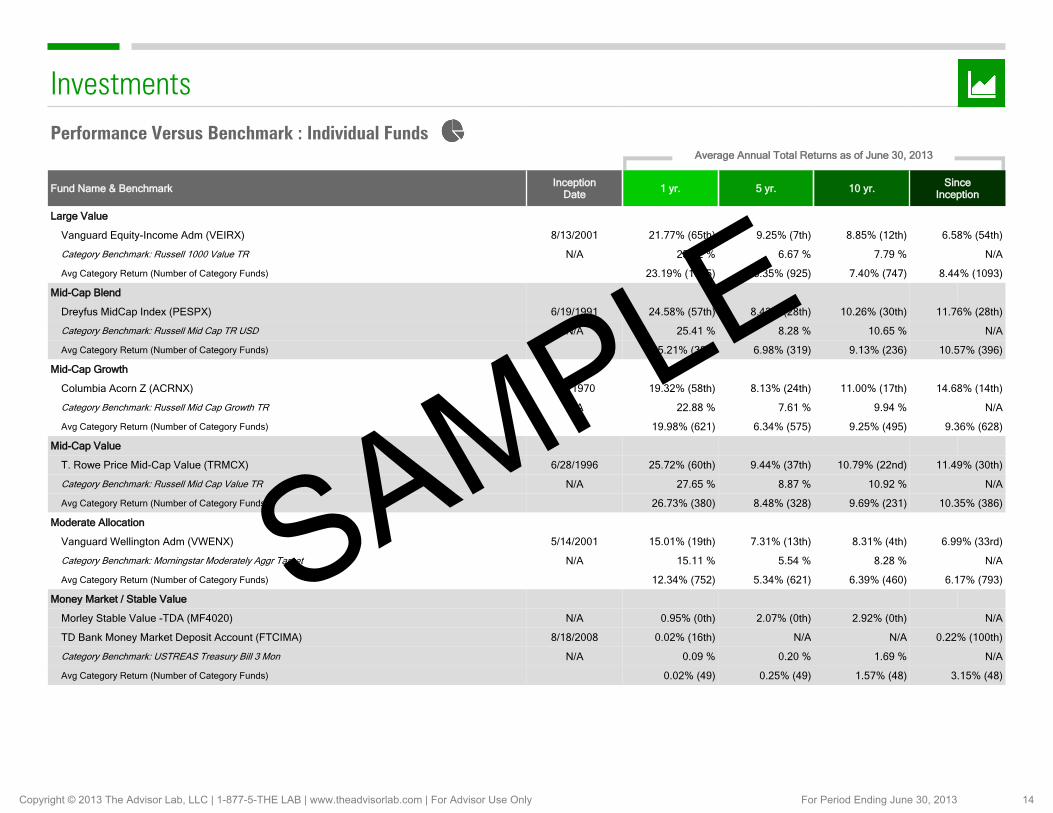
InvestmentsPerformance Versus Benchmark : Individual Funds
Average Annual Total Returns as of June 30, 2013
Fund Name & Benchmark InceptionDate 1 yr. 5 yr. 10 yr. Since
Inception
Large Value
Vanguard Equity-Income Adm (VEIRX) 8/13/2001 21.77% (65th) 9.25% (7th) 8.85% (12th) 6.58% (54th)
Category Benchmark: Russell 1000 Value TR N/A 25.32 % 6.67 % 7.79 % N/A
Avg Category Return (Number of Category Funds) 23.19% (1045) 6.35% (925) 7.40% (747) 8.44% (1093)
Mid-Cap Blend
Dreyfus MidCap Index (PESPX) 6/19/1991 24.58% (57th) 8.43% (28th) 10.26% (30th) 11.76% (28th)
Category Benchmark: Russell Mid Cap TR USD N/A 25.41 % 8.28 % 10.65 % N/A
Avg Category Return (Number of Category Funds) 25.21% (383) 6.98% (319) 9.13% (236) 10.57% (396)
Mid-Cap Growth
Columbia Acorn Z (ACRNX) 6/9/1970 19.32% (58th) 8.13% (24th) 11.00% (17th) 14.68% (14th)
Category Benchmark: Russell Mid Cap Growth TR N/A 22.88 % 7.61 % 9.94 % N/A
Avg Category Return (Number of Category Funds) 19.98% (621) 6.34% (575) 9.25% (495) 9.36% (628)
Mid-Cap Value
T. Rowe Price Mid-Cap Value (TRMCX) 6/28/1996 25.72% (60th) 9.44% (37th) 10.79% (22nd) 11.49% (30th)
Category Benchmark: Russell Mid Cap Value TR N/A 27.65 % 8.87 % 10.92 % N/A
Avg Category Return (Number of Category Funds) 26.73% (380) 8.48% (328) 9.69% (231) 10.35% (386)
Moderate Allocation
Vanguard Wellington Adm (VWENX) 5/14/2001 15.01% (19th) 7.31% (13th) 8.31% (4th) 6.99% (33rd)
Category Benchmark: Morningstar Moderately Aggr Target N/A 15.11 % 5.54 % 8.28 % N/A
Avg Category Return (Number of Category Funds) 12.34% (752) 5.34% (621) 6.39% (460) 6.17% (793)
Money Market / Stable Value
Morley Stable Value -TDA (MF4020) N/A 0.95% (0th) 2.07% (0th) 2.92% (0th) N/A
TD Bank Money Market Deposit Account (FTCIMA) 8/18/2008 0.02% (16th) N/A N/A 0.22% (100th)
Category Benchmark: USTREAS Treasury Bill 3 Mon N/A 0.09 % 0.20 % 1.69 % N/A
Avg Category Return (Number of Category Funds) 0.02% (49) 0.25% (49) 1.57% (48) 3.15% (48)
SAMPLE
Copyright © 2013 The Advisor Lab, LLC | 1-877-5-THE LAB | www.theadvisorlab.com | For Advisor Use Only For Period Ending June 30, 2013 14

InvestmentsPerformance Versus Benchmark : Individual Funds
Average Annual Total Returns as of June 30, 2013
Fund Name & Benchmark InceptionDate 1 yr. 5 yr. 10 yr. Since
Inception
Real Estate
Vanguard REIT Index Signal (VGRSX) 6/4/2007 8.95% (20th) 8.11% (23rd) 10.92% (39th) 2.34% (89th)
Category Benchmark: DJ US Select REIT TR USD N/A 7.69 % 6.97 % 10.68 % N/A
Avg Category Return (Number of Category Funds) 8.14% (237) 6.93% (209) 10.03% (179) 9.47% (252)
Short-Term Bond
Vanguard Short-Term Investment-Grade Adm (VFSUX) 2/12/2001 1.78% (36th) 3.80% (29th) 3.65% (17th) 4.18% (29th)
Category Benchmark: Barclays 1-5 Yr Govt/Credit N/A 0.60 % 3.37 % 3.37 % N/A
Avg Category Return (Number of Category Funds) 1.39% (371) 3.28% (339) 2.97% (285) 3.26% (380)
Small Blend
Vanguard Small Cap Index Signal (VSISX) 12/15/2006 25.74% (34th) 10.15% (21st) 10.85% (15th) 6.34% (77th)
Category Benchmark: Russell 2000 TR N/A 24.21 % 8.77 % 9.53 % N/A
Avg Category Return (Number of Category Funds) 24.78% (619) 8.25% (551) 9.44% (438) 10.06% (644)
Small Growth
Vanguard Small Cap Growth Index Admiral (VSGAX) 9/27/2011 24.36% (33rd) 9.77% (35th) 11.16% (10th) 24.52% (2nd)
Category Benchmark: Russell 2000 Growth TR N/A 23.67 % 8.89 % 9.62 % N/A
Avg Category Return (Number of Category Funds) 22.53% (623) 8.58% (562) 9.57% (459) 10.05% (635)
Small Value
Vanguard Small Cap Value Index Admiral (VSIAX) 9/27/2011 26.20% (43rd) 10.07% (38th) 10.18% (47th) 26.35% (1st)
Category Benchmark: Russell 2000 Value TR N/A 24.77 % 8.60 % 9.30 % N/A
Avg Category Return (Number of Category Funds) 25.87% (330) 9.56% (274) 10.13% (202) 10.93% (336)
Technology
Janus Global Technology T (JAGTX) 12/31/1998 15.87% (35th) 8.63% (25th) 9.33% (37th) 5.31% (55th)
Category Benchmark: Morningstar Technology Sector TR N/A 7.11 % 7.78 % 8.07 % N/A
Avg Category Return (Number of Category Funds) 14.13% (194) 7.29% (179) 8.25% (166) 5.59% (195)
The performance data shown represents past performance, which is not a guarantee of future results. Investment returns and principal value will fluctuate, investors’ shares, when sold may be worth more or less than their original cost. Current performance of individual Plan participants may be lower or higher than the performance data cited. The category benchmark is the benchmark listed by the majority of funds within each category. Performance reported prior to the funds inception date is extended performance and is an estimate based on fund performance of the funds oldest share class adjusted for fees. The parenthetical () indicates the fund's percentile ranking vs its peer group. The lower the number the better the fund performance relative to the peer group.
SAMPLE
Copyright © 2013 The Advisor Lab, LLC | 1-877-5-THE LAB | www.theadvisorlab.com | For Advisor Use Only For Period Ending June 30, 2013 15
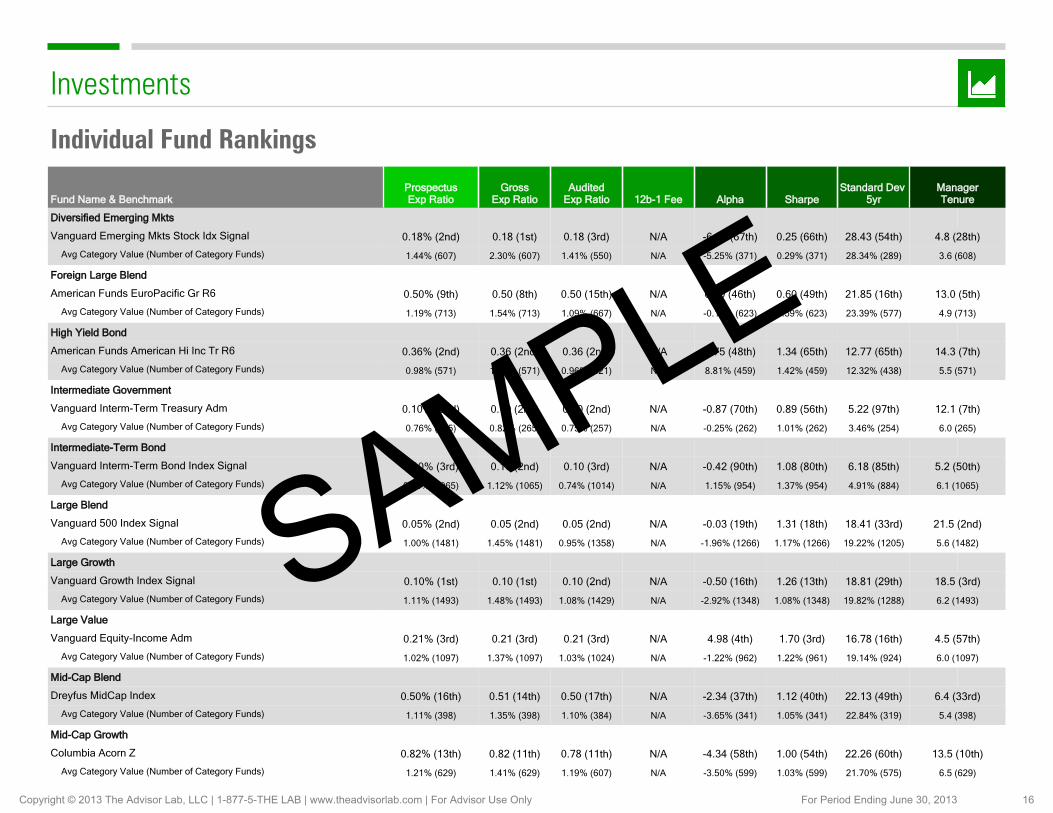
Investments
Individual Fund Rankings
Fund Name & BenchmarkProspectusExp Ratio
GrossExp Ratio
AuditedExp Ratio 12b-1 Fee Alpha Sharpe
Standard Dev 5yr
ManagerTenure
Diversified Emerging Mkts
Vanguard Emerging Mkts Stock Idx Signal 0.18% (2nd) 0.18 (1st) 0.18 (3rd) N/A -6.06 (67th) 0.25 (66th) 28.43 (54th) 4.8 (28th)
Avg Category Value (Number of Category Funds) 1.44% (607) 2.30% (607) 1.41% (550) N/A -5.25% (371) 0.29% (371) 28.34% (289) 3.6 (608)
Foreign Large Blend
American Funds EuroPacific Gr R6 0.50% (9th) 0.50 (8th) 0.50 (15th) N/A 0.10 (46th) 0.60 (49th) 21.85 (16th) 13.0 (5th)
Avg Category Value (Number of Category Funds) 1.19% (713) 1.54% (713) 1.09% (667) N/A -0.16% (623) 0.59% (623) 23.39% (577) 4.9 (713)
High Yield Bond
American Funds American Hi Inc Tr R6 0.36% (2nd) 0.36 (2nd) 0.36 (2nd) N/A 8.75 (48th) 1.34 (65th) 12.77 (65th) 14.3 (7th)
Avg Category Value (Number of Category Funds) 0.98% (571) 1.29% (571) 0.96% (521) N/A 8.81% (459) 1.42% (459) 12.32% (438) 5.5 (571)
Intermediate Government
Vanguard Interm-Term Treasury Adm 0.10% (2nd) 0.10 (2nd) 0.10 (2nd) N/A -0.87 (70th) 0.89 (56th) 5.22 (97th) 12.1 (7th)
Avg Category Value (Number of Category Funds) 0.76% (265) 0.82% (265) 0.75% (257) N/A -0.25% (262) 1.01% (262) 3.46% (254) 6.0 (265)
Intermediate-Term Bond
Vanguard Interm-Term Bond Index Signal 0.10% (3rd) 0.10 (2nd) 0.10 (3rd) N/A -0.42 (90th) 1.08 (80th) 6.18 (85th) 5.2 (50th)
Avg Category Value (Number of Category Funds) 0.76% (1065) 1.12% (1065) 0.74% (1014) N/A 1.15% (954) 1.37% (954) 4.91% (884) 6.1 (1065)
Large Blend
Vanguard 500 Index Signal 0.05% (2nd) 0.05 (2nd) 0.05 (2nd) N/A -0.03 (19th) 1.31 (18th) 18.41 (33rd) 21.5 (2nd)
Avg Category Value (Number of Category Funds) 1.00% (1481) 1.45% (1481) 0.95% (1358) N/A -1.96% (1266) 1.17% (1266) 19.22% (1205) 5.6 (1482)
Large Growth
Vanguard Growth Index Signal 0.10% (1st) 0.10 (1st) 0.10 (2nd) N/A -0.50 (16th) 1.26 (13th) 18.81 (29th) 18.5 (3rd)
Avg Category Value (Number of Category Funds) 1.11% (1493) 1.48% (1493) 1.08% (1429) N/A -2.92% (1348) 1.08% (1348) 19.82% (1288) 6.2 (1493)
Large Value
Vanguard Equity-Income Adm 0.21% (3rd) 0.21 (3rd) 0.21 (3rd) N/A 4.98 (4th) 1.70 (3rd) 16.78 (16th) 4.5 (57th)
Avg Category Value (Number of Category Funds) 1.02% (1097) 1.37% (1097) 1.03% (1024) N/A -1.22% (962) 1.22% (961) 19.14% (924) 6.0 (1097)
Mid-Cap Blend
Dreyfus MidCap Index 0.50% (16th) 0.51 (14th) 0.50 (17th) N/A -2.34 (37th) 1.12 (40th) 22.13 (49th) 6.4 (33rd)
Avg Category Value (Number of Category Funds) 1.11% (398) 1.35% (398) 1.10% (384) N/A -3.65% (341) 1.05% (341) 22.84% (319) 5.4 (398)
Mid-Cap Growth
Columbia Acorn Z 0.82% (13th) 0.82 (11th) 0.78 (11th) N/A -4.34 (58th) 1.00 (54th) 22.26 (60th) 13.5 (10th)
Avg Category Value (Number of Category Funds) 1.21% (629) 1.41% (629) 1.19% (607) N/A -3.50% (599) 1.03% (599) 21.70% (575) 6.5 (629)
SAMPLE
Copyright © 2013 The Advisor Lab, LLC | 1-877-5-THE LAB | www.theadvisorlab.com | For Advisor Use Only For Period Ending June 30, 2013 16
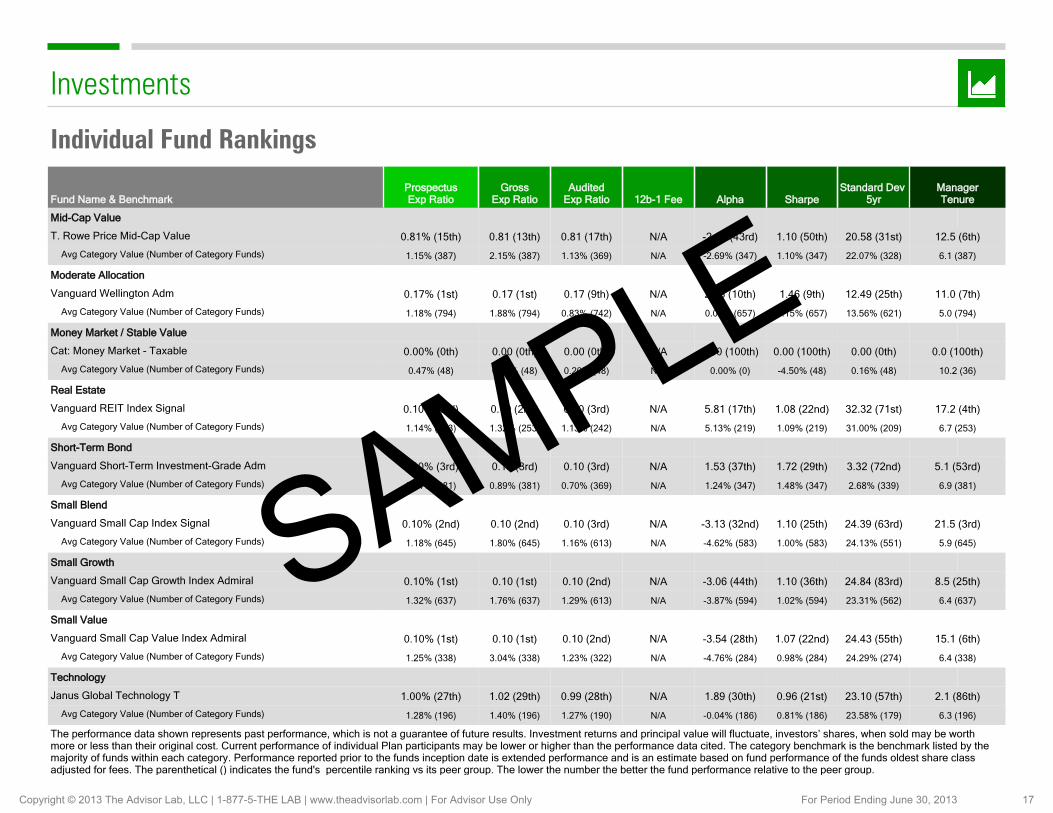
Investments
Individual Fund Rankings
Fund Name & BenchmarkProspectusExp Ratio
GrossExp Ratio
AuditedExp Ratio 12b-1 Fee Alpha Sharpe
Standard Dev 5yr
ManagerTenure
Mid-Cap Value
T. Rowe Price Mid-Cap Value 0.81% (15th) 0.81 (13th) 0.81 (17th) N/A -2.64 (43rd) 1.10 (50th) 20.58 (31st) 12.5 (6th)
Avg Category Value (Number of Category Funds) 1.15% (387) 2.15% (387) 1.13% (369) N/A -2.69% (347) 1.10% (347) 22.07% (328) 6.1 (387)
Moderate Allocation
Vanguard Wellington Adm 0.17% (1st) 0.17 (1st) 0.17 (9th) N/A 2.83 (10th) 1.46 (9th) 12.49 (25th) 11.0 (7th)
Avg Category Value (Number of Category Funds) 1.18% (794) 1.88% (794) 0.83% (742) N/A 0.03% (657) 1.15% (657) 13.56% (621) 5.0 (794)
Money Market / Stable Value
Cat: Money Market - Taxable 0.00% (0th) 0.00 (0th) 0.00 (0th) N/A 0.00 (100th) 0.00 (100th) 0.00 (0th) 0.0 (100th)
Avg Category Value (Number of Category Funds) 0.47% (48) 0.53% (48) 0.20% (48) N/A 0.00% (0) -4.50% (48) 0.16% (48) 10.2 (36)
Real Estate
Vanguard REIT Index Signal 0.10% (3rd) 0.10 (2nd) 0.10 (3rd) N/A 5.81 (17th) 1.08 (22nd) 32.32 (71st) 17.2 (4th)
Avg Category Value (Number of Category Funds) 1.14% (253) 1.32% (253) 1.13% (242) N/A 5.13% (219) 1.09% (219) 31.00% (209) 6.7 (253)
Short-Term Bond
Vanguard Short-Term Investment-Grade Adm 0.10% (3rd) 0.10 (3rd) 0.10 (3rd) N/A 1.53 (37th) 1.72 (29th) 3.32 (72nd) 5.1 (53rd)
Avg Category Value (Number of Category Funds) 0.71% (381) 0.89% (381) 0.70% (369) N/A 1.24% (347) 1.48% (347) 2.68% (339) 6.9 (381)
Small Blend
Vanguard Small Cap Index Signal 0.10% (2nd) 0.10 (2nd) 0.10 (3rd) N/A -3.13 (32nd) 1.10 (25th) 24.39 (63rd) 21.5 (3rd)
Avg Category Value (Number of Category Funds) 1.18% (645) 1.80% (645) 1.16% (613) N/A -4.62% (583) 1.00% (583) 24.13% (551) 5.9 (645)
Small Growth
Vanguard Small Cap Growth Index Admiral 0.10% (1st) 0.10 (1st) 0.10 (2nd) N/A -3.06 (44th) 1.10 (36th) 24.84 (83rd) 8.5 (25th)
Avg Category Value (Number of Category Funds) 1.32% (637) 1.76% (637) 1.29% (613) N/A -3.87% (594) 1.02% (594) 23.31% (562) 6.4 (637)
Small Value
Vanguard Small Cap Value Index Admiral 0.10% (1st) 0.10 (1st) 0.10 (2nd) N/A -3.54 (28th) 1.07 (22nd) 24.43 (55th) 15.1 (6th)
Avg Category Value (Number of Category Funds) 1.25% (338) 3.04% (338) 1.23% (322) N/A -4.76% (284) 0.98% (284) 24.29% (274) 6.4 (338)
Technology
Janus Global Technology T 1.00% (27th) 1.02 (29th) 0.99 (28th) N/A 1.89 (30th) 0.96 (21st) 23.10 (57th) 2.1 (86th)
Avg Category Value (Number of Category Funds) 1.28% (196) 1.40% (196) 1.27% (190) N/A -0.04% (186) 0.81% (186) 23.58% (179) 6.3 (196)
The performance data shown represents past performance, which is not a guarantee of future results. Investment returns and principal value will fluctuate, investors’ shares, when sold may be worth more or less than their original cost. Current performance of individual Plan participants may be lower or higher than the performance data cited. The category benchmark is the benchmark listed by the majority of funds within each category. Performance reported prior to the funds inception date is extended performance and is an estimate based on fund performance of the funds oldest share class adjusted for fees. The parenthetical () indicates the fund's percentile ranking vs its peer group. The lower the number the better the fund performance relative to the peer group.
SAMPLE
Copyright © 2013 The Advisor Lab, LLC | 1-877-5-THE LAB | www.theadvisorlab.com | For Advisor Use Only For Period Ending June 30, 2013 17
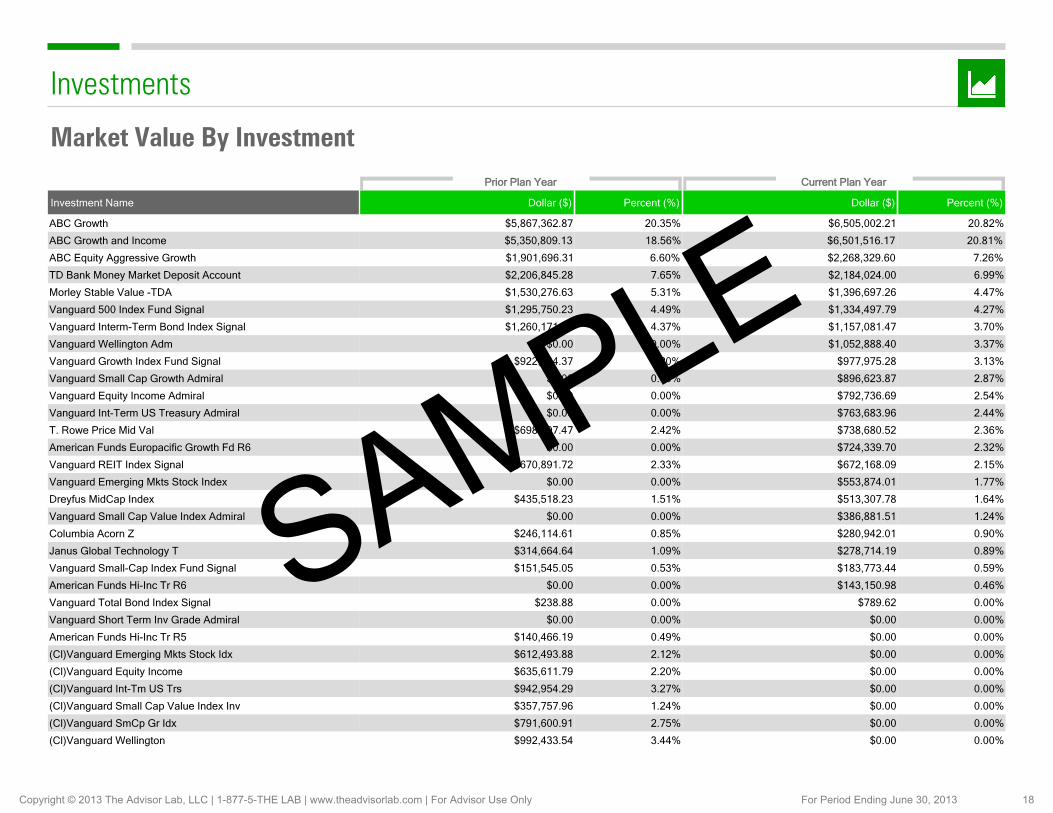
Investments
Market Value By InvestmentPrior Plan Year Current Plan Year
Investment Name Dollar ($) Percent (%) Dollar ($) Percent (%)
ABC Growth $5,867,362.87 20.35% $6,505,002.21 20.82%
ABC Growth and Income $5,350,809.13 18.56% $6,501,516.17 20.81%
ABC Equity Aggressive Growth $1,901,696.31 6.60% $2,268,329.60 7.26%
TD Bank Money Market Deposit Account $2,206,845.28 7.65% $2,184,024.00 6.99%
Morley Stable Value -TDA $1,530,276.63 5.31% $1,396,697.26 4.47%
Vanguard 500 Index Fund Signal $1,295,750.23 4.49% $1,334,497.79 4.27%
Vanguard Interm-Term Bond Index Signal $1,260,171.48 4.37% $1,157,081.47 3.70%
Vanguard Wellington Adm $0.00 0.00% $1,052,888.40 3.37%
Vanguard Growth Index Fund Signal $922,084.37 3.20% $977,975.28 3.13%
Vanguard Small Cap Growth Admiral $0.00 0.00% $896,623.87 2.87%
Vanguard Equity Income Admiral $0.00 0.00% $792,736.69 2.54%
Vanguard Int-Term US Treasury Admiral $0.00 0.00% $763,683.96 2.44%
T. Rowe Price Mid Val $698,707.47 2.42% $738,680.52 2.36%
American Funds Europacific Growth Fd R6 $0.00 0.00% $724,339.70 2.32%
Vanguard REIT Index Signal $670,891.72 2.33% $672,168.09 2.15%
Vanguard Emerging Mkts Stock Index $0.00 0.00% $553,874.01 1.77%
Dreyfus MidCap Index $435,518.23 1.51% $513,307.78 1.64%
Vanguard Small Cap Value Index Admiral $0.00 0.00% $386,881.51 1.24%
Columbia Acorn Z $246,114.61 0.85% $280,942.01 0.90%
Janus Global Technology T $314,664.64 1.09% $278,714.19 0.89%
Vanguard Small-Cap Index Fund Signal $151,545.05 0.53% $183,773.44 0.59%
American Funds Hi-Inc Tr R6 $0.00 0.00% $143,150.98 0.46%
Vanguard Total Bond Index Signal $238.88 0.00% $789.62 0.00%
Vanguard Short Term Inv Grade Admiral $0.00 0.00% $0.00 0.00%
American Funds Hi-Inc Tr R5 $140,466.19 0.49% $0.00 0.00%
(Cl)Vanguard Emerging Mkts Stock Idx $612,493.88 2.12% $0.00 0.00%
(Cl)Vanguard Equity Income $635,611.79 2.20% $0.00 0.00%
(Cl)Vanguard Int-Tm US Trs $942,954.29 3.27% $0.00 0.00%
(Cl)Vanguard Small Cap Value Index Inv $357,757.96 1.24% $0.00 0.00%
(Cl)Vanguard SmCp Gr Idx $791,600.91 2.75% $0.00 0.00%
(Cl)Vanguard Wellington $992,433.54 3.44% $0.00 0.00%
SAMPLE
Copyright © 2013 The Advisor Lab, LLC | 1-877-5-THE LAB | www.theadvisorlab.com | For Advisor Use Only For Period Ending June 30, 2013 18
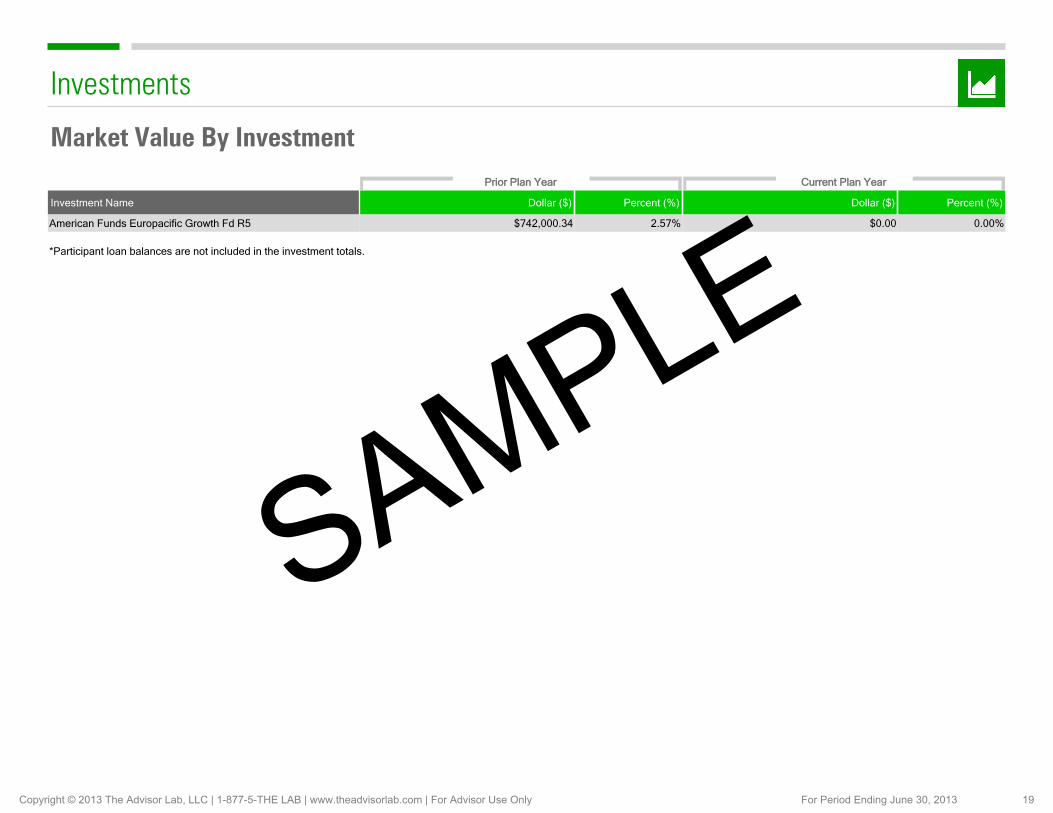
Investments
Market Value By InvestmentPrior Plan Year Current Plan Year
Investment Name Dollar ($) Percent (%) Dollar ($) Percent (%)
American Funds Europacific Growth Fd R5 $742,000.34 2.57% $0.00 0.00%
*Participant loan balances are not included in the investment totals.
SAMPLE
Copyright © 2013 The Advisor Lab, LLC | 1-877-5-THE LAB | www.theadvisorlab.com | For Advisor Use Only For Period Ending June 30, 2013 19
Investments
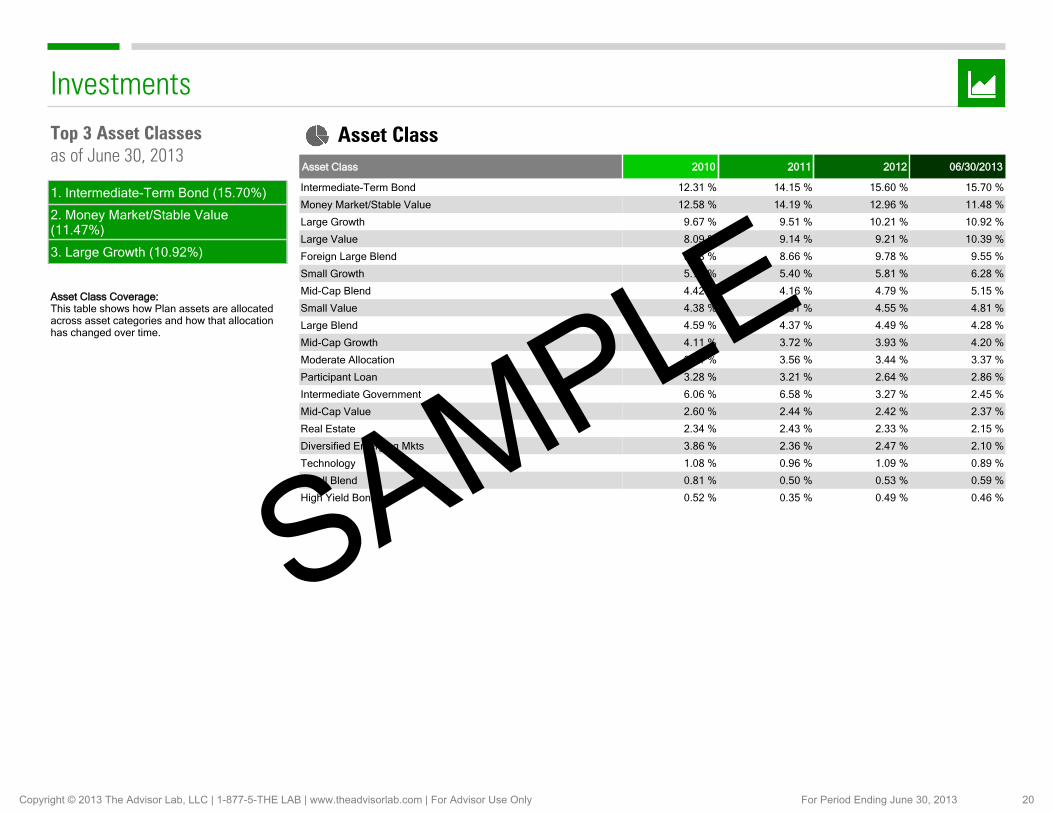
Asset ClassAsset Class 2010 2011 2012 06/30/2013
Intermediate-Term Bond 12.31 % 14.15 % 15.60 % 15.70 %
Money Market/Stable Value 12.58 % 14.19 % 12.96 % 11.48 %
Large Growth 9.67 % 9.51 % 10.21 % 10.92 %
Large Value 8.09 % 9.14 % 9.21 % 10.39 %
Foreign Large Blend 9.88 % 8.66 % 9.78 % 9.55 %
Small Growth 5.72 % 5.40 % 5.81 % 6.28 %
Mid-Cap Blend 4.42 % 4.16 % 4.79 % 5.15 %
Small Value 4.38 % 4.31 % 4.55 % 4.81 %
Large Blend 4.59 % 4.37 % 4.49 % 4.28 %
Mid-Cap Growth 4.11 % 3.72 % 3.93 % 4.20 %
Moderate Allocation 3.71 % 3.56 % 3.44 % 3.37 %
Participant Loan 3.28 % 3.21 % 2.64 % 2.86 %
Intermediate Government 6.06 % 6.58 % 3.27 % 2.45 %
Mid-Cap Value 2.60 % 2.44 % 2.42 % 2.37 %
Real Estate 2.34 % 2.43 % 2.33 % 2.15 %
Diversified Emerging Mkts 3.86 % 2.36 % 2.47 % 2.10 %
Technology 1.08 % 0.96 % 1.09 % 0.89 %
Small Blend 0.81 % 0.50 % 0.53 % 0.59 %
High Yield Bond 0.52 % 0.35 % 0.49 % 0.46 %
Asset Class Coverage:This table shows how Plan assets are allocated across asset categories and how that allocation has changed over time.
1. Intermediate-Term Bond (15.70%)
2. Money Market/Stable Value (11.47%)
3. Large Growth (10.92%)
Top 3 Asset Classesas of June 30, 2013
SAMPLE
Copyright © 2013 The Advisor Lab, LLC | 1-877-5-THE LAB | www.theadvisorlab.com | For Advisor Use Only For Period Ending June 30, 2013 20
Investments
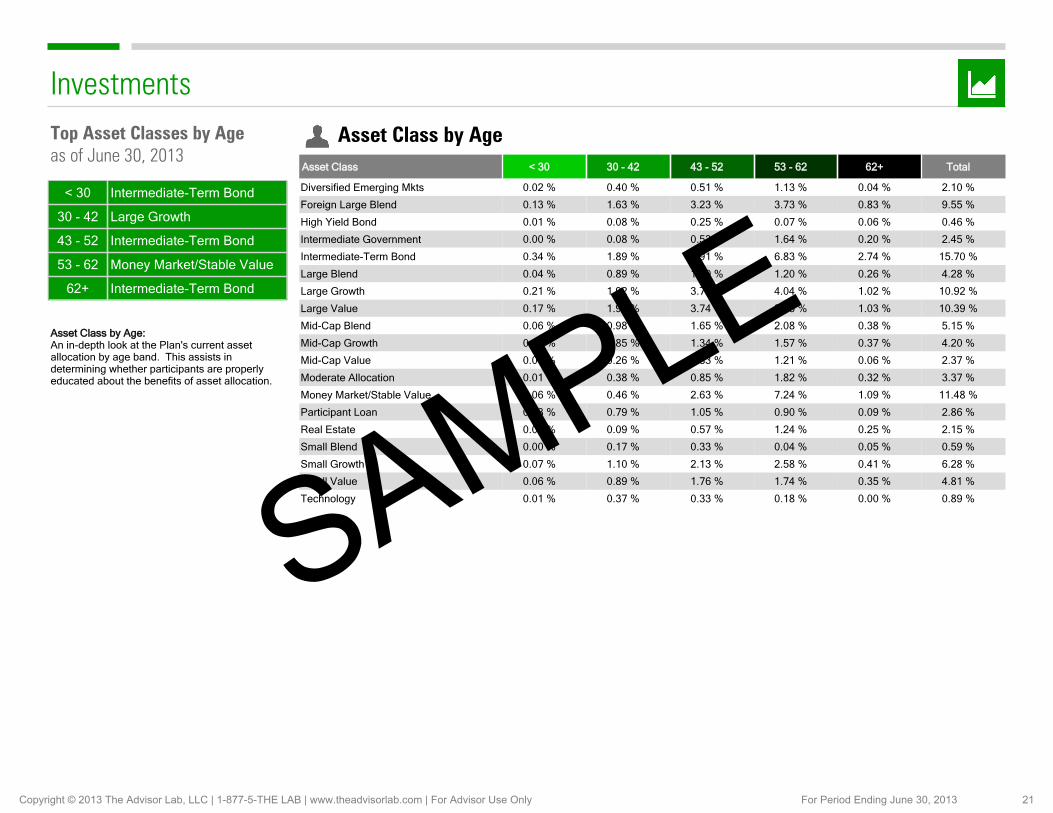
Asset Class by AgeAsset Class < 30 30 - 42 43 - 52 53 - 62 62+ Total
Diversified Emerging Mkts 0.02 % 0.40 % 0.51 % 1.13 % 0.04 % 2.10 %
Foreign Large Blend 0.13 % 1.63 % 3.23 % 3.73 % 0.83 % 9.55 %
High Yield Bond 0.01 % 0.08 % 0.25 % 0.07 % 0.06 % 0.46 %
Intermediate Government 0.00 % 0.08 % 0.53 % 1.64 % 0.20 % 2.45 %
Intermediate-Term Bond 0.34 % 1.89 % 3.91 % 6.83 % 2.74 % 15.70 %
Large Blend 0.04 % 0.89 % 1.89 % 1.20 % 0.26 % 4.28 %
Large Growth 0.21 % 1.92 % 3.74 % 4.04 % 1.02 % 10.92 %
Large Value 0.17 % 1.90 % 3.74 % 3.55 % 1.03 % 10.39 %
Mid-Cap Blend 0.06 % 0.98 % 1.65 % 2.08 % 0.38 % 5.15 %
Mid-Cap Growth 0.06 % 0.85 % 1.34 % 1.57 % 0.37 % 4.20 %
Mid-Cap Value 0.01 % 0.26 % 0.83 % 1.21 % 0.06 % 2.37 %
Moderate Allocation 0.01 % 0.38 % 0.85 % 1.82 % 0.32 % 3.37 %
Money Market/Stable Value 0.06 % 0.46 % 2.63 % 7.24 % 1.09 % 11.48 %
Participant Loan 0.03 % 0.79 % 1.05 % 0.90 % 0.09 % 2.86 %
Real Estate 0.00 % 0.09 % 0.57 % 1.24 % 0.25 % 2.15 %
Small Blend 0.00 % 0.17 % 0.33 % 0.04 % 0.05 % 0.59 %
Small Growth 0.07 % 1.10 % 2.13 % 2.58 % 0.41 % 6.28 %
Small Value 0.06 % 0.89 % 1.76 % 1.74 % 0.35 % 4.81 %
Technology 0.01 % 0.37 % 0.33 % 0.18 % 0.00 % 0.89 %
Asset Class by Age:An in-depth look at the Plan's current asset allocation by age band. This assists in determining whether participants are properly educated about the benefits of asset allocation.
< 30 Intermediate-Term Bond
30 - 42 Large Growth
43 - 52 Intermediate-Term Bond
53 - 62 Money Market/Stable Value
62+ Intermediate-Term Bond
Top Asset Classes by Ageas of June 30, 2013
SAMPLE
Copyright © 2013 The Advisor Lab, LLC | 1-877-5-THE LAB | www.theadvisorlab.com | For Advisor Use Only For Period Ending June 30, 2013 21
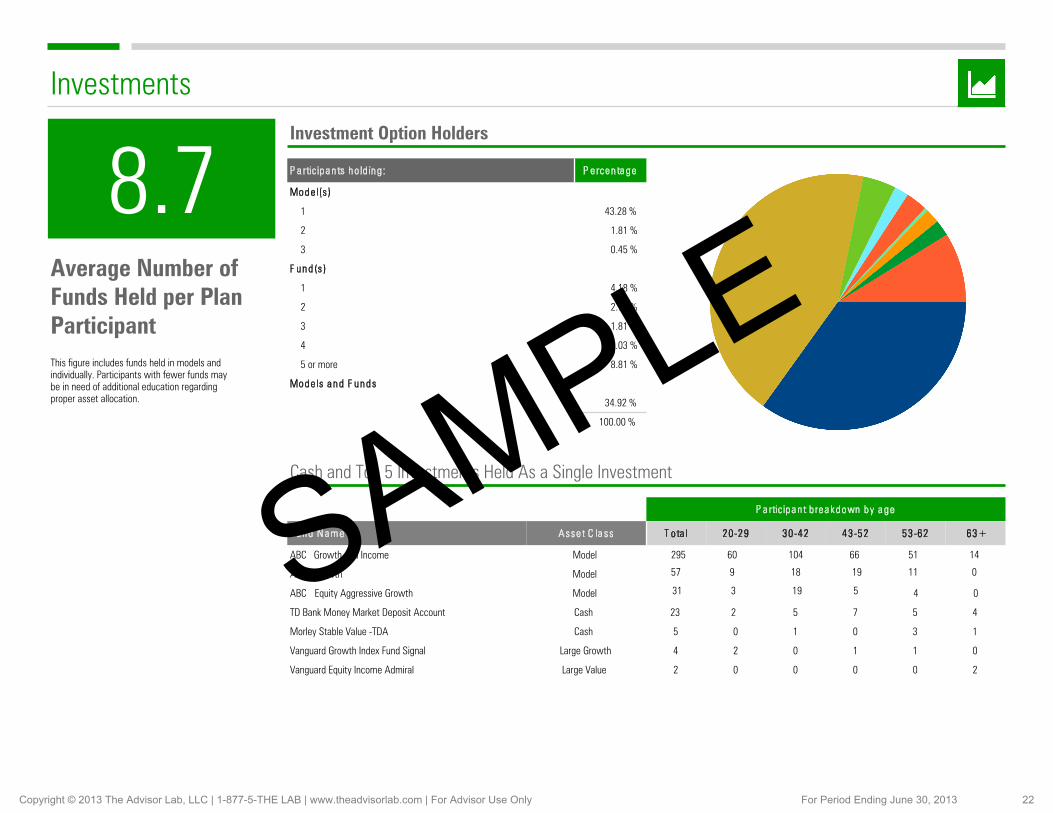
P a rtic ipa n t b rea k down by a ge
F u n d N a m e Asse t C la ss T o ta l 20-29 30-42 43-52 53-62 63+
ABC Growth and Income Model
ABC Growth Model
ABC Equity Aggressive Growth Model 4 0
TD Bank Money Market Deposit Account Cash 23 2 5 7 5 4
Morley Stable Value -TDA Cash 5 0 1 0 3 1
Vanguard Growth Index Fund Signal Large Growth 4 2 0 1 1 0
Vanguard Equity Income Admiral Large Value 2 0 0 0 0 2
Investment Option Holders
Investments
Cash and Top 5 Investments Held As a Single Investment
P a rtic ipa n ts h o ld in g : P e rcen ta ge
Mode l(s )
1 43.28 %
2 1.81 %
3 0.45 %
F u n d (s )
1 4.18 %
2 2.71 %
3 1.81 %
4 2.03 %
5 or more 8.81 %
Mode ls a n d F u n ds
34.92 %
100.00 %
Average Number of Funds Held per Plan Participant
8.7
This figure includes funds held in models and individually. Participants with fewer funds may be in need of additional education regarding proper asset allocation.
57 9 18 19 11 0
295 60 104 66 51 14
31 3 19 5 SAMPLE
Copyright © 2013 The Advisor Lab, LLC | 1-877-5-THE LAB | www.theadvisorlab.com | For Advisor Use Only For Period Ending June 30, 2013 22
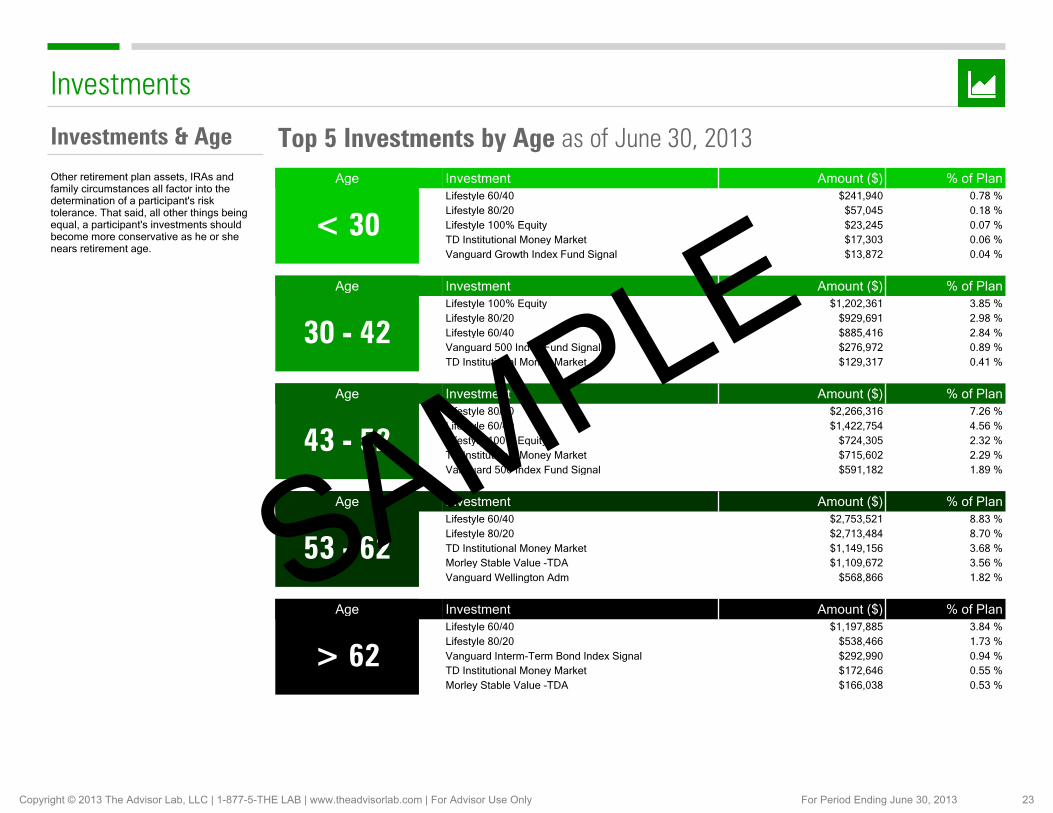
Investments & AgeOther retirement plan assets, IRAs and family circumstances all factor into the determination of a participant's risk tolerance. That said, all other things being equal, a participant's investments should become more conservative as he or she nears retirement age.
Investments
< 30
Investment Amount ($) % of PlanLifestyle 60/40 $241,940 0.78 %Lifestyle 80/20 $57,045 0.18 %Lifestyle 100% Equity $23,245 0.07 %TD Institutional Money Market $17,303 0.06 %Vanguard Growth Index Fund Signal $13,872 0.04 %
Age
43 - 52
Investment Amount ($) % of PlanLifestyle 80/20 $2,266,316 7.26 %Lifestyle 60/40 $1,422,754 4.56 %Lifestyle 100% Equity $724,305 2.32 %TD Institutional Money Market $715,602 2.29 %Vanguard 500 Index Fund Signal $591,182 1.89 %
Age
53 - 62
Investment Amount ($) % of PlanLifestyle 60/40 $2,753,521 8.83 %Lifestyle 80/20 $2,713,484 8.70 %TD Institutional Money Market $1,149,156 3.68 %Morley Stable Value -TDA $1,109,672 3.56 %Vanguard Wellington Adm $568,866 1.82 %
Age
> 62
Investment Amount ($) % of PlanLifestyle 60/40 $1,197,885 3.84 %Lifestyle 80/20 $538,466 1.73 %Vanguard Interm-Term Bond Index Signal $292,990 0.94 %TD Institutional Money Market $172,646 0.55 %Morley Stable Value -TDA $166,038 0.53 %
Age
30 - 42
Investment Amount ($) % of PlanLifestyle 100% Equity $1,202,361 3.85 %Lifestyle 80/20 $929,691 2.98 %Lifestyle 60/40 $885,416 2.84 %Vanguard 500 Index Fund Signal $276,972 0.89 %TD Institutional Money Market $129,317 0.41 %
Age
Top 5 Investments by Age as of June 30, 2013
SAMPLE
Copyright © 2013 The Advisor Lab, LLC | 1-877-5-THE LAB | www.theadvisorlab.com | For Advisor Use Only For Period Ending June 30, 2013 23
Participation
Average Account Balance by Age
Participation Rates
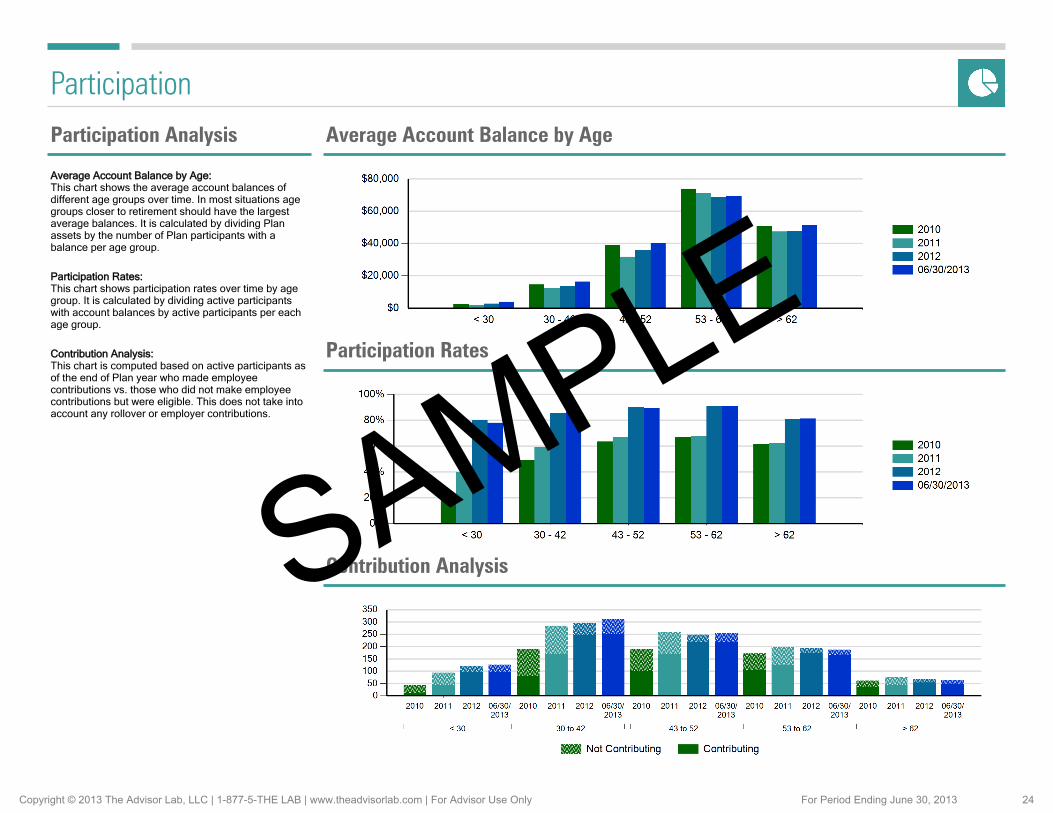
Participation Analysis
Contribution Analysis:This chart is computed based on active participants as of the end of Plan year who made employee contributions vs. those who did not make employee contributions but were eligible. This does not take into account any rollover or employer contributions.
Average Account Balance by Age:This chart shows the average account balances of different age groups over time. In most situations age groups closer to retirement should have the largest average balances. It is calculated by dividing Plan assets by the number of Plan participants with a balance per age group.
Participation Rates:This chart shows participation rates over time by age group. It is calculated by dividing active participants with account balances by active participants per each age group.
Contribution AnalysisSAMPLE
Copyright © 2013 The Advisor Lab, LLC | 1-877-5-THE LAB | www.theadvisorlab.com | For Advisor Use Only For Period Ending June 30, 2013 24

Participation
Average Participant Contribution by Age
Average Employer Contribution Average Deferral Rate for HCE & Non HCE*
Participants On Track to Retire by Age
*HCE and Non HCE refer to highly compensated and non-highly compensated employees determined in accordance with Internal Revenue Service code 414(q), as adjusted for cost of living.
SAMPLE
Copyright © 2013 The Advisor Lab, LLC | 1-877-5-THE LAB | www.theadvisorlab.com | For Advisor Use Only For Period Ending June 30, 2013 25
Service
Activity ActualTiming Standards
Statement Delivery
Participant Transfers
Response Time to Advisor, Sponsor or Participant Inquiries
Website Uptime (Availability)
15 business days
Same day (if received by 4 pm ET)
Within 24 hours of email or telephone call
99.999% of the time ("5 9s")
100%
100%
100%
100%
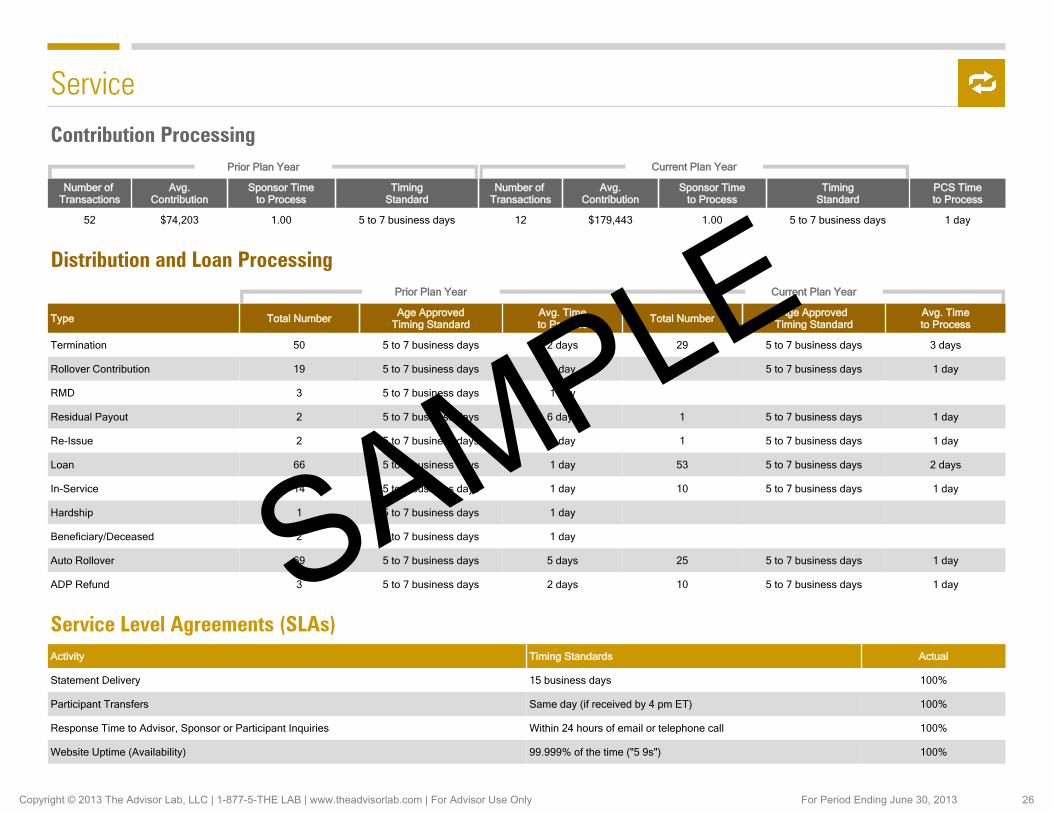
Service Level Agreements (SLAs)
Prior Plan Year Current Plan Year
Type Total Number Age ApprovedTiming Standard
Avg. Timeto Process Total Number Age Approved
Timing StandardAvg. Timeto Process
Termination 50 5 to 7 business days 2 days 29 5 to 7 business days 3 days
Rollover Contribution 19 5 to 7 business days 1 day 7 5 to 7 business days 1 day
RMD 3 5 to 7 business days 1 day
Residual Payout 2 5 to 7 business days 6 days 1 5 to 7 business days 1 day
Re-Issue 2 5 to 7 business days 1 day 1 5 to 7 business days 1 day
Loan 66 5 to 7 business days 1 day 53 5 to 7 business days 2 days
In-Service 14 5 to 7 business days 1 day 10 5 to 7 business days 1 day
Hardship 1 5 to 7 business days 1 day
Beneficiary/Deceased 2 5 to 7 business days 1 day
Auto Rollover 69 5 to 7 business days 5 days 25 5 to 7 business days 1 day
ADP Refund 3 5 to 7 business days 2 days 10 5 to 7 business days 1 day
Distribution and Loan Processing
Contribution ProcessingPrior Plan Year Current Plan Year
Number of Transactions
Avg.Contribution
Sponsor Timeto Process
TimingStandard
Number of Transactions
Avg.Contribution
Sponsor Timeto Process
TimingStandard
PCS Timeto Process
52 $74,203 1.00 5 to 7 business days 12 $179,443 1.00 5 to 7 business days 1 day
SAMPLE
Copyright © 2013 The Advisor Lab, LLC | 1-877-5-THE LAB | www.theadvisorlab.com | For Advisor Use Only For Period Ending June 30, 2013 26
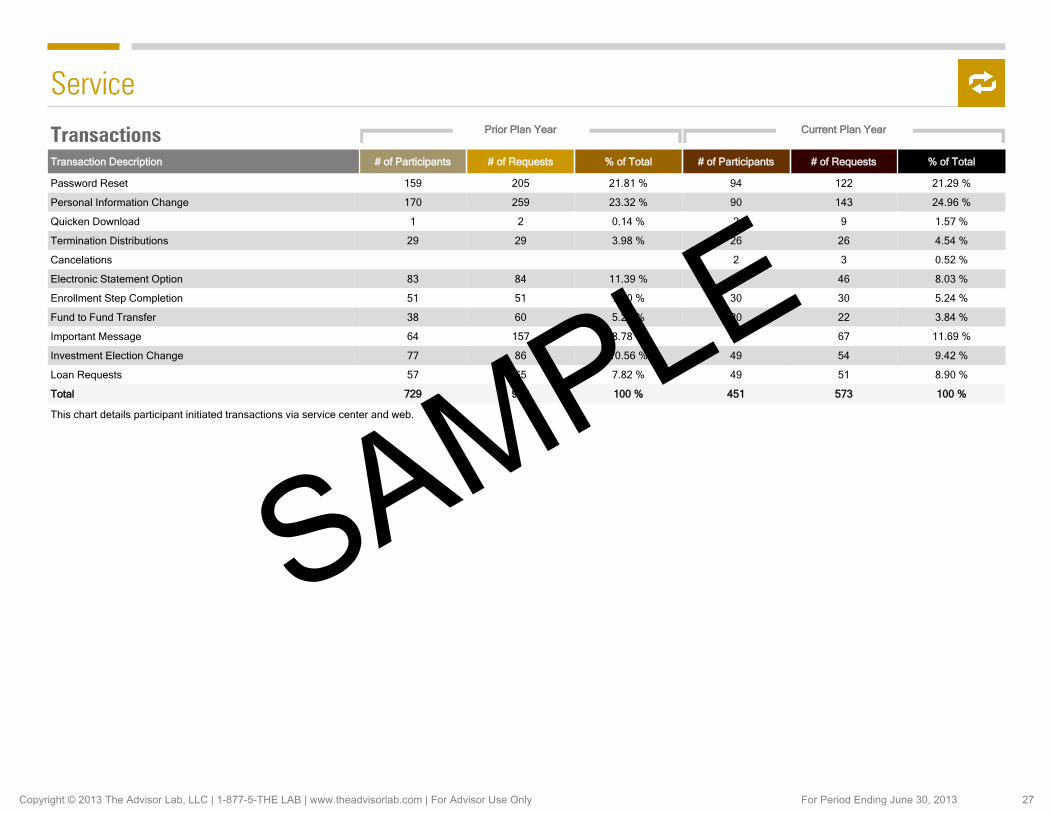
This chart details participant initiated transactions via service center and web.
Service
Transactions Prior Plan Year Current Plan Year
Transaction Description # of Participants # of Requests % of Total # of Participants # of Requests % of Total
Password Reset 159 205 21.81 % 94 122 21.29 %
Personal Information Change 170 259 23.32 % 90 143 24.96 %
Quicken Download 1 2 0.14 % 2 9 1.57 %
Termination Distributions 29 29 3.98 % 26 26 4.54 %
Cancelations 2 3 0.52 %
Electronic Statement Option 83 84 11.39 % 44 46 8.03 %
Enrollment Step Completion 51 51 7.00 % 30 30 5.24 %
Fund to Fund Transfer 38 60 5.21 % 20 22 3.84 %
Important Message 64 157 8.78 % 45 67 11.69 %
Investment Election Change 77 86 10.56 % 49 54 9.42 %
Loan Requests 57 65 7.82 % 49 51 8.90 %
Total 729 998 100 % 451 573 100 %
SAMPLE
Copyright © 2013 The Advisor Lab, LLC | 1-877-5-THE LAB | www.theadvisorlab.com | For Advisor Use Only For Period Ending June 30, 2013 27
Fiduciary/Compliance Review
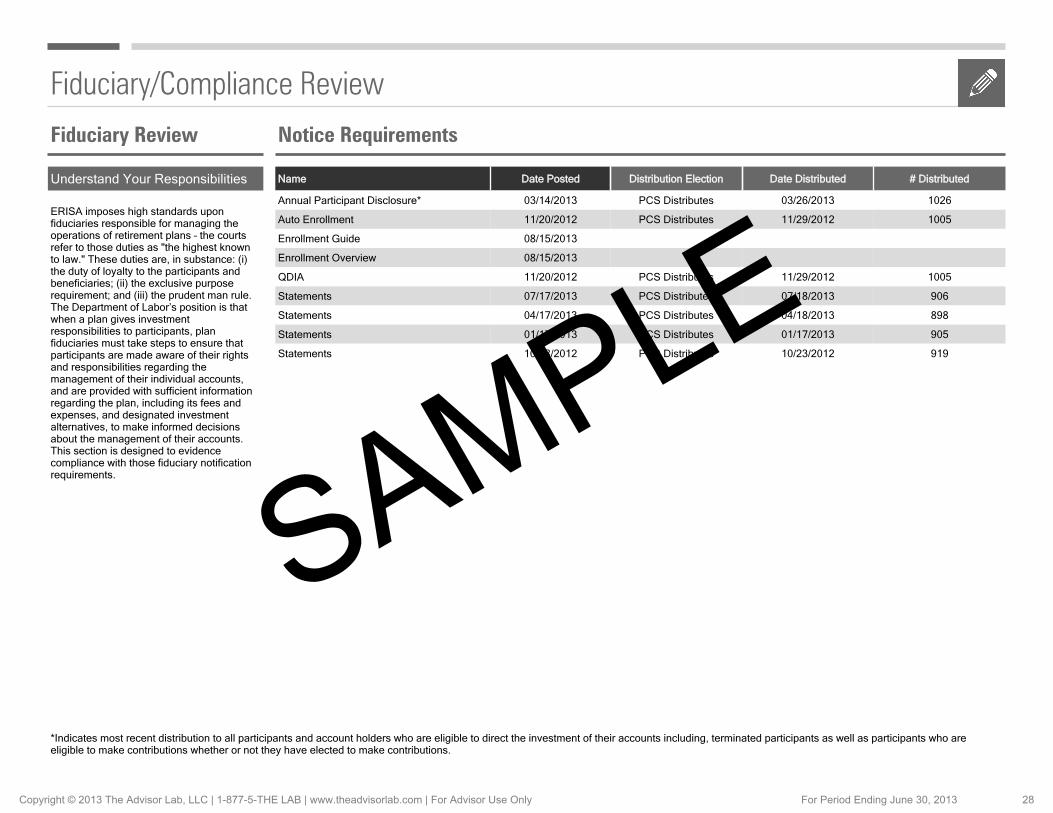
Understand Your Responsibilities
ERISA imposes high standards upon fiduciaries responsible for managing the operations of retirement plans – the courts refer to those duties as "the highest known to law." These duties are, in substance: (i) the duty of loyalty to the participants and beneficiaries; (ii) the exclusive purpose requirement; and (iii) the prudent man rule. The Department of Labor’s position is that when a plan gives investment responsibilities to participants, plan fiduciaries must take steps to ensure that participants are made aware of their rights and responsibilities regarding the management of their individual accounts, and are provided with sufficient information regarding the plan, including its fees and expenses, and designated investment alternatives, to make informed decisions about the management of their accounts. This section is designed to evidence compliance with those fiduciary notification requirements.
Name Date Posted Distribution Election Date Distributed # Distributed
Annual Participant Disclosure* 03/14/2013 PCS Distributes 03/26/2013 1026
Auto Enrollment 11/20/2012 PCS Distributes 11/29/2012 1005
Enrollment Guide 08/15/2013
Enrollment Overview 08/15/2013
QDIA 11/20/2012 PCS Distributes 11/29/2012 1005
Statements 07/17/2013 PCS Distributes 07/18/2013 906
Statements 04/17/2013 PCS Distributes 04/18/2013 898
Statements 01/17/2013 PCS Distributes 01/17/2013 905
Statements 10/18/2012 PCS Distributes 10/23/2012 919
Fiduciary Review Notice Requirements
*Indicates most recent distribution to all participants and account holders who are eligible to direct the investment of their accounts including, terminated participants as well as participants who are eligible to make contributions whether or not they have elected to make contributions.
SAMPLE
Copyright © 2013 The Advisor Lab, LLC | 1-877-5-THE LAB | www.theadvisorlab.com | For Advisor Use Only For Period Ending June 30, 2013 28
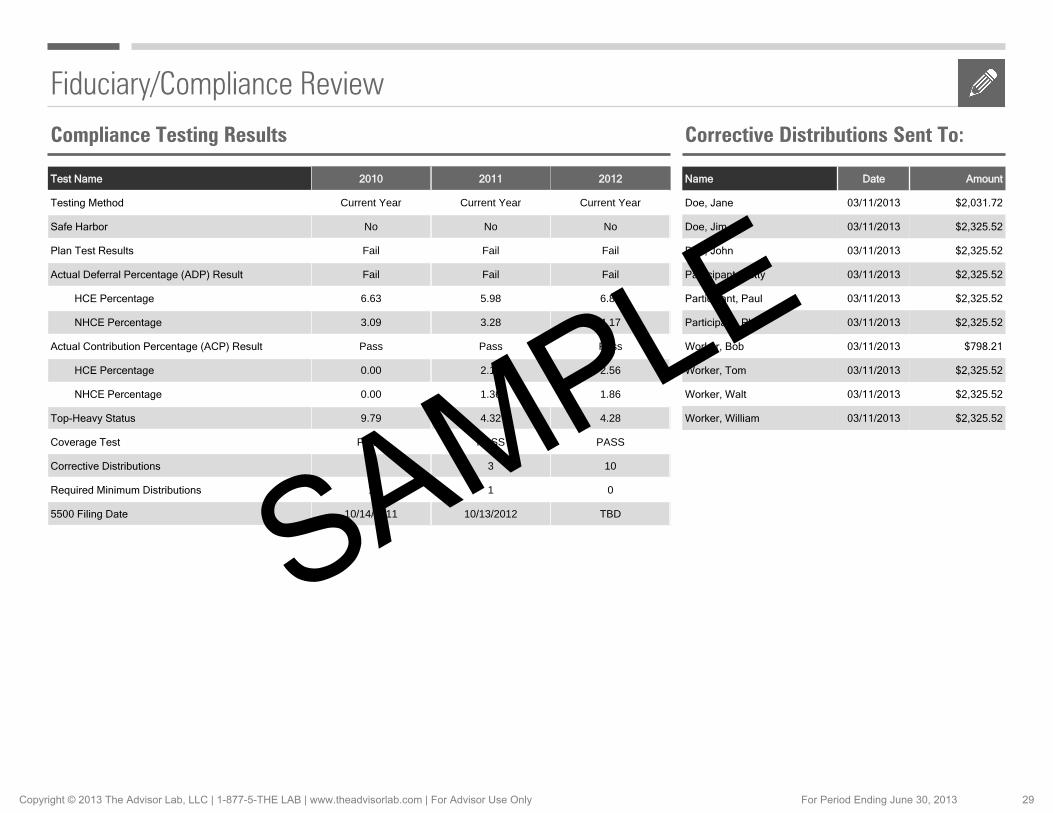
Plan Test Results
Safe Harbor
Test Name
Testing Method
Actual Deferral Percentage (ADP) Result
HCE Percentage
NHCE Percentage
Actual Contribution Percentage (ACP) Result
HCE Percentage
NHCE Percentage
Top-Heavy Status
Coverage Test
Corrective Distributions
Required Minimum Distributions
5500 Filing Date
Fiduciary/Compliance Review
Compliance Testing Results
Name Date Amount
Doe, Jane 03/11/2013 $2,031.72
Doe, Jim 03/11/2013 $2,325.52
Doe, John 03/11/2013 $2,325.52
Participant, Patty 03/11/2013 $2,325.52
Participant, Paul 03/11/2013 $2,325.52
Participant, Phil 03/11/2013 $2,325.52
Worker, Bob 03/11/2013 $798.21
Worker, Tom 03/11/2013 $2,325.52
Worker, Walt 03/11/2013 $2,325.52
Worker, William 03/11/2013 $2,325.52
Corrective Distributions Sent To:
2010
Current Year
No
Fail
Fail
6.63
3.09
Pass
0.00
0.00
9.79
PASS
3
1
10/14/2011
2011
Current Year
No
Fail
Fail
5.98
3.28
Pass
2.12
1.36
4.32
PASS
3
1
10/13/2012
2012
Current Year
No
Fail
Fail
6.87
4.17
Pass
2.56
1.86
4.28
PASS
10
0
TBDSAMPLE
Copyright © 2013 The Advisor Lab, LLC | 1-877-5-THE LAB | www.theadvisorlab.com | For Advisor Use Only For Period Ending June 30, 2013 29
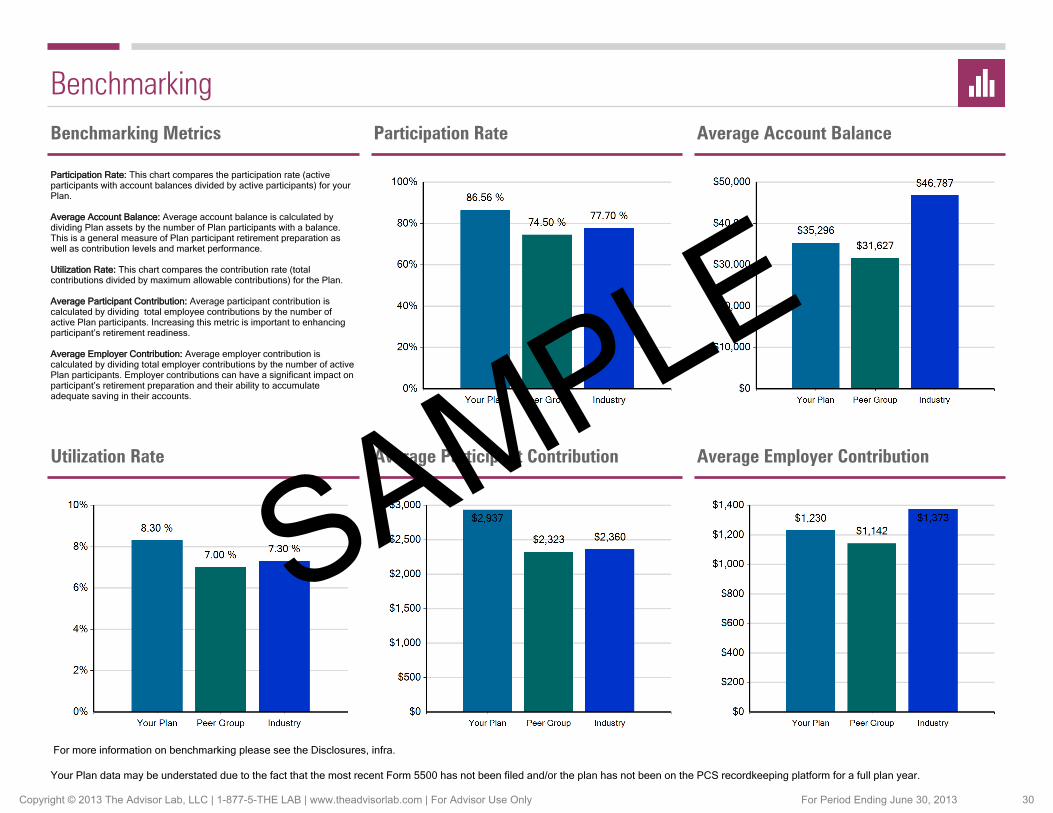
BenchmarkingBenchmarking Metrics
Participation Rate: This chart compares the participation rate (active participants with account balances divided by active participants) for your Plan.
Average Account Balance: Average account balance is calculated by dividing Plan assets by the number of Plan participants with a balance. This is a general measure of Plan participant retirement preparation as well as contribution levels and market performance. Utilization Rate: This chart compares the contribution rate (total contributions divided by maximum allowable contributions) for the Plan. Average Participant Contribution: Average participant contribution is calculated by dividing total employee contributions by the number of active Plan participants. Increasing this metric is important to enhancing participant’s retirement readiness.
Average Employer Contribution: Average employer contribution is calculated by dividing total employer contributions by the number of active Plan participants. Employer contributions can have a significant impact on participant’s retirement preparation and their ability to accumulate adequate saving in their accounts.
Participation Rate Average Account Balance
Utilization Rate Average Participant Contribution Average Employer Contribution
For more information on benchmarking please see the Disclosures, infra.
Your Plan data may be understated due to the fact that the most recent Form 5500 has not been filed and/or the plan has not been on the PCS recordkeeping platform for a full plan year.
SAMPLE
Copyright © 2013 The Advisor Lab, LLC | 1-877-5-THE LAB | www.theadvisorlab.com | For Advisor Use Only For Period Ending June 30, 2013 30
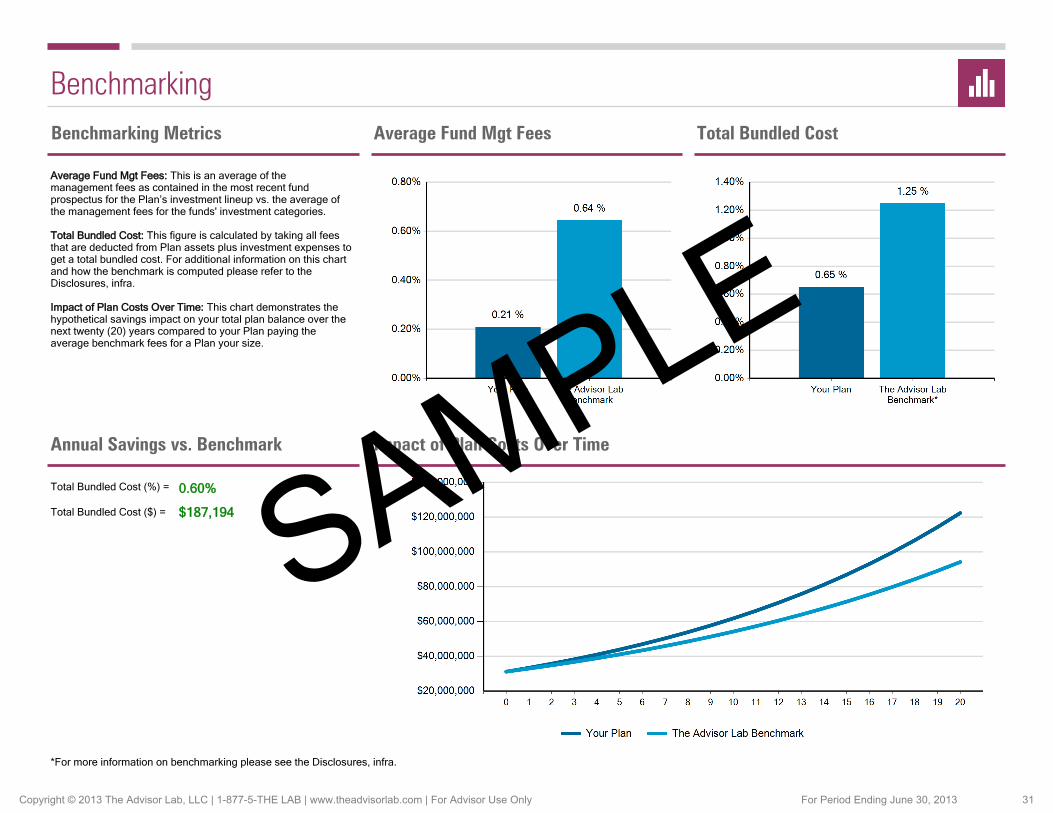
BenchmarkingTotal Bundled CostAverage Fund Mgt Fees Benchmarking Metrics
Average Fund Mgt Fees: This is an average of the management fees as contained in the most recent fund prospectus for the Plan’s investment lineup vs. the average of the management fees for the funds' investment categories.
Total Bundled Cost: This figure is calculated by taking all fees that are deducted from Plan assets plus investment expenses to get a total bundled cost. For additional information on this chart and how the benchmark is computed please refer to the Disclosures, infra.
Impact of Plan Costs Over Time: This chart demonstrates the hypothetical savings impact on your total plan balance over the next twenty (20) years compared to your Plan paying the average benchmark fees for a Plan your size.
Impact of Plan Costs Over TimeAnnual Savings vs. Benchmark
*For more information on benchmarking please see the Disclosures, infra.
Total Bundled Cost (%) =
Total Bundled Cost ($) =
0.60%
$187,194 SAMPLE
Copyright © 2013 The Advisor Lab, LLC | 1-877-5-THE LAB | www.theadvisorlab.com | For Advisor Use Only For Period Ending June 30, 2013 31
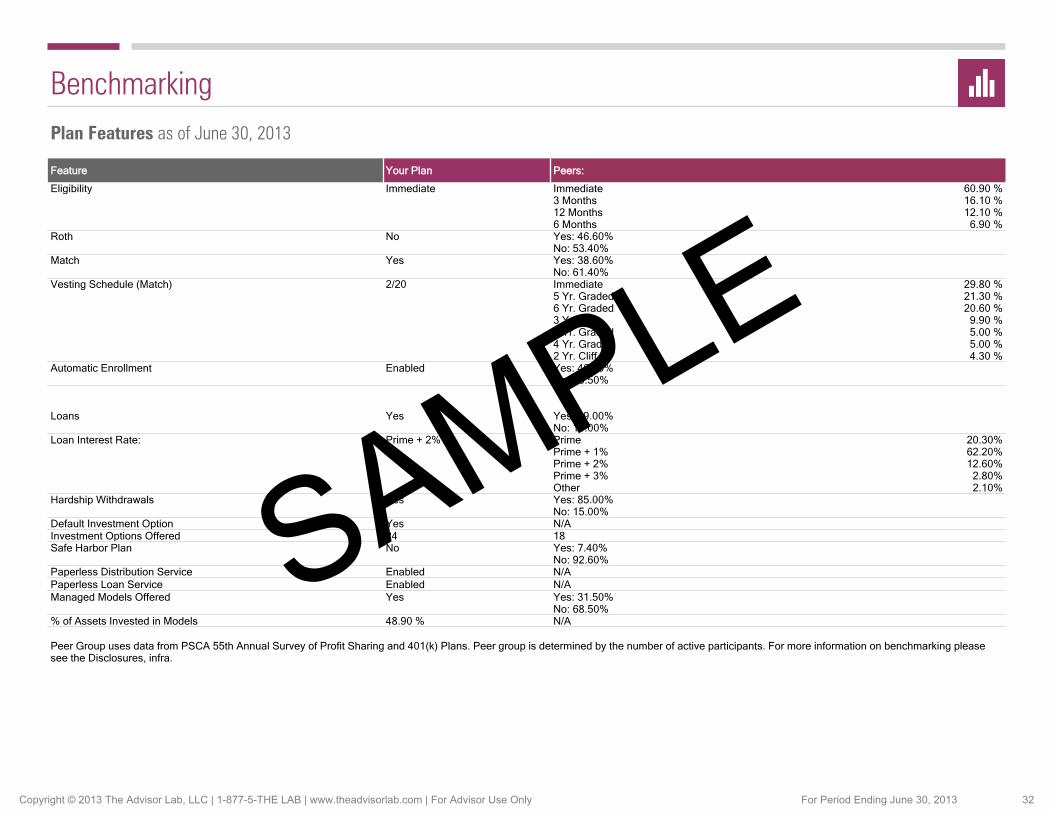
Peers:
Eligibility Immediate 60.90 %3 Months 16.10 %12 Months 12.10 %6 Months 6.90 %
Immediate
Match Yes Yes: 38.60%No: 61.40%
Loans Yes Yes: 89.00%No: 11.00%
Automatic Enrollment Enabled Yes: 46.50%No: 53.50%
Investment Options Offered 1824
Vesting Schedule (Match) 2/20 Immediate 29.80 %5 Yr. Graded 21.30 %6 Yr. Graded 20.60 %3 Yr. Cliff 9.90 %3 Yr. Graded 5.00 %4 Yr. Graded 5.00 %2 Yr. Cliff 4.30 %
Roth No Yes: 46.60%No: 53.40%
Feature
Default Investment Option Yes N/A
Hardship Withdrawals Yes Yes: 85.00%No: 15.00%
Paperless Distribution Service Enabled N/A
Safe Harbor Plan No Yes: 7.40%No: 92.60%
Paperless Loan Service Enabled N/AManaged Models Offered Yes Yes: 31.50%
No: 68.50%% of Assets Invested in Models 48.90 % N/A
BenchmarkingPlan Features as of June 30, 2013
Your Plan
Prime + 2%Loan Interest Rate: Prime 20.30%Prime + 1% 62.20%Prime + 2% 12.60%Prime + 3% 2.80%Other 2.10%
Peer Group uses data from PSCA 55th Annual Survey of Profit Sharing and 401(k) Plans. Peer group is determined by the number of active participants. For more information on benchmarking please see the Disclosures, infra.
SAMPLE
Copyright © 2013 The Advisor Lab, LLC | 1-877-5-THE LAB | www.theadvisorlab.com | For Advisor Use Only For Period Ending June 30, 2013 32
Executive Summary Year in Review: Data for fields Total Assets, Total Participants, Total Participants with Account Balance, Total Active Participants, Contribution, and Distributions come from the Plan’s Form 5500 if it is available as of the date the report was generated. Total Active Participant data for plans filing the short-form 5500 (Form 5500-SF) is taken from the PCS recordkeeping system. All other data, including the current plan year’s data, comes from the PCS recordkeeping system unless otherwise stated. Data for this section is computed on a cash basis for Plans that file Form 5500-SF and an accrual basis for Plans that file Form 5500. Certain data for this period may be subject to change after inclusion of the Plan's Form 5500 data for such period in the data feed from the US Department of Labor to The Advisor Lab, LLC (for example, Plan assets that are not maintained on the PCS recordkeeping system may not be reflected).
RetireOnTime™: The analysis shows a hypothetical look at how well prepared Plan participants are for retirement. Participants included in the analysis have an account balance and made a deferral of any amount in the last 12 months. Only compensation up to $255,000 (the annual compensation limit under Internal Revenue Code Sections 401(a)(17), 404(l), 408(k)(3)(C) and 408(k)(6)(D)(ii)) is included in this analysis since individuals earning in excess of such amount likely have significant retirement savings outside of the Plan. The analysis takes into account age, salary, contributions, Plan balance, inflation, estimated Social Security Income, and the 10 year return of participant's Plan investments. It does not take into account outside assets or spousal assets. For a participant to be counted as on track to RetireOnTime™, his/her monthly income from retirement savings at Social Security retirement age must be equal to or greater than 70% of their current salary (adjusted for inflation). This tool is for informational purposes only and should not be used to make any investment decisions.
Model Performance: Performance and benchmark results are provided exclusively for illustrative purposes. Comparisons to benchmarks have limitations because benchmarks have volatility and other material characteristics that may differ from the portfolio. Also, performance results for benchmarks do not reflect payment of investment management/incentive fees and other fund expenses. Because of these differences, benchmarks should not be relied upon as an accurate measure of comparison. Performance results are provided only to assist an individual in assessing whether a specific model may meet, or continue to meet, his/her investment objective(s). For reasons including variances in portfolio account holdings, variances in the investment management fee incurred, market fluctuation, the date on which a participant invests in a model, and any contributions or withdrawals, the performance of a specific participant's account may vary substantially from the results shown. No representation is being made that any account will or is likely to achieve future profits or losses similar to those shown. The performance results also assume the reinvestment of dividends and capital gains but do not reflect the deduction of service provider fees, such as investment advisor(s), recordkeeper, TPA, and custodian. Past performance does not indicate future results. For composition of the benchmarks please see the Investment performance section.
Investment Data: Data for fund performance, index performance, expense ratios, and fund ranking provided by Lipper, a Thomson Reuters company, & Morningstar, Inc.
Fiduciary/Compliance Review: Data in this section is based on the Plan's year end testing. If testing has not been completed as of the date this report is generated, the results may be unavailable. The number of corrective distributions is counted on an accrual basis.
Benchmarking: The Plan’s participation rate, average account balance, utilization rate, average participant contribution and average employer contribution are benchmarked against plans within your Plan’s peer group and industry. The Peer group is comprised of plans of similar size, which includes plans with participants and assets of both10% more and 10% less than your Plan. If this calculation does not yield at least 25 plans in the Peer Group, the percentage is automatically increased in 10% increments until a minimum of 25 plans have been included. The industry is determined by selecting those plans with the same business code as reported on your plan’s Form 5500 (limited to a maximum of 10,000 plans). Active participants are used in the calculation of participation rate, utilization rate, average participant contribution and average employer contribution. Your Plan’s participation rate and average account balance data is as of the most recent period from the PCS recordkeeping system. For utilization rate, average participant contribution and average employer contribution if the most recent Form 5500 data is not available from the Department of Labor, data is from the PCS recordkeeping system for the most recent full Plan year. Active participant data for plans filing the short-form 5500 (Form 5500-SF) is taken from the PCS recordkeeping system.
Fee Benchmarking: Your Plan's Total Bundled Cost – Your Plan's annual expenses are calculated by taking a straight average of all fund expenses (offset by 100% of any mutual fund reimbursements) and adding all plan-level administrative fees charged to or deducted from Plan assets for the 4th quarter of 2012 and then annualizing such amount (multiplying by four). Administrative expenses typically include items as such as recordkeeping, participant website access, participant statements, trading and investment support, Plan compliance services (including third party administration, legal and accounting services) and investment advisory and financial professional services. In order to show a proper apples-to-apples comparison vs. The Advisor Lab peer group benchmark (see below) any forfeitures (of the non-vested Plan account balances of former participants) used to offset Plan expenses were added back. As a result the amount shown for Your Plan's Total Bundled Cost may be higher than the pro rata fee deducted from participant accounts during the applicable period. Peer Group (The Advisor Lab Benchmark) -- The Advisor Lab maintains a large database of information, which is continually updated, and has developed software to build reports that compare a plan's fees to a universe of similar plans. The use of The Advisor Lab benchmark is intended to provide material assistance to fiduciaries in fulfilling their legal responsibilities in the information gathering, analysis and monitoring phases of the due diligence process.
Impact of Plan Costs Over TIme: The graph is for illustrative purposes only. The graph shows the hypothetical growth Plan and peer group assets over time. They are calculated by reducing the assumed 8% rate of return by the total plan costs. The compounding cost in both charts are estimates and do not take into account new contributions, distributions or investment changes that may be made during the hypothetical twenty year period.
Benchmarking Plan Features: Data for your Plan's features is what is currently available as of the date the report was generated. Data from PSCA 55th Annual Survey of Profit Sharing and 401(k) Plans (reflecting the 2011 plan experience), the peer group for this section is determined by the peer groups sizes in the PSCA survey (participant ranges 1-49, 50-199, 200-999, 1,000-4,999, >5000). The survey reports on 840 plans with 10.3 million participants and $753 billion in plan assets.
Disclosures
SAMPLE
Copyright © 2013 The Advisor Lab, LLC | 1-877-5-THE LAB | www.theadvisorlab.com | For Advisor Use Only For Period Ending June 30, 2013 33