Embed Size (px)
Citation preview

ANNEXES
277
ANNE
XES
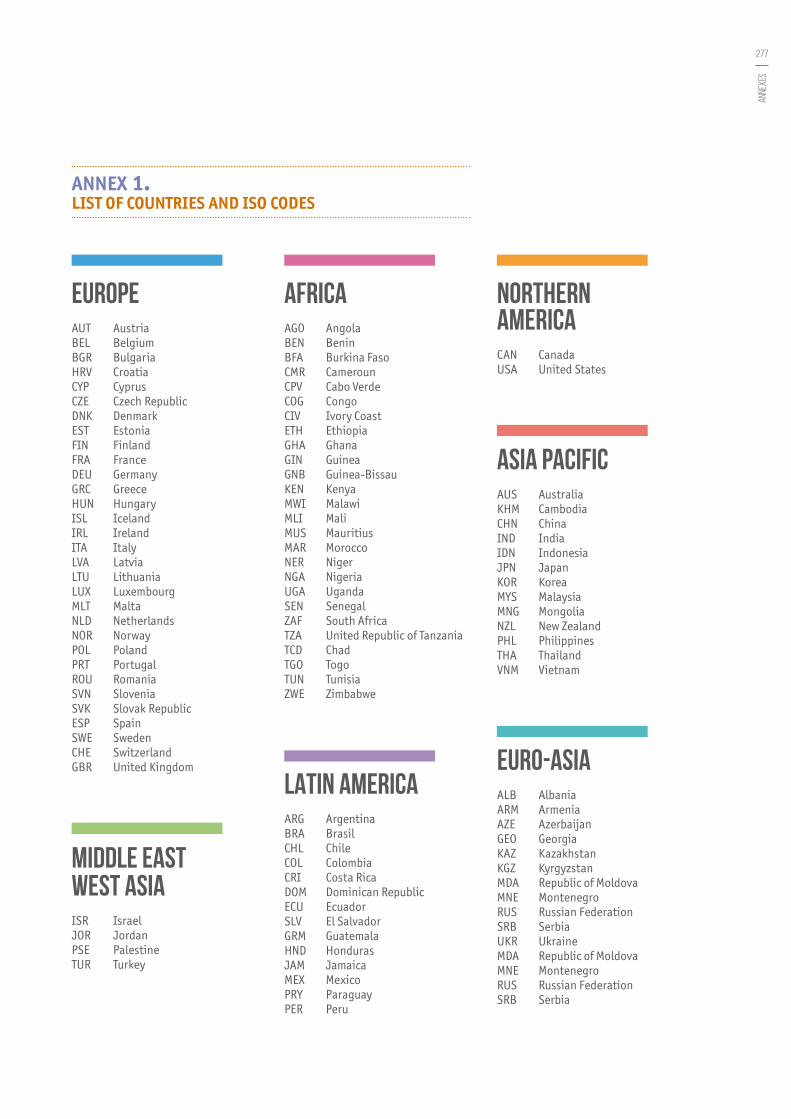
ANNEX 1. LIST OF COUNTRIES AND ISO CODES
EUROPEAUT AustriaBEL BelgiumBGR BulgariaHRV CroatiaCYP CyprusCZE Czech RepublicDNK DenmarkEST EstoniaFIN FinlandFRA FranceDEU GermanyGRC GreeceHUN HungaryISL IcelandIRL IrelandITA ItalyLVA LatviaLTU LithuaniaLUX LuxembourgMLT MaltaNLD NetherlandsNOR NorwayPOL PolandPRT PortugalROU RomaniaSVN SloveniaSVK Slovak RepublicESP SpainSWE SwedenCHE SwitzerlandGBR United Kingdom
MIDDLE EAST WEST ASIAISR IsraelJOR JordanPSE PalestineTUR Turkey
AFRICAAGO AngolaBEN BeninBFA Burkina FasoCMR CamerounCPV Cabo VerdeCOG CongoCIV Ivory CoastETH EthiopiaGHA GhanaGIN Guinea GNB Guinea-BissauKEN KenyaMWI MalawiMLI MaliMUS MauritiusMAR MoroccoNER NigerNGA NigeriaUGA UgandaSEN SenegalZAF South AfricaTZA United Republic of TanzaniaTCD ChadTGO TogoTUN TunisiaZWE Zimbabwe
LATIN AMERICAARG ArgentinaBRA BrasilCHL ChileCOL ColombiaCRI Costa RicaDOM Dominican RepublicECU EcuadorSLV El SalvadorGRM GuatemalaHND HondurasJAM JamaicaMEX MexicoPRY ParaguayPER Peru
NORTHERN AMERICACAN CanadaUSA United States
ASIA PACIFICAUS AustraliaKHM CambodiaCHN ChinaIND IndiaIDN IndonesiaJPN JapanKOR KoreaMYS MalaysiaMNG MongoliaNZL New ZealandPHL PhilippinesTHA ThailandVNM Vietnam
EURO-ASIAALB AlbaniaARM ArmeniaAZE AzerbaijanGEO GeorgiaKAZ KazakhstanKGZ KyrgyzstanMDA Republic of MoldovaMNE MontenegroRUS Russian FederationSRB SerbiaUKR UkraineMDA Republic of MoldovaMNE MontenegroRUS Russian FederationSRB Serbia
278
Subn
ation
al g
over
nmen
ts a
roun
d th
e wor
ld St
ruct
ure a
nd fi
nanc
e
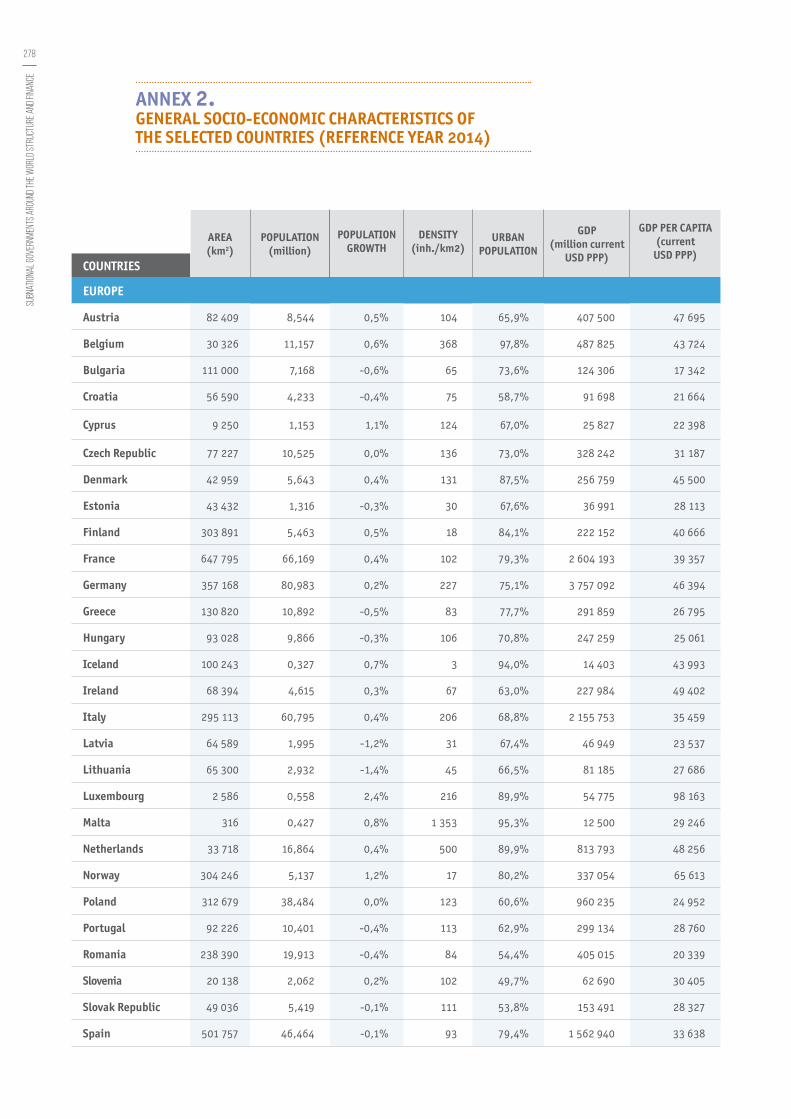
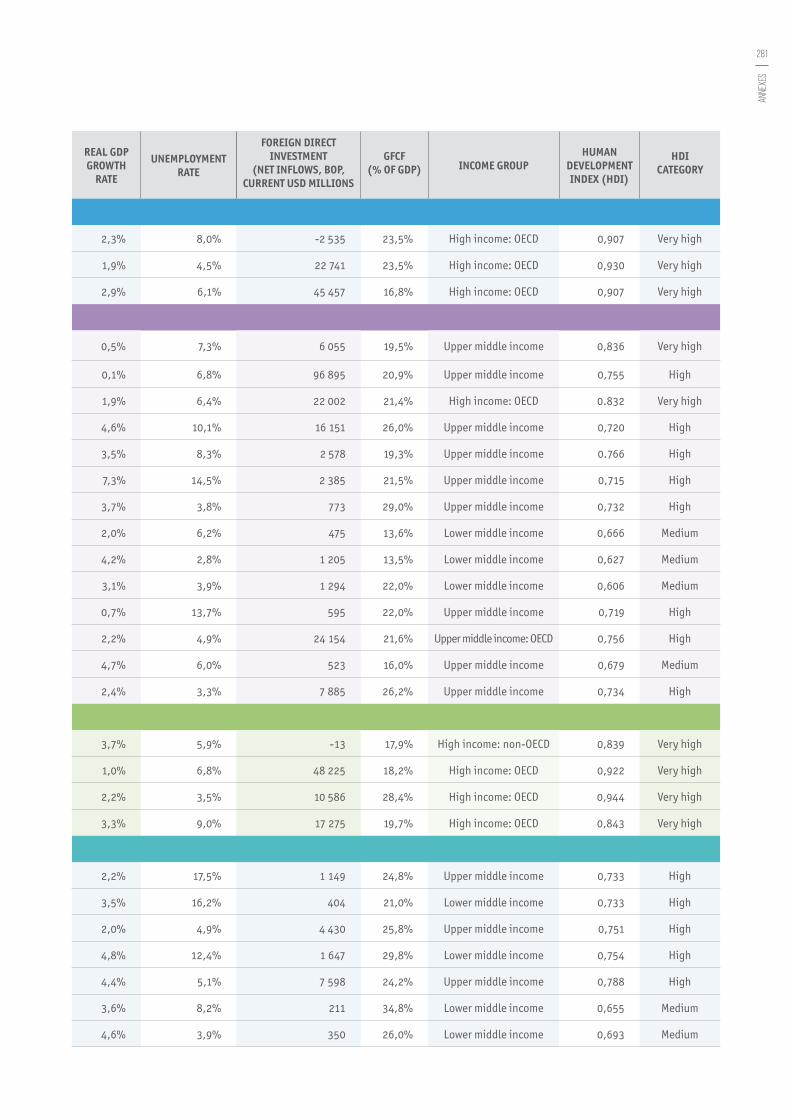
ANNEX 2. GENERAL SOCIO-ECONOMIC CHARACTERISTICS OF THE SELECTED COUNTRIES (REFERENCE YEAR 2014)
AREA (km2)
POPULATION (million)
POPULATION GROWTH
DENSITY (inh./km2)
URBAN POPULATION
GDP (million current
USD PPP)
GDP PER CAPITA (current USD PPP)
COUNTRIES
EUROPE
Austria 82 409 8,544 0,5% 104 65,9% 407 500 47 695
Belgium 30 326 11,157 0,6% 368 97,8% 487 825 43 724
Bulgaria 111 000 7,168 -0,6% 65 73,6% 124 306 17 342
Croatia 56 590 4,233 -0,4% 75 58,7% 91 698 21 664
Cyprus 9 250 1,153 1,1% 124 67,0% 25 827 22 398
Czech Republic 77 227 10,525 0,0% 136 73,0% 328 242 31 187
Denmark 42 959 5,643 0,4% 131 87,5% 256 759 45 500
Estonia 43 432 1,316 -0,3% 30 67,6% 36 991 28 113
Finland 303 891 5,463 0,5% 18 84,1% 222 152 40 666
France 647 795 66,169 0,4% 102 79,3% 2 604 193 39 357
Germany 357 168 80,983 0,2% 227 75,1% 3 757 092 46 394
Greece 130 820 10,892 -0,5% 83 77,7% 291 859 26 795
Hungary 93 028 9,866 -0,3% 106 70,8% 247 259 25 061
Iceland 100 243 0,327 0,7% 3 94,0% 14 403 43 993
Ireland 68 394 4,615 0,3% 67 63,0% 227 984 49 402
Italy 295 113 60,795 0,4% 206 68,8% 2 155 753 35 459
Latvia 64 589 1,995 -1,2% 31 67,4% 46 949 23 537
Lithuania 65 300 2,932 -1,4% 45 66,5% 81 185 27 686
Luxembourg 2 586 0,558 2,4% 216 89,9% 54 775 98 163
Malta 316 0,427 0,8% 1 353 95,3% 12 500 29 246
Netherlands 33 718 16,864 0,4% 500 89,9% 813 793 48 256
Norway 304 246 5,137 1,2% 17 80,2% 337 054 65 613
Poland 312 679 38,484 0,0% 123 60,6% 960 235 24 952
Portugal 92 226 10,401 -0,4% 113 62,9% 299 134 28 760
Romania 238 390 19,913 -0,4% 84 54,4% 405 015 20 339
Slovenia 20 138 2,062 0,2% 102 49,7% 62 690 30 405
Slovak Republic 49 036 5,419 -0,1% 111 53,8% 153 491 28 327
Spain 501 757 46,464 -0,1% 93 79,4% 1 562 940 33 638

279
ANNE
XES
REAL GDP GROWTH
RATE
UNEMPLOYMENT RATE
FOREIGN DIRECT INVESTMENT
(NET INFLOWS, BOP, CURRENT USD MILLIONS
GFCF (% OF GDP) INCOME GROUP
HUMAN DEVELOPMENT INDEX (HDI)
HDI CATEGORY
0,4% 5,6% 8 202 22,4% High income: OECD 0,885 Very high
1,3% 8,5% -20 097 23,3% High income: OECD 0,890 Very high
1,6% 13,0% 1 971 21,1% Upper middle income 0,782 High
-0,4% 17,3% 3 937 19,1% High income: non-OECD 0,818 Very high
-2,3% 16,1% 861 11,5% High income: non-OECD 0,850 Very high
2,0% 6,1% 4 871 25,0% High income: OECD 0,870 Very high
1,3% 6,6% -677 19,1% High income: OECD 0,923 Very high
2,9% 7,4% 1 571 25,2% High income: OECD 0,861 Very high
-0,4% 8,7% 14 812 20,6% High income: OECD 0,883 Very high
0,2% 10,3% 7 957 21,6% High income: OECD 0,888 Very high
1,6% 5,0% 8 390 20,1% High income: OECD 0,916 Very high
0,7% 26,5% 1 683 11,6% High income: OECD 0,865 Very high
3,7% 7,7% 12 400 21,7% High income: OECD 0,828 Very high
1,8% 4,9% 746 16,8% High income: OECD 0,899 Very high
5,2% 11,3% 86 766 19,3% High income: OECD 0,916 Very high
-0,4% 12,7% 13 727 16,6% High income: OECD 0,873 Very high
2,4% 10,8% 878 22,9% High income: OECD 0,819 Very high
3,0% 10,7% 351 18,9% High income: non OECD 0,839 Very high
4,1% 6,1% 7 087 18,6% High income: OECD 0,892 Very high
3,7% 5,9% -13 17,9% High income: non-OECD 0,839 Very high
1,0% 6,8% 48 225 18,2% High income: OECD 0,922 Very high
2,2% 3,5% 10 586 28,4% High income: OECD 0,944 Very high
3,3% 9,0% 17 275 19,7% High income: OECD 0,843 Very high
0,9% 13,9% 12 410 14,9% High income: OECD 0,830 Very high
2,8% 6,8% 3 864 24,2% Upper middle income 0,793 High
3,0% 9,7% 1 030 19,6% High income: OECD 0,880 Very high
2,5% 13,2% 85 20,9% High income: OECD 0,844 Very high
1,4% 24,4% 34 233 19,6% High income: OECD 0,876 Very high

280
Subn
ation
al g
over
nmen
ts a
roun
d th
e wor
ld St
ruct
ure a
nd fi
nanc
e
AREA (km2)
POPULATION (million)
POPULATION GROWTH
DENSITY (inh./km2)
URBAN POPULATION
GDP (million current
USD PPP)
GDP PER CAPITA (current USD PPP)
COUNTRIES
EUROPE
Sweden 407 340 9,696 0,8% 24 85,7% 439 204 45 297
Switzerland 39 996 8,189 1,0% 205 73,8% 487 518 59 536
United Kingdom 242 509 64,597 0,7% 266 82,3% 2 597 421 40 210
LATIN AMERICA
Argentina 2 766 890 42,980 1,0% 15 91,8% 754 477 17 554
Brazil 8 515 770 202,769 0,5% 24 85,4% 3 275 227 16 153
Chile 740 243 17,836 0,9% 24 89,4% 392 041 21 980
Colombia 1 141 748 47,791 1,0% 42 76,2% 638 357 13 357
Costa Rica 51 100 4,758 1,1% 93 75,9% 70 974 14 918
Dominican Republic 48 734 10,405 1,3% 214 79,0% 138 007 13 262
Ecuador 256 370 16,300 1,6% 64 63,7% 180 843 11 092
El Salvador 21 041 6,426 0,3% 305 66,7% 51 006 7 936
Guatemala 108 890 16,020 2,1% 147 51,6% 119 375 7 453
Honduras 112 492 7,962 1,5% 71 54,7% 39 081 4 909
Jamaica 10 830 2,721 0,3% 251 54,8% 24 152 8 878
Mexico 1 959 248 119,713 1,2% 61 79,0% 2 171 020 18 135
Paraguay 406 752 6,553 1,4% 16 59,7% 58 392 8 912
Peru 1 285 220 30,973 1,3% 24 78,3% 371 335 11 989
MIDDLE EAST & WEST ASIA
Israel 316 0,427 0,8% 1 353 95,3% 12 500 29 246
Jordan 33 718 16,864 0,4% 500 89,9% 813 793 48 256
Palestine 304 246 5,137 1,2% 17 80,2% 337 054 65 613
Turkey 312 679 38,484 0,0% 123 60,6% 960 235 24 952
EURO-ASIA
Albania 28 750 3,197 0,3% 111 57,4% 32 152 10 057
Armenia 29 740 2,989 0,4% 101 62,7% 24 259 8 115
Azerbaijan 86 600 9,535 1,3% 110 54,6% 167 061 17 525
Georgia 69 700 4,305 1,3% 62 53,6% 34 100 7 921
Kazakhstan 2 724 900 16,607 1,5% 6 53,3% 418 879 25 223
Kyrgyzstan 199 900 5,835 1,7% 29 35,7% 19 382 3 325
Republic of Moldova 33 700 3,437 0,0% 102 45,0% 17 720 5 150
281
ANNE
XES
REAL GDP GROWTH
RATE
UNEMPLOYMENT RATE
FOREIGN DIRECT INVESTMENT
(NET INFLOWS, BOP, CURRENT USD MILLIONS
GFCF (% OF GDP) INCOME GROUP
HUMAN DEVELOPMENT INDEX (HDI)
HDI CATEGORY
2,3% 8,0% -2 535 23,5% High income: OECD 0,907 Very high
1,9% 4,5% 22 741 23,5% High income: OECD 0,930 Very high
2,9% 6,1% 45 457 16,8% High income: OECD 0,907 Very high
0,5% 7,3% 6 055 19,5% Upper middle income 0,836 Very high
0,1% 6,8% 96 895 20,9% Upper middle income 0,755 High
1,9% 6,4% 22 002 21,4% High income: OECD 0.832 Very high
4,6% 10,1% 16 151 26,0% Upper middle income 0,720 High
3,5% 8,3% 2 578 19,3% Upper middle income 0.766 High
7,3% 14,5% 2 385 21,5% Upper middle income 0,715 High
3,7% 3,8% 773 29,0% Upper middle income 0,732 High
2,0% 6,2% 475 13,6% Lower middle income 0,666 Medium
4,2% 2,8% 1 205 13,5% Lower middle income 0,627 Medium
3,1% 3,9% 1 294 22,0% Lower middle income 0,606 Medium
0,7% 13,7% 595 22,0% Upper middle income 0,719 High
2,2% 4,9% 24 154 21,6% Upper middle income: OECD 0,756 High
4,7% 6,0% 523 16,0% Upper middle income 0,679 Medium
2,4% 3,3% 7 885 26,2% Upper middle income 0,734 High
3,7% 5,9% -13 17,9% High income: non-OECD 0,839 Very high
1,0% 6,8% 48 225 18,2% High income: OECD 0,922 Very high
2,2% 3,5% 10 586 28,4% High income: OECD 0,944 Very high
3,3% 9,0% 17 275 19,7% High income: OECD 0,843 Very high
2,2% 17,5% 1 149 24,8% Upper middle income 0,733 High
3,5% 16,2% 404 21,0% Lower middle income 0,733 High
2,0% 4,9% 4 430 25,8% Upper middle income 0,751 High
4,8% 12,4% 1 647 29,8% Lower middle income 0,754 High
4,4% 5,1% 7 598 24,2% Upper middle income 0,788 High
3,6% 8,2% 211 34,8% Lower middle income 0,655 Medium
4,6% 3,9% 350 26,0% Lower middle income 0,693 Medium
282
Subn
ation
al g
over
nmen
ts a
roun
d th
e wor
ld St
ruct
ure a
nd fi
nanc
e
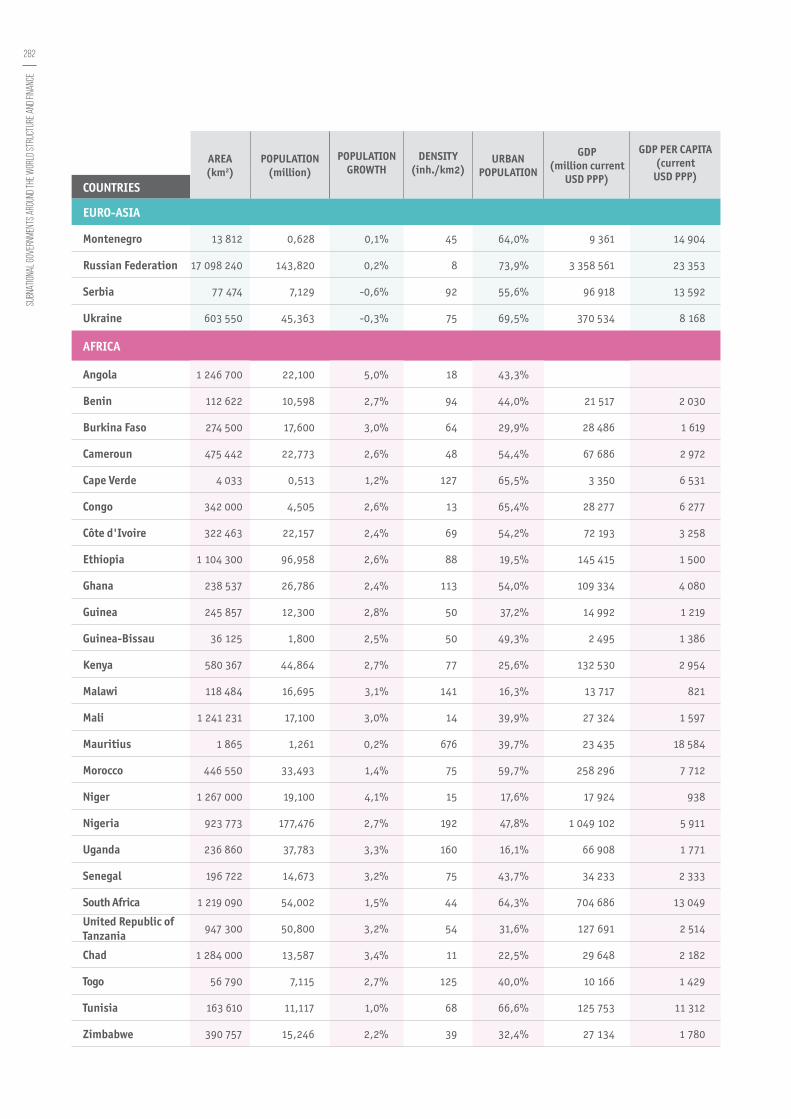
AREA (km2)
POPULATION (million)
POPULATION GROWTH
DENSITY (inh./km2)
URBAN POPULATION
GDP (million current
USD PPP)
GDP PER CAPITA (current USD PPP)
COUNTRIES
EURO-ASIA
Montenegro 13 812 0,628 0,1% 45 64,0% 9 361 14 904
Russian Federation 17 098 240 143,820 0,2% 8 73,9% 3 358 561 23 353
Serbia 77 474 7,129 -0,6% 92 55,6% 96 918 13 592
Ukraine 603 550 45,363 -0,3% 75 69,5% 370 534 8 168
AFRICA
Angola 1 246 700 22,100 5,0% 18 43,3%
Benin 112 622 10,598 2,7% 94 44,0% 21 517 2 030
Burkina Faso 274 500 17,600 3,0% 64 29,9% 28 486 1 619
Cameroun 475 442 22,773 2,6% 48 54,4% 67 686 2 972
Cape Verde 4 033 0,513 1,2% 127 65,5% 3 350 6 531
Congo 342 000 4,505 2,6% 13 65,4% 28 277 6 277
Côte d'Ivoire 322 463 22,157 2,4% 69 54,2% 72 193 3 258
Ethiopia 1 104 300 96,958 2,6% 88 19,5% 145 415 1 500
Ghana 238 537 26,786 2,4% 113 54,0% 109 334 4 080
Guinea 245 857 12,300 2,8% 50 37,2% 14 992 1 219
Guinea-Bissau 36 125 1,800 2,5% 50 49,3% 2 495 1 386
Kenya 580 367 44,864 2,7% 77 25,6% 132 530 2 954
Malawi 118 484 16,695 3,1% 141 16,3% 13 717 821
Mali 1 241 231 17,100 3,0% 14 39,9% 27 324 1 597
Mauritius 1 865 1,261 0,2% 676 39,7% 23 435 18 584
Morocco 446 550 33,493 1,4% 75 59,7% 258 296 7 712
Niger 1 267 000 19,100 4,1% 15 17,6% 17 924 938
Nigeria 923 773 177,476 2,7% 192 47,8% 1 049 102 5 911
Uganda 236 860 37,783 3,3% 160 16,1% 66 908 1 771
Senegal 196 722 14,673 3,2% 75 43,7% 34 233 2 333
South Africa 1 219 090 54,002 1,5% 44 64,3% 704 686 13 049
United Republic of Tanzania 947 300 50,800 3,2% 54 31,6% 127 691 2 514
Chad 1 284 000 13,587 3,4% 11 22,5% 29 648 2 182
Togo 56 790 7,115 2,7% 125 40,0% 10 166 1 429
Tunisia 163 610 11,117 1,0% 68 66,6% 125 753 11 312
Zimbabwe 390 757 15,246 2,2% 39 32,4% 27 134 1 780

283
ANNE
XES
REAL GDP GROWTH
RATE
UNEMPLOYMENT RATE
FOREIGN DIRECT INVESTMENT
(NET INFLOWS, BOP, CURRENT USD MILLIONS
GFCF (% OF GDP) INCOME GROUP
HUMAN DEVELOPMENT INDEX (HDI)
HDI CATEGORY
1,8% 18,0% 497 20,0% Upper middle income 0,802 Very high
0,6% 5,1% 22 891 20,3% Upper middle income 0,798 High
-1,8% 18,9% 2 000 15,6% Upper middle income 0,771 High
-6,8% 9,3% 847 14,1% Lower middle income 0,747 High
3,9% 7,6% 1 922 24,0% Upper middle income 0,526 Low
6,5% 1,1% 377 25,0% Low income 0,480 Low
4,0% 3,0% 342 31,0% Low income 0,402 Low
5,9% 4,4% 501 20,7% Lower middle income 0,512 Low
2,8% 10,7% 132 34,1% Lower middle income 0,646 Medium
6,8% 10,3% 5 502 41,3% Lower middle income 0,591 Medium
8,6% 9,4% 462 17,0% Lower middle income 0,462 Low
10,3% 5,3% 1 200 38,0% Low income 0,442 Low
4,0% 5,9% 3 363 27,1% Lower middle income 0,579 Medium
0,4% 1,7% 566 14,0% Low income 0,411 Low
2,5% 7,6% 21 7,0% Low income 0,420 Low
5,3% 9,2% 944 21,4% Lower middle income 0,548 Low
5,7% 6,6% 716 15,4% Low income 0,445 Low
7,2% 8,2% 199 34,1% Low income 0,419 Low
3,6% 7,7% 418 23,0% Upper middle income 0,777 High
2,4% 9,9% 3 582 32,0% Lower middle income 0,628 Medium
7,0% 2,7% 769 40,2% Low income 0,348 Low
6,3% 4,8% 4 656 15,8% Lower middle income 0,514 Low
5,0% 3,8% 1 147 27,5% Low income 0,483 Low
4,7% 9,7% 343 26,0% Low income 0,466 Low
1,5% 24,9% 5 741 20,4% Upper middle income 0,666 Medium
7,0% 3,1% 2 045 31,0% Low income 0,488 Low
7,3% 5,6% 761 33,8% Low income 0,392 Low
5,7% 7,7% 292 21,3% Low income 0,484 Low
2,7% 15,3% 1 005 21,9% Lower middle income 0,721 High
3,8% 11,3% 545 13,2% Low income 0,509 Low

284
Subn
ation
al g
over
nmen
ts a
roun
d th
e wor
ld St
ruct
ure a
nd fi
nanc
e
AREA (km2)
POPULATION (million)
POPULATION GROWTH
DENSITY (inh./km2)
URBAN POPULATION
GDP (million current
USD PPP)
GDP PER CAPITA (current USD PPP)
COUNTRIES
ASIA-PACIFIC
Australia 7 703 354 23,663 1,6% 3 89,3% 1 077 878 45 550
Cambodia 181 035 15,238 1,6% 85 20,7% 50 010 3 282
China 9 596 961 1 401,587 0,5% 146 55,6% 18 017 073 12 855
India 3 287 263 1 295,291 1,3% 394 32,7% 7 384 099 5 701
Indonesia 1 910 930 254,454 1,3% 133 53,0% 2 676 109 10 517
Japan 373 530 127,120 -0,2% 340 93,0% 4 655 494 36 623
Korea 99 461 50,424 0,5% 507 82,4% 1 683 898 33 395
Malaysia 330 800 29,900 1,6% 90 74,7% 766 645 25 639
Mongolia 1 564 120 2,923 1,5% 2 72,0% 34 760 11 892
New Zealand 264 944 4,534 1,0% 17 86,3% 169 921 37 477
Philippines 300 000 99,139 1,6% 339 44,4% 690 894 6 969
Thailand 513 120 67,723 0,4% 132 50,4% 964 518 14 242
Vietnam 331 041 90,729 1,1% 274 33,6% 510 714 5 629
NORTH AMERICA
Canada 9 984 670 35,544 1,1% 4 81,6% 1 601 800 45 066
United States 9 161 923 319,173 0,7% 35 81,4% 17 419 000 54 575
285
ANNE
XES
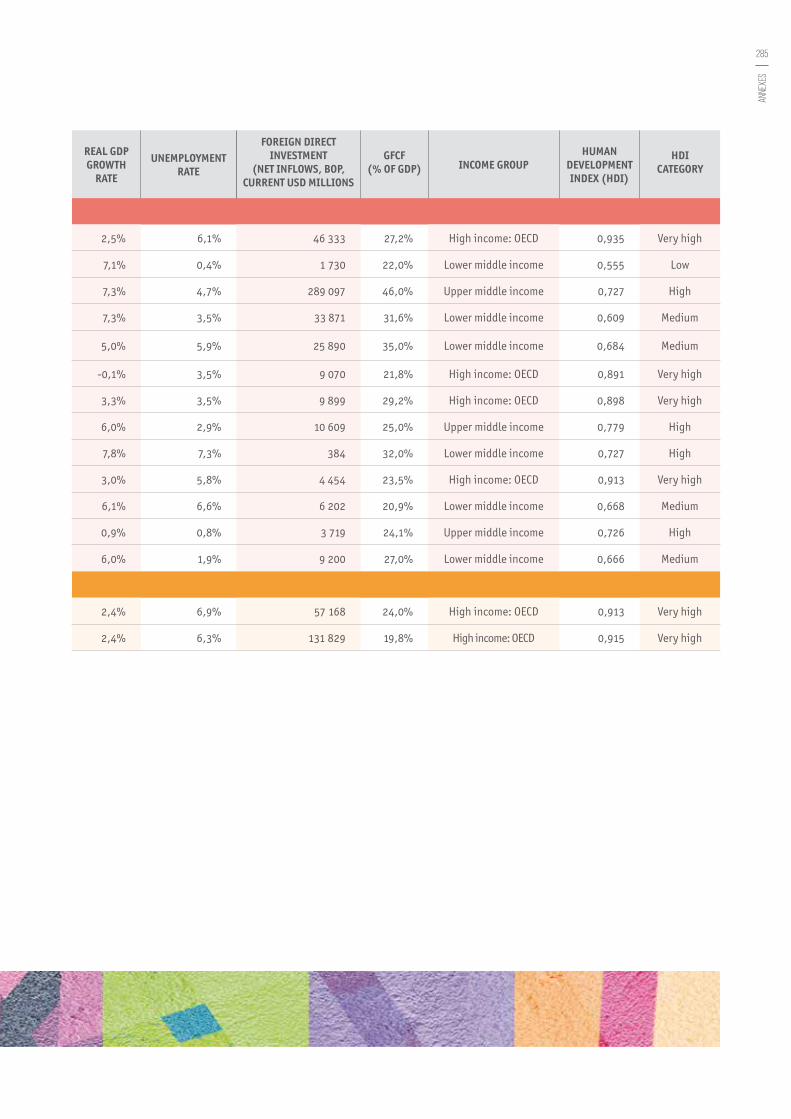
REAL GDP GROWTH
RATE
UNEMPLOYMENT RATE
FOREIGN DIRECT INVESTMENT
(NET INFLOWS, BOP, CURRENT USD MILLIONS
GFCF (% OF GDP) INCOME GROUP
HUMAN DEVELOPMENT INDEX (HDI)
HDI CATEGORY
2,5% 6,1% 46 333 27,2% High income: OECD 0,935 Very high
7,1% 0,4% 1 730 22,0% Lower middle income 0,555 Low
7,3% 4,7% 289 097 46,0% Upper middle income 0,727 High
7,3% 3,5% 33 871 31,6% Lower middle income 0,609 Medium
5,0% 5,9% 25 890 35,0% Lower middle income 0,684 Medium
-0,1% 3,5% 9 070 21,8% High income: OECD 0,891 Very high
3,3% 3,5% 9 899 29,2% High income: OECD 0,898 Very high
6,0% 2,9% 10 609 25,0% Upper middle income 0,779 High
7,8% 7,3% 384 32,0% Lower middle income 0,727 High
3,0% 5,8% 4 454 23,5% High income: OECD 0,913 Very high
6,1% 6,6% 6 202 20,9% Lower middle income 0,668 Medium
0,9% 0,8% 3 719 24,1% Upper middle income 0,726 High
6,0% 1,9% 9 200 27,0% Lower middle income 0,666 Medium
2,4% 6,9% 57 168 24,0% High income: OECD 0,913 Very high
2,4% 6,3% 131 829 19,8% High income: OECD 0,915 Very high
286
Subn
ation
al g
over
nmen
ts a
roun
d th
e wor
ld St
ruct
ure a
nd fi
nanc
e
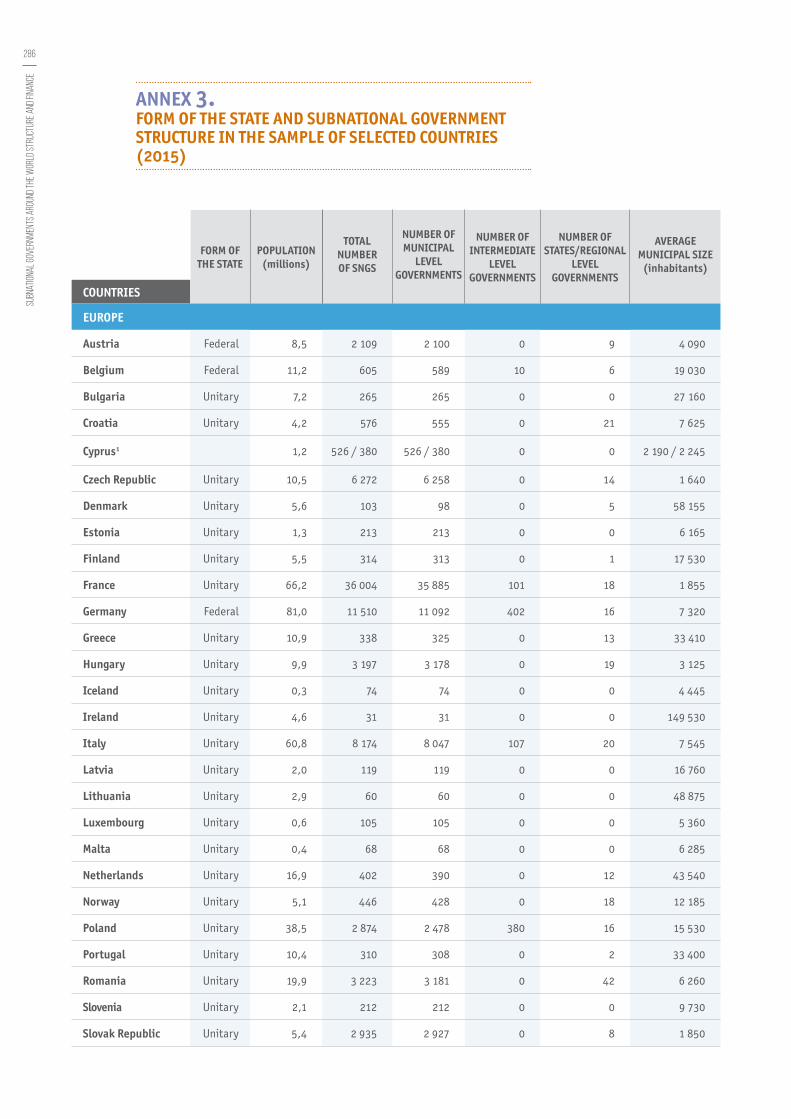
ANNEX 3. FORM OF THE STATE AND SUBNATIONAL GOVERNMENT STRUCTURE IN THE SAMPLE OF SELECTED COUNTRIES (2015)
FORM OF THE STATE
POPULATION (millions)
TOTAL NUMBER OF SNGS
NUMBER OF MUNICIPAL
LEVEL GOVERNMENTS
NUMBER OF INTERMEDIATE
LEVEL GOVERNMENTS
NUMBER OF STATES/REGIONAL
LEVEL GOVERNMENTS
AVERAGE MUNICIPAL SIZE
(inhabitants)
COUNTRIES
EUROPE
Austria Federal 8,5 2 109 2 100 0 9 4 090
Belgium Federal 11,2 605 589 10 6 19 030
Bulgaria Unitary 7,2 265 265 0 0 27 160
Croatia Unitary 4,2 576 555 0 21 7 625
Cyprus1 1,2 526 / 380 526 / 380 0 0 2 190 / 2 245
Czech Republic Unitary 10,5 6 272 6 258 0 14 1 640
Denmark Unitary 5,6 103 98 0 5 58 155
Estonia Unitary 1,3 213 213 0 0 6 165
Finland Unitary 5,5 314 313 0 1 17 530
France Unitary 66,2 36 004 35 885 101 18 1 855
Germany Federal 81,0 11 510 11 092 402 16 7 320
Greece Unitary 10,9 338 325 0 13 33 410
Hungary Unitary 9,9 3 197 3 178 0 19 3 125
Iceland Unitary 0,3 74 74 0 0 4 445
Ireland Unitary 4,6 31 31 0 0 149 530
Italy Unitary 60,8 8 174 8 047 107 20 7 545
Latvia Unitary 2,0 119 119 0 0 16 760
Lithuania Unitary 2,9 60 60 0 0 48 875
Luxembourg Unitary 0,6 105 105 0 0 5 360
Malta Unitary 0,4 68 68 0 0 6 285
Netherlands Unitary 16,9 402 390 0 12 43 540
Norway Unitary 5,1 446 428 0 18 12 185
Poland Unitary 38,5 2 874 2 478 380 16 15 530
Portugal Unitary 10,4 310 308 0 2 33 400
Romania Unitary 19,9 3 223 3 181 0 42 6 260
Slovenia Unitary 2,1 212 212 0 0 9 730
Slovak Republic Unitary 5,4 2 935 2 927 0 8 1 850

287
ANNE
XES
FORM OF THE STATE
POPULATION (millions)
TOTAL NUMBER OF SNGS
NUMBER OF MUNICIPAL
LEVEL GOVERNMENTS
NUMBER OF INTERMEDIATE
LEVEL GOVERNMENTS
NUMBER OF STATES/REGIONAL
LEVEL GOVERNMENTS
AVERAGE MUNICIPAL SIZE
(inhabitants)
COUNTRIES
EUROPE
Spain Quasi-federal 46,5 8 186 8 119 50 17 5 605
Sweden Unitary 9,7 311 290 0 21 33 890
Switzerland Federal 8,2 2 320 2 294 0 26 3 590
United Kingdom Unitary 64,6 419 389 27 3 166 060
LATIN AMERICA
Argentina Federal 43,0 2 242 2 218 0 24 19 378
Brazil Federal 202,8 5 597 5 570 0 27 36 400
Chile Unitary 17,8 360 345 0 15 51 650
Colombia Unitary 47,8 1 134 1 101 0 33 43 370
Costa Rica Unitary 4,8 81 81 0 0 58 735
Dominican Republic Unitary 10,4 191 159 0 32 65 440
Ecuador Unitary 16,3 243 221 0 22 73 756
El Salvador Unitary 6,4 262 262 0 0 24 527
Guatemala Unitary 16,0 334 334 0 0 47 964
Honduras Unitary 8,0 298 298 0 0 26 718
Jamaica Unitary 2,7 14 14 0 0 194 357
Mexico Federal 119,7 2 489 2 457 0 32 45 740
Paraguay Unitary 6,6 255 238 0 17 27 533
Peru Unitary 31,0 1 891 1 866 0 25 18 535
MIDDLE EAST & WEST ASIA
Israel Unitary 8,2 255 255 0 0 33 190
Jordan Unitary 7,7 94 94 0 0 81 808
Palestine Unitary 4,3 483 483 0 0
Turkey Unitary 76,6 1 478 1 397 0 81 53 940
EURO-ASIA
Albania Unitary 3,2 73 61 0 12 52 459
Armenia Unitary 3,0 915 915 0 0 3 266

288
Subn
ation
al g
over
nmen
ts a
roun
d th
e wor
ld St
ruct
ure a
nd fi
nanc
e
FORM OF THE STATE
POPULATION (millions)
TOTAL NUMBER OF SNGS
NUMBER OF MUNICIPAL
LEVEL GOVERNMENTS
NUMBER OF INTERMEDIATE
LEVEL GOVERNMENTS
NUMBER OF STATES/REGIONAL
LEVEL GOVERNMENTS
AVERAGE MUNICIPAL SIZE
(inhabitants)
COUNTRIES
EURO-ASIA
Albania Unitary 3,2 73 61 0 12 52 459
Armenia Unitary 3,0 915 915 0 0 3 266
Azerbaijan Unitary 9,5 1 698 1 607 90 1 5 933
Georgia Unitary 4,3 78 76 0 2 56 644
Kazakhstan Unitary 16,6 2 676 2 445 215 16
Kyrgyzstan Unitary 5,8 531 459 63 9
Republic of Moldova Unitary 3,4 1 714 1 679 0 35 2 047
Montenegro Unitary 0,6 23 23 0 0 26 087
Russian Federation Federal 143,8 22 489 20 055 2 351 83
Serbia Unitary 7,1 176 174 0 2 40 805
Ukraine Unitary 45,4 11 418 10 670 721 27 -
AFRICA
Angola Unitary 22,1 180 162 0 18
Benin Unitary 10,6 77 77 0 0
Burkina Faso Unitary 17,6 381 368 0 13 47 826
Cameroun Unitary 22,8 370 360 0 10 63 250
Cabo Verde Unitary 0,5 22 22 0 0
Congo Unitary 4,5 106 94 0 12 51 193
Côte d'Ivoire Unitary 22,2 230 197 0 33 112 473
Ethiopia Federal 97,0 781 770 0 11 125 919
Ghana Unitary 26,8 226 216 0 10 124 009
Guinea Unitary 12,3 38 38 0 0
Guinea-Bissau Unitary 1,8 36 36 0 0
Kenya Unitary 44,9 47 47 0 0
Malawi Unitary 16,7 35 35 0 0 477 000
Mali Unitary 17,1 761 703 49 9 24 324
Mauritius Unitary 1,3 143 130 12 1 10 000
Morocco Unitary 33,5
Niger Unitary 19,1 273 265 0 8 72 075
Nigeria Federal 177,5 811 774 0 37

289
ANNE
XES
FORM OF THE STATE
POPULATION (millions)
TOTAL NUMBER OF SNGS
NUMBER OF MUNICIPAL
LEVEL GOVERNMENTS
NUMBER OF INTERMEDIATE
LEVEL GOVERNMENTS
NUMBER OF STATES/REGIONAL
LEVEL GOVERNMENTS
AVERAGE MUNICIPAL SIZE
(inhabitants)
COUNTRIES
AFRICA
Uganda Unitary 37,8 308 196 0 112 192 700
Senegal Unitary 14,7 609 550 45 14 26 677
South Africa Quasi-federal
54,0 287 278 0 9
United Republic of Tanzania Unitary 50,8 160 160 0 0 317 500
Chad Unitary 13,6 432 348 61 23
Togo Unitary 7,1 390 354 30 6 20 099
Tunisia Unitary 11,1 288 264 0 24 42 110
Zimbabwe Unitary 15,2 96 86 0 10
ASIA-PACIFIC
Australia Federal 23,7 579 571 8 41 005
Cambodia Unitary 15,2 1 830 1 621 185 24 9 383
China Unitary 1 401,6 3 217 2 852 334 31
India Federal 1 295,3 250 706 250 671 0 35 5 167
Indonesia Unitary 254,5 542 508 0 34 500 894
Japan Unitary 127,1 1 788 1 741 0 47 72 715
Korea Unitary 50,4 245 228 0 17 224 440
Malaysia Federal 29,9 162 149 0 13 200 671
Mongolia Unitary 2,9 2 105 1 744 339 22 1 676
New Zealand Unitary 4,5 78 67 0 11 68 590
Philippines Unitary 99,1 43 703 42 028 1 594 81 2 359
Thailand Unitary 67,7 2 517 2 232 209 76 30 341
Vietnam Unitary 90,7 11 909 11 145 700 64 8 379
NORTH AMERICA
Canada Federal 35,5 3 818 3 805 0 13 8 205
United States Federal 319,2 38 960 35 879 3 031 50 8 990
1. The first figure refers to the whole island, while the second does not include the northern part of the island of Cyprus.

290
Subn
ation
al g
over
nmen
ts a
roun
d th
e wor
ld St
ruct
ure a
nd fi
nanc
e
ANNEX 4. DETAILED STRUCTURE OF THE CLASSIFICATIONS OF THE FUNCTIONS OF GOVERNMENT (COFOG)
01 GENERAL PUBLIC SERVICE
01.1 Executive and Legislative Organs, Financial and Fiscal Affairs, External Affairs
01.2 Foreign Economic Aid01.3 General Services01.4 Basic Research01.5 R&D General Public Services01.6 General Public Services N.E.C.01.7 Public Debt Transactions01.8 Transfers of a General Character between Different
Levels of Government
02 DEFENCE
02.1 Military Defence02.2 Civil Defence02.3 Foreign Military Aid02.4 R&D Defence02.5 Defence N.E.C.
03 PUBLIC ORDER AND SAFETY
03.1 Police Services03.2 Fire-Protection Services03.3 Law Courts03.4 Prisons03.5 R&D Public Order and Safety03.6 Public Order and Safety N.E.C.
04 ECONOMIC AFFAIRS
04.1 General Economic, Commercial and Labour Affairs04.2 Agriculture, Forestry, Fishing and Hunting04.3 Fuel and Energy04.4 Mining, Manufacturing and Construction04.5 Transport04.6 Communication04.7 Other Industries04.8 R&D Economic Affairs04.9 Economic Affairs N.E.C.
05 ENVIRONMENTAL PROTECTION
05.1 Waste Management05.2 Waste Water Management05.3 Pollution Abatement05.4 Protection of Biodiversity and Landscape05.5 R&D Environmental Protection05.6 Environmental Protection N.E.C.
06 HOUSING AND COMMUNITY AMENITIES
06.1 Housing Development06.2 Community Development06.3 Water Supply06.4 Street Lighting06.5 R&D Housing and Community Amenities06.6 Housing and Community Amenities N.E.C
07 HEALTH
07.1 Medical Products, Appliances and Equipment07.2 Outpatient Services07.3 Hospital Services07.4 Public Health Services07.5 R&D Health07.6 Health N.E.C.
08 RECREATION, CULTURE AND RELIGION
08.1 Recreational and Sporting Services08.2 Cultural Services08.3 Broadcasting and Publishing Services08.4 Religious and Other Community Services08.5 R&D Recreation, Culture and Religion08.6 Recreation, Culture and Religion N.E.C.
09 EDUCATION
09.1 Pre-Primary and Primary Education09.2 Secondary Education09.3 Post-Secondary Non-Tertiary Education09.4 Tertiary Education09.5 Education Not Definable By Level09.6 Subsidiary Services to Education09.7 R&D Education09.8 Education N.E.C.
10 SOCIAL PROTECTION
10.1 Sickness and Disability10.2 Old Age10.3 Survivors10.4 Family and Children10.5 Unemployment10.6 Housing10.7 Social Exclusion N.E.C.10.8 R&D Social Protection10.9 Social Protection N.E.C

291
ANNE
XES
ANNEX 5. DETAILED STATISTICS BY COUNTRY
1. SNG expenditure as a percentage of GDP and of public spending by country
Figure A1. SNG expenditure as a % of GDP (2013)
292
Subn
ation
al g
over
nmen
ts a
roun
d th
e wor
ld St
ruct
ure a
nd fi
nanc
e
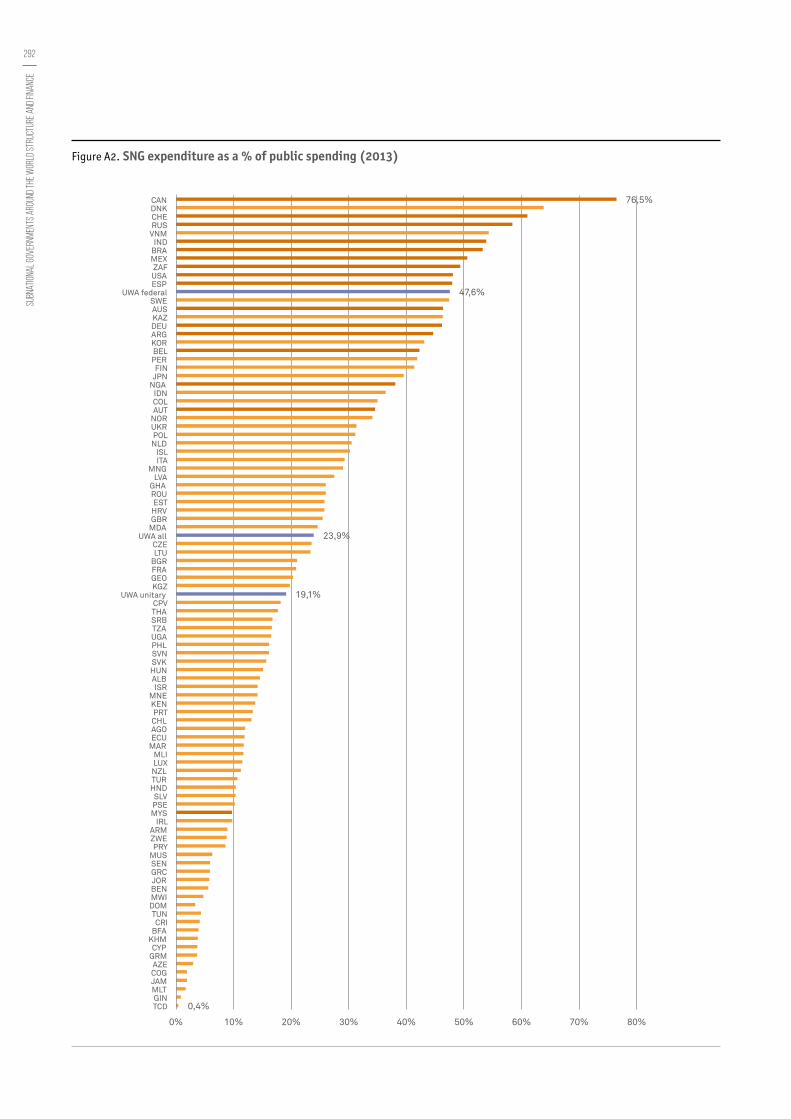
Figure A2. SNG expenditure as a % of public spending (2013)

293
ANNE
XES
2. SNG expenditure by COFOG as a % of GDP by country
Figure A3. SNG expenditure dedicated to education (% of GDP, 2013)
Figure A5. SNG expenditure dedicated to general public services (% of GDP, 2013)
Figure A4. SNG expenditure dedicated to social protection (% of GDP, 2013)
Figure A6. SNG expenditure dedicated to health (% of GDP, 2013)

294
Subn
ation
al g
over
nmen
ts a
roun
d th
e wor
ld St
ruct
ure a
nd fi
nanc
e
Figure A7. SNG expenditure dedicated to economic affairs and transport (% of GDP, 2013)
Figure A9. SNG expenditure dedicated to recreation, culture and religion (% of GDP, 2013)
Figure A8. SNG expenditure dedicated to housing and community amenities (% of GDP, 2013)
Figure A10. SNG expenditure dedicated to environmental protection (% of GDP, 2013)

295
ANNE
XES
3. SNG expenditure by COFOG as a percentage of SNG expenditure by country
Figure A11. Share of SNG expenditure dedicated to education in SNG expenditure (%, 2013)
Figure A13. Share of SNG expenditure dedicated to economic affairs and transport in SNG expenditure (%, 2013)
Figure A12. Share of SNG expenditure dedicated to general public services in SNG expenditure (%, 2013)
Figure A14. Share of SNG expenditure dedicated to social protection in SNG expenditure (%, 2013)
296
Subn
ation
al g
over
nmen
ts a
roun
d th
e wor
ld St
ruct
ure a
nd fi
nanc
e
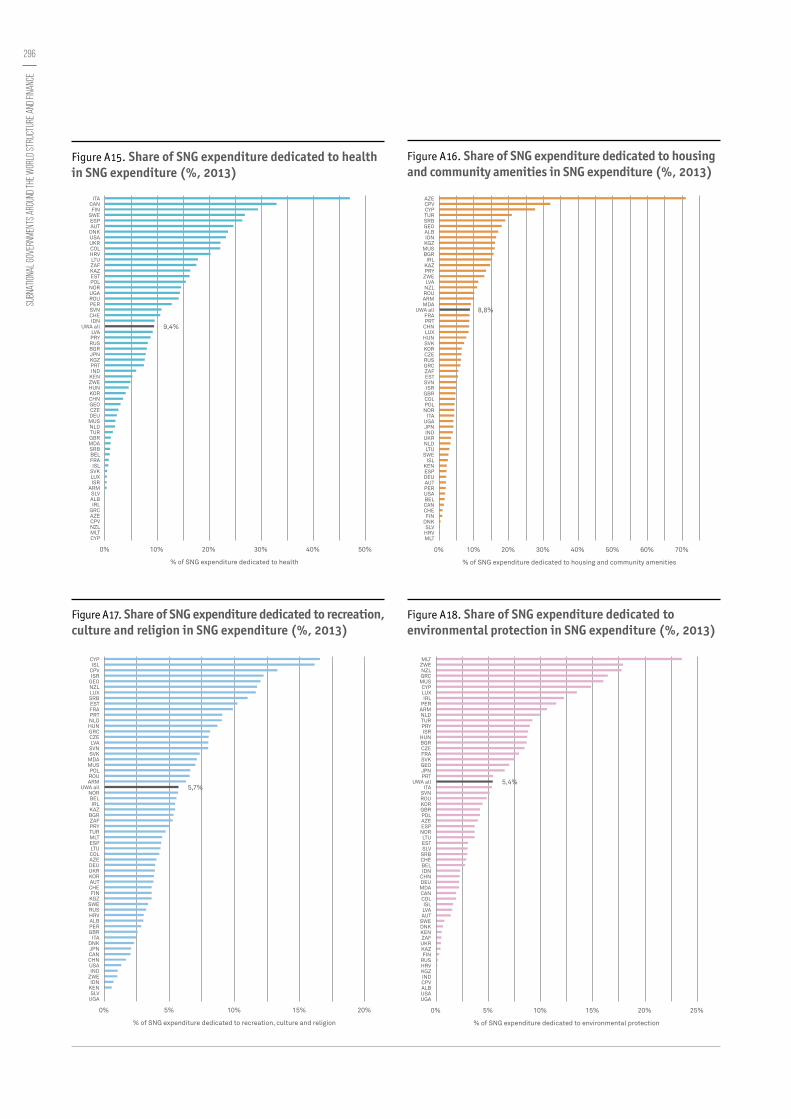
Figure A15. Share of SNG expenditure dedicated to health in SNG expenditure (%, 2013)
Figure A17. Share of SNG expenditure dedicated to recreation, culture and religion in SNG expenditure (%, 2013)
Figure A16. Share of SNG expenditure dedicated to housing and community amenities in SNG expenditure (%, 2013)
Figure A18. Share of SNG expenditure dedicated to environmental protection in SNG expenditure (%, 2013)

297
ANNE
XES
4. SNG staff expenditure as a % of public staff expenditure and of GDP by country
Figure A19. SNG staff expenditure as a % of GDP (2013)
298
Subn
ation
al g
over
nmen
ts a
roun
d th
e wor
ld St
ruct
ure a
nd fi
nanc
e
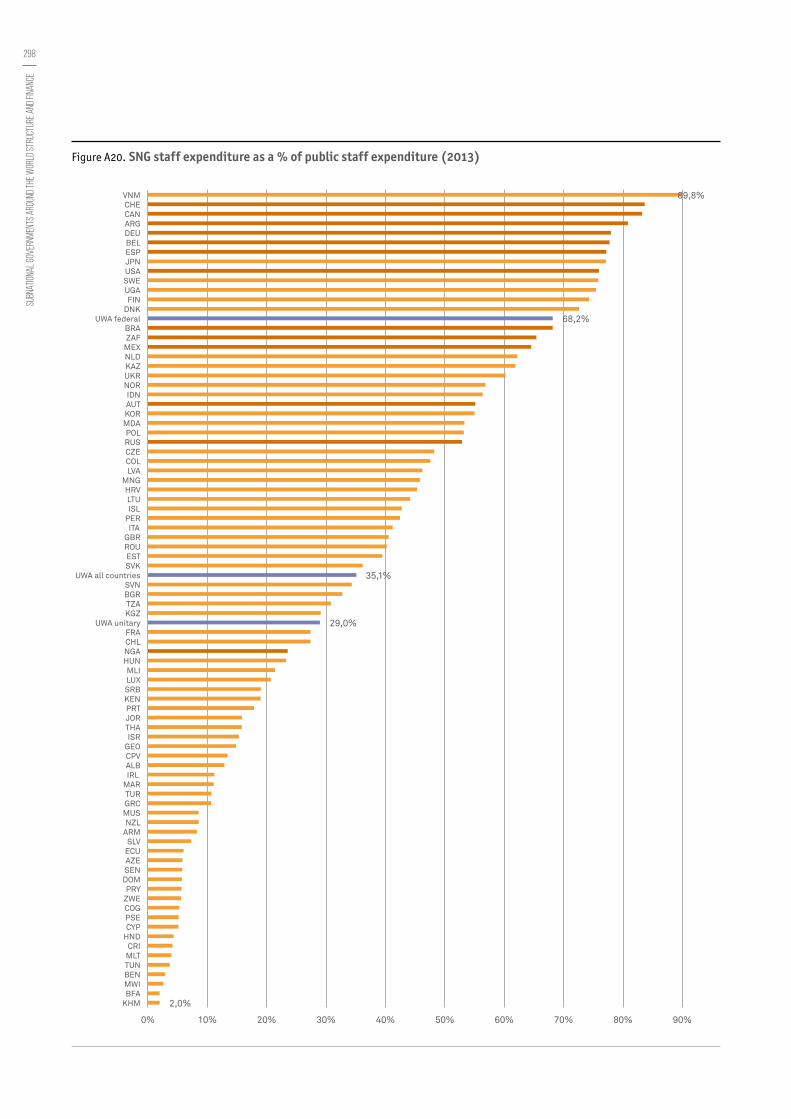
Figure A20. SNG staff expenditure as a % of public staff expenditure (2013)

299
ANNE
XES
5. SNG investment as a % of GDP and of public investment by country
Figure A21. SNG investment as a % of GDP (2013)
300
Subn
ation
al g
over
nmen
ts a
roun
d th
e wor
ld St
ruct
ure a
nd fi
nanc
e
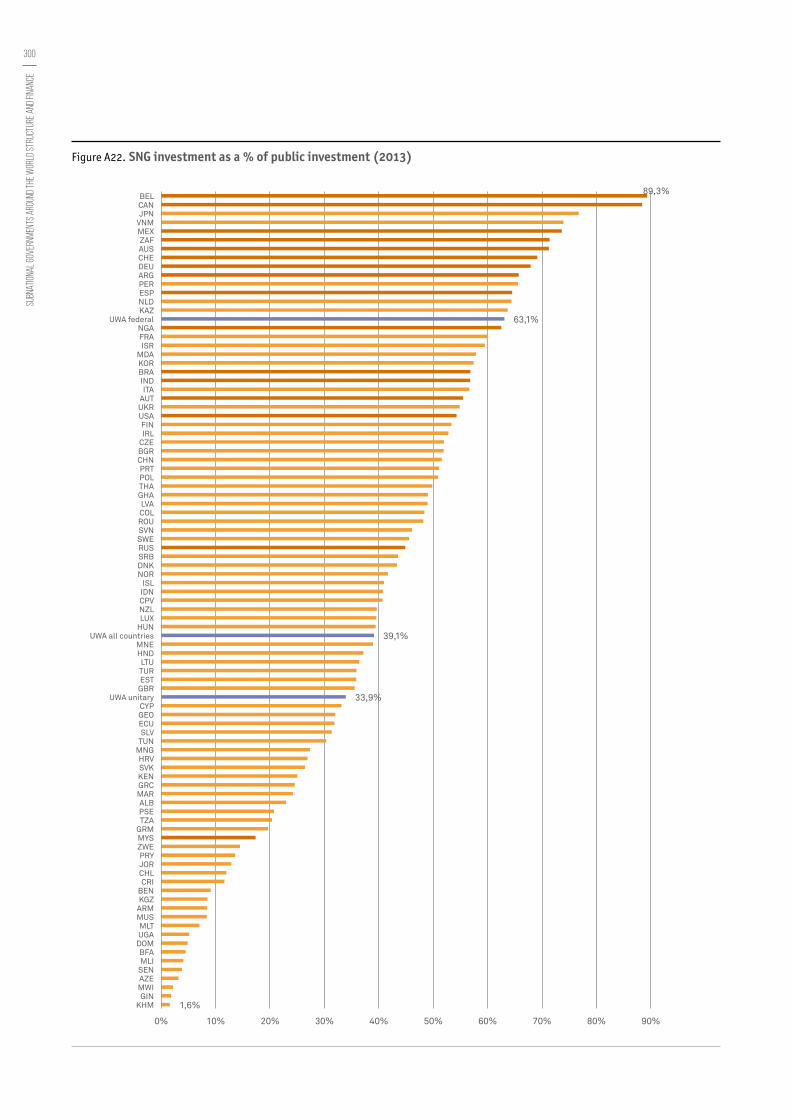
Figure A22. SNG investment as a % of public investment (2013)
301
ANNE
XES
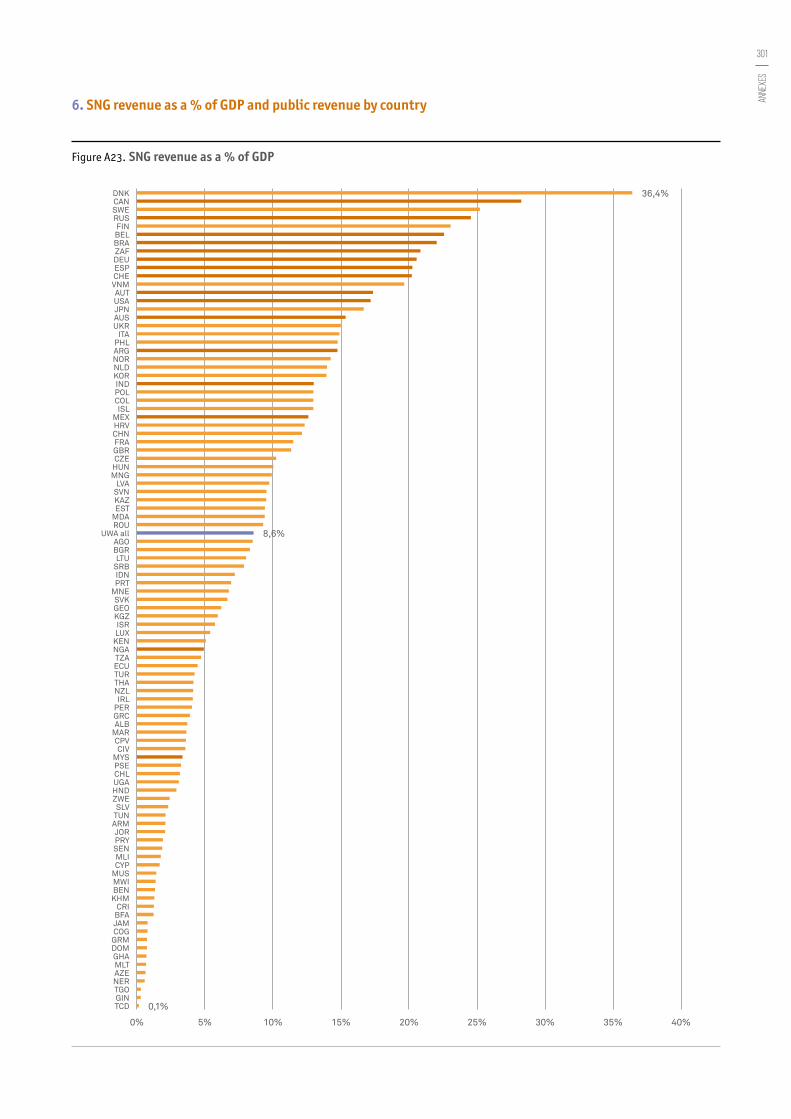
6. SNG revenue as a % of GDP and public revenue by country
Figure A23. SNG revenue as a % of GDP

302
Subn
ation
al g
over
nmen
ts a
roun
d th
e wor
ld St
ruct
ure a
nd fi
nanc
e
Figure A24. SNG revenue as a % of public revenue

303
ANNE
XES
7. SNG grants as a % of GDP and of SNG revenue by country
Figure A25. SNG grants and subsidies as a % of GDP (2013)

304
Subn
ation
al g
over
nmen
ts a
roun
d th
e wor
ld St
ruct
ure a
nd fi
nanc
e
Figure A26. SNG grants and subsidies as a SNG revenue (2013)

305
ANNE
XES
8. SNG “other revenues” as a % of GDP and of SNG revenue by country
Figure A27. SNG “other revenues” as a % of GDP (2013)
306
Subn
ation
al g
over
nmen
ts a
roun
d th
e wor
ld St
ruct
ure a
nd fi
nanc
e
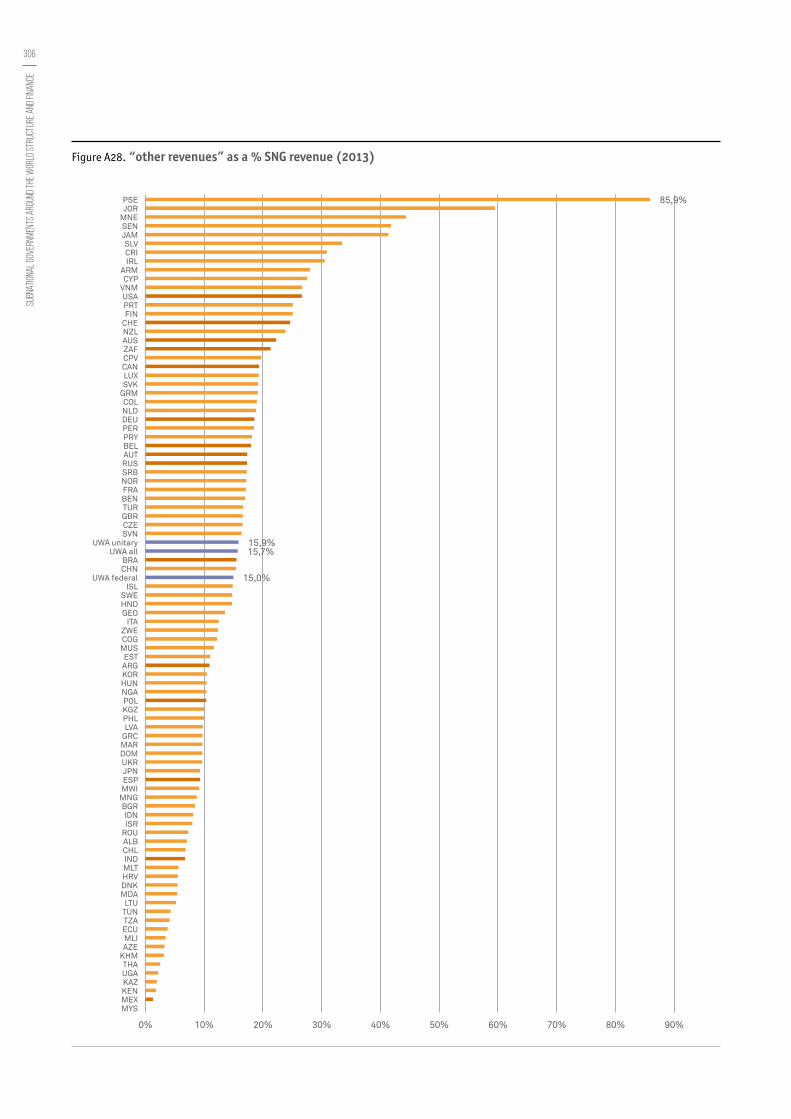
Figure A28. “other revenues” as a % SNG revenue (2013)

307
ANNE
XES
9. SNG Tax revenue as a % of GDP and of SNG revenue by country
Figure A29. Tax revenue as a % of GDP (2013)
308
Subn
ation
al g
over
nmen
ts a
roun
d th
e wor
ld St
ruct
ure a
nd fi
nanc
e
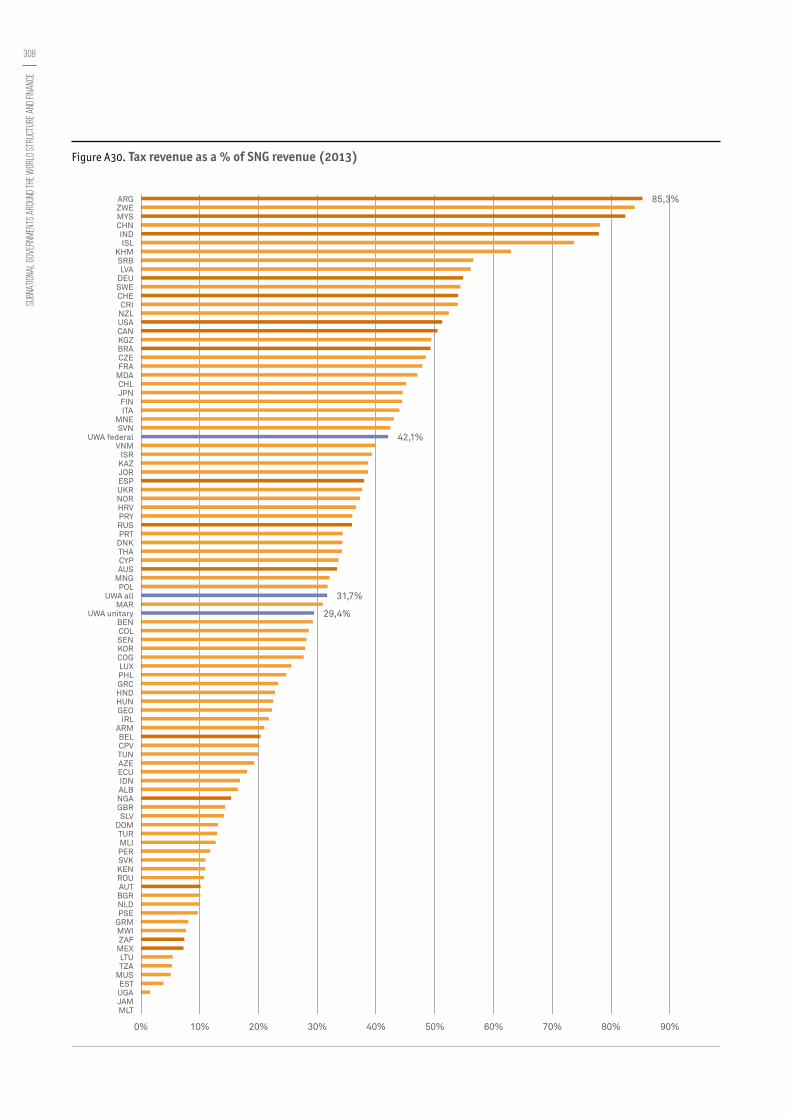
Figure A30. Tax revenue as a % of SNG revenue (2013)
309
ANNE
XES
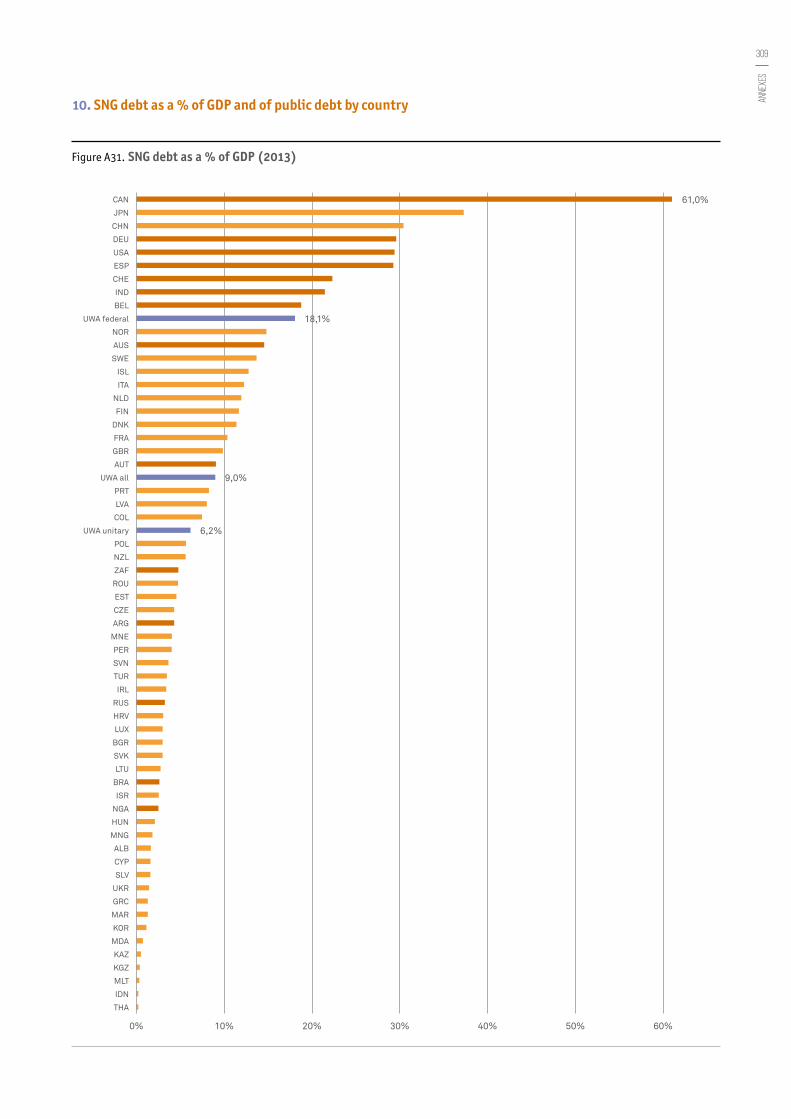
10. SNG debt as a % of GDP and of public debt by country
Figure A31. SNG debt as a % of GDP (2013)
310
Subn
ation
al g
over
nmen
ts a
roun
d th
e wor
ld St
ruct
ure a
nd fi
nanc
e
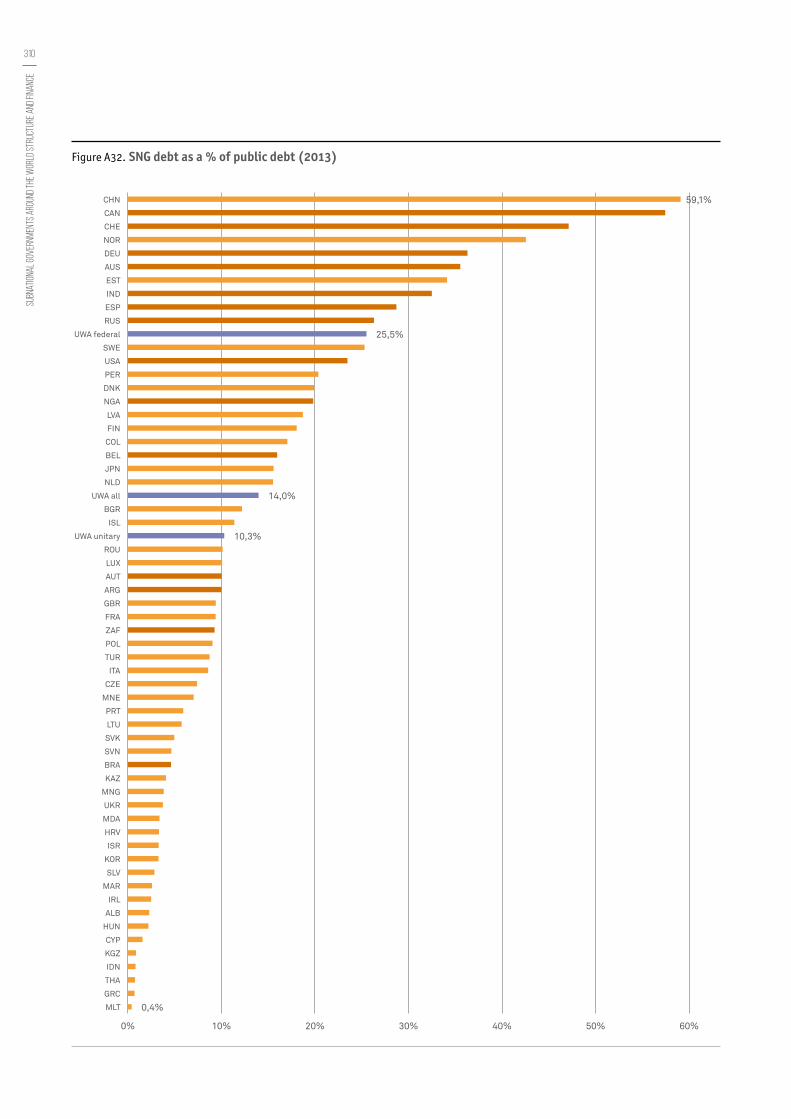
Figure A32. SNG debt as a % of public debt (2013)

www.uclg-localfinance.org
PARTNERS
UNITED CITIES AND LOCAL GOVERNMENTSCarrer Avinyó, 1508002 Barcelona, Spain+34-933-428-767