Embed Size (px)
Citation preview
Annex F
Metro North EIS
Information supporting the surface water chapters
- Results of chemical water sampling of surface water bodies - Emission limit values for surface water discharges - Relevant surface water legislation

1 Information that supports surface water chapters
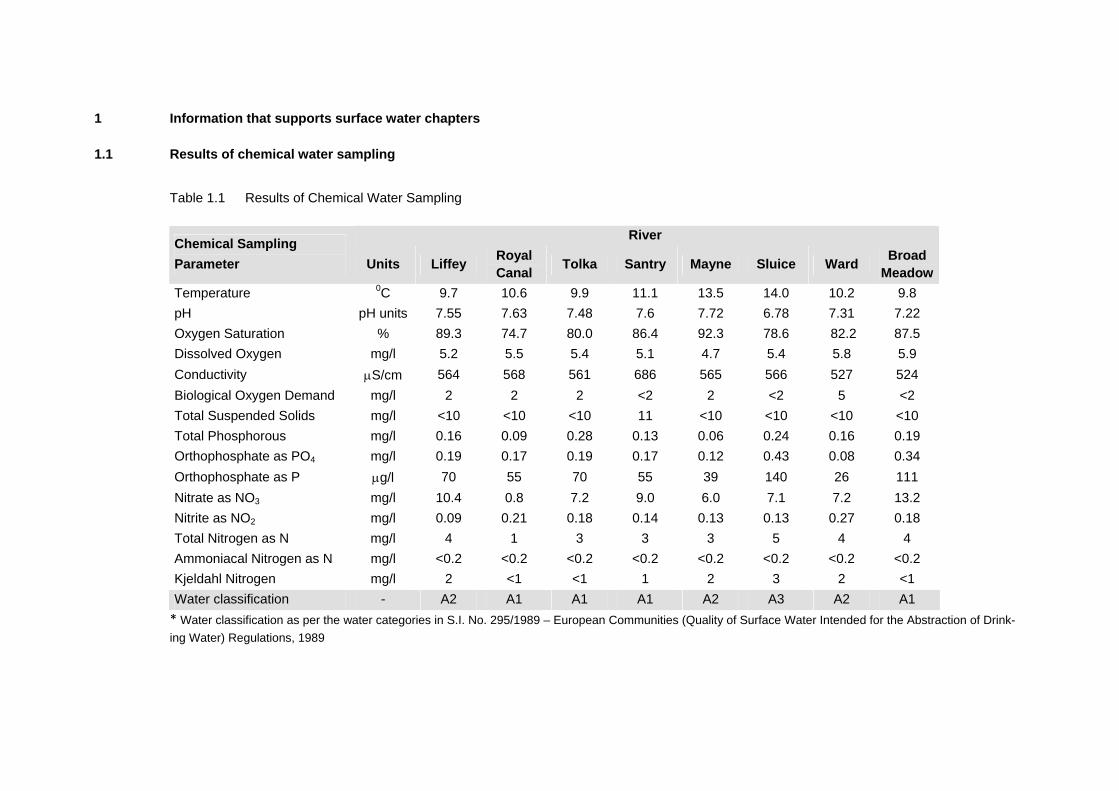
1.1 Results of chemical water sampling
Table 1.1 Results of Chemical Water Sampling
River Chemical Sampling Parameter Units Liffey Royal
Canal Tolka Santry Mayne Sluice Ward Broad Meadow
Temperature 0C 9.7 10.6 9.9 11.1 13.5 14.0 10.2 9.8
pH pH units 7.55 7.63 7.48 7.6 7.72 6.78 7.31 7.22 Oxygen Saturation % 89.3 74.7 80.0 86.4 92.3 78.6 82.2 87.5 Dissolved Oxygen mg/l 5.2 5.5 5.4 5.1 4.7 5.4 5.8 5.9 Conductivity µS/cm 564 568 561 686 565 566 527 524
Biological Oxygen Demand mg/l 2 2 2 <2 2 <2 5 <2 Total Suspended Solids mg/l <10 <10 <10 11 <10 <10 <10 <10 Total Phosphorous mg/l 0.16 0.09 0.28 0.13 0.06 0.24 0.16 0.19 Orthophosphate as PO4 mg/l 0.19 0.17 0.19 0.17 0.12 0.43 0.08 0.34 Orthophosphate as P µg/l 70 55 70 55 39 140 26 111 Nitrate as NO3 mg/l 10.4 0.8 7.2 9.0 6.0 7.1 7.2 13.2 Nitrite as NO2 mg/l 0.09 0.21 0.18 0.14 0.13 0.13 0.27 0.18 Total Nitrogen as N mg/l 4 1 3 3 3 5 4 4 Ammoniacal Nitrogen as N mg/l <0.2 <0.2 <0.2 <0.2 <0.2 <0.2 <0.2 <0.2 Kjeldahl Nitrogen mg/l 2 <1 <1 1 2 3 2 <1 Water classification - A2 A1 A1 A1 A2 A3 A2 A1 * Water classification as per the water categories in S.I. No. 295/1989 – European Communities (Quality of Surface Water Intended for the Abstraction of Drink-ing Water) Regulations, 1989
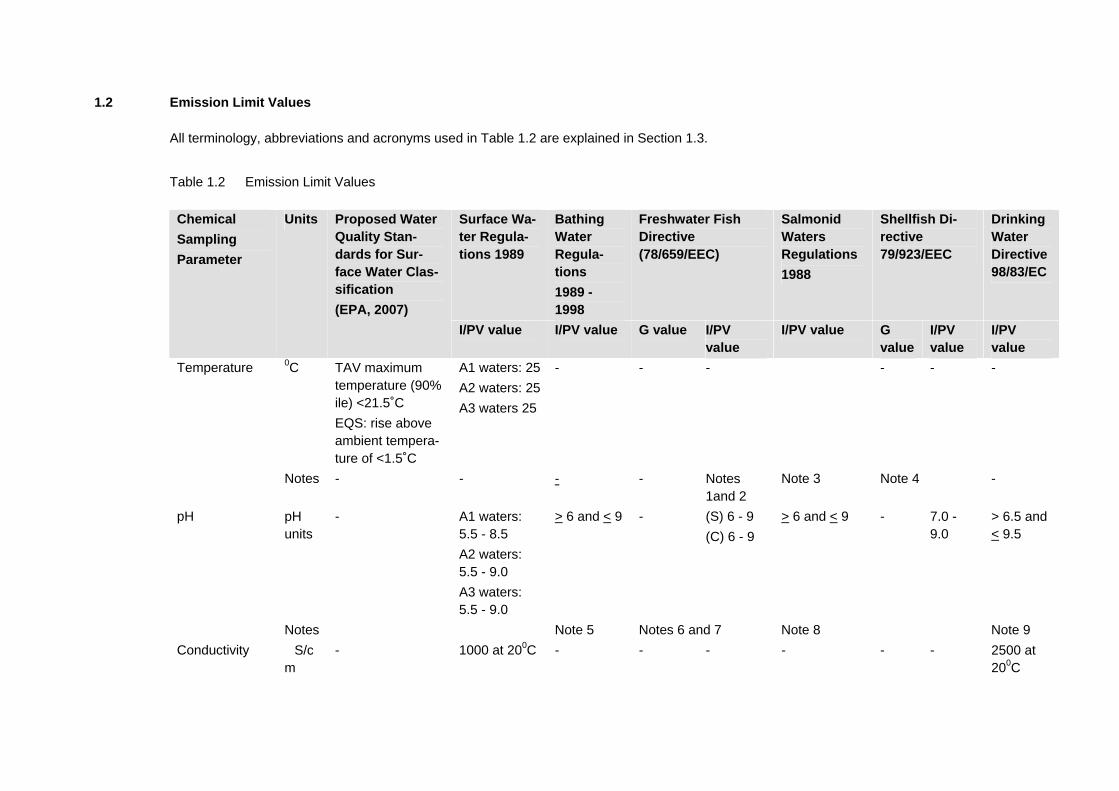
1.2 Emission Limit Values
All terminology, abbreviations and acronyms used in Table 1.2 are explained in Section 1.3.
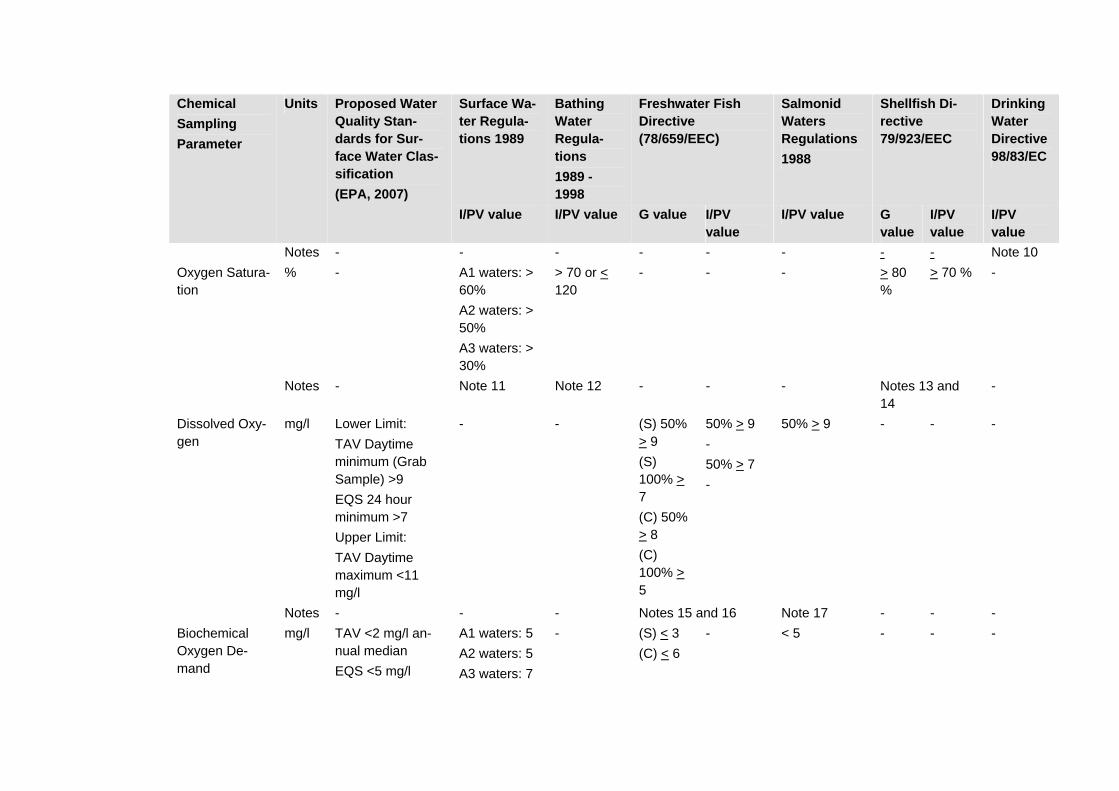
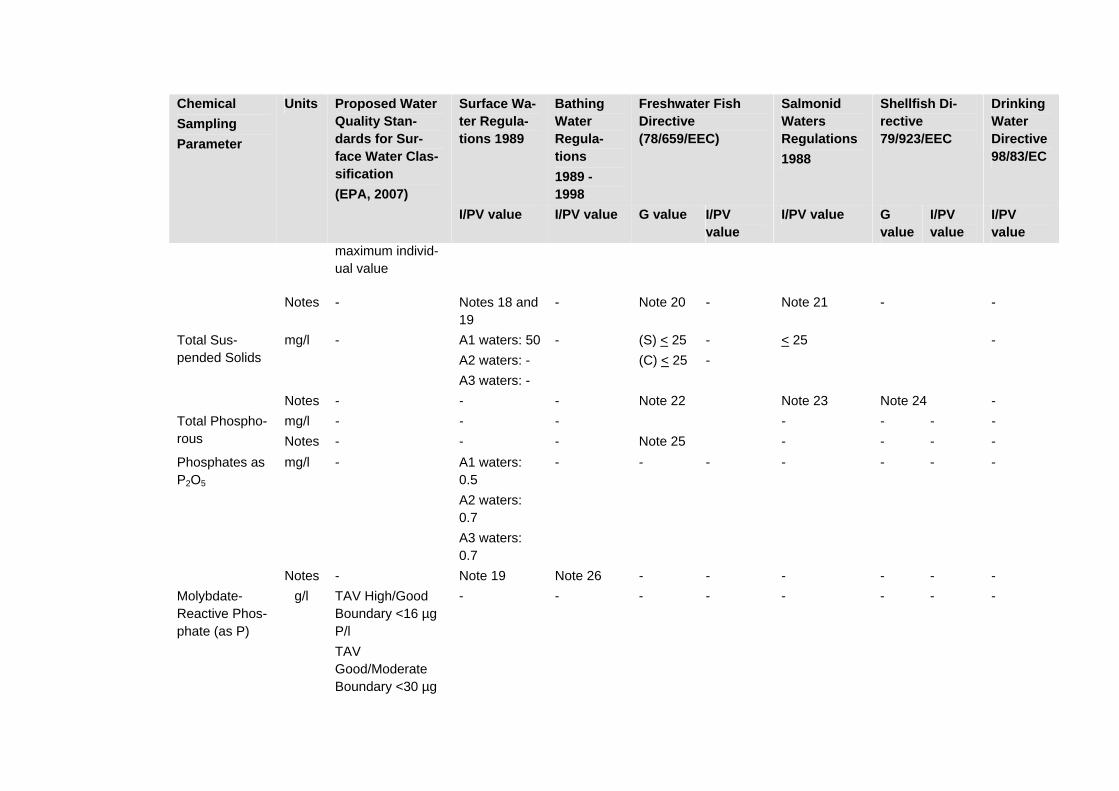
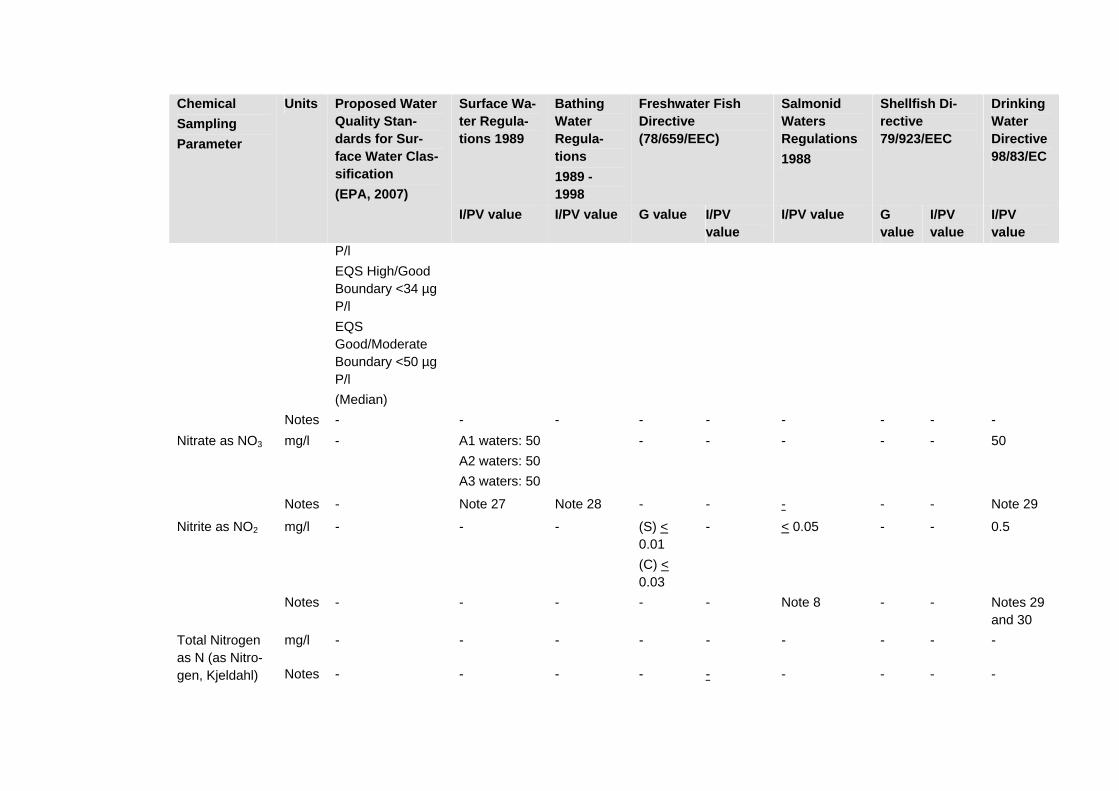
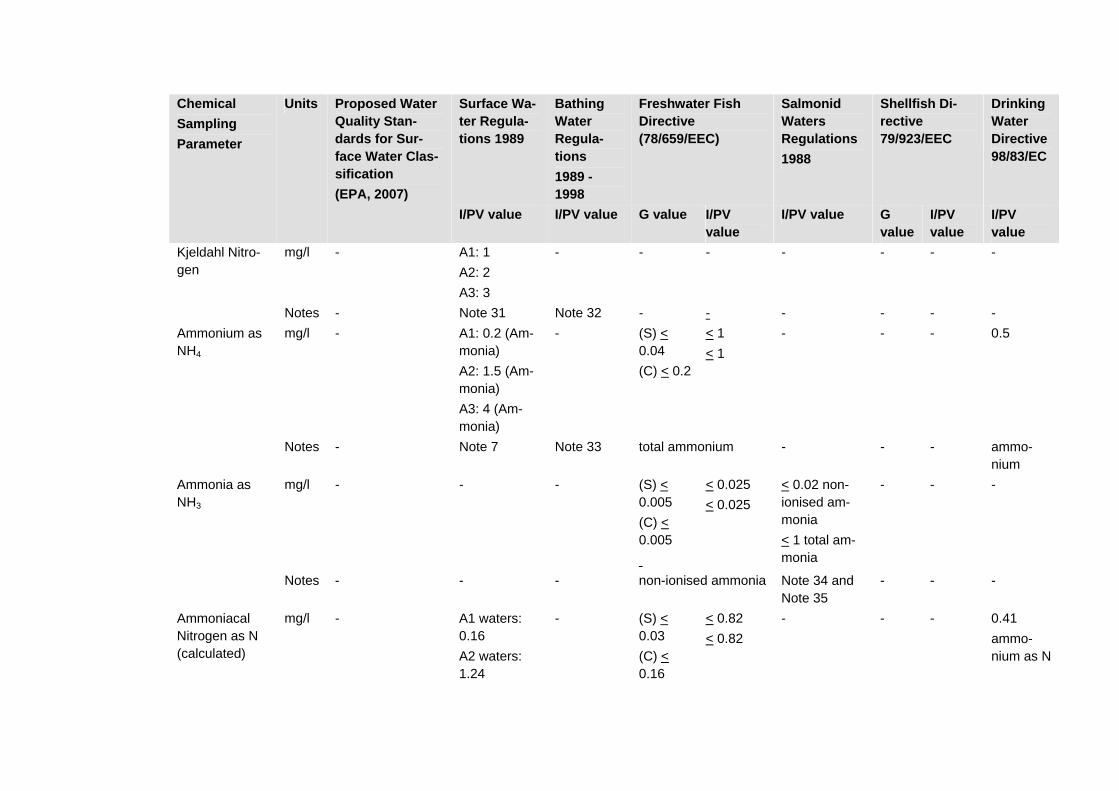
Table 1.2 Emission Limit Values
Surface Wa-ter Regula-tions 1989
Bathing Water Regula-tions 1989 - 1998
Freshwater Fish Directive (78/659/EEC)
Salmonid Waters Regulations 1988
Shellfish Di-rective 79/923/EEC
Drinking Water Directive 98/83/EC
Chemical Sampling Parameter
Units Proposed Water Quality Stan-dards for Sur-face Water Clas-sification (EPA, 2007)
I/PV value I/PV value G value I/PV value
I/PV value G value
I/PV value
I/PV value
0C TAV maximum temperature (90% ile) <21.5˚C EQS: rise above ambient tempera-ture of <1.5˚C
A1 waters: 25A2 waters: 25A3 waters 25
- - - - - - Temperature
Notes - - - - Notes 1and 2
Note 3 Note 4 -
pH units
- A1 waters: 5.5 - 8.5 A2 waters: 5.5 - 9.0 A3 waters: 5.5 - 9.0
> 6 and < 9 -
(S) 6 - 9 (C) 6 - 9
> 6 and < 9
- 7.0 - 9.0
> 6.5 and < 9.5
pH
Notes Note 5 Notes 6 and 7 Note 8 Note 9 Conductivity �S/c
m - 1000 at 200C - - - - - - 2500 at
200C
Surface Wa-ter Regula-tions 1989
Bathing Water Regula-tions 1989 - 1998
Freshwater Fish Directive (78/659/EEC)
Salmonid Waters Regulations 1988
Shellfish Di-rective 79/923/EEC
Drinking Water Directive 98/83/EC
Chemical Sampling Parameter
Units Proposed Water Quality Stan-dards for Sur-face Water Clas-sification (EPA, 2007)
I/PV value I/PV value G value I/PV value
I/PV value G value
I/PV value
I/PV value
Notes - - - - - - - - Note 10 % - A1 waters: >
60% A2 waters: > 50% A3 waters: > 30%
> 70 or < 120
- - - > 80 %
> 70 % - Oxygen Satura-tion
Notes - Note 11 Note 12 - - - Notes 13 and 14
-
mg/l Lower Limit: TAV Daytime minimum (Grab Sample) >9 EQS 24 hour minimum >7 Upper Limit: TAV Daytime maximum <11 mg/l
- - (S) 50% > 9 (S) 100% > 7 (C) 50% > 8 (C) 100% > 5
50% > 9 - 50% > 7 -
50% > 9 - - - Dissolved Oxy-gen
Notes - - - Notes 15 and 16 Note 17 - - - Biochemical Oxygen De-mand
mg/l TAV <2 mg/l an-nual median EQS <5 mg/l
A1 waters: 5 A2 waters: 5 A3 waters: 7
- (S) < 3 (C) < 6
-
< 5 - - -
Surface Wa-ter Regula-tions 1989
Bathing Water Regula-tions 1989 - 1998
Freshwater Fish Directive (78/659/EEC)
Salmonid Waters Regulations 1988
Shellfish Di-rective 79/923/EEC
Drinking Water Directive 98/83/EC
Chemical Sampling Parameter
Units Proposed Water Quality Stan-dards for Sur-face Water Clas-sification (EPA, 2007)
I/PV value I/PV value G value I/PV value
I/PV value G value
I/PV value
I/PV value
maximum individ-ual value
Notes - Notes 18 and 19
- Note 20 - Note 21 - -
mg/l - A1 waters: 50A2 waters: - A3 waters: -
- (S) < 25 (C) < 25
- -
< 25 - Total Sus-pended Solids
Notes - - - Note 22 Note 23 Note 24 - mg/l - - - - - - - Total Phospho-
rous Notes - - - Note 25 - - - - mg/l - A1 waters:
0.5 A2 waters: 0.7 A3 waters: 0.7
- - - - - - - Phosphates as P2O5
Notes - Note 19 Note 26 - - - - - - Molybdate-Reactive Phos-phate (as P)
�g/l TAV High/Good Boundary <16 µg P/l TAV Good/Moderate Boundary <30 µg
- - - - - - - -
Surface Wa-ter Regula-tions 1989
Bathing Water Regula-tions 1989 - 1998
Freshwater Fish Directive (78/659/EEC)
Salmonid Waters Regulations 1988
Shellfish Di-rective 79/923/EEC
Drinking Water Directive 98/83/EC
Chemical Sampling Parameter
Units Proposed Water Quality Stan-dards for Sur-face Water Clas-sification (EPA, 2007)
I/PV value I/PV value G value I/PV value
I/PV value G value
I/PV value
I/PV value
P/l EQS High/Good Boundary <34 µg P/l EQS Good/Moderate Boundary <50 µg P/l (Median)
Notes - - - - - - - - - mg/l - A1 waters: 50
A2 waters: 50A3 waters: 50
- - - - - 50
Nitrate as NO3
Notes - Note 27 Note 28 - - - - - Note 29
mg/l - - - (S) < 0.01 (C) < 0.03
-
< 0.05 - - 0.5 Nitrite as NO2
Notes - - - - - Note 8 - - Notes 29 and 30
mg/l - - - - - - - - - Total Nitrogen as N (as Nitro-gen, Kjeldahl) Notes - - - - - - - - -
Surface Wa-ter Regula-tions 1989
Bathing Water Regula-tions 1989 - 1998
Freshwater Fish Directive (78/659/EEC)
Salmonid Waters Regulations 1988
Shellfish Di-rective 79/923/EEC
Drinking Water Directive 98/83/EC
Chemical Sampling Parameter
Units Proposed Water Quality Stan-dards for Sur-face Water Clas-sification (EPA, 2007)
I/PV value I/PV value G value I/PV value
I/PV value G value
I/PV value
I/PV value
mg/l - A1: 1 A2: 2 A3: 3
- - - - - - - Kjeldahl Nitro-gen
Notes - Note 31 Note 32 - - - - - - mg/l - A1: 0.2 (Am-
monia) A2: 1.5 (Am-monia) A3: 4 (Am-monia)
- (S) < 0.04 (C) < 0.2
< 1 < 1
- - - 0.5 Ammonium as NH4
Notes - Note 7 Note 33 total ammonium - - - ammo-nium
mg/l - - - (S) < 0.005 (C) < 0.005
< 0.025 < 0.025
< 0.02 non-ionised am-monia < 1 total am-monia
- - - Ammonia as NH3
Notes - - - non-ionised ammonia Note 34 and Note 35
- - -
Ammoniacal Nitrogen as N (calculated)
mg/l - A1 waters: 0.16 A2 waters: 1.24
- (S) < 0.03 (C) < 0.16
< 0.82 < 0.82
- - - 0.41 ammo-nium as N
Surface Wa-ter Regula-tions 1989
Bathing Water Regula-tions 1989 - 1998
Freshwater Fish Directive (78/659/EEC)
Salmonid Waters Regulations 1988
Shellfish Di-rective 79/923/EEC
Drinking Water Directive 98/83/EC
Chemical Sampling Parameter
Units Proposed Water Quality Stan-dards for Sur-face Water Clas-sification (EPA, 2007)
I/PV value I/PV value G value I/PV value
I/PV value G value
I/PV value
I/PV value
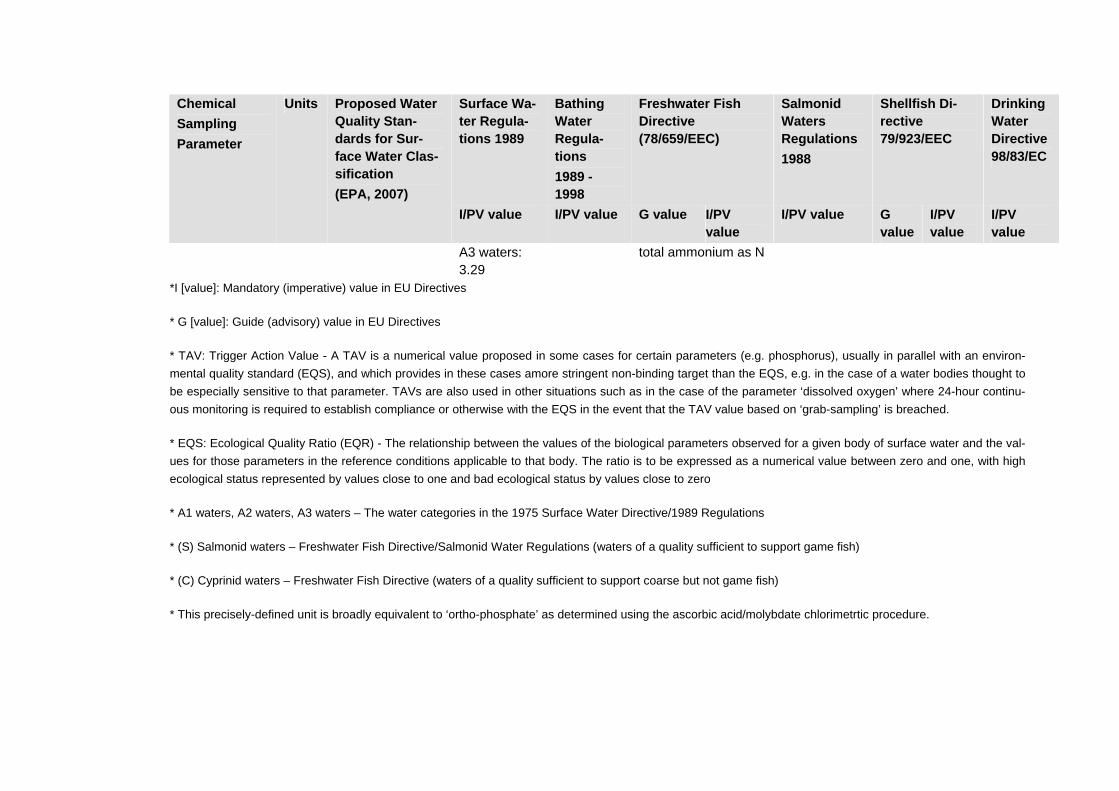
A3 waters: 3.29
total ammonium as N
*I [value]: Mandatory (imperative) value in EU Directives
* G [value]: Guide (advisory) value in EU Directives
* TAV: Trigger Action Value - A TAV is a numerical value proposed in some cases for certain parameters (e.g. phosphorus), usually in parallel with an environ-mental quality standard (EQS), and which provides in these cases amore stringent non-binding target than the EQS, e.g. in the case of a water bodies thought to be especially sensitive to that parameter. TAVs are also used in other situations such as in the case of the parameter ‘dissolved oxygen’ where 24-hour continu-ous monitoring is required to establish compliance or otherwise with the EQS in the event that the TAV value based on ‘grab-sampling’ is breached.
* EQS: Ecological Quality Ratio (EQR) - The relationship between the values of the biological parameters observed for a given body of surface water and the val-ues for those parameters in the reference conditions applicable to that body. The ratio is to be expressed as a numerical value between zero and one, with high ecological status represented by values close to one and bad ecological status by values close to zero
* A1 waters, A2 waters, A3 waters – The water categories in the 1975 Surface Water Directive/1989 Regulations
* (S) Salmonid waters – Freshwater Fish Directive/Salmonid Water Regulations (waters of a quality sufficient to support game fish)
* (C) Cyprinid waters – Freshwater Fish Directive (waters of a quality sufficient to support coarse but not game fish)
* This precisely-defined unit is broadly equivalent to ‘ortho-phosphate’ as determined using the ascorbic acid/molybdate chlorimetrtic procedure.
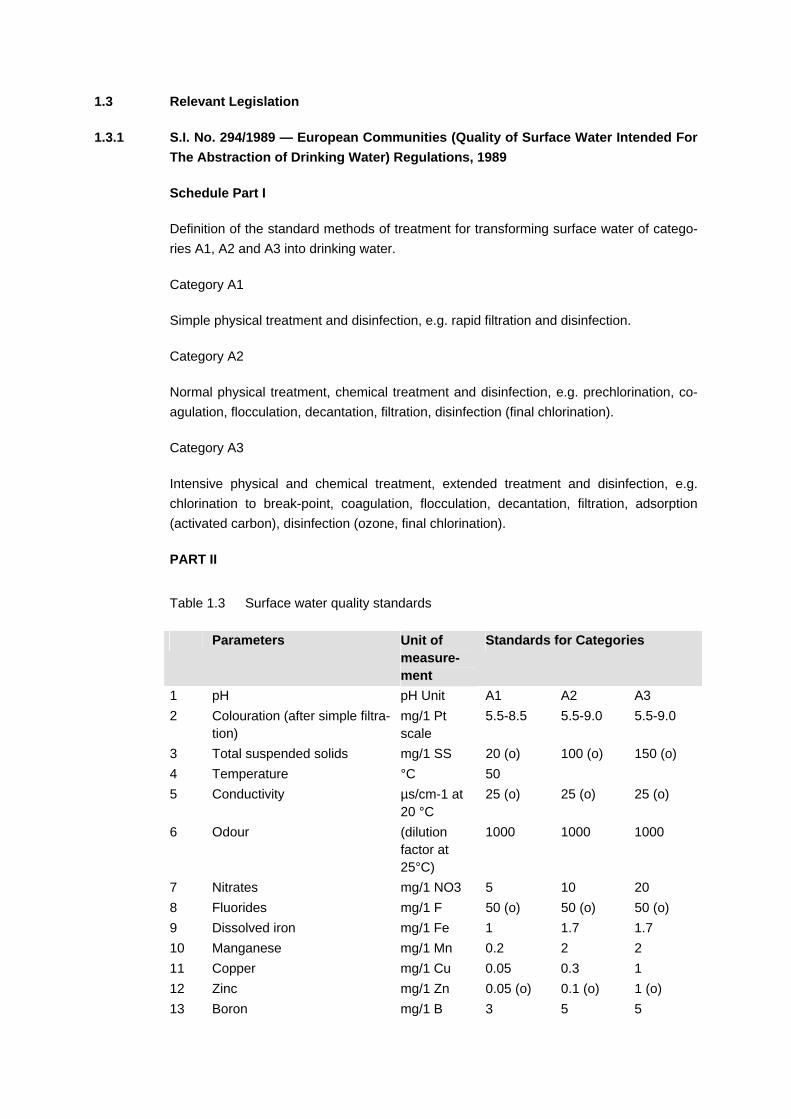
1.3 Relevant Legislation
1.3.1 S.I. No. 294/1989 — European Communities (Quality of Surface Water Intended For The Abstraction of Drinking Water) Regulations, 1989
Schedule Part I
Definition of the standard methods of treatment for transforming surface water of catego-ries A1, A2 and A3 into drinking water.
Category A1
Simple physical treatment and disinfection, e.g. rapid filtration and disinfection.
Category A2
Normal physical treatment, chemical treatment and disinfection, e.g. prechlorination, co-agulation, flocculation, decantation, filtration, disinfection (final chlorination).
Category A3
Intensive physical and chemical treatment, extended treatment and disinfection, e.g. chlorination to break-point, coagulation, flocculation, decantation, filtration, adsorption (activated carbon), disinfection (ozone, final chlorination).
PART II
Table 1.3 Surface water quality standards
Parameters Unit of measure-ment
Standards for Categories
1 pH pH Unit A1 A2 A3 2 Colouration (after simple filtra-
tion) mg/1 Pt scale
5.5-8.5 5.5-9.0 5.5-9.0
3 Total suspended solids mg/1 SS 20 (o) 100 (o) 150 (o) 4 Temperature °C 50 5 Conductivity µs/cm-1 at
20 °C 25 (o) 25 (o) 25 (o)
6 Odour (dilution factor at 25°C)
1000 1000 1000
7 Nitrates mg/1 NO3 5 10 20 8 Fluorides mg/1 F 50 (o) 50 (o) 50 (o) 9 Dissolved iron mg/1 Fe 1 1.7 1.7 10 Manganese mg/1 Mn 0.2 2 2 11 Copper mg/1 Cu 0.05 0.3 1 12 Zinc mg/1 Zn 0.05 (o) 0.1 (o) 1 (o) 13 Boron mg/1 B 3 5 5
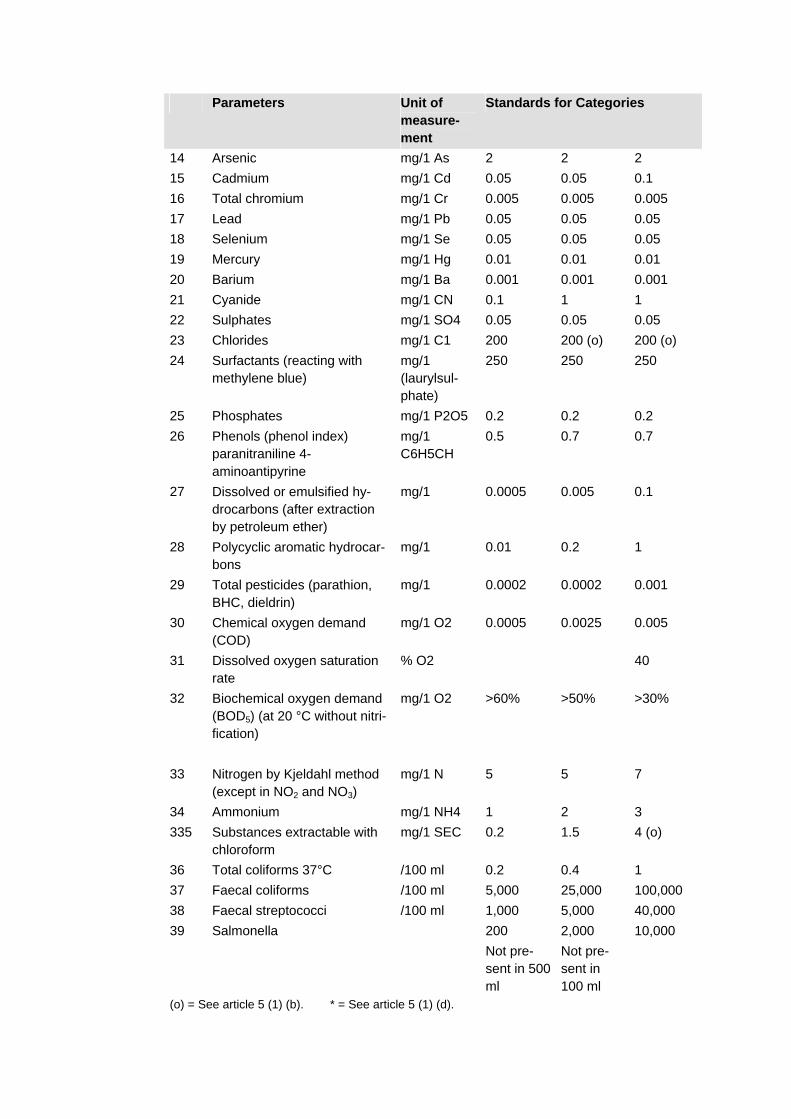
Parameters Unit of measure-ment
Standards for Categories
14 Arsenic mg/1 As 2 2 2 15 Cadmium mg/1 Cd 0.05 0.05 0.1 16 Total chromium mg/1 Cr 0.005 0.005 0.005 17 Lead mg/1 Pb 0.05 0.05 0.05 18 Selenium mg/1 Se 0.05 0.05 0.05 19 Mercury mg/1 Hg 0.01 0.01 0.01 20 Barium mg/1 Ba 0.001 0.001 0.001 21 Cyanide mg/1 CN 0.1 1 1 22 Sulphates mg/1 SO4 0.05 0.05 0.05 23 Chlorides mg/1 C1 200 200 (o) 200 (o) 24 Surfactants (reacting with
methylene blue) mg/1 (laurylsul-phate)
250 250 250
25 Phosphates mg/1 P2O5 0.2 0.2 0.2 26 Phenols (phenol index)
paranitraniline 4-aminoantipyrine
mg/1 C6H5CH
0.5 0.7 0.7
27 Dissolved or emulsified hy-drocarbons (after extraction by petroleum ether)
mg/1 0.0005 0.005 0.1
28 Polycyclic aromatic hydrocar-bons
mg/1 0.01 0.2 1
29 Total pesticides (parathion, BHC, dieldrin)
mg/1 0.0002 0.0002 0.001
30 Chemical oxygen demand (COD)
mg/1 O2 0.0005 0.0025 0.005
31 Dissolved oxygen saturation rate
% O2 40
32 Biochemical oxygen demand (BOD5) (at 20 °C without nitri-fication)
mg/1 O2 >60% >50% >30%
33 Nitrogen by Kjeldahl method (except in NO2 and NO3)
mg/1 N 5 5 7
34 Ammonium mg/1 NH4 1 2 3 335 Substances extractable with
chloroform mg/1 SEC 0.2 1.5 4 (o)
36 Total coliforms 37°C /100 ml 0.2 0.4 1 37 Faecal coliforms /100 ml 5,000 25,000 100,000 38 Faecal streptococci /100 ml 1,000 5,000 40,000 39 Salmonella 200 2,000 10,000 Not pre-
sent in 500 ml
Not pre-sent in 100 ml
(o) = See article 5 (1) (b). * = See article 5 (1) (d).
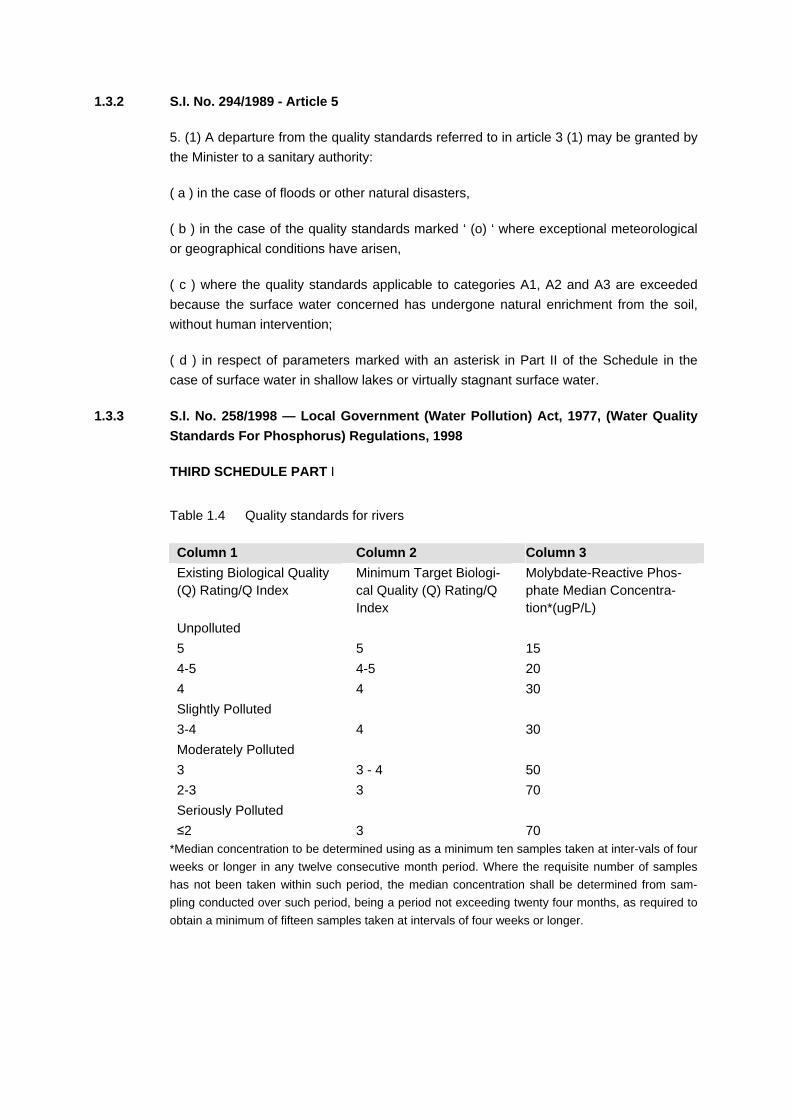
1.3.2 S.I. No. 294/1989 - Article 5
5. (1) A departure from the quality standards referred to in article 3 (1) may be granted by the Minister to a sanitary authority:
( a ) in the case of floods or other natural disasters,
( b ) in the case of the quality standards marked ‘ (o) ‘ where exceptional meteorological or geographical conditions have arisen,
( c ) where the quality standards applicable to categories A1, A2 and A3 are exceeded because the surface water concerned has undergone natural enrichment from the soil, without human intervention;
( d ) in respect of parameters marked with an asterisk in Part II of the Schedule in the case of surface water in shallow lakes or virtually stagnant surface water.
1.3.3 S.I. No. 258/1998 — Local Government (Water Pollution) Act, 1977, (Water Quality Standards For Phosphorus) Regulations, 1998
THIRD SCHEDULE PART I
Table 1.4 Quality standards for rivers
Column 1 Column 2 Column 3 Existing Biological Quality (Q) Rating/Q Index
Minimum Target Biologi-cal Quality (Q) Rating/Q Index
Molybdate-Reactive Phos-phate Median Concentra-tion*(ugP/L)
Unpolluted 5 5 15 4-5 4-5 20 4 4 30 Slightly Polluted 3-4 4 30 Moderately Polluted 3 3 - 4 50 2-3 3 70 Seriously Polluted ≤2 3 70
*Median concentration to be determined using as a minimum ten samples taken at inter-vals of four weeks or longer in any twelve consecutive month period. Where the requisite number of samples has not been taken within such period, the median concentration shall be determined from sam-pling conducted over such period, being a period not exceeding twenty four months, as required to obtain a minimum of fifteen samples taken at intervals of four weeks or longer.

1.4 Explanatory notes
1. value is ‘. Temperature measured downstream of a point of thermal discharge (at the edge of the mixing one) must not exceed the unaffected temperature by more than 1.5oC in salmonid waters and 3.00oC in cyprinid waters. Derogations limited in geographical scope may we decided by Member States in particular conditions if the competent author-ity can prove that there are no harmful consequences for the balanced development of the fish population.’
2. Thermal discharges must not cause the temperature downstream of the point of dis-charge (at the edge of the mixing zone) to exceed the following: 21.5oC/10oC in salmonid waters and 28oC/10oC in cyprinid waters. The 10oC temperature limit applies only to breeding periods of species which need cold water for reproduction and only to waters which may contain such species.’ Temperature limits may, however be exceeded for 2% of the time.
3. Standard laid down in Regulations is: ‘Temperature measured downstream of a point of thermal discharge (at the edge of the mixing zone as determined by the local authority) must not -
exceed the unaffected temperature by more than 1.5oC
exceed (i) 21.5 oC or (ii) 10oC during the period from 1 November to 30 April where species which need cold water for reproduction are present.
A thermal discharge must not cause sudden variations in temperatures. ‘ (‘Temperature limits to be conformed with for 98% of the time.’)
4. G value is: ‘A discharge affecting shellfish waters must not cause the temperature of the waters to exceed by more than 2oC the temperature of water not so affected.’
5. Sampling to be carried out ‘where an investigation... shows, or there are other grounds for believing, that there has been deterioration in the quality of waters...’ No two consecu-tive samples to fall outside the range.
6. Standard to be conformed by 95% of samples over a period of 12 months where sam-pling is carried out at least once per month; where sampling is less frequent the standard shall be conformed with by all samples.
7. Parameter is designated ‘Hydrogen ion concentration’ with the comments ‘The water should not be aggressive’ and ‘For still water put into bottles or containers, the minimum value may be reduced to 4.5 pH units. For water put into bottles or containers which is naturally rich in or artificially enriched with carbon dioxide, the minimum value may be lower.’
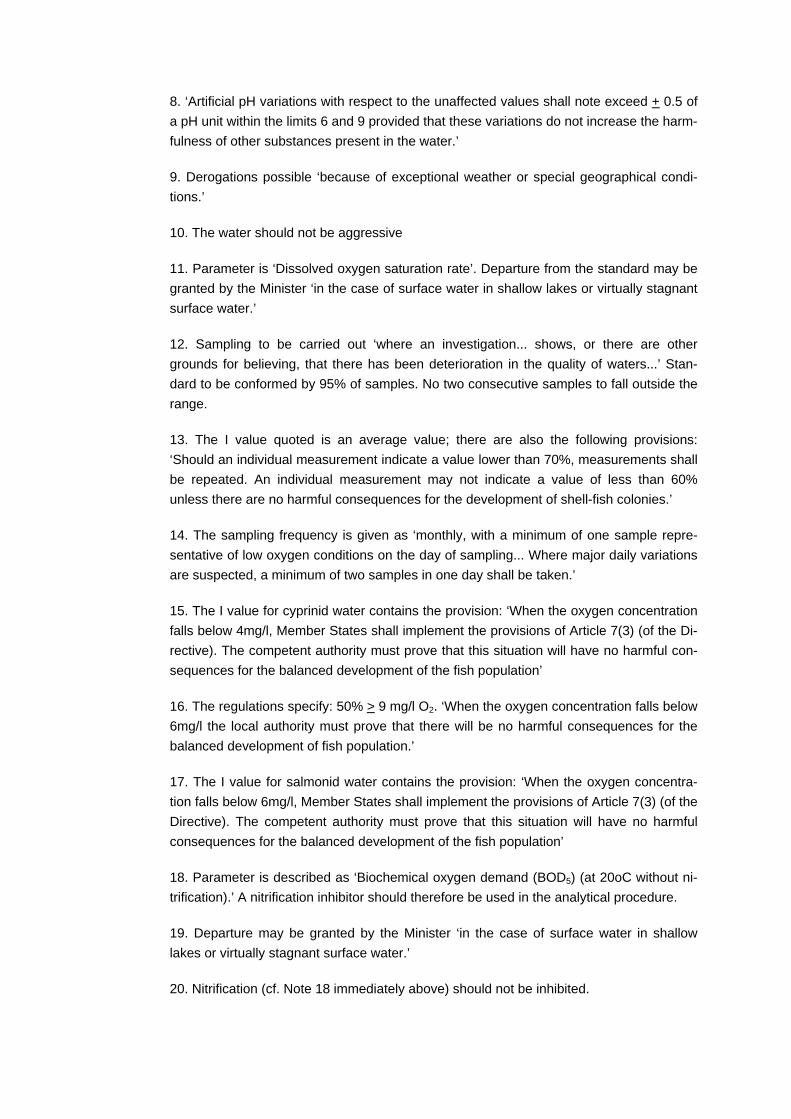
8. ‘Artificial pH variations with respect to the unaffected values shall note exceed + 0.5 of a pH unit within the limits 6 and 9 provided that these variations do not increase the harm-fulness of other substances present in the water.’
9. Derogations possible ‘because of exceptional weather or special geographical condi-tions.’
10. The water should not be aggressive
11. Parameter is ‘Dissolved oxygen saturation rate’. Departure from the standard may be granted by the Minister ‘in the case of surface water in shallow lakes or virtually stagnant surface water.’
12. Sampling to be carried out ‘where an investigation... shows, or there are other grounds for believing, that there has been deterioration in the quality of waters...’ Stan-dard to be conformed by 95% of samples. No two consecutive samples to fall outside the range.
13. The I value quoted is an average value; there are also the following provisions: ‘Should an individual measurement indicate a value lower than 70%, measurements shall be repeated. An individual measurement may not indicate a value of less than 60% unless there are no harmful consequences for the development of shell-fish colonies.’
14. The sampling frequency is given as ‘monthly, with a minimum of one sample repre-sentative of low oxygen conditions on the day of sampling... Where major daily variations are suspected, a minimum of two samples in one day shall be taken.’
15. The I value for cyprinid water contains the provision: ‘When the oxygen concentration falls below 4mg/l, Member States shall implement the provisions of Article 7(3) (of the Di-rective). The competent authority must prove that this situation will have no harmful con-sequences for the balanced development of the fish population’
16. The regulations specify: 50% > 9 mg/l O2. ‘When the oxygen concentration falls below 6mg/l the local authority must prove that there will be no harmful consequences for the balanced development of fish population.’
17. The I value for salmonid water contains the provision: ‘When the oxygen concentra-tion falls below 6mg/l, Member States shall implement the provisions of Article 7(3) (of the Directive). The competent authority must prove that this situation will have no harmful consequences for the balanced development of the fish population’
18. Parameter is described as ‘Biochemical oxygen demand (BOD5) (at 20oC without ni-trification).’ A nitrification inhibitor should therefore be used in the analytical procedure.
19. Departure may be granted by the Minister ‘in the case of surface water in shallow lakes or virtually stagnant surface water.’
20. Nitrification (cf. Note 18 immediately above) should not be inhibited.
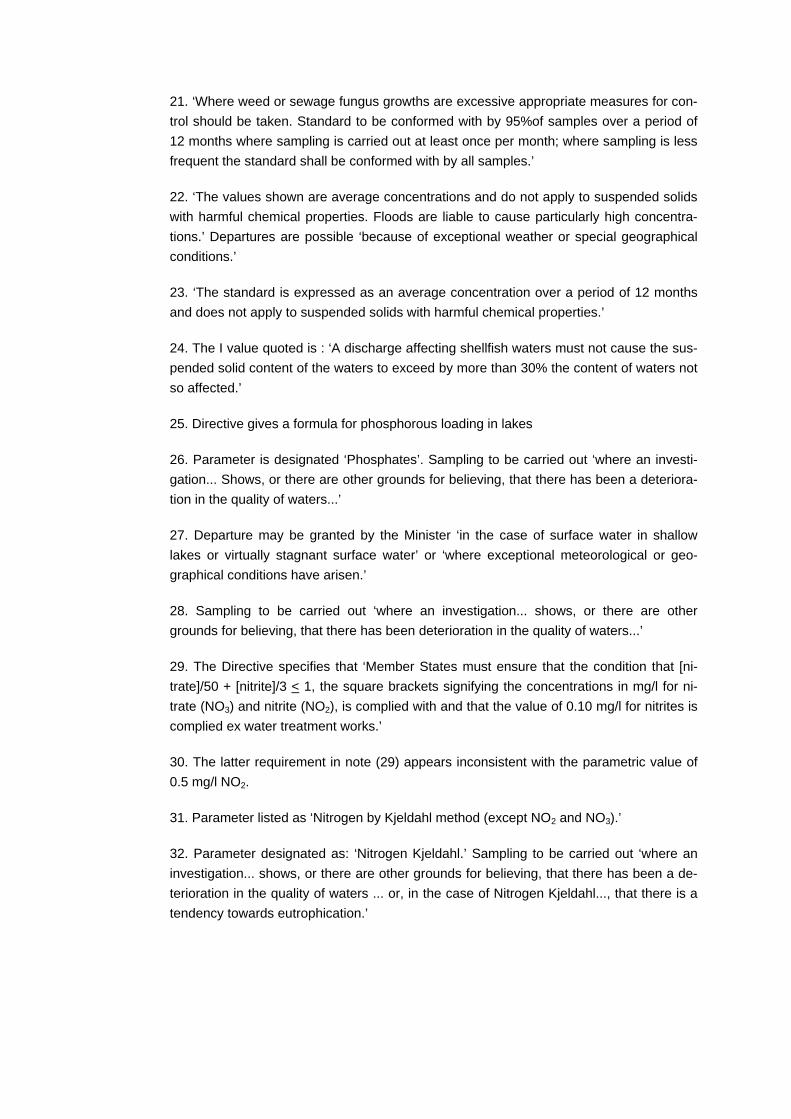
21. ‘Where weed or sewage fungus growths are excessive appropriate measures for con-trol should be taken. Standard to be conformed with by 95%of samples over a period of 12 months where sampling is carried out at least once per month; where sampling is less frequent the standard shall be conformed with by all samples.’
22. ‘The values shown are average concentrations and do not apply to suspended solids with harmful chemical properties. Floods are liable to cause particularly high concentra-tions.’ Departures are possible ‘because of exceptional weather or special geographical conditions.’
23. ‘The standard is expressed as an average concentration over a period of 12 months and does not apply to suspended solids with harmful chemical properties.’
24. The I value quoted is : ‘A discharge affecting shellfish waters must not cause the sus-pended solid content of the waters to exceed by more than 30% the content of waters not so affected.’
25. Directive gives a formula for phosphorous loading in lakes
26. Parameter is designated ‘Phosphates’. Sampling to be carried out ‘where an investi-gation... Shows, or there are other grounds for believing, that there has been a deteriora-tion in the quality of waters...’
27. Departure may be granted by the Minister ‘in the case of surface water in shallow lakes or virtually stagnant surface water’ or ‘where exceptional meteorological or geo-graphical conditions have arisen.’
28. Sampling to be carried out ‘where an investigation... shows, or there are other grounds for believing, that there has been deterioration in the quality of waters...’
29. The Directive specifies that ‘Member States must ensure that the condition that [ni-trate]/50 + [nitrite]/3 < 1, the square brackets signifying the concentrations in mg/l for ni-trate (NO3) and nitrite (NO2), is complied with and that the value of 0.10 mg/l for nitrites is complied ex water treatment works.’
30. The latter requirement in note (29) appears inconsistent with the parametric value of 0.5 mg/l NO2.
31. Parameter listed as ‘Nitrogen by Kjeldahl method (except NO2 and NO3).’
32. Parameter designated as: ‘Nitrogen Kjeldahl.’ Sampling to be carried out ‘where an investigation... shows, or there are other grounds for believing, that there has been a de-terioration in the quality of waters ... or, in the case of Nitrogen Kjeldahl..., that there is a tendency towards eutrophication.’
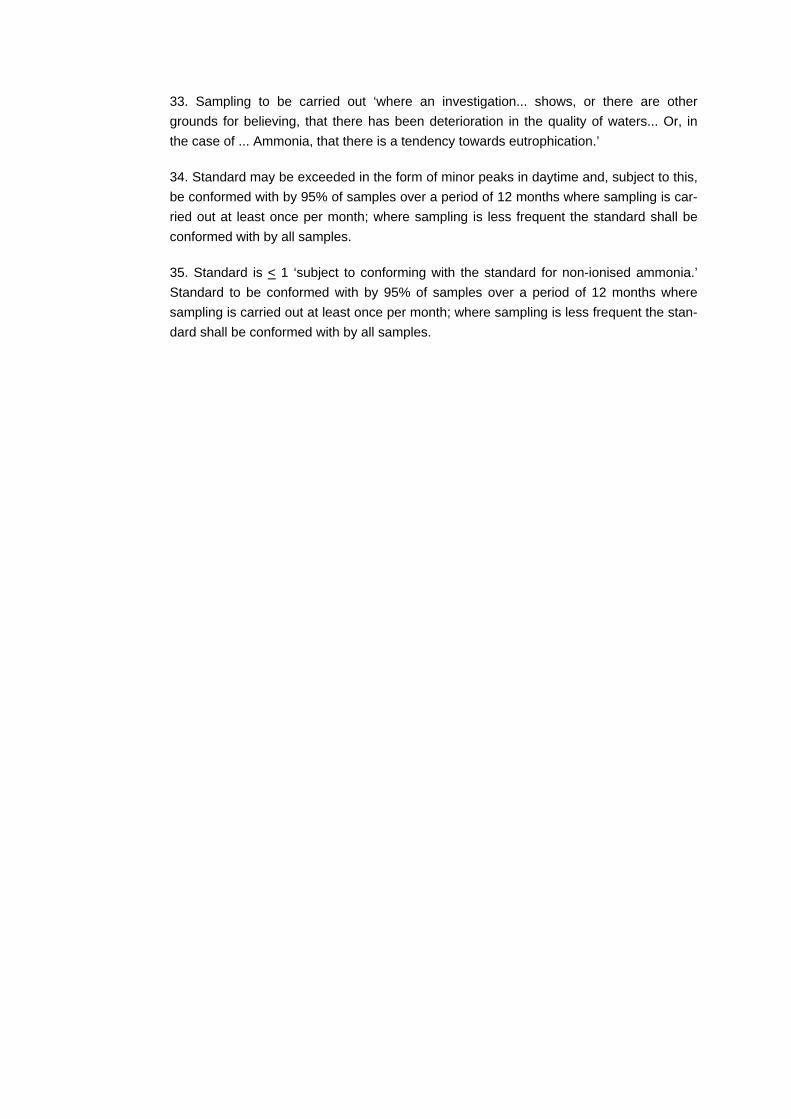
33. Sampling to be carried out ‘where an investigation... shows, or there are other grounds for believing, that there has been deterioration in the quality of waters... Or, in the case of ... Ammonia, that there is a tendency towards eutrophication.’
34. Standard may be exceeded in the form of minor peaks in daytime and, subject to this, be conformed with by 95% of samples over a period of 12 months where sampling is car-ried out at least once per month; where sampling is less frequent the standard shall be conformed with by all samples.
35. Standard is < 1 ‘subject to conforming with the standard for non-ionised ammonia.’ Standard to be conformed with by 95% of samples over a period of 12 months where sampling is carried out at least once per month; where sampling is less frequent the stan-dard shall be conformed with by all samples.