Embed Size (px)
Citation preview

CDP CDP 2016 Climate Change 2016 Information Request
Anglo American
Module: Introduction
Page: Introduction
CC0.1
Introduction Please give a general description and introduction to your organization. Anglo American is a global and diversified mining business that provides raw materials essential for economic development and modern life. Our operations, growth projects and exploration and marketing activities extend across southern African, South America, Australia, North America, Asia and Europe. Our diversified assets portfolio currently comprises bulk commodities – iron ore and manganese, metallurgical coal and thermal coal; base metals and minerals – copper, nickel, niobium and phosphates; and precious metals and minerals – platinum and diamonds. Our headquarters are in London, United Kingdom and we are listed on the London and Johannesburg stock exchanges. Our business is divided into: Anglo American Platinum, the De Beers Group of Companies, Base Metals and Minerals (Copper in Chile and Peru, and Nickel, Niobium and Phosphates in Brazil), Coal South Africa and Australia-Canada, Kumba Iron Ore, Iron Ore Brazil, and exploration and corporate functions. Our purpose is to create sustainable value that makes a real difference through safe and responsible mining that provides raw materials the world needs to develop and grow. We are focusing our business on our core portfolio of world class assets – in diamonds, platinum group metals (PGMs) and copper – to meet growing consumer-driven demand in the world’s maturing and developed economies. We are adapting to create a greatly streamlined and agile business, with the technical and marketing expertise and critical mass to compete effectively for, and to deliver, future opportunities, both within and beyond our portfolio. For the purposes of the CDP and other sustainable development reporting, the data presented covers Anglo American companies, subsidiaries and joint ventures over which Anglo American has management control or where Anglo American sustainability standards are applied (including De Beers’ 50:50 joint ventures with the governments of Namibia and Botswana). It does not include independently managed operations such as Cerrejón and Samancor. Significant changes to Anglo American’s portfolio during 2015 included the sale of the Mantoverde and Mantos Blancos copper mines in Chile, both of which ceased reporting in September. In the same month, Anglo American Platinum entered into a sale and purchase agreement with Sibanye Gold for its Rustenburg mines. The affected operations will continue reporting until the transaction has been concluded. Kimberley diamond mines were sold in January 2016.
CC0.2

Reporting Year Please state the start and end date of the year for which you are reporting data. The current reporting year is the latest/most recent 12-month period for which data is reported. Enter the dates of this year first. We request data for more than one reporting period for some emission accounting questions. Please provide data for the three years prior to the current reporting year if you have not provided this information before, or if this is the first time you have answered a CDP information request. (This does not apply if you have been offered and selected the option of answering the shorter questionnaire). If you are going to provide additional years of data, please give the dates of those reporting periods here. Work backwards from the most recent reporting year. Please enter dates in following format: day(DD)/month(MM)/year(YYYY) (i.e. 31/01/2001).
Enter Periods that will be disclosed
Thu 01 Jan 2015 - Thu 31 Dec 2015
CC0.3
Country list configuration Please select the countries for which you will be supplying data. If you are responding to the Electric Utilities module, this selection will be carried forward to assist you in completing your response.
Select country
Australia
Brazil
Botswana
Canada
Chile
Namibia
Peru
South Africa
United Kingdom

Select country
Zimbabwe
Rest of world
CC0.4
Currency selection Please select the currency in which you would like to submit your response. All financial information contained in the response should be in this currency. USD($)
CC0.6
Modules As part of the request for information on behalf of investors, electric utilities, companies with electric utility activities or assets, companies in the automobile or auto component manufacture sub-industries, companies in the oil and gas sub-industries, companies in the information technology and telecommunications sectors and companies in the food, beverage and tobacco industry group should complete supplementary questions in addition to the main questionnaire. If you are in these sector groupings (according to the Global Industry Classification Standard (GICS)), the corresponding sector modules will not appear below but will automatically appear in the navigation bar when you save this page. If you want to query your classification, please email [email protected]. If you have not been presented with a sector module that you consider would be appropriate for your company to answer, please select the module below. If you wish to view the questions first, please see https://www.cdp.net/en-US/Programmes/Pages/More-questionnaires.aspx.
Further Information
Module: Management
Page: CC1. Governance
CC1.1

Where is the highest level of direct responsibility for climate change within your organization? Board or individual/sub-set of the Board or other committee appointed by the Board
CC1.1a
Please identify the position of the individual or name of the committee with this responsibility The Sustainability Committee is a sub-committee of the Board chaired by Jack Thompson (non-executive director). The Committee’s role is to oversee material policies, processes and strategies designed to manage material risks and opportunities, including climate change and energy. Climate change and energy are included in every quarterly report to the Board and in business unit performance reports, as well as in the form of an annual ‘deep dive’ agenda item. Members of the Sustainability Committee also include: Mark Cutifani (CEO), Tony O’Neill (Group Director of Technical and Sustainability), Sir John Parker (Chairman of the Board), Ray O’Rourke (non-executive director), Mphu Ramatlapheng (non-executive director), and Jim Rutherford (non-executive director) along with participation from business unit CEOs as well as sustainability specialists from across the Group.
CC1.2
Do you provide incentives for the management of climate change issues, including the attainment of targets? Yes
CC1.2a
Please provide further details on the incentives provided for the management of climate change issues

Who is entitled to benefit from these incentives?
The type of incentives
Incentivized performance
indicator
Comment
Corporate executive team Recognition (non-monetary)
Emissions reduction target Energy reduction target
The CEO scorecard is compiled every two months and is the basis for the CEO’s performance reporting to the Board. Each business unit CEO has a scorecard that is aligned with what is in the Group CEO scorecard. These include the WETT (water) and ECO2MAN (GHG and energy reduction) targets. Not all indicators are currently linked to remuneration.
Energy managers Monetary reward
Emissions reduction target Energy reduction target
A portion of energy managers' variable remuneration is linked to quantitative energy and GHG targets developed through the bottom-up ECO2MAN programme and associated targets.
Environment/Sustainability managers
Monetary reward
Emissions reduction target Energy reduction target
A portion of environment/sustainable development managers' variable remuneration is linked, where relevant, to quantitative GHG and climate change reductions in line with ECO2MAN targets.
Corporate executive team Monetary reward
Emissions reduction target Energy reduction target
At Anglo American Platinum, both emission reduction and energy reduction targets are included as individual performance indicators of each corporate executive team member. These indicators form part of the overall deliverables of each Executive, which play a part in determining their final performance rating.
Further Information
Page: CC2. Strategy
CC2.1
Please select the option that best describes your risk management procedures with regard to climate change risks and opportunities Integrated into multi-disciplinary company wide risk management processes

CC2.1a
Please provide further details on your risk management procedures with regard to climate change risks and opportunities
Frequency
of monitoring
To whom are results
reported?
Geographical areas considered
How far into
the future are risks
considered?
Comment
Annually
Board or individual/sub-set of the Board or committee appointed by the Board
Australia, South America, North America, Asia, Europe and Africa. The focus mainly around the areas where Anglo American has a footprint as well as (to an extent) including components of the upstream and downstream value chain.
> 6 years
The Climate Risk and Adaptation (CRA) guideline has been developed in line with the Anglo American Group Integrated Risk Management and Operational Risk Management processes. The CRA is a systematic approach that utilises four layers in order to identify and analyse climate change associated risks and opportunities and put measures in place to control those risks. Each business unit submits an annual integrated risk report on the key risks and opportunities (including climate change and adaptation risks) to the corporate centre for review and presentation to the Board.
CC2.1b
Please describe how your risk and opportunity identification processes are applied at both company and asset level Anglo American’s climate change risk and opportunity identification process is aligned with the Operational Risk Management (ORM) process and governed by the Group’s overarching Integrated Risk Management standard. Each level of the business (asset to business unit and Group level) is responsible for the identification, analysis, evaluation, execution and monitoring and review of risks and opportunities. Anglo American Business Assurance Services is responsible for the overall facilitation, monitoring and assurance of the process/methodology. The process is four tiered and includes: Baseline risk assessments involve gathering long term weather data and information including projected regional climate model (including impacts on local communities and infrastructure). This involves identification of new unwanted events and potential influences on current unwanted events. Issue based risk assessments involve the analysis and prioritisation of unwanted events using a five-by-five box matrix, ranking them in terms of potential impact and likelihood of occurrence. Bow-tie analyses to identify critical controls are conducted to ensure the risk is kept within acceptable limits. Task-based risk assessments ensure that risks and opportunities are addressed at the level of individual tasks so that risk control measures are integrated into

standard operating procedures. Assessments are conducted regularly to identify areas for continual improvement. Each site (asset level) is responsible for the compilation and submission of a risk and control register, of which the most material risks are rolled up into the business unit risk and control register and ultimately the Group risk and control register (company level). The Group risk and control register, in conjunction with the operational technical assurance reviews, provides the basis for reporting risks to the Anglo American Board Audit Committee and Anglo American Board Sustainability Committee.
CC2.1c
How do you prioritize the risks and opportunities identified? Climate change risks and opportunities are identified through the analysis of climate scenario models and prioritised with the use of multi-disciplinary workshops, involving specialist skills. Each subset (from asset level to company level) of the company (with support from the Anglo American Business Assurance Services) is responsible for the identification, analysis, evaluation, execution and monitoring and review of risks and opportunities pertaining to their area of responsibility. The prioritization process is integrated into the issue based risk assessment layer of the risk management process. Issue based risk assessments involve the investigation and prioritisation of unwanted events using a five-by-five box matrix, which ranks risks in terms of potential impact and likelihood of occurrence. Bow-tie analysis and other root cause analysis techniques are used to further evaluate the risks and identify the controls necessary to prevent, mitigate and ameliorate the potential consequences (thus to ensure the risk is kept to levels in line with the defined risk appetite). The overall prioritisation is based on likelihood of occurrence and potential impact with potential impact covering multiple facets of the business including: material loss/business interruption/physical damage, safety, health, environment, social/community, reputation, legal, and regulatory. For example, we have done work at Venetia where the risk of extreme rainfall events is likely to continue to increase, which has implications for production and safety at open cast operations. As a consequence of this exercise, we will look at storm water drainage requirements to accommodate 1/500 year flood events.
CC2.1d
Please explain why you do not have a process in place for assessing and managing risks and opportunities from climate change, and whether you plan to introduce such a process in future
Main reason for not having a process
Do you plan to introduce a process?
Comment
CC2.2
Is climate change integrated into your business strategy? Yes
CC2.2a
Please describe the process of how climate change is integrated into your business strategy and any outcomes of this process At the core of the Anglo American strategy is our position as ‘the’ diversified miner. Having a diversified portfolio gives us options in terms of how and where we choose to allocate capital to grow the business, improve margins, generate returns and ultimately deliver value, and helps protect us through commodity and economic cycles. We are focusing our business on our core portfolio of world class assets in diamonds, PGMs and copper. Within this portfolio are products that enable the global transition to the low carbon economy, which, together with the implementation of the Operating Model and associated reduction of our direct GHG emissions as well as adaptation measures, will contribute to shared value. i) Information regarding climate change is reported to the Board Sustainability Committee and executives on a quarterly basis. The information is based on the analysis of GHG and energy data that are recorded into a central database by all operations; quarterly reports by each business unit on a range of sustainability issues, including climate change and energy; and relevant results of risk assessments of the potential physical impacts of climate change on certain operations/regions. This information, together with direct engagement with business units and other relevant internal stakeholders, as well as a review of the external environment as it relates to climate change, form the foundation for the climate change strategy development and review process. The climate projections at our De Beers Venetia mine, for example, were considered along with mine operational information and insights from line managers and other stakeholders – including environmental and social specialists, engineers and external consultants – in order to understand the operational context and identify vulnerabilities and related climate risks and opportunities. ii) There are three main aspects of climate change that have influenced our business strategy: changes in the demand for some of our products associated with carbon mitigation imperatives (for example, platinum is increasingly used in low-carbon technologies such a fuel cells); the effects of climate regulation and taxation on the performance of parts of our business (e.g. increased operating costs); and the physical and social impacts of a changing climate and their potential impacts on our operations (including security of energy supply) and host communities. iii) In the short term (1-5 years), climate change has driven the more efficient use of energy as well as emissions reductions via the ECO2MAN programme. The programme was introduced following performance benchmarking exercises and pilot studies at our operations. The initial five-year ECO2MAN programme targets were to reduce energy consumption by 7% and GHG emissions by 19% against the 2015 business as usual plan. New targets have now been set for each business unit and for the Group. As an integral part of Anglo American strategy, the proposed 2020 targets will support enhanced business performance through cost reduction and aligns with the environmental value pillar objectives of energy and GHG emissions management. The Anglo American Operating Model provides the framework for integrating energy and emissions management into the business process. The “analyse and improve” and the “service strategy” elements of the operating model are most applicable. Climate change has also triggered a series of climate adaptation studies and adaptation plans for high risk assets and projects and raised various opportunities and challenges in relation to certain products. iv) The most significant long-term (5-20 year) strategic consideration related to climate change for Anglo American has been potential risks associated with thermal coal assets in the Group’s portfolio. While this risk was taken into account when deciding to focus our portfolio on PGMs, copper and diamonds (and divest coal

assets) it proved not to be the deciding factor given the view of global experts that coal will continue to play an important role as a primary energy source until at least 2040 – even in scenarios that limit global average temperature increases to 2’C. Despite our decision to exit from our coal assets, we believe that it would be irresponsible, and detrimental to the development prospects of many of the world's emerging economies and poorest countries, to simply stop mining coal. To date, our responsible approach has focused on collaborating in the research and development of pragmatic solutions that manage the carbon impacts of coal through new and advanced technologies. Anglo American Platinum is considering the potential development and use of less carbon-intensive energy sources including biomass, biodiesel and solar and is investing in growing an alternative market for PGMs in the development of cleaner technologies v) Our operational GHG and energy reduction programme reduces our exposure to carbon taxation and delivers energy cost savings beyond what we believe our competitors are achieving. We are also playing a leading role in driving demand for low carbon technologies that rely on our products (e.g. R&D of platinum-based fuel cells). vi) The most substantial business decisions that have been made in the context of climate change relate to our position on coal mining (as described in point iv); our investment in the development of low-emission technologies that utilize significant quantities of PGMs and in 2015, the setting of new long term carbon reduction targets. . With regards to our disposal of coal assets, climate change was a consideration, but proved not to be the deciding factor given our position that coal will continue to play an important role in energy production and needs to be phased out responsibly over the medium term (over which time our coal assets would naturally have come to the end of their commercially viable ore reserves). Climate change and the world’s increasing demand for low-carbon technologies was an important factor in decision to focus on PGMs as core commodities. The new targets have been set in the context of capital constraints and market complexities and uncertainties. In addition to our focus on GHG management, we continue to investigate opportunities for carbon-offsetting partnerships. We have identified opportunities and developed strategies for their implementation once the carbon trading market develops. Other examples include: • Our Australian Coal operations extended the capture and use of methane rich gas from underground operations for power generation plants and gas exports. A 21 MW New Power Station is to be constructed at Grosvenor during 2016. • De Beers has undertaken early work to explore the potential for mineral carbonation through kimberlite tailings, since the nature of the kimberlite allows for carbon sequestration once exposed at the earth’s surface. A desktop project was proposed for 2016.
CC2.2b
Please explain why climate change is not integrated into your business strategy
CC2.2c
Does your company use an internal price of carbon? Yes

CC2.2d
Please provide details and examples of how your company uses an internal price of carbon Anglo American uses a carbon price that aligns with relevant policies in the countries in which we operate. In South Africa the carbon tax has been put into the budget guidelines with reference to scope 1 emissions in particular. The tax will commence at an initial rate of R120/tonne CO2e, with 10% per annum escalation up until 2020, at which point the tax rate and tax-free exemptions will come under review. Current tax-free exemptions and other measures (e.g. offsets) are provided to manage the transition over time. Changes to earlier versions of the tax design include the intention to have a neutral impact on the price of electricity. The pricing aligns with the carbon tax design (R120 per tonne with various exemptions that takes it down to an average rate of R48 per tonne). In Our For At our Australian business we previously used a carbon price aligned with the governments carbon pricing mechanism, but no longer do so since the tax was repealed. We are currently assessing long term carbon pricing scenarios that impact on the global business, including the demand for our products.
CC2.3
Do you engage in activities that could either directly or indirectly influence public policy on climate change through any of the following? (tick all that apply) Trade associations Funding research organizations Other
CC2.3a
On what issues have you been engaging directly with policy makers?
Focus of legislation
Corporate Position
Details of engagement
Proposed legislative solution
CC2.3b

Are you on the Board of any trade associations or provide funding beyond membership? Yes
CC2.3c
Please enter the details of those trade associations that are likely to take a position on climate change legislation
Trade association
Is your position on
climate change
consistent with
theirs?
Please explain the trade association's position
How have you, or are you attempting to, influence the position?
Industry Task Team on Climate Change (ITTCC)
Consistent
We Chair the ITTCC in South Africa, which is a non-profit organization that represents energy-intensive industries. The ITTCC is committed to working with industry, business groups and government departments to ensure sustainable economic growth while transitioning to a low-carbon economy. The ITTCC’s role is to undertake technical, fact-based studies to ensure that South Africa’s policies on Climate Change are based on the best information and best practice and prescribe tangible, achievable ends. As an example, Anglo American's Stan Pillay, Chairman of the ITTCC, represented both the ITTCC and BUSA at the ‘intended nationally determined contribution’ (INDC) Parliamentary public hearings in September 2015.
Anglo American actively participates in meetings, provides expert advice and has supported a piece of work to provide a fact base to inform policy development.
International Council on Mining and Metals (ICMM)
Consistent
Anglo American’s CEO is Chairman of the ICMM and we participate in its climate change working group. As a member, Anglo American has signed up to the organisation’s Principles for Climate Change Policy Design. In summary, the principles for climate change policy design are: •provide clear policies for a predictable, measured transition to a long term price on greenhouse gas emissions •apply climate change related revenues to manage a transition to a low carbon future •facilitate trade competitiveness across sectors •seek broad-based application •be predictable and gradual •be simple and effective •support low-emission base-load generation technology development.
Anglo American provided commentary on drafts of this position through participation on the working group.
Chamber of Mines in South Africa
Consistent
Anglo American’s CEO is a council member of the Chamber of Mines (CoM), which holds a range of positions on carbon policy issues. In general, the CoM seeks to ensure that environmental issues are addressed in a manner that enhances members' contribution to sustainable development and ensures that
Anglo American provided commentary into the process – the company is supportive of carbon mitigation mechanisms in a way that does not compromise socio-economic imperatives.

Trade association
Is your position on
climate change
consistent with
theirs?
Please explain the trade association's position
How have you, or are you attempting to, influence the position?
risks to the viability of the mining industry are identified and managed. The CoM was not supportive of the carbon tax as proposed.
CC2.3d
Do you publicly disclose a list of all the research organizations that you fund? No
CC2.3e
Please provide details of the other engagement activities that you undertake Anglo American undertakes a range of engagements specific to various countries in which we operate. For example: • Anglo American, through our Nickel, Niobium and Phosphates (NNP) operations, was the first mining company to join the Climate Protocol of the State of São Paulo. The initiative is part of the São Paulo State strategy to reduce GHG emissions and take actions to adapt to climate change. This is a pioneering initiative in Brazil presented by the Secretariat of Environment of São Paulo, during the COP-21. In line with Anglo American’s support of a fact base informing policy, NNP has also partnered with the Sustainability Study Center of the School of Business Administration of the Getulio Vargas Foundation. One project aims to estimate the financial gain of using woodchips as fuel for the Codemin process instead of coal. Reforestation activities are in place to produce wood used as energy in the kilns of Codemin and in the Catalão dryers. New uses for wood, such as in the nickel ore drying process, are being evaluated. • In South Africa, Anglo American participates in a wide spectrum of policy engagement processes through its membership of the National Business Initiative (NBI) and Business Unity South Africa (BUSA). The NBI is a voluntary association of companies mobilising business leadership and resources for specific sustainability objectives. Anglo American engages with the NBI and feeds into workshops and research processes. BUSA is the representative body of organized business in South Africa. BUSA has played a leading role in facilitating climate change policy workshops and submitting formal comments to the national government in relations to the proposed carbon tax, carbon budgets, pollution prevention plans, GHG reporting, the ‘desired emission reduction outcomes’ and the country’s ‘intended nationally determined contribution’. These engagements are undertaken as members of the ITTCC and the Chamber of Mines. Anglo American also served as Chair of the Energy Efficiency Leadership Network (EELN): a collaboration between the Department of Energy (DOE), NBI, and BUSA to assist the South African business sector with skills and capacity building on energy management and sharing of best practice. • Our copper operations have shared experiences in energy efficiency with government and other companies in workshops and meetings designed to inform a new energy regulation for 2020 in Chile.

CC2.3f
What processes do you have in place to ensure that all of your direct and indirect activities that influence policy are consistent with your overall climate change strategy? Since our prior CDP submission, we have conducted a full review of the climate change positions and activities of organisations that Anglo American and our business units are members of to ensure that those organisations do not hold positions on climate change that are contrary to our own. In addition, Anglo American’s policy and position on climate change is approved by the General Management Committee and the Board Sustainability Committee. As such, every business unit is responsible for ensuring that direct and indirect activities are consistent with the Group climate change policy and position.
CC2.3g
Please explain why you do not engage with policy makers
Further Information
Page: CC3. Targets and Initiatives
CC3.1
Did you have an emissions reduction or renewable energy consumption or production target that was active (ongoing or reached completion) in the reporting year? Absolute target
CC3.1a

Please provide details of your absolute target
ID
Scope
% of emissions in
scope
% reduction
from base year
Base year
Base year emissions covered by
target (metric tonnes CO2e)
Target year
Is this a science-based target?
Comment
Abs1 Scope 1+2 (location-based)
100% 19% 2011 18774226 2015
No, but we anticipate setting one in the next 2 years
Our overall targets for greenhouse gas (GHG)-emission reduction is 19% by 2015, with 2011 as a base year. Emissions are projected based on circumstances in line with operating plans (stripping ratios, ore hardness, haul distances, expansions and closures, etc.) and then performance is measured, ex-post, in line with the World Resources Institute’s (WRI) Policy and Action Standard. Improvements are achieved by selecting and implementing high value energy efficiency and GHG mitigating and include projects undertaken through operational improvements and supply chain procurement. In 2011, we launched our operational energy- and carbon management programme, ECO2MAN, following increased recognition of our responsibility to reduce operational GHG emissions, as well as growing concern over the potential bearing on business of the policy responses to climate change. Through ECO2MAN, we have been able to analyse our activities and identify opportunities to reduce energy consumption and carbon emissions. This understanding formed the basis for setting our ambitious target to reduce GHG emissions by 19% against our adjusted 2015 baseline consumption. ECO2MAN is supported by a mandatory carbon and energy technical standard and related guidance. Anglo American has set a new long term target extend our 19% reduction to 22% relative to an adjusted baseline in 2020 (subject to divestments and significant business changes).
Abs2 Scope 1+2 (location-based)
100% 22% 2015 18227939 2020
No, but we anticipate setting one in the next 2 years
We have set new long-term targets for energy (extended to 8%) and GHGs (extended to 22%) reduction by 2020. The method adopted again conforms with the WRI’s Policy and Action Standard.

CC3.1b
Please provide details of your intensity target
ID
Scope
% of emissions in
scope
% reduction from base
year
Metric
Base year
Normalized base year emissions covered by
target
Target year
Is this a science-based target?
Comment
CC3.1c
Please also indicate what change in absolute emissions this intensity target reflects
ID
Direction of change anticipated in absolute Scope 1+2 emissions at
target completion?
% change anticipated in absolute Scope 1+2
emissions
Direction of change anticipated in absolute Scope 3 emissions at target
completion?
% change anticipated in absolute Scope 3
emissions
Comment
CC3.1d
Please provide details of your renewable energy consumption and/or production target

ID
Energy types
covered by target
Base year
Base year energy for energy type covered
(MWh)
% renewable
energy in base year
Target year
% renewable
energy in target year
Comment
CC3.1e
For all of your targets, please provide details on the progress made in the reporting year
ID
% complete (time)
% complete (emissions or
renewable energy)
Comment
Abs1 100% 100%
In 2015, our ECO2MAN energy- and GHG-reduction programme prevented 4.6 million tonnes of CO2 -equivalent emissions from entering the atmosphere. Through ECO2MAN, we were able to reduce our GHG emissions by 22% in relation to our adjusted 2015 consumption baseline, thereby exceeding our reduction target
Abs2 17% 14% In 2015 we exceeded the previous target by 3% reduction relative to the adjusted baseline. This represents 14% of the extended target of an additional 22% reduction below the adjusted baseline, by 2020.
CC3.1f
Please explain (i) why you do not have a target; and (ii) forecast how your emissions will change over the next five years
CC3.2

Do you classify any of your existing goods and/or services as low carbon products or do they enable a third party to avoid GHG emissions? Yes
CC3.2a
Please provide details of your products and/or services that you classify as low carbon products or that enable a third party to avoid GHG emissions
Level of
aggregation
Description of product/Group of
products
Are you
reporting low carbon product/s or avoided emissions?
Taxonomy, project or
methodology used to classify product/s as low
carbon or to calculate avoided
emissions
%
revenue from low carbon
product/s in the
reporting year
% R&D in
low carbon product/s
in the reporting
year
Comment
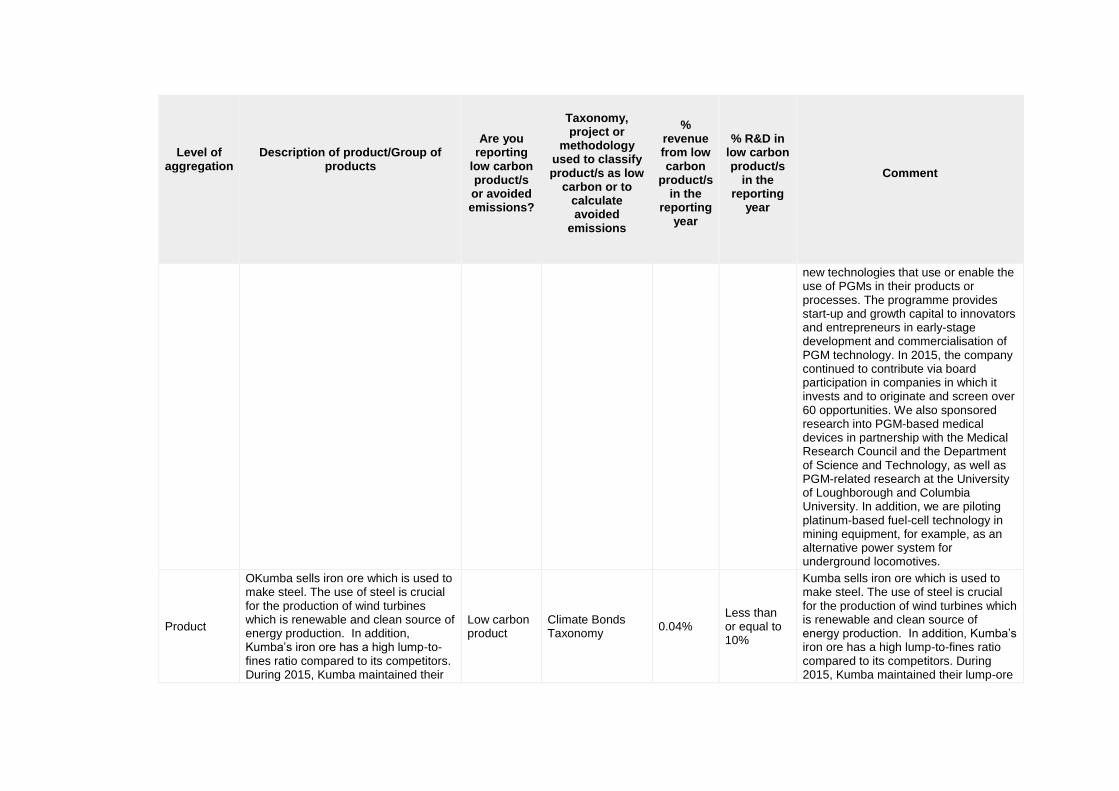
Product
Platinum-based proton exchange membrane (PEM) fuel cells systems are cost-effective replacements for conventional batteries or diesel generators in rural schools, clinics and communities far from existing power grids. Fuel cells produce electricity by combining hydrogen (the fuel) and oxygen (from air) over a platinum catalyst. Fuel cells in vehicles are approximately 14% more energy efficient than new petrol/diesel internal combustion engines. Fuel cells also enable greater penetration of renewable energy technologies
Avoided emissions
Other: own calculations in line with IPA LCA results
21.3%
More than 60% but less than or equal to 80%
In 2015, we sponsored three hydrogen-based fuel cells at three schools in the Cofimvaba district as part of the South African Department of Science and Technology’s TECH4RED programme. Anglo American Platinum and the government feel that strengthening research capacity and building skills in the fields of science and engineering will support the development of new PGM products over time. Accordingly, the company supported two fuel cell-related research programmes at the North West University and University of Cape Town, both in partnership with the Department of Science and Technology’s HySA programme. The PGM investment programme was created to invest in
Level of
aggregation
Description of product/Group of
products
Are you
reporting low carbon product/s or avoided emissions?
Taxonomy, project or
methodology used to classify product/s as low
carbon or to calculate avoided
emissions
%
revenue from low carbon
product/s in the
reporting year
% R&D in
low carbon product/s
in the reporting
year
Comment
new technologies that use or enable the use of PGMs in their products or processes. The programme provides start-up and growth capital to innovators and entrepreneurs in early-stage development and commercialisation of PGM technology. In 2015, the company continued to contribute via board participation in companies in which it invests and to originate and screen over 60 opportunities. We also sponsored research into PGM-based medical devices in partnership with the Medical Research Council and the Department of Science and Technology, as well as PGM-related research at the University of Loughborough and Columbia University. In addition, we are piloting platinum-based fuel-cell technology in mining equipment, for example, as an alternative power system for underground locomotives.
Product
OKumba sells iron ore which is used to make steel. The use of steel is crucial for the production of wind turbines which is renewable and clean source of energy production. In addition, Kumba’s iron ore has a high lump-to-fines ratio compared to its competitors. During 2015, Kumba maintained their
Low carbon product
Climate Bonds Taxonomy
0.04% Less than or equal to 10%
Kumba sells iron ore which is used to make steel. The use of steel is crucial for the production of wind turbines which is renewable and clean source of energy production. In addition, Kumba’s iron ore has a high lump-to-fines ratio compared to its competitors. During 2015, Kumba maintained their lump-ore

Level of
aggregation
Description of product/Group of
products
Are you
reporting low carbon product/s or avoided emissions?
Taxonomy, project or
methodology used to classify product/s as low
carbon or to calculate avoided
emissions
%
revenue from low carbon
product/s in the
reporting year
% R&D in
low carbon product/s
in the reporting
year
Comment
lump-ore to fine-ore ratio at 65:35. This ratio affects the amount of energy required in the sintering process in steel making. A high lump-to-fines ratio enables a significant reduction of emissions.
to fine-ore ratio at 65:35. This ratio affects the amount of energy required in the sintering process in steel making. A high lump-to-fines ratio enables a significant reduction of emissions.
Product
Copper is used in several low-carbon technology and energy efficiency applications. Use of copper in transmission and distribution lines can reduce losses and therefore reduce emissions associated with fossil fuel based power. Electric vehicles and various renewable energy technologies rely on copper. Copper is also used in ICT equipment that can enable dematerialisation and avoid GHG emissions.
Avoided emissions
Other: own calculations in line with the GHG Protocol Standards for emissions accounting
15.4% Less than or equal to 10%
The European Copper Institute estimates that incorporating one extra kilogram of copper into expanding the copper conductor diameter can save between 100 and 7,500 kilograms of CO2e emissions.
CC3.3
Did you have emissions reduction initiatives that were active within the reporting year (this can include those in the planning and/or implementation phases) Yes
CC3.3a

Please identify the total number of projects at each stage of development, and for those in the implementation stages, the estimated CO2e savings
Stage of development
Number of projects
Total estimated annual CO2e savings in metric tonnes CO2e (only for rows marked *)
Under investigation 162 270000
To be implemented* 170 246000
Implementation commenced* 91 188000
Implemented* 324 4600000
Not to be implemented 70 42000
CC3.3b
For those initiatives implemented in the reporting year, please provide details in the table below
Activity type
Description of activity
Estimated annual CO2e
savings (metric tonnes CO2e)
Scope
Voluntary/ Mandatory
Annual monetary savings
(unit currency
- as specified in CC0.4)
Investment required
(unit currency -
as specified in CC0.4)
Payback period
Estimated lifetime of
the initiative
Comment
Fugitive emissions reductions
Coal Australia continued to invest in additional capture and use of rich gas from underground operations through power generation plants and gas exports. The
320000 Scope 1
Voluntary
With regular planned maintenance, this initiative is expected to last to the end of life of mine or until new technology, with better

Activity type
Description of activity
Estimated annual CO2e
savings (metric tonnes CO2e)
Scope
Voluntary/ Mandatory
Annual monetary savings
(unit currency
- as specified in CC0.4)
Investment required
(unit currency -
as specified in CC0.4)
Payback period
Estimated lifetime of
the initiative
Comment
savings were estimated to be able to generate a potential AUD$7,3M per year on the basis of the CPM (which has since been repealed). This initiative supports the achievement of Anglo American's Scope 1 and 2 emission reduction targets.
returns/savings, is developed and applied.
Energy efficiency: Processes
Nickel Niobium and Phosphates improved energy efficiency as a result of the furnace re-build programme at Barro Alto completed in 2015. This initiative affects an entire production line: refining, kilns and auxiliary systems such as off-gas, generators, etc. This resulted in a 21% reduction in CO2 relative to 2014. This initiative supports the achievement of Anglo American's Scope 1 and 2 emission reduction targets.
10408
Scope 2 (location-based)
Voluntary
6000000
With regular planned maintenance, this initiative is expected to last to the end of life of mine or until new technology, with better returns/savings, is developed and applied.
Activity type
Description of activity
Estimated annual CO2e
savings (metric tonnes CO2e)
Scope
Voluntary/ Mandatory
Annual monetary savings
(unit currency
- as specified in CC0.4)
Investment required
(unit currency -
as specified in CC0.4)
Payback period
Estimated lifetime of
the initiative
Comment
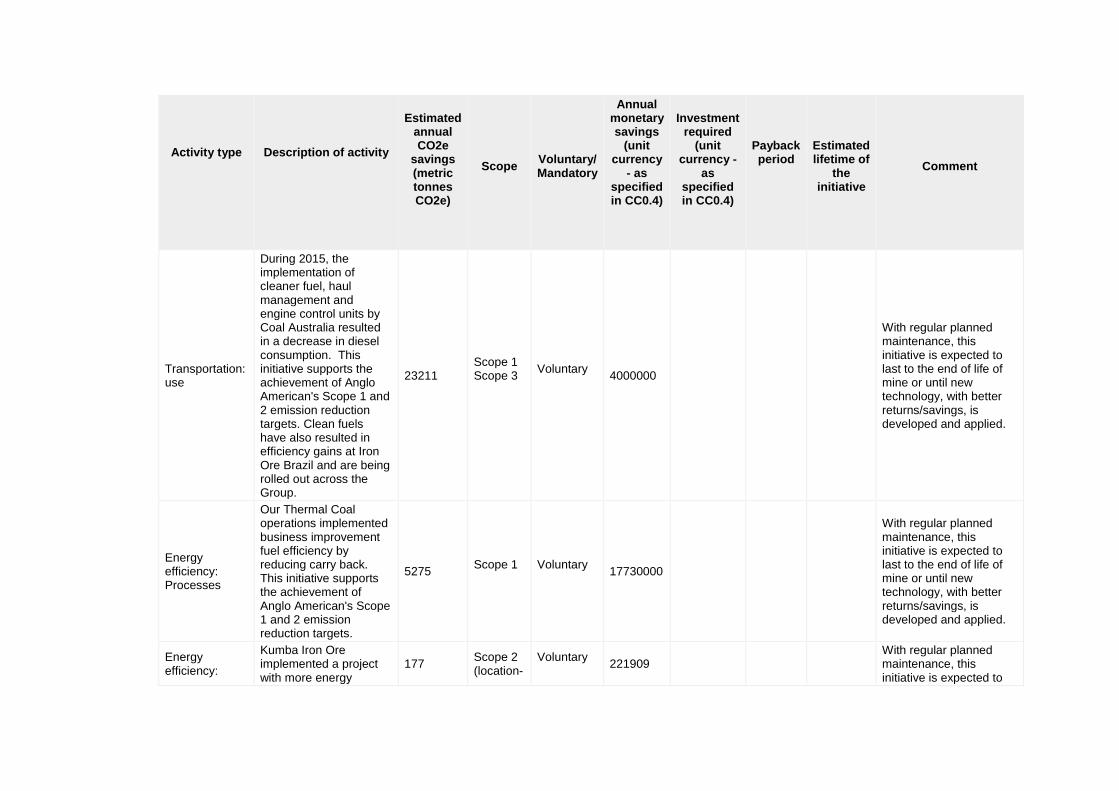
Transportation: use
During 2015, the implementation of cleaner fuel, haul management and engine control units by Coal Australia resulted in a decrease in diesel consumption. This initiative supports the achievement of Anglo American's Scope 1 and 2 emission reduction targets. Clean fuels have also resulted in efficiency gains at Iron Ore Brazil and are being rolled out across the Group.
23211 Scope 1 Scope 3
Voluntary
4000000
With regular planned maintenance, this initiative is expected to last to the end of life of mine or until new technology, with better returns/savings, is developed and applied.
Energy efficiency: Processes
Our Thermal Coal operations implemented business improvement fuel efficiency by reducing carry back. This initiative supports the achievement of Anglo American's Scope 1 and 2 emission reduction targets.
5275 Scope 1
Voluntary
17730000
With regular planned maintenance, this initiative is expected to last to the end of life of mine or until new technology, with better returns/savings, is developed and applied.
Energy efficiency:
Kumba Iron Ore implemented a project with more energy
177 Scope 2 (location-
Voluntary
221909 With regular planned maintenance, this initiative is expected to

Activity type
Description of activity
Estimated annual CO2e
savings (metric tonnes CO2e)
Scope
Voluntary/ Mandatory
Annual monetary savings
(unit currency
- as specified in CC0.4)
Investment required
(unit currency -
as specified in CC0.4)
Payback period
Estimated lifetime of
the initiative
Comment
Building services
efficient screens and lighting at Thabazimbi. This initiative supports the achievement of Anglo American's Scope 1 and 2 emission reduction targets.
based)
last to the end of life of mine or until new technology, with better returns/savings, is developed and applied.
Transportation: use
Anglo American Platinum and copper operations implemented more fuel efficient haul trucks, optimised loading and cycle times. These initiatives support the achievement of Anglo American's Scope 1 and 2 emission reduction targets.
19485 Scope 1
Voluntary
6500000 18779343 1-3 years
6-10 years
With regular planned maintenance, this initiative is expected to last to the end of life of mine or until new technology, with better returns/savings, is developed and applied.
Energy efficiency: Processes
Anglo American Platinum invested in additional energy efficient composite fans at Bathopele Mine, Thembelani Mine, Khuseleka Mine, Siphumelele 1 Mine, Dishaba Mine, Tumela Mine and Twickenham Mine. The more efficient fans replaced the previous generation of
14880
Scope 2 (location-based)
Voluntary
615048 0 4-10 years
6-10 years
With regular planned maintenance, this initiative is expected to last to the end of life of mine or until new technology, with better returns/savings, is developed and applied.

Activity type
Description of activity
Estimated annual CO2e
savings (metric tonnes CO2e)
Scope
Voluntary/ Mandatory
Annual monetary savings
(unit currency
- as specified in CC0.4)
Investment required
(unit currency -
as specified in CC0.4)
Payback period
Estimated lifetime of
the initiative
Comment
in-stope ventilation fans. This initiative supports the achievement of Anglo American's Scope 1 and 2 emission reduction targets.
Energy efficiency: Processes
Anglo American Platinum invested in Fridge Plant cooling optimisation (cooling auxiliaries) at Dishaba mine. This initiative supports the achievement of Anglo American's Scope 1 and 2 emission reduction targets.
20557
Scope 2 (location-based)
Voluntary
1072502 257870 <1 year 3-5 years
With regular planned maintenance, this initiative is expected to last to the end of life of mine or until new technology, with better returns/savings, is developed and applied.
Waste recovery
Anglo American Platinum commissioned a waste heat recovery system at our ACP (converting) operation which generates about 4.3 MW of electrical power from waste heat from the converter using an organic rankine cycle (ORC) process. This initiative supports the achievement of Anglo American's Scope 1 and
6252
Scope 2 (location-based)
Voluntary
0 0 16-20 years
11-15 years
The Eternity Power Thermal Harvesting™ project which was commissioned in June 2015 and developed by Vuselela Energy in collaboration with Anglo American Platinum at a total project cost of R150 million. This ground-breaking initiative uses waste heat from the ACP convertor cooling circuit to evaporate an organic

Activity type
Description of activity
Estimated annual CO2e
savings (metric tonnes CO2e)
Scope
Voluntary/ Mandatory
Annual monetary savings
(unit currency
- as specified in CC0.4)
Investment required
(unit currency -
as specified in CC0.4)
Payback period
Estimated lifetime of
the initiative
Comment
2 emission reduction targets.
liquid and drive an expansion turbine. The plant has an installed capacity of 5 MW of which 4.3 MW is available to the grid reducing Anglo American Platinum’s capacity bought from Eskom. The amount of power generate also results in a reduction of the smelter’s carbon footprint and a more efficient use of energy.
Other
Anglo American Platinum initiated a domestic waste recycling campaign at our Rustenburg operations. A contract for sorting and recycling domestic waste was implemented in September 2015. Monthly waste has been reduced from 813 tonnes/ month on average to 576 tonnes/month for the same waste category.
35 Scope 3
Voluntary
0 0 <1 year <1 year

Activity type
Description of activity
Estimated annual CO2e
savings (metric tonnes CO2e)
Scope
Voluntary/ Mandatory
Annual monetary savings
(unit currency
- as specified in CC0.4)
Investment required
(unit currency -
as specified in CC0.4)
Payback period
Estimated lifetime of
the initiative
Comment
Transportation: fleet
Anglo American's Kumba Iron Ore implemented a range of emission reduction initiatives across its fleet. This included improving the payload management system at Kolomela and Sishen mines, extending the diesel energy efficiency management system (DEEMS) to Kolomela’s loading equipment vehicle fleet, optimising the loading of haul trucks at Kolomela, fuel consumption improvements at Sishen mine through derating the haul truck engines through adjustments on engine by the original equipment manufacturer and a recalibration project for its Komatsu 730E AC. Beyond the direct scope 1 emissions reductions Kumba’s scope 3 emissions from fuel- and energy-related activities (not included in
12764 Scope 1 Scope 3
Voluntary
4758516 97028 <1 year 21-30 years
These interventions have been captured in standard operating procedures so this practice will continue for the life of the mines.

Activity type
Description of activity
Estimated annual CO2e
savings (metric tonnes CO2e)
Scope
Voluntary/ Mandatory
Annual monetary savings
(unit currency
- as specified in CC0.4)
Investment required
(unit currency -
as specified in CC0.4)
Payback period
Estimated lifetime of
the initiative
Comment
Scopes 1 and 2)will also be reduced. These initiatives supports the achievement of Anglo American's Scope 1 and 2 emission reduction targets.
CC3.3c
What methods do you use to drive investment in emissions reduction activities?
Method
Comment
Compliance with regulatory requirements/standards
Our Group Technical Standard (GTS 23) has been rolled-out across the business, and sets out the minimum requirements for carbon and energy performance management. Implementation of GTS 23 within the business units is supported by our Safety and Sustainable Development corporate function.
Dedicated budget for low carbon product R&D
Anglo American has launched a $100 million fund to invest in platinum-based technology companies in South Africa. Platinum-based fuel cells provide a significant economic and environmental development opportunity for the country by facilitating the provision of clean, reliable and cost-effective power. In Australia, we hold a 19.2% interest in MBD Energy, which is undertaking applied research into an algal synthesiser process that involves entrapping CO2 from power station fuel gases for the production of biodiesel and other by-products.
Internal price of carbon An internal price of carbon is used for the budgeting process for scope 1 emissions in South Africa, and as a downside risk for scope 2, Sensitivity testing against carbon pricing scenarios is done for coal.

Method
Comment
Dedicated budget for energy efficiency
Each of our business units are required to budget for projects (and where necessary the capital requirements) to meet their energy and carbon emissions savings targets which have been decided through the implementation of ECO2MAN.
CC3.3d
If you do not have any emissions reduction initiatives, please explain why not
Further Information
Page: CC4. Communication
CC4.1
Have you published information about your organization’s response to climate change and GHG emissions performance for this reporting year in places other than in your CDP response? If so, please attach the publication(s)
Publication
Status
Page/Section reference
Attach the document
Comment
In mainstream reports (including an integrated report) but have not used the CDSB Framework
Complete Develop core business processes- 27-28; Key Performance Indicators- 34-35
https://www.cdp.net/sites/2016/72/772/Climate Change 2016/Shared Documents/Attachments/CC4.1/aa-ar-15.pdf
In voluntary communications Complete
Key public policy engagement issues and responses- 19; Material issues- 21-23; Corporate Social Investment – 52; water quality – 59; Energy security – 65-68; Stakeholder engagement- 82.
https://www.cdp.net/sites/2016/72/772/Climate Change 2016/Shared Documents/Attachments/CC4.1/aa-sdreport-2015.pdf

Further Information
Module: Risks and Opportunities
Page: CC5. Climate Change Risks
CC5.1
Have you identified any inherent climate change risks that have the potential to generate a substantive change in your business operations, revenue or expenditure? Tick all that apply Risks driven by changes in regulation Risks driven by changes in physical climate parameters Risks driven by changes in other climate-related developments
CC5.1a
Please describe your inherent risks that are driven by changes in regulation
Risk driver
Description
Potential impact
Timeframe
Direct/ Indirect
Likelihood
Magnitude of impact
Estimated financial
implications
Management
method
Cost of
management
Carbon taxes
Following on the initial discussion paper (2010) on carbon tax and subsequent policy drafts, the National Treasury released the draft carbon tax bill in November
Increased operational cost
1 to 3 years
Direct Very likely High
The estimated exposure to carbon tax is R50 million ($3.9 million)
Anglo American’s ECO2MAN energy and GHG management programme mitigates our exposure to carbon taxation by reducing operational GHG emissions by
An estimated $12 million has been invested in energy savings projects, research, policy development and developing climate change

Risk driver
Description
Potential impact
Timeframe
Direct/ Indirect
Likelihood
Magnitude of impact
Estimated financial
implications
Management
method
Cost of
management
2015 for public comment. Comments on the socio-economic impacts, the design details and administration of the bill were received until 15 December 2015. Anglo American submitted comments on the Draft Carbon Tax Bill Changes to previous version of the design include the intention to have a neutral impact on the price of electricity. There remains significant opposition to the carbon tax, including from within government. If implemented, the scheme is expected to commence in 2017. The tax will commence at an initial rate of R120/tonne CO2e, with 10% per annum escalation
4.6Mt during 2015 (and ~$100 million in avoided energy costs throughout the Group). We have set new standards on operation energy efficiency across the Group. An example of this is our underground mine ventilation system optimisation initiatives, which has allowed us to avoid an estimated R80 million ($7.4 million) per annum as well as 16,998 tCO2e per annum in emissions. In addition, the possibility of reducing the utility’s environmental levies to mitigate some of the impact of the carbon taxes is being discussed with the government. Challenges exist with regard to reducing GHG emissions associated with our South African coal operations. Currently, there are
fact bases in South Africa since 2011.

Risk driver
Description
Potential impact
Timeframe
Direct/ Indirect
Likelihood
Magnitude of impact
Estimated financial
implications
Management
method
Cost of
management
up until 2020, at which point the tax rate and tax free exemptions will come under review.
no viable technologies to extract low-concentration fugitive methane from mine ventilation air. We have made use of mobile flaring units at New Denmark colliery in South Africa to reduce the intermittent methane volumes drained from boreholes drilled into underground workings. These flares have not been operating for approximately 18 months due to the very low inherent methane concentrations. Carbon offset projects will be pursued to further reduce emissions. Our budget guidelines include provision for the SA carbon tax and the guidance for new investments evaluations include

Risk driver
Description
Potential impact
Timeframe
Direct/ Indirect
Likelihood
Magnitude of impact
Estimated financial
implications
Management
method
Cost of
management
sensitivity to carbon pricing.
International agreements
COP 21 concluded with the Paris Agreement, which has the purpose to: • Hold the increase in global average temperatures to well below 2˚C, and pursue efforts to achieve 1.5˚C above pre-industrial levels; • Improve the ability to adapt to adverse climate change and foster low carbon emissions development; and • Support funding, consistent with a pathway towards low carbon emissions and climate resilient development. The Paris Agreement marks a milestone in climate negotiations and for the first time establishes a regime to limit global warming to
Other: Uncertainty and variation of regulatory impact across the portfolio
3 to 6 years
Direct Likely Unknown
Financial implications will only become evident as countries develop and implement domestic policies that will impact our different operations.
The Anglo American Operating Model provides the framework for integrating energy and emissions management into the business process. We have implemented ECO2MAN across the Group, with an emphasis on implementing energy and emission savings. ECO2MAN is underpinned by a technical standard and site level reduction targets. In October 2015, the Board Sustainability Committee ratified the Anglo American 2020 reduction targets of 8% for energy and 22% for GHG emissions. These targets were derived taking into account the current cash flow and economic
Costs form part of overall operating costs.

Risk driver
Description
Potential impact
Timeframe
Direct/ Indirect
Likelihood
Magnitude of impact
Estimated financial
implications
Management
method
Cost of
management
below 2˚C. The negotiated outcomes will influence national policies and energy technology choices for decades into the future. All countries in which Anglo American operates will be required to contribute to the global effort to deliver on the Paris Agreement. Domestic policies will likely follow where they are not in place already presenting a portfolio risk. For Anglo American the Agreement provides further signals that the global economy is becoming increasingly carbon constrained and as such we need to continue with efforts to reduce our direct and value chain emissions in order to remain competitive. Key
constraints. We are working with recognised experts on climate science such as the UK Meteorological Office to understand and prioritise adaptation controls to future climate and extreme weather risks. For vulnerable operations, the Anglo American ORM process is used to evaluate climate risks and critical controls. Adaptation measures are also considered in new project stage gate evaluations. We are working with governments and industry to develop equitable and effective climate change policies and technologies to facilitate the transition to a lower carbon future. The engagements with the South African government on carbon tax and

Risk driver
Description
Potential impact
Timeframe
Direct/ Indirect
Likelihood
Magnitude of impact
Estimated financial
implications
Management
method
Cost of
management
impacts for our business include: • Changing demand and markets for our products: In the transition to a low carbon future, thermal coal becomes vulnerable, whilst platinum and copper could benefit from new energy technology markets; • Increasing disclosure and regulatory compliance: Energy and GHG emissions policies will establish more stringent reduction goals, affecting our global operations; and • Site impacts: Integrating our adaptation to the physical impacts of climate change, such as water scarcity and more frequent extreme weather with local planning.
energy efficiency incentives are ongoing. A range of carbon pricing and offset/incentive policies expected to emerge in all our operating geographies.

CC5.1b
Please describe your inherent risks that are driven by changes in physical climate parameters
Risk driver
Description
Potential impact
Timeframe
Direct/ Indirect
Likelihood
Magnitude of impact
Estimated financial
implications
Management
method
Cost of
management
Change in mean (average) temperature
Anglo American has, in collaboration with research partners, run initial assessments on the susceptibility of some sites to the physical aspects of climate change. The findings of these assessments are often region/site specific but can be extrapolated to the majority of our operations to predict localized increases in temperatures of about 2-6 degrees Celsius by 2040/2050. An increase in temperature has implications for
Increased capital cost
>6 years Direct More likely than not
Medium-high
Unknown
Direct management action has not been taken given the long-term and uncertain nature of the risk. Management action has been focused on understanding the potential changes and required monitoring and critical controls.
Costs of various adaptation studies have amounted to $494,100.
Risk driver
Description
Potential impact
Timeframe
Direct/ Indirect
Likelihood
Magnitude of impact
Estimated financial
implications
Management
method
Cost of
management
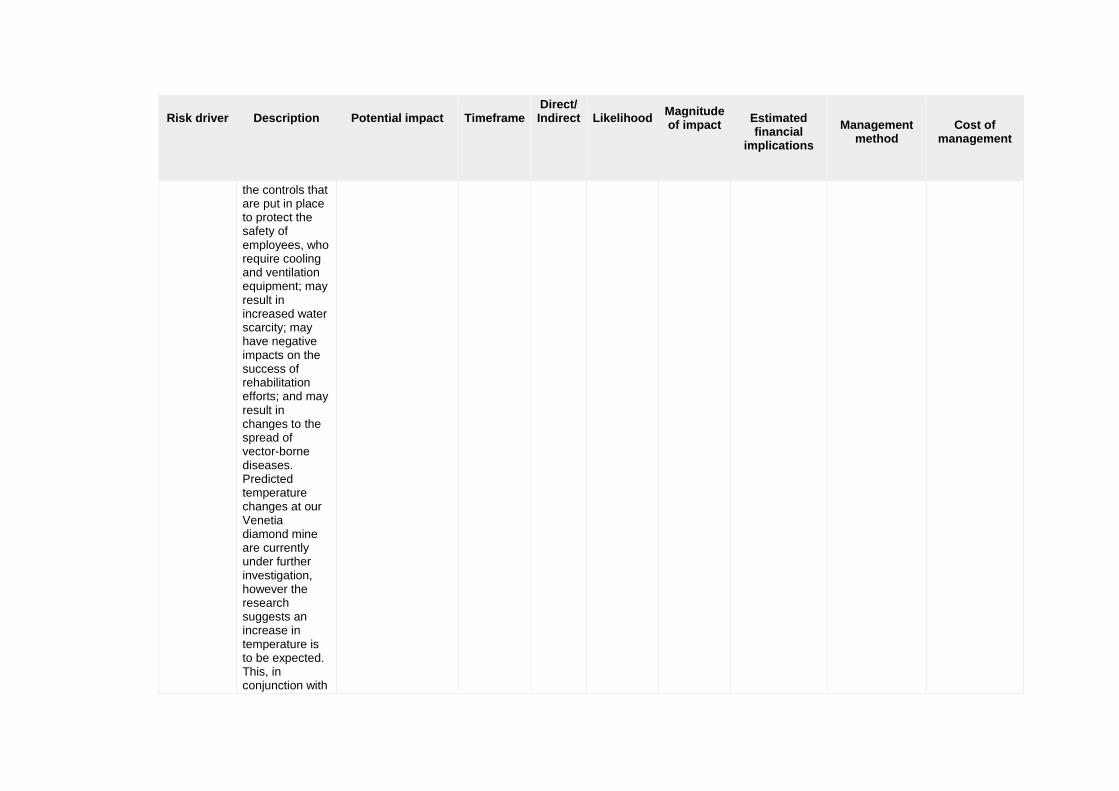
the controls that are put in place to protect the safety of employees, who require cooling and ventilation equipment; may result in increased water scarcity; may have negative impacts on the success of rehabilitation efforts; and may result in changes to the spread of vector-borne diseases. Predicted temperature changes at our Venetia diamond mine are currently under further investigation, however the research suggests an increase in temperature is to be expected. This, in conjunction with

Risk driver
Description
Potential impact
Timeframe
Direct/ Indirect
Likelihood
Magnitude of impact
Estimated financial
implications
Management
method
Cost of
management
the predicted reduction in precipitation, is likely to facilitate pooling of water promoting the mosquito breeding cycle as well as the prevalence of typhoid and/or cholera if contamination occurs.
Change in precipitation pattern
Availability of water is central to mining and thus has the potential to impact Anglo American’s core business. Potential changes in precipitation patterns have been less certain in the climate change adaptation studies undertaken so far. However, in general, changes in rainfall
Reduction/disruption in production capacity
>6 years Direct More likely than not
Medium-high
As an indication of the potential impacts of extreme weather events, recent floods in Chile resulted in lost production of 2,660 tons of copper over 12 days and the establishment of a $2 million fund to support the reconstruction of Chanaral and El Salado.
Direct management action has been taken in relation to current rainfall variability involving developing and implementing water efficiency technologies to reduce water dependency and projects to improve resilience against physical impacts of extreme weather events (e.g. Coal
Costs of various adaptation studies have amounted to $494,100. For Anglo American Platinum, the direct impact of providing water to communities on Mogalakwena resulted in increased operational costs of approximately $250,000. In order to secure additional future water we

Risk driver
Description
Potential impact
Timeframe
Direct/ Indirect
Likelihood
Magnitude of impact
Estimated financial
implications
Management
method
Cost of
management
variability may cause operational disruptions due to floods and droughts (which impact on energy security), present risks to the health and safety of employees and local communities, and may negatively affect land rehabilitation outcomes. As a result of extreme precipitation, flooding flood events recently occurred in Chile resulting in the loss of 12 production days at our copper operations, amounting to 2,660 tons of lost production. All of our platinum operations
Australia’s Rain Immunisation Project, which has involved improvements to infrastructure and operational processes to safeguard operations – and the safety of people – against extreme weather events). At De Beers, management action has been focused on understanding the potential changes and identifying the critical controls and monitoring requirements. During August 2015 the Camborne School of Mines facilitated the development of two Bowtie Analysis, for the priority unwanted events of
have spent approximately $5 million upgrading the municipal (Polokwane) sewage works.

Risk driver
Description
Potential impact
Timeframe
Direct/ Indirect
Likelihood
Magnitude of impact
Estimated financial
implications
Management
method
Cost of
management
within the Limpopo river basin are in water stressed areas. In addition, there are challenging socio-economic circumstances with high poverty levels and poor infrastructure. This means that access to secure water and community opposition is a risk. For example, in August 2015 Mogalakwena mine experienced community protests and public violence. When consultations between government and the mines and communities took place, one of the issues highlighted by communities
reduced water availability on mine and flooding due to extreme weather events. Anglo American Platinum has been investing in the provision of water available for communities in which we operate. Anglo American Platinum have implemented a long term bulk water strategy and infrastructure plan, to protect, manage and maintain water supply to their operations. Anglo American Platinum is a representative member and chairperson of the Executive Committee of the Olifants River Joint Water Forum.

Risk driver
Description
Potential impact
Timeframe
Direct/ Indirect
Likelihood
Magnitude of impact
Estimated financial
implications
Management
method
Cost of
management
was the lack of potable water provision. Low levels of rainfall in Brazil during 2015 posed risks to energy security for the Minas Rio mine as the grid is dependent on hydro-power.
Change in precipitation extremes and droughts
Los Bronces is Anglo American's largest operation in Chile and one of the largest copper deposits in the world. Los Bronces is currently experiencing its 6th consecutive dry year. The water constraints led to a decrease in production, but returned to normal in the final quarter of 2015 following snowfall. In response to
Reduction/disruption in production capacity
1 to 3 years
Direct Virtually certain
Medium
Total copper production in 2015 was 401,700 tones, marginally lower compared to the previous year partially due to the impact of the drought-related water restrictions. The water restrictions had a net negative impact on production of approximately 18,000 tonnes. The resultant financial loss was
Los Bronces has continued to implement technical solutions to prevent further business impacts: water is now transported via a 56-kilometre pipeline from the Las Tórtolas tailings dam to the mine using a special water-recycling system. Other reduction initiatives include reducing the evaporation in tailing dams as well as
The water recycling system was a significant investment of $180 million at the Los Bronces operation.

Risk driver
Description
Potential impact
Timeframe
Direct/ Indirect
Likelihood
Magnitude of impact
Estimated financial
implications
Management
method
Cost of
management
shortages, the team developed and implemented a series of water-efficiency measures and seek alternative, non-competing sources of water to ensure the continuity of adequate water supply for the operation
approximately $90.5 million.
improving tailings deposition. The site will be adopting evaporation covers, expanding the use of thickeners, and investigating other technology to recover water from tailings dams in 2016. In August the installation of a new cyclone station was completed to increase the recovery of water in the dam. Los Bronces is currently recycling more than 78% of available water. In the long-term, more stringent environmental conditions, competing demand and continued dry

Risk driver
Description
Potential impact
Timeframe
Direct/ Indirect
Likelihood
Magnitude of impact
Estimated financial
implications
Management
method
Cost of
management
conditions will continue to challenge security. A project to support the operation to help it achieve Copper’s stated goal of “water resilience” by 2020 is underway.
Change in precipitation extremes and droughts
A changing climate has the potential to exacerbate electricity supply challenges affecting our operations Brazil, where approximately 65% of national electricity comes from hydropower. In 2015, the south-eastern region of Brazil experienced the worst drought in more than eight decades putting significant pressure on
Reduction/disruption in production capacity
Up to 1 year
Indirect (Supply chain)
Likely Medium-high
Costs will vary depending on the length of a power cut and the effect on production.
In Brazil, Anglo American is engaging with government around the electricity supply sector. Efforts are being made to improve efficiency and reduce energy consumption at our Brazilian operations. In the event that the national power utility is unable to provide electricity Anglo American will investigate
The cost to generate electricity using diesel generators amounted to approximately $0.13/kWh compared to approximately $0.075/kWh which Brazil currently pays for electricity from the national power utility (hydro-powered grid). Other costs associated with engaging with utilities form

Risk driver
Description
Potential impact
Timeframe
Direct/ Indirect
Likelihood
Magnitude of impact
Estimated financial
implications
Management
method
Cost of
management
electricity generation capacity. This has caused electricity price increases and supply outages (although this has not resulted in any production stoppages at Anglo American operations). The drought led to more thermal generation. This may also contribute to climate change mitigation-related risks faced by the operations.
alternative power sources and may revert to the use of diesel generators for power generation. The cost estimate for this response strategy was quantified by calculating the cost to generate electricity from diesel generators compared to the current electricity price Anglo pays to the national utility at its Brazil operations.
part of normal operating costs.
CC5.1c
Please describe your inherent risks that are driven by changes in other climate-related developments

Risk driver
Description
Potential impact
Timeframe
Direct/ Indirect
Likelihood
Magnitude of impact
Estimated financial
implications
Management method
Cost of
management
Changing consumer behaviour
Thermal coal supply is the most significant climate exposure for Anglo American, with the indirect downstream GHG emissions amounting to 108 million tonnes of CO2 annually. Our coal business represented 21% of operating profit for 2015. Nearly 50% of our coal business, by revenue, relates to metallurgical coal used in the production of steel. However, there is limited substitution for metallurgical coal in steel making.
Reduced demand for goods/services
>6 years Direct More likely than not
Medium-high
Underlying EBIT for coal operations was $457 million in 2015.
To mitigate climate risk our thermal coal investments and supply/demand forecasts are informed by climate scenarios, including the International Energy Association 450 ppm scenario, which limits the increase in global warming to below 2˚C. We are participating in the development of carbon capture and storage and clean coal technologies various investments: We sponsor research to use algae to sequester carbon and for bioremediation. In Australia, we voluntarily contribute to the Coal 21 Fund for development of low emission technologies. In South Africa we are founding members of the Centre for Carbon Capture and Storage. Through the World Coal Association and the Coal Industry Advisory Board, we engage with
Our investment in clean coal technology amounts to approximately $10 million.

Risk driver
Description
Potential impact
Timeframe
Direct/ Indirect
Likelihood
Magnitude of impact
Estimated financial
implications
Management method
Cost of
management
governments to inform policy for the effective uptake of new technologies under the global platform for accelerating coal efficiency (PACE). We also invest directly in reducing our emissions. Savings in GHG emissions due to ECO2MAN projects implemented since 2011 amounted to 19%, largely through the use of coal mine methane drainage for power generation at our underground operations in Australia.
CC5.1d
Please explain why you do not consider your company to be exposed to inherent risks driven by changes in regulation that have the potential to generate a substantive change in your business operations, revenue or expenditure
CC5.1e

Please explain why you do not consider your company to be exposed to inherent risks driven by physical climate parameters that have the potential to generate a substantive change in your business operations, revenue or expenditure
CC5.1f
Please explain why you do not consider your company to be exposed to inherent risks driven by changes in other climate-related developments that have the potential to generate a substantive change in your business operations, revenue or expenditure
Further Information
Page: CC6. Climate Change Opportunities
CC6.1
Have you identified any inherent climate change opportunities that have the potential to generate a substantive change in your business operations, revenue or expenditure? Tick all that apply Opportunities driven by changes in regulation Opportunities driven by changes in other climate-related developments
CC6.1a
Please describe your inherent opportunities that are driven by changes in regulation

Opportunity driver
Description
Potential impact
Timeframe
Direct/Indirect
Likelihood
Magnitude of impact
Estimated financial
implications
Management
method
Cost of
management
Other regulatory drivers
During 2013, regulations on the allowance for energy efficiency savings in terms of section 12L of the South African Income Tax Act as amended came into operation. Tax incentives were introduced for businesses that can show measurable energy savings. The 12L regulation allows for a R0.95/kWh tax allowance for energy savings and sets out the process for determining the significance of energy efficiency savings, and the requirements for claiming the proposed tax deduction. Energy security is a major risk to Anglo American, and in light of the 12.7% 2015
Reduced operational costs
1 to 3 years
Direct Likely Medium
The estimated potential benefit is in the region of $3 million (R38.9 million) Electricity use savings at Kumba Iron Ore's Sishen and Kolomela operations resulted in benefits totalling $21,362.
This will require the third party (registered) monitoring and verification of all viable and/applicable projects within Anglo American’s South African business units and/or operations. Such as the compressed air supply optimisation initiative at the Anglo American Platinum Union and Thembelani underground mines, as well as the mine ventilation optimization initiatives at both our Coal and Platinum business units. Kumba Iron Ore successfully submitted fuel efficiency and electricity savings projects at its Sishen and Kolomela
No cost ($0): there is a net benefit (this is the model offered by energy service companies).

Opportunity driver
Description
Potential impact
Timeframe
Direct/Indirect
Likelihood
Magnitude of impact
Estimated financial
implications
Management
method
Cost of
management
increase and a further 9.4% (2016) tariff increase, our ECO2MAN programme affords us opportunities, demonstrated by a $100 million saving in avoided energy input costs for global operations. Opportunities are available for our South African business units to utilise the 12L tax incentive regulation, translating to a conservative $3 million (provided the benefits outweigh the cost of third party measurement and verification). With the potential of upcoming regulation requiring the submission of a five-year Energy Management Plan and annual
operations during the reporting year. At our Coal South Africa operations, opportunities to utilise the 12L energy efficiency tax incentive is being considered for 2016 for all significant energy users and a pilot case is currently underway at Goedehoop colliery.

Opportunity driver
Description
Potential impact
Timeframe
Direct/Indirect
Likelihood
Magnitude of impact
Estimated financial
implications
Management
method
Cost of
management
progress reporting, there is opportunity to align this with the ECO2MAN programme.
Carbon taxes
The South African carbon tax bill allows for the use of domestic offset credits against 10% of tax exposure. In accordance with the current requirements of the draft bill, Anglo American is identifying viable domestic carbon offset opportunities.
Reduced operational costs
1 to 3 years
Direct More likely than not
Low-medium
With regard the draft South African carbon tax bill, it is estimated that offsets could reduce compliance costs by R2.5 million/pa.
Carbon credits to be transacted in accordance with Anglo American's Treasury and Supply Chain policies and requirements. Such transactions will consider access to both project specific offset credits as well as the carbon market supply. As an example, Anglo American's Kumba Iron Ore have identified and implemented various carbon-offset projects. These have included: 1. A bamboo plantation, with over 1000 trees covering 4 hectares; 2. Installing
To be determined at a company level. Anglo American's Kumba Iron Ore has invested just over R 2 million in bamboo and solar in pilot projects in preparation for the offset mechanism.

Opportunity driver
Description
Potential impact
Timeframe
Direct/Indirect
Likelihood
Magnitude of impact
Estimated financial
implications
Management
method
Cost of
management
domestic solar water heaters in houses; 3. Undertaking a camelthorn tree preservation project aimed at creating an offset area to preserve vegetation; and 4. Solar powered facilities at Heuningkranz exploration site.
International agreements
Over the longer-term it is envisaged carbon offsets, and in particular international forestry (REDD+) credits will play a significant role in meeting regulatory emission caps.In this regard Anglo American is considering options for long-term partnership with companies engaged in REDD+ initiatives.
Reduced operational costs
3 to 6 years
Direct More likely than not
Low-medium
Uncertain
Carbon credits to be transacted in accordance with Anglo American's Treasury and Supply Chain policies and requirements. Such transactions will consider access to both project specific offset credits as well as the carbon market supply.
To be determined. None at this stage.

CC6.1b
Please describe the inherent opportunities that are driven by changes in physical climate parameters
Opportunity driver
Description
Potential impact
Timeframe
Direct/ Indirect
Likelihood
Magnitude of impact
Estimated financial
implications
Management
method
Cost of
management
CC6.1c
Please describe the inherent opportunities that are driven by changes in other climate-related developments
Opportunity driver
Description
Potential impact
Timeframe
Direct/ Indirect
Likelihood
Magnitude of impact
Estimated financial
implications
Management
method
Cost of
management
Changing consumer behaviour
International pressure on the reduction of GHG emissions from mobile and stationary sources driven by internal combustion engines is putting pressure on the development of alternative forms of energy conversion, such as fuel cells. As Proton Exchange
Increased demand for existing products/services
1 to 3 years
Direct Likely Medium
Assuming that supply was to remain unchanged, an increased demand for PGMs for use in fuel cells is expected to cause an increase in the PGM basket price. An increased PGM basket price of 1% is expected to increase revenue by approximately
Anglo American Platinum believes that it is important to invest in developing new and sustainable markets for PGMs. The PGM Investment Programme sits at the heart of the broader market development undertaken by the Group. Together with various partners,
R5.9 million has been invested in the PGM-based medical device/drug discovery research. The cost of the methanol-based fuel mini-grid system is confidential. The hydrogen-based fuel cells at the schools incurred capital costs of R1.4 million in 2014 and monthly

Opportunity driver
Description
Potential impact
Timeframe
Direct/ Indirect
Likelihood
Magnitude of impact
Estimated financial
implications
Management
method
Cost of
management
Membrane (PEM) fuel systems – which are used in fuel cell electric vehicles – contain PGMs as catalysts, the emerging fuel cell industry presents a major demand segment for the global platinum mining industry. With large scale manufacturing and further research and development, capital costs are expected to decrease, which should open up new markets.
1.1%. Anglo American Platinum revenue in 2015 was R59.8 billion, so an increase of 1.1% would amount to approximately R658 million.
we invest in a portfolio of activities ranging from lab-scale research and product development and demonstration through to investments in the early-stage companies who use or enable the use of PGMs in the longer term. The market development work also includes investments into the Platinum Guild International and the World Platinum Investment Council. Anglo American Platinum’s PGM Investment Programme invests in early stage companies that use or enable the use of PGM-based
operating costs of R15,000. Support for the two research programmes amounts to just over R7 million for three years (2014 - 2016).

Opportunity driver
Description
Potential impact
Timeframe
Direct/ Indirect
Likelihood
Magnitude of impact
Estimated financial
implications
Management
method
Cost of
management
technologies, some of which focus on using PGMs for solutions to the demand for energy storage and supply such as fuel-cell systems. We also sponsored research into PGM-based medical devices in partnership with the Medical Research Council and the Department of Science and Technology, as well as PGM-related research at the University of Loughborough and Columbia University. In addition, Anglo American Platinum is investing in stimulating fuel cell demand.
Other drivers The South African renewable
Other: Securing carbon offsets
3 to 6 years
Direct Very likely Medium R42 million ($3.9 million)
Management of this involved the securement of
R500,000 ($45,998)

Opportunity driver
Description
Potential impact
Timeframe
Direct/ Indirect
Likelihood
Magnitude of impact
Estimated financial
implications
Management
method
Cost of
management
energy bid programme provided the opportunity for Anglo American to invest in the Kathu Concentrated Solar project. The 100 MW project has achieved financial closure, with construction to commence in 2018. The project was sold to GDF Suez and will be developed on property made available by Kumba Iron Ore, without additional investment by Anglo American. The project has been registered as a CDM project, with Kumba holding the rights to all carbon credits issued (estimated at 200ktpa)
the Kathu Solar project for CDM registration during the project initiation.

CC6.1d
Please explain why you do not consider your company to be exposed to inherent opportunities driven by changes in regulation that have the potential to generate a substantive change in your business operations, revenue or expenditure
CC6.1e
Please explain why you do not consider your company to be exposed to inherent opportunities driven by physical climate parameters that have the potential to generate a substantive change in your business operations, revenue or expenditure I) Anglo American has considered impacts of a changing climate in terms of the impact on rainfall, temperature, wind and humidity. These impacts are assessed at a regional level for all operations and in certain cases at a more local level (such as in the case of Los Bronces which operates in a very water stressed area). In addition to considering the potential risks of a changing climate to employee health, production stoppages, increased operational costs etc., we have considered whether these impacts could present opportunities for additional revenue streams or providing indirect benefits such as enhancing our social license to operate. II) Anglo American has conducted several climate change and adaptation studies and no substantive opportunities have been identified, given the uncertainties around climatic patterns. Climate change predictions are often based on simulations that are run using various climatic models in conjunction with historic data, to infer future trends. These predictions can only be used at a high-level and are most effective at providing a global perspective on trends. Studies run by Anglo American do attempt to provide a more regional/ landscape perspective including distinctive trends on temperature however cannot get distinctive views on how rainfall, wind and humidity will change. iii) Potential opportunities associated with mining are indirect and have multiple dependencies on a variety of climatic conditions. We are unable to confidently predict and quantify the value posed by climate change with regards to quantity of water supply, for example. More than 70% of Anglo American's operations and surrounding communities are already in water-stressed areas. For Anglo American to maintain its licence to operate, the company cannot degrade water quality, nor can it compromise other users’ right of access to this commodity. The company has an opportunity to contribute to adequate supply of water which will build community resilience to adapt to a changing climate where projected water availability is expected to decrease. For example, we have spent R80 million on upgrading the Polokwane sewage works to ensure additional water to Mogalakwena, R23 million on improving the reservoirs in Thabazimbi and R19 million on a dissolved air flotation system at Rustenburg. However we view this more as risk mitigation than an opportunity.

CC6.1f
Please explain why you do not consider your company to be exposed to inherent opportunities driven by changes in other climate-related developments that have the potential to generate a substantive change in your business operations, revenue or expenditure
Further Information
Module: GHG Emissions Accounting, Energy and Fuel Use, and Trading
Page: CC7. Emissions Methodology
CC7.1
Please provide your base year and base year emissions (Scopes 1 and 2)
Scope
Base year
Base year emissions (metric tonnes CO2e)
Scope 1 Sat 01 Jan 2011 - Sat 31 Dec 2011
9347918
Scope 2 (location-based) Sat 01 Jan 2011 - Sat 31 Dec 2011
9426307
Scope 2 (market-based) Sat 01 Jan 2011 - Sat 31 Dec 2011
0

CC7.2
Please give the name of the standard, protocol or methodology you have used to collect activity data and calculate Scope 1 and Scope 2 emissions
Please select the published methodologies that you use
IPCC Guidelines for National Greenhouse Gas Inventories, 2006
CC7.2a
If you have selected "Other" in CC7.2 please provide details of the standard, protocol or methodology you have used to collect activity data and calculate Scope 1 and Scope 2 emissions Not Applicable
CC7.3
Please give the source for the global warming potentials you have used
Gas
Reference
CH4 IPCC Second Assessment Report (SAR - 100 year)
CO2 IPCC Third Assessment Report (TAR - 100 year)
CC7.4

Please give the emissions factors you have applied and their origin; alternatively, please attach an Excel spreadsheet with this data at the bottom of this page
Fuel/Material/Energy
Emission Factor
Unit
Reference
Electricity 1.03 metric tonnes CO2e per MWh
Country Specific - South Africa
Electricity 0.98 metric tonnes CO2e per MWh
Country Specific - Australia
Electricity 0.39 metric tonnes CO2e per MWh
Country Specific - Chile
Electricity 0.64 metric tonnes CO2e per MWh
Country Specific - Peru
Electricity 0.13 metric tonnes CO2e per MWh
Country Specific - Brazil. State and / or provider specific: Codemin (1.075) Niobium (0.118) Phosphates (0.1075) Minas Rio mine (in Goias – 0.1431) Minas Rio construction (in Rio – 0.1244)
Electricity 0.6 metric tonnes CO2e per MWh
Country Specific - United Kingdom
Electricity 0.29 metric tonnes CO2e per MWh
Country Specific - Canada. State specific: Capcoal, Callide, Dawson, Foxleigh, BCO, Moranbah, Grosvenor (0.79) Drayton, Dartbrook (0.84)
Electricity 1.03 metric tonnes CO2e per MWh
Country Specific - Namibia (the Eskom (South African) factor is applied if site cannot confirm a country specific factor)
Electricity 1.03 metric tonnes CO2e per MWh
Country Specific - Botswana (the Eskom (South African) factor is applied if site cannot confirm a country specific factor)
Electricity 0.59 metric tonnes CO2e per MWh
Country Specific - Zimbabwe
Diesel/Gas oil 2.67 metric tonnes CO2e per m3
Business unit specific –CoalAus
Motor gasoline 2.28 metric tonnes CO2e per m3
Business unit specific –CoalAus
Liquefied petroleum gas (LPG)
1.53 metric tonnes CO2e per metric tonne
Business unit specific –CoalAus
Natural gas 0.00215 metric tonnes CO2e per m3
Business unit specific –CoalAus

Fuel/Material/Energy
Emission Factor
Unit
Reference
Diesel/Gas oil 2.68 metric tonnes CO2e per m3
IPCC
Motor gasoline 2.4 metric tonnes CO2e per m3
IPCC
Liquefied petroleum gas (LPG)
2.98 metric tonnes CO2e per metric tonne
IPCC
Natural gas 0.00215 metric tonnes CO2e per m3
IPCC
Other: Heavy fuel oil 3.13 metric tonnes CO2e per metric tonne
IPCC
Other: Light fuel oil 2.77 metric tonnes CO2e per m3
IPCC
Bituminous coal 2.62 metric tonnes CO2e per metric tonne
IPCC
Metallurgical coke 2.44 metric tonnes CO2e per metric tonne
IPCC
Waste oils 2.46 metric tonnes CO2e per m3
IPCC
Kerosene 2.83 metric tonnes CO2e per m3
IPCC
Petroleum coke 3.17 metric tonnes CO2e per metric tonne
IPCC
Other: Tailgas 0.00024 metric tonnes CO2e per m3
IPCC
Other: Non-renewable waste fuel
0 metric tonnes CO2e per metric tonne
IPCC
Other: Intermediate fuel oil 2.74 metric tonnes CO2e per m3
IPCC
Other: Marine gas oil 2.669 metric tonnes CO2e per m3
IPCC
Biodiesels 2.69 metric tonnes CO2e per m3
IPCC
Other: Biomass used as fuel
0 metric tonnes CO2e per metric tonne
IPCC

Fuel/Material/Energy
Emission Factor
Unit
Reference
Wood or wood waste 0 metric tonnes CO2e per metric tonne
IPCC
Other: Methane flared 2.749 Other: metric tonnes CO2 per metric tonne CH4
IPCC; Australia does a specific conversion based on NGERs and accounts for changing combustion efficiency
Other: Methane from coal mining
21 Other: metric tonnes CO2 per metric tonne CH4
IPCC: from July 2015, Australia’s GWP was revised to 25
Further Information
Page: CC8. Emissions Data - (1 Jan 2015 - 31 Dec 2015)
CC8.1
Please select the boundary you are using for your Scope 1 and 2 greenhouse gas inventory Operational control
CC8.2
Please provide your gross global Scope 1 emissions figures in metric tonnes CO2e 8699733
CC8.3

Does your company have any operations in markets providing product or supplier specific data in the form of contractual instruments? Yes
CC8.3a
Please provide your gross global Scope 2 emissions figures in metric tonnes CO2e
Scope 2, location-
based
Scope 2,
market-based (if applicable)
Comment
9528206 848109
As of October 2015, Chile is among the countries/regions where the I-REC Standard board has authorized the issuers to implement attribute tracking systems. A total of 2,156,500 MWh of electricity were purchased by our operations in Chile in 2015. The emissions factors associated with electricity purchased are based on information provided by suppliers in the market, according to the I-REC Standard. These factors are used for the location-based and the market-based Scope 2 emission values (hence they are the same). In early 2016, Anglo American updated its systems to more accurately report in line with the revised Scope 2 reporting methodologies.
CC8.4
Are there are any sources (e.g. facilities, specific GHGs, activities, geographies, etc.) of Scope 1 and Scope 2 emissions that are within your selected reporting boundary which are not included in your disclosure? Yes
CC8.4a

Please provide details of the sources of Scope 1 and Scope 2 emissions that are within your selected reporting boundary which are not included in your disclosure
Source
Relevance of
Scope 1 emissions from
this source
Relevance of
location-based Scope 2
emissions from this source
Relevance of market-based
Scope 2 emissions from this source (if
applicable)
Explain why the source is excluded
F-Gasses Emissions are not relevant
Emissions are not relevant
Emissions are not relevant
After review, the contribution of F-gasses to Anglo American's carbon footprint was considered negligible (significantly below the materiality threshold).
N2O Emissions are not relevant
Emissions are not relevant
Emissions are not relevant
After review, the contribution of N2O to Anglo American's carbon footprint was considered negligible (significantly below the materiality threshold).
CO2 emissions from spontaneous combustion (sponcom)
Emissions are not relevant
Emissions are not relevant
Emissions are not relevant
There is no internationally recognised methodology for calculating CO2 emissions from sponcom.
Emissions from explosives detonation
Emissions are not relevant
Emissions are not relevant
Emissions are not relevant
The emissions have previously been assessed and found to be immaterial.
CC8.5
Please estimate the level of uncertainty of the total gross global Scope 1 and 2 emissions figures that you have supplied and specify the sources of uncertainty in your data gathering, handling and calculations
Scope
Uncertainty range
Main sources of
uncertainty
Please expand on the uncertainty in your data
Scope 1 More than 2% but less than or equal to 5%
Metering/ Measurement
Annual audits conducted by an external assurance provider operate on a 5% materiality threshold. There are occasionally errors in data associated with metering that fall below this threshold.

Scope
Uncertainty range
Main sources of
uncertainty
Please expand on the uncertainty in your data
Constraints
Scope 2 (location-based)
Less than or equal to 2%
Metering/ Measurement Constraints
Annual audits conducted by an external assurance provider operate on a 5% materiality threshold. There are occasionally errors in data associated with metering that fall below this threshold.
Scope 2 (market-based)
Less than or equal to 2%
Metering/ Measurement Constraints
Annual audits conducted by an external assurance provider operate on a 5% materiality threshold. There are occasionally errors in data associated with metering that fall below this threshold.
CC8.6
Please indicate the verification/assurance status that applies to your reported Scope 1 emissions Third party verification or assurance process in place
CC8.6a
Please provide further details of the verification/assurance undertaken for your Scope 1 emissions, and attach the relevant statements

Verification or
assurance cycle in place
Status in the
current reporting
year
Type of verification
or assurance
Attach the statement
Page/section
reference
Relevant standard
Proportion of reported
Scope 1 emissions verified (%)
Annual process Complete Reasonable assurance
https://www.cdp.net/sites/2016/72/772/Climate Change 2016/Shared Documents/Attachments/CC8.6a/aa-sdreport-2015.pdf
71 ISAE 3410 100
Annual process Complete Reasonable assurance
https://www.cdp.net/sites/2016/72/772/Climate Change 2016/Shared Documents/Attachments/CC8.6a/aa-sdreport-2015.pdf
71 ISAE3000 100
CC8.6b
Please provide further details of the regulatory regime to which you are complying that specifies the use of Continuous Emissions Monitoring Systems (CEMS)
Regulation
% of emissions covered by the system
Compliance period
Evidence of submission
CC8.7
Please indicate the verification/assurance status that applies to at least one of your reported Scope 2 emissions figures Third party verification or assurance process in place
CC8.7a
Please provide further details of the verification/assurance undertaken for your location-based and/or market-based Scope 2 emissions, and attach the relevant statements

Location-based or market-based figure?
Verification
or assurance
cycle in place
Status in
the current
reporting year
Type of verification
or assurance
Attach the statement
Page/Section reference
Relevant standard
Proportion
of reported Scope 2
emissions verified
(%)
Location-based
Annual process
Complete Reasonable assurance
https://www.cdp.net/sites/2016/72/772/Climate Change 2016/Shared Documents/Attachments/CC8.7a/aa-sdreport-2015.pdf
71 ISAE 3410 100
Location-based
Annual process
Complete Reasonable assurance
https://www.cdp.net/sites/2016/72/772/Climate Change 2016/Shared Documents/Attachments/CC8.7a/aa-sdreport-2015.pdf
71 ASAE3000 100
CC8.8
Please identify if any data points have been verified as part of the third party verification work undertaken, other than the verification of emissions figures reported in CC8.6, CC8.7 and CC14.2
Additional data points verified
Comment
Other: Total amount of energy used in million GJ As part of our 2015 sustainability reporting process we also requested that the assurer audit energy data for expression of reasonable assurance.
CC8.9
Are carbon dioxide emissions from biologically sequestered carbon relevant to your organization? No

CC8.9a
Please provide the emissions from biologically sequestered carbon relevant to your organization in metric tonnes CO2
Further Information
Page: CC9. Scope 1 Emissions Breakdown - (1 Jan 2015 - 31 Dec 2015)
CC9.1
Do you have Scope 1 emissions sources in more than one country? Yes
CC9.1a
Please break down your total gross global Scope 1 emissions by country/region
Country/Region
Scope 1 metric tonnes CO2e
Australia 4519428
Botswana 387742
Brazil 679446
Canada 190455
Chile 610624
Namibia 146597
Peru 15667

Country/Region
Scope 1 metric tonnes CO2e
Rest of world 52251
South Africa 2090949
United Kingdom 262
Zimbabwe 6312
CC9.2
Please indicate which other Scope 1 emissions breakdowns you are able to provide (tick all that apply) By business division By GHG type
CC9.2a
Please break down your total gross global Scope 1 emissions by business division
Business division
Scope 1 emissions (metric tonnes CO2e)
Kumba Iron Ore 693861
Iron Ore Brazil 96868
Coal: Australia-Canada 4520379
Coal: South Africa 654863
Copper 626291
Nickel, Niobium and Phosphates 582578
Platinum 561772

Business division
Scope 1 emissions (metric tonnes CO2e)
De Beers 952137
Exploration 1238
Corporate 9469
Vergelegen 278
CC9.2b
Please break down your total gross global Scope 1 emissions by facility
Facility
Scope 1 emissions (metric tonnes CO2e)
Latitude
Longitude
CC9.2c
Please break down your total gross global Scope 1 emissions by GHG type
GHG type
Scope 1 emissions (metric tonnes CO2e)
CO2 4421828
CH4 4418309
CC9.2d

Please break down your total gross global Scope 1 emissions by activity
Activity
Scope 1 emissions (metric tonnes CO2e)
Further Information
Page: CC10. Scope 2 Emissions Breakdown - (1 Jan 2015 - 31 Dec 2015)
CC10.1
Do you have Scope 2 emissions sources in more than one country? Yes
CC10.1a
Please break down your total gross global Scope 2 emissions and energy consumption by country/region
Country/Region
Scope 2, location-based (metric
tonnes CO2e)
Scope 2, market-based (metric tonnes CO2e)
Purchased and consumed electricity, heat, steam or cooling
(MWh)
Purchased and consumed low carbon electricity, heat, steam or cooling
accounted in market-based approach (MWh)
South Africa 6928443 0 6675290 0
Australia 637744 0 794838 0
Brazil 282403 0 2262569 0

Country/Region
Scope 2, location-based (metric
tonnes CO2e)
Scope 2, market-based (metric tonnes CO2e)
Purchased and consumed electricity, heat, steam or cooling
(MWh)
Purchased and consumed low carbon electricity, heat, steam or cooling
accounted in market-based approach (MWh)
Peru 95 0 147 0
Chile 848109 848109 2156500 0
Zimbabwe 65268 0 110623 0
Botswana 527178 0 475696 0
Namibia 188463 0 147406 0
Rest of world 23223 0 112888 0
United Kingdom 1143 0 14407 0
Canada 26138 0 115198 0
CC10.2
Please indicate which other Scope 2 emissions breakdowns you are able to provide (tick all that apply) By business division
CC10.2a
Please break down your total gross global Scope 2 emissions by business division
Business division
Scope 2 emissions, location based (metric tonnes CO2e)
Scope 2 emissions, market-based
(metric tonnes CO2e)
Kumba Iron Ore 509736 0

Business division
Scope 2 emissions, location based (metric tonnes CO2e)
Scope 2 emissions, market-based
(metric tonnes CO2e)
Iron Ore Brazil 75582 0
Coal: Australia-Canada 637723 0
Coal: South Africa 835499 0
Copper 848204 848109
Nickel, Niobium and Phosphates 206821 0
Platinum 5317868 0
De Beers 1064602 0
Exploration 159 0
Corporate 30825 0
Vergelegen 1186 0
Other Mining and Industries 0 0
CC10.2b
Please break down your total gross global Scope 2 emissions by facility
Facility
Scope 2 emissions, location based (metric tonnes CO2e)
Scope 2 emissions, market-based
(metric tonnes CO2e)
CC10.2c
Please break down your total gross global Scope 2 emissions by activity

Activity
Scope 2 emissions, location based (metric tonnes CO2e)
Scope 2 emissions, market-based
(metric tonnes CO2e)
Further Information
Page: CC11. Energy
CC11.1
What percentage of your total operational spend in the reporting year was on energy? More than 5% but less than or equal to 10%
CC11.2
Please state how much heat, steam, and cooling in MWh your organization has purchased and consumed during the reporting year
Energy type
Energy purchased and consumed (MWh)
Heat 0
Steam 0
Cooling 0
CC11.3
Please state how much fuel in MWh your organization has consumed (for energy purposes) during the reporting year

16576610
CC11.3a
Please complete the table by breaking down the total "Fuel" figure entered above by fuel type
Fuels
MWh
Bituminous coal 997596
Metallurgical coke 392178
Diesel/Gas oil 12162268
Natural gas 252361
Liquefied petroleum gas (LPG) 436746
Motor gasoline 79502
Kerosene 5788
Petroleum coke 3914
Biodiesels 47847
Other: Heavy Fuel Oil 1012000
Other: Biomass 742888
Other: Marine Gas Oil 321545
Other: Intermediate Fuel Oil 95960
Other: Smaller Quantity Fuels Used 26017
CC11.4
Please provide details of the electricity, heat, steam or cooling amounts that were accounted at a low carbon emission factor in the market-based Scope 2 figure reported in CC8.3a

Basis for applying a low carbon emission factor
MWh consumed associated with
low carbon electricity, heat, steam or cooling
Comment
Energy attribute certificates, I-RECs
848109
As of October 2015, Chile is among the countries/regions where the I-REC Standard board has authorized the issuers to implement attribute tracking systems. A total of 2,156,500 MWh of electricity were purchased by our operations in Chile in 2015. The emissions factors associated with electricity purchased are based on information provided by suppliers in the market, according to the I-REC Standard. These factors are used for the location-based and the market-based Scope 2 emission values (hence they are the same). Anglo American has revised report systems to more accurately report in line with the revised Scope 2 reporting methodologies.
Off-grid energy consumption from an onsite installation or through a direct line to an off-site generator
6070
Anglo American Platinum purchases an estimated 18,500 MWh per year from Eternity Power RF associated with the 4,3 MW Eternity Thermal Harvesting power plant at ACP. The plant was commissioned in June 2015 and a total of 6,070 MWh produced for Anglo American Platinum’s consumption in the reporting year. This electricity is not purchased through a market-based instrument and therefore is not considered Scope 2 market-based emissions according to the CDP guidance.
CC11.5
Please report how much electricity you produce in MWh, and how much electricity you consume in MWh
Total
electricity consumed
(MWh)
Consumed electricity
that is purchased
(MWh)
Total
electricity produced
(MWh)
Total
renewable electricity produced
(MWh)
Consumed renewable electricity
that is produced by
company (MWh)
Comment
14159241 12965563 1293678 855523 855523
Anglo American has also invested in a 100 MW Concentrated Solar Power plant (with storage). The Kathu Solar project has achieved preferred bidder status in the South African Renewable Energy Independent Power Producer Programme bid window 3. Energy generated will feed into the grid. The Kathu Solar project has not been included in the figures reported here. De Beers is considering (at pre-concept phase) wind and solar

Total
electricity consumed
(MWh)
Consumed electricity
that is purchased
(MWh)
Total
electricity produced
(MWh)
Total
renewable electricity produced
(MWh)
Consumed renewable electricity
that is produced by
company (MWh)
Comment
energy projects in Botswana, South Africa and Namibia. NNP is considering an opportunity to replace the LPG gas in natural gas and / or biogas derived from sugar cane waste. At Coal Australia, there was a significant effort to extend the capture and use of rich gas from underground operations through power generation plants and gas exports. To allow for the increased capture and combustion capacity of rich gas from the Moranbah mining complex (i.e. the Moranbah and Grosvenor mines), the business is upgrading the mines electrical network. A 21 MW new power station is scheduled to be constructed at Grosvenor during 2016. We operated biomass plants (electrolyte heating) at Mantoverde and Mantos Blancos up until their point of divestment in September 2015. A 1 MW solar PV plant was constructed by Coal South Africa to understand the application of solar PV technology in South Africa.
Further Information
Page: CC12. Emissions Performance
CC12.1
How do your gross global emissions (Scope 1 and 2 combined) for the reporting year compare to the previous year? Increased
CC12.1a
Please identify the reasons for any change in your gross global emissions (Scope 1 and 2 combined) and for each of them specify how your emissions compare to the previous year

Reason
Emissions value
(percentage)
Direction of change
Please explain and include calculation
Emissions reduction activities
3 Decrease
Anglo American’s ECO2MAN energy and GHG management programme resulted in reduced operational GHG emissions by 4.6Mt during 2015 based on initiatives implemented since 2010 (and ~$100 million in energy savings throughout the Group). Total new initiatives implemented in 2015 resulted in a saving of 433,009 tCO2e representing an 8% reduction relative to the absolute 2014 Scope 1 and 2 GHG emissions. In the reporting year an additional 433,009 tCO2e were reduced by our emissions reduction initiatives, and our total S1 and S2 emissions in the previous year was 17,273,105 tCO2e, therefore we arrived at 3% through (433009/ 17273105)*100= 3%
Divestment 0 No change
There was an immaterial 0.0006% decrease due to the sale of Tarmac.
Acquisitions 0 No change
Anglo American had no acquisitions in the reporting year.
Mergers 0 No change
Anglo American had no mergers in the reporting year.
Change in output 6 Increase Ramp up at Coal Australia's Grosvenor project and the commissioning of Iron Ore Brazil's Minas Rio mine accounted for 2% of the increase in emissions. The remainder of the change is due to a variety of relatively smaller changes in output across the various operations.
Change in methodology
2 Increase
From July 2015 onwards Coal Australia used a revised Global Warming Potential for methane in line with government reporting requirements (GWP 25 compared to GWP 21 used previously). For our Australian operations this represented a 19% increase in reported monthly emissions post-July, with a cumulative increase of 9% for the full year. At Group level this translated to a 3% increase post July and a cumulative impact of 2% for the full year.
Change in boundary
0 No change
There was no change in boundary.
Change in physical operating conditions
0 No change
There was no change in physical operating conditions.
Unidentified 0 No change
There were no unidentified changes.
Other 0 No change
There were no other changes.
CC12.1b

Is your emissions performance calculations in CC12.1 and CC12.1a based on a location-based Scope 2 emissions figure or a market-based Scope 2 emissions figure? Location-based
CC12.2
Please describe your gross global combined Scope 1 and 2 emissions for the reporting year in metric tonnes CO2e per unit currency total revenue
Intensity figure =
Metric numerator (Gross global combined
Scope 1 and 2 emissions)
Metric denominator:
Unit total revenue
Scope 2 figure used
% change
from previous
year
Direction of change
from previous
year
Reason for change
0.000891 metric tonnes CO2e 20455000000 Location-based
40 Increase
Anglo American’s scope 1 and 2 emissions have increased by 6% and Group revenue (statutory measure) has decreased by 24% resulting in the 40% increase in emissions intensity relative to revenue. The challenging economic conditions resulted in a 24% decrease in the basket price of our products
CC12.3
Please provide any additional intensity (normalized) metrics that are appropriate to your business operations

Intensity figure =
Metric numerator (Gross global combined
Scope 1 and 2 emissions)
Metric denominator
Metric
denominator: Unit total
Scope 2 figure used
% change
from previous
year
Direction of change
from previous
year
Reason for change
132 metric tonnes CO2e
full time equivalent (FTE) employee
138081 Location-based
4 Increase
Emissions per FTE: Anglo American’s scope 1 and 2 emissions have increased by 6% and FTE (employees and contractors) have decreased by 9%. The decrease in FTE is a result of the restructuring associated with creating a fit for purpose organisation.
0.01501 metric tonnes CO2e
Other: tonne of product mined ('000)
1214790 Location-based
13 Increase
Emissions per tonne of product mined: Anglo American’s scope 1 and 2 emissions have increased by 6% and tonnes of product mined decreased by 2%
Further Information
Page: CC13. Emissions Trading
CC13.1
Do you participate in any emissions trading schemes? No, and we do not currently anticipate doing so in the next 2 years
CC13.1a
Please complete the following table for each of the emission trading schemes in which you participate

Scheme name
Period for which data is supplied
Allowances allocated
Allowances purchased
Verified emissions in metric tonnes CO2e
Details of ownership
CC13.1b
What is your strategy for complying with the schemes in which you participate or anticipate participating?
CC13.2
Has your organization originated any project-based carbon credits or purchased any within the reporting period? No
CC13.2a
Please provide details on the project-based carbon credits originated or purchased by your organization in the reporting period
Credit origination
or credit purchase
Project type
Project identification
Verified to which standard
Number of credits (metric
tonnes of CO2e)
Number of credits (metric tonnes
CO2e): Risk adjusted volume
Credits cancelled
Purpose, e.g. compliance
Further Information
Page: CC14. Scope 3 Emissions

CC14.1
Please account for your organization’s Scope 3 emissions, disclosing and explaining any exclusions
Sources of Scope 3
emissions
Evaluation status
metric tonnes CO2e
Emissions calculation methodology
Percentage of
emissions calculated using data obtained
from suppliers or value
chain partners
Explanation
Purchased goods and services
Relevant, calculated
722953
This category includes upstream (i.e., cradle-to-gate) emissions from the production of products purchased or acquired by Anglo American’s Platinum (Platinum), Nickel Niobium & Phosphates (NNP), Coal South Africa (Coal SA), Iron Ore Brazil (IOB), Copper and Kumba Iron Ore (Kumba) business units. Activity data: The Platinum data was based on the purchase of explosives obtained from supply chain records of the quantities purchased. CoalSA data was based on the quantity of lime/limestone produced and/or consumed on site for stone dusting and water treatment. Kumba identified explosives, steel, tyres and cement as its top four purchased goods using supplier invoices to obtain the total masses in tonnes. NNP data relates to explosives purchased. IOB includes explosives and LPG. Emission factors: The emission factors and their respective sources are provided below: Explosives: 2.51 tCO2e/tonne product (CCalc Tool Manual Version 1.1 – Carbon Calculations over the Life Cycle of Industrial Activities). Steel: 1.9 tCO2e/tonne product (Greenhouse Gas Abatement in Energy Intensive Industries, page 5, Integrated steel mill average) Tyres: 1.2 tCO2e per tonne (Michelin Annual Report - 2013 Performance, page 43) Cement: 0.893 tCO2e/tonne product (Pretoria Portland Cement - http://ppc.investoreports.com/ppc_ar_2013/downloads/ppc-ar-2013) Lime/Limestone: 0.75 tCO2e per tonne (Tier 1 IPCC 2006
53.5% Not applicable

Sources of Scope 3
emissions
Evaluation status
metric tonnes CO2e
Emissions calculation methodology
Percentage of
emissions calculated using data obtained
from suppliers or value
chain partners
Explanation
Guideline methodology) NNP explosives: 0.17 per tCO2e and 0.55 per tonne N20 GWP values: Carbon dioxide = 1 Methodology: The direct supplier emissions are estimated by multiplying the quantity of purchased product by an emission factor associated with the production of the product. Calculations were performed in accordance with ISO 14064 Part 1 and the Scope 3 Accounting and Reporting Standard by The Greenhouse Gas Protocol Initiative. IOB calculated emissions using the Brazilian GHG Programme calculation sheets and its conversion factors (GHG Protocol Brazilian ProgrammeTool - Version 2016.1.1). Assumptions: No assumptions were made in the calculation of the emissions in this category. Allocation methods: Operational Control (Platinum, Nickel Niobium & Phosphates, Iron Ore Brazil, Copper and Coal SA) Financial Control (Kumba)
Capital goods Relevant, calculated
3228
This category includes all upstream (i.e. cradle-to-gate) emissions from the production of capital goods purchased or acquired by Kumba Iron Ore. These emissions can be attributed to the purchase of new equipment and new vehicles associated with new project development. Kumba indicated that 33 new vehicles were purchased during this reporting period. Activity data: The number and cost associated with the acquisition of each new vehicle was sourced from supplier invoices. Emissions factors: The emission factors and their respective sources are provided below: Mining Vehicle Purchases: 293.43 tCO2e per mining vehicle (As a specific emission factor for a mining vehicle is not available, an emission factor was calculated based on the following premise: Kumba’s total expenditure on mining vehicles was divided by the total revenue in the reporting year from the vehicle supplier. The percentage of revenue that the supplier gained from purchases
7%
Anglo American Platinum reported zero emissions for this category as it did not start-up any new mines/operations/purchase new vehicles during the reporting year. Due to the complex nature of the embedded carbon within the capital goods generally procured by the Anglo American Coal South Africa business unit (i.e. a dragline or haul truck), no capital goods were investigated however future scope 3 emissions inventories will

Sources of Scope 3
emissions
Evaluation status
metric tonnes CO2e
Emissions calculation methodology
Percentage of
emissions calculated using data obtained
from suppliers or value
chain partners
Explanation
made by Kumba was multiplied by the supplier’s total emissions for the reporting year to determine the quantity of emissions generated by Kumba per vehicle purchased) GWP values: Carbon dioxide = 1 Methodology: The amount of vehicles purchased in the reporting year was multiplied by the emission factor for mining vehicles purchased to determine the tCO2e associated with Capital Goods. Calculations were performed in accordance with ISO 14064 Part 1 and The Greenhouse Gas Protocol: Corporate Value Chain (Scope 3) Accounting and Reporting Standard. Assumptions: The transport of the mining vehicles to Kumba’s facility was not included in the calculation. Emission factor per mining vehicle produced was calculated on the basis of revenue allocation that Kumba contributed to the supplier of the vehicles. Allocation methods: Financial control approach
attempt to include embedded carbon from the manufacture and processing of materials in the production of these assets.
Fuel-and-energy-related activities (not included in Scope 1 or 2)
Relevant, calculated
1364247
This category includes emissions related to the extraction and/or production of fuels and energy purchased and consumed by Anglo American’s Platinum (Platinum), Coal South Africa (CoalSA), Copper and Kumba Iron Ore (Kumba) business units that are not accounted for in Scope 1 and Scope 2. For Platinum this includes the emissions from coal, diesel, petrol, LPG and paraffin. Transmission and Distribution losses have been accounted for under Scope 2 emissions and have not been included in this section. CoalSA only deems the extraction and/or production of diesel and petrol to be material and includes emissions from the refining of diesel and petrol from crude oil. Kumba includes in its report the extraction, production, and transportation of diesel, LPG and petrol (motor gasoline), AVGAS, used oil as well as electricity transmission and distribution losses Activity data: The activity data was obtained from supply chain records of the quantity of each
47%
The Tier 2 (RSA country specific) emission factor employed by CoalSA (for diesel and petrol) is one that was given to CoalSA verbally and is a confidential number specific to South African industry.

Sources of Scope 3
emissions
Evaluation status
metric tonnes CO2e
Emissions calculation methodology
Percentage of
emissions calculated using data obtained
from suppliers or value
chain partners
Explanation
type of fuel purchased and electricity consumed. Emission factors: The emission factors and their respective sources are provided below: Platinum Coal: 0.2909 kgCO2e/kg; (Defra, 2011). Diesel: 0.5644 kgCO2e/litre; (Defra, 2012). Petrol: 0.4638 kgCO2e/litre; (Defra, 2012). LPG: 0.1868 kgCO2e/litre; (Defra, 2013). Paraffin: 0.5271 kgCO2e/liter; (Defra, 2012). Kumba Diesel: 0.5787 kgCO2e/litre; (DEFRA, 2014). Petrol: 0.4504 kgCO2e/litre; (DEFRA, 2014). LPG: 0.3978 tCO2e/tonne; (DEFRA, 2014.) AVGAS: 0.524kgCO2e/litre; (DEFRA, 2014.) Used oil for combustion: 0.599 tCO2e/m3; (DEFRA, 2014. Electricity: 0.04 tCO2e/MWh (Eskom Supplementary & Divisional Report 2014) GWP values: Carbon dioxide = 1 Methodology: The quantity of fuel consumed in the reporting year was multiplied by the emission factor associated with the extraction, production, and transportation of that fuel. The quantity of electricity purchased was multiplied by the transmission and distribution emission factor of the South African electricity grid. Calculations were performed in accordance with ISO 14064 Part 1 and The Greenhouse Gas Protocol: Corporate Value Chain (Scope 3) Accounting and Reporting Standard. Assumptions: No assumptions were made in the calculation of the emissions in this category. Allocation methods: Operational Control (Platinum, Copper and CoalSA) Financial Control (Kumba)
Upstream transportation and distribution
Relevant, calculated
223383
Only Diesel and Petrol have been considered as material to Platinum. Diesel and Biodiesel are material to NNP. Coal SA’s material T&D: Transport of product from respective operations, or from the Rapid Loading Terminal, to the Richards Bay Coal Terminal via Rail within South Africa. Kumba Iron Ore factored in diesel along with other products which were billed as purchased
53.5%
Anglo American Platinum deemed only Diesel and Petrol as the fossil fuels that are most material in this category because previous investigations demonstrated that the amounts

Sources of Scope 3
emissions
Evaluation status
metric tonnes CO2e
Emissions calculation methodology
Percentage of
emissions calculated using data obtained
from suppliers or value
chain partners
Explanation
transport services in kilometres. Iron Ore Brazil included petrol and diesel consumed by contractors. Copper reported on this category for the first time. Activity data: obtained from supply chain records of the quantity of each type of fuel purchased. Emission factors: Platinum Diesel: 0.5644 tCO2e/1000 litres (Defra, 2012) Petrol: 0.4638 tCO2e/1000 litres (Defra, 2012) CoalSA Electric rail: 14.18 gCO2e/net t-km (Transnet) Kumba Heavy Articulated vehicle: 0.9946 kgCO2e/vehicle km, (DEFRA, 2014) NNP Diesel: 2.431 kgCO2e/1000 litres Biodiesel: 2.603 kgCO2e/1000 litres GWP values: Carbon dioxide = 1 Methodology: The total quantities of diesel and petrol used for the transportation and distribution of goods were multiplied with the respective emission factors. The emission factor for a Heavy Goods Vehicle was divided by an assumed 30m3 volume of the purchased goods transported per trip to get the emission factor in terms of volume and then multiplied by a single distance travelled from Sasolburg to Kumba’s operations. The Calculations were performed in accordance with ISO 14064 Part 1 and The Greenhouse Gas Protocol: Corporate Value Chain (Scope 3) accounting and Reporting Standard Assumptions: only electric rail emission rates were applied as diesel rail contributed an insignificant 0.21% to this export line; all purchased goods are transported to Kumba’s operations in a Heavy Articulated Vehicle >33 tonne; tanker delivery capacity of 30m3 for all goods being transported to the operations; transportation of diesel originated from Sasolburg; distance from Sasolburg to Sishen -542 km; distance from Sasolburg to Kolomela - 580 km; distance from Sasolburg to Thabazimbi - 302 km. IOB calculated emissions using the Brazilian GHG Programme calculation sheets and its conversion factors (GHG Protocol Brazilian Programme Tool - Version 2016.1.1). Allocation methods:
of grease and lubricating oil were less than 2% of the total emission from the transportation and distribution of goods, hence deemed immaterial. Moreover allocation is complex as the transportation and distribution service providers service a multitude of clients.

Sources of Scope 3
emissions
Evaluation status
metric tonnes CO2e
Emissions calculation methodology
Percentage of
emissions calculated using data obtained
from suppliers or value
chain partners
Explanation
Operational Control (Platinum, NNP, IOB, Copper and CoalSA) Financial Control (Kumba)
Waste generated in operations
Relevant, calculated
38965
This category includes emissions from third-party disposal and treatment of waste that is generated by Anglo American Platinum (Platinum) Coal South Africa (CoalSA), Nickel, Niobium & Phosphates (NNP), Iron Ore Brazil (IOB), Copper and Kumba Iron Ore (Kumba) owned and/or controlled operations during the reporting year. Activity data The activity data on waste quantities disposed of was obtained from Platinum’s Safety, Health and Environment (SHE) Database. Kumba Supply chain records were utilised to obtain the total volume of lubricant consumed at each of the operations whilst the amount of waste generated per person in the reporting year was estimated from data provided by the Institute of Waste Management South Africa. Emission factors: The emission factors associated with the waste generated in operations for the reporting year are: Land filling (i.e. transport to landfill site): 0.0367 tCO2e/tonne waste (EPA 2002) Lubricants: 2.62 kgCO2e/litre (DEFRA 2014) Waste disposal: 0.17 tCO2e/tonne waste (US Environmental Protection Agency) NNP Waste disposal: 0.745 tCO2e/tonne waste GWP values: Carbon dioxide = 1 Methodology: The quantity of waste disposed of, was multiplied by the emission factor associated with landfilling, combustion of lubricant, waste water treatment and non-hazardous solid waste disposal. Calculations were performed in accordance with ISO 14064 Part 1 and The Greenhouse Gas Protocol: Corporate Value Chain (Scope 3) accounting and Reporting Standard. Assumptions: Due to lack of suitable information on the construction and operation of various municipal sewage treatment facilities CoalSA assumed that all facilities are anaerobic, deep
53.5% Not applicable

Sources of Scope 3
emissions
Evaluation status
metric tonnes CO2e
Emissions calculation methodology
Percentage of
emissions calculated using data obtained
from suppliers or value
chain partners
Explanation
(>2m) collection lagoon type facilities. It was assumed that the average density of the waste lubricant was 825kg/m3 (http://www.machinerylubrication.com/Read/29319/measuring-relative-density). It was assumed that the average amount of waste generated per employee at Kumba’s operations was 0.7kg per day. (Institute of Waste Management Southern Africa). IOB included non hazardous waste to legal landfill and used the Brazilian GHG Programme calculation sheets and its conversion factors (GHG Protocol Brazilian Programme Tool - Version 2016.1.1). Allocation methods: Operational Control (Platinum, Nickel Niobium & Phosphates, Iron Ore Brazil, Copper and CoalSA) Financial Control (Kumba)
Business travel
Relevant, calculated
6017
This category includes emissions from business-related employee travel in vehicles operated by 3rd parties, including air travel and terrestrial vehicular travel. Activity data: obtained directly from the Anglo American travel agent and the company’s financial system. The monetary value of claimed kms and an average rate was used to calculate kms travelled. Emission factors: NNP air travel: <500km: 0.165 kgCO2e/km 500-3700km: 0.094 kgCO2e/km >3700km: 0.108 kgCO2e/km Platinum Long haul air travel: 0.1314 kgCO2e/km (Defra, 2012) Short haul air travel: 0.1149 kgCO2e/km (Defra, 2012) Domestic air travel: 0.2012 kgCO2e/km; (Defra, 2012). Car travel: 0.2339 kgCO2e/km; (Defra, 2012; Average, unknown fuel). CoalSA Car travel: 2.69 tCO2/kL (IPCC 2006) Domestic air travel: 0.191kgCO2/km (GHG Protocol) Long haul First class air travel: 0.352kgCO2/km (GHG Protocol) Long haul Business air travel: 0.255 kgCO2/km (GHG Protocol) Long haul Economy air travel: 0.088kgCO2/km (GHG Protocol) Short haul First class air travel: 0.153kgCO2/km (GHG Protocol) Short haul
53.5%
Use of vehicles on operations / service offices (and the associated diesel / petrol consumption) is included into the scope 1 emissions of each respective operation (reported as tCO2e from fossil fuels).

Sources of Scope 3
emissions
Evaluation status
metric tonnes CO2e
Emissions calculation methodology
Percentage of
emissions calculated using data obtained
from suppliers or value
chain partners
Explanation
Business air travel: 0.153kgCO2/km (GHG Protocol) Short haul Economy air travel: 0.102 kgCO2/km (GHG Protocol) Car Hire: 0.207 kgCO2/km (GHG Protocol) Kumba Domestic flights: 0.155 kg CO2e/passenger.km (DEFRA 2014). Short haul economy flights: 0.0837 kg CO2e/passenger.km (DEFRA 2014). Short haul business flights: 0.126 kg CO2e/passenger.km (DEFRA 2014). Long haul business flights: 0.231 kg CO2e/passenger.km (DEFRA 2014). Upper Medium Car (unknown fuel): 0.189 kg CO2e/vehicle km (DEFRA 2014). GWP values: CO2 = 1 CH4 = 25 N2O = 298 Methodology: The activity data was multiplied by the appropriate emission factor in accordance with ISO 14064 Part 1 and The GHG Protocol: Corporate Value Chain (Scope 3) accounting and Reporting Standard. Iron Ore Brazil calculated emissions using the Brazilian GHG Programme calculation sheets and its conversion factors (GHG Protocol Brazilian Programme Tool - Version 2016.1.1). Assumptions: CoalSA assumed all cars to have 3 way catalysts (IPCC 2006 Guideline) Kumba assumed all cars to be medium sized with unknown fuel type Allocation methods: Operational Control (Platinum, CoalSA, Iron Ore Brazil, Copper and Nickel Niobium & Phosphates) Financial Control (Kumba)
Employee commuting
Relevant, calculated
54563
This category includes emissions from the transportation of employees between their homes and their worksites in vehicles not owned or operated by Anglo American. Activity data: Information taken from the report "Anglo American Platinum Employee transport subsidy plan" 31 August 2012. The distance travelled by employees from home to work, and the number and type of employees working at each operation were obtained from a study conducted in 2013 and was used to estimate Anglo American’s Kumba Iron Ore emissions. Emission factors: Platinum Average
38% Not applicable

Sources of Scope 3
emissions
Evaluation status
metric tonnes CO2e
Emissions calculation methodology
Percentage of
emissions calculated using data obtained
from suppliers or value
chain partners
Explanation
car (unknown size or fuel): 0.233 kg CO2e/km (Defra, 2012). Minibus Taxi: 0.300 kg CO2e/ km (Defra, 2012). Bus: 0.150 kg CO2e/ passenger.km (Defra, 2012). Rail: 0.115 kg CO2e/passenger.km (Defra, 2011, adjusted with Eskom GEF). Kumba An ‘average car’ with unknown fuel: 0.189 kgCO2e/km; (DEFRA, 2014). A taxi (Specification sheet of Toyota Quantum 2.7GL 14 seater bus): 0.000022 kg CO2e/passenger.km; (DEFRA , 2014) A local bus: 0.109 kg CO2e/ km (DEFRA , 2014) GWP values: Carbon dioxide = 1 Methodology: Number of employees and approximate distances and methods of travel used was obtained from in-house employee transport studies. The distance travelled by the specific method was multiplied with the appropriate emission factor from Defra 2012 (Anglo American Platinum) Defra 2014 (Anglo American Kumba Iron Ore) to obtain the emissions. Calculations were performed in accordance with ISO 14064 Part 1 and The Greenhouse Gas Protocol: Corporate Value Chain (Scope 3) accounting and Reporting Standard. Assumptions: Assumptions were made in terms of the distances travelled by employees based on the finding of the internal studies. Allocation methods: Operational Control (Platinum, Copper) Financial Control (Kumba)
Upstream leased assets
Not relevant, explanation provided
0 Not applicable 100%
This category includes emissions from the operation of assets that are leased by Anglo American and its business units and not included in the scope 1 or scope 2 inventories. This is reported to be zero as any property that may currently be leased out is fully managed and

Sources of Scope 3
emissions
Evaluation status
metric tonnes CO2e
Emissions calculation methodology
Percentage of
emissions calculated using data obtained
from suppliers or value
chain partners
Explanation
as such incorporated into the scope 1&2 inventories.
Downstream transportation and distribution
Relevant, calculated
5035683
Anglo American Platinum’s products are taken by air to the Rand Refinery in Anglo American owned helicopters. From the Rand Refinery the products are transported by flight to the relevant customers. Kumba Iron Ore’s products are transported by railway from Sishen and Kolomela to Saldanha, product from Thabazimbi is transported to Vanderbijlpark and Newcastle. The product due for international export is transported by sea vessel. Anglo American’s Coal South Africa product is transported domestically by railway and a combination of rail and sea vessel for internationally exported products. Activity data: The activity data for this category comprises sources of air, land and sea transportation including helicopters, long and short haul flights, domestic rail as well as export by ship. Emission factors: Helicopter flights: 523.26 kg CO2e/hour based on 170 litres/hour and 3.078 kilogram CO2e/litre (Defra 2012) Platinum Air Domestic: 0.426 kg CO2e/tonne.km (Indirect, Defra 2012) and 2.065 kg CO2e/tonne.km (Direct, Defra 2012). Air Long-haul international: 0.641 kg CO2e/tonne.km (Direct, Defra 2012) and 0.132 kg CO2e/tonne.km (Indirect, Defra 2012). CoalSA Domestic rail: 0.042ktCO2e/tkm (Transnet) International Ocean Freight: 0.0078ktCO2e/tkm (IPCC) Kumba Rail: 0.059 kgCO2e/tonne.km (DEFRA, 2014) Shipping: 0.0025 kgCO2e/tonne.km (DEFRA, 2014) GWP values: Carbon dioxide = 1 Methodology: With regard to the helicopter trips, the total hours travelled was estimated, which was then multiplied by the relevant emission factor in kgCO2e/hour. The weight of the product transported and distance travelled was multiplied by the relevant emission factor.
47% Not applicable

Sources of Scope 3
emissions
Evaluation status
metric tonnes CO2e
Emissions calculation methodology
Percentage of
emissions calculated using data obtained
from suppliers or value
chain partners
Explanation
Calculations were performed in accordance with ISO 14064 Part 1 and The Greenhouse Gas Protocol. Assumptions: An assumption was made that rail emissions were negligible for Platinum due to immaterial emissions factor. Kumba made the following assumptions: All of the product which is transported via ship is transported via a Bulk Carrier 200,000t + dry weight tonnage (dwt) type of ship classification used in DEFRA The rail emission factor used from DEFRA could be adjusted for the South African rail services by dividing the emission factor by the UK grid emission factor (GEF) and then multiplying it by the South African GEF. Allocation methods: Operational Control (Platinum, Copper and CoalSA) Financial Control (Kumba)
Processing of sold products
Relevant, calculated
106212219
This category includes emissions from the processing (by third parties/consumers) of sold intermediate products. This processing occurs subsequent to sale by Anglo American Platinum (Platinum), Coal South Africa (CoalSA) and Kumba Iron Ore (Kumba). Activity data: The activity data for this category includes emissions from: processing nickel for production of stainless steel; the production of copper wire from copper; the processing of refined PGMs and Gold as well as the production of steel from iron ore. Emission Factors: Stainless steel: 6.84 tCO2e/t steel smelted Copper wire: 0.1500 kgCO2/tonne copper Platinum: 33.78 kgCO2/ton Palladium: 46.75 kgCO2/ton Rhodium: 76.80 kgCO2/ton Gold: 18.94 kgCO2/ton Other PGMs: 38.57 kgCO2/ton Iron: 1.35 tCO2e/tonne pig iron (2006 IPCC) Steelmaking: 1.46 tCO2e/tonne steel (2006 IPCC) Steel Products: 0.845 tCO2e/tonne ore Sintering Emission Factor: 0.202 tCO2e/tonne sinter (2006 IPCC) GWP values: Carbon dioxide = 1 Methane = 25 Sintering results in the emission of Carbon dioxide and methane. Methodology: The emissions
38%
CoalSA reported zero for this category because, coal is processed at plants on site / at operational level and thus all energy/fugitive related emissions are therefore included in Scope 1 and 2 reports. Any further emissions related to processing subsequent to this are deemed immaterial. The combined contribution of all other PGMs to the total of emissions associated with processing of sold products is regarded as negligible as they account for ~16% of total PGM production.

Sources of Scope 3
emissions
Evaluation status
metric tonnes CO2e
Emissions calculation methodology
Percentage of
emissions calculated using data obtained
from suppliers or value
chain partners
Explanation
associated with the processing of the respective materials were calculated by multiplying the mass of the product sold with the emission factor for the processing technique. Calculations were performed in accordance with ISO 14064 Part 1 and The Greenhouse Gas Protocol. Assumptions: Conversion of pig iron to steel is assumed a ratio of 1:1. For conservative estimates, nickel produced is assumed to be used for stainless steel production (8% nickel content), as stainless steel production is the most energy intensive process of all nickel end-products. It is further assumed that the product will be recycled at least once during its lifetime. For conservative estimates, copper produced is assumed to be used for the production of copper wire, as the production of copper wire is the most energy intensive process for copper end-products. It is further assumed that the product will be recycled at least once during its lifetime. Platinum constitutes 50% of total PGM production, it is assumed that the energy involved in the manufacturing of auto-catalysts and jewellery is immaterial. Allocation methods: Operational Control (Platinum and CoalSA) Financial Control (Kumba)
Use of sold products
Relevant, calculated
109457078
This category includes emissions from the use of goods and services sold by Anglo American. Anglo American’s thermal coal product is utilised in the thermal coal powered generation of electricity, both domestically (in South Africa) and Internationally. Whilst our metallurgical coal is exported out (mostly) of Australia and to the rest of the world for steel production amongst others. Activity data: The activity data for this category comprises the metric tonnes of thermal and metallurgical coal product supplied to the various energy generators /providers and steelmakers across the world. Emission factors: Metallurgical coal: 3.06 Thermal coal:
33%
There are no material emissions directly associated with the use of the iron ore and PGMs post their processing as outlined in the previous category (“Processing of sold products”).

Sources of Scope 3
emissions
Evaluation status
metric tonnes CO2e
Emissions calculation methodology
Percentage of
emissions calculated using data obtained
from suppliers or value
chain partners
Explanation
2.03 GWP values: Carbon dioxide = 1 Methane = 25 Nitrous oxide = 296 Methodology: Equation 2.1 (Stationary combustion) of the IPCC 2006 Guidelines (Chapter 2, v2.2) was used to estimate the emissions from coal product sold to and used by the consumer. Emissions (GHG and fuel) is the result of Fuel Consumption multiplied by Emissions Factor (GHG and fuel) ,where: Emissions (GHG and fuel) is the emissions of a given GHG by type of fuel (kg GHG) Fuel Consumption is the amount of fuel combusted (TJ) Emissions Factor (GHG and fuel) is the default emission factor of a given GHG by type of fuel (kg gas/TJ). Assumptions: The carbon oxidation factor is assumed to be 1. Allocation methods: Operational Control (Platinum and CoalSA) Financial Control (Kumba)
End of life treatment of sold products
Relevant, calculated
676110
This category includes emissions from the disposal and end-treatment of products sold by Anglo American’s Platinum (Platinum), Coal South Africa (CoalSA) and Kumba Iron Ore (Kumba) business units . The end of life treatment of coal product (ash/fly post combustion in power stations) is disposal onto discard dumps. Platinum and most PGMs are recycled at end of life. Steel (product of iron ore) is also often recycled with the process involving smelting. Activity data: This data comprises the amount of iron ore sold in the reporting year based on sales records. Emissions factors: The emission factor associated with the end of life treatment: Processing of scrap metal in an Electric Arc Furnace: 0.08 tCO2e / tonne ore (2006 IPCC Guidelines) GWP values: Carbon dioxide = 1 Methodology: The amount of steel recycled was determined by multiplying the recycling rate (30%) with the total amount of steel produced. The amount of recycled steel was then multiplied by the number of times recycled (one)
47%
In South Africa, ash/fly is discarded on dumps and no further treatment is done, as a result this category is immaterial to CoalSA. The products of platinum (PGMs) are not often disposed of or treated, instead these usually remain as is or are recycled and as a result this category is reported as zero by Platinum.

Sources of Scope 3
emissions
Evaluation status
metric tonnes CO2e
Emissions calculation methodology
Percentage of
emissions calculated using data obtained
from suppliers or value
chain partners
Explanation
and finally multiplied by the electric arc furnace emission factor to estimate the emissions associated with end of life treatment. The Calculations were performed in accordance with ISO 14064 Part 1 and The Greenhouse Gas Protocol: Corporate Value Chain (Scope 3) Accounting and Reporting Standard. Assumptions: A steel recycling rate of 30% (World Steel Association report from 2012). Number of times steel is recycled is once. All sold iron ore product is processed into steel. Allocation methods: Operational Control (Platinum and CoalSA) Financial Control (Kumba)
Downstream leased assets
Not relevant, explanation provided
0 Not applicable 100%
Anglo American and its business units do not lease out their assets and as such this category is irrelevant in this respect.
Franchises
Not relevant, explanation provided
0 Not applicable 100% The franchise category is immaterial to the Anglo American business model
Investments Relevant, calculated
1553213
This category includes scope 3 emissions associated with Anglo American’s Coal South Africa (CoalSA) and Platinum (Platinum) investments in the reporting year. Non-managed (equity share) operations, Mafube Colliery (50%) and Cerrejon Coal (33%), are included with only the respective shared percentages of their emissions being reported. Activity data: The activity data consists on the quantities of PGM produced at the site of Joint Venture Companies. Scope 1 and 2 emissions from the Coal South Africa equity share operations are reported in this category. Emission factors: The applied emission factor is 1.4665 tCO2e/refined ounce of precious metal. (GHG intensity factor of Anglo American
40%
Anglo American’s Kumba Iron Ore primarily has investments in holding companies without any direct operational footprints and as such reports zero emissions for this category.

Sources of Scope 3
emissions
Evaluation status
metric tonnes CO2e
Emissions calculation methodology
Percentage of
emissions calculated using data obtained
from suppliers or value
chain partners
Explanation
Platinum for 2014, i.e. the CO2 equivalent emissions / refined ounces). The reported direct scope 1&2 emissions were utilised for CoalSA’s equity share investments. GWP values: Carbon dioxide = 1 Methodology: The PGM production of the Platinum joint venture mines was multiplied by the GHG intensity figure of Platinum for 2014 as well as the percentage shareholding in order to estimate the emissions from these operations. The CoalSA emissions were obtained from the Enablon database and multiplied by the shareholding percentage. Calculations were performed in accordance with ISO 14064 Part 1 and The Greenhouse Gas Protocol: Corporate Value Chain (Scope 3) accounting and Reporting Standard. Assumptions: No assumptions were made. Allocation methods: Operational Control (Platinum and CoalSA)
Other (upstream)
Not relevant, explanation provided
0 Not applicable 100% Anglo American has no other relevant/material upstream emissions.
Other (downstream)
Not relevant, explanation provided
0 Not applicable 100% Anglo American has no other relevant/material downstream emissions.
CC14.2
Please indicate the verification/assurance status that applies to your reported Scope 3 emissions No third party verification or assurance

CC14.2a
Please provide further details of the verification/assurance undertaken, and attach the relevant statements
Verification or
assurance cycle in place
Status in the
current reporting year
Type of
verification or assurance
Attach the statement
Page/Section reference
Relevant standard
Proportion of
reported Scope 3 emissions verified (%)
CC14.3
Are you able to compare your Scope 3 emissions for the reporting year with those for the previous year for any sources? Yes
CC14.3a
Please identify the reasons for any change in your Scope 3 emissions and for each of them specify how your emissions compare to the previous year

Sources of Scope 3
emissions
Reason for
change
Emissions
value (percentage)
Direction
of change
Comment
Purchased goods & services
Change in output 10 Increase The increase was largely due to increases in the amount of explosives used at our Platinum and Kumba operations. A minor contributor to the increase was due to the addition of emissions data associated with Iron Ore Brazil and Copper.
Capital goods Change in output 62 Decrease The number of vehicles purchased by Kumba in this reporting year was less than half that purchased in the previous year, due to decreased production outputs planned for the year. This resulted in a decrease in emissions from the purchasing of capital goods.
Fuel- and energy-related activities (not included in Scopes 1 or 2)
Change in methodology
10 Increase Kumba reported a 16% increase due to a change in transmission and distribution emission factor for electricity consumption increase from 0.106 to 0.123 tCO2e/MWh in the reporting year. The addition of Copper also contributed to the increase
Fuel- and energy-related activities (not included in Scopes 1 or 2)
Emissions reduction activities
0.2 Decrease
Emission reduction activities in 2015 at Kumba reduced the year on year change in fuel and energy related activities by 1.7% at Kumba. The emission reduction activities reduced the diesel consumption by 4,762 m3 of diesel, this equates to a saving of 2,760 tCO2e when multiplied by the emission factor of 0.5796 tCO2e/m3 diesel. Thus the percentage saving from emission reduction activities is calculated as [2760/164926.73]x100. Where 164,926.73 is the scope 3 emissions from the fuel and energy related activities (not included in scope 1 or 2) for FY2014, the previous reporting year. This represents 0,2% of the Anglo American fuel and energy related activities (not included in scope 1 or 2) for FY2014 (1 239 810 tCO2e)
Upstream transportation & distribution
Change in output 23 Decrease
The emissions associated with upstream transportation and distribution decreased as a result of a decreased use of purchased transport services and diesel transport due to decreased production at the sites. The decrease was partially offset by the addition of emissions from Iron Ore Brazil and Copper.
Waste generated in operations
Unidentified 51 Decrease
Waste generated in operations
Emissions reduction activities
0.04 Decrease
Anglo American Platinum initiated a domestic waste recycling campaign at our Rustenburg operations. A contract for sorting and recycling domestic waste was implemented in September 2015. Monthly waste has been reduced from 813 tonnes/ month on average to 576 tonnes/month for the same waste category.
Business travel Unidentified 1 Decrease There was a marginal decrease in business travel which was also partially offset by the addition of emissions data from Iron Ore Brazil and Copper.

Sources of Scope 3
emissions
Reason for
change
Emissions
value (percentage)
Direction
of change
Comment
Employee commuting Other: decreased number of employees
13 Decrease The decrease was largely the result of restructuring at Platinum and Kumba operations. This was partially offset by the addition of emissions from Copper.
Downstream transportation and distribution
Change in methodology
1 Increase The increase is due to the addition of emissions from our copper operations.
Processing of sold products
Change in output 6 Decrease Product sold by Kumba decreased and product sold by Platinum increased however the emissions associated with the processing of Kumba’s product represent a greater contribution to the total.
Use of sold products Change in output 44 Decrease Coal South Africa sales decreased compared to 2014. This category only includes emissions associated with the use of thermal coal
End-of-life treatment of sold products
Change in output 6 Decrease
The decreased emissions associated with the end-of-life treatment of sold products resulted from the decrease in sold product by Kumba in the reporting year. This category only includes emissions associated with the end of life treatment of Kumba products.
Investments Change in output 7 Increase The increase is largely due to a change in production at Platinum, and to a lesser extent, Coal South Africa Joint Ventures.
CC14.4
Do you engage with any of the elements of your value chain on GHG emissions and climate change strategies? (Tick all that apply) Yes, our suppliers
CC14.4a
Please give details of methods of engagement, your strategy for prioritizing engagement and measures of success

I. Method of engagement Mining operations require all the goods and services that are used in any large-scale infrastructure and manufacturing projects, including labour, heavy equipment, process chemicals, fuel and lubricating oils, explosives, motors and a range of services. We have a large and diverse base of more than 30,000 suppliers around the world. Through our responsible sourcing programme, we aim to ensure that the goods and services we procure do not cause harm to individuals or the natural environment. We expect suppliers to demonstrate compliance with local laws and regulations, as well as good practices, in areas including climate change. Our approach is guided by the Anglo American Supplier Sustainable Development Code and Policy. Based on a risk ranking, suppliers are requested to complete a self-assessment questionnaire. This is typically for first tier suppliers, who represent our most material suppliers. Environmental information, including information on climate change, is requested in the self-assessment questionnaire. The more notable questions in the environmental management portion of the questionnaire focused on each supplier’s climate change risks, GHG data and GHG reduction strategies. Along with this, suppliers may be required to provide proof of statements made and demonstrate that the supplier code is followed. Anglo American may conduct site visits and audits to verify compliance with the code. Where elements of the code aren’t met, suppliers are required to implement corrective action plans to prevent recurrence. Anglo American may revoke the contracts of suppliers who fail to comply with the code. No incentive is given to suppliers to report information; however a penalty of non-compliance could result in that supplier losing its contract. ii. Strategy for prioritizing engagements Anglo American has more than 30,000 suppliers. However, for the engagement on GHG emissions and climate change strategies, Anglo American prioritised its top suppliers (by operational spend). To date, more than 300 suppliers have been audited by Anglo American. No new audits were undertaken in 2015 owing to cost constraints; instead, we have worked with mining peers to harmonise supplier standards, simplify auditing protocols and agree on principles of mutual recognition for suppliers. This approach will ultimately reduce duplication in cost and effort and establish an industry-wide commitment to responsible sourcing. iii. Measure of success Anglo American considers a questionnaire that has been fully completed by its supplier as a successful engagement. We found that engaging with its major suppliers on GHG emissions and climate change strategies generally strengthened the relationship with each of the suppliers. The engagement allowed us to gain a common understanding with the suppliers of emissions-related information and the opportunities and benefits of achieving GHG reductions. This engagement also allowed for cost savings through the value chain due to the implementation of energy efficiency initiatives which reduced price escalation. Further success would be greater follow up engagements and moving towards a supplier relationship programme. Anglo American recognizes that climate change presents uncertainties and although we are actively managing inherent risks in our supply we need to work with our suppliers to identify and manage risks. Success will therefore be an empowered supply chain able to help identify risks and offer products and solutions that help us mitigate our risks and reduce costs. Examples of successful measures to work with our supply chain to reduce our direct and indirect risks include: • Shifting from a fuel contract with one supplier to another was driven by a number of considerations including the fact that total fuel includes an additive that improves vehicle efficiency and therefore reduces costs and greenhouse gas emissions; • Distribution for Amandelbult platinum mine is looking to convert from road to rail. There are logistical challenges and the Platinum BU is engaging with government and Transnet to try and find a solution; • Anglo American has included requirements that service providers transporting employees meet basic requirements regarding the buses. This requirement is driven by mostly by safety objectives but to an extent also efficiency (with GHG benefits); and

• Anglo American works with suppliers to source more efficient products that still meet our needs, therefore saving money and reducing GHG emissions. Examples include investing in lighter materials associated with hauling to reduce energy consumption and looking at more efficient fuel burning through an alternative fuel mix for vehicles.
CC14.4b
To give a sense of scale of this engagement, please give the number of suppliers with whom you are engaging and the proportion of your total spend that they represent
Number of suppliers
% of total spend (direct and indirect)
Comment
300 1%
To date, more than 300 suppliers have been audited by Anglo American. No new audits were undertaken in 2015 owing to cost constraints; instead, we have worked with mining peers to harmonise supplier standards, simplify auditing protocols and agree on principles of mutual recognition for suppliers. This approach will ultimately reduce duplication in cost and effort and establish an industry-wide commitment to responsible sourcing.
CC14.4c
If you have data on your suppliers’ GHG emissions and climate change strategies, please explain how you make use of that data
How you make use of the data
Please give details
Managing the impact of regulation in the supply chain
Carbon tax is set to be implemented in South Africa in 2017. Based on the proposed taxation structure, companies will be taxed at a rate of R120 on 5 to 40% of their Scope 1 emissions (Treasury intends to create a net zero impact on the electricity price suggesting no liability associated with Scope 2 emissions). The tax will be escalated by 10% per annum up until 2020, at which point the tax rate and tax free exemptions will come under review. If Anglo American's South African suppliers are able to share their GHG emissions data, along with the proposed impact of carbon tax on their business,we can build in the anticipated pass through costs into the company’s business plans and life of mine plans.
CC14.4d

Please explain why you do not engage with any elements of your value chain on GHG emissions and climate change strategies, and any plans you have to develop an engagement strategy in the future
Further Information
Module: Sign Off
Page: CC15. Sign Off
CC15.1
Please provide the following information for the person that has signed off (approved) your CDP climate change response
Name
Job title
Corresponding job category
Tony O’Neill Group Director – Technical Chief Operating Officer (COO)
Further Information
CDP 2016 Climate Change 2016 Information Request