Embed Size (px)
Citation preview

Angle Resolved Photoemission SpectroscopyDan Dessau
University of Colorado, BoulderOffice – F625 Lab- G235
sample
analyzer
e -
hν
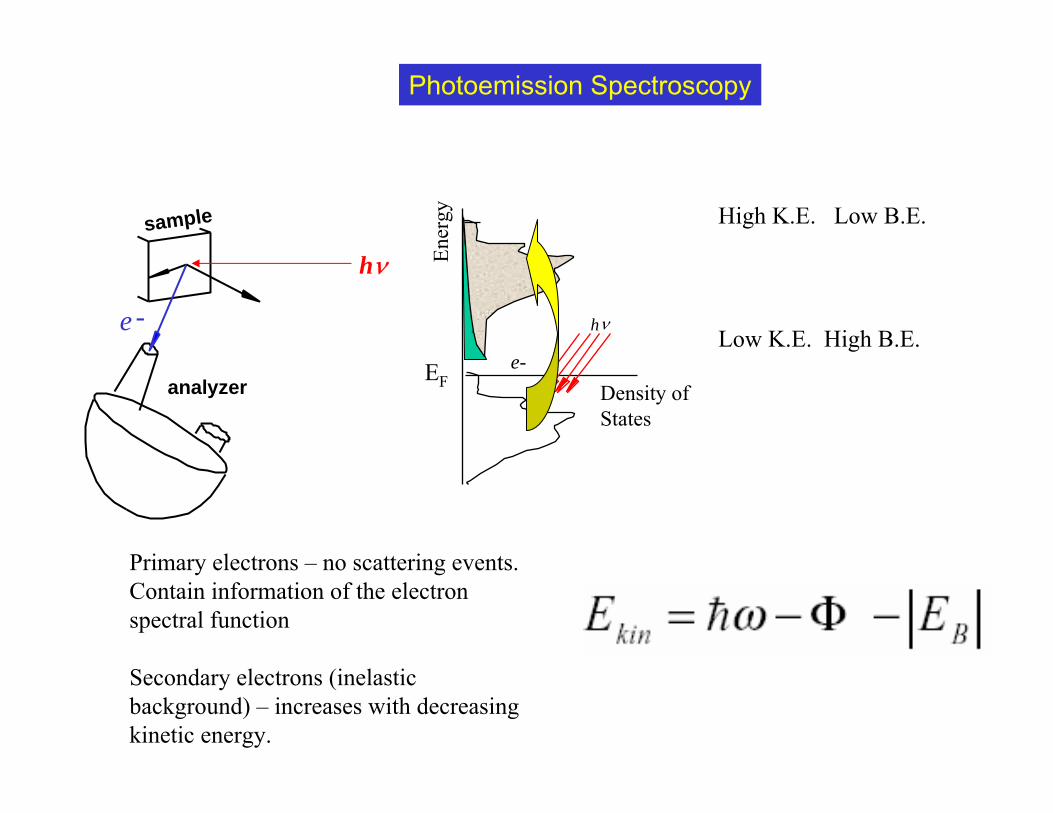
Photoemission Spectroscopy
Density of States
Ener
gy
EFe-
hν
Primary electrons – no scattering events. Contain information of the electron spectral function
Secondary electrons (inelastic background) – increases with decreasing kinetic energy.
High K.E. Low B.E.
Low K.E. High B.E.

Interested in critical details of the lowest energy interactions near EF.Requirement for the highest spectral resolution and sensitivity.
Angle Resolved Photoemission (ARPES)
Most direct way to measure quantum mechanical “dance” of electrons in a solid.
Density of States
Ener
gyEF
e-
hν
sample
analyzer
e -
hν
EF
Ener
gy
k
Angle-integratedDensity of States
Angle-Resolved (ARPES)k-dependent elect. structure

θφ
hν
A detector
sample
e-
Angle Resolved Photoemission (ARPES)Angle Resolved Photoemission (ARPES)A momentum resolved spectroscopyA momentum resolved spectroscopy
Electron momentum Parallel to the surface is conserved
)(),( Intensity2
EfEAifi,f
kAprrr∑ •∝
Most direct way to measure E vs. k of a solid.
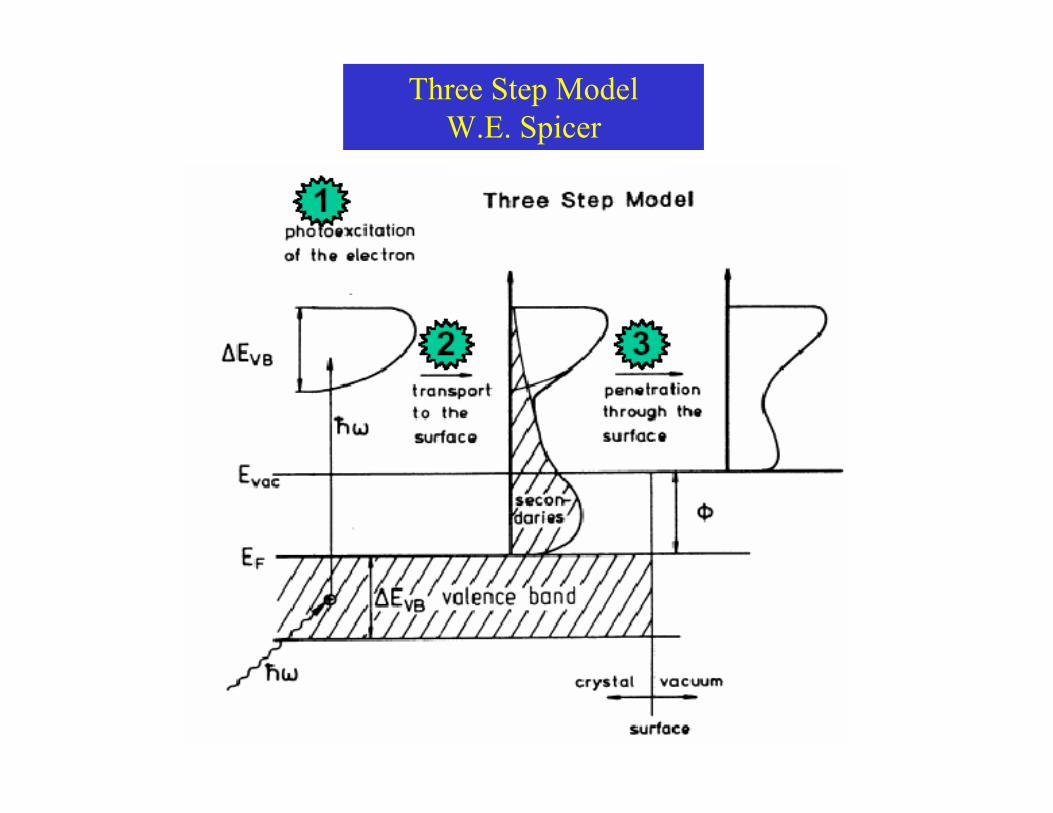
Three Step Model W.E. Spicer
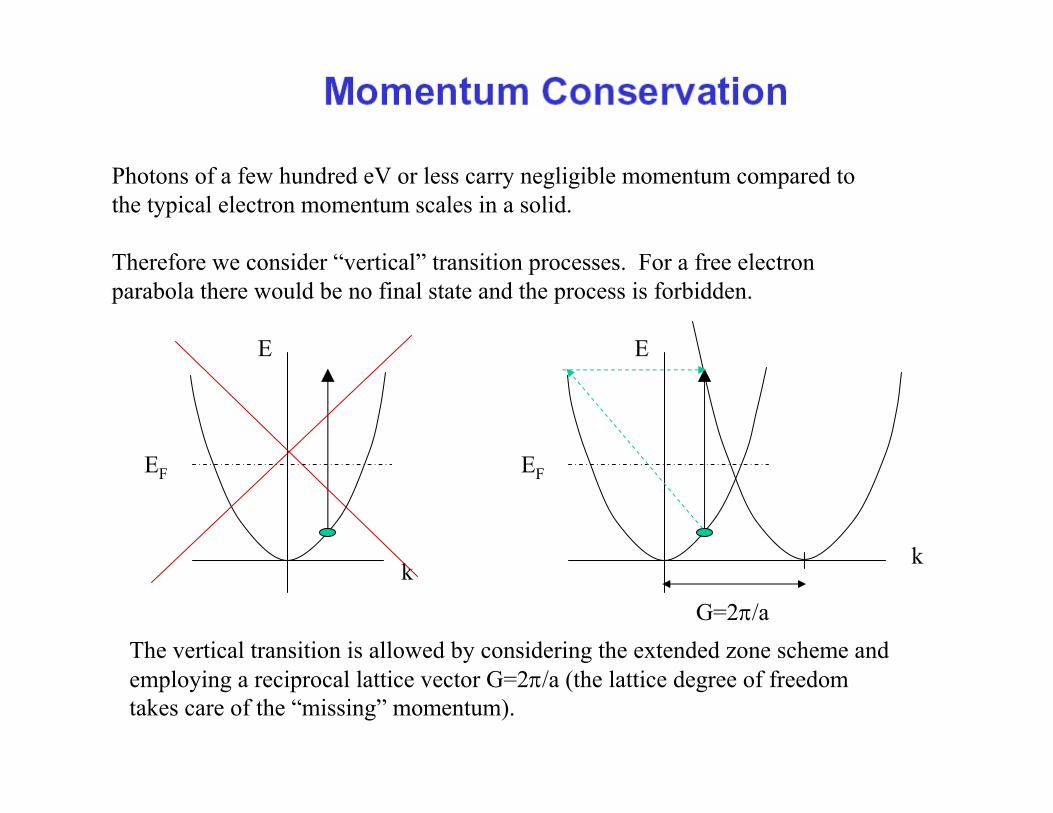
Photons of a few hundred eV or less carry negligible momentum compared to the typical electron momentum scales in a solid.
Therefore we consider “vertical” transition processes. For a free electron parabola there would be no final state and the process is forbidden.
E
k
EF
E
k
EF
G=2π/aThe vertical transition is allowed by considering the extended zone scheme and employing a reciprocal lattice vector G=2π/a (the lattice degree of freedom takes care of the “missing” momentum).
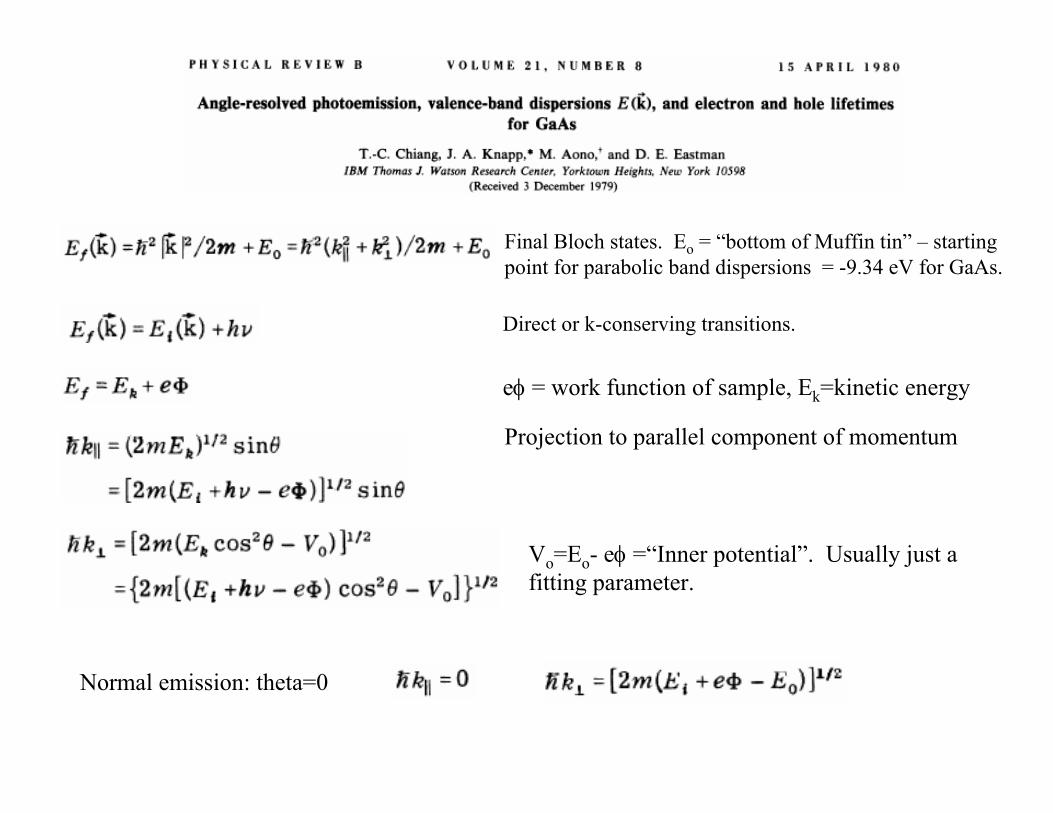
Final Bloch states. Eo = “bottom of Muffin tin” – starting point for parabolic band dispersions = -9.34 eV for GaAs.
Direct or k-conserving transitions.
eφ = work function of sample, Ek=kinetic energy
Vo=Eo- eφ =“Inner potential”. Usually just a fitting parameter.
Normal emission: theta=0
Projection to parallel component of momentum
•Can ignore kz dispersion. •Need not vary photon energy to map out Fermi surface and high symmetry directions.•Less final state broadening. Intrinsic initial-state linewidthscan be studied.•Usually much better cleaved surfaces
2D compounds
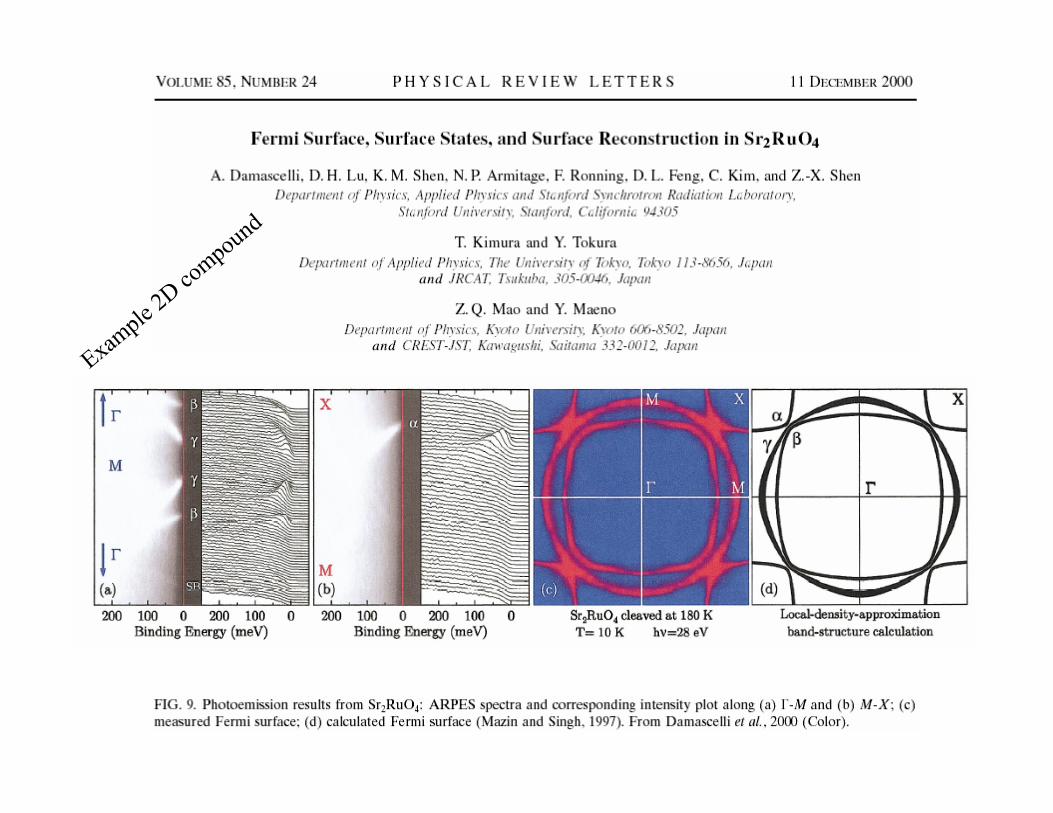
Example 2
D compound

Normal emission: theta=0
k_perp=0
ΓKX
3ΓKX
EF
2ΓKX
Eo
Example 3
D compound
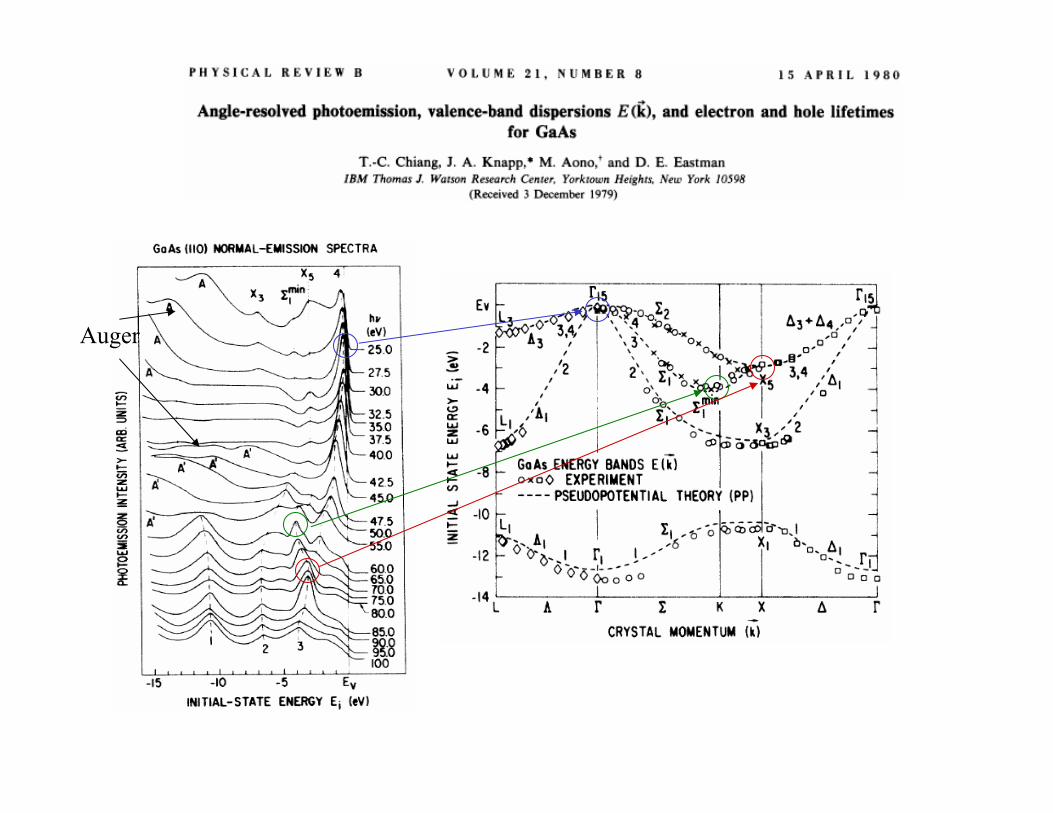
Auger

•Can ignore kz dispersion. •Need not vary photon energy to map out Fermi surface and high symmetry directions.•Less final state broadening. Intrinsic initial-state linewidthscan be studied.•Usually much better cleaved surfaces
2D compounds

Measured linewidths Γm have a contribution from the lifetimes of the initial state (lifetime Γi) and final state (lifetime Γf).f
i
Final s
tate (
e.g. fr
ee
electr
on) u
noccu
pied
band
Initial st
ate
occupied
band
kperp (and hν) value with maximum intensity (cross section)
kperp (and hν) value with half maximum intensity
Nearly 2D limit: vi perp small. Near isolation of Γi.
M. P
. Sea
h an
d W
. A. D
ench
, Sur
f. In
terfa
ce A
nal.
1, 2
(197
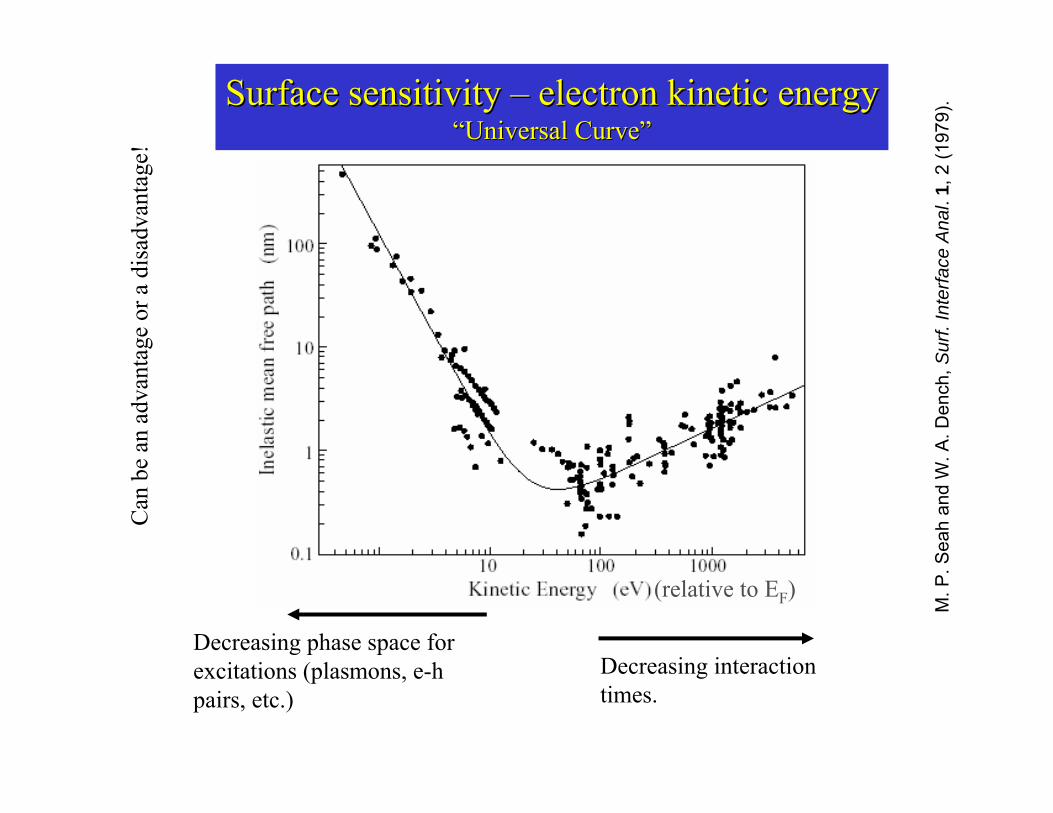
9).Surface sensitivity Surface sensitivity –– electron kinetic energyelectron kinetic energy
““Universal CurveUniversal Curve””
(relative to EF)
Can
be
an a
dvan
tage
or a
dis
adva
ntag
e!
Decreasing phase space for excitations (plasmons, e-hpairs, etc.)
Decreasing interaction times.
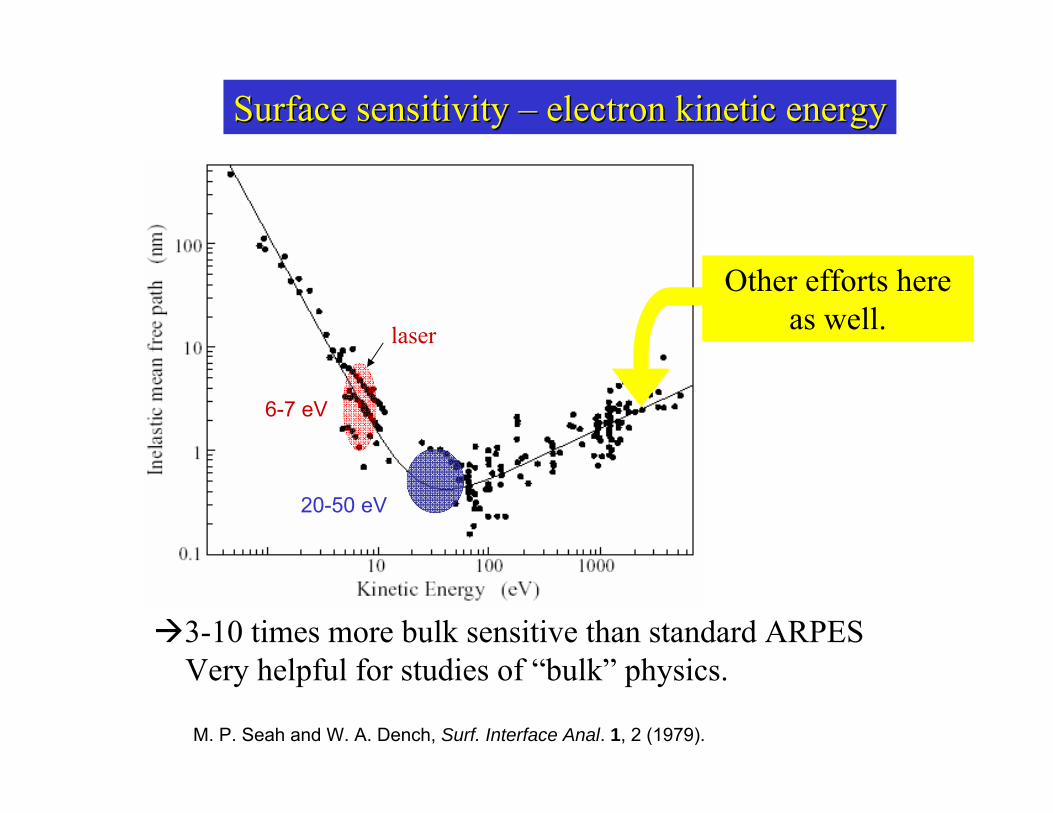
M. P. Seah and W. A. Dench, Surf. Interface Anal. 1, 2 (1979).
Surface sensitivity Surface sensitivity –– electron kinetic energyelectron kinetic energy
3-10 times more bulk sensitive than standard ARPESVery helpful for studies of “bulk” physics.
6-7 eV
20-50 eV
Other efforts here as well.laser

Researchers Turn Up the Heat in Superconductivity Hunt
J.D. Koralek, D.S.D. et.al, Phys. Rev. Lett. 96, 017005 (2006)
ARPES dispersionalong the nodal lineof Bi2Sr2CaCu2O8
T ~ 20K

•Improved k and E resolution•Improved bulk sensitivity•Reduced background•Decreased space-charge effect•Increased final state lifetimes (less k_perp broadening)
Low photon energy ARPESLow photon energy ARPES
Disadvantages of lowDisadvantages of low--energy ARPESenergy ARPES
• Potential issues with breakdown of the sudden-approximation• Technically more challenging (Electron analyzers don’t like low
kinetic energy)• Often a lack of matrix element/photon energy control • Not many synchrotron beamlines.
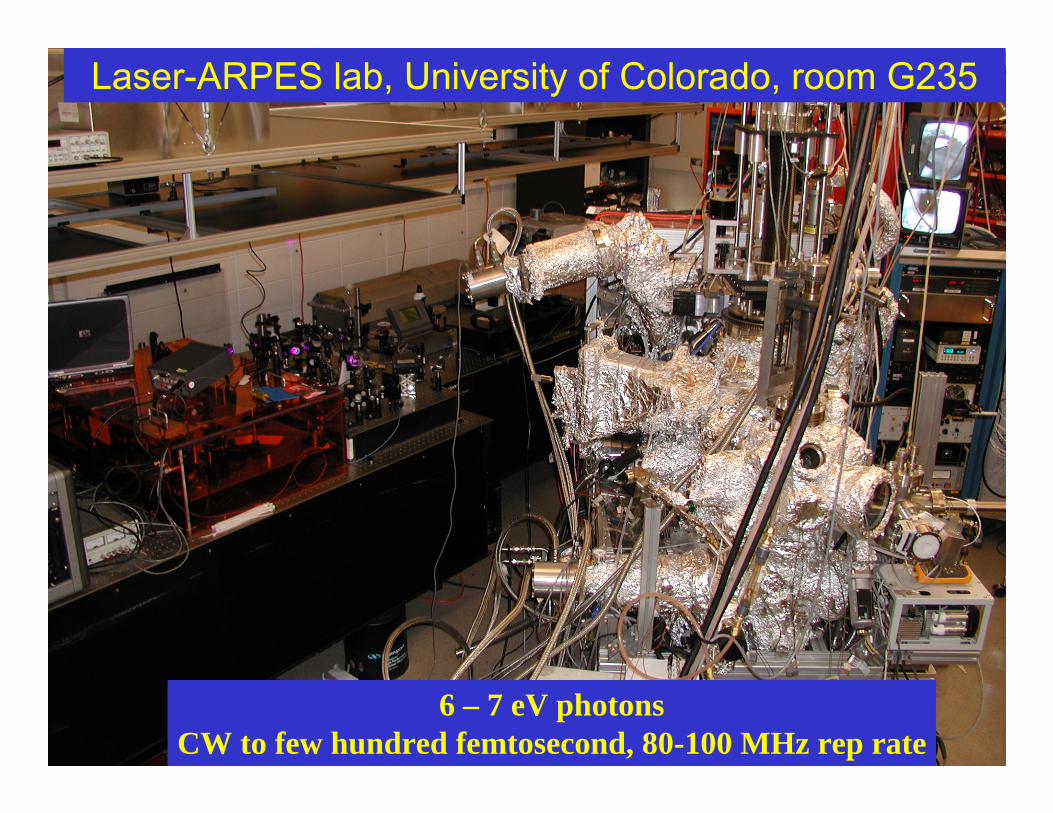
Laser-ARPES lab, University of Colorado, room G235
6 – 7 eV photonsCW to few hundred femtosecond, 80-100 MHz rep rate

Resolution and k-space effect
(π,0)
-1.0
-0.5
0.0
0.5
1.0
-1.0 -0.5 0.0 0.5 1.0
(π,π)
θsin2// kmEhk =
•For the same angular resolution, the k resolution at low E is superior.•k resolution translates to E widths if the peak is dispersive.
For nodal states & + .15 degree angular resolution,5 meV broadening for hv=6eV, 38 meV for hv=52 eV.
• However – relatively small range of k-space accessible.
Range of k-space accessible in Bi2212 at hv= 6 eV

Typical synchrotron beamline for ARPES
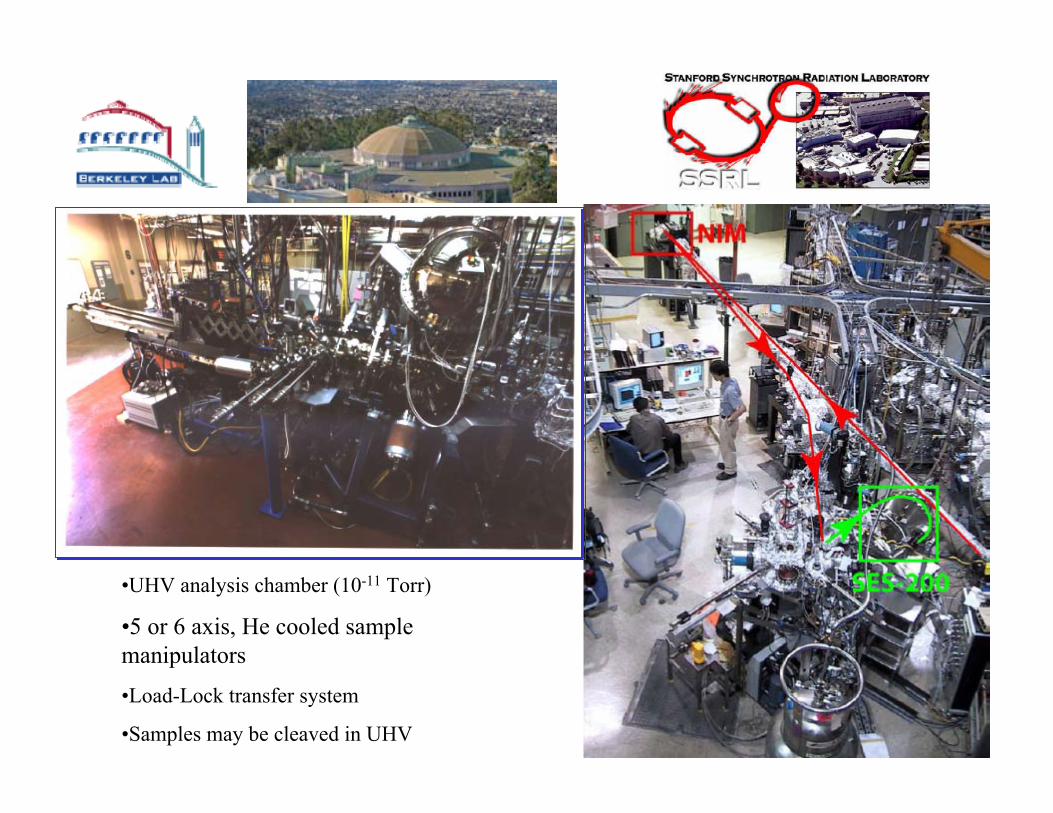
•UHV analysis chamber (10-11 Torr)
•5 or 6 axis, He cooled sample manipulators
•Load-Lock transfer system
•Samples may be cleaved in UHV
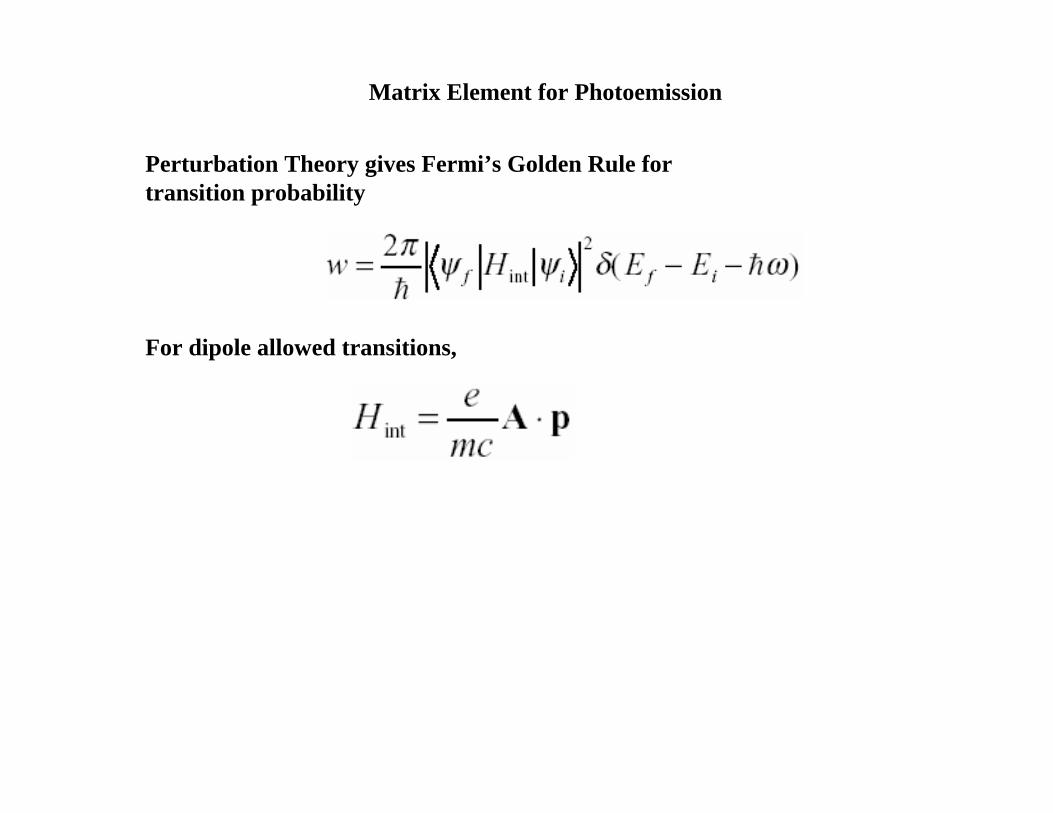
Matrix Element for Photoemission
Perturbation Theory gives Fermi’s Golden Rule fortransition probability
For dipole allowed transitions,
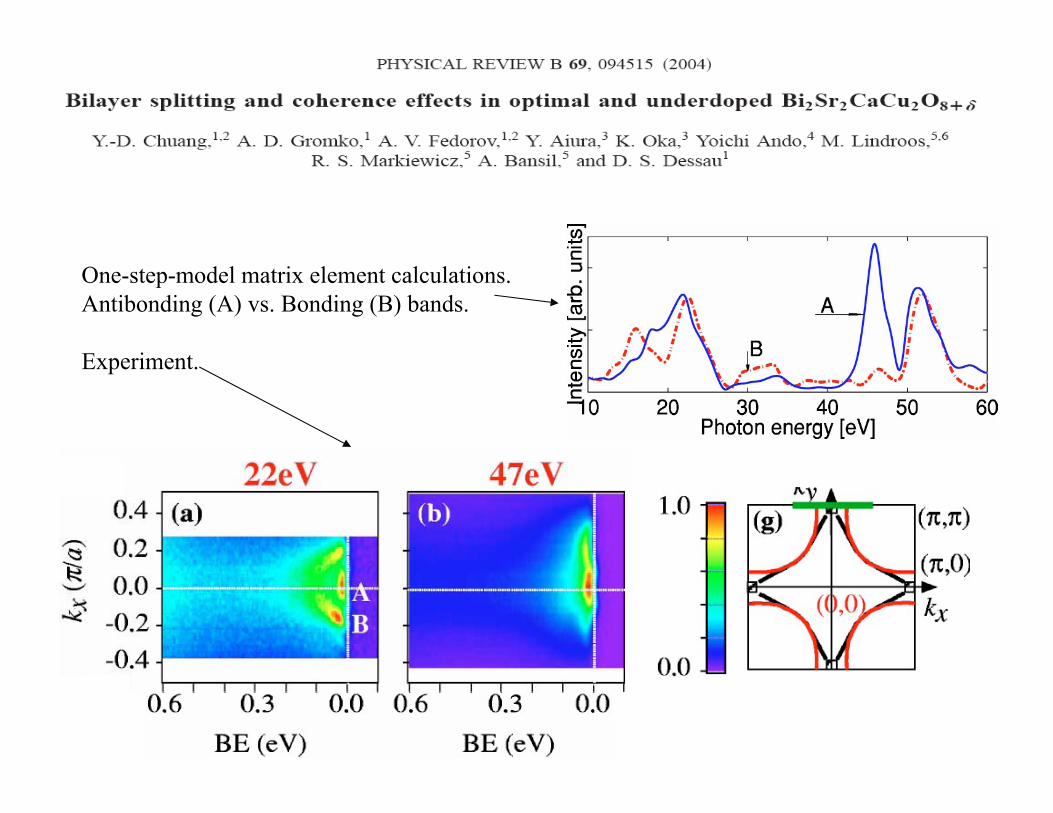
One-step-model matrix element calculations.Antibonding (A) vs. Bonding (B) bands.
Experiment.
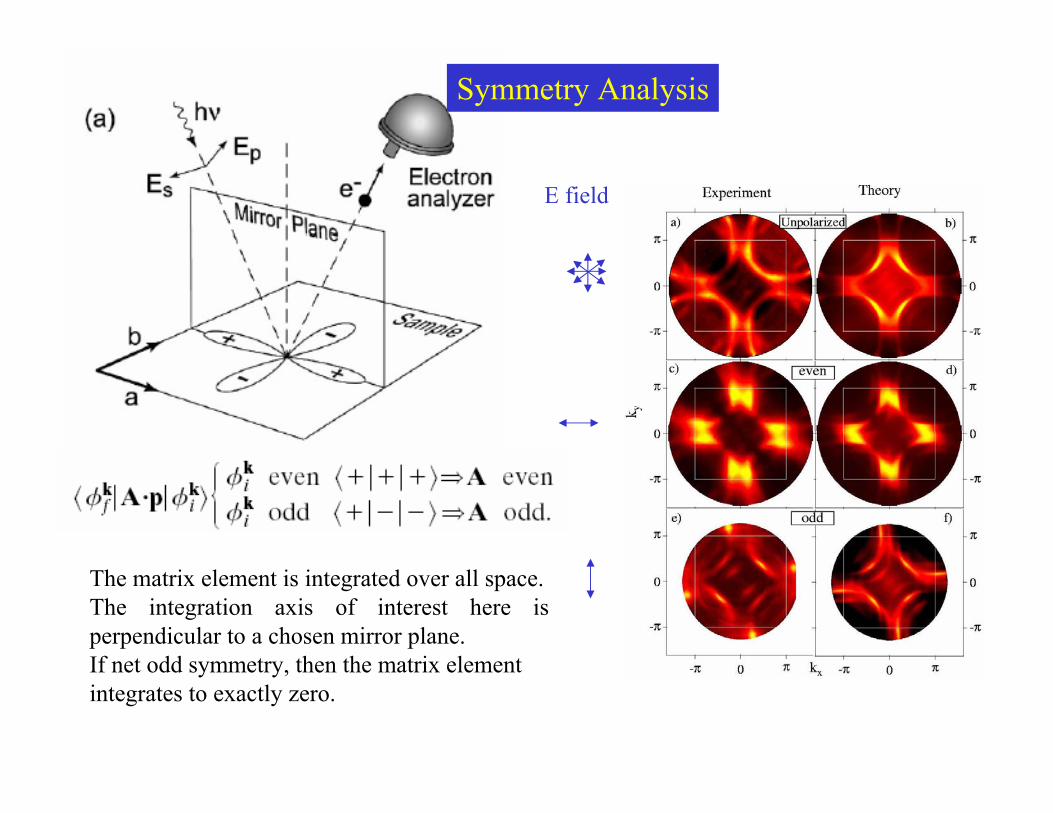
Symmetry Analysis
The matrix element is integrated over all space.The integration axis of interest here is perpendicular to a chosen mirror plane.If net odd symmetry, then the matrix element integrates to exactly zero.
E field
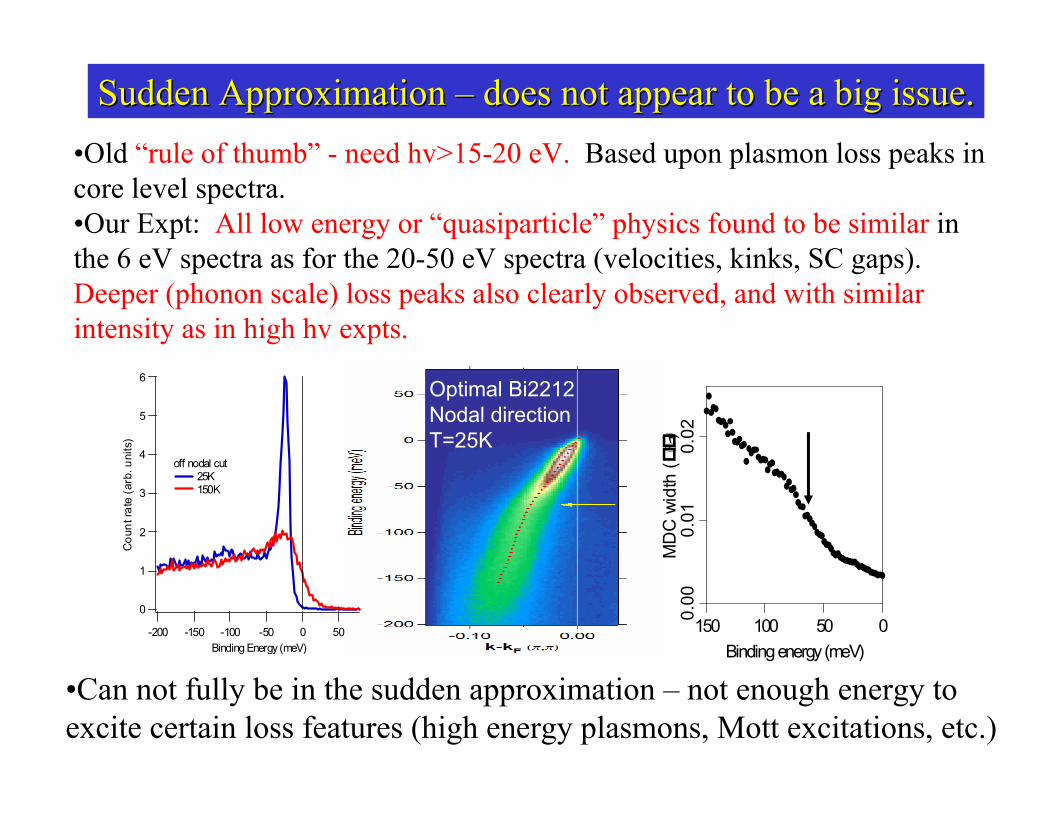
Sudden Approximation Sudden Approximation –– does not appear to be a big issue.does not appear to be a big issue.•Old “rule of thumb” - need hv>15-20 eV. Based upon plasmon loss peaks in core level spectra. •Our Expt: All low energy or “quasiparticle” physics found to be similar in the 6 eV spectra as for the 20-50 eV spectra (velocities, kinks, SC gaps). Deeper (phonon scale) loss peaks also clearly observed, and with similar intensity as in high hv expts.
Optimal Bi2212Nodal directionT=25K
6
5
4
3
2
1
0
Cou
nt ra
te (a
rb. u
nits
)
-200 -150 -100 -50 0 50Binding Energy (meV)
off nodal cut 25K 150K
0.02
0.01
0.00
MD
C w
idth
()
150 100 50 0Binding energy (meV)
•Can not fully be in the sudden approximation – not enough energy to excite certain loss features (high energy plasmons, Mott excitations, etc.)
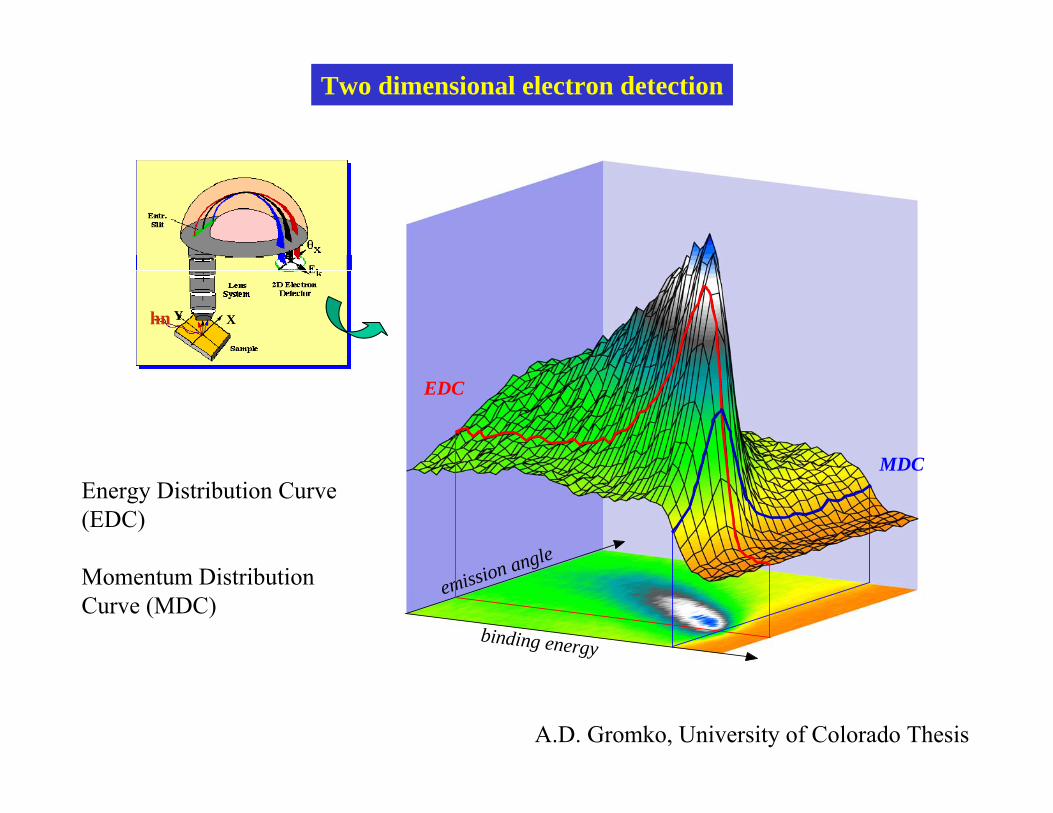
binding energy
emission angle
MDC
EDC
Two dimensional electron detection
XYhn
A.D. Gromko, University of Colorado Thesis
Energy Distribution Curve (EDC)
Momentum Distribution Curve (MDC)
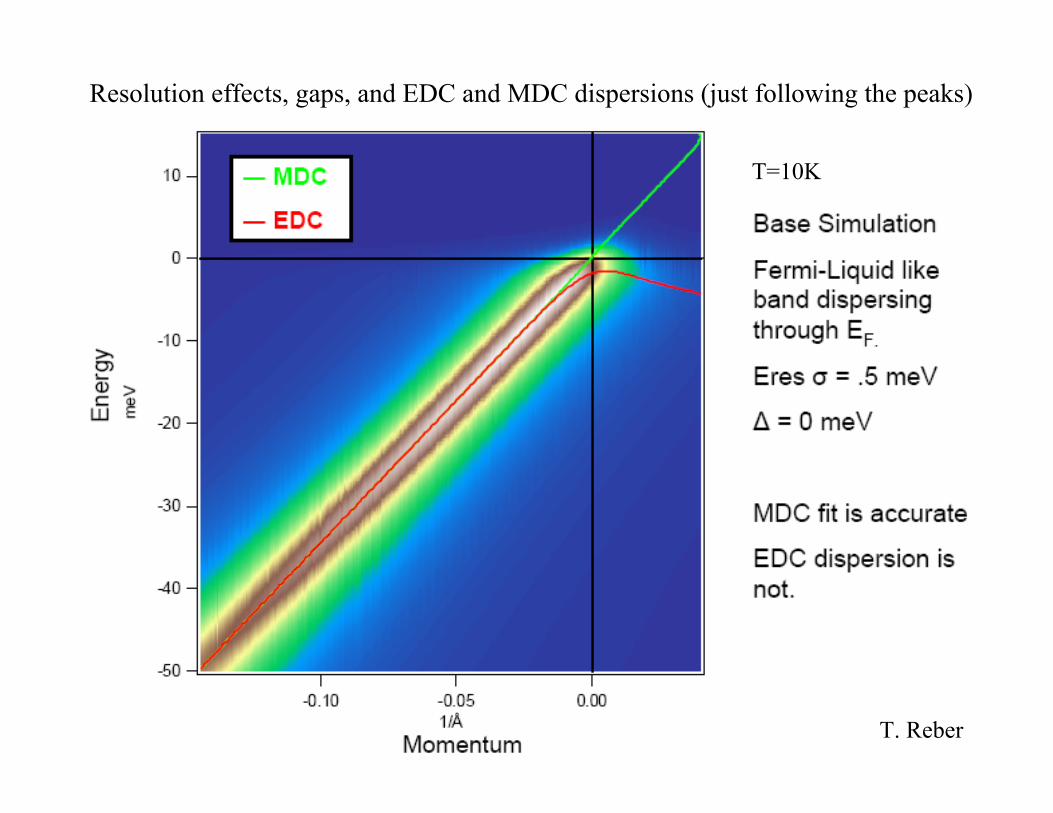
Resolution effects, gaps, and EDC and MDC dispersions (just following the peaks)
T. Reber
T=10K
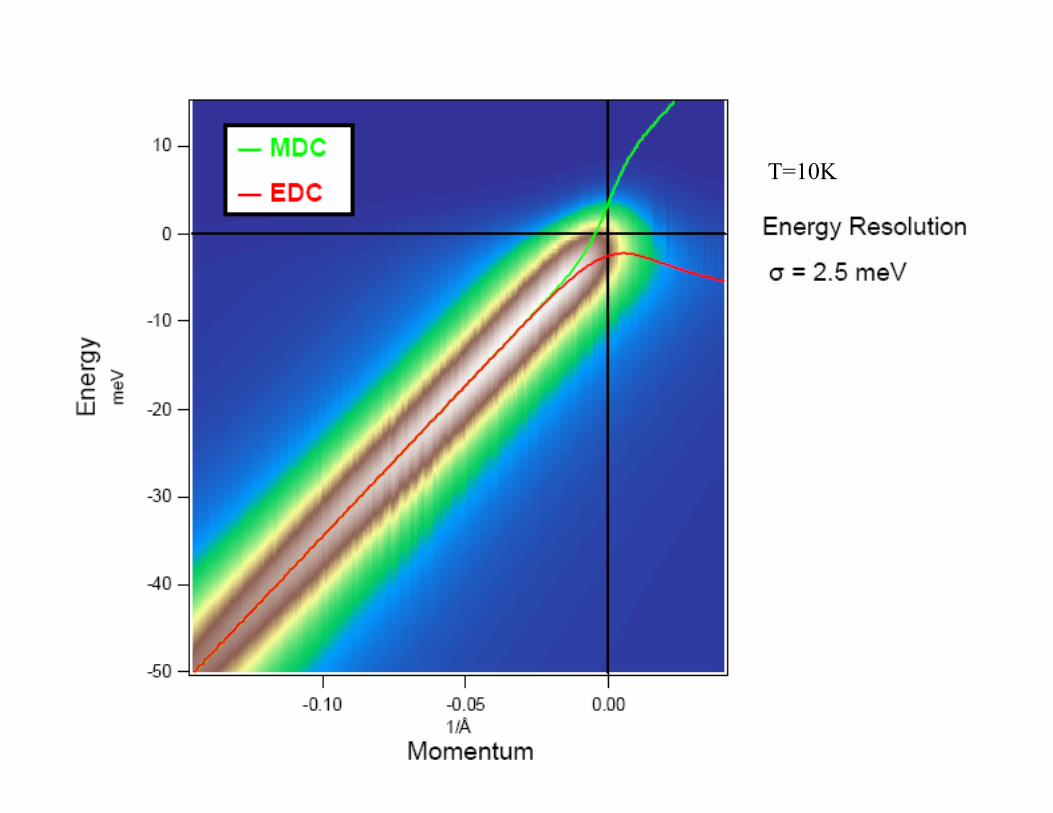
T=10K
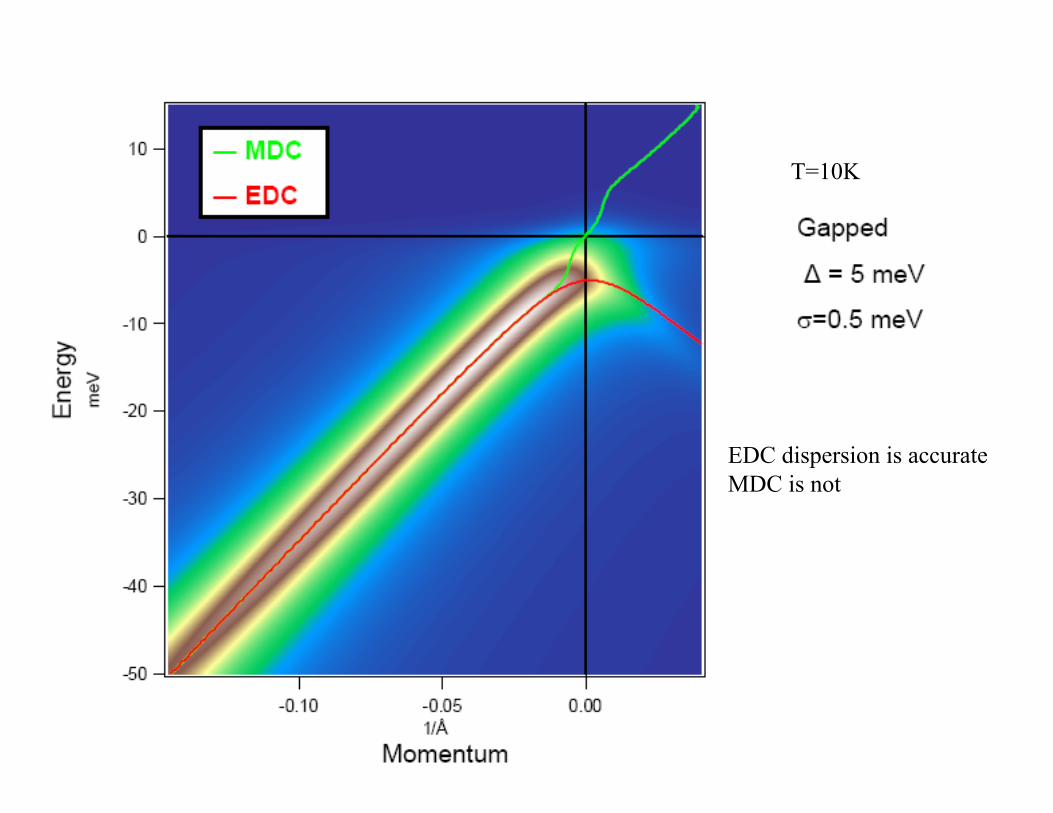
EDC dispersion is accurateMDC is not
T=10K
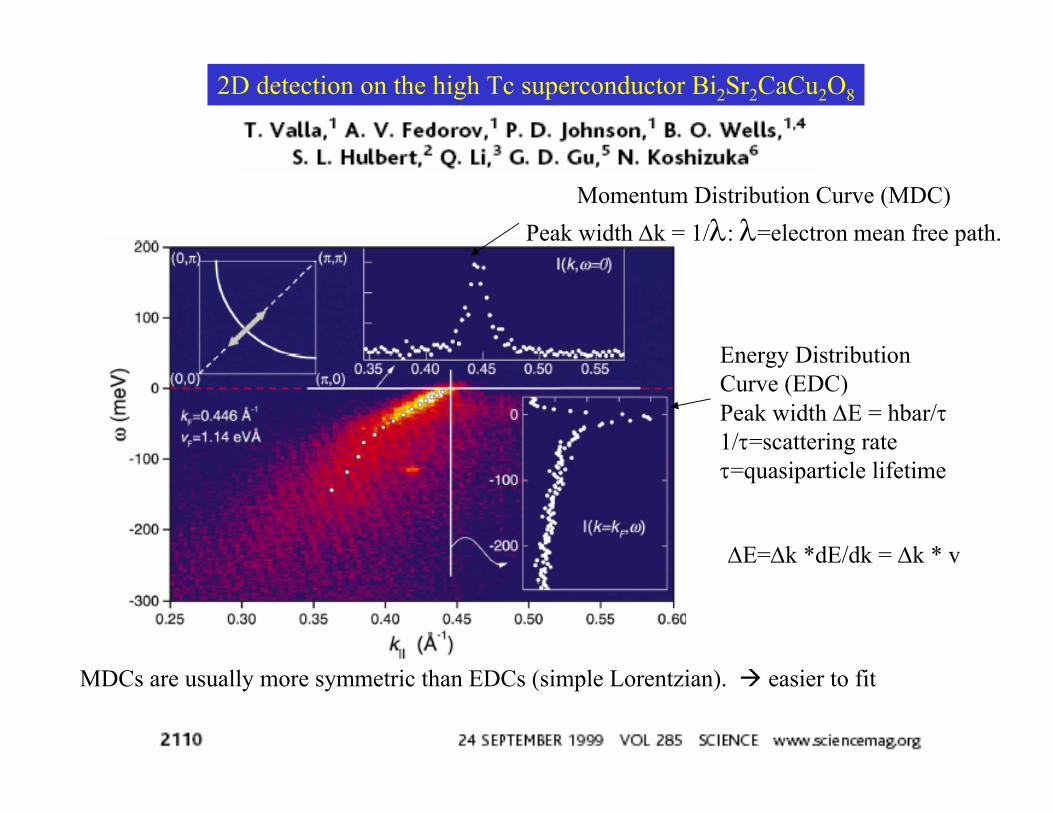
Momentum Distribution Curve (MDC)Peak width Δk = 1/λ: λ=electron mean free path.
Energy Distribution Curve (EDC)Peak width ΔE = hbar/τ1/τ=scattering rateτ=quasiparticle lifetime
2D detection on the high Tc superconductor Bi2Sr2CaCu2O8
ΔE=Δk *dE/dk = Δk * v
MDCs are usually more symmetric than EDCs (simple Lorentzian). easier to fit
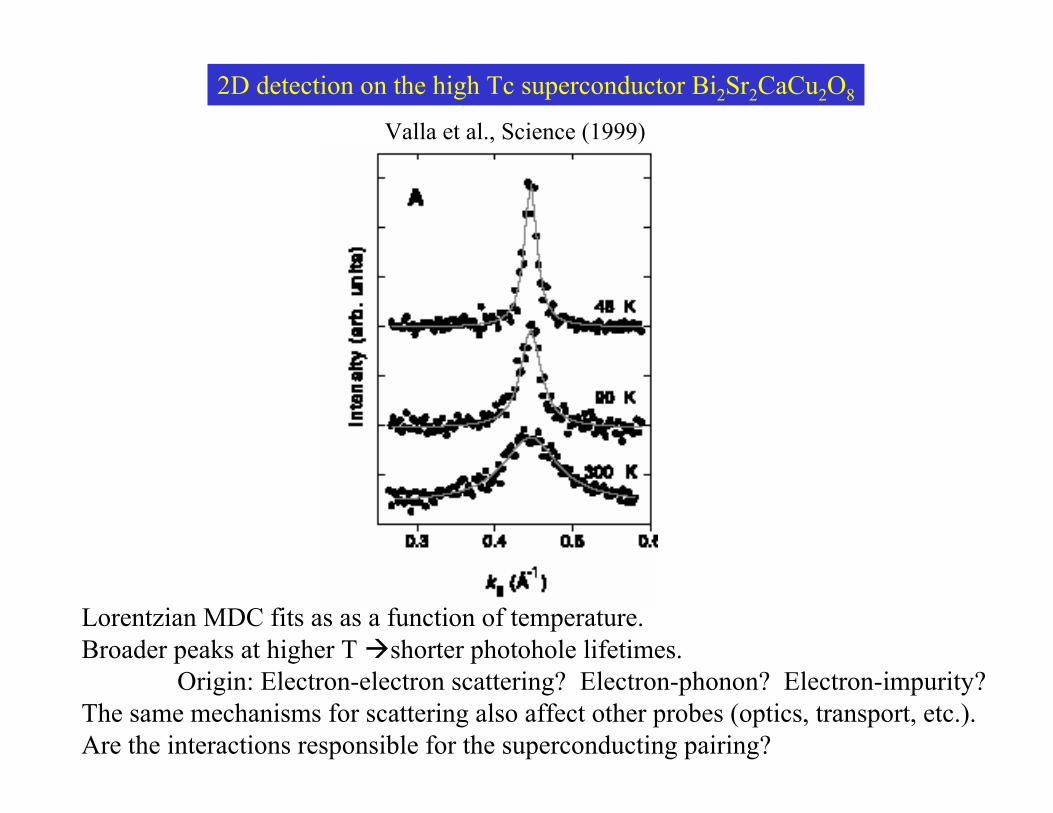
2D detection on the high Tc superconductor Bi2Sr2CaCu2O8
Lorentzian MDC fits as as a function of temperature. Broader peaks at higher T shorter photohole lifetimes.
Origin: Electron-electron scattering? Electron-phonon? Electron-impurity?The same mechanisms for scattering also affect other probes (optics, transport, etc.).Are the interactions responsible for the superconducting pairing?
Valla et al., Science (1999)

LorentzianLorentzian EDC fitting (nodal OP Bi2212)EDC fitting (nodal OP Bi2212)IARPES = [Lorentzian x Fermi] + Background
25K 100K 150K 200K
Color scale set by peak in 25K
data
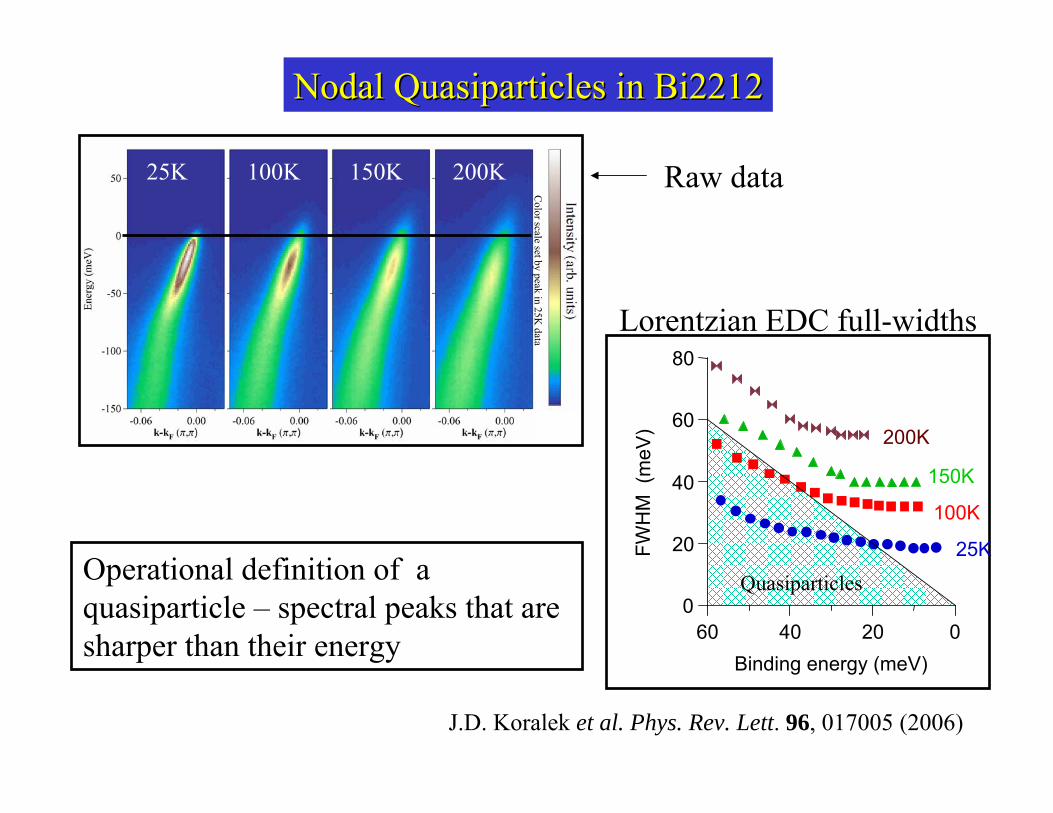
Nodal Quasiparticles in Bi2212Nodal Quasiparticles in Bi2212
Raw data
Operational definition of a quasiparticle – spectral peaks that are sharper than their energy
J.D. Koralek et al. Phys. Rev. Lett. 96, 017005 (2006)
Lorentzian EDC full-widths
Quasiparticles
80
60
40
20
0
FWH
M(m
eV)
60 40 20 0Binding energy (meV)
25K
100K
150K
200K
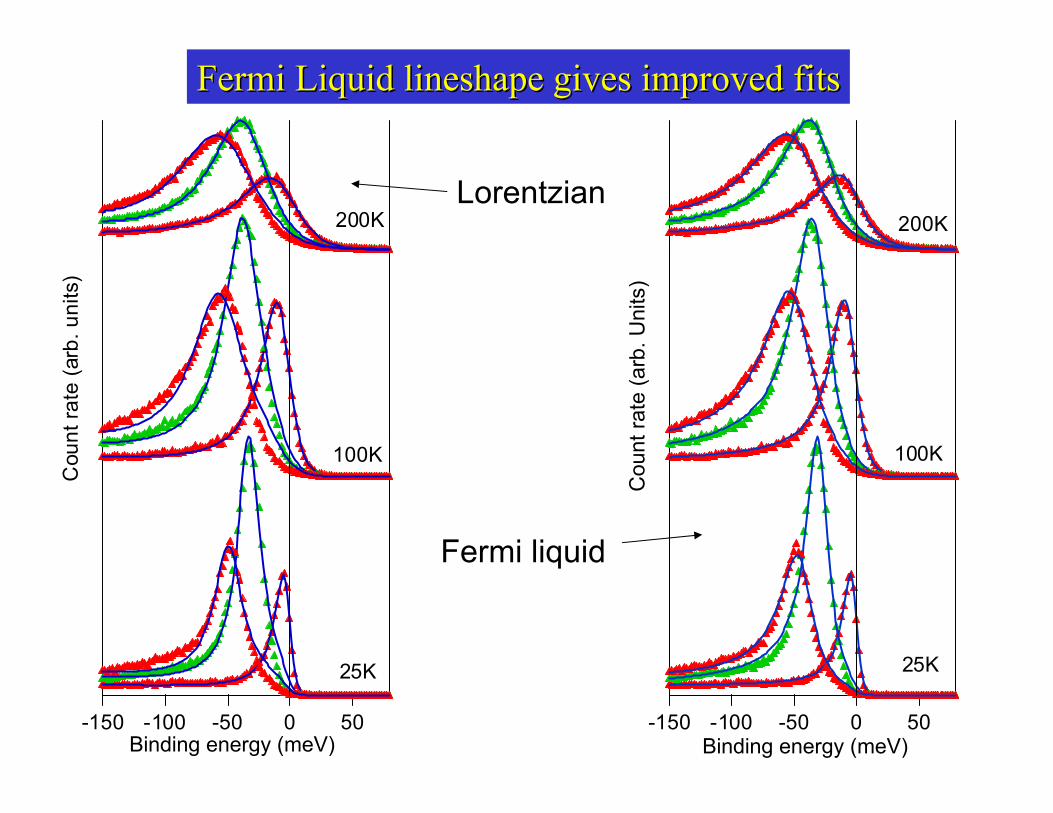
Fermi Liquid Fermi Liquid lineshapelineshape gives improved fitsgives improved fits
-150 -100 -50 0 50
100K
200K
25K
Binding energy (meV)
Cou
nt ra
te (a
rb. U
nits
)
Lorentzian
Fermi liquid
-150 -100 -50 0 50
Cou
nt ra
te (a
rb. u
nits
)
100K
200K
25K
Binding energy (meV)

p=.25(1-x)2 x is doping level
Anderson – effect of Gutzwiller projection on ARPES lineshapeRed – Lorentzian
Black – Gutzwiller projected
Main empirical difference to FL: reduced background
P.A. Casey, J.D. Koralek, N.C. Plumb, D.S. Dessau, P.W. Anderson, Nature Physics 4, 210 (2008)
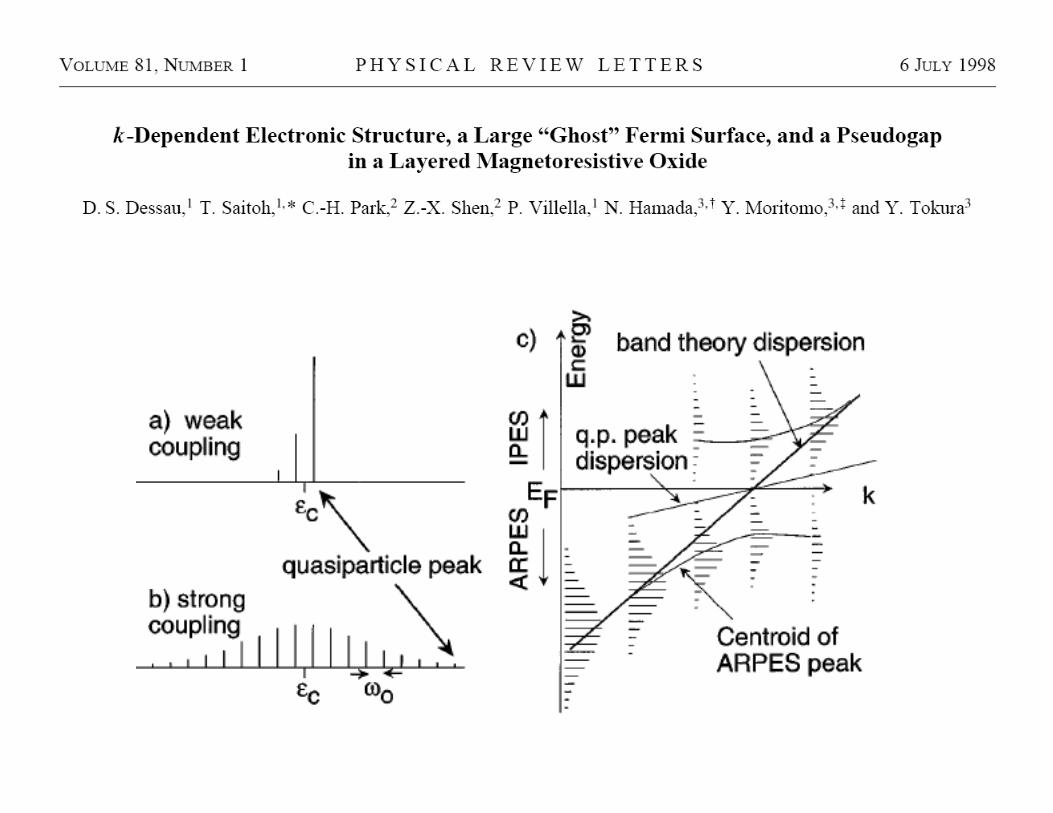
Coherent vs. Incoherent states
Different operational meanings for a coherent state.a) A true Landau quasiparticleb) A “sharp” spectral peak near EF.c) A dispersive spectral peak, even if it is broad.

Angle-integrated photoemission spectra of Ca1-xSrxVO3 (Inoue et al., 1995)
Photoemission and inverse-photoemission spectra of SrVO3 and CaVO3 in the V 3d band region compared with a LDA band-structure calculation of Takegahara (1994). FromMorikawa et al., 1995.
SrVO3
CaVO3
Bandwidth control d1 system – varying U/W ratio
d1 d0Lower Hubbard band or incoherent portion
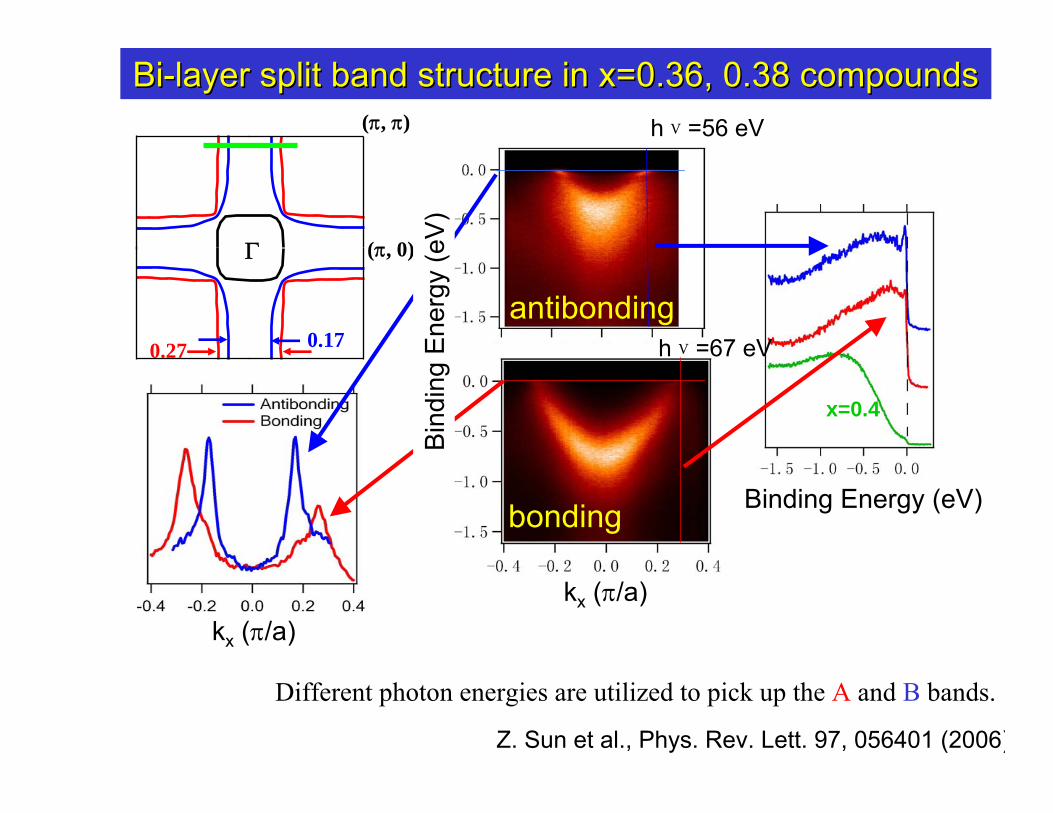
BiBi--layer split band structure in x=0.36, 0.38 compoundslayer split band structure in x=0.36, 0.38 compounds
(π, 0)
(π, π)
Γ
antibonding
bonding
0.27 0.17
x=0.4
kx (π/a)
hν=56 eV
hν=67 eV
kx (π/a)
Bin
ding
Ene
rgy
(eV
)
Binding Energy (eV)
Z. Sun et al., Phys. Rev. Lett. 97, 056401 (2006)
Different photon energies are utilized to pick up the A and B bands.
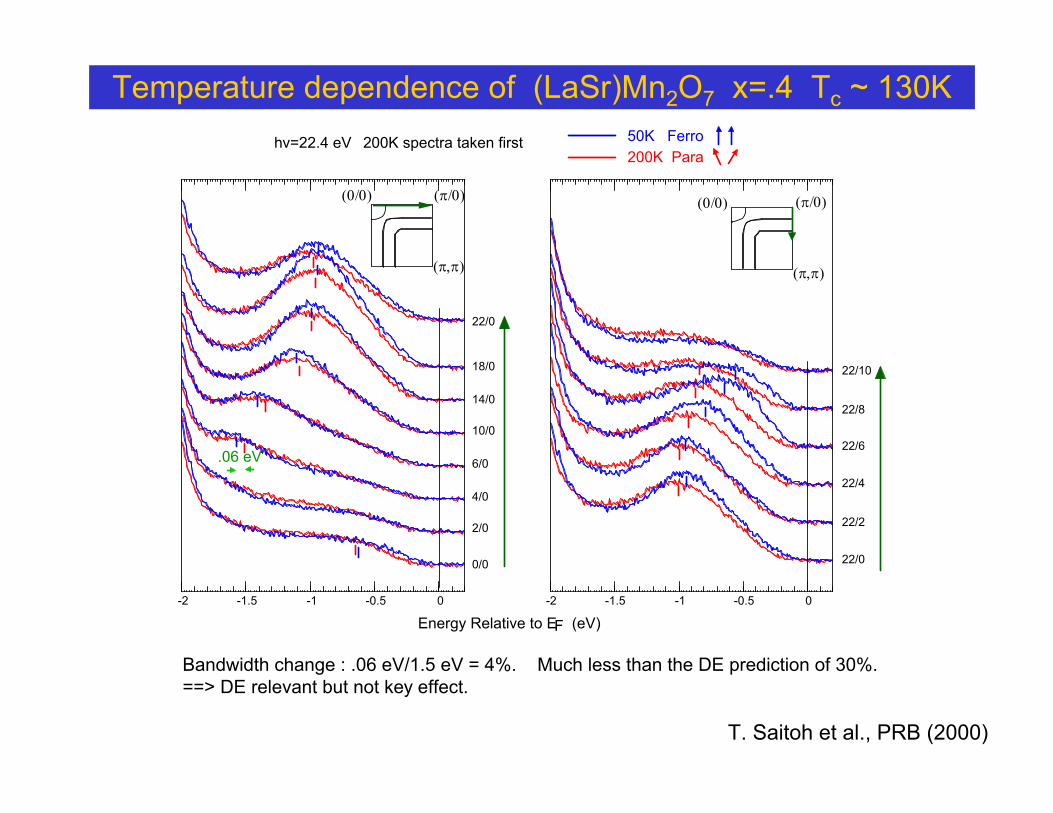
hv=22.4 eV 200K spectra taken first
-2 -1.5 -1 -0.5 0
0/0
2/0
4/0
6/0
10/0
14/0
18/0
22/0
(0/0) (π/0)
(π,π)
-2 -1.5 -1 -0.5 0
22/0
22/2
22/4
22/6
22/8
22/10
(0/0) (π/0)
(π,π)
50K Ferro 200K Para
Energy Relative to EF (eV)
.06 eV
Temperature dependence of (LaSr)Mn2O7 x=.4 Tc ~ 130K
Bandwidth change : .06 eV/1.5 eV = 4%. Much less than the DE prediction of 30%.==> DE relevant but not key effect.
T. Saitoh et al., PRB (2000)
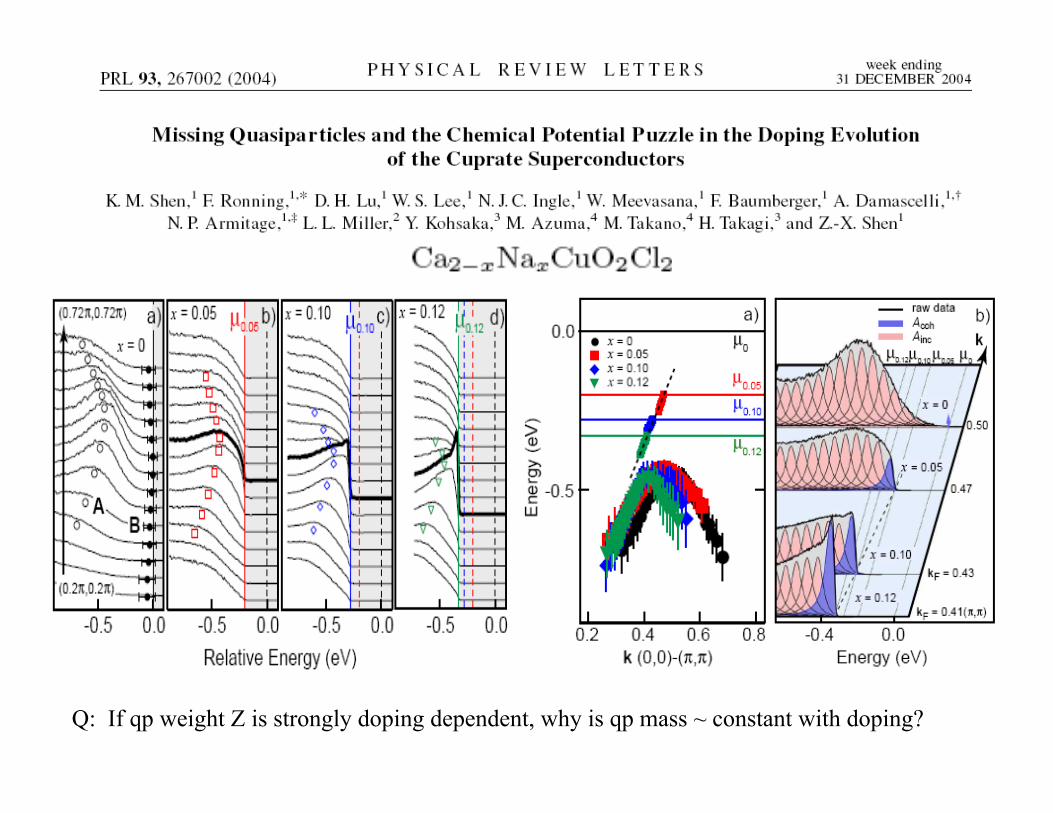
Q: If qp weight Z is strongly doping dependent, why is qp mass ~ constant with doping?
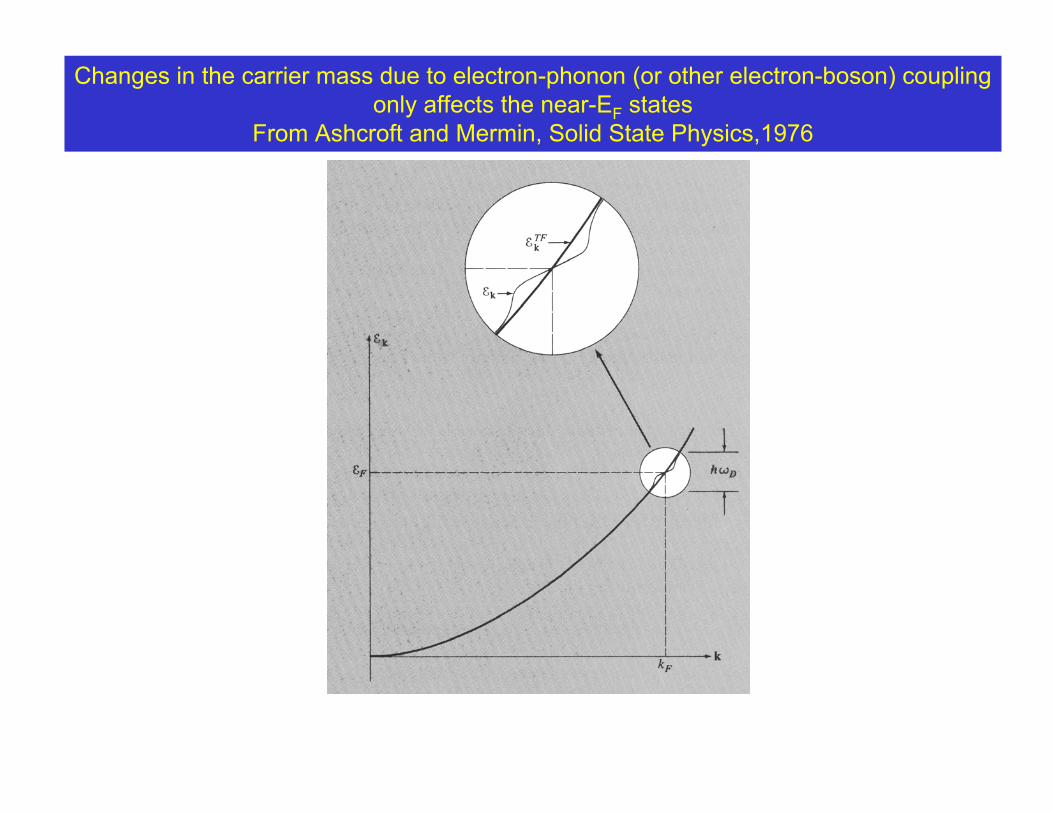
Changes in the carrier mass due to electron-phonon (or other electron-boson) couplingonly affects the near-EF states
From Ashcroft and Mermin, Solid State Physics,1976
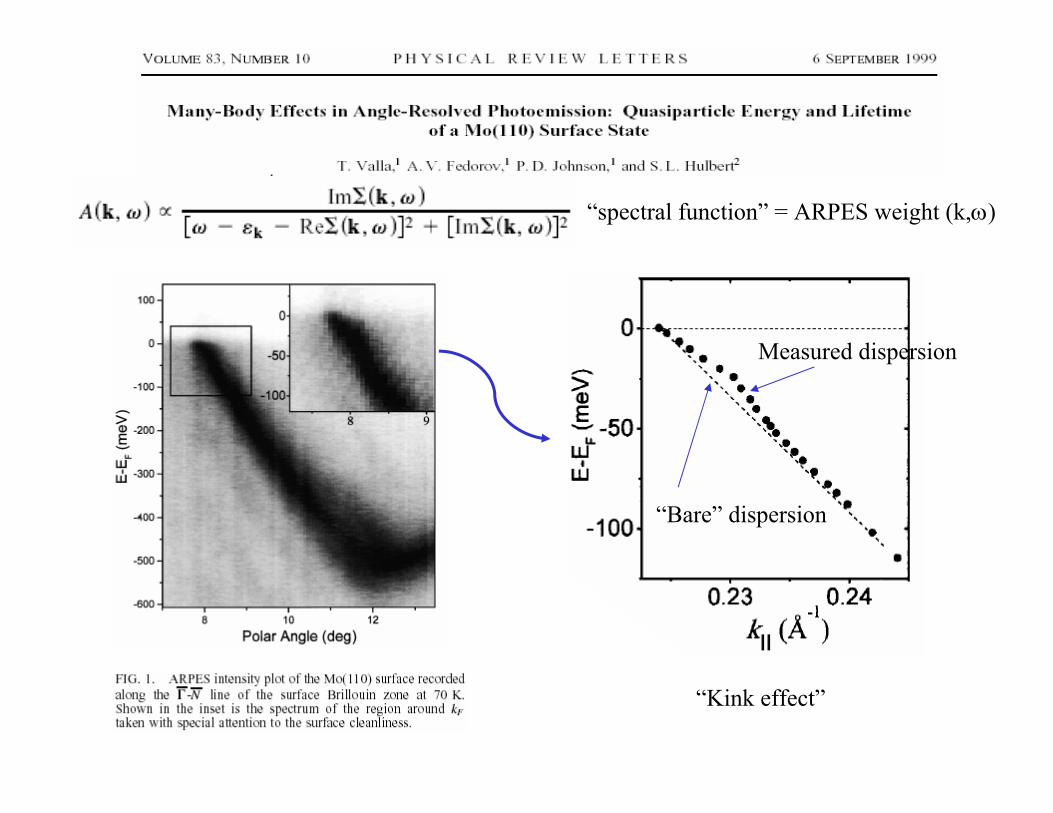
Measured dispersion
“Bare” dispersion
“spectral function” = ARPES weight (k,ω)
“Kink effect”
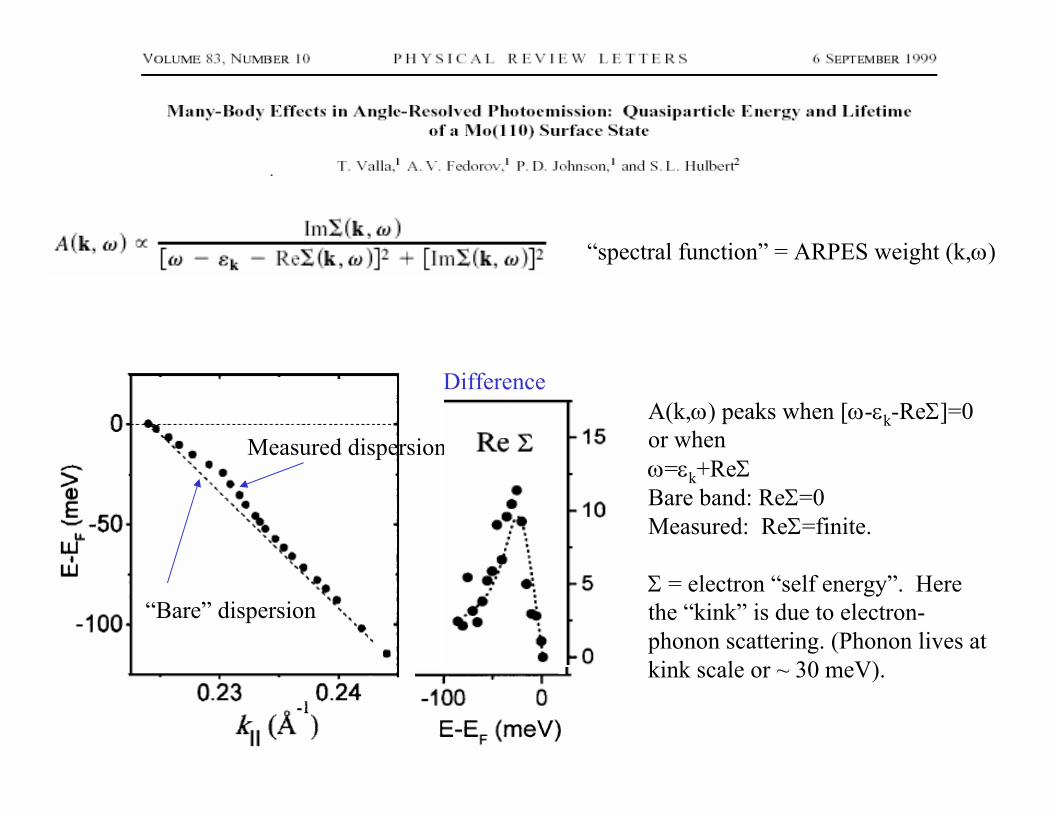
A(k,ω) peaks when [ω-εk-ReΣ]=0or whenω=εk+ReΣBare band: ReΣ=0Measured: ReΣ=finite.
Σ = electron “self energy”. Here the “kink” is due to electron-phonon scattering. (Phonon lives at kink scale or ~ 30 meV).
Measured dispersion
“Bare” dispersion
“spectral function” = ARPES weight (k,ω)
Difference
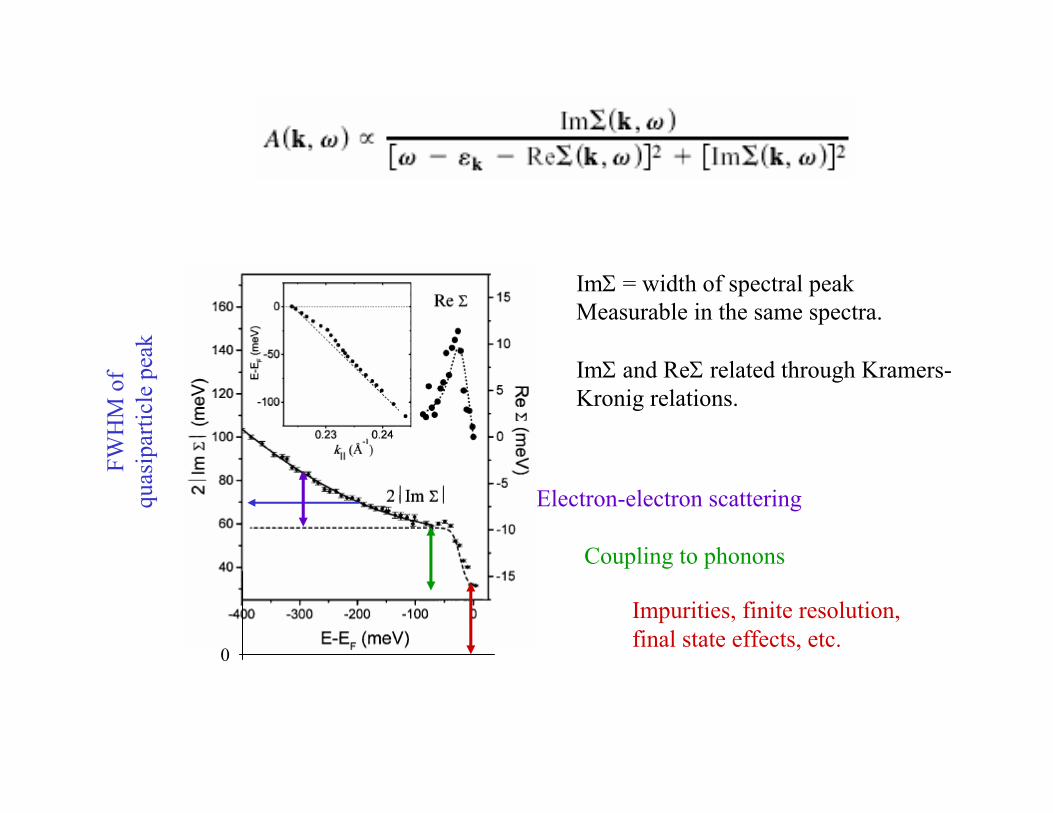
FWH
M o
f qu
asip
artic
lepe
ak
ImΣ = width of spectral peak Measurable in the same spectra.
ImΣ and ReΣ related through Kramers-Kronig relations.
Impurities, finite resolution, final state effects, etc.
Coupling to phonons
Electron-electron scattering
0
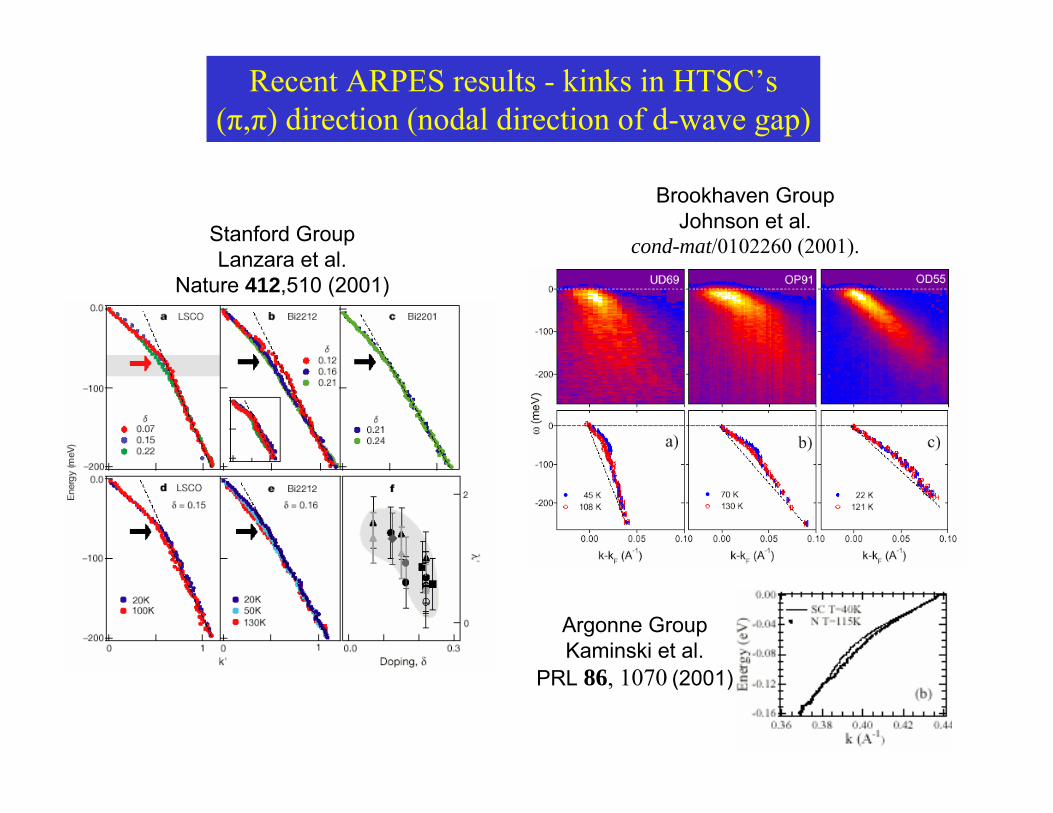
Recent ARPES results - kinks in HTSC’s(π,π) direction (nodal direction of d-wave gap)
Stanford GroupLanzara et al.
Nature 412,510 (2001)
Brookhaven GroupJohnson et al.
cond-mat/0102260 (2001).
Argonne GroupKaminski et al.
PRL 86, 1070 (2001)

16O18O
Throughout this presentation
Inte
nsity
(arb
. uni
ts)
0 200 600400 800Raman shift (cm-1)
40Energy (meV)
0 20 60 80
)3()( ×zxyz
zyyz )(
Inte
nsity
(arb
. uni
ts)
0 200 600400 800Raman shift (cm-1)
0 200 600400 800Raman shift (cm-1)
40Energy (meV)
0 20 60 8040Energy (meV)
0 20 60 80
)3()( ×zxyz
zyyz )(
Raman on our samples:- near full substitution of 18O for 16O- ~ 3 meV softening with substitution
-Same samples as used by J.Lee and J.C. Davis for isotope studies using STM
Isotope substitutions in Bi2212Way to fingerprint a mode coupling as phonon originated or not

Search for a low energy scale (few meV) shift of the nodal kink
16O18O
16O18O

Kink energy analysis method for ARPES widths (ImΣ)
a) Using ARPES widths (ImΣ), no assumed background is neededb) Take derivative to try to find a well-defined peak
Search for a low energy scale (few meV) shift of the kink, version 2
16O18O
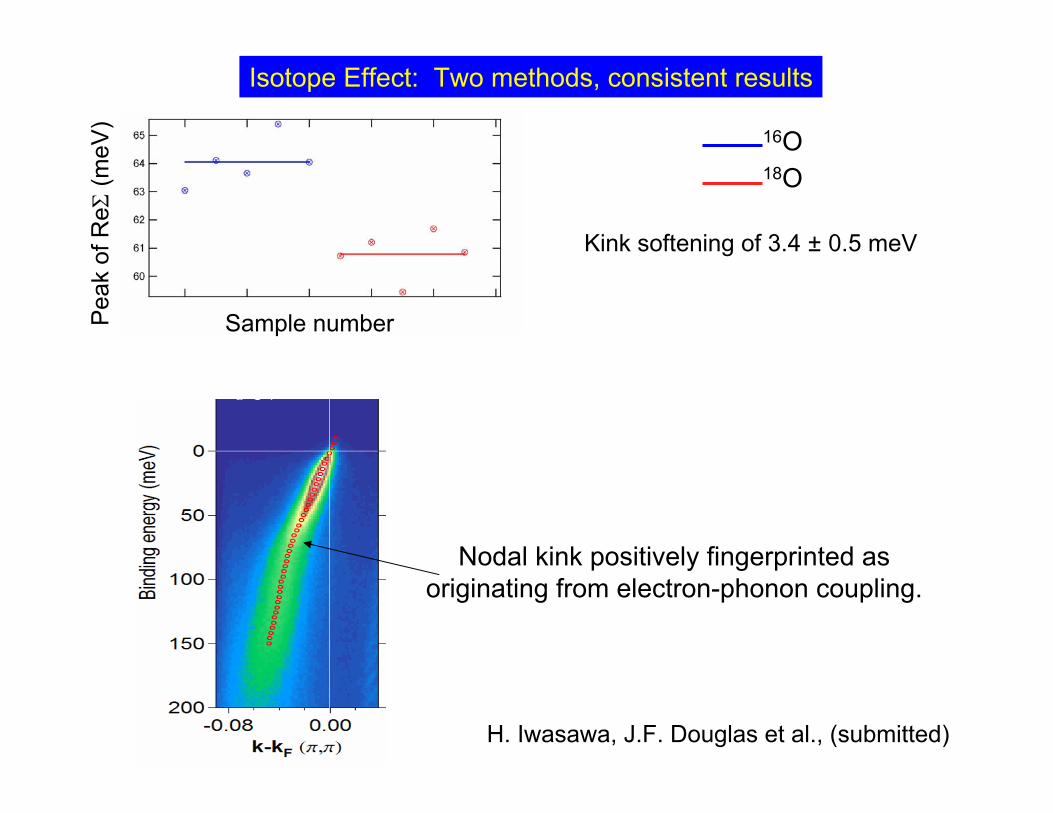
Isotope Effect: Two methods, consistent results
Kink softening of 3.4 ± 0.5 meV
Nodal kink positively fingerprinted as originating from electron-phonon coupling.
H. Iwasawa, J.F. Douglas et al., (submitted)
16O18O
Sample numberPea
k of
ReΣ
(meV
)
Y
X
(0,0) (π,0)
(π,π)
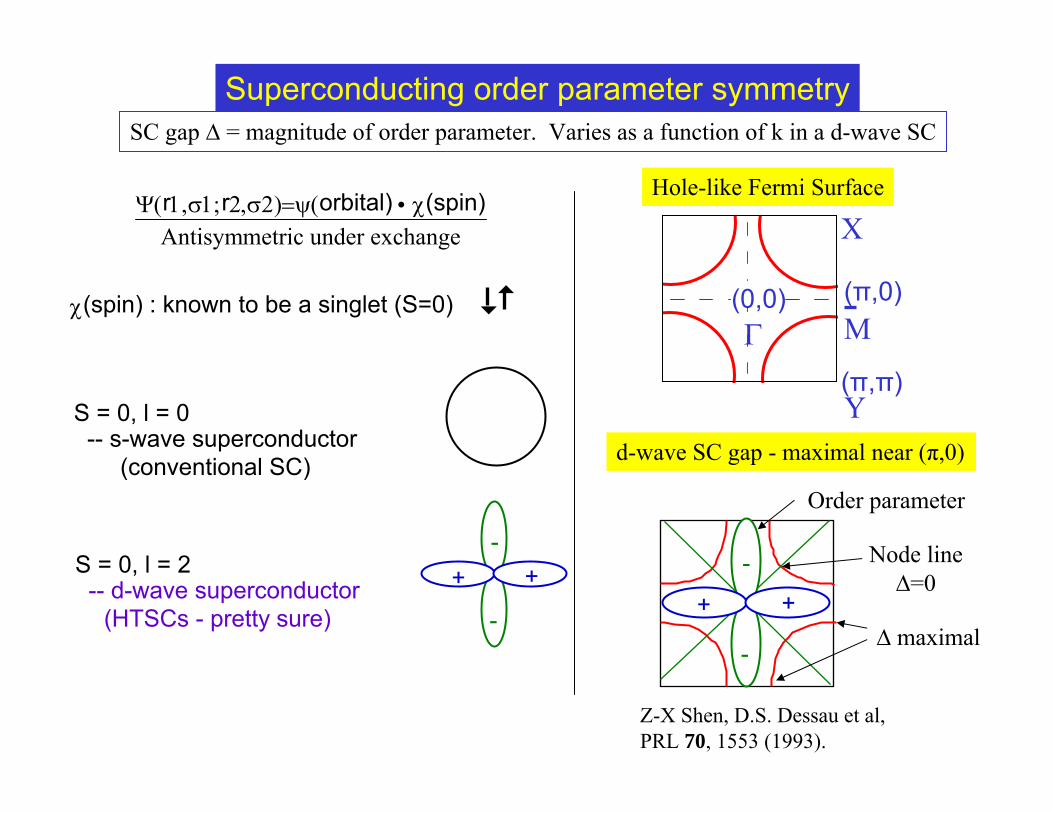
Γ Mχ(spin) : known to be a singlet (S=0)
S = 0, l = 0-- s-wave superconductor
(conventional SC)
++-
-
S = 0, l = 2-- d-wave superconductor
(HTSCs - pretty sure)
Hole-like Fermi Surface
d-wave SC gap - maximal near (π,0)
Z-X Shen, D.S. Dessau et al, PRL 70, 1553 (1993).
Order parameter
∆ maximal
Node line∆=0
++
-
-
Ψ(r1,σ1;r2,σ2)=ψ(orbital) χ(spin)•Antisymmetric under exchange
Superconducting order parameter symmetrySC gap ∆ = magnitude of order parameter. Varies as a function of k in a d-wave SC
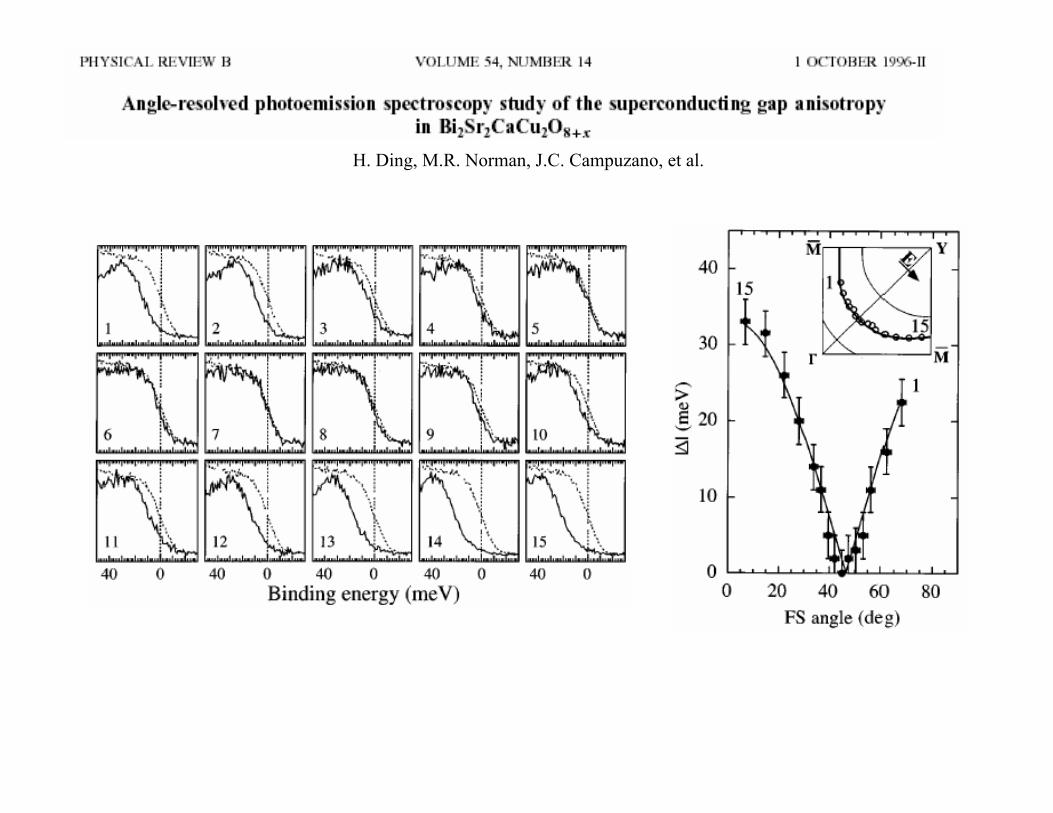
H. Ding, M.R. Norman, J.C. Campuzano, et al.
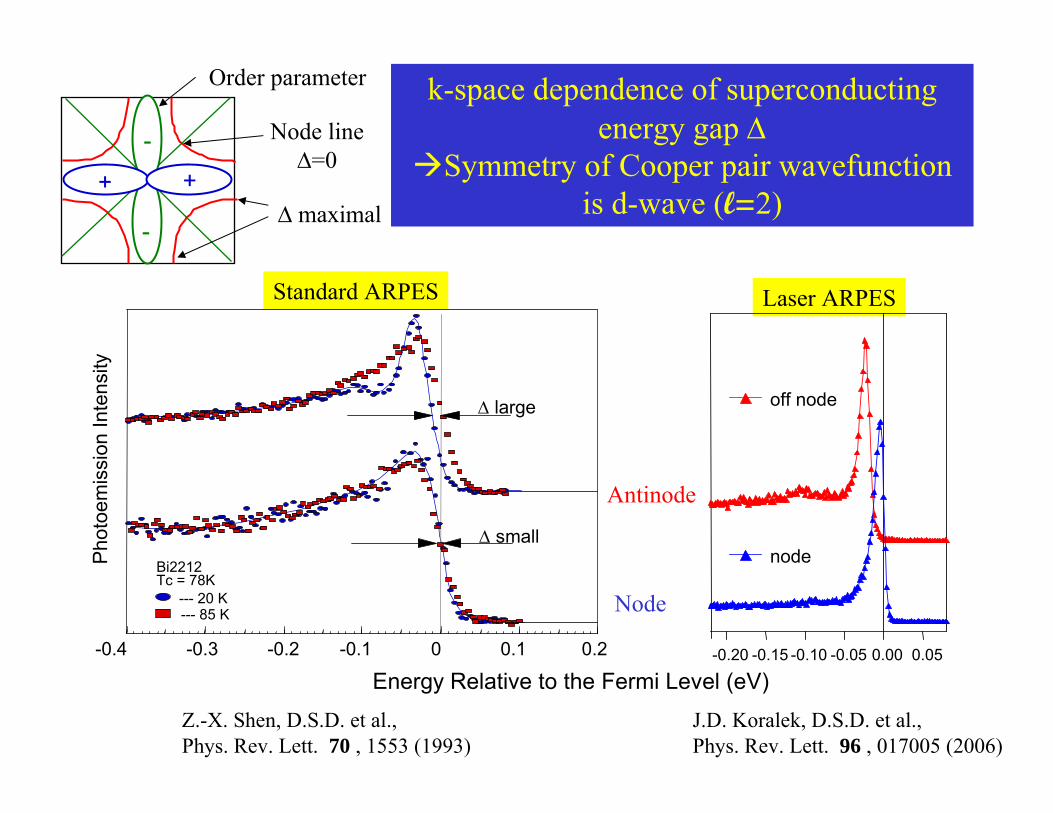
k-space dependence of superconducting energy gap Δ
Symmetry of Cooper pair wavefunctionis d-wave (l=2)
Standard ARPES Laser ARPES
Node
Antinode
Δ small
-0.4 -0.3 -0.2 -0.1 0 0.1 0.2
Energy Relative to the Fermi Level (eV)
Bi2212 Tc = 78K
--- 20 K--- 85 K
Pho
toem
issi
on In
tens
ity
Δ large
-0.20 -0.15 -0.10 -0.05 0.00 0.05
node
off node
Z.-X. Shen, D.S.D. et al., Phys. Rev. Lett. 70 , 1553 (1993)
J.D. Koralek, D.S.D. et al., Phys. Rev. Lett. 96 , 017005 (2006)
Order parameter
∆ maximal
Node line∆=0
++
-
-
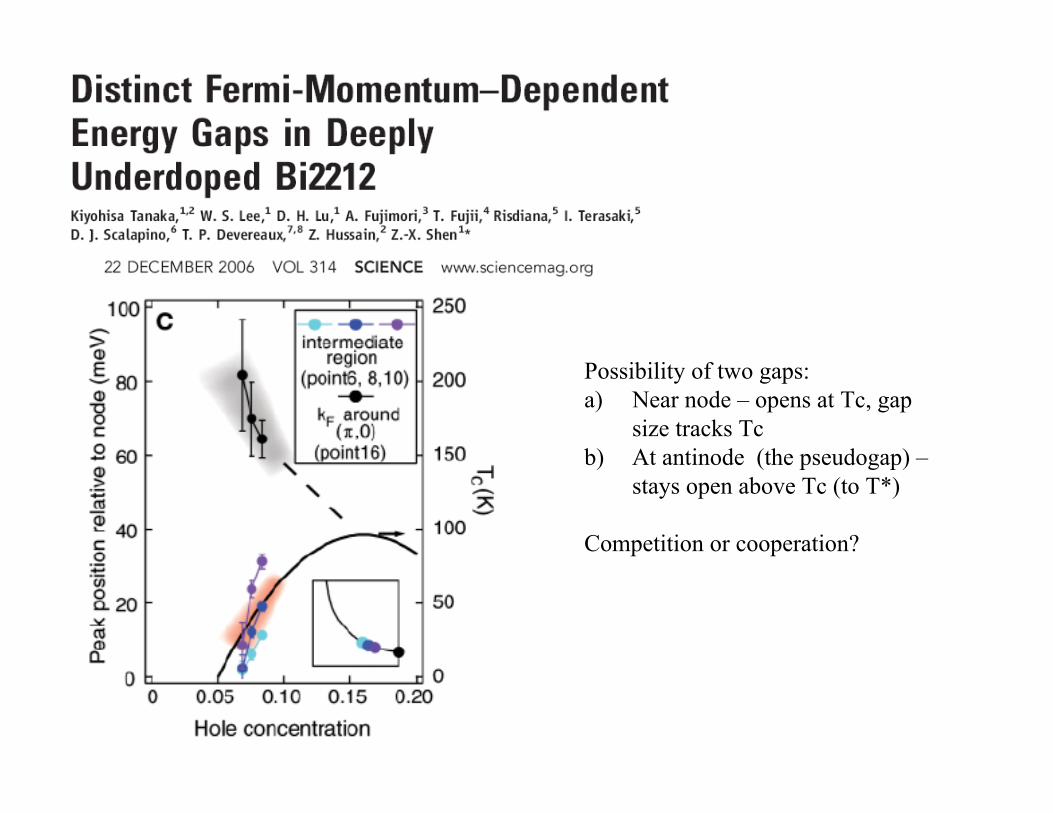
Possibility of two gaps:a) Near node – opens at Tc, gap
size tracks Tcb) At antinode (the pseudogap) –
stays open above Tc (to T*)
Competition or cooperation?