Embed Size (px)
Citation preview
Alcohol pricing and taxation policies
IFS Briefing Note BN124 Andrew Leicester
© Institute for Fiscal Studies, 2011
1
Alcohol pricing and taxation policies
Andrew Leicester†
Institute for Fiscal Studies
Executive Summary
Recently, a range of policies that would affect alcohol prices have been introduced or considered. Following an announcement in the March 2011 Budget, higher taxes on strong beers (above 7.5% alcohol by volume) and reduced taxes on low-strength beers (of 2.8% ABV or less) came into force in October 2011. A ban on ‘below-cost’ sales of alcohol (where ‘cost’ is defined as the total tax – duty and VAT – due on the product) is set to be introduced for England and Wales, though the timetable is not yet clear. And following their victory in the 2011 Scottish Parliamentary election, the SNP have committed to introduce a minimum price per unit of alcohol, following an unsuccessful attempt to do so in 2010. This Briefing Note uses detailed data recording off-licence alcohol purchases for a large sample of households to assess which types of alcohol products, retailers and consumers would be most affected by these different reforms.
The change to beer duty introduces a little more consistency into the way different types of alcohol are taxed. Strong beers are now taxed at 23.2p/unit, similar to the 25.5p rate at which spirits are taxed. As a whole, though, alcohol duties remain highly inconsistent across alcohol types and strengths. A strong cider at 7.5% ABV attracts a tax equivalent to just 4.8p/unit, little over half the rate of 9.3p/unit now due on low-strength beers. Given the failure to raise duty on strong cider (indeed, a 10% increase in cider duty introduced by Alistair Darling in 2010 was later reversed by George Osborne in his first Budget), it may be that those consuming strong beer will react to higher duty rates by consuming strong cider instead. Indeed, it is highly unlikely that the current system of alcohol taxes is optimal. In the absence of compelling evidence to the contrary (for example, on the social costs associated with different types of
† Address for correspondence: [email protected]. Funding from the ESRC Centre for the Microeconomic Analysis of Public Policy (RES-544-28-5001) is gratefully acknowledged. The author would like to thank Paul Johnson and Peter Levell for comments on earlier drafts, Jennifer Curran of Alcohol Focus Scotland and Andrew Misell of Alcohol Concern Wales for advice on policy in the devolved administrations, Andy Grayson at HMRC for advice on the taxation of cider, Nick Morgan at the Home Office for discussion on the ban on below-cost retail, and Kantar Worldpanel for the data on which much of the analysis is based. Data from the Living Costs and Food Survey are Crown Copyright and are used with the permission of the Controller of HMSO and the Queen’s Printer for Scotland. Any errors are the responsibility of the author. The views expressed reflect those of the author and not of the IFS.
© Institute for Fiscal Studies, 2011
2
alcohol), a sensible starting point would be to tax all alcohols at an equivalent rate per unit. Such a change would require policy action at the EU level which the Government should pursue.
High- and low-strength beers combined make up a small part of the overall off-licence alcohol market, respectively accounting for 0.8% and 0.2% of units purchased in 2010. Strong beers are particularly significant parts of alcohol sales for off-licences and corner stores, however. Currently, low-strength beers are largely made up of supermarket own brands, though one response to the change in beer duty in the long-term might be to encourage new low-strength branded products to the market. Poorer households buy a larger share of low-strength beers, but given the small market share the overall distributional effect of the change is very insignificant. Households who consume large amounts of alcohol are more likely to buy high-strength beer. Those consuming, on average, more than 35 units per adult per week account for about 23% of all off-licence alcohol units purchased, but 53% of high-strength beer units.
The ban on ‘below-cost’ sales is similarly a very small policy in terms of its likely overall impact. It introduces a de facto minimum price, which varies by alcohol type and strength. For example, a 500ml can of standard-strength lager would sell for no less than 51p and a bottle of 40% strength vodka for no less than £12.31. However, we estimate that it will affect only 1% of off-licence alcohol units, with virtually no impact on ciders (which have very low duty rates) or alcopops (which tend to be priced more highly per unit in any case). The stores most affected would be discount supermarkets and off-licences. There is some evidence that poorer households and those who consume the most alcohol are more likely to buy below-cost products, though the differences are not as pronounced as they were for high- and low-strength beers. Obviously, the ‘cost’ of supplying alcohol is not limited to duty and VAT alone. Estimating the true cost would be much more complex. It may be that a ‘cost-plus’ definition (i.e. duty and VAT plus some fixed proportion) could later be introduced.
A minimum price per unit of 45p, the level proposed in Scotland in 2010, would be a much more significant policy. 71% of all off-licence units retailed for less than this in 2010, including 87% of cider units and 81% of lager units. Less than 2% of alcopop units sold this cheaply. With no behavioural response from consumers and no wider price effects, the policy introduced across Britain could transfer £1.4 billion from alcohol consumers to producers and retailers. However, the behavioural responses – including those of producers as well as consumers – will be hugely important and should be included as part of any full economic analysis. For example, how would the price of alcohol currently selling above the minimum change? How would the price of non-alcohol products change? What would happen to the available set of products?
© Institute for Fiscal Studies, 2011
3
A minimum price would have a larger effect on low-income households. Poorer households are less likely to consume alcohol and pay lower prices when they do. Those with incomes below £10,000 paid 40p per off-licence alcohol unit on average in 2010 compared to 49p for those with incomes over £70,000 (though total consumption among those who drink was similar in both groups). Without behavioural changes, the cost to the poorest households of a 45p/unit minimum price would be 2.0% of their total food budget, compared to 1.3% for the richest. The impact would also be greatest for those who consume the most alcohol – those buying more than 35 units per adult per week would lose 13% of their food budget However, this is mostly because they buy more alcohol rather than because they buy substantially cheaper alcohol than moderate consumers. Households buying more than 25 units per adult per week pay just under 40p per unit on average. Those buying less than 10 units per week pay a little more, about 45p on average. In cash terms, assuming no behavioural changes, the policy would cost at least £1 per week on average for households drinking 7 or more off-licence units per adult per week.
Advocates of minimum pricing tend to argue that it would more precisely target problem drinkers and would have relatively little effect on moderate consumers. Our figures suggest that at 45p a minimum price would directly affect the vast majority of off-licence alcohol consumers. Another argument for minimum pricing, that higher taxes may not be passed through, is also unclear. On average, the evidence suggests that alcohol taxes are passed through more than one to one into final prices, but whether pass through differs for cheaper products is unclear both empirically and theoretically. More evidence would be useful. These findings, together with the transfers from consumers to industry that would result, lead us to prefer higher and restructured alcohol taxes as an alternative to minimum pricing. At least with taxation the revenues flow to the Government rather than to the industry. Taxes that were more closely focused on the alcohol content of different products could also allow something closer to a minimum price to be introduced through the tax system, perhaps in tandem with a ban on below-tax sales.
1. Introduction
The government’s coalition agreement contained two main pledges relating to alcohol pricing: first, to “ban the sale of alcohol below cost price” and second, to “review alcohol taxation and pricing to ensure it

© Institute for Fiscal Studies, 2011
4
tackles binge drinking without unfairly penalising responsible drinkers, pubs and important local industries.”1
Following a joint review between the Treasury and the Home Office, the government’s plans for alcohol taxation were announced in a briefing paper in November 2010 and more details were announced in the March 2011 Budget.2 The main changes to alcohol taxation were a 25% increase in the duty on beers with strengths that exceed 7.5% alcohol by volume (ABV), and a 50% reduction in the rate of duty on beers with an ABV of 2.8% or less, which came into operation on 1st October 2011. Plans inherited by the government to increase real alcohol duty by 2% each year to 2014-15 are set to continue.
In early 2011, the Home Office announced plans to ban the sale of alcohol at ‘below-cost’ prices, with ‘cost’ defined as the relevant rate of alcohol duty plus associated VAT of 20%.3 This policy would apply to England and Wales. A formal start date for the policy and precisely how it will be implemented have yet to be announced. The Home Office ‘Business Plan’ for 2011–15 suggests that legislation on alcohol pricing may be introduced in April 2012.4
In recent years, there has been a growing call for a minimum price per unit of alcohol (where a ‘unit’ is defined as 10ml of pure alcohol).5 Sir Liam Donaldson, former Chief Medical Officer of England, advocated a 50p/unit minimum price.6 The measure has received the support of a range of interest groups.7 The SNP administration in Scotland has introduced
1 See http://www.cabinetoffice.gov.uk/sites/default/files/resources/coalition_programme_for_government.pdf, page 13.
2 HM Treasury (2010), Review of Alcohol Taxation, http://www.hm-treasury.gov.uk/d/alcohol_tax_review301110.pdf; HM Treasury (2011), Budget 2011, http://cdn.hm-treasury.gov.uk/2011budget_complete.pdf.
3 See http://www.homeoffice.gov.uk/drugs/alcohol/alcohol-pricing/.
4 http://www.homeoffice.gov.uk/publications/about-us/corporate-publications/business-plan-2011-15/business-plan?view=Binary, p. 14
5 For previous IFS analysis of minimum pricing, see Griffith, R. and A. Leicester (2010), The Impact of Introducing a Minimum Price on Alcohol in Britain, IFS Briefing Note 109 (http://www.ifs.org.uk/bns/bn109.pdf).
6 Donaldson, L. (2009), Passive Drinking: The Collateral Damage from Alcohol (http://www.dh.gov.uk/prod_consum_dh/groups/dh_digitalassets/documents/digitalasset/dh_096229.pdf)
7 Amongst others, the House of Commons Health Select Committee (http://www.publications.parliament.uk/pa/cm200910/cmselect/cmhealth/151/151i.p
© Institute for Fiscal Studies, 2011
5
legislation to set a minimum price there – though has not yet decided the rate it intends to set – with the Bill expected to become law in 2012.8
In this Briefing Note, we discuss these various reforms to the taxation and pricing of alcohol. Using detailed household-level information about off-licence alcohol purchases in Britain (that is, alcohol purchased from supermarkets, off-licences, corner shops and so on), we explore the effect of each policy in terms of the types of products, retailers and consumers that might be most affected. We make no attempt to model any possible behavioural responses, though any full analysis of their economic and wider impacts would clearly need to take these responses into account and we examine the sorts of likely responses of interest in Section 2. Nor do we have data to estimate the possible impact for on-licence alcohol (purchased in pubs, bars, restaurants and so on). However, it is likely that minimum pricing or a below-cost sales ban would have relatively little direct impact on the on-trade where prices tend to be much higher (though they could clearly encourage consumers to switch their alcohol consumption from off- to on-licence). Of course, changes to the level or structure of alcohol taxes would obviously impact the on-trade as well.
The rest of the Note is organised as follows. Section 2 looks at some of the background to alcohol policy, including trends in alcohol prices and taxes over time, the current structure of alcohol taxes, the economics of alcohol taxation, and distributional aspects of alcohol taxes. Sections 3, 4 and 5 then look at each policy – reforms to beer taxes, a ban on below-cost sales, and a minimum price – in detail. In each case, we discuss the economic issues around the policy, and analyse the possible impact both on the off-licence sector and alcohol consumers. Section 6 concludes.
2. Background
2.1 Alcohol prices
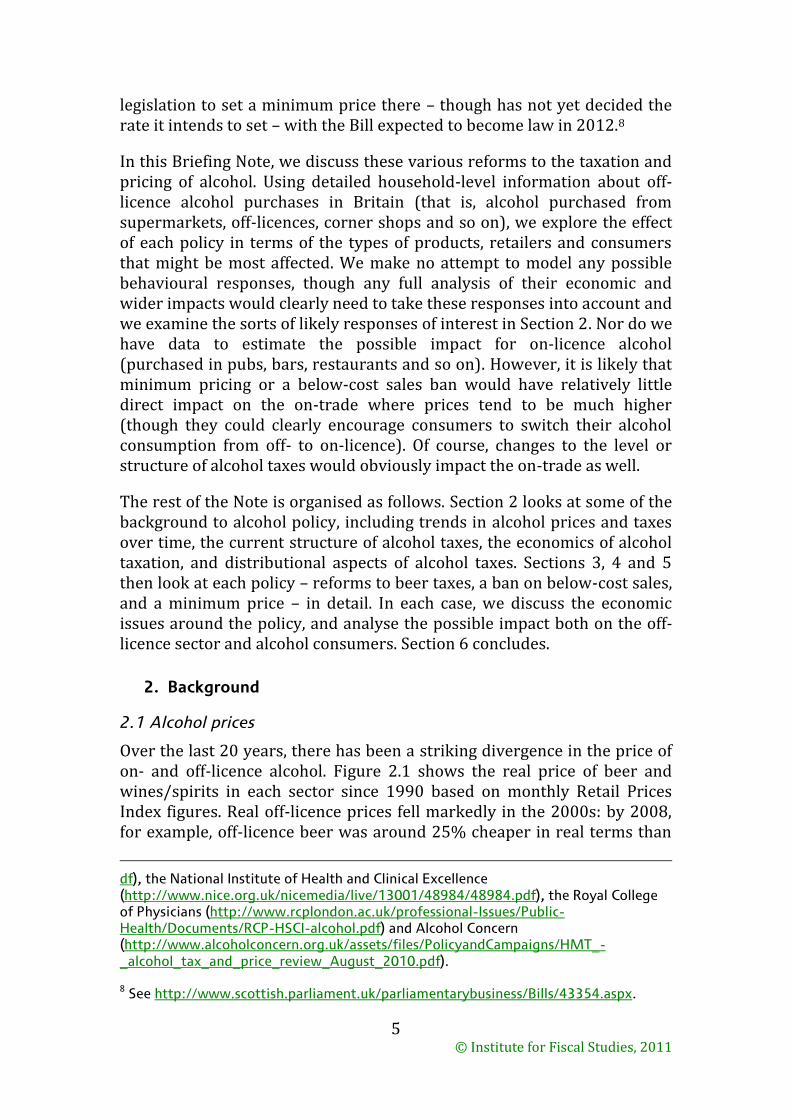
Over the last 20 years, there has been a striking divergence in the price of on- and off-licence alcohol. Figure 2.1 shows the real price of beer and wines/spirits in each sector since 1990 based on monthly Retail Prices Index figures. Real off-licence prices fell markedly in the 2000s: by 2008, for example, off-licence beer was around 25% cheaper in real terms than
df), the National Institute of Health and Clinical Excellence (http://www.nice.org.uk/nicemedia/live/13001/48984/48984.pdf), the Royal College of Physicians (http://www.rcplondon.ac.uk/professional-Issues/Public-Health/Documents/RCP-HSCI-alcohol.pdf) and Alcohol Concern (http://www.alcoholconcern.org.uk/assets/files/PolicyandCampaigns/HMT_-_alcohol_tax_and_price_review_August_2010.pdf).
8 See http://www.scottish.parliament.uk/parliamentarybusiness/Bills/43354.aspx.
© Institute for Fiscal Studies, 2011
6
in 2000 and off-licence wines and spirits were around 15% cheaper. Off-licence prices then stabilised and if anything rose slightly. In contrast, real on-licence prices rose over most of the period. By the end of 2010, on-licence beer was around 30% more expensive in real terms than in 1990 whilst on-licence wines and spirits were just over 25% more expensive.
Figure 2.1: RPI alcohol price indices relative to all-items index, Jan 1990-May 2011
Source: Calculated from ONS RPI inflation data (http://www.ons.gov.uk/ons/datasets-and-tables/data-selector.html?table-id=2.1&dataset=mm23).
Given these price trends, it is not at all surprising that overall alcohol consumption has shifted from the on-licence sector to the off-licence sector. In 2001/2, 50% of alcohol consumption in England was off-licence but by 2009 this had risen to 63%.9
These price figures are averages. Using detailed data on household’s grocery purchases we can look at the changing distribution of off-licence alcohol purchase prices over the last six years. Box 2.1 describes this data source, which also underlies the analysis in Section 3 to 5, in more detail.
Box 2.1: “Scanner” data on off-licence alcohol purchases
This Briefing Note uses “Worldpanel” data from the market research company Kantar.a The data record the grocery purchases of a large, representative sample of British households. Households are sent a barcode reader and are asked to scan all grocery items, including off-licence alcohol, brought into the home. No information on food consumed outside the home, including on-licence alcohol, is recorded. Detailed information is collected on the products purchased including quantity and price (and if any promotion was attached to the price), along with data on the store of purchase and household characteristics. The data record purchases of alcohol rather than consumption, though over a long period these should be similar. Data are collected at
9 Figures calculated from http://www.ic.nhs.uk/pubs/alcohol11, table 2.7.
60
70
80
90
100
110
120
130
140
Jan
19
90
Jan
19
91
Jan
19
92
Jan
19
93
Jan
19
94
Jan
19
95
Jan
19
96
Jan
19
97
Jan
19
98
Jan
19
99
Jan
20
00
Jan
20
01
Jan
20
02
Jan
20
03
Jan
20
04
Jan
20
05
Jan
20
06
Jan
20
07
Jan
20
08
Jan
20
09
Jan
20
10
Jan
20
11
Pri
ce in
dex
(re
lati
ve t
o a
ll-it
em R
PI)
Beer (on-licence) Wine&spirits (on-licence) Beer (off-licence) Wine&spirits (off-licence) Overall alcohol

© Institute for Fiscal Studies, 2011
7
the household level, so we cannot identify who in the household makes each purchase. We use data covering a 6-year period from November 2004 to October 2010. We break the data down into 6 single 52-week ‘years’ running roughly from November to October (for example, the data we label ‘2010’ covers 2nd November 2009 to 31st October 2010). Our analysis therefore covers periods labelled 2005 to 2010.
In common with much survey data relating to alcohol, alcohol spending appears to be relatively under-recorded in the Kantar Worldpanel. Applying weights supplied with the data, a total of 24.86 billion units of alcohol are recorded in 2010.b When looking at alcohol prices in this Section, and at the impact of different policies by alcohol type and retailer in Sections 3-5, we use the full, weighted sample of data. When looking at the impact by household type, we use the most recent data from 2010 and select a subset of households and a sub-period of their purchase records during which they appear to report relatively consistently.c Our final household sample size is 19,379 from a total of 26,681 who are ever observed in the 2010 data. In this sample, a (weighted) total of 17.93 billion alcohol units are recorded.
For some types of alcohol – namely beer, cider and ready-to-drinks (RTDs, or alcopops) – the precise strength (measured as % alcohol by volume, ABV) of each product is recorded directly in the data. For fortified wines, sparkling wines and spirits, we have obtained information on the ABV of different products from manufacturer and retailer websites where possible, and otherwise used assumed strengths as applied by the ONS when converting volumes to units of alcohol.d For table wines, the sheer number of different products in the data made it infeasible to look up individual strengths (which can also depend on the vintage of wine), and so we use the ONS assumption that table wines are all 12.5% ABV. Where strengths have been assumed, this could cause some error in measuring whether products are sold below cost or below 45p/unit.e
To determine whether products were sold below cost, we use data on historical rates of alcohol duty from HMRC and historical rates of VAT from IFS Fiscal Facts to calculate the tax liable.f We assume that all off-licence ciders face the ‘still’ duty rate; HMRC suggest the ‘sparkling’ cider market is very small and applicable only to ‘champagne substitute’ ciders or perries sold in pressurised bottles. We also cannot identify products in our data which would be liable to reduced-rates of duty for microbreweries, but again we expect this to be a very small proportion of the market. a For analysis of the quality of the data and a fuller description of the collection method, see
Leicester, A. and Z. Oldfield (2009), ‘Using scanner technology to collect expenditure data’, Fiscal Studies, 30 (3–4), 309–337 and Griffith, R. and M. O’Connell (2009), ‘The use of scanner data for research into nutrition’, Fiscal Studies, 30 (3–4), 339–365. b For comparison, around 31.91 billion off-licence units of alcohol are recorded in 2009 in data
collected for the Scottish Parliament on alcohol consumption in Britain. See http://www.healthscotland.com/documents/4558.aspx. c In particular, we select for each household the longest period of 12 weeks or more during
which no gap of more than 2 weeks in their reporting is observed. Households that do not have any such period of reporting are dropped from the sample. We also drop a small number of households with incomplete demographic records. d See Goddard, E. (2007), Estimating Alcohol Consumption from Survey Data: Updated
Method of Converting Volumes to Units, National Statistics Methodological Series 37
(http://www.ons.gov.uk/ons/guide-method/method-quality/specific/gss-methodology-series/gss-methodology-series--37--estimating-alcohol-consumption-from-survey-data--updated-method-of-converting-volumes-to-units.pdf) e See Griffith, R. and A. Leicester (2010), op. cit. for more on this. In particular, they show that
the assumed wine strength can have a significant effect on the proportion of wines sold below a minimum price threshold. f See https://www.uktradeinfo.com/index.cfm?task=bullAlcohol and http://www.ifs.org.uk/ff/vat.xls.
© Institute for Fiscal Studies, 2011
8
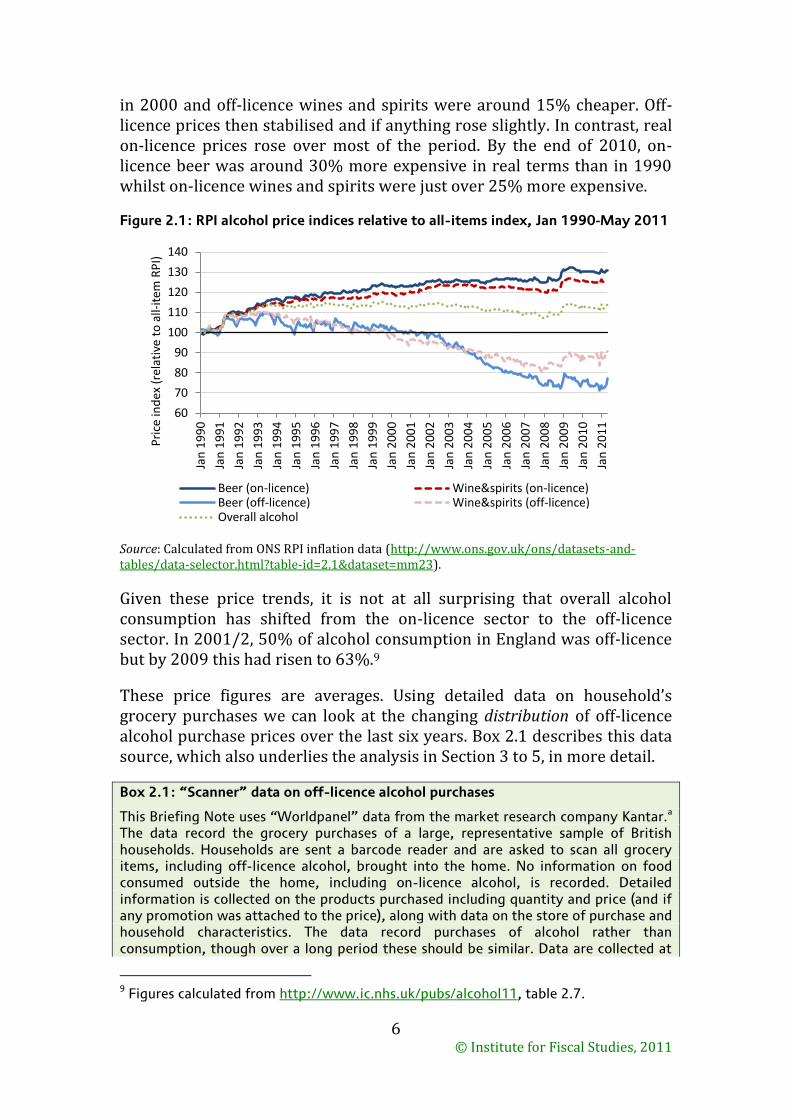
Figure 2.2 plots various percentiles of the real (December 2010 prices) off-licence alcohol price distribution, where purchase prices have been converted to a price per alcohol unit for comparability across products. The overall trends are comparable to the RPI data above: prices fall until around 2008 then begin to rise. The real mean per-unit price fell from 41.5p in 2005 to 39.8p in 2008, rising to 42.6p by 2010. Trends in the mean were also reflected at different points in the price distribution. There is substantial variation in the prices paid for alcohol: typically, around 10% or so of units are sold for less than 25p whilst around 10% or so are sold for more than 60p. The gap between the 75th percentile of unit prices and the 25th percentile is around 15p in all years.
Figure 2.2: Distribution of real off-licence per-alcohol unit prices, 2005 to 2010
Source: Calculated from Kantar Worldpanel data. Notes: Top whisker is the 90th percentile of the price distribution, top box is the upper quartile, middle line is the median, bottom box is the lower quartile and bottom whisker is the 10th percentile. Crosses represent mean prices. Each ‘year’ represents a 52-week period of data running approximately November-October (e.g. the 2010 data represents the period 2nd November 2009 to 31st October 2010). Prices are converted to December 2010 values using the all-items RPI. All table wines are assumed to be 12.5% ABV; the strength of spirits, fortified wines and sparkling wines are taken either from ONS assumptions or are looked up using retailer and manufacturer websites; for other alcohol products ABV is observed in the data.
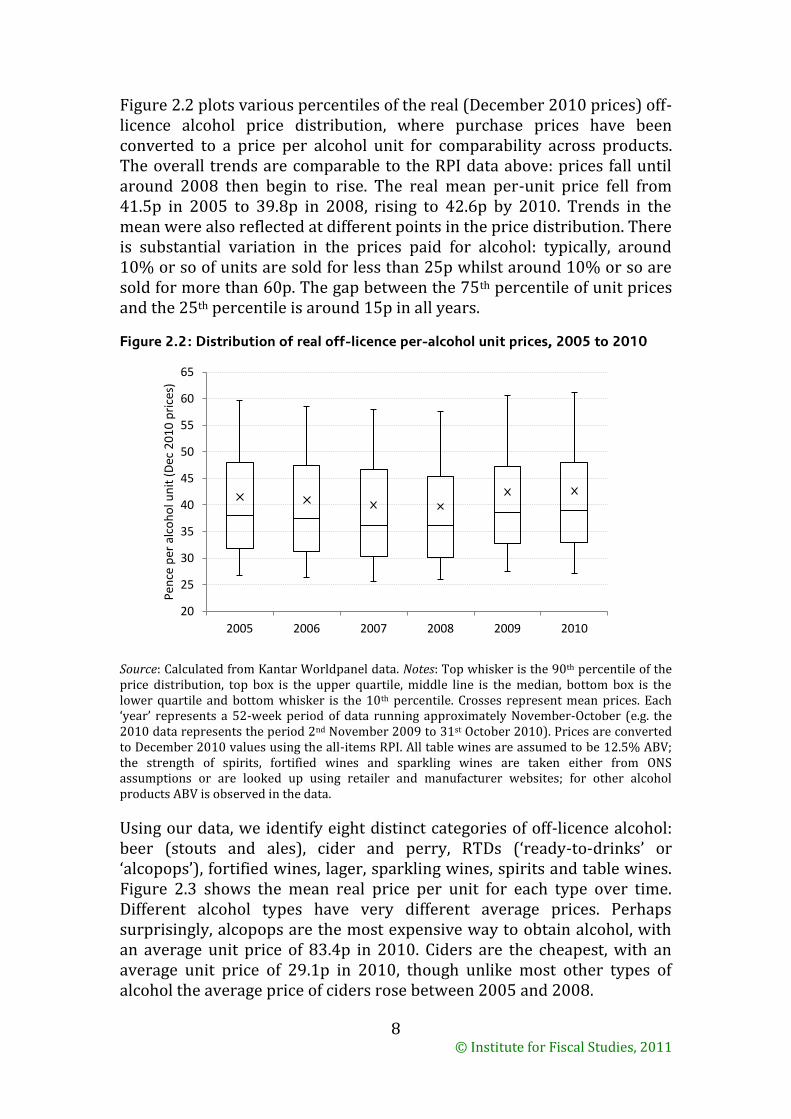
Using our data, we identify eight distinct categories of off-licence alcohol: beer (stouts and ales), cider and perry, RTDs (‘ready-to-drinks’ or ‘alcopops’), fortified wines, lager, sparkling wines, spirits and table wines. Figure 2.3 shows the mean real price per unit for each type over time. Different alcohol types have very different average prices. Perhaps surprisingly, alcopops are the most expensive way to obtain alcohol, with an average unit price of 83.4p in 2010. Ciders are the cheapest, with an average unit price of 29.1p in 2010, though unlike most other types of alcohol the average price of ciders rose between 2005 and 2008.
20
25
30
35
40
45
50
55
60
65
2005 2006 2007 2008 2009 2010
Pen
ce p
er a
lco
ho
l un
it (
Dec
20
10
pri
ces)
© Institute for Fiscal Studies, 2011
9
Figure 2.3: Real per-unit off-licence alcohol prices by alcohol type, 2005 – 2010
Source: Calculated from Kantar Worldpanel data. Notes: RTDs are ‘ready-to-drink’ alcopops. Each ‘year’ represents a 52-week period of data running approximately November. Prices are real December 2010 values. Assumptions on alcohol strength are detailed in the notes to Figure 2.2.
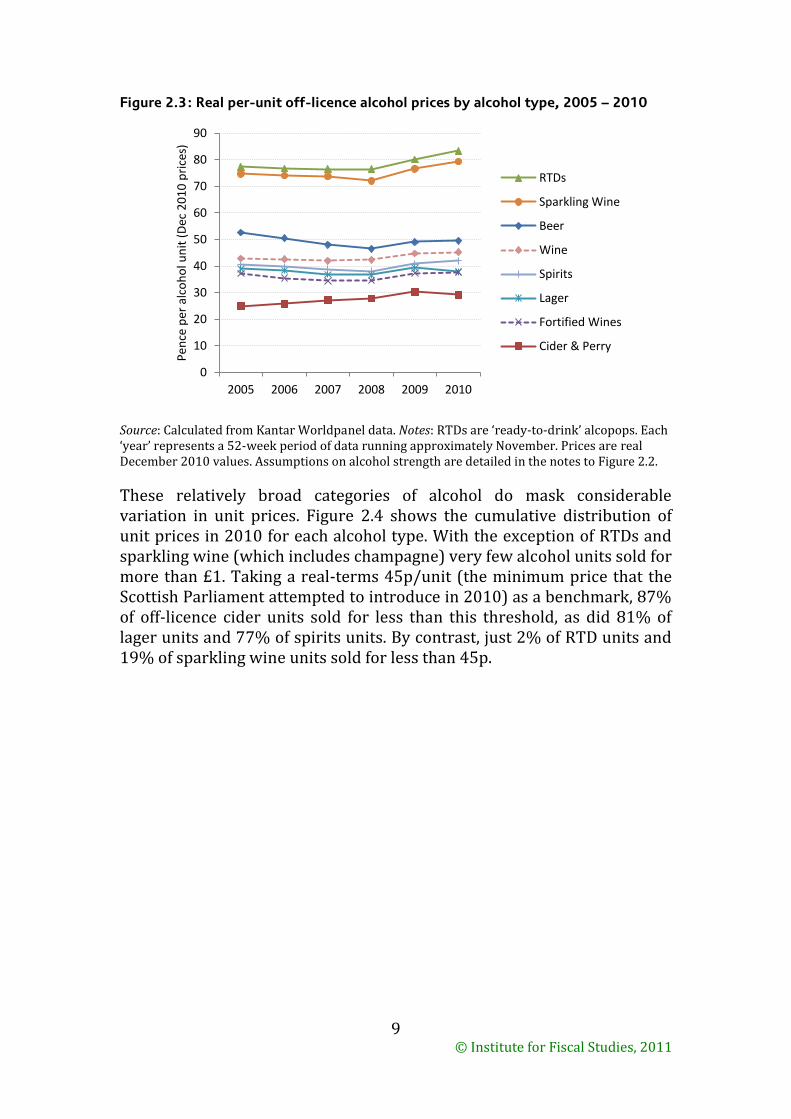
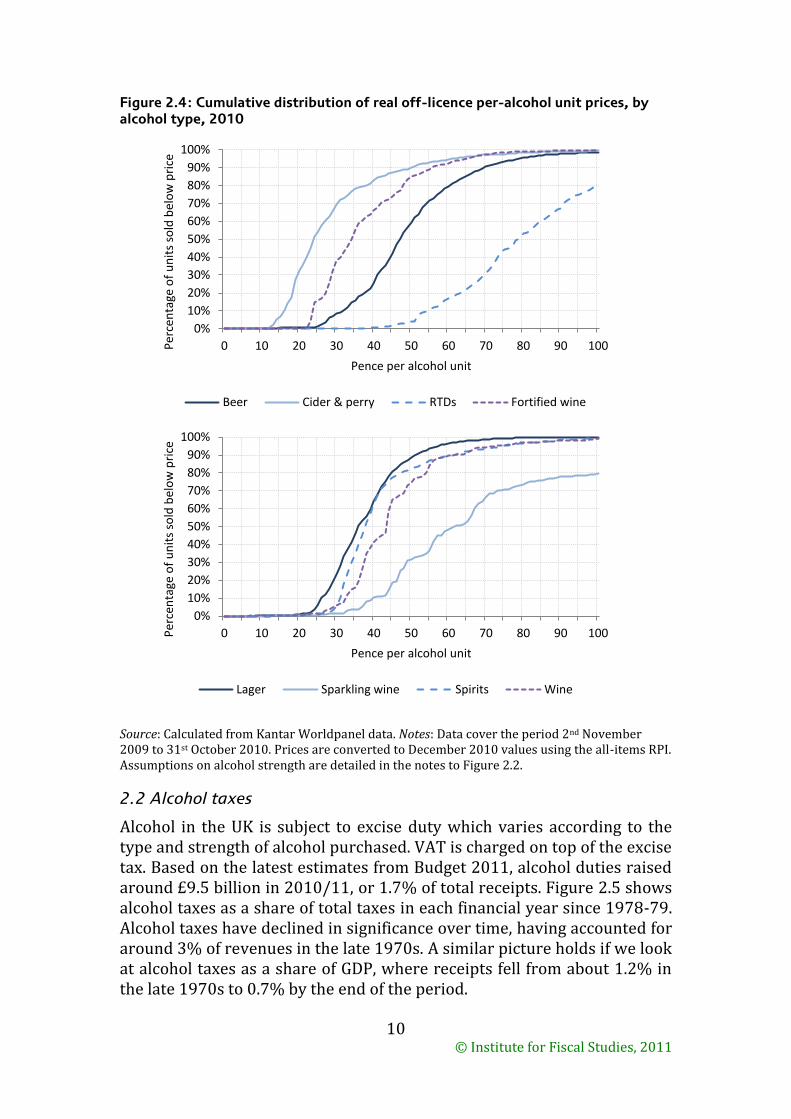
These relatively broad categories of alcohol do mask considerable variation in unit prices. Figure 2.4 shows the cumulative distribution of unit prices in 2010 for each alcohol type. With the exception of RTDs and sparkling wine (which includes champagne) very few alcohol units sold for more than £1. Taking a real-terms 45p/unit (the minimum price that the Scottish Parliament attempted to introduce in 2010) as a benchmark, 87% of off-licence cider units sold for less than this threshold, as did 81% of lager units and 77% of spirits units. By contrast, just 2% of RTD units and 19% of sparkling wine units sold for less than 45p.
0
10
20
30
40
50
60
70
80
90
2005 2006 2007 2008 2009 2010
Pen
ce p
er a
lco
ho
l un
it (
Dec
20
10
pri
ces)
RTDs
Sparkling Wine
Beer
Wine
Spirits
Lager
Fortified Wines
Cider & Perry
© Institute for Fiscal Studies, 2011
10
Figure 2.4: Cumulative distribution of real off-licence per-alcohol unit prices, by alcohol type, 2010
Source: Calculated from Kantar Worldpanel data. Notes: Data cover the period 2nd November 2009 to 31st October 2010. Prices are converted to December 2010 values using the all-items RPI. Assumptions on alcohol strength are detailed in the notes to Figure 2.2.
2.2 Alcohol taxes
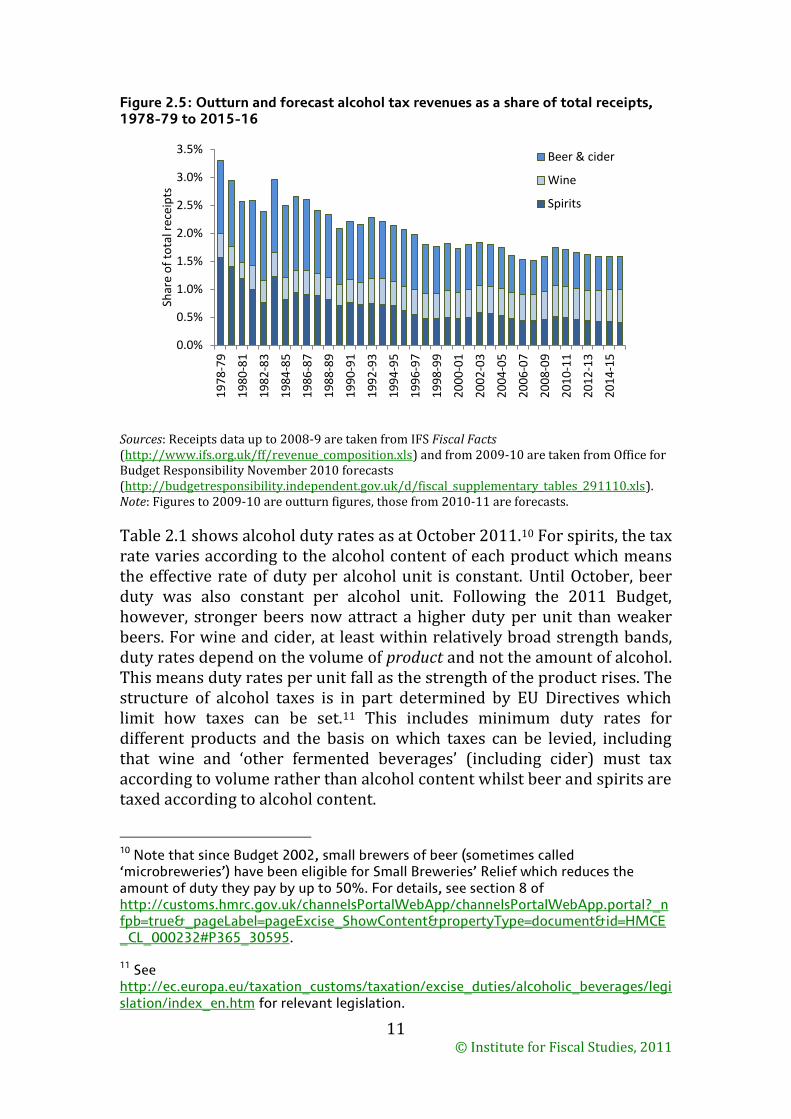
Alcohol in the UK is subject to excise duty which varies according to the type and strength of alcohol purchased. VAT is charged on top of the excise tax. Based on the latest estimates from Budget 2011, alcohol duties raised around £9.5 billion in 2010/11, or 1.7% of total receipts. Figure 2.5 shows alcohol taxes as a share of total taxes in each financial year since 1978-79. Alcohol taxes have declined in significance over time, having accounted for around 3% of revenues in the late 1970s. A similar picture holds if we look at alcohol taxes as a share of GDP, where receipts fell from about 1.2% in the late 1970s to 0.7% by the end of the period.
0%
10%
20%
30%
40%
50%
60%
70%
80%
90%
100%
0 10 20 30 40 50 60 70 80 90 100 Per
cen
tage
of
un
its
sold
bel
ow
pri
ce
Pence per alcohol unit
Beer Cider & perry RTDs Fortified wine
0%
10%
20%
30%
40%
50%
60%
70%
80%
90%
100%
0 10 20 30 40 50 60 70 80 90 100 Per
cen
tage
of
un
its
sold
bel
ow
pri
ce
Pence per alcohol unit
Lager Sparkling wine Spirits Wine
© Institute for Fiscal Studies, 2011
11
Figure 2.5: Outturn and forecast alcohol tax revenues as a share of total receipts, 1978-79 to 2015-16
Sources: Receipts data up to 2008-9 are taken from IFS Fiscal Facts (http://www.ifs.org.uk/ff/revenue_composition.xls) and from 2009-10 are taken from Office for Budget Responsibility November 2010 forecasts (http://budgetresponsibility.independent.gov.uk/d/fiscal_supplementary_tables_291110.xls). Note: Figures to 2009-10 are outturn figures, those from 2010-11 are forecasts.
Table 2.1 shows alcohol duty rates as at October 2011.10 For spirits, the tax rate varies according to the alcohol content of each product which means the effective rate of duty per alcohol unit is constant. Until October, beer duty was also constant per alcohol unit. Following the 2011 Budget, however, stronger beers now attract a higher duty per unit than weaker beers. For wine and cider, at least within relatively broad strength bands, duty rates depend on the volume of product and not the amount of alcohol. This means duty rates per unit fall as the strength of the product rises. The structure of alcohol taxes is in part determined by EU Directives which limit how taxes can be set.11 This includes minimum duty rates for different products and the basis on which taxes can be levied, including that wine and ‘other fermented beverages’ (including cider) must tax according to volume rather than alcohol content whilst beer and spirits are taxed according to alcohol content.
10 Note that since Budget 2002, small brewers of beer (sometimes called ‘microbreweries’) have been eligible for Small Breweries’ Relief which reduces the amount of duty they pay by up to 50%. For details, see section 8 of http://customs.hmrc.gov.uk/channelsPortalWebApp/channelsPortalWebApp.portal?_nfpb=true&_pageLabel=pageExcise_ShowContent&propertyType=document&id=HMCE_CL_000232#P365_30595.
11 See http://ec.europa.eu/taxation_customs/taxation/excise_duties/alcoholic_beverages/legislation/index_en.htm for relevant legislation.
0.0%
0.5%
1.0%
1.5%
2.0%
2.5%
3.0%
3.5%
19
78
-79
19
80
-81
19
82
-83
19
84
-85
19
86
-87
19
88
-89
19
90
-91
19
92
-93
19
94
-95
19
96
-97
19
98
-99
20
00
-01
20
02
-03
20
04
-05
20
06
-07
20
08
-09
20
10
-11
20
12
-13
20
14
-15
Shar
e o
f to
tal r
ecei
pts
Beer & cider
Wine
Spirits
© Institute for Fiscal Studies, 2011
12
Table 2.1: Alcohol excise duty rates, by alcohol type and strength, October 2011
Strength (ABV) Rate Example
Beer >1.2%-2.8% £9.29 / hectolitre % ABV 500ml can (2.6% ABV) = 12.1p >2.8%-7.5% £18.57 / hectolitre % ABV 500ml can (5.2% ABV) = 48.3p >7.5% £23.21 / hectolitre % ABV 500ml can (7.8% ABV) = 90.5p
Cider & perrya
>1.2%-7.5% £35.87 / hectolitre 500ml can (3.5% ABV) = 17.9p >7.5%-8.5% £53.84 / hectolitre 500ml can (7.0% ABV) = 26.9p
Wine >1.2%-4.0%
b £74.32 / hectolitre 250ml bottle (2.5% ABV) = 18.6p
>4.0%-5.5%b £102.21 / hectolitre 250ml bottle (5.0% ABV) = 25.6p
>5.5%-15.0% £241.23 / hectolitre 750ml bottle (12.5% ABV) = £1.81 >15.0%-22.0%
c £321.61 / hectolitre 750ml bottle (16.0% ABV) = £2.41
Sparkling wined
>5.5%-8.5% £233.55 / hectolitre 750ml bottle (6.5% ABV) = £1.75 >8.5%-15.0% £308.99 / hectolitre 750ml bottle (12.5% ABV) = £2.32
Spiritse
All £25.52 / litre of pure alcohol 1 litre bottle (40% ABV) = £10.21
Source: HMRC. Notes: aRates for ‘still’ cider which accounts for the vast majority of cider sales. Different rates apply for ‘sparkling’ ciders. bRates for low-strength wine products mostly apply to wine ‘coolers’ which are pre-mixed drinks containing wine and juices. cWines exceeding 22% ABV are taxed as spirits. dSparkling wine rates match those for table wine outside the rates shown. eSpirits includes spirits-based RTDs.
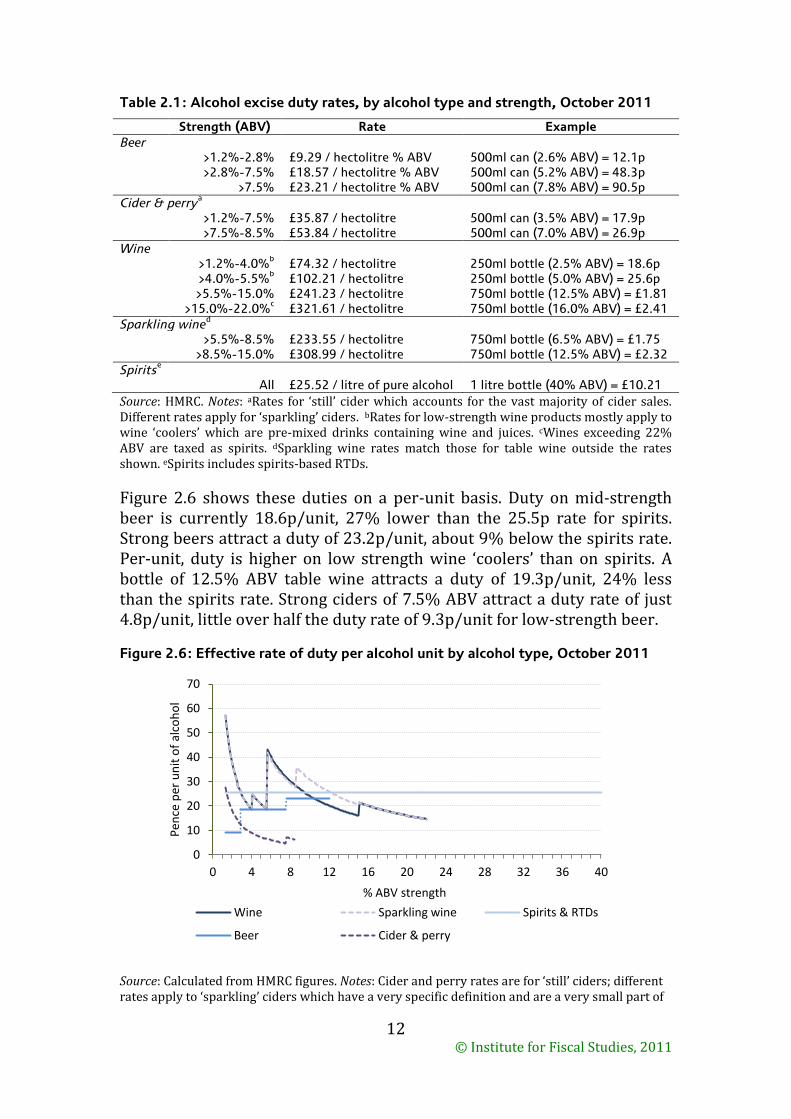
Figure 2.6 shows these duties on a per-unit basis. Duty on mid-strength beer is currently 18.6p/unit, 27% lower than the 25.5p rate for spirits. Strong beers attract a duty of 23.2p/unit, about 9% below the spirits rate. Per-unit, duty is higher on low strength wine ‘coolers’ than on spirits. A bottle of 12.5% ABV table wine attracts a duty of 19.3p/unit, 24% less than the spirits rate. Strong ciders of 7.5% ABV attract a duty rate of just 4.8p/unit, little over half the duty rate of 9.3p/unit for low-strength beer.
Figure 2.6: Effective rate of duty per alcohol unit by alcohol type, October 2011
Source: Calculated from HMRC figures. Notes: Cider and perry rates are for ‘still’ ciders; different rates apply to ‘sparkling’ ciders which have a very specific definition and are a very small part of
0
10
20
30
40
50
60
70
0 4 8 12 16 20 24 28 32 36 40
Pen
ce p
er u
nit
of
alco
ho
l
% ABV strength
Wine Sparkling wine Spirits & RTDs
Beer Cider & perry
© Institute for Fiscal Studies, 2011
13
the cider market. Ciders above 8.5% ABV are treated as wine or spirits. Wine above 22% treated as spirits. Spirits duty rates apply to all spirits-based ready-to-drinks (RTDs).
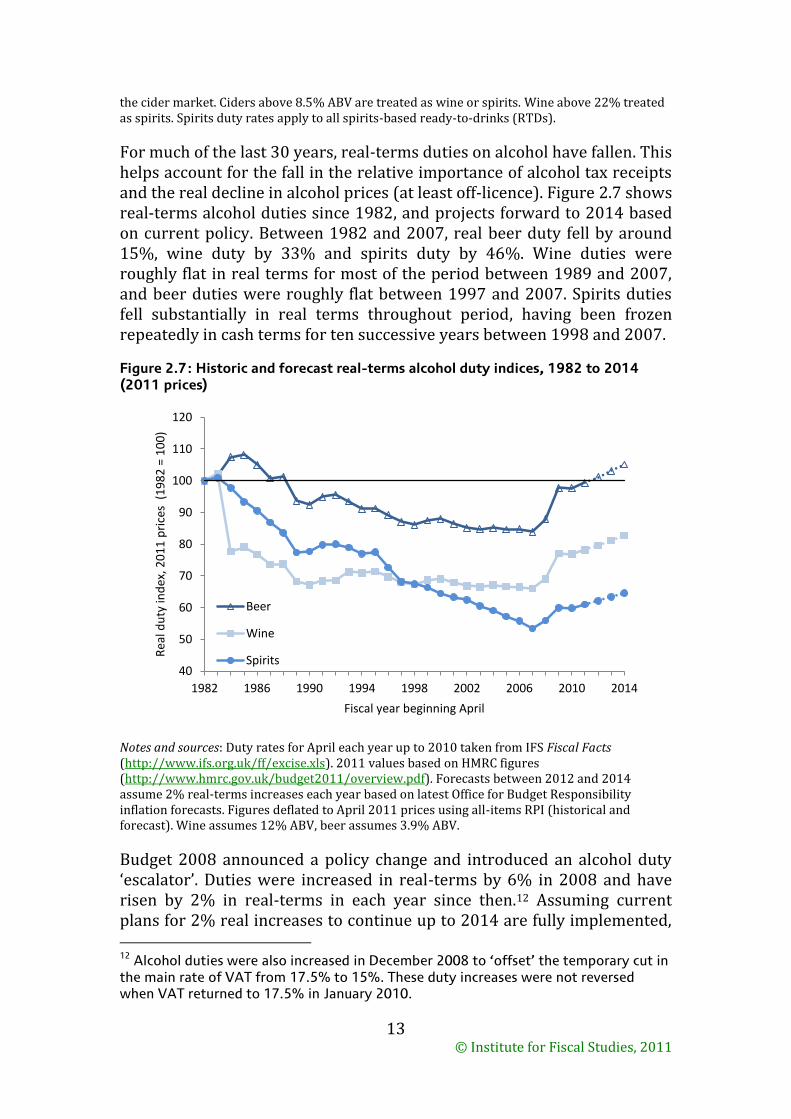
For much of the last 30 years, real-terms duties on alcohol have fallen. This helps account for the fall in the relative importance of alcohol tax receipts and the real decline in alcohol prices (at least off-licence). Figure 2.7 shows real-terms alcohol duties since 1982, and projects forward to 2014 based on current policy. Between 1982 and 2007, real beer duty fell by around 15%, wine duty by 33% and spirits duty by 46%. Wine duties were roughly flat in real terms for most of the period between 1989 and 2007, and beer duties were roughly flat between 1997 and 2007. Spirits duties fell substantially in real terms throughout period, having been frozen repeatedly in cash terms for ten successive years between 1998 and 2007.
Figure 2.7: Historic and forecast real-terms alcohol duty indices, 1982 to 2014 (2011 prices)
Notes and sources: Duty rates for April each year up to 2010 taken from IFS Fiscal Facts (http://www.ifs.org.uk/ff/excise.xls). 2011 values based on HMRC figures (http://www.hmrc.gov.uk/budget2011/overview.pdf). Forecasts between 2012 and 2014 assume 2% real-terms increases each year based on latest Office for Budget Responsibility inflation forecasts. Figures deflated to April 2011 prices using all-items RPI (historical and forecast). Wine assumes 12% ABV, beer assumes 3.9% ABV.
Budget 2008 announced a policy change and introduced an alcohol duty ‘escalator’. Duties were increased in real-terms by 6% in 2008 and have risen by 2% in real-terms in each year since then.12 Assuming current plans for 2% real increases to continue up to 2014 are fully implemented, 12 Alcohol duties were also increased in December 2008 to ‘offset’ the temporary cut in the main rate of VAT from 17.5% to 15%. These duty increases were not reversed when VAT returned to 17.5% in January 2010.
40
50
60
70
80
90
100
110
120
1982 1986 1990 1994 1998 2002 2006 2010 2014
Rea
l du
ty in
dex
, 20
11
pri
ces
(1
98
2 =
10
0)
Fiscal year beginning April
Beer
Wine
Spirits

© Institute for Fiscal Studies, 2011
14
real beer duty in 2014 will be higher than at any time since at least 1982, wine duty will reach levels last seen in 1983 and spirits duty at levels last seen in 2000. Implementing all future real increases will raise around £360 million extra in real terms per year from 2014.13
As was clear from Figure 2.6 above, per-unit taxes on cider are in general considerably lower than those on other types of alcohol. In his final Budget in March 2010, Alistair Darling announced a 10% real rise in cider duties ‘... to bring them more into line with the duty rates on other alcohol products.’ These increases were reversed in George Osborne’s first Budget in June 2010. Recent legislative changes on the definition of ‘cider’ for duty purposes have specified that to count as cider, products must contain a minimum level of apple or pear juice (both before and after fermentation). Products that do not meet this requirement are taxed in effect as wines.14 This might impact particularly on strong ‘white’ ciders though precisely which products are affected is unclear.
2.3 The rationale for intervention
Taxes on alcohol are typically justified as externality-correcting taxes. Alcohol consumption leads to costs which are not imposed on the individual consuming the product. This means the social impact of alcohol consumption is higher than the cost facing individuals when making their private decision of whether and how much alcohol to consume. This leads to an inefficiently high level of consumption from a social perspective. Well-designed alcohol duties ensure these external costs are factored into the price facing private consumers.
The external costs associated with alcohol include the costs to the NHS of treating alcohol-related illnesses, costs of crime (including drink-driving) and anti-social behaviour, lost productivity and working days, family problems and so on. How large are these costs? Clearly it is difficult to quantify them in many cases. A report for the Prime Minister’s Strategy Unit (2004) suggested total costs in the order of £20 billion or so per year, including more than £6 billion lost to industry, more than £7 billion from crime and public disorder and £1.7 billion costs to the Health Service.15 From the perspective of alcohol taxes, however, what matters in terms of setting the ‘right’ rate is the marginal external cost associated with an
13 Based on HMRC ‘Ready Reckoner’ estimates that a 1% rise in alcohol duties raises £60 million. See http://www.hmrc.gov.uk/stats/tax_expenditures/table1-6.pdf.
14 See http://www.legislation.gov.uk/uksi/2010/1914/pdfs/uksiem_20101914_en.pdf.
15 Strategy Unit (2004), Alcohol Harm Reduction Strategy for England (http://webarchive.nationalarchives.gov.uk/20100416132449/http:/www.cabinetoffice.gov.uk/media/cabinetoffice/strategy/assets/caboffce%20alcoholhar.pdf)
© Institute for Fiscal Studies, 2011
15
additional unit of alcohol consumption, and there is no reason to assume that this is the same as the average external cost obtained from dividing the total cost by the amount of alcohol consumed. In particular, the external costs associated with alcohol are highly non-linear and vary from person to person (and even drink to drink). The external costs of moderate alcohol consumption are probably negligible, but the costs of binge drinking are much higher. The first unit of alcohol drunk by a moderate drinker therefore has a very different external cost from the twentieth unit drunk by a binger. However, it is not practical to differentiate alcohol taxes by consumer or by the number of units drunk in the same drinking session. Crawford et al (2010) discuss the economic implications of this.16 Assuming that it is the number of drinks consumed in a single sitting that matters for the external cost, they find that the optimal alcohol tax rate is likely to be much higher than the average external cost. Setting the optimal tax rate will involve a trade-off between the loss of welfare for moderate drinkers against the social gain from reducing alcohol consumption amongst heavy- and binge-drinkers, which in turn depends on the number of each type in society and how responsive they are to higher prices.
Another reason for alcohol taxes might be so-called ‘internalities’. The idea, based on concepts from behavioural economics, is that people may not be making fully rational decisions in how much alcohol they consume. This is not a question of information – if people were unaware of the health risks, for example, the appropriate policy would be to provide the information and allow people to make informed choices rather than to tax alcohol. Rather, it says that people’s ‘true’ preferences may be to drink a little but that they cannot resist bingeing when they are out with friends or once they have had the first drink. In this case, taxes may help people to consume an optimal amount based on their ‘true’ desires. Indeed, people aware of their inability to control their drinking might value alcohol taxes as a way to constrain their behaviour.
One obvious question is whether different types of alcohol should be taxed to different extents. Figure 2.6 showed that different alcohol types and strengths attract very different duty rates per alcohol unit. This kind of differentiation may be justified if, say, the marginal external costs associated with spirits intake are higher than those associated with beer, wine or cider. It may be that consumption of spirits, a relatively undiluted form of alcohol, is associated with harmful ‘binge’ drinking more than consumption of other alcohol types. More generally, the optimal tax rates on different types of alcohol will depend on how responsive demand is to
16 Crawford, I., M. Keen and S. Smith (2010), ‘Value Added Tax and excises’, in Mirrlees, J. et al (eds.), Dimensions of Tax Design: The Mirrlees Review, Oxford: Oxford University Press (http://www.ifs.org.uk/mirrleesreview/dimensions/ch4.pdf).
© Institute for Fiscal Studies, 2011
16
prices and the extent to which different types of alcohol are complementary to leisure (since taxing goods which are complementary to leisure may improve work incentives). In US studies, Saffer and Chaloupka (1994), ignoring the complementarity to leisure, argue that if anything taxes on beer should be higher than those on spirits but conclude that given the uncertainties involved in their estimates, a position of neutrality in which all alcohols were taxed at the same rate (per alcohol unit) was a sensible approach.17 Parry et al (2009) argue that once the relationship between alcohol and leisure is taken into account a case can be made to tax beer more heavily than wine and in turn tax both more heavily than spirits.18 This is the reverse of the current UK duty structure.
The economic evidence suggests that the current structure of alcohol excise taxes is probably not optimal. As a starting point, it would seem desirable to treat different types of alcohol in the same way in the tax system, which would point to relatively large increases in cider taxes and ideally a restructuring of alcohol taxation so that all drinks could be taxed on the basis of their alcohol content rather than just spirits and beers. This would obviously require legislative change at the EU level as well as the UK level. Deviating from this neutral position should be motivated by strong evidence that certain types of alcohol are associated with higher marginal external costs than others, and more research on this for the UK would be useful for good policy making.
What about the rationale for policies that seek to directly set minimum alcohol prices, including bans on below-cost sales? If consumption of very cheap alcohol is associated with higher marginal external costs than more expensive products, this might rationalise policies that raise the price of cheap alcohol – though increases in taxes would also (assuming they are passed on) have a relatively larger effect on cheaper products. Bans on below-cost sales are also motivated as a way to prevent anti-competitive pricing of alcohol by large retailers or using alcohol as a loss-leader. If very cheap off-licence alcohol retail is the result of anti-competitive pricing then it may be better left to competition authorities to intervene. However, whilst previous investigations of grocery retail have found evidence that supermarkets sell some items, including alcohol, below cost (where ‘cost’ was defined more broadly than tax liable to include some estimates of production costs), little evidence was found that this was anti-competitive
17 Saffer, H. and F. Chaloupka (1994), ‘Alcohol tax equalization and social costs’, Eastern Economic Journal, 20 (1), 33–43.
18 Parry, I. W. H, S. E. West and R. Laxminarayan (2009), ‘Fiscal and externality rationales for alcohol policies’, The B.E. Journal of Economic Analysis and Policy Contributions, 9 (1), Article 29
© Institute for Fiscal Studies, 2011
17
(for example, predatory pricing designed to drive out competitors after which prices rise again).19
One point worth making in terms of the proposal to introduce minimum pricing in Scotland is that the devolved Parliament there does not have the power to unilaterally raise alcohol duty, which is a matter of Westminster policy. In the absence of this tax-setting ability, the only way for a Scottish Government to raise the price of alcohol is to use direct price-setting legislation. Devolving alcohol duty decisions to Scotland (or perhaps allowing some degree of variation in rates, as happens with income tax) should therefore be considered, though issues around distortions of the location of alcohol production and possible complexities for producers and retailers who operate UK-wide would have to be borne in mind.
2.4 Are alcohol taxes regressive?
A common concern with many indirect taxes is that they may impact more heavily on poorer households. Figure 2.8 uses information from the 2009 Living Costs and Food Survey (LCFS), which records the expenditure patterns over two weeks of around 6,000 households, to show the proportion of households buying alcohol according to their position in the overall distribution of total spending.20 We split households into ten groups (‘deciles’) based on their total weekly non-housing expenditure.
Overall, about two-thirds of households buy alcohol during the survey period. 52% buy off-licence and 44% buy on-licence alcohol. Just 29% of those in the bottom expenditure decile purchase alcohol compared to 83% of those in the top decile. There is much greater variation in the propensity to buy on-licence than off-licence. Only 9% of the worst-off households buy on-licence compared to 67% of those in the best-off expenditure decile. By contrast, 24% of the worst-off households buy off-licence alcohol compared to 67% of the best-off households.
Using the LCFS data, we estimate the impact of a 5% rise in all alcohol prices (on- and off-licence) on household’s total expenditures. Figure 2.9 shows the impact by expenditure decile. Given that worse-off households are less likely to buy alcohol, it is not surprising that the impact of the price rise across all households looks, if anything, broadly progressive: the
19 See e.g. Competition Commission (2008), Groceries Market Investigation (http://www.competition-commission.org.uk/rep_pub/reports/2008/538grocery.htm).
20 We prefer spending to income as a measure of whether households are well-off. A range of evidence suggests that very low-income households are not necessarily ‘poor’, but may instead have mis-measured or temporarily low incomes and maintain relatively high living standards from borrowing or running down savings. See for example http://www.ifs.org.uk/pr/pr-2011-03-11.pdf and the references cited therein.

© Institute for Fiscal Studies, 2011
18
worst-off households lose around 0.1% of their budget on average compared to almost 0.2% for those further up the expenditure distribution. Looking just at those households who buy alcohol, the impact is regressive, with the worst-off tenth of alcohol buyers losing more than 0.3% of their budget on average compared to 0.2% for the best-off tenth.
Figure 2.8: Proportion of households buying alcohol by expenditure decile, 2009
Source: Calculated from 2009 Living Costs and Food Survey. Notes: Households spending more than 20% of their budget on either on- or off-licence alcohol excluded, as are those with per-adult equivalent income or expenditure of less than £10/week. Expenditure excludes housing costs.
Figure 2.9: Cost of a 5% rise in alcohol prices by expenditure decile, 2009
Source: Calculated from 2009 Living Costs and Food Survey. Notes: Households spending more than 20% of their budget on either on- or off-licence alcohol excluded, as are those with per-adult equivalent income or expenditure of less than £10/week. Expenditure excludes housing costs.
0%
10%
20%
30%
40%
50%
60%
70%
80%
90%
Poorest 2 3 4 5 6 7 8 9 Richest ALL
Pro
po
rtio
n p
urc
has
ing
alco
ho
l
On sales Off sales Any alcohol
0.00
0.05
0.10
0.15
0.20
0.25
0.30
0.35
Poorest 2 3 4 5 6 7 8 9 Richest ALL
Loss
(%
of
exp
end
itu
re)
All households
Households purchasing alcohol
© Institute for Fiscal Studies, 2011
19
It is worth noting that the propensity to buy off-sales alcohol is much smaller in the LCFS than in scanner data we use to assess the different policies in sections 3 to 5 (see Box 2.1). This is at least partly because the LCFS data record spending over just two weeks whereas households in our scanner data sample record spending for a minimum of twelve weeks and in some cases a full year. Off-licence alcohol is storable for a relatively long time, so it may be that some households buy it infrequently (less than once a fortnight) but ‘stock up’ when they do so to consume over a long period. Other households may just buy alcohol on special occasions. However, to understand the potential effects of alcohol policies it seems important to recognise that for many households, off-licence alcohol buying is an irregular thing which may not be picked up in short survey periods.
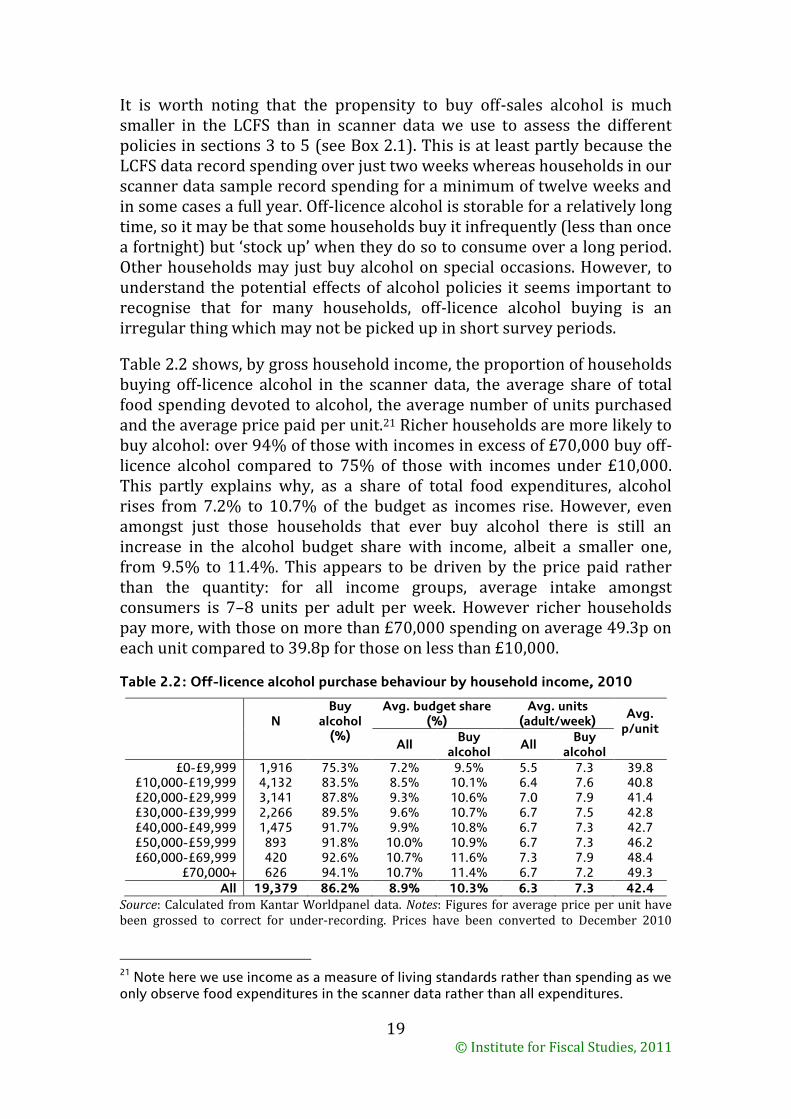
Table 2.2 shows, by gross household income, the proportion of households buying off-licence alcohol in the scanner data, the average share of total food spending devoted to alcohol, the average number of units purchased and the average price paid per unit.21 Richer households are more likely to buy alcohol: over 94% of those with incomes in excess of £70,000 buy off-licence alcohol compared to 75% of those with incomes under £10,000. This partly explains why, as a share of total food expenditures, alcohol rises from 7.2% to 10.7% of the budget as incomes rise. However, even amongst just those households that ever buy alcohol there is still an increase in the alcohol budget share with income, albeit a smaller one, from 9.5% to 11.4%. This appears to be driven by the price paid rather than the quantity: for all income groups, average intake amongst consumers is 7–8 units per adult per week. However richer households pay more, with those on more than £70,000 spending on average 49.3p on each unit compared to 39.8p for those on less than £10,000.
Table 2.2: Off-licence alcohol purchase behaviour by household income, 2010
N
Buy alcohol
(%)
Avg. budget share (%)
Avg. units (adult/week)
Avg. p/unit
All Buy
alcohol All
Buy alcohol
£0-£9,999 1,916 75.3% 7.2% 9.5% 5.5 7.3 39.8 £10,000-£19,999 4,132 83.5% 8.5% 10.1% 6.4 7.6 40.8 £20,000-£29,999 3,141 87.8% 9.3% 10.6% 7.0 7.9 41.4 £30,000-£39,999 2,266 89.5% 9.6% 10.7% 6.7 7.5 42.8 £40,000-£49,999 1,475 91.7% 9.9% 10.8% 6.7 7.3 42.7 £50,000-£59,999 893 91.8% 10.0% 10.9% 6.7 7.3 46.2 £60,000-£69,999 420 92.6% 10.7% 11.6% 7.3 7.9 48.4
£70,000+ 626 94.1% 10.7% 11.4% 6.7 7.2 49.3
All 19,379 86.2% 8.9% 10.3% 6.3 7.3 42.4
Source: Calculated from Kantar Worldpanel data. Notes: Figures for average price per unit have been grossed to correct for under-recording. Prices have been converted to December 2010
21
Note here we use income as a measure of living standards rather than spending as we only observe food expenditures in the scanner data rather than all expenditures.

© Institute for Fiscal Studies, 2011
20
values using the all-items RPI. “All” row includes households with unknown incomes. Budget share is a proportion of total expenditure on food and alcohol.
2.5 Responsiveness to alcohol price interventions
When thinking about the impact of policies that change alcohol prices it is crucial to think of the likely response of different parts of the market – that is, how will the consumers, producers and retailers of alcohol respond?
Consumers typically respond to higher prices by reducing their demand. This response is measured by the ‘own-price elasticity’ of demand: for example, if demand falls by 5% when prices rise by 10% then the own-price elasticity is -0.5. Similarly, ‘cross-price elasticites’ measure the change in demand for a product when the prices of other products change. Policies which both raise alcohol prices and cause relative prices to change will lead consumers not only to consume less alcohol overall but also to substitute their consumption patterns. Higher taxes on strong beers may increase the demand for weaker beers or strong ciders, for example. Policies such as minimum prices or below-cost bans will affect particular brands and alcohol products but will have no direct effect on others, which could lead to brand-switching responses as well as more ‘high-level’ substitution (such as from off- to on-licence consumption or from cheaper forms of alcohol like cider to more expensive forms like wine).
A number of recent papers have surveyed the literature on the size of alcohol demand elasticities. Gallet (2007) surveys 132 papers and finds a median own-price elasticity for alcohol of -0.50. Broken down by alcohol type, wine (-0.70) and spirits (-0.68) typically have higher own-price elasticities than beer (-0.36).22 Wagenaar et al (2009) survey 112 studies and reach similar conclusions: the mean own-price elasticity for alcohol is estimated to be -0.51, with beer being slightly less elastic (-0.46) and wine (-0.69) and spirits (-0.80) more elastic.23 HMRC (2010) estimate elasticities for beer, wine, spirits, RTDs and cider on- and off-licence. They find that apart from spirits, own-price demand responses are higher off-licence than on-licence. Wine is found to be least price elastic (-0.46 on-licence, -0.54 off-licence). Spirits are most elastic on-licence (-1.15) and cider most elastic off-licence (-1.34).24
22 Gallet, C. (2007), ‘The demand for alcohol: a meta-analysis of elasticities’, Australian Journal of Agricultural and Resource Economics, 51, 121–135.
23 Wagenaar, A., M. Salois and K. Komro (2009), ‘Effects of beverage alcohol price and tax levels on drinking: a meta-analysis of 1003 estimates from 112 studies’, Addiction, 104, 179–190.
24 Collis, J., A. Grayson and S. Johal (2010), Econometric Analysis of Alcohol Consumption in the UK, HMRC Working Paper 10 (http://www.hmrc.gov.uk/research/alcohol-consumption-uk.pdf)
© Institute for Fiscal Studies, 2011
21
Alcohol elasticities also vary across consumers. Elasticities may be correlated both with observable characteristics (such as income, age, household structure, overall alcohol consumption) and with unobservable characteristics (such as tastes for alcohol). This variation would need to be taken into account for any full understanding of the impact of alcohol pricing policies, particularly since the intention is often to focus on particular groups such as young drinkers or those consuming the most alcohol. There is some evidence that households that drink a lot are less responsive to prices than others: Wagenaar et al (2009) find that the average own-price alcohol elasticity amongst ‘heavy drinkers’ is -0.28, compared to -0.51 across all estimates. Estimates from the University of Sheffield (2009), using data from England between 2001 and 2006, find that own-price elasticities are higher for ‘hazardous’ or ‘harmful’ drinkers (those consuming more than government-recommended weekly amounts) than ‘moderate’ drinkers, but also that cross-price responses are much greater for heavy-drinking households.25
In general, we tend to think of consumers responding to higher alcohol prices by reducing alcohol consumption (and potentially stopping drinking altogether). Consumers can of course react in other ways: for example, cross-border shopping (buying alcohol in other countries where it is sold more cheaply and bringing it back to the UK), buying cheaper illicit alcohol where no UK tax is paid or even home-brewing. If the primary concern of alcohol policy is to reduce consumption then understanding the extent to which these sorts of responses occur is important. Unsurprisingly, however, it can be hard to get good evidence on this. HMRC publishes regular estimates of the size of the ‘tax gap’ for indirect taxes (i.e. the difference between total tax receipts and those that would have been received in the absence of fraud and evasion). The most recent estimates suggest that in 2008-9, around 2% of the spirits market was illicit (leading to revenue losses of around £50 million). For beer, only an upper bound estimate is available, suggesting that up to 11% of the market was illict (leading to revenue losses of around £650 million).26
Whilst there is a considerable literature on consumer responses to alcohol prices, how alcohol manufacturers and retailers would respond to different interventions is much less studied but equally as important. An immediate issue, for example, is the extent to which higher alcohol taxes
25 Purshouse, R. et al (2009), Modelling to Assess the Effectiveness and Cost-Effectiveness of Public Health Related Strategies and Interventions to Reduce Alcohol Attributable Harm in England Using the Sheffield Alcohol Policy Model Version 2.0 (http://www.nice.org.uk/nicemedia/live/11828/45668/45668.pdf)
26 HMRC (2010), Measuring Tax Gaps 2010
(http://www.hmrc.gov.uk/stats/measuring-tax-gaps-2010.htm.pdf)
© Institute for Fiscal Studies, 2011
22
are passed on to consumers or borne instead by producers or retailers. In general there is no reason to assume that higher alcohol taxes would be passed on one-for-one into final product prices. Economic theory suggests that in competitive markets, more of the incidence of taxes is borne by consumers where demand is relatively inelastic compared to supply. However, alcohol production and retail are probably better characterised as oligopolistic markets where a small number of large firms have a degree of market power which makes the analysis more difficult. Alcohol duties are formally levied on the producers of alcohol. These producers then negotiate with retailers who in turn sell products to final consumers. The ultimate tax incidence between producers, retailers and consumers may well depend on the relative bargaining power of producers and retailers as well as supply and demand elasticities. Ultimately the issue is an empirical one. Some papers have shown that increases in alcohol taxes are passed on more than one-for-one into final consumer prices on average though it is an area where more evidence, particularly for the UK, would be useful..27
Aside from pass-through, producers and retailers could respond to particular interventions in other ways. One would be to change the set of alcohol products brought to market in the longer-term. Higher taxes on strong beers and reduced rates on weak beers could encourage producers to start manufacturing more lower-strength products. The imposition of minimum pricing may make some cheap, low-quality products uncompetitive and would encourage producers to invest in higher-quality products instead. Another response could be to change the prices of alcohol and other products more generally from those directly affected by any given policy change. For example, a minimum price could lead to retailers and manufacturers changing their entire portfolio of product prices, re-optimising their price strategy in the face of new constraints on pricing behaviour. In markets where firms produce a number of closely related but differentiated products, and a number of brands are produced by the same manufacturer, such behaviour is likely to be particularly important. In terms of alcohol retail, if firms use cheap alcohol to attract consumers into the store, then below-cost bans or minimum pricing might lead to lower prices of other products instead to achieve the same result. Finally, if retailers are prevented from competing on price then there may be increases in ‘non-price’ competition such as advertising.
27 See for example Young, D. J. and A. Bielińska-Kwapisz (2002), ‘Alcohol taxes and
beverage prices’, National Tax Journal, 55 (1), 57–73; Kenkel, D. S. (2005), ‘Are alcohol tax hikes fully passed through to prices? Evidence from Alaska’, American Economic Review, 95 (2), 273–277 and Bergman, M. and N. L. Hansen (2010), Are Excise Taxes on Beverages Fully Passed Through to Prices? The Danish Evidence, University of Copenhagen Working Paper (http://www.econ.ku.dk/okombe/BergmanHansen.pdf).
© Institute for Fiscal Studies, 2011
23
Understanding the impact of different interventions is therefore likely to require estimation of an economic model which is, as far as possible, able to account for these different responses on both demand and supply side.
Having discussed some of the general issues regarding alcohol taxes and prices, we now turn to the individual policies that have been proposed or that have featured in recent debate: changes to the structure of beer taxes, a ‘below-cost’ ban and a minimum price (we choose 45p/unit to match the recent Scottish proposal).
3. Changes to beer duty
3.1 Background
In Budget 2011, the Chancellor announced reforms to beer taxes to be enacted in October 2011. A new ‘high-strength beer duty’ was introduced on products above 7.5% ABV, set at 25% of the main beer duty rate. At the same time, the beer duty rate was reduced by 50% for weaker beers of 2.8% ABV or less.28 This is also the threshold at which EU legislation allows reduced duty rates on beers to be introduced (there is no legal minimum for these reduced rates). However there is no comparable strength threshold above which beer duty can be raised. This may explain why the change for stronger beers is being introduced as a completely new duty whereas the change for weaker beers is being introduced as a cut in the standard rate of beer duty.
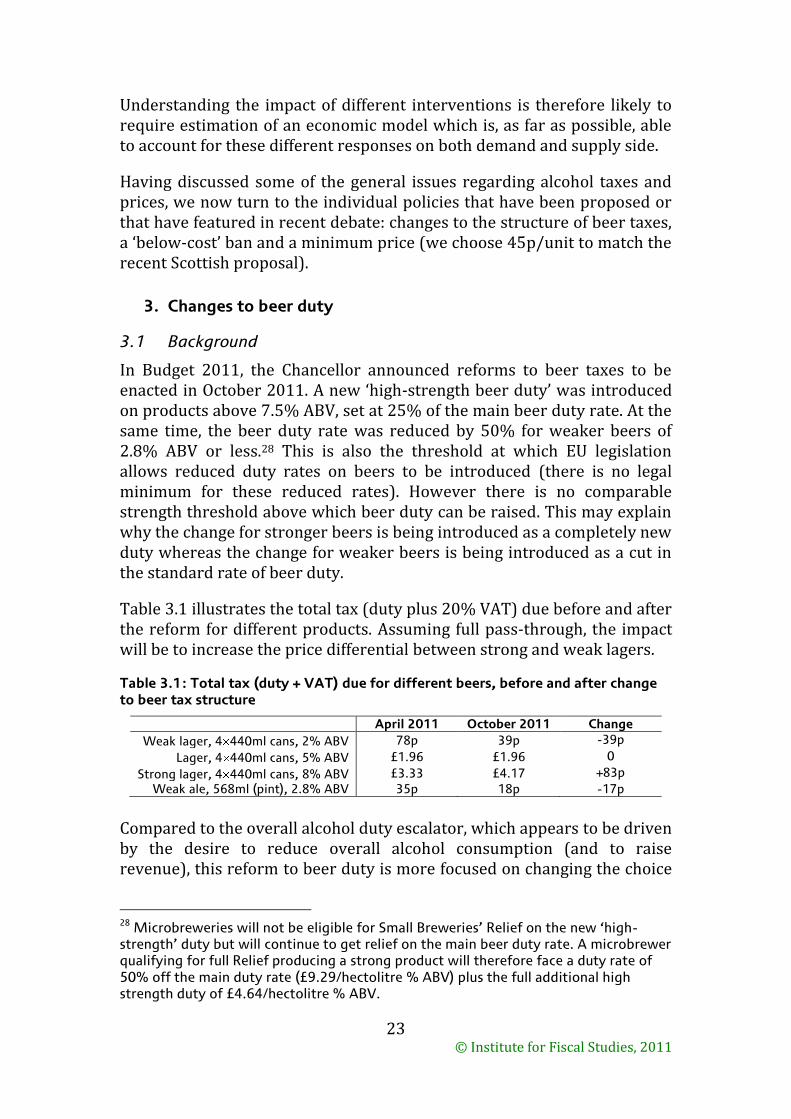
Table 3.1 illustrates the total tax (duty plus 20% VAT) due before and after the reform for different products. Assuming full pass-through, the impact will be to increase the price differential between strong and weak lagers.
Table 3.1: Total tax (duty + VAT) due for different beers, before and after change to beer tax structure
April 2011 October 2011 Change
Weak lager, 4 440ml cans, 2% ABV 78p 39p -39p
Lager, 4 440ml cans, 5% ABV £1.96 £1.96 0
Strong lager, 4 440ml cans, 8% ABV £3.33 £4.17 +83p
Weak ale, 568ml (pint), 2.8% ABV 35p 18p -17p
Compared to the overall alcohol duty escalator, which appears to be driven by the desire to reduce overall alcohol consumption (and to raise revenue), this reform to beer duty is more focused on changing the choice
28 Microbreweries will not be eligible for Small Breweries’ Relief on the new ‘high-strength’ duty but will continue to get relief on the main beer duty rate. A microbrewer qualifying for full Relief producing a strong product will therefore face a duty rate of 50% off the main duty rate (£9.29/hectolitre % ABV) plus the full additional high strength duty of £4.64/hectolitre % ABV.
© Institute for Fiscal Studies, 2011
24
of alcohol product by raising the relative price of strong beer. However, it is noticeable that cider, particularly strong cider, will continue to have significantly lower duty rates than other alcohol types (see Figure 2.6). A cider of 7.6% ABV attracts a duty rate of 7.1p/unit, compared to 23.2p/unit for a beer of the same strength. If the government is concerned about people consuming strong beers, it seems somewhat odd that there is not similar concern about strong ciders. Indeed, in his first Budget in June 2010, George Osborne reversed a 10% real duty increase on cider which Alistair Darling had announced in his final March 2010 Budget. By changing the structure of beer taxes, the intention is clearly to encourage people to substitute from stronger to weaker beers but by leaving cider taxes unchanged it may well be that those currently consuming strong beers now choose to purchase strong ciders instead.
Producers may also have incentives under the new tax structure to change their portfolio of products. As we show below, strong and weak beers are fairly small parts of the overall off-licence alcohol market, but the change could lead to more low-strength products being introduced over time.
3.2 Overall impact and impact by retailer
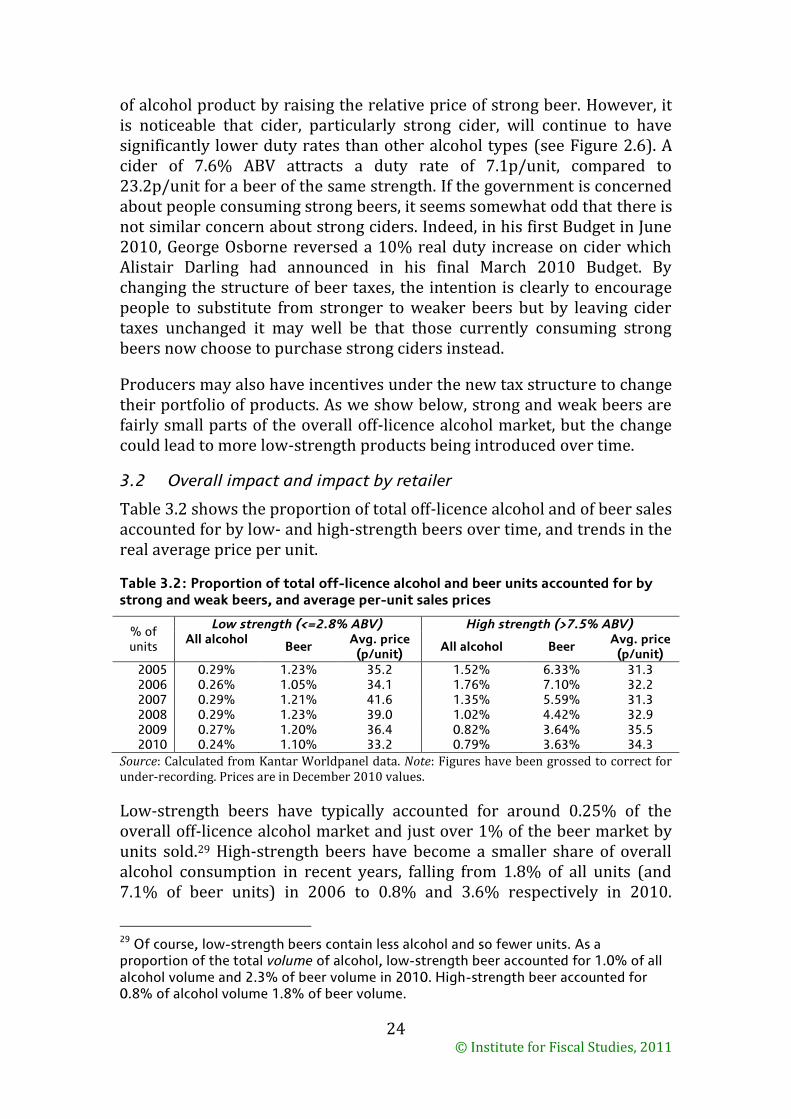
Table 3.2 shows the proportion of total off-licence alcohol and of beer sales accounted for by low- and high-strength beers over time, and trends in the real average price per unit.
Table 3.2: Proportion of total off-licence alcohol and beer units accounted for by strong and weak beers, and average per-unit sales prices
% of units
Low strength (<=2.8% ABV) High strength (>7.5% ABV) All alcohol
Beer Avg. price (p/unit)
All alcohol Beer Avg. price (p/unit)
2005 0.29% 1.23% 35.2 1.52% 6.33% 31.3 2006 0.26% 1.05% 34.1 1.76% 7.10% 32.2 2007 0.29% 1.21% 41.6 1.35% 5.59% 31.3 2008 0.29% 1.23% 39.0 1.02% 4.42% 32.9 2009 0.27% 1.20% 36.4 0.82% 3.64% 35.5 2010 0.24% 1.10% 33.2 0.79% 3.63% 34.3
Source: Calculated from Kantar Worldpanel data. Note: Figures have been grossed to correct for under-recording. Prices are in December 2010 values.
Low-strength beers have typically accounted for around 0.25% of the overall off-licence alcohol market and just over 1% of the beer market by units sold.29 High-strength beers have become a smaller share of overall alcohol consumption in recent years, falling from 1.8% of all units (and 7.1% of beer units) in 2006 to 0.8% and 3.6% respectively in 2010.
29 Of course, low-strength beers contain less alcohol and so fewer units. As a proportion of the total volume of alcohol, low-strength beer accounted for 1.0% of all alcohol volume and 2.3% of beer volume in 2010. High-strength beer accounted for 0.8% of alcohol volume 1.8% of beer volume.

© Institute for Fiscal Studies, 2011
25
Looking at prices, there is no clear trend for low-strength products but some evidence that stronger beers have risen in price over time.
Table 3.3 shows the share of units sold as strong and weak beers by retailer in 2010. Discount retailers such as Aldi, Lidl and Netto sell very little beer in either low- or high-strength groups. Low-strength beers appear to be most important in the major supermarkets, but make up almost none of the alcohol sold in off-licences or corner shops. The most common low-strength beers in the data tend to be own-brand products, which would explain this result; there appear to be few branded low-strength beers. By contrast, high-strength beers are very significant proportions of the alcohol sold in off-licences (more than 5% of all alcohol units and 16% of beer units) and local shops and tend to be a mixture of branded and own-label goods.
Table 3.3: Proportion of total off-licence alcohol and beer units accounted for by strong and weak beers, by retailer, 2010
% of units Low strength beer (<=2.8% ABV) High strength beer (>7.5% ABV)
All alcohol Beer All alcohol Beer
Aldi 0.0% 0.0% 0.0% 0.0% Asda 0.5% 1.9% 0.5% 1.9%
Co-op 0.1% 0.4% 1.3% 8.6% Iceland 0.0% 0.0% 0.0% 0.3%
Lidl 0.0% 0.0% 0.0% 0.0% M&S 0.0% 0.0% 0.0% 0.8%
Morrisons 0.3% 1.4% 0.9% 3.6% Netto 0.0% 0.1% 0.1% 0.4%
Sainsburys 0.3% 1.5% 0.5% 2.5% Somerfield 0.1% 0.5% 1.0% 6.2%
Tesco 0.2% 1.1% 0.6% 2.7% Waitrose 0.0% 0.1% 1.4% 10.5%
Off Licence 0.0% 0.0% 5.2% 16.5% Local/Corner 0.0% 0.1% 3.7% 14.6%
Other 0.0% 0.2% 1.1% 4.9%
All 0.2% 1.1% 0.8% 3.6%
Source: Calculated from Kantar Worldpanel data. Note: Figures have been grossed to correct for under-recording.
3.3 Impact by consumer type
Table 3.4 shows the importance of strong and weak off-licence beers by household income. Amongst households who buy any alcohol, 1.6% buy strong beer and 4.7% weak beer.
For strong beer, the likelihood of buying does not appear to be related to income in a systematic way. Poorer households are much more likely to buy weak beer than richer households. Weak beers made up 0.5% of all alcohol units for those with incomes under £10,000 but virtually none of the units of those with incomes above £30,000. The relationship between income and the proportion of units accounted for by strong beer is inconsistent, though the largest proportion (2.3%) is found for the richest households. Strong/weak beer units are distributed very differently across
© Institute for Fiscal Studies, 2011
26
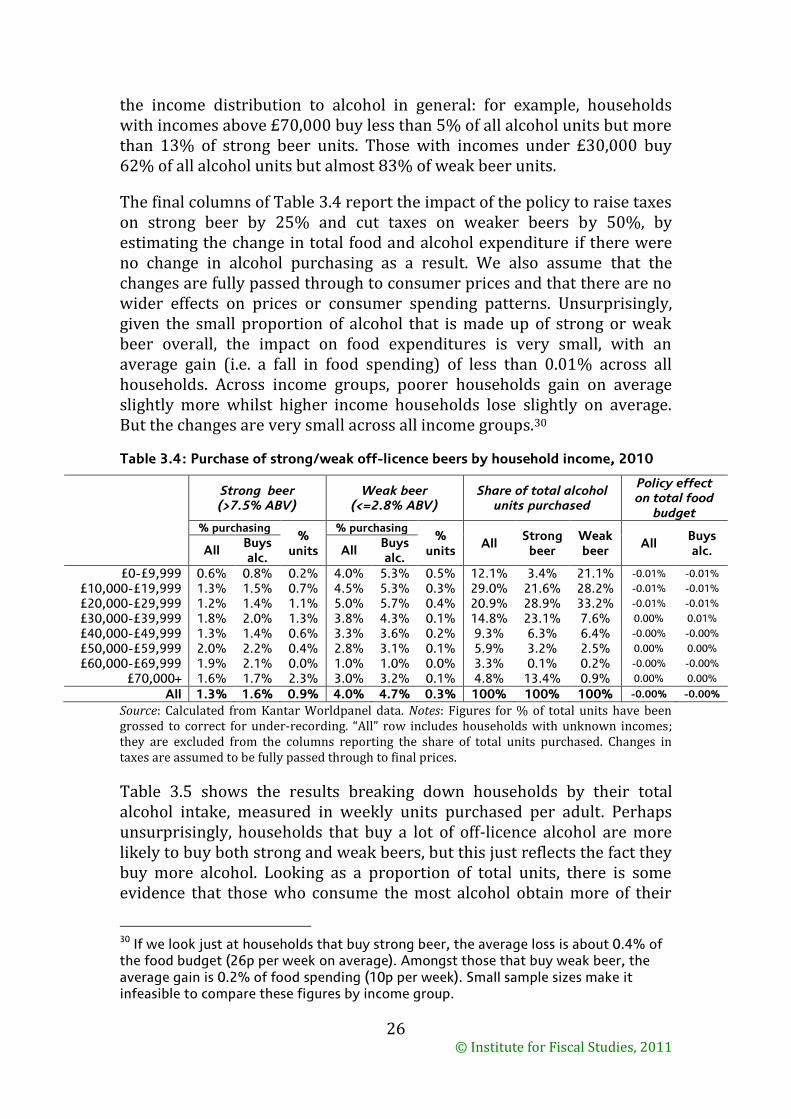
the income distribution to alcohol in general: for example, households with incomes above £70,000 buy less than 5% of all alcohol units but more than 13% of strong beer units. Those with incomes under £30,000 buy 62% of all alcohol units but almost 83% of weak beer units.
The final columns of Table 3.4 report the impact of the policy to raise taxes on strong beer by 25% and cut taxes on weaker beers by 50%, by estimating the change in total food and alcohol expenditure if there were no change in alcohol purchasing as a result. We also assume that the changes are fully passed through to consumer prices and that there are no wider effects on prices or consumer spending patterns. Unsurprisingly, given the small proportion of alcohol that is made up of strong or weak beer overall, the impact on food expenditures is very small, with an average gain (i.e. a fall in food spending) of less than 0.01% across all households. Across income groups, poorer households gain on average slightly more whilst higher income households lose slightly on average. But the changes are very small across all income groups.30
Table 3.4: Purchase of strong/weak off-licence beers by household income, 2010
Strong beer (>7.5% ABV)
Weak beer (<=2.8% ABV)
Share of total alcohol units purchased
Policy effect on total food
budget
% purchasing %
units
% purchasing %
units All
Strong beer
Weak beer
All Buys alc. All
Buys alc.
All Buys alc.
£0-£9,999 0.6% 0.8% 0.2% 4.0% 5.3% 0.5% 12.1% 3.4% 21.1% -0.01% -0.01%
£10,000-£19,999 1.3% 1.5% 0.7% 4.5% 5.3% 0.3% 29.0% 21.6% 28.2% -0.01% -0.01%
£20,000-£29,999 1.2% 1.4% 1.1% 5.0% 5.7% 0.4% 20.9% 28.9% 33.2% -0.01% -0.01%
£30,000-£39,999 1.8% 2.0% 1.3% 3.8% 4.3% 0.1% 14.8% 23.1% 7.6% 0.00% 0.01%
£40,000-£49,999 1.3% 1.4% 0.6% 3.3% 3.6% 0.2% 9.3% 6.3% 6.4% -0.00% -0.00%
£50,000-£59,999 2.0% 2.2% 0.4% 2.8% 3.1% 0.1% 5.9% 3.2% 2.5% 0.00% 0.00%
£60,000-£69,999 1.9% 2.1% 0.0% 1.0% 1.0% 0.0% 3.3% 0.1% 0.2% -0.00% -0.00%
£70,000+ 1.6% 1.7% 2.3% 3.0% 3.2% 0.1% 4.8% 13.4% 0.9% 0.00% 0.00%
All 1.3% 1.6% 0.9% 4.0% 4.7% 0.3% 100% 100% 100% -0.00% -0.00%
Source: Calculated from Kantar Worldpanel data. Notes: Figures for % of total units have been grossed to correct for under-recording. “All” row includes households with unknown incomes; they are excluded from the columns reporting the share of total units purchased. Changes in taxes are assumed to be fully passed through to final prices.
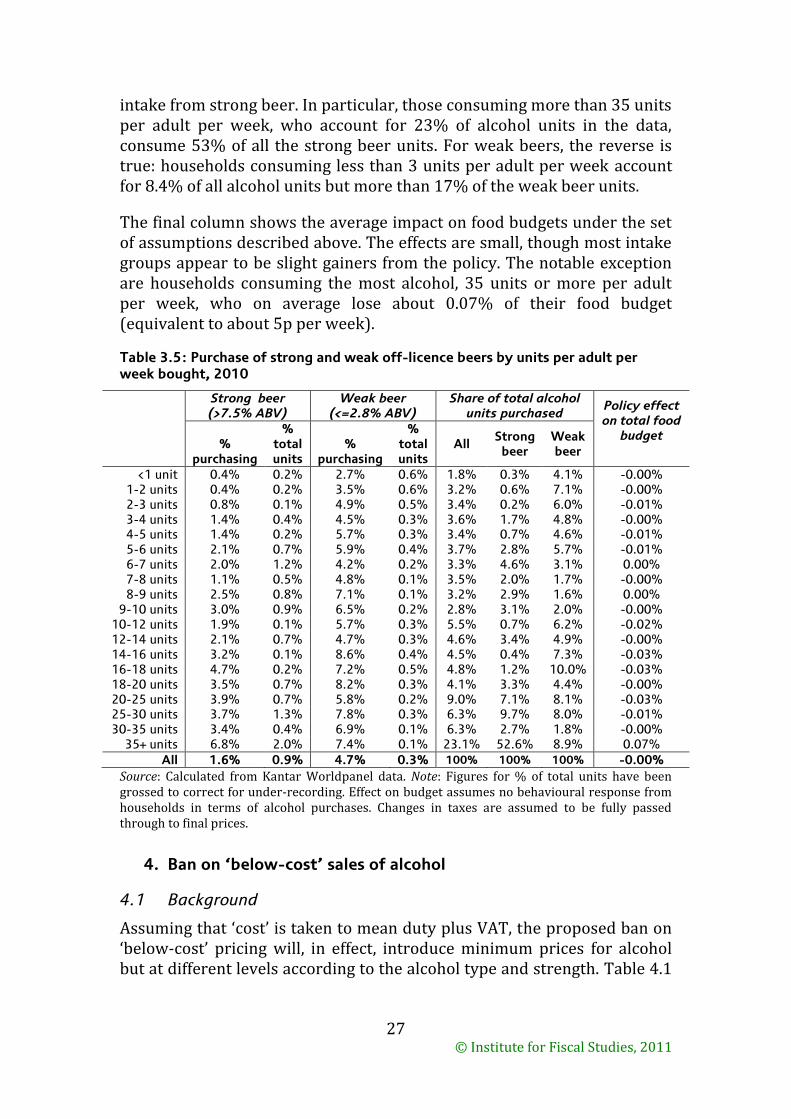
Table 3.5 shows the results breaking down households by their total alcohol intake, measured in weekly units purchased per adult. Perhaps unsurprisingly, households that buy a lot of off-licence alcohol are more likely to buy both strong and weak beers, but this just reflects the fact they buy more alcohol. Looking as a proportion of total units, there is some evidence that those who consume the most alcohol obtain more of their
30 If we look just at households that buy strong beer, the average loss is about 0.4% of the food budget (26p per week on average). Amongst those that buy weak beer, the average gain is 0.2% of food spending (10p per week). Small sample sizes make it infeasible to compare these figures by income group.
© Institute for Fiscal Studies, 2011
27
intake from strong beer. In particular, those consuming more than 35 units per adult per week, who account for 23% of alcohol units in the data, consume 53% of all the strong beer units. For weak beers, the reverse is true: households consuming less than 3 units per adult per week account for 8.4% of all alcohol units but more than 17% of the weak beer units.
The final column shows the average impact on food budgets under the set of assumptions described above. The effects are small, though most intake groups appear to be slight gainers from the policy. The notable exception are households consuming the most alcohol, 35 units or more per adult per week, who on average lose about 0.07% of their food budget (equivalent to about 5p per week).
Table 3.5: Purchase of strong and weak off-licence beers by units per adult per week bought, 2010
Strong beer (>7.5% ABV)
Weak beer (<=2.8% ABV)
Share of total alcohol units purchased
Policy effect on total food
budget %
purchasing
% total units
% purchasing
% total units
All Strong
beer Weak beer
<1 unit 0.4% 0.2% 2.7% 0.6% 1.8% 0.3% 4.1% -0.00% 1-2 units 0.4% 0.2% 3.5% 0.6% 3.2% 0.6% 7.1% -0.00% 2-3 units 0.8% 0.1% 4.9% 0.5% 3.4% 0.2% 6.0% -0.01% 3-4 units 1.4% 0.4% 4.5% 0.3% 3.6% 1.7% 4.8% -0.00% 4-5 units 1.4% 0.2% 5.7% 0.3% 3.4% 0.7% 4.6% -0.01% 5-6 units 2.1% 0.7% 5.9% 0.4% 3.7% 2.8% 5.7% -0.01% 6-7 units 2.0% 1.2% 4.2% 0.2% 3.3% 4.6% 3.1% 0.00% 7-8 units 1.1% 0.5% 4.8% 0.1% 3.5% 2.0% 1.7% -0.00% 8-9 units 2.5% 0.8% 7.1% 0.1% 3.2% 2.9% 1.6% 0.00%
9-10 units 3.0% 0.9% 6.5% 0.2% 2.8% 3.1% 2.0% -0.00% 10-12 units 1.9% 0.1% 5.7% 0.3% 5.5% 0.7% 6.2% -0.02% 12-14 units 2.1% 0.7% 4.7% 0.3% 4.6% 3.4% 4.9% -0.00% 14-16 units 3.2% 0.1% 8.6% 0.4% 4.5% 0.4% 7.3% -0.03% 16-18 units 4.7% 0.2% 7.2% 0.5% 4.8% 1.2% 10.0% -0.03% 18-20 units 3.5% 0.7% 8.2% 0.3% 4.1% 3.3% 4.4% -0.00% 20-25 units 3.9% 0.7% 5.8% 0.2% 9.0% 7.1% 8.1% -0.03% 25-30 units 3.7% 1.3% 7.8% 0.3% 6.3% 9.7% 8.0% -0.01% 30-35 units 3.4% 0.4% 6.9% 0.1% 6.3% 2.7% 1.8% -0.00%
35+ units 6.8% 2.0% 7.4% 0.1% 23.1% 52.6% 8.9% 0.07%
All 1.6% 0.9% 4.7% 0.3% 100% 100% 100% -0.00%
Source: Calculated from Kantar Worldpanel data. Note: Figures for % of total units have been grossed to correct for under-recording. Effect on budget assumes no behavioural response from households in terms of alcohol purchases. Changes in taxes are assumed to be fully passed through to final prices.
4. Ban on ‘below-cost’ sales of alcohol
4.1 Background
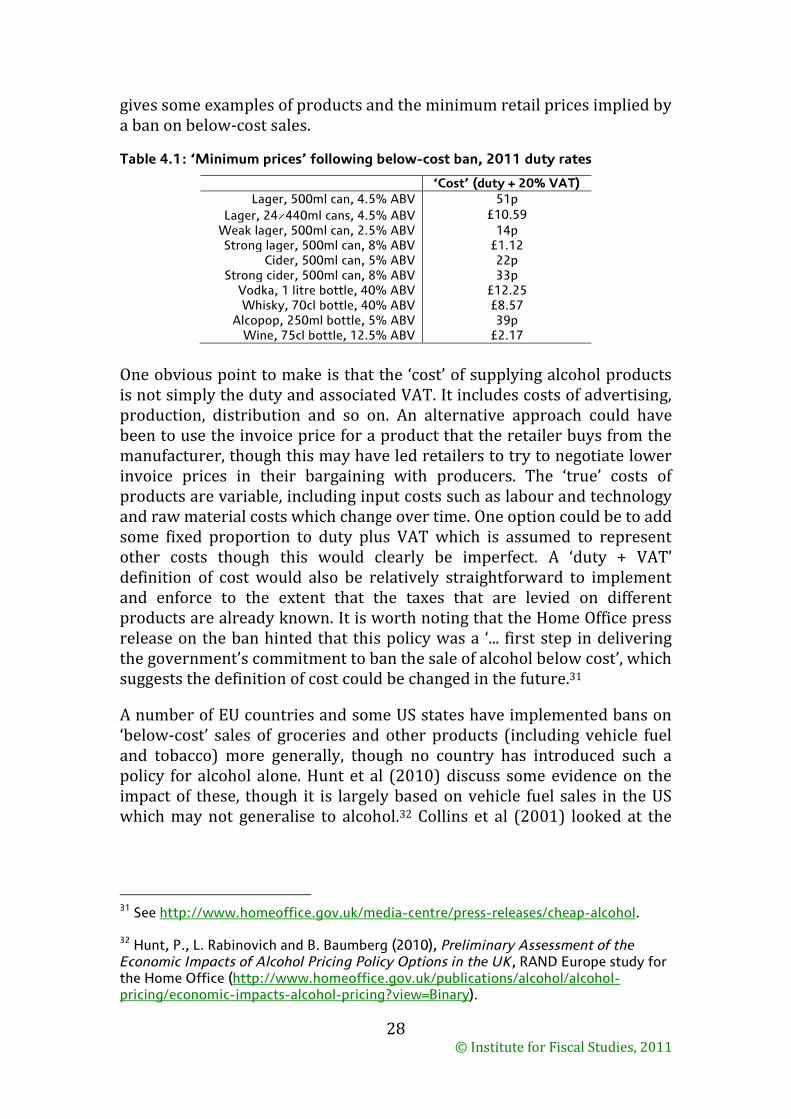
Assuming that ‘cost’ is taken to mean duty plus VAT, the proposed ban on ‘below-cost’ pricing will, in effect, introduce minimum prices for alcohol but at different levels according to the alcohol type and strength. Table 4.1
© Institute for Fiscal Studies, 2011
28
gives some examples of products and the minimum retail prices implied by a ban on below-cost sales.
Table 4.1: ‘Minimum prices’ following below-cost ban, 2011 duty rates
‘Cost’ (duty + 20% VAT)
Lager, 500ml can, 4.5% ABV 51p
Lager, 24 440ml cans, 4.5% ABV £10.59
Weak lager, 500ml can, 2.5% ABV 14p Strong lager, 500ml can, 8% ABV £1.12
Cider, 500ml can, 5% ABV 22p Strong cider, 500ml can, 8% ABV 33p
Vodka, 1 litre bottle, 40% ABV £12.25 Whisky, 70cl bottle, 40% ABV £8.57
Alcopop, 250ml bottle, 5% ABV 39p Wine, 75cl bottle, 12.5% ABV £2.17
One obvious point to make is that the ‘cost’ of supplying alcohol products is not simply the duty and associated VAT. It includes costs of advertising, production, distribution and so on. An alternative approach could have been to use the invoice price for a product that the retailer buys from the manufacturer, though this may have led retailers to try to negotiate lower invoice prices in their bargaining with producers. The ‘true’ costs of products are variable, including input costs such as labour and technology and raw material costs which change over time. One option could be to add some fixed proportion to duty plus VAT which is assumed to represent other costs though this would clearly be imperfect. A ‘duty + VAT’ definition of cost would also be relatively straightforward to implement and enforce to the extent that the taxes that are levied on different products are already known. It is worth noting that the Home Office press release on the ban hinted that this policy was a ‘... first step in delivering the government’s commitment to ban the sale of alcohol below cost’, which suggests the definition of cost could be changed in the future.31
A number of EU countries and some US states have implemented bans on ‘below-cost’ sales of groceries and other products (including vehicle fuel and tobacco) more generally, though no country has introduced such a policy for alcohol alone. Hunt et al (2010) discuss some evidence on the impact of these, though it is largely based on vehicle fuel sales in the US which may not generalise to alcohol.32 Collins et al (2001) looked at the
31 See http://www.homeoffice.gov.uk/media-centre/press-releases/cheap-alcohol.
32 Hunt, P., L. Rabinovich and B. Baumberg (2010), Preliminary Assessment of the Economic Impacts of Alcohol Pricing Policy Options in the UK, RAND Europe study for the Home Office (http://www.homeoffice.gov.uk/publications/alcohol/alcohol-pricing/economic-impacts-alcohol-pricing?view=Binary).
© Institute for Fiscal Studies, 2011
29
impact of an Irish ban on below-cost grocery selling from 1988 and concluded that it led to a rise in gross retailer margins.33
4.2 Overall impact and impact by retailer
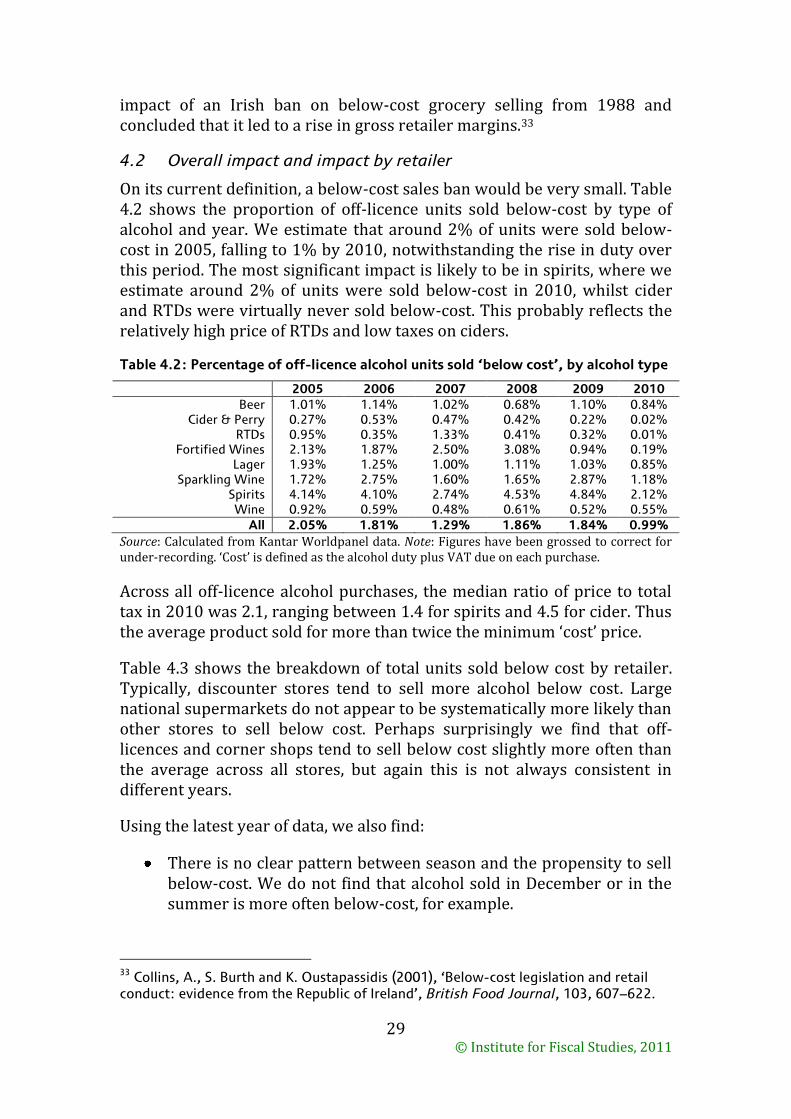
On its current definition, a below-cost sales ban would be very small. Table 4.2 shows the proportion of off-licence units sold below-cost by type of alcohol and year. We estimate that around 2% of units were sold below-cost in 2005, falling to 1% by 2010, notwithstanding the rise in duty over this period. The most significant impact is likely to be in spirits, where we estimate around 2% of units were sold below-cost in 2010, whilst cider and RTDs were virtually never sold below-cost. This probably reflects the relatively high price of RTDs and low taxes on ciders.
Table 4.2: Percentage of off-licence alcohol units sold ‘below cost’, by alcohol type
2005 2006 2007 2008 2009 2010
Beer 1.01% 1.14% 1.02% 0.68% 1.10% 0.84% Cider & Perry 0.27% 0.53% 0.47% 0.42% 0.22% 0.02%
RTDs 0.95% 0.35% 1.33% 0.41% 0.32% 0.01% Fortified Wines 2.13% 1.87% 2.50% 3.08% 0.94% 0.19%
Lager 1.93% 1.25% 1.00% 1.11% 1.03% 0.85% Sparkling Wine 1.72% 2.75% 1.60% 1.65% 2.87% 1.18%
Spirits 4.14% 4.10% 2.74% 4.53% 4.84% 2.12% Wine 0.92% 0.59% 0.48% 0.61% 0.52% 0.55%
All 2.05% 1.81% 1.29% 1.86% 1.84% 0.99%
Source: Calculated from Kantar Worldpanel data. Note: Figures have been grossed to correct for under-recording. ‘Cost’ is defined as the alcohol duty plus VAT due on each purchase.
Across all off-licence alcohol purchases, the median ratio of price to total tax in 2010 was 2.1, ranging between 1.4 for spirits and 4.5 for cider. Thus the average product sold for more than twice the minimum ‘cost’ price.
Table 4.3 shows the breakdown of total units sold below cost by retailer. Typically, discounter stores tend to sell more alcohol below cost. Large national supermarkets do not appear to be systematically more likely than other stores to sell below cost. Perhaps surprisingly we find that off-licences and corner shops tend to sell below cost slightly more often than the average across all stores, but again this is not always consistent in different years.
Using the latest year of data, we also find:
There is no clear pattern between season and the propensity to sell below-cost. We do not find that alcohol sold in December or in the summer is more often below-cost, for example.
33
Collins, A., S. Burth and K. Oustapassidis (2001), ‘Below-cost legislation and retail conduct: evidence from the Republic of Ireland’, British Food Journal, 103, 607–622.
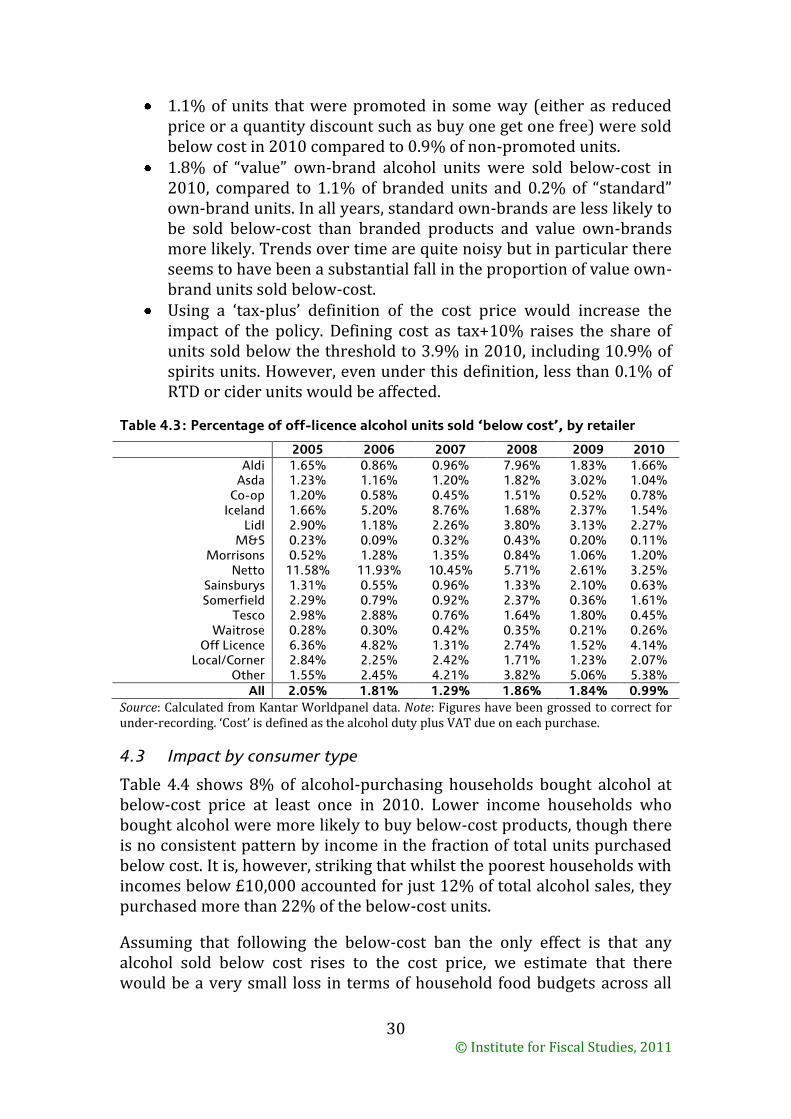
© Institute for Fiscal Studies, 2011
30
1.1% of units that were promoted in some way (either as reduced price or a quantity discount such as buy one get one free) were sold below cost in 2010 compared to 0.9% of non-promoted units.
1.8% of “value” own-brand alcohol units were sold below-cost in 2010, compared to 1.1% of branded units and 0.2% of “standard” own-brand units. In all years, standard own-brands are less likely to be sold below-cost than branded products and value own-brands more likely. Trends over time are quite noisy but in particular there seems to have been a substantial fall in the proportion of value own-brand units sold below-cost.
Using a ‘tax-plus’ definition of the cost price would increase the impact of the policy. Defining cost as tax+10% raises the share of units sold below the threshold to 3.9% in 2010, including 10.9% of spirits units. However, even under this definition, less than 0.1% of RTD or cider units would be affected.
Table 4.3: Percentage of off-licence alcohol units sold ‘below cost’, by retailer
2005 2006 2007 2008 2009 2010
Aldi 1.65% 0.86% 0.96% 7.96% 1.83% 1.66% Asda 1.23% 1.16% 1.20% 1.82% 3.02% 1.04%
Co-op 1.20% 0.58% 0.45% 1.51% 0.52% 0.78% Iceland 1.66% 5.20% 8.76% 1.68% 2.37% 1.54%
Lidl 2.90% 1.18% 2.26% 3.80% 3.13% 2.27% M&S 0.23% 0.09% 0.32% 0.43% 0.20% 0.11%
Morrisons 0.52% 1.28% 1.35% 0.84% 1.06% 1.20% Netto 11.58% 11.93% 10.45% 5.71% 2.61% 3.25%
Sainsburys 1.31% 0.55% 0.96% 1.33% 2.10% 0.63% Somerfield 2.29% 0.79% 0.92% 2.37% 0.36% 1.61%
Tesco 2.98% 2.88% 0.76% 1.64% 1.80% 0.45% Waitrose 0.28% 0.30% 0.42% 0.35% 0.21% 0.26%
Off Licence 6.36% 4.82% 1.31% 2.74% 1.52% 4.14% Local/Corner 2.84% 2.25% 2.42% 1.71% 1.23% 2.07%
Other 1.55% 2.45% 4.21% 3.82% 5.06% 5.38%
All 2.05% 1.81% 1.29% 1.86% 1.84% 0.99%
Source: Calculated from Kantar Worldpanel data. Note: Figures have been grossed to correct for under-recording. ‘Cost’ is defined as the alcohol duty plus VAT due on each purchase.
4.3 Impact by consumer type
Table 4.4 shows 8% of alcohol-purchasing households bought alcohol at below-cost price at least once in 2010. Lower income households who bought alcohol were more likely to buy below-cost products, though there is no consistent pattern by income in the fraction of total units purchased below cost. It is, however, striking that whilst the poorest households with incomes below £10,000 accounted for just 12% of total alcohol sales, they purchased more than 22% of the below-cost units.
Assuming that following the below-cost ban the only effect is that any alcohol sold below cost rises to the cost price, we estimate that there would be a very small loss in terms of household food budgets across all
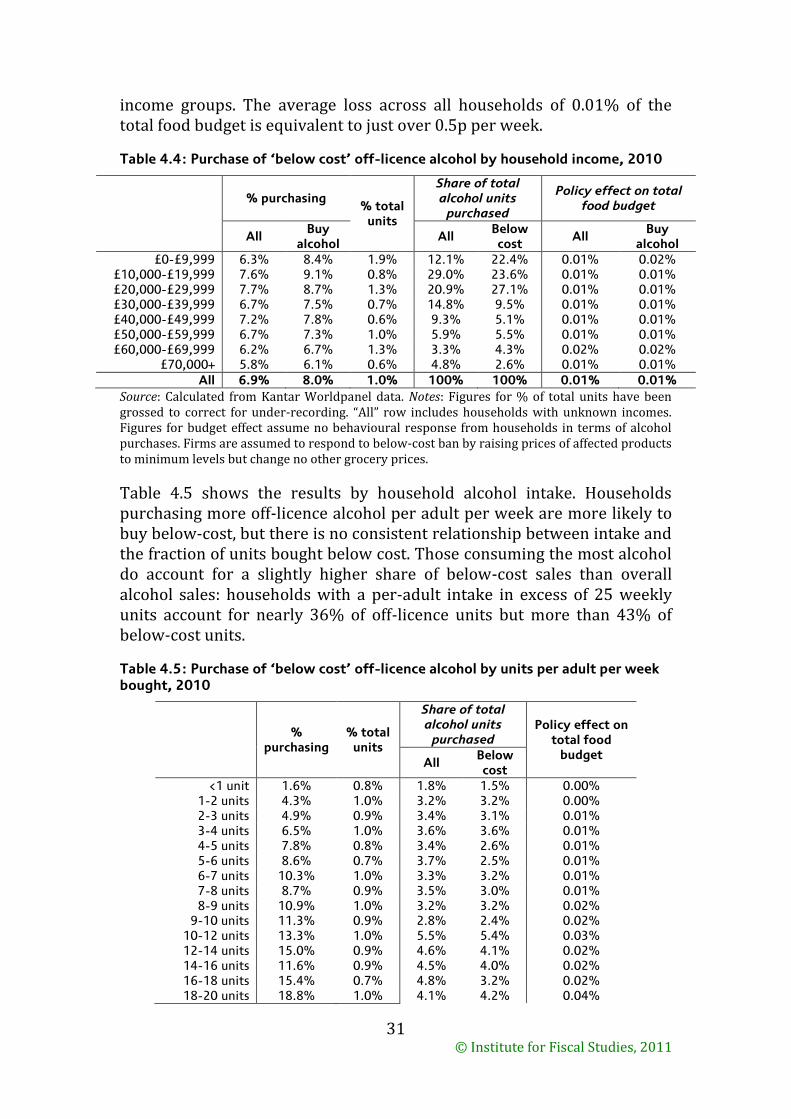
© Institute for Fiscal Studies, 2011
31
income groups. The average loss across all households of 0.01% of the total food budget is equivalent to just over 0.5p per week.
Table 4.4: Purchase of ‘below cost’ off-licence alcohol by household income, 2010
% purchasing
% total units
Share of total alcohol units
purchased
Policy effect on total food budget
All
Buy alcohol
All Below cost
All Buy
alcohol
£0-£9,999 6.3% 8.4% 1.9% 12.1% 22.4% 0.01% 0.02% £10,000-£19,999 7.6% 9.1% 0.8% 29.0% 23.6% 0.01% 0.01% £20,000-£29,999 7.7% 8.7% 1.3% 20.9% 27.1% 0.01% 0.01% £30,000-£39,999 6.7% 7.5% 0.7% 14.8% 9.5% 0.01% 0.01% £40,000-£49,999 7.2% 7.8% 0.6% 9.3% 5.1% 0.01% 0.01% £50,000-£59,999 6.7% 7.3% 1.0% 5.9% 5.5% 0.01% 0.01% £60,000-£69,999 6.2% 6.7% 1.3% 3.3% 4.3% 0.02% 0.02%
£70,000+ 5.8% 6.1% 0.6% 4.8% 2.6% 0.01% 0.01%
All 6.9% 8.0% 1.0% 100% 100% 0.01% 0.01%
Source: Calculated from Kantar Worldpanel data. Notes: Figures for % of total units have been grossed to correct for under-recording. “All” row includes households with unknown incomes. Figures for budget effect assume no behavioural response from households in terms of alcohol purchases. Firms are assumed to respond to below-cost ban by raising prices of affected products to minimum levels but change no other grocery prices.
Table 4.5 shows the results by household alcohol intake. Households purchasing more off-licence alcohol per adult per week are more likely to buy below-cost, but there is no consistent relationship between intake and the fraction of units bought below cost. Those consuming the most alcohol do account for a slightly higher share of below-cost sales than overall alcohol sales: households with a per-adult intake in excess of 25 weekly units account for nearly 36% of off-licence units but more than 43% of below-cost units.
Table 4.5: Purchase of ‘below cost’ off-licence alcohol by units per adult per week bought, 2010
% purchasing
% total units
Share of total alcohol units
purchased Policy effect on
total food budget
All Below cost
<1 unit 1.6% 0.8% 1.8% 1.5% 0.00% 1-2 units 4.3% 1.0% 3.2% 3.2% 0.00% 2-3 units 4.9% 0.9% 3.4% 3.1% 0.01% 3-4 units 6.5% 1.0% 3.6% 3.6% 0.01% 4-5 units 7.8% 0.8% 3.4% 2.6% 0.01% 5-6 units 8.6% 0.7% 3.7% 2.5% 0.01% 6-7 units 10.3% 1.0% 3.3% 3.2% 0.01% 7-8 units 8.7% 0.9% 3.5% 3.0% 0.01% 8-9 units 10.9% 1.0% 3.2% 3.2% 0.02%
9-10 units 11.3% 0.9% 2.8% 2.4% 0.02% 10-12 units 13.3% 1.0% 5.5% 5.4% 0.03% 12-14 units 15.0% 0.9% 4.6% 4.1% 0.02% 14-16 units 11.6% 0.9% 4.5% 4.0% 0.02% 16-18 units 15.4% 0.7% 4.8% 3.2% 0.02% 18-20 units 18.8% 1.0% 4.1% 4.2% 0.04%
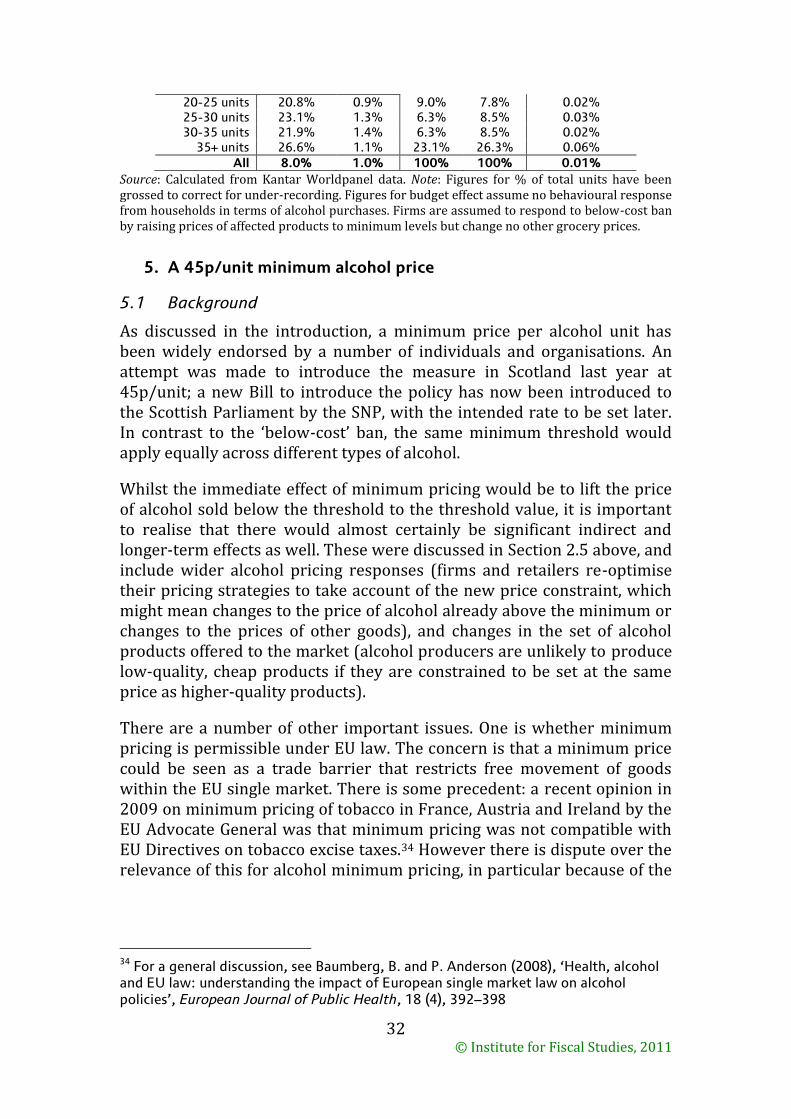
© Institute for Fiscal Studies, 2011
32
20-25 units 20.8% 0.9% 9.0% 7.8% 0.02% 25-30 units 23.1% 1.3% 6.3% 8.5% 0.03% 30-35 units 21.9% 1.4% 6.3% 8.5% 0.02%
35+ units 26.6% 1.1% 23.1% 26.3% 0.06%
All 8.0% 1.0% 100% 100% 0.01%
Source: Calculated from Kantar Worldpanel data. Note: Figures for % of total units have been grossed to correct for under-recording. Figures for budget effect assume no behavioural response from households in terms of alcohol purchases. Firms are assumed to respond to below-cost ban by raising prices of affected products to minimum levels but change no other grocery prices.
5. A 45p/unit minimum alcohol price
5.1 Background
As discussed in the introduction, a minimum price per alcohol unit has been widely endorsed by a number of individuals and organisations. An attempt was made to introduce the measure in Scotland last year at 45p/unit; a new Bill to introduce the policy has now been introduced to the Scottish Parliament by the SNP, with the intended rate to be set later. In contrast to the ‘below-cost’ ban, the same minimum threshold would apply equally across different types of alcohol.
Whilst the immediate effect of minimum pricing would be to lift the price of alcohol sold below the threshold to the threshold value, it is important to realise that there would almost certainly be significant indirect and longer-term effects as well. These were discussed in Section 2.5 above, and include wider alcohol pricing responses (firms and retailers re-optimise their pricing strategies to take account of the new price constraint, which might mean changes to the price of alcohol already above the minimum or changes to the prices of other goods), and changes in the set of alcohol products offered to the market (alcohol producers are unlikely to produce low-quality, cheap products if they are constrained to be set at the same price as higher-quality products).
There are a number of other important issues. One is whether minimum pricing is permissible under EU law. The concern is that a minimum price could be seen as a trade barrier that restricts free movement of goods within the EU single market. There is some precedent: a recent opinion in 2009 on minimum pricing of tobacco in France, Austria and Ireland by the EU Advocate General was that minimum pricing was not compatible with EU Directives on tobacco excise taxes.34 However there is dispute over the relevance of this for alcohol minimum pricing, in particular because of the
34 For a general discussion, see Baumberg, B. and P. Anderson (2008), ‘Health, alcohol and EU law: understanding the impact of European single market law on alcohol policies’, European Journal of Public Health, 18 (4), 392–398
© Institute for Fiscal Studies, 2011
33
possibility of appealing to public health interests which in some cases may override concerns about trade or conflicts with other Directives.35
There may also be concern about border effects. For example, minimum prices introduced across the UK could lead to cross-border shopping between Northern Ireland and the Irish Republic or England and France, and a policy introduced only in Scotland could have similar effects at the border with England.
There appear to be two main reasons for which a minimum price is often advocated in preference to increases in alcohol taxation: pass-through and a desire to focus policy on ‘problem’ drinkers rather than ‘moderate’ drinkers. Minimum pricing would appear to be most sensible if:
1. Increases in alcohol duties are not passed through to consumer prices for very cheap products.
2. The cheapest alcohols are those with the highest marginal external costs – that is, most often consumed by binge drinkers or those who consume the most alcohol.
3. Those who consume in moderation tend to buy products already costing more than the proposed minimum.
As discussed above, the empirical evidence tends to be that higher taxes are passed through (and possibly over-shifted) on average, but this may disguise variation in pass-through for different products and we know less about whether this happens. We would expect pass through to be higher for products where consumers are less price-sensitive. If very cheap products are bought by those who consume excess amounts of alcohol (and for whom evidence suggest price sensitivity is lower) then we might expect pass-through to be greater for cheap products. However if cheap products are bought by low-income households (who we might think are more price sensitive) or if there is a greater willingness for those who consume a lot to switch across brands and alcohol types when prices change, then we might expect pass-through to be lower for cheap products. More empirical evidence here would be useful.
What about the relationship between prices and ‘problem’ consumption? There is certainly evidence that those who drink the most pay lower prices. Figure 5.1 shows the average off-licence price per alcohol unit broken down by weekly units purchased per adult in 2010. There is a clear gradient: those buying more than 25 off-licence units per adult per week
35 For a summary, see http://www.shaap.org.uk/UserFiles/File/Minimum%20pricing%20campaign/SHAAPBriefNov09.pdf.
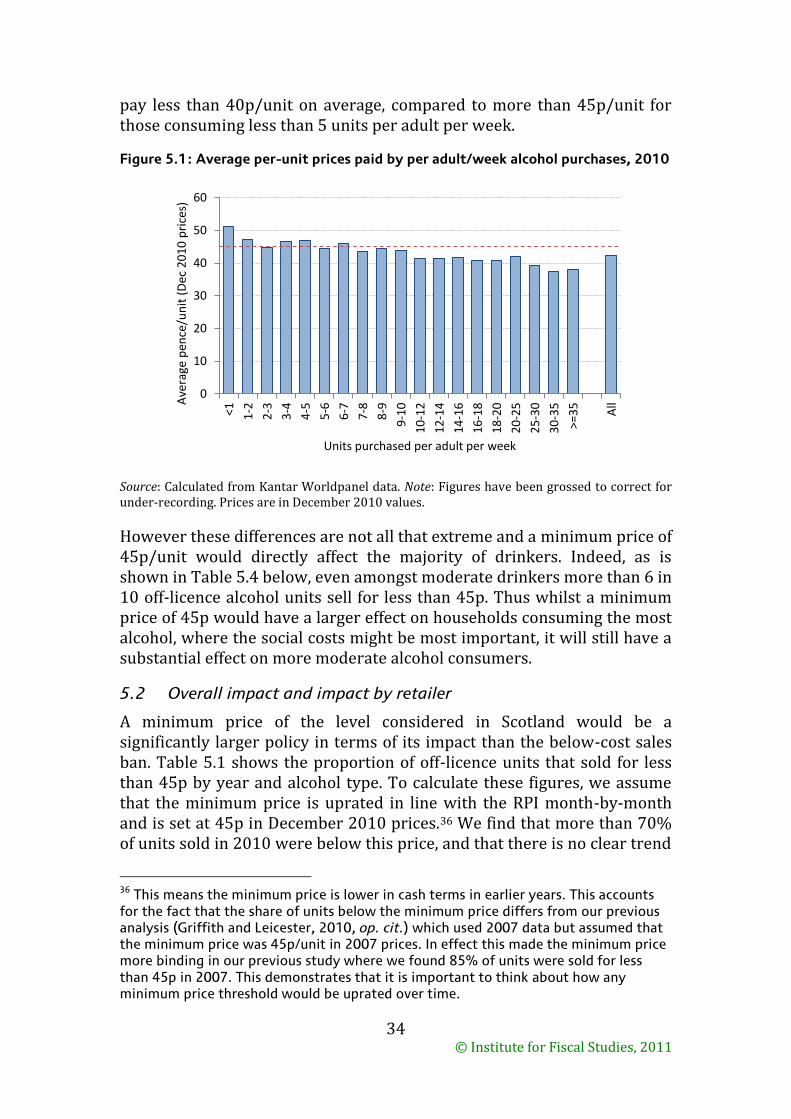
© Institute for Fiscal Studies, 2011
34
pay less than 40p/unit on average, compared to more than 45p/unit for those consuming less than 5 units per adult per week.
Figure 5.1: Average per-unit prices paid by per adult/week alcohol purchases, 2010
Source: Calculated from Kantar Worldpanel data. Note: Figures have been grossed to correct for under-recording. Prices are in December 2010 values.
However these differences are not all that extreme and a minimum price of 45p/unit would directly affect the majority of drinkers. Indeed, as is shown in Table 5.4 below, even amongst moderate drinkers more than 6 in 10 off-licence alcohol units sell for less than 45p. Thus whilst a minimum price of 45p would have a larger effect on households consuming the most alcohol, where the social costs might be most important, it will still have a substantial effect on more moderate alcohol consumers.
5.2 Overall impact and impact by retailer
A minimum price of the level considered in Scotland would be a significantly larger policy in terms of its impact than the below-cost sales ban. Table 5.1 shows the proportion of off-licence units that sold for less than 45p by year and alcohol type. To calculate these figures, we assume that the minimum price is uprated in line with the RPI month-by-month and is set at 45p in December 2010 prices.36 We find that more than 70% of units sold in 2010 were below this price, and that there is no clear trend
36 This means the minimum price is lower in cash terms in earlier years. This accounts for the fact that the share of units below the minimum price differs from our previous analysis (Griffith and Leicester, 2010, op. cit.) which used 2007 data but assumed that the minimum price was 45p/unit in 2007 prices. In effect this made the minimum price more binding in our previous study where we found 85% of units were sold for less than 45p in 2007. This demonstrates that it is important to think about how any minimum price threshold would be uprated over time.
0
10
20
30
40
50
60
<1
1-2
2-3
3-4
4-5
5-6
6-7
7-8
8-9
9-1
0
10
-12
12
-14
14
-16
16
-18
18
-20
20
-25
25
-30
30
-35
>=3
5
All A
vera
ge p
ence
/un
it (
Dec
20
10
pri
ces)
Units purchased per adult per week
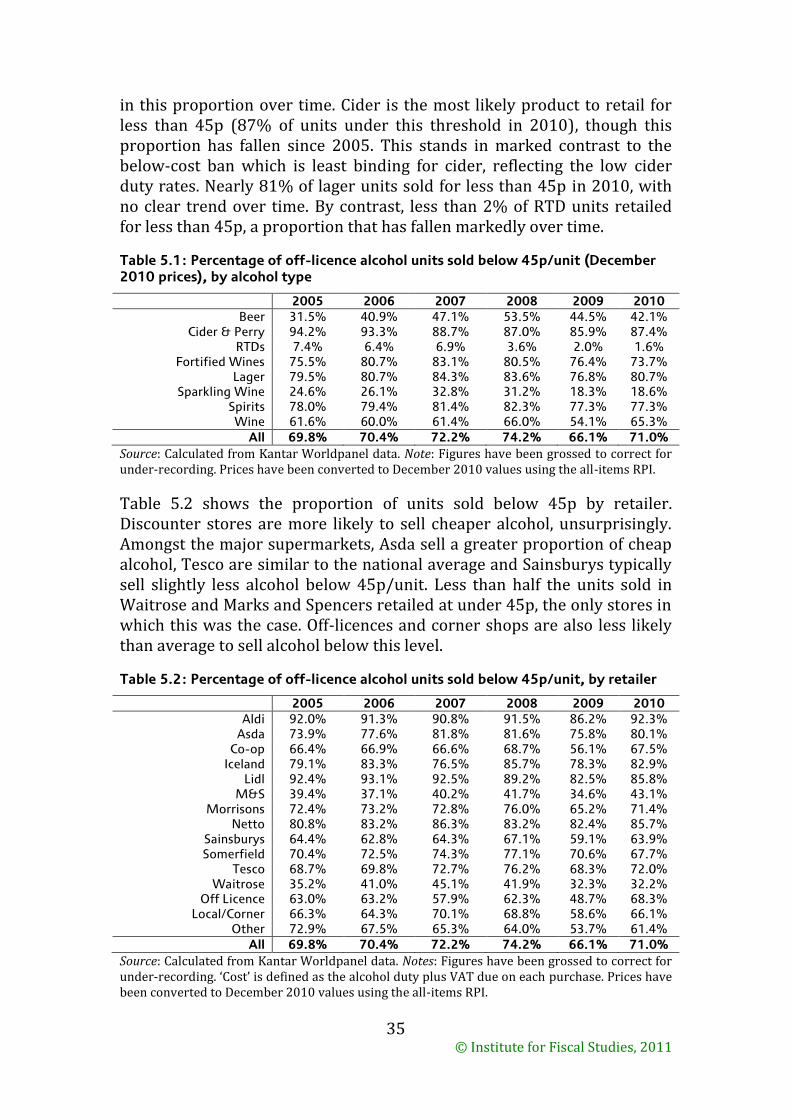
© Institute for Fiscal Studies, 2011
35
in this proportion over time. Cider is the most likely product to retail for less than 45p (87% of units under this threshold in 2010), though this proportion has fallen since 2005. This stands in marked contrast to the below-cost ban which is least binding for cider, reflecting the low cider duty rates. Nearly 81% of lager units sold for less than 45p in 2010, with no clear trend over time. By contrast, less than 2% of RTD units retailed for less than 45p, a proportion that has fallen markedly over time.
Table 5.1: Percentage of off-licence alcohol units sold below 45p/unit (December 2010 prices), by alcohol type
2005 2006 2007 2008 2009 2010
Beer 31.5% 40.9% 47.1% 53.5% 44.5% 42.1% Cider & Perry 94.2% 93.3% 88.7% 87.0% 85.9% 87.4%
RTDs 7.4% 6.4% 6.9% 3.6% 2.0% 1.6% Fortified Wines 75.5% 80.7% 83.1% 80.5% 76.4% 73.7%
Lager 79.5% 80.7% 84.3% 83.6% 76.8% 80.7% Sparkling Wine 24.6% 26.1% 32.8% 31.2% 18.3% 18.6%
Spirits 78.0% 79.4% 81.4% 82.3% 77.3% 77.3% Wine 61.6% 60.0% 61.4% 66.0% 54.1% 65.3%
All 69.8% 70.4% 72.2% 74.2% 66.1% 71.0%
Source: Calculated from Kantar Worldpanel data. Note: Figures have been grossed to correct for under-recording. Prices have been converted to December 2010 values using the all-items RPI.
Table 5.2 shows the proportion of units sold below 45p by retailer. Discounter stores are more likely to sell cheaper alcohol, unsurprisingly. Amongst the major supermarkets, Asda sell a greater proportion of cheap alcohol, Tesco are similar to the national average and Sainsburys typically sell slightly less alcohol below 45p/unit. Less than half the units sold in Waitrose and Marks and Spencers retailed at under 45p, the only stores in which this was the case. Off-licences and corner shops are also less likely than average to sell alcohol below this level.
Table 5.2: Percentage of off-licence alcohol units sold below 45p/unit, by retailer
2005 2006 2007 2008 2009 2010
Aldi 92.0% 91.3% 90.8% 91.5% 86.2% 92.3% Asda 73.9% 77.6% 81.8% 81.6% 75.8% 80.1%
Co-op 66.4% 66.9% 66.6% 68.7% 56.1% 67.5% Iceland 79.1% 83.3% 76.5% 85.7% 78.3% 82.9%
Lidl 92.4% 93.1% 92.5% 89.2% 82.5% 85.8% M&S 39.4% 37.1% 40.2% 41.7% 34.6% 43.1%
Morrisons 72.4% 73.2% 72.8% 76.0% 65.2% 71.4% Netto 80.8% 83.2% 86.3% 83.2% 82.4% 85.7%
Sainsburys 64.4% 62.8% 64.3% 67.1% 59.1% 63.9% Somerfield 70.4% 72.5% 74.3% 77.1% 70.6% 67.7%
Tesco 68.7% 69.8% 72.7% 76.2% 68.3% 72.0% Waitrose 35.2% 41.0% 45.1% 41.9% 32.3% 32.2%
Off Licence 63.0% 63.2% 57.9% 62.3% 48.7% 68.3% Local/Corner 66.3% 64.3% 70.1% 68.8% 58.6% 66.1%
Other 72.9% 67.5% 65.3% 64.0% 53.7% 61.4%
All 69.8% 70.4% 72.2% 74.2% 66.1% 71.0%
Source: Calculated from Kantar Worldpanel data. Notes: Figures have been grossed to correct for under-recording. ‘Cost’ is defined as the alcohol duty plus VAT due on each purchase. Prices have been converted to December 2010 values using the all-items RPI.
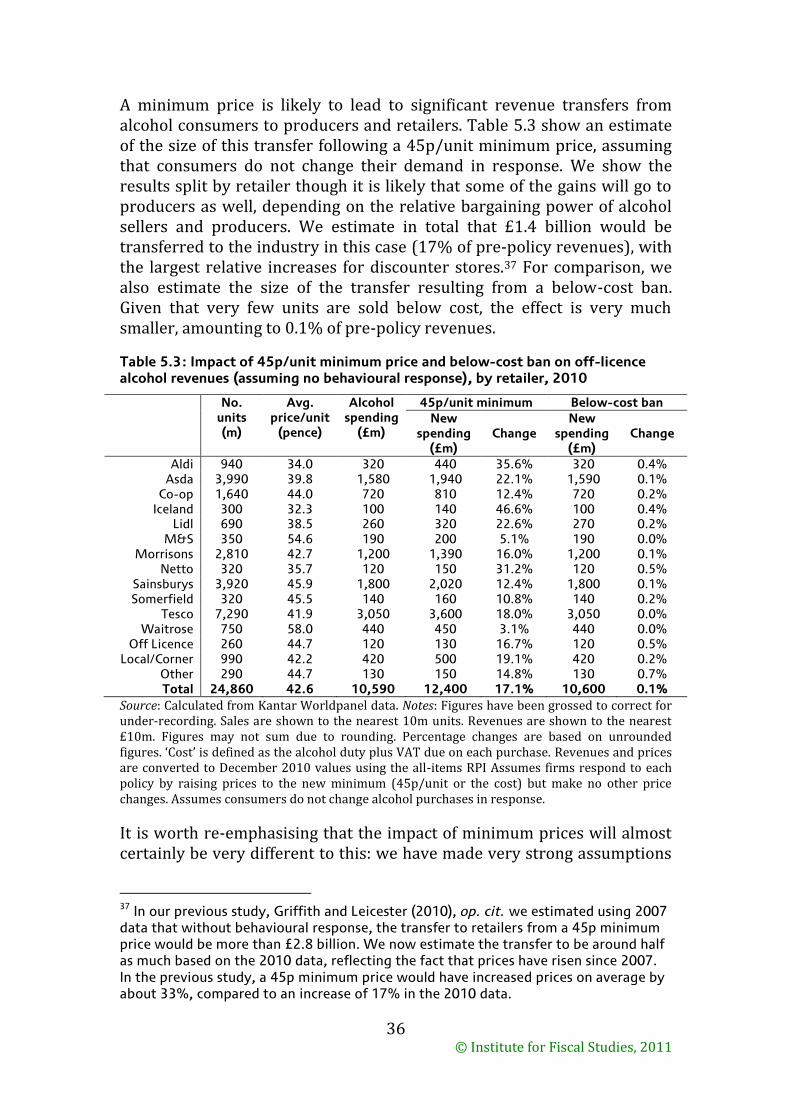
© Institute for Fiscal Studies, 2011
36
A minimum price is likely to lead to significant revenue transfers from alcohol consumers to producers and retailers. Table 5.3 show an estimate of the size of this transfer following a 45p/unit minimum price, assuming that consumers do not change their demand in response. We show the results split by retailer though it is likely that some of the gains will go to producers as well, depending on the relative bargaining power of alcohol sellers and producers. We estimate in total that £1.4 billion would be transferred to the industry in this case (17% of pre-policy revenues), with the largest relative increases for discounter stores.37 For comparison, we also estimate the size of the transfer resulting from a below-cost ban. Given that very few units are sold below cost, the effect is very much smaller, amounting to 0.1% of pre-policy revenues.
Table 5.3: Impact of 45p/unit minimum price and below-cost ban on off-licence alcohol revenues (assuming no behavioural response), by retailer, 2010
No. units (m)
Avg. price/unit
(pence)
Alcohol spending
(£m)
45p/unit minimum Below-cost ban
New
spending (£m)
Change New
spending (£m)
Change
Aldi 940 34.0 320 440 35.6% 320 0.4% Asda 3,990 39.8 1,580 1,940 22.1% 1,590 0.1%
Co-op 1,640 44.0 720 810 12.4% 720 0.2% Iceland 300 32.3 100 140 46.6% 100 0.4%
Lidl 690 38.5 260 320 22.6% 270 0.2% M&S 350 54.6 190 200 5.1% 190 0.0%
Morrisons 2,810 42.7 1,200 1,390 16.0% 1,200 0.1% Netto 320 35.7 120 150 31.2% 120 0.5%
Sainsburys 3,920 45.9 1,800 2,020 12.4% 1,800 0.1% Somerfield 320 45.5 140 160 10.8% 140 0.2%
Tesco 7,290 41.9 3,050 3,600 18.0% 3,050 0.0% Waitrose 750 58.0 440 450 3.1% 440 0.0%
Off Licence 260 44.7 120 130 16.7% 120 0.5% Local/Corner 990 42.2 420 500 19.1% 420 0.2%
Other 290 44.7 130 150 14.8% 130 0.7% Total 24,860 42.6 10,590 12,400 17.1% 10,600 0.1%
Source: Calculated from Kantar Worldpanel data. Notes: Figures have been grossed to correct for under-recording. Sales are shown to the nearest 10m units. Revenues are shown to the nearest £10m. Figures may not sum due to rounding. Percentage changes are based on unrounded figures. ‘Cost’ is defined as the alcohol duty plus VAT due on each purchase. Revenues and prices are converted to December 2010 values using the all-items RPI Assumes firms respond to each policy by raising prices to the new minimum (45p/unit or the cost) but make no other price changes. Assumes consumers do not change alcohol purchases in response.
It is worth re-emphasising that the impact of minimum prices will almost certainly be very different to this: we have made very strong assumptions
37 In our previous study, Griffith and Leicester (2010), op. cit. we estimated using 2007 data that without behavioural response, the transfer to retailers from a 45p minimum price would be more than £2.8 billion. We now estimate the transfer to be around half as much based on the 2010 data, reflecting the fact that prices have risen since 2007. In the previous study, a 45p minimum price would have increased prices on average by about 33%, compared to an increase of 17% in the 2010 data.
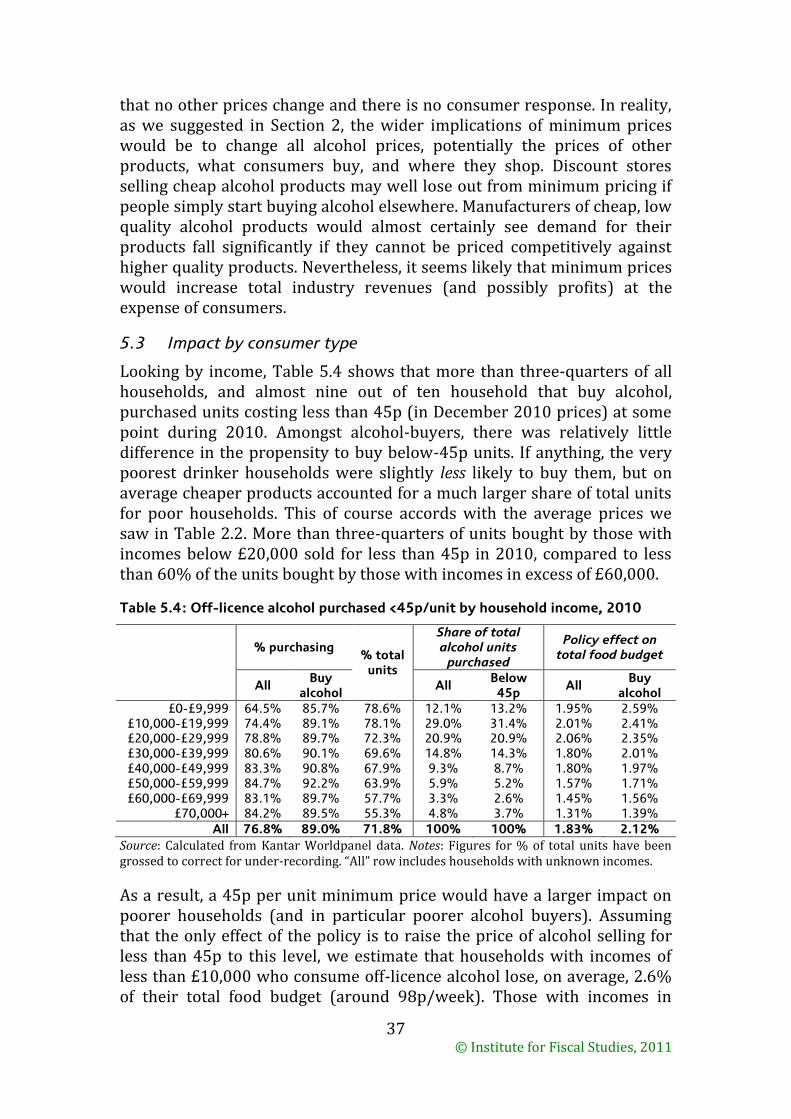
© Institute for Fiscal Studies, 2011
37
that no other prices change and there is no consumer response. In reality, as we suggested in Section 2, the wider implications of minimum prices would be to change all alcohol prices, potentially the prices of other products, what consumers buy, and where they shop. Discount stores selling cheap alcohol products may well lose out from minimum pricing if people simply start buying alcohol elsewhere. Manufacturers of cheap, low quality alcohol products would almost certainly see demand for their products fall significantly if they cannot be priced competitively against higher quality products. Nevertheless, it seems likely that minimum prices would increase total industry revenues (and possibly profits) at the expense of consumers.
5.3 Impact by consumer type
Looking by income, Table 5.4 shows that more than three-quarters of all households, and almost nine out of ten household that buy alcohol, purchased units costing less than 45p (in December 2010 prices) at some point during 2010. Amongst alcohol-buyers, there was relatively little difference in the propensity to buy below-45p units. If anything, the very poorest drinker households were slightly less likely to buy them, but on average cheaper products accounted for a much larger share of total units for poor households. This of course accords with the average prices we saw in Table 2.2. More than three-quarters of units bought by those with incomes below £20,000 sold for less than 45p in 2010, compared to less than 60% of the units bought by those with incomes in excess of £60,000.
Table 5.4: Off-licence alcohol purchased <45p/unit by household income, 2010
% purchasing
% total units
Share of total alcohol units
purchased
Policy effect on total food budget
All
Buy alcohol
All Below 45p
All Buy
alcohol
£0-£9,999 64.5% 85.7% 78.6% 12.1% 13.2% 1.95% 2.59% £10,000-£19,999 74.4% 89.1% 78.1% 29.0% 31.4% 2.01% 2.41% £20,000-£29,999 78.8% 89.7% 72.3% 20.9% 20.9% 2.06% 2.35% £30,000-£39,999 80.6% 90.1% 69.6% 14.8% 14.3% 1.80% 2.01% £40,000-£49,999 83.3% 90.8% 67.9% 9.3% 8.7% 1.80% 1.97% £50,000-£59,999 84.7% 92.2% 63.9% 5.9% 5.2% 1.57% 1.71% £60,000-£69,999 83.1% 89.7% 57.7% 3.3% 2.6% 1.45% 1.56%
£70,000+ 84.2% 89.5% 55.3% 4.8% 3.7% 1.31% 1.39%
All 76.8% 89.0% 71.8% 100% 100% 1.83% 2.12%
Source: Calculated from Kantar Worldpanel data. Notes: Figures for % of total units have been grossed to correct for under-recording. “All” row includes households with unknown incomes.
As a result, a 45p per unit minimum price would have a larger impact on poorer households (and in particular poorer alcohol buyers). Assuming that the only effect of the policy is to raise the price of alcohol selling for less than 45p to this level, we estimate that households with incomes of less than £10,000 who consume off-licence alcohol lose, on average, 2.6% of their total food budget (around 98p/week). Those with incomes in
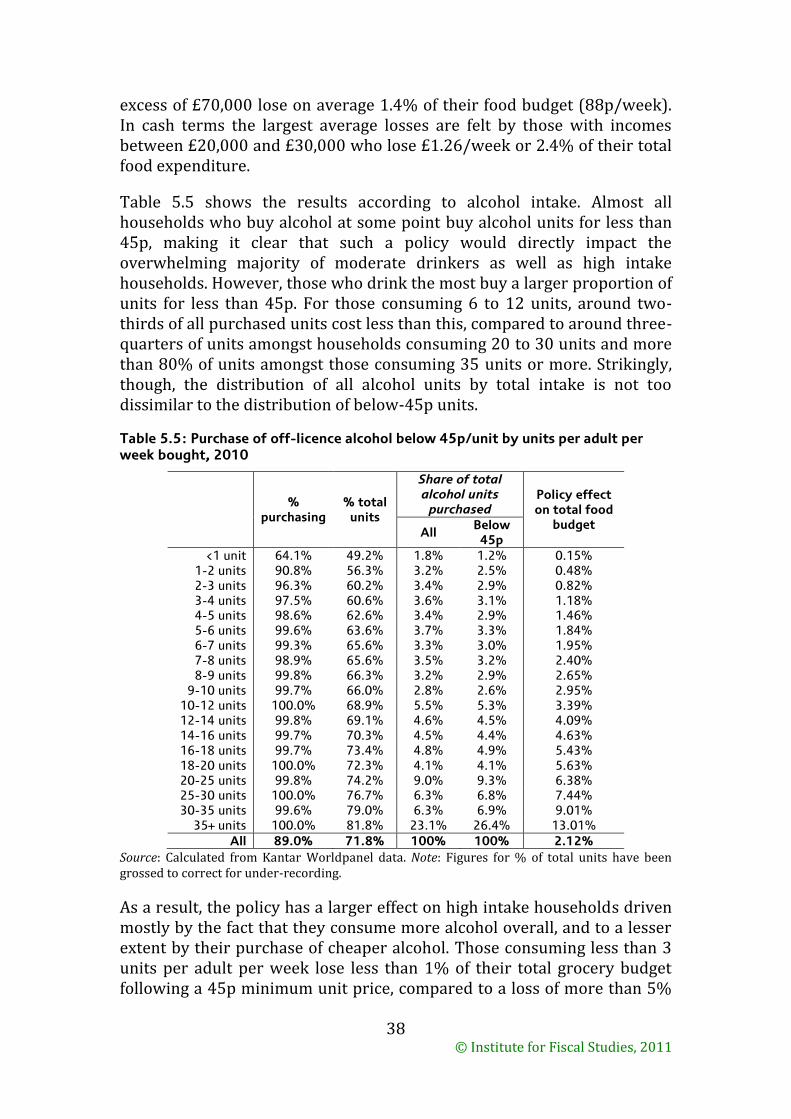
© Institute for Fiscal Studies, 2011
38
excess of £70,000 lose on average 1.4% of their food budget (88p/week). In cash terms the largest average losses are felt by those with incomes between £20,000 and £30,000 who lose £1.26/week or 2.4% of their total food expenditure.
Table 5.5 shows the results according to alcohol intake. Almost all households who buy alcohol at some point buy alcohol units for less than 45p, making it clear that such a policy would directly impact the overwhelming majority of moderate drinkers as well as high intake households. However, those who drink the most buy a larger proportion of units for less than 45p. For those consuming 6 to 12 units, around two-thirds of all purchased units cost less than this, compared to around three-quarters of units amongst households consuming 20 to 30 units and more than 80% of units amongst those consuming 35 units or more. Strikingly, though, the distribution of all alcohol units by total intake is not too dissimilar to the distribution of below-45p units.
Table 5.5: Purchase of off-licence alcohol below 45p/unit by units per adult per week bought, 2010
% purchasing
% total units
Share of total alcohol units
purchased Policy effect on total food
budget All
Below 45p
<1 unit 64.1% 49.2% 1.8% 1.2% 0.15% 1-2 units 90.8% 56.3% 3.2% 2.5% 0.48% 2-3 units 96.3% 60.2% 3.4% 2.9% 0.82% 3-4 units 97.5% 60.6% 3.6% 3.1% 1.18% 4-5 units 98.6% 62.6% 3.4% 2.9% 1.46% 5-6 units 99.6% 63.6% 3.7% 3.3% 1.84% 6-7 units 99.3% 65.6% 3.3% 3.0% 1.95% 7-8 units 98.9% 65.6% 3.5% 3.2% 2.40% 8-9 units 99.8% 66.3% 3.2% 2.9% 2.65%
9-10 units 99.7% 66.0% 2.8% 2.6% 2.95% 10-12 units 100.0% 68.9% 5.5% 5.3% 3.39% 12-14 units 99.8% 69.1% 4.6% 4.5% 4.09% 14-16 units 99.7% 70.3% 4.5% 4.4% 4.63% 16-18 units 99.7% 73.4% 4.8% 4.9% 5.43% 18-20 units 100.0% 72.3% 4.1% 4.1% 5.63% 20-25 units 99.8% 74.2% 9.0% 9.3% 6.38% 25-30 units 100.0% 76.7% 6.3% 6.8% 7.44% 30-35 units 99.6% 79.0% 6.3% 6.9% 9.01%
35+ units 100.0% 81.8% 23.1% 26.4% 13.01%
All 89.0% 71.8% 100% 100% 2.12%
Source: Calculated from Kantar Worldpanel data. Note: Figures for % of total units have been grossed to correct for under-recording.
As a result, the policy has a larger effect on high intake households driven mostly by the fact that they consume more alcohol overall, and to a lesser extent by their purchase of cheaper alcohol. Those consuming less than 3 units per adult per week lose less than 1% of their total grocery budget following a 45p minimum unit price, compared to a loss of more than 5%
© Institute for Fiscal Studies, 2011
39
for those consuming more than 16 weekly units and 13% for those consuming more than 35 units. In cash terms, the loss for this group exceeds £8.40/week on average. The average cash loss is more than £1/week for all groups consuming at least 7 units per adult per week.
6 Conclusions
How alcohol should be taxed and priced is clearly an active area of policy. Whilst decisions on alcohol tax rates are still made at the central government level, it seems clear that significant regional variation in pricing policy is imminent, with Scottish proposals for a minimum per-unit price now having majority support in the Scottish Parliament and a ban on below-cost alcohol sales set to be introduced in England and Wales.
Attention is also being paid not just to the level of alcohol taxes, but also their structure, with higher duty on strong beer and lower duty on weak beers coming into force this month. Higher taxes do appear to translate into consumer prices, which have risen since 2008 when the most recent alcohol tax escalator was introduced. It would be sensible to consider the structure of alcohol taxes more fundamentally than the reform of beer duty. This reform brings a little more consistency to the tax treatment of different alcohol types, but there remains significant variation in the implied duty rate per alcohol unit across types and strengths of alcohol. For example, the decision to raise duty on strong beer but maintain low duty rates on strong cider means the reform may at least partly encourage product switching rather than a reduction in the strength of alcohol purchased. At least in the absence of convincing evidence that such variation is optimal, a starting point would be to treat all alcohols equally in the tax system, and the Government should seek changes at the EU level to allow this to happen.
The restructuring of beer duty and the proposed ban on below-cost sales (defined as duty plus VAT) are both small policies in terms of their likely effects. Strong and weak beers as defined for duty purposes together account for about 1% of all off-licence alcohol units and less than 5% of beer units. Poorer households are more likely to buy weak beers, but the overall distributional implications are very insignificant. The change will hit those households who consume the most off-licence alcohol harder: households who buy in excess of 35 units per adult per week account for 23% of all alcohol units but more than half of the strong beer units sold. More important are the long-term incentives for manufacturers to introduce lower-strength products to the market – weaker beers are predominantly store own-brands at the moment.
A ban on below-cost sales would introduce de facto minimum prices which vary by alcohol type and strength. The rates on this definition are low, and
© Institute for Fiscal Studies, 2011
40
impact only around 1% of off-licence units, most notably cheaper sparkling wines and spirits. Cider and alcopops are largely unaffected: the former because the cost-price is so low given the low duty rate, the latter because prices of alcopops are higher than other alcohol types per unit. A ban on below-cost sales would tend to affect discount supermarkets and local stores and off-licences most heavily. Poorer households are more likely to buy very cheap, below-cost alcohol, but the distributional consequences are very minor given the overall size of the policy. Again, the longer-term implications are perhaps most interesting, whether the definition of cost might change into something more binding – perhaps cost plus some fixed amount – later.
A minimum price per alcohol unit is a much bigger policy. Set at 45p/unit, it could affect more than 7 in 10 alcohol units sold off-licence, with a particularly large impact on low-income alcohol consumers and those purchasing large amounts of alcohol as both groups tend to pay lower prices. Without question, though, minimum pricing would have important implications for alcohol consumers, producers and retailers, and understanding them requires more detailed modelling of the likely effects than is currently available. There also remains some considerable uncertainty about the legal implications of minimum pricing.
We estimate that a minimum price could transfer significant sums from alcohol consumers to the alcohol industry. A restructured system of alcohol taxation might well be a preferable way to raise prices. Alcohol taxes could not easily mimic minimum pricing perfectly. Increased taxes apply to all products whereas the direct impact of minimum pricing would only be on cheaper products – though as we make clear, at 45p a unit a minimum price would extend a long way up the off-licence price distribution. However a clear advantage of taxes over minimum pricing is that the revenues flow from drinkers to the government, rather than to firms. If alcohol duties could be restructured so that they depended on alcohol content for all types of drink, then a ‘minimum price per unit’ could be set more directly through the tax system (certainly if the proposed ban on below duty sales remained in place and assuming that the duty rate were equalised across alcohol types). In the absence of this reform, it would at least seem sensible to try and equalise the treatment of different alcohols within the existing tax structure as closely as possible.


![ESRC Report [English]](https://img.dokumen.tips/doc/110x75/577d1fa91a28ab4e1e910c34/esrc-report-english.jpg)


![Index [ifs.org.uk]](https://img.dokumen.tips/doc/110x75/621c50a39561082b99290f64/index-ifsorguk.jpg)


![[ESRC][K55]TankGame Project](https://img.dokumen.tips/doc/110x75/577cd6c01a28ab9e789d27bf/esrck55tankgame-project.jpg)


