Embed Size (px)
Citation preview
Contents
Copy goes here
Derisking Renewable Energy Investment
Book Title
c
DEFINITIONS
Nam ipsum mauris
Dapibus et tristique ac, consectetur ac nunc. Fusce pulvinar eros in libero eleif end sodales fringilla risus lobor ryul tis. Duis ullamcorper laoreet sapien faucibus tincidunt.
Aliquam sit amet pelitu lentesque nunc. Sed eut mauris tellus, et eleifend urna. Fusce ultricies trey vehicula mauris pulvinar ullamcorper.
Derisking Renewable Energy Investment
A Framework to Support Policymakers in Selecting Public Instruments to Promote Renewable Energy Investment in Developing Countries

UNDP partners with people at all levels of society to help build nations that can withstand crisis, and drive and sustain the kind of growth that improves the quality of life for everyone. On the ground in 177 countries and territories, we offer global perspective and local insight to help empower lives and build resilient nations.
UNDP’s Energy, Infrastructure, Transport and Technology (EITT) team focuses on clean and affordable energy development; low-emission, climate-resilient urban and transport infrastructure; and access to new financing mechanisms.
United Nations Development Programme 304 East 45th Street New York, NY 10017 USA www.undp.org
Authors: Oliver Waissbein (UNDP), Yannick Glemarec (UNDP), Hande Bayraktar (consultant) and Tobias. S. Schmidt (consultant)
UNDP reviewers and contributors: Marcel Alers, Manuel Soriano, Rakshya Thapa, Robert Kelly, Lucas Black, Oliver Page, Marina Olshanskaya, Raúl Alfaro-Pelico, John O’Brien and Kyle Lee (intern)
External reviewers: Chizuru Aoki, Catharina Bening, Hans Olav Ibrekk, Monique Koning, Wolfgang Mostert, Wilson Rickerson and Nelson Sam
Acknowledgments: UNDP would like to acknowledge the important contribution of Hande Bayraktar and Tobias S. Schmidt to this publication. The authors would also like to thank the wind energy investors, developers and stakeholders in Kenya, Mongolia, Panama and South Africa who participated in interviews for the illustrative modelling exercise. Finally, the authors would like to express their gratitude to all the external expert reviewers for their valuable comments and inputs.
This publication builds on a series of prior research. This includes Transforming On-Grid Renewable Energy Markets (Glemarec et al., 2012), which synthesises UNDP’s experiences with renewable energy market transformation projects, as well as GET FiT Plus (DB Climate Change Advisors, 2011), a research partnership with Deutsche Bank on feed-in tariffs. The authors hereby acknowledge the valuable foundations laid by these two reports.
This report should be referenced as: Waissbein, O., Glemarec, Y., Bayraktar, H., & Schmidt, T.S., (2013). Derisking Renewable Energy Investment. A Framework to Support Policymakers in Selecting Public Instruments to Promote Renewable Energy Investment in Developing Countries. New York, NY: United Nations Development Programme
Editor: Ton Koster
Design: Camilo J. Salomón ([email protected], www.benedictodesign.com)
March 2013, New York
DEFINITIONS
Nam ipsum mauris
Dapibus et tristique ac, consectetur ac nunc. Fusce pulvinar eros in libero eleif end sodales fringilla risus lobor ryul tis. Duis ullamcorper laoreet sapien faucibus tincidunt.
Aliquam sit amet pelitu lentesque nunc. Sed eut mauris tellus, et eleifend urna. Fusce ultricies trey vehicula mauris pulvinar ullamcorper.
1
Figures, Tables and Boxes 2
Acronyms 6
Foreword 8
Executive Summary 11
Introduction 28
1. The Role of Public Instruments in Reducing Financing 31 Costs for Renewable Energy in Developing Countries 1.1 High Financing Costs for Renewable Energy 31
1.2 The Role of Public Instruments in Reducing Financing Costs 35
1.3 Challenges to Identifying an Appropriate Public Instrument Mix 38
2. A Framework to Select Public Instruments to Promote 43 Renewable Energy Investment 2.1 Stage 1: Risk Environment 46
2.2 Stage 2: Public Instruments 55
2.3 Stage 3: Levelised Cost 67
2.4 Stage 4: Evaluation 75
3. Illustrative Country Case Studies 79 3.1 Approach to the Modelling Exercise 79
3.2 Country Results for South Africa 88
3.3 Country Results for Panama 96
3.4 Country Results for Mongolia 103
3.5 Country Results for Kenya 112
4. Implications for Public Finance of Scaling-Up Renewable Energy 121 4.1 Public Finance Effectiveness to Transform Renewable Energy Markets 121
4.2 Public Finance Efficiency to Transform Renewable Energy Markets 123
4.3 The Distributional Impact of Renewable Energy Policies 125
4.4 Scaled-up Climate Change Mitigation Outcomes 127
Conclusion 131
Annexes 135 A. Methodology and Data for the Illustrative Modelling Exercise 135
B. References 147
Table of Contents
Derisking Renewable Energy Investment

Contents
Copy goes hereNulla ut nisl etly neque lobortis islu
egestas sit amet quis consectetur ac nunc.
FVivamu nisi mi felis, tincidun non blandit
vestibu luma.
2
FIGURESExecutive SummaryFigure 1: Impact of financing costs on wind and gas power generation costs in developed and
developing countriesFigure 2: Shifting the risk-reward profile of renewable energy projectsFigure 3: Public instrument selection for large-scale renewable energyFigure 4: Public derisking instruments can reduce financing costs of renewable energy investmentsFigure 5: Overview of the framework to select public instruments to promote renewable
energy investmentFigure 6: The four country case studies and their illustrative combinations of public instruments Figure 7: Illustrative modelling exercise for Kenya (Wind, 1GW): selected resultsFigure 8: Scaled-up mitigation actions blending derisking instruments and performance-based
payments
IntroductionFigure 9: Investments in clean energy by type of countries (USD billions)
Chapter 1Figure 10: The core drivers of the LCOE Figure 11: The different capital intensity of electricity production from wind energy and combined
cycle gasFigure 12: Impact of financing costs on wind and gas power generation costs in developed and
developing countriesFigure 13: Shifting the risk-reward profile of renewable energy investmentFigure 14: Public instrument selection for large-scale renewable energy
Chapter 2Figure 15: Public derisking instruments can reduce financing costs of renewable energy investmentsFigure 16: Overview of the framework to support policymakers in selecting public instruments to
promote renewable energy investmentFigure 17: Overview of Stage 1: Risk EnvironmentFigure 18: Drivers and components of investor risk for renewable energy investmentFigure 19: Illustrative financing cost waterfall quantifying the impact of risks on increasing
financing costsFigure 20: Interview questions to quantify the impact of risk categories on the cost of equity and debtFigure 21: Illustrative simplified application of the methodology to determine the impact of risk
categories on increasing financing costsFigure 22: Overview of Stage 2: Public InstrumentsFigure 23: The effects of policy and financial derisking on investor riskFigure 24: Illustrative post-derisking cost of equity waterfall, identifying the impact of public instruments
in reducing the incremental financing costs attributable to investor risk categoriesFigure 25: Overview of Stage 3: Levelised Cost
Figures, Tables and Boxes
Derisking Renewable Energy Investment
Figures, Tables and Boxes

3
Figure 26: Illustrative baseline energy mixFigure 27: Illustrative comparison of the LCOE of pre- and post-derisking renewable energy
investments in comparison to the baseline energy mixFigure 28: Overview of Stage 4: EvaluationFigure 29: Visualisation of the investment leverage ratioFigure 30: Visualisation of the savings leverage ratioFigure 31: Visualisation of end-user affordabilityFigure 32: Visualisation of carbon abatement potential and costFigure 33: Key drivers for sensitivity analyses
Chapter 3Figure 34: The four country case studies and their illustrative combinations of public instruments
South AfricaFigure 35: Energy generation mix in South Africa (1971 to 2009)Figure 36: Wind map of South AfricaFigure 37: Impact of risk categories on financing costs for wind energy investment in South Africa,
business-as-usual scenario Figure 38: Impact of policy derisking instruments on reducing financing costs for wind energy
in South Africa Figure 39: LCOE for the marginal baseline and wind investment in South AfricaFigure 40: Performance metrics for the selected package of policy derisking instruments in
promoting 8.4 GW of wind energy investment in South Africa
PanamaFigure 41: Energy generation mix in Panama (1971 to 2009)Figure 42: Wind map of PanamaFigure 43: Impact of risk categories on financing costs for wind energy investment in Panama,
business-as-usual scenario Figure 44: Impact of policy derisking instruments on reducing financing costs for wind energy
in PanamaFigure 45: LCOE for the marginal baseline and wind investment in PanamaFigure 46: Performance metrics for the selected package of policy derisking instruments in
promoting 1 GW of wind energy investment in Panama
MongoliaFigure 47: Energy generation mix in Mongolia (1985 to 2009)Figure 48: Wind map of MongoliaFigure 49: Impact of risk categories on financing costs for wind energy investment in Mongolia,
business-as-usual scenario Figure 50: Impact of policy derisking instruments on reducing financing costs for wind energy
in MongoliaFigure 51: LCOE for the marginal baseline and wind investment in Mongolia
Derisking Renewable Energy Investment
Figures, Tables and Boxes
Contents
Copy goes hereNulla ut nisl etly neque lobortis islu
egestas sit amet quis consectetur ac nunc.
FVivamu nisi mi felis, tincidun non blandit
vestibu luma.
4
Figure 52: Performance metrics for the selected package of policy derisking instruments in promoting 1 GW of wind energy investment in Mongolia
KenyaFigure 53: Energy generation mix in Kenya (1971 to 2009)Figure 54: Wind map of KenyaFigure 55: Impact of risk categories on financing costs for wind energy investment in Kenya,
business-as-usual scenario Figure 56: Impact of policy derisking instruments on reducing financing costs for wind energy
in KenyaFigure 57: LCOE for the marginal baseline and wind investment in KenyaFigure 58: Performance metrics for the selected package of policy derisking instruments
in promoting 1 GW of wind energy investment in Kenya
Chapter 4Figure 59: Overview of the modelling exercise’s results for investment leverage ratiosFigure 60: Overview of the modelling exercise’s results for savings leverage ratiosFigure 61: Overview of the modelling exercise’s results for end-user affordability Figure 62: Overview of the modelling exercise’s results for carbon abatement
ConclusionFigure 63: Scaled-up mitigation actions blending derisking instruments and performance-based
payments
AnnexesFigure 64: The modelling exercise’s fuel price assumptions
TABLES Chapter 1Table 1: Examples of the evolution of public instruments in the short-, medium- and long-term
Chapter 2Table 2: Typical stakeholders for large-scale renewable energy projects Table 3: A generic multi-stakeholder barrier and risk table for large-scale, on-grid
renewable energy deployment in developing countriesTable 4: A generic public instrument table for large-scale, on-grid renewable energy
deployment in developing countries
Chapter 3Table 5: The modelling exercise’s public instrument table
South AfricaTable 6: Investor feedback on risk categories for wind energy investment in South Africa
Derisking Renewable Energy Investment
Figures, Tables and Boxes
5
Table 7: Example sensitivity analyses on the South Africa case study’s performance metrics when varying key inputs by +/- 10%
Table 8: Summary assumptions for the South Africa case study
PanamaTable 9: Investor feedback on risk categories for wind energy investment in PanamaTable 10: Example sensitivity analyses on the Panama case study’s performance metrics
when varying key inputs by +/- 10%Table 11: Summary assumptions for the Panama case study
MongoliaTable 12: Investor feedback on risk categories for wind energy investment in MongoliaTable 13: Example sensitivity analyses on the Mongolia case study’s performance metrics when
varying key inputs by +/- 10%Table 14: Summary assumptions for the Mongolia case study
KenyaTable 15: Investor feedback on risk categories for wind energy investment in KenyaTable 16: Example sensitivity analyses on the Kenya case study’s performance metrics when
varying key inputs by +/- 10%Table 17: Summary assumptions for the Kenya case study
AnnexesTable 18: Interview sample size in each of the modelling exercise’s countriesTable 19: The modeling exercise’s assumptions for policy derisking instruments’ effectivenessTable 20: The modelling exercise’s assumptions on costing of financial derisking instrumentsTable 21: The modelling exercise’s assumptions for the baseline energy mixTable 22: The modelling exercise’s assumptions for marginal baseline emission factorsTable 23: The modelling exercise’s assumptions for wind energy full load hoursTable 24: The modelling exercise’s assumptions on technology specifications for wind energy
BOXES Chapter 1Box 1: How different investment types affect the pricing of risk into financing costs
Chapter 2Box 2: Methodology for quantifying the impact of risk categories on increasing financing costsBox 3: The different effects of policy and financial derisking instruments
Annexes Box 4: The eight investment assumptions for wind energy in the four countriess Box 5: The modelling exercise’s LCOE formula
Derisking Renewable Energy Investment
Figures, Tables and Boxes

Contents
Copy goes hereNulla ut nisl etly neque lobortis islu
egestas sit amet quis consectetur ac nunc.
FVivamu nisi mi felis, tincidun non blandit
vestibu luma.
6
General AcronymsBAU Business as usual
BDP UNDP Bureau for Development Policy
BM Build margin
BNEF Bloomberg New Energy Finance
BOO Build-own-operate
BOP Balance-of-plant
CCGT Combined cycle gas turbine
CDM Clean Development Mechanism
CM Combined margin
ECN Energy Research Centre of the Netherlands
EIA Environmental impact assessment
EITT UNDP Energy, Infrastructure, Transport and Technology team
EPC Engineering, procurement and construction
ESCO Energy service company
FDI Foreign direct investment
FiT Feed-in tariff
GDP Gross domestic product
GCF Green Climate Fund
GEF Global Environment Facility
GHG Greenhouse gas
GW Gigawatt
HDI Human Development Index
IEA International Energy Agency
IIASA International Institute for Applied Systems Analysis
IPP Independent power producer
IRENA International Renewable Energy Agency
ISO Organisation for International Standardisation
kW Kilowatt
kWh Kilowatt-hour
LCOE Levelised cost of electricity
LDC Least developed country
MIGA Multilateral Investment Guarantee Agency (World Bank)
MW Megawatt
NAMA Nationally Appropriate Mitigation Action
NIMBY Not in my back yard
NMM New market mechanism
NREL National Renewable Energy Laboratory
Derisking Renewable Energy Investment
Acronyms
Acronyms
7Derisking Renewable Energy Investment
Acronyms
O&M Operations and maintenance
OECD Organisation for Economic Cooperation and Development
OM Operating margin
PDD CDM project design document
PoA CDM programme of activities
PPA Power purchase agreement
PPP Purchasing power parity
PRI Political risk insurance
PV Photovoltaic
REFIT Renewable energy feed-in tariff
REN21 Renewable Energy Policy Network for the 21st Century
RET Renewable energy technology
RFP Request for proposal
UN-DESA United Nations Department of Economic and Social Affairs
UNDP United Nations Development Programme
UNEP United Nations Environment Programme
UNFCCC United Nations Framework Convention on Climate Change
UN REDD United Nations Collaborative Programme on Reducing Emissions from Deforestation and Forest Degradation
USD United States dollar
VAT Value-added tax
South Africa Case Study AcronymsNERSA National Energy Regulator of South Africa
SAWEA South African Wind Energy Association
ZAR South African rand
Panama Cast Study AcronymsANAM Autoridad Nacional del Ambiente
ASEP Autoridad Nacional de Servicios Publicos
ENEL Ente Nazionale per l'Energia Elettrica (Italy)
ETESA Empresa de Transmisión Eléctrica S.A
SNE Secretaría Nacional de Energía
Mongolia Case Study AcronymsERA Energy Regulatory Authority
Kenya Case Study AcronymsKETRACO Kenya Electricity Transmission Company
KPLC Kenya Power and Lighting Company

Derisking Renewable Energy Investment8
Foreword
Foreword
The latest figures from the Global Carbon Project show that worldwide CO2 emissions increased by an annual rate of 2.6 percent in 2012 (Peters et al., 2013). These emissions were the highest in human history and 58 percent higher than in 1990, the Kyoto Protocol reference year. Current trajectories of fossil fuel emissions will take global mean surface temperature to approximately 4 to 6°C above pre-industrial times by 2100.
Limiting warming to 2°C is still possible. We have the technologies and the public instruments to cost-effectively decarbonise power generation and provide universal energy access to the poor. But these technologies are unlikely to be deployed on time to meet the world’s growing energy needs and avert catastrophic climate change in the absence of sustained market transformation efforts.
The technology cost of renewable energy has been rapidly falling over the past decades and it has been suggested that a technology push by a few initial leader countries could prove sufficient to make renewable energy competitive with fossil fuels by the end of this decade. However, the barriers confronting a full-scale transition to renewable energy in developing countries lie not just with technology costs but with the challenges of securing long-term affordable finance. Fuel is the primary cost incurred by power companies to generate electricity from fossil fuel-fired power plants. For renewable energy, financing cost is the primary determinant of generation cost, as renewable energy (other than biomass and biofuel) has no fuel cost but does have high upfront investment costs.
Project developers in developing countries often struggle to access the large sums of upfront financing they need. When available, the cost of available financing is substantially higher than in developed countries, translating into higher power generation costs for renewable energy technologies. The elevated financing costs in developing countries reflect a number of perceived or actual investment barriers and associated risks, and can be understood as the extra reward required by investors to compensate them for the additional risks they face. Lowering these financing costs by addressing barriers to investments is, therefore, an important task for policymakers seeking to scale-up access to renewable energy in developing countries.
Derisking Renewable Energy Investment 9
Foreword
The challenge of addressing these barriers has inspired the development of a wide array of public measures to promote renewable energy. However, public instruments to catalyse clean energy finance come at a cost. Irrespective of the instrument portfolio that is selected, there will be a cost to industry, consumers or the tax-payer. This publication, together with its accompanying financial tool, introduces an innovative framework developed by UNDP to help decision-makers quantitatively compare different public instruments and their environmental and cost effectiveness. To illustrate how the framework can support policy decision making in practice, the publication provides the results from case studies in four countries. It draws on these results to discuss possible directions for enhancing the effectiveness and efficiency of public finance to catalyse renewable energy investment and provide universal access to clean, secure and affordable energy services.
I hope that policymakers, development practitioners and the renewable energy community at large will find this first version of the framework helpful. UNDP looks forward to collaborating with our partners to further develop and refine it – thereby hopefully making a contribution to addressing global warming and to assisting developing countries in meeting their sustainable energy objectives.
Rebeca Grynspan Associate Administrator, United Nations Development Programme

Executive Summary

Derisking Renewable Energy Investment 11
Executive Summary
Executive Summary
THE ROLE OF PUBLIC INSTRUMENTS IN REDUCING FINANCING COST OF RENEWABLE ENERGYAround the world, developing countries are seeking to rapidly scale-up renewable energy investment. This shift to renewable energy is driven by a number of considerations. Many developing countries are struggling to meet fast-growing energy demand. About 1.3 billion people still lack access to electricity and 2.7 billion to modern energy services, with their human development held back through energy poverty (UN, 2011). Meanwhile, rising global fuel prices and resource scarcities are making developing countries increasingly vulnerable to oil prices. Over one-third of low-income countries already pay more than 10 percent of their gross domestic product (GDP) to secure their oil supply (Economy Watch, 2011; Seth, 2012).
At the same time, the technology cost of renewable energy has been experiencing remarkably steady falls over the past decades (nearly 98 percent for solar photovoltaic (PV) modules since 1979, for instance (IRENA, 2012a)). It has been suggested that a sustained technology push by a few pioneer countries could further reduce technology costs, enabling renewable energy to out-compete fossil fuels by the end of this decade. However, barriers towards a full-scale transition to renewable energy in developing countries lie not just in technology costs but in the challenges of securing long-term affordable finance. Financing cost is the primary determinant of generation cost for renewable sources, as renewable energy (other than biomass and biofuel) has no fuel cost but does have high upfront investment costs.
The financial sums involved in a rapid shift to low-emission energy systems are enormous. According to the Global Energy Assessment (GEA, 2012), global investment in energy efficiency and low-carbon energy generation will need to increase to between USD 1.7–2.2 trillion per year – compared with present levels of about USD 1.3 trillion – over the coming decades to meet the combined challenges of energy access, energy security and climate change. In order to successfully scale-up renewable energy in developing countries, it is clear that private sector investment must be at the forefront. In principle, with enabling policies and investment practice aligned, global capital markets, amounting to some USD 212 trillion in financial assets (McKinsey, 2011), have the size and depth to step up to the investment challenge. However, project developers in developing countries often struggle to access the large quantities of financing they need. When available, the financing cost of this upfront investment is substantially higher than in developed countries, translating into higher power generation costs for renewable energy technologies.
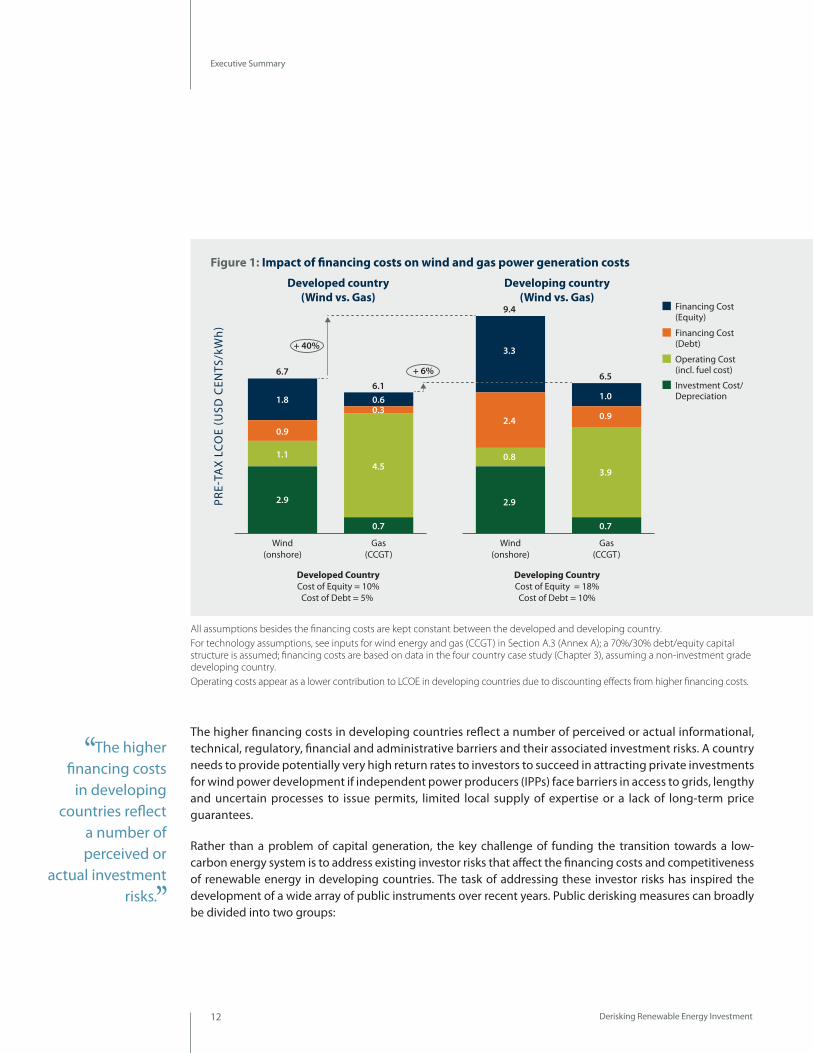
The difference in financing costs (debt and equity) can dramatically affect the competitiveness of renewable energy versus fossil fuel technologies in developing countries. Figure 1 compares the 2012 levelised cost of electricity (LCOE)1 of a generic onshore wind energy plant and a combined-cycle gas plant in a developed country with those of the same plants in a developing country. In a developed country benefiting from low financing costs, wind power can be almost cost-competitive with gas, despite the present affordability of natural gas. All other assumptions kept constant, in a developing country with higher financing costs, wind power generation cost becomes 40 percent more expensive than that of gas because of the upfront capital intensity of wind technologies.
1 The levelised cost of electricity (LCOE) is a popular metric to compare different types of systems – from renewable energy projects, where the upfront capital cost is high and the ‘fuel’ cost is near-zero, to a natural gas plant, where the capital cost is lower but the fuel cost is higher. LCOE allocates the costs of an energy plant across its useful life to give an effective price per each unit of energy (for example, USD/kWh).
In order to successfully scale-up renewable energy in developing countries, it is clear that private sector investment must be at the forefront.
Derisking Renewable Energy Investment12
Executive Summary
The higher financing costs in developing countries reflect a number of perceived or actual informational, technical, regulatory, financial and administrative barriers and their associated investment risks. A country needs to provide potentially very high return rates to investors to succeed in attracting private investments for wind power development if independent power producers (IPPs) face barriers in access to grids, lengthy and uncertain processes to issue permits, limited local supply of expertise or a lack of long-term price guarantees.
Rather than a problem of capital generation, the key challenge of funding the transition towards a low- carbon energy system is to address existing investor risks that affect the financing costs and competitiveness of renewable energy in developing countries. The task of addressing these investor risks has inspired the development of a wide array of public instruments over recent years. Public derisking measures can broadly be divided into two groups:
Developed country(Wind vs. Gas)
Developed CountryCost of Equity = 10%
Cost of Debt = 5%
Developing CountryCost of Equity = 18%Cost of Debt = 10%
Developing country(Wind vs. Gas)
PRE-
TAX
LC
OE
(USD
CEN
TS/k
Wh
)
Gas(CCGT)
Wind(onshore)
Gas(CCGT)
Wind(onshore)
Financing Cost (Equity)
Financing Cost (Debt)
Operating Cost (incl. fuel cost)
Investment Cost/Depreciation
2.9
1.1
0.9
1.8
6.7
+ 40%
0.7
4.5
0.30.66.1
2.9
0.8
2.4
3.3
9.4
0.7
3.9
0.9
1.0
6.5+ 6%
Figure 1: Impact of financing costs on wind and gas power generation costs
All assumptions besides the financing costs are kept constant between the developed and developing country.For technology assumptions, see inputs for wind energy and gas (CCGT) in Section A.3 (Annex A); a 70%/30% debt/equity capital structure is assumed; financing costs are based on data in the four country case study (Chapter 3), assuming a non-investment grade developing country.Operating costs appear as a lower contribution to LCOE in developing countries due to discounting effects from higher financing costs.
The higher financing costs
in developing countries reflect
a number of perceived or
actual investment risks.

Derisking Renewable Energy Investment 13
Executive Summary
●● Policy derisking instruments seek to remove the underlying barriers that are the root causes of risks. These instruments include, for example, support for renewable energy policy design, institutional capacity building, resource assessments, grid connection and management, and skills development for local operations and maintenance (O&M).
●● Financial derisking instruments do not seek to directly address the underlying barriers but, instead, transfer the risks that investors face to public actors, such as development banks. These instruments can include, for example, loan guarantees, political risk insurance (PRI) and public equity co-investments.
Recognising that not all risks can be eliminated through policy derisking or transferred through financial derisking, efforts to reduce risks can be supplemented by direct financial incentives (price premiums, tax breaks, carbon offsets, etc.) to compensate for residual incremental costs and to thereby increase returns. The overall aim is to achieve a risk/return profile that can attract private sector investment.
Figure 2 provides a conceptual illustration of the approach. The figure illustrates a shift from a commercially unattractive investment opportunity (right) to a commercially attractive one (top). This is achieved through two actions: first, by reducing the risk of the activity, for example, through a regulatory policy such as guaranteed access to the grid for IPPs; and, second, by increasing the return on investment by, for example, creating financial incentives, such as a premium price for renewable energy.
FIN
AN
CIA
L R
ETU
RN
RISK OF INVESTMENT
Infeasible renewable
energy project
Example: price premium
Feasiblerenewable
energy project
Example: guaranteed access to the grid
Figure 2: Shifting the risk-reward profile of renewable energy projects
Source: Glemarec (2011), adapted.
Public derisking can be supplemented by direct financial incentives to compensate for residual incremental costs.
Derisking Renewable Energy Investment14
Executive Summary
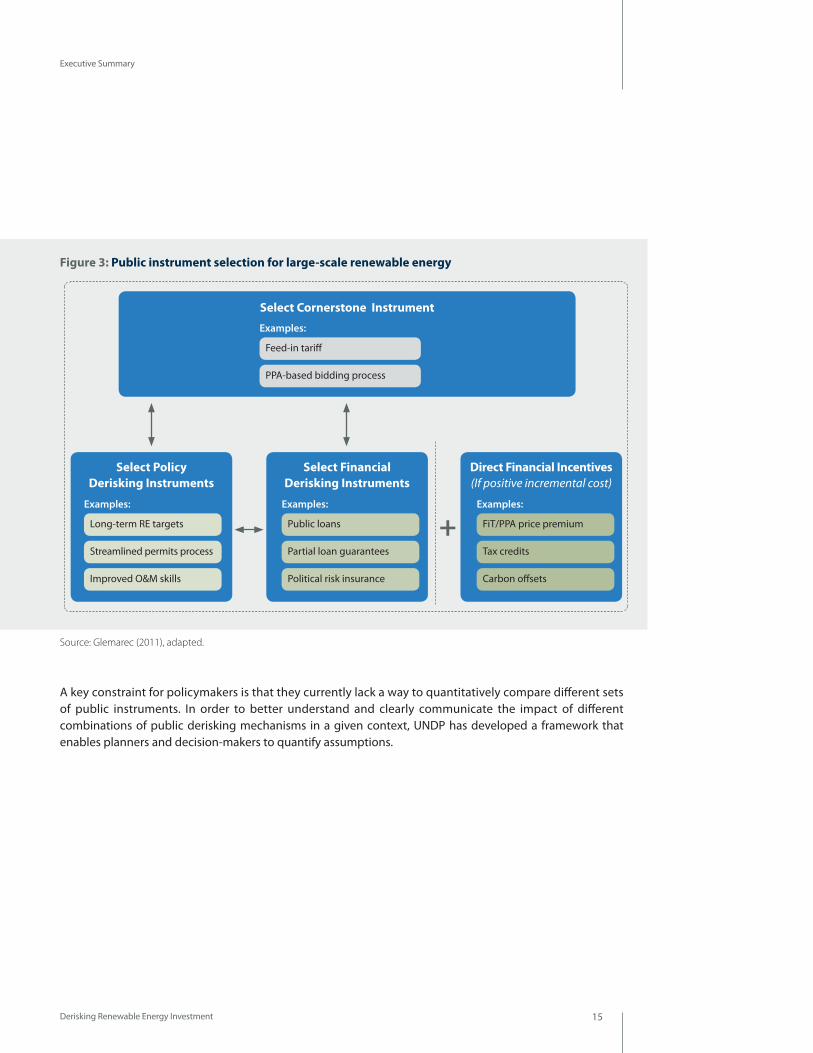
While policymakers can use a range of different instruments to address renewable energy investment risks and their underlying barriers, certain types of instruments have achieved greater prominence than others and are often referred as ‘cornerstone instruments’. A cornerstone instrument targets key investment risks and is the foundation upon which all complementary policy and financial derisking instruments are built.
Mechanisms that provide renewable energy generators with a power purchase agreement (PPA), ensuring a fixed long-term price for power and guaranteed access to the electricity grid, are often the cornerstone instrument for renewable energy market transformation efforts. Such cornerstone instruments are often referred to as feed-in tariffs (FiTs), but can also be designed around auctions or bidding processes.2 When necessary, FiTs can also include an above-market price premium in order to increase the return on investment. Thus, FiTs are simultaneously both a policy derisking instrument (market access to the grid and must-take requirements) and a financial derisking instrument (guaranteed price over a period of 15-25 years) that can also act, when needed, as a financial incentive instrument (through a price premium), shifting the entire risk-reward profile of a renewable energy investment.
Usually, cornerstone instruments are supplemented by a number of policy and financial derisking instruments to address residual investment risks. Figure 3 illustrates a typical public instrument portfolio building on a FiT to promote large-scale renewable energy technologies. Identifying an appropriate combination of policy and financial derisking instruments to supplement a cornerstone instrument can prove very challenging in practice. The severity of investment barriers to renewable energy varies between locations and technologies. Different resource endowments, market conditions and national goals mean that there is no one-size-fits-all ‘best’ public instrument mix.
Decision-makers tasked with selecting an optimal instrument mix need to take a wide range of considerations into account. They have to identify the different stakeholders associated with each investment barrier, and closely understand the varying interests that have resulted in the barrier coming about. The appropriateness of different public measures to address these barriers needs to be assessed: some public instruments may be less effective and require a longer amount of time to take effect in some countries than others. For example, institutional strengthening within ministries may be an important precursor to a well-designed FiT regime. While a public instrument may be effective, the public expenditures required to achieve this might be disproportionate and therefore politically unbearable. Determining the ex-ante cost of public instruments involves multiple, complex assumptions (Schmidt et al., 2012). Direct financial incentives for renewable energy are becoming particularly controversial in industrial countries and are likely to prove even more problematic in developing countries (Frondel, 2008; Peters et al., 2012; Hoppmann, 2013).
2 Recognising that there are few clear dividing lines between FiTs and PPA-based auctions/bidding processes – both result in project developers entering into long-term PPAs at a fixed price – this report uses the term FiTs at times to cover both types of cornerstone instrument. For a comparative discussion on FiT and auctions/bidding in non-OECD countries see Becker and Fischer (2013).
Different resource endowments,
market conditions and national goals mean that there is no one-size-fits-all public instrument
mix.
Derisking Renewable Energy Investment 15
Executive Summary
A key constraint for policymakers is that they currently lack a way to quantitatively compare different sets of public instruments. In order to better understand and clearly communicate the impact of different combinations of public derisking mechanisms in a given context, UNDP has developed a framework that enables planners and decision-makers to quantify assumptions.
Figure 3: Public instrument selection for large-scale renewable energy
Source: Glemarec (2011), adapted.
+
Direct Financial Incentives (If positive incremental cost)
Examples:
FiT/PPA price premium
Select Cornerstone Instrument
Examples:
Feed-in tariff
PPA-based bidding process
Select Policy Derisking Instruments
Examples:
Long-term RE targets
Streamlined permits process
Improved O&M skills
Select Financial Derisking Instruments
Examples:
Public loans
Partial loan guarantees
Political risk insurance
Tax credits
Carbon offsets

Derisking Renewable Energy Investment16
Executive Summary
A FRAMEWORK TO SELECT PUBLIC INSTRUMENTS TO PROMOTE RENEWABLE ENERGY INVESTMENT
The theory of change3 underlying the framework is that one of the main challenges for scaling-up renewable energy technologies in developing countries is to lower the financing costs that affect their competitiveness against fossil fuels. As these higher financing costs reflect barriers and associated risks in the investment environment, the key entry point for policymakers to foster renewable energy technologies is to address these risks and thereby lower overall life-cycle costs. This theory of change draws from UNDP’s experience in renewable energy market transformation in over 80 developing economies (Glemarec et al., 2012) as well as from the findings of a recent UNDP research partnership with Deutsche Bank on feed-in tariffs (DB Climate Change Advisors, 2011). Figure 4 illustrates this theory of change and how public instruments, through addressing barriers to investment, can reduce the financing costs of renewable energy investments and attract capital at scale.4
3 ‘Theory of change’ is an increasingly common concept used in international development (Vogel, 2012). While there is no single definition of the term, it is here used to articulate UNDP’s underlying assumptions of how and why change might happen as a result of a public programme’s actions.
4 In this figure, operational and investment costs are shown as remaining constant. There are two main reasons for this. First, it is recognised that barriers to investment can lead to higher operational and investment costs. For example, an investor may incur additional costs in a prolonged attempt to obtain permits if the permits process is poorly designed. Similarly, an investor may incur additional costs in flying technicians from abroad for project commissioning and O&M in the absence of a local supply of expertise. The framework is based on the assumption that the possibility of higher costs brought about by investor barriers are factored into the upfront investment decision and result in the investor demanding a higher return on investment, which translates into a higher cost of capital (McKinsey 2012, DB Climate Change Advisors, 2011). Second, the figure only addresses the role of public derisking instruments. The figure therefore does not include direct financial incentives, such as production tax credits or accelerated depreciation, which do reduce operational and investment costs.
USD/kWh
USD/kWh
Pre-DeriskingLife-cycle Costs (LCOE)
Post-Derisking Life-cycle Costs (LCOE)
Renewable Energy Renewable Energy
Cost of Equity
Financing Costs
Technology Costs
Operational Costs
Investment Costs/Depreciation
Cost of Debt
Figure 4: Public derisking instruments can reduce financing costs of renewable energy investments
One of the main challenges for
scaling-up renewable energy in developing countries is to lower
the financing costs that affect their
competitiveness against fossil fuels.
Derisking Renewable Energy Investment 17
Executive Summary
The framework aims to support policy decision making by quantitatively comparing different public instrument portfolios and their impacts. The intent of the framework is not to provide one predominant numeric result, but instead is to facilitate a structured, transparent process whereby key inputs and assumptions are made explicit, so that they can be checked, debated and enriched to strengthen the design of market transformation initiatives for renewable energy.
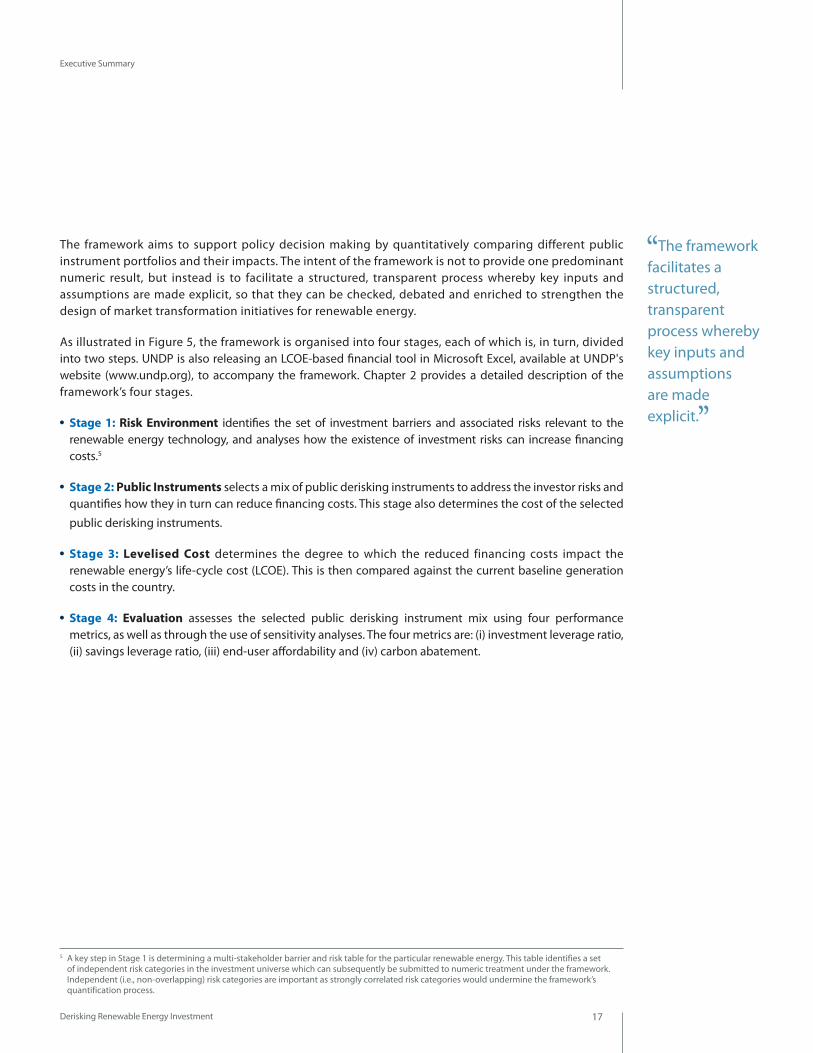
As illustrated in Figure 5, the framework is organised into four stages, each of which is, in turn, divided into two steps. UNDP is also releasing an LCOE-based financial tool in Microsoft Excel, available at UNDP's website (www.undp.org), to accompany the framework. Chapter 2 provides a detailed description of the framework’s four stages.
●● Stage 1: Risk Environment identifies the set of investment barriers and associated risks relevant to the renewable energy technology, and analyses how the existence of investment risks can increase financing costs.5
●● Stage 2: Public Instruments selects a mix of public derisking instruments to address the investor risks and quantifies how they in turn can reduce financing costs. This stage also determines the cost of the selected
public derisking instruments.
●● Stage 3: Levelised Cost determines the degree to which the reduced financing costs impact the renewable energy’s life-cycle cost (LCOE). This is then compared against the current baseline generation costs in the country.
●● Stage 4: Evaluation assesses the selected public derisking instrument mix using four performance metrics, as well as through the use of sensitivity analyses. The four metrics are: (i) investment leverage ratio, (ii) savings leverage ratio, (iii) end-user affordability and (iv) carbon abatement.
5 A key step in Stage 1 is determining a multi-stakeholder barrier and risk table for the particular renewable energy. This table identifies a set of independent risk categories in the investment universe which can subsequently be submitted to numeric treatment under the framework. Independent (i.e., non-overlapping) risk categories are important as strongly correlated risk categories would undermine the framework’s quantification process.
The framework facilitates a structured, transparent process whereby key inputs and assumptions are made explicit.
Derisking Renewable Energy Investment18
Executive Summary
Figure 5: Overview of the framework to select public instruments to promote renewable energy investment
Step 1
Step 1
Step 2
Step 2
●● Determine a multi-stakeholder barrier and risk table for the renewable energy investment
●● Select one or more public derisking instrument(s) to mitigate the identified risk categories
●● Quantify the impact of risk categories on increased financing costs
●● Quantify the impact of the public derisking instrument(s) to reduce financing costs
●● Quantify the public costs of the public derisking instrument(s)
Main Output: Multi-stakeholder Barrier and Risk Table
Main Output: Public Instrument Table
STAKEHOLDERS BARRIER RISK CATEGORY
End-usersBarrier #1
Risk #1Barrier #2
Supply chainBarrier #3
Risk #2Barrier #4
BARRIERRISK
CATEGORY
POLICY DERISKING
INSTRUMENT
FINANCIAL DERISKING
INSTRUMENT
Barrier #1Risk #1
Instrument #1
Barrier #2 Instrument #2
Barrier #3 Risk #2 Instrument #3 Instrument #1
Main Output: Financing Costs Waterfall
Main Output: Post-Derisking Waterfall
%%
‘Best-in-Class’(Developed Country)
Cost of Equity/Debt
Risk #2
Risk #3
Risk #1
Pre-Derisking(Developed Country)Cost of Equity/Debt
%%
Pre-DeriskingCost of Equity/Debt
DeriskingInstrument
#2
DeriskingInstrument
#1
Post-DeriskingCost of Equity/Debt
Stage 1: Risk Environment
Stage 2: Public Instruments

Derisking Renewable Energy Investment 19
Executive Summary
Step 1
Step 1
Step 2
Step 2
●● Calculate the levelised cost of electricity (LCOE) for the baseline energy generation mix in the particular country
●● Analyse the selected public instrument(s) in terms of four key performance metrics
●● Quantify the LCOE for renewable energy investment in the (i) pre-derisking and (ii) post-derisking scenarios
●● Calculate the incremental cost (or savings) by comparing these scenarios vs. the baseline
●● Perform sensitivity analyses on key inputs and assumptions
Main Output: Baseline LCOE
Main Output: 4 Performance Metrics
Coal 52%
Diesel Oil 21%
Hydro 27%
Investment Leverage Ratio
Savings Leverage Ratio
End-user Affordability
Carbon Abatement
Main Output: Incremental Cost (via LCOE)
Main Output: Sensitivity Analyses
USD/ kWh
USD/ kWh
USD/ kWh
Baseline Activity
Renewable Energy Investment
Pre-Derisking
Renewable Energy Investment
Post-Derisking
USD/ kWh
Baseline Activity
Varying key inputs
Stage 3: Levelised Cost
Stage 4: Evaluation

Derisking Renewable Energy Investment20
Executive Summary
ILLUSTRATIVE COUNTRY CASE STUDIES
In order to demonstrate how the framework can be used in practice, the report describes a simplified modelling exercise to promote large-scale, onshore wind energy in four selected countries: Kenya, Mongolia, Panama and South Africa.
As set out in Figure 6, the four countries represent a range of renewable energy market conditions, reflecting different investment environments and baseline electricity generation costs. For example, South Africa has a high sovereign rating investment environment, combined with relatively low-cost electricity (where the baseline energy mix is dominated by inexpensive coal). In contrast, Kenya has a low sovereign rating investment environment, combined with relatively high-cost electricity (where the baseline energy mix has a high share of expensive fuel-oil-based generation).
Onshore wind energy is chosen as it represents a mature renewable energy technology with a strong track record and good data availability. All four countries have strong, untapped wind resources and already have guaranteed price and market-access cornerstone instruments for wind energy in place. Kenya and Mongolia have implemented FiTs, while Panama and South Africa have deployed PPA-based bidding.
The modelling exercise assumes a long-term, 20-year national target for wind investment in each of the four countries: 8.4 GW in South Africa, and 1 GW each in Kenya, Mongolia and Panama. In South Africa, the Government’s announced 2030 target has been used. In the other three countries, the long-term 20-year targets are the exercise’s own assumptions. The objective was to create an ambitious vision for wind energy in each country but, at the same time, to cap wind energy’s share of the anticipated future generation mix at a level whereby intermittency issues could be managed.
The two-by-two instrument matrix illustrated in Figure 6 above provides an organising basis with which to select a plausible set of policy and financial derisking instruments to complement the existing cornerstone instrument in each country.
●● Financial derisking for wind energy, a relatively mature renewable energy technology, is assumed not to be required in countries with high sovereign ratings (South Africa, Panama). Financial derisking instruments are assumed to be a requirement in countries with low sovereign ratings (Mongolia, Kenya).
●● A direct financial incentive, in the form of a price premium in the tariff, is modelled when the LCOE of wind energy is higher than the baseline electricity generation costs (in South Africa, Mongolia). No price premium is assumed necessary in cases where wind power is less expensive than the baseline generation costs (in Panama, Kenya).
The use of the framework requires the collection of a large amount of data and many assumptions. Over 30 investors and other wind energy stakeholders in the four countries were interviewed for the modelling exercise. However, in order to keep the overall exercise manageable, several modelling simplifications have been adopted. Many input parameters, such as wind technology costs, have been standardised across all four countries. Actual costs might differ considerably from country to country and project to project. A number
The modelling exercise's four
countries represent a range of market
conditions, reflecting different investment
environments and baseline electricity generation costs.

Derisking Renewable Energy Investment 21
Executive Summary
of key assumptions on the scope of the modelling exercise have also been made regarding: intermittency, where balancing costs are not factored into the study; the cost of the transmission grid, which is effectively excluded from the analysis; and, with regard to the cost of fossil fuels, unsubsidised fuel costs have been used in order to remove the distortive effects of subsidies and to allow for comparison between the four countries.
None of the above simplifying assumptions undermines the integrity of the modelling exercise. However, should policymakers wish to use the framework for detailed policy analysis, additional in-depth country consultations would be required to collect empirical data to fine-tune the input parameters and modelling assumptions. The framework allows for the degree of complexity used to be tailored on a case-by-case basis.
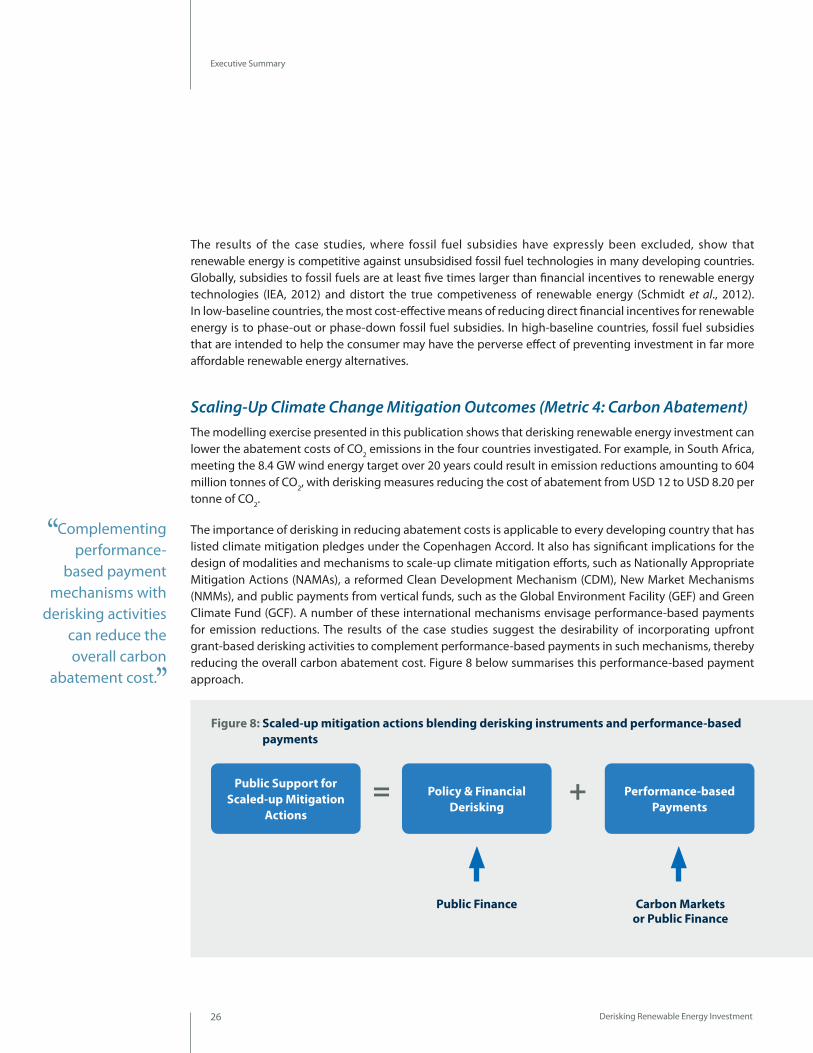
A presentation of the results of the four country case studies is given in Chapter 3. The full data-sets and assumptions for the modelling exercise are set out in Annex A. As an illustration, Figure 7 shows some of the key framework outputs for Kenya and the case study’s 1 GW 20-year target for wind energy investment. The figure shows outputs for the modelling exercise’s business-as-usual (BAU) scenario, where Kenya’s FiT is complemented only by financial derisking instruments, and for a post-derisking scenario, where Kenya’s FiT is complemented by both policy and financial derisking instruments.
* For the modelling exercise, the investment environment is classified using sovereign ratings from credit rating agencies as a general indicator. High reflects a sovereign rating of BBB- or above (commonly referred to as “investment-grade”); low reflects a sovereign rating below BBB- (“non-investment grade”)
Figure 6: The four country case studies and their illustrative combinations of public instruments
General investment environment *
Base
line
ener
gy g
ener
atio
n co
st
LOW
CO
ST
BASE
LIN
EH
IGH
CO
ST
BASE
LIN
E
HIGH SOVEREIGN RATING LOW SOVEREIGN RATING
South Africa (8.4 GW)
Panama (1 GW)
Mongolia (1 GW)
Kenya (1 GW)
Cornerstone instrument: PPA bidding
Cornerstone instrument: PPA bidding
Cornerstone instrument: FiT
Cornerstone instrument: FiT
Policy derisking instruments
Policy derisking instruments
Direct financial incentive: premium
Direct financial incentive: premium
Financial derisking instruments
Financial derisking instruments
+
+
+
+
++
Policy derisking instruments
Policy derisking instruments

Derisking Renewable Energy Investment22
Executive Summary
Figure 7: Illustrative modelling exercise for Kenya (Wind, 1 GW): selected results
Cost of Equity
Cost of Equity
Cost of Equity
Cost
of E
quity
BAU
15.0%
Curr
ency
/M
acro
-eco
n.Ri
sk
1.2% Po
litic
alRi
sk0.6%
Fina
ncia
lSe
ctor
Ris
k
0.5%
Coun
terp
arty
Risk
0.6%
1.1%
Perm
itsRi
sk
0.2%
Pow
er M
arke
tRi
sk
Soci
alAc
cept
ance
Risk
Cost
of E
quity
Best
-in-C
lass
Coun
try
0.7% 0.5%
Grid
Inte
grat
ion
Risk
Cost
of E
quity
BAU
Curr
ency
/M
acro
-eco
n.Ri
sk
Polit
ical
Risk
Fina
ncia
lSe
ctor
Ris
k
Coun
terp
arty
Risk
Perm
itsRi
sk
Pow
er M
arke
tRi
sk
Soci
alAc
cept
ance
Risk
Cost
of E
quity
Best
-in-C
lass
Coun
try
Grid
Inte
grat
ion
Risk
Cost
of E
quity
BAU
Curr
ency
/M
acro
-eco
n.Ri
sk
Polit
ical
Risk
Fina
ncia
lSe
ctor
Ris
k
Coun
terp
arty
Risk
Perm
itsRi
sk
Pow
er M
arke
tRi
sk
Soci
alAc
cept
ance
Risk
Cost
of E
quity
Best
-in-C
lass
Coun
try
Grid
Inte
grat
ion
Risk
Cost of Equity Co
st o
f Equ
ityBA
U
Curr
ency
/M
acro
-eco
n.Ri
sk
Polit
ical
Risk
Fina
ncia
lSe
ctor
Ris
k
Coun
terp
arty
Risk
Perm
itsRi
sk
Pow
er M
arke
tRi
sk
Soci
alAc
cept
ance
Risk
Cost
of E
quity
Best
-in-C
lass
Coun
try
Grid
Inte
grat
ion
Risk
9.5% 18.0%
0.9% 1.5%
1.4%
1.5%
1.3%
9.5%
0.9%
0.1% 1.0%
15.0%
0.5% 0.4% 0.7% 0.5%
0.9% 0.7%
0.8% 0.9%
9.5% 18.0%
0.4% 1.4%
1.6% 1.4%
1.3%
0.0% 0.8% 1.7%
9.5%
0.3% 0.2% 0.3% 0.2% 0.2% 0.2%
0.5% 0.3% 0.0%
18.0%
0.6% 0.2%
0.3%
16.1%
0.5% 0.4% 0.0% 0.3%
0.2% 0.6%
-1.2%
Cost
of E
quity
Post
-Der
iski
ng
0.2%
Soci
alAc
cept
ance
Risk
0.1%
Perm
itsRi
sk
0.1%
Fina
ncia
lSe
ctor
Ris
k
15.0%
Polit
ical
Risk
0.2% 0.1%
Curr
ency
/M
acro
-eco
n.Ri
sk
13.8%
0.4% N/A N/A
Cost
of D
ebt
BAU
Coun
terp
arty
Risk
Pow
er M
arke
tRi
sk
Grid
Inte
grat
ion
Risk
Cost of Equity Cost of Equity
Cost
of E
quity
Post
-Der
iski
ng
Soci
alAc
cept
ance
Risk
Perm
itsRi
sk
Fina
ncia
lSe
ctor
Ris
k
15.0%
Polit
ical
Risk
Curr
ency
/M
acro
-eco
n.Ri
sk
13.6%
N/A N/A
Cost
of D
ebt
BAU
Coun
terp
arty
Risk
Pow
er M
arke
tRi
sk
Grid
Inte
grat
ion
Risk
Cost
of E
quity
Post
-Der
iski
ng
Soci
alAc
cept
ance
Risk
Perm
itsRi
sk
Fina
ncia
lSe
ctor
Ris
k
Polit
ical
Risk
Curr
ency
/M
acro
-eco
n.Ri
sk
Cost
of D
ebt
BAU
Coun
terp
arty
Risk
Pow
er M
arke
tRi
sk
Grid
Inte
grat
ion
Risk
Co
st o
f Equ
ityPo
st-D
eris
king
Soci
alAc
cept
ance
Risk
Perm
itsRi
sk
Fina
ncia
lSe
ctor
Ris
k
Polit
ical
Risk
Curr
ency
/M
acro
-eco
n.Ri
sk
Cost
of D
ebt
BAU
Coun
terp
arty
Risk
Pow
er M
arke
tRi
sk
Grid
Inte
grat
ion
Risk
Cost of Equity 18.0% 15.9% Cost of Equity
-1.9%
N/A N/A
-2.1%
N/A N/A
-1.4%
0.7% 0.4% 0.6%
0.4% 0.1% 0.3% 0.4%
0.7%
0.7% 0.6% 0.0%
0.6%
0.2% 0.7%
0.7% 0.9% 0.0%
0.9% 0.5% 0.7% 0.4% 0.3%
0.7% 0.4%
Cost of Debt
Cost of Debt
Cost of Debt
Cost
of D
ebt
BAU
7.5%
Curr
ency
/M
acro
-eco
nRi
sk
Polit
ical
Risk
Coun
terp
arty
Risk
Pow
er M
arke
tRi
sk
Soci
alAc
cept
ance
Risk
Cost
of D
ebt
Best
-in-C
lass
Coun
try
Grid
Inte
grat
ion
Risk
Cost
of D
ebt
BAU
Curr
ency
/M
acro
-eco
n.Ri
sk
Polit
ical
Risk
Coun
terp
arty
Risk
Pow
er M
arke
tRi
sk
Soci
alAc
cept
ance
Risk
Cost
of D
ebt
Best
-in-C
lass
Coun
try
Grid
Inte
grat
ion
Risk
Cost
of D
ebt
BAU
Curr
ency
/M
acro
-eco
n.Ri
sk
Polit
ical
Risk
Coun
terp
arty
Risk
Pow
er M
arke
tRi
sk
Soci
alAc
cept
ance
Risk
Cost
of D
ebt
Best
-in-C
lass
Coun
try
Grid
Inte
grat
ion
Risk
Cost
of D
ebt
BAU
Curr
ency
/M
acro
-eco
n.Ri
sk
Polit
ical
Risk
Coun
terp
arty
Risk
Pow
er M
arke
tRi
sk
Soci
alAc
cept
ance
Risk
Cost
of D
ebt
Best
-in-C
lass
Coun
try
Grid
Inte
grat
ion
Risk
Cost of Debt
5.0% 8.0% 5.0%
8.0% 5.0% 8.5% 5.0%
0.1% 0.1% 0.0% 0.2% 0.2% 0.3% 0.0% 0.2%
0.2% 0.2% 0.2% 0.2% 0.3% 0.2% 0.2% 0.0%
N/A N/A
N/A N/A
N/A N/A
N/A N/A
8.0% 7.3%
-0.5%
Cost
of D
ebt
Post
-Der
iski
ng
Soci
alAc
cept
ance
Risk
7.5%
Polit
ical
Risk
Curr
ency
/M
acro
-eco
n.Ri
sk
7.0%
Cost
of D
ebt
BAU
Coun
terp
arty
Risk
Pow
er M
arke
tRi
sk
Grid
Inte
grat
ion
Risk
Cost
of D
ebt
Post
-Der
iski
ng
Soci
alAc
cept
ance
Risk
Polit
ical
Risk
Curr
ency
/M
acro
-eco
n.Ri
sk
Cost
of D
ebt
BAU
Coun
terp
arty
Risk
Pow
er M
arke
tRi
sk
Grid
Inte
grat
ion
Risk
Cost of Debt Cost of Debt
Cost
of D
ebt
Post
-Der
iski
ng
Soci
alAc
cept
ance
Risk
Polit
ical
Risk
Curr
ency
/M
acro
-eco
n.Ri
sk
Cost
of D
ebt
BAU
Coun
terp
arty
Risk
Pow
er M
arke
tRi
sk
Grid
Inte
grat
ion
Risk
Cost
of D
ebt
Post
-Der
iski
ng
Soci
alAc
cept
ance
Risk
Polit
ical
Risk
Curr
ency
/M
acro
-eco
n.Ri
sk
Cost
of D
ebt
BAU
Coun
terp
arty
Risk
Pow
er M
arke
tRi
sk
Grid
Inte
grat
ion
Risk
8.0% 7.2% Cost of Debt 8.5% 7.7% Cost of Debt
-0.7%
-0.8% -0.8%
Stage 1: Risk Environment Quantify the impact of barriers and associated risks on increased financing costs
Stage 3: Levelised Cost Determine incremental costs of the BAU and post-derisking wind LCOE versus the baseline LCOE
Stage 2: Public Instruments Quantify the impact of derisking instruments on reducing financing costs
Wind Investment Post-Derisking
Wind Investment BAU
Baseline Activity(Unsubsidised)
8.18.717.1
LCO
E (U
SD C
ENTS
/kW
h)

Derisking Renewable Energy Investment 23
Executive Summary
Stage 4: Evaluation 4 Performance Metrics
x 8.0*
MIL
LIO
N U
SD
Wind EnergyInvestments
1,980
Cost of Post-Derisking
Instruments
131
112
Cost of BAU Instruments
248
x 15.1
19
Policy derisking instruments Present value of costs over 20 years
Financial derisking instruments
Marginal baseline LCOE (unsubsidised)
-6%
USD
cen
t/kW
h
17.11618
141210
86420
-53%
LCOE Post-Derisking
LCOE BAU
8.7 8.1
MIL
LIO
N U
SD
x 14.219
(Pre
sent
val
ue o
ver 2
0 yr
s)
4,516
275
4,241
IncrementalCosts –
Post-Derisking
Savings IncrementalCosts-BAU
Cost ofPolicy
Derisking
-6%
USD
/tCO
2e
0
-20
-40
-60
-80
-100
-120
-140
-120.9 -113.5
BAU Post-Derisking
37.4 Mt CO2e (20 yrs)
INVESTMENT LEVERAGE RATIO (Metric 1)
END-USER AFFORDABILITY (Metric 3)
SAVINGS LEVERAGE RATIO (Metric 2)
CARBON ABATEMENT (Metric 4)
Source: interviews with wind investors and developers; modelling exercise; see Table 5, Table 17 (Chapter 3) and Annex A for details on assumptions and methodology.
For Stage 1: the cost of debt and equity assume supporting financial derisking instruments are in place. The cost of debt shown is the commercial rate assuming financial derisking is in place.
For Stage 2: the impacts shown are average impacts over the 20-year modelling period, assuming linear timing effects.* In the BAU scenario the full investment target may not be met.

Derisking Renewable Energy Investment24
Executive Summary
IMPLICATIONS FOR PUBLIC FINANCE TO PROMOTE RENEWABLE ENERGY AT SCALE
A number of practical findings emerge from a comparative analysis of the illustrative results across the four case study countries. While a more detailed modelling exercise may substantially refine the figures obtained, it is likely that the overall implications will stay the same.
In analysing the results, each of the framework’s four performance metrics provides a different perspective for the policymaker seeking to promote renewable energy at scale.
Public Finance Effectiveness (Metric 1: Investment Leverage Ratio)A fundamental goal of the policymaker is to catalyse concrete private sector investment. A finding of this illustrative modelling exercise is that the presence of a cornerstone instrument, such as a FiT or PPA bidding process, by itself does not guarantee this investment. Instead, the results show that there is a role for complementary policy and financial derisking measures to target the residual risks that a cornerstone instrument alone cannot address and that can otherwise suppress investment.
This point is particularly well illustrated by the case study of Panama. Despite the country having a PPA bidding process in place, an attractive investment climate and low wind power generation costs when compared to an existing high-cost baseline, financial closure with banks for the first wind licences awarded has yet to occur. The financing cost waterfall for Panama clearly shows that a number of non-price barriers remain and that additional derisking efforts are required to complement the existing PPA bidding process. The modelling exercise shows that the impact of such additional derisking efforts could be dramatic. With Panama’s unique combination of favourable factors, a relatively small amount of policy derisking could catalyse 100 times its cost in private investment.
More broadly, these findings illustrate that renewable energy market transformation takes time. Despite the fact that a FiT or PPA bidding process has been in place in the four case study countries for several years, it may not be immediately effective. Barriers to renewable energy investment are often deeply embedded, reflecting long-held practices centred on fossil-fuels and monopolistic market structures. A cornerstone instrument, such as a FiT, complemented by policy and financial derisking, can therefore be seen as the starting point on a longer path to transforming a market for renewable energy investment.
Policy and financial derisking instruments target
the residual risks that a FiT alone cannot address and which can
otherwise suppress investment.

Derisking Renewable Energy Investment 25
Executive Summary
Public Finance Efficiency (Metric 2: Savings Leverage Ratio)A second key finding from the modelling exercise is that derisking measures can generate significant public savings in all four countries. In low-cost baseline countries, such as South Africa and Mongolia, derisking instruments reduce the price premium required to make renewable energy competitive with conventional energy. In South Africa, with a large 8.4 GW wind target, the modelling finds that an estimated USD 40 million in policy derisking instruments can result in a USD 2.3 billion reduction in the price premium over the 20-year target, a savings leverage ratio of over 50.
Less intuitive but just as critical, derisking instruments can unlock the savings associated with the lower cost of renewable energy in high-cost baseline countries, such as Panama and Kenya. For example, a modest investment in additional policy derisking instruments in Kenya, estimated at about USD 20 million in this simplified modelling exercise, could ‘unlock’ USD 4.5 billion in negative incremental costs over the next 20 years as compared to an unsubsidised baseline.
For the two low-cost baseline countries (South Africa and Mongolia), wind energy remains more expensive than the baseline even after derisking, and this can result in a net cost to taxpayers or electricity consumers. In such cases, an implication of the modelling exercise is that the ambition of a country’s long-term vision for wind energy can be an important factor. Although local content requirements have proven controversial, in South Africa, for example, the ambitious 8.4 GW target for wind energy could provide a solid foundation for the local manufacturing sector. The experience of countries, such as China and India shows that local manufacturing can greatly reduce the total installed cost of wind energy (IRENA, 2012b) and generate foreign direct investment (FDI) and green jobs. In Mongolia, with the modelling assumptions (1 GW, domestic low cost baseline) employed, the economic case in favour of public financial incentives for wind energy is questionable. However, a more ambitious, export-oriented vision for wind in Mongolia, partnering with neighbouring countries with higher baseline costs, could dramatically alter the cost equation and competitiveness of Mongolian wind energy.
Distributional Impact of Public Interventions (Metric 3: End-user Affordability)Ultimately the generation costs of renewable energy, as well as those of any associated public measures, will be met by the end-user (industry, households) and/or the taxpayer. The results of the modelling exercise show that, if passed on to the consumer, the use of derisking instruments to complement a FiT or PPA bidding process has the potential to increase affordability of the renewable energy technologies in all four countries.
Efforts to promote renewable energy are commonly blamed for causing high energy costs in countries that have adopted ambitious clean energy targets. However, contrary to this widespread belief, the modelling exercise indicates that well-designed and implemented public measures can offer tangible benefits in the form of reduced household energy bills in countries with high baseline power costs. In Kenya, the LCOE of wind energy after derisking (USD 8.1 cents per kWh) is a full 53 percent lower than the unsubsidised baseline cost (USD 17.1 cents per kWh), creating potentially very large benefits for low-income ratepayers.
Derisking measures reduce the price premium in low-cost baseline countries.... and unlock savings in the high-cost baseline countries.
Well-designed and implemented public measures can offer tangible benefits in the form of reduced household energy bills.
Derisking Renewable Energy Investment26
Executive Summary
The results of the case studies, where fossil fuel subsidies have expressly been excluded, show that renewable energy is competitive against unsubsidised fossil fuel technologies in many developing countries. Globally, subsidies to fossil fuels are at least five times larger than financial incentives to renewable energy technologies (IEA, 2012) and distort the true competiveness of renewable energy (Schmidt et al., 2012). In low-baseline countries, the most cost-effective means of reducing direct financial incentives for renewable energy is to phase-out or phase-down fossil fuel subsidies. In high-baseline countries, fossil fuel subsidies that are intended to help the consumer may have the perverse effect of preventing investment in far more affordable renewable energy alternatives.
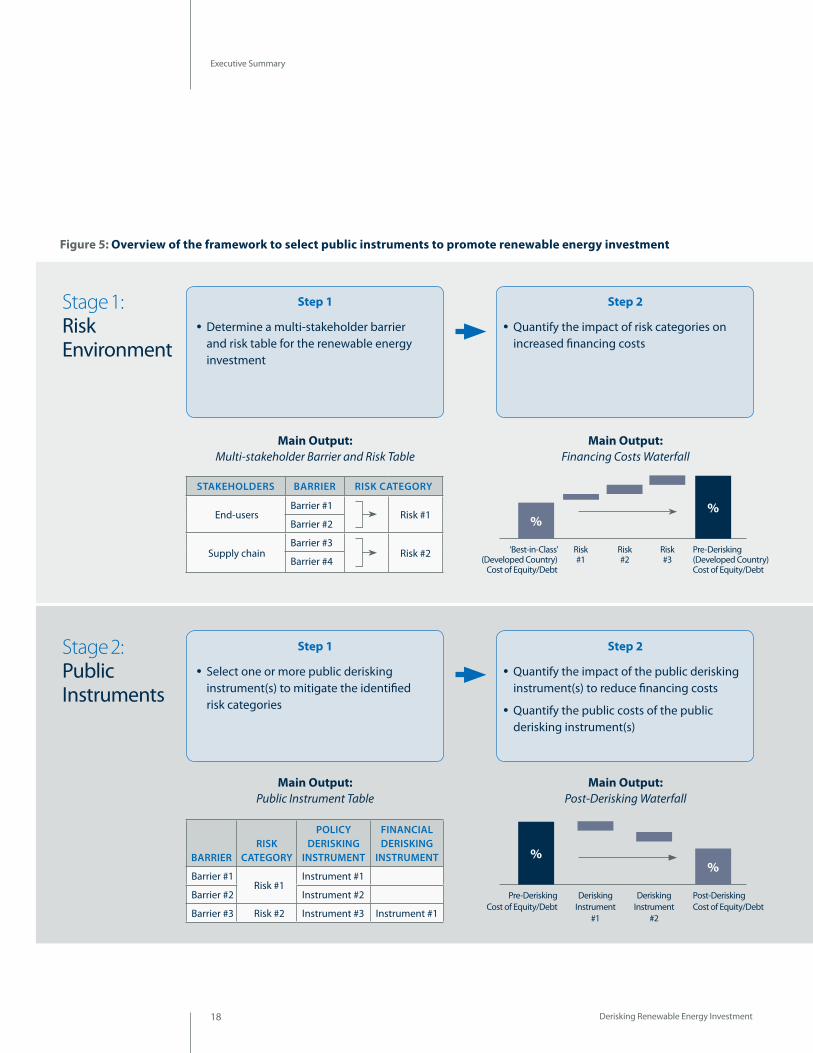
Scaling-Up Climate Change Mitigation Outcomes (Metric 4: Carbon Abatement)The modelling exercise presented in this publication shows that derisking renewable energy investment can lower the abatement costs of CO2 emissions in the four countries investigated. For example, in South Africa, meeting the 8.4 GW wind energy target over 20 years could result in emission reductions amounting to 604 million tonnes of CO2, with derisking measures reducing the cost of abatement from USD 12 to USD 8.20 per tonne of CO2.
The importance of derisking in reducing abatement costs is applicable to every developing country that has listed climate mitigation pledges under the Copenhagen Accord. It also has significant implications for the design of modalities and mechanisms to scale-up climate mitigation efforts, such as Nationally Appropriate Mitigation Actions (NAMAs), a reformed Clean Development Mechanism (CDM), New Market Mechanisms (NMMs), and public payments from vertical funds, such as the Global Environment Facility (GEF) and Green Climate Fund (GCF). A number of these international mechanisms envisage performance-based payments for emission reductions. The results of the case studies suggest the desirability of incorporating upfront grant-based derisking activities to complement performance-based payments in such mechanisms, thereby reducing the overall carbon abatement cost. Figure 8 below summarises this performance-based payment approach.
Figure 8: Scaled-up mitigation actions blending derisking instruments and performance-based payments
Policy & Financial Derisking
Public Support for Scaled-up Mitigation
Actions
Performance-based Payments
+=
Carbon Markets or Public Finance
Public Finance
Complementing performance-
based payment mechanisms with
derisking activities can reduce the overall carbon
abatement cost.
Derisking Renewable Energy Investment 27
Executive Summary
CONCLUSIONThere are many different ways to create markets for renewable energy, and the path each country takes will depend on its specific national context, goals and resource endowments.
A central conclusion of the report is that it is important for policymakers to address the risks to renewable energy investment in a systemic and integrated manner. In all four case study countries, the framework’s financing cost waterfalls clearly demonstrate that a range of risks exist in the investment environment. Any isolated, short-term effort focusing on a subset of risks and relying on a subset of instruments is unlikely to sustainably transform renewable energy markets.
A complementary conclusion is that investing in derisking measures, bringing down the financing costs of renewable energy, appears to be cost-effective when measured against paying direct financial incentives to compensate investors for higher risks. Instead of using scarce public funds to pay higher electricity tariffs, it can be advantageous to first reduce and manage typical renewable energy risks (for example, those associated with power markets, permits, and transmission), and thereby change the fundamental risk reward trade-off that energy investors face in a given country.
The framework introduced in this report can help to estimate the costs of derisking instruments and the amount of upfront grant required. It can also help to assess the direct financial incentives required to meet the derisked incremental costs of renewable energy and calibrate a performance-based payment scheme accordingly.
However, it is important to be realistic about the difficulties associated with modelling derisked incremental costs in the absence of what is often scarce historical empirical data and when confronting long-run uncertainties, such as those relating to technological evolution. The sensitivity analysis conducted for the four country case studies shows that relatively small changes in key model input parameters can result in major variations. The framework can support, but not substitute for, in-depth policy decision-making and consultation processes involving all key stakeholders.
Any isolated, short-term effort focusing on a subset of risks and relying on a subset of instruments is unlikely to sustainably transform renewable energy markets.

Derisking Renewable Energy Investment28
Introduction
Around the world, developing countries are seeking to rapidly scale-up renewable energy investment. This shift to renewable energy is driven by a number of considerations. Many developing countries are facing fast-growing energy demand coupled with increasing exposure to rising fossil fuel imports and prices. About 1.3 billion people still lack access to electricity and 2.7 billion to modern energy services (UN, 2011), with their human development held back through energy poverty. At the same time, rising global fuel prices and resource scarcities are making developing countries increasingly vulnerable to oil prices. Nine of the 25 low-income countries for which data are available already pay more than 10 percent of their gross domestic product (GDP) as an average over 2006-2010, to simply secure their oil supply (Economy Watch, 2011; Seth, 2012). This number is expected to increase in the future, given the transition from traditional energy sources (for example, fuel, wood and waste) to modern energy systems. On the other hand, costs of energy efficient and renewable energy technologies are falling and renewable energy is offering increasingly attractive investment opportunities.
The financial sums involved in a rapid shift to low-emission energy systems are enormous. UN-DESA, for example, has estimated that it would cost up to USD 250–270 billion per year to shift developing countries to 20 percent renewable energy by 2025 (DeMartino & Le Blanc, 2010). According to the Global Energy Assessment (GEA, 2012), global investment in energy efficiency and low-carbon energy generation will need to increase to between USD 1.7–2.2 trillion per year – compared to present levels of about USD 1.3 trillion per year – over the coming decades to meet the combined challenges of energy access, energy security and climate change. If developing countries are going to successfully scale-up their use of renewable energy, it is clear that private sector investment must be at the forefront.
Global capital markets, representing some USD 212 trillion in financial assets (McKinsey, 2011), including USD 71 trillion managed by institutional investors (CPI, 2013), in principle have the size and depth to step up to the investment challenge.6 The existence of significant potential for low-carbon investments, with many options already available and cost-effective, should make a compelling case for businesses, private investors and households to independently adopt mitigation and adaptation technologies. Nonetheless, investment in seemingly straightforward renewable energy technologies faces a range of informational, technical, institutional and financial barriers. As a result, global investment in renewable energy suffers from severe regional imbalances. Figure 9 compares investments in Organisation for Economic Cooperation and Development (OECD) countries, the BASIC countries (Brazil, South Africa, India and China) and others. Outside the BASIC countries, developing countries have consistently accounted for less than 10 percent of investment in clean energy over each of the last nine years (BNEF, 2013). In order to sustain and accelerate renewable market growth across all developing economies, significant public financial resources from both national and international actors will be required to establish an enabling investment environment to attract capital at scale.
The challenge of addressing these barriers to meet the increasing demand for clean energy has inspired the development of a wide array of policy and financing instruments to shift investments from fossil fuels to more climate-friendly alternatives. However, public policies to catalyse clean energy finance come at a cost for
Introduction
6 Many renewable energy investment opportunities should appeal to institutional investors (pension funds, insurance companies, etc.) seeking attractive, low-risk, long-term investment performance. Yet general infrastructure investment only accounts for around 1 percent of the asset allocation of the average pension fund, and specifically green infrastructure accounts for around 3 percent of that (BNEF, 2013). Institutional investors face a series of constraints in investing in renewable energy projects, including limitations on investing in illiquid assets, transaction costs to maintain a direct investment capability and sector diversification requirements. However, a recent study from CPI (2013) estimates that “with policy and investment practices properly aligned, pension funds and insurance companies could supply about a quarter of the equity and half of the debt renewable energy projects and all of the corporate equity and debt that would feed into renewable energy” to foster a low-carbon society.
Outside the BASIC countries,
developing countries have consistently
accounted for less than 10 percent of investment in
clean energy.

Derisking Renewable Energy Investment 29
2004 2005 2006 2007 2008 2009 2010 2011 2012
$54bn
$80bn
$114bn
$164bn
$191bn
$187bn
$251bn
$302bn
$269bn
9%
35%
56%
6%
27%
67%
6%
26%
68%
7%
27%
66%
7%
25%
68%
6%
22%
73%
5%
7%
6%
20%
74%
17%
76%
14%
84%
OECD Countries BASIC Countries Other Developing Countries
Introduction
industry, consumers or taxpayers. As such, and with an array of other development priorities competing for scarce public resources, the challenge for policymakers is to identify the most cost-effective policy portfolio tailored to the particular national energy context. A key constraint for policymakers to meet this challenge is that they currently lack means of quantitatively comparing different public instruments and their impacts. As a contribution to address this gap, this publication presents an innovative framework developed by UNDP to support decision-making for renewable energy investment.
The paper is structured in four chapters. Chapter 1 spells out the theory of change underpinning UNDP’s approach to derisking renewable energy investment. In Chapter 2, the overall structure and the individual steps of the framework are described. To illustrate its potential and limits, Chapter 3 applies the framework to large-scale, onshore wind energy development in four illustrative countries: Kenya, Mongolia, Panama and South Africa. Based on the findings of the four-country study, Chapter 4 discusses the implications of the framework for public interventions to promote renewable energy market transformation.
Figure 9: Investments in clean energy by type of countries (USD billions)
Source: Bloomberg New Energy Finance (2013)

●● 1.1 High Financing Costs for Renewable Energy
●● 1.2 The Role of Public Instruments in Reducing Financing Costs
●● 1.3 Challenges to Identifying an Appropriate Public Instrument Mix
The Role of Public Instruments in Reducing Financing Costs for Renewable Energy in Developing Countries Chapter 1
Derisking Renewable Energy Investment 31
1Historically, some of the most significant barriers to renewable energy development have been technical. Today, the lack of long-term operational experience, technical standards and quality control that plagued renewable energy technologies in the past has mostly been addressed. Renewable energy technologies have also shown considerable potential for price reduction.
However, the large upfront investment costs inherent to renewable energy remain a major impediment to the development of the sector in developing countries. This chapter describes the impact of high financing costs in developing countries on the financial viability of renewable energy investment. It then discusses how public instruments can improve the risk-reward profile of renewable energy investments, either by reducing risks or by providing a financial incentive, and thereby attracting private sector capital. It concludes with a discussion on the challenges in identifying an appropriate public instrument mix to cost-effectively address investment barriers and associated risks.
1.1 HIGH FINANCING COSTS FOR RENEWABLE ENERGY INVESTMENT When analysing how to promote investment in renewable energy, a useful metric is the levelised cost of electricity (LCOE). While by no means a perfect metric,7 the use of the LCOE does allow for a like-for-like comparison of the life-cycle generation costs of different technologies. In this way, it provides a measure of a renewable energy technology’s competitiveness and can assist in determining the need for publicly- funded financial incentives. The LCOE is commonly used by policymakers, energy planners and researchers to support decision-making and formulate energy policy.
Figure 10 sets out the core drivers of the LCOE calculation. More detail on the LCOE formula, as used in the framework’s financial tool, can be found in Annex A. In simplified terms, the LCOE takes the life-cycle costs of an energy project and divides these costs by the project’s electricity generation over its lifetime, to give a cost per unit of electricity generated, for example, in USD cents per kWh. An LCOE calculation for any given energy technology takes into account both technology costs, made up of investment costs and O&M (including fuel costs), and financing costs, made up of the cost of equity and debt.
The Role of Public Instruments in Reducing Financing Costs for Renewable Energy in Developing Countries
Chapter 1: The Role of Public Instruments in Reducing Financing Costs for Renewable Energy in Developing Countries
7 Comparisons based on LCOE do not, for example, factor in the costs of intermittency balancing and the different value of peak/off peak generation costs (Joskow, 2011) or portfolio and merit-order effects with renewable energy. However, for the purposes of feed-in tariff design and in the less mature power markets often found in developing countries, LCOE is well suited (Schmidt et al., 2012). In addition, it should be noted that LCOE focuses on generation costs, and does not capture the macro-economic benefits of fuel price certainty, greenhouse gas abatement, green employment, energy security and other aspects (Kammen and Pacca, 2004).

Derisking Renewable Energy Investment32
Technology costs for new renewable energy technologies have experienced a remarkably steady decrease in investment costs over the past decades (IRENA, 2012a, IPCC, 2011; Peters et al., 2011). In the case of solar PV energy, module costs have fallen from about USD 40 per Watt in 1979 to USD 0.90 in 2012 (IRENA, 2012a), realising a near 98 percent cost reduction over the period.
Given this rapid fall in renewable technology costs, it has been suggested that a sustained technology push by a few initial leader countries could prove enough to further reduce the generation cost of renewable energy and enable renewable energy to out-compete fossil fuels by the end of this decade (Lilliestam et al., 2012). However, this is unlikely to be the case in most developing countries in the near future. The barriers towards a full-scale transition to renewable energy lie not just in technology costs but also in the challenges associated with securing long-term affordable finance.
While the technology costs of many renewable energy technologies are rapidly declining, they continue to have high upfront investment costs compared with fossil fuel energy projects. Figure 11 illustrates the different cost profiles of electricity generation from wind energy and combined-cycle gas plants. Investment costs account for approximately 80% of the total lifetime technology costs for wind energy but only account for around 15% in the case of gas. Annual operating costs are relatively low for wind energy, but, due to the impact of fuel costs, predominate in the case of gas. In essence, renewable energy investments exchange long-term fuel costs for upfront investment costs.
Chapter 1: The Role of Public Instruments in Reducing Financing Costs for Renewable Energy in Developing Countries
USD/kWh
Levelised Cost ofElectricity (LCOE)
Cost of Equity
Financing Costs
Technology Costs
Operational Costs
Investment Costs/Depreciation
Cost of Debt
Figure 10: The core drivers of the LCOE

Derisking Renewable Energy Investment 33
Chapter 1: The Role of Public Instruments in Reducing Financing Costs for Renewable Energy in Developing Countries
As a consequence, project developers in developing countries often struggle to access the large quantities of upfront financing needed for renewable energy investments. When available, the cost of financing is often substantially higher than in developed countries. Given their upfront capital intensity, renewable energy projects are particularly sensitive to high costs of debt and equity. Over the long lifetimes of infrastructure investments, the impact of higher financing costs on renewable energy’s competitiveness can be quite substantial.
Furthermore, banks in some developing countries provide credit only on a short-term basis in order to manage lending risks, posing an additional challenge to renewable energy projects that require long-term financing to be cost-competitive. So, for example, for onshore wind in developed countries, wind projects seeking financing have been able to obtain commercial loans with tenors of up to 18 years (Tan, 2012), close to the anticipated lifetime of the underlying equipment. However, commercial loans for renewable energy in developing countries, where available, typically have a loan tenor equating to around only half or less of the project’s anticipated lifetime. Moreover, lenders tend to demand a higher contribution of equity from project developers when there is higher perceived investment risk. As the cost of debt is lower than the cost of equity, this increased share of equity can have a significant impact on overall financing costs.8
$2.0 m
$1.5 m
$1.0 m
$0.5 m
$0.0 m
Wind (onshore)
$2.0 m
$1.5 m
$1.0 m
$0.5 m
$0.0 m
YEAR
YEAR
0 1 2 3 4 5 6 7 8 9 10 11 12 13 14 15 16 17 18 19 20 21 22 23 24 25
0 1 2 3 4 5 6 7 8 9 10 11 12 13 14 15 16 17 18 19 20 21 22 23 24 25
Gas (combined cycle)
Investment Costs Operating Cost (including Fuel)
CO
STS
IN U
SD/M
W IN
STA
LLED
Figure 11: The different capital intensity of electricity production from wind energy and combined cycle gas
For technology assumptions, see inputs for wind energy and gas (CCGT) in Section A.3 (Annex A).
8 Upcoming Basel III regulations in the financial sector could unintentionally further limit the ability of banks to provide long-term, non-recourse project finance (BNEF, 2013). Under Basel III, renewable energy projects cannot be counted as liquid and will negatively affect the liquidity coverage ratio of banks.
Given their upfront capital intensity, renewable energy projects are particularly sensitive to high financing costs.
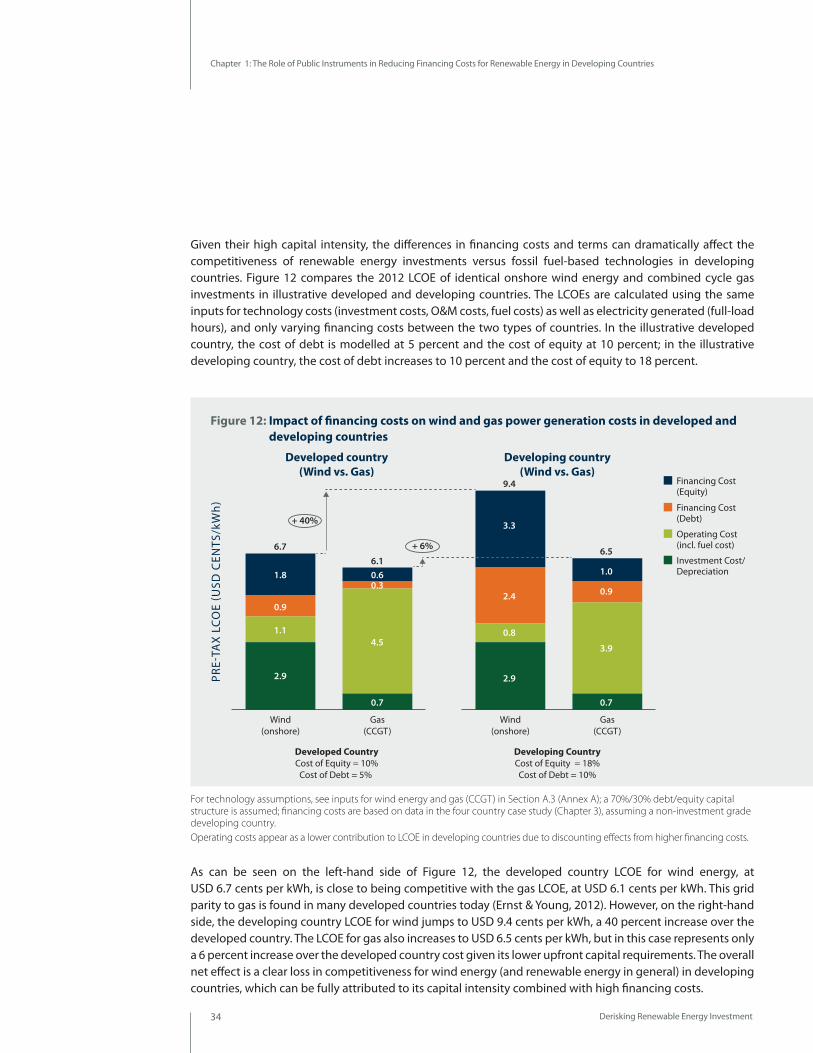
Derisking Renewable Energy Investment34
As can be seen on the left-hand side of Figure 12, the developed country LCOE for wind energy, at USD 6.7 cents per kWh, is close to being competitive with the gas LCOE, at USD 6.1 cents per kWh. This grid parity to gas is found in many developed countries today (Ernst & Young, 2012). However, on the right-hand side, the developing country LCOE for wind jumps to USD 9.4 cents per kWh, a 40 percent increase over the developed country. The LCOE for gas also increases to USD 6.5 cents per kWh, but in this case represents only a 6 percent increase over the developed country cost given its lower upfront capital requirements. The overall net effect is a clear loss in competitiveness for wind energy (and renewable energy in general) in developing countries, which can be fully attributed to its capital intensity combined with high financing costs.
Given their high capital intensity, the differences in financing costs and terms can dramatically affect the competitiveness of renewable energy investments versus fossil fuel-based technologies in developing countries. Figure 12 compares the 2012 LCOE of identical onshore wind energy and combined cycle gas investments in illustrative developed and developing countries. The LCOEs are calculated using the same inputs for technology costs (investment costs, O&M costs, fuel costs) as well as electricity generated (full-load hours), and only varying financing costs between the two types of countries. In the illustrative developed country, the cost of debt is modelled at 5 percent and the cost of equity at 10 percent; in the illustrative developing country, the cost of debt increases to 10 percent and the cost of equity to 18 percent.
Chapter 1: The Role of Public Instruments in Reducing Financing Costs for Renewable Energy in Developing Countries
Developed country(Wind vs. Gas)
Developed CountryCost of Equity = 10%
Cost of Debt = 5%
Developing CountryCost of Equity = 18%Cost of Debt = 10%
Developing country(Wind vs. Gas)
PRE-
TAX
LC
OE
(USD
CEN
TS/k
Wh
)
Gas(CCGT)
Wind(onshore)
Gas(CCGT)
Wind(onshore)
Financing Cost (Equity)
Financing Cost (Debt)
Operating Cost (incl. fuel cost)
Investment Cost/Depreciation
2.9
1.1
0.9
1.8
6.7
+ 40%
0.7
4.5
0.30.66.1
2.9
0.8
2.4
3.3
9.4
0.7
3.9
0.9
1.0
6.5+ 6%
Figure 12: Impact of financing costs on wind and gas power generation costs in developed and developing countries
For technology assumptions, see inputs for wind energy and gas (CCGT) in Section A.3 (Annex A); a 70%/30% debt/equity capital structure is assumed; financing costs are based on data in the four country case study (Chapter 3), assuming a non-investment grade developing country.Operating costs appear as a lower contribution to LCOE in developing countries due to discounting effects from higher financing costs.

Derisking Renewable Energy Investment 35
Chapter 1: The Role of Public Instruments in Reducing Financing Costs for Renewable Energy in Developing Countries
1.2 THE ROLE OF PUBLIC INSTRUMENTS IN REDUCING FINANCING COSTS
The higher financing costs for renewable energy in developing countries reflect a number of perceived or actual risks to investment (Glemarec, 2011; Glemarec et al., 2012). Some risks may be specific to renewable energy. For example, there may be shortcomings in new grid codes for renewable energy, or concerns regarding the ability of the grid to manage intermittent renewable energy sources. Other risks may reflect broader concerns regarding the investment environment in the particular country, such as poor macro-economic performance or political instability. Taken together, these higher financing costs can be understood as the extra reward required by investors to compensate them for the extra risks that come with capital-intensive, long-term renewable energy investments in developing economies.
Investors adjust their required risk/return profiles to take into account risks in the investment environment. As risks can result in negative financial impacts for investors, investors require a higher return to compensate for the possibility of this impact (Glemarec et al., 2012; McKinsey, 2012; DB Climate Change Advisors, 2011). The degree to which investors accurately price barriers and risks into their financial return requirements depends in practice on the particular type of investment being made (Box 1).
Box 1: How different investment types affect the pricing of risk into financing costs
A number of different factors can affect whether risks are priced into investor’s financing costs. These include:
●● Corporate finance vs. project structures. If a corporate finance structure is taken, a bank will typically lend on the strength of the business’ balance sheet, and the cost of debt is less likely to price in the specific risks faced by the renewable energy investment. If a project finance structure is taken, the only collateral a bank can have recourse to is the underlying assets of the investment. In this case, a bank is likely to perform detailed due diligence on the investment itself, and in turn will price in the various risks faced by the investment.
●● Core vs. non-core investments. If the investment is a non-core activity, the risks associated with the investment are less likely to affect financing costs. A common example of non-core activities in this context are energy efficient investments. As an illustration, an upgrade of an inefficient industrial boiler in a textile factory may simply use a cost of financing associated with the factory’s core activity (textile manufacturing). Here, the particular risks of the energy efficiency upgrade will have minimal affect on the financing costs used. On the other hand, if an investment is a core activity, the cost of financing used is more likely to incorporate the associated risks. An example is an energy efficient boiler upgrade in a textile factory where the investment is now fully outsourced to an energy service company (ESCO). The energy efficiency investment undertaken by the ESCO is now in line with the core activities of the ESCO, and as such the financing costs used are more likely to incorporate the particular risks of the energy efficient investment.
●● Unsophisticated vs. sophisticated investors. Generally, the more experienced and sophisticated the investor, the more capable the investor is of pricing in the particular risks. So, for example, an inexperienced IPP investing its own equity may underestimate the uncertainty associated with certain risks, resulting in a low cost of equity and overly aggressive bidding in a PPA-based bidding process. Similarly, commercial banks in an immature domestic financial sector may not be fully comfortable with investments related to renewable energy technologies, resulting in a conservatively priced high cost of debt.
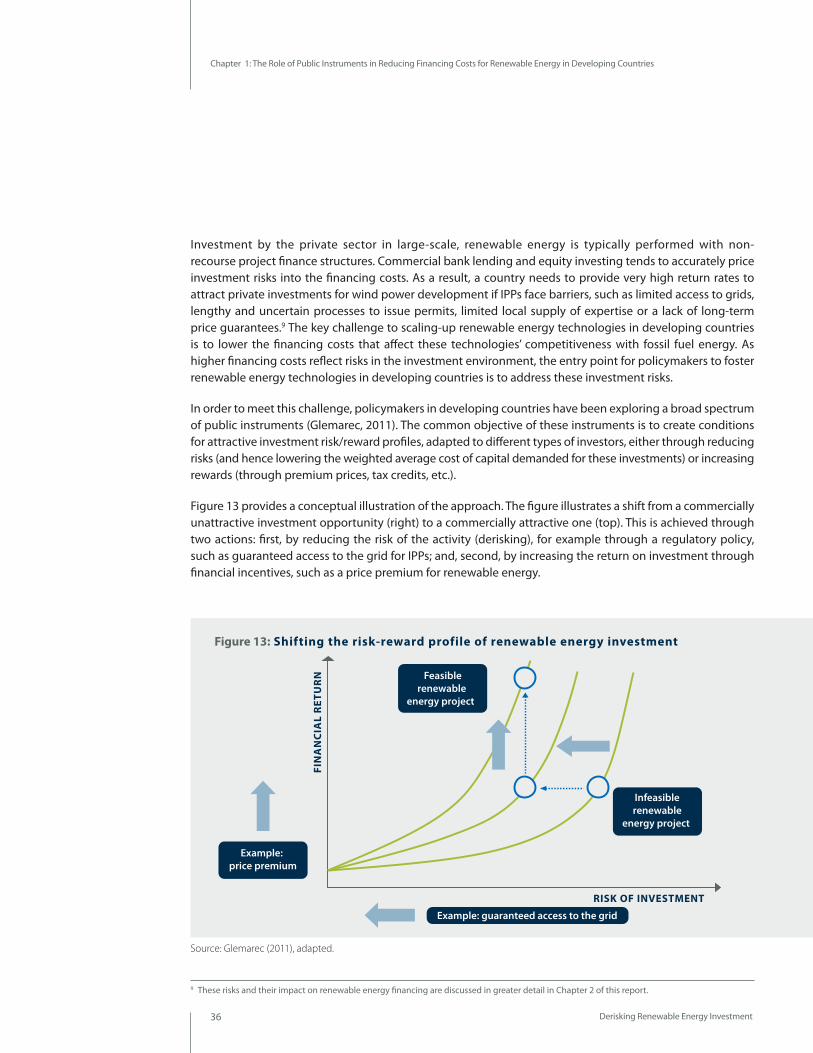
Derisking Renewable Energy Investment36
Investment by the private sector in large-scale, renewable energy is typically performed with non- recourse project finance structures. Commercial bank lending and equity investing tends to accurately price investment risks into the financing costs. As a result, a country needs to provide very high return rates to attract private investments for wind power development if IPPs face barriers, such as limited access to grids, lengthy and uncertain processes to issue permits, limited local supply of expertise or a lack of long-term price guarantees.9 The key challenge to scaling-up renewable energy technologies in developing countries is to lower the financing costs that affect these technologies’ competitiveness with fossil fuel energy. As higher financing costs reflect risks in the investment environment, the entry point for policymakers to foster renewable energy technologies in developing countries is to address these investment risks.
In order to meet this challenge, policymakers in developing countries have been exploring a broad spectrum of public instruments (Glemarec, 2011). The common objective of these instruments is to create conditions for attractive investment risk/reward profiles, adapted to different types of investors, either through reducing risks (and hence lowering the weighted average cost of capital demanded for these investments) or increasing rewards (through premium prices, tax credits, etc.).
Figure 13 provides a conceptual illustration of the approach. The figure illustrates a shift from a commercially unattractive investment opportunity (right) to a commercially attractive one (top). This is achieved through two actions: first, by reducing the risk of the activity (derisking), for example through a regulatory policy, such as guaranteed access to the grid for IPPs; and, second, by increasing the return on investment through financial incentives, such as a price premium for renewable energy.
Chapter 1: The Role of Public Instruments in Reducing Financing Costs for Renewable Energy in Developing Countries
Example: price premium
Example: guaranteed access to the grid
FIN
AN
CIA
L R
ETU
RN
RISK OF INVESTMENT
Infeasible renewable
energy project
Feasiblerenewable
energy project
Figure 13: Shifting the risk-reward profile of renewable energy investment
9 These risks and their impact on renewable energy financing are discussed in greater detail in Chapter 2 of this report.
Source: Glemarec (2011), adapted.

Derisking Renewable Energy Investment 37
Chapter 1: The Role of Public Instruments in Reducing Financing Costs for Renewable Energy in Developing Countries
Public derisking measures can broadly be divided into two groups: policy derisking instruments and financial derisking instruments.
●● Policy derisking instruments address and attempt to remove the underlying barriers that are the root causes of risks. These instruments utilise policy and programmatic interventions to mitigate risk. For example, renewable energy projects typically involve obtaining a number of permits and approvals, including generation licences, environmental impact assessments (EIAs) and land rights. Unclear and overlapping institutional responsibilities related to renewable energy permitting, or lack of staff experience with renewable energy, can increase transaction costs, delay revenues and discourage investment. A policy derisking approach might involve streamlining the permitting process, clarifying and standardizing institutional responsibilities, reducing the number of process steps and providing capacity building to programme administrators.
●● Financial derisking instruments do not seek to directly address the underlying barrier but, instead, function by transferring the risks that investors face to public actors, such as development banks. These instruments can include development banks loans and guarantees, political risk insurance and public equity co-investments. Financial derisking instruments can also indirectly address certain underlying barriers through learning-by-doing and track-record effects. For example, in countries with immature and under- capitalised financial sectors, local banks may be concerned about lending their limited capital to borrowers in an unproven sector such as renewable energy. Partial loan guarantees from a development bank can provide these local banks with the security they need to issue loans, whereby a portion of the risk of default is transferred to a public actor. In this way, financial derisking instruments can kick-start the local financial sector’s involvement in renewable energy.
Recognising that all risks cannot be eliminated through policy derisking or transferred through financial derisking, efforts to reduce risks might need to be complemented by a third group of public instruments, direct financial incentives, to compensate for any residual risks and costs. These incentives can take a number of different forms including price premiums, tax breaks, such as production tax credits, and proceeds from carbon offsets.
Derisking Renewable Energy Investment38
1.3 CHALLENGES TO IDENTIFYING AN APPROPRIATE PUBLIC INSTRUMENT MIX
To promote renewable energy at scale, policymakers typically need to proceed in two steps:
●● Select an appropriate combination of public instruments centred around a cornerstone instrument.
●● Assess the cost effectiveness of these different public instruments throughout the market transformation process.
i. Selecting an appropriate combination of public instruments
Identifying an appropriate combination of public instruments can prove very challenging in practice. The severity of investment barriers to renewable energy varies across locations and technologies. Selecting from the many hundreds of different public instruments (Glemarec, 2011) can be overwhelming. A public instrument can prove highly effective in one country context and face major compliance issues in another. Different resource endowments, market conditions and national goals mean that there is no one-size-fits-all ‘best’ public instrument mix.
Decision-makers tasked with selecting an optimal mix of public instruments will first need to survey all the investor risks to renewable energy development in the country. They will have to identify how underlying barriers affect different stakeholders and translate into investment risks. They will then have to identify a mix of public instruments that effectively target all major investment risks.
While policymakers can use a range of different instruments to address renewable energy investment risks and their underlying barriers, certain types of instruments have achieved greater prominence than others and are often referred to as ‘cornerstone instruments’. A cornerstone instrument targets key investment risks and is the foundation upon which all complementary policy and financial derisking instruments are built.
Mechanisms that provide renewable energy generators with a PPA, ensuring a fixed long-term price for power and guaranteed access to the electricity grid, are often the cornerstone instrument for renewable energy market transformation efforts. Such cornerstone instruments often referred to as feed-in tariffs (FiTs), but can also be designed around auctions or bidding processes.10 When necessary, FiTs can also include an above-market price, in the form of a premium, in order to increase the return on investment. Thus, FiTs are both a policy derisking instrument (market access to the grid and must-take requirements) and a financial derisking instrument (guaranteed price over a period of 15-25 years) that can also act, when needed, as a financial incentive instrument (through a price premium), shifting the entire risk-reward profile of a renewable energy investment. FiTs have become the most widely used mandated price and market instrument in the renewable electricity sector, having been adopted by at least 65 countries and 27 states/provinces as of 2012 (REN21, 2012).
Chapter 1: The Role of Public Instruments in Reducing Financing Costs for Renewable Energy in Developing Countries
10 Recognising that there are few clear dividing lines between FiTs and PPA-based auctions/bidding processes – both result in project developers entering into long-term PPAs at a fixed price – this report uses the term FiTs at times to cover both types of cornerstone instrument. For a comparative discussion on FiT and auctions/bidding in non-OECD countries see Becker and Fischer (2013).
A cornerstone instrument targets
key investment risks and is the
foundation upon which all
complementary policy and financial
derisking instruments
are built.

Derisking Renewable Energy Investment 39
Chapter 1: The Role of Public Instruments in Reducing Financing Costs for Renewable Energy in Developing Countries
FiTs are popular with developers and investors because they can mitigate the specific risks associated with the financial profile of renewable energy projects (von Flotow & Friebe, 2011; Bürer & Wüstenhagen, 2009). As discussed above, approximately 80 percent of the lifetime total technology cost of wind energy is related to upfront costs of the wind turbine, foundations and grid connection. By establishing a secure future revenue stream, FiTs minimise the risk associated with long-term, fixed-cost investments. As renewable energy generation is not exposed to variations in future fossil fuel prices, a FiT can thus dramatically improve the relative financial attractiveness of a renewable energy investment versus its conventional energy alternative.
Figure 14 below sets out the key components of a public instrument portfolio for large-scale renewable energy with a cornerstone instrument as the centerpiece, complemented by policy and financial derisking instruments, and, where necessary, direct financial incentives.
Figure 14: Public instrument selection for large-scale renewable energy
Source: Glemarec (2011), adapted.
+
Direct Financial Incentives (If positive incremental cost)
Examples:
FiT/PPA price premium
Select Cornerstone Instrument
Examples:
Feed-in tariff
PPA-based bidding process
Select Policy Derisking Instruments
Examples:
Long-term RE targets
Streamlined permits process
Improved O&M skills
Select Financial Derisking Instruments
Examples:
Public loans
Partial loan guarantees Tax credits
Carbon offsetsPolitical risk insurance

Derisking Renewable Energy Investment40
Most renewable market transformation efforts are likely to proceed by stages, with each stage usually combining a mix of policy and financial derisking instruments, supplemented by direct financial incentives as required. Indeed, some public instruments require considerable amounts of time and effort to develop in countries that do not already have the supporting institutions and systems in place. For example, institutional strengthening within ministries may be an important precursor to a well-designed FiT regime. For many public instruments to be effective, supporting actions may be required to ensure sufficient enabling conditions in the institutional and political environments.
Table 1 illustrates how policy derisking instruments to reduce grid/transmission risks, financial derisking measures to provide access to affordable long-term finance, and direct financial incentives to address above-average incremental costs could evolve over time. This renewable energy market transformation path will be specific to each country.
Chapter 1: The Role of Public Instruments in Reducing Financing Costs for Renewable Energy in Developing Countries
SHORT-TERM MEDIUM-TERM LONG-TERM
Policy Derisking Updated grid code for renewable energy
Building skills and expertise in grid management
Strengthening physical grid infrastructure
Financial●Derisking Providing direct public loans to project developers
Providing guarantees for commercial loans (engaging local financial sector)
Ideally standalone commercial loans. (Renewable energy is derisked)
Direct Financial Incentives
Adopting tax-based incentives
Phase out of fossil fuel subsidies
Ideally no renewable energy incentives. (Renewable energy is derisked and competitive)
Table 1: Examples of the evolution of public instruments in the short-, medium- and long-term.
Most renewable market
transformation efforts are likely
to proceed by stages, with each
stage usually combining a mix
of policy and financial derisking
instruments.

Derisking Renewable Energy Investment 41
ii. Assessing the cost effectiveness of public instruments
Another important factor in selecting an appropriate package of instruments is to determine their respective costs to assess their cost effectiveness. While a public instrument may be effective at reducing financing costs, the public expenditures required to achieve this might be disproportionate and therefore politically unbearable. The cost of policy derisking instruments is generally a function of their operational complexity, duration, and country implementation capacity. The costing of financial derisking instruments is complex, involving the transfer and sharing of risks.
Determining the cost and degree of direct financial incentives in the form of a price premium, production grants or tax exemptions can also prove difficult (Schmidt et al., 2012). As fuel prices, technology and policy evolve over time, incremental costs will tend to fall, requiring careful design and calibrating of public interventions. Such direct financial incentives for renewable energy are becoming particularly controversial in industrial countries and can place an unsustainable burden on public budgets (Frondel, 2008; Peters et al., 2012; Hoppmann, 2013). They are likely to prove even more problematic in developing countries. On the other hand, renewable energy investment typically leads to substantial development co-benefits in the form of job creation, energy security and improved quality of services, leading to a potential over-estimation of incremental costs to society (Ernst & Young, 2012; Bazilian et al., 2012).
Assessing the costs of public support for renewable energy is also likely to prove sensitive in the context of internationally-supported mitigation efforts. A number of the international modalities and mechanisms to scale-up mitigation efforts (CDM, NAMAs, GCF, GEF) envisage direct financial incentives to cover the incremental costs of low-carbon solutions. The calculation of such incremental costs, with all the associated methodological difficulties, adds another layer of complexity to the selection of an appropriate public instrument portfolio to promote renewable energy technologies.
A key constraint for policymakers in selecting an optimal combination of public instruments and deciding on the need for direct financial incentives is that they currently lack a way to quantitatively compare different public instruments and their impacts. In order to better understand and clearly communicate the impact of different combinations of public derisking instruments in a given context, UNDP has developed a framework that enables planners and decision-makers to identify appropriate combinations of derisking instruments and assess the need for direct financial incentives. Chapter 2 of the publication presents this framework.
Chapter 1: The Role of Public Instruments in Reducing Financing Cost for Renewable Energy in Developing Countries
While a public instrument may be effective ... the related public expenditures may be politically unbearable.

●● 2.1 Stage 1: Risk Environment
●● 2.2 Stage 2: Public Instruments
●● 2.3 Stage 3: Levelised Cost
●● 2.4 Stage 4: Evaluation
A Framework to Select Public Instruments to Promote Renewable Energy Investment Chapter 2

Derisking Renewable Energy Investment 43
2The objective of the framework presented in this report is to assist policymakers in selecting and quantifying the impact of public instruments on the level of investment in renewable energy. This can, in turn, support broader national objectives, such as fostering energy access, energy security and mitigating climate risks.
As discussed in Chapter 1, the theory of change11 underlying the framework is that reducing the financing costs for renewable energy investments in developing countries represents a major opportunity for policymakers to catalyse private finance. The capital intensity of renewable energy – with high upfront investment costs and low operational costs – results in renewable energy investments being especially sensitive to financing costs. Further, the financing costs for renewable energy investments in developing countries are typically high, reflecting investor perceptions of barriers to investment.
This theory of change draws from UNDP’s experience in renewable energy market transformation in over 80 developing economies (Glemarec et al., 2012), as well as from the findings of a recent research partnership with Deutsche Bank on Fits (DB Climate Change Advisors, 2011). Based on this theory of change, the framework examines how public instruments, through addressing barriers to investment, can reduce the financing costs of renewable energy investments and thereby lower their overall life-cycle costs. Figure 15 illustrates the impact of public instrument deployment, transforming a high pre-derisking life-cycle cost into a lower post-derisking life-cycle cost12.
A Framework to Select Public Instruments to Promote Renewable Energy Investment
Chapter 2: A Framework to Select Public Instruments to Promote Renewable Energy Investment
USD/kWh
USD/kWh
Pre-DeriskingLife-cycle Costs (LCOE)
Post-DeriskingLife-cycle Costs (LCOE)
Renewable Energy Renewable Energy
Cost of Equity Financing Costs
Technology Costs
Operational Costs
Investment Costs/Depreciation
Cost of Debt
Figure 15: Public derisking instruments can reduce financing costs of renewable energy investments
11 ‘Theory of change’ is an increasingly common concept used in international development (Vogel, 2012). While there is no single definition of the term, it is here used to articulate UNDP’s underlying assumptions of how and why change might happen as a result of a public programme’s actions.
12 In this figure, operational and investment costs are shown as remaining constant. There are two main reasons for this. First, it is recognised that barriers to investment can lead to higher operational and investment costs. For example, an investor may incur additional costs in a prolonged attempt to obtain permits if the permits process is poorly designed. Similarly, an investor may incur additional costs in flying technicians from abroad for project commissioning and O&M in the absence of a local supply of expertise. The framework is based on the assumption that the possibility of higher costs brought about by investor barriers are factored into the upfront investment decision and result in the investor demanding a higher return on investment, which translates into a higher cost of capital (McKinsey 2012, DB Climate Change Advisors, 2011). Second, the figure only addresses the role of public derisking instruments. The figure therefore does not include direct financial incentives, such as production tax credits or accelerated depreciation, which do reduce operational and investment costs.

Derisking Renewable Energy Investment44
Chapter 2: A Framework to Select Public Instruments to Promote Renewable Energy Investment
Selecting public instruments for renewable energy is highly dependent on national circumstances. Each country has its own particular renewable resources, objectives and constraints. Therefore, the framework is designed to be applied flexibly and to be tailored to a specific renewable energy technology and national context. As illustrated in Figure 16, the framework is organised into four stages, each of which addresses a key aspect of selecting and analysing public instruments. Each of these four stages is in turn divided into two steps.
●● Stage 1: Risk Environment assists in understanding how the existence of investment barriers can result in investment risks and thus in higher financing costs for renewable energy. The first step determines the set of barriers and risk categories relevant to the renewable energy investment type. The second step quantifies the impact of these risks on increasing the cost of equity or debt.
●● Stage 2: Public Instruments assists in understanding the effects of selected public instruments on reducing renewable energy financing costs. The first step selects public instruments that directly mitigate the identified barriers and risk categories. The second step quantifies the impact of the public instruments on each of cost of equity and debt.
●● Stage 3: Levelised Cost assists in understanding the degree to which reduced financing costs impact the life-cycle cost of the renewable energy investment. The first step calculates the LCOE for the baseline energy mix. The second step calculates the LCOE for the renewable energy investment, for both the pre- and post-derisking financing costs, and derives the incremental cost gap between the renewable energy and baseline. In order to facilitate this LCOE modelling, UNDP has developed a financial tool in Microsoft Excel, available at UNDP's website (www.undp.org), to accompany the framework.
●● Stage 4: Evaluation assists in assessing different public instrument packages using four performance metrics: (i) investment leverage ratio, (ii) savings leverage ratio, (iii) end-user affordability and (iv) carbon abatement. As the output of the framework is dependent on the accuracy of a large set of empirical data and assumptions, the second step performs sensitivity scenarios on key input assumptions.
The intent of the framework is not to provide one predominant numeric result, but instead is to facilitate a transparent, structured process whereby assumptions are made explicit, and can be checked, debated and enriched to strengthen the design of market transformation initiatives. This can assist in building a shared political understanding among key stakeholders of the need for a portfolio of public instruments and the composition of this portfolio to reduce investment risks and promote renewable energy technologies.
The remainder of Chapter 2 describes the main aspects of each of the frameworks four stages.
The framework is designed to
be applied flexibly and to be tailored
to a specific renewable energy
technology and national context.

Derisking Renewable Energy Investment 45
Chapter 2: A Framework to Select Public Instruments to Promote Renewable Energy Investment
Figure 16: Overview of the framework to support policymakers in selecting public instruments to promote renewable energy investment
Step 1●● Determine a multi-stakeholder
barrier and risk table for the renewable energy investment
Step 1●● Analyse the selected public
instrument(s) in terms of four key performance metrics
Step 1●● Select one or more public
derisking instrument(s) to mitigate the identified risk categories
Step 1●● Calculate the levelised cost of
electricity (LCOE) for the baseline energy generation mix in the particular country
Step 2●● Quantify the impact of risk
categories on increased financing costs
Step 2●● Perform sensitivity analyses on
key inputs and assumptions
Step 2●● Quantify the impact of the public
derisking instrument(s) to reduce financing costs
●● Quantify the public costs of the public derisking instrument(s)
Step 2●● Quantify the LCOE for renewable
energy investment in the (i) pre-derisking and (ii) post- derisking scenarios
●● Calculate the incremental cost (or savings) by comparing these scenarios vs. the baseline
Stage 1: Risk Environment
Stage 3: Levelised Cost
Stage 2: Public Instruments
Stage 4: Evaluation

Derisking Renewable Energy Investment46
Chapter 2: A Framework to Select Public Instruments to Promote Renewable Energy Investment
2.1 STAGE 1: RISK ENVIRONMENT. IDENTIFYING BARRIERS AND RISKS, AND QUANTIFYING THEIR IMPACT ON FINANCING COSTS
The overall objective of the framework is to assess how public instruments can reduce the financing costs of renewable energy, thereby lowering overall life-cycle costs. In order to achieve this, an initial task is to understand the current local investment environment, determining the barriers and risks that exist. A second task is to evaluate how these risks result in higher financing costs. This is the purpose of Stage 1: Risk Environment. Figure 17 visualizes the stage’s two steps and its two principal outputs: the multi-stakeholder barrier and risk table and the financing cost waterfall. The two steps are described in detail in the following sub-sections.
Figure 17: Overview of Stage 1: Risk Environment
Step 1 Step 2
●● Determine a multi-stakeholder barrier and risk table for the renewable energy investment
●● Quantify the impact of risk categories on increased financing costs
Main Output: Multi-stakeholder Barrier and Risk Table
STAKEHOLDERS BARRIER RISK CATEGORY
End-usersBarrier #1
Risk #1Barrier #2
Supply chainBarrier #3
Risk #2Barrier #4
Main Output: Financing Costs Waterfall
%%
‘Best-in-Class’(Developed Country)
Cost of Equity/Debt
Risk #2
Risk #3
Risk #1
Pre-Derisking(Developed Country)Cost of Equity/Debt
Stage 1: Risk Environment
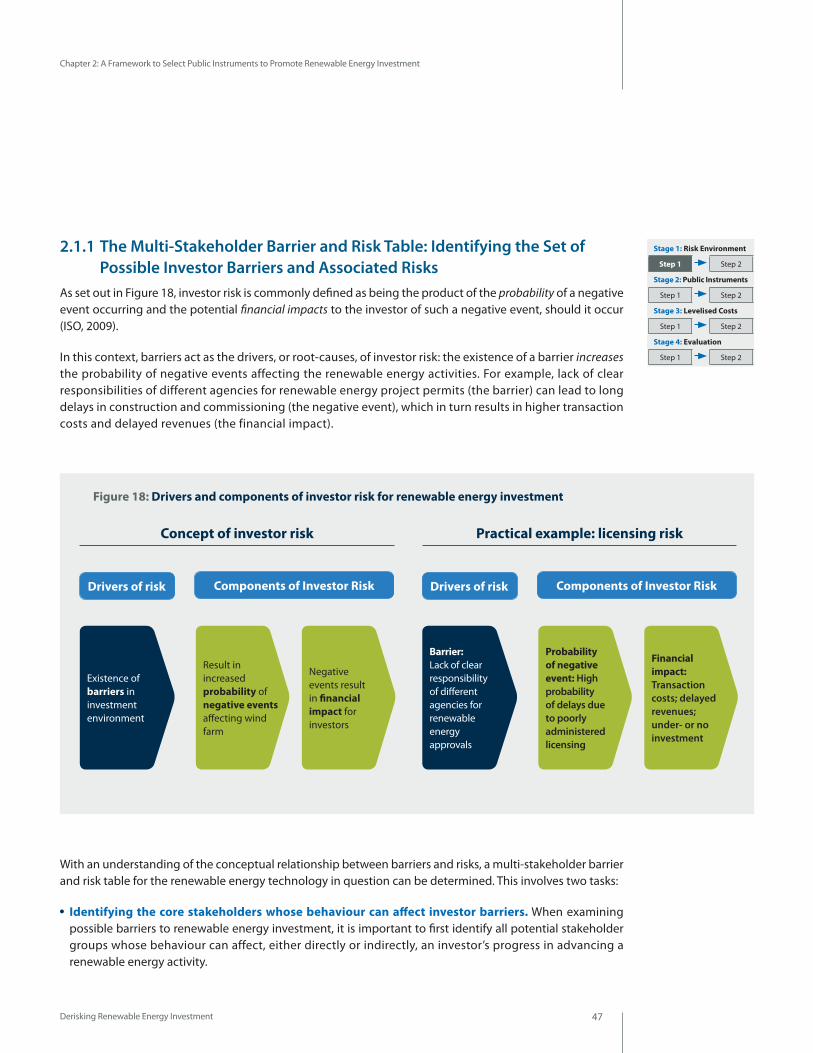
Derisking Renewable Energy Investment 47
Chapter 2: A Framework to Select Public Instruments to Promote Renewable Energy Investment
2.1.1 The Multi-Stakeholder Barrier and Risk Table: Identifying the Set of Possible Investor Barriers and Associated Risks
As set out in Figure 18, investor risk is commonly defined as being the product of the probability of a negative event occurring and the potential financial impacts to the investor of such a negative event, should it occur (ISO, 2009).
In this context, barriers act as the drivers, or root-causes, of investor risk: the existence of a barrier increases the probability of negative events affecting the renewable energy activities. For example, lack of clear responsibilities of different agencies for renewable energy project permits (the barrier) can lead to long delays in construction and commissioning (the negative event), which in turn results in higher transaction costs and delayed revenues (the financial impact).
Stage 1: Risk Environment
Step 1 Step 2
Stage 2: Public Instruments
Step 1 Step 2
Stage 3: Levelised Costs
Step 1 Step 2
Stage 4: Evaluation
Step 1 Step 2
Figure 18: Drivers and components of investor risk for renewable energy investment
Concept of investor risk Practical example: licensing risk
Drivers of risk Drivers of risk
Existence of barriers in investment environment
Barrier: Lack of clear responsibility of different agencies for renewable energy approvals
Result in increased probability of negative events affecting wind farm
Probability of negative event: High probability of delays due to poorly administered licensing
Negative events result in financial impact for investors
Financial impact: Transaction costs; delayed revenues; under- or no investment
Components of Investor Risk Components of Investor Risk
With an understanding of the conceptual relationship between barriers and risks, a multi-stakeholder barrier and risk table for the renewable energy technology in question can be determined. This involves two tasks:
●● Identifying the core stakeholders whose behaviour can affect investor barriers. When examining possible barriers to renewable energy investment, it is important to first identify all potential stakeholder groups whose behaviour can affect, either directly or indirectly, an investor’s progress in advancing a renewable energy activity.

Derisking Renewable Energy Investment48
Chapter 2: A Framework to Select Public Instruments to Promote Renewable Energy Investment
●● Identifying investor barriers and then grouping barriers into independent risk categories. Using each stakeholder as the starting point, an exercise can be performed to gather the full range of barriers in the investment environment. Barriers associated with each stakeholder can then be grouped into one risk category, resulting in a set of independent risk categories.
The following section describes in further detail each of these tasks:
i. Identifying the core stakeholders whose behaviour can affect investor barriers.
There are a range of stakeholder groups whose behaviour can, in some way, result in possible negative events for a renewable energy activity (Worlen, 2011; Glemarec et al., 2012). Building on lessons learned from its extensive project portfolio (Schwarz, 2010; Glemarec, 2011; Glemarec et al., 2012), UNDP’s experience has shown that large-scale renewable energy investment typically involves up to eight such stakeholder groups: (i) public sector policymakers, (ii) public sector administrators, (iii) end-consumers and the general public, (iv) project developers,13 (v) the supply chain, (vi) the utility (transmission company /grid operators), (vii) the utility (electricity purchaser)14 and (viii) investors (equity and debt). The behaviour of each of these stakeholder groups (either through action or inaction) can act as an impediment to the diffusion of renewable energy technologies. For example, a bank’s unfamiliarity with assessing large-scale solar PV projects can be an impediment to lending. Similarly, concerns held by the general public or local residents on the perceived negative environmental effects of wind energy can result in delays or cancellation of a wind energy project. In all cases, stakeholders face constraints with respect to acting in a way that is conducive to renewable energy investment – typically these constraints are informational, technical, regulatory or financial in nature. Table 2 describes each of these key stakeholder groups and gives examples of the constraints they can encounter. In preparing a barrier and risk table, it is critical that all the key stakeholder groups are considered. Addressing the barriers relating to only a few stakeholder groups can leave residual barriers unaddressed.
ii. Identifying investor barriers and then grouping barriers into risk categories.
Having identified all the core stakeholders, an exercise can then be performed to capture the full range of possible barriers associated with these stakeholder groups. This can be best achieved through a systematic analysis of the local market for the particular renewable energy – through interviews with stakeholders, investors, practitioners and literature15 reviews – to gain a good understanding of the role of each stakeholder group, their incentives and constraints, and how this may result in investor barriers.
Next, by using stakeholder groups as the organising basis, the various barriers identified can then be aggregated into risk categories. In this way, each risk category is associated with the stakeholder group that can address or mitigate it. For example, all barriers related to policymakers, which concern policies and regulation of power markets, can be grouped into a risk category called ‘power market risk’. Similarly, all barriers related to end-users and the general public can be grouped into a risk category called ‘social acceptance risk’. The end-result is a table with a reduced number of risk categories, where each risk category can easily be linked back to its stakeholder group and underlying barriers.
While most risk categories for the renewable energy technology in question can be determined via the stakeholder approach, there will also be a small number of national-level risk categories concerning the
13 Project developers can also often act as equity investors (a separate stakeholder group), or vice versa. In these cases a distinction is made between the individuals within the project developer focusing on technical matters (resource assessment, etc.) and financial matters (investment terms, etc.).
14 Depending on the local market structure, the utility may encompass both transmission/grid operator and purchasing roles, or alternatively these may be debundled. In this framework, they are generally represented separately.
15 For example, see Komendantova et al., 2011 & 2012; Oxera, 2011; and, Wang et al., 2004
Large-scale renewable energy
investment typically involves up to eight
stakeholder groups.
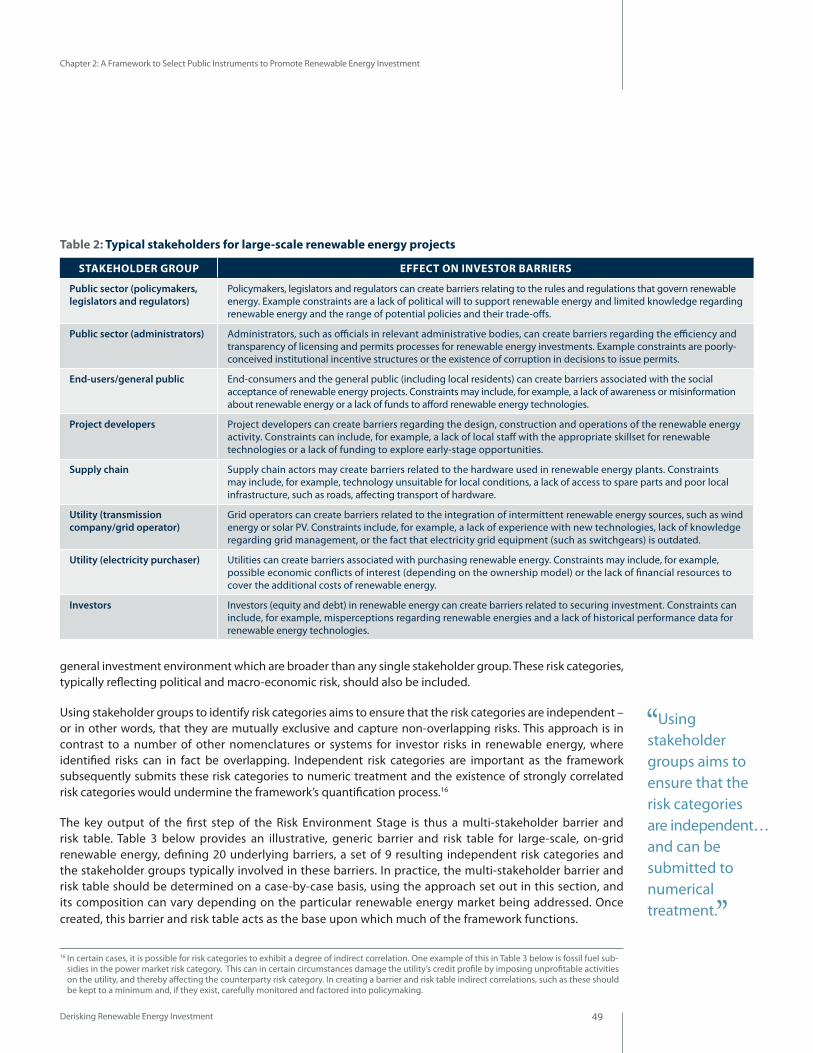
Derisking Renewable Energy Investment 49
Chapter 2: A Framework to Select Public Instruments to Promote Renewable Energy Investment
general investment environment which are broader than any single stakeholder group. These risk categories, typically reflecting political and macro-economic risk, should also be included.
Using stakeholder groups to identify risk categories aims to ensure that the risk categories are independent – or in other words, that they are mutually exclusive and capture non-overlapping risks. This approach is in contrast to a number of other nomenclatures or systems for investor risks in renewable energy, where identified risks can in fact be overlapping. Independent risk categories are important as the framework subsequently submits these risk categories to numeric treatment and the existence of strongly correlated risk categories would undermine the framework’s quantification process.16
The key output of the first step of the Risk Environment Stage is thus a multi-stakeholder barrier and risk table. Table 3 below provides an illustrative, generic barrier and risk table for large-scale, on-grid renewable energy, defining 20 underlying barriers, a set of 9 resulting independent risk categories and the stakeholder groups typically involved in these barriers. In practice, the multi-stakeholder barrier and risk table should be determined on a case-by-case basis, using the approach set out in this section, and its composition can vary depending on the particular renewable energy market being addressed. Once created, this barrier and risk table acts as the base upon which much of the framework functions.
16 In certain cases, it is possible for risk categories to exhibit a degree of indirect correlation. One example of this in Table 3 below is fossil fuel sub-sidies in the power market risk category. This can in certain circumstances damage the utility’s credit profile by imposing unprofitable activities on the utility, and thereby affecting the counterparty risk category. In creating a barrier and risk table indirect correlations, such as these should be kept to a minimum and, if they exist, carefully monitored and factored into policymaking.
Table 2: Typical stakeholders for large-scale renewable energy projects
STAKEHOLDER GROUP EFFECT ON INVESTOR BARRIERS
Public sector (policymakers, legislators and regulators)
Policymakers, legislators and regulators can create barriers relating to the rules and regulations that govern renewable energy. Example constraints are a lack of political will to support renewable energy and limited knowledge regarding renewable energy and the range of potential policies and their trade-offs.
Public sector (administrators) Administrators, such as officials in relevant administrative bodies, can create barriers regarding the efficiency and transparency of licensing and permits processes for renewable energy investments. Example constraints are poorly- conceived institutional incentive structures or the existence of corruption in decisions to issue permits.
End-users/general public End-consumers and the general public (including local residents) can create barriers associated with the social acceptance of renewable energy projects. Constraints may include, for example, a lack of awareness or misinformation about renewable energy or a lack of funds to afford renewable energy technologies.
Project developers Project developers can create barriers regarding the design, construction and operations of the renewable energy activity. Constraints can include, for example, a lack of local staff with the appropriate skillset for renewable technologies or a lack of funding to explore early-stage opportunities.
Supply chain Supply chain actors may create barriers related to the hardware used in renewable energy plants. Constraints may include, for example, technology unsuitable for local conditions, a lack of access to spare parts and poor local infrastructure, such as roads, affecting transport of hardware.
Utility (transmission company/grid operator)
Grid operators can create barriers related to the integration of intermittent renewable energy sources, such as wind energy or solar PV. Constraints include, for example, a lack of experience with new technologies, lack of knowledge regarding grid management, or the fact that electricity grid equipment (such as switchgears) is outdated.
Utility (electricity purchaser) Utilities can create barriers associated with purchasing renewable energy. Constraints may include, for example, possible economic conflicts of interest (depending on the ownership model) or the lack of financial resources to cover the additional costs of renewable energy.
Investors Investors (equity and debt) in renewable energy can create barriers related to securing investment. Constraints can include, for example, misperceptions regarding renewable energies and a lack of historical performance data for renewable energy technologies.
Using stakeholder groups aims to ensure that the risk categories are independent… and can be submitted to numerical treatment.

Derisking Renewable Energy Investment50
Chapter 2: A Framework to Select Public Instruments to Promote Renewable Energy Investment
Table 3: A generic multi-stakeholder barrier and risk table for large-scale, on-grid renewable energy deployment in developing countries
KEy STAKEHOLDER GROUP BARRIERS RISK CATEGORy
RISK DEFINITION
Public sector (legislators, policymakers)
●● Market outlook: lack of or uncertainty regarding governmental (renewable) energy strategy and targets
1. Power Market Risk
Risk arising from limitations and uncertainties in the power market, and/or suboptimal regulations to address these limitations and promote renewable energy markets
●● Market access and prices: limitations related to energy market liberalization; uncertainty related to access, the competitive landscape and price outlook for renewable energy; limitations in design of standard PPAs and/or PPA tendering procedures
●● Market distortions: such as high fossil fuel subsidies
Public sector (administrators)
●● Labor-intensive, complex processes and long time-frames for obtaining licenses and permits (generation, EIAs, land title) for renewable energy projects 2. Permits Risk
Risk arising from the public sector’s inability to efficiently and transparently administer renewable energy-related licensing and permits.●● High levels of corruption. No clear recourse
mechanisms
End-users, general public
●● Lack of awareness on renewable energy amongst consumers, end-users and local residents 3. Social
Acceptance Risk
Risks arising from lack of awareness and resistence to renewable energy in communities and end-users ●● Social and political resistance related to renewable
energy NIMBY concerns, special interest groups
Project developers, supply chain
●● For resource assessment and supply: inaccuracies in early-stage assessment of renewable energy resource; where applicable (e.g. bioenergy), uncertainties related to future supply and cost of resource
4. Resource & Technology Risk
Risks arising from uncertainties regarding renewable energy resource and technology (resource assessment; construction and operational use; hardware purchase and manufacturing)
●● For planning, construction, operations and maintenance: suboptimal plant design; lack of local firms offering construction, maintenance services; lack of skilled and experienced local staff; uncertainties related to securing land and limitations in civic infrastructure (roads etc.)
●● For the purchase and, if applicable, local manufacture of hardware: purchaser's lack of information on quality, reliability and cost of hardware; lack of local industrial presence and experience with hardware, including skilled and experienced local workforce

Derisking Renewable Energy Investment 51
Chapter 2: A Framework to Select Public Instruments to Promote Renewable Energy Investment
KEy STAKEHOLDER GROUP BARRIERS RISK CATEGORy
RISK DEFINITION
Utility (transmission company/grid operator)
●● Grid code and management: limited experience or suboptimal operational track-record of grid operator with intermittent sources (e.g. grid management and stability). Lack of standards for the integration of intermittent, renewable energy sources into the grid 5. Grid/
Transmission Risk
Risks arising from limitations in grid management and transmission infrastructure in the particular country●● Transmission infrastructure: inadequate or
antiquated grid infrastructure, including lack of transmission lines from the renewable energy source to load centres; uncertainties for construction of new transmission infrastructure
Utility (electricity purchaser)
●● Limitations in the utility's (electricity purchaser) credit quality, corporate governance, management and operational track-record or outlook; unfavourable policies regarding utility's cost-recovery arrangements
6. Counterparty Risk
Risks arising from the utility's poor credit quality and an IPP's reliance on payments
Investors (equity and debt)
●● Capital scarcity: Limited availablity of local or international capital (equity/and or debt) for green energy infrastructure due to, for example: under-developed local financial sector; policy bias against investors in green energy
7. Financial Sector Risk
Risks arising from general scarcity of investor capital (debt and equity) in the particular country, and investors' lack of information and track record on renewable energy
●● Limited experience with renewable energy: Lack of information, assessment skills and track-record for renewable energy projects amongst investor community; lack of network effects (investors, investment opportunities) found in established markets; lack of familiarity and skills with project finance structures
National Level
●● Uncertainty or impediments due to war, terrorism, and/or civil disturbance
8. Political Risk
Risks arising from country- specific governance and legal characteristics
●● Uncertainty due to high political instability; poor governance; poor rule of law and institutions
●● Uncertainty or impediments due to government policy (currency restrictions, corporate taxes)
National Level
●● Uncertainty due to volatile local currency; unfavorable currency exchange rate movements 9. Currency/
Macro- economic Risk
Risks arising from the country's macro-economic performance●● Uncertainty around inflation, interest rate outlook
due to an unstable macro-economic environment
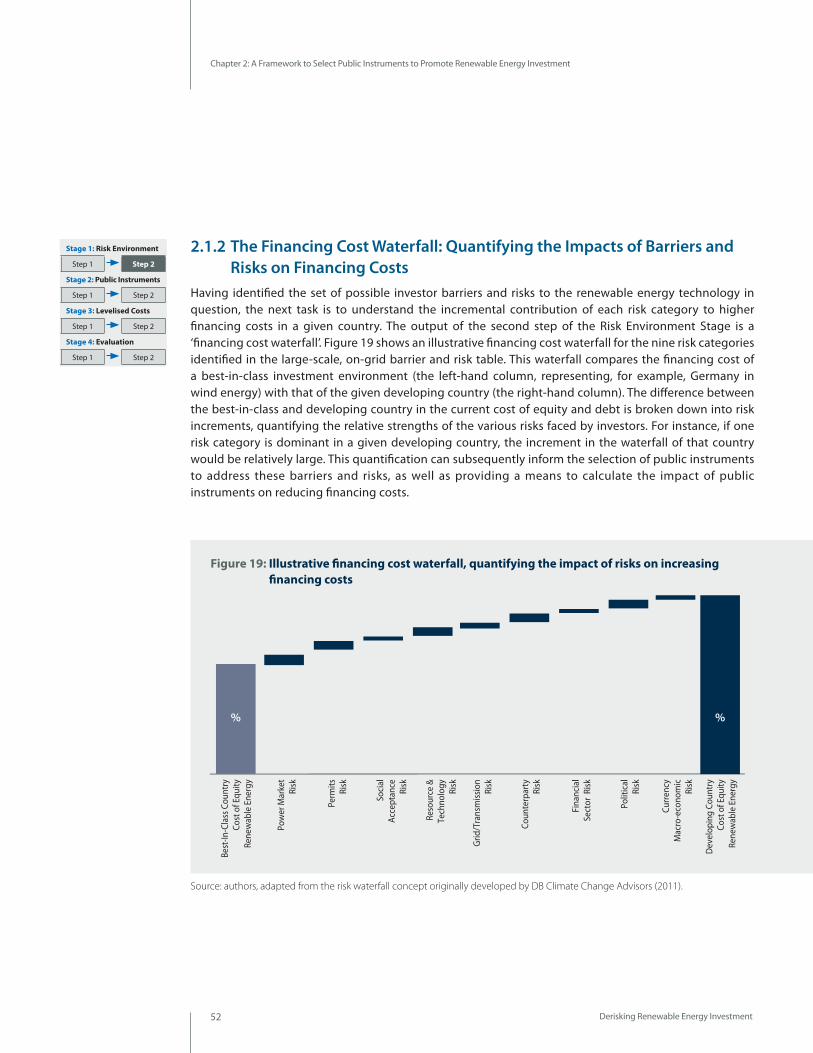
Derisking Renewable Energy Investment52
Chapter 2: A Framework to Select Public Instruments to Promote Renewable Energy Investment
2.1.2 The Financing Cost Waterfall: Quantifying the Impacts of Barriers and Risks on Financing Costs
Having identified the set of possible investor barriers and risks to the renewable energy technology in question, the next task is to understand the incremental contribution of each risk category to higher financing costs in a given country. The output of the second step of the Risk Environment Stage is a ‘financing cost waterfall’. Figure 19 shows an illustrative financing cost waterfall for the nine risk categories identified in the large-scale, on-grid barrier and risk table. This waterfall compares the financing cost of a best-in-class investment environment (the left-hand column, representing, for example, Germany in wind energy) with that of the given developing country (the right-hand column). The difference between the best-in-class and developing country in the current cost of equity and debt is broken down into risk increments, quantifying the relative strengths of the various risks faced by investors. For instance, if one risk category is dominant in a given developing country, the increment in the waterfall of that country would be relatively large. This quantification can subsequently inform the selection of public instruments to address these barriers and risks, as well as providing a means to calculate the impact of public instruments on reducing financing costs.
Stage 1: Risk Environment
Step 1 Step 2
Stage 2: Public Instruments
Step 1 Step 2
Stage 3: Levelised Costs
Step 1 Step 2
Stage 4: Evaluation
Step 1 Step 2
Best
-In-C
lass
Cou
ntry
Cos
t of E
quity
Rene
wab
le E
nerg
y
Dev
elop
ing
Coun
try
Cost
of E
quity
Rene
wab
le E
nerg
y
Pow
er M
arke
tRi
sk
Perm
itsRi
sk
Soci
alAc
cept
ance
Risk
Reso
urce
&Te
chno
logy Risk
Grid
/Tra
nsm
issio
nRi
sk
Coun
terp
arty
Risk
Fina
ncia
l S
ecto
r Ri
sk
Polit
ical
Risk
Curr
ency
Mac
ro-e
cono
mic
Risk
% %
Figure 19: Illustrative financing cost waterfall, quantifying the impact of risks on increasing financing costs
Source: authors, adapted from the risk waterfall concept originally developed by DB Climate Change Advisors (2011).

Derisking Renewable Energy Investment 53
Chapter 2: A Framework to Select Public Instruments to Promote Renewable Energy Investment
The concept of a financing cost waterfall was originally developed by Deutsche Bank (DB Climate Change Advisors , 2011) and is based on the assumption that investors price investment risks into the cost of financing. As discussed in Chapter 1, large-scale, renewable energy does indeed typically involve such pricing of risk (See Box 1, Section 1.2.).
The financing cost waterfall is constructed on the basis of the barrier and risk table. In a structured interview format, equity and debt investors are confronted with these categories and definitions and are asked to score the risk categories (See Box 2 below.). These risk scores, for each of cost of equity and debt, are then processed and risk waterfalls generated comparing the particular renewable energy investment in the developing country against a best-in-class country.
Separate waterfalls should be prepared for the cost of equity and the cost of debt. There is a need to distinguish between equity and debt financing as debt and equity investors have clearly different costs of financing, representing in large part debt’s seniority over equity. Equity and debt investors are also exposed to different sets of risks. Equity investors are involved from the outset of the project, including early development stages, and are therefore exposed to the full range of barriers and associated risk categories. Debt investors typically enter later in the process: commercial banks, for example, typically require a business plan, a licence and a PPA already in hand if they are to consider evaluating a funding proposal.
Box 2: Methodology for quantifying the impact of risk categories on increasing financing costs
1. InterviewsInterviews are held with debt and equity investors active in the particular renewable energy market being studied as well as in a best-in-class country.
The interviewees are asked to provide two types of data:
●● The current cost of financing for making an investment today, which represents the end-point of the waterfall (or the starting point in case of the best-in-class country).
●● Scores for the various risk categories identified in the barrier and risk framework. The scoring examines two aspects of barriers and risks, as set out in Figure 20.
(Continued over the page)
Q1: How would you rate the probability that the events underlying the particular risk category occur?
UNLIKELY 1 2 3 4 5 VERY LIKELY
Q2: How would you rate the financial impact of the events underlying the particular risk category, should the events occur?
LOW IMPACT 1 2 3 4 5 HIGH IMPACT
Figure 20: Interview questions to quantify the impact of risk categories on the cost of equity and debt

Derisking Renewable Energy Investment54
Chapter 2: A Framework to Select Public Instruments to Promote Renewable Energy Investment
Box 2: Methodology for quantifying the impact of risk categories on increasing financing costs (Continued)
2. Processing the data gathered
The data gathered from interviews is then processed. The basic methodology (more sophisticated statistical treatment can be used depending on the number of interviewees) involves identifying the total difference in cost of equity or debt between the developing country and the best-in-class developed country. This figure for the total difference reflects the total additional financing cost in the developing country.
The interview scores provided for each risk category address both components of risk (See Section 2.1.1.): the probability of a negative event occuring above the probability of such event occuring in a best-in-class country and the financial impact of the event if such an event occurs. These two ratings are then multiplied to obtain a total score per risk category. These total risk scores are then used to pro-rate and apportion the total difference in cost of equity or debt.
A very simplified example, demonstrating the basic approach, is shown in Figure 21.
COST OF EQUITY
Developing Country 16%
Best-in-class Developed Country
11%
Total Diference 5%
INVESTOR RISK SCORES FOR COST OF EQUITY
Incremental Score for
Probability Score for Impact
Total Risk Score
Risk Category # 1 4 X 4 = 16
Risk Category # 2 2 X 3 = 6
Risk Category # 3 3 X 3 = 9
Total Across all Risks 31
PRO-RATING RISK SCORES ACROSS COST OF EQUITY Pro-rated
Risk Score
Total Difference for Cost of
Equity
Risk Category
Cost of Equity
Risk Category # 1 16/31 X 5% = 2.6%
Risk Category # 2 6/31 X 5% = 1.0%
Risk Category # 3 9/31 X 5% = 1.4%
Total Across all Risks 5.0%
‘Best-in-Class’ (Developed
Country) Cost of Equity/Debt
Risk #2
Risk #3
Risk #1
Pre-Derisking(Developed Country)Cost of Equity/Debt
2.6%11%
1.0%1.4% 16%
Figure 21: Illustrative simplified application of the methodology to determine the impact of risk categories on increasing financing costs
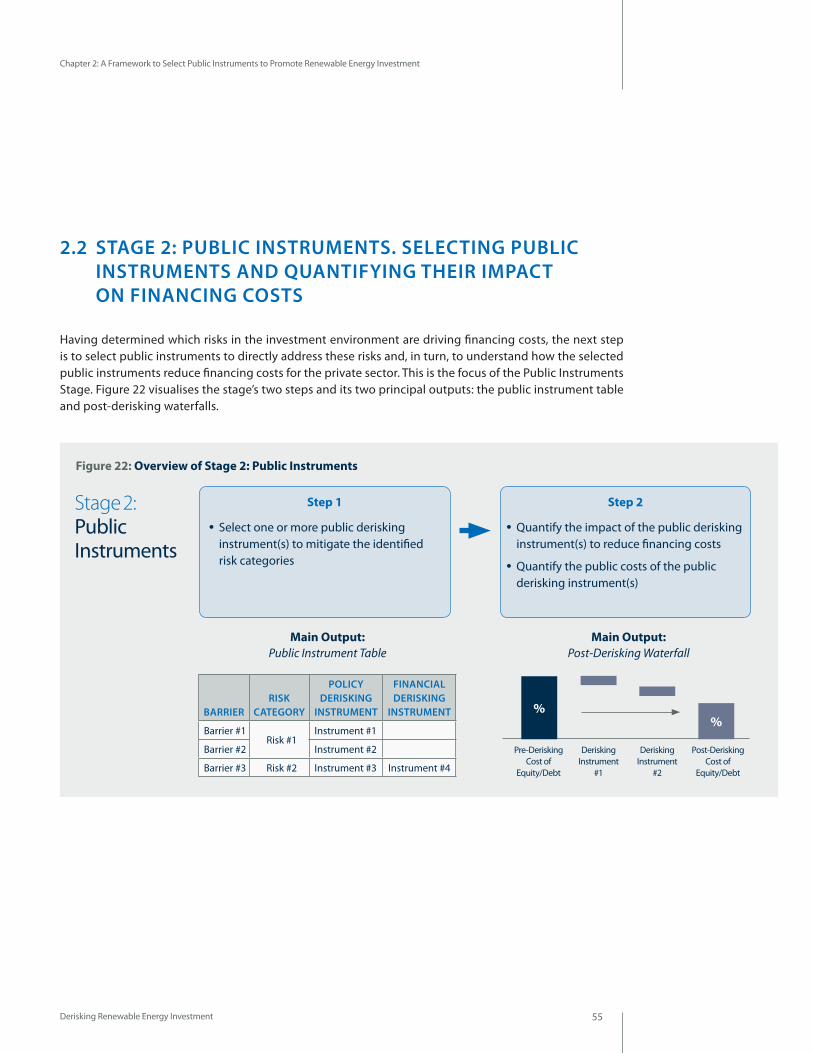
Derisking Renewable Energy Investment 55
Chapter 2: A Framework to Select Public Instruments to Promote Renewable Energy Investment
2.2 STAGE 2: PUBLIC INSTRUMENTS. SELECTING PUBLIC INSTRUMENTS AND QUANTIFYING THEIR IMPACT ON FINANCING COSTS
Having determined which risks in the investment environment are driving financing costs, the next step is to select public instruments to directly address these risks and, in turn, to understand how the selected public instruments reduce financing costs for the private sector. This is the focus of the Public Instruments Stage. Figure 22 visualises the stage’s two steps and its two principal outputs: the public instrument table and post-derisking waterfalls.
Figure 22: Overview of Stage 2: Public Instruments
Step 1 Step 2
●● Select one or more public derisking instrument(s) to mitigate the identified risk categories
●● Quantify the impact of the public derisking instrument(s) to reduce financing costs
●● Quantify the public costs of the public derisking instrument(s)
Main Output: Public Instrument Table
BARRIERRISK
CATEGORY
POLICY DERISKING
INSTRUMENT
FINANCIAL DERISKING
INSTRUMENT
Barrier #1Risk #1
Instrument #1
Barrier #2 Instrument #2
Barrier #3 Risk #2 Instrument #3 Instrument #4
Main Output: Post-Derisking Waterfall
%%
Pre-DeriskingCost of
Equity/Debt
DeriskingInstrument
#2
DeriskingInstrument
#1
Post-DeriskingCost of
Equity/Debt
Stage 2: Public Instruments
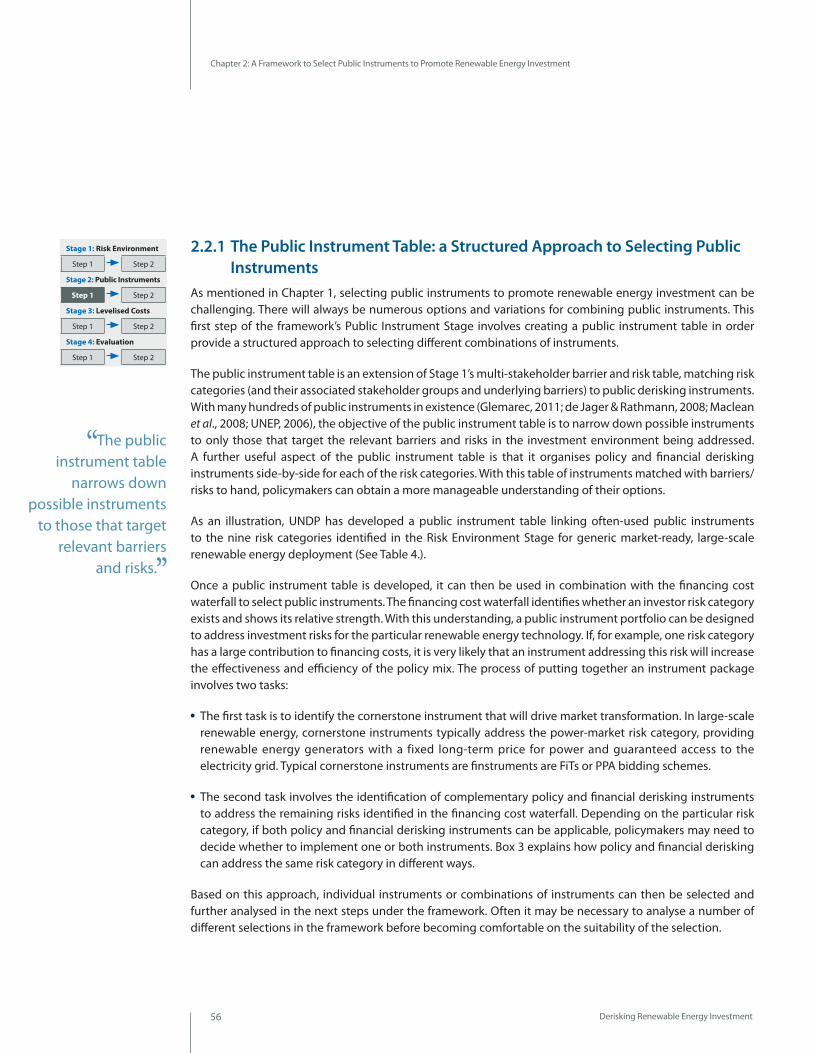
Derisking Renewable Energy Investment56
Chapter 2: A Framework to Select Public Instruments to Promote Renewable Energy Investment
2.2.1 The Public Instrument Table: a Structured Approach to Selecting Public InstrumentsAs mentioned in Chapter 1, selecting public instruments to promote renewable energy investment can be challenging. There will always be numerous options and variations for combining public instruments. This first step of the framework’s Public Instrument Stage involves creating a public instrument table in order provide a structured approach to selecting different combinations of instruments.
The public instrument table is an extension of Stage 1’s multi-stakeholder barrier and risk table, matching risk categories (and their associated stakeholder groups and underlying barriers) to public derisking instruments. With many hundreds of public instruments in existence (Glemarec, 2011; de Jager & Rathmann, 2008; Maclean et al., 2008; UNEP, 2006), the objective of the public instrument table is to narrow down possible instruments to only those that target the relevant barriers and risks in the investment environment being addressed. A further useful aspect of the public instrument table is that it organises policy and financial derisking instruments side-by-side for each of the risk categories. With this table of instruments matched with barriers/risks to hand, policymakers can obtain a more manageable understanding of their options.
As an illustration, UNDP has developed a public instrument table linking often-used public instruments to the nine risk categories identified in the Risk Environment Stage for generic market-ready, large-scale renewable energy deployment (See Table 4.).
Once a public instrument table is developed, it can then be used in combination with the financing cost waterfall to select public instruments. The financing cost waterfall identifies whether an investor risk category exists and shows its relative strength. With this understanding, a public instrument portfolio can be designed to address investment risks for the particular renewable energy technology. If, for example, one risk category has a large contribution to financing costs, it is very likely that an instrument addressing this risk will increase the effectiveness and efficiency of the policy mix. The process of putting together an instrument package involves two tasks:
●● The first task is to identify the cornerstone instrument that will drive market transformation. In large-scale renewable energy, cornerstone instruments typically address the power-market risk category, providing renewable energy generators with a fixed long-term price for power and guaranteed access to the electricity grid. Typical cornerstone instruments are finstruments are FiTs or PPA bidding schemes.
●● The second task involves the identification of complementary policy and financial derisking instruments to address the remaining risks identified in the financing cost waterfall. Depending on the particular risk category, if both policy and financial derisking instruments can be applicable, policymakers may need to decide whether to implement one or both instruments. Box 3 explains how policy and financial derisking can address the same risk category in different ways.
Based on this approach, individual instruments or combinations of instruments can then be selected and further analysed in the next steps under the framework. Often it may be necessary to analyse a number of different selections in the framework before becoming comfortable on the suitability of the selection.
The public instrument table
narrows down possible instruments
to those that target relevant barriers
and risks.
Stage 1: Risk Environment
Step 1 Step 2
Stage 2: Public Instruments
Step 1 Step 2
Stage 3: Levelised Costs
Step 1 Step 2
Stage 4: Evaluation
Step 1 Step 2
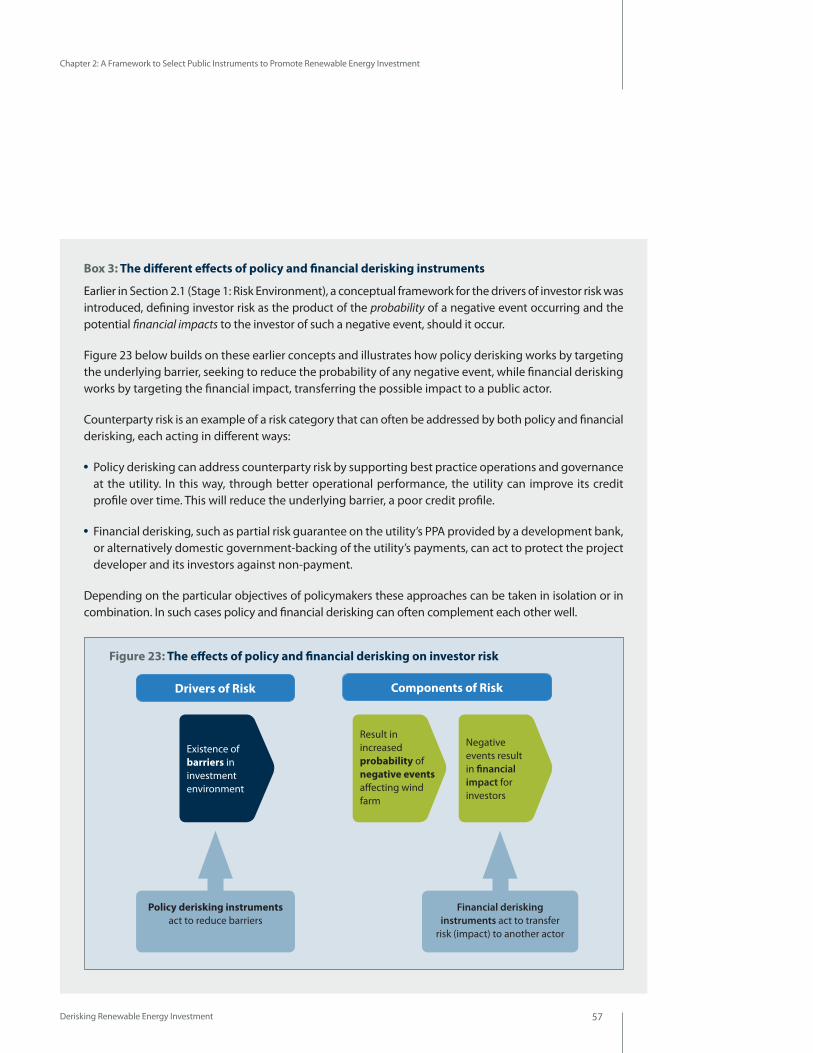
Derisking Renewable Energy Investment 57
Box 3: The different effects of policy and financial derisking instruments
Earlier in Section 2.1 (Stage 1: Risk Environment), a conceptual framework for the drivers of investor risk was introduced, defining investor risk as the product of the probability of a negative event occurring and the potential financial impacts to the investor of such a negative event, should it occur.
Figure 23 below builds on these earlier concepts and illustrates how policy derisking works by targeting the underlying barrier, seeking to reduce the probability of any negative event, while financial derisking works by targeting the financial impact, transferring the possible impact to a public actor.
Counterparty risk is an example of a risk category that can often be addressed by both policy and financial derisking, each acting in different ways:
●● Policy derisking can address counterparty risk by supporting best practice operations and governance at the utility. In this way, through better operational performance, the utility can improve its credit profile over time. This will reduce the underlying barrier, a poor credit profile.
●● Financial derisking, such as partial risk guarantee on the utility’s PPA provided by a development bank, or alternatively domestic government-backing of the utility’s payments, can act to protect the project developer and its investors against non-payment.
Depending on the particular objectives of policymakers these approaches can be taken in isolation or in combination. In such cases policy and financial derisking can often complement each other well.
Chapter 2: A Framework to Select Public Instruments to Promote Renewable Energy Investment
Policy derisking instruments act to reduce barriers
Financial derisking instruments act to transfer
risk (impact) to another actor
Drivers of Risk
Existence of barriers in investment environment
Result in increased probability of negative events affecting wind farm
Negative events result in financial impact for investors
Components of Risk
Figure 23: The effects of policy and financial derisking on investor risk

Derisking Renewable Energy Investment58
Chapter 2: A Framework to Select Public Instruments to Promote Renewable Energy Investment
Table 4: A generic public instrument table for large-scale, on-grid renewable energy deployment in developing countries (Part I)
BARRIERS MENU OF SELECTED PUBLIC INSTRUMENTS
RISK CATEGORy DESCRIPTION UNDERLyING BARRIERS KEy STAKEHOLDER GROUP
POLICy DERISKING INSTRUMENTS FINANCIAL DERISKING INSTRUMENTS
ACTIVITy DESCRIPTION ACTIVITy DESCRIPTION
1. Power Market Risk
Risk arising from limitations and uncertainties in the energy market, and/or sub-optimal regulations to address these limitations and promote renewable energy markets
●● Market outlook: lack of or uncertainties regarding governmental renewable energy strategy and targets
Public sector (policymakers,
legislators, regulators)
Establish transparent, long-term national renewable energy strategy and targets
National-level resource inventory/ mapping; establish national energy office; review technology options; renewable energy target formulation (as part of national energy planning)
●● Market access and prices: limitations related to energy market liberalization; uncertainty related to access, the competitive landscape and price outlook for renewable energy; limitations in design of standard PPAs and/or PPA tendering procedures
Establish a harmonized, well- regulated and unbundled energy market, with cornerstone instruments to address price and market-access risk for renewable energy projects
Unbundling of the energy market (generation, transmission, distribution); establish well-designed and transparent procedures for FIT, PPA tendering (or similar); well-designed, transparent policy on key clauses* for standard PPA
●● Market distortions: such as high fossil fuel subsidies Reform of fossil fuel subsidies
Assessment of fuel subsidies; phase- out/down of subsidies; awareness campaigns; design of transfer programs to vulnerable social groups
2. Permits Risk
Risk arising from the public sector’s inability to efficiently and transparently administer renewable energy-related licensing and permits
●● Labour-intensive, complex processes and long time-frames for obtaining licences and permits (generation, EIAs, land title) for renewable energy projects Public sector
(administrators)
Establish a one-stop-shop for renewable energy permits; streamline processes for permits
Establish institutional champion with clear accountability and appropriate expertise for renewable energy; harmonisation of requirements; reduction of process steps; training of staff in renewable energy
●● High levels of corruption. No clear recourse mechanisms
Contract enforcement and recourse mechanisms
Enforce transparent practices, renewable energy related corruption control and fraud avoidance mechanisms; establish effective recourse mechanisms
3. Social Acceptance Risk
Risks arising from lack of awareness and resistance to renewable energy in communities and end-users
●● Lack of awareness of wind energy amongst consumers, end-users, and local residents
End-users, general public
Awareness-raising campaigns targeting communities and end-users
Awareness campaigns, stakeholder dialogue and workshops with end-users, policymakers, and local residents.
●● Social and political resistance related to NIMBY concerns, special interest groups
Pilot models for community involvement at project sites
Community consultations including piloting models, such as in-kind services (energy access, local employment, etc.) or equity stakes in renewable energy projects
4. Resource & Technology Risk
Risks arising from use of the renewable energy resource and technology (resource assessment; construction and operational use; hardware purchase and manufacturing)
●● For resource assessment and supply: inaccuracies in early-stage assessment of renewable energy resource; where applicable (e.g. bioenergy), uncertainties related to future supply and cost of resource
Project developers, supply chain
Project development facility: capacity building for resource assessment
Dissemination of top-level, national resource assessment findings; grant funding for on-site resource assessment (depending on technology); capacity building for resource assessment.
●● For planning, construction, operations and maintenance: uncertainties related to securing land; sub-optimal plant design; lack of local firms offering construction, maintenance services; lack of skilled and experienced local staff; limitations in civil infrastructure (roads etc.)
Project development facility: feasibility studies; networking; training and qualifications
Industry conferences; grant funding for pre-feasibility studies (depending on technology); training, apprenticeships and university programmes to build skills (planning, construction, O&M).
●● For the purchase and, if applicable, local manufacture of hardware: purchaser's lack of information on quality, reliability and cost of hardware; lack of local industrial presence and experience with hardware, including skilled and experienced local workforce
Research and development; technology standards; exchange of market information (e.g. via trade fairs)
Test centre for research and development into long-term quality of equipment; standards, testing and certification; awareness campaigns and trade fairs
Financial products by development banks to assist manufacturers in gaining access to capital/funding
Depends on specific financial circumstances. Can include as necessary: public loans; public loan guarantees; public equity
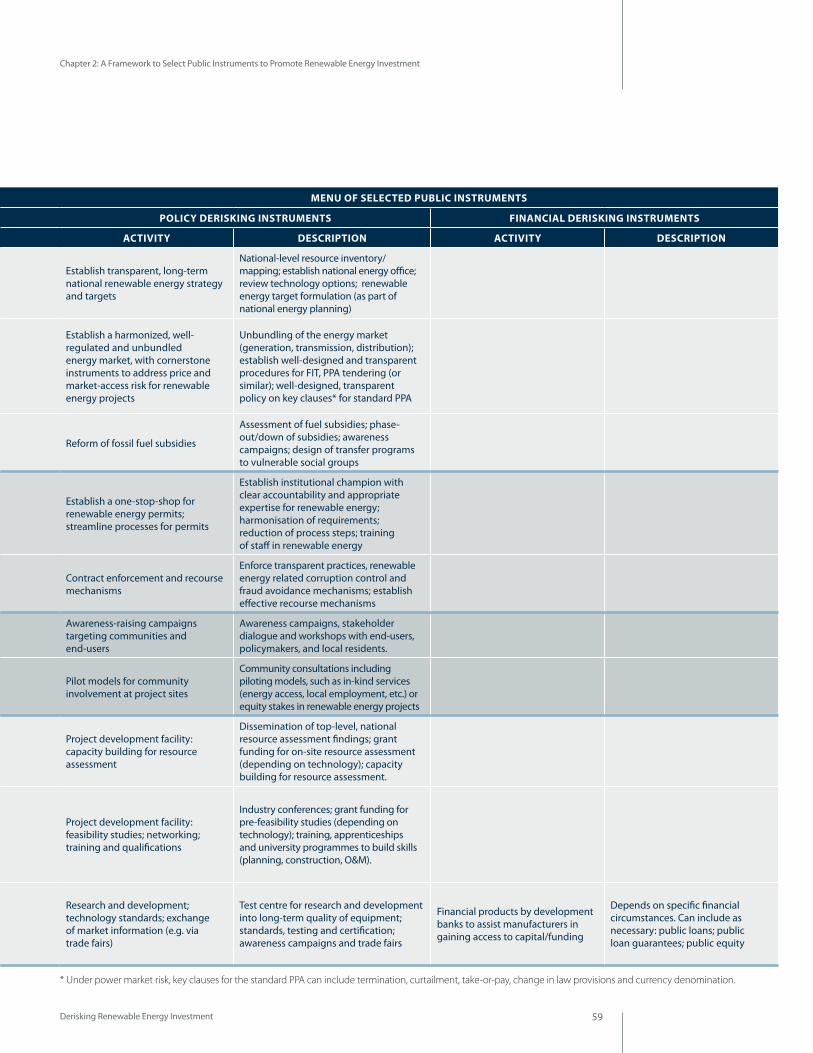
Derisking Renewable Energy Investment 59
Chapter 2: A Framework to Select Public Instruments to Promote Renewable Energy Investment
BARRIERS MENU OF SELECTED PUBLIC INSTRUMENTS
RISK CATEGORy DESCRIPTION UNDERLyING BARRIERS KEy STAKEHOLDER GROUP
POLICy DERISKING INSTRUMENTS FINANCIAL DERISKING INSTRUMENTS
ACTIVITy DESCRIPTION ACTIVITy DESCRIPTION
1. Power Market Risk
Risk arising from limitations and uncertainties in the energy market, and/or sub-optimal regulations to address these limitations and promote renewable energy markets
●● Market outlook: lack of or uncertainties regarding governmental renewable energy strategy and targets
Public sector (policymakers,
legislators, regulators)
Establish transparent, long-term national renewable energy strategy and targets
National-level resource inventory/ mapping; establish national energy office; review technology options; renewable energy target formulation (as part of national energy planning)
●● Market access and prices: limitations related to energy market liberalization; uncertainty related to access, the competitive landscape and price outlook for renewable energy; limitations in design of standard PPAs and/or PPA tendering procedures
Establish a harmonized, well- regulated and unbundled energy market, with cornerstone instruments to address price and market-access risk for renewable energy projects
Unbundling of the energy market (generation, transmission, distribution); establish well-designed and transparent procedures for FIT, PPA tendering (or similar); well-designed, transparent policy on key clauses* for standard PPA
●● Market distortions: such as high fossil fuel subsidies Reform of fossil fuel subsidies
Assessment of fuel subsidies; phase- out/down of subsidies; awareness campaigns; design of transfer programs to vulnerable social groups
2. Permits Risk
Risk arising from the public sector’s inability to efficiently and transparently administer renewable energy-related licensing and permits
●● Labour-intensive, complex processes and long time-frames for obtaining licences and permits (generation, EIAs, land title) for renewable energy projects Public sector
(administrators)
Establish a one-stop-shop for renewable energy permits; streamline processes for permits
Establish institutional champion with clear accountability and appropriate expertise for renewable energy; harmonisation of requirements; reduction of process steps; training of staff in renewable energy
●● High levels of corruption. No clear recourse mechanisms
Contract enforcement and recourse mechanisms
Enforce transparent practices, renewable energy related corruption control and fraud avoidance mechanisms; establish effective recourse mechanisms
3. Social Acceptance Risk
Risks arising from lack of awareness and resistance to renewable energy in communities and end-users
●● Lack of awareness of wind energy amongst consumers, end-users, and local residents
End-users, general public
Awareness-raising campaigns targeting communities and end-users
Awareness campaigns, stakeholder dialogue and workshops with end-users, policymakers, and local residents.
●● Social and political resistance related to NIMBY concerns, special interest groups
Pilot models for community involvement at project sites
Community consultations including piloting models, such as in-kind services (energy access, local employment, etc.) or equity stakes in renewable energy projects
4. Resource & Technology Risk
Risks arising from use of the renewable energy resource and technology (resource assessment; construction and operational use; hardware purchase and manufacturing)
●● For resource assessment and supply: inaccuracies in early-stage assessment of renewable energy resource; where applicable (e.g. bioenergy), uncertainties related to future supply and cost of resource
Project developers, supply chain
Project development facility: capacity building for resource assessment
Dissemination of top-level, national resource assessment findings; grant funding for on-site resource assessment (depending on technology); capacity building for resource assessment.
●● For planning, construction, operations and maintenance: uncertainties related to securing land; sub-optimal plant design; lack of local firms offering construction, maintenance services; lack of skilled and experienced local staff; limitations in civil infrastructure (roads etc.)
Project development facility: feasibility studies; networking; training and qualifications
Industry conferences; grant funding for pre-feasibility studies (depending on technology); training, apprenticeships and university programmes to build skills (planning, construction, O&M).
●● For the purchase and, if applicable, local manufacture of hardware: purchaser's lack of information on quality, reliability and cost of hardware; lack of local industrial presence and experience with hardware, including skilled and experienced local workforce
Research and development; technology standards; exchange of market information (e.g. via trade fairs)
Test centre for research and development into long-term quality of equipment; standards, testing and certification; awareness campaigns and trade fairs
Financial products by development banks to assist manufacturers in gaining access to capital/funding
Depends on specific financial circumstances. Can include as necessary: public loans; public loan guarantees; public equity
* Under power market risk, key clauses for the standard PPA can include termination, curtailment, take-or-pay, change in law provisions and currency denomination.

Derisking Renewable Energy Investment60
Chapter 2: A Framework to Select Public Instruments to Promote Renewable Energy Investment
Table 4: A generic public instrument table for large-scale, on-grid renewable energy deployment in developing countries (Part II)
BARRIERS MENU OF SELECTED PUBLIC INSTRUMENTS
RISK CATEGORy DESCRIPTION UNDERLyING BARRIERS KEy STAKEHOLDER GROUP
POLICy DERISKING INSTRUMENTS FINANCIAL DERISKING INSTRUMENTS
ACTIVITy DESCRIPTION ACTIVITy DESCRIPTION
5. Grid/Transmission Risk
Risks arising from limitations in grid management and transmission infrastructure in the particular country
●● Grid code and management: limited experience or suboptimal operational track-record of grid operator with intermittent sources (e.g. grid management and stability). Lack of standards for the integration of intermittent, renewable energy sources into the grid
Utility (transmission company, grid
operator)
Strengthen transmission company's operational performance, grid management and formulation of grid code
Develop a grid code for new renewable energy technologies; sharing of international best practice in grid management
●● Transmission infrastructure: inadequate or antiquated grid infrastructure, including lack of transmission lines from the renewable energy source to load centres; uncertainties for construction of new transmission infrastructure
Policy support for national grid infrastructure development
Develop a long-term national transmission/grid road-map to include intermittent renewable energy
Financial products by development banks to assist transmission companies in gaining access to capital/funding
Depends on specific financial circumstances. Can include as necessary: public loans; public loan guarantees; public equity
6. Counterparty Risk
Risks arising from the utility's poor credit quality and an IPP's reliance on payments
●● Limitations in the utility's (electricity purchaser) credit quality, corporate governance, management and operational track-record or outlook; unfavourable policies regarding utility's cost-recovery arrangements
Utility (electricity purchaser)
Strengthen utility/distribution company's performance
Establish international best practice in utility/distribution company's management, operations and corporate governance; implement sustainable cost recovery policies
Government guarantees or backing for PPA payments; counterparty guarantees offered by development banks
Depends on specific circumstances and division of risks in PPA. Can include, as necesssary: partial risk guarantees on PPA; counterparty guarantees as part of political risk insurance (PRI)
7. Financial Sector Risk
Risks arising from general scarcity of investor capital (debt and equity) in the particular country, and investors' lack of information and track record on renewable energy
●● Capital scarcity: Limited availablity of local or international capital (equity/and or debt) for green infrastructure due to, for example: under-developed local financial sector; policy bias against investors in green energy
Investors (equity and debt)
Financial sector policy reforms
Assess trade-offs between finanical stability regulation and renewable energy objectives (e.g. liquidity treatment); promote finanical sector policy favorable to long-term infrastructure, including project finance
Financial products by development banks to assist project developers to gain access to capital/funding
Depends on specific financial circumstances. Can include as necessary: public loans; public loan guarantees; public equity
●● Limited experience with renewable energy: Lack of information, assessment skills and track- record for renewable energy projects amongst investor community; lack of network effects (investors, investment opportunities) found in established markets; lack of familiarity and skills with project finance structures
Strengthen investors' (debt and equity) familiarity with and capacity regarding renewable energy projects
Industry-finance dialogues and conferences; workshops/training on project assessment and financial structuring (project finance); public- private partnership building
8. Political Risk
Risks arising from country-specific governance and legal characteristics
●● Uncertainty or impediments due to war, terrorism, and/or civil disturbance
National level
Risk sharing products by development banks to address political risk
Provision of political risk insurance (PRI) covering (i) expropriation, (ii) political violence, (iii) currency restrictions
●● Uncertainty due to high political instability; poor governance; poor rule of law and institutions
●● Uncertainty or impediments due to government policy (currency restrictions, corporate taxes)
9. Currency/ Macro-economic Risk
Risks arising from the broader macro-economic environment and market dynamics
●● Uncertainty due to volatile local currency; unfavourable currency exchange rate movements
National level●● Uncertainty around inflation, interest rate
outlook due to an unstable macro-economic environment

Derisking Renewable Energy Investment 61
Chapter 2: A Framework to Select Public Instruments to Promote Renewable Energy Investment
BARRIERS MENU OF SELECTED PUBLIC INSTRUMENTS
RISK CATEGORy DESCRIPTION UNDERLyING BARRIERS KEy STAKEHOLDER GROUP
POLICy DERISKING INSTRUMENTS FINANCIAL DERISKING INSTRUMENTS
ACTIVITy DESCRIPTION ACTIVITy DESCRIPTION
5. Grid/Transmission Risk
Risks arising from limitations in grid management and transmission infrastructure in the particular country
●● Grid code and management: limited experience or suboptimal operational track-record of grid operator with intermittent sources (e.g. grid management and stability). Lack of standards for the integration of intermittent, renewable energy sources into the grid
Utility (transmission company, grid
operator)
Strengthen transmission company's operational performance, grid management and formulation of grid code
Develop a grid code for new renewable energy technologies; sharing of international best practice in grid management
●● Transmission infrastructure: inadequate or antiquated grid infrastructure, including lack of transmission lines from the renewable energy source to load centres; uncertainties for construction of new transmission infrastructure
Policy support for national grid infrastructure development
Develop a long-term national transmission/grid road-map to include intermittent renewable energy
Financial products by development banks to assist transmission companies in gaining access to capital/funding
Depends on specific financial circumstances. Can include as necessary: public loans; public loan guarantees; public equity
6. Counterparty Risk
Risks arising from the utility's poor credit quality and an IPP's reliance on payments
●● Limitations in the utility's (electricity purchaser) credit quality, corporate governance, management and operational track-record or outlook; unfavourable policies regarding utility's cost-recovery arrangements
Utility (electricity purchaser)
Strengthen utility/distribution company's performance
Establish international best practice in utility/distribution company's management, operations and corporate governance; implement sustainable cost recovery policies
Government guarantees or backing for PPA payments; counterparty guarantees offered by development banks
Depends on specific circumstances and division of risks in PPA. Can include, as necesssary: partial risk guarantees on PPA; counterparty guarantees as part of political risk insurance (PRI)
7. Financial Sector Risk
Risks arising from general scarcity of investor capital (debt and equity) in the particular country, and investors' lack of information and track record on renewable energy
●● Capital scarcity: Limited availablity of local or international capital (equity/and or debt) for green infrastructure due to, for example: under-developed local financial sector; policy bias against investors in green energy
Investors (equity and debt)
Financial sector policy reforms
Assess trade-offs between finanical stability regulation and renewable energy objectives (e.g. liquidity treatment); promote finanical sector policy favorable to long-term infrastructure, including project finance
Financial products by development banks to assist project developers to gain access to capital/funding
Depends on specific financial circumstances. Can include as necessary: public loans; public loan guarantees; public equity
●● Limited experience with renewable energy: Lack of information, assessment skills and track- record for renewable energy projects amongst investor community; lack of network effects (investors, investment opportunities) found in established markets; lack of familiarity and skills with project finance structures
Strengthen investors' (debt and equity) familiarity with and capacity regarding renewable energy projects
Industry-finance dialogues and conferences; workshops/training on project assessment and financial structuring (project finance); public- private partnership building
8. Political Risk
Risks arising from country-specific governance and legal characteristics
●● Uncertainty or impediments due to war, terrorism, and/or civil disturbance
National level
Risk sharing products by development banks to address political risk
Provision of political risk insurance (PRI) covering (i) expropriation, (ii) political violence, (iii) currency restrictions
●● Uncertainty due to high political instability; poor governance; poor rule of law and institutions
●● Uncertainty or impediments due to government policy (currency restrictions, corporate taxes)
9. Currency/ Macro-economic Risk
Risks arising from the broader macro-economic environment and market dynamics
●● Uncertainty due to volatile local currency; unfavourable currency exchange rate movements
National level●● Uncertainty around inflation, interest rate
outlook due to an unstable macro-economic environment
Private sector instruments, such as hedging for currency risk or interest rate swaps, are commonly used to address this risk category but are not shown in this public instrument table.

Derisking Renewable Energy Investment62
Chapter 2: A Framework to Select Public Instruments to Promote Renewable Energy Investment
2.2.2 Post-Derisking Waterfall: Quantifying Public Instruments’ Impact on Reducing Financing Costs
The second step of Stage 2 consists of determining the cost-effectiveness of the selected public instruments. This involves two tasks:
●● Quantifying the impact of the public instruments in reducing financing costs
●● Estimating the public cost of the instruments
2.2.2.1 Quantifying the Impact of Public Instruments on Financing Terms
The main output of the second step of Stage 2 is a post-derisking waterfall. The post-derisking waterfall quantifies the impact of the selected instruments in reducing the financing costs associated with each investor risk category. It can be understood as the counterpart to the financing cost waterfall introduced in Section 2.1.2. Figure 24 shows an illustrative post-derisking waterfall for the cost of equity and the nine risk categories identified in the multi-stakeholder barrier and risk table introduced in Section 2.1.1.
Stage 1: Risk Environment
Step 1 Step 2
Stage 2: Public Instruments
Step 1 Step 2
Stage 3: Levelised Costs
Step 1 Step 2
Stage 4: Evaluation
Step 1 Step 2
Best
-In-C
lass
Cou
ntry
Cos
t of E
quity
Re
new
able
Ene
rgy
Dev
elop
ing
Coun
try
Cost
of E
quity
Rene
wab
le E
nerg
y
Pow
er M
arke
t Ri
sk
Perm
itsRi
sk
Soci
alAc
cept
ance
Risk
Reso
urce
& Te
chno
logy
Ri
sk
Grid
/Tra
nsm
issio
nRi
sk
Coun
terp
arty
Risk
Fina
ncia
l S
ecto
r Risk
Polit
ical
Risk
Curre
ncy
Mac
ro-e
cono
mic
Risk
% %
N/A*
Figure 24: Illustrative post-derisking cost of equity waterfall, identifying the impact of public instruments in reducing the incremental financing costs attributable to investor risk categories
Source: authors, adapted from the risk waterfall concept originally developed by DB Climate Change Advisors (2011). * Note: currency macro-economic risk is marked “N/A”, as the scope of the framework is limited to public derisking instruments.

Derisking Renewable Energy Investment 63
Chapter 2: A Framework to Select Public Instruments to Promote Renewable Energy Investment
The methodology for quantifying the post-derisking waterfall, like the financing cost waterfall (See Box 2.), is based on data gathering from structured interviews with renewable energy investors (equity and debt) and developers. In the interviews investors are asked to score, for example, using a scale from 1 to 5, their perception of the effectiveness of each selected public instruments to address its matching risk category. The data obtained from these interviews indicates investor perceptions and their likely reaction to public instruments. However, this feedback can be supplemented by previous local and international experiences in implementing public instruments in similar sectors, as local investors are seldom familiar with the internal workings of public instruments.
The outcome of this exercise is an estimate for each public derisking instrument’s effectiveness, for example 25 percent or 75 percent, which is then applied as a discount to its matching risk category increment in the financing cost waterfall and subsequently allows for the construction of the post-derisking waterfall.
In determining an estimate for the effectiveness of each public instrument in reducing its matching risk category, a common consideration is that the effectiveness of any public instrument is often unlikely to be 100 percent. This is due to a number of possible factors:
●● Residual risk. In certain cases, there may be residual risk that goes beyond the scope of the selected public instrument. For example, public instruments that address certain aspects of resource and technology risk, such as assisting with resource assessments or improving performance through technology standards, may not address shortcomings in general civil infrastructure, such as poor roads, which is another aspect of this risk category. In such a case, a residual risk will remain after deployment of the public instrument.
●● Timing effects. Underlying barriers are often entrenched and cannot be addressed overnight. As policy derisking instruments are often implemented over a number of years, their impacts may not be immediately realised. For example, UNDP’s work in the renewable energy sector shows that it can take over a decade for market transformation interventions to become fully effective (Glemarec et al., 2012). This timing element should be factored into the impact estimates.
●● Sub-optimal implementation. Implementing public instruments is a complex endeavour and delivering the intended outcomes on budget, on scope and on time can be challenging, especially as the underlying barriers, as indicated in Section 2.2.1, can involve multiple stakeholders. The overall renewable energy context is fast-moving and unforeseen developments (such as technology changes) may undermine the initial design of the instrument. As such, it can be prudent to anticipate a discount to full effectiveness of the instrument.
The effectiveness of any public instrument is often unlikely to be 100 percent.

Derisking Renewable Energy Investment64
Chapter 2: A Framework to Select Public Instruments to Promote Renewable Energy Investment
While the post-derisking waterfall assesses the impact of public instruments on the cost of equity and debt, reduced investor risk perception can also translate into increased capital structure gearing and increased loan tenors.17 This, in turn, additionally reduces financing costs. The accompanying UNDP financial tool for the framework enables users to adjust the gearing ratio and the tenor of debt instruments to reflect these two further potential sources of financing cost reduction.
Over time, and with better monitoring of the impact of public interventions on reducing financing costs, improved data on effectiveness of instruments may become available. It is recommended the assumptions for effectiveness are further investigated through sensitivity scenarios included in the Evaluation Stage (Stage 4, see Section 2.4.).
2.2.2.2 Determining the Cost of Public Instruments.
In addition to assessing the effectiveness of the selected public instruments, another important factor is determining their costs. For example, while a public instrument may be effective at reducing financing costs, the public expenditures required to achieve this might be disproportionate and therefore politically unbearable.
The task of costing the selected public derisking instruments ex-ante under the framework involves substantial data-gathering, benchmarking and financial modelling. This task is best addressed in two parts, each of which requires a different approach.
●● The costing of policy derisking instruments
●● The costing of financial derisking instruments
i. Costing of policy derisking instruments
Policy derisking instruments typically involve policy or programmatic interventions by the government or other actors on its behalf. For example, one policy derisking instrument to address social acceptance risk could involve piloting community based participation in renewable energy projects. In each case, the cost of a policy derisking instrument is a function of the specific circumstances found in the country, and can be estimated based on the following factors:
●● Budgeting core costs. While policy derisking instruments can involve a wide variety of activities, best practice typically involves three generic tasks that apply to all instruments: design, implementation and impact evaluation. A significant cost component arises from the staff time needed to perform these three stages. In addition, there may be additional costs, such as publicity costs (for awareness campaigns), certification workshops (for skills) and the cost of hardware or software (for demonstration projects).
17 The use of public instruments to improve the investment environment can result in a greater willingness of debt investors to contribute a larger share of the overall capital structure. As the cost of debt is lower than the cost of equity, this increased share can have a significant reduction on the overall financing costs. Similarly, the use of public instruments to improve the investment environment can result in improved (i.e. extended) loan tenors for renewable energy projects. Each additional year of loan tenor in the project lifetime reduces the annual debt servicing requirement in the early stages of a project, which can have a significant beneficial impact on discounted life-cycle cost.
Costing public derisking
instruments involves
data-gathering, benchmarking
and financial modelling.

Derisking Renewable Energy Investment 65
Chapter 2: A Framework to Select Public Instruments to Promote Renewable Energy Investment
●● Duration. Choices have to be made regarding the duration of the measure. Policy derisking interventions can sometimes be discrete and short-lived but, more commonly, involve longer-term, ongoing activities. One example of ongoing activities may be the establishment of a one-stop-shop government office for the streamlined issuance of permits. Another example may be power market regulations to promote renewable energy, which will need to be regularly monitored and updated to account for evolving market developments. In general, UNDP's experience shows that market transformation exercises take place over years rather than months. As such, the length of time that the policy derisking instrument is deployed is another key factor underlying costs.
●● Domestic versus international assistance. All policy derisking should be designed in accordance with domestic government priorities. The objective should be for domestic government employees to perform the design, implementation and monitoring of the instruments. In certain cases, international assistance from multilateral and bilateral development agencies, or from private sector specialists, may be required. In these cases, the different cost bases of domestic and international input should also be factored into the overall costs.
●● Economies of scale. Policy derisking instruments’ costs are only partly proportional to the scale of renewable energy investments they serve to derisk. So, if a large market share of a new technology is to be installed, this might lead to higher costs than if only a few additional megawatts are planned. However, most policy derisking instruments also exhibit strong economies of scale, meaning that the costs of these instruments do not, for instance, double if the target capacity is doubled.
ii. Costing of financial derisking instruments
Financial derisking instruments typically involve financial products, such as loan guarantees or political risk insurance, offered by public financial intermediaries, such as development banks. Estimating the cost of financial derisking instruments to the public purse can be challenging, as financial derisking involves the transfer and sharing of risks.
There are two aspects to the cost of financial derisking instruments: first, there is the cost to the public sector of providing these instruments; second, there is the cost to the renewable energy project developer for the rates and fees related to the instruments. The framework includes both of these aspects in its assessment of the cost effectiveness of the selected public instruments being analysed.
When determining the cost of financial derisking instrument to the public sector, several different approaches can be taken:
●● Capital deployed or in reserve. This approach bases the public cost on the capital deployed, or the capital reserve put in place, by the development bank. So, for example, if a loan of USD 50 million is made, the public cost can be accounted for as the total capital deployed of USD 50 million. Similarly, the treasury departments of development banks indirectly set aside capital reserves when they offer loan guarantees and political risk insurance. This is a commonly used approach, for example, taken by the report of the Advisory Group on Climate Change Financing (UN, 2010).

Derisking Renewable Energy Investment66
Chapter 2: A Framework to Select Public Instruments to Promote Renewable Energy Investment
●● Attributing no public cost. This approach is based on the rationale that if a development bank offers a loan to a renewable energy project and assuming the borrower does not default, then the development bank should receive the principal and interest back in full. Similarly, unless there is a default, development banks should not incur capital losses on guarantees and political risk insurance. In practice, it is often the case that development banks often break even or make a small surplus on such financial derisking products. Assuming that lending and pricing of products is on a non-concessional basis, a case can be made for attributing no public cost.
●● Capital losses. This approach adopts a similar rationale to the ‘no public cost’ approach but recognises that, on occasion, there will in fact be a default on a financial derisking product and that, in such cases, the development bank will entail a capital loss. These losses can then be considered the public cost. In this instance, the cost of the financial derisking instrument can be estimated by applying a loss rate over the capital deployed, preferably based on a historical track record well suited to the particular investment environment.
A further consideration when taking the ‘capital reserve’ approach to public cost is the issue of leveraging paid-in capital to a development bank. This refers to a development bank’s ability to issue bonds on the capital markets and then to use the proceeds from the bond sales for non-concessional financial derisking products. The Advisory Group on Climate Change Financing (UN, 2010) estimated that large multilateral development banks (typically with AAA credit ratings), such as the World Bank, can leverage 3.5 times their paid-in capital. A development bank’s ability to benefit from this will vary on a case-by-case basis – many development banks, particularly national banks in developing countries, may simply not access the capital markets in this way. Other development banks may do so, but their credit profile may result in a lower leverage ratio.
When determining the cost of financial derisking instruments to the renewable energy project developer, it is recommended that data on rates and fees are gathered in consultation with local public financial intermediaries. An important aspect to be determined is whether the instrument is offered on a non-concessional (market rate) or concessional (subsidised rate) basis. Fees can include, for example, front-end fees, which are paid for arranging the financial derisking instrument, as well as annual fees or premia, which are paid on a regular basis during the lifetime of the instrument. Each development bank typically prices its products based on in-house risk and pricing models, and in practice pricing is tailored to the particular profile of each renewable energy project. For the purpose of the framework, it is generally sufficient to estimate the costs for a typical profile of an investor in the renewable energy market being assessed.
The accompanying UNDP financial tool for the framework enables users to input the costs both to the public sector, as well as to renewable energy project developers. The fees to renewable energy project developers are incorporated in the the cash flows for the renewable energy investment.
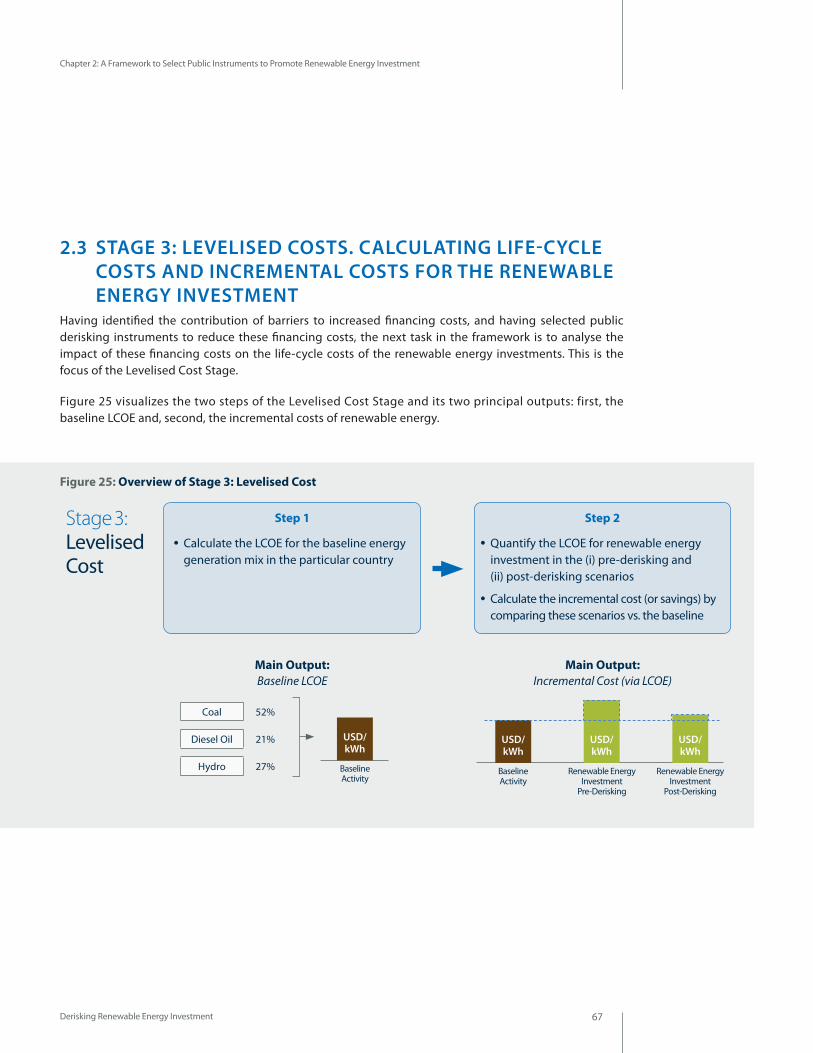
Derisking Renewable Energy Investment 67
Chapter 2: A Framework to Select Public Instruments to Promote Renewable Energy Investment
Figure 25: Overview of Stage 3: Levelised Cost
2.3 STAGE 3: LEVELISED COSTS. CALCULATING LIFE-CYCLE COSTS AND INCREMENTAL COSTS FOR THE RENEWABLE ENERGY INVESTMENTHaving identified the contribution of barriers to increased financing costs, and having selected public derisking instruments to reduce these financing costs, the next task in the framework is to analyse the impact of these financing costs on the life-cycle costs of the renewable energy investments. This is the focus of the Levelised Cost Stage.
Figure 25 visualizes the two steps of the Levelised Cost Stage and its two principal outputs: first, the baseline LCOE and, second, the incremental costs of renewable energy.
Step 1 Step 2
●● Calculate the LCOE for the baseline energy generation mix in the particular country
●● Quantify the LCOE for renewable energy investment in the (i) pre-derisking and (ii) post-derisking scenarios
●● Calculate the incremental cost (or savings) by comparing these scenarios vs. the baseline
Main Output: Baseline LCOE
Coal 52%
Diesel Oil 21%
Hydro 27%
Main Output: Incremental Cost (via LCOE)
USD/ kWh
USD/ kWh
USD/ kWh
Baseline Activity
Renewable Energy Investment
Pre-Derisking
Renewable Energy Investment
Post-Derisking
USD/ kWh
Baseline Activity
Stage 3: Levelised Cost

Derisking Renewable Energy Investment68
Stage 1: Risk Environment
Step 1 Step 2
Stage 2: Public Instruments
Step 1 Step 2
Stage 3: Levelised Costs
Step 1 Step 2
Stage 4: Evaluation
Step 1 Step 2
Chapter 2: A Framework to Select Public Instruments to Promote Renewable Energy Investment
2.3.1 Baseline LCOE: Determining the Life-Cycle Costs for the Baseline Energy MixRenewable energy investments do not take place in isolation but, rather, are made in the context of an existing and/or evolving (with new installed capacity coming on-line) domestic energy generation mix. The baseline energy mix can be understood as either being the electricity generation that is replaced by electricity generated through the newly-added renewable capacity or the electricity generation that would come on-line if the renewable investment was not made. The baseline is typically a combination of different energy technologies, ranging from nuclear-based generation and fossil fuel-based technologies to renewable energy. A good understanding of the generation costs of the baseline mix is needed to determine the competitiveness of renewable energy and, where necessary, the possible costs involved in providing financial incentives to make renewable energy investment competitive.
The first step of the Levelised Cost Stage involves estimating the generation cost of the baseline energy mix. This is done by determining which technologies are to be included in the energy mix, and then by calculating the LCOE for each of the technologies. As illustrated in Figure 26, having calculated the individual generation costs, an average cost for the entire baseline energy mix can be generated, weighting the individual technologies according to the share of the total energy mix. UNDP has released an accompanying LCOE-based financial tool in Microsoft Excel to conduct the calculations for a baseline LCOE, including standardized, default data for some common technologies.
This section addresses three aspects of calculating the baseline LCOE under the framework:
●● Selecting an approach to determining the baseline energy mix
●● The role of fossil fuel subsidies
●● Calculating the baseline carbon emissions
Figure 26: Illustrative baseline energy mix
Coal 52%
Diesel Oil 21%
Hydro 27%
USD/kWh
Baseline Activity

Derisking Renewable Energy Investment 69
Chapter 2: A Framework to Select Public Instruments to Promote Renewable Energy Investment
i. Selecting an approach to determining the baseline energy mix
In practice, there are three broad approaches that can be taken to determining the baseline energy mix: taking an existing baseline, marginal baseline or combined baseline approach.
●● The existing baseline approach, also called operating margin (OM), assumes that the electricity generated by the new renewable capacity replaces a share of the current mix of technologies in use today. For relatively new installed capacity, a full LCOE includes both the investment costs and operational costs, as well as the original financing costs. For older installed capacity, which may have exceeded its original anticipated lifetime, the operational costs alone may form the basis of the LCOE, as here the investment is treated as a sunk cost. If existing baselines have a substantial component of older installed capacity, this can result in a particularly low LCOE. An existing baseline LCOE might be the preferred approach if the country has a lot of surplus installed capacity, and the renewable energy investment is substituting the existing installed capacity.
●● The marginal baseline approach, also called build margin (BM), assumes that the electricity generated by the new renewable capacity replaces electricity from capacity that would come on-line if the renewable investment was not made. It is, however, often unclear which capacity will be built in the future18. Under the Clean Development Mechanism (CDM), the CDM Executive Board deals with this issue by assuming that the most recent capacity additions are the best indicator of capacity additions to come. Therefore, for the LCOE calculation, one typically selects a mix of marginal technologies, based on the most recent investments made (Schmidt et al., 2012; UNFCCC, 2007 & 2011). In this case, in calculating the LCOE it is important to use up-to-date technology costs and financing costs for each technology used. A marginal baseline LCOE makes sense as the preferred approach when the country is experiencing fast growing electricity demand. In this case, the renewable energy investment is competing against planned increases in installed capacity
to meet this demand.
●● The combined baseline approach, also called combined margin (CM), combines the two approaches above, based on the assumption that the electricity generated by the new renewable capacity replaces electricity partly generated by existing capacity and partly by capacity to-be-built. Simplified approaches, as used in the CDM rules, calculate the combined margin as a weighted average of the existing and marginal baselines (applying standard weightings, such as 50%:50% OM:BM or 75%:25% OM:BM) (UNFCCC, 2011). Other, more sophisticated approaches exist and explicitly and exactly consider the intermittency of renewable energy via their capacity credit.
An important decision in calculating the baseline costs is whether to include both public and private investments, or whether simply to focus on private investments. In particular, this has ramifications when it comes to the financing costs, where large-scale publicly-financed energy investments can benefit from far lower cost financing.
18 For example, in old national energy plans one often observes forecasted capacity additions for the years to come which were not subsequently realised.
Derisking Renewable Energy Investment70
Chapter 2: A Framework to Select Public Instruments to Promote Renewable Energy Investment
ii. The role of fossil fuel subsidies
When fossil fuel-based energy technologies are included in the baseline energy mix, a further important consideration under the framework is how to treat the existing fossil fuel subsidies – either including or excluding subsidies in the LCOE calculations (Schmidt et al., 2012). Depending on the extent of the subsidies, this can strongly change the results, as the cost of fossil fuels is often the predominant factor in the LCOE of fossil fuel-based technologies (See Chapter 1.).
Using wholesale fuel prices (without subsidies), can make sense if the policymaker would like to understand what the undistorted competitive situation may be. This can also highlight the benefits of reforming fossil fuel subsidies. To calculate these unsubsidised prices, one approach is to follow the IEA’s opportunity cost approach, which uses global/regional fuel prices adjusted for shipment costs (IEA, 2012; Schmidt et al., 2012). Using subsidised prices can be the preferred approach if the policymaker wishes to understand the actual (artificially distorted) competitive situation that renewable energy often faces today.
iii. Calculating the baseline carbon emissions
In addition to determining the LCOE of the baseline energy mix, in this step of the framework the carbon emissions (in tonnes of CO2e) of the baseline energy mix is calculated. This can then act as a reference to determine the emission reductions should renewable energy investment take place. To this end, UNFCCC and IPCC rules and data can be used (UNFCCC 2007 & 2011; IPCC, 2006). The more emissions-intensive the baseline electricity generation, the higher the lifetime carbon abatement potential from the renewable energy investment. The emissions intensity of the baseline is mainly triggered by the fuel mix (for example, with coal being very emissions-intensive and hydro-power being virtually emissions-free) and the efficiency of the generation plants.
The extent of fossil fuel subsidies can
strongly change the results, as fuel
costs are often the predominant
factor in the LCOE of fossil fuel-based
technologies.

Derisking Renewable Energy Investment 71
Stage 1: Risk Environment
Step 1 Step 2
Stage 2: Public Instruments
Step 1 Step 2
Stage 3: Levelised Costs
Step 1 Step 2
Stage 4: Evaluation
Step 1 Step 2
Chapter 2: A Framework to Select Public Instruments to Promote Renewable Energy Investment
2.3.2 Incremental Costs of Renewable Energy: Determining Life-Cycle Costs of the Renewable Energy Investments and the Incremental Cost Gap The second step of the Levelised Cost Stage calculates the life-cycle costs of the renewable energy investment for two scenarios:
●● A pre-derisking scenario, reflecting the financing costs before the use of the selected public derisking instruments. These financing costs are generated by the earlier Risk Environment Stage (Stage 1).
●● A post-derisking scenario, reflecting both (i) the financing costs after the use of the selected public instruments as well as (ii) the cost of the financial derisking instruments to the project developer.19 These costs are generated under the Public Instruments Stage (Stage 2).
The accompanying UNDP financial tool to the framework can assist in these LCOE calculations for the two renewable energy investment scenarios. In performing these LCOE calculations, data will also need to be gathered on the operational and investment costs for the particular renewable energy technology being assessed.
The main objective of this second step, having calculated the LCOE for the two renewable energy investment scenarios, is to compare these LCOEs with the LCOE of the baseline energy mix. This comparison is an import-ant output of the framework and can give an immediate sense of whether renewable energy is competitive with the baseline and what are the incremental costs (or savings) of renewable energy compared with the baseline.
Figure 27 illustrates this comparison, showing two scenarios – one where there is a positive gap (incremental cost) and one where there is a negative gap (incremental saving). The positive gap case illustrates a situation where renewable energy has become more competitzive following derisking, but where it is still more costly than the baseline energy mix: an incremental cost associated with renewable energy still exists. In these circumstances, should a policymaker wish to promote renewable energy a financial incentive covering the incremental cost (a price premium, production subsidy, carbon offsets, etc.) would be necessary. The negative gap case illustrates a situation where renewable energy is more competitive, both before and after the use of public instruments, than the baseline energy mix. The result is an incremental saving for each unit of energy generated by the renewable energy investment.20
19 Financial derisking instruments, such as loan guarantees and political risk insurance, involve fees for the project developer. These should be included in the LCOE calculation.
20 Additionally, while not shown in the figure, intermediate cases, where renewable energy exhibits a positive incremental cost in the pre-derisking scenario and a negative incremental cost in the post-derisking scenario, are also possible. In this situation the implementation of public derisking instruments serves to transform renewable energy from being a relatively expensive option to one that is cheaper than the baseline.

Derisking Renewable Energy Investment72
As mentioned in Chapter 1, positive or negative gaps are not fixed; changes in fuel prices, technology costs and public policies can reduce or increase them over time. The framework provides a current numerical estimate of the gap for a set of input parameters. For example, changes in input parameters, such as the lag time for public instruments to take effect, may substantially modify the final gap estimate. To consider such changes, it is important to undertake sensitivity analysis (See Section 2.4.2.).
The renewable energy incremental cost is a useful but incomplete financial indicator. A broader analytical view is required in order to judge overall performance of public funding and avoid the above pitfalls. The following section describes additional performance metrics which can be generated by the framework, building on the Levelised Cost Stage, in order to further assess the performance of public interventions.
Chapter 2: A Framework to Select Public Instruments to Promote Renewable Energy Investment
Baseline Activity
RenewableEnergy
Investment Pre-Derisking
Pre-DeriskingIncremental
Cost
Post-DeriskingIncremental
Cost
Pre-DeriskingIncremental
Savings
Post-DeriskingIncremental
Savings
RenewableEnergy
Investment Post-Derisking
Baseline Activity
RenewableEnergy
Investment Pre-Derisking
RenewableEnergy
Investment Post-Derisking
USD/kWh USD/kWh USD/kWh USD/kWh USD/kWh USD/kWh
POSITIVE GAP (INCREMENTAL COST) NEGATIVE GAP (INCREMENTAL SAVINGS)
Figure 27: Illustrative comparison of the LCOE of pre- and post-derisking renewable energy investments in comparison to the baseline energy mix
Positive or negative gaps are
not fixed; changes in fuel prices,
technology costs and public policies
can reduce or increase them
over time.
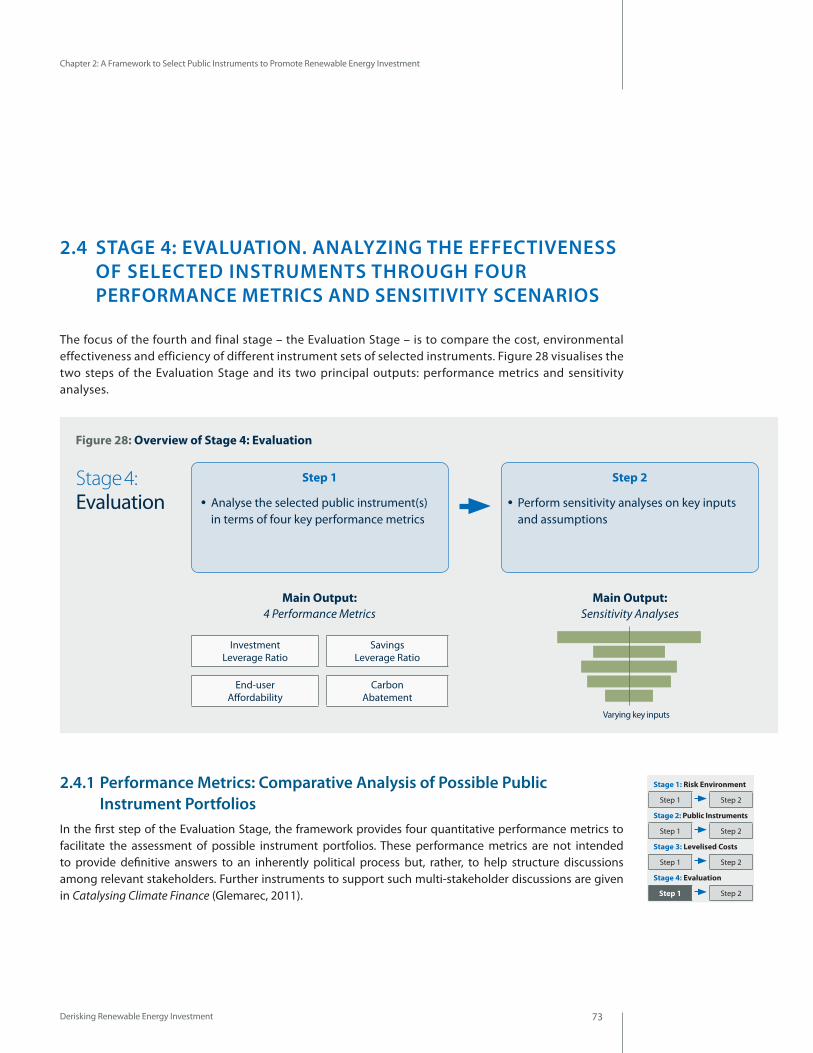
Derisking Renewable Energy Investment 73
Chapter 2: A Framework to Select Public Instruments to Promote Renewable Energy Investment
2.4 STAGE 4: EVALUATION. ANALYZING THE EFFECTIVENESS OF SELECTED INSTRUMENTS THROUGH FOUR PERFORMANCE METRICS AND SENSITIVITY SCENARIOS
The focus of the fourth and final stage – the Evaluation Stage – is to compare the cost, environmental effectiveness and efficiency of different instrument sets of selected instruments. Figure 28 visualises the two steps of the Evaluation Stage and its two principal outputs: performance metrics and sensitivity analyses.
2.4.1 Performance Metrics: Comparative Analysis of Possible Public Instrument Portfolios In the first step of the Evaluation Stage, the framework provides four quantitative performance metrics to facilitate the assessment of possible instrument portfolios. These performance metrics are not intended to provide definitive answers to an inherently political process but, rather, to help structure discussions among relevant stakeholders. Further instruments to support such multi-stakeholder discussions are given in Catalysing Climate Finance (Glemarec, 2011).
Figure 28: Overview of Stage 4: Evaluation
Stage 1: Risk Environment
Step 1 Step 2
Stage 2: Public Instruments
Step 1 Step 2
Stage 3: Levelised Costs
Step 1 Step 2
Stage 4: Evaluation
Step 1 Step 2
Step 1 Step 2
●● Analyse the selected public instrument(s) in terms of four key performance metrics
●● Perform sensitivity analyses on key inputs and assumptions
Main Output: 4 Performance Metrics
Investment Leverage Ratio
Savings Leverage Ratio
End-user Affordability
Carbon Abatement
Main Output: Sensitivity Analyses
Varying key inputs
Stage 4: Evaluation
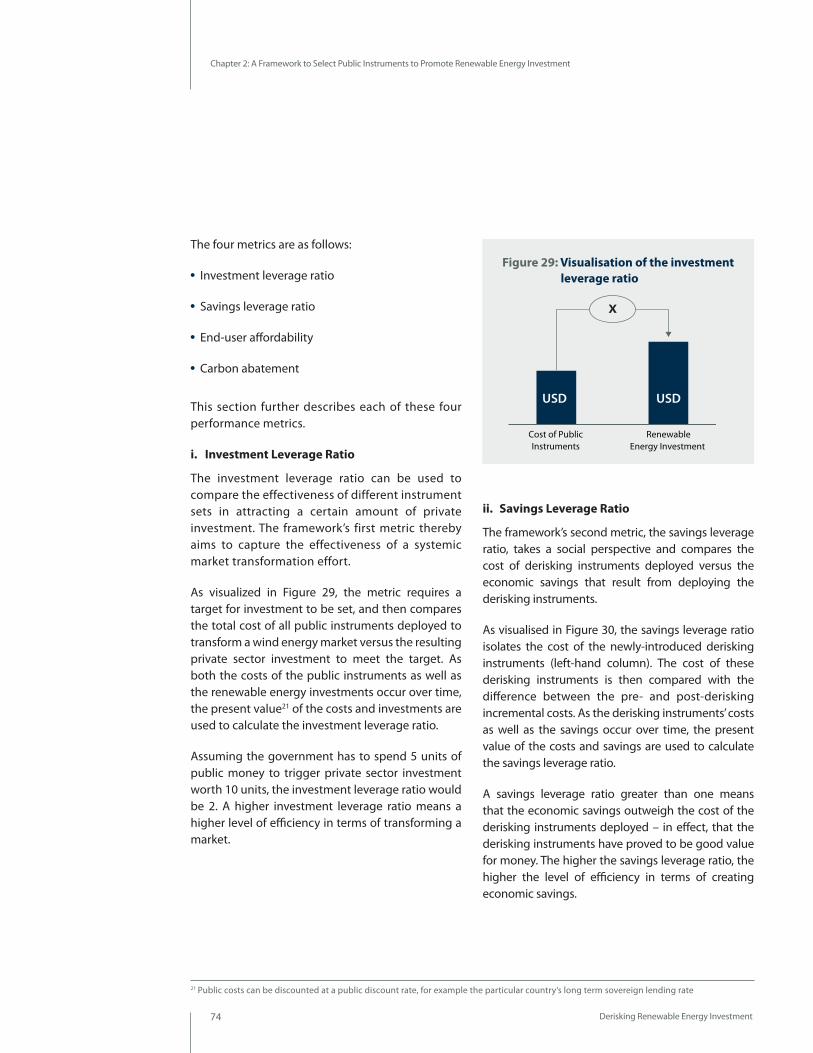
Derisking Renewable Energy Investment74
The four metrics are as follows:
●● Investment leverage ratio
●● Savings leverage ratio
●● End-user affordability
●● Carbon abatement
This section further describes each of these four performance metrics.
i. Investment Leverage Ratio
The investment leverage ratio can be used to compare the effectiveness of different instrument sets in attracting a certain amount of private investment. The framework’s first metric thereby aims to capture the effectiveness of a systemic market transformation effort.
As visualized in Figure 29, the metric requires a target for investment to be set, and then compares the total cost of all public instruments deployed to transform a wind energy market versus the resulting private sector investment to meet the target. As both the costs of the public instruments as well as the renewable energy investments occur over time, the present value21 of the costs and investments are used to calculate the investment leverage ratio.
Assuming the government has to spend 5 units of public money to trigger private sector investment worth 10 units, the investment leverage ratio would be 2. A higher investment leverage ratio means a higher level of efficiency in terms of transforming a market.
Chapter 2: A Framework to Select Public Instruments to Promote Renewable Energy Investment
ii. Savings Leverage Ratio
The framework’s second metric, the savings leverage ratio, takes a social perspective and compares the cost of derisking instruments deployed versus the economic savings that result from deploying the derisking instruments.
As visualised in Figure 30, the savings leverage ratio isolates the cost of the newly-introduced derisking instruments (left-hand column). The cost of these derisking instruments is then compared with the difference between the pre- and post-derisking incremental costs. As the derisking instruments’ costs as well as the savings occur over time, the present value of the costs and savings are used to calculate the savings leverage ratio.
A savings leverage ratio greater than one means that the economic savings outweigh the cost of the derisking instruments deployed – in effect, that the derisking instruments have proved to be good value for money. The higher the savings leverage ratio, the higher the level of efficiency in terms of creating economic savings.
USD
x
Cost of PublicInstruments
RenewableEnergy Investment
USD
Figure 29: Visualisation of the investment leverage ratio
21 Public costs can be discounted at a public discount rate, for example the particular country’s long term sovereign lending rate

Derisking Renewable Energy Investment 75
Chapter 2: A Framework to Select Public Instruments to Promote Renewable Energy Investment
iii. End-user Affordability
The framework’s third metric, end-user affordability, takes an electricity consumer perspective and compares the generation cost (LCOE) of wind energy in the post-derisking scenario versus the pre-derisking scenario. The unit for this metric is USD cents per kWh. As visualised in Figure 31, the greater the percentage decrease between the LCOE for the two scenarios, the higher the efficiency of the public instrument portfolio from a rate-payer (i.e. electricity consumer) perspective.
For illustration, if a set of derisking instruments bring down the LCOE of a renewable investment from 10 units to 8 units, the derisking would have an affordability impact of 20 percent. Through assessing the effect of the selected instrument portfolio on electricity rates and additionally comparing the post- derisking LCOE with the baseline costs, the end-user affordability metric can prove a useful indicator of the political feasibility of spending public money on derisking instruments to support renewable energy. Public policy change is never easy. However, a public instrument package expected to generate savings for rate-payers or increase energy access through improving the balance sheet of power utilities in developing countries is likely to face less political opposition.
USD
x
Incremental Costs
Pre-Derisking
USD
Cost of Public
Instruments
Savings Incremental Costs
Post-Derisking
USD
USD
USD/kWh
%
Life-cycle CostPre-Derisking
Life-cycle CostPost-Derisking
USD/kWh
USD/tCo2e
%
Cost of AbatementPre-Derisking
Cost of AbatementPost-Derisking
USD/tCo2e
Figure 30: Visualisation of the savings leverage ratio
Figure 31: Visualisation of end-user affordability
Figure 32: Visualisation of carbon abatement cost
iv. Carbon Abatement
The framework’s fourth metric, carbon abatement, is an environmental effectiveness indicator. As visualized in Figure 32, this metric adopts a climate change mitigation perspective by considering the carbon abatement potential (See Section 2.3.1 for the methodology.) and the carbon abatement costs of the renewable energy investment. The abatement costs are calculated by dividing the present value of the incremental costs of the renewable energy by the abatement potential. The unit for carbon abatement potential is tonnes of CO2 equivalent over the lifetime of the renewable energy project. The unit for carbon abatement cost is USD per tonne of CO2 equivalent.

Derisking Renewable Energy Investment76
Chapter 2: A Framework to Select Public Instruments to Promote Renewable Energy Investment
Stage 1: Risk Environment
Step 1 Step 2
Stage 2: Public Instruments
Step 1 Step 2
Stage 3: Levelised Costs
Step 1 Step 2
Stage 4: Evaluation
Step 1 Step 2
For illustration, assuming a pre-derisking abatement cost of 3 units per tonne of CO2and a post-derisking cost of 2 units per tonne of CO2, then the abatement cost reduction is 33 percent. Note that if the incremental costs of renewable energy are negative (i.e. renewable energy is less expensive than the baseline energy mix), its abatement costs will also be negative. The greater the reduction in carbon abatement cost, the higher the efficiency of the policy instrument package from a climate perspective.
2.4.2 Perform sensitivity analyses on instrument selection and key inputs and drivers. The framework takes a bottom-up approach to assessing the selection of public instruments and, as a result, requires the input of a large set of up-to-date empirical data and assumptions. As has been described in the framework’s first three stages, this includes, for example, data for the selected renewable energy technology relating to barriers to investment, renewable energy resources, technology costs and financing costs; data on the country’s baseline energy mix; and data on the cost of the selected public instruments.
Collecting, scrutinizing and sharing these data and assumptions is an important part of using the framework. The intent of the framework is to transparently address input assumptions, and then provide a range of outputs that can be compared and used as the basis for an informed discussion on selecting public instruments to promote renewable energy.
As discussed in the previous sections, changes in input parameters can substantially modify the framework’s outputs. Performing sensitivity analyses enables the framework’s users to identify input parameters that can cause significant variability in the framework’s output, and should therefore be the focus of additional attention in terms of data collection and selection of assumptions, as well as to qualify any recommendations communicated to stakeholders.
This second step of the Evaluation Stage therefore enables users to perform different sensitivity scenarios on input variables. Figure 33 sets out the input parameters which are particularly important as they can strongly affect the outputs of the framework.
Scrutinizing and sharing the
framework's data and assumptions
is critical.

Derisking Renewable Energy Investment 77
Chapter 2: A Framework to Select Public Instruments to Promote Renewable Energy Investment
Sensitivity analyses may involve varying any of these input parameters (and/or combinations of parameters) to understand the sensitivity of the overall results to changes in those parameters. When collecting data and making assumptions, users can identify those input parameters for which the margin of error is potentially the largest and/or that are most relevant for a particular country or technology. Sensitivities on input parameters may both be plausible (for instance, changes are of a realistic magnitude) or implausible (for instance, interactions between the adjusted variables are ignored), but the main objective is to explore the framework’s sensitivity to these inputs and to gain a better understanding of the possible uncertainty and variability in outputs.22
22 The framework can also be used in a probabilistic manner by assigning stochastic distributions to the input parameters and running Monte Carlo simulations. The outcome would then be a stochastic distribution for each performance metric: in other words, the four performance metrics would have associated error bars.
Figure 33: Drivers and components of investor risk for renewable energy investment
Stage 1: Risk Environment
●● Best-in-class country selection
Stage 2: Public Instruments
●● Public instrument effectiveness (impact on cost of debt & equity, capital structure, loan tenors)
●● Public instrument timing effects ●● Cost of financial derisking instruments (including [paid-in-capital leveraging])●● Cost of policy derisking instruments
Stage 3: Levelised Cost Baseline LCOE●● Existing vs. marginal baseline●● Energy mix
Investment costs, O&M costs Fuel costs (unsubsidised vs. subsidised, market projections)Capacity factorFinancing (cost of debt & equity, capital structure, loan tenors)
Wind LCOE●● Investment costs●● Capacity factor●● Financing (cost of debt & equity,
capital structure, loan tenors)
General ●● Public sector discount rate●● Tax rates●● Depreciation

●● 3.1 Approach to the Modelling Exercise
●● 3.2 Country Results for South Africa
●● 3.3 Country Results for Panama
●● 3.4 Country Results for Mongolia
●● 3.5 Country Results for Kenya
Illustrative Country Case Studies Chapter 3

Derisking Renewable Energy Investment 79
3In order to demonstrate how the framework can be used in practice, this chapter describes a modelling exercise to promote large-scale, onshore wind energy in four selected countries: Kenya, Mongolia, Panama and South Africa. Onshore wind energy is chosen as it represents a mature renewable energy technology with a strong track-record and good data availability. The model uses a simplified set of data and assumptions, and therefore the model outputs are indicative only. In-depth complementary data collection, country consultations and more comprehensive assumptions would be required to increase the robustness of these illustrative outputs to support an actual decision-making process.
The chapter first provides a summary of the approach to the modelling exercise: describing the selection of the four countries, the two scenarios modelled in each country, highlighting key modelling assumptions and setting out the exercise’s public instrument table. It then describes the findings in terms of the four individual country case studies, each including an overview of the country’s power sector as well as the modelling results for each country. The full underlying datasets and assumptions used in preparing these case studies are given in Annex A.
3.1 APPROACH TO THE MODELLING EXERCISE
3.1.1 Selecting the Four Illustrative CountriesThe two-by-two instrument matrix illustrated in Figure 34 identifies four typical public instrument combinations that can be deployed to promote renewable energy in different national contexts. The objective of the matrix is to represent the spectrum of investment conditions that these instrument combinations can be deployed in: whether a country had a high or low sovereign rating and whether a country has high or low baseline energy generation costs. One of the criteria for the selection of the case country studies was that each of the four countries could be mapped onto a different quadrant of the matrix. South Africa and Mongolia have relatively low-cost baseline energy mixes, with coal and lignite predominating. In contrast, Panama and Kenya have relatively high-cost baselines, with a large proportion of the generation mix coming from fuel oil. All four countries are attracting private sector interest in wind energy investment. As a general indication of investment risk, South Africa and Panama currently have high sovereign ratings by credit agencies while Kenya and Mongolia currently have low sovereign ratings.
Illustrative Country Case Studies
Chapter 3: Illustrative Country Case Studies

Derisking Renewable Energy Investment80
Chapter 3: Illustrative Country Case Studies
All four countries have the following in common
●● The presence of strong, untapped wind resources. This results in wind energy capacity factors for the modelling exercise of between 39 percent and 50 percent for the four countries.
●● A FiT, or similar cornerstone instrument, for onshore wind energy is already in place. Kenya and Mongolia have implemented FiTs. Panama and South Africa have deployed PPA-based bidding processes.
The two-by-two instrument matrix is used as an organising framework to select a plausible set of policy and financial derisking instruments to complement the existing FiT/PPA bidding schemes.
●● Financial derisking for wind energy, a relatively mature renewable energy technology, is assumed to be not required for investment-grade countries (South Africa, Panama). On the other hand, financial derisking instruments are assumed to be a requirement in non-investment-grade countries (Mongolia, Kenya).
Figure 34: The four country case studies and their illustrative combinations of public instruments
* For the modelling exercise, the investment environment is classified using sovereign ratings from credit rating agencies as a general indicator. High reflects a sovereign rating of BBB- or above (commonly referred to as “investment-grade”); low reflects a sovereign rating below BBB- (“non-investment grade”).
General investment environment *
Base
line
ener
gy g
ener
atio
n co
st
LOW
CO
ST
BASE
LIN
EH
IGH
CO
ST
BASE
LIN
E
HIGH SOVEREIGN RATING LOW SOVEREIGN RATING
South Africa (8.4 GW)
Panama (1 GW)
Mongolia (1 GW)
Kenya (1 GW)
Cornerstone instrument: PPA bidding
Cornerstone instrument: PPA bidding
Cornerstone instrument: FiT
Cornerstone instrument: FiT
Policy derisking instruments
Policy derisking instruments
Direct financial incentive: premium
Direct financial incentive: premium
Financial derisking instruments
Financial derisking instruments
+
+
+
+
++
Policy derisking instruments
Policy derisking instruments
All four countries have strong,
untapped wind resources and a
cornerstone public instrument in place.
Derisking Renewable Energy Investment 81
Chapter 3: Illustrative Country Case Studies
●● A price premium is modelled when the cost of wind energy is higher than the unsubsidised baseline (in South Africa and Mongolia, whose baselines are dominated by relatively inexpensive coal). No premium is assumed necessary where wind power is less expensive than the unsubsidised baseline (in Kenya and Panama, which have high shares of relatively expensive fuel-oil-based generation in their baseline mix).
The modelling exercise assumes a long-term, 20-year national target for wind investment in each of the four countries: 8.4 GW in South Africa, and 1 GW each in Kenya, Mongolia and Panama. In South Africa, the Government’s 2030 target has been used. In the other three countries, the long-term 20-year targets are the modelling exercise’s own assumptions. The objective was to create an ambitious vision for wind energy in each country but, at the same time, to cap wind energy’s share of the anticipated future generation mix at a level whereby intermittency issues could be managed.
3.1.2 Modelling Two Scenarios for Each CountryIn order to study different public instruments packages, the modelling exercise compares two scenarios to achieve the long-term, 20-year investment target in each country, a business-as-usual (BAU) scenario and a post-derisking scenario. Both scenarios take today’s current risk environment in each country as
the starting point.
●● BAU scenario
This scenario assumes that the 20-year investment target for the country is made under today’s risk environment in the country, including, if applicable, project developers benefiting from financial derisking instruments and a price premium. As this scenario captures, or ‘freezes’, the current risk environment, no use of policy derisking instruments is modelled.
The BAU scenario uses the current financing costs and terms (capital structure and loan tenor) that an investor encounters in the country.
●● Post-derisking scenario
This scenario assumes that the 20-year investment target for the country is made under a derisked investment environment where a set of policy derisking instruments is deployed to complement the BAU public instruments. These policy derisking measures address the current barriers to investment. This scenario therefore assumes that the full set of public instruments presented in the two-by-two instrument matrix is used.
As such, the post-derisking scenario uses adjusted financing costs and terms (capital structure and loan tenor) compared to the BAU scenario, reflecting the impact of policy derisking instruments in reducing the financing costs and improving financing terms.
For details on the precise instruments selected for both scenarios in each country, please refer to the summary of country assumptions at the end of each country case study (Sections 3.2 to 3.5.).

Derisking Renewable Energy Investment82
Chapter 3: Illustrative Country Case Studies
3.1.3 Key Modelling AssumptionsThe practical application of the framework entails a significant amount of data gathering and requires a number of assumptions to be made. In order to keep the scope of the modelling exercise manageable, a set of simplified data and modelling assumptions have been used. Many input parameters, such as wind technology costs, have been standardised across all four countries (compare to Schmidt et al, 2012). Should policymakers wish to use the framework for detailed policy analysis, additional in-depth country consultations will be required to collect empirical data and fine-tune input parameters and modelling assumptions.
Three key issues in the scope and assumptions made in the modelling exercise merit being highlighted:
●● Intermittency. An inherent characteristic of wind energy is its intermittency and its lack of dispatchability. Energy planners typically need to balance wind energy with dispatchable capacity, and LCOE-based comparisons using intermittent energy sources can have limitations in not capturing this balancing cost, nor generation costs at peak demand. The modelling exercise expressly excludes these balancing costs, however, as mentioned above, it seeks to indirectly address these issues by capping wind energy’s share of the anticipated future generation mix at a level whereby alternative installed capacity in the country will be able to provide a degree of balancing.
●● Transmission Lines. In order to keep the modelling exercise manageable, issues regarding the physical grid infrastructure in the particular country are excluded from the analysis. The modelling exercise assumes that all wind energy sites are within 50 km of a well-maintained transmission line.

Derisking Renewable Energy Investment 83
Chapter 3: Illustrative Country Case Studies
●● Unsubsidised marginal baseline.
A marginal baseline (build margin) approach has been chosen. All four countries are characterised by rapidly increasing energy demand (IEA, 2012): consequently, new wind installations will likely not replace existing capacity. The marginal baseline was determined using the UNFCCC CDM methodology (UNFCCC, 2007 & 2011).
Fuel costs are unsubsidised, following the IEA’s opportunity cost approach. This results in fully transparent findings, taking out the distortive effects of subsidies, and allows for a comparison between the four countries. The fuel price assumptions (See Annex A.) are informed by current fuel prices and IEA price projections (IEA, 2010).
Private sector financing costs are used in the marginal baseline mix. This reflects an assumption that the four countries are seeking to attract private sector investment irrespective of energy technology, and allows for the comparability of the marginal baseline LCOE with the wind energy LCOE.
The overall methodology used for the modelling exercise can be found in the description of the framework in Chapter 2. The full underlying datasets and assumptions for the modelling exercise are set out in Annex A.
3.1.4 Public Instrument TableThe modelling exercise’s public instrument table, setting out the approach to stakeholders, barriers and risk categories for wind energy, and the matching public instruments to address these barriers and risks, is set out in full in Table 5. This was derived from the generic public instrument table for renewable energy introduced in Section 2.1.2. A small number of changes have been made to the generic table; these changes are set out fully in Annex A.

Derisking Renewable Energy Investment84
Chapter 3: Illustrative Country Case Studies
Table 5: The modelling exercise’s public instrument table (Part I)
BARRIERS MENU OF SELECTED PUBLIC INSTRUMENTS
RISK CATEGORy DESCRIPTION UNDERLyING BARRIERS KEy STAKEHOLDER GROUP
POLICy DERISKING INSTRUMENTS FINANCIAL DERISKING INSTRUMENTS
ACTIVITy DESCRIPTION ACTIVITy DESCRIPTION
1. Power Market Risk
Risk arising from limitations and uncertainties in the energy market, and/or sub-optimal regulations to address these limitations and promote renewable energy markets
●● Market outlook: lack of or uncertainties regarding governmental renewable energy strategy and targets
Public sector (policymakers,
legislators, regulators)
Establish transparent, long-term national wind energy strategy and targets
National-level resource inventory/ mapping; establish national energy office; review technology options; renewable energy target formulation (as part of national energy planning)
●● Market access and prices: limitations related to energy market liberalization; uncertainty related to access, the competitive landscape and price outlook for renewable energy; limitations in design of standard PPAs and/or PPA tendering procedures
Establish a harmonized, well-regulated and unbundled energy market, with cornerstone instruments to address price and market-access risk for wind energy projects
Unbundling of the energy market (generation, transmission, distribution); establish well- designed and transparent procedures for FiT, PPA tendering (or similar); well-designed,transparent policy on key clauses* for standard PPA
●● Market distortions: such as high fossil fuel subsidies
2. Permits Risk
Risk arising from the public sector’s inability to efficiently and transparently administer wind energy-related licensing and permits
●● Labour-intensive, complex processes and long time-frames for obtaining licences and permits (generation, EIAs, land title) for renewable energy projects Public sector
(administrators)
Establish a one-stop-shop for renewable energy permits; streamline processes for permits
Establish institutional champion with clear accountability and appropriate ex-pertise for renewable energy; harmonisa-tion of requirements; reduction of process steps; training of staff in wind energy
●● High levels of corruption. No clear recourse mechanisms
Contract enforcement and recourse mechanisms
Enforce transparent practices, wind energy related corruption control and fraud avoidance mechanisms; establish effective recourse mechanisms
3. Social Acceptance Risk
Risks arising from lack of awareness and resistance to wind energy in communities and end-users
●● Lack of awareness of wind energy amongst consumers, end-users, and local residents
End-users, general public
Awareness-raising campaigns targeting communities and end-users
Awareness campaigns, stakeholder dialogue and workshops with end users, policymakers and local residents
●● Social and political resistance related to NIMBY concerns, special interest groups
Pilot models for community involvement at project sites
Community consultations including piloting models such as in-kind services (energy access, local employment, etc.) or equity stakes in wind parks
4. Resource & Technology Risk
Risks arising from use of the renewable energy resource and technology (resource assessment; construction and operational use; hardware purchase and manufacturing)
●● For resource assessment and supply: inaccuracies in early-stage assessment of renewable energy resource; where applicable (e.g. bioenergy), uncertainties related to future supply and cost of resource
Project developers, supply chain
●● For planning, construction, operations and maintenance: uncertainties related to securing land; sub-optimal plant design; lack of local firms offering construction, maintenance services; lack of skilled and experienced local staff; limitations in civil infrastructure (roads etc.)
●● For the purchase and, if applicable, local manufacture of hardware: purchaser's lack of information on quality, reliability and cost of hardware; lack of local industrial presence and experience with hardware, including skilled and experienced local workforce

Derisking Renewable Energy Investment 85
Chapter 3: Illustrative Country Case Studies
* Under power market risk, key clauses for the standard PPA can include termination, curtailment, take-or-pay, change in law provisions and currency denomination.
BARRIERS MENU OF SELECTED PUBLIC INSTRUMENTS
RISK CATEGORy DESCRIPTION UNDERLyING BARRIERS KEy STAKEHOLDER GROUP
POLICy DERISKING INSTRUMENTS FINANCIAL DERISKING INSTRUMENTS
ACTIVITy DESCRIPTION ACTIVITy DESCRIPTION
1. Power Market Risk
Risk arising from limitations and uncertainties in the energy market, and/or sub-optimal regulations to address these limitations and promote renewable energy markets
●● Market outlook: lack of or uncertainties regarding governmental renewable energy strategy and targets
Public sector (policymakers,
legislators, regulators)
Establish transparent, long-term national wind energy strategy and targets
National-level resource inventory/ mapping; establish national energy office; review technology options; renewable energy target formulation (as part of national energy planning)
●● Market access and prices: limitations related to energy market liberalization; uncertainty related to access, the competitive landscape and price outlook for renewable energy; limitations in design of standard PPAs and/or PPA tendering procedures
Establish a harmonized, well-regulated and unbundled energy market, with cornerstone instruments to address price and market-access risk for wind energy projects
Unbundling of the energy market (generation, transmission, distribution); establish well- designed and transparent procedures for FiT, PPA tendering (or similar); well-designed,transparent policy on key clauses* for standard PPA
●● Market distortions: such as high fossil fuel subsidies
2. Permits Risk
Risk arising from the public sector’s inability to efficiently and transparently administer wind energy-related licensing and permits
●● Labour-intensive, complex processes and long time-frames for obtaining licences and permits (generation, EIAs, land title) for renewable energy projects Public sector
(administrators)
Establish a one-stop-shop for renewable energy permits; streamline processes for permits
Establish institutional champion with clear accountability and appropriate ex-pertise for renewable energy; harmonisa-tion of requirements; reduction of process steps; training of staff in wind energy
●● High levels of corruption. No clear recourse mechanisms
Contract enforcement and recourse mechanisms
Enforce transparent practices, wind energy related corruption control and fraud avoidance mechanisms; establish effective recourse mechanisms
3. Social Acceptance Risk
Risks arising from lack of awareness and resistance to wind energy in communities and end-users
●● Lack of awareness of wind energy amongst consumers, end-users, and local residents
End-users, general public
Awareness-raising campaigns targeting communities and end-users
Awareness campaigns, stakeholder dialogue and workshops with end users, policymakers and local residents
●● Social and political resistance related to NIMBY concerns, special interest groups
Pilot models for community involvement at project sites
Community consultations including piloting models such as in-kind services (energy access, local employment, etc.) or equity stakes in wind parks
4. Resource & Technology Risk
Risks arising from use of the renewable energy resource and technology (resource assessment; construction and operational use; hardware purchase and manufacturing)
●● For resource assessment and supply: inaccuracies in early-stage assessment of renewable energy resource; where applicable (e.g. bioenergy), uncertainties related to future supply and cost of resource
Project developers, supply chain
●● For planning, construction, operations and maintenance: uncertainties related to securing land; sub-optimal plant design; lack of local firms offering construction, maintenance services; lack of skilled and experienced local staff; limitations in civil infrastructure (roads etc.)
●● For the purchase and, if applicable, local manufacture of hardware: purchaser's lack of information on quality, reliability and cost of hardware; lack of local industrial presence and experience with hardware, including skilled and experienced local workforce
Resource and technology risk is excluded from the modeling exercise due to wind being a mature technology and various modeling assumptions used (high quality imported hardware, O&M insurance etc.). See Section A.1 (Annex A.).
The public instruments associated with this barrier are excluded from the modeling exercise. See Section A.2 (Annex A.).
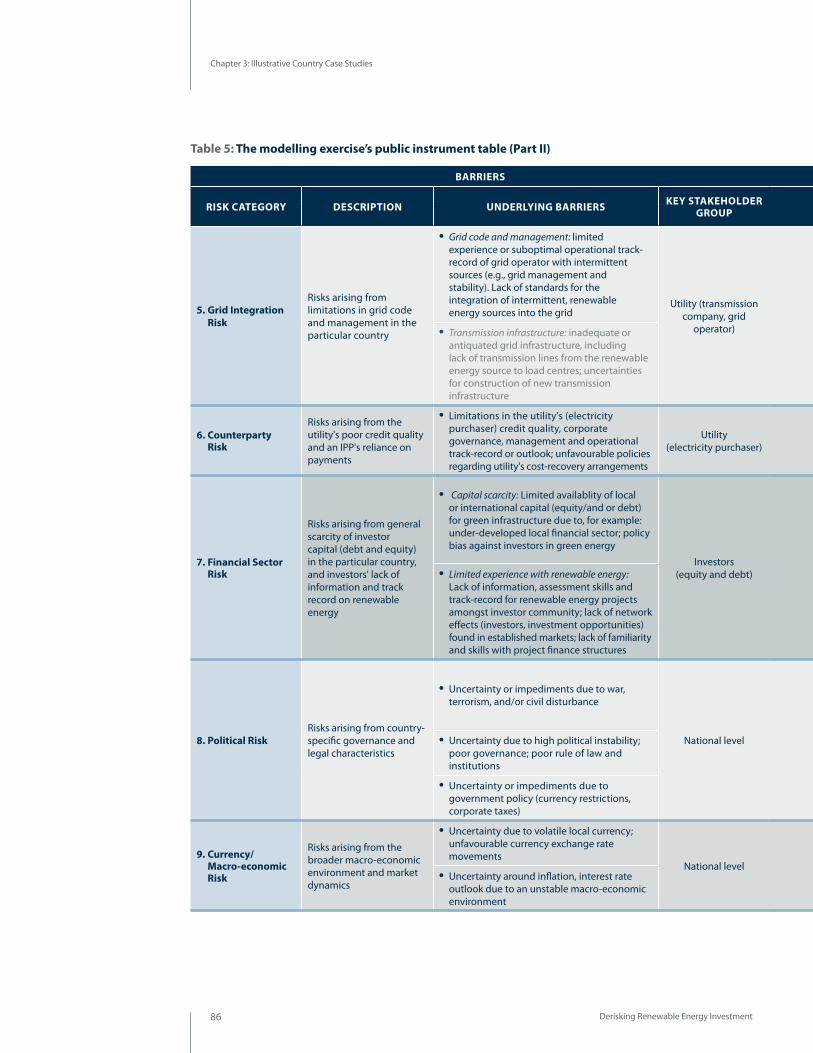
Derisking Renewable Energy Investment86
Chapter 3: Illustrative Country Case Studies
Table 5: The modelling exercise’s public instrument table (Part II)
BARRIERS MENU OF SELECTED PUBLIC INSTRUMENTS
RISK CATEGORy DESCRIPTION UNDERLyING BARRIERS KEy STAKEHOLDER GROUP
POLICy DERISKING INSTRUMENTS FINANCIAL DERISKING INSTRUMENTS
ACTIVITy DESCRIPTION ACTIVITy DESCRIPTION
5. Grid Integration Risk
Risks arising from limitations in grid code and management in the particular country
●● Grid code and management: limited experience or suboptimal operational track- record of grid operator with intermittent sources (e.g., grid management and stability). Lack of standards for the integration of intermittent, renewable energy sources into the grid
Utility (transmission company, grid
operator)
Strengthen transmission company's operational performance, grid management and formulation of grid code
Develop a grid code for new renewable energy technologies; sharing of international best practice in grid management
●● Transmission infrastructure: inadequate or antiquated grid infrastructure, including lack of transmission lines from the renewable energy source to load centres; uncertainties for construction of new transmission infrastructure
6. Counterparty Risk
Risks arising from the utility's poor credit quality and an IPP's reliance on payments
●● Limitations in the utility's (electricity purchaser) credit quality, corporate governance, management and operational track-record or outlook; unfavourable policies regarding utility's cost-recovery arrangements
Utility (electricity purchaser)
Strengthen utility/distribution company's performance
Establish international best practice in utility/distribution company's management, operations and corporate governance; implement sustainable cost-recovery policies
Counterparty guarantees by development banks offered to equity holders *
Provision of political risk insurance (PRI) by an entity such as MIGA, with 4 point coverage including counterparty guarantee, covering 90 percent of equity
7. Financial Sector Risk
Risks arising from general scarcity of investor capital (debt and equity) in the particular country, and investors' lack of information and track record on renewable energy
●● Capital scarcity: Limited availablity of local or international capital (equity/and or debt) for green infrastructure due to, for example: under-developed local financial sector; policy bias against investors in green energy
Investors (equity and debt)
Financial products by development banks to assist project developers to gain access to capital/funding
Provision by development banks of:
(i) Non-concessional public loans; or
(ii) Partial loan guarantees (non- sovereign backed) at 50 percent of commerical loan value
●● Limited experience with renewable energy: Lack of information, assessment skills and track-record for renewable energy projects amongst investor community; lack of network effects (investors, investment opportunities) found in established markets; lack of familiarity and skills with project finance structures
Strengthen investors' (debt and equity) familiarity with and capacity regarding renewable energy projects
Industry-finance dialogues and conferences; workshops/training on project assessment and financial structuring (project finance); public-private partnership building
8. Political RiskRisks arising from country- specific governance and legal characteristics
●● Uncertainty or impediments due to war, terrorism, and/or civil disturbance
National level
Political risk insurance (PRI) by development banks for equity investors
Provision of political risk insurance (PRI) covering (i) expropriation, (ii) political violence, (iii) currency restrictions
●● Uncertainty due to high political instability; poor governance; poor rule of law and institutions
●● Uncertainty or impediments due to government policy (currency restrictions, corporate taxes)
9. Currency/ Macro-economic Risk
Risks arising from the broader macro-economic environment and market dynamics
●● Uncertainty due to volatile local currency; unfavourable currency exchange rate movements
National level●● Uncertainty around inflation, interest rate
outlook due to an unstable macro-economic environment

Derisking Renewable Energy Investment 87
Chapter 3: Illustrative Country Case Studies
BARRIERS MENU OF SELECTED PUBLIC INSTRUMENTS
RISK CATEGORy DESCRIPTION UNDERLyING BARRIERS KEy STAKEHOLDER GROUP
POLICy DERISKING INSTRUMENTS FINANCIAL DERISKING INSTRUMENTS
ACTIVITy DESCRIPTION ACTIVITy DESCRIPTION
5. Grid Integration Risk
Risks arising from limitations in grid code and management in the particular country
●● Grid code and management: limited experience or suboptimal operational track- record of grid operator with intermittent sources (e.g., grid management and stability). Lack of standards for the integration of intermittent, renewable energy sources into the grid
Utility (transmission company, grid
operator)
Strengthen transmission company's operational performance, grid management and formulation of grid code
Develop a grid code for new renewable energy technologies; sharing of international best practice in grid management
●● Transmission infrastructure: inadequate or antiquated grid infrastructure, including lack of transmission lines from the renewable energy source to load centres; uncertainties for construction of new transmission infrastructure
6. Counterparty Risk
Risks arising from the utility's poor credit quality and an IPP's reliance on payments
●● Limitations in the utility's (electricity purchaser) credit quality, corporate governance, management and operational track-record or outlook; unfavourable policies regarding utility's cost-recovery arrangements
Utility (electricity purchaser)
Strengthen utility/distribution company's performance
Establish international best practice in utility/distribution company's management, operations and corporate governance; implement sustainable cost-recovery policies
Counterparty guarantees by development banks offered to equity holders *
Provision of political risk insurance (PRI) by an entity such as MIGA, with 4 point coverage including counterparty guarantee, covering 90 percent of equity
7. Financial Sector Risk
Risks arising from general scarcity of investor capital (debt and equity) in the particular country, and investors' lack of information and track record on renewable energy
●● Capital scarcity: Limited availablity of local or international capital (equity/and or debt) for green infrastructure due to, for example: under-developed local financial sector; policy bias against investors in green energy
Investors (equity and debt)
Financial products by development banks to assist project developers to gain access to capital/funding
Provision by development banks of:
(i) Non-concessional public loans; or
(ii) Partial loan guarantees (non- sovereign backed) at 50 percent of commerical loan value
●● Limited experience with renewable energy: Lack of information, assessment skills and track-record for renewable energy projects amongst investor community; lack of network effects (investors, investment opportunities) found in established markets; lack of familiarity and skills with project finance structures
Strengthen investors' (debt and equity) familiarity with and capacity regarding renewable energy projects
Industry-finance dialogues and conferences; workshops/training on project assessment and financial structuring (project finance); public-private partnership building
8. Political RiskRisks arising from country- specific governance and legal characteristics
●● Uncertainty or impediments due to war, terrorism, and/or civil disturbance
National level
Political risk insurance (PRI) by development banks for equity investors
Provision of political risk insurance (PRI) covering (i) expropriation, (ii) political violence, (iii) currency restrictions
●● Uncertainty due to high political instability; poor governance; poor rule of law and institutions
●● Uncertainty or impediments due to government policy (currency restrictions, corporate taxes)
9. Currency/ Macro-economic Risk
Risks arising from the broader macro-economic environment and market dynamics
●● Uncertainty due to volatile local currency; unfavourable currency exchange rate movements
National level●● Uncertainty around inflation, interest rate
outlook due to an unstable macro-economic environment
Private sector instruments, such as hedging for currency risk or interest rate swaps, are commonly used to address this risk category but are not shown in this public instrument table.
The transmission infrastructure barrier is excluded from the modeling exercise based on the modelling assumption that well-operating tranmission lines can be found within 50km of the wind farm. See Section A.1 (Annex A.).
The policy derisking instruments associated with this barrier are excluded from the modeling exercise. See Section A.2 (Annex A.).
* Debt holders exposure to counterparty risk is addressed by the use of non-concessional public loans and partial loan guarantees (see instruments for financial sector risk)
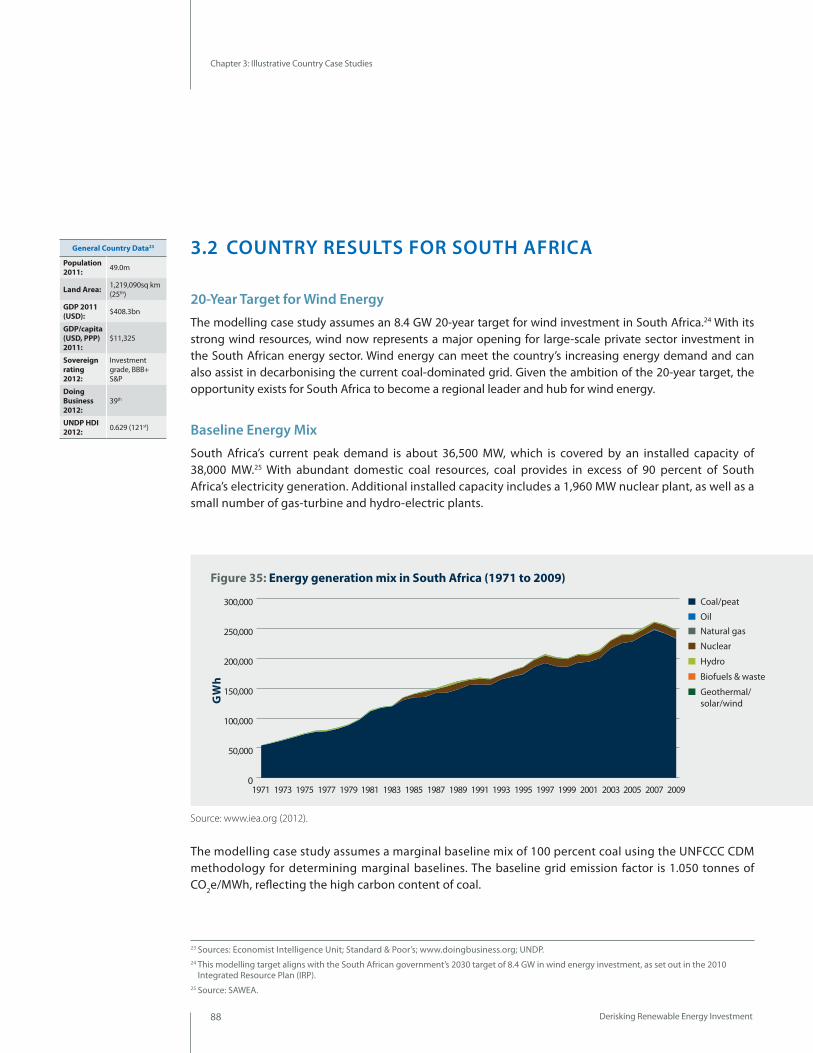
Derisking Renewable Energy Investment88
Chapter 3: Illustrative Country Case Studies
3.2 COUNTRY RESULTS FOR SOUTH AFRICA
20-Year Target for Wind Energy
The modelling case study assumes an 8.4 GW 20-year target for wind investment in South Africa.24 With its strong wind resources, wind now represents a major opening for large-scale private sector investment in the South African energy sector. Wind energy can meet the country’s increasing energy demand and can also assist in decarbonising the current coal-dominated grid. Given the ambition of the 20-year target, the opportunity exists for South Africa to become a regional leader and hub for wind energy.
Baseline Energy Mix
South Africa’s current peak demand is about 36,500 MW, which is covered by an installed capacity of 38,000 MW.25 With abundant domestic coal resources, coal provides in excess of 90 percent of South Africa’s electricity generation. Additional installed capacity includes a 1,960 MW nuclear plant, as well as a small number of gas-turbine and hydro-electric plants.
The modelling case study assumes a marginal baseline mix of 100 percent coal using the UNFCCC CDM methodology for determining marginal baselines. The baseline grid emission factor is 1.050 tonnes of CO2e/MWh, reflecting the high carbon content of coal.
23 Sources: Economist Intelligence Unit; Standard & Poor’s; www.doingbusiness.org; UNDP.24 This modelling target aligns with the South African government’s 2030 target of 8.4 GW in wind energy investment, as set out in the 2010
Integrated Resource Plan (IRP).25 Source: SAWEA.
General Country Data23
Population 2011: 49.0m
Land Area: 1,219,090sq km (25th)
GDP 2011 (USD): $408.3bn
GDP/capita (USD, PPP) 2011:
$11,325
Sovereign rating 2012:
Investment grade, BBB+ S&P
Doing Business 2012:
39th
UNDP HDI 2012: 0.629 (121st)
Coal/peat
Oil
Natural gas
Nuclear
Hydro
Biofuels & waste
Geothermal/solar/windG
Wh
200,000
250,000
300,000
0
50,000
100,000
150,000
20092007200520032001199919971995199319911989198719851983198119791977197519731971
Figure 35: Energy generation mix in South Africa (1971 to 2009)
Source: www.iea.org (2012).
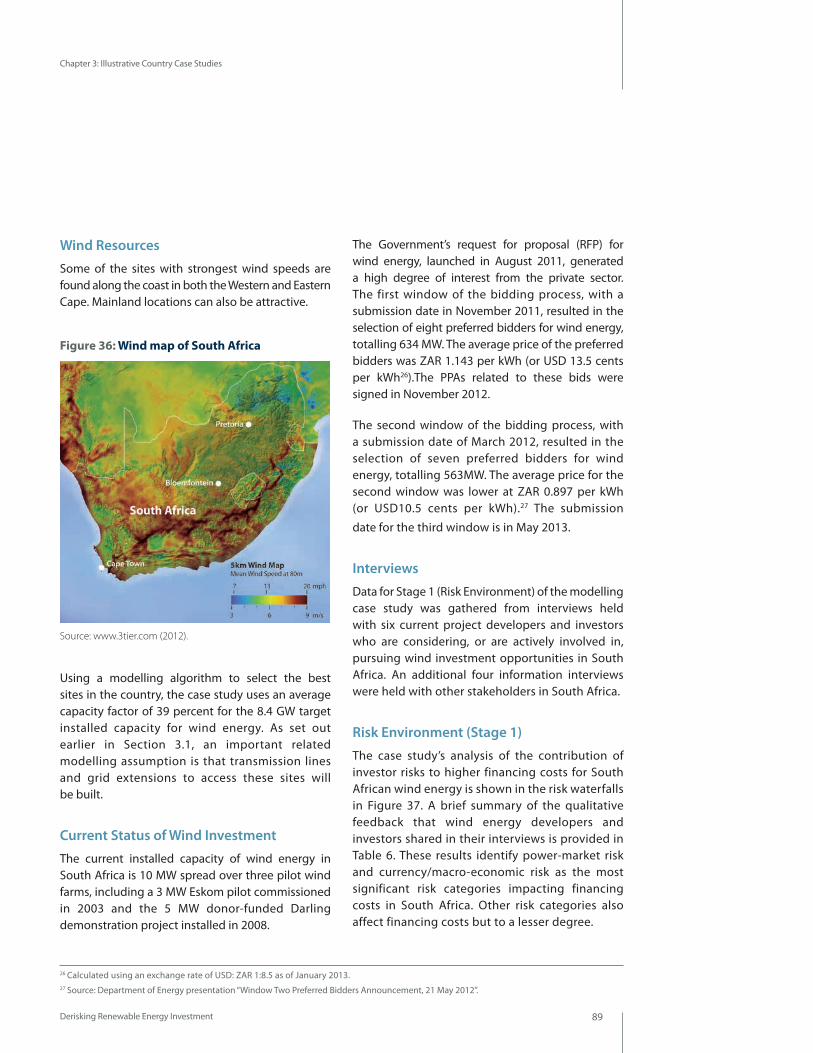
Derisking Renewable Energy Investment 89
Chapter 3: Illustrative Country Case Studies
Wind Resources
Some of the sites with strongest wind speeds are found along the coast in both the Western and Eastern Cape. Mainland locations can also be attractive.
Using a modelling algorithm to select the best sites in the country, the case study uses an average capacity factor of 39 percent for the 8.4 GW target installed capacity for wind energy. As set out earlier in Section 3.1, an important related modelling assumption is that transmission lines and grid extensions to access these sites will be built.
Current Status of Wind Investment
The current installed capacity of wind energy in South Africa is 10 MW spread over three pilot wind farms, including a 3 MW Eskom pilot commissioned in 2003 and the 5 MW donor-funded Darling demonstration project installed in 2008.
The Government’s request for proposal (RFP) for wind energy, launched in August 2011, generated a high degree of interest from the private sector. The first window of the bidding process, with a submission date in November 2011, resulted in the selection of eight preferred bidders for wind energy, totalling 634 MW. The average price of the preferred bidders was ZAR 1.143 per kWh (or USD 13.5 cents per kWh26).The PPAs related to these bids were signed in November 2012.
The second window of the bidding process, with a submission date of March 2012, resulted in the selection of seven preferred bidders for wind energy, totalling 563MW. The average price for the second window was lower at ZAR 0.897 per kWh (or USD10.5 cents per kWh).27 The submission
date for the third window is in May 2013.
Interviews
Data for Stage 1 (Risk Environment) of the modelling case study was gathered from interviews held with six current project developers and investors who are considering, or are actively involved in, pursuing wind investment opportunities in South Africa. An additional four information interviews were held with other stakeholders in South Africa.
Risk Environment (Stage 1)
The case study’s analysis of the contribution of investor risks to higher financing costs for South African wind energy is shown in the risk waterfalls in Figure 37. A brief summary of the qualitative feedback that wind energy developers and investors shared in their interviews is provided in Table 6. These results identify power-market risk and currency/macro-economic risk as the most significant risk categories impacting financing costs in South Africa. Other risk categories also affect financing costs but to a lesser degree.
26 Calculated using an exchange rate of USD: ZAR 1:8.5 as of January 2013.27 Source: Department of Energy presentation “Window Two Preferred Bidders Announcement, 21 May 2012”.
Figure 36: Wind map of South Africa
Source: www.3tier.com (2012).
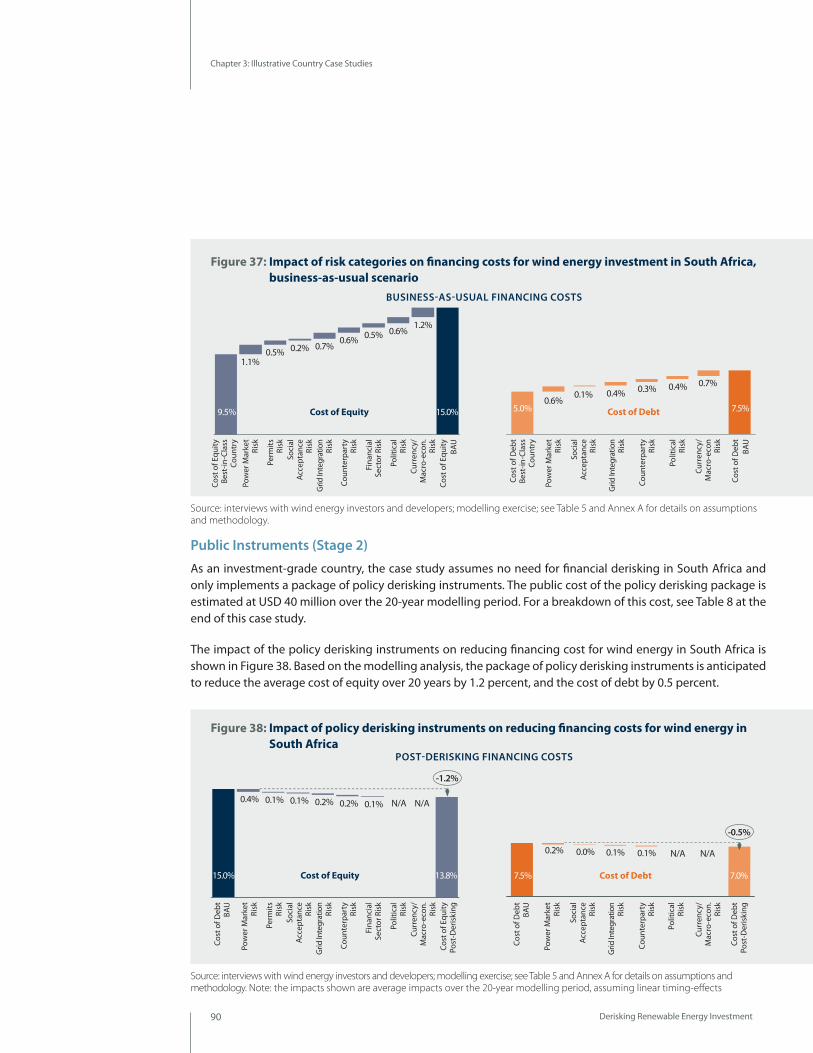
Derisking Renewable Energy Investment90
Chapter 3: Illustrative Country Case Studies
Public Instruments (Stage 2)
As an investment-grade country, the case study assumes no need for financial derisking in South Africa and only implements a package of policy derisking instruments. The public cost of the policy derisking package is estimated at USD 40 million over the 20-year modelling period. For a breakdown of this cost, see Table 8 at the end of this case study.
The impact of the policy derisking instruments on reducing financing cost for wind energy in South Africa is shown in Figure 38. Based on the modelling analysis, the package of policy derisking instruments is anticipated to reduce the average cost of equity over 20 years by 1.2 percent, and the cost of debt by 0.5 percent.
Figure 37: Impact of risk categories on financing costs for wind energy investment in South Africa, business-as-usual scenario
Figure 38: Impact of policy derisking instruments on reducing financing costs for wind energy in South Africa
Source: interviews with wind energy investors and developers; modelling exercise; see Table 5 and Annex A for details on assumptions and methodology.
Source: interviews with wind energy investors and developers; modelling exercise; see Table 5 and Annex A for details on assumptions and methodology. Note: the impacts shown are average impacts over the 20-year modelling period, assuming linear timing-effects
Cost of Equity
Cost of Equity
Cost of Equity
Cost
of E
quity
BAU
15.0% Cu
rren
cy/
Mac
ro-e
con.
Risk
1.2%
Polit
ical
Risk
0.6%
Fina
ncia
lSe
ctor
Ris
k
0.5% Co
unte
rpar
tyRi
sk
0.6%
1.1%
Perm
itsRi
sk
0.2%
Pow
er M
arke
tRi
sk
Soci
alAc
cept
ance
Risk
Cost
of E
quity
Best
-in-C
lass
Coun
try
0.7% 0.5%
Grid
Inte
grat
ion
Risk
Cost
of E
quity
BAU
Curr
ency
/M
acro
-eco
n.Ri
sk
Polit
ical
Risk
Fina
ncia
lSe
ctor
Ris
k
Coun
terp
arty
Risk
Perm
itsRi
sk
Pow
er M
arke
tRi
sk
Soci
alAc
cept
ance
Risk
Cost
of E
quity
Best
-in-C
lass
Coun
try
Grid
Inte
grat
ion
Risk
Cost
of E
quity
BAU
Curr
ency
/M
acro
-eco
n.Ri
sk
Polit
ical
Risk
Fina
ncia
lSe
ctor
Ris
k
Coun
terp
arty
Risk
Perm
itsRi
sk
Pow
er M
arke
tRi
sk
Soci
alAc
cept
ance
Risk
Cost
of E
quity
Best
-in-C
lass
Coun
try
Grid
Inte
grat
ion
Risk
Cost of Equity
Cost
of E
quity
BAU
Curr
ency
/M
acro
-eco
n.Ri
sk
Polit
ical
Risk
Fina
ncia
lSe
ctor
Ris
k
Coun
terp
arty
Risk
Perm
itsRi
sk
Pow
er M
arke
tRi
sk
Soci
alAc
cept
ance
Risk
Cost
of E
quity
Best
-in-C
lass
Coun
try
Grid
Inte
grat
ion
Risk
9.5% 18.0%
0.9% 1.5%
1.4%
1.5%
1.3%
9.5%
0.9%
0.1% 1.0%
15.0%
0.5% 0.4% 0.7% 0.5%
0.9% 0.7%
0.8% 0.9%
9.5% 18.0%
0.4% 1.4%
1.6% 1.4%
1.3%
0.0% 0.8% 1.7%
9.5%
0.3% 0.2% 0.3% 0.2% 0.2% 0.2%
0.5% 0.3% 0.0%
18.0%
0.6% 0.2%
0.3%
16.1%
0.5% 0.4% 0.0% 0.3%
0.2% 0.6%
-1.2%
Cost
of E
quity
Post
-Der
iski
ng
0.2%
Soci
alAc
cept
ance
Risk
0.1%
Perm
itsRi
sk
0.1%
Fina
ncia
lSe
ctor
Ris
k
15.0%
Polit
ical
Risk
0.2% 0.1%
Curr
ency
/M
acro
-eco
n.Ri
sk
13.8%
0.4% N/A N/A
Cost
of D
ebt
BAU
Coun
terp
arty
Risk
Pow
er M
arke
tRi
sk
Grid
Inte
grat
ion
Risk
Cost of Equity Cost of Equity
Cost
of E
quity
Post
-Der
iski
ng
Soci
alAc
cept
ance
Risk
Perm
itsRi
sk
Fina
ncia
lSe
ctor
Ris
k
15.0%
Polit
ical
Risk
Curr
ency
/M
acro
-eco
n.Ri
sk
13.6%
N/A N/A
Cost
of D
ebt
BAU
Coun
terp
arty
Risk
Pow
er M
arke
tRi
sk
Grid
Inte
grat
ion
Risk
Cost
of E
quity
Post
-Der
iski
ng
Soci
alAc
cept
ance
Risk
Perm
itsRi
sk
Fina
ncia
lSe
ctor
Ris
k
Polit
ical
Risk
Curr
ency
/M
acro
-eco
n.Ri
sk
Cost
of D
ebt
BAU
Coun
terp
arty
Risk
Pow
er M
arke
tRi
sk
Grid
Inte
grat
ion
Risk
Co
st o
f Equ
ityPo
st-D
eris
king
Soci
alAc
cept
ance
Risk
Perm
itsRi
sk
Fina
ncia
lSe
ctor
Ris
k
Polit
ical
Risk
Curr
ency
/M
acro
-eco
n.Ri
sk
Cost
of D
ebt
BAU
Coun
terp
arty
Risk
Pow
er M
arke
tRi
sk
Grid
Inte
grat
ion
Risk
Cost of Equity 18.0% 15.9% Cost of Equity
-1.9%
N/A N/A
-2.1%
N/A N/A
-1.4%
0.7% 0.4% 0.6%
0.4% 0.1% 0.3% 0.4%
0.7%
0.7% 0.6% 0.0%
0.6%
0.2% 0.7%
0.7% 0.9% 0.0%
0.9% 0.5% 0.7% 0.4% 0.3%
0.7% 0.4%
Cost of Debt
Cost of Debt
Cost of Debt
Cost
of D
ebt
BAU
7.5%
Curr
ency
/M
acro
-eco
nRi
sk
Polit
ical
Risk
Coun
terp
arty
Risk
Pow
er M
arke
tRi
sk
Soci
alAc
cept
ance
Risk
Cost
of D
ebt
Best
-in-C
lass
Coun
try
Grid
Inte
grat
ion
Risk
Cost
of D
ebt
BAU
Curr
ency
/M
acro
-eco
n.Ri
sk
Polit
ical
Risk
Coun
terp
arty
Risk
Pow
er M
arke
tRi
sk
Soci
alAc
cept
ance
Risk
Cost
of D
ebt
Best
-in-C
lass
Coun
try
Grid
Inte
grat
ion
Risk
Cost
of D
ebt
BAU
Curr
ency
/M
acro
-eco
n.Ri
sk
Polit
ical
Risk
Coun
terp
arty
Risk
Pow
er M
arke
tRi
sk
Soci
alAc
cept
ance
Risk
Cost
of D
ebt
Best
-in-C
lass
Coun
try
Grid
Inte
grat
ion
Risk
Cost
of D
ebt
BAU
Curr
ency
/M
acro
-eco
n.Ri
sk
Polit
ical
Risk
Coun
terp
arty
Risk
Pow
er M
arke
tRi
sk
Soci
alAc
cept
ance
Risk
Cost
of D
ebt
Best
-in-C
lass
Coun
try
Grid
Inte
grat
ion
Risk
Cost of Debt
5.0% 8.0% 5.0%
8.0% 5.0% 8.5% 5.0%
0.1% 0.1% 0.0% 0.2% 0.2% 0.3% 0.0% 0.2%
0.2% 0.2% 0.2% 0.2% 0.3% 0.2% 0.2% 0.0%
N/A N/A
N/A N/A
N/A N/A
N/A N/A
8.0% 7.3%
-0.5%
Cost
of D
ebt
Post
-Der
iski
ng
Soci
alAc
cept
ance
Risk
7.5%
Polit
ical
Risk
Curr
ency
/M
acro
-eco
n.Ri
sk
7.0%
Cost
of D
ebt
BAU
Coun
terp
arty
Risk
Pow
er M
arke
tRi
sk
Grid
Inte
grat
ion
Risk
Cost
of D
ebt
Post
-Der
iski
ng
Soci
alAc
cept
ance
Risk
Polit
ical
Risk
Curr
ency
/M
acro
-eco
n.Ri
sk
Cost
of D
ebt
BAU
Coun
terp
arty
Risk
Pow
er M
arke
tRi
sk
Grid
Inte
grat
ion
Risk
Cost of Debt Cost of Debt
Cost
of D
ebt
Post
-Der
iski
ng
Soci
alAc
cept
ance
Risk
Polit
ical
Risk
Curr
ency
/M
acro
-eco
n.Ri
sk
Cost
of D
ebt
BAU
Coun
terp
arty
Risk
Pow
er M
arke
tRi
sk
Grid
Inte
grat
ion
Risk
Cost
of D
ebt
Post
-Der
iski
ng
Soci
alAc
cept
ance
Risk
Polit
ical
Risk
Curr
ency
/M
acro
-eco
n.Ri
sk
Cost
of D
ebt
BAU
Coun
terp
arty
Risk
Pow
er M
arke
tRi
sk
Grid
Inte
grat
ion
Risk
8.0% 7.2% Cost of Debt 8.5% 7.7% Cost of Debt
-0.7%
-0.8% -0.8%
BUSINESS-AS-USUAL FINANCING COSTS
POST-DERISKING FINANCING COSTS

Derisking Renewable Energy Investment 91
Chapter 3: Illustrative Country Case Studies
RISK CATEGORy DESCRIPTION/EXAMPLES OF RISK
Power market risk This risk category has a high impact on financing costs. On the positive side, investors comment favourably on many aspects of the regulatory framework. South Africa has a clear long-term 2030 target for wind energy in place. After a prolonged start, when the originally envisaged renewable energy feed-in tariff (‘REFIT’) was dropped, investors generally praise the replacement bidding process as well-defined and robust. The bidding process’s stringent requirements on financing to ensure projects are commissioned is viewed positively. In terms of competitiveness, investors note that fossil fuel subsidies on electricity have been rolled-back in recent years, with end-user pricing rising significantly in this period.
On the other hand, investors raise concerns in a number of areas. Some caution is expressed regarding Eskom’s monopoly and a perception of past difficult experiences for fossil fuel IPPs to enter the market in South Africa. Some investors remark that tender processes can result in aggressive bidding and question whether current bids are sustainable. Investors also raise concerns regarding delays to the tender process. Looking ahead, investors note that it will be important for the government to closely monitor the development of the energy sector if it is to continue to maintain an effective regulatory framework going forward. Some investors expect local content requirements may become restrictive in later bidding windows.
Permits risk This risk category has a moderate impact on financing costs. Investors generally view the licensing process with NERSA and other entities positively, noting good progress having been made in designing transparent, streamlined procedures, as well as in training staff specifically in wind energy. At the same time, some investors comment on a lack of coordination between entities issuing licences and permits.
Social acceptance risk
This risk category has a low impact on financing costs. Investors remark that public resistance to wind energy is low. They also note that the bidding process has trust-building requirements with local communities, with many communities holding stakes of up to 5 percent. Some investors, however, feel that social acceptance risk may increase overtime, particularly as wind farms become more widespread. Wind power can be perceived negatively as being expensive in comparison to coal-fuelled power.
Grid integration risk
This risk category has a moderate impact on financing costs. Investors comment that, after a mixed start, good recent progress has been made in coordinating with Eskom on this matter. NERSA has been regularly updating the grid code, which investors comment on as being realistic and suitable. The PPA has a 5 percent curtailment clause - investors note it is important that this is correctly priced into bids.
Counterparty risk This risk category has a moderate impact on financing costs. The standard PPA is with Eskom, however Eskom’s payments are backed by the Department of Energy. Investors are reassured by this government backing. Nonetheless, given the large long-term targets for renewable energy in South Africa, investors comment that counterparty risk remains, even at the sovereign level.
Financial sector risk This risk category has a moderate impact on financing costs. South Africa has a large, developed financial sector, which has welcomed and engaged with wind-energy. The successful participants in the first bidding windows have obtained commitments for financing, in the most part from domestic banks. Given the large total investments needed to meet the long-term target, investors do express concern regarding lack of capital for investors participating in future bidding windows.
Political risk This risk category has a moderate impact on financing costs. Investors are generally attracted by South Africa’s stable political environment. Nonetheless, issues such as social inequality and good governance are identified as possible concerns.
Currency/ macro-economic risk
This risk category has a high impact on financing costs. The standard PPA for wind-energy is Rand-denominated and inflation- linked. Investors comment that this creates significant currency risk, particularly given the historical volatility of the Rand.
Table 6: Investor feedback on risk categories for wind energy investment in South Africa
Source: interviews with wind energy investors and developers.
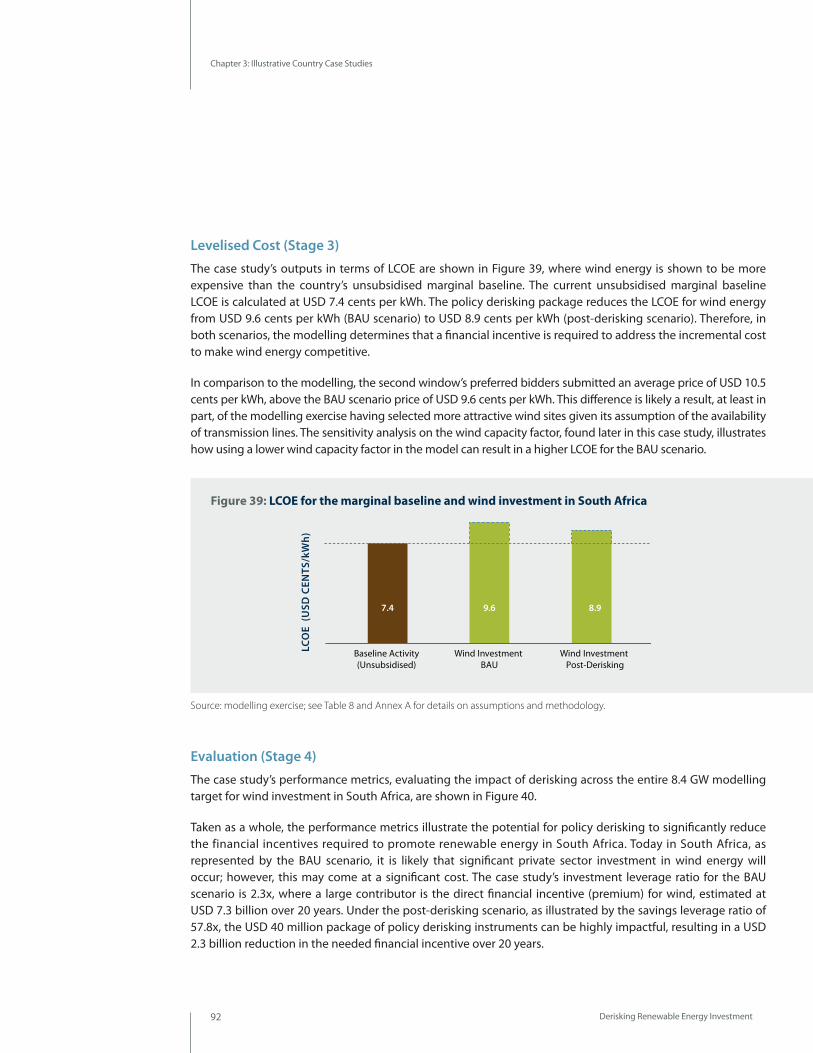
Derisking Renewable Energy Investment92
Chapter 3: Illustrative Country Case Studies
Levelised Cost (Stage 3)
The case study’s outputs in terms of LCOE are shown in Figure 39, where wind energy is shown to be more expensive than the country’s unsubsidised marginal baseline. The current unsubsidised marginal baseline LCOE is calculated at USD 7.4 cents per kWh. The policy derisking package reduces the LCOE for wind energy from USD 9.6 cents per kWh (BAU scenario) to USD 8.9 cents per kWh (post-derisking scenario). Therefore, in both scenarios, the modelling determines that a financial incentive is required to address the incremental cost to make wind energy competitive.
In comparison to the modelling, the second window’s preferred bidders submitted an average price of USD 10.5 cents per kWh, above the BAU scenario price of USD 9.6 cents per kWh. This difference is likely a result, at least in part, of the modelling exercise having selected more attractive wind sites given its assumption of the availability of transmission lines. The sensitivity analysis on the wind capacity factor, found later in this case study, illustrates how using a lower wind capacity factor in the model can result in a higher LCOE for the BAU scenario.
Evaluation (Stage 4)
The case study’s performance metrics, evaluating the impact of derisking across the entire 8.4 GW modelling target for wind investment in South Africa, are shown in Figure 40.
Taken as a whole, the performance metrics illustrate the potential for policy derisking to significantly reduce the financial incentives required to promote renewable energy in South Africa. Today in South Africa, as represented by the BAU scenario, it is likely that significant private sector investment in wind energy will occur; however, this may come at a significant cost. The case study’s investment leverage ratio for the BAU scenario is 2.3x, where a large contributor is the direct financial incentive (premium) for wind, estimated at USD 7.3 billion over 20 years. Under the post-derisking scenario, as illustrated by the savings leverage ratio of 57.8x, the USD 40 million package of policy derisking instruments can be highly impactful, resulting in a USD 2.3 billion reduction in the needed financial incentive over 20 years.
Figure 39: LCOE for the marginal baseline and wind investment in South Africa
Source: modelling exercise; see Table 8 and Annex A for details on assumptions and methodology.
Wind Investment Post-Derisking
Wind Investment BAU
Baseline Activity (Unsubsidised)
8.99.67.4
LCO
E (U
SD C
ENTS
/kW
h)
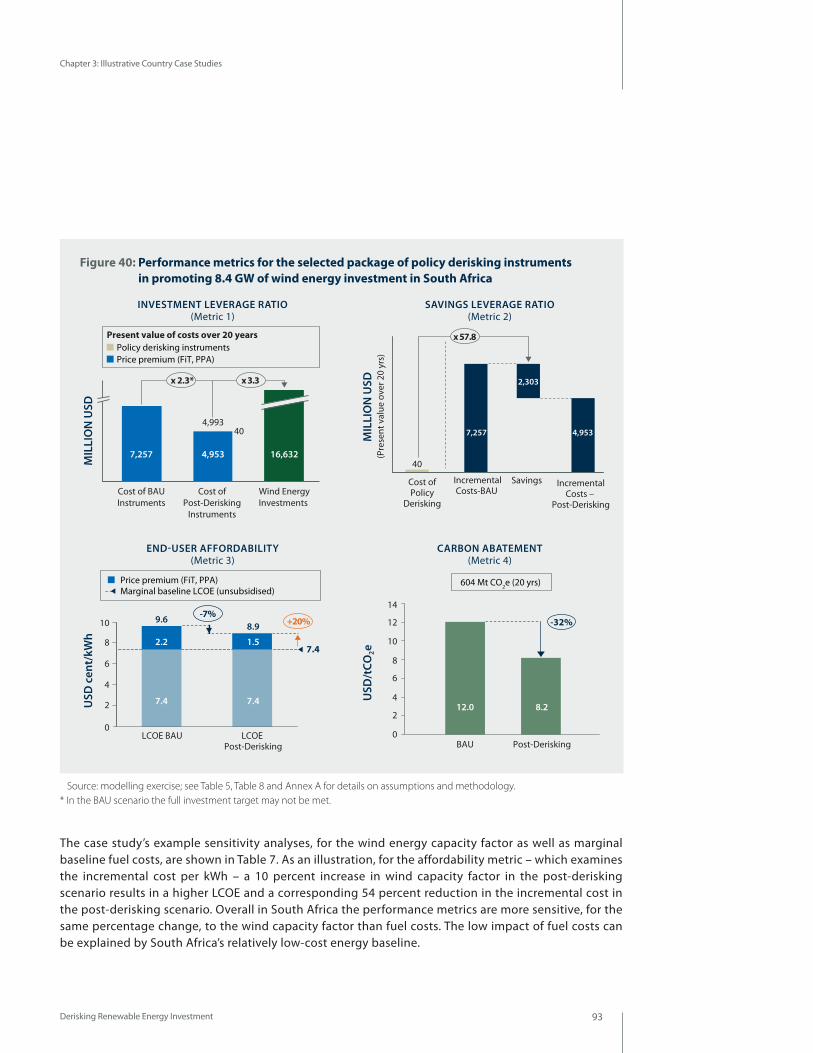
Derisking Renewable Energy Investment 93
Chapter 3: Illustrative Country Case Studies
The case study’s example sensitivity analyses, for the wind energy capacity factor as well as marginal baseline fuel costs, are shown in Table 7. As an illustration, for the affordability metric – which examines the incremental cost per kWh – a 10 percent increase in wind capacity factor in the post-derisking scenario results in a higher LCOE and a corresponding 54 percent reduction in the incremental cost in the post-derisking scenario. Overall in South Africa the performance metrics are more sensitive, for the same percentage change, to the wind capacity factor than fuel costs. The low impact of fuel costs can be explained by South Africa’s relatively low-cost energy baseline.
x 2.3*
MIL
LIO
N U
SD
Wind EnergyInvestments
16,632
Cost of Post-Derisking
Instruments
4,993
4,953
Cost of BAUInstruments
7,257
x 3.3
40
Policy derisking instruments Present value of costs over 20 years
Price premium (FiT, PPA)
Price premium (FiT, PPA) Marginal baseline LCOE (unsubsidised)
-7%
USD
cen
t/kW
h
7.4
10
8
6
4
2
0
+20%
LCOE Post-Derisking
LCOE BAU
7.4 7.4
2.2 1.5
9.68.9
MIL
LIO
N U
SD
x 57.8
40
(Pre
sent
val
ue o
ver 2
0 yr
s)
4,953
2,303
7,257
IncrementalCosts –
Post-Derisking
Savings IncrementalCosts-BAU
Cost ofPolicy
Derisking
-32%
USD
/tCO
2e
14
12
10
8
6
4
2
0
8.212.0
BAU Post-Derisking
604 Mt CO2e (20 yrs)
Figure 40: Performance metrics for the selected package of policy derisking instruments in promoting 8.4 GW of wind energy investment in South Africa
INVESTMENT LEVERAGE RATIO (Metric 1)
END-USER AFFORDABILITY (Metric 3)
SAVINGS LEVERAGE RATIO (Metric 2)
CARBON ABATEMENT (Metric 4)
Source: modelling exercise; see Table 5, Table 8 and Annex A for details on assumptions and methodology. * In the BAU scenario the full investment target may not be met.
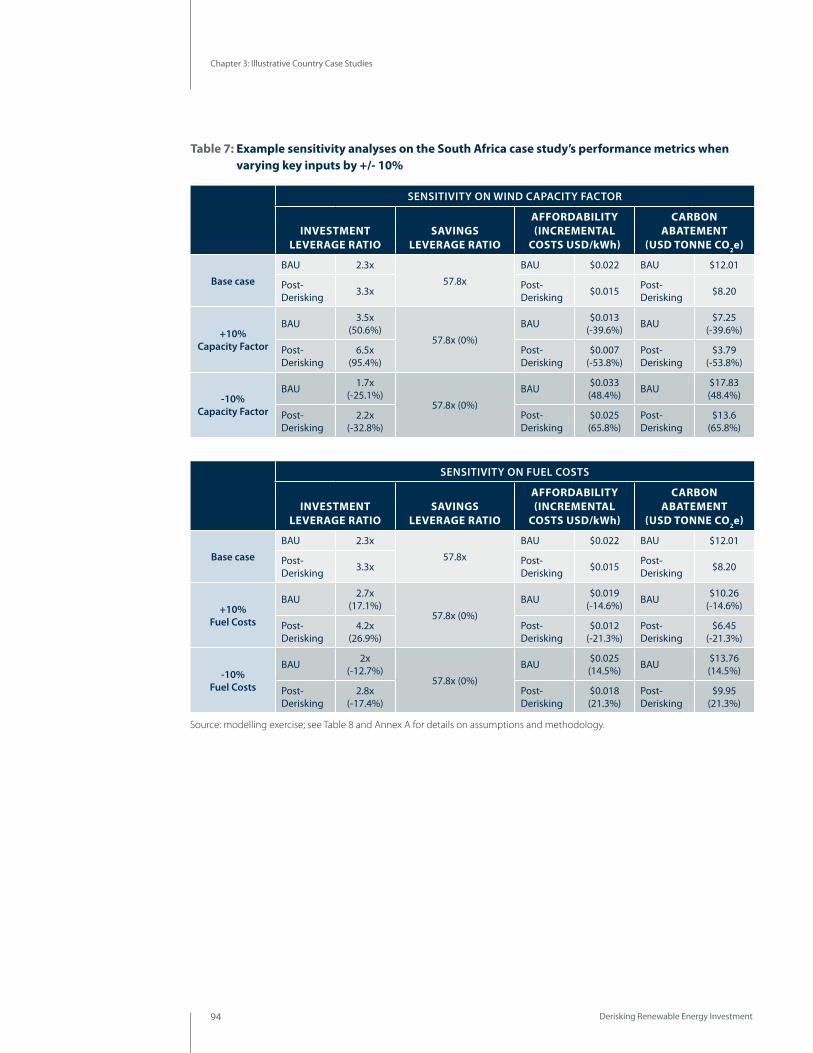
Derisking Renewable Energy Investment94
Chapter 3: Illustrative Country Case Studies
SENSITIVITY ON WIND CAPACITY FACTOR
INVESTMENT LEVERAGE RATIO
SAVINGS LEVERAGE RATIO
AFFORDABILITy (INCREMENTAL
COSTS USD/kWh)
CARBON ABATEMENT
(USD TONNE CO2e)
Base case
BAU 2.3x
57.8x
BAU $0.022 BAU $12.01
Post- Derisking 3.3x Post-
Derisking $0.015 Post- Derisking $8.20
+10% Capacity Factor
BAU 3.5x (50.6%)
57.8x (0%)
BAU $0.013 (-39.6%) BAU $7.25
(-39.6%)
Post- Derisking
6.5x (95.4%)
Post- Derisking
$0.007 (-53.8%)
Post- Derisking
$3.79 (-53.8%)
-10% Capacity Factor
BAU 1.7x (-25.1%)
57.8x (0%)
BAU $0.033 (48.4%) BAU $17.83
(48.4%)
Post- Derisking
2.2x (-32.8%)
Post- Derisking
$0.025 (65.8%)
Post- Derisking
$13.6 (65.8%)
SENSITIVITY ON FUEL COSTS
INVESTMENT LEVERAGE RATIO
SAVINGS LEVERAGE RATIO
AFFORDABILITy (INCREMENTAL
COSTS USD/kWh)
CARBON ABATEMENT
(USD TONNE CO2e)
Base case
BAU 2.3x
57.8x
BAU $0.022 BAU $12.01
Post- Derisking 3.3x Post-
Derisking $0.015 Post- Derisking $8.20
+10% Fuel Costs
BAU 2.7x (17.1%)
57.8x (0%)
BAU $0.019 (-14.6%) BAU $10.26
(-14.6%)
Post- Derisking
4.2x (26.9%)
Post- Derisking
$0.012 (-21.3%)
Post- Derisking
$6.45 (-21.3%)
-10% Fuel Costs
BAU 2x (-12.7%)
57.8x (0%)
BAU $0.025 (14.5%) BAU $13.76
(14.5%)
Post- Derisking
2.8x (-17.4%)
Post- Derisking
$0.018 (21.3%)
Post- Derisking
$9.95 (21.3%)
Table 7: Example sensitivity analyses on the South Africa case study’s performance metrics when varying key inputs by +/- 10%
Source: modelling exercise; see Table 8 and Annex A for details on assumptions and methodology.

Derisking Renewable Energy Investment 95
Chapter 3: Illustrative Country Case Studies
WIND TARGET AND RESOURCES20 Year Target (in MW) 8,400 Wind Capacity Factor (%) 39%Total Annual Energy Production for Target (in MWh) 28,761,600
MARGINAL BASELINEEnergy Mix Coal (%) 100%Grid Emission Factor (tCO2e/MWh) 1.050
GENERAL COUNTRY INPUTSEffective Corporate Tax Rate (%) 28%Public Cost of Capital (%) 6%
BUSINESS-AS-USUAL SCENARIO
POST-DERISKING SCENARIO
FINANCING COSTS
Capital Structure Debt/Equity Split
70.0%/30.0%
72.5%/27.5%
Cost of Debt Non-concessional public loan Commercial loans with public guarantees Commercial loans without public guarantees
N/A N/A
7.5%
N/A N/A
7.0%
Loan Tenor Non-concessional public loan Commercial loans with public guarantees Commercial loans without public guarantees
N/A N/A
10 years
N/A N/A
11 years
Cost of Equity 15.0% 13.8%
Weighted Average Cost of Capital (WACC) (After-tax) 8.3% 7.5%
INVESTMENT
Total Investment (USD million) $16,632.0 $16,632.0
Debt (USD million) Non-concessional public loan Commercial loans with public guarantees Commercial loans without public guarantees
N/A N/A
$11,642.4
N/A N/A
$12,058.2
Equity (USD million) Private Sector Equity Public Sector Equity
$4,989.6
N/A
$4,573.8
N/A
COST OF PUBLIC INSTRUMENTS
Policy Derisking Instruments (USD million, 20 years) Power market risk activities Permits risk activities Social acceptance risk activities Grid integration risk activities Counterparty risk activities Financial sector risk activities Total
N/A N/A N/A N/A N/A N/A N/A
$14.3 $4.1 $4.5 $7.5 $6.5 $2.8
$39.8
Financial Derisking Instruments (USD million, 20 years) Methodology for costing Use of paid-in-capital leverage multiplier Non-concessional public loan Public guarantees for commercial loans Political risk insurance Total
N/A N/A N/A N/A N/A N/A
N/A N/A N/A N/A N/A N/A
Direct Financial Incentives (USD million, 20 years) Present Value of 20 year PPA Price Premium Funded by domestic public sector Funded by international public sector
$7,257.0 $0.0
$4,953.0 $0.0
Table 8: Summary assumptions for the South Africa case study
Source: modelling exercise; see Table 5 and Annex A for details on assumptions and methodology.Financing costs are average cost over 20-year target.

Derisking Renewable Energy Investment96
Chapter 3: Illustrative Country Case Studies
3.3 COUNTRY RESULTS FOR PANAMA
20-Year Target for Wind Energy
The modelling case study assumes a 1 GW 20-year target for wind investment in Panama.29 Two possible visions for wind energy in Panama, or some combination of both, could support this modelling target. A domestic-led vision could involve wind energy playing a significant role in meeting Panama’s rapidly increasing domestic electricity demand. Wind energy has the benefit of complementing Panama’s existing hydro-power, as the windiest months are in the dry season when energy is most expensive. An alternative, export-led vision sees Panama taking advantage of its comparative advantages, strong wind resources and a stable investment climate to export power to its neighbouring countries. Opportunities for export could exist with other Central American countries, Colombia and Mexico.30
Baseline Energy Mix
Panama currently has an available installed capacity of 1,320 MW,31 split approximately equally between thermal power and hydro-power. After significant investment in hydro-power in the late 1970s and 1980s, the majority of recent investment has been in oil-based power (bunker, diesel and marine diesel), which is quickly implemented and has low-upfront investment costs, but has resulted in high generation costs. The current installed capacity is anticipated to barely cover current peak demand of 1,280 MW. Demand is expected to continue to increase at high single-digit growth rates in coming years.
29 Sources: Economist Intelligence Unit; Standard & Poor's; www.doingbusiness.org; UNDP. 29 The Panamanian Government has currently not issued its own long-term target for wind.30 SIEPAC is a proposed 300 MW transmission line linking 37 million consumers in replace with Costa Rica, El Salvador, Guatemala, Honduras, Nicaragua
and Panama. ICP is a proposed 600 MW 614 km transmission line between Panama and Colombia. ICP may face resistance from indigenous groups. 31 Source: ASEP statement, 2012. Note total installed capacity is quoted as 2,322 MW, which is subsequently discounted to 1,669 MW in firm power,
and after transmission losses, 1,320 MW.
General Country Data28
Population 2011: 3.6m
Land Area: 75,420sq km (118th)
GDP 2011 (USD): $31.8bn
GDP/capita (USD, PPP) 2011:
$18,100
Sovereign rating 2012:
Investment grade, [BBB-] S&P
Doing Business 2012:
61st
UNDP HDI 2012: 0.780 (59th)
OilHydroBiofuels & waste
GW
h
6,000
8,000
0
2,000
4,000
20092007200520032001199919971995199319911989198719851983198119791977197519731971
Figure 41: Energy generation mix in Panama (1971 to 2009)
Source: www.iea.org (2012).

Derisking Renewable Energy Investment 97
Chapter 3: Illustrative Country Case Studies
The modelling case study assumes a marginal baseline mix of 62 percent heavy fuel oil and 38 percent hydro-power, using the UNFCCC CDM methodology for determining marginal baselines. A grid emission factor of 0.435 tonnes of CO2e/MWh is estimated for the baseline.
Wind Resources
Attractive wind sites can be found throughout much of the country. Particularly strong resources can be found in west Panama along the central mountain chain.
Using a modelling algorithm to select the best sites in the country, the case study assumes an average capacity factor of 43 percent over the 1 GW wind energy target. As set out earlier in Section 3.1, an important related modelling assumption is that transmission lines and grid extensions to access these sites will be built.
Current Status of Wind Investment
Panama is currently attracting the interest of a number of private sector wind energy developers and investors; however, to date there has been no construction in wind energy on the ground.
Autoridad Nacional de Servicios Publicos (ASEP), the authority issuing generation licences, has now issued five definitive licences: two licences totalling 330 MW to one developer and an additional three licences totalling 235 MW to a second developer. ASEP is also evaluating, or has issued, provisional licences for 17 other wind sites, for a further total of 1,484 MW in installed capacity. Empresa de Transmisión Eléctrica S.A, (ETESA), the state-owned transmission company overseeing the power market, in turn held its first exclusive wind tender in November 2011. The successful bidder, which had already secured 235 MW in generation licences, submitted bids at between USD 9.5 cents per kWh and USD 11.0 cents per kWh. As of January 2013, the developer had yet to begin construction on any of its sites. ETESA is currently expected to launch its next tender sometime in 2013.
Interviews
Data for Stage 1 (Risk Environment) of the modelling case study was gathered from interviews held with five current project developers and investors who are considering, or are actively involved in, pursuing wind energy investment opportunities in Panama. An additional three information interviews were held with other stakeholders in Panama.
Risk Environment (Stage 1)
The case study’s analysis of the contribution of risks to increasing financing costs for Panamanian wind energy is shown in the risk waterfalls in Figure 43. A brief summary of the qualitative feedback that wind energy developers and investors shared in their interviews is provided in Table 9. A range of risk categories – power market risk, permits risk, social acceptance risk, grid integration risk and financial sector risk – appear to affect financing costs. Counterparty risk, political risk and currency/macro-economic risk are the least significant.
Figure 42: Wind map of Panama
Source: www.3tier.com (2012).

Derisking Renewable Energy Investment98
Chapter 3: Illustrative Country Case Studies
Public Instruments (Stage 2)
As an investment-grade country, the case study assumes no need for financial derisking32 in Panama and only implements a package of policy derisking instruments. The public cost of the policy derisking package is estimated at USD 20 million over the 20-year modelling period. For a breakdown of this cost, see Table 11 at the end of this case study.
The impact of the policy derisking instruments on reducing the financing cost for wind energy in Panama is shown in Figure 44. Based on the case study’s analysis, the package of policy derisking instruments is anticipated to reduce the average cost of equity over 20 years by 1.4 percent, and the cost of debt by 0.8 percent.
Figure 43: Impact of risk categories on financing costs for wind energy investment in Panama, business-as-usual scenario
Figure 44: Impact of policy derisking instruments on reducing financing costs for wind energy in Panama
Source: interviews with wind energy investors and developers; modelling exercise; see Table 5 and Annex A for details on assumptions and methodology.
Source: interviews with wind energy investors and developers; modelling exercise; see Table 5 and Annex A for details on assumptions and methodology. Note: the impacts shown are average impacts over the 20-year modelling period, assuming linear timing effects.
Cost of Equity
Cost of Equity
Cost of Equity
Cost
of E
quity
BAU
15.0%
Curr
ency
/M
acro
-eco
n.Ri
sk
1.2%
Polit
ical
Risk
0.6%
Fina
ncia
lSe
ctor
Ris
k
0.5%
Coun
terp
arty
Risk
0.6%
1.1%
Perm
itsRi
sk
0.2%
Pow
er M
arke
tRi
sk
Soci
alAc
cept
ance
Risk
Cost
of E
quity
Best
-in-C
lass
Coun
try
0.7% 0.5%
Grid
Inte
grat
ion
Risk
Cost
of E
quity
BAU
Curr
ency
/M
acro
-eco
n.Ri
sk
Polit
ical
Risk
Fina
ncia
lSe
ctor
Ris
k
Coun
terp
arty
Risk
Perm
itsRi
sk
Pow
er M
arke
tRi
sk
Soci
alAc
cept
ance
Risk
Cost
of E
quity
Best
-in-C
lass
Coun
try
Grid
Inte
grat
ion
Risk
Cost
of E
quity
BAU
Curr
ency
/M
acro
-eco
n.Ri
sk
Polit
ical
Risk
Fina
ncia
lSe
ctor
Ris
k
Coun
terp
arty
Risk
Perm
itsRi
sk
Pow
er M
arke
tRi
sk
Soci
alAc
cept
ance
Risk
Cost
of E
quity
Best
-in-C
lass
Coun
try
Grid
Inte
grat
ion
Risk
Cost of Equity
Cost
of E
quity
BAU
Curr
ency
/M
acro
-eco
n.Ri
sk
Polit
ical
Risk
Fina
ncia
lSe
ctor
Ris
k
Coun
terp
arty
Risk
Perm
itsRi
sk
Pow
er M
arke
tRi
sk
Soci
alAc
cept
ance
Risk
Cost
of E
quity
Best
-in-C
lass
Coun
try
Grid
Inte
grat
ion
Risk
9.5% 18.0%
0.9% 1.5%
1.4%
1.5%
1.3%
9.5%
0.9%
0.1% 1.0%
15.0%
0.5% 0.4% 0.7% 0.5%
0.9% 0.7%
0.8% 0.9%
9.5% 18.0%
0.4% 1.4%
1.6% 1.4%
1.3%
0.0% 0.8% 1.7%
9.5%
0.3% 0.2% 0.3% 0.2% 0.2% 0.2%
0.5% 0.3% 0.0%
18.0%
0.6% 0.2%
0.3%
16.1%
0.5% 0.4% 0.0% 0.3%
0.2% 0.6%
-1.2%
Cost
of E
quity
Post
-Der
iski
ng
0.2%
Soci
alAc
cept
ance
Risk
0.1%
Perm
itsRi
sk
0.1%
Fina
ncia
lSe
ctor
Ris
k
15.0%
Polit
ical
Risk
0.2% 0.1%
Curr
ency
/M
acro
-eco
n.Ri
sk
13.8%
0.4% N/A N/A
Cost
of D
ebt
BAU
Coun
terp
arty
Risk
Pow
er M
arke
tRi
sk
Grid
Inte
grat
ion
Risk
Cost of Equity Cost of Equity
Cost
of E
quity
Post
-Der
iski
ng
Soci
alAc
cept
ance
Risk
Perm
itsRi
sk
Fina
ncia
lSe
ctor
Ris
k
15.0%
Polit
ical
Risk
Curr
ency
/M
acro
-eco
n.Ri
sk
13.6%
N/A N/A
Cost
of D
ebt
BAU
Coun
terp
arty
Risk
Pow
er M
arke
tRi
sk
Grid
Inte
grat
ion
Risk
Cost
of E
quity
Post
-Der
iski
ng
Soci
alAc
cept
ance
Risk
Perm
itsRi
sk
Fina
ncia
lSe
ctor
Ris
k
Polit
ical
Risk
Curr
ency
/M
acro
-eco
n.Ri
sk
Cost
of D
ebt
BAU
Coun
terp
arty
Risk
Pow
er M
arke
tRi
sk
Grid
Inte
grat
ion
Risk
Co
st o
f Equ
ityPo
st-D
eris
king
Soci
alAc
cept
ance
Risk
Perm
itsRi
sk
Fina
ncia
lSe
ctor
Ris
k
Polit
ical
Risk
Curr
ency
/M
acro
-eco
n.Ri
sk
Cost
of D
ebt
BAU
Coun
terp
arty
Risk
Pow
er M
arke
tRi
sk
Grid
Inte
grat
ion
Risk
Cost of Equity 18.0% 15.9% Cost of Equity
-1.9%
N/A N/A
-2.1%
N/A N/A
-1.4%
0.7% 0.4% 0.6%
0.4% 0.1% 0.3% 0.4%
0.7%
0.7% 0.6% 0.0%
0.6%
0.2% 0.7%
0.7% 0.9% 0.0%
0.9% 0.5% 0.7% 0.4% 0.3%
0.7% 0.4%
Cost of Debt
Cost of Debt
Cost of Debt
Cost
of D
ebt
BAU
7.5%
Curr
ency
/M
acro
-eco
nRi
sk
Polit
ical
Risk
Coun
terp
arty
Risk
Pow
er M
arke
tRi
sk
Soci
alAc
cept
ance
Risk
Cost
of D
ebt
Best
-in-C
lass
Coun
try
Grid
Inte
grat
ion
Risk
Cost
of D
ebt
BAU
Curr
ency
/M
acro
-eco
n.Ri
sk
Polit
ical
Risk
Coun
terp
arty
Risk
Pow
er M
arke
tRi
sk
Soci
alAc
cept
ance
Risk
Cost
of D
ebt
Best
-in-C
lass
Coun
try
Grid
Inte
grat
ion
Risk
Cost
of D
ebt
BAU
Curr
ency
/M
acro
-eco
n.Ri
sk
Polit
ical
Risk
Coun
terp
arty
Risk
Pow
er M
arke
tRi
sk
Soci
alAc
cept
ance
Risk
Cost
of D
ebt
Best
-in-C
lass
Coun
try
Grid
Inte
grat
ion
Risk
Cost
of D
ebt
BAU
Curr
ency
/M
acro
-eco
n.Ri
sk
Polit
ical
Risk
Coun
terp
arty
Risk
Pow
er M
arke
tRi
sk
Soci
alAc
cept
ance
Risk
Cost
of D
ebt
Best
-in-C
lass
Coun
try
Grid
Inte
grat
ion
Risk
Cost of Debt
5.0% 8.0% 5.0%
8.0% 5.0% 8.5% 5.0%
0.1% 0.1% 0.0% 0.2% 0.2% 0.3% 0.0% 0.2%
0.2% 0.2% 0.2% 0.2% 0.3% 0.2% 0.2% 0.0%
N/A N/A
N/A N/A
N/A N/A
N/A N/A
8.0% 7.3%
-0.5%
Cost
of D
ebt
Post
-Der
iski
ng
Soci
alAc
cept
ance
Risk
7.5%
Polit
ical
Risk
Curr
ency
/M
acro
-eco
n.Ri
sk
7.0%
Cost
of D
ebt
BAU
Coun
terp
arty
Risk
Pow
er M
arke
tRi
sk
Grid
Inte
grat
ion
Risk
Cost
of D
ebt
Post
-Der
iski
ng
Soci
alAc
cept
ance
Risk
Polit
ical
Risk
Curr
ency
/M
acro
-eco
n.Ri
sk
Cost
of D
ebt
BAU
Coun
terp
arty
Risk
Pow
er M
arke
tRi
sk
Grid
Inte
grat
ion
Risk
Cost of Debt Cost of Debt
Cost
of D
ebt
Post
-Der
iski
ng
Soci
alAc
cept
ance
Risk
Polit
ical
Risk
Curr
ency
/M
acro
-eco
n.Ri
sk
Cost
of D
ebt
BAU
Coun
terp
arty
Risk
Pow
er M
arke
tRi
sk
Grid
Inte
grat
ion
Risk
Cost
of D
ebt
Post
-Der
iski
ng
Soci
alAc
cept
ance
Risk
Polit
ical
Risk
Curr
ency
/M
acro
-eco
n.Ri
sk
Cost
of D
ebt
BAU
Coun
terp
arty
Risk
Pow
er M
arke
tRi
sk
Grid
Inte
grat
ion
Risk
8.0% 7.2% Cost of Debt 8.5% 7.7% Cost of Debt
-0.7%
-0.8% -0.8%
BUSINESS-AS-USUAL FINANCING COSTS
POST-DERISKING FINANCING COSTS

Derisking Renewable Energy Investment 99
Chapter 3: Illustrative Country Case Studies
RISK CATEGORy DESCRIPTION/EXAMPLES OF RISK
Power market risk This risk category has a high impact on financing costs. Investors recognise that the Government has made significant progress over the years in putting in place a regulatory framework. Panama has long had an unbundled and liberalized energy market, dating back to the Law 6 (1997). Policy-making coordination across ministries was recently improved through the establishment of the Secretaría Nacional de Energía (SNE) in 2008. Law 44 (2011) establishes a legal framework to encourage wind development, including tenders (15-year PPAs with feed-in priority) for wind operators, as well as incentives, such as exemption from import tariffs on equipment and accelerated depreciation.
Despite this progress, investors point to the need to continue to liberalize and improve the regulatory framework in Panama. Investors commented that some generation and distribution companies remain partly government-owned, which was identified as possibly creating an uneven competitive landscape. In shaping policy, investors state that that government actors are often familiar with hydro-power but lack knowledge of wind energy. Investors state that they have had to invest in higher-than-normal development costs as they have worked with government entities on acceptable arrangements.
Permits risk This risk category has a high impact on financing costs. The main permitting processes include ASEP issuing generation licences, and Autoridad Nacional del Ambiente (ANAM) environmental licences. The Government is commended for putting in place generally transparent procedures. Nonetheless, investors point to a lack of coordination between government bodies. For example, generation licences require that construction has commenced within one year. Without regular tenders to secure PPAs, this has acted as significant barrier, as generation licences and EIAs have expired. Investors also identify lengthy approval times, for example, for EIAs.
Social acceptance risk
This risk category has a moderate impact on financing costs. Many of the most attractive wind sites are found on lands belonging to indigenous peoples. Due to some non-wind energy cases of maltreatment of indigenous peoples in Panama, this is a sensitive issue. On the other hand, investors feel that early awareness campaigns by Government have been effective and that social benefits (health and education) could flow to poor communities involved in wind farms. One investor mitigated community risks by ensuring that a share of carbon finance proceeds will flow to the local community.
Grid Integration Risk
This risk category has a high impact on financing costs. Investors have a positive view of the dispatch centre, with personnel having been trained in Germany for intermittent power integration and management. Investors also refer to Panama benefiting from possible balancing via hydro-power. At the same time, investors express concern with the fact that grid management for wind energy is simply a completely new, unproven area in Panama and, as such, risk is elevated.33
Counterparty risk This risk category has a low impact on financing costs. Investors refer to a combination of factors resulting in manageable credit risk: a competitive, liberalized market resulting in well-run companies; foreign ownership of domestic companies by large international power operators, such as ENEL of Italy; as well as the Panamanian state’s own investment-grade sovereign rating.
Financial sector risk This risk category has a moderate impact on financing costs. Investors point out that while commercial banks are new to wind energy, local banks have shown an interest to date and Panama has a large and relatively developed financial community with access to capital. Development banks have also shown a willingness to engage with the first-mover wind projects, as necessary. Nonetheless, investors note high transactions costs and time-consuming efforts to bring finance to closure.
Political risk This risk category has a low impact on financing costs. Investors welcome Panama’s political stability, and its reputation as a business-friendly centre.
Currency/ macro-economic risk
This risk category has a low impact on financing costs. The Panamanian economy is effectively dollarized, minimizing currency risks to investors. In addition, investors generally hold confidence in the economy, with the Panama Canal’s expansion on track. Relatively minor concerns were expressed regarding inflation and the economy’s possible over-exposure to the Canal and real estate.
Table 9: Investor feedback on risk categories for wind energy investment in Panama
32 While outside the scope of this modelling study, investors also recognized the limitations of the current grid infrastructure in Panama, centred in the vicinity of Panama City. This has led to a lack of geographical diversity of bids, with a preponderance of proposals for large wind farms being in the centre of the country.
33 Some of the bidders for the wind tender are exploring the use of financial derisking debt products offered by development banks. As wind is a relatively mature technology and Panama has an advanced financial sector, the modelling exercise assumes that, over the entire 1 GW 20-year target, there will be no need for financial derisking.
Source: interviews with wind energy investors and developers.
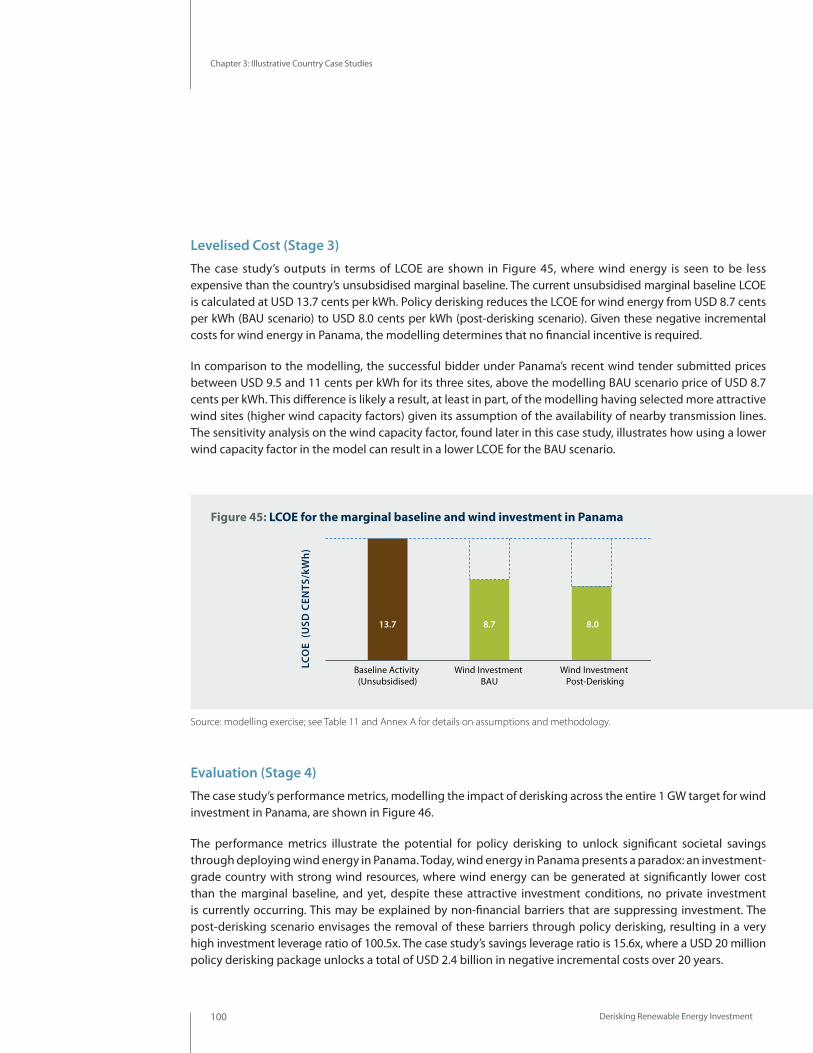
Derisking Renewable Energy Investment100
Chapter 3: Illustrative Country Case Studies
Levelised Cost (Stage 3)
The case study’s outputs in terms of LCOE are shown in Figure 45, where wind energy is seen to be less expensive than the country’s unsubsidised marginal baseline. The current unsubsidised marginal baseline LCOE is calculated at USD 13.7 cents per kWh. Policy derisking reduces the LCOE for wind energy from USD 8.7 cents per kWh (BAU scenario) to USD 8.0 cents per kWh (post-derisking scenario). Given these negative incremental costs for wind energy in Panama, the modelling determines that no financial incentive is required.
In comparison to the modelling, the successful bidder under Panama’s recent wind tender submitted prices between USD 9.5 and 11 cents per kWh for its three sites, above the modelling BAU scenario price of USD 8.7 cents per kWh. This difference is likely a result, at least in part, of the modelling having selected more attractive wind sites (higher wind capacity factors) given its assumption of the availability of nearby transmission lines. The sensitivity analysis on the wind capacity factor, found later in this case study, illustrates how using a lower wind capacity factor in the model can result in a lower LCOE for the BAU scenario.
Evaluation (Stage 4)
The case study’s performance metrics, modelling the impact of derisking across the entire 1 GW target for wind investment in Panama, are shown in Figure 46.
The performance metrics illustrate the potential for policy derisking to unlock significant societal savings through deploying wind energy in Panama. Today, wind energy in Panama presents a paradox: an investment- grade country with strong wind resources, where wind energy can be generated at significantly lower cost than the marginal baseline, and yet, despite these attractive investment conditions, no private investment is currently occurring. This may be explained by non-financial barriers that are suppressing investment. The post-derisking scenario envisages the removal of these barriers through policy derisking, resulting in a very high investment leverage ratio of 100.5x. The case study’s savings leverage ratio is 15.6x, where a USD 20 million policy derisking package unlocks a total of USD 2.4 billion in negative incremental costs over 20 years.
Figure 45: LCOE for the marginal baseline and wind investment in Panama
Source: modelling exercise; see Table 11 and Annex A for details on assumptions and methodology.
Wind Investment Post-Derisking
Wind Investment BAU
Baseline Activity (Unsubsidised)
8.08.713.7
LCO
E (U
SD C
ENTS
/kW
h)
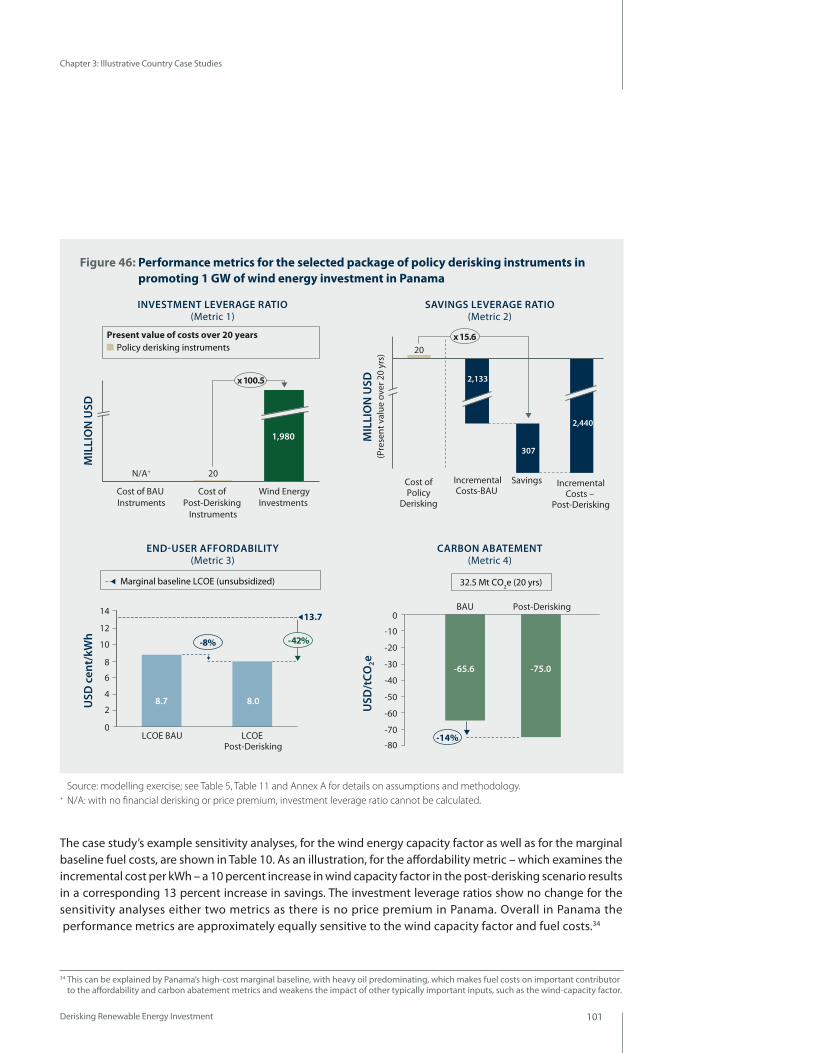
Derisking Renewable Energy Investment 101
Chapter 3: Illustrative Country Case Studies
MIL
LIO
N U
SD
Wind EnergyInvestments
1,980
Cost of Post-Derisking
Instruments
20
Cost of BAU Instruments
N/A+
x 100.5
Policy derisking instruments Present value of costs over 20 years
Marginal baseline LCOE (unsubsidized)
-8%
USD
cen
t/kW
h
13.714
12
10
8
6
4
2
0
-42%
LCOE Post-Derisking
LCOE BAU
8.7 8.0
MIL
LIO
N U
SD
x 15.620
(Pre
sent
val
ue o
ver 2
0 yr
s)
2,440
307
2,133
IncrementalCosts –
Post-Derisking
Savings IncrementalCosts-BAU
Cost ofPolicy
Derisking
-14%
USD
/tCO
2e
0
-10
-20
-30
-40
-50
-60
-80
-70
-75.0 -65.6
BAU Post-Derisking
32.5 Mt CO2e (20 yrs)
Figure 46: Performance metrics for the selected package of policy derisking instruments in promoting 1 GW of wind energy investment in Panama
INVESTMENT LEVERAGE RATIO (Metric 1)
END-USER AFFORDABILITY (Metric 3)
SAVINGS LEVERAGE RATIO (Metric 2)
CARBON ABATEMENT (Metric 4)
Source: modelling exercise; see Table 5, Table 11 and Annex A for details on assumptions and methodology. + N/A: with no financial derisking or price premium, investment leverage ratio cannot be calculated.
The case study’s example sensitivity analyses, for the wind energy capacity factor as well as for the marginal baseline fuel costs, are shown in Table 10. As an illustration, for the affordability metric – which examines the incremental cost per kWh – a 10 percent increase in wind capacity factor in the post-derisking scenario results in a corresponding 13 percent increase in savings. The investment leverage ratios show no change for the sensitivity analyses either two metrics as there is no price premium in Panama. Overall in Panama the performance metrics are approximately equally sensitive to the wind capacity factor and fuel costs.34
34 This can be explained by Panama’s high-cost marginal baseline, with heavy oil predominating, which makes fuel costs on important contributor to the affordability and carbon abatement metrics and weakens the impact of other typically important inputs, such as the wind-capacity factor.

Derisking Renewable Energy Investment102
Chapter 3: Illustrative Country Case Studies
SENSITIVITY ON WIND CAPACITY FACTOR
INVESTMENT LEVERAGE RATIO
SAVINGS LEVERAGE RATIO
AFFORDABILITy (INCREMENTAL
COSTS USD/kWh)
CARBON ABATEMENT
(USD TONNE CO2e)
Base case
BAU N/A
15.6x
BAU -$0.05 BAU -$65.59
Post- Derisking 100.5x Post-
Derisking -$0.06 Post- Derisking -$75.02
+10% Capacity Factor
BAU N/A
15.6x (0%)
BAU -0.06 (-15.9%) BAU -76.05
(-15.9%)
Post- Derisking
100.5x (0%)
Post- Derisking
-0.06 (-12.8%)
Post- Derisking
-84.62 (-12.8%)
-10% Capacity Factor
BAU N/A
15.6x (0%)
BAU -0.04 (19.5%) BAU -52.81
(19.5%)
Post- Derisking
100.5x (0%)
Post- Derisking
-0.05 (15.6%)
Post- Derisking
-63.29 (15.6%)
SENSITIVITY ON FUEL COSTS
INVESTMENT LEVERAGE RATIO
SAVINGS LEVERAGE RATIO
AFFORDABILITy (INCREMENTAL
COSTS USD/kWh)
CARBON ABATEMENT
(USD TONNE CO2e)
Base case
BAU N/A
15.6x
BAU -$0.05 BAU -$65.59
Post- Derisking 100.5x Post-
Derisking -$0.06 Post- Derisking -$75.02
+10% Fuel Costs
BAU N/A
15.6x (0%)
BAU -0.06 (-17.9%) BAU -77.33
(-17.9%)
Post- Derisking
100.5x (0%)
Post- Derisking
-0.07 (-15.6%)
Post- Derisking
-86.75 (-15.6%)
-10% Fuel Costs
BAU N/A
15.6x (0%)
BAU -0.04 (17.9%) BAU -53.86
(17.9%)
Post- Derisking
100.5x (0%)
Post- Derisking
-0.05 (15.6%)
Post- Derisking
-63.29 (15.6%)
Table 10: Example sensitivity analyses on the Panama case study’s performance metrics when varying key inputs by +/- 10 percent
Source: modelling exercise; see Table 11 and Annex A for details on assumptions and methodology.

Derisking Renewable Energy Investment 103
Chapter 3: Illustrative Country Case Studies
WIND TARGET AND RESOURCES20 Year Target (in MW) 1,000 Wind Capacity Factor (%) 43%Total Annual Energy Production for Target (in MWh) 3,738,000
MARGINAL BASELINEEnergy Mix Coal (%) Heavy Oil (%) 62% Hydro (%) 38%Grid Emission Factor (tCO2e/MWh) 0.435
GENERAL COUNTRY INPUTSEffective Corporate Tax Rate (%) 25%Public Cost of Capital (%) 6%
BUSINESS-AS-USUAL SCENARIO
POST-DERISKING SCENARIO
FINANCING COSTSCapital Structure Debt/Equity Split
70.0%/30.0%
72.5%/27.5%
Cost of Debt Non-concessional public loan Commercial loans with public guarantees Commercial loans without public guarantees
N/A N/A
8.0%
N/A N/A
7.2%
Loan Tenor Non-concessional public loan Commercial loans with public guarantees Commercial loans without public guarantees
N/A N/A
10 years
N/A N/A
11 years
Cost of Equity 15.0% 13.6%
Weighted Average Cost of Capital (WACC) (After-tax) 8.7% 7.7%
INVESTMENT
Total Investment (USD million) $1,980.0 $1,980.0
Debt (USD million) Non-concessional public loan Commercial loans with public guarantees Commercial loans without public guarantees
$0.0 $0.0
$1,386.0
$0.0 $0.0
$1,435.5
Equity (USD million) Private Sector Equity Public Sector Equity
$594.0
$0.0
$544.5
$0.0
COST OF PUBLIC INSTRUMENTS
Policy Derisking Instruments (USD million, 20 years) Power market risk activities Permits risk activities Social acceptance risk activities Grid integration risk activities Counterparty risk activities Financial sector risk activities Total
N/A N/A N/A N/A N/A N/A N/A
$7.0 $1.6 $2.9 $4.7 $1.5 $2.1
$17.7
Financial Derisking Instruments (USD million, 20 years) Methodology for costing Use of paid-in-capital leverage multiplier Non-concessional public loan Public guarantees for commercial loans Political risk insurance Total
N/A N/A N/A N/A N/A N/A
N/A N/A N/A N/A N/A N/A
Direct Financial Incentives (USD million, 20 years) Present Value of 20 year PPA Price Premium Funded by domestic public sector Funded by international public sector
N/A N/A
N/A N/A
Table 11: Summary assumptions for the Panama case study
Source: modelling exercise; see Table 5 and Annex A for details on assumptions and methodology.Financing costs are average costs over the 20-year modelling period.

Derisking Renewable Energy Investment104
Chapter 3: Illustrative Country Case Studies
3.4 COUNTRY RESULTS FOR MONGOLIA
20-Year Target for Wind Energy
The case study for Mongolia assumes a 20-year target of 1 GW of wind investment.36 The opportunity for wind energy in Mongolia mirrors the country’s transformation from a Soviet-era centrally-planned economy to a market-based economy. Now open to private investment and driven by a mining boom, Mongolia has entered a period of strong economic growth.37 This has placed its low-cost and ageing coal-fueled power system under significant pressure.38 Large-scale wind energy is an attractive option to meet this increased demand. Balancing could come from existing coal plants or new hydro-power. A more ambitious vision could also see Mongolia becoming an Asian energy leader, exporting renewable power to its neighbouring countries, including China.
Baseline Energy Mix
The current installed capacity in Mongolia is 1,050 MW, of which only 728 MW is available due to losses from ageing plants and transmission.39 The energy sector is almost entirely fossil fuel-based and is dominated by coal. With low historical growth in energy demand, there has been virtually no investment in new power generation since 1985. In recent years, driven by the economic boom, domestic consumption has been increasing rapidly.
35 Sources: Economist Intelligence Unit; Standard & Poor's; www.doingbusiness.org; UNDP.36 The Mongolian Government has not issued a specific target for wind energy; however, the Renewable Energy Law of 2007 targets a 20-25
percent share for renewable energy by 2020.37 GDP has grown between 7-10 percent per annum every year since 2003.38 For example, in recent years Mongolia has been importing nearly 10 percent of its peak electricity from Russia at USD 7-10 cents per kWh, far
higher than its domestic coal-powered costs.39 In 2009, generation losses were 16 percent and transmission and distribution losses were 18 percent. Source: ADB, 2010.
General Country Data35
Population 2011: 2.8m
Land Area: 1,564,116sq km (19th)
GDP 2011 (USD): $6.1bn
GDP/capita (USD, PPP) 2011:
$4,800
Sovereign rating 2012:
Non-investment grade, [BB-] S&P
Doing Business 2012:
76th
UNDP HDI 2012: 0.675 (108th)
Coal/peatOilGeothermal/solar/wind
GW
h 2,500
3,500
4,500
0
500
1,500
2009200720052003200119991997199519931991198919871985
Figure 47: Energy generation mix in Mongolia (1985 to 2009)
Source: www.iea.org (2012).
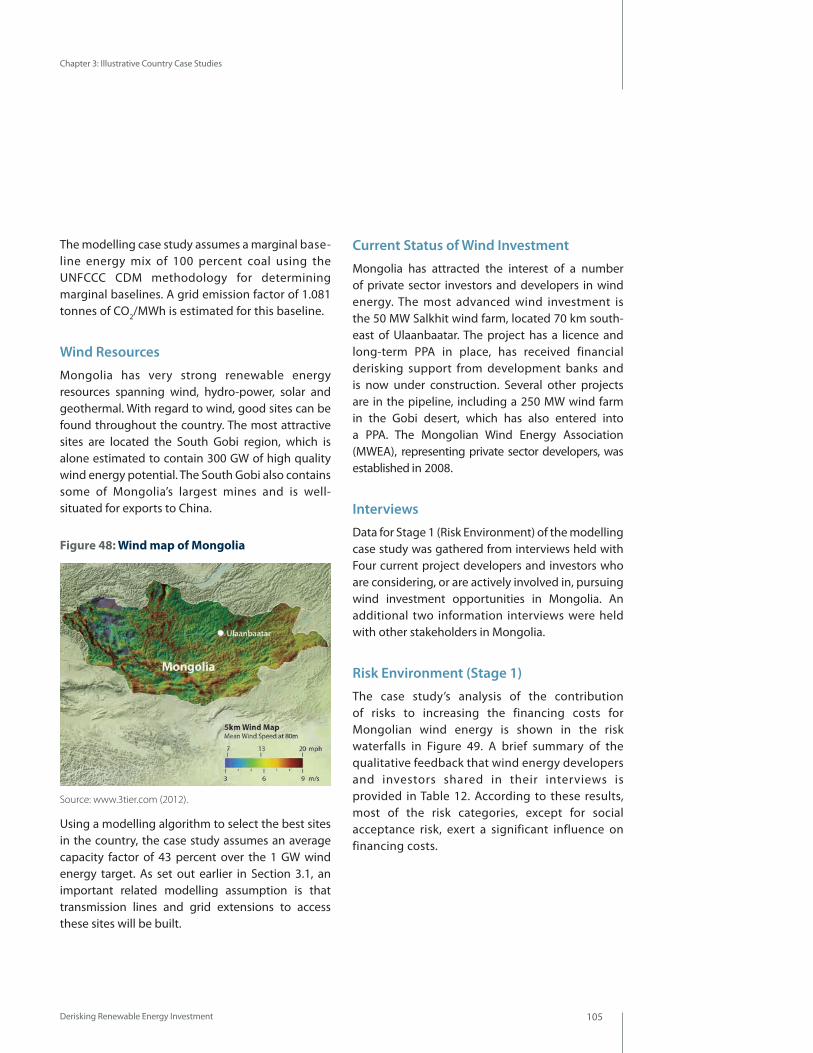
Derisking Renewable Energy Investment 105
Chapter 3: Illustrative Country Case Studies
The modelling case study assumes a marginal base-line energy mix of 100 percent coal using the UNFCCC CDM methodology for determining marginal baselines. A grid emission factor of 1.081 tonnes of CO2/MWh is estimated for this baseline.
Wind Resources
Mongolia has very strong renewable energy resources spanning wind, hydro-power, solar and geothermal. With regard to wind, good sites can be found throughout the country. The most attractive sites are located the South Gobi region, which is alone estimated to contain 300 GW of high quality wind energy potential. The South Gobi also contains some of Mongolia’s largest mines and is well- situated for exports to China.
Using a modelling algorithm to select the best sites in the country, the case study assumes an average capacity factor of 43 percent over the 1 GW wind energy target. As set out earlier in Section 3.1, an important related modelling assumption is that transmission lines and grid extensions to access these sites will be built.
Current Status of Wind Investment
Mongolia has attracted the interest of a number of private sector investors and developers in wind energy. The most advanced wind investment is the 50 MW Salkhit wind farm, located 70 km south- east of Ulaanbaatar. The project has a licence and long-term PPA in place, has received financial derisking support from development banks and is now under construction. Several other projects are in the pipeline, including a 250 MW wind farm in the Gobi desert, which has also entered into a PPA. The Mongolian Wind Energy Association (MWEA), representing private sector developers, was established in 2008.
Interviews
Data for Stage 1 (Risk Environment) of the modelling case study was gathered from interviews held with Four current project developers and investors who are considering, or are actively involved in, pursuing wind investment opportunities in Mongolia. An additional two information interviews were held with other stakeholders in Mongolia.
Risk Environment (Stage 1)
The case study’s analysis of the contribution of risks to increasing the financing costs for Mongolian wind energy is shown in the risk waterfalls in Figure 49. A brief summary of the qualitative feedback that wind energy developers and investors shared in their interviews is provided in Table 12. According to these results, most of the risk categories, except for social acceptance risk, exert a significant influence on financing costs.
Figure 48: Wind map of Mongolia
Source: www.3tier.com (2012).

Derisking Renewable Energy Investment106
Chapter 3: Illustrative Country Case Studies
Public Instruments (Stage 2)
As Mongolia is a non-investment-grade country, the case study models the use of financial derisking instruments in the BAU scenario and both financial derisking instruments and policy derisking instruments in the post-derisking scenario. Details on the public cost of these instruments can be found in Table 14.
The impact of the policy derisking instruments on reducing the financing cost for wind energy in Mongolia is shown in Figure 50. Based on the case study’s analysis, the package of policy derisking instruments is anticipated to reduce the average cost of equity over 20 years by 1.9 percent, and the cost of debt by 0.7 percent.
Figure 49: Impact of risk categories on financing costs for wind energy investment in Mongolia, business-as-usual scenario
Figure 50: Impact of policy derisking instruments on reducing financing costs for wind energy in Mongolia
Source: interviews with wind energy investors and developers; modelling exercise; see Table 5 and Annex A for details on assumptions and methodology.Both cost of debt and equity assume supporting financial derisking instruments are in place. The cost of debt shown is the commercial rate assuming financial derisking is in place.
Source: interviews with wind energy investors and developers; modelling exercise; see Table 5 and Annex A for details on assumptions and methodology. Note: the impacts shown are average impacts over the 20-year modelling period, assuming linear timing effects.
Cost of Equity
Cost of Equity
Cost of Equity
Cost
of E
quity
BAU
15.0%
Curr
ency
/M
acro
-eco
n.Ri
sk
1.2%
Polit
ical
Risk
0.6%
Fina
ncia
lSe
ctor
Ris
k
0.5%
Coun
terp
arty
Risk
0.6%
1.1%
Perm
itsRi
sk
0.2%
Pow
er M
arke
tRi
sk
Soci
alAc
cept
ance
Risk
Cost
of E
quity
Best
-in-C
lass
Coun
try
0.7% 0.5%
Grid
Inte
grat
ion
Risk
Cost
of E
quity
BAU
Curr
ency
/M
acro
-eco
n.Ri
sk
Polit
ical
Risk
Fina
ncia
lSe
ctor
Ris
k
Coun
terp
arty
Risk
Perm
itsRi
sk
Pow
er M
arke
tRi
sk
Soci
alAc
cept
ance
Risk
Cost
of E
quity
Best
-in-C
lass
Coun
try
Grid
Inte
grat
ion
Risk
Cost
of E
quity
BAU
Curr
ency
/M
acro
-eco
n.Ri
sk
Polit
ical
Risk
Fina
ncia
lSe
ctor
Ris
k
Coun
terp
arty
Risk
Perm
itsRi
sk
Pow
er M
arke
tRi
sk
Soci
alAc
cept
ance
Risk
Cost
of E
quity
Best
-in-C
lass
Coun
try
Grid
Inte
grat
ion
Risk
Cost of Equity
Cost
of E
quity
BAU
Curr
ency
/M
acro
-eco
n.Ri
sk
Polit
ical
Risk
Fina
ncia
lSe
ctor
Ris
k
Coun
terp
arty
Risk
Perm
itsRi
sk
Pow
er M
arke
tRi
sk
Soci
alAc
cept
ance
Risk
Cost
of E
quity
Best
-in-C
lass
Coun
try
Grid
Inte
grat
ion
Risk
9.5% 18.0%
0.9% 1.5%
1.4%
1.5%
1.3%
9.5%
0.9%
0.1% 1.0%
15.0%
0.5% 0.4% 0.7% 0.5%
0.9% 0.7%
0.8% 0.9%
9.5% 18.0%
0.4% 1.4%
1.6% 1.4%
1.3%
0.0% 0.8% 1.7%
9.5%
0.3% 0.2% 0.3% 0.2% 0.2% 0.2%
0.5% 0.3% 0.0%
18.0%
0.6% 0.2%
0.3%
16.1%
0.5% 0.4% 0.0% 0.3%
0.2% 0.6%
-1.2%
Cost
of E
quity
Post
-Der
iski
ng
0.2%
Soci
alAc
cept
ance
Risk
0.1%
Perm
itsRi
sk
0.1%
Fina
ncia
lSe
ctor
Ris
k
15.0%
Polit
ical
Risk
0.2% 0.1%
Curr
ency
/M
acro
-eco
n.Ri
sk
13.8%
0.4% N/A N/A
Cost
of D
ebt
BAU
Coun
terp
arty
Risk
Pow
er M
arke
tRi
sk
Grid
Inte
grat
ion
Risk
Cost of Equity Cost of Equity
Cost
of E
quity
Post
-Der
iski
ng
Soci
alAc
cept
ance
Risk
Perm
itsRi
sk
Fina
ncia
lSe
ctor
Ris
k
15.0%
Polit
ical
Risk
Curr
ency
/M
acro
-eco
n.Ri
sk
13.6%
N/A N/A
Cost
of D
ebt
BAU
Coun
terp
arty
Risk
Pow
er M
arke
tRi
sk
Grid
Inte
grat
ion
Risk
Cost
of E
quity
Post
-Der
iski
ng
Soci
alAc
cept
ance
Risk
Perm
itsRi
sk
Fina
ncia
lSe
ctor
Ris
k
Polit
ical
Risk
Curr
ency
/M
acro
-eco
n.Ri
sk
Cost
of D
ebt
BAU
Coun
terp
arty
Risk
Pow
er M
arke
tRi
sk
Grid
Inte
grat
ion
Risk
Co
st o
f Equ
ityPo
st-D
eris
king
Soci
alAc
cept
ance
Risk
Perm
itsRi
sk
Fina
ncia
lSe
ctor
Ris
k
Polit
ical
Risk
Curr
ency
/M
acro
-eco
n.Ri
sk
Cost
of D
ebt
BAU
Coun
terp
arty
Risk
Pow
er M
arke
tRi
sk
Grid
Inte
grat
ion
Risk
Cost of Equity 18.0% 15.9% Cost of Equity
-1.9%
N/A N/A
-2.1%
N/A N/A
-1.4%
0.7% 0.4% 0.6%
0.4% 0.1% 0.3% 0.4%
0.7%
0.7% 0.6% 0.0%
0.6%
0.2% 0.7%
0.7% 0.9% 0.0%
0.9% 0.5% 0.7% 0.4% 0.3%
0.7% 0.4%
Cost of Debt
Cost of Debt
Cost of Debt
Cost
of D
ebt
BAU
7.5%
Curr
ency
/M
acro
-eco
nRi
sk
Polit
ical
Risk
Coun
terp
arty
Risk
Pow
er M
arke
tRi
sk
Soci
alAc
cept
ance
Risk
Cost
of D
ebt
Best
-in-C
lass
Coun
try
Grid
Inte
grat
ion
Risk
Cost
of D
ebt
BAU
Curr
ency
/M
acro
-eco
n.Ri
sk
Polit
ical
Risk
Coun
terp
arty
Risk
Pow
er M
arke
tRi
sk
Soci
alAc
cept
ance
Risk
Cost
of D
ebt
Best
-in-C
lass
Coun
try
Grid
Inte
grat
ion
Risk
Cost
of D
ebt
BAU
Curr
ency
/M
acro
-eco
n.Ri
sk
Polit
ical
Risk
Coun
terp
arty
Risk
Pow
er M
arke
tRi
sk
Soci
alAc
cept
ance
Risk
Cost
of D
ebt
Best
-in-C
lass
Coun
try
Grid
Inte
grat
ion
Risk
Cost
of D
ebt
BAU
Curr
ency
/M
acro
-eco
n.Ri
sk
Polit
ical
Risk
Coun
terp
arty
Risk
Pow
er M
arke
tRi
sk
Soci
alAc
cept
ance
Risk
Cost
of D
ebt
Best
-in-C
lass
Coun
try
Grid
Inte
grat
ion
Risk
Cost of Debt
5.0% 8.0% 5.0%
8.0% 5.0% 8.5% 5.0%
0.1% 0.1% 0.0% 0.2% 0.2% 0.3% 0.0% 0.2%
0.2% 0.2% 0.2% 0.2% 0.3% 0.2% 0.2% 0.0%
N/A N/A
N/A N/A
N/A N/A
N/A N/A
8.0% 7.3%
-0.5%
Cost
of D
ebt
Post
-Der
iski
ng
Soci
alAc
cept
ance
Risk
7.5%
Polit
ical
Risk
Curr
ency
/M
acro
-eco
n.Ri
sk
7.0%
Cost
of D
ebt
BAU
Coun
terp
arty
Risk
Pow
er M
arke
tRi
sk
Grid
Inte
grat
ion
Risk
Cost
of D
ebt
Post
-Der
iski
ng
Soci
alAc
cept
ance
Risk
Polit
ical
Risk
Curr
ency
/M
acro
-eco
n.Ri
sk
Cost
of D
ebt
BAU
Coun
terp
arty
Risk
Pow
er M
arke
tRi
sk
Grid
Inte
grat
ion
Risk
Cost of Debt Cost of Debt
Cost
of D
ebt
Post
-Der
iski
ng
Soci
alAc
cept
ance
Risk
Polit
ical
Risk
Curr
ency
/M
acro
-eco
n.Ri
sk
Cost
of D
ebt
BAU
Coun
terp
arty
Risk
Pow
er M
arke
tRi
sk
Grid
Inte
grat
ion
Risk
Cost
of D
ebt
Post
-Der
iski
ng
Soci
alAc
cept
ance
Risk
Polit
ical
Risk
Curr
ency
/M
acro
-eco
n.Ri
sk
Cost
of D
ebt
BAU
Coun
terp
arty
Risk
Pow
er M
arke
tRi
sk
Grid
Inte
grat
ion
Risk
8.0% 7.2% Cost of Debt 8.5% 7.7% Cost of Debt
-0.7%
-0.8% -0.8%
BUSINESS-AS-USUAL FINANCING COSTS
POST-DERISKING FINANCING COSTS

Derisking Renewable Energy Investment 107
Chapter 3: Illustrative Country Case Studies
RISK CATEGORy DESCRIPTION/EXAMPLES OF RISK
Power market risk This risk category has a high impact on financing costs. Investors comment favourably on the enabling regulatory environment the government is putting in place. The government has unbundled the energy sector and established the Energy Regulatory Authority (ERA). The Renewable Energy Law of 2007 established a FiT regime for renewable energy at between USD 8 cents per kWh and USD 9.5 cents per kWh (for ERA regulated projects). Investors welcome ERA’s actions in phasing-out end-user subsidies, as evidenced by retail prices rising substantially in the last decade.
Nonetheless, investors remark on a number of existing barriers in this risk category. Investors feel that the lack of a long-term government road-map and targets for wind create a degree of uncertainty. With the Government and utility having limited experience in wind, a number of investors remark on the need to engage in lengthy consultations with policymakers to achieve acceptable regulations. Other investors comment on a lack of clarity in the process to obtain a PPA, as well as time-consuming negotiations.
Permits risk This risk category has a moderate impact on financing costs. Investors point to the difficulty of navigating administrative and bureaucratic matters in Mongolia. Corruption is also viewed as an impediment.
Social acceptance risk
This risk category has a low impact on financing costs. Mongolia is generally sparsely populated, although herders can be affected by wind sites. Investors have minimised this risk to date through actively engaging in awareness campaigns and stakeholder dialogues. Investors also point to the collective pride in deploying new technology, such as wind.
Grid integration risk
This risk category has a high impact on financing costs. With coal dominating the country’s energy mix, investors comment on the transmission company’s clear lack of experience with wind energy. Investors also raise additional concerns regarding overall grid stability due to the Mongolian grid’s antiquated, Soviet-era technology. Another barrier is the lack of a public grid code for wind, without which manufacturers have been prevented from tailoring turbines.
Counterparty risk This risk category has a high impact on financing costs. Investors comment positively on the improved cash position of the utility in recent years. Mongolia’s sovereign sovereign rating is also, as a whole, improving. Nonetheless, investors, especially banks, view counterparty risk as elevated and have sought guarantees or comfort letters from the Government as assurance.
Financial sector risk This risk category has a moderate impact on financing costs. The financial sector remains immature, with no experience in wind energy and limited access to capital. Commercial actors (debt, equity) are either local or Chinese, with currently little or no broader international awareness of wind in Mongolia. Development banks have made financial derisking products available.
Political risk This risk category has a high impact on financing costs. Investors comment that Mongolian politics can lack stability, with common changes in coalitions and cabinet membership.
Currency/ macro-economic risk
This risk category has a moderate impact on financing costs. Mongolia’s strong economic performance is reassuring to investors. Nonetheless, inflation is high. PPAs are denominated in local currency which can create currency risk. Some investors have sought to manage this risk through financial hedging.
Table 12: Investor feedback on risk categories for wind energy investment in Mongolia
Source: interviews with wind energy investors and developers.

Derisking Renewable Energy Investment108
Chapter 3: Illustrative Country Case Studies
Levelised Cost (Stage 3)
The case study’s outputs in terms of LCOE are shown in Figure 51, where wind energy is seen to be more expensive than the unsubsidised marginal baseline. The current unsubsidised marginal baseline LCOE is calculated at USD 8.2 cents per kWh. Policy derisking reduces the LCOE for wind energy from USD 9.7 cents per kWh (BAU scenario) to USD 9.2 cents per kWh (post-derisking scenario). The modelling thus determines that in both scenarios a financial incentive is required to address the incremental cost and make wind energy competitive.
In comparison to the modelling, the Government’s FiT is capped at USD 9.5 cents per kWh, below the modelling BAU scenario price of USD 9.7 cents per kWh. This can be explained by a number of possible modelling assumptions, including the model’s assumptions regarding wind speed (capacity factor), and its simplified assumptions on investment costs and tax rates/treatment.
Evaluation (Stage 4)
The case study’s performance metrics, modelling the impact of derisking across the 1 GW target for wind investment in Mongolia, are show in Figure 52.
Overall, the performance metrics illustrate the potential for policy derisking to reduce the costs of incentives and financial derisking in Mongolia. The case study’s investment leverage ratio increases from 2.2x in the BAU scenario to 3.5x in the post-derisking scenario. This reflects a reduction in the estimated financial incentive over 20 years from USD 665 million to USD 433 million. Similarly, the public cost of financial derisking falls from USD 248 million to USD 130 million. The post-derisking scenario lowers the carbon abatement cost by 35 percent to USD 5.36 per tonne of CO2e.
Figure 51: LCOE for the marginal baseline and wind investment in Mongolia
Source: modelling exercise; see Table 14 and Annex A for details on assumptions and methodology.
Wind Investment Post-Derisking
Wind Investment BAU
Baseline Activity (Unsubsidised)
9.29.78.2
LCO
E (U
SD C
ENTS
/kW
h)
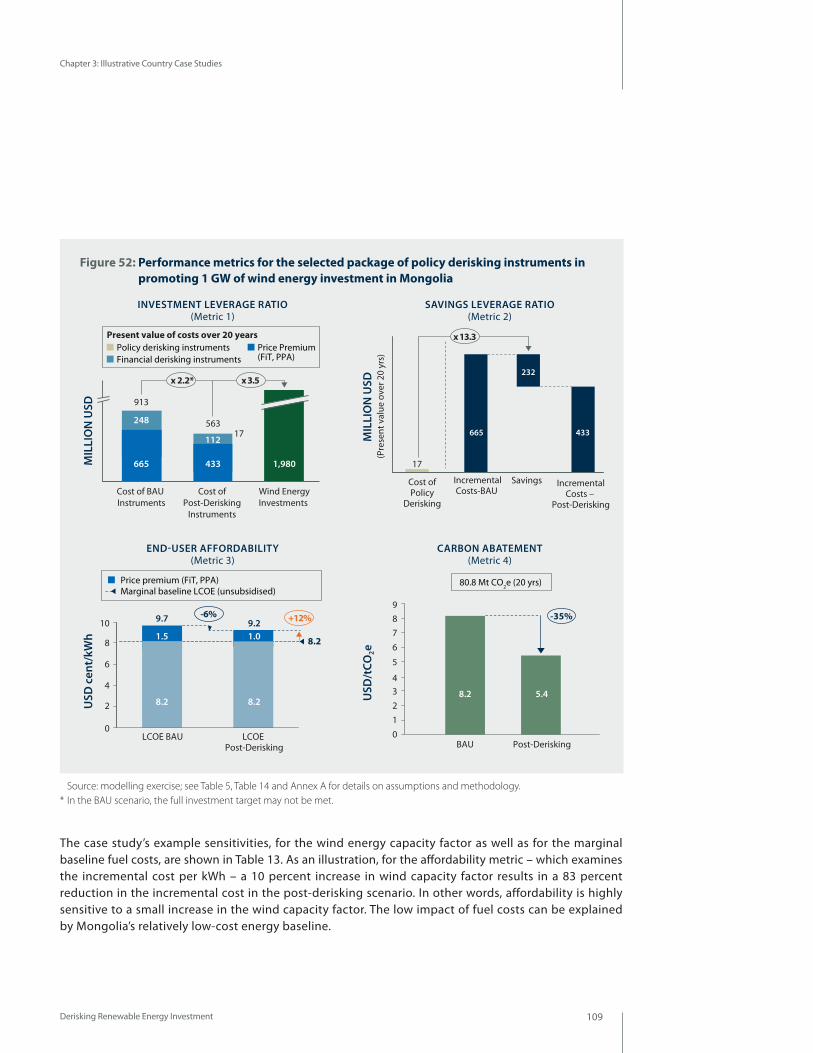
Derisking Renewable Energy Investment 109
Chapter 3: Illustrative Country Case Studies
The case study’s example sensitivities, for the wind energy capacity factor as well as for the marginal baseline fuel costs, are shown in Table 13. As an illustration, for the affordability metric – which examines the incremental cost per kWh – a 10 percent increase in wind capacity factor results in a 83 percent reduction in the incremental cost in the post-derisking scenario. In other words, affordability is highly sensitive to a small increase in the wind capacity factor. The low impact of fuel costs can be explained by Mongolia’s relatively low-cost energy baseline.
x 2.2*
MIL
LIO
N U
SD
Wind EnergyInvestments
1,980
Cost of Post-Derisking
Instruments
563
433
112
Cost of BAU Instruments
665
248
913
x 3.5
17
Policy derisking instruments Present value of costs over 20 years
Price Premium (FiT, PPA) Financial derisking instruments
Price premium (FiT, PPA) Marginal baseline LCOE (unsubsidised)
-6%
USD
cen
t/kW
h 8.2
10
8
6
4
2
0
+12%
LCOE Post-Derisking
LCOE BAU
8.2 8.2
1.5 1.0
9.7 9.2
MIL
LIO
N U
SD
x 13.3
17
(Pre
sent
val
ue o
ver 2
0 yr
s)
433
232
665
IncrementalCosts –
Post-Derisking
Savings IncrementalCosts-BAU
Cost ofPolicy
Derisking
-35%
USD
/tCO
2e
9876
4
5
321
0
5.48.2
BAU Post-Derisking
80.8 Mt CO2e (20 yrs)
Figure 52: Performance metrics for the selected package of policy derisking instruments in promoting 1 GW of wind energy investment in Mongolia
INVESTMENT LEVERAGE RATIO (Metric 1)
END-USER AFFORDABILITY (Metric 3)
SAVINGS LEVERAGE RATIO (Metric 2)
CARBON ABATEMENT (Metric 4)
Source: modelling exercise; see Table 5, Table 14 and Annex A for details on assumptions and methodology. * In the BAU scenario, the full investment target may not be met.

Derisking Renewable Energy Investment110
Chapter 3: Illustrative Country Case Studies
SENSITIVITY ON WIND CAPACITY FACTOR
INVESTMENT LEVERAGE RATIO
SAVINGS LEVERAGE RATIO
AFFORDABILITy (INCREMENTAL
COSTS USD/kWh)
CARBON ABATEMENT
(USD TONNE CO2e)
Base case
BAU 2.2x
13.3x
BAU $0.016 BAU $8.23
Post- Derisking 3.5x Post-
Derisking $0.010 Post- Derisking $5.36
+10% Capacity Factor
BAU 3.5x (62.3%)
13.3x (0%)
BAU $0.007 (-57%) BAU $3.54
(-57%)
Post- Derisking
9.3x (164.9%)
Post- Derisking
$0.002 (-82.6%)
Post- Derisking
$0.93 (-82.6%)
-10% Capacity Factor
BAU 1.6x (-27.7%)
13.3x (0%)
BAU $0.026 (69.6%) BAU $13.97
(69.6%)
Post- Derisking
2.2x (-38.4%)
Post- Derisking
$0.02 (101%)
Post- Derisking
$10.78 (101%)
SENSITIVITY ON FUEL COSTS
INVESTMENT LEVERAGE RATIO
SAVINGS LEVERAGE RATIO
AFFORDABILITy (INCREMENTAL
COSTS USD/kWh)
CARBON ABATEMENT
(USD TONNE CO2e)
Base case
BAU 2.2x
13.3x
BAU $0.016 BAU $8.23
Post- Derisking 3.5x Post-
Derisking $0.010 Post- Derisking $5.36
+10% Fuel Costs
BAU 2.4x (10.8%)
13.3x (0%)
BAU $0.013 (-13.4%) BAU $7.13
(-13.4%)
Post- Derisking
4.2x (18.8%)
Post- Derisking
$0.008 (-20.5%)
Post- Derisking
$4.26 (-20.5%)
-10% Fuel Costs
BAU 2x (-8.9%)
13.3x (0%)
BAU $0.018 (13.4%) BAU $9.33
(13.4%)
Post- Derisking
3x (-13.7%)
Post- Derisking
$0.012 (20.5%)
Post- Derisking
$6.46 (20.5%)
Table 13: Example sensitivity analyses on the Mongolia case study’s performance metrics when varying key inputs by +/- 10%
Source: modelling exercise; see Table 14 and Annex A for details on assumptions and methodology.

Derisking Renewable Energy Investment 111
Chapter 3: Illustrative Country Case Studies
WIND TARGET AND RESOURCES20 Year Target (in MW) 1,000 Wind Capacity Factor (%) 43%Total Annual Energy Production for Target (in MWh) 3,738,000
MARGINAL BASELINEEnergy Mix Coal (%) 100%Grid Emission Factor (tCO2e/MWh) 1.081
GENERAL COUNTRY INPUTSEffective Corporate Tax Rate (%) 25%Public Cost of Capital (%) 6%
BUSINESS-AS-USUAL SCENARIO
POST-DERISKING SCENARIO
FINANCING COSTS
Capital Structure Debt/Equity Split
65.0%/35.0%
67.5%/32.5%
Cost of Debt Non-concessional public loan Commercial loans with public guarantees Commercial loans without public guarantees
9.0% 8.0% NA
NA
7.3% NA
Loan Tenor Non-concessional public loan Commercial loans with public guarantees Commercial loans without public guarantees
15 years 10 years
N/A
N/A
11 years N/A
Cost of Equity 18.0% 16.1%
Weighted Average Cost of Capital (WACC) (After-tax) 10.4% 8.9%
INVESTMENT
Total Investment (USD million) $1,980.0 $1,980.0
Debt (USD million) Non-concessional public loan Commercial loans with public guarantees Commercial loans without public guarantees
$643.5 $643.5
$0.0
$0.0
$1,336.5 $0.0
Equity (USD million) Private Sector Equity Public Sector Equity
$693.0
$0.0
$643.5
$0.0
COST OF PUBLIC INSTRUMENTS
Policy Derisking Instruments (USD million, 20 years) Power market risk activities Permits risk activities Social acceptance risk activities Grid integration risk activities Counterparty risk activities Financial sector risk activities Total
N/A N/A N/A N/A N/A N/A N/A
$4.9 $1.6 $1.2 $4.6 $2.9 $2.4
$17.5
Financial Derisking Instruments (USD million, 20 years) Methodology for costing Use of paid-in-capital leverage multiplier Non-concessional public loan Public guarantees for commercial loans Political risk insurance Total
See Annex A
Yes, 3.5x $183.9 $46.0 $17.8
$247.6
See Annex A
Yes, 3.5x N/A
N$95.5 $16.5
$112.0
Direct Financial Incentives (USD million, 20 years) Present Value of 20 year PPA Price Premium Funded by domestic public sector Funded by international public sector
$665.0 $0.0
$433.0 $0.0
Table 14: Summary assumptions for the Mongolia case study
Source: modelling exercise; see Table 5 and Annex A for details on assumptions and methodology.Financing costs are average costs over 20-year modelling period.

Derisking Renewable Energy Investment112
Chapter 3: Illustrative Country Case Studies
3.5 COUNTRY RESULTS FOR KENYA
20-Year Target for Wind Energy
The modelling case study assumes a 1 GW 20-year target for wind investment in Kenya.41 With a high-cost baseline energy mix, wind energy can assist in increasing Kenya’s electrification, meeting its forecast increases in demand and bringing down costs. Investment in wind energy will need to accompanied by significant investment in the transmission grid, and balancing of wind’s intermittency can conceivably come from additional geothermal or hydro-power, among other sources. Longer-term opportunities could include Kenya exporting wind power within the East African Power Pool.42
Baseline Energy Mix
Kenya’s 2011 peak load demand is estimated at 1,302 MW, while the current available installed capacity is 1,429 MW. The Government anticipates that the peak load will grow to 2,500 MW by 2015, and 15,000 MW by 2030.43 Kenya has long depended on hydro-power and, to a lesser degree, geothermal. In recent years, new capacity has predominantly consisted of diesel and heavy fuel oil, taking advantage of their ease of deployment and low upfront cost.
40 Sources: Economist Intelligence Unit; Standard & Poor's; www.doingbusiness.org; UNDP.41 The Kenyan Government, in the third draft of the National Energy Policy which was issued in May 2012, is considering setting the following
short-, medium- and long-term targets for wind energy: 1.0 GW by 2016, 2.0 GW by 2022 and 3.0 GW by 2030. The modelling case study assumes a lower 20-year 1.0 GW target in order to be consistent with the modelling exercise’s assumptions about transmission lines (within 50 km of sites) and intermittency.
42 For example, with strong wind resources in north-west Kenya, the opportunity exists to interconnect with Uganda, where Kenyan wind energy could be balanced with Uganda’s hydro-power.
43 Source: Least Cost Power Development Plan, Government of Kenya (2010).
General Country Data40
Population 2011: 41.6m
Land Area: 580,367sq km (49th)
GDP 2011 (USD): $35.1bn
GDP/capita (USD, PPP) 2011:
$1,696
Sovereign rating 2012:
Non-investment grade, B+ S&P
Doing Business 2012:
121st
UNDP HDI 2012: 0.519 (145th)
OilNuclearHydroBiofuels & waste
Geothermal/solar/wind
GW
h
6,000
8,000
0
2,000
4,000
20092007200520032001199919971995199319911989198719851983198119791977197519731971
Figure 53: Energy generation mix in Kenya (1971 to 2009)
Source: www.iea.org (2012).
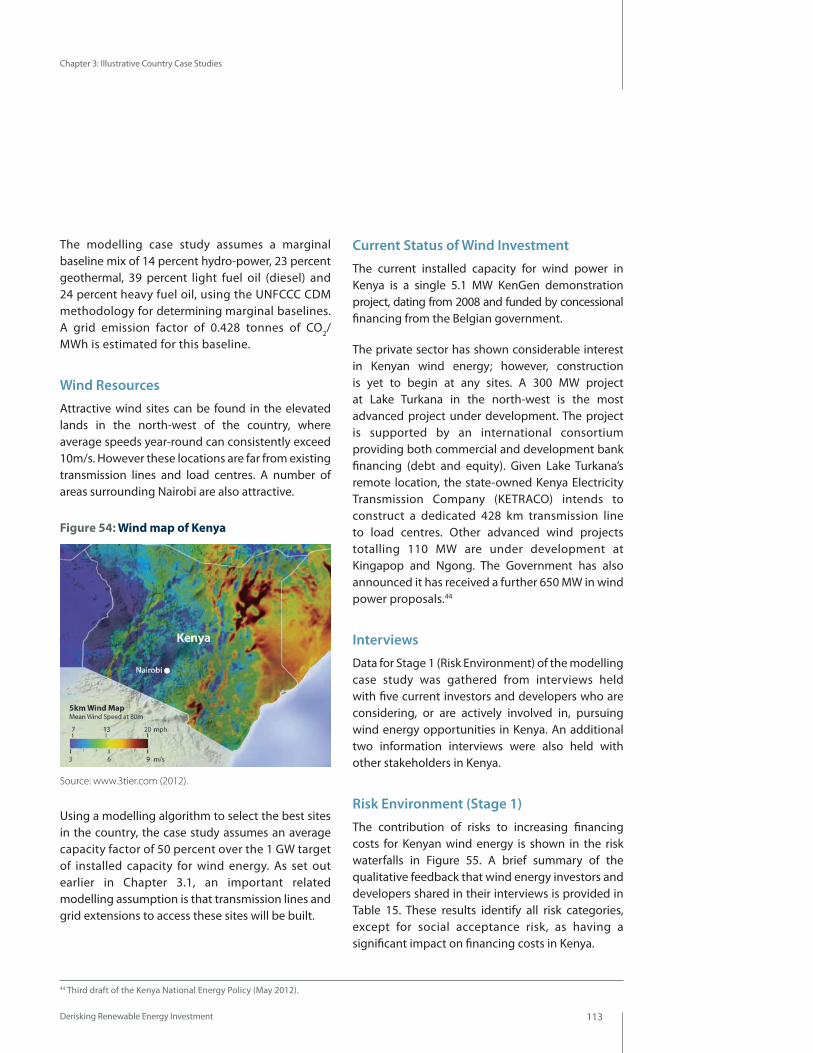
Derisking Renewable Energy Investment 113
Chapter 3: Illustrative Country Case Studies
The modelling case study assumes a marginal baseline mix of 14 percent hydro-power, 23 percent geothermal, 39 percent light fuel oil (diesel) and 24 percent heavy fuel oil, using the UNFCCC CDM methodology for determining marginal baselines. A grid emission factor of 0.428 tonnes of CO2/MWh is estimated for this baseline.
Wind Resources
Attractive wind sites can be found in the elevated lands in the north-west of the country, where average speeds year-round can consistently exceed 10m/s. However these locations are far from existing transmission lines and load centres. A number of areas surrounding Nairobi are also attractive.
Using a modelling algorithm to select the best sites in the country, the case study assumes an average capacity factor of 50 percent over the 1 GW target of installed capacity for wind energy. As set out earlier in Chapter 3.1, an important related modelling assumption is that transmission lines and grid extensions to access these sites will be built.
Current Status of Wind Investment
The current installed capacity for wind power in Kenya is a single 5.1 MW KenGen demonstration project, dating from 2008 and funded by concessional financing from the Belgian government.
The private sector has shown considerable interest in Kenyan wind energy; however, construction is yet to begin at any sites. A 300 MW project at Lake Turkana in the north-west is the most advanced project under development. The project is supported by an international consortium providing both commercial and development bank financing (debt and equity). Given Lake Turkana’s remote location, the state-owned Kenya Electricity Transmission Company (KETRACO) intends to construct a dedicated 428 km transmission line to load centres. Other advanced wind projects totalling 110 MW are under development at Kingapop and Ngong. The Government has also announced it has received a further 650 MW in wind power proposals.44
Interviews
Data for Stage 1 (Risk Environment) of the modelling case study was gathered from interviews held with five current investors and developers who are considering, or are actively involved in, pursuing wind energy opportunities in Kenya. An additional two information interviews were also held with other stakeholders in Kenya.
Risk Environment (Stage 1)
The contribution of risks to increasing financing costs for Kenyan wind energy is shown in the risk waterfalls in Figure 55. A brief summary of the qualitative feedback that wind energy investors and developers shared in their interviews is provided in Table 15. These results identify all risk categories, except for social acceptance risk, as having a significant impact on financing costs in Kenya.
44 Third draft of the Kenya National Energy Policy (May 2012).
Figure 54: Wind map of Kenya
Source: www.3tier.com (2012).

Derisking Renewable Energy Investment114
Chapter 3: Illustrative Country Case Studies
Public Instruments (Stage 2)
As Kenya is a non-investment-grade country, the case study models the use of financial derisking instruments in the BAU scenario, and both financial derisking instruments and policy derisking instruments in the post-derisking scenario. Details of the public cost of these instruments can be found in Table 17 at the end of this case study.
The impact of the policy instruments on reducing the financing cost for wind energy in Kenya is shown in Figure 56. Based on the case study’s analysis, the package of policy derisking instruments is anticipated to reduce the average cost of equity over 20 years by 2.1 percent, and the cost of debt by 0.8 percent.
Figure 55: Impact of risk categories on financing costs for wind energy investment in Kenya, business-as-usual scenario
Figure 56: Impact of policy derisking instruments on reducing financing costs for wind energy in Kenya
Source: interviews with wind energy investors and developers; modelling exercise; see Table 5 and Annex A for details on assumptions and methodology.Both cost of debt and equity assume supporting financial derisking instruments are in place. The cost of debt shown is the commercial rate assuming financial derisking is in place.
Source: interviews with wind energy investors and developers; modelling exercise; see Table 5 and Annex A for details on assumptions and methodology. Note: the impacts shown are average impacts over the 20-year modelling period, assuming linear timing effects.
Cost of Equity
Cost of Equity
Cost of Equity Co
st o
f Equ
ityBA
U15.0%
Curr
ency
/M
acro
-eco
n.Ri
sk
1.2%
Polit
ical
Risk
0.6% Fi
nanc
ial
Sect
or R
isk
0.5%
Coun
terp
arty
Risk
0.6%
1.1%
Perm
itsRi
sk
0.2%
Pow
er M
arke
tRi
sk
Soci
alAc
cept
ance
Risk
Cost
of E
quity
Best
-in-C
lass
Coun
try
0.7% 0.5%
Grid
Inte
grat
ion
Risk
Cost
of E
quity
BAU
Curr
ency
/M
acro
-eco
n.Ri
sk
Polit
ical
Risk
Fina
ncia
lSe
ctor
Ris
k
Coun
terp
arty
Risk
Perm
itsRi
sk
Pow
er M
arke
tRi
sk
Soci
alAc
cept
ance
Risk
Cost
of E
quity
Best
-in-C
lass
Coun
try
Grid
Inte
grat
ion
Risk
Cost
of E
quity
BAU
Curr
ency
/M
acro
-eco
n.Ri
sk
Polit
ical
Risk
Fina
ncia
lSe
ctor
Ris
k
Coun
terp
arty
Risk
Perm
itsRi
sk
Pow
er M
arke
tRi
sk
Soci
alAc
cept
ance
Risk
Cost
of E
quity
Best
-in-C
lass
Coun
try
Grid
Inte
grat
ion
Risk
Cost of Equity
Cost
of E
quity
BAU
Curr
ency
/M
acro
-eco
n.Ri
sk
Polit
ical
Risk
Fina
ncia
lSe
ctor
Ris
k
Coun
terp
arty
Risk
Perm
itsRi
sk
Pow
er M
arke
tRi
sk
Soci
alAc
cept
ance
Risk
Cost
of E
quity
Best
-in-C
lass
Coun
try
Grid
Inte
grat
ion
Risk
9.5% 18.0%
0.9% 1.5%
1.4%
1.5%
1.3%
9.5%
0.9%
0.1% 1.0%
15.0%
0.5% 0.4% 0.7% 0.5%
0.9% 0.7%
0.8% 0.9%
9.5% 18.0%
0.4% 1.4%
1.6% 1.4%
1.3%
0.0% 0.8% 1.7%
9.5%
0.3% 0.2% 0.3% 0.2% 0.2% 0.2%
0.5% 0.3% 0.0%
18.0%
0.6% 0.2%
0.3%
16.1%
0.5% 0.4% 0.0% 0.3%
0.2% 0.6%
-1.2%
Cost
of E
quity
Post
-Der
iski
ng
0.2%
Soci
alAc
cept
ance
Risk
0.1%
Perm
itsRi
sk
0.1%
Fina
ncia
lSe
ctor
Ris
k
15.0%
Polit
ical
Risk
0.2% 0.1%
Curr
ency
/M
acro
-eco
n.Ri
sk
13.8%
0.4% N/A N/A
Cost
of D
ebt
BAU
Coun
terp
arty
Risk
Pow
er M
arke
tRi
sk
Grid
Inte
grat
ion
Risk
Cost of Equity Cost of Equity
Cost
of E
quity
Post
-Der
iski
ng
Soci
alAc
cept
ance
Risk
Perm
itsRi
sk
Fina
ncia
lSe
ctor
Ris
k
15.0%
Polit
ical
Risk
Curr
ency
/M
acro
-eco
n.Ri
sk
13.6%
N/A N/A
Cost
of D
ebt
BAU
Coun
terp
arty
Risk
Pow
er M
arke
tRi
sk
Grid
Inte
grat
ion
Risk
Cost
of E
quity
Post
-Der
iski
ng
Soci
alAc
cept
ance
Risk
Perm
itsRi
sk
Fina
ncia
lSe
ctor
Ris
k
Polit
ical
Risk
Curr
ency
/M
acro
-eco
n.Ri
sk
Cost
of D
ebt
BAU
Coun
terp
arty
Risk
Pow
er M
arke
tRi
sk
Grid
Inte
grat
ion
Risk
Co
st o
f Equ
ityPo
st-D
eris
king
Soci
alAc
cept
ance
Risk
Perm
itsRi
sk
Fina
ncia
lSe
ctor
Ris
k
Polit
ical
Risk
Curr
ency
/M
acro
-eco
n.Ri
sk
Cost
of D
ebt
BAU
Coun
terp
arty
Risk
Pow
er M
arke
tRi
sk
Grid
Inte
grat
ion
Risk
Cost of Equity 18.0% 15.9% Cost of Equity
-1.9%
N/A N/A
-2.1%
N/A N/A
-1.4%
0.7% 0.4% 0.6%
0.4% 0.1% 0.3% 0.4%
0.7%
0.7% 0.6% 0.0%
0.6%
0.2% 0.7%
0.7% 0.9% 0.0%
0.9% 0.5% 0.7% 0.4% 0.3%
0.7% 0.4%
Cost of Debt
Cost of Debt
Cost of Debt
Cost
of D
ebt
BAU
7.5%
Curr
ency
/M
acro
-eco
nRi
sk
Polit
ical
Risk
Coun
terp
arty
Risk
Pow
er M
arke
tRi
sk
Soci
alAc
cept
ance
Risk
Cost
of D
ebt
Best
-in-C
lass
Coun
try
Grid
Inte
grat
ion
Risk
Cost
of D
ebt
BAU
Curr
ency
/M
acro
-eco
n.Ri
sk
Polit
ical
Risk
Coun
terp
arty
Risk
Pow
er M
arke
tRi
sk
Soci
alAc
cept
ance
Risk
Cost
of D
ebt
Best
-in-C
lass
Coun
try
Grid
Inte
grat
ion
Risk
Cost
of D
ebt
BAU
Curr
ency
/M
acro
-eco
n.Ri
sk
Polit
ical
Risk
Coun
terp
arty
Risk
Pow
er M
arke
tRi
sk
Soci
alAc
cept
ance
Risk
Cost
of D
ebt
Best
-in-C
lass
Coun
try
Grid
Inte
grat
ion
Risk
Cost
of D
ebt
BAU
Curr
ency
/M
acro
-eco
n.Ri
sk
Polit
ical
Risk
Coun
terp
arty
Risk
Pow
er M
arke
tRi
sk
Soci
alAc
cept
ance
Risk
Cost
of D
ebt
Best
-in-C
lass
Coun
try
Grid
Inte
grat
ion
Risk
Cost of Debt
5.0% 8.0% 5.0%
8.0% 5.0% 8.5% 5.0%
0.1% 0.1% 0.0% 0.2% 0.2% 0.3% 0.0% 0.2%
0.2% 0.2% 0.2% 0.2% 0.3% 0.2% 0.2% 0.0%
N/A N/A
N/A N/A
N/A N/A
N/A N/A
8.0% 7.3%
-0.5%
Cost
of D
ebt
Post
-Der
iski
ng
Soci
alAc
cept
ance
Risk
7.5%
Polit
ical
Risk
Curr
ency
/M
acro
-eco
n.Ri
sk
7.0%
Cost
of D
ebt
BAU
Coun
terp
arty
Risk
Pow
er M
arke
tRi
sk
Grid
Inte
grat
ion
Risk
Cost
of D
ebt
Post
-Der
iski
ng
Soci
alAc
cept
ance
Risk
Polit
ical
Risk
Curr
ency
/M
acro
-eco
n.Ri
sk
Cost
of D
ebt
BAU
Coun
terp
arty
Risk
Pow
er M
arke
tRi
sk
Grid
Inte
grat
ion
Risk
Cost of Debt Cost of Debt
Cost
of D
ebt
Post
-Der
iski
ng
Soci
alAc
cept
ance
Risk
Polit
ical
Risk
Curr
ency
/M
acro
-eco
n.Ri
sk
Cost
of D
ebt
BAU
Coun
terp
arty
Risk
Pow
er M
arke
tRi
sk
Grid
Inte
grat
ion
Risk
Cost
of D
ebt
Post
-Der
iski
ng
Soci
alAc
cept
ance
Risk
Polit
ical
Risk
Curr
ency
/M
acro
-eco
n.Ri
sk
Cost
of D
ebt
BAU
Coun
terp
arty
Risk
Pow
er M
arke
tRi
sk
Grid
Inte
grat
ion
Risk
8.0% 7.2% Cost of Debt 8.5% 7.7% Cost of Debt
-0.7%
-0.8% -0.8%
BUSINESS-AS-USUAL FINANCING COSTS
POST-DERISKING FINANCING COSTS
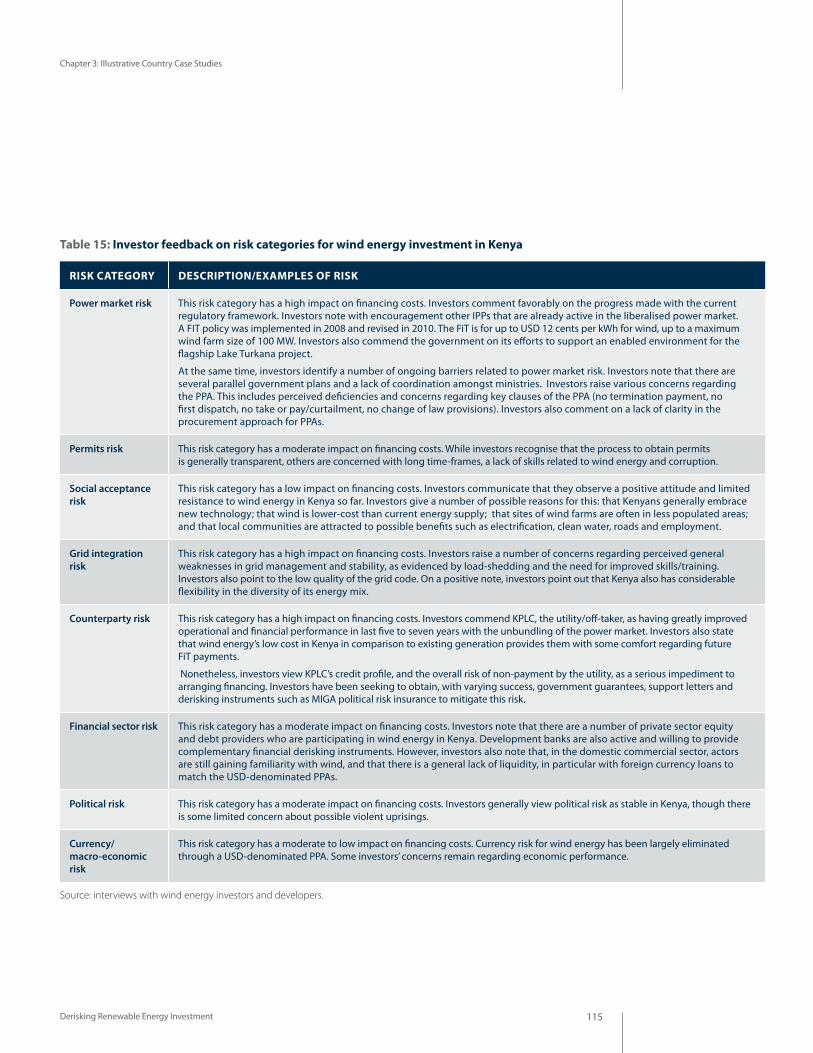
Derisking Renewable Energy Investment 115
Chapter 3: Illustrative Country Case Studies
RISK CATEGORy DESCRIPTION/EXAMPLES OF RISK
Power market risk This risk category has a high impact on financing costs. Investors comment favorably on the progress made with the current regulatory framework. Investors note with encouragement other IPPs that are already active in the liberalised power market. A FIT policy was implemented in 2008 and revised in 2010. The FiT is for up to USD 12 cents per kWh for wind, up to a maximum wind farm size of 100 MW. Investors also commend the government on its efforts to support an enabled environment for the flagship Lake Turkana project.
At the same time, investors identify a number of ongoing barriers related to power market risk. Investors note that there are several parallel government plans and a lack of coordination amongst ministries. Investors raise various concerns regarding the PPA. This includes perceived deficiencies and concerns regarding key clauses of the PPA (no termination payment, no first dispatch, no take or pay/curtailment, no change of law provisions). Investors also comment on a lack of clarity in the procurement approach for PPAs.
Permits risk This risk category has a moderate impact on financing costs. While investors recognise that the process to obtain permits is generally transparent, others are concerned with long time-frames, a lack of skills related to wind energy and corruption.
Social acceptance risk
This risk category has a low impact on financing costs. Investors communicate that they observe a positive attitude and limited resistance to wind energy in Kenya so far. Investors give a number of possible reasons for this: that Kenyans generally embrace new technology; that wind is lower-cost than current energy supply; that sites of wind farms are often in less populated areas; and that local communities are attracted to possible benefits such as electrification, clean water, roads and employment.
Grid integration risk
This risk category has a high impact on financing costs. Investors raise a number of concerns regarding perceived general weaknesses in grid management and stability, as evidenced by load-shedding and the need for improved skills/training. Investors also point to the low quality of the grid code. On a positive note, investors point out that Kenya also has considerable flexibility in the diversity of its energy mix.
Counterparty risk This risk category has a high impact on financing costs. Investors commend KPLC, the utility/off-taker, as having greatly improved operational and financial performance in last five to seven years with the unbundling of the power market. Investors also state that wind energy’s low cost in Kenya in comparison to existing generation provides them with some comfort regarding future FiT payments.
Nonetheless, investors view KPLC’s credit profile, and the overall risk of non-payment by the utility, as a serious impediment to arranging financing. Investors have been seeking to obtain, with varying success, government guarantees, support letters and derisking instruments such as MIGA political risk insurance to mitigate this risk.
Financial sector risk This risk category has a moderate impact on financing costs. Investors note that there are a number of private sector equity and debt providers who are participating in wind energy in Kenya. Development banks are also active and willing to provide complementary financial derisking instruments. However, investors also note that, in the domestic commercial sector, actors are still gaining familiarity with wind, and that there is a general lack of liquidity, in particular with foreign currency loans to match the USD-denominated PPAs.
Political risk This risk category has a moderate impact on financing costs. Investors generally view political risk as stable in Kenya, though there is some limited concern about possible violent uprisings.
Currency/ macro-economic risk
This risk category has a moderate to low impact on financing costs. Currency risk for wind energy has been largely eliminated through a USD-denominated PPA. Some investors’ concerns remain regarding economic performance.
Table 15: Investor feedback on risk categories for wind energy investment in Kenya
Source: interviews with wind energy investors and developers.

Derisking Renewable Energy Investment116
Chapter 3: Illustrative Country Case Studies
Levelised Cost (Stage 3)
The case study’s outputs in terms of LCOE are shown in Figure 57, where wind energy is seen to be significantly less expensive than the unsubsidised marginal baseline. The current unsubsidised marginal baseline LCOE is calculated at USD 17.1 cents per kWh. Policy derisking reduces the LCOE for wind energy from USD 8.7 cents per kWh (BAU scenario) to USD 8.1 cents per kWh (post-derisking scenario). Thus, given Kenya’s negative incremental costs under the modelling, no financial incentive is required.
In comparison to the modelling, the Government’s FiT is capped at USD 12.0 cents per kWh, above the modelling BAU scenario price of USD 8.7 cents per kWh. This can be explained by a number of possible modelling assumptions, including the model’s assumptions regarding wind speed (capacity factor) and its simplified assumptions on tax rates/treatment.
Evaluation (Stage 4)
The case study’s performance metrics, modelling the impact of derisking across the 1 GW target for wind investment in Kenya, are shown in Figure 58.
Kenya, like its fellow high-baseline country Panama, represents a paradox – wind is financially competitive with the baseline and therefore one should expect private sector investment to flow: yet, today, there is still no investment in wind energy taking place. As with Panama, this can be explained by the existence of non-financial barriers in the investment environment.
The performance metrics illustrate the potential for policy derisking to unlock significant societal savings through investing in wind energy in Kenya, and in particular to increase affordability. The case study generates an investment leverage ratio of 15.1x. The case study’s savings leverage ratio is 14.2x, unlocking a total of USD 4.5 billion over 20 years in societal savings due to the negative incremental cost. These savings are reflected in the affordability metric, where the LCOE is reduced by 53 percent in the post-derisking scenario.
Figure 57: LCOE for the marginal baseline and wind investment in Kenya
Source: modelling exercise; see Table 17 and Annex A for details on assumptions and methodology.
Wind Investment Post-Derisking
Wind Investment BAU
Baseline Activity (Unsubsidised)
8.18.717.1
LCO
E (U
SD C
ENTS
/kW
h)
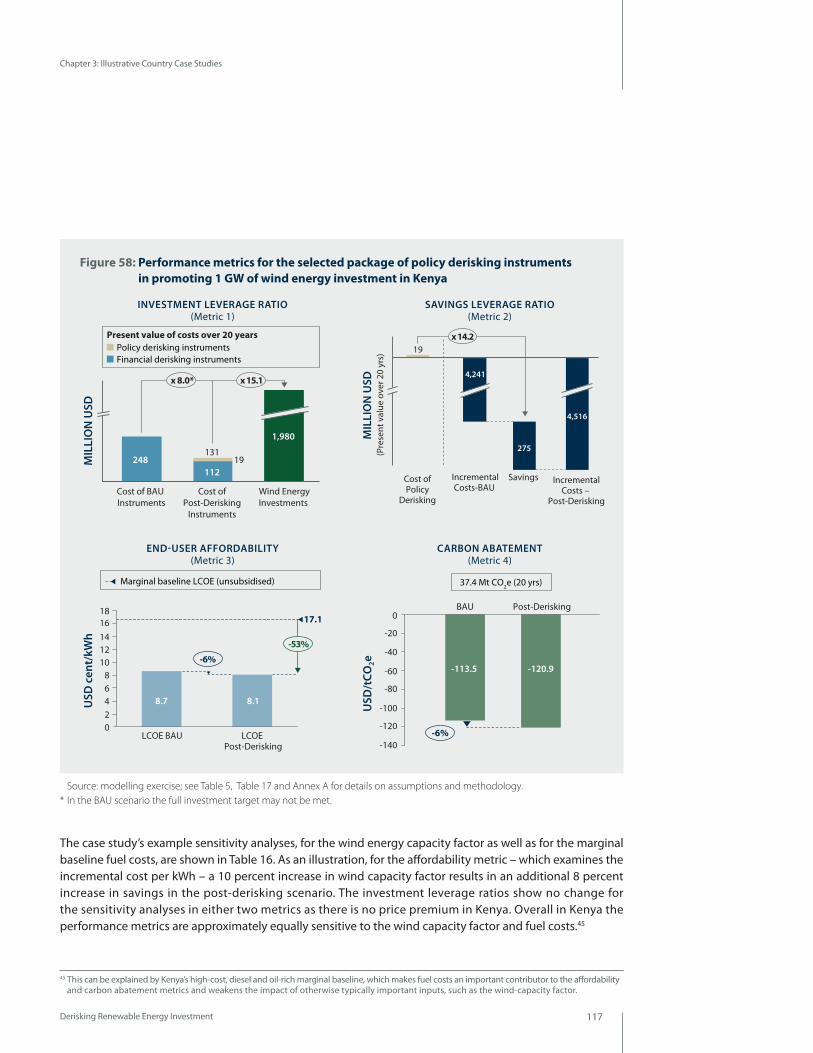
Derisking Renewable Energy Investment 117
Chapter 3: Illustrative Country Case Studies
The case study’s example sensitivity analyses, for the wind energy capacity factor as well as for the marginal baseline fuel costs, are shown in Table 16. As an illustration, for the affordability metric – which examines the incremental cost per kWh – a 10 percent increase in wind capacity factor results in an additional 8 percent increase in savings in the post-derisking scenario. The investment leverage ratios show no change for the sensitivity analyses in either two metrics as there is no price premium in Kenya. Overall in Kenya the performance metrics are approximately equally sensitive to the wind capacity factor and fuel costs.45
x 8.0*
MIL
LIO
N U
SD
Wind EnergyInvestments
1,980
Cost of Post-Derisking
Instruments
131
112
Cost of BAU Instruments
248
x 15.1
19
Policy derisking instruments Present value of costs over 20 years
Financial derisking instruments
Marginal baseline LCOE (unsubsidised)
-6%
USD
cen
t/kW
h
17.11618
141210
86420
-53%
LCOE Post-Derisking
LCOE BAU
8.7 8.1
MIL
LIO
N U
SD
x 14.219
(Pre
sent
val
ue o
ver 2
0 yr
s)
4,516
275
4,241
IncrementalCosts –
Post-Derisking
Savings IncrementalCosts-BAU
Cost ofPolicy
Derisking
-6%
USD
/tCO
2e
0
-20
-40
-60
-80
-100
-120
-140
-120.9 -113.5
BAU Post-Derisking
37.4 Mt CO2e (20 yrs)
Figure 58: Performance metrics for the selected package of policy derisking instruments in promoting 1 GW of wind energy investment in Kenya
INVESTMENT LEVERAGE RATIO (Metric 1)
END-USER AFFORDABILITY (Metric 3)
SAVINGS LEVERAGE RATIO (Metric 2)
CARBON ABATEMENT (Metric 4)
Source: modelling exercise; see Table 5, Table 17 and Annex A for details on assumptions and methodology. * In the BAU scenario the full investment target may not be met.
45 This can be explained by Kenya’s high-cost, diesel and oil-rich marginal baseline, which makes fuel costs an important contributor to the affordability and carbon abatement metrics and weakens the impact of otherwise typically important inputs, such as the wind-capacity factor.

Derisking Renewable Energy Investment118
Chapter 3: Illustrative Country Case Studies
SENSITIVITY ON WIND CAPACITY FACTOR
INVESTMENT LEVERAGE RATIO
SAVINGS LEVERAGE RATIO
AFFORDABILITy (INCREMENTAL
COSTS USD/kWh)
CARBON ABATEMENT
(USD TONNE CO2e)
Base case
BAU 8.0x
14.2x
BAU -$0.08 BAU -$113.53
Post- Derisking 15.1x Post-
Derisking -$0.09 Post- Derisking -$120.89
+10% Capacity Factor
BAU 8.0x
14.2x (0%)
BAU -0.09 (-9.3%) BAU -124.09
(-9.3%)
Post- Derisking 15.1x (0%) Post-
Derisking-0.1
(-8.2%)Post- Derisking
-130.79 (-8.2%)
-10% Capacity Factor
BAU 8.0x
14.2x (0%)
BAU -0.08 (11.4%) BAU -100.63
(11.4%)
Post- Derisking 15.1x (0%) Post-
Derisking-0.08 (10%)
Post- Derisking
-108.81 (10%)
SENSITIVITY ON FUEL COSTS
INVESTMENT LEVERAGE RATIO
SAVINGS LEVERAGE RATIO
AFFORDABILITy (INCREMENTAL
COSTS USD/kWh)
CARBON ABATEMENT
(USD TONNE CO2e)
Base case
BAU 8.0x
14.2x
BAU -$0.08 BAU -$113.53
Post- Derisking 15.1x Post-
Derisking -$0.09 Post- Derisking -$120.89
+10% Fuel Costs
BAU 8.0x
14.2x (0%)
BAU -0.1 (-13.5%) BAU -128.9
(-13.5%)
Post- Derisking 15.1x (0%) Post-
Derisking-0.1
(-12.7%)Post- Derisking
-136.26 (-12.7%)
-10% Fuel Costs
BAU 8.0x
14.2x (0%)
BAU -0.07 (13.5%) BAU -98.17
(13.5%)
Post- Derisking 15.1x (0%) Post-
Derisking-0.08
(12.7%)Post- Derisking
-105.53 (12.7%)
Table 16: Example sensitivity analyses on the Kenya case study’s performance metrics when varying key inputs by +/- 10%
Source: modelling exercise; see Table 17 and Annex A for details on assumptions and methodology.

Derisking Renewable Energy Investment 119
Chapter 3: Illustrative Country Case Studies
WIND TARGET AND RESOURCES20 Year Target (in MW) 1,000 Wind Capacity Factor (%) 50%Total Annual Energy Production for Target (in MWh) 4,364,000
MARGINAL BASELINEEnergy Mix Hydro (%) Geothermal (%) Light Fuel Oil (Diesel) (%) Heavy Fuel Oil (%)
14% 23% 39% 24%
Grid Emission Factor (tCO2e/MWh) 0.428
GENERAL COUNTRY INPUTSEffective Corporate Tax Rate (%) 30%Public Cost of Capital (%) 6%
BUSINESS-AS-USUAL SCENARIO
POST-DERISKING SCENARIO
FINANCING COSTS
Capital Structure Debt/Equity Split
65.0%/35.0%
67.5%/32.5%
Cost of Debt Non-concessional public loan Commercial loans with public guarantees Commercial loans without public guarantees
9.5% 8.5% N/A
N/A
7.7% N/A
Loan Tenor Non-concessional public loan Commercial loans with public guarantees Commercial loans without public guarantees
15 years 10 years
N/A
N/A
11 years N/A
Cost of Equity 18.0% 15.9%
Weighted Average Cost of Capital (WACC) (After-tax) 10.4% 8.8%
INVESTMENT
Total Investment (USD million) $1,980.0 $1,980.0
Debt (USD million) Non-concessional public loan Commercial loans with public guarantees Commercial loans without public guarantees
$643.5 $643.5
$0.0
$0.0
$1,336.5 $0.0
Equity (USD million) Private Sector Equity Public Sector Equity
$693.0
$0.0
$643.5
$0.0
COST OF PUBLIC INSTRUMENTS
Policy Derisking Instruments (USD million, 20 years) Power market risk activities Permits risk activities Social acceptance risk activities Grid integration risk activities Counterparty risk activities Financial sector risk activities Total
N/A N/A N/A N/A N/A N/A N/A
$6.6 $1.6 $0.7 $4.3 $4.4 $1.8
$19.4
Financial Derisking Instruments (USD million, 20 years) Methodology for costing Use of paid-in-capital leverage multiplier Non-concessional public loan Public guarantees for commercial loans Political risk insurance Total
See Annex A
Yes, 3.5x $183.9 $46.0 $17.8
$247.6
See Annex A
Yes, 3.5x N/A
$95.5 $16.5
$112.0
Direct Financial Incentives (USD million, 20 years) Present Value of 20 year PPA Price Premium Funded by domestic public sector Funded by international public sector
N/A N/A
N/A N/A
Table 17: Summary assumptions for the Kenya case study
Source: modelling exercise; see Table 5 and Annex A for details on assumptions and methodology.Financing costs are average costs over 20-year modelling period.

●● 4.1 Public Finance Effectiveness to Transform Renewable Energy Markets
●● 4.2 Public Finance Efficiency to Transform Renewable Energy Markets
●● 4.3 The Distributional Impact of Renewable Energy Policies
●● 4.4 Scaled-Up Climate Change Mitigation Outcomes
Implications for Public Finance of Scaling-Up Renewable Energy Chapter 4

Derisking Renewable Energy Investment 121
4A number of practical findings emerge from a comparative analysis of the illustrative results across the four case study countries. While a more detailed modelling exercise may substantially refine the figures obtained, it is likely that the overall implications will stay the same.
The first section of this chapter discusses some possible directions to increase the effectiveness of public finance to scale-up renewable energy investment using the investment leverage ratio. The second section focuses on public finance efficiency using the saving leverage ratio. The third section addresses the distributional impact of renewable energy policies using the affordability performance metric. The fourth section explores the implications of this modelling exercise for scaling-up climate change mitigation outcomes.
4.1 PUBLIC FINANCE EFFECTIVENESS TO TRANSFORM RENEWABLE ENERGY MARKETS A fundamental goal of the policymaker is to catalyse concrete private sector investment. Figure 59 compares the results for the model’s first performance metric, the investment leverage ratio, for each of the four case study countries. A key finding of this illustrative modelling exercise is that the presence of a cornerstone instrument, such as a FiT or PPA bidding process, by itself does not guarantee private sector investment. Instead the results show that there is a role for complementary policy and financial derisking measures to target the residual risks which a cornerstone instrument alone cannot address and which can otherwise suppress investment.
This point is particularly well illustrated by the case of Panama. Despite the country having a PPA bidding process in place, a business-friendly and attractive investment environment, and low wind power generation costs when compared with an existing high-cost baseline, financial closure with commercial banks for the first wind licences awarded has yet to occur. The financing cost waterfall for Panama clearly shows that a number of non-price barriers remain and that additional derisking efforts are required to complement the existing PPA bidding process. The modelling exercise demonstrates that the impact of such additional derisking efforts could be dramatic. With Panama’s unique combination of favourable factors, a relatively small amount of policy derisking could catalyse 100.5x its cost in private investment.
The modelling for Panama is supported by experiences from the UNDP portfolio. For example, Uruguay displays market conditions very similar to those of Panama and a current wind market transformation exercise supported by UNDP and co-financed by the Global Environment Facility (GEF) is expected to yield a leveraging ratio of that order of magnitude by 2015 (Glemarec et al., 2012).
Implications for Public Finance of Scaling-Up Renewable Energy
Chapter 4: Implications for Public Finance of Scaling-Up Renewable Energy
Policy and financial derisking instruments target the residual risks that a FiT alone cannot address.
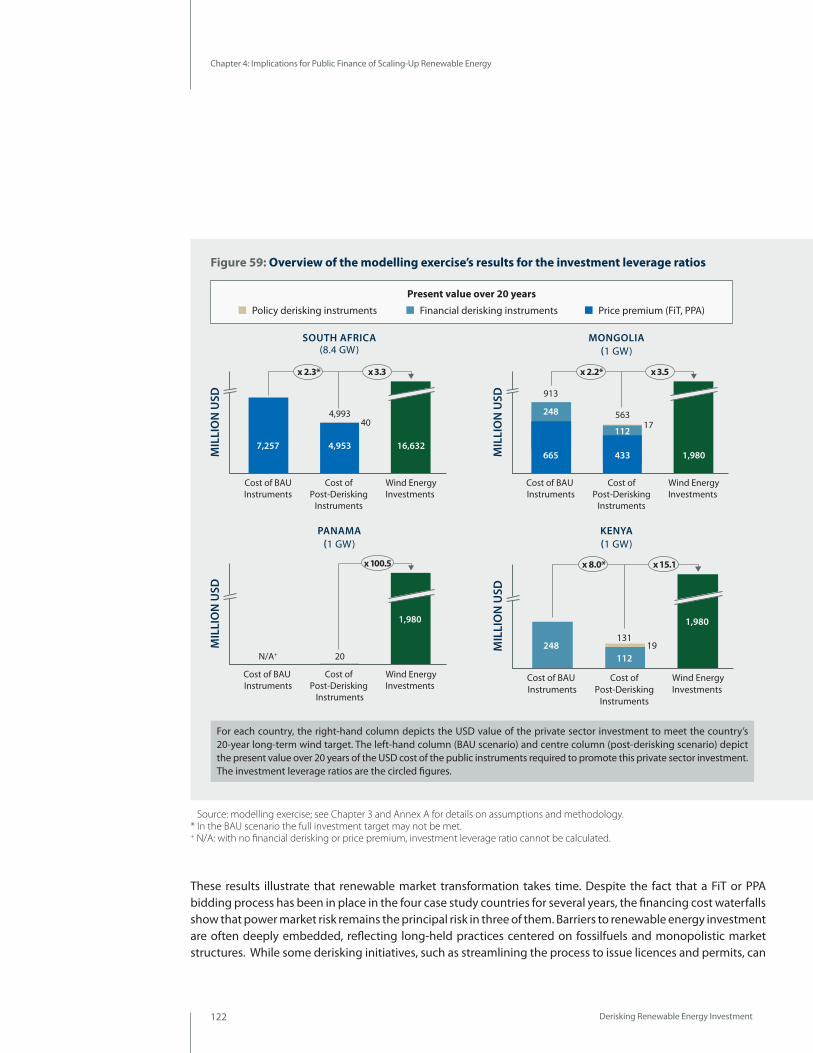
Derisking Renewable Energy Investment122
Chapter 4: Implications for Public Finance of Scaling-Up Renewable Energy
For each country, the right-hand column depicts the USD value of the private sector investment to meet the country’s 20-year long-term wind target. The left-hand column (BAU scenario) and centre column (post-derisking scenario) depict the present value over 20 years of the USD cost of the public instruments required to promote this private sector investment. The investment leverage ratios are the circled figures.
x 2.3*
MIL
LIO
N U
SD
Wind EnergyInvestments
16,632
Cost of Post-Derisking
Instruments
4,993
4,953
Cost of BAUInstruments
7,257
x 3.3
40
Policy derisking instruments Present value of costs over 20 years
Price premium (FiT, PPA)
MIL
LIO
N U
SD
Wind EnergyInvestments
1,980
Cost of Post-Derisking
Instruments
20
Cost of BAU Instruments
N/A+
x 100.5
Policy derisking instruments Present value of costs over 20 years
x 2.2*
MIL
LIO
N U
SD Wind EnergyInvestments
1,980
Cost of Post-Derisking
Instruments
563
433
112
Cost of BAU Instruments
665
248
913
x 3.5
17
Policy derisking instruments Present value of costs over 20 years
Price Premium (FiT, PPA) Financial derisking instruments
x 8.0*
MIL
LIO
N U
SD
Wind EnergyInvestments
1,980
Cost of Post-Derisking
Instruments
131
112
Cost of BAU Instruments
248
x 15.1
19
Policy derisking instruments Present value of costs over 20 years
Financial derisking instruments
Figure 59: Overview of the modelling exercise’s results for the investment leverage ratios
SOUTH AFRICA (8.4 GW)
PANAMA (1 GW)
MONGOLIA (1 GW)
KENYA (1 GW)
Source: modelling exercise; see Chapter 3 and Annex A for details on assumptions and methodology. * In the BAU scenario the full investment target may not be met. + N/A: with no financial derisking or price premium, investment leverage ratio cannot be calculated.
Present value over 20 years
Policy derisking instruments Financial derisking instruments Price premium (FiT, PPA)
These results illustrate that renewable market transformation takes time. Despite the fact that a FiT or PPA bidding process has been in place in the four case study countries for several years, the financing cost waterfalls show that power market risk remains the principal risk in three of them. Barriers to renewable energy investment are often deeply embedded, reflecting long-held practices centered on fossilfuels and monopolistic market structures. While some derisking initiatives, such as streamlining the process to issue licences and permits, can

Derisking Renewable Energy Investment 123
Chapter 4: Implications for Public Finance of Scaling-Up Renewable Energy
have an immediate effect, the impact of most public instruments is gradual. Several years are often required to develop the FiT by-laws as well as the implementation capacity of regulatory authorities. This finding is supported by empirical evidence from the UNDP portfolio, which shows that a successful market transformation exercise for renewable energy technology can require more than a decade.46
A FiT or similar cornerstone instrument can be seen as the starting point of a longer path to sustainability. Supplemented by a combination of policy and financial derisking instruments, the instrument mix will need to evolve as market players gain experience and the relative costs of renewable energy technologies fall. Most often, a mix of financial derisking and policy derisking instruments will have to be deployed at the beginning to initiate investment. Efforts can be made over time to shift the balance of interventions from financial derisking to policy derisking. Financial derisking, acting on a project-by-project basis, can be effective at catalysing investment quickly. However, policy derisking, rather than transferring risks, acts systemically to remove the underlying barriers to investor risks. As such, policy derisking is ultimately essential if developing countries are to achieve sustainable renewable energy investment.
4.2 PUBLIC FINANCE EFFICIENCY TO TRANSFORM RENEWABLE ENERGY MARKETS The model’s second performance metric, the savings leverage ratio, compares the USD cost of derisking instruments deployed versus the resulting USD savings to society. A higher savings leverage ratio means a higher level of public funding efficiency in terms of reducing the cost of renewable energy to rate-payers (electricity consumers) and/or taxpayers.
As shown in Figure 60, a second key finding from the modelling exercise is that the deployment of derisking instruments to complement a FiT or similar cornerstone instrument can generate significant economic savings in both low- and high-cost baseline countries. For low-cost baseline countries (South Africa and Mongolia), where wind energy is more expensive than the baseline, derisking can result in significant reductions in the public cost of the price premium. In South Africa, with a large 8.4 GW wind target, an estimated USD 40 million in policy derisking instruments results in a USD 2.3 billion reduction in the price premium over the 20-year target, a savings leverage ratio of over 50.
Less intuitive but just as critical, derisking instruments can ‘unlock’ the savings associated with the lower cost of renewable energy in high-cost baseline countries such as Panama and Kenya. For example, in Kenya the impact of an estimated USD 19 million in policy derisking instruments creates direct savings of USD 275 million over 20 years, a savings leverage ratio of 14.2x. However, this gain in Kenya is dwarfed by the unlocking of an indirect USD 4.5 billion of negative incremental cost savings over 20 years as compared to the unsubsidised baseline. By enabling oil-importing countries to access their local renewable energy potential, the use of derisking instruments can generate substantial savings that can then be reinvested in equally urgent development priorities.
46 For example, UNDP helped lay the foundation for China’s rapid expansion through its GEF-supported Capacity Building for the Rapid Commercialization of the Renewable Energy in China project (1999–2007). The goal of tis market transformation project was to promote the widespread adoption of renewable energy by removing barriers and supporting the development of new policies. A major focus of the UNDP-GEF project was to the development of the national Renewable Energy Law (REL). The REL passed in 2005 and included aggressive targets for renewable energy sources. However, four additional years were required for the adoption of the final pricing mechanisms for wind energy (the government initially used competitive bidding but then switched to standard offer prices in 2009). Although the entire policy development exercise took place over a decade, the market transformation results greatly exceeded initial expectations, with China leading the world in terms of total renewable energy investment each year since 2009.
A FiT can be seen as the starting point of a longer path to sustainability.
Derisking measures reduce the price premium in low-cost baseline countries.... and unlock savings in the high-cost baseline countries.

Derisking Renewable Energy Investment124
Chapter 4: Implications for Public Finance of Scaling-Up Renewable Energy
For each country, the centre-left column depicts the present value over 20 years of the USD incremental costs for the country to meet its 20-year long-term wind investment target in the BAU scenario. Incremental costs reflect the difference in cost between wind energy and the baseline generation costs. The far-right column shows the present value over 20 years of the USD incremental costs for the post-derisking scenario (once policy derisking instruments have been deployed). The difference between these two scenarios, depicted in the centre-right column, is the present value over 20 years of the USD economic savings that are created by deploying the policy derisking instruments. Finally, the column on the far-left of each country shows the USD public cost of deploying the policy derisking instruments. The savings leverage ratios are the circled figures. Note that incremental costs in Panama and Kenya are negative since the LCOE of baseline generation exceeds the LCOE of wind power.
MIL
LIO
N U
SD
x 57.8
40
(Pre
sent
val
ue o
ver 2
0 yr
s)
4,953
2,303
7,257
IncrementalCosts –
Post-Derisking
Savings IncrementalCosts-BAU
Cost ofPolicy
Derisking
MIL
LIO
N U
SD
x 15.620
(Pre
sent
val
ue o
ver 2
0 yr
s)
2,440
307
2,133
IncrementalCosts –
Post-Derisking
Savings IncrementalCosts-BAU
Cost ofPolicy
Derisking
MIL
LIO
N U
SD
x 13.3
17
(Pre
sent
val
ue o
ver 2
0 yr
s)
433
232
665
IncrementalCosts –
Post-Derisking
Savings IncrementalCosts-BAU
Cost ofPolicy
DeriskingM
ILLI
ON
USD
x 14.219
(Pre
sent
val
ue o
ver 2
0 yr
s)
4,516
275
4,241
IncrementalCosts –
Post-Derisking
Savings IncrementalCosts-BAU
Cost ofPolicy
Derisking
Figure 60: Overview of the modelling exercise’s results for the savings leverage ratios
SOUTH AFRICA (8.4 GW)
PANAMA (1 GW)
MONGOLIA (1 GW)
KENYA (1 GW)
Source: modelling exercise; see Chapter 3 and Annex A for details on assumptions and methodology.
Derisking Renewable Energy Investment 125
Chapter 4: Implications for Public Finance of Scaling-Up Renewable Energy
For the two low-cost baseline countries (South Africa and Mongolia) wind energy remains more expensive than the baseline after derisking and can result in a net cost to taxpayers or electricity consumers. In these cases, the ambition of the country’s long-term vision for wind energy can be an important factor. In South Africa, for example, the ambitious 8.4 GW target for wind should create large economies of scale, as evidenced by the 57.8x savings leverage ratio. Although local content requirements have proven controversial, it could also provide a solid foundation for local manufacturing in wind energy. The experience of countries, such as China and India, shows that local manufacturing can greatly reduce total installed costs for wind energy (IRENA, 2012) and generate FDI and green jobs. South Africa is poised to become a regional manufacturing hub for wind energy, whose benefits should rapidly offset the residual incremental cost.
In Mongolia, with the current modelling assumptions (1 GW, domestic baseline), the economic case in favour of public financial incentives for wind energy deserves careful consideration. However, a more ambitious, export-oriented vision for wind in Mongolia, partnering with neighbouring countries, could dramatically alter the cost equation. There have also been reports regarding a possible Asian super-grid, which could allow links to markets, such as China, Republic of Korea and Japan. Here, economies of scale and higher power generation baseline costs in neighbouring countries could further increase the competitiveness of wind energy in Mongolia: in effect, wind power generation could become a new 'extractive industry' for Mongolia.
4.3 THE DISTRIBUTIONAL IMPACT OF RENEWABLE ENERGY POLICIES Irrespective of the instrument mix and implementation scheme that is selected, there will be a cost for electricity consumers (industry, households) and/or taxpayers associated with the adoption of public instruments. Furthermore, any public measures paid for through consumer bills have the potential to be regressive, impacting the least well-off more significantly than the rich. This is because poorer people spend a larger proportion of their income on energy, particularly domestic electricity and heating.
The model’s third metric, end-user affordability, takes an electricity consumer perspective and compares the unsubsidised generation cost (LCOE, in units of USD cents per kWh) of wind energy for the post-derisking scenario with the BAU scenario. Figure 61 compares the modelling exercise’s results for end-user affordability in each of the four case study countries.
These results show that, if passed on to the consumer, the use of derisking instruments to complement a FiT or similar cornerstone instrument has the potential to increase affordability of renewable energy technologies in all four countries: reducing the cost burden in South Africa and Mongolia, and increasing the savings (against the unsubsidised baseline) in Panama and Kenya.
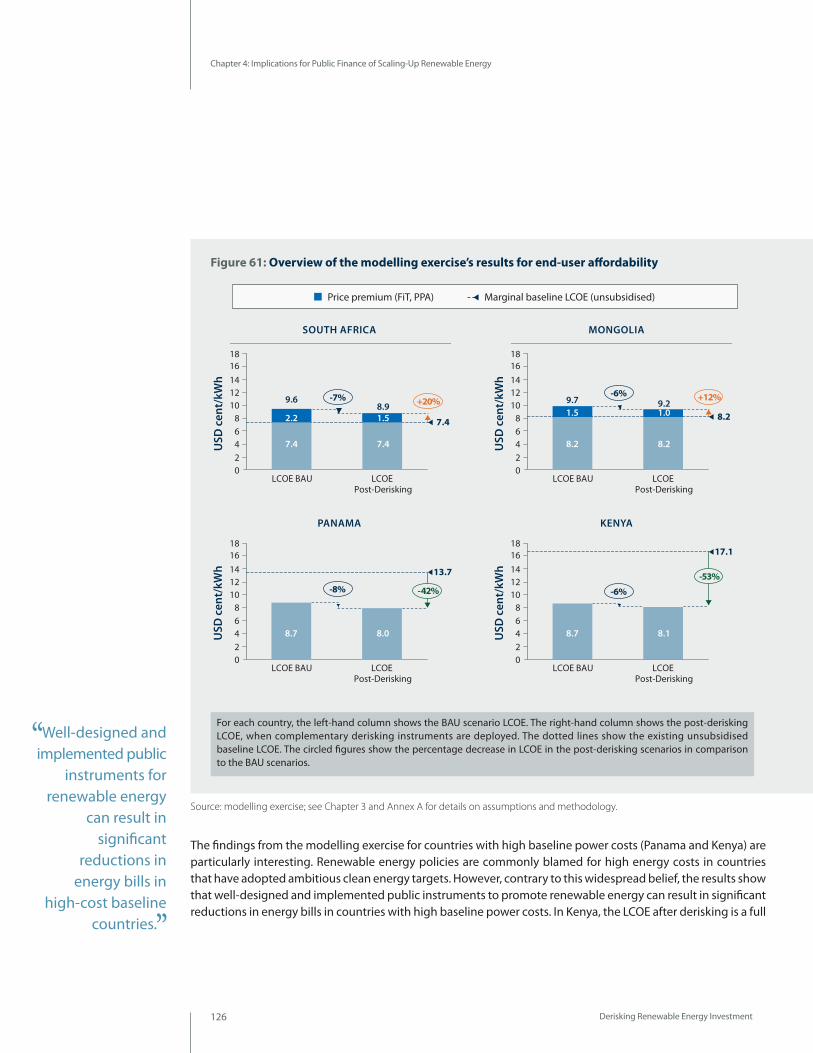
Derisking Renewable Energy Investment126
Chapter 4: Implications for Public Finance of Scaling-Up Renewable Energy
For each country, the left-hand column shows the BAU scenario LCOE. The right-hand column shows the post-derisking LCOE, when complementary derisking instruments are deployed. The dotted lines show the existing unsubsidised baseline LCOE. The circled figures show the percentage decrease in LCOE in the post-derisking scenarios in comparison to the BAU scenarios.
1618
141210
86420
Price premium (FiT, PPA) Marginal baseline LCOE (unsubsidised)
-7%
USD
cen
t/kW
h
7.4
+20%
LCOE Post-Derisking
LCOE BAU
7.4 7.4
2.2 1.5
9.68.9
1618
141210
86420
Marginal baseline LCOE (unsubsidized)
-8%
USD
cen
t/kW
h 13.7
-42%
LCOE Post-Derisking
LCOE BAU
8.7 8.0
1618
141210
86420
Price premium (FiT, PPA) Marginal baseline LCOE (unsubsidised)
-6%
USD
cen
t/kW
h
8.2
+12%
LCOE Post-Derisking
LCOE BAU
8.2 8.2
1.5 1.09.7 9.2
Marginal baseline LCOE (unsubsidised)
-6%
USD
cen
t/kW
h
17.11618
141210
86420
-53%
LCOE Post-Derisking
LCOE BAU
8.7 8.1
Figure 61: Overview of the modelling exercise’s results for end-user affordability
SOUTH AFRICA
PANAMA
MONGOLIA
KENYA
Price premium (FiT, PPA) Marginal baseline LCOE (unsubsidised)
The findings from the modelling exercise for countries with high baseline power costs (Panama and Kenya) are particularly interesting. Renewable energy policies are commonly blamed for high energy costs in countries that have adopted ambitious clean energy targets. However, contrary to this widespread belief, the results show that well-designed and implemented public instruments to promote renewable energy can result in significant reductions in energy bills in countries with high baseline power costs. In Kenya, the LCOE after derisking is a full
Well-designed and implemented public
instruments for renewable energy
can result in significant
reductions in energy bills in
high-cost baseline countries.
Source: modelling exercise; see Chapter 3 and Annex A for details on assumptions and methodology.
Derisking Renewable Energy Investment 127
Chapter 4: Implications for Public Finance of Scaling-Up Renewable Energy
53 percent lower than the unsubsidised baseline cost, creating potentially very large benefits for low-income ratepayers. The low cost and competitiveness of wind energy in high-baseline cost countries is also attractive to investors, as it is perceived to reduce power market risk (changes in regulations and policy) and counterparty risk (risk of non-payment).
The results of the case studies, where fossil fuel subsidies have expressly been excluded, show that renewable energy is competitive against unsubsidised fossil fuel technologies in many developing countries. Globally, the IEA estimates subsidies to fossil fuels were in the order of USD 523 billion in 2011, over five times greater than financial incentives to renewable energy amounting to USD 88 billion (IEA, 2012). This distorts the true competitiveness of renewable energy investment. In low-cost baseline countries, the most cost-effective means of reducing direct financial incentives for renewable energy incentives is to phase-out or phase-down fossil fuel subsidies. In high-cost baseline countries, fossil fuel subsidies that are intended to help the consumer may have the perverse effect of preventing investment in far more affordable renewable energy alternatives (Blum et al., 2013).
However, fossil fuel reform is notoriously difficult and faces political challenges worldwide for a variety of reasons, including the distributional impacts associated with reforms as well as the interests of different constituencies. Although a large body of literature (OECD, 2005 and 2010; World Bank, 2005; Bredenkamp and Pattillo, 2010; Laan, 2010) shows that subsidies mostly benefit the wealthy, indiscriminately removing them can also hurt the poor. However, successful experiences from countries that have undertaken reform of their fossil fuel subsidies, such as South Africa, show that these impacts can be potentially offset by re-targeting some of the saved subsidy expenditure toward social programmes, either in the form of direct subsidies or through the removal of regressive taxes such as value-added tax (VAT) on food.
4.4 SCALED-UP CLIMATE CHANGE MITIGATION OUTCOMES Figure 62 shows the effect of derisking on the cost of carbon abatement. A key finding from the modelling exercise is that a public finance component to derisk renewable energy investment can lower the abatement costs of carbon in the four country case studies, reducing the societal cost of climate mitigation efforts. For example, in South Africa, meeting the 8.4 GW wind energy target over 20 years could result in emission reductions amounting to 604 million tonnes of CO2e, with derisking measures reducing the cost of abatement from USD 12 to USD 8.20 per tonne of CO2e.
In low-cost baseline countries, the most cost-effective means of reducing direct financial incentives for renewable energy incentives is to phase-out or phase-down fossil fuel subsidies.

Derisking Renewable Energy Investment128
Chapter 4: Implications for Public Finance of Scaling-Up Renewable Energy
This finding could also have significant implications for the design of sector-wide approaches to scale-up climate mitigation outcomes. The international community agreed in Copenhagen in 2009 that the maximum mean global temperature increase should be limited to 2° C. New research suggests that a warming of 2° C could be achieved as early as the 2030s (STAP, 2012). Not surprisingly, strong interest in the concept of sector-wide approaches to support such transformational shifts has emerged. The extension of the Kyoto commitments, new national/regional emissions trading schemes, the advent of comprehensive NAMAs,
For each country, the left-hand column shows the USD per tonne carbon abatement cost in the BAU scenario. The right-hand column shows the USD per tonne carbon abatement cost in the post-derisking scenario, when complementary derisking instruments are deployed. The circled figures show the percentage decrease in carbon abatement costs in the post-derisking scenarios in comparison to the BAU scenarios. Note that carbon abatement costs are negative in Panama and Kenya where the LCOE of the baseline generation exceeds the LCOE of wind.
-32%
USD
/tCO
2e
14
12
10
8
6
4
2
0
8.212.0
BAU Post-Derisking
604 Mt CO2e (20 yrs)
-14%
USD
/tCO
2e
-75.0 -65.6
BAU Post-Derisking
32.5 Mt CO2e (20 yrs)
0
-20
-40
-60
-80
-100
-120
-140
-35%
USD
/tCO
2e
5.48.2
BAU Post-Derisking
80.8 Mt CO2e (20 yrs)
14
12
10
8
6
4
2
0
-6%
USD
/tCO
2e
0
-20
-40
-60
-80
-100
-120
-140
-120.9 -113.5
BAU Post-Derisking
37.4 Mt CO2e (20 yrs)
Figure 62: Overview of the modelling exercise’s results for carbon abatement
SOUTH AFRICA (8.4 GW)
PANAMA (1 GW)
MONGOLIA (1 GW)
KENYA (1 GW)
Source: modelling exercise; see Chapter 3 and Annex A for details on assumptions and methodology.
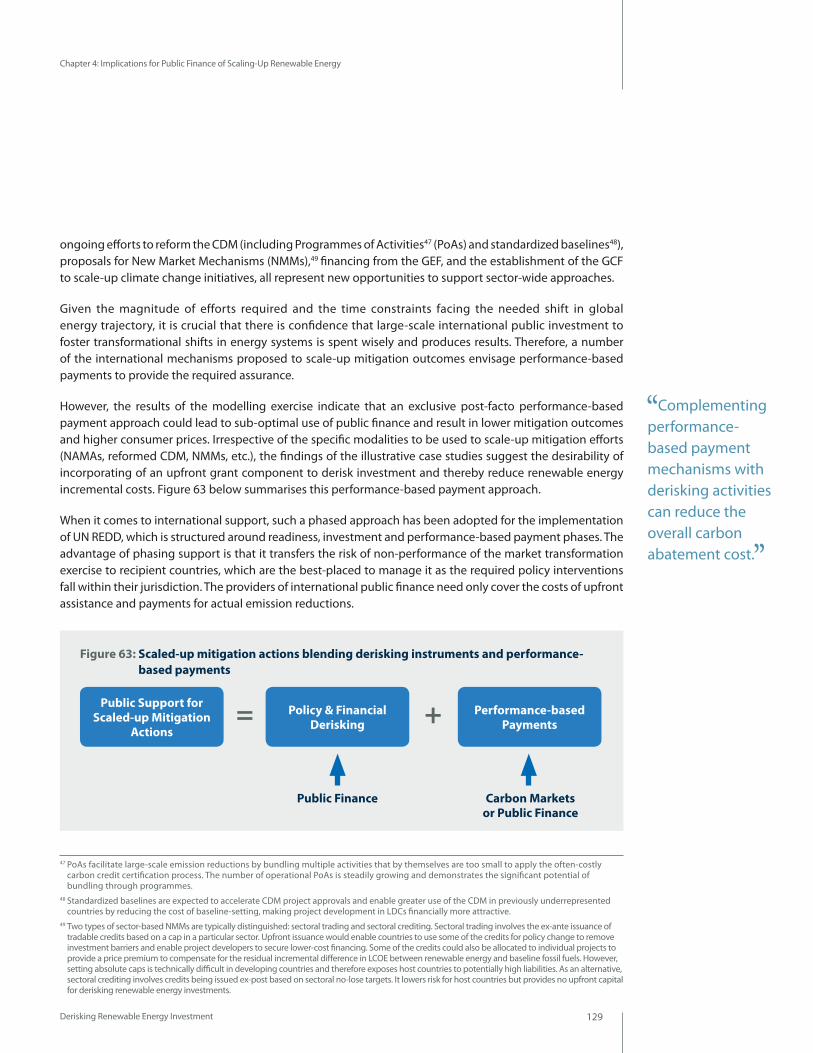
Derisking Renewable Energy Investment 129
Chapter 4: Implications for Public Finance of Scaling-Up Renewable Energy
ongoing efforts to reform the CDM (including Programmes of Activities47 (PoAs) and standardized baselines48), proposals for New Market Mechanisms (NMMs),49 financing from the GEF, and the establishment of the GCF to scale-up climate change initiatives, all represent new opportunities to support sector-wide approaches.
Given the magnitude of efforts required and the time constraints facing the needed shift in global energy trajectory, it is crucial that there is confidence that large-scale international public investment to foster transformational shifts in energy systems is spent wisely and produces results. Therefore, a number of the international mechanisms proposed to scale-up mitigation outcomes envisage performance-based payments to provide the required assurance.
However, the results of the modelling exercise indicate that an exclusive post-facto performance-based payment approach could lead to sub-optimal use of public finance and result in lower mitigation outcomes and higher consumer prices. Irrespective of the specific modalities to be used to scale-up mitigation efforts (NAMAs, reformed CDM, NMMs, etc.), the findings of the illustrative case studies suggest the desirability of incorporating of an upfront grant component to derisk investment and thereby reduce renewable energy incremental costs. Figure 63 below summarises this performance-based payment approach.
When it comes to international support, such a phased approach has been adopted for the implementation of UN REDD, which is structured around readiness, investment and performance-based payment phases. The advantage of phasing support is that it transfers the risk of non-performance of the market transformation exercise to recipient countries, which are the best-placed to manage it as the required policy interventions fall within their jurisdiction. The providers of international public finance need only cover the costs of upfront assistance and payments for actual emission reductions.
47 PoAs facilitate large-scale emission reductions by bundling multiple activities that by themselves are too small to apply the often-costly carbon credit certification process. The number of operational PoAs is steadily growing and demonstrates the significant potential of bundling through programmes.
48 Standardized baselines are expected to accelerate CDM project approvals and enable greater use of the CDM in previously underrepresented countries by reducing the cost of baseline-setting, making project development in LDCs financially more attractive.
49 Two types of sector-based NMMs are typically distinguished: sectoral trading and sectoral crediting. Sectoral trading involves the ex-ante issuance of tradable credits based on a cap in a particular sector. Upfront issuance would enable countries to use some of the credits for policy change to remove investment barriers and enable project developers to secure lower-cost financing. Some of the credits could also be allocated to individual projects to provide a price premium to compensate for the residual incremental difference in LCOE between renewable energy and baseline fossil fuels. However, setting absolute caps is technically difficult in developing countries and therefore exposes host countries to potentially high liabilities. As an alternative, sectoral crediting involves credits being issued ex-post based on sectoral no-lose targets. It lowers risk for host countries but provides no upfront capital for derisking renewable energy investments.
Figure 63: Scaled-up mitigation actions blending derisking instruments and performance- based payments
Policy & Financial Derisking
Public Support for Scaled-up Mitigation
Actions
Performance-based Payments +=
Carbon Markets or Public Finance
Public Finance
Complementing performance- based payment mechanisms with derisking activities can reduce the overall carbon abatement cost.

Conclusion
Derisking Renewable Energy Investment 131
The technology cost of renewable energy is rapidly declining and generation costs are expected to reach cost-competitiveness in OECD countries within a few years. However, this energy transition is likely to take longer in developing countries. Sustained market transformation efforts will be required to reduce the actual or perceived investment risks that are currently resulting in high financing costs for renewable energy in these countries. Reducing these elevated financing costs in developing countries is a major opportunity for policymakers acting today.
Introducing the FrameworkThis report introduces the first version of a framework, and its accompanying financial tool, to assist policymakers in selecting and quantifying the impact of public instruments to promote renewable energy.
A key benefit of the framework is that it involves a transparent, structured process whereby assumptions are made explicit, and can be checked, debated and enriched to strengthen the design of market transformation initiatives. In most countries, there is still considerable work to do in building a shared political understanding of the need for a portfolio of public instruments, and the composition of this portfolio, to promote renewable energy technologies. By enabling the modelling of alternative portfolios and supporting their analysis through a set of performance metrics, the framework can foster such an understanding.
A further benefit of the framework is that it can be applied in a versatile manner. Using the entire framework in order to make informed policy decisions is likely to require a significant time and resource investment – in all likelihood several months, including extensive stakeholder consultations and detailed data gathering. Alternatively, specific steps in the framework can be valuable even in isolation. For example, the financing cost waterfall can be a useful tool by itself to help prioritize the selection of public instruments, or to monitor public instruments’ impact over time.
This initial version of the framework is only a start and holds potential for further refinement. Many of its methodological options merit scrutiny and can be improved on. Much of this report, and the financial tool itself, focus on onshore wind energy. There is the possibility of broadening its application to additional renewable energy technologies. There is also a great need for better benchmarking data: on financing costs for renewable energy in developing countries, on the costing of public instruments and on the effectiveness of public instruments.
Implications for Renewable Energy Policy A central conclusion of the report is that it is important for policymakers to address the risks to renewable energy investment in a systemic and integrated manner. In all four case study countries, the framework’s financing cost waterfalls clearly demonstrate that a range of risks exist in the investment environment. Barriers to renewable energy investment can be numerous and are often deeply embedded, reflecting long-held practices centered on fossil-fuels and monopolistic market structures. Any isolated, short- term effort focusing on a sub-set of risks and relying on a sub-set of instruments is unlikely to sustainably transform renewable energy markets. Each market transformation stage will usually require a mix of policy and financial derisking instruments, supplemented by direct financial incentives as required.
Conclusion
Conclusion
The framework facilitates a transparent, structured process whereby assumptions can be checked, debated and enriched to strengthen the design of market transformation initiatives.
Derisking Renewable Energy Investment132
Conclusion
A complementary conclusion of this report is that investing in derisking measures, bringing down the financing costs of renewable energy, appears to be cost-effective when measured against paying direct financial incentives to compensate investors for higher risks. Instead of using scarce public funds to pay higher electricity tariffs, it can be advantageous to first reduce and manage typical renewable energy risks (for example, those associated with power markets, permits, and transmission) and thereby change the fundamental risk-reward trade-off that energy investors face in a given country. Well-designed, stable policies are required by investors and can reduce risks, lower finance costs and benefit consumers.
Public finance in the form of targeted grants or tax subsidies might still be required to supplement policy and financial derisking efforts when renewable energy technologies are still not cost-competitive with the existing energy mix. However, everything that can be done to first reduce investment risks — such as establishing long-term renewable energy targets, simplifying and shortening administrative processes and improving stakeholder information — should be done before resorting to direct financial incentives to buy-down risks at the project level.
Looking AheadThe framework introduced in this report in its first version can help to estimate the costs of derisking instruments and the amount of upfront funding required for these activities. It can also help to assess the financial incentives required to meet the derisked incremental costs of renewable energy and calibrate a performance-based payment scheme accordingly.
However, it is important to be realistic about the difficulties associated with modelling derisked incremental costs in the absence of (often scarce) historical empirical data and when confronting long-run uncertainties (such as those relating to technological evolution). The sensitivity analyses conducted for the four country case studies shows that small differences in key model input parameters can result in major variations in outputs. The framework can support, but does not substitute for, in-depth policy decision-making and consultation processes involving all key stakeholders.
The framework is currently being piloted on several UNDP renewable energy market tranformation projects. In line with these pilots, UNDP looks forward to collaborating with its partners to further test and develop the framework.
Any isolated, short-term effort
focusing on a subset of risks and relying on a subset
of instruments is unlikely to sustainably transform renewable
energy markets.

Derisking Renewable Energy Investment 133

Methodology and Data for the Illustrative Modelling ExerciseAnnex A

Derisking Renewable Energy Investment 135
This annex sets out the methodology, assumptions and data that are used in performing the modelling exercise described in Chapters 3 and 4 of this report, examining the use of public instruments to promote onshore wind energy in Kenya, Mongolia, Panama and South Africa.
The modelling exercise closely follows the methodology for the framework set out in Chapter 2. Summary tables of the key data and inputs for each of the four countries (Tables 8, 11, 14 and 17) can be found in Chapter 3.
The annex is organised in line with the four stages of the framework: the Risk Environment Stage (Stage 1), the Public Instrument Stage (Stage 2), the Levelised Cost Stage (Stage 3) and the Evaluation Stage (Stage 4).
A.1 RISK ENVIRONMENT (STAGE 1) The data for the Risk Environment Stage come from three principal sources:
●● General and country-specific literature on wind investment barriers
●● 14 information interviews with relevant stakeholders and experts, such as government officials, national wind associations and development practitioners (including out-posted UNDP staff)
●● 21 structured interviews with investors and developers in wind energy in the four case study countries and the best-in-class country
Multi-stakeholder Barrier and Risk TableThe modelling exercise’s multi-stakeholder barrier and risk table for wind energy is derived from the generic table for renewable energy (See Table 3 introduced in Section 2.1.1.). Two changes have been made to the generic table to take into account key assumptions on wind energy used in the modelling exercise:
●● The generic table’s ‘resource and technology risk’ category has been removed due to the use of various assumptions (See Box 4.) in the modelling exercise, including: the use of high-quality wind turbines from an established manufacturer; the use of an EPC contract with high penalties and the use of O&M insurance.
●● The generic table’s ‘grid/transmission risk’ category consists of two underlying barriers. The second barrier, regarding investment in grid infrastructure, has similarly been removed due to the assumption in the modelling exercise (See Box 4.) that all wind energy sites are within 50 km of a well-maintained
transmission line.
Annex A. Methodology and Data for the Illustrative Modelling Exercise
Annex A. Methodology and Data for the Illustrative Modelling Exercise

Derisking Renewable Energy Investment136
Annex A. Methodology and Data for the Illustrative Modelling Exercise
The modelling exercise’s multi-stakeholder barrier and risk table therefor uses eight risk categories in all: power market risk; permits risk; social acceptance risk; grid integration risk; counterparty risk; financial sector risk; political risk; and currency/macro-economic risk. These risk categories, their underlying barriers and associated stakeholders can be seen on the left hand side of Table 5 in Section 3.1.4.
Impact of Risk Categories on Financing CostsThe basis of the financing cost waterfalls produced in the modelling exercise is structured, quantitative interviews undertaken with wind energy investors and developers. The interviews were performed on a confidential basis, and all data across interviews was aggregated together. The interviews and processing of data followed the methodology described in Box 2 in Section 2.1.2, with investors scoring each risk category according to (i) the probability of occurance of negative events, (ii) level of financial impact from these events (should they occur) and (iii) effectiveness of public instruments. Investors were also asked to provide estimates of their cost of equity, cost of debt, capital structure and loan tenors. Interviewees were provided beforehand with an information document setting out key definitions and questions and the typical interview took between 45 and 90 minutes.
Box 4: The eight investment assumptions for the four countries
1. Provide scores based on the current investment environment in the country today
2. Assume you have the opportunity to investment in a 50-100 MW onshore wind park
3. Assume 2-3 MW class turbines from a quality manufacturer with proven track record
4. Assume a build-own-operate (BOO) business model
5. Assume a comprehensive O&M contract
6. Assume that well-maintained transmission lines with free capacities are located within 50km of the project site
7. Assume a an EPC construction sub-contract with high penalties for breach of contract
8. Assume a non-recourse project finance structure
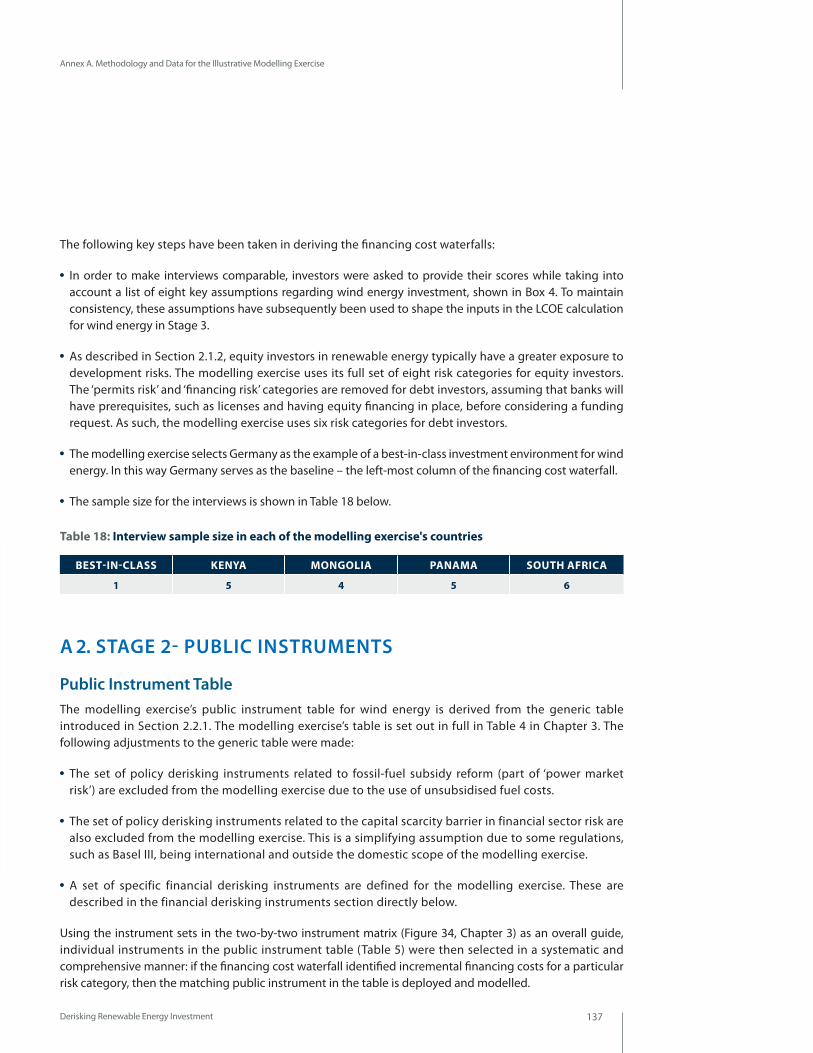
Derisking Renewable Energy Investment 137
Annex A. Methodology and Data for the Illustrative Modelling Exercise
The following key steps have been taken in deriving the financing cost waterfalls:
●● In order to make interviews comparable, investors were asked to provide their scores while taking into account a list of eight key assumptions regarding wind energy investment, shown in Box 4. To maintain consistency, these assumptions have subsequently been used to shape the inputs in the LCOE calculation for wind energy in Stage 3.
●● As described in Section 2.1.2, equity investors in renewable energy typically have a greater exposure to development risks. The modelling exercise uses its full set of eight risk categories for equity investors. The ‘permits risk’ and ‘financing risk’ categories are removed for debt investors, assuming that banks will have prerequisites, such as licenses and having equity financing in place, before considering a funding request. As such, the modelling exercise uses six risk categories for debt investors.
●● The modelling exercise selects Germany as the example of a best-in-class investment environment for wind energy. In this way Germany serves as the baseline – the left-most column of the financing cost waterfall.
●● The sample size for the interviews is shown in Table 18 below.
A 2. STAGE 2- PUBLIC INSTRUMENTS
Public Instrument Table The modelling exercise’s public instrument table for wind energy is derived from the generic table introduced in Section 2.2.1. The modelling exercise’s table is set out in full in Table 4 in Chapter 3. The following adjustments to the generic table were made:
●● The set of policy derisking instruments related to fossil-fuel subsidy reform (part of ‘power market risk’) are excluded from the modelling exercise due to the use of unsubsidised fuel costs.
●● The set of policy derisking instruments related to the capital scarcity barrier in financial sector risk are also excluded from the modelling exercise. This is a simplifying assumption due to some regulations, such as Basel III, being international and outside the domestic scope of the modelling exercise.
●● A set of specific financial derisking instruments are defined for the modelling exercise. These are described in the financial derisking instruments section directly below.
Using the instrument sets in the two-by-two instrument matrix (Figure 34, Chapter 3) as an overall guide, individual instruments in the public instrument table (Table 5) were then selected in a systematic and comprehensive manner: if the financing cost waterfall identified incremental financing costs for a particular risk category, then the matching public instrument in the table is deployed and modelled.
BEST-IN-CLASS KENyA MONGOLIA PANAMA SOUTH AFRICA
1 5 4 5 6
Table 18: Interview sample size in each of the modelling exercise's countries

Derisking Renewable Energy Investment138
Annex A. Methodology and Data for the Illustrative Modelling Exercise
Policy Derisking Instruments The data and assumptions for policy derisking instruments are based on UNDP’s in-house data and experience of renewable energy market transformation projects (Glemarec et al., 2012). The following is a summary of the key approaches taken:
●● Estimates for the public cost of policy derisking instruments are calculated based on a bottom-up modelling exercise. This follows the approach for costing shown in Section 2.2.2., factoring in the core costs (design, implementation and evaluation), duration and actor (domestic versus international assistance) for each policy derisking instrument activity. Policy derisking measures are modelled for up to the full 20-year target investment period. Cost estimates are determined at first for a generic developing country and are then tailored to reflect the particular circumstances of each of the four case study countries. This involves adjustments based on each country’s 20-year wind target, population, geographic size, electricity generation and the current status of existing policy derisking activities in the country. See Tables 8, 11, 14 and 17 (Chapter 3) for the cost estimates for policy derisking instruments in each country.
●● Estimates for the effectiveness of policy derisking instruments in reducing financing costs are based on the structured interviews with investors and then further adjusted to reflect UNDP’s in-house experience. As certain policy derisking instruments may take time to become maximally effective, a linear (‘straight-line’) approach to time effects is modeled over the 20-year target investment period. The same standardized estimates for effectiveness are used across all four countries. The assumptions for the final effectiveness (after 20 years) are shown in Table 19.
RISK CATEGORy POLICy DERISKING INSTRUMENT EFFECTIVENESS COMMENT
Energy Market Risk
Establish wind energy strategy and targets; well-designed and harmonized energy market liberalization and FiT (or similar instrument)
75% Interview responses: high effectiveness
Permits Risk
Establish streamlined processes to issue licences and permits; establish a dedicated wind energy permitting institution (‘one-stop shop’); contract enforcement and recourse mechanisms
50% Interview responses: moderate effectiveness. Residual risk due to corruption.
Social Acceptance Risk
Awareness raising campaigns targeting communities and end-users; pilot models for community involvement at project sites
75% Interview responses: high effectiveness.
Grid Integration Risk
Develop a long-term national strategy for grid connection & management; strengthen the utility's grid management capabilities; develop a grid-code for wind energy
50% Interview responses: moderate effectiveness. Residual risk due to physical grid infrastructure.
Counterparty Risk Sharing of international best practice in utility/distribution company's management, operations and corporate governance
75% Interview responses: high effectiveness.
Financial Sector Risk
Strengthening investors' (debt and equity) familiarity and assessment capacity for wind energy; industry-finance dialogues, conferences, workshops/training on project assessment, public-private partnership building
50% Interview responses: moderate effectiveness. Residual risk from limited local capital.
Table 19: The modeling exercise’s assumptions for policy derisking instruments’ effectiveness
Derisking Renewable Energy Investment 139
Annex A. Methodology and Data for the Illustrative Modelling Exercise
Financial Derisking Instruments The modelling exercise’s assumptions for financial derisking instruments are informed by UNDP’s in-house experience, interviews with representatives from international financial institutions, interviews with project developers and a review of the available literature.
Empirically, the selection and pricing of financial derisking instruments for a particular renewable energy investment is determined on a case-by-case basis, and reflects the particular risk-reward characteristics of that investment. The modelling exercise assumptions instead cover the aggregate investments (for example, 1 GW in total) for the country’s 20-year wind target and represent a simplified, but plausible, formulation for the selection and pricing of financial derisking instruments. The following is a summary of the key assumptions used:
●● In line with the two-by-two instrument matrix (Figure 34, Chapter 3), the modelling exercise assumes the deployment of financial derisking instruments in countries with a low sovereign rating (Kenya, Mongolia). The modelling exercise assumes an evolution in how debt-related financial derisking instruments are used from the BAU scenario to the post-derisking scenario (from public loans to partial loan guarantees), reflecting an effort to develop and engage the domestic financial sector. The assumptions for financial derisking instruments are as follows:
In the BAU scenario:
●● 50 percent of the debt is in the form of public non-concessional loans, and 50 percent is in the form of commercial loans, backed by public partial loan-guarantees.
●● 4-point PRI coverage (available by a public sector entity, such as MIGA), including counterparty guaran-tees, is used by equity investors.
In the post-derisking scenario:
●● 100 percent of the debt is in the form of commercial loans, backed by public partial loan-guarantees.
●● 4-point PRI coverage (available by a public sector entity, such as MIGA), including counterparty guarantees, is used by equity investors.
Estimates of the costing of financial derisking instruments includes both the (i) public cost and the (ii) private cost to project developers. The various assumptions and data used are set out in Table 20 below, as well as in Tables 8, 11, 14, and 17 (Chapter 3) for each case study country.
The public cost of financial derisking instruments use the ‘capital reserve’ approach to costing (See Section 2.2.2.). These cost estimates are further discounted to take into account paid-in-capital leverage, using an assumption of a 3.5 multiple (UN, 2010).

Derisking Renewable Energy Investment140
Annex A. Methodology and Data for the Illustrative Modelling Exercise
The private costs of financial derisking instruments to project developers reflect the various pricing, fees and premiums that are typically charged.
●● The modelling exercise assumes that public loans to project developers are non-concessional or, in other words, are priced at market levels and address a lack of access to capital.
●● The modelling exercise assumes ‘an equivalent price for the project developer for either (i) debt financing based on public non-concessional loans or (ii) debt financing based on commercial loans backed by public partial loan guarantees.
FINANCIAL DERISKING INSTRUMENT DESCRIPTION OF MODELLING EXERCISE’S ASSUMPTIONS
Public Loan ●● Public cost:
Assumes public cost is 100% of the loan amount
Assumes 3.5x paid-in-capital multiplier
Partial Loan Guarantee ●● Assumes a partial loan guarantee at 50% of the face value of the commercial loan, to avoid moral hazard and recognising that wind-turbines can be used as collateral. Assumes no matching sovereign guarantee is required by domestic government.
●● Public cost:
Assumes the public cost is a 50% of the guarantee amount
Assumes 3.5x paid-in-capital multiplier●● Private cost (fee structure) assumes 200 basis points (2%) loan guarantee fee, calculated annually, based on the average
outstanding value of the commercial loan covered by the guarantee
Political Risk Insurance ●● Assumes 4 point MIGA-type coverage for equity holders covering (i) expropriation, (ii) political violence, (iii) currency restrictions, and (iv) counterparty risk. Covers 90% of the original face value of equity invested.
●● Public cost:
Assumes the public cost is 10% (loss reserve) of the equity amount covered
Assumes 3.5x paid-in-capital multiplier●● Private cost (fee structure):
Assumes a 20 basis points (0.2%) front end fee
Assumes a 100 basis points (1%) premium payment, calculated annually
Table 20: The modelling exercise’s assumptions on costing of financial derisking instruments

Derisking Renewable Energy Investment 141
Annex A. Methodology and Data for the Illustrative Modelling Exercise
A.3 STAGE 3- LEVELISED COSTS In order to keep the modelling exercise manageable, simplified approaches to data gathering for both the (i) baseline energy mix and (ii) wind energy LCOE calculations were taken.
●● Country-specific costs of financing and capacity factors are used.
●● Standardised technology costs (investment, O&M, fuel costs) are applied across all four countries.
●● The overall approach to data gathering was strongly informed by the work of Schmidt and colleagues (Schmidt et al., 2012).
Levelised Cost of Electricity (LCOE) CalculationThe framework’s financial tool is used for the LCOE calculations. The financial tool is based on the equity-share based approach to LCOE, which is also used by ECN and NREL (IEA, 2011; NREL, 2011). Box 5 sets out the LCOE formula used. In this approach, a capital structure (debt and equity) is determined for the investment and the cost of equity is used to discount the energy cash flows.
Tax-deductible, linear depreciation of 95 percent of fixed assets over the lifetime of investment is used. The standard corporate tax rate for each country was used: 25 percent in Mongolia and Panama; 28 percent in South Africa; and 30 percent in Kenya (Deloitte, 2012). No tax credits, or other tax treatment, are assumed in any of the four countries.
Box 5: The modelling exercise’s LCOE formula
Where, % Equity Capital = portion of the investment funded by equity investors O&M Expense = operations and maintenance expenses Debt Financing Costs = interest & principal payments on debt Depreciation = depreciation on fixed assets Cost of Equity = after-tax target equity IRR
% Equity Capital * Total Investment + Σ Τ τ=1
(O&M Expense)τ + (Debt Financing Costs)
τ – Tax Rate * (Interest Expense
τ + Depreciation
τ + O&M Expense
τ)
Electricity Productionτ * (1 – Tax Rate )
(1 + Cost of Equity)τ
ΣΤ τ=1(1 + Cost of Equity)τ
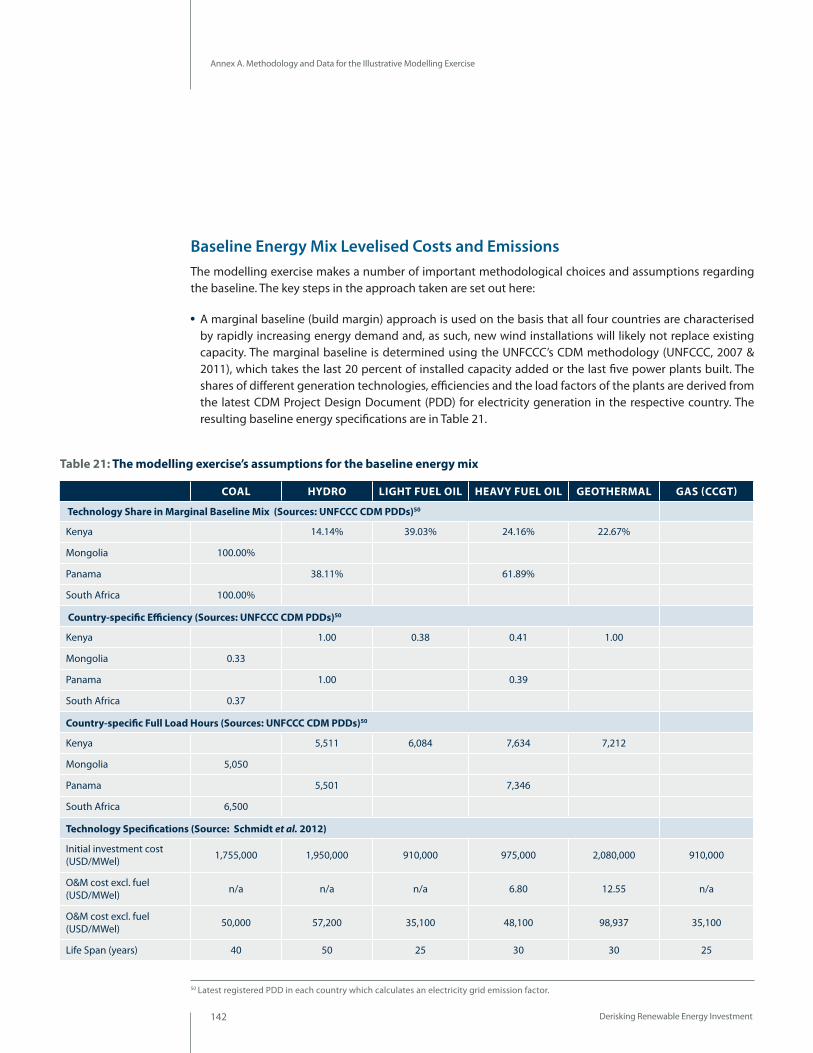
Derisking Renewable Energy Investment142
Annex A. Methodology and Data for the Illustrative Modelling Exercise
Baseline Energy Mix Levelised Costs and EmissionsThe modelling exercise makes a number of important methodological choices and assumptions regarding the baseline. The key steps in the approach taken are set out here:
●● A marginal baseline (build margin) approach is used on the basis that all four countries are characterised by rapidly increasing energy demand and, as such, new wind installations will likely not replace existing capacity. The marginal baseline is determined using the UNFCCC’s CDM methodology (UNFCCC, 2007 & 2011), which takes the last 20 percent of installed capacity added or the last five power plants built. The shares of different generation technologies, efficiencies and the load factors of the plants are derived from the latest CDM Project Design Document (PDD) for electricity generation in the respective country. The resulting baseline energy specifications are in Table 21.
COAL HyDRO LIGHT FUEL OIL HEAVy FUEL OIL GEOTHERMAL GAS (CCGT)
Technology Share in Marginal Baseline Mix (Sources: UNFCCC CDM PDDs)50
Kenya 14.14% 39.03% 24.16% 22.67%
Mongolia 100.00%
Panama 38.11% 61.89%
South Africa 100.00%
Country-specific Efficiency (Sources: UNFCCC CDM PDDs)50
Kenya 1.00 0.38 0.41 1.00
Mongolia 0.33
Panama 1.00 0.39
South Africa 0.37
Country-specific Full Load Hours (Sources: UNFCCC CDM PDDs)50
Kenya 5,511 6,084 7,634 7,212
Mongolia 5,050
Panama 5,501 7,346
South Africa 6,500
Technology Specifications (Source: Schmidt et al. 2012)
Initial investment cost (USD/MWel) 1,755,000 1,950,000 910,000 975,000 2,080,000 910,000
O&M cost excl. fuel (USD/MWel) n/a n/a n/a 6.80 12.55 n/a
O&M cost excl. fuel (USD/MWel) 50,000 57,200 35,100 48,100 98,937 35,100
Life Span (years) 40 50 25 30 30 25
Table 21: The modelling exercise’s assumptions for the baseline energy mix
50 Latest registered PDD in each country which calculates an electricity grid emission factor.
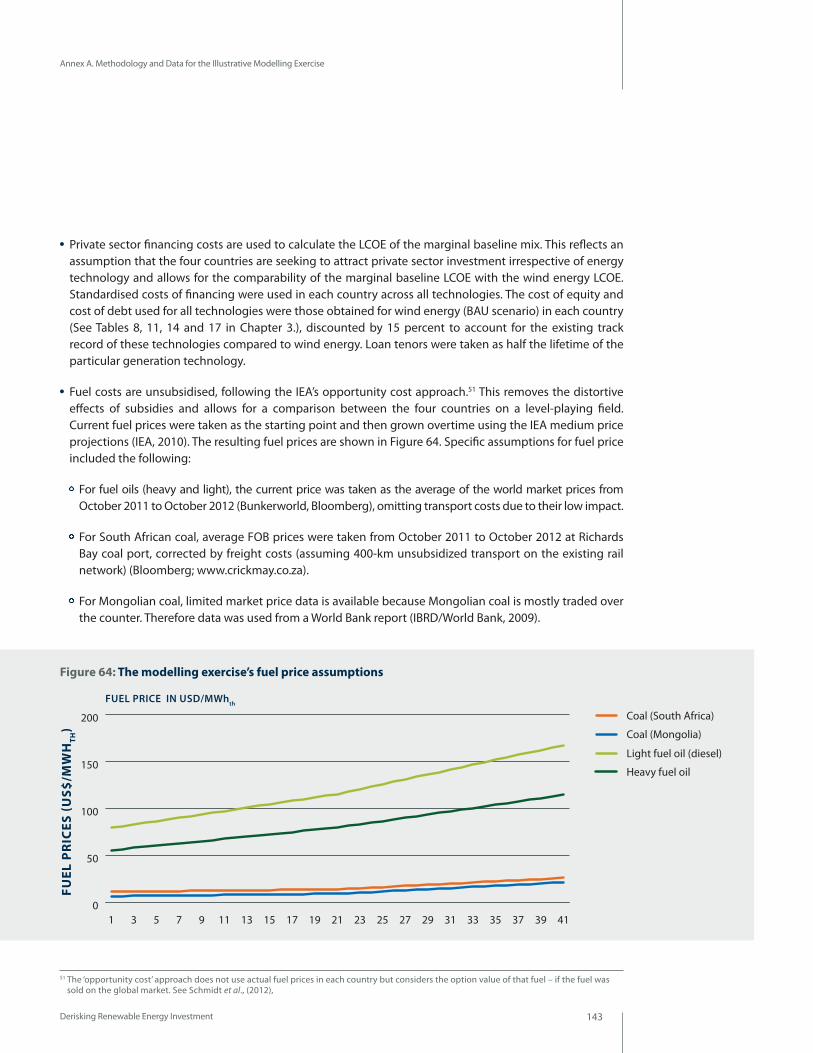
Derisking Renewable Energy Investment 143
Annex A. Methodology and Data for the Illustrative Modelling Exercise
●● Private sector financing costs are used to calculate the LCOE of the marginal baseline mix. This reflects an assumption that the four countries are seeking to attract private sector investment irrespective of energy technology and allows for the comparability of the marginal baseline LCOE with the wind energy LCOE. Standardised costs of financing were used in each country across all technologies. The cost of equity and cost of debt used for all technologies were those obtained for wind energy (BAU scenario) in each country (See Tables 8, 11, 14 and 17 in Chapter 3.), discounted by 15 percent to account for the existing track record of these technologies compared to wind energy. Loan tenors were taken as half the lifetime of the particular generation technology.
●● Fuel costs are unsubsidised, following the IEA’s opportunity cost approach.51 This removes the distortive effects of subsidies and allows for a comparison between the four countries on a level-playing field. Current fuel prices were taken as the starting point and then grown overtime using the IEA medium price projections (IEA, 2010). The resulting fuel prices are shown in Figure 64. Specific assumptions for fuel price included the following:
For fuel oils (heavy and light), the current price was taken as the average of the world market prices from October 2011 to October 2012 (Bunkerworld, Bloomberg), omitting transport costs due to their low impact.
For South African coal, average FOB prices were taken from October 2011 to October 2012 at Richards Bay coal port, corrected by freight costs (assuming 400-km unsubsidized transport on the existing rail network) (Bloomberg; www.crickmay.co.za).
For Mongolian coal, limited market price data is available because Mongolian coal is mostly traded over the counter. Therefore data was used from a World Bank report (IBRD/World Bank, 2009).
51 The ‘opportunity cost’ approach does not use actual fuel prices in each country but considers the option value of that fuel – if the fuel was sold on the global market. See Schmidt et al., (2012),
Figure 64: The modelling exercise’s fuel price assumptions
FUEL
PR
ICES
(US$
/MW
HTH
)
0
50
100
150
200
Heavy fuel oil
Light fuel oil (diesel)
Coal (South Africa)
Coal (Mongolia)
4139373533312927252321191715131197531
FUEL PRICE IN USD/MWhth
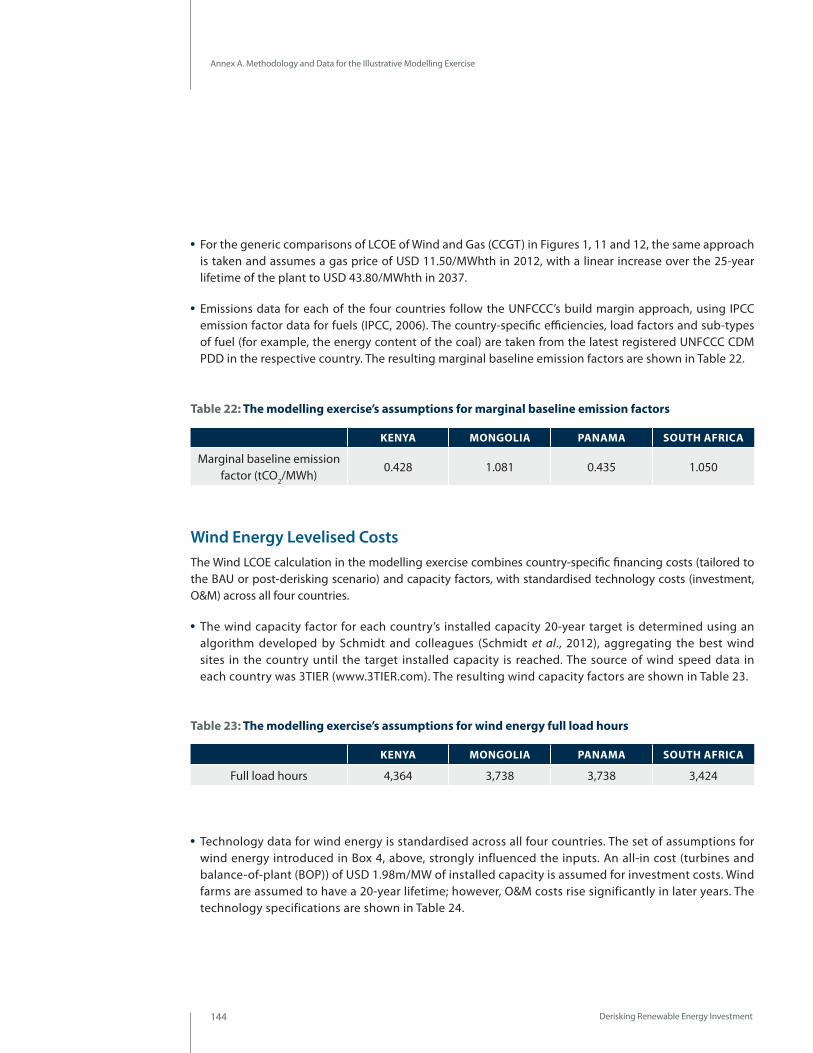
Derisking Renewable Energy Investment144
Annex A. Methodology and Data for the Illustrative Modelling Exercise
Wind Energy Levelised Costs The Wind LCOE calculation in the modelling exercise combines country-specific financing costs (tailored to the BAU or post-derisking scenario) and capacity factors, with standardised technology costs (investment, O&M) across all four countries.
●● The wind capacity factor for each country’s installed capacity 20-year target is determined using an algorithm developed by Schmidt and colleagues (Schmidt et al., 2012), aggregating the best wind sites in the country until the target installed capacity is reached. The source of wind speed data in each country was 3TIER (www.3TIER.com). The resulting wind capacity factors are shown in Table 23.
●● Technology data for wind energy is standardised across all four countries. The set of assumptions for wind energy introduced in Box 4, above, strongly influenced the inputs. An all-in cost (turbines and balance-of-plant (BOP)) of USD 1.98m/MW of installed capacity is assumed for investment costs. Wind farms are assumed to have a 20-year lifetime; however, O&M costs rise significantly in later years. The technology specifications are shown in Table 24.
●● For the generic comparisons of LCOE of Wind and Gas (CCGT) in Figures 1, 11 and 12, the same approach is taken and assumes a gas price of USD 11.50/MWhth in 2012, with a linear increase over the 25-year lifetime of the plant to USD 43.80/MWhth in 2037.
●● Emissions data for each of the four countries follow the UNFCCC’s build margin approach, using IPCC emission factor data for fuels (IPCC, 2006). The country-specific efficiencies, load factors and sub-types of fuel (for example, the energy content of the coal) are taken from the latest registered UNFCCC CDM PDD in the respective country. The resulting marginal baseline emission factors are shown in Table 22.
KENyA MONGOLIA PANAMA SOUTH AFRICA
Marginal baseline emission factor (tCO2/MWh)
0.428 1.081 0.435 1.050
KENyA MONGOLIA PANAMA SOUTH AFRICA
Full load hours 4,364 3,738 3,738 3,424
Table 22: The modelling exercise’s assumptions for marginal baseline emission factors
Table 23: The modelling exercise’s assumptions for wind energy full load hours

Derisking Renewable Energy Investment 145
Annex A. Methodology and Data for the Illustrative Modelling Exercise
A.4 STAGE 4 - EVALUATION The modelling exercise performs two example sensitivities for each country case study. For each sensitivity, one key input factor is selected and varied by +/- 10 percent. The two sensitivities are:
●● Wind energy capacity factor. This sensitivity illustrates variations in wind speed, site selection and turbine performance from the base-case assumptions in the modelling exercise. This is also closely related to issues such as social acceptance and transmission lines, which may prevent the best sites from being accessed.
●● Unsubsidised fuel costs. This sensitivity increases or decreases the starting unsubsidised fuel costs. The change is then kept constant over time. This sensitivity illustrates the impact of variations in the marginal baseline LCOE, one of the key outputs in each country’s case study.
TECHNOLOGy ITEM ASSUMPTION SOURCE
Turbine size 2-3 MW class Authors
Hub height approx. 80m EWEA, Vestas
Park size 50-100 MW Authors
Core investment costs (turbine only) 1,293,600 USD/MW Wind Power Monthly
Additional Investment costs (including balance of plant costs such as civil works, transformers)
686,400 USD/MW Wind Power Monthly
Annual O&M costs at start of operations Annual increase
6,996 USD/MW 4,547 USD/MW
ISET/IWES, Schneider et al. , (2010)
Lifetime 20 years EWEA
Table 24: The modelling exercise’s assumptions on technology specifications for wind energy

ReferencesAnnex B

Derisking Renewable Energy Investment 147
Bazilian, M., Onyejia,I., Liebreich, M., MacGill, I., Chase,J., Shah, J., Gielen, D., Arent, D., Landfear, D., & Zhengrong, S. (2012) Re-considering the Economics of Photovoltaic Power. White Paper. Bloomberg New Energy Finance.
Becker, B., Fischer, D. (2013). Promoting renewable electricity generation in emerging economies. Energy Policy 56, 446-455.
Blum, N.U., Sryantoro Wakeling, R., Schmidt, T.S. (2013). Rural electrification through village grids—Assessing the cost competitiveness of isolated renewable energy technologies in Indonesia. Renewable and Sustainable Energy Reviews 22, 482-496.
BNEF. (2013). Clean Energy – White Paper. Financial Regulation – Biased Against Clean Energy and Green Infrastructure? London: Bloomberg New Energy Finance.
Bredenkamp, H. & Pattillo, C. (2010). Financing the Response to Climate Change. IMF Staff Position Note No. 2010/06. Washington D.C.: International Monetary Fund.
Bürer, M. J., & Wüstenhagen, R. (2009). Which Renewable Energy Policy is a Venture Capitalist’s Best Friend? Empirical Evidence from a Survey of International Cleantech Investors. Energy Policy, 37(12), 4997-5006.
CPI. (2013). The Challenge of Institutional Investment in Renewable Energy. Climate Policy Initiative.
DB Climate Change Advisors. (2011). GET FiT Plus: Derisking Clean Energy Business Models in a Developing Country Contex. New York, NY: The Deutsche Bank Group and United Nations Development Programme.
De Jager, D. ,Rathmann, M. (2008). Policy Instrument Design to Reduce Financing Costs in Renewable Energy Technology Projects. Report by Order of the IEA Implementing Agreement on Renewable Energy Technology Deployment (RETD). Ecofys.
Deloitte (2012). Global Tax Rates 2012. London: Deloitte Touche Tohmatsu Limited.
DeMartino, S., Le Blanc, D. (2010). Estimating the Amount of a Global Feed-in Tariff for Renewable Electricity. DESA Working Paper No. 95. New York, NY: United Nations Department of Social Affairs.
Economy Watch. (2011). Econ Stats: The Economic Statistics and Indicators Database (Online). Singapore: Stanley St Labs.
Ernst & Young. (2012). Analysis of the Value Creation Potential of Wind Energy Policies. Paris.
Frondel, M., Ritter, N., & Schmidt, C. M. (2008). Germany's Solar Cell Promotion: Dark Clouds on the Horizon. Energy Policy, 36(11), 4198-4204.
Annex B. References
Annex B. References

Derisking Renewable Energy Investment148
Annex B. References
GEA. (2012). Global Energy Assessment – Toward a Sustainable Future. Cambridge, University Press, Cambridge UK and New York, NY, USA and the International Institute for Applied Systems Analysis, Laxenburg, Austria.
Glemarec, Y. (2011). Catalysing Climate Finance: A Guidebook on Policy and Financing Options to Support Green, Low-emission and Climate-resilient Development. New York, NY: United Nations Development Programme.
Glemarec, Y., Rickerson, W., Waissbein, O. (2012). Transforming On-Grid Renewable Energy Markets. A Review of UNDP-GEF Support for Feed-in Tariffs and Related Price and Market-Access Instruments. New York, NY: United Nations Development Programme.
Hoppmann J., Peters M., Schneider M., Hoffmann V.H. (2013). The Two Faces of Market Support – How Deployment Policies Affect Technological Exploration and Exploitation in the Solar Photovoltaic Industry. Research Policy 42, 989-1003.
IBRD/Worldbank. (2009). Southern Mongolia Infrastructure Strategy. Washington DC: The International Bank for Reconstruction and Development / The World Bank.
IEA. (2010). Energy Technology Perspectives 2010. Paris: International Energy Agency.
IEA. (2011). Multinational Case Study of the Financial Cost of Wind Energy, IEA Wind Task 26, Work Package 1, Final Report. Paris: International Energy Agency.
IEA. (2012). World Energy Outlook 2012. Paris: International Energy Agency.
IPCC. (2006). Guidelines for National Greenhouse Gas Inventories. Geneva: Intergovernmental Panel on Climate Change.
IPCC. (2007). Climate Change 2007: Mitigation of Climate Change, Fourth Assessment Report of the Intergovernmental Panel on Climate Change. Geneva: Intergovernmental Panel on Climate Change.
IPCC. (2011). IPCC Special Report on Renewable Energy Sources and Climate Change Mitigation. Geneva: Intergovernmental Panel on Climate Change.
IRENA. (2012a). Renewable Power Generation Costs in 2012: An Overview. Abu Dhabi: International Renewable Energy Agency.
IRENA. (2012b). IRENA Working Paper: Renewable Energy Jobs: Status; Prospects & Policies. Abu Dhabi, International Renewable Energy Agency.
Derisking Renewable Energy Investment 149
Annex B. References
ISO. (2009). ISO Guide 73, Risk Management – Vocabulary. Geneva, Switzerland: International Standardization Organization.
Joskow, P. L. (2011). Comparing the Costs of Intermittent and Dispatchable Electricity Generating Technologies. American Economic Review 101, 238-241.
Kammen, D. M., & Pacca, S. (2004). Assessing the Costs of Electricity. Annual Review of Environment and Resources 29, 301-344.
Komendantova, N., Patt, A., Barras, L., Battaglini, A. (2012). Perception of Risks in Renewable Energy Projects: The Case of Concentrated Solar Power in North Africa. Energy Policy 40, 103-109.
Komendantova, N., Patt, A., Williges, K. (2011). Solar Power Investment in North Africa: Reducing Perceived Risks. Renewable and Sustainable Energy Reviews 15, 4829-4835.
Laan, T. (2010). Gaining Traction: the Importance of Transparency in Accelerating the Reform of Fossil-fuel Subsidies. Untold Billions: Fossil-fuel Subsidies, Their Impacts and the Path to Reform. Geneva: International Institute for Sustainable Development.
Lilliestam, J., Battaglini, A., Finlay, C., Furstenwerth, D., Patt, A., Schellekens, G. and Schmidt, P. (2012). An Alternative to a Global Climate Deal may be Unfolding Before our Eyes. Climate and Development, 2012, 1-5.
Maclean, J., Tan, J., Tirpak, D., Sonntag-O’Brian, V., Usher, E. (2008). Public Finance Mechanisms to Mobilise Investment in Climate Change Mitigation. Nairobi: United Nations Environment Programme.
McKinsey & Company. (2012). Avoiding a Risk Premium that Unnecessarily Kills your Project. McKinsey on Finance, 44: 7-10.
McKinsey Global Institute. (2011). Mapping Global Capital Markets 2011.
NREL. (2011). Renewable Energy Cost Modeling: A Toolkit for Establishing Cost-Based Incentives in the United States. Golden, Colorado: National Renewable Energy Laboratory.
OECD. (2005). Environmental Fiscal Reform for Poverty Reduction. OECD Guidelines and Reference Series. Paris: Organisation for Economic Co-operation and Development.
OECD. (2010). Taxation, Innovation and the Environment. Paris: Organisation for Economic Co-operation and Development.
Oxera. (2011). Discount Rates for Low-carbon and Renewable Generation Technologies. Oxford, UK & Brussels, Belgium: Oxera Consulting Ltd.

Derisking Renewable Energy Investment150
Annex B. References
Peters, G.P., Andrew, R.M., Boden, T., Canadell, J.G., Ciais, P., Le Quere, C., Marland, G., Raupach, M.R., Wilson, C. (2013). The Challenge to Keep Global Warming Below Two Degrees. Nature Climate Change 3, 4-6.
Peters, M., Schmidt, T.S., Wiederkehr, D., Schneider, M. (2011). Shedding Light on Solar Technologies - a Techno-Economic Assessment and its Policy Implications. Energy Policy 39, 6422-6439.
Peters, M., Schneider, M., Griesshaber, T., & Hoffmann, V. H. (2012). The Impact of Technology-Push and Demand-Pull Policies on Technical Change – Does the Locus of Policies Matter? Research Policy 41, 1296-1308.
REN21. (2012). Renewables 2012 Global Status Report. Paris: REN21 Secretariat.
Schmidt, T.S., Born, R., Schneider, M. (2012). Assessing the Costs of Photovoltaic and Wind Power in Six Developing Countries. Nature Climate Change 2, 548-553.
Schneider, M. Schmidt, T.S., Hoffmann, V.H. (2010). Performance of Renewable Energy Technologies under the CDM. Climate Policy 10, 17-37.
Schwarz, V. (2008). Promotion of Wind Energy: Lessons learned from International Experience and UNDP-GEF projects. New York, NY: United National Development Programme.
Seth, P. (2012). The Economic Case for Adopting Low-Carbon Trajectories in Low Income Countries: a Test Case of the Electricity Sector. ODI Working Paper 359. London, UK; Overseas Development Institute.
STAP. (2012). Climate Change: A Scientific Assessment for the GEF. A STAP Information Document. Washington DC: Global Environment Facility.
Tan, M. (2012). Financing Renewable Energy Projects in the US, Case Studies and Opportunities Spring 2012. New York, NY: Kay Scholer LLP.
UNEP. (2006). Assessment of Financial Risk Management Instruments for RE Projects in Developing Countries. Under the UNEP/GEF project: Assessment of Financial Risk Management Instruments for Renewable Energy Projects. Nairobi: United Nations Environment Programme.
UNFCCC. (2007). Methodological Tool to Calculate the Emission Factor for an Electricity System (Annex 12, EB 35). Bonn: United Nations Framework Convention on Climate Change.
UNFCCC. (2011). Methodological Tool to Calculate the Emission Factor for an Electricity System, Updated Version 1.01 (Annex 12, EB 35). Bonn: United Nations Framework Convention on Climate Change.

Derisking Renewable Energy Investment 151
Annex B. References
UN. (2010). Report of the Secretary-General’s High-level Advisory Group on Climate Change Financing. New York, NY: United Nations.
UN. (2011). Sustainable Energy For All. A vision statement by Ban Ki-moon, Secretary General of the United Nations. New York, NY: United Nations.
Vogel, I. (2012). Review of the Use of ‘Theory of Change’ in International Development. London: Department for International Development (DfiD).
von Flotow, P. & Friebe, C. (2011). Framework Conditions for Investments in Wind Parks in Emerging and Developing Markets: The Investors’ Perspective. Oestrich-Winkel: Sustainable Business Institute.
Wang, S.Q., Dulaimi, M.F., Aguria, M.Y. (2004). Risk Management Framework for Construction Projects in Developing Countries. Construction Management and Economics, 22:3, 237-252.
World Bank. (2005). Environmental Fiscal Reform: What Should Be Done and How to Achieve It. Washington D.C.
Wörlen, C. (2011). Meta-evaluation of Climate Mitigation Evaluations. Washington, D.C.: Global Environment Facility Evaluation Office, Climate Change Evaluation Community of Practice.


Contents
Copy goes here
Derisking Renewable Energy Investment
Book Title
b
Nulla ut nisl etly neque lobortis islu
egestas sit amet quis consectetur ac nunc.
FVivamu nisi mi felis, tincidun non blandit
vestibu luma.
United Nations Development Programme Bureau for Development Policy Environment and Energy Group 304 East 45th Street, 9th Floor New York, NY 10017 USA
www.undp.org
March 2013, New York


![Plantilla Libro · Web view[Para que el lector pueda confirmar que comprendió contenido] [Define el término] Duis posuere est ac turpis dapibus ut aliquam odio pellentesque Respuesta:](https://img.dokumen.tips/doc/110x75/5be38f5809d3f219598b7981/plantilla-libro-web-viewpara-que-el-lector-pueda-confirmar-que-comprendio.jpg)


![[XLS] · Web viewAC UARINI AC URUCARA AC URUCURITUBA AC AGRESTE AC AMAPA AC BAILIQUE AC BEIROL AC CALCOENE AC CENTRO AC CUTIAS AC EQUATORIAL AC FERREIRA GOMES AC ITAUBAL AC LARANJAL](https://img.dokumen.tips/doc/110x75/5c5be47c09d3f245368c84d6/xls-web-viewac-uarini-ac-urucara-ac-urucurituba-ac-agreste-ac-amapa-ac-bailique.jpg)