Embed Size (px)
Citation preview
ANALYTICAL METHOD VALIDATIONAND INSTRUMENT PERFORMANCEVERIFICATION
Edited by
CHUNG CHOW CHANEli Lilly Canada, Inc.
HERMAN LAMGlaxoSmithKline Canada, Inc.
Y. C. LEEPatheon YM, Inc.
XUE-MING ZHANGNovex Pharma
A JOHN WILEY & SONS, INC., PUBLICATION
For more, Visit http://www.77169.uni.cc

18 POTENCY METHOD VALIDATION
three concentration levels covering the specified range (e.g., three concentra-tions/three replicates).
For a drug substance, the common method of determining accuracy is toapply the analytical procedure to the drug substance and to quantitate it againsta reference standard of known purity. For the drug product, accuracy is usuallydetermined by application of the analytical procedure to synthetic mixtures ofthe drug product components or placebo dosage form to which known quantitiesof drug substance of known purity have been added. The range for the accuracylimit should be within the linear range. Typical accuracy of the recovery of thedrug substance in the mixture is expected to be about 98 to 102%. Values ofaccuracy of the recovery data beyond this range need to be investigated.
2.4.3 Precision
The precision of an analytical procedure expresses the closeness of agreement(degree of scatter) between a series of measurements obtained from multiplesamples of the same homogeneous sample under prescribed conditions. Preci-sion is usually investigated at three levels: repeatability, intermediate precision,and reproducibility. For simple formulation it is important that precision be deter-mined using authentic homogeneous samples. A justification will be required if ahomogeneous sample is not possible and artificially prepared samples or samplesolutions are used.
Repeatability (Precision). Repeatability is a measure of the precision under thesame operating conditions over a short interval of time. It is sometimes referredto as intraassay precision. Two assaying options are allowed by the ICH forinvestigating repeatability:
1. A minimum of nine determinations covering the specified range for theprocedure (e.g., three concentrations/three replicates as in the accuracyexperiment), or
2. A minimum of six determinations at 100% of the test concentration.
The standard deviation, relative standard deviation (coefficient of variation),and confidence interval should be reported as required by the ICH.
Tables 2.2 and 2.3 are examples of repeatability data. Table 2.2 shows goodrepeatability data. However, note that the data show a slight bias below 100%(all data between 97.5 and 99.1%). This may not be an issue, as the true valueof the samples and the variation of the assay may be between 97.5 and 99.1%.Table 2.3 shows two sets of data for a formulation at two dose strengths that wereperformed using sets of six determinations at 100% test concentration. The dataindicate a definite bias and high variability for the low-strength dose formulation.It may call into question the appropriateness of the low-dose samples for thevalidation experiment.

20 POTENCY METHOD VALIDATION
and method transfer between different laboratories). To validate this character-istic, similar studies need to be performed at other laboratories using the samehomogeneous sample lot and the same experimental design. In the case of methodtransfer between two laboratories, different approaches may be taken to achievethe successful transfer of the procedure. However, the most common approach isthe direct method transfer from the originating laboratory to the receiving labo-ratory. The originating laboratory is defined as the laboratory that has developedand validated the analytical method or a laboratory that has previously been cer-tified to perform the procedure and will participate in the method transfer studies.The receiving laboratory is defined as the laboratory to which the analytical pro-cedure will be transferred and that will participate in the method transfer studies.In direct method transfer it is recommended that a protocol be initiated withdetails of the experiments to be performed and acceptance criteria (in terms ofthe difference between the means of the two laboratories) for passing the methodtransfer. Table 2.4 gives a set of sample data where the average results obtainedbetween two laboratories were within 0.5%.
2.4.4 Robustness
The robustness of an analytical procedure is a measure of its capacity to remainunaffected by small but deliberate variations in the analytical procedure param-eters. The robustness of the analytical procedure provides an indication of itsreliability during normal use. The evaluation of robustness should be consideredduring development of the analytical procedure. If measurements are susceptibleto variations in analytical conditions, the analytical conditions should be suitablycontrolled or a precautionary statement should be included in the procedure. Forexample, if the resolution of a critical pair of peaks was very sensitive to thepercentage of organic composition in the mobile phase, that observation wouldhave been observed during method development and should be stressed in theprocedure. Common variations that are investigated for robustness include filtereffect, stability of analytical solutions, extraction time during sample prepara-tion, pH variations in the mobile-phase composition, variations in mobile-phasecomposition, columns, temperature effect, and flow rate.
Table 2.5 shows examples of sample and standard stability performed on ananalytical procedure. The two sets of data indicate that the sample and standard
Table 2.4. Results from Method Transfer between TwoLaboratories
Runs Average %
Originating 12 100.7laboratory
Receiving 4 100.2laboratory

44 METHOD VALIDATION FOR HPLC ANALYSIS OF RELATED SUBSTANCES
at expiry), one can determine the repeatability by performing three replicatepreparations for each sample. ICH guidelines require a minimum of three sampleswith three different levels of related substance.
Instead of using spike samples (as in accuracy determination), drug productlots that are representative of the commercial products should be used for preci-sion (repeatability, intermediate precision). This is to ensure that the commercialdrug product is used in at least one part of the method validation and that therepeatability results are representative of those that can be expected in the future.
Intermediate Precision. ICH definition: Intermediate precision expresses, withinlaboratories variations, different days, different analysts, different equipment, andso on.
Intermediate precision is to determine method precision in different experimentsusing different analysts and/or instrument setup. Similar to that of repeatability,one should evaluate the results of individual related substances, total relatedsubstances, and the consistency of related substance profiles in all experiments.The percent RSD and confidence level of these results are reported to illustratethe intermediate precision.
Reproducibility. ICH definition: Reproducibility expresses the precision betweenlaboratories (collaborative studies are generally used, for standardization ofmethodology).
This is an optional validation parameter that requires demonstration of laboratory-to-laboratory variation only if multiple laboratories use the same procedure. Thereproducibility data can be obtained during method transfer between laboratories.
3.3.6 Range
ICH definition: The range of an analytical procedure is the interval betweenthe upper and lower concentrations (amounts) of analytes in the sample (includ-ing these concentrations) for which it has been demonstrated that the analyticalprocedure has a suitable level of precision, accuracy, and linearity (Figure 3.13).
Typically, linearity and accuracy determination covers a wide concentration range(e.g., 50% of the ICH reporting limit to 150% of specification). However, theconcentration range for precision will be limited by the availability of sampleof different related substance levels. Therefore, to ensure an appropriate methodvalidation range with respect to precision, it is critical to use samples of lowand high levels of related substance in precision experiments (e.g., fresh andstressed samples).
3.3.7 Robustness
ICH definition: The robustness of an analytical procedure is a measure of itscapacity to remain unaffected by small but deliberate variations in method param-eters and provides an indication of its reliability during normal use.

76 DEVELOPMENT AND VALIDATION OF AUTOMATED METHODS
Table 5.1. Testing for Repeatability
Method Testing Acceptance Criteria
Assay Six sample determinations atthe nominal concentration.
The variability of the automatedmethod should not be more than2.0% (RSD) or less than themanual method.
Degradation andimpurity
Six determinations of a samplespiked at specification limitwith available impurities.
The variability of the individualimpurities is not more than15.0% (RSD), and totalimpurities is not more than10.0% (RSD) or less than theexisting manual method,whichever is greater.
Content uniformity Ten sample determinations atthe nominal concentration.
The variability of the automatedmethod should be not more than6.0% (RSD).
Dissolution Six sample determinations atthe nominal concentration.
The variability of the automatedmethod should be not more than6.0% (RSD) at the Q point.
should be considered at three levels: repeatability, intermediate precision, andreproducibility.
Repeatability. Repeatability expresses the precision under the same operatingconditions over a short interval of time. The recommended testing for automatedcontent uniformity, assays, degradation and impurity methods, and dissolutionmethods are listed in Table 5.1.
Intermediate Precision. Intermediate precision expresses within-laboratory vari-ation and is generally performed on different days using different analysts, equip-ment, and sample preparations. This test may not be applicable if the laboratoryhas only one workstation. Additionally, this test may not be appropriate for auto-mated workstations that are operating under the same environment and controlswithin a laboratory. This assumption is made on the basis that the automatedworkstations are identical (i.e., same configuration, same software and hardware)and that they have been suitably qualified and maintained to a consistent standardand operate under a similar climatic environment. The influence of the analystis reduced to the preparation of solvents, and this should be covered by therobustness studies.
Reproducibility. Reproducibility expresses the precision between laboratories andwould usually involve technical transfer of methods to laboratories in differentgeographical locations. The recommended testing for content uniformity, assays,degradation and impurity methods, and dissolution methods are listed in Table 5.2.

8BIOANALYTICAL METHODVALIDATION
FABIO GAROFOLO, PH.D.Vicuron Pharmaceuticals, Inc.
8.1 INTRODUCTION
8.1.1 Definition of Bioanalytical Method Validation
Bioanalytical method validation is a procedure employed to demonstrate that ananalytical method used for quantification of analytes in a biological matrix isreliable and reproducible to achieve its purpose: to quantify the analyte with adegree of accuracy and precision appropriate to the task. Validation data, throughspecific laboratory investigations, demonstrate that the performance of a methodis suitable and reliable for the analytical applications intended. The quantitativeapproach used in bioanalytical methods involves the use of a standard curvemethod with internal standard. In this approach the analyte concentration canbe assigned by referring the response to other samples, called calibrators orcalibration standards. In addition to the samples of unknown concentration, thebioanalytical set includes the calibration standards, and samples containing noanalyte, called blanks, to assure that there are no interferences in the matrix.Accuracy and precision of the method are calculated using the back-calculatedconcentrations of samples of known composition called quality control samples(QCs). The calibrator standards and quality control samples should be preparedin the same matrix as the actual samples.
All these checks should be performed to guarantee the reliability of selec-tive and sensitive bioanalytical method before applying them for the quantitative
Analytical Method Validation and Instrument Performance Verification, Edited by Chung ChowChan, Herman Lam, Y. C. Lee, and Xue-Ming ZhangISBN 0-471-25953-5 Copyright 2004 John Wiley & Sons, Inc.
105

CURRENT VALIDATION PRACTICE 107
developed. This technical advancement leads to the use of commercial hyphenatedmass spectrometric techniques and automation as preferred instrumentation forbioanalytical methods. LC-MS/MS assays replaced the conventional LC and GC,and the use of multiwell plates, automated robotic sample processing (Multiprobe,Tomtec), and online extraction techniques (Prospeck, Turbulent Flow Chromatog-raphy) took over manual sample preparation procedures.
The worldwide use of these new powerful bioanalytical techniques, charac-terized by more rapid throughput and increase in sensitivity [12,16] requireda review of the original 1990 Washington report. The Guidelines of the 1990Conference were initially reviewed during a meeting in June 1994 in Munich,Germany [2]. This meeting focused primarily on the critical and statistical eval-uation of the acceptance criteria defined in the guidelines and on formulatingrecommendations to improve the guidelines.
A conference titled “Bioanalytical Methods Validation: A Revisit with a Decadeof Progress” was held on January 2000, again in Washington, DC. The objectiveof this conference was to reach a consensus on what should be required in bio-analytical methods validation, and which procedures should be used to performthe validation [3]. The FDA 2001 Guidance for Industry on Bioanalytical MethodValidation [4] is based on the final report of both the 1990 and 2000 Washingtonconferences. At the beginning of this document the FDA states very clearly that itsguidance for bioanalytical method validation represents its current thinking on thistopic and that an alternative approach may be used if such an approach satisfies therequirements of applicable statutes and regulations [4]. This statement allows bio-analytical laboratories to adjust or modify the FDA recommendations, dependingon the specific type of bioanalytical method used.
Compliance with the FDA guidance can be considered a minimum require-ment to test the performance of a bioanalytical method. Due to the fact that thevalidation process should simulate closely sample analysis, the real and decisivefinal test for a “validated” method will always be the sample analysis itself. It ispossible that even if it passes all the validation criteria, a bioanalytical methodmay not be reliable for the analysis of actual samples. This undesirable situationcould happen when actual samples (in vivo samples) contain new interferencesnot present in the spiked samples (in vitro samples) due to a metabolic pro-cess and/or other biotransformations. For this reason, bioanalytical laboratoriescould decide to use more stringent criteria and procedures and/or use actualsample during the method development to further guarantee the validity of thevalidated methods.
In the following section we summarize the current general recommendationsfor bioanalytical method validation practices according to the FDA guidelines,with other alternative approaches to be discussed later.
8.2 CURRENT VALIDATION PRACTICE
The validation procedures for bioanalytical methods are in continuous evolutionsince bioanalytical methods are constantly undergoing changes in improvements,
108 BIOANALYTICAL METHOD VALIDATION
and in many instances they are at the cutting edge of the technology. An overviewof the FDA Guidance for Industry, Bioanalytical Methods Validation, May 2001[4], is reported here as a reference for current validation practice.
8.2.1 Definitions
As the first step in understanding the procedure used for the validation of bio-analytical methods, it is important to have clearly in mind definitions of theanalytical terms used.
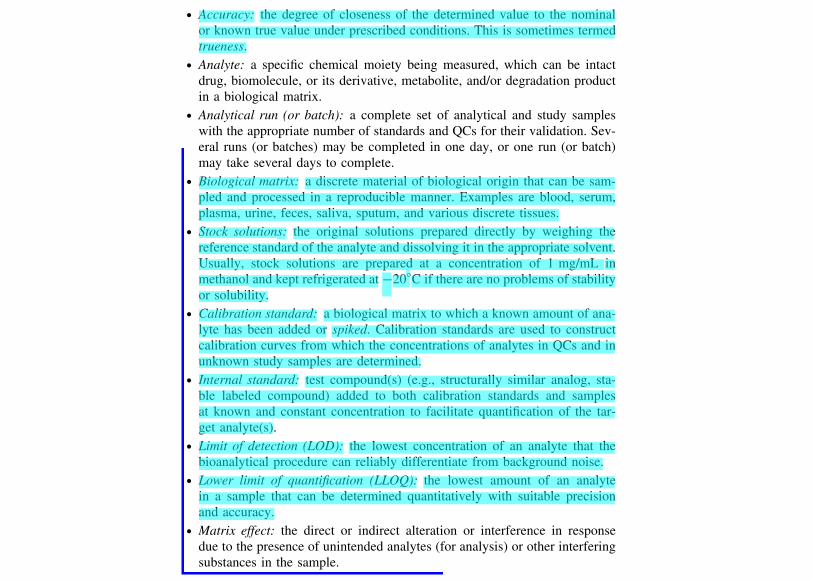
ž Accuracy: the degree of closeness of the determined value to the nominalor known true value under prescribed conditions. This is sometimes termedtrueness.
ž Analyte: a specific chemical moiety being measured, which can be intactdrug, biomolecule, or its derivative, metabolite, and/or degradation productin a biological matrix.
ž Analytical run (or batch): a complete set of analytical and study sampleswith the appropriate number of standards and QCs for their validation. Sev-eral runs (or batches) may be completed in one day, or one run (or batch)may take several days to complete.
ž Biological matrix: a discrete material of biological origin that can be sam-pled and processed in a reproducible manner. Examples are blood, serum,plasma, urine, feces, saliva, sputum, and various discrete tissues.
ž Stock solutions: the original solutions prepared directly by weighing thereference standard of the analyte and dissolving it in the appropriate solvent.Usually, stock solutions are prepared at a concentration of 1 mg/mL inmethanol and kept refrigerated at −20◦C if there are no problems of stabilityor solubility.
ž Calibration standard: a biological matrix to which a known amount of ana-lyte has been added or spiked. Calibration standards are used to constructcalibration curves from which the concentrations of analytes in QCs and inunknown study samples are determined.
ž Internal standard: test compound(s) (e.g., structurally similar analog, sta-ble labeled compound) added to both calibration standards and samplesat known and constant concentration to facilitate quantification of the tar-get analyte(s).
ž Limit of detection (LOD): the lowest concentration of an analyte that thebioanalytical procedure can reliably differentiate from background noise.
ž Lower limit of quantification (LLOQ): the lowest amount of an analytein a sample that can be determined quantitatively with suitable precisionand accuracy.
ž Matrix effect: the direct or indirect alteration or interference in responsedue to the presence of unintended analytes (for analysis) or other interferingsubstances in the sample.
CURRENT VALIDATION PRACTICE 109
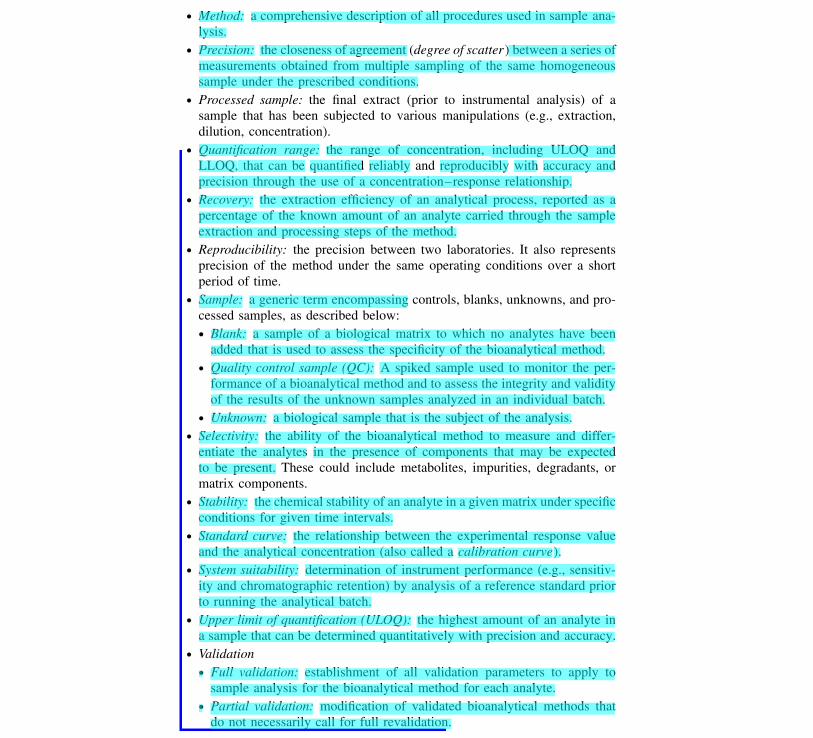
ž Method: a comprehensive description of all procedures used in sample ana-lysis.
ž Precision: the closeness of agreement (degree of scatter) between a series ofmeasurements obtained from multiple sampling of the same homogeneoussample under the prescribed conditions.
ž Processed sample: the final extract (prior to instrumental analysis) of asample that has been subjected to various manipulations (e.g., extraction,dilution, concentration).
ž Quantification range: the range of concentration, including ULOQ andLLOQ, that can be quantified reliably and reproducibly with accuracy andprecision through the use of a concentration–response relationship.
ž Recovery: the extraction efficiency of an analytical process, reported as apercentage of the known amount of an analyte carried through the sampleextraction and processing steps of the method.
ž Reproducibility: the precision between two laboratories. It also representsprecision of the method under the same operating conditions over a shortperiod of time.
ž Sample: a generic term encompassing controls, blanks, unknowns, and pro-cessed samples, as described below:ž Blank: a sample of a biological matrix to which no analytes have been
added that is used to assess the specificity of the bioanalytical method.ž Quality control sample (QC): A spiked sample used to monitor the per-
formance of a bioanalytical method and to assess the integrity and validityof the results of the unknown samples analyzed in an individual batch.
ž Unknown: a biological sample that is the subject of the analysis.ž Selectivity: the ability of the bioanalytical method to measure and differ-
entiate the analytes in the presence of components that may be expectedto be present. These could include metabolites, impurities, degradants, ormatrix components.
ž Stability: the chemical stability of an analyte in a given matrix under specificconditions for given time intervals.
ž Standard curve: the relationship between the experimental response valueand the analytical concentration (also called a calibration curve).
ž System suitability: determination of instrument performance (e.g., sensitiv-ity and chromatographic retention) by analysis of a reference standard priorto running the analytical batch.
ž Upper limit of quantification (ULOQ): the highest amount of an analyte ina sample that can be determined quantitatively with precision and accuracy.
ž Validationž Full validation: establishment of all validation parameters to apply to
sample analysis for the bioanalytical method for each analyte.ž Partial validation: modification of validated bioanalytical methods that
do not necessarily call for full revalidation.

110 BIOANALYTICAL METHOD VALIDATION
ž Cross-validation: comparison of validation parameters of two bioanalyt-ical methods.
ž Working solutions: solutions prepared from the stock solution through dilu-tion in the appropriate solvent at the concentration requested for spiking thebiological matrix.
8.2.2 Selectivity
For selectivity, there should be evidence that the substance being quantified isthe intended analyte. Therefore, analyses of blank samples of the appropriatebiological matrix (plasma, urine, or other matrix) should be obtained from at leastsix sources. Each blank sample should be tested for interference, and selectivityshould be ensured at the lower limit of quantification (LLOQ).
Potential interfering substances in a biological matrix include endogenousmatrix components, metabolites, decomposition products, and in the actual study,concomitant medication. Whenever possible, the same biological matrix as thematrix in the intended samples should be used for validation purposes. For tis-sues of limited availability, such as bone marrow, physiologically appropriateproxy matrices can be substituted. Method selectivity should be evaluated duringmethod development and method validation and can continue during the analysisof actual study samples.
As with chromatographic methods, microbiological and ligand-binding assaysshould be shown to be selective for the analyte. The following recommendationsfor dealing with two selectivity issues should be considered:
1. Specific interference from substances physiochemically similar to theanalyte:a. Cross-reactivity of metabolites, concomitant medications, or endogenous
compounds should be evaluated individually and in combination withthe analyte of interest.
b. Whenever possible, the immunoassay should be compared with a val-idated reference method (such as LC-MS) using incurred samples andpredetermined criteria for agreement of accuracy of immunoassay andreference method.
c. The dilutional linearity to the reference standard should be assessedusing study (incurred) samples.
d. Selectivity may be improved for some analytes by incorporation of sep-aration steps prior to immunoassay.
2. Nonspecific matrix effects:a. The standard curve in biological fluids should be compared with standard
in buffer to detect matrix effects.b. Parallelism of diluted study samples should be evaluated with diluted
standards to detect matrix effects.c. Nonspecific binding should be determined.

CURRENT VALIDATION PRACTICE 113
In consideration of high throughput analyses, including but not limited tomultiplexing, multicolumn, and parallel systems, sufficient QC samples should beused to ensure control of the assay. The number of QC samples to ensure propercontrol of the assay should be determined based on the run size. The placementof QC samples should be considered judiciously in the run. At a minimum,three concentrations representing the entire range of the standard curve shouldbe studied: one within three times the lower limit of quantification (LLOQ)(low QC sample), one near the center (middle QC), and one near the upperboundary of the standard curve (high QC). Reported method validation data andthe determination of accuracy and precision should include all outliers; however,calculations of accuracy and precision, excluding values that are statisticallydetermined as outliers, can also be reported.
8.2.6 Dilutions
The ability to dilute samples originally above the upper limit of the standard curveshould be demonstrated by accuracy and precision parameters in the validation.
8.2.7 Recovery
Recovery of the analyte need not be 100%, but the extent of recovery of ananalyte and of the internal standard should be consistent, precise, and repro-ducible. Recovery experiments should be performed by comparing the analyticalresults for extracted samples at three concentrations (low, medium, and high)with unextracted standards that represent 100% recovery.
It may be important to consider the variability of the matrix due to thephysiological nature of the sample. In the case of LC-M/MS-based procedures,appropriate steps should be taken to ensure the lack of matrix effects throughoutapplication of the method, especially if the nature of the matrix changes from thematrix used during method validation. For Microbiological and immunoassay, ifseparation is used prior to assay for study samples but not for standards, it isimportant to establish recovery and use it in determining results. In this case,possible approaches to assess efficiency and reproducibility of recovery are:
ž The use of radiolabeled tracer analyte (quantity too small to affect the assay)ž The advance establishment of reproducible recoveryž The use of an internal standard that is not recognized by the antibody but
can be measured by another technique
8.2.8 Stability
The stability of an analyte in a particular matrix and container system is relevantonly to that matrix and container system and should not be extrapolated to othermatrices and container systems. Stability procedures should evaluate the stabilityof the analytes during sample collection and handling, after long-term (frozen at

114 BIOANALYTICAL METHOD VALIDATION
the intended storage temperature) and short-term (benchtop, room-temperature)storage, and after going through freeze–thaw cycles and the analytical process.Conditions used in stability experiments should reflect situations likely to beencountered during actual sample handling and analysis. The procedure shouldinclude an evaluation of analyte stability in stock solution. For compounds withpotentially labile metabolites, the stability of analyte in matrix from dosed sub-jects (or species) should be confirmed. All stability determinations should use aset of samples prepared from a freshly made stock solution of the analyte in theappropriate analyte-free, interference-free biological matrix.
Freeze and Thaw Stability. Analyte stability should be determined after threefreeze–thaw cycles. At least three aliquots at each of the low and high concen-trations should be stored at the intended storage temperature for 24 h and thawedunassisted at room temperature. When thawed completely, the samples shouldbe refrozen for 12 to 24 h under the same conditions. The freeze–thaw cycleshould be repeated twice more, then analyzed on the third cycle. If an analyteis unstable at the intended storage temperature, the stability sample should befrozen at −70◦C during the three freeze–thaw cycles.
Short-Term Temperature Stability. Three aliquots of each of the low and highconcentrations should be thawed at room temperature and kept at this temperaturefrom 4 to 24 h (based on the expected duration that samples will be maintainedat room temperature in the intended study) and analyzed.
Long-Term Stability. The storage time in a long-term stability evaluation shouldexceed the time between the date of first sample collection and the date of lastsample analysis. Long-term stability should be determined by storing at least threealiquots of each of the low and high concentrations under the same conditions asthe study samples. The volume of samples should be sufficient for analysis onthree separate occasions. The concentrations of all the stability samples shouldbe compared to the mean of back-calculated values for the standards at theappropriate concentrations from the first day of long-term stability testing.
Stock Solution Stability. The stability of stock solutions of drug and the inter-nal standard should be evaluated at room temperature for at least 6 h. If thestock solutions are refrigerated or frozen for the relevant period, the stabilityshould be documented. After completion of the desired storage time, the stabil-ity should be tested by comparing the instrument response with that of freshlyprepared solutions.
Postpreparative Stability. The stability of processed samples, including the resi-dent time in the autosampler, should be determined. The stability of the drug andthe internal standard should be assessed over the anticipated run time for the batchsize in validation samples by determining concentrations on the basis of originalcalibration standards. Reinjection reproducibility should be evaluated to deter-mine if an analytical run could be reanalyzed in the case of instrument failure.

116 BIOANALYTICAL METHOD VALIDATION
to establish interlaboratory reliability. All modifications should be assessed todetermine the degree of validation recommended. Immunoassay reoptimization orvalidation may be important when there are changes in key reagents.
8.2.10 Documentation
A specific, detailed description of the bioanalytical method should be written.This can be in the form of a protocol, study plan, report, and/or standard operat-ing procedure (SOP). All experiments used to make claims or draw conclusionsabout the validity of the method should be presented in a report (method valida-tion report).
8.3 COMMON PROBLEMS AND SOLUTIONS
The 2000 Washington Conference on Bioanalytical Method Validation [3] revie-wed the progress, impact, and advances made during the last decade of bioanalyti-cal methods validation since the first Washington conference in 1990. Hyphenatedmass spectrometric–based assays, ligand-based assay, and high-throughput sys-tems were discussed in depth. However, there are still some controversies onsome scientific approaches and criteria used during the validation process. Someof the most interesting issues discussed during the last 10 years are discussed inthe following paragraphs.
8.3.1 Definitions
The glossaries in the 1990 and 2000 Washington conference final reports [1,3]define most of the analytical terms used in the validation of a method. How-ever, internationally accepted definitions such as those by ISO or IUPAC alreadyexist and have been elaborated carefully over many years [2,6]. The definitionsreported in the 1990 and 2000 Washington conference final reports sometimeagree only partially with the ISO and IUPAC. Following are some examplesfor comparison.
Limit of Detection
2000 Conference: the lowest concentration of an analyte that a bioanalyticalprocedure can reliably differentiate from background noise.
1990 Conference: the lowest concentration of an analyte that an analytical pro-cess can reliably differentiate from background levels.
United States Pharmacopoeia: “thus, limit tests merely substantiate that the ana-lyte concentration is above or below a certain level. . ..”
IUPAC: the concentration giving a signal three times the standard deviation ofthe blank.

COMMON PROBLEMS AND SOLUTIONS 117
Lower Limit of Quantification
2000 Conference: the lowest amount of an analyte in a sample that can bedetermined quantitatively with suitable precision and accuracy.
Comment:
ž This definition is connected with the definition of sensitivity of the methodas the concentration of the lowest standard with a coefficient of variance(CV) ≤20%.
1990 Conference: the lowest concentration of an analyte that can be measuredwith a stated level of confidence.
IUPAC: the concentration that gives rise to a signal 10 times the standard devi-ation of the blank
Upper Limit of Quantification
2000 Conference: the highest amount of an analyte in a sample that can bedetermined quantitatively with precision and accuracy.
Comment:
ž From a practical point of view this definition can be interpreted as beingimposed by the linear boundary of the calibration curve (quadratic behav-ior) due to saturation of the detector or/and ion suppression effect and/orcontamination for low-level samples (carryover) (see Section 8.3.7).
Accuracy
2000 Conference: the degree of closeness of the determined value to the nomi-nal or known true value under prescribed conditions. This is sometimes termedtrueness.
Comments:
ž This is expressed as percent relative error (% RE).ž RE may be positive, negative, or zero.ž % RE = [(mean value/theoretical value) − 1] × 100.ž In general, the measured concentration of sample of known composition
compared to the theoretical concentration over an appropriate range of con-centration is considered an indication of accuracy.
ž Intraassay accuracy is the RE of the mean of the replicate analysis of avalidation sample during a single validation batch.
ž Interassay accuracy is the RE of the overall mean of the replicate analysesof a validation sample for all validation batches.
1990 Conference: the closeness of the determined value to the true value. Gen-erally, recovery of added analyte over an appropriate range of concentrations is

118 BIOANALYTICAL METHOD VALIDATION
taken as an indication of accuracy. Whenever possible, the concentration rangechosen should bracket the concentration of interest.
ISO: the closeness of agreement between the test result and the accepted refer-ence value.
Comment:
ž The definition of accuracy reported in the 1990 Washington conference glos-sary was partially reformulated in the 2000 conference. The first sentenceof both definitions is close to the ISO definition. Some disagreements wereraised [2] on the second sentence of the 1990 definition during the 1994meeting in Germany: “It is correct that recovery can be taken as an indica-tion that a method is accurate but it is no more than an indication. Inclusionof recovery in a definition of accuracy may lead some analysis to concludethat adequate recovery always means that a method is accurate and that, ofcourse, is not true. Suppose that a method is not selective and that someinterference is also measured. The result will then be a certain (approx-imately the same) amount too high in both the unspiked and the spikedsample. However, the difference between the two results from which therecovery is calculated, will be correct, leading to the false conclusion thatthe method is accurate.”
8.3.2 Selectivity/Specificity
Selectivity is the ability of the bioanalytical method to measure and differen-tiate the analytes in the presence of components that may be expected to bepresent. Specificity is the ability to assess unequivocally the analyte in the pres-ence of components that may be expected to be present. In general, analyticalmethods are selective, and only in same cases also specific (e.g., an LC-MS/MSbioanalytical method is highly selective but not always also specific because itcould be possible to find in the complex biological matrix an interference withthe same retention time, molecular weight, and main fragment of the analyteof interest). Even if the 2000 Washington conference focuses only on selectiv-ity, it is up to bioanalytical laboratories to differentiate in their documentationbetween selectivity and specificity or consider them equivalent and use theminterchangeably.
A general approach to prove the selectivity (specificity) of the method is toverify that:
ž The response of interfering peaks at the retention time of the analyte isless than 20% of the response of an LLOQ standard, or the response at theLLOQ concentration is at least five times greater than any interference inblanks at the retention time of the analyte.
ž The responses of interfering peaks at the retention time of the internalstandard are ≤5% of the response of the concentration of the internalstandard used in the studies.
An analysis of the SFSTP guide on validation ofchromatographic bioanalytical methods: progresses and
limitations
B. Boulanger a, P. Chiap b,*, W. Dewe a, J. Crommen b, Ph. Hubert b
a Lilly Development Centre, Statistical and Mathematical Sciences, rue Granbompre, 11, B-1348 Mont-Saint-Guibert, Belgiumb Department of Analytical Pharmaceutical Chemistry, Institute of Pharmacy, University of Liege, CHU, B36, B-4000 Liege 1, Belgium
Received 22 May 2002; received in revised form 23 September 2002; accepted 26 September 2002
Abstract
The Societe Francaise des Sciences et Techniques Pharmaceutiques (SFSTP) published in 1997 a guide on the
validation of chromatographic bio-analytical methods, which introduces new concepts in three different areas: stages of
the validation, test of acceptability of a method and design of experiments to perform. In ‘stages of validation’, the
SFSTP guide requires two phases to validate a method. The first phase, called ‘prevalidation’, is intended to (1) identify
the model to use for the calibration curve; (2) evaluate the limits of quantitation; and (3) provide good estimates of the
precision and bias of the method before designing the ‘validation’ phase per se. In the ‘test of acceptability’, the use of
the interval hypotheses is envisaged by the SFSTP guide, not on the parameters of bias and precision, but on individual
results by mixing mean bias and intermediate precision in a single test. The SFSTP guide also avoids the use of
Satterthwaite’s df for testing the acceptability. The reasons for those choices are discussed extensively. In ‘design of
experiments’, much effort has been devoted to improving the quality of results by optimally designing and sizing the
experiments to perform in validation. The rationale for using near D-optimal designs for the calibration curve is
demonstrated and sample sizes are proposed to correctly size the validation experiments.
# 2003 Elsevier Science B.V. All rights reserved.
Keywords: Bioanalysis; Method validation; Statistics
1. Introduction
Before using an analytical method for quantita-
tive determinations of drugs and their metabolites,
an applicant laboratory must first demonstrate
that the envisaged method fulfils a number of
performance criteria. Since the publications of the
‘Washington Conference’ [1] and the ICH Guide-
lines on Validation of Analytical Methods Q2A
and Q2B [2,3], which list the performance criteria
to reach from a regulatory point of view, many
laboratories have started to redesign their pro-
cesses by involving analysts and statisticians, in
order to define strategies that will allow the
fulfilment of the regulatory requirements, while* Corresponding author.
E-mail address: [email protected] (P. Chiap).
Journal of Pharmaceutical and Biomedical Analysis
32 (2003) 753�/765 www.elsevier.com/locate/jpba
0731-7085/03/$ - see front matter # 2003 Elsevier Science B.V. All rights reserved.
doi:10.1016/S0731-7085(03)00182-1
being practicable and scientifically consistent.
Some laboratories have probably been lucky in
finding an easy way to reach the goals, most have
certainly experienced, as we did, some frustrations
while trying to cope with contradictory, sometimes
scientifically irrelevant, requirements and defini-
tions. As an indication of this difficulty to define
reasonable practicable strategies to satisfy global
regulatory requirements, laboratory constraints
and scientific consistency, no guide has been
published that entirely addresses that issue. For
this reason, the ‘Societe Francaise des Sciences et
Techniques Pharmaceutiques (SFSTP)’ created in
1995 a Commission involving analysts and statis-
ticians from the industry and the regulatory
agencies with the objective of publishing a guide
[4] that could be used by laboratories. The
proposed guide has been validated in several real
cases before being published and practical applica-
tions are now available [5,6] that provide the
analyst, on the one hand, with a better under-
standing on the way to proceed and on the other
hand, real data for qualifying his own computa-
tions that he could perform using a commercial
spreadsheet.The SFSTP guide does not constitute a final end
point, but on the contrary, was envisaged as a
large basis to pave the way for developments that
are expected from readers and analysts that will
practice the guide. On one hand, since the pub-
lication of the guide in 1997, members of the
SFSTP Commission already have some modifica-
tions or warnings to propose in order to initiate a
continuous process of improvements. On the other
hand, many choices and decisions that have been
taken in this guide constitute disruptive progresses
compared to traditional ways to proceed in this
area. Those choices must be clearly justified and
understood because the guide is consistent as a
whole and cannot be applied part by part. Finally,
the SFSTP guide [4,7] does not cover all the topics
or performance criteria imposed by the ICH, such
as stability and robustness.
The objectives of the present article are precisely
to identify and explain the progress permitted by
the SFSTP guide, point out some of the limitations
and suggest ways to overcome them.
2. Stages of validation
As pointed out by Smith and Sittampalam [8],
the validation process involves four stages that are
called by the authors ‘Concept’, ‘Performance’,
‘Operational’ and possibly ‘Cross Validation’.
Behind the new words proposed, it is of initial
importance to understand that the validation is a
permanent process that starts from the verybeginning of the life of the method until its
retirement. In the Concept or development phase,
the analyst must identify and evaluate the impact
of potential sources of variability that could later
alter the global quality of the results. The objective
today in development is no more to find a method
that ‘works’, nor to elaborate smartly an analytical
method whose quality will have to be evaluated ina later stage; the objective becomes to build results
of quality by means of an analytical method. In
other words, questions about the bias, precision
and robustness must conduct the actions of the
analyst developing a new method and no more
focus its efforts only on some performance criteria,
such as minimal resolution or maximal retention
(migration) time in the case of chromatographic orelectrophoretic methods. The ability of an analy-
tical method to provide individual determinations
of high quality, i.e. measurements close from the
true content of a sample, should be the very
endpoint every developer has to focus on.
The SFSTP guide unfortunately does not ex-
plicitly put a great emphasis on the development
phase and might give the impression that the‘validation’ is only seen as a sequence of experi-
ments and calculations to perform to successfully
reach an endpoint that is the documentation step.
The SFSTP guide indirectly addresses the issue of
the development since, as clearly stated, prelimin-
ary knowledge or a priori on the performance of
the method must be available before properly
starting the characterisation stage. This formalvalidation stage must be seen as a set of experi-
ments that will confirm the regulatory agencies
and the analyst himself that the method can indeed
be used for its intended purpose. The validation
phase can absolutely not be envisaged as a mean to
estimate the performance of the method. If noth-
ing or very little is known about the bias, the
B. Boulanger et al. / J. Pharm. Biomed. Anal. 32 (2003) 753�/765754

E109
The AAPS Journal 2007; 9 (1) Article 11 (http://www.aapsj.org).
A BSTRACT Method validation is a process that demonstrates that a method will successfully meet or exceed the minimum stan-dards recommended in the Food and Drug Administration (FDA) guidance for accuracy, precision, selectivity, sensi-tivity, reproducibility, and stability. This article discusses the validation of bioanalytical methods for small molecules with emphasis on chromatographic techniques. We present current thinking on validation requirements as described in the current FDA Guidance and subsequent 2006 Bioanalyti-cal Methods Validation Workshop white paper.
K EYWORDS: bioanalytical , validation , precision , accuracy , sensitivity , selectivity , reproducibility
INTRODUCTION Bioanalytical methods are used for the quantitation of drugs and their metabolites in biological matrices. In today ’ s drug development environment, highly sensitive and selective methods are required to quantify drugs in matrices such as blood, plasma, serum, or urine. Chromatographic methods (high-performance liquid chromatography [HPLC] or gas chromatography [GC]) have been widely used for the bioanalysis of small molecules, with liquid chromatography coupled to triple quadrupole mass spectrometry (LC/MS/MS) being the single most commonly used technology. After developing a method with desired attributes, the method is validated to establish that it will continue to provide accurate, precise, and reproducible data during study-sample analysis. Method validation is a process that demonstrates that the method will successfully meet or exceed the minimum standards recommended in the Food and Drug Administration (FDA) Guidance 1 for accuracy, precision, selectivity, sensitivity, reproducibility, and stability. The validation is performed using a control matrix spiked with the compounds to be quantifi ed. This article discusses the validation of bioanalytical methods for small molecules with emphasis on chromatographic techniques. We present
current thinking on validation requirements as described in the current FDA Guidance 1 and subsequent 2006 Bioana-lytical Methods Validation Workshop white paper. 2
VALIDATION PARAMETERS Bioanalytical methods can be developed in the laboratory conducting the validation or obtained from another labora-tory or literature. The results from a method validation can be no better than the quality of the method that was devel-oped. Thus, before beginning the method validation, it is important that the method is set up and tested in the labora-tory. For methods obtained externally, modifi cations may be necessary to achieve the desired performance of the method relative to how it was developed originally. This process will help ensure that when validation begins, chances for its successful completion (and more important, successful sample analysis) are high. During method validation, values for validation parameters are obtained. The essential param-eters required according to the FDA Guidance 1 are selectiv-ity, sensitivity, accuracy, precision, reproducibility, and stability. While obtaining these parameters, other parameters are also determined during validation (eg, extraction effi -ciency, calibration range and response function [linear or nonlinear], positional differences within an analytical run, and dilution integrity for analyzing above limit of quantita-tion [ALQ] samples). These validation parameters are de-scribed below in detail and are summarized in Table 1 .
Selectivity Selectivity or specifi city should be assessed to show that the intended analytes are measured and that their quantitation is not affected by the presence of the biological matrix, known metabolites, degradation products, or co-administered drugs. Specifi city should be determined for each analyte in the assay. Selectivity determination depends on the type of the assay as discussed below. In assays wherein the intrinsic selectivity is low (eg, HPLC or GC with detection other than MS), it is necessary to confi rm, using blank matrices from at least 6 independent sources, that the biological matrix will not interfere signifi cantly with the assay. The same matrix as in samples should be used when-ever possible. A proxy matrix is allowed if the sample matrix
Corresponding Author: Surendra Bansal, 340 Kingsland Street, Nutley, NJ 07110 . Tel: (973) 235-5919 ; Fax: (973) 235-7010 ; E-mail: [email protected]
Themed Issue: Bioanalytical Method Validation and Implementation: Best Practices for Chromatographic and Ligand Binding AssaysGuest Editors - Mario L. Rocci Jr., Vinod P. Shah, Mark J. Rose, Jeffrey M. Sailstad
Key Elements of Bioanalytical Method Validation for Small Molecules Submitted: February 7 , 2007 ; Accepted: March 8 , 2007; Published: March 30, 2007
Surendra Bansal 1 and Anthony DeStefano 2 1 Hoffman-LaRoche Inc, Nutley, NJ 2 Procter & Gamble Pharmaceuticals, Mason, OH
E112
The AAPS Journal 2007; 9 (1) Article 11 (http://www.aapsj.org).
of precision and accuracy samples is analyzed on a different column or instrument on one of the days of validation. This method is a good practice but is not required for all validations.
• Reproducibility using incurred samples: Reproducibil-ity using incurred samples should be shown if samples are available. This test can be postponed and per-formed during sample analysis, where it is more important to prove the reproducibility of incurred samples analysis.
Stability Several types of stability should be evaluated during the validation. Suggested experiments to determine stability are provided below. Alternate experiments that evaluate equiv-alent aspects of stability may be performed. • Stock solution stability: The stability of the stock
solutions of drug and internal standards should be evaluated at room temperature for at least 6 hours. If the stock solutions are kept refrigerated or frozen over a period of time, the stability over that period should be evaluated by comparing the response of the aged stock solution to that of a freshly prepared stock solution. Stock solution stability should be performed at one concentration in at least duplicate.
• Postpreparative (extracted samples/autosampler tray) stability: This stability is determined for ~48 to 96 hours to cover the anticipated run time for the analyti-cal batch and to allow for delayed injection owing to unforeseen circumstances (eg, an instrument malfunc-tion or the need to store samples over a weekend prior to analysis). The extracted QC samples (ready to inject) are kept at autosampler temperature for the established time and analyzed with fresh standards.
• Benchtop stability: Replicate (eg, triplicate) QC samples in matrix at a minimum of 2 concentrations are analyzed after keeping them at ambient tempera-ture for 4 to 24 hours to cover at least the duration of time it takes to extract the samples. The observed sample concentrations are compared with their nomi-nal values. This experiment can be combined with that for the extracted samples/autosampler tray stability above to demonstrate overall process stability, if desired.
• Freeze-thaw stability: QC samples in matrix at a minimum of 2 concentrations (eg, low and high QC concentrations) are frozen overnight, at normal storage temperature (eg, − 20°C or − 70°C) and thawed unas-sisted at room temperature. When completely thawed, the samples are frozen again at the same temperature for 12 to 24 hours and thawed. This freeze-thaw cycle
is repeated 2 more times. After the third cycle, the samples are analyzed. The observed concentrations are compared with their nominal values. If an unac-ceptable level of degradation is observed, cycles 1 and 2 are repeated to determine where the instability occurs. The number of freeze-thaw cycles can be extended if needed.
• Freezer storage stability: During validation, stability at the nominal freezer storage temperature should be determined to the extent possible. However, longer term stability should be determined and appropriately documented, as discussed below.
• Postvalidation long-term stability: After validation is complete, long-term stability of the analyte(s) in the matrix should be determined by storing a suffi cient number of QC samples at the required long-term storage temperature and analyzing them in at least triplicate at a minimum of 2 QC concentrations (eg, low and high QC concentrations). The long-term stability should be determined at several time points (eg, 1, 3, 6, 9, and 12 months) depending on the length of stability required. If possible, it is recommended that some stored in vivo samples are analyzed to assess the long-term stability of incurred samples at storage temperature. Upon obtaining the long-term stability data, the validation report can be amended to include the stability results or a separate report can be written to describe the long-term stability.
Extraction Effi ciency (Recovery) The extraction effi ciency is a ratio of the detector response of an analyte from an extracted sample to the detector response of the analyte from an unextracted sample contain-ing the same amount of analyte that was added to the extracted sample. The unextracted sample can be made up in solvents and is not taken through the extraction process. Alternatively, blank samples can be extracted and the extracts fortifi ed with the analytes after extraction. These preparations represent 100% recovery during extraction. Extraction effi ciency need not be very high, but it should be consistent, precise, and reproducible. Extraction effi ciency can also be determined for the IS, and the ratio of the extrac-tion effi ciencies of the analyte and IS provides an IS- normalized extraction effi ciency.
Calibration Range and Response Function The relationship between the detector response and concen-tration should be demonstrated to be well defi ned and repro-ducible. A calibration curve should consist of a blank sample (matrix sample processed without the IS), a zero standard (matrix sample processed with internal standard), and 6 to 8
E113
The AAPS Journal 2007; 9 (1) Article 11 (http://www.aapsj.org).
nonzero standards. The number of standards can be increased for a complex curve or a curve covering a very large range. The simplest relationship that provides acceptable back- calculated concentrations for the standards should be used to fi t the calibration curve. If a weighting factor is used, it should be defi ned during validation. The concentrations of calibration standards are back-calculated, and the residuals (difference between the back-calculated concentration of the calibration standard and its nominal concentration) determined. The residuals should be no more than ± 15% at all concentrations except at the LLOQ level, where they can be up to ± 20% of the nominal value. To accept an analytical run, at least 75% of the calibration standards should meet the stated acceptance criteria. Calibration standards not meeting the acceptance criteria should be eliminated from
the calibration curve calculations. No extrapolation from the calibration curves is allowed, therefore the range of the calibration curve will be truncated if the end points on the calibration curve are eliminated.
Positional Differences During a chromatographic analysis, samples are injected in sequence over several hours. Therefore, it is important to determine if the sample position in the chromatographic run sequence has an infl uence on the observed response (eg, if there is response change over the course of the run or any carryover is observed from previous samples). An evaluation of the situation should be done during the validation of the method and monitored during sample analysis. Procedures
Table 2. Glossary of Common Bioanalytical Method Validation Terms. Defi nition of many of the terms given in the table are available in FDA guidance 1 or other publications, but are provided here for convenience
Accuracy The degree of closeness of the observed concentration to the nominal or known true concentration. It is typically measured as relative error (%RE).
Precision Measurement of scatter for the concentrations obtained for replicate samplings of a homogeneous sample. It is typically measured as coeffi cient of variation (%CV).
Selectivity The ability of the bioanalytical method to measure and differentiate the analytes in the presence of components that may be expected to be present. These could include metabolites, impurities, degradants, or matrix components.
Sensitivity (LLOQ, lower limit of quantifi cation) The lowest concentration of an analyte in a sample that can be quantitatively determined with an acceptable precision and accuracy.
Sensitivity (ULOQ, upper limit of quantifi cation) The highest amount of an analyte in a sample that can be quantitatively determined with an acceptable precision and accuracy.
Standard curve The relationship between the experimental response value and the analytical concentration.
Linearity The ability of the bioanalytical procedure to obtain test results that are directly proportional to the concentration of analyte in the sample within the range of the standard curve.
Quantifi cation range The range of concentration, including the LLOQ and ULOQ that can be reliably and reproducibly quantifi ed with suitable accuracy and precision through the use of a concentration- response relationship.
Recovery The extraction effi ciency of an analytical process, reported as a percentage of the known amount of an analyte carried through the sample extraction and processing steps of the method.
Matrix factor A quantitative measure of the matrix effects due to suppression or enhancement of ionization in a mass spectrometric detector.
Stability The chemical or physical stability of an analyte in a given matrix under specifi c conditions for given time intervals.
Reproducibility Ability of the method to yield similar concentration for a sample when measured on different occasions.

Method Validationin Pharmaceutical Analysis
Edited by
J. Ermer and J. H. McB. Miller
MethodValidation in Pharmaceutical Analysis. AGuide to Best Practice. JoachimErmer, JohnH.McB.Miller (Eds.)Copyright � 2005 WILEY-VCH Verlag GmbH & Co. KGaA, WeinheimISBN: 3-527-31255-2

21
The following sections discuss parameters and calculations, which describe the per-formance of analytical procedures according to the ICH validation characteristics.The selection and discussion of these parameters and calculations reflect the experi-ence of the authors and is primarily based on practical considerations. Their rele-vance will vary with the individual analytical application; some are also suitable foraddressing questions other than validation itself. It is not intended to replace statis-tical textbooks, but the authors have tried to provide sufficient background informa-tion – always with the practical analytical application in mind – in order to make iteasier for the reader to decide which parameters and tests are relevant and useful inhis/her specific case. Precision is discussed first, because many other performanceparameters are linked to analytical variability.
2.1Precision
Joachim Ermer
2
Performance Parameters, Calculations and Tests
ICH“The precision of an analytical procedure expresses the closeness of agreement
(degree of scatter) between a series of measurements obtained from multiple samplingof the same homogeneous sample under the prescribed conditions. Precision may beconsidered at three levels; repeatability, intermediate precision and reproducibility.”[1a]
Precision should be obtained preferably using authentic samples. As parame-ters, the standard deviation, the relative standard deviation (coefficient of varia-tion) and the confidence interval should be calculated for each level of preci-sion.
Repeatability expresses the analytical variability under the same operatingconditions over a short interval of time (within-assay, intra-assay). At least ninedeterminations covering the specified range or six determinations at 100% testconcentration should be performed.
MethodValidation in Pharmaceutical Analysis. AGuide to Best Practice. JoachimErmer, JohnH.McB.Miller (Eds.)Copyright � 2005 WILEY-VCH Verlag GmbH & Co. KGaA, WeinheimISBN: 3-527-31255-2

2 Performance Parameters, Calculations and Tests22
Intermediate precision includes the influence of additional random effects with-in laboratories, according to the intended use of the procedure, for example, dif-ferent days, analysts or equipment, etc.
Reproducibility, i.e., the precision between laboratories (collaborative or inter-laboratory studies), is not required for submission, but can be taken intoaccount for standardisation of analytical procedures.
Before discussing the precision levels in detail, some fundamentals concerningthe distribution of data are recalled. This is deemed to be very important for a cor-rect understanding and evaluation of the following sections. For practical applica-tions, a good understanding of the acceptable and achievable precision ranges is cru-cial. The section concludes with the description of some approaches used to obtainprecision results.
2.1.1Parameters Describing the Distribution of Analytical Data
2.1.1.1 Normal Distribution�Measurements are inherently variable’ [16], i.e., the analytical data obtained scatteraround the true value. The distribution of data can be visualised by histograms, i.e.,plotting the frequency of the data within constant intervals (classes) throughout thewhole data range observed. Such histograms can be generated using MicrosoftExcel� (Tools/Data Analysis/Histogram; the Analysis ToolPak can be installed bymeans of Tools/Add-Ins). Usually, the number of classes corresponds approximatelyto the square root of the number of data. Figure 2.1-1 shows clearly that a largenumber of data is required to obtain a clear picture. The data were obtained byrecording the absorbance of a drug substance test solution at 291 nm for 60 minuteswith a sampling rate of 10/s. Of course, over such a long time, an instrumental driftcannot be avoided. From 15 minutes onwards, the drift in the absorbance valueswas constant. Various time segments were further investigated and for the drift be-tween 35 and 60 minutes the lowest residual standard deviation of the regressionline was observed. The data were corrected accordingly, i.e., the corrected data repre-sent the scattering of the absorbance values around the regression line of the drift.The mean and standard deviation of these 15 000 data were calculated to be 692 and0.1774 mAU, respectively. The very small relative standard deviation of 0.026% rep-resents only the detection variability of the spectrophotometer.
The usually assumed normal distribution, in physico-chemical analysis, could beconfirmed for the data sets in the example, but even with 15 000 data the theoreticaldistribution cannot be achieved (Fig. 2.1-2). The normal distribution or Gaussiancurve is bell-shaped and symmetrically centred around the mean (true value) forwhich the highest frequency is expected. The probability of measured data decreaseswith the distance from the true value and can be calculated with the probability den-sity function (Eq. 2.1-1).

2 Performance Parameters, Calculations and Tests
(as described in the control test), rather merely to injecting the same sample solutionsix times. This is also the reason for using authentic samples [1b], because only thencan the analytical procedure be performed exactly as in the routine application.There may be exceptions, but these should be demonstrated or cautiously justified.For example, analysing degradants near the quantitation limit, where the variancecontribution of the sample preparation can be neglected, injection precision andrepeatability are identical (Figs. 2.1-7 and 2.1-8). For some applications, where preci-sion can be regarded as less critical, such as in early development (see Chapter 5), orif the variability demands only a small part of specification range (less than approxi-mately 10%), or if the expected content of impurities is far away from the specifica-tion limit, artificially prepared (spiked) samplesmay be used, allowing several validationcharacteristics (linearity, precision and accuracy) to be addressed simultaneously.
Repeatability can be calculated using Eq.( 2.1-2) from a larger number of repeat-edly prepared samples (at least 6), or according to Eq.( 2.1-8) from a sufficient num-ber of duplicate sample preparations. Calculations should not be performed withsmaller number of data due to the large uncertainty involved (Fig. 2.1-4B). The truestandard deviation may be up to 4.4 times greater than a result obtained from threedeterminations!
2.1.2.3 Intermediate Precision and ReproducibilityIntermediate precision includes the influence of additional random effects accordingto the intended use of the procedure in the same laboratory and can be regarded asan (initial) estimate for the long-term variability. Relevant factors, such as operator,instrument, and days should be varied. Intermediate precision is obtained fromseveral independent series of applications of the (whole) analytical procedure to (pre-ferably) authentic, identical samples. In case of relative techniques, the preparationand analysis of the reference standard is an important variability contribution.Therefore, it is not appropriate to determine intermediate precision from the peakarea of the sample alone (analysed on different days or even several concentrationsonly), as is sometimes reported in validation literature. Apart from ignoring the con-tribution of the reference standard, any signal shift of the instrument will be falselyinterpreted as random variability. In order to reflect the expected routine variabilityproperly, the calibration must be performed exactly as described in the control test.
Reproducibility, according to the ICH definition is obtained varying further factorsbetween laboratories and is particularly important in the assessment of �official’ com-pendial methods or if the method is applied at different sites. However, understoodin the long-term perspective, both intermediate precision and reproducibility approacheach other, at least in the same company. Reproducibility from collaborative trials can beexpected to include additional contributions due to a probably larger difference ofknowledge, experience, equipment, etc. among the participating laboratories.
Analysis of variancesIt is very important to address intermediate precision/reproducibility appropriatelyas it is an estimate for the variability (and robustness) to be expected in long-termapplications, such as in stability testing. According to ICH, standard deviations
32

2 Performance Parameters, Calculations and Tests
2.2Specificity
Joachim Ermer
52
ICH“Specificity is the ability to assess unequivocally the analyte in the presence of com-
ponents which may be expected to be present. Typically these might include impurities,degradants, matrix, etc. Lack of specificity of an individual procedure may be compen-sated by other supporting analytical procedure(s)” [1a].
With respect to identification, discrimination between closely related com-pounds likely to be present should be demonstrated by positive and negativesamples. In the case of chromatographic assay and impurity tests, availableimpurities/degradants can be spiked at appropriate levels to the correspondingmatrix or else degraded samples can be used. For assay, it can be demonstratedthat the result is unaffected by the spiked material. Impurities should be sepa-rated individually and/or from other matrix components. Specificity can also bedemonstrated by verification of the result with an independent analytical proce-dure.
In the case of chromatographic separation, resolution factors should beobtained for critical separation. Tests for peak homogeneity, for example, bydiode array detection (DAD) or mass spectrometry (MS) are recommended.
There has been some controversial discussion about the terminology for this valida-tion characteristic. In contrast to the ICH, most other analytical organisations definethis as selectivity, whereas specificity is regarded in an absolute sense, as the “ultimatedegree of selectivity” (IUPAC) [68]. Despite this controversy, there is a broad agree-ment that specificity/selectivity is the critical basis of each analytical procedure.Without a sufficient selectivity, the other performance parameters are meaningless.In order to maintain a consistent terminology, in the following �specificity’ is usedas the general term for the validation characteristic, whereas �selective’ and �selectiv-ity’ describe its qualitative grade. The latter is important to realise, because there isno absolute measure of selectivity, there is only an absence of evidence, no evidence ofabsence.
In contrast to chemical analysis, where each analytical procedure is regarded (andevaluated) separately, in pharmaceutical analysis, a whole range of control tests isused to evaluate a batch. Therefore, the performance of these individual analyticalprocedures can complement each other in order to achieve the required overall levelof selectivity. For example, an assay by means of a less selective titration that willinclude impurities with the same functional groups, can be confirmed (or corrected)by a selective impurity determination by LC [1b].
Specificity is to be considered from the beginning of the method development,taking into account the properties of both analyte and sample (matrix). The (suffi-ciently) selective determination of the analyte can be achieved by appropriate sample

2 Performance Parameters, Calculations and Tests
2.7Robustness
Gerd Kleinschmidt
Although robustness of analytical procedures is generally noticed least of all, it isone of the most important validation parameters. Fortunately, in pharmaceuticalanalysis more and more attention is paid to it. Basically, robustness testing means toevaluate the ability of a method to perform effectively in a typical laboratory environ-ment and with acceptable variations. Robustness definitions have been widely har-monised among international drug authorities, which is mainly the merit of theInternational Conference on Harmonisation (ICH).
2.7.1Terminology and Definitions
Definitions provided by regulatory bodies, which play a significant role in the phar-maceutical world are itemised below.
2.7.1.1 International Conference on Harmonisation (ICH)According to ICH Q2A [1a] “the robustness of an analytical procedure is a measure of itscapacity to remain unaffected by small, but deliberate variations in method parametersand provides an indication of its reliability during normal usage”.
Furthermore, it is stated in ICH Q2B [1b], “The evaluation of robustness should beconsidered during the development phase and depends on the type of procedure understudy. It should show the reliability of an analysis with respect to deliberate variations inmethod parameters. If measurements are susceptible to variations in analytical conditions,the analytical conditions should be suitably controlled or a precautionary statement shouldbe included in the procedure. One consequence of the evaluation of robustness should bethat a series of system suitability parameters (e.g., resolution test) is established to ensurethat the validity of the analytical procedure is maintained whenever used”.
Additionally, the ICH guideline Q2B lists examples of typical variations such asextraction time or in case of liquid chromatography the mobile phase pH, themobile phase composition and flow rate etc.
Even though these explanations are not very detailed, they guide an analyst onwhen and how to evaluate robustness. To decide what is small, but deliberatedepends on the method and is the responsibility of the analyst.
2.7.1.2 Food and Drug Administration (FDA)The FDA utilises the ICH definition for robustness and remarks that “data obtainedfrom studies for robustness, though not usually submitted, are recommended to be includedas part of method validation”. This is stated in the Reviewer Guidance “Validation ofChromatographic Methods” [3].
Corresponding to ICH, robustness testing “should be performed during developmentof the analytical procedure and the data discussed and / or submitted. In cases where an
120

Guidance for Industry
Bioanalytical Method Validation
U.S. Department of Health and Human ServicesFood and Drug Administration
Center for Drug Evaluation and Research (CDER)Center for Veterinary Medicine (CVM)
May 2001BP

14
A calibration curve should be generated for each analyte to assay samples in each analytical run andshould be used to calculate the concentration of the analyte in the unknown samples in the run. Thespiked samples can contain more than one analyte. An analytical run can consist of QC samples,calibration standards, and either (1) all the processed samples to be analyzed as one batch or (2) abatch composed of processed unknown samples of one or more volunteers in a study. The calibration(standard) curve should cover the expected unknown sample concentration range in addition to acalibrator sample at LLOQ. Estimation of concentration in unknown samples by extrapolation ofstandard curves below LLOQ or above the highest standard is not recommended. Instead, thestandard curve should be redefined or samples with higher concentration should be diluted andreassayed. It is preferable to analyze all study samples from a subject in a single run.
Once the analytical method has been validated for routine use, its accuracy and precision should bemonitored regularly to ensure that the method continues to perform satisfactorily. To achieve thisobjective, a number of QC samples prepared separately should be analyzed with processed testsamples at intervals based on the total number of samples. The QC samples in duplicate at threeconcentrations (one near the LLOQ (i.e., #3 x LLOQ), one in midrange, and one close to the high endof the range) should be incorporated in each assay run. The number of QC samples (in multiples ofthree) will depend on the total number of samples in the run. The results of the QC samples provide thebasis of accepting or rejecting the run. At least four of every six QC samples should be within "15% oftheir respective nominal value. Two of the six QC samples may be outside the "15% of their respectivenominal value, but not both at the same concentration.
The following recommendations should be noted in applying a bioanalytical method to routine druganalysis:
• A matrix-based standard curve should consist of a minimum of six standard points,excluding blanks (either single or replicate), covering the entire range.
• Response Function: Typically, the same curve fitting, weighting, and goodness of fitdetermined during prestudy validation should be used for the standard curve within thestudy. Response function is determined by appropriate statistical tests based on the actualstandard points during each run in the validation. Changes in the response functionrelationship between prestudy validation and routine run validation indicate potentialproblems.
• The QC samples should be used to accept or reject the run. These QC samples are matrixspiked with analyte.
• System suitability: Based on the analyte and technique, a specific SOP (or sample) shouldbe identified to ensure optimum operation of the system used.

16
QC), and one approaching the high end of the range (high QC)) should be incorporated intoeach run. The results of the QC samples provide the basis of accepting or rejecting the run. At least 67% (four out of six) of the QC samples should be within 15% of their respectivenominal (theoretical) values; 33% of the QC samples (not all replicates at the sameconcentration) can be outside the ±15% of the nominal value. A confidence intervalapproach yielding comparable accuracy and precision is an appropriate alternative.
The minimum number of samples (in multiples of three) should be at least 5% of the number ofunknown samples or six total QCs, whichever is greater.
• Samples involving multiple analytes should not be rejected based on the data from oneanalyte failing the acceptance criteria.
• The data from rejected runs need not be documented, but the fact that a run was rejectedand the reason for failure should be recorded.
VII. DOCUMENTATION
The validity of an analytical method should be established and verified by laboratory studies, anddocumentation of successful completion of such studies should be provided in the assay validationreport. General and specific SOPs and good record keeping are an essential part of a validatedanalytical method. The data generated for bioanalytical method establishment and the QCs should bedocumented and available for data audit and inspection. Documentation for submission to the Agencyshould include (1) summary information, (2) method development and establishment, (3) bioanalyticalreports of the application of any methods to routine sample analysis, and (4) other informationapplicable to method development and establishment and/or to routine sample analysis.
A. Summary Information
Summary information should include:
• Summary table of validation reports, including analytical method validation, partialrevalidation, and cross-validation reports. The table should be in chronological sequence,and include assay method identification code, type of assay, and the reason for the newmethod or additional validation (e.g., to lower the limit of quantitation).
• Summary table with a list, by protocol, of assay methods used. The protocol number,protocol title, assay type, assay method identification code, and bioanalytic report codeshould be provided.
• A summary table allowing cross-referencing of multiple identification codes should beprovided (e.g., when an assay has different codes for the assay method, validation reports,
Received: 16 June 2002Accepted: 12 July 2002
Part of this review was published in thecommunications of the International Asso-ciation of Forensic Toxicologists (TIAFT;TIAFT Bulletin 32 (2002): 16–23) and ofthe Society for Forensic and ToxicologicChemistry (GTFCH; Toxichem and Krimi-tech 68 (2001): 116-126).
Abstract The reliability of analyti-cal data is very important to forensicand clinical toxicologists for the cor-rect interpretation of toxicologicalfindings. This makes (bio)analyticalmethod validation an integral part ofquality management and accredita-tion in analytical toxicology. There-fore, consensus should be reached inthis field on the kind and extent ofvalidation experiments as well as onacceptance criteria for validation pa-rameters. In this review, the most im-portant papers published on this top-ic since 1991 have been reviewed.Terminology, theoretical and practi-cal aspects as well as implicationsfor forensic and clinical toxicologyof the following validation parame-ters are discussed: selectivity (speci-
ficity), calibration model (linearity),accuracy, precision, limits, stability,recovery and ruggedness (robust-ness).
Keywords Method · Validation ·Bioanalysis · Toxicology
Accred Qual Assur (2002) 7:441–449DOI 10.1007/s00769-002-0516-5
© Springer-Verlag 2002
REVIEW PAPER
Frank T. PetersHans H. Maurer
Bioanalytical method validation and its implications for forensic and clinical toxicology – A review
Introduction
The reliability of analytical findings is a matter of greatimportance in forensic and clinical toxicology, as it is aprerequisite for correct interpretation of toxicologicalfindings. Unreliable results might not only be contestedin court, but could also lead to unjustified legal conse-quences for the defendant or to wrong treatment of thepatient. The importance of validation, at least of routineanalytical methods, can therefore hardly be overestimat-ed. This is especially true in the context of quality man-agement and accreditation, which have become mattersof increasing importance in analytical toxicology in re-cent years. This is also reflected in the increasing re-quirements of peer-reviewed scientific journals concern-ing method validation. Therefore, this topic should beextensively discussed on an international level to reach a
consensus on the extent of validation experiments and onacceptance criteria for validation parameters of bioana-lytical methods in forensic and clinical toxicology.
Over the last decade, similar discussions have beengoing on in the closely related field of pharmacokineticstudies for registration of pharmaceuticals. This is re-flected by the number of publications on this topic pub-lished in the last decade, of which the most important arediscussed here.
Important publications on validation (1991 to present)
A review on validation of bioanalytical methods waspublished by Karnes et al. in 1991 which was intended toprovide guidance for bioanalytical chemists [1]. One
F.T. Peters (✉) · H.H. MaurerDepartment of Experimental and Clinical Toxicology, Institute of Experimental and ClinicalPharmacology and Toxicology, University of Saarland, 66421 Homburg,Germanye-mail: [email protected].: +49-6841-1626050Fax: +49-6841-1626051
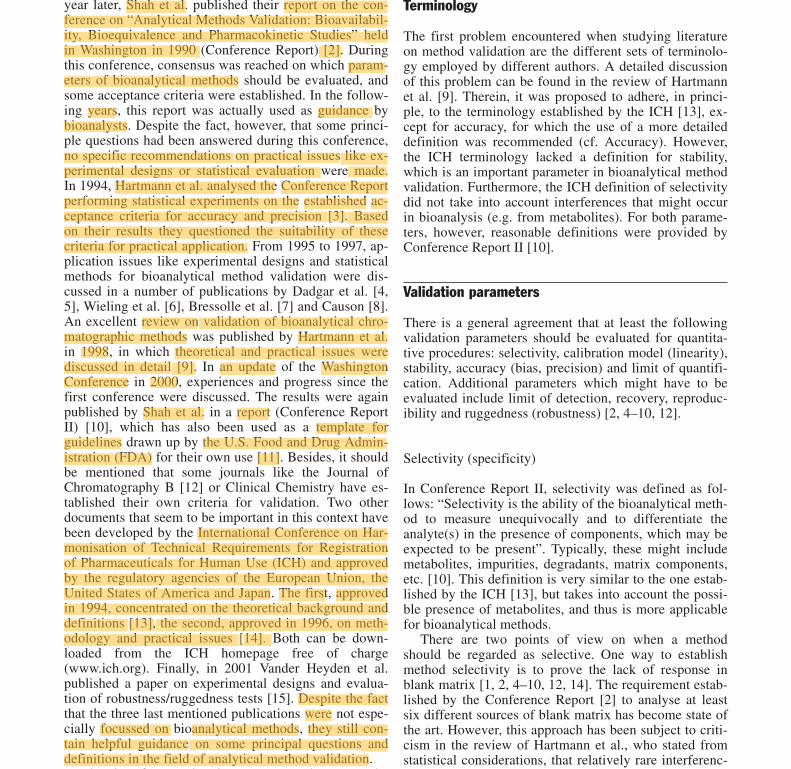
year later, Shah et al. published their report on the con-ference on “Analytical Methods Validation: Bioavailabil-ity, Bioequivalence and Pharmacokinetic Studies” heldin Washington in 1990 (Conference Report) [2]. Duringthis conference, consensus was reached on which param-eters of bioanalytical methods should be evaluated, andsome acceptance criteria were established. In the follow-ing years, this report was actually used as guidance bybioanalysts. Despite the fact, however, that some princi-ple questions had been answered during this conference,no specific recommendations on practical issues like ex-perimental designs or statistical evaluation were made.In 1994, Hartmann et al. analysed the Conference Reportperforming statistical experiments on the established ac-ceptance criteria for accuracy and precision [3]. Basedon their results they questioned the suitability of thesecriteria for practical application. From 1995 to 1997, ap-plication issues like experimental designs and statisticalmethods for bioanalytical method validation were dis-cussed in a number of publications by Dadgar et al. [4,5], Wieling et al. [6], Bressolle et al. [7] and Causon [8].An excellent review on validation of bioanalytical chro-matographic methods was published by Hartmann et al.in 1998, in which theoretical and practical issues werediscussed in detail [9]. In an update of the WashingtonConference in 2000, experiences and progress since thefirst conference were discussed. The results were againpublished by Shah et al. in a report (Conference ReportII) [10], which has also been used as a template forguidelines drawn up by the U.S. Food and Drug Admin-istration (FDA) for their own use [11]. Besides, it shouldbe mentioned that some journals like the Journal ofChromatography B [12] or Clinical Chemistry have es-tablished their own criteria for validation. Two otherdocuments that seem to be important in this context havebeen developed by the International Conference on Har-monisation of Technical Requirements for Registrationof Pharmaceuticals for Human Use (ICH) and approvedby the regulatory agencies of the European Union, theUnited States of America and Japan. The first, approvedin 1994, concentrated on the theoretical background anddefinitions [13], the second, approved in 1996, on meth-odology and practical issues [14]. Both can be down-loaded from the ICH homepage free of charge(www.ich.org). Finally, in 2001 Vander Heyden et al.published a paper on experimental designs and evalua-tion of robustness/ruggedness tests [15]. Despite the factthat the three last mentioned publications were not espe-cially focussed on bioanalytical methods, they still con-tain helpful guidance on some principal questions anddefinitions in the field of analytical method validation.
The aim of our review is to present and compare thecontents of the above mentioned publications on (bio)an-alytical method validation, and to discuss possible impli-cations for forensic and clinical toxicology.
Terminology
The first problem encountered when studying literatureon method validation are the different sets of terminolo-gy employed by different authors. A detailed discussionof this problem can be found in the review of Hartmannet al. [9]. Therein, it was proposed to adhere, in princi-ple, to the terminology established by the ICH [13], ex-cept for accuracy, for which the use of a more detaileddefinition was recommended (cf. Accuracy). However,the ICH terminology lacked a definition for stability,which is an important parameter in bioanalytical methodvalidation. Furthermore, the ICH definition of selectivitydid not take into account interferences that might occurin bioanalysis (e.g. from metabolites). For both parame-ters, however, reasonable definitions were provided byConference Report II [10].
Validation parameters
There is a general agreement that at least the followingvalidation parameters should be evaluated for quantita-tive procedures: selectivity, calibration model (linearity),stability, accuracy (bias, precision) and limit of quantifi-cation. Additional parameters which might have to beevaluated include limit of detection, recovery, reproduc-ibility and ruggedness (robustness) [2, 4–10, 12].
Selectivity (specificity)
In Conference Report II, selectivity was defined as fol-lows: “Selectivity is the ability of the bioanalytical meth-od to measure unequivocally and to differentiate theanalyte(s) in the presence of components, which may beexpected to be present”. Typically, these might includemetabolites, impurities, degradants, matrix components,etc. [10]. This definition is very similar to the one estab-lished by the ICH [13], but takes into account the possi-ble presence of metabolites, and thus is more applicablefor bioanalytical methods.
There are two points of view on when a methodshould be regarded as selective. One way to establishmethod selectivity is to prove the lack of response inblank matrix [1, 2, 4–10, 12, 14]. The requirement estab-lished by the Conference Report [2] to analyse at leastsix different sources of blank matrix has become state ofthe art. However, this approach has been subject to criti-cism in the review of Hartmann et al., who stated fromstatistical considerations, that relatively rare interferenc-es will remain undetected with a rather high probability[9]. For the same reason, Dadgar et al. proposed to eval-uate at least 10–20 sources of blank samples [4]. Howev-er, in Conference Report II [10], even analysis of onlyone source of blank matrix was deemed acceptable, if
442
surement uncertainty has been published by EURA-CHEM/CITAC [20].
Conclusion
There are only a few principle differences concerningvalidation of bioanalytical methods in the fields of phar-
macokinetic studies and forensic and clinical toxicology.Therefore, it seems reasonable to base the discussion onvalidation in the field of toxicology on the experiencesand consensus already existing in the closely relatedfield of pharmacokinetic studies for registration of phar-maceuticals and focus the discussion on those parame-ters, which are of special importance for toxicologists,i.e. selectivity, LOD, LLOQ and stability.
449
References
1. Karnes HT, Shiu G, Shah VP (1991)Pharm Res 8:421–426
2. Shah VP, Midha KK, Dighe S, McGilveray IJ, Skelly JP, Yacobi A,Layloff T, Viswanathan CT, Cook CE,McDowall RD, Pittman KA, Spector S(1992) Pharm Res 9:588–592
3. Hartmann C, Massart DL, McDowallRD (1994) J Pharm Biomed Anal12:1337–1343
4. Dadgar D, Burnett PE (1995) J PharmBiomed Anal 14:23–31
5. Dadgar D, Burnett PE, Choc MG, Gallicano K, Hooper JW (1995) JPharm Biomed Anal 13:89–97
6. Wieling J, Hendriks G, Tamminga WJ,Hempenius J, Mensink CK, OosterhuisB, Jonkman JH (1996) J Chromatogr A730:381–394
7. Bressolle F, Bromet PM, Audran M(1996) J Chromatogr B 686:3–10
8. Causon R (1997) J Chromatogr B689:175–180
9. Hartmann C, Smeyers-Verbeke J,Massart DL, McDowall RD (1998) JPharm Biomed Anal 17:193–218
10. Shah VP, Midha KK, Findlay JW, HillHM, Hulse JD, McGilveray IJ, McKayG, Miller KJ, Patnaik RN, Powell ML,Tonelli A, Viswanathan CT, Yacobi A(2000) Pharm Res 17:1551–1557
11. U.S. Department of Health and HumanServices, Food and Drug Administra-tion (2001) Guidance for industry, bio-analytical method validationhttp://www.fda.gov/cder/guidance/in-dex.htm
12. Lindner W, Wainer IW (1998) J Chro-matogr B 707:1–2
13. International Conference on Harmoni-zation (ICH) (1994) Validation of ana-lytical methods: Definitions and termi-nology ICH Q2 A
14. International Conference on Harmoniza-tion (ICH) (1996) Validation of analyti-cal methods: Methodology ICH Q2 B
15. Vander-Heyden Y, Nijhuis A, Smeyers-Verbeke J, Vandeginste BG, MassartDL (2001) J Pharm Biomed Anal24:723–753
16. Penninckx W, Hartmann C, MassartDL, Smeyers-Verbeke J (1996) J AnalAt Spectrom 11:237–246
17. International Organization for Stan-dardization (ISO) (1994) Accuracy(trueness and precision) of measure-ment methods and results: ISO/DIS5725–1 to 5725–3. ISO, Geneva, Switzerland
18. NCCLS (1999) Evaluation of precisionperformance of clinical chemistry de-vices; Approved guideline. NCCLS,Wayne, Pa., USA
19. Toennes SW, Kauert GF (2001) J AnalToxicol 25:339–343
20. EURACHEM/CITAC (2000) Quantify-ing uncertainty in analytical measure-ment http://www.eura-chem.bam.de/guides/quam2.pdf
Journal of Pharmaceutical and Biomedical Analysis 44 (2007) 652–657
Determination of loratadine and its active metabolite in humanplasma by high-performance liquid chromatography with
mass spectrometry detection
Laurian Vlase a, Silvia Imre b,∗, Dana Muntean a, Sorin E. Leucuta a
a Faculty of Pharmacy, University of Medicine and Pharmacy “Iuliu Hatieganu”, Emil Isac 13, RO-400023, Cluj-Napoca, Romaniab Faculty of Pharmacy, University of Medicine and Pharmacy, Gh. Marinescu 38, RO-540139, Tg. Mures, Romania
Received 5 June 2006; received in revised form 8 August 2006; accepted 10 August 2006Available online 8 September 2006
Abstract
A new sensitive and selective liquid chromatography coupled with mass spectrometry (LC/MS/MS) method for quantification of loratadine (LOR)and its active metabolite descarboethoxyloratadine (DSL) in human plasma was validated. After addition of the internal standard, metoclopramide,the human plasma samples (0.3 ml) were precipitated using acetonitrile (0.75 ml) and the centrifuged supernatants were partially evaporated undernitrogen at 37 ◦C at approximately 0.3 ml volume. The LOR, DSL and internal standard were separated on a reversed phase column (ZorbaxSB-C18, 100 mm × 3.0 mm i.d., 3.5 �m) under isocratic conditions using a mobile phase of an 8:92 (v/v) mixture of acetonitrile and 0.4% (v/v)formic acid in water. The flow rate was 1 ml/min and the column temperature 45 ◦C. The detection of LOR, DSL and internal standard was in MRMmode using an ion trap mass spectrometer with electrospray positive ionisation. The ion transitions were monitored as follows: 383 → 337 for LOR,311 → (259 + 294 + 282) for DSL and 300 → 226.8 for internal standard. Calibration curves were generated over the range of 0.52–52.3 ng/mlfor both LOR and DSL with values for coefficient of determination greater than 0.994 by using a weighted (1/y) quadratic regression. The lowerlimits of quantification were established at 0.52 ng/ml LOR and DSL, respectively, with an accuracy and precision less than 20%. Both analytesdemonstrated good short-term, long-term, post-preparative and freeze-thaw stability. Besides its simplicity, the sample treatment allows obtaininga very good recovery of both analytes, around 100%. The validated LC/MS/MS method has been applied to a pharmacokinetic study of loratadinetablets on healthy volunteers.© 2006 Elsevier B.V. All rights reserved.
Keywords: Loratadine; Bioequivalence; Pharmacokinetics; LC–MS/MS
1. Introduction
4-(8-Chloro-5,6-dihydro-11H-benzo[5,6]-cycloheptal[1,2-b]-pyridin-11-ylidine)-1-piperidinecarboxylic acid ethyl ester(loratadine) is a long acting tricyclic antihistamine with selec-tive peripheral histamine H1-receptor antagonist activity that isused for relief of symptoms of seasonal allergies and skin rash(Fig. 1). Among the second-generation antihistamines, lorata-dine is free from sedation at recommended dosages. Followingan oral administration of 10 mg tablet, loratadine (LOR) israpidly absorbed and reaches peak concentration (Tmax) at 1.3 h.For its major active metabolite, descarboethoxyloratadine, the
∗ Corresponding author. Tel.: +40 745 231516.E-mail address: [email protected] (S. Imre).
Tmax is 2.5 h [1]. Descarboethoxyloratadine or desloratadine(DSL) would be expected to produce results similar to LORand other nonsedating antihistamines. The elimination half-lifeof LOR is 8–14 h, and that of DSL 17–24 h. An oral dose ofloratadine (20 mg) leads to maximum plasma concentrations ofonly 11 and 10 ng/ml for LOR and DSL, respectively [2].
In view of these facts, the analytical method for LOR andDSL determination in human plasma has to be very sensitiveand in the case of a large number of samples, the developmentof a chromatographic method suitable for this kind of analysismust take into account not only a sensitive procedure, but also afast one, and as much as possible a simple sample preparation.An HPLC–MS or GC–MS method offers the solution from thesepoints of view, in many cases.
Loratadine and desloratadine in plasma were studied by GC[3,4] or HPLC methods with UV [5] or fluorescence detec-
0731-7085/$ – see front matter © 2006 Elsevier B.V. All rights reserved.doi:10.1016/j.jpba.2006.08.013
L. Vlase et al. / Journal of Pharmaceutical and Biomedical Analysis 44 (2007) 652–657 653
Fig. 1. Chemical structures of loratadine, desloratadine and metoclopramide(internal standard).
tion [6–9], with a sufficient lower limit of quantification forthe purpose of study, by applying liquid–liquid or solid phaseextraction. HPLC with MS detection was extensively used inthe past years for the sensitive quantification of LOR and DSL[10–18], with a very low limit of quantification obtained mainlyafter liquid–liquid extraction of analytes.
Taking into account these facts, the aim of the present studywas to develop a fast HPLC/MS/MS method able to quantifyloratadine and desloratadine in human plasma after oral admin-istration of a therapeutic dose of loratadine after a simple stepof extraction. Finally, the developed and validated method wasapplied for bioequivalence investigation of two medicinal prod-ucts containing 10 mg loratadine.
2. Experimental
2.1. Reagents
Loratadine and desloratadine were reference standards fromMorepen Lab. Limited, India. Metoclopramide hydrochloride(MTC) (Fig. 1) was the internal standard (European Pharma-copoeia standard). Acetonitrile, methanol and formic acid wereMerck products (Merck KgaA, Darmstadt, Germany). Distilled,deionised water was produced by a Direct Q-5 Millipore (Mil-lipore SA, Molsheim, France) water system. The human blankplasma was supplied by the Local Bleeding Centre Cluj-Napoca,Romania.
2.2. Standard solutions
Two stock solutions of loratadine and desloratadine, respec-tively, with concentration of 2.5 mg/ml were prepared by dis-solving appropriate quantities of reference substances (weighedon an Analytical Plus balance from Ohaus, USA) in 10 mlmethanol. Two working solutions were then obtained for each
substance by diluting specific volumes of stock solution withplasma. Then these were used to spike different volumes ofplasma blank, providing finally eight plasma standards withthe concentrations ranged between 0.52 and 52.3 ng/ml, equallyfor loratadine and desloratadine. Accuracy and precision of themethod was verified using plasma standards with concentrationsof 0.52, 1.68, 10.47 and 20.94 ng/ml loratadine and deslorata-dine, respectively. Quality control samples (QC) of 1.68, 10.47and 20.94 ng/ml analytes were used during clinical samples anal-ysis. The internal standard solution was prepared by sequentialdilution of a stock solution of metoclopramide in acetonitrile(1 mg/ml) to reach a concentration of 3.65 ng/ml. This solutionwas used for precipitation of plasma proteins.
2.3. Chromatographic and mass spectrometry systems andconditions
The HPLC system was an 1100 series model (Agilent Tech-nologies) consisted of a binary pump, an in-line degasser, anautosampler, a column thermostat and an Ion Trap VL massspectrometer detector (Brucker Daltonics GmbH, Germany).Chromatograms were processed using QuantAnalysis software.The detection of LOR, DSL and internal standard was in MRMmode using an ion trap mass spectrometer with electrospray pos-itive ionisation. The ion transitions were monitored as follows:383 → 337 for LOR, 311 → (259 + 294 + 282) for DSL and300 → 226.8 for internal standard. Chromatographic separationwas performed at 45 ◦C on a Zorbax SB-C18 100 mm × 3 mm,3.5 �m column (Agilent Technologies), protected by an in-linefilter.
2.4. Mobile phase
The mobile phase consisted of a mixture of water containing0.4% formic acid and acetonitrile (92:8, v/v), each componentbeing degassed, before elution, for 10 min in an Elma Transsonic700/H (Singen, Germany) ultrasonic bath. The pump deliveredthe mobile phase at 1 ml/min.
2.5. Sample preparation
Standard and test plasma samples were prepared as followsin order to be chromatographically analyzed. In a test tube of1.5 ml, 0.3 ml plasma and 0.75 ml acetonitrile containing inter-nal standard (3.65 ng/ml metoclopramide as base) were added.The tube was vortex-mixed for 10 s (Vortex Genie 2, Scien-tific Industries) and then centrifuged for 6 min at 6000 rpm (204Sigma centrifuge, Osterode am Harz, Germany). The super-natant was transferred in a glass centrifuge tube and evaporatedat 37 ◦C under nitrogen to approximate 0.3 ml. The final solutionwas transferred to an autosampler vial and 10 �l were injectedinto the HPLC system.
2.6. Validation
As a first step of method validation [19–21], specificitywas verified using six different plasma blanks obtained from
654 L. Vlase et al. / Journal of Pharmaceutical and Biomedical Analysis 44 (2007) 652–657
healthy human volunteers who had not previously taken anymedication.
The concentration of analytes was determined automati-cally by the instrument data system using the internal standardmethod. Calibration was performed using singlicate calibra-tion standards on five different occasions. The calibration curvemodel was determined by the least squares analysis. The appliedcalibration model was y = c + bx + ax2, weight 1/y (1/y) quadraticresponse, where y, area ratio and x, concentration ratio. Dis-tribution of the residuals (%difference of the back-calculatedconcentration from the nominal concentration) was investigated.The calibration model was accepted, if the residuals were within±20% at the lower limit of quantification (LLOQ) and within±15% at all other calibration levels and at least two-third ofthe standards meet this criterion, including highest and lowestcalibration levels.
The lower limit of quantification was established as the lowestcalibration standard with an accuracy and precision less than20%.
The within- and between-run precision (expressed as coeffi-cient of variation, CV%) and accuracy (expressed as relative dif-ference between obtained and theoretical concentration, bias%)of the assay procedure were determined by analysis on the sameday of five different samples at each of the lower (1.68 ng/ml),medium (10.47 ng/ml) and higher (20.94 ng/ml) levels of theconsidered concentration range and one different sample of eachon five different occasions, respectively. The selected concen-tration values are relevant in practice taking in account to thefact that the reported maximum concentration levels of eitherloratadine or its metabolite are not greater that 8–10 ng/ml atusual oral doses (20 mg loratadine) [1,2].
The relative recoveries at each of the previously three lev-els of concentration and limit of quantification were measuredby comparing the response, relative to the internal standard, ofthe treated plasma standards with the response of standards insolvent with the same concentration of analytes and internalstandard as the plasma sample.
The stability of the analytes in human plasma was inves-tigated in three ways, in order to characterize each operationduring the process of bioequivalence studies: room-temperaturestability (RTS), post-preparative stability (PPS) in the autosam-pler, freeze-thaw stability (FTS) and long-term stability (LTS)below −20 ◦C. For all stability studies, plasma standards atlow (1.68 ng/ml both LOR and DSL) and high concentrations(20.94 ng/ml both LOR and DSL) were used. Four plasmastandards at each of the two levels were prepared and let atroom temperature 4 h before processing (RTS study). Other fourpairs were prepared, immediately processed and stored in theautosampler (25 ◦C) of the HPLC system (PPS study). The sam-ples were injected after 10 h, the expected longest storage timeof the samples in autosampler before injection. For the freeze-thaw stability, aliquots at the same low and high concentrationswere prepared. These samples were subjected to three cyclesof freeze-thaw operations in 3 consecutive days. After the thirdcycle, the samples were analyzed against calibration curve ofthe day. The mean concentration calculated for the samples sub-jected to the cycles and the nominal ones were compared. For
long-term stability, in the first validation day, there were injectedand analyzed four samples at each of low and high concentra-tions, and values were calculated against calibration curve of theday. Other two sets with the same plasma concentrations werestored in freezer below −20 ◦C and analyzed together with cal-ibration samples after 5 months. The values were calculatedagainst calibration curve of the day and the mean values for thestored samples and nominal concentrations were compared. Therequirement for stable analytes was that the difference betweenmean concentrations of the tested samples in various conditionsand nominal concentrations had to be in ±15% range.
2.7. Clinical application and in-study validation
The validated method was applied in a bioequivalence studyof two dosage forms—tablets containing 10 mg loratadine. Thecollecting times were 0, 0.25, 0.5, 1, 1.5, 2, 2.5, 3, 4, 6, 8, 10,12, 24, 48 h after oral administration of 40 mg loratadine. Theaccuracy and precision of the validated method was monitored toensure that it continued to perform satisfactorily during analysisof volunteer samples. To achieve this objective, a number ofQC samples prepared in duplicate at three concentration levelswere analyzed in each assay run and the results compared withthe corresponding calibration curve. At least 67% (four out ofsix) of the QC samples should be within 15% of their respectivenominal values; 33% of the QC samples (not all replicates at thesame concentration) can be outside ±15% of the nominal value.
3. Results and discussions
No significant interference at the retention time of LOR(7 min) and DSL (3.2 min) was observed in different plasmablank samples chromatograms (Figs. 2 and 3) due to the speci-ficity of selected signals (Fig. 4). It is well known that anadvantage of the ion trap over the triple quadrupole is the sensi-bility in scan mode. This allows adding multiple fragments froman MS spectrum in order to improve the overall signal. In thecase of desloratadine, the sum of ions from MS spectrum (m/z259, 294, 282) was chosen for quantification because the detec-tion is about 40% more sensitive that the case based only on ionm/z 259.
Fig. 2. Chromatograms of a plasma blank containing metoclopramide (MTC,internal standard).
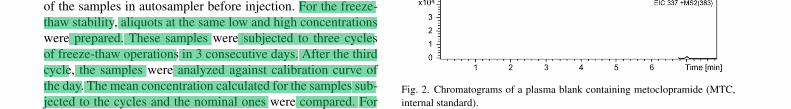
New validated method for piracetam HPLCdetermination in human plasma
Augustin Curticapean ⁎, Silvia Imre
University of Medicine and Pharmacy Tg-Mures, Faculty of Pharmacy, Gh. Marinescu Str. No.38,Tg-Mures RO-540139, Romania
Received 19 January 2006; received in revised form 3 May 2006; accepted 6 June 2006
Abstract
The newmethod for HPLC determination of piracetam in human plasma was developed and validated by anew approach. The simple determination by UV detection was performed on supernatant, obtained fromplasma, after proteins precipitation with perchloric acid. The chromatographic separation of piracetam under agradient elution was achieved at room temperature with a RP-18 LiChroSpher 100 column and aqueousmobile phase containing acetonitrile and methanol. The quantitative determination of piracetam wasperformed at 200 nmwith a lower limit of quantification LLQ=2 μg/ml. For this limit, the calculated values ofthe coefficient of variation and difference between mean and the nominal concentration are CV%=9.7 andbias%=0.9 for the intra-day assay, and CV%=19.1 and bias%=−7.45 for the between-days assay. Forprecision, the rangewas CV%=1.8÷11.6 in the intra-day and between-days assay, and for accuracy, the rangewas bias%=2.3÷14.9 in the intra-day and between-days assay. In addition, the stability of piracetam indifferent conditions was verified. Piracetam proved to be stable in plasma during 4 weeks at −20 °C and for36 h at 20 °C in the supernatant after protein precipitation. The new proposed method was used for abioequivalence study of two medicines containing 800 mg piracetam.© 2006 Elsevier B.V. All rights reserved.
Keywords: Piracetam; HPLC determination; Method validation
J. Biochem. Biophys. Methods 69 (2007) 273–281www.elsevier.com/locate/jbbm
Abbreviations: SC, Stock Solution; WC, Working Solution; STD, Standard Plasma Solutions; QC, Quality Control;LLQ, Lower Limit of Quantification; PPS, Post-Preparative Stability; FTS, Freeze-Thaw Stability; LTS, Long-TermStability; SD, Standard Deviation; CV%, Coefficient of Variation; bias%, ratio of the difference between mean found andnominal concentration and nominal concentration.⁎ Corresponding author. Tel.: +40 265 215551x171; fax: +40 265 210407.E-mail address: [email protected] (A. Curticapean).
0165-022X/$ - see front matter © 2006 Elsevier B.V. All rights reserved.doi:10.1016/j.jbbm.2006.06.001
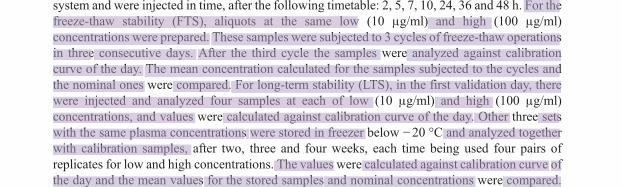
2.3. Method validation
Specificity of the method was investigated by analyzing blank plasma samples of sixindividual volunteers, in order to determine any interference of endogenous compounds withthe analyte. Investigation of the selectivity was carried out together with the calibration curveassay.
The six calibration standard replications were prepared and measured in a single run in the firstvalidation day. Then, during the next four consecutive days there weremeasured standards for onlyone calibration curve. Percentage residuals (% difference of the back-calculated concentrationfrom the nominal concentration) were calculated for each calibration standard. The appliedrequirements for a valid calibration model were: a regression coefficient higher than 0.99 (R2), andthe residuals and coefficient of variation (CV%) to be within ±20% at the lower limit ofquantification (LLQ) and ±15% for the rest of the concentrations tested. For the first validation daythere were analyzed in a single validation batch five replicates of QC samples, at each of theconcentration levels (5, 20 and 80 μg/ml), and reported to the calibration curve of the batch (intra-day assay). On each of the four remaining consecutive days, a single QC sample from each of theconcentration levels (5, 20 and 80 μg/ml) was analyzed against daily calibration (between-daysassay). The requirement for precision was acceptable if the coefficient of variation (CV%) of thedetermined QC concentrations did not exceed ±15%, either for intra-day or between-days assay.The accuracy was acceptable if the ratio of the difference between the mean measured con-centration and the nominal values against nominal concentration (bias%) did not exceed ±15%,either for intra-day or between-days assay.
The lower limit of quantification LLQ was analyzed against calibration curve (intra-dayassay), by determining in the first day, five couples of STD replicates with the concentrations of1 μg/ml and 2 μg/ml, respectively. Then, on each of the four consecutive days a single couple ofSTD samples were analyzed, against daily calibration curve (between-days assay). The require-ment for precision was acceptable if the coefficient of variation (CV%) of the measured STDsamples (at lowest concentration of the calibration curve) did not exceed ±20%, either for intra-day or between-days assay. The accuracy was acceptable if the bias% did not exceed ±20%, eitherfor intra-day or between-days assay.
The stability of the piracetam in human plasma was investigated by three ways, in order tocharacterize each operation during the process of bioequivalence studies (post-preparativestability in the autosampler, freeze-thaw stability and long-term plasma stability below −20 °C).For post-preparative stability (PPS), prepared samples at low (10 μg/ml) and high concentrations(100 μg/ml) were investigated. All aliquots were stored at 20 °C in the autosampler of the HPLCsystem and were injected in time, after the following timetable: 2, 5, 7, 10, 24, 36 and 48 h. For thefreeze-thaw stability (FTS), aliquots at the same low (10 μg/ml) and high (100 μg/ml)concentrations were prepared. These samples were subjected to 3 cycles of freeze-thaw operationsin three consecutive days. After the third cycle the samples were analyzed against calibrationcurve of the day. The mean concentration calculated for the samples subjected to the cycles andthe nominal ones were compared. For long-term stability (LTS), in the first validation day, therewere injected and analyzed four samples at each of low (10 μg/ml) and high (100 μg/ml)concentrations, and values were calculated against calibration curve of the day. Other three setswith the same plasma concentrations were stored in freezer below −20 °C and analyzed togetherwith calibration samples, after two, three and four weeks, each time being used four pairs ofreplicates for low and high concentrations. The values were calculated against calibration curve ofthe day and the mean values for the stored samples and nominal concentrations were compared.
276 A. Curticapean, S. Imre / J. Biochem. Biophys. Methods 69 (2007) 273–281
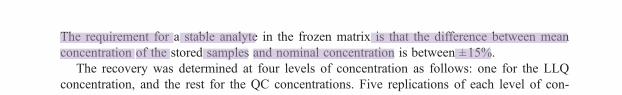
The requirement for a stable analyte in the frozen matrix is that the difference between meanconcentration of the stored samples and nominal concentration is between ±15%.
The recovery was determined at four levels of concentration as follows: one for the LLQconcentration, and the rest for the QC concentrations. Five replications of each level of con-centration were prepared and analyzed. The efficiency was calculated by height ratio of the meanvalues of the samples against height of the reference samples with the same concentrationsprepared in supernatant.
3. Results
The developed method showed that piracetam is well separated by the joint action of themobile phase and the solid one.
For specificity determination, the requirements are fulfilled, as one can observe in the chro-matograms recorded for six different volunteers (Fig. 2a and b). No endogenous peaks interfered atthe retention time of piracetam.
The chromatograms of the high QC (80 μg/ml) sample and overlay of the standard plasmasamples, spiked with piracetam, are shown in Fig. 3a and b, respectively.
The retention time at RT=5.1(±1%) min, having an unretained solute time of t0=1.6 min,offers a good separation factor k′=2.19(±1%).
The regression coefficient was higher than 0.99 (R2) with the values between 0.9986÷0.9999and the residuals and coefficient of variation (CV%) are within ±20% at the LLQ and within ±15%for the rest of the tested concentrations.
The method proved to be precise, with CV%=3.2÷11.6 for the intra-day assay and CV%=1.8÷11.6 for the between-days assay. The accuracy (bias%) ranged between 8.4÷14.9 for intra-dayassay and between 2.3÷3.9 for the between-days assay (Table 2).
Table 3Stability results
Stability Post-preparative Freeze-thaw Long-term (4 weeks)
Sample code PPS PPS FTS FTS LTS LTS
cnominal (μg/ml) 10 100 10 100 10 100cmean (μg/ml) 9.62 100.80 10.52 105.81 10.03 100.18bias% −3.8 0.8 5.2 5.8 0.3 0.2
Table 2Precision and accuracy (n=5)
cnominal (μg/ml) 2 (LLQ) 5 (QCA) 20 (QCB) 80 (QCC)
Intra-day assaycmean (μg/ml) 2.018 5.744 21.678 87.968CV% 9.7 11.6 3.2 9.9bias% 0.9 14.9 8.4 9.9
Between-days assaycmean (μg/ml) 1.851 5.194 20.752 81.853CV% 19.1 11.6 1.8 5.5bias% −7.5 3.9 3.8 2.3
279A. Curticapean, S. Imre / J. Biochem. Biophys. Methods 69 (2007) 273–281