Embed Size (px)
Citation preview
COMPREHENSIVE MARKET ANALYSIS REPORTS
COMPREHENSIVE MARKET ANALYSIS REPORTS
Policy Development & Research
Analysis of the Elmira-Corning, New York
Housing Market
As of October 1, 2002
ECONOMIC RESEARCH
U.S. Department of Housing and Urban Development
Analysis of the Elmira-Corning, New York Housing Market Area as of October 1, 2002
Foreword This analysis has been prepared for the assistance and guidance of the U.S. Department of Housing and Urban Development (HUD) in its operations. The factual information, findings, and conclusions may be useful also to builders, mortgagees, and others concerned with local housing conditions and trends. The analysis does not purport to make determinations with respect to the acceptability of any particular mortgage insurance proposals that may be under consideration in a particular locality or the housing market area. The factual framework for this analysis was developed by HUD’s Economic and Market Analysis Division as thoroughly as possible on the basis of information available on the “as-of” date from both local and national sources. As such, they may be modified by subsequent developments. We wish to express our appreciation to those industry sources and government officials who provided data and information on local economic and housing market conditions. This analysis takes into consideration changes in the economic, demographic, and housing inventory characteristics of the area during three time periods: 1990 to 2000, 2000 to the as-of date of the analysis (“Current” date), and from the Current date to a “Forecast” date 2 years hence. The analysis incorporates changes in employment, population, households, housing inventory, and vacancies for the Current and Forecast dates. The prospective demand expressed in the analysis should not be construed as a forecast of building activity; rather, it presents the prospective housing production that would maintain a reasonable balance in demand-supply relationship given the market’s condition on the as-of date of the analysis. This analysis was prepared by Mr. Michael Pelone, one of the Division’s Field Economists in the Buffalo, New York Field Office, based on fieldwork conducted in August 2002. If there are questions regarding the findings and conclusions of the analysis, he may be reached at (716) 551–5755, extension 5002 and at [email protected].
2
Analysis of the Elmira-Corning, New York Housing Market Area as of October 1, 2002
Housing Market Area
The Elmira-Corning Housing Market Area (HMA) comprises the counties of Chemung and Steuben, located in the Southern Tier region of New York State. This area is approximately midway between Lake Erie and New York City. For the purposes of this analysis, the Elmira-Corning HMA has been divided into three geographic submarkets: the city of Elmira; the city of Corning together with the townships of Erwin and Corning in Steuben County and Big Flats and Horseheads in Chemung County; and the remainder of the two-county HMA. Summary
Like many areas in the industrial Northeast, the population of the Elmira-Corning HMA has declined during the past 30 years, paralleling the declines in manufacturing employment and the greater economic opportunities in other areas of the region and the nation. The economy of the Elmira-Corning area has traditionally been dependent upon manufacturing. Corning Incorporated is the largest private-sector employer the area. In 1998, Corning Incorporated, formerly Corning Glass, Inc., divested several traditional consumer products and invested extensively in fiber optic and photonics research and development for applications in cable television, computers, and Internet communications. As a result, nonagricultural wage and salary employment in the HMA increased rapidly between 1995 and 2000, slowing in 2001. However, as a result of a downturn in the fiber optics sector, due to the falling demand from the telecommunications industry, employment declined during the 12 months ending October 2002. Despite the recent downturn, the 24-month forecast for the local economy is positive. The assumptions for recovery and renewed growth are based on a moderate increase in the number of jobs in both the manufacturing and services sectors as the HMA attempts to diversify, making a transition away from the fiber optics sector. Despite the growth in the economy from 1990 through 2000, the HMA continued to lose population, but at a much lower rate than previously. However, with the recent declines in employment and the slower economy the rate of population loss increased between 2000 and the Current date. While the HMA is expected to continue to register a net loss in population over the 2-year forecast, the annual rate is expected to be lower than in recent years, due the moderate economic recovery forecast. The average annual change in households from 2000 to the Current date was slightly above the annual rate of growth during the previous decade. However, during the 2-year forecast, the rate of growth is expected continue at about the same rate or slightly less. The growth in the housing inventory in the Elmira-Corning HMA was relatively stable, averaging approximately 350 homes and apartments annually from 1990 through 1998. With the rapid employment gains in 1999 to 2001, residential construction increased significantly. Much of the increase in the area’s housing stock occurred during the last half of the 1990s in higher-priced homes and upper-end Class A and AA rental units.
3
Analysis of the Elmira-Corning, New York Housing Market Area as of October 1, 2002
This construction boom was short-lived and ended with the employment declines of the past 12 months. Given the current economic downturn in the telecommunications industry, the current recession, and the relatively soft market conditions in the HMA, the pace of residential construction is expected to be much lower. Based on the analysis of Current and anticipated economic and demographic changes, it is estimated that there will be a demand for approximately 520 additional housing units during the 2-year forecast period, ending October 1, 2004. Economy of the Area
The economy of the Elmira-Corning area has traditionally been dependent upon manufacturing. Corning Incorporated is the largest private-sector employer the area. In 1998, Corning Incorporated, formerly Corning Glass, Inc., divested several traditional consumer products and invested extensively in fiber optic and photonics research and development for applications in cable television, computers, and Internet communications. Local research and development activities at Corning are concentrated at the company’s facilities in Erwin, New York. The company grew rapidly during the evolutionary phase of the Internet. The expectation was that strong consumer demand for advanced communication and entertainment services would support the demand for fiber optic products and installation of a national fiber optic cable network. Excess capital investments by major telecommunication services and equipment suppliers during 1998 through 2000 created significant excess capacity in a national fiber optics network. This overcapacity and lack of growth in demand Corning has cut back in fiber optics research and development. As a result the company cut back employment substantially beginning in early 2001. Total employment at Corning facilities in the area is currently estimated to be approximately 4,500 persons, compared with 7,000 at the end of 2000. Corning, Inc. also operates the Sullivan Research Center in the Town of Erwin, just outside of city of Corning, New York. The Sullivan Park complex occupies more than 1 million square feet and employs close to 2,000 persons. Steuben County is also home to the Alstom Corporation, which manufactures and repairs railcars and Gunlocke Company a leading manufacturer of top-of-the line office furniture. Alstom has renovated an abandoned railcar refurbishing operation for the renovation of mass transit cars and engine units for several metropolitan transit systems. The company, as of the date of this study, employed an estimated 1,000 workers, with expectations of future growth during the next 3 years. This favorable outlook is further reinforced by expectations that several suppliers and subcontractors to Alstom are considering relocation to the area to be closer to the rail car facility. In Chemung County, the largest manufacturer is Toshiba Display Devices, employing approximately 1,100 persons. Health care and medical services have become a growing sector of the Chemung County economy. Two health care organizations, Arnot Ogden Medical Center and St. Joseph’s Hospital, each employ more than 1,000 persons. The most significant economic development in Chemung County in recent years has been the addition of the NUCOR Steel Corporation manufacturing facility. The company employs 250 persons at a modern steel fabrication plant that produces steel joists, girders, and steel deck products.
4
Analysis of the Elmira-Corning, New York Housing Market Area as of October 1, 2002
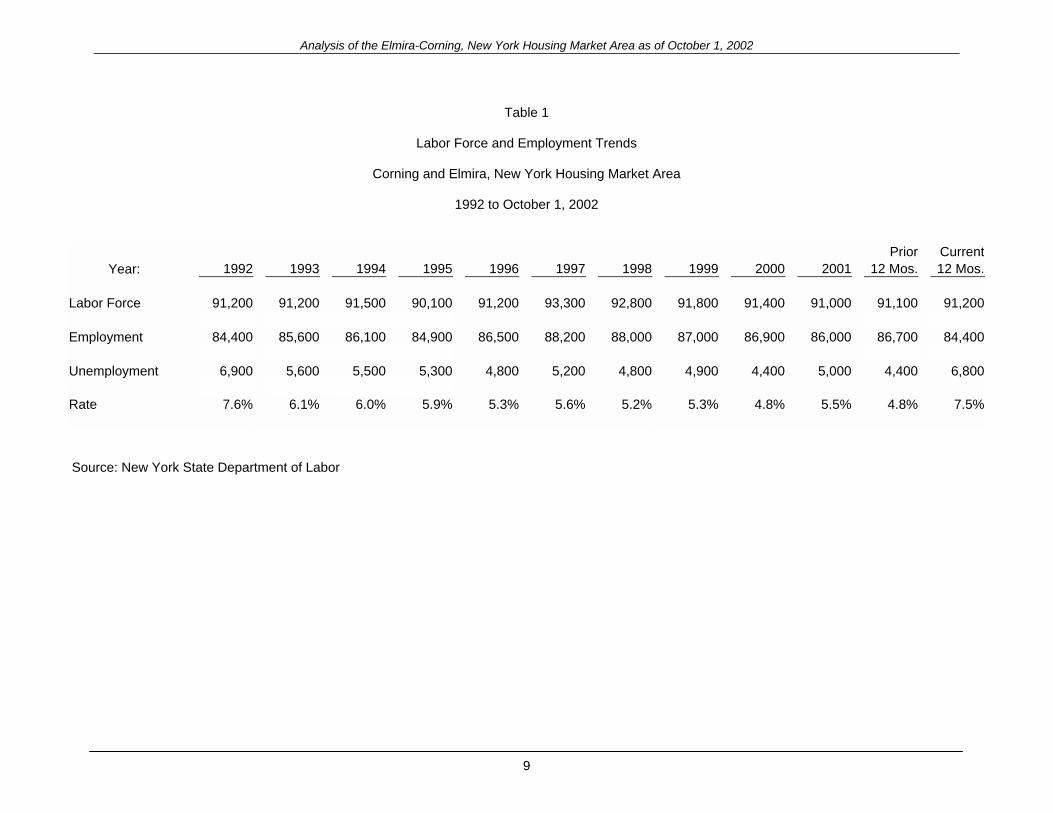
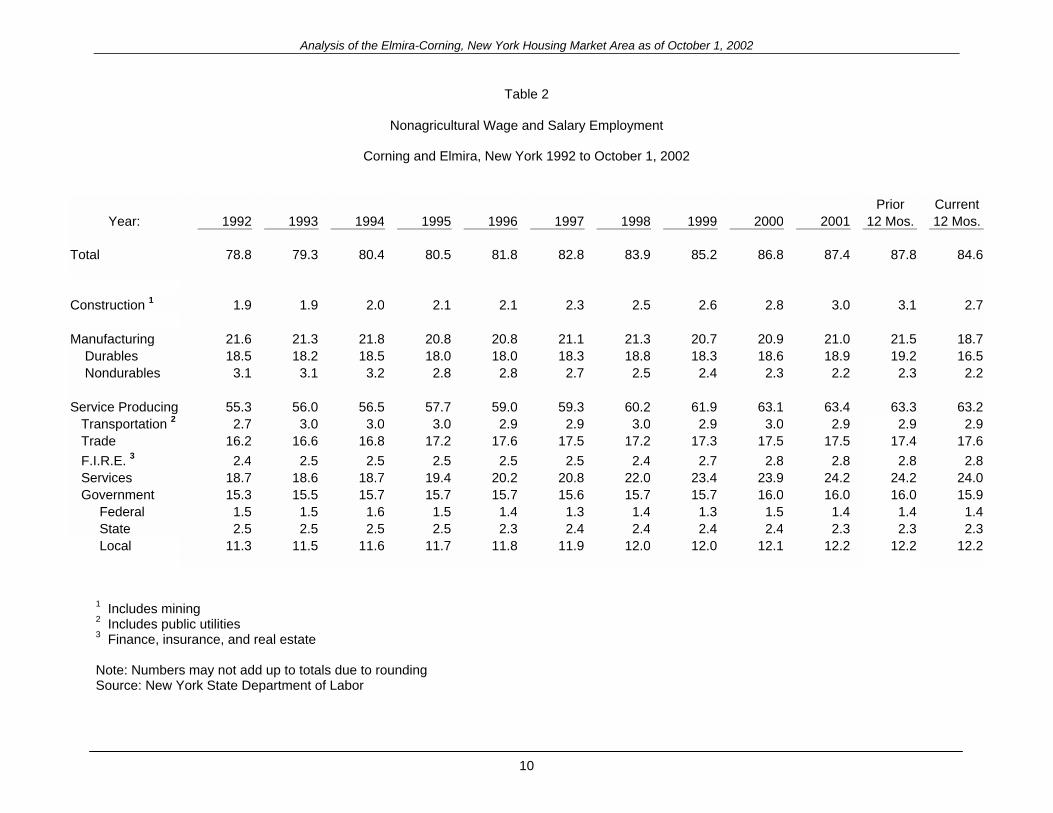
Another major economic factor in the HMA is the Arnot Shopping Center, a regional retail center located in the western portion of Chemung County, which has more than 100 stores. The mall services a large part of the Southern Tier and portions of north central Pennsylvania. The labor force has been very stable during the previous 24 months. During the 12-month period ending in October 2002, the labor force averaged 91,200 persons. Trends in labor force, resident employment, and unemployment since 1992 are presented in Table 1. Employment in the Elmira-Corning HMA declined between 2000 and the Current date, the result of a slowing national economy and the rapid downturn in business conditions experienced by the fiber optics and durable goods sectors. Beginning in late 2001 and continuing into 2002, there was a sharp decrease in employment levels in the area due to the general recession and the downturn in the telecommunications industry. The rapid decline in demand for fiber optics and related products resulted in significant production cutbacks and layoffs at Corning, Inc. The recession and the bust in high technology eroded the economic gains of the later half of the 1990s in the HMA. During the 24 months ending in October 2002, nonagricultural employment growth slowed, in large part due to declines in the manufacturing sector. Average annual nonagricultural employment from 1992 through the Current date is presented in Table 2. Over the two-forecast period, the economy is expected to recover instep with the national economy. Nonagricultural employment is estimated to register a net increase of approximately 500 jobs annually during the forecast period. The labor force is also expected to increase but only nominally. Expansion of employment in the non-durable goods sector will be an important key to growth in demand for housing during the forecast period. This growth will be preceded by a slow economic recovery and subsequent re-hiring of local production workers that have been laid off in the HMA during the last 2 years. Nominal employment gains are also forecast in the service sector. Household Incomes
The median family income in Chemung County as of the 2000 census was $43,994, a 37 percent increase over the 1990 census figure. The median income in Steuben County was $41,940, a 38 percent increase. Estimated median income for Steuben County in 2002 was $46,100 versus $45,500 in Chemung County. Population
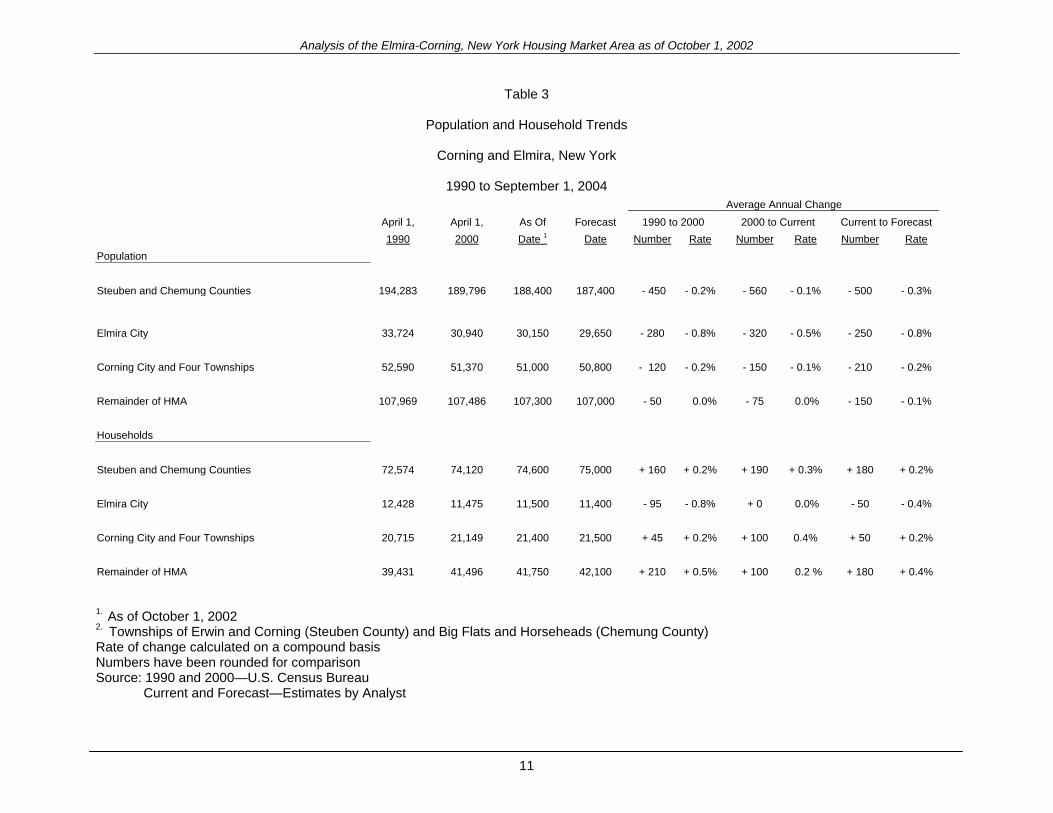
The population of the Elmira-Corning HMA, as of the 2000 census, was 189,796 persons, a loss of approximately 4,500 persons compared to the 1990 census. More than 60 percent of the population decline in the HMA in the decade occurred in the city of Elmira. As of the 2000 census, 16 percent of the population of the HMA lived in the city of Elmira and 27 percent resided in the Corning submarket area. The remainder of the HMA reported only nominal population change during the decade. Trends in population change for the HMA and the submarkets from 1990 to the Forecast date are presented in Table 3.
5
Analysis of the Elmira-Corning, New York Housing Market Area as of October 1, 2002
The population of the Elmira-Corning HMA as of the Current date was estimated to be 188,450 persons, or an average annual decline of 540 persons since the 2000 census. Population losses within the HMA as a whole and its three submarkets are the result of declines in net natural increase (resident births minus resident deaths) and continued net out-migration. During the past 12 years, the population of the HMA has declined an average of approximately 500 persons annually. The population of the HMA is expected to decrease to 187,400 by the end of the Forecast date, an average annual loss of 500 persons. This level of decline is comparable to the annual change between 1990 and 2000 and consistent with the average annual decline between 2000 and the Current date. The patterns and annual volumes of out-migration from Steuben and Chemung counties are not expected to change during the Forecast period. Households
There were an estimated 74,600 households in the HMA as of the Current date, an increase of 200 annually since the 2000 census. This compares with an annual average increase of 160 households between the 1990 and 2000 censuses. The trends in household growth from 1990 through the Forecast date are presented in Table 3. Reflecting the development of new homes and apartments and the increase in employment opportunities in the HMA, household growth since 1990 has been concentrated in the Corning submarket and the remainder of the HMA. Following the trend in population change between the 1990 and 2000 censuses, the number of households in the city of Elmira declined by an average of 95 households annually, during the period. From 2000 to the Current date, the number of households in Elmira has remained almost constant. From 2000 to the Current date, the number of households increased in the Corning submarket and the remainder of the HMA by an average of 100 annually in both areas. In contrast, the number of households increased in the Corning submarket by an average of 100 households annually. A comparable change also occurred in the remainder of the HMA during the same period. With a limited employment gains forecast, total household growth in the Elmira-Corning HMA during the 2-year Forecast period is estimated to be approximately 180 households annually. The city of Elmira is expected to continue to register small declines in households. Forecast household growth in the Corning and adjacent townships and the remainder of the HMA is projected to be comparable with average annual changes recorded between 1990 and 2000. Housing Inventory
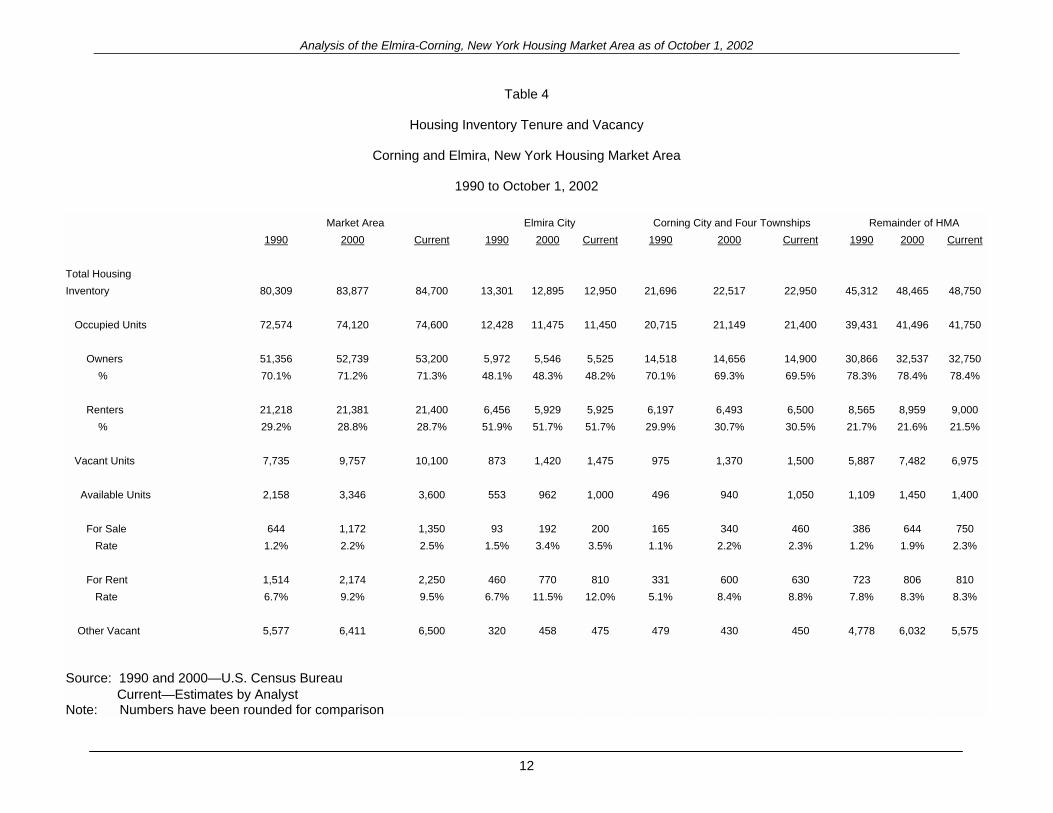
From 1990 to 2000, the housing inventory increased by an annual average of 360 units to 83,877 units. During the last half of the decade, housing production increased with demand due to the employment growth in fiber optics and related technology firms in the area. Since the 2000 census, the housing inventory of the HMA increased by an average of 310 units annually to an estimated 84,700, as of the Current date. Approximately 85 percent of the net additions to the inventory have been for owner housing. Table 4 presents the trend in the housing inventory between 1990 and the Current date.
6
Analysis of the Elmira-Corning, New York Housing Market Area as of October 1, 2002
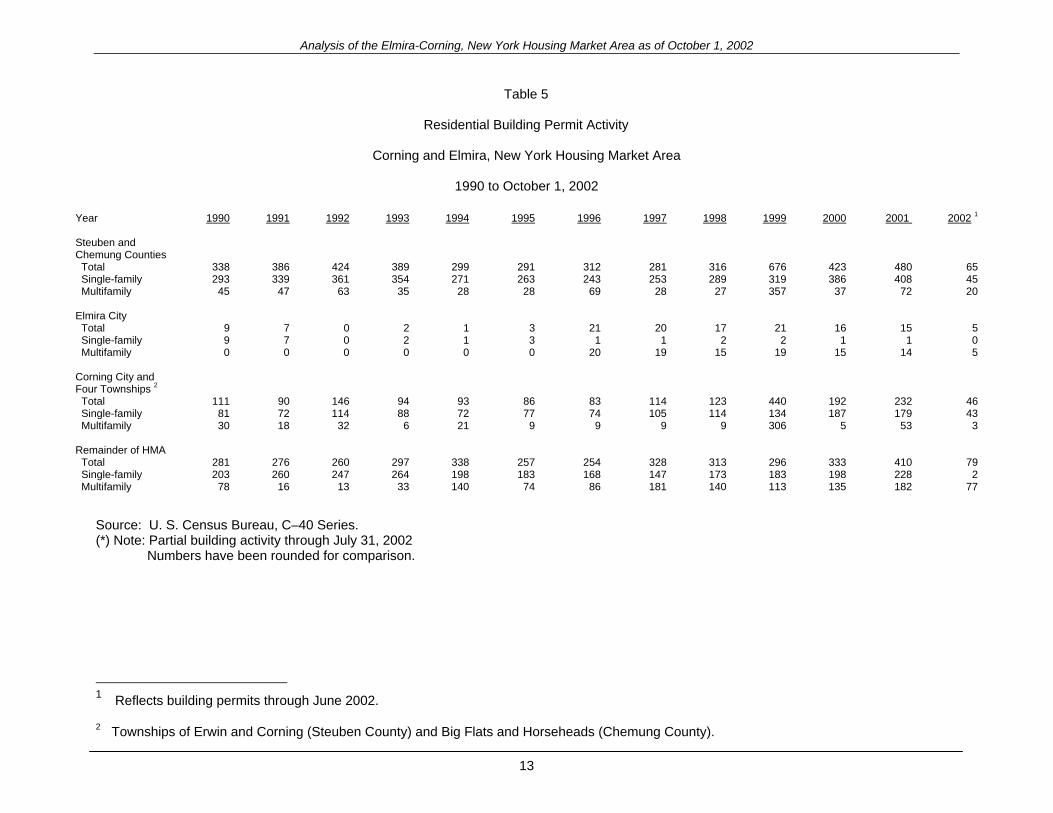
During most of the 1990s, multifamily rental housing construction averaged only 30 units per year. However with the expansion of the local economy beginning in 1998 several relatively large rental developments were built. The relocation of highly paid technical and professional employees into the housing market from 1996 through 2000 was the basis for the sustained annual increase in housing production. With the rapid expansion of technology firms and durable goods, multifamily construction activity peaked at more than 350 units in 1999, well above the average during the preceding 10 years. Many of the new apartment developments were targeted toward the new high-technology employees and had rents and amenities well above the existing rental stock in the HMA. Local real estate interests considered these apartment units to be the initial phase of a long-term apartment development boom that would be sustained by the emerging fiber optics industry. However, with the decline in the industry and the more competitive market conditions, multifamily construction has fallen sharply since 2001. In the first 7 months of 2002, permits were issued for only 20 multifamily units. Single-family housing production averaged approximately 325 units a year between 1990 and 1994. This volume decreased slightly to 275 units each year in the next 5 years. Homebuilding activity increased significantly in 2000 and 2001 as many middle management households relocating to the area contracted for construction of new single-family homes. Much of this new residential construction has been higher end single-family homes to accommodate the influx of high-wage managers, executives, scientists, and researchers. Most of the new sales housing is concentrated in subdivisions located along the Route 17 corridor that extends east and west between Corning and the Horseheads-Big Flats area. A significant portion of the new home market was priced between $300,000 and $450,000 and ranging in size from 3,200 to 3,600 square feet. Single-family permits have dropped to less than 50 units for the 7-month period ending July 2002. Table 5 summarizes annual building permit activity between 1990 and the Current date. Housing Vacancy
The Elmira-Corning area recorded significant increases in the number of vacant housing units between 1990 and 2000 in sales, rentals, and other vacancies. Some of the increase can be explained by continued population declines, which resulted in the low levels of annual household growth; and increases in production, which meet the demands of new households coming to the HMA. A portion of vacant housing units, designated by the census as “all other vacant,” increased during the 10 years between 1990 and 2000 as numerous recreational and lakeside resort and summer residences were constructed along the shoreline of Keuka Lake and adjacent areas near the village of Hammondsport. The relatively inexpensive land prices in the HMA and the area’s reputation for exceptional hunting and recreation have resulted in an increase in the construction of seasonal properties. As of the Current date, vacancies in sales housing totaled 1,350 homes, for a vacancy rate of 2.5 percent; and there were an estimated 2,250 vacant rental units, for an overall rental vacancy rate of 9.5 percent. Vacancy trends between 1990 and the Current date for the HMA and the three submarkets are presented in Table 4.
7
Analysis of the Elmira-Corning, New York Housing Market Area as of October 1, 2002
Sales Market Conditions
The sales market in the HMA as of the Current data was soft and can be primarily attributed to the effects of the recession in the national and local economies. Limited growth in the number of households, combined with an oversupply of new single-family homes at the high end of the market, has curtailed demand for single-family production during 2002. Existing single-family home sales have trended downward over the previous 3 years. According to the New York State Association of Realtors®, resales declined from 1,569 homes in 2000, to 1,431 in 2001, to 1,155 homes in 2002; or a 26 percent decrease. With the softer market, prices have also fallen. The median price in 2002 was approximately $67,500 compared to $72,500, 3 years earlier. The average price for a newly built single-family home in the Elmira-Corning HMA during 2002 was estimated to be $150,000. The sales market is projected to improve slightly during the Forecast period based on employment growth and an expectation of continued favorable interest rates. Rental Market Conditions
Overall, the rental market in the Elmira-Corning HMA is relatively balanced. However, conditions are very competitive in the newer higher-rent segment of the market. Interviews at selected “luxury type” apartment developments priced at $150 to $250 above the older rental stock in the HMA, document rising vacancy rates in the 12 months prior to the Current date. The major reason for the softer market conditions is the loss of high technology jobs in Steuben County. Rent concessions, special promotions, and aggressive marketing programs were underway at several of the larger properties as of August 2002 in an effort to maintain occupancy levels. The newer market rate rentals are expected to remain somewhat soft over the 24 months of the forecast period or until there are some major improvements in the local economy. It may take more than 3 years for the market to rebound and occupancy to increase to more balanced levels. The majority of older rental properties in the HMA have been unaffected by the swings in employment in the fiber optics and related high-technology sectors. Forecast Housing Demand
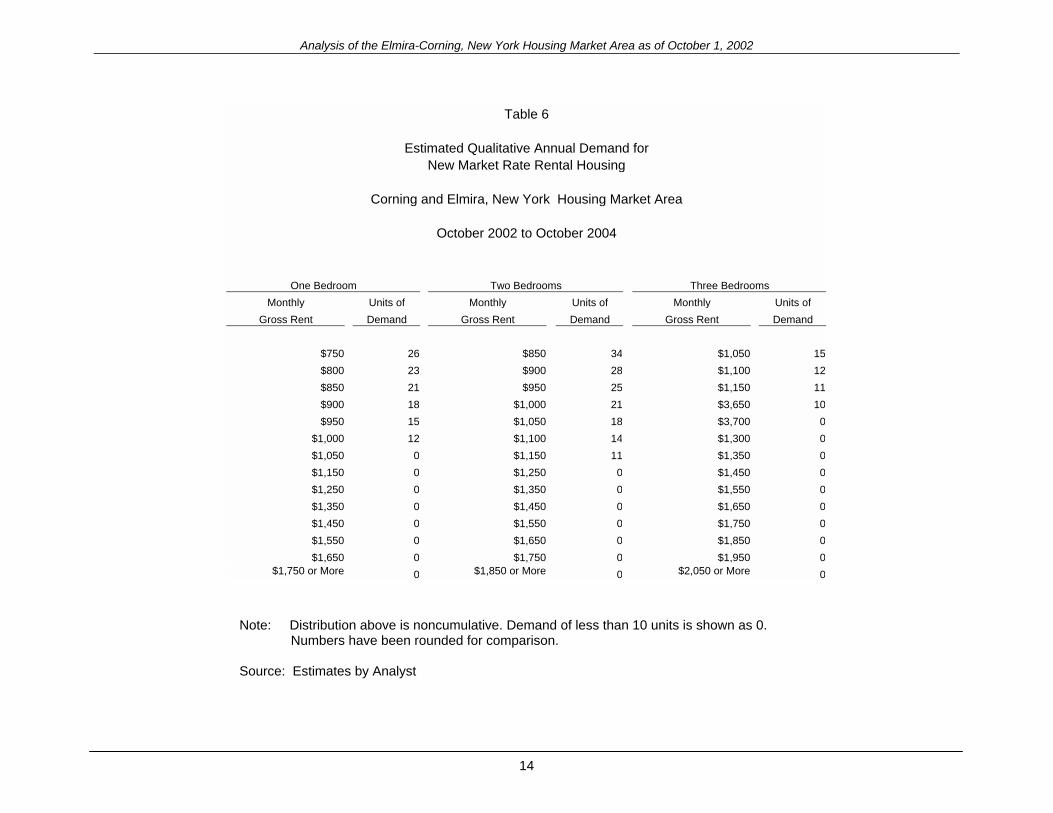
On the basis of the economic and demographic prospects in the HMA as of the Current date and the forecast, it is estimated that a total of 520 units of new housing would be an appropriate level of residential construction during the next 2 years, to maintain balanced conditions. The annual demand is estimated at 180 units of sales housing and 75 market rate rental units. The principal factor driving this demand is a projected household growth of 370 over the next 2 years. Owner households are expected to increase by 275 during the 2-year forecast and renter households are estimated to grow by 75. In addition, there will be a need to replace units lost from the inventory due to demolitions and other causes. The current annual forecast demand of for new sales housing is slightly below that of the historic rate of construction in the HMA. The distribution of demand for new rentals by bedroom size was based on the trends in production in recent years and the current pipeline. During the period, demand was strongest for two-bedroom units. It is estimated that there will be an annual demand for approximately 25 one-bedroom units at rents of $750 per month or more and 35 two-bedroom units at rents of $850 or more. A qualitative demand estimate for new rental housing in the HMA is presented in Table 6.
8
Analysis of the Elmira-Corning, New York Housing Market Area as of October 1, 2002
Table 1
Labor Force and Employment Trends
Corning and Elmira, New York Housing Market Area
1992 to October 1, 2002
Prior Current Year: 1992 1993 1994 1995 1996 1997 1998 1999 2000 2001 12 Mos. 12 Mos.
Labor Force 91,200 91,200 91,500 90,100 91,200 93,300 92,800 91,800 91,400 91,000 91,100 91,200 Employment 84,400 85,600 86,100 84,900 86,500 88,200 88,000 87,000 86,900 86,000 86,700 84,400 Unemployment 6,900 5,600 5,500 5,300 4,800 5,200 4,800 4,900 4,400 5,000 4,400 6,800 Rate 7.6% 6.1% 6.0% 5.9% 5.3% 5.6% 5.2% 5.3% 4.8% 5.5% 4.8% 7.5%
Source: New York State Department of Labor
9
Analysis of the Elmira-Corning, New York Housing Market Area as of October 1, 2002
Table 2
Nonagricultural Wage and Salary Employment
Corning and Elmira, New York 1992 to October 1, 2002
Prior Current
Year: 1992 1993 1994 1995 1996 1997 1998 1999 2000 2001 12 Mos. 12 Mos. Total 78.8 79.3 80.4 80.5 81.8 82.8 83.9 85.2 86.8 87.4 87.8 84.6 Construction 1 1.9 1.9 2.0 2.1 2.1 2.3 2.5 2.6 2.8 3.0 3.1 2.7 Manufacturing 21.6 21.3 21.8 20.8 20.8 21.1 21.3 20.7 20.9 21.0 21.5 18.7 Durables 18.5 18.2 18.5 18.0 18.0 18.3 18.8 18.3 18.6 18.9 19.2 16.5 Nondurables 3.1 3.1 3.2 2.8 2.8 2.7 2.5 2.4 2.3 2.2 2.3 2.2 Service Producing 55.3 56.0 56.5 57.7 59.0 59.3 60.2 61.9 63.1 63.4 63.3 63.2 Transportation 2 2.7 3.0 3.0 3.0 2.9 2.9 3.0 2.9 3.0 2.9 2.9 2.9 Trade 16.2 16.6 16.8 17.2 17.6 17.5 17.2 17.3 17.5 17.5 17.4 17.6 F.I.R.E. 3 2.4 2.5 2.5 2.5 2.5 2.5 2.4 2.7 2.8 2.8 2.8 2.8 Services 18.7 18.6 18.7 19.4 20.2 20.8 22.0 23.4 23.9 24.2 24.2 24.0 Government 15.3 15.5 15.7 15.7 15.7 15.6 15.7 15.7 16.0 16.0 16.0 15.9 Federal 1.5 1.5 1.6 1.5 1.4 1.3 1.4 1.3 1.5 1.4 1.4 1.4 State 2.5 2.5 2.5 2.5 2.3 2.4 2.4 2.4 2.4 2.3 2.3 2.3 Local 11.3 11.5 11.6 11.7 11.8 11.9 12.0 12.0 12.1 12.2 12.2 12.2
1 Includes mining 2 Includes public utilities 3 Finance, insurance, and real estate Note: Numbers may not add up to totals due to rounding Source: New York State Department of Labor
10
Analysis of the Elmira-Corning, New York Housing Market Area as of October 1, 2002
Table 3
Population and Household Trends
Corning and Elmira, New York
1990 to September 1, 2004 Average Annual Change
April 1, April 1, As Of Forecast 1990 to 2000 2000 to Current Current to Forecast 1990 2000 Date 1 Date Number Rate Number Rate Number Rate
Population Steuben and Chemung Counties 194,283 189,796 188,400 187,400 - 450 - 0.2% - 560 - 0.1% - 500 - 0.3%
Elmira City 33,724 30,940 30,150 29,650 - 280 - 0.8% - 320 - 0.5% - 250
- 0.8% Corning City and Four Townships 52,590 51,370 51,000 50,800 - 120 - 0.2% - 150 - 0.1% - 210 - 0.2% Remainder of HMA 107,969 107,486 107,300 107,000 - 50 0.0% - 75 0.0% - 150 - 0.1% Households Steuben and Chemung Counties 72,574 74,120 74,600 75,000 + 160 + 0.2% + 190 + 0.3% + 180 + 0.2% Elmira City 12,428 11,475 11,500 11,400 - 95 - 0.8% + 0 0.0% - 50 - 0.4% Corning City and Four Townships 20,715 21,149 21,400 21,500 + 45 + 0.2% + 100 0.4% + 50 + 0.2% Remainder of HMA 39,431 41,496 41,750 42,100 + 210 + 0.5% + 100 0.2 % + 180 + 0.4% 1. As of October 1, 2002 2. Townships of Erwin and Corning (Steuben County) and Big Flats and Horseheads (Chemung County) Rate of change calculated on a compound basis Numbers have been rounded for comparison Source: 1990 and 2000—U.S. Census Bureau Current and Forecast—Estimates by Analyst
11
Analysis of the Elmira-Corning, New York Housing Market Area as of October 1, 2002
Table 4
Housing Inventory Tenure and Vacancy
Corning and Elmira, New York Housing Market Area
1990 to October 1, 2002
Market Area Elmira City Corning City and Four Townships Remainder of HMA 1990 2000 Current 1990 2000 Current 1990 2000 Current 1990 2000 Current
Total Housing Inventory 80,309 83,877 84,700 13,301 12,895 12,950 21,696 22,517 22,950 45,312 48,465 48,750 Occupied Units 72,574 74,120 74,600 12,428 11,475 11,450 20,715 21,149 21,400 39,431 41,496 41,750 Owners 51,356 52,739 53,200 5,972 5,546 5,525 14,518 14,656 14,900 30,866 32,537 32,750 % 70.1% 71.2% 71.3% 48.1% 48.3% 48.2% 70.1% 69.3% 69.5% 78.3% 78.4% 78.4% Renters 21,218 21,381 21,400 6,456 5,929 5,925 6,197 6,493 6,500 8,565 8,959 9,000 % 29.2% 28.8% 28.7% 51.9% 51.7% 51.7% 29.9% 30.7% 30.5% 21.7% 21.6% 21.5% Vacant Units 7,735 9,757 10,100 873 1,420 1,475 975 1,370 1,500 5,887 7,482 6,975 Available Units 2,158 3,346 3,600 553 962 1,000 496 940 1,050 1,109 1,450 1,400 For Sale 644 1,172 1,350 93 192 200 165 340 460 386 644 750 Rate 1.2% 2.2% 2.5% 1.5% 3.4% 3.5% 1.1% 2.2% 2.3% 1.2% 1.9% 2.3% For Rent 1,514 2,174 2,250 460 770 810 331 600 630 723 806 810 Rate 6.7% 9.2% 9.5% 6.7% 11.5% 12.0% 5.1% 8.4% 8.8% 7.8% 8.3% 8.3% Other Vacant 5,577 6,411 6,500 320 458 475 479 430 450 4,778 6,032 5,575 Source: 1990 and 2000—U.S. Census Bureau Current—Estimates by Analyst Note: Numbers have been rounded for comparison
12
Analysis of the Elmira-Corning, New York Housing Market Area as of October 1, 2002
13
Table 5
Residential Building Permit Activity
Corning and Elmira, New York Housing Market Area
1990 to October 1, 2002
Year 1990 1991 1992 1993 1994 1995 1996 1997 1998 1999 2000 2001 2002 1
Steuben and Chemung Counties
Total 338 386 424 389 299 291 312 281 316 676 423 480 65 Single-family 293 339 361 354 271 263 243 253 289 319 386 408 45 Multifamily 45 47 63 35 28 28 69 28 27 357 37 72 20 Elmira City
Total 9 7 0 2 1 3 21 20 17 21 16 15 5 Single-family 9 7 0 2 1 3 1 1 2 2 1 1 0 Multifamily 0 0 0 0 0 0 20 19 15 19 15 14 5 Corning City and Four Townships 2
Total 111 90 146 94 93 86 83 114 123 440 192 232 46 Single-family 81 72 114 88 72 77 74 105 114 134 187 179 43 Multifamily 30 18 32 6 21 9 9 9 9 306 5 53 3 Remainder of HMA
Total 281 276 260 297 338 257 254 328 313 296 333 410 79 Single-family 203 260 247 264 198 183 168 147 173 183 198 228 2 Multifamily 78 16 13 33 140 74 86 181 140 113 135 182 77
Source: U. S. Census Bureau, C–40 Series. (*) Note: Partial building activity through July 31, 2002 Numbers have been rounded for comparison.
1 Reflects building permits through June 2002. 2 Townships of Erwin and Corning (Steuben County) and Big Flats and Horseheads (Chemung County).
Analysis of the Elmira-Corning, New York Housing Market Area as of October 1, 2002
14
Table 6
Estimated Qualitative Annual Demand for
New Market Rate Rental Housing
Corning and Elmira, New York Housing Market Area
October 2002 to October 2004
One Bedroom Two Bedrooms Three Bedrooms Monthly Units of Monthly Units of Monthly Units of
Gross Rent Demand Gross Rent Demand Gross Rent Demand
$750 26 $850 34 $1,050 15$800 23 $900 28 $1,100 12$850 21 $950 25 $1,150 11$900 18 $1,000 21 $3,650 10$950 15 $1,050 18 $3,700 0
$1,000 12 $1,100 14 $1,300 0$1,050 0 $1,150 11 $1,350 0$1,150 0 $1,250 0 $1,450 0$1,250 0 $1,350 0 $1,550 0$1,350 0 $1,450 0 $1,650 0$1,450 0 $1,550 0 $1,750 0$1,550 0 $1,650 0 $1,850 0$1,650 0 $1,750 0 $1,950 0
$1,750 or More 0 $1,850 or More 0 $2,050 or More 0
Note: Distribution above is noncumulative. Demand of less than 10 units is shown as 0. Numbers have been rounded for comparison.
Source: Estimates by Analyst


![[[Chemung Schuyler Steuben]] LOCAL PLAN · Alfred State College, Corning Community College, Elmira College, GST BOCES, as well as a host of equipment (OEM) and business/skill-specific](https://img.dokumen.tips/doc/110x75/5fca7c013adaa26de6454400/chemung-schuyler-steuben-local-plan-alfred-state-college-corning-community.jpg)