Embed Size (px)
Citation preview

ANALYSIS OF POWER DRAW IN BALL MILLS BY THE
DISCRETE ELEMENT METHOD
AMLAN DATTA* B. K. MISHRA1{ and R. K. RAJAMANIComminution Center, University of Utah, Salt Lake City, UT 84112, USA
(Received 28 October 1997; received in revised form 1 December 1998; accepted 1 December 1998)
AbstractÐBall mills, like other comminution devices, consume large amounts of energy. Mill operatorsoften have to assess the power draft of mills for an entirely di�erent set of operating conditions or fora recon®gured circuit. It is shown that the power draft can be accurately predicted from analysis of themotion of the charge. The motion of the charge is rigorously simulated with a numerical techniqueknown as Discrete Element Method (DEM). In this technique, the coordinates and velocities of each in-dividual ball are computed from a knowledge of forces arising when balls collide with each other andwith mill shell and lifter walls. First, simulation results on a wide range of ball mills are compared withavailable experimental data. Then the power draft predictions as a function of a few operating variablesare shown. The unique feature of this method is that the mill power can be predicted for a mixture ofball sizes, di�erent lifter geometry and lifter spacing, which is absent in other methods proposed in theliterature. # 1999 Canadian Institute of Mining and Metallurgy. Published by Elsevier Science Ltd. Allrights reserved
Re sumeÂÐLes broyeurs aÁ billes, comme d'autres appareils de comminution, consommenme grande quan-tite d'energie. Les ope rateurs de broyeurs ont souvent aÁ e valueda demande de courant de broyeurs ayantun ensemble compleÁ tement di�e rent de conditions d'ope rations ou d'un circuit recon®gure . On montrequ'aÁ partir de l'analyse du mouvement de lacharge, l'on peut pre dire pre cise ment la demande de courant.Le mouvement de la charge est simule rigoureusement par un technique nume rique connue sous le nom deme thode des e le ments ®nis (MEF). Par cette techniquen calcule les coordonne es et la ve locite de chaquebille individuelle, aÁ partir de donnaissance des forces qui se produisent lorsque les billes entrent on col-lision loanes avec les autres et avec le reveà tement du broyeur et les parois deeames. En premier lieu, lesre sultats de la simulation d'un grand nombre de broyeursaÁ billes sont compare s avec les donne es expe ri-mentales disponibles. Ensuite, on montre les pre dictions de demande de courant en fonction de quelquesvariables d'ope ration. La caracte ristique unique de cette me thode est que l'on peut pre dire le courantbroyeur pour un me lange de taille de billes et pour di�e rentes ge ome tries des cames di�e rents espace-ments, ce qui manque chez d'autres me thodes propose es dans la litte rature. # 1999 Canadian Institute ofMining and Metallurgy. Published by Elsevier Science Ltd. All rights reserved
NOMENCLATURE
C damping coe�cientD diameter of ball mill (m)E energy loss in mill (joules)F, Fn, Fs force (Newton)I moment of inertia of a disc (kg � m2)J fractional mill ®llingK sti�ness coe�cientL length of ball mill (m)M moment of a ball about its centroidMb mass of mill charge (kg)N mill speed (rpm)Nr mill speed as a function of radius (rpm)P mill power draft (watt)T torque needed to rotate the mill (N.m)m mass of a ballri inner radius of charge (m)rg distance between mill center and center of gravity of
charge (m)
rm mill radius (m)vn normal velocity (m/sec)Dt time step (sec)xi linear displacement of disc (m)
Greek lettersa angle of repose of chargeb model parameterf fraction of critical mill speedy angle describing the mill ®llingyS shoulder angle of chargeyT toe angle of chargey angular acceleration of ballr bulk density of ball charge (dimension depends upon the model)
INTRODUCTION
Comminution equipment consumes a large amount of
electrical energy in a mineral processing plant and the ball
mill is no exception. Since the net energy supplied to the mill
is responsible for tumbling the mill charge, fundamental
Canadian Metallurgical Quarterly Vol. 38, No. 2, pp. 133±140, 1999# 1999 Canadian Institute of Mining and Metallurgy Published by Elsevier Science Ltd. All rights reserved
Printed in Great Britain0008-4433/99 $19.00+0.00
PII: S0008-4433(98)00039-1
*Author to whom correspondence should be addressed. Tel.: +1-801-581-6386; fax: +1-801-581-4937. E-mail: [email protected].
1Currently at Indian Institute of Technology, Kanpur 208016, India.
133

understanding of the mechanics of charge motion inside themill is of great importance. This knowledge would eventually
lead to the correct prediction of power and consequentlyoptimization of the process. Therefore, accurate prediction ofpower has received considerable attention in the past few
decades. The ®rst systematic formulation of power draft byanalyzing ball trajectories goes back to 1919 [1] and sincethen a considerable amount of e�ort has been put to
correlate power draft and operating and design parametersof the ball mill. However, most of the theoretical formulaeavailable to quantify power draft until now, do not take into
account the underlying mechanics of the motion of the ballcharge. Besides, it is easy to calculate the trajectory of asingle ball, but the complexity arises when the samecalculation is done for thousands of balls simultaneously.
With modern day computers and suitable numericaltechniques it is possible to compute the trajectory of eachball in the charge, while they interact with one another.
In the earlier work, researchers took a continuumapproach, where the whole mill charge is considered as asingle body and modeled power draft from the torque-arm
principle. The torque necessary to maintain the o�set in thecenter of gravity of the cascading charge from the restposition is given by:
T �Mbrg sin a �1�
where, T is the torque, Mb is the mass of the balls, rg is thedistance from the mill center to the center of gravity of theload, and a is the angle of repose of the ball charge. For a
mill running at a speed of N revolutions per minute, thepower draft is given by:
P � 2pTN �2�A number of researchers [2±6] have derived empirical modelsas shown in Table 1, using this concept. Here, mill power iscorrelated with mill diameter (D), mill length (L), charge
angle of repose (a), mill ®lling (J), mill speed (f or N), bulkdensity of charge (r), acceleration due to gravity (g) andangle related to mill ®lling (y).The charge inside the mill expands and contracts as the
mill revolves. Hence, the center of gravity also keepschanging position. Moreover, the angular speed of the milland mass of balls within the mill in¯uence the pro®le of the
cascading charge which results in the torque being a complexfunction of all the operating variables, not as simple as
implied in many of the empirical formulae [7]. Theseempirical models lack detailed information aboutinteractions among the entities of the mill charge and also,
most of them contain several unknown parameters. Due toall of these shortcomings, these formulae ®nd very restrictedpractical application.
Powel and Nurick [8] extended the same idea one stepahead and appropriately identi®ed the importance ofincluding the balls in free ¯ight in the model. In this context,
a term called Center Of Mass (COM) has been de®ned. Itdenotes the points in the mill where if all the mass iscondensed would exert an equivalent torque-arm from thecenter of mill. A linear relationship of mill speed and
angular location of COM was established from experimentaldata. The correlation certainly needs to be veri®ed for largemills, because the mechanics of charge motion would be
di�erent for a laboratory mill and an industrial mill.Moreover, the methodology for determining the location ofballs, which is needed to calculate COM, is too simplistic to
depict a real situation.Recently, Morrell [9] developed a model based on the
motion of charge, although presuming the motion to be
con®ned between a ®xed shoulder and toe angular positions.It is assumed that the active zone of charge occupies theplace between an inner radius (ri) and the mill radius (rm)and the extent of this zone is limited by toe (yT) and
shoulder (yS). If the angular speed (velocities of upward anddownward moving balls) of the balls is Nr,, the power draftof a mill of length L and bulk density of charge r, is given
by:
P � 2pgLr�rm
ri
�yS
ytNrr
2 cos y dy dr �3�
Later on, all the variables, for example, ri, rm, yT and yS arecalculated from operating conditions using a few empirical
correlations. Morrell carefully included slippage betweenlayers of balls by expressing Nr as a function of radialposition. The model can also take care of charge constitutedby materials of di�erent densities, as is the case in semi-
autogeneous mill. All these advanced features made themodel quite comprehensive. However, the toe and shoulderpositions of industrial mill are calculated from the same
correlation obtained from a laboratory mill and that is notquite acceptable. The reason is that the intensity of force atthe ball-ball and ball-wall interface will not be same for two
di�erent mills. Nevertheless, despite its simpli®ed approachthe model claims a greater degree of accuracy than theprevious empirical models.In this study, a new method of estimating power draw is
shown. The mill is simulated with a computer code,developed on the basis of discrete element method (DEM).The strength of this method is its fundamental approach,
robustness and lack of any empiricism. The veri®cation ofthis technique, followed by a summary of results showing thee�ects of various design and operating conditions on mill
power, is presented here.
Table 1. . Power draw formulae
Bond [2]P � 12:26rLD2:3J�1ÿ 0:937J ��1ÿ 0:1=29±10f�Hogg and Fuerstenau [3]P � 3:627rfLD2:5 sin3y sin aGuerrero and Arbiter [4]P � 3:627rfLD2:5f �J �Harris et al. [5]P � 9:69rfLD2:5J�1ÿ J �Harris et al. [5]P � 1:88mgfD0:5�1ÿ J � sin aMoys [6]P � KD2:3 sin arLJ�1ÿ bJ �N
A. DATTA et al. : ANALYSIS OF POWER DRAW IN BALL MILLS BY THE DISCRETE ELEMENT METHOD134

THE NUMERICAL METHOD
The numerical method that has been adopted here is calledDiscrete Element Method (DEM). The original techniquewas pioneered by Cundall and Strack in 1979 [10] for
simulating discrete, but interacting bodies. Therefore, thediscrete element method is a suitable choice for modeling theinternal dynamics of ball mill, where balls and the mill shellare treated as geometrically inviolate elements [11].
The discrete element analysis starts with a mathematicalrepresentation of the entities. Ideally the system should besimulated in three dimensions. But, in the case of ball mill
one can assume that the axial motion in either direction isminimal so it can be simulated in two dimensions, where themill is considered to be made up of several circular
compartments containing one layer of ballsÐand one ofthese compartments is the system of our interest. In thatway, the computational complexity is reduced to a great
extent. In two dimensions, a ball is visualized as a circle ordisc that has the mass of a sphere of same diameter, whereasthe mill wall is represented by straight lines. Each of thesediscs and lines are treated as separate elements. Another
important aspect of DEM simulation is the modeling of thecontact points between two elements. Here, the contacts aremodeled with two imaginary pairs of spring and dashpot,
one each in the normal and shear directions. The internalrestoring force is simulated by the spring, while the dashpotmodels the damped fraction of the force. Coe�cient of
friction plays a role at the contact where the absolutevalue of the force in the shear direction is never allowedto increase beyond a limiting value given by the productof normal force and coe�cient of friction. The dynamic
force balance for each ball can be written in the generalform as:
m �x i � C _x i � Kxi � Fi, i � 1,2 �4�
I�y �X2i�1�Kxi � C _x i �Li �M, i � 1,2 �5�
where m, I, C, and K are the mass, moment of inertia,damping, and sti�ness matrix respectively; F is the applied
force vector; M is the moment about the centroid of disc; Li
is the perpendicular distance from the line of action of forceto the centroid of the ball and xi is the position vector. The
major computational tasks of DEM in each time step are asfollows: (a) detection of contacts between an element and itsneighbors; (b) computation of contact forces from relative
displacement between elements employing the contactdeformation equation (Eq. 4) and contact properties; (c)summation of contact forces to determine total unbalancedforce; (d) computation of acceleration from force, followed
by velocity and displacement by integrating acceleration; (e)updating the position of wall and ball elements. The angulardisplacement of the disc is also calculated after obtaining the
moment about its center from Eq. 5. Contact detection takesthe bulk of the computational time. For this reason, themotion of the balls is monitored within a sub region of the
system and summed over all the sub regions. Repetition of
the same scheme for all the elements gives the ball chargemotion in one-time steps. The integration of acceleration is
carried out by ®nite di�erence approximation. Therefore, inorder to maintain computational stability, a very smalltime step, generally in the order of 10ÿ5 s, is used. The
simplicity of the method is quite tangible. DEM appliesNewton's second law of motion to compute the accelerationof a moving body from the net force applied on it and the
force is calculated from the physical properties of thematerial.A computation of the mill power draft can be easily
obtained from the simulation of ball charge motion. Thepower supplied to the mill is expended to keep the ballcharge in motion. While doing this work, energy is alsoexpended in friction and collisions. At each collision, a part
of the total energy is lost, which is mimicked by the dashpot.Thus, the product of normal and shear force on the dashpotand respective displacement give the energy lost at that
contact. The energy lost in two-dimensional calculation isexpressed in the following way:
E �Xt
Xk
��Fn � vnDt� � �Fs � vsDt�� �6�
Here, F is the dissipative force and v is the velocity of the
element. The subscripts n and s denote normal and sheardirection at the contact point. As shown in the expression,the energy loss term is summed up over all the collisions (k)for all the time steps (t).
As mentioned earlier, the mill is a combination of severalaxially symmetric compartments. The above expression givesthe energy lost in one such compartment of the mill which
needs to be multiplied by number of compartments tocalculate the energy supplied to the mill. Since the same mill®lling and ball size distribution are used to generate the discs
in two dimensional simulation, the ratio of total mass of ballin the actual mill and the mass of ball in one compartmentprovides the total number of compartments. Thus, the net
mill power draft is computed from the DEM simulation of asingle compartment.There are four important contact parameters that should
be speci®ed to simulate a mill. They are normal and shear
sti�ness, coe�cient of restitution and coe�cient of friction.Generally, these parameters are determined experimentallyfor di�erent materials, for example, steel±steel contact or
steel±rubber contact. However, coe�cient of restitutionand friction depends upon the environment inside the mill.Therefore, they need to be ®ne-tuned using experimental
mill power data. Afterwards, the same set of parameterscan be used for simulation of the same mill for widerange of operating conditions. A standard set ofparameters used for simulation of 0.762-m diameter by
0.457-m length mill in this study is presented in Table 2.A typical snapshot of the charge motion in this millis shown in Fig. 1. In small pilot mills of this type
both cascading and cataracting motions are seen even atlow mill speed. It is this unique feature of visualizingcharge motion that makes DEM an attractive modeling
tool.
A. DATTA et al. : ANALYSIS OF POWER DRAW IN BALL MILLS BY THE DISCRETE ELEMENT METHOD 135

POWER DRAW ANALYSIS
A substantial fraction of the energy lost in the collisions isresponsible for breakage of ore in a ball mill and the rest ofit causes the wear of grinding media and the mill wall. Thus,
prior information regarding the power draw is quiteimportant from the operational standpoint so that maximumthroughput can be achieved with minimum loss of material
from balls and mill shell. In subsequent sections, theprediction of power draw from DEM simulation is comparedwith the practical data and, along with that, the in¯uence of
various design and operating parameters on mill power isstudied with simulation results.
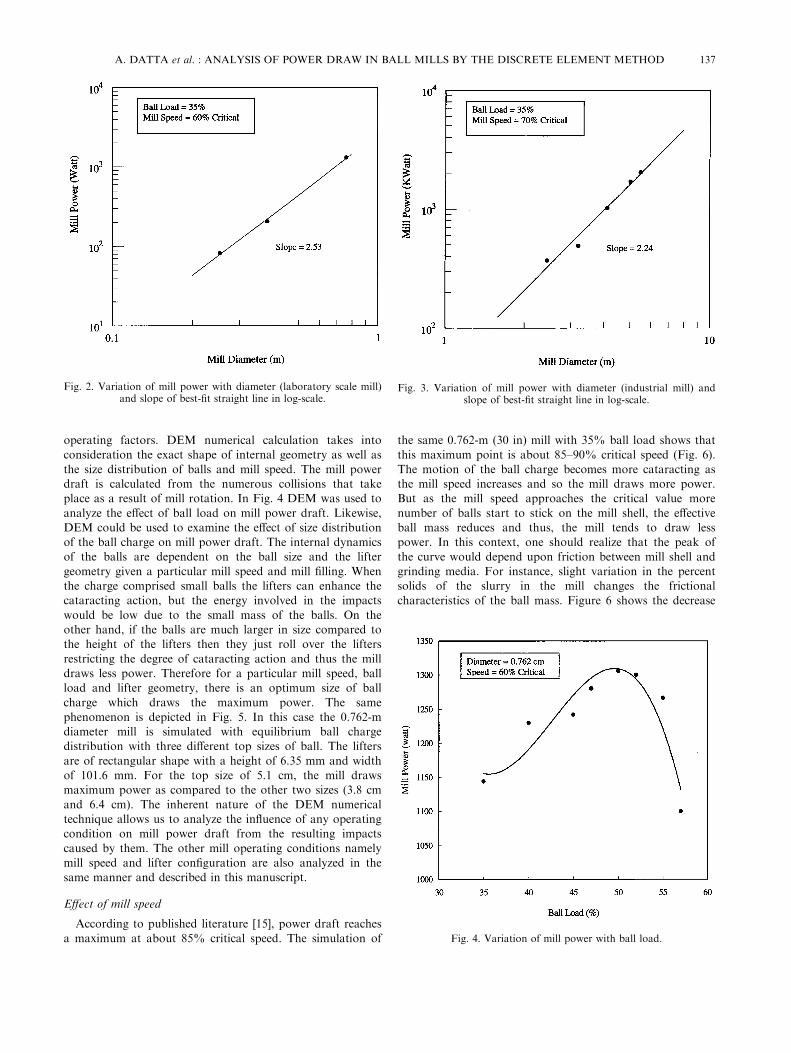
E�ect of mill diameter
A genuine di�culty with modeling of mill power is the
fact that the internal dynamics di�ers signi®cantly between asmall and large mill, even if identical operating conditionsare maintained. That is why the earlier research work failed
to develop a model that works for all mill sizes. In thisstudy, mills ranging in size from 0.254-m diameter laboratorymill to 4.11-m diameter industrial mill were simulated by
DEM. The results (Table 3) clearly show the accuracy ofpower draft predictions. The robustness of the method isattributed to its fundamental approach.
In a simplistic way, it can be assumed that the number ofcollisions is proportional to the number of balls multipliedby frequency of collisions. The number of balls isproportional to D2L, mill rotation is proportional to 1/D0.5
and the height up to which balls are raised is a fraction of D,hence mill power draft is proportional to D2.5. Mill powerdraft was predicted for di�erent diameter laboratory mills
(Fig. 2) and industrial mills (Fig. 3), operating underidentical conditions. The best-®t straight line in log scale has
a slope of 2.5 for the laboratory mill, which is in good
agreement with the original correlation. But, for industrialmills the power draft appears to be proportional to D2.24. Inthis context, it should be mentioned that Bond also observed
a similar correlation experimentally and used the term `D2.3'in his formula (Table 1). In a nutshell, it is shown that DEMis able to account for this subtle aspect of ball motion in
mills of widely varying diameter.
E�ect of mill ®lling
Bond's power draw equation (Table 1) suggests that
PAJ�1ÿ 0:937J � �9�where, J is ball load. The ball load, at which the mill drawsmaximum power, is about 53%. The simulation results of
0.762-m mill running at 60% critical speed are plotted inFig. 4. The relevant operating and simulation parameters arelisted in Table 3. The calculated power draft is maximum atabout 50% ball load. According to Eq. 1, mill power is a
function of ball mass (Mb) and the distance between millcenter and the center of gravity of ball mass (rg). So, as themill ®lling increases Mb goes up, but rg decreases. Therefore,
the power draft passes through a maximum. However, thevalue of this critical mill ®lling is also in¯uenced by other
Table 2. . Simulation parameters for 0.762-m diameter � 0.457 m
length mill
Normal sti�ness 400,000 N/mShear sti�ness 300,000 N/mCoe�cient of friction 0.6Coe�cient of restitution 0.5Time step 1 � 10ÿ5
Number of lifters 8Lifter dimension (rectangular) 0.635 � 10.2 cmBall ®lling 35%Ball size distribution 3.8 cm (53%), 2.5 cm (30%),
1.9 cm (12%) 1.3 cm (5%)60% critical speed 29 rpm
Fig. 1. Simulated charge motion of 0.762-m mill.
Table 3. . Comparison of predicted and measured mill power
Mill diameter (m)� length (m) Mill ®lling (%) Mill speed (% critical) Measured power (kW) Predicted power (kW) Reference
0.254�0.292 50 60 0.082 0.071 120.381�0.292 50 60 0.209 0.207 120.550�0.304 38 87 0.495 0.521 70.762�0.457 50 60 1.215 1.306 121.80�0.448 43 91 6.24 6.09 132.04�2.72 37 74 105 114 144.11�5.49 34 77 1324 1318 14
A. DATTA et al. : ANALYSIS OF POWER DRAW IN BALL MILLS BY THE DISCRETE ELEMENT METHOD136
operating factors. DEM numerical calculation takes intoconsideration the exact shape of internal geometry as well as
the size distribution of balls and mill speed. The mill powerdraft is calculated from the numerous collisions that takeplace as a result of mill rotation. In Fig. 4 DEM was used to
analyze the e�ect of ball load on mill power draft. Likewise,DEM could be used to examine the e�ect of size distributionof the ball charge on mill power draft. The internal dynamicsof the balls are dependent on the ball size and the lifter
geometry given a particular mill speed and mill ®lling. Whenthe charge comprised small balls the lifters can enhance thecataracting action, but the energy involved in the impacts
would be low due to the small mass of the balls. On theother hand, if the balls are much larger in size compared tothe height of the lifters then they just roll over the lifters
restricting the degree of cataracting action and thus the milldraws less power. Therefore for a particular mill speed, ballload and lifter geometry, there is an optimum size of ball
charge which draws the maximum power. The samephenomenon is depicted in Fig. 5. In this case the 0.762-mdiameter mill is simulated with equilibrium ball chargedistribution with three di�erent top sizes of ball. The lifters
are of rectangular shape with a height of 6.35 mm and widthof 101.6 mm. For the top size of 5.1 cm, the mill drawsmaximum power as compared to the other two sizes (3.8 cm
and 6.4 cm). The inherent nature of the DEM numericaltechnique allows us to analyze the in¯uence of any operatingcondition on mill power draft from the resulting impacts
caused by them. The other mill operating conditions namelymill speed and lifter con®guration are also analyzed in thesame manner and described in this manuscript.
E�ect of mill speed
According to published literature [15], power draft reaches
a maximum at about 85% critical speed. The simulation of
the same 0.762-m (30 in) mill with 35% ball load shows that
this maximum point is about 85±90% critical speed (Fig. 6).The motion of the ball charge becomes more cataracting asthe mill speed increases and so the mill draws more power.But as the mill speed approaches the critical value more
number of balls start to stick on the mill shell, the e�ectiveball mass reduces and thus, the mill tends to draw lesspower. In this context, one should realize that the peak of
the curve would depend upon friction between mill shell andgrinding media. For instance, slight variation in the percentsolids of the slurry in the mill changes the frictional
characteristics of the ball mass. Figure 6 shows the decrease
Fig. 2. Variation of mill power with diameter (laboratory scale mill)and slope of best-®t straight line in log-scale.
Fig. 3. Variation of mill power with diameter (industrial mill) andslope of best-®t straight line in log-scale.
Fig. 4. Variation of mill power with ball load.
A. DATTA et al. : ANALYSIS OF POWER DRAW IN BALL MILLS BY THE DISCRETE ELEMENT METHOD 137

in the mill power draft as the friction coe�cient decreases.This decrease in friction re¯ects either a dilute slurry or aslurry that ¯ows easily as ®ner particles accumulate. Also,
the rubber lifter would exhibit a higher frictional e�ect thansteel liners. Once again the power of DEM is demonstratedin its ability to incorporate such details. However, some
other experimental work is necessary to quantify the frictioncoe�cient of a ball charge in a speci®c slurry.
E�ect of lifter-bar
Discrete element method (DEM) computes the mill powerfrom very fundamental modeling principles of colliding
bodies. Thus, power draft predicted by DEM takes intoaccount the changes in lifter design in terms of materialproperties, geometry and arrangement. This is a uniquefeature of this numerical technique, because none of the
existing models for power draw is capable of accounting forthe lifter dimensions or the number of lifters or even the ballsize distribution. The design of lifter-bars should be such
that the mill is able to draw adequate power to achievemaximum throughput and at the same time, minimize linerdamage. All the simulations related to the study of e�ect of
lifter-bars, were conducted for a 0.762-m diameter milloperating at 35% ball load and 60% critical speed.Two successive lifters lock-up the ball mass and raise them
to a height thus working against gravity. The presence oflifters restricts the slippage of charge and enhances thetumbling action of the grinding media. The power needed toaccomplish this is proportional to the height of lift and
consequent cataracting and cascading of charge. Even thefrictional force existing between balls and between ball massand mill shell in¯uences the height of lift. Thus, there is a
di�erence in lifting action when the size and mass of the ballcharge are varied.The variation of power with respect to the lifter height is
shown in Fig. 7. The motion of the ball mass becomes more
vigorous as the lifter height increases. But after a certainlimit, the e�ective volume of mill reduces which restricts themotion of media and the mill power reduces. For the same
reason, lifting action and mill-power signi®cantly alsodepend upon the number of lifters. When the lifters areclosely spaced, as is the case when the number of lifters isincreased, balls will be carried to a greater height if the ball
size remains unchanged. In other words, the extent ofcataracting motion will be enhanced with the increase inlifter number. But at the same point, the intervening gap
between two lifters reduces so much that the lifters just lock
Fig. 5. Variation of mill power with ball charge distribution. Fig. 6. Variation of mill power with mill speed and coe�cient of fric-tion.
Fig. 7. Variation of mill power with lifter height.
A. DATTA et al. : ANALYSIS OF POWER DRAW IN BALL MILLS BY THE DISCRETE ELEMENT METHOD138

the ball trapped between them. The lifters used in these
simulations are of rectangular shape with 2.5-cm height and
5.1-cm width and the top-ball size of the charge is 3.8 cm.
Therefore, beyond a certain number of lifters, depending
upon the other parameters, the mill starts behaving like one
with smooth liner and less volume. Thus power draft
decreases. This idea has been corroborated in Fig. 8, where
the DEM power draw calculation is shown as a function of
number of lifters.
The shape of the lifter is also a crucial factor for
optimizing mill operation. It is shown in Fig. 9 that for
same lifter height, base-width and number, the mill with
rectangular lifters draws maximum power. The mill power
with trapezoidal lifters is marginally less. Trapezoidal lifters
have a higher face angle. So, the extent of cataracting is
less than that with rectangular lifters due to early release of
locked-up charge. With triangular lifters, the ball charge
has even a lower shoulder angle. The leading face of the
triangular lifter is slanted. In other words, the face makes
an angle of 148 with the horizontal as the lifter travels
upward. Hence, the ball charge easily ¯ows away from the
face of the lifter, giving rise to a cascading ball charge. The
angle is calculated from the height and the base-width,
which as mentioned before, are maintained at ®xed values
for a common ground of comparison. For the same mill
speed, the rectangular lifter would produce some
cataracting. Semi-circular lifters practically do not lock-up
the charge at all. They just allow the balls to roll over,
causing a very limited degree of lifting. Obviously, a mill
with semi-circular lifters draws the least power. However,
one should note that the dimensions of lifters of any
particular shape are also very signi®cant for mill
performance. This particular aspect is shown in previous
section (Fig. 7), where the variation of mill power with
lifter height is depicted.
CONCLUSION
The net power drawn by the mill is an indication of itsoperational capacity. Ideally the mill should operate at
maximum power, while causing minimum damage to theliner wall. In this study, the mill power has been predictedby a numerical technique called the discrete element method
(DEM). The method has been validated by comparing theresults with the measured value of mill power for laboratoryscale as well as industrial scale mills. In all the cases,
predictions were very close to measured data. The variationof mill power with respect to mill diameter, mill load andmill speed was studied by DEM. Interestingly, all the resultsclosely followed the trends given in the literature.
One unique feature of this method is its ability to considerlifter characteristics in predicting the mill power. Therelationships between power draft and lifter height, number
of lifters and lifter geometry have been presented here.All this information is very promising for carrying out
further research in the line of mill design. The power draft is
computed from the energy expended in the mill, which isnothing but the summation of all the collision energies.Hence, the numerical simulation also gives us a completeaccount of those collisions. With this information about the
collisions occurring in the mill, a methodology can bedeveloped to estimate the product size distribution as well asthe liner life [16] of the mill and correlate them with the mill
power draft.
REFERENCES
1. Davis, E. W., AIME transactions, 1919, 61, 250±296.2. Bond, F. C., Allis-Chalmers, Publication No. 07R9235C, 1961.3. Hogg, R. and Fuerstenau, D. W., Transactions SME/AIME,
1972, 252, 418±423.4. Guerrero, P. K. and Arbiter, N., Transactions SME/AIME,
1960, 217, 73.5. Harris, C. C., Schonock, E. M. and Arbiter, N., Miner. Process.
Tech. Rev., 1985, 1, 297±345.
Fig. 8. Variation of mill power with number of lifters.
Fig. 9. Variation of mill power with shape of lifter.
A. DATTA et al. : ANALYSIS OF POWER DRAW IN BALL MILLS BY THE DISCRETE ELEMENT METHOD 139

6. Moys, M. H., Preprints of 7th European symposium on comminu-tion, pp. 395±607, 1990.
7. Liddell, K. S. and Moys, M. H., J. S. Afr. Inst. Min. Metall.,1988, 88(2), 49±57.
8. Powel, M. S. and Nurick, G. S., Minerals Engg., 9, 259±268.9. Morrell, S., Prediction of grinding mill power, Trans. Inst. Min.
Metall., (Section C: Mineral Process. Extr. Metall., 1992, 101,C25±C32.
10. Cundall, P. A. and Strack, O. D. L., Geotechnique, 1979, 29, 47±65.
11. Mishra, B. K. and Rajamani, R. K., Applied MathematicalModelling, 1992, 16, 598±604.
12. Herbst, J. A., Siddique, M., Rajamani, R. K. and Sanchez, E.,Transaction SME/AIME, 1983, 272, 1945±1954.
13. Powel, M. S. and Vermeulen, L. A., Minerals Engg., 1994, 7(2/3), 169±183.
14. Data collected from industry (Svedela±Skega, Sweden andBarrick Mines, USA).
15. Austin, L. G., Klimpel, R. R. and Luckie, P. T., ProcessEngineering of Size Reduction: Ball Milling, SME publication,pp. 240, 1984.
16. Radziszewski, P., Canadian Met. Quart., 1997, 36(2), 87±93.
A. DATTA et al. : ANALYSIS OF POWER DRAW IN BALL MILLS BY THE DISCRETE ELEMENT METHOD140