Embed Size (px)
Citation preview
ORIGINAL ARTICLE
Analysis of bone mineral density distribution at trabecular bonesin thoracic and lumbar vertebrae using X-ray CT images
Tatsuro Hayashi • Huayue Chen • Kei Miyamoto •
Xiangrong Zhou • Takeshi Hara • Ryujiro Yokoyama •
Masayuki Kanematsu • Hiroaki Hoshi • Hiroshi Fujita
Received: 2 April 2009 / Accepted: 7 June 2010 / Published online: 16 July 2010
� The Japanese Society for Bone and Mineral Research and Springer 2010
Abstract The number of participants in thoracic or
abdominal examinations using multi-detector-row CT
(MDCT) has been increasing recently. If the degree of
progress of osteoporosis can be estimated using these
images, it may be useful as it will allow predictions of
vertebral fractures without an additional radiation expo-
sure. The aims of this study were to investigate segmental
variations in bone mineral density (BMD) distributions of
thoracic and lumbar vertebral bodies and to show specific
differences according to age and gender. A large database
including 1,031 Japanese subjects for whom MDCT was
used to examine various organs and tissues was utilized in
this study for trabecular BMD at thoracic and lumbar
vertebrae. In relationship to vertebral level, L3 had the
lowest trabecular BMD. BMD tended to gradually increase
from L3 to T1 in all age categories. Also, there was a
moderate correlation between vertebrae whose distance
from each other was great whereas there was a high cor-
relation between adjacent vertebrae. It may be appropriate
to use an arbitrary vertebra as a first approximation for
assessing vertebrae that are in the area of predilection for
the fracture; however, to better understand their behavior, it
may be necessary to measure BMD directly in this region.
This study showed trabecular BMD distribution at healthy
thoracic and lumbar vertebrae in Japanese subjects and
specific differences in age and gender. Improved knowl-
edge about vertebral BMD may help with the diagnosis of
primary osteoporosis using MDCT.
Keywords Vertebral trabecular bone � Bone mineral
density (BMD) � Vertebra � Osteoporosis � Quantitative
computed tomography (QCT)
Introduction
With osteoporosis, skeletal sites where trabecular bone is
predominant, such as the vertebrae, the bone of the fore-
arm, and femoral neck, are vulnerable to fracture. Coun-
termeasures against this disorder have become an
increasingly important public health problem because of
the rapidly aging populations. Early diagnosis of bone loss
is important for the prevention of vertebral fractures
because therapeutic drug treatments are the most effective
before the decrease of BMD affects bone fractures [1].
A definition of bone quality that includes bone mineral
density (BMD) was proposed by Bouxsein et al. [2]
T. Hayashi (&) � X. Zhou � T. Hara � H. Fujita
Department of Intelligent Image Information,
Division of Regeneration and Advanced Medical Sciences,
Graduate School of Medicine, Gifu University,
1-1 Yanagido, Gifu 501-1194, Japan
e-mail: [email protected]
H. Chen
Department of Anatomy, Division of Disease Control,
Graduate School of Medicine, Gifu University, Gifu, Japan
K. Miyamoto
Department of Reconstructive Surgery for Spine, Bone,
and Joint, Graduate School of Medicine,
Gifu University, Gifu, Japan
R. Yokoyama � M. Kanematsu
Department of Radiology Services,
Gifu University Hospital, Gifu, Japan
M. Kanematsu
Department of Radiology,
Gifu University Hospital, Gifu, Japan
H. Hoshi
Department of Radiology, Division of Tumor Control,
Graduate School of Medicine, Gifu University, Gifu, Japan
123
J Bone Miner Metab (2011) 29:174–185
DOI 10.1007/s00774-010-0204-1
because loss of bone mass is the most significant contrib-
utor to an increase in fracture risk. A greater understanding
of all aspects of bone quality is required to improve diag-
nostic techniques for osteoporosis [1].
In recent years, much research using micro-computed
tomography (lCT), which analyzes trabecular bones by
architectural parameters such as trabecular bone pattern
factors, has been reported [1, 3–8]. Because of the high
radiation doses involved, it has not yet been possible to use
this technique on human subjects in vivo. Work is in pro-
gress to adapt the lCT scanning technique so that it can be
used in vivo for human clinical applications. However,
McDonnell et al. [1] predict that, although it may be pos-
sible in the future to obtain high-resolution lCT images in
vivo at clinically relevant sites, such scans will be confined
to relatively small areas of bone. The prior knowledge on
BMD distribution at trabecular bones in thoracic and
lumbar vertebrae on X-ray CT images may help to estab-
lish the determination of vertebral level to be scanned by
lCT. Noninvasive bone mass measurement by peripheral
quantitative computed tomography (pQCT), which is
characterized as inexpensive, precise, and involving low
doses of radiation [9], has also been studied [10]. Sawada
et al. [10] attempted to monitor response to alendronate
therapy at the distal radius in postmenopausal women.
Recently, the number of participants in thoracic or
abdominal examinations using multi-detector-row CT
(MDCT) has been increasing. Thoracic or lumbar vertebrae
are included in these images. If the degree of progress of
osteoporosis can be estimated using these images, it may
be useful for participants as it will allow predictions of
vertebral fractures without additional radiation exposure.
As a similar consideration, Lenchik et al. [11] reported a
method of measuring the trabecular bone mineral density
(BMD) of thoracic vertebrae that uses cardiac-gated CT,
which was primarily intended for the measurement of
coronary vascular calcium.
However, at this time, the diagnostic criterion for pri-
mary osteoporosis using MDCT is not clear. Its establish-
ment requires exploration of the BMD distribution using
many subjects. Research exploring the BMD of vertebrae
using dual X-ray absorptiometry (DXA), based on thou-
sands of subjects (images), has been reported [12, 13].
Various studies exploring the BMD of vertebrae using
QCT have also been reported [3, 11, 14–27]. For instance,
Bouxsein et al. [14] explored the BMD of L1–L3 vertebral
bodies (including both cortical and trabecular bone) from
687 study subjects. Sigurdsson et al. [15] also reported the
BMD of L1–L2 vertebral bodies (including both cortical
and trabecular bone and areal BMD) from 1,715 study
subjects. Research focused on the vertebral level has
reported some findings, such as high BMD correlations of
adjacent vertebrae in thoracic and lumbar vertebrae [18],
and a difference of BMD distribution in cervical and sacral
vertebrae in comparison to thoracic and lumbar vertebrae
[17–19]. However, only a small number of study subjects
were analyzed. The analysis of BMD at different vertebral
levels is necessary because osteoporotic vertebral fractures
have been shown to occur most commonly in the midtho-
racic spine, and to a lesser extent in the thoracolumbar
junction, as described by Smet et al. [28]. If the BMD of
one vertebra is known, the BMD of other vertebrae may be
estimated using our knowledge of BMD correlations. This
observation suggests that the BMD of vertebra outside the
scope of CT images can be estimated (e.g., by estimating
the BMD of the thoracolumbar junction using CT images
from thoracic examination).
The aims of this study were to investigate segmental
variations in BMD distribution of thoracic and lumbar
vertebral bodies (vertebral trabecular bones) and to show
specific differences according to age and gender. To
improve our understanding of bone fragility, we attempted
to answer three key questions: (1) Does BMD of the ver-
tebrae differ by gender at each vertebral level? (2) Does the
correlation between BMD and age show a different pattern
at each vertebral level? (3) Can the BMD of the other
vertebrae be estimated using the BMD of one vertebra?
Improved knowledge of BMD correlations among thoracic
and lumbar vertebrae may help establish the diagnostic
criteria for primary osteoporosis using MDCT. Parts of this
research have been described in previous articles [24, 25].
Materials and methods
Study subjects
The study sample consisted of the first 1,750 enrolled
Japanese men and women with CT images from 2002 to
2006, scanned for the purpose of examinations of various
organs and tissues. The CT images included all thoracic
and lumbar vertebrae (LightSpeed Ultra; GE Yokogawa
Medical Systems, Tokyo, Japan) and were scanned for each
subject using standard settings (120 kV, auto mAs, 1.25-
mm-thick slice, pitch = 0.49–0.88 mm) routinely used
clinically. Slice intervals were modified to the same value
as the pitch using sinc interpolation to keep each voxel in
an isotropic size in three dimensions (3-D).
Of the 1,750 individuals with CT data available, 719
were excluded because of normal variants, bone pathology,
vertebral fractures, or reasons other than mild degenerative
changes at vertebrae, as confirmed by radiologists or ana-
tomic experts. The study subjects consisted, therefore, of
1,031 individuals: 490 men and 541 women. The study
subjects were then subdivided into four age categories to
observe age differences. The age categories were 40 or
J Bone Miner Metab (2011) 29:174–185 175
123
years or less (mean age = 30 years), 41–55 years (mean
age = 50 years), 56–70 years (mean age = 63 years), and
older than 71 years (mean age = 76 years). The distribu-
tion of our database is shown in Table 1. This research was
approved by the Institutional Review Board of Gifu
University.
Inhomogeneity of vertebral trabecular bones
Local measurement of BMD is possible using MDCT
because of its high resolution. However, clinical assess-
ment is limited to one or two thin slices, and QCT is
generally performed in the central part of the vertebral
body. If the BMD of the vertebral body is not homoge-
neous, an understanding of the lower BMD location inside
the vertebral body may be helpful to clinical diagnosis. To
investigate this, we have previously analyzed local BMD at
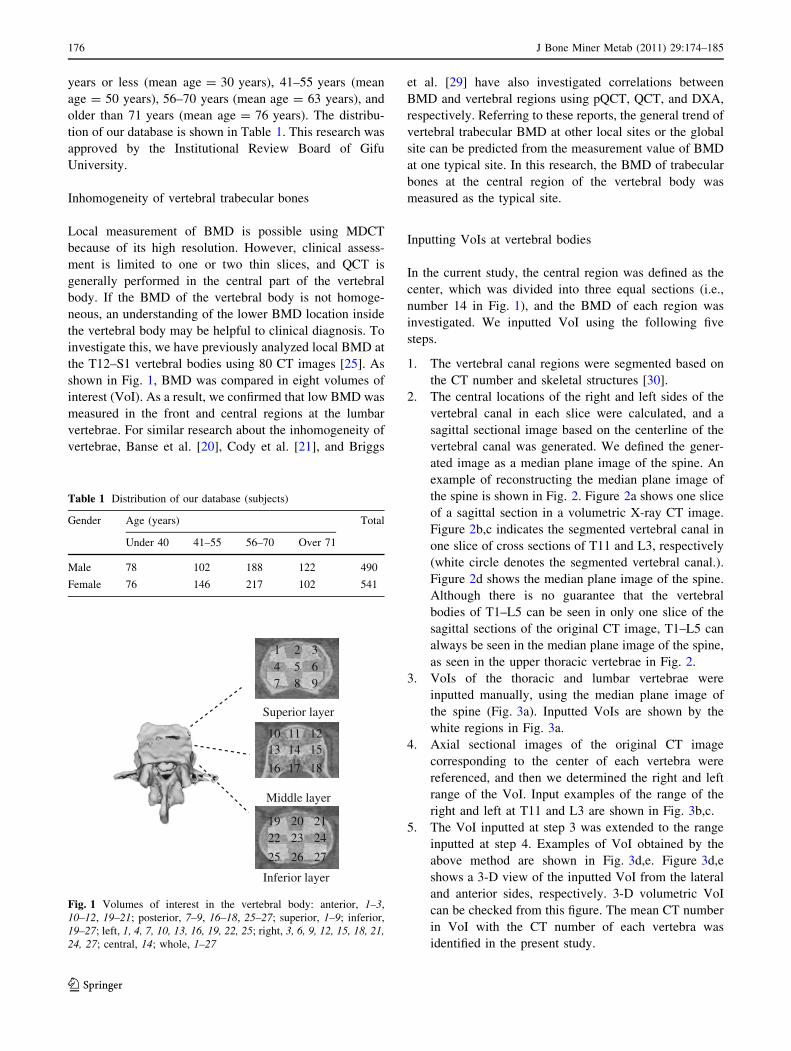
the T12–S1 vertebral bodies using 80 CT images [25]. As
shown in Fig. 1, BMD was compared in eight volumes of
interest (VoI). As a result, we confirmed that low BMD was
measured in the front and central regions at the lumbar
vertebrae. For similar research about the inhomogeneity of
vertebrae, Banse et al. [20], Cody et al. [21], and Briggs
et al. [29] have also investigated correlations between
BMD and vertebral regions using pQCT, QCT, and DXA,
respectively. Referring to these reports, the general trend of
vertebral trabecular BMD at other local sites or the global
site can be predicted from the measurement value of BMD
at one typical site. In this research, the BMD of trabecular
bones at the central region of the vertebral body was
measured as the typical site.
Inputting VoIs at vertebral bodies
In the current study, the central region was defined as the
center, which was divided into three equal sections (i.e.,
number 14 in Fig. 1), and the BMD of each region was
investigated. We inputted VoI using the following five
steps.
1. The vertebral canal regions were segmented based on
the CT number and skeletal structures [30].
2. The central locations of the right and left sides of the
vertebral canal in each slice were calculated, and a
sagittal sectional image based on the centerline of the
vertebral canal was generated. We defined the gener-
ated image as a median plane image of the spine. An
example of reconstructing the median plane image of
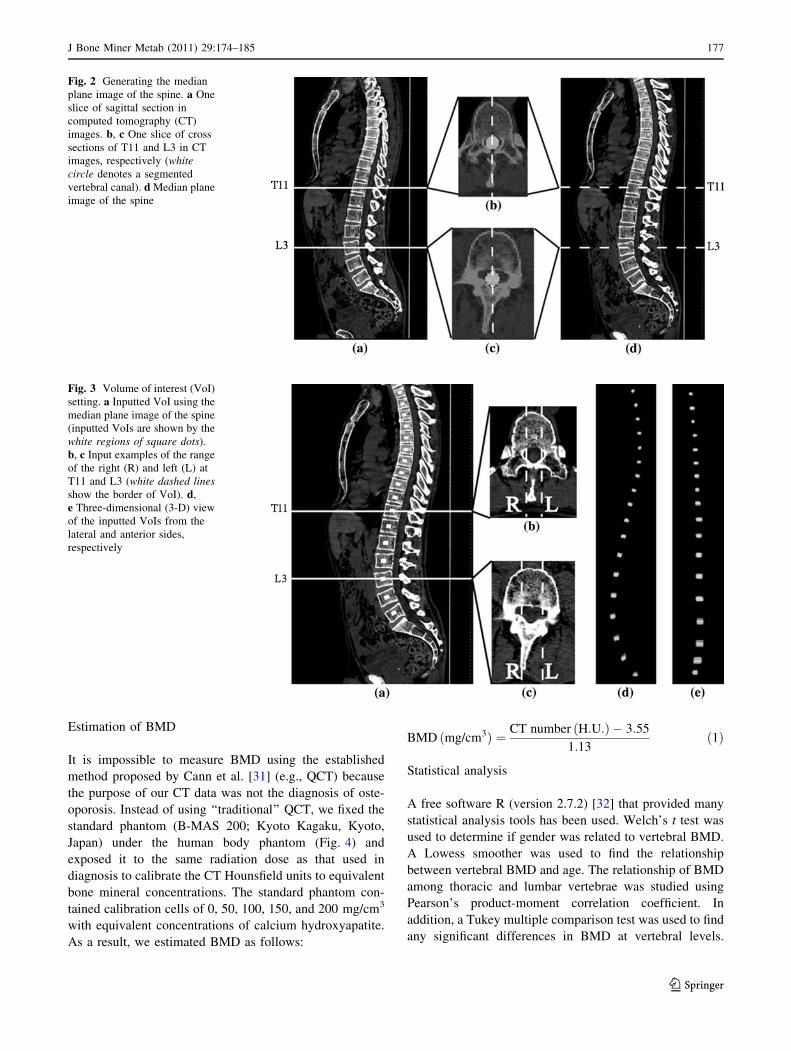
the spine is shown in Fig. 2. Figure 2a shows one slice
of a sagittal section in a volumetric X-ray CT image.
Figure 2b,c indicates the segmented vertebral canal in
one slice of cross sections of T11 and L3, respectively
(white circle denotes the segmented vertebral canal.).
Figure 2d shows the median plane image of the spine.
Although there is no guarantee that the vertebral
bodies of T1–L5 can be seen in only one slice of the
sagittal sections of the original CT image, T1–L5 can
always be seen in the median plane image of the spine,
as seen in the upper thoracic vertebrae in Fig. 2.
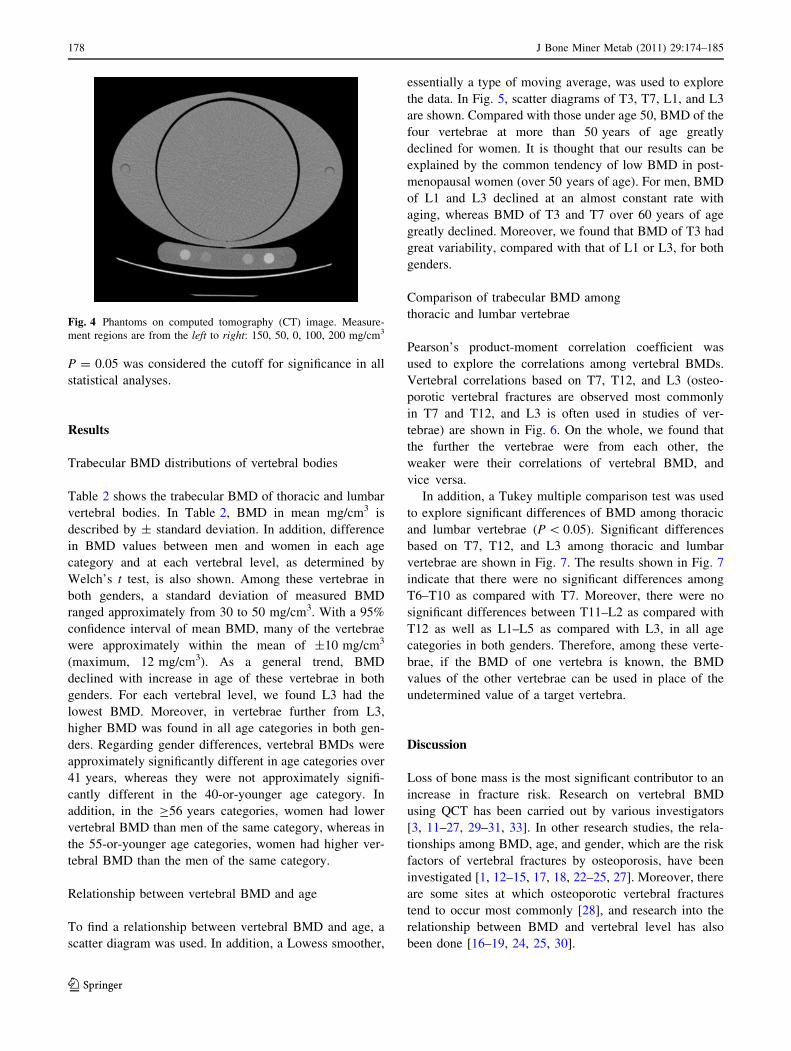
3. VoIs of the thoracic and lumbar vertebrae were
inputted manually, using the median plane image of
the spine (Fig. 3a). Inputted VoIs are shown by the
white regions in Fig. 3a.
4. Axial sectional images of the original CT image
corresponding to the center of each vertebra were
referenced, and then we determined the right and left
range of the VoI. Input examples of the range of the
right and left at T11 and L3 are shown in Fig. 3b,c.
5. The VoI inputted at step 3 was extended to the range
inputted at step 4. Examples of VoI obtained by the
above method are shown in Fig. 3d,e. Figure 3d,e
shows a 3-D view of the inputted VoI from the lateral
and anterior sides, respectively. 3-D volumetric VoI
can be checked from this figure. The mean CT number
in VoI with the CT number of each vertebra was
identified in the present study.
Table 1 Distribution of our database (subjects)
Gender Age (years) Total
Under 40 41–55 56–70 Over 71
Male 78 102 188 122 490
Female 76 146 217 102 541
1 2 34 5 7 8 9
6
1013
16
19 20 2122 23
26 27
24
25
17
1214 1511
18
Superior layer
Inferior layer
Middle layer
Fig. 1 Volumes of interest in the vertebral body: anterior, 1–3,
10–12, 19–21; posterior, 7–9, 16–18, 25–27; superior, 1–9; inferior,
19–27; left, 1, 4, 7, 10, 13, 16, 19, 22, 25; right, 3, 6, 9, 12, 15, 18, 21,24, 27; central, 14; whole, 1–27
176 J Bone Miner Metab (2011) 29:174–185
123
Estimation of BMD
It is impossible to measure BMD using the established
method proposed by Cann et al. [31] (e.g., QCT) because
the purpose of our CT data was not the diagnosis of oste-
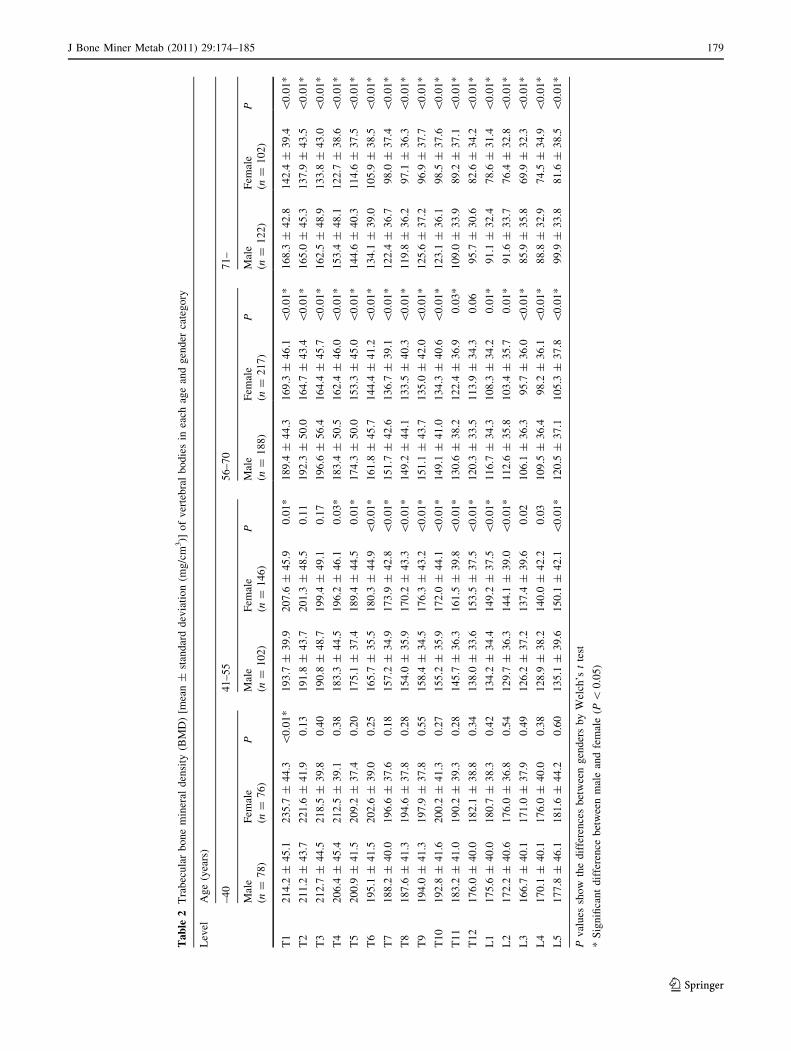
oporosis. Instead of using ‘‘traditional’’ QCT, we fixed the
standard phantom (B-MAS 200; Kyoto Kagaku, Kyoto,
Japan) under the human body phantom (Fig. 4) and
exposed it to the same radiation dose as that used in
diagnosis to calibrate the CT Hounsfield units to equivalent
bone mineral concentrations. The standard phantom con-
tained calibration cells of 0, 50, 100, 150, and 200 mg/cm3
with equivalent concentrations of calcium hydroxyapatite.
As a result, we estimated BMD as follows:
BMD ðmg/cm3Þ ¼ CT number ðH:U:Þ � 3:55
1:13ð1Þ
Statistical analysis
A free software R (version 2.7.2) [32] that provided many
statistical analysis tools has been used. Welch’s t test was
used to determine if gender was related to vertebral BMD.
A Lowess smoother was used to find the relationship
between vertebral BMD and age. The relationship of BMD
among thoracic and lumbar vertebrae was studied using
Pearson’s product-moment correlation coefficient. In
addition, a Tukey multiple comparison test was used to find
any significant differences in BMD at vertebral levels.
Fig. 2 Generating the median
plane image of the spine. a One
slice of sagittal section in
computed tomography (CT)
images. b, c One slice of cross
sections of T11 and L3 in CT
images, respectively (whitecircle denotes a segmented
vertebral canal). d Median plane
image of the spine
Fig. 3 Volume of interest (VoI)
setting. a Inputted VoI using the
median plane image of the spine
(inputted VoIs are shown by the
white regions of square dots).
b, c Input examples of the range
of the right (R) and left (L) at
T11 and L3 (white dashed linesshow the border of VoI). d,
e Three-dimensional (3-D) view
of the inputted VoIs from the
lateral and anterior sides,
respectively
J Bone Miner Metab (2011) 29:174–185 177
123
P = 0.05 was considered the cutoff for significance in all
statistical analyses.
Results
Trabecular BMD distributions of vertebral bodies
Table 2 shows the trabecular BMD of thoracic and lumbar
vertebral bodies. In Table 2, BMD in mean mg/cm3 is
described by ± standard deviation. In addition, difference
in BMD values between men and women in each age
category and at each vertebral level, as determined by
Welch’s t test, is also shown. Among these vertebrae in
both genders, a standard deviation of measured BMD
ranged approximately from 30 to 50 mg/cm3. With a 95%
confidence interval of mean BMD, many of the vertebrae
were approximately within the mean of ±10 mg/cm3
(maximum, 12 mg/cm3). As a general trend, BMD
declined with increase in age of these vertebrae in both
genders. For each vertebral level, we found L3 had the
lowest BMD. Moreover, in vertebrae further from L3,
higher BMD was found in all age categories in both gen-
ders. Regarding gender differences, vertebral BMDs were
approximately significantly different in age categories over
41 years, whereas they were not approximately signifi-
cantly different in the 40-or-younger age category. In
addition, in the C56 years categories, women had lower
vertebral BMD than men of the same category, whereas in
the 55-or-younger age categories, women had higher ver-
tebral BMD than the men of the same category.
Relationship between vertebral BMD and age
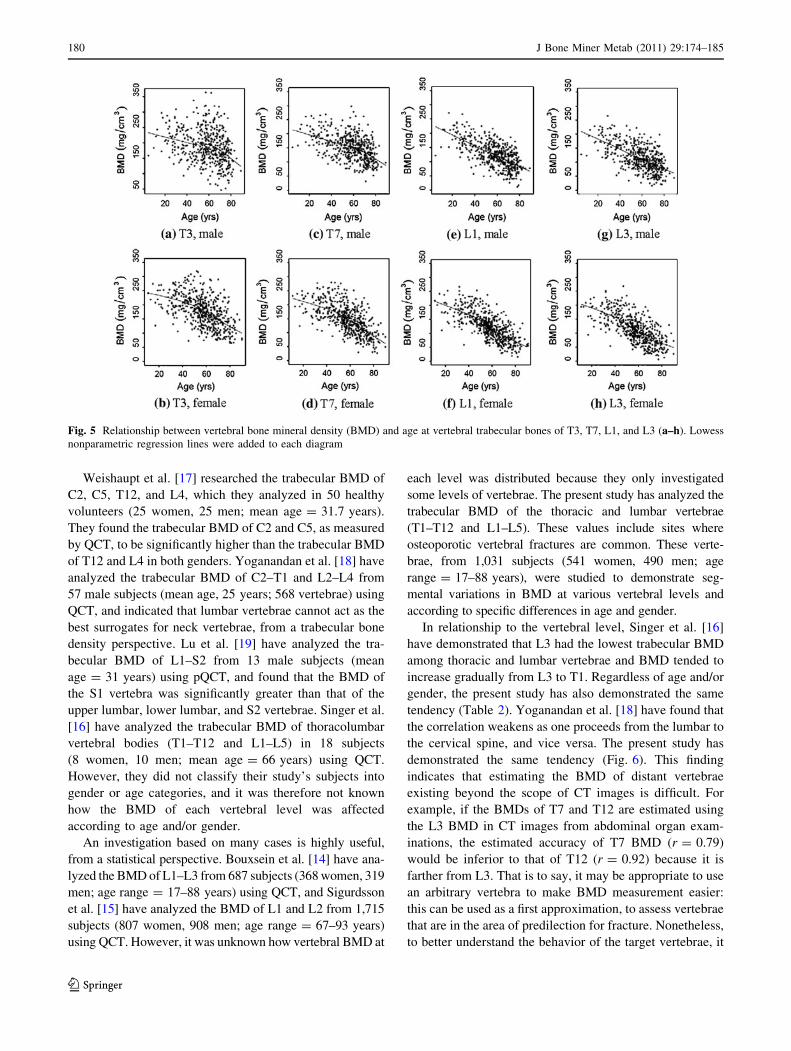
To find a relationship between vertebral BMD and age, a
scatter diagram was used. In addition, a Lowess smoother,
essentially a type of moving average, was used to explore
the data. In Fig. 5, scatter diagrams of T3, T7, L1, and L3
are shown. Compared with those under age 50, BMD of the
four vertebrae at more than 50 years of age greatly
declined for women. It is thought that our results can be
explained by the common tendency of low BMD in post-
menopausal women (over 50 years of age). For men, BMD
of L1 and L3 declined at an almost constant rate with
aging, whereas BMD of T3 and T7 over 60 years of age
greatly declined. Moreover, we found that BMD of T3 had
great variability, compared with that of L1 or L3, for both
genders.
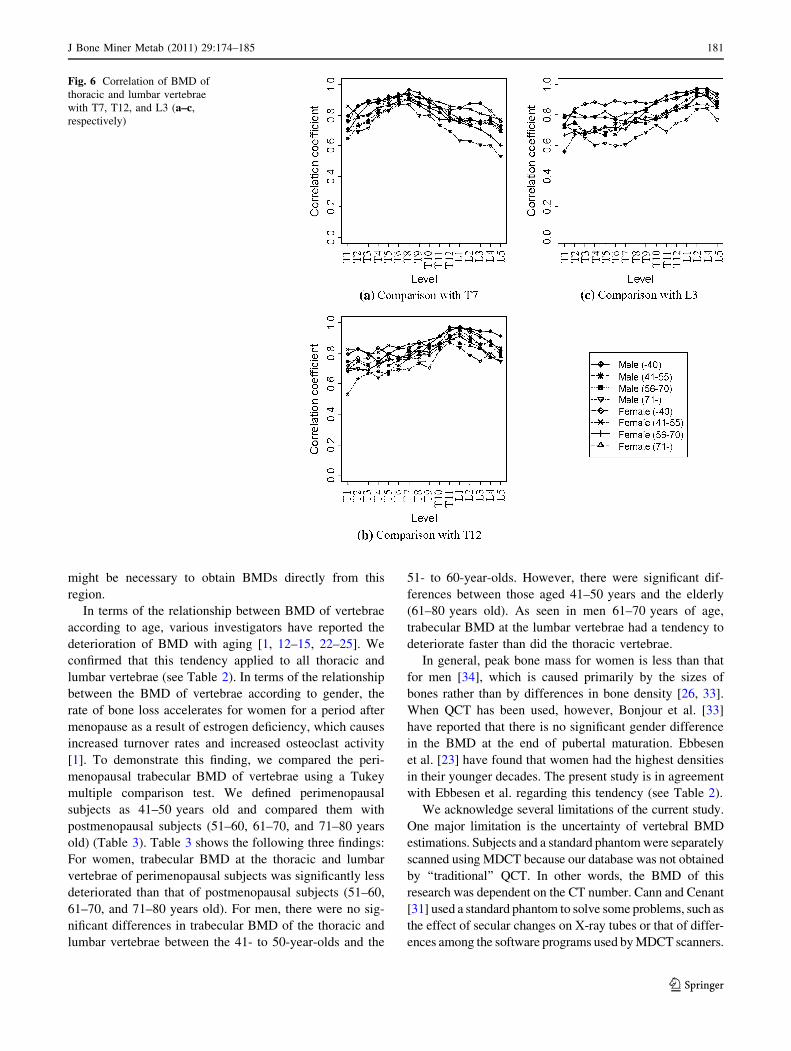
Comparison of trabecular BMD among
thoracic and lumbar vertebrae
Pearson’s product-moment correlation coefficient was
used to explore the correlations among vertebral BMDs.
Vertebral correlations based on T7, T12, and L3 (osteo-
porotic vertebral fractures are observed most commonly
in T7 and T12, and L3 is often used in studies of ver-
tebrae) are shown in Fig. 6. On the whole, we found that
the further the vertebrae were from each other, the
weaker were their correlations of vertebral BMD, and
vice versa.
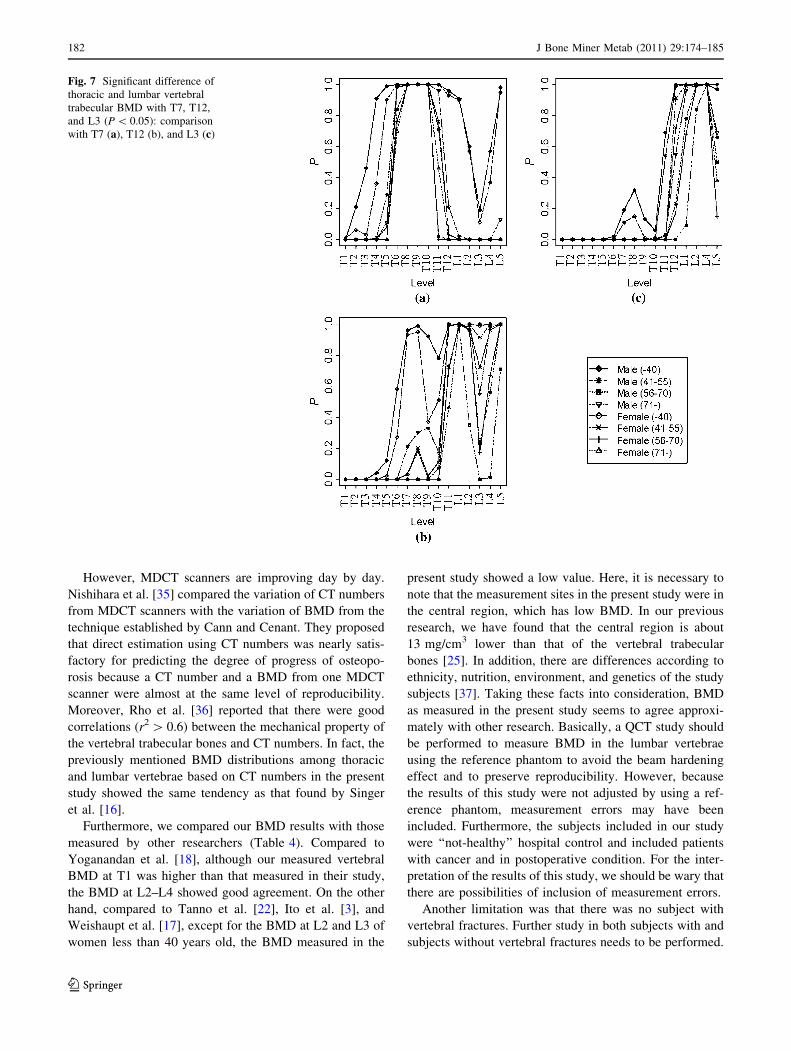
In addition, a Tukey multiple comparison test was used
to explore significant differences of BMD among thoracic
and lumbar vertebrae (P \ 0.05). Significant differences
based on T7, T12, and L3 among thoracic and lumbar
vertebrae are shown in Fig. 7. The results shown in Fig. 7
indicate that there were no significant differences among
T6–T10 as compared with T7. Moreover, there were no
significant differences between T11–L2 as compared with
T12 as well as L1–L5 as compared with L3, in all age
categories in both genders. Therefore, among these verte-
brae, if the BMD of one vertebra is known, the BMD
values of the other vertebrae can be used in place of the
undetermined value of a target vertebra.
Discussion
Loss of bone mass is the most significant contributor to an
increase in fracture risk. Research on vertebral BMD
using QCT has been carried out by various investigators
[3, 11–27, 29–31, 33]. In other research studies, the rela-
tionships among BMD, age, and gender, which are the risk
factors of vertebral fractures by osteoporosis, have been
investigated [1, 12–15, 17, 18, 22–25, 27]. Moreover, there
are some sites at which osteoporotic vertebral fractures
tend to occur most commonly [28], and research into the
relationship between BMD and vertebral level has also
been done [16–19, 24, 25, 30].
Fig. 4 Phantoms on computed tomography (CT) image. Measure-
ment regions are from the left to right: 150, 50, 0, 100, 200 mg/cm3
178 J Bone Miner Metab (2011) 29:174–185
123
Ta
ble
2T
rab
ecu
lar
bo
ne
min
eral
den
sity
(BM
D)
[mea
n±
stan
dar
dd
evia
tio
n(m
g/c
m3)]
of
ver
teb
ral
bo
die
sin
each
age
and
gen
der
cate
go
ry
Lev
elA
ge
(yea
rs)
–4
04
1–
55
56
–7
07
1–
Mal
e
(n=
78
)
Fem
ale
(n=
76
)
PM
ale
(n=
10
2)
Fem
ale
(n=
14
6)
PM
ale
(n=
18
8)
Fem
ale
(n=
21
7)
PM
ale
(n=
12
2)
Fem
ale
(n=
10
2)
P
T1
21
4.2
±4
5.1
23
5.7
±4
4.3
\0
.01
*1
93
.7±
39
.92
07
.6±
45
.90
.01
*1
89
.4±
44
.31
69
.3±
46
.1\
0.0
1*
16
8.3
±4
2.8
14
2.4
±3
9.4
\0
.01
*
T2
21
1.2
±4
3.7
22
1.6
±4
1.9
0.1
31
91
.8±
43
.72
01
.3±
48
.50
.11
19
2.3
±5
0.0
16
4.7
±4
3.4
\0
.01
*1
65
.0±
45
.31
37
.9±
43
.5\
0.0
1*
T3
21
2.7
±4
4.5
21
8.5
±3
9.8
0.4
01
90
.8±
48
.71
99
.4±
49
.10
.17
19
6.6
±5
6.4
16
4.4
±4
5.7
\0
.01
*1
62
.5±
48
.91
33
.8±
43
.0\
0.0
1*
T4
20
6.4
±4
5.4
21
2.5
±3
9.1
0.3
81
83
.3±
44
.51
96
.2±
46
.10
.03
*1
83
.4±
50
.51
62
.4±
46
.0\
0.0
1*
15
3.4
±4
8.1
12
2.7
±3
8.6
\0
.01
*
T5
20
0.9
±4
1.5
20
9.2
±3
7.4
0.2
01
75
.1±
37
.41
89
.4±
44
.50
.01
*1
74
.3±
50
.01
53
.3±
45
.0\
0.0
1*
14
4.6
±4
0.3
11
4.6
±3
7.5
\0
.01
*
T6
19
5.1
±4
1.5
20
2.6
±3
9.0
0.2
51
65
.7±
35
.51
80
.3±
44
.9\
0.0
1*
16
1.8
±4
5.7
14
4.4
±4
1.2
\0
.01
*1
34
.1±
39
.01
05
.9±
38
.5\
0.0
1*
T7
18
8.2
±4
0.0
19
6.6
±3
7.6
0.1
81
57
.2±
34
.91
73
.9±
42
.8\
0.0
1*
15
1.7
±4
2.6
13
6.7
±3
9.1
\0
.01
*1
22
.4±
36
.79
8.0
±3
7.4
\0
.01
*
T8
18
7.6
±4
1.3
19
4.6
±3
7.8
0.2
81
54
.0±
35
.91
70
.2±
43
.3\
0.0
1*
14
9.2
±4
4.1
13
3.5
±4
0.3
\0
.01
*1
19
.8±
36
.29
7.1
±3
6.3
\0
.01
*
T9
19
4.0
±4
1.3
19
7.9
±3
7.8
0.5
51
58
.4±
34
.51
76
.3±
43
.2\
0.0
1*
15
1.1
±4
3.7
13
5.0
±4
2.0
\0
.01
*1
25
.6±
37
.29
6.9
±3
7.7
\0
.01
*
T1
01
92
.8±
41
.62
00
.2±
41
.30
.27
15
5.2
±3
5.9
17
2.0
±4
4.1
\0
.01
*1
49
.1±
41
.01
34
.3±
40
.6\
0.0
1*
12
3.1
±3
6.1
98
.5±
37
.6\
0.0
1*
T1
11
83
.2±
41
.01
90
.2±
39
.30
.28
14
5.7
±3
6.3
16
1.5
±3
9.8
\0
.01
*1
30
.6±
38
.21
22
.4±
36
.90
.03
*1
09
.0±
33
.98
9.2
±3
7.1
\0
.01
*
T1
21
76
.0±
40
.01
82
.1±
38
.80
.34
13
8.0
±3
3.6
15
3.5
±3
7.5
\0
.01
*1
20
.3±
33
.51
13
.9±
34
.30
.06
95
.7±
30
.68
2.6
±3
4.2
\0
.01
*
L1
17
5.6
±4
0.0
18
0.7
±3
8.3
0.4
21
34
.2±
34
.41
49
.2±
37
.5\
0.0
1*
11
6.7
±3
4.3
10
8.3
±3
4.2
0.0
1*
91
.1±
32
.47
8.6
±3
1.4
\0
.01
*
L2
17
2.2
±4
0.6
17
6.0
±3
6.8
0.5
41
29
.7±
36
.31
44
.1±
39
.0\
0.0
1*
11
2.6
±3
5.8
10
3.4
±3
5.7
0.0
1*
91
.6±
33
.77
6.4
±3
2.8
\0
.01
*
L3
16
6.7
±4
0.1
17
1.0
±3
7.9
0.4
91
26
.2±
37
.21
37
.4±
39
.60
.02
10
6.1
±3
6.3
95
.7±
36
.0\
0.0
1*
85
.9±
35
.86
9.9
±3
2.3
\0
.01
*
L4
17
0.1
±4
0.1
17
6.0
±4
0.0
0.3
81
28
.9±
38
.21
40
.0±
42
.20
.03
10
9.5
±3
6.4
98
.2±
36
.1\
0.0
1*
88
.8±
32
.97
4.5
±3
4.9
\0
.01
*
L5
17
7.8
±4
6.1
18
1.6
±4
4.2
0.6
01
35
.1±
39
.61
50
.1±
42
.1\
0.0
1*
12
0.5
±3
7.1
10
5.3
±3
7.8
\0
.01
*9
9.9
±3
3.8
81
.6±
38
.5\
0.0
1*
Pv
alu
essh
ow
the
dif
fere
nce
sb
etw
een
gen
der
sb
yW
elch
’st
test
*S
ign
ifica
nt
dif
fere
nce
bet
wee
nm
ale
and
fem
ale
(P\
0.0
5)
J Bone Miner Metab (2011) 29:174–185 179
123
Weishaupt et al. [17] researched the trabecular BMD of
C2, C5, T12, and L4, which they analyzed in 50 healthy
volunteers (25 women, 25 men; mean age = 31.7 years).
They found the trabecular BMD of C2 and C5, as measured
by QCT, to be significantly higher than the trabecular BMD
of T12 and L4 in both genders. Yoganandan et al. [18] have
analyzed the trabecular BMD of C2–T1 and L2–L4 from
57 male subjects (mean age, 25 years; 568 vertebrae) using
QCT, and indicated that lumbar vertebrae cannot act as the
best surrogates for neck vertebrae, from a trabecular bone
density perspective. Lu et al. [19] have analyzed the tra-
becular BMD of L1–S2 from 13 male subjects (mean
age = 31 years) using pQCT, and found that the BMD of
the S1 vertebra was significantly greater than that of the
upper lumbar, lower lumbar, and S2 vertebrae. Singer et al.
[16] have analyzed the trabecular BMD of thoracolumbar
vertebral bodies (T1–T12 and L1–L5) in 18 subjects
(8 women, 10 men; mean age = 66 years) using QCT.
However, they did not classify their study’s subjects into
gender or age categories, and it was therefore not known
how the BMD of each vertebral level was affected
according to age and/or gender.
An investigation based on many cases is highly useful,
from a statistical perspective. Bouxsein et al. [14] have ana-
lyzed the BMD of L1–L3 from 687 subjects (368 women, 319
men; age range = 17–88 years) using QCT, and Sigurdsson
et al. [15] have analyzed the BMD of L1 and L2 from 1,715
subjects (807 women, 908 men; age range = 67–93 years)
using QCT. However, it was unknown how vertebral BMD at
each level was distributed because they only investigated
some levels of vertebrae. The present study has analyzed the
trabecular BMD of the thoracic and lumbar vertebrae
(T1–T12 and L1–L5). These values include sites where
osteoporotic vertebral fractures are common. These verte-
brae, from 1,031 subjects (541 women, 490 men; age
range = 17–88 years), were studied to demonstrate seg-
mental variations in BMD at various vertebral levels and
according to specific differences in age and gender.
In relationship to the vertebral level, Singer et al. [16]
have demonstrated that L3 had the lowest trabecular BMD
among thoracic and lumbar vertebrae and BMD tended to
increase gradually from L3 to T1. Regardless of age and/or
gender, the present study has also demonstrated the same
tendency (Table 2). Yoganandan et al. [18] have found that
the correlation weakens as one proceeds from the lumbar to
the cervical spine, and vice versa. The present study has
demonstrated the same tendency (Fig. 6). This finding
indicates that estimating the BMD of distant vertebrae
existing beyond the scope of CT images is difficult. For
example, if the BMDs of T7 and T12 are estimated using
the L3 BMD in CT images from abdominal organ exam-
inations, the estimated accuracy of T7 BMD (r = 0.79)
would be inferior to that of T12 (r = 0.92) because it is
farther from L3. That is to say, it may be appropriate to use
an arbitrary vertebra to make BMD measurement easier:
this can be used as a first approximation, to assess vertebrae
that are in the area of predilection for fracture. Nonetheless,
to better understand the behavior of the target vertebrae, it
Fig. 5 Relationship between vertebral bone mineral density (BMD) and age at vertebral trabecular bones of T3, T7, L1, and L3 (a–h). Lowess
nonparametric regression lines were added to each diagram
180 J Bone Miner Metab (2011) 29:174–185
123
might be necessary to obtain BMDs directly from this
region.
In terms of the relationship between BMD of vertebrae
according to age, various investigators have reported the
deterioration of BMD with aging [1, 12–15, 22–25]. We
confirmed that this tendency applied to all thoracic and
lumbar vertebrae (see Table 2). In terms of the relationship
between the BMD of vertebrae according to gender, the
rate of bone loss accelerates for women for a period after
menopause as a result of estrogen deficiency, which causes
increased turnover rates and increased osteoclast activity
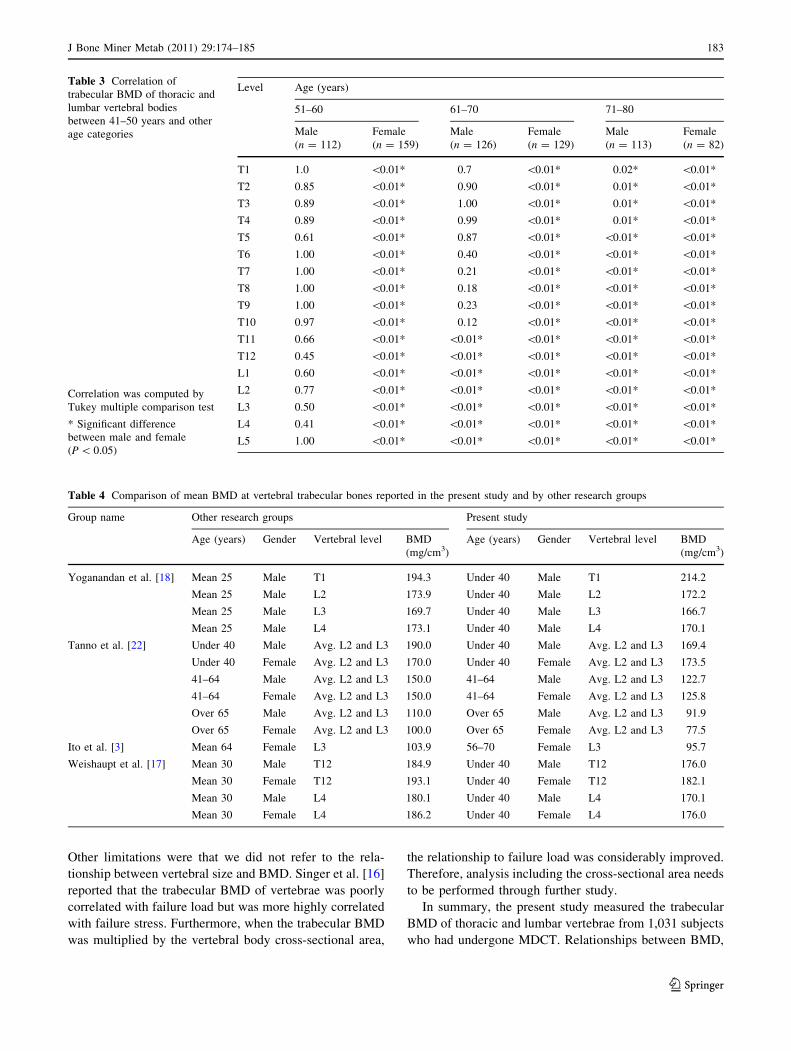
[1]. To demonstrate this finding, we compared the peri-
menopausal trabecular BMD of vertebrae using a Tukey
multiple comparison test. We defined perimenopausal
subjects as 41–50 years old and compared them with
postmenopausal subjects (51–60, 61–70, and 71–80 years
old) (Table 3). Table 3 shows the following three findings:
For women, trabecular BMD at the thoracic and lumbar
vertebrae of perimenopausal subjects was significantly less
deteriorated than that of postmenopausal subjects (51–60,
61–70, and 71–80 years old). For men, there were no sig-
nificant differences in trabecular BMD of the thoracic and
lumbar vertebrae between the 41- to 50-year-olds and the
51- to 60-year-olds. However, there were significant dif-
ferences between those aged 41–50 years and the elderly
(61–80 years old). As seen in men 61–70 years of age,
trabecular BMD at the lumbar vertebrae had a tendency to
deteriorate faster than did the thoracic vertebrae.
In general, peak bone mass for women is less than that
for men [34], which is caused primarily by the sizes of
bones rather than by differences in bone density [26, 33].
When QCT has been used, however, Bonjour et al. [33]
have reported that there is no significant gender difference
in the BMD at the end of pubertal maturation. Ebbesen
et al. [23] have found that women had the highest densities
in their younger decades. The present study is in agreement
with Ebbesen et al. regarding this tendency (see Table 2).
We acknowledge several limitations of the current study.
One major limitation is the uncertainty of vertebral BMD
estimations. Subjects and a standard phantom were separately
scanned using MDCT because our database was not obtained
by ‘‘traditional’’ QCT. In other words, the BMD of this
research was dependent on the CT number. Cann and Cenant
[31] used a standard phantom to solve some problems, such as
the effect of secular changes on X-ray tubes or that of differ-
ences among the software programs used by MDCT scanners.
Fig. 6 Correlation of BMD of
thoracic and lumbar vertebrae
with T7, T12, and L3 (a–c,
respectively)
J Bone Miner Metab (2011) 29:174–185 181
123
However, MDCT scanners are improving day by day.
Nishihara et al. [35] compared the variation of CT numbers
from MDCT scanners with the variation of BMD from the
technique established by Cann and Cenant. They proposed
that direct estimation using CT numbers was nearly satis-
factory for predicting the degree of progress of osteopo-
rosis because a CT number and a BMD from one MDCT
scanner were almost at the same level of reproducibility.
Moreover, Rho et al. [36] reported that there were good
correlations (r2 [ 0.6) between the mechanical property of
the vertebral trabecular bones and CT numbers. In fact, the
previously mentioned BMD distributions among thoracic
and lumbar vertebrae based on CT numbers in the present
study showed the same tendency as that found by Singer
et al. [16].
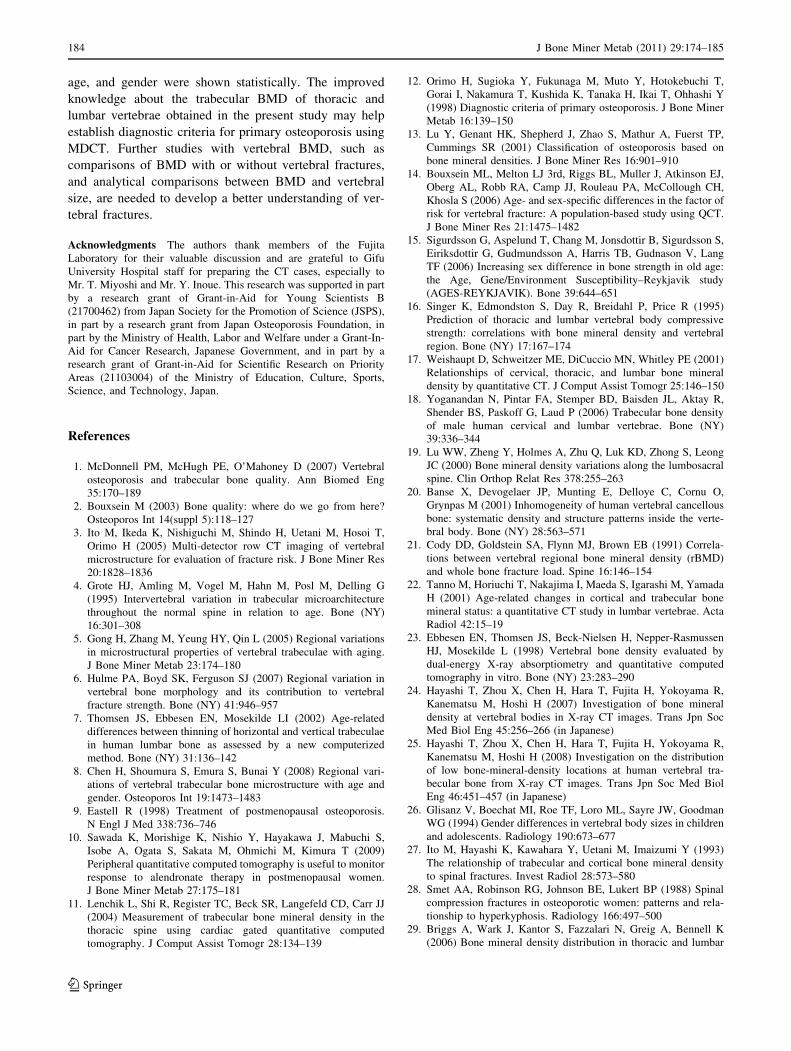
Furthermore, we compared our BMD results with those
measured by other researchers (Table 4). Compared to
Yoganandan et al. [18], although our measured vertebral
BMD at T1 was higher than that measured in their study,
the BMD at L2–L4 showed good agreement. On the other
hand, compared to Tanno et al. [22], Ito et al. [3], and
Weishaupt et al. [17], except for the BMD at L2 and L3 of
women less than 40 years old, the BMD measured in the
present study showed a low value. Here, it is necessary to
note that the measurement sites in the present study were in
the central region, which has low BMD. In our previous
research, we have found that the central region is about
13 mg/cm3 lower than that of the vertebral trabecular
bones [25]. In addition, there are differences according to
ethnicity, nutrition, environment, and genetics of the study
subjects [37]. Taking these facts into consideration, BMD
as measured in the present study seems to agree approxi-
mately with other research. Basically, a QCT study should
be performed to measure BMD in the lumbar vertebrae
using the reference phantom to avoid the beam hardening
effect and to preserve reproducibility. However, because
the results of this study were not adjusted by using a ref-
erence phantom, measurement errors may have been
included. Furthermore, the subjects included in our study
were ‘‘not-healthy’’ hospital control and included patients
with cancer and in postoperative condition. For the inter-
pretation of the results of this study, we should be wary that
there are possibilities of inclusion of measurement errors.
Another limitation was that there was no subject with
vertebral fractures. Further study in both subjects with and
subjects without vertebral fractures needs to be performed.
Fig. 7 Significant difference of
thoracic and lumbar vertebral
trabecular BMD with T7, T12,
and L3 (P \ 0.05): comparison
with T7 (a), T12 (b), and L3 (c)
182 J Bone Miner Metab (2011) 29:174–185
123
Other limitations were that we did not refer to the rela-
tionship between vertebral size and BMD. Singer et al. [16]
reported that the trabecular BMD of vertebrae was poorly
correlated with failure load but was more highly correlated
with failure stress. Furthermore, when the trabecular BMD
was multiplied by the vertebral body cross-sectional area,
the relationship to failure load was considerably improved.
Therefore, analysis including the cross-sectional area needs
to be performed through further study.
In summary, the present study measured the trabecular
BMD of thoracic and lumbar vertebrae from 1,031 subjects
who had undergone MDCT. Relationships between BMD,
Table 3 Correlation of
trabecular BMD of thoracic and
lumbar vertebral bodies
between 41–50 years and other
age categories
Correlation was computed by
Tukey multiple comparison test
* Significant difference
between male and female
(P \ 0.05)
Level Age (years)
51–60 61–70 71–80
Male
(n = 112)
Female
(n = 159)
Male
(n = 126)
Female
(n = 129)
Male
(n = 113)
Female
(n = 82)
T1 1.0 \0.01* 0.7 \0.01* 0.02* \0.01*
T2 0.85 \0.01* 0.90 \0.01* 0.01* \0.01*
T3 0.89 \0.01* 1.00 \0.01* 0.01* \0.01*
T4 0.89 \0.01* 0.99 \0.01* 0.01* \0.01*
T5 0.61 \0.01* 0.87 \0.01* \0.01* \0.01*
T6 1.00 \0.01* 0.40 \0.01* \0.01* \0.01*
T7 1.00 \0.01* 0.21 \0.01* \0.01* \0.01*
T8 1.00 \0.01* 0.18 \0.01* \0.01* \0.01*
T9 1.00 \0.01* 0.23 \0.01* \0.01* \0.01*
T10 0.97 \0.01* 0.12 \0.01* \0.01* \0.01*
T11 0.66 \0.01* \0.01* \0.01* \0.01* \0.01*
T12 0.45 \0.01* \0.01* \0.01* \0.01* \0.01*
L1 0.60 \0.01* \0.01* \0.01* \0.01* \0.01*
L2 0.77 \0.01* \0.01* \0.01* \0.01* \0.01*
L3 0.50 \0.01* \0.01* \0.01* \0.01* \0.01*
L4 0.41 \0.01* \0.01* \0.01* \0.01* \0.01*
L5 1.00 \0.01* \0.01* \0.01* \0.01* \0.01*
Table 4 Comparison of mean BMD at vertebral trabecular bones reported in the present study and by other research groups
Group name Other research groups Present study
Age (years) Gender Vertebral level BMD
(mg/cm3)
Age (years) Gender Vertebral level BMD
(mg/cm3)
Yoganandan et al. [18] Mean 25 Male T1 194.3 Under 40 Male T1 214.2
Mean 25 Male L2 173.9 Under 40 Male L2 172.2
Mean 25 Male L3 169.7 Under 40 Male L3 166.7
Mean 25 Male L4 173.1 Under 40 Male L4 170.1
Tanno et al. [22] Under 40 Male Avg. L2 and L3 190.0 Under 40 Male Avg. L2 and L3 169.4
Under 40 Female Avg. L2 and L3 170.0 Under 40 Female Avg. L2 and L3 173.5
41–64 Male Avg. L2 and L3 150.0 41–64 Male Avg. L2 and L3 122.7
41–64 Female Avg. L2 and L3 150.0 41–64 Female Avg. L2 and L3 125.8
Over 65 Male Avg. L2 and L3 110.0 Over 65 Male Avg. L2 and L3 91.9
Over 65 Female Avg. L2 and L3 100.0 Over 65 Female Avg. L2 and L3 77.5
Ito et al. [3] Mean 64 Female L3 103.9 56–70 Female L3 95.7
Weishaupt et al. [17] Mean 30 Male T12 184.9 Under 40 Male T12 176.0
Mean 30 Female T12 193.1 Under 40 Female T12 182.1
Mean 30 Male L4 180.1 Under 40 Male L4 170.1
Mean 30 Female L4 186.2 Under 40 Female L4 176.0
J Bone Miner Metab (2011) 29:174–185 183
123
age, and gender were shown statistically. The improved
knowledge about the trabecular BMD of thoracic and
lumbar vertebrae obtained in the present study may help
establish diagnostic criteria for primary osteoporosis using
MDCT. Further studies with vertebral BMD, such as
comparisons of BMD with or without vertebral fractures,
and analytical comparisons between BMD and vertebral
size, are needed to develop a better understanding of ver-
tebral fractures.
Acknowledgments The authors thank members of the Fujita
Laboratory for their valuable discussion and are grateful to Gifu
University Hospital staff for preparing the CT cases, especially to
Mr. T. Miyoshi and Mr. Y. Inoue. This research was supported in part
by a research grant of Grant-in-Aid for Young Scientists B
(21700462) from Japan Society for the Promotion of Science (JSPS),
in part by a research grant from Japan Osteoporosis Foundation, in
part by the Ministry of Health, Labor and Welfare under a Grant-In-
Aid for Cancer Research, Japanese Government, and in part by a
research grant of Grant-in-Aid for Scientific Research on Priority
Areas (21103004) of the Ministry of Education, Culture, Sports,
Science, and Technology, Japan.
References
1. McDonnell PM, McHugh PE, O’Mahoney D (2007) Vertebral
osteoporosis and trabecular bone quality. Ann Biomed Eng
35:170–189
2. Bouxsein M (2003) Bone quality: where do we go from here?
Osteoporos Int 14(suppl 5):118–127
3. Ito M, Ikeda K, Nishiguchi M, Shindo H, Uetani M, Hosoi T,
Orimo H (2005) Multi-detector row CT imaging of vertebral
microstructure for evaluation of fracture risk. J Bone Miner Res
20:1828–1836
4. Grote HJ, Amling M, Vogel M, Hahn M, Posl M, Delling G
(1995) Intervertebral variation in trabecular microarchitecture
throughout the normal spine in relation to age. Bone (NY)
16:301–308
5. Gong H, Zhang M, Yeung HY, Qin L (2005) Regional variations
in microstructural properties of vertebral trabeculae with aging.
J Bone Miner Metab 23:174–180
6. Hulme PA, Boyd SK, Ferguson SJ (2007) Regional variation in
vertebral bone morphology and its contribution to vertebral
fracture strength. Bone (NY) 41:946–957
7. Thomsen JS, Ebbesen EN, Mosekilde LI (2002) Age-related
differences between thinning of horizontal and vertical trabeculae
in human lumbar bone as assessed by a new computerized
method. Bone (NY) 31:136–142
8. Chen H, Shoumura S, Emura S, Bunai Y (2008) Regional vari-
ations of vertebral trabecular bone microstructure with age and
gender. Osteoporos Int 19:1473–1483
9. Eastell R (1998) Treatment of postmenopausal osteoporosis.
N Engl J Med 338:736–746
10. Sawada K, Morishige K, Nishio Y, Hayakawa J, Mabuchi S,
Isobe A, Ogata S, Sakata M, Ohmichi M, Kimura T (2009)
Peripheral quantitative computed tomography is useful to monitor
response to alendronate therapy in postmenopausal women.
J Bone Miner Metab 27:175–181
11. Lenchik L, Shi R, Register TC, Beck SR, Langefeld CD, Carr JJ
(2004) Measurement of trabecular bone mineral density in the
thoracic spine using cardiac gated quantitative computed
tomography. J Comput Assist Tomogr 28:134–139
12. Orimo H, Sugioka Y, Fukunaga M, Muto Y, Hotokebuchi T,
Gorai I, Nakamura T, Kushida K, Tanaka H, Ikai T, Ohhashi Y
(1998) Diagnostic criteria of primary osteoporosis. J Bone Miner
Metab 16:139–150
13. Lu Y, Genant HK, Shepherd J, Zhao S, Mathur A, Fuerst TP,
Cummings SR (2001) Classification of osteoporosis based on
bone mineral densities. J Bone Miner Res 16:901–910
14. Bouxsein ML, Melton LJ 3rd, Riggs BL, Muller J, Atkinson EJ,
Oberg AL, Robb RA, Camp JJ, Rouleau PA, McCollough CH,
Khosla S (2006) Age- and sex-specific differences in the factor of
risk for vertebral fracture: A population-based study using QCT.
J Bone Miner Res 21:1475–1482
15. Sigurdsson G, Aspelund T, Chang M, Jonsdottir B, Sigurdsson S,
Eiriksdottir G, Gudmundsson A, Harris TB, Gudnason V, Lang
TF (2006) Increasing sex difference in bone strength in old age:
the Age, Gene/Environment Susceptibility–Reykjavik study
(AGES-REYKJAVIK). Bone 39:644–651
16. Singer K, Edmondston S, Day R, Breidahl P, Price R (1995)
Prediction of thoracic and lumbar vertebral body compressive
strength: correlations with bone mineral density and vertebral
region. Bone (NY) 17:167–174
17. Weishaupt D, Schweitzer ME, DiCuccio MN, Whitley PE (2001)
Relationships of cervical, thoracic, and lumbar bone mineral
density by quantitative CT. J Comput Assist Tomogr 25:146–150
18. Yoganandan N, Pintar FA, Stemper BD, Baisden JL, Aktay R,
Shender BS, Paskoff G, Laud P (2006) Trabecular bone density
of male human cervical and lumbar vertebrae. Bone (NY)
39:336–344
19. Lu WW, Zheng Y, Holmes A, Zhu Q, Luk KD, Zhong S, Leong
JC (2000) Bone mineral density variations along the lumbosacral
spine. Clin Orthop Relat Res 378:255–263
20. Banse X, Devogelaer JP, Munting E, Delloye C, Cornu O,
Grynpas M (2001) Inhomogeneity of human vertebral cancellous
bone: systematic density and structure patterns inside the verte-
bral body. Bone (NY) 28:563–571
21. Cody DD, Goldstein SA, Flynn MJ, Brown EB (1991) Correla-
tions between vertebral regional bone mineral density (rBMD)
and whole bone fracture load. Spine 16:146–154
22. Tanno M, Horiuchi T, Nakajima I, Maeda S, Igarashi M, Yamada
H (2001) Age-related changes in cortical and trabecular bone
mineral status: a quantitative CT study in lumbar vertebrae. Acta
Radiol 42:15–19
23. Ebbesen EN, Thomsen JS, Beck-Nielsen H, Nepper-Rasmussen
HJ, Mosekilde L (1998) Vertebral bone density evaluated by
dual-energy X-ray absorptiometry and quantitative computed
tomography in vitro. Bone (NY) 23:283–290
24. Hayashi T, Zhou X, Chen H, Hara T, Fujita H, Yokoyama R,
Kanematsu M, Hoshi H (2007) Investigation of bone mineral
density at vertebral bodies in X-ray CT images. Trans Jpn Soc
Med Biol Eng 45:256–266 (in Japanese)
25. Hayashi T, Zhou X, Chen H, Hara T, Fujita H, Yokoyama R,
Kanematsu M, Hoshi H (2008) Investigation on the distribution
of low bone-mineral-density locations at human vertebral tra-
becular bone from X-ray CT images. Trans Jpn Soc Med Biol
Eng 46:451–457 (in Japanese)
26. Glisanz V, Boechat MI, Roe TF, Loro ML, Sayre JW, Goodman
WG (1994) Gender differences in vertebral body sizes in children
and adolescents. Radiology 190:673–677
27. Ito M, Hayashi K, Kawahara Y, Uetani M, Imaizumi Y (1993)
The relationship of trabecular and cortical bone mineral density
to spinal fractures. Invest Radiol 28:573–580
28. Smet AA, Robinson RG, Johnson BE, Lukert BP (1988) Spinal
compression fractures in osteoporotic women: patterns and rela-
tionship to hyperkyphosis. Radiology 166:497–500
29. Briggs A, Wark J, Kantor S, Fazzalari N, Greig A, Bennell K
(2006) Bone mineral density distribution in thoracic and lumbar
184 J Bone Miner Metab (2011) 29:174–185
123
vertebrae: an ex vivo study using dual energy X-ray absorpti-
ometry. Bone (NY) 38:286–288
30. Hayashi T, Zhou X, Hara T, Fujita H, Yokoyama R, Kiryu T,
Hoshi H (2006) Automated segmentation of the skeleton in torso
X-ray volumetric CT images. In: Proceedings of the 20th inter-
national congress and exhibition of computer assisted radiology
and surgery 2006, vol 1, pp 522–523
31. Cann CE, Cenant HK (1980) Precise measurement of vertebral
mineral content using computed tomography. J Comput Assist
Tomogr 4:493–500
32. http://www.r-project.org/. Accessed September 11, 2008
33. Bonjour JP, Theintz G, Law F, Slosman D, Rizzoli R (1994) Peak
bone mass. Osteoporos Int 4(suppl 1):7–13
34. Compston JE (1995) Alimentary pharmacology therapeutics.
Blackwell, Oxford, pp 237–250
35. Nishihara S, Koike M, Ueda K, Sanada T, Ebitani K, Kohama C,
Sumida H, Iida T, Fujita H, Hara T (2003) Intra- and inter-
equipment variations in the mean CT numbers of a vertebral body
for X-ray CT equipment. Jpn Soc Med Imaging Inform Sci
20:40–43 (Japanese)
36. Rho JY, Hobatho MC, Ashman RB (1995) Relations of
mechanical properties to density and CT numbers in human bone.
Med Eng Phys 17:347–355
37. Ross PD, Fujiwara S, Huang C, Davis JW, Epstein RS, Wasnich
RD, Kodama K, Melton LJ 3rd (1995) Vertebral fracture preva-
lence in women in Hiroshima compared to Caucasians or Japa-
nese in the US. Int J Epidemiol 24:1171–1177
J Bone Miner Metab (2011) 29:174–185 185
123