Embed Size (px)
Citation preview
ORIGINAL ARTICLE
Analysing integration and diversity in agro-ecosystemsby using indicators of network analysis
M. C. Rufino Æ H. Hengsdijk Æ A. Verhagen
Received: 7 June 2008 / Accepted: 12 December 2008 / Published online: 4 February 2009
� The Author(s) 2009. This article is published with open access at Springerlink.com
Abstract Diversity of farming activities may
increase income stability and reduce risks to resource-
poor households, while integration—using the outputs
of one activity as input in another activity—may reduce
dependency on external resources. In practice, diversity
and integration are poorly defined, and there is no
method to characterise them, hampering the explora-
tion of their benefits. We introduce a method based on
network analysis (NA) to assess the diversity and
integration in farm household systems by using the
Finn cycling index to characterise integration of
farming activities, and the average mutual information,
and the statistical uncertainty (HR) to characterise
diversity of flows. We used nitrogen (N) flows in an
application of NA to crop-livestock systems of the
highlands of Northern Ethiopia. N recycling was low
(FCI \ 3%) in these systems independently of the farm
type. Even with improved N management FCI was
lower than 10%. Since large amounts of N are
withdrawn from the system with the harvests, there
are relatively few opportunities for recycling. The
diversity in N flows increased from the poor to the
wealthier farm households, but differences were small.
The wealthier farm households did not recycle more N
than the relatively less diverse and poorer farm
household. The definition of the system and compart-
ments boundaries must be made explicit in any
application of the method as these strongly affect the
results. NA appears useful to assess the effects of farm
management practices on system performance and to
support discussions on diversity and integration of
agro-ecosystems.
Keywords Farm management � Farming systems
analysis � Africa � Nitrogen flows � Systems design
Introduction
Farm household systems are agro-ecosystems in
which rural households are a central component.
Diverse and integrated farm household systems are
often associated with sustainable agro-ecosystems
(Dalsgaard and Oficial 1997), because diversity and
integration enable the realisation of complementari-
ties between different activities and may improve
resource use efficiencies. Diversity in farming activ-
ities may increase income stability and reduce
income risks of resource-poor households (Ellis
2000; Niehof 2004). Integrated farm household
systems use the outputs of one activity as inputs in
M. C. Rufino (&) � H. Hengsdijk � A. Verhagen
Plant Research International, Wageningen University
and Research Centre, P.O. Box 16, 6700 AA Wageningen,
The Netherlands
e-mail: [email protected]
M. C. Rufino
Plant Production Systems Group, Wageningen University,
P.O. Box 430, 6700 AK Wageningen, The Netherlands
123
Nutr Cycl Agroecosyst (2009) 84:229–247
DOI 10.1007/s10705-008-9239-2
another activity, which may reduce adverse effects to
the environment and decrease the dependency on
external resources through recycling (Edwards et al.
1993; Vereijken 2002). Cycling of energy and
nutrients are considered two of the most important
features that confers stability to ecosystem function-
ing (Allesina and Ulanowicz 2004).
In practice, diversity and integration are still poorly
defined and, although there have been several studies
that focus on integrated agro-ecosystems (Prein 2002;
Pant et al. 2005), there is no practical method to
characterise, quantify, and assess integration of
diverse agro-ecosystems. We define integration in
agro-ecosystems as the degree to which the com-
partments (or activities in such systems) are
interconnected by flows of material. In agro-ecosys-
tems that are diverse, the number of options for flows
of material is larger than in relatively simple, often
specialised non-diverse agro-ecosystems. We intro-
duce and apply network analysis (NA) to quantify the
degree of integration and diversity of farm household
systems using a set of indicators. NA is basically an
input–output analysis originally developed in eco-
nomics (Leontief 1951) that was introduced into
ecology by Hannon (1973) to quantify relationships
within ecosystems (Fath and Patten 1999). Leontief
developed input–output analysis to estimate the
amount of materials needed to produce a certain
quantity of goods. It is applied in systems analysis,
which conceptualizes systems as networks of inter-
acting compartments exchanging resources. In farm
household systems, it may be used to analyse input–
output relationships among different compartments or
household activities. The flow analysis of Finn (1980),
belongs to the early developments of NA where it was
used to study throughflow of nutrients or energy, and
cycling in ecosystems. The Shannon index, derived
from communication theory (Shannon 1948), was
introduced in ecology by MacArthur (1955) to
evaluate flow patterns in ecosystems. Later, Rutledge
et al. (1976) introduced another measure of commu-
nication theory, i.e. the average mutual information
(AMI) to study the organisation of nutrients and
energy flows in ecosystems. AMI has been proposed
by Ulanowicz (1980, 1997, 2001) to measure systems
organisation, and how the structure of the flows in an
ecosystem is refined to increase autocatalysis (Odum
1969). Since the earlier developments of NA, there
have been several applications to study ecosystem
properties (e.g. Baird and Ulanowicz 1993; Christian
et al. 1996; Heymans et al. 2002), but seldom to study
agro-ecosystems (e.g. Fores and Christian 1993;
Dalsgaard and Oficial 1997; Groot et al. 2003).
The objective of this study was to assess the
potentials and limitations of NA to evaluate integra-
tion of diverse agro-ecosystems, specifically indi-
cators of flow analysis (throughflow, throughput and
cycling) and indicators from communication theory
(i.e. measures of organisation and diversity) are
addressed. We introduce the method, the system
conceptualisation and the indicators using theoretical
examples to illustrate their meaning. Then we present
a case study from the highlands of Northern Ethiopia
where the method was applied, and the consequences
of different management options for the degree of
integration and diversity were explored. We end the
article with conclusions on the appropriateness of the
indicators to characterise diversity and integration of
agro-ecosystems.
Materials and methods
Network analysis of nutrient flows
The NA uses matrices built with the resource flows of
the systems under study, and a number of indicators.
The resource flows characterise the organisation of
the system. In this study, we use flows of nitrogen (N)
to perform the NA because this resource is often the
most limiting production factor in low-input agricul-
ture, and it can—to a large extent—be managed by
farm households. The selection of the system bound-
ary depends on the purpose of the study. In the
application presented later the system definitions
were defined by the resource base of the farm
household, which consists of a number of compart-
ments that interact. We used one year as the temporal
unit of analysis, because this is a common time
horizon for agricultural production.
Conceptualising the system
After having defined the boundaries of the system/
network, the next steps in NA are to define the n
compartments, and to quantify their interactions (N
flows). For farm households, compartments are
defined as farming activities that contribute directly
230 Nutr Cycl Agroecosyst (2009) 84:229–247
123
(e.g. provide food) or indirectly (e.g. through cash
income) to the consumption of the farm household
and have an impact on the N resources (Langeveld
et al. 2008). Farming activities can be characterised
in terms of N inputs and N outputs of which the latter
can be used in other farming activities or can be
exported from the system.
Indicators from network analysis to assess
integration
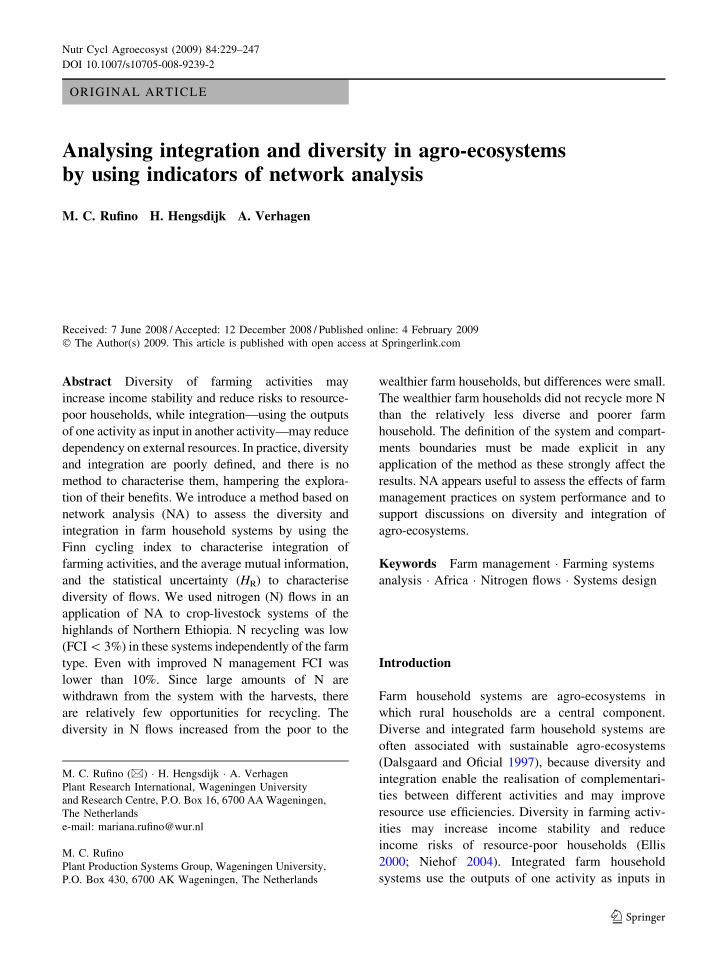
In this section the indicators used to assess size,
activity and cycling in ecosystems (Finn 1980) are
explained using a theoretical example of a simple
network, i.e. a system with two compartments (H1
and H2), for which storage (x1, x2) and flows are
quantified (y01, z10, f12, f21, y02, z20) (Fig. 1). This
system is characterised by the following elements: Hi
is the compartment i, _xi is the change in the storage of
compartment Hi, yoi is the outflow from compartment
Hi to the external environment, zio is the inflow from
the external environment to compartment Hi, and fij is
an internal flow from compartment Hj to compart-
ment Hi. The flows are expressed in kg N year-1, and
storage and the size of the compartments in kg N.
Nitrogen flows move from one compartment (j = 0,
…, n) to another (i = 1, …, n, n ? 1, n ? 2), where
n ? 1 accounts for usable exports (e.g. grain, milk)
and n ? 2 accounts for losses (e.g. animal excreta in
pastures, human excreta). Here compartment j = 0 is
used to keep track of the imports. We use the
convention of usable (n ? 1) and unusable export or
losses (n ? 2) from Hirata and Ulanowicz (1984).
Storage in a compartment is an estimation of the
amount of N contained in the total human and animal
mass (expressed as kg N per compartment) while for
cropping activities or field compartments storage is
an estimation of the amount of N contained in the top
soil layer (e.g. 0–30 cm), also expressed in kg N per
compartment.
Based on this conceptualisation of the network,
Finn (1980) developed a number of indicators that
characterise N flows in the system:
Imports (IN) is the amount of N that is imported
from the external environment into the system (Eq. 1).
IN ¼Xn
i¼1
zio ð1Þ
Total inflow (TIN) into the system is the sum of N
flows from external inputs (z) into all n compartments
plus the amount of N contributed to the system total
flows by the storage of all compartments _xið Þ, i.e.
negative changes in the storage (Eq. 2).
TIN ¼Xn
i¼1
zio �Xn
i¼1
_xið Þ� ð2Þ
These definitions take the input perspective (Finn
1980), and are used to assess whether a network
accumulates or loses material.
Throughflow (Ti) is the total flow from other
compartments to compartment i (fij) plus the inflow
from the exterior (z) and the N flows contributed by
the storage of compartment Hi (the negative changes
in storage _xi) (Eq. 3). This definition takes the input
perspective.
Ti ¼Xn
j¼1
fij þ zio � _xið Þ� ð3Þ
Total system throughflow (TST) is the sum of all
the Ti in the system (Eq. 4). It represents the N pool
within the system that contributes to the production
or activity. The ratio IN/TST is an indicator of
dependency of the system on external inputs.
TST ¼Xn
i¼1
Ti ð4Þ
Path length (PL) is the average number of
compartments that a unit of inflow passes through
(Eq. 5). It is a measure of the cycling intensity within
the system. Part of the nutrients entering the system
may flow through one or more compartments and
leave the system, while another part may be recycled
repeatedly before leaving the system.
H1x1
H2x2
y02
z20
y01
z10
f21
f12
Fig. 1 System representing a network with two compartments
H1 and H2, and their respective storages x1 and x2, the internal
flows f12 and f 21, and exchanges from (z10 and z20) and to the
external environment, (y01 and y02). The rectangular box
defines the system boundaries. Source: Finn (1980)
Nutr Cycl Agroecosyst (2009) 84:229–247 231
123
PL ¼ TST
TINð5Þ
Throughput (T..) is the sum of all flows in the
system (Eq. 6).
T:: ¼Xnþ2
i¼1
Xn
j¼0
Tij ð6Þ
Each flow fij can be expressed as a fraction q��ij of
the total flow (Tj) leaving the compartment Hj, then
throughflow can be expressed as:
Ti ¼Xn
j¼1
q��ij Tj þ zio � _xið Þ� ð7Þ
Expressed in matrix form:
T ¼ Q��T þ z� _xið Þ� ð8Þ
where Q** is a matrix with the q��ij elements, T is a
column vector of throughflows, z is a column vector
of inflows and (xi)– is a vector of negative state
derivatives. Solving for T gives:
T ¼ ½I � Q����1 z� ð _xiÞ�� �
ð9Þ
where I is the identity matrix, the matrix [I-Q**]-1
is called N**, whose i, j element indicate the flow in
Hi due to an unit of flow starting in Hj. Cycling
efficiency (REi) (Eq. 10) is the fraction of through-
flow (Ti) that returns to the compartment Hi, and it
can be found by examining the diagonal of matrix
N**. The element n**ii represents the flows gener-
ated by a unit of flow that started in Hi.
REi ¼n��ii � 1
n��iið10Þ
The Finn’s cycling index (FCI) is the proportion of
TST that is recycled (Eq. 12) within the system. FCI
is calculated by dividing the relative cycling effi-
ciency of all compartments (TSTc) (Eq. 10) by the
total TST (Eq. 11). It yields values between 0 and 1,
indicating either no recycling or complete recycling.
TSTc ¼Xn
i¼1
REiTi ð11Þ
FCI ¼ TSTc
TSTð12Þ
See Finn (1980) for more details on the calculation
of the flow analysis indicators. We use the indicators
FCI, PL and the relationship between IN/TST to
assess integration in agro-ecosystems, because
according to our definition (see ‘‘Introduction’’) a
more integrated system shows more internal recy-
cling and less dependency from the external
environment. Additionally, the ratio of TST/T.. can
be used to characterise the role of the storage in the
compartments to the system total flow.
The analysis focused on N flows associated with
management decisions and controlled by farmers,
such as the imports of N through fertilisers or food and
the exports to the market in harvested products. We
did not estimate the size of flows such as N leaching,
volatilisation, runoff, wet deposition, N2-fixation or
redistribution of nutrients at the farm and landscape
level. Information related to the size of these flows is
difficult to obtain at the farm scale. The assumption
was made that these flows do not largely differ for the
studied farm households. Clearly, omission of these
flows may affect the contribution from and to the soil
N storages, and losses to the environment.
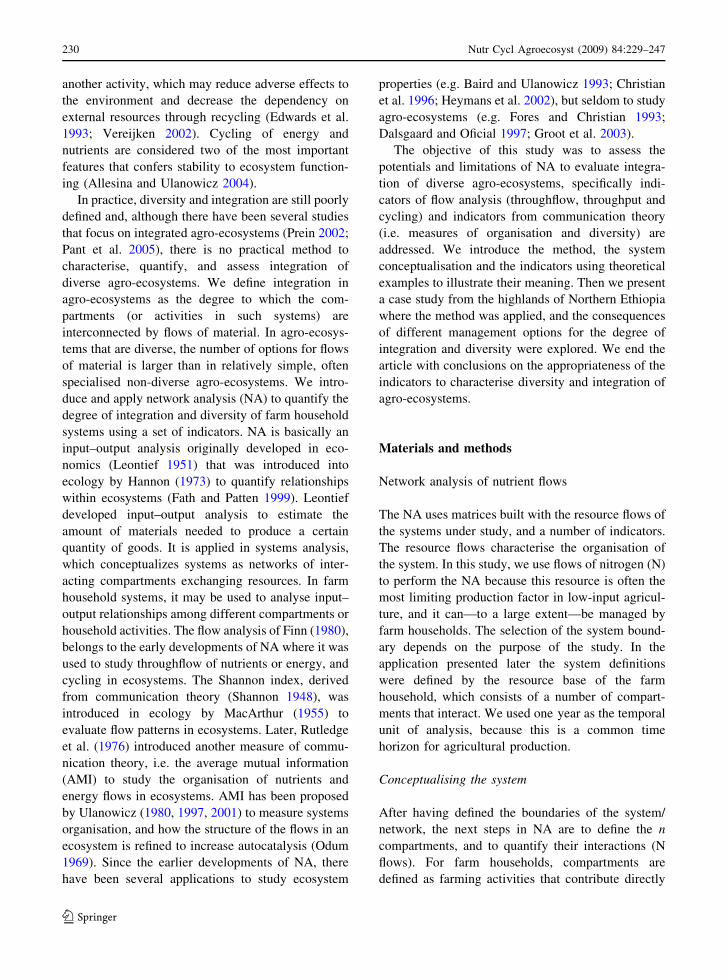
Illustration of integration indicators
Here, we present examples of different systems with
four compartments to illustrate the calculations of the
indicators and to facilitate their interpretation
(Fig. 2A, B). Systems A and B receive both inputs
from the external environment (IN). For system A the
total inflow (TIN) is five, and for network B it is four.
Comparing IN and TIN allows to assess whether a
system accumulates or loses material because TIN
combines the external input (IN) with the changes in
compartment storage needed to support the total
network flow. In these systems TIN and IN are the
same because the compartment storages do not
contribute to the network flows. Both systems do not
accumulate or lose material; they are in a steady-state
as storage xi = 0 and total inflows (TIN) and imports
(IN) are equal. The ratio IN/TST shows that system A
depends more on imports to support the system
activity (TST) than system B. The total system
throughflow (TST) is the sum of all material flowing
through the system compartments, while the T.. sums
all inputs and outputs flowing from and to all system
compartments. System B differs from system A in that
imports are smaller and recycling is larger. As a result,
the ratio TST/T.. is larger for B than for system A,
which means that the storage compensates for the
difference between inputs and outputs. As an example
232 Nutr Cycl Agroecosyst (2009) 84:229–247
123
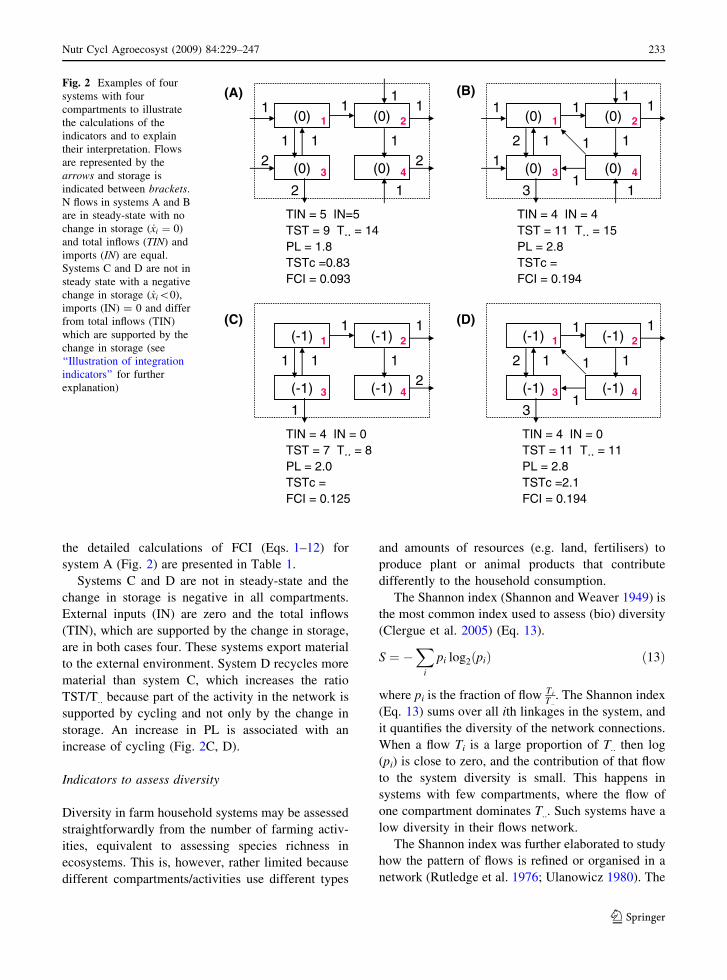
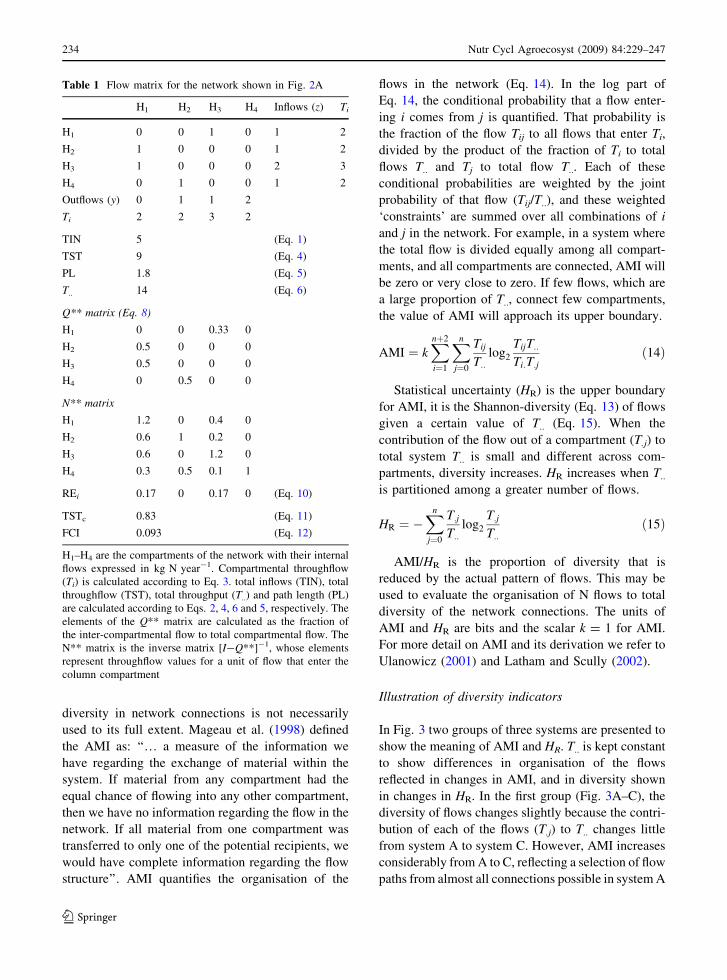
the detailed calculations of FCI (Eqs. 1–12) for
system A (Fig. 2) are presented in Table 1.
Systems C and D are not in steady-state and the
change in storage is negative in all compartments.
External inputs (IN) are zero and the total inflows
(TIN), which are supported by the change in storage,
are in both cases four. These systems export material
to the external environment. System D recycles more
material than system C, which increases the ratio
TST/T.. because part of the activity in the network is
supported by cycling and not only by the change in
storage. An increase in PL is associated with an
increase of cycling (Fig. 2C, D).
Indicators to assess diversity
Diversity in farm household systems may be assessed
straightforwardly from the number of farming activ-
ities, equivalent to assessing species richness in
ecosystems. This is, however, rather limited because
different compartments/activities use different types
and amounts of resources (e.g. land, fertilisers) to
produce plant or animal products that contribute
differently to the household consumption.
The Shannon index (Shannon and Weaver 1949) is
the most common index used to assess (bio) diversity
(Clergue et al. 2005) (Eq. 13).
S ¼ �X
i
pi log2 pið Þ ð13Þ
where pi is the fraction of flow Ti
T ::. The Shannon index
(Eq. 13) sums over all ith linkages in the system, and
it quantifies the diversity of the network connections.
When a flow Ti is a large proportion of T.. then log
(pi) is close to zero, and the contribution of that flow
to the system diversity is small. This happens in
systems with few compartments, where the flow of
one compartment dominates T... Such systems have a
low diversity in their flows network.
The Shannon index was further elaborated to study
how the pattern of flows is refined or organised in a
network (Rutledge et al. 1976; Ulanowicz 1980). The
(0) (0)
(0) (0)
1
1
2
1
11
2
2
1 2
3 4
11
1(0) (0)
(0) (0)
1
1
1
11
1
3
1 2
3 4
12
1
1
1
(-1) (-1)
(-1) (-1)
12
1
1
1 2
3 4
11
1(-1) (-1)
(-1) (-1)
1
1
3
1 2
3 4
12
1
1
1
(A) (B)
(D)(C)
TIN = 4 IN = 0TST = 7 T.. = 8PL = 2.0TSTc =FCI = 0.125
TIN = 4 IN = 0 TST = 11 T.. = 11PL = 2.8TSTc =2.1FCI = 0.194
TIN = 5 IN=5TST = 9 T.. = 14PL = 1.8TSTc =0.83FCI = 0.093
TIN = 4 IN = 4TST = 11 T.. = 15PL = 2.8TSTc =FCI = 0.194
Fig. 2 Examples of four
systems with four
compartments to illustrate
the calculations of the
indicators and to explain
their interpretation. Flows
are represented by the
arrows and storage is
indicated between brackets.
N flows in systems A and B
are in steady-state with no
change in storage ( _xi ¼ 0)
and total inflows (TIN) and
imports (IN) are equal.
Systems C and D are not in
steady state with a negative
change in storage ( _xi\0),
imports (IN) = 0 and differ
from total inflows (TIN)
which are supported by the
change in storage (see
‘‘Illustration of integration
indicators’’ for further
explanation)
Nutr Cycl Agroecosyst (2009) 84:229–247 233
123
diversity in network connections is not necessarily
used to its full extent. Mageau et al. (1998) defined
the AMI as: ‘‘… a measure of the information we
have regarding the exchange of material within the
system. If material from any compartment had the
equal chance of flowing into any other compartment,
then we have no information regarding the flow in the
network. If all material from one compartment was
transferred to only one of the potential recipients, we
would have complete information regarding the flow
structure’’. AMI quantifies the organisation of the
flows in the network (Eq. 14). In the log part of
Eq. 14, the conditional probability that a flow enter-
ing i comes from j is quantified. That probability is
the fraction of the flow Tij to all flows that enter Ti,
divided by the product of the fraction of Ti to total
flows T.. and Tj to total flow T... Each of these
conditional probabilities are weighted by the joint
probability of that flow (Tij/T..), and these weighted
‘constraints’ are summed over all combinations of i
and j in the network. For example, in a system where
the total flow is divided equally among all compart-
ments, and all compartments are connected, AMI will
be zero or very close to zero. If few flows, which are
a large proportion of T.., connect few compartments,
the value of AMI will approach its upper boundary.
AMI ¼ kXnþ2
i¼1
Xn
j¼0
Tij
T::log2
TijT::Ti:T:j
ð14Þ
Statistical uncertainty (HR) is the upper boundary
for AMI, it is the Shannon-diversity (Eq. 13) of flows
given a certain value of T.. (Eq. 15). When the
contribution of the flow out of a compartment (T.j) to
total system T.. is small and different across com-
partments, diversity increases. HR increases when T..
is partitioned among a greater number of flows.
HR ¼ �Xn
j¼0
T:jT::
log2
T:jT::
ð15Þ
AMI/HR is the proportion of diversity that is
reduced by the actual pattern of flows. This may be
used to evaluate the organisation of N flows to total
diversity of the network connections. The units of
AMI and HR are bits and the scalar k = 1 for AMI.
For more detail on AMI and its derivation we refer to
Ulanowicz (2001) and Latham and Scully (2002).
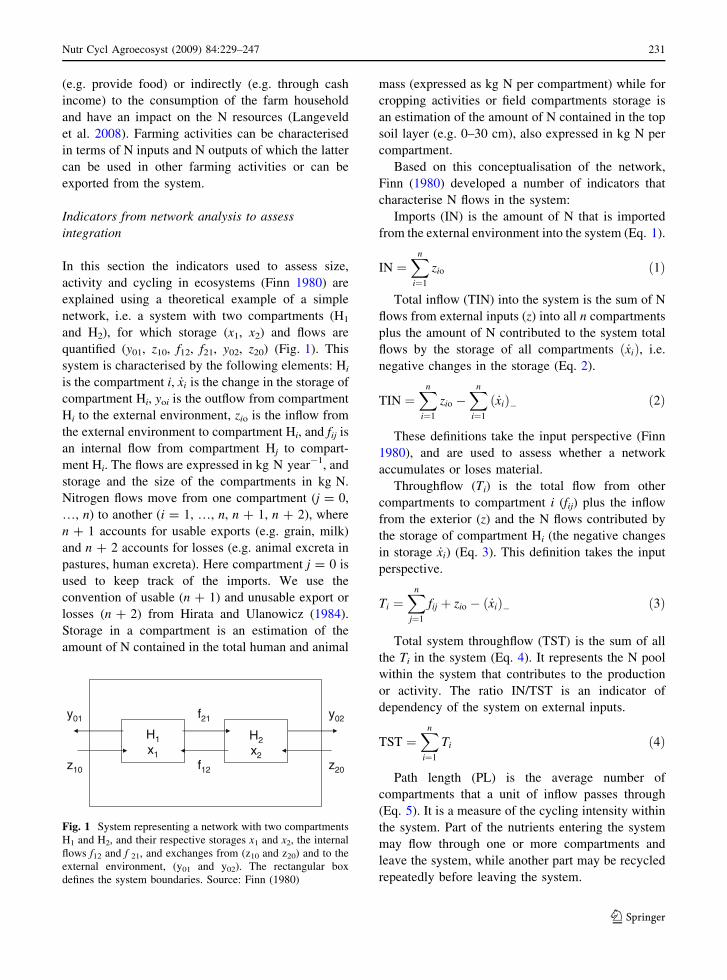
Illustration of diversity indicators
In Fig. 3 two groups of three systems are presented to
show the meaning of AMI and HR. T.. is kept constant
to show differences in organisation of the flows
reflected in changes in AMI, and in diversity shown
in changes in HR. In the first group (Fig. 3A–C), the
diversity of flows changes slightly because the contri-
bution of each of the flows (T.j) to T.. changes little
from system A to system C. However, AMI increases
considerably from A to C, reflecting a selection of flow
paths from almost all connections possible in system A
Table 1 Flow matrix for the network shown in Fig. 2A
H1 H2 H3 H4 Inflows (z) Ti
H1 0 0 1 0 1 2
H2 1 0 0 0 1 2
H3 1 0 0 0 2 3
H4 0 1 0 0 1 2
Outflows (y) 0 1 1 2
Ti 2 2 3 2
TIN 5 (Eq. 1)
TST 9 (Eq. 4)
PL 1.8 (Eq. 5)
T.. 14 (Eq. 6)
Q** matrix (Eq. 8)
H1 0 0 0.33 0
H2 0.5 0 0 0
H3 0.5 0 0 0
H4 0 0.5 0 0
N** matrix
H1 1.2 0 0.4 0
H2 0.6 1 0.2 0
H3 0.6 0 1.2 0
H4 0.3 0.5 0.1 1
REi 0.17 0 0.17 0 (Eq. 10)
TSTc 0.83 (Eq. 11)
FCI 0.093 (Eq. 12)
H1–H4 are the compartments of the network with their internal
flows expressed in kg N year-1. Compartmental throughflow
(Ti) is calculated according to Eq. 3. total inflows (TIN), total
throughflow (TST), total throughput (T..) and path length (PL)
are calculated according to Eqs. 2, 4, 6 and 5, respectively. The
elements of the Q** matrix are calculated as the fraction of
the inter-compartmental flow to total compartmental flow. The
N** matrix is the inverse matrix [I-Q**]-1, whose elements
represent throughflow values for a unit of flow that enter the
column compartment
234 Nutr Cycl Agroecosyst (2009) 84:229–247
123
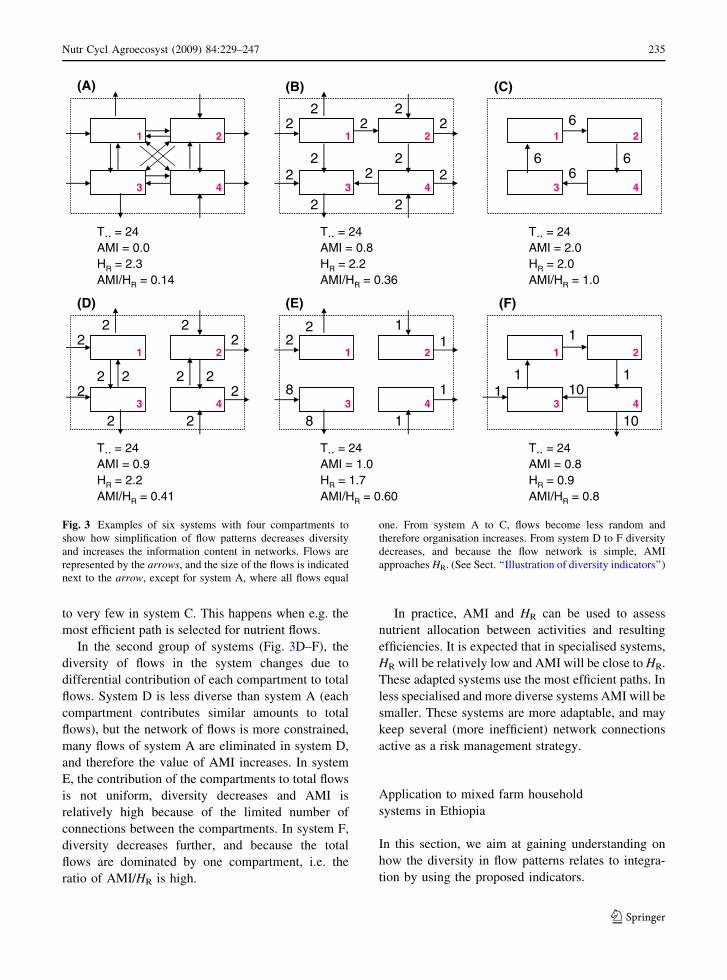
to very few in system C. This happens when e.g. the
most efficient path is selected for nutrient flows.
In the second group of systems (Fig. 3D–F), the
diversity of flows in the system changes due to
differential contribution of each compartment to total
flows. System D is less diverse than system A (each
compartment contributes similar amounts to total
flows), but the network of flows is more constrained,
many flows of system A are eliminated in system D,
and therefore the value of AMI increases. In system
E, the contribution of the compartments to total flows
is not uniform, diversity decreases and AMI is
relatively high because of the limited number of
connections between the compartments. In system F,
diversity decreases further, and because the total
flows are dominated by one compartment, i.e. the
ratio of AMI/HR is high.
In practice, AMI and HR can be used to assess
nutrient allocation between activities and resulting
efficiencies. It is expected that in specialised systems,
HR will be relatively low and AMI will be close to HR.
These adapted systems use the most efficient paths. In
less specialised and more diverse systems AMI will be
smaller. These systems are more adaptable, and may
keep several (more inefficient) network connections
active as a risk management strategy.
Application to mixed farm household
systems in Ethiopia
In this section, we aim at gaining understanding on
how the diversity in flow patterns relates to integra-
tion by using the proposed indicators.
1 2
3 4
1 2
3 4
(A) (C)(B)
1 2
3 4
T.. = 24AMI = 0.8HR = 2.2AMI/HR = 0.36
T.. = 24AMI = 2.0HR = 2.0AMI/HR = 1.0
T.. = 24AMI = 0.0HR = 2.3 AMI/HR = 0.14
1 2
3 4
1 2
3 4
1 2
3 4
T.. = 24AMI = 1.0HR = 1.7AMI/HR = 0.60
T.. = 24AMI = 0.8HR = 0.9AMI/HR = 0.8
T.. = 24AMI = 0.9HR = 2.2AMI/HR = 0.41
22
8
8
11
1
1
1
10
1
1
110
(F)(E)(D)
2222
22 2
2
2 22
2
66
6
6
2
2
2
22 2
22
22
2
2
Fig. 3 Examples of six systems with four compartments to
show how simplification of flow patterns decreases diversity
and increases the information content in networks. Flows are
represented by the arrows, and the size of the flows is indicated
next to the arrow, except for system A, where all flows equal
one. From system A to C, flows become less random and
therefore organisation increases. From system D to F diversity
decreases, and because the flow network is simple, AMI
approaches HR. (See Sect. ‘‘Illustration of diversity indicators’’)
Nutr Cycl Agroecosyst (2009) 84:229–247 235
123
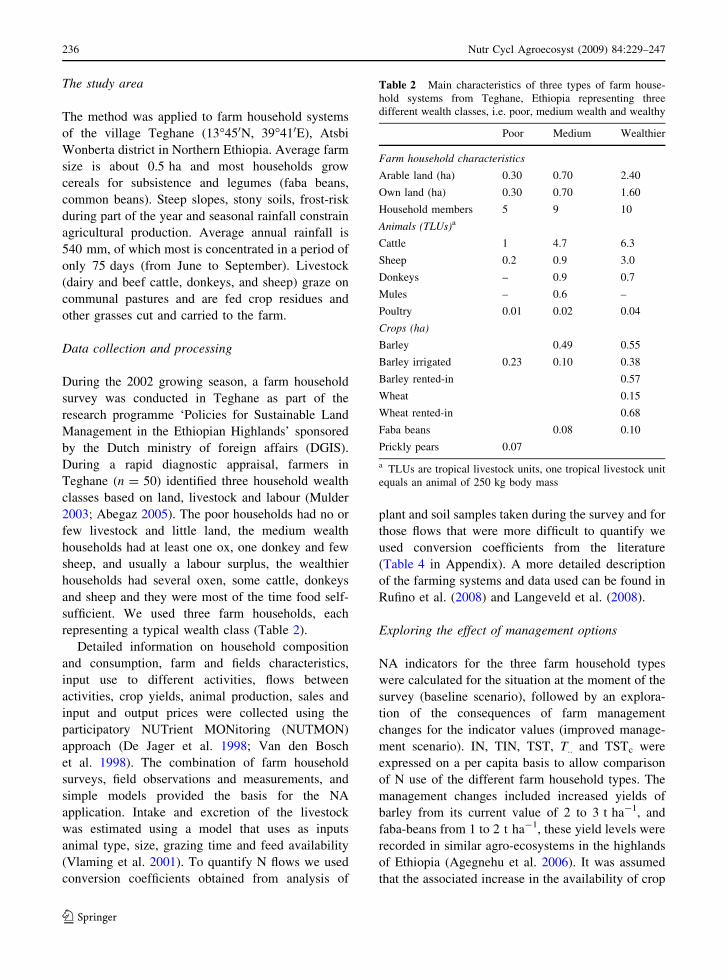
The study area
The method was applied to farm household systems
of the village Teghane (13�450N, 39�410E), Atsbi
Wonberta district in Northern Ethiopia. Average farm
size is about 0.5 ha and most households grow
cereals for subsistence and legumes (faba beans,
common beans). Steep slopes, stony soils, frost-risk
during part of the year and seasonal rainfall constrain
agricultural production. Average annual rainfall is
540 mm, of which most is concentrated in a period of
only 75 days (from June to September). Livestock
(dairy and beef cattle, donkeys, and sheep) graze on
communal pastures and are fed crop residues and
other grasses cut and carried to the farm.
Data collection and processing
During the 2002 growing season, a farm household
survey was conducted in Teghane as part of the
research programme ‘Policies for Sustainable Land
Management in the Ethiopian Highlands’ sponsored
by the Dutch ministry of foreign affairs (DGIS).
During a rapid diagnostic appraisal, farmers in
Teghane (n = 50) identified three household wealth
classes based on land, livestock and labour (Mulder
2003; Abegaz 2005). The poor households had no or
few livestock and little land, the medium wealth
households had at least one ox, one donkey and few
sheep, and usually a labour surplus, the wealthier
households had several oxen, some cattle, donkeys
and sheep and they were most of the time food self-
sufficient. We used three farm households, each
representing a typical wealth class (Table 2).
Detailed information on household composition
and consumption, farm and fields characteristics,
input use to different activities, flows between
activities, crop yields, animal production, sales and
input and output prices were collected using the
participatory NUTrient MONitoring (NUTMON)
approach (De Jager et al. 1998; Van den Bosch
et al. 1998). The combination of farm household
surveys, field observations and measurements, and
simple models provided the basis for the NA
application. Intake and excretion of the livestock
was estimated using a model that uses as inputs
animal type, size, grazing time and feed availability
(Vlaming et al. 2001). To quantify N flows we used
conversion coefficients obtained from analysis of
plant and soil samples taken during the survey and for
those flows that were more difficult to quantify we
used conversion coefficients from the literature
(Table 4 in Appendix). A more detailed description
of the farming systems and data used can be found in
Rufino et al. (2008) and Langeveld et al. (2008).
Exploring the effect of management options
NA indicators for the three farm household types
were calculated for the situation at the moment of the
survey (baseline scenario), followed by an explora-
tion of the consequences of farm management
changes for the indicator values (improved manage-
ment scenario). IN, TIN, TST, T.. and TSTc were
expressed on a per capita basis to allow comparison
of N use of the different farm household types. The
management changes included increased yields of
barley from its current value of 2 to 3 t ha-1, and
faba-beans from 1 to 2 t ha-1, these yield levels were
recorded in similar agro-ecosystems in the highlands
of Ethiopia (Agegnehu et al. 2006). It was assumed
that the associated increase in the availability of crop
Table 2 Main characteristics of three types of farm house-
hold systems from Teghane, Ethiopia representing three
different wealth classes, i.e. poor, medium wealth and wealthy
Poor Medium Wealthier
Farm household characteristics
Arable land (ha) 0.30 0.70 2.40
Own land (ha) 0.30 0.70 1.60
Household members 5 9 10
Animals (TLUs)a
Cattle 1 4.7 6.3
Sheep 0.2 0.9 3.0
Donkeys – 0.9 0.7
Mules – 0.6 –
Poultry 0.01 0.02 0.04
Crops (ha)
Barley 0.49 0.55
Barley irrigated 0.23 0.10 0.38
Barley rented-in 0.57
Wheat 0.15
Wheat rented-in 0.68
Faba beans 0.08 0.10
Prickly pears 0.07
a TLUs are tropical livestock units, one tropical livestock unit
equals an animal of 250 kg body mass
236 Nutr Cycl Agroecosyst (2009) 84:229–247
123
residues was subtracted from the feed imported from
common pastures. More manure N was retained on-
farm because of improved management within fea-
sible ranges as reported by Rufino et al. (2006). We
assumed that in the improved management scenario,
70% of the manure available for recycling on-farm
was conserved contributing to higher application
rates to crops, and resulting in higher crop yields.
Sensitivity analysis
The objective of the partial sensitivity analysis was to
evaluate the effect of changes in the underlying data
used to estimate N flows, and the conceptualisation of
the system on the NA indicators. We used only the
wealthier farm household for the sensitivity analysis.
First, all parameters associated to plant and animal
products and fertilisers were changed to their max-
imum and minimum values (Table 4 in Appendix).
Second, parameters related to management were
changed to their maximum and minimum. Third,
we compared three network configurations of the
same farm household system to evaluate the impact
of (dis)aggregation of compartments on NA indica-
tors, i.e. (1) the baseline configuration with 12
compartments (Fig. 4), and (2) a configuration with
four compartments where all animal compartments
were aggregated into one livestock compartment and
all cropping activities into one crop compartment,
and (3) a configuration with 14 compartments where
two crop compartments were each split into two
compartments, i.e. fields were divided into two plots.
BarleyFababeans Barley
irrigated
Mule
Milk
Manure
Manure
Manure
Feed
Manure
Grain Straw
FeedManure
Straw
Straw
Grain Grain
Straw
Sheep
Manure
Manure
Seed
Faeces
Waste
Straw Straw
Manure
Manure
Milk
Manure
Manure
Urine Food
Eggs
Household
Feed
Seed Fertilisers
Feed
Grain
Meat Meat
Manure
Meat
ChickenCattle
Manure storage
Donkey
Barley Wheat
Donkey
Cattle
Manure storageFeed
Manure
Manure
Barley(rented)
Wheat(rented)
Manure
Seeds
Straw
Chicken
Sheep
Straw
Eggs
Manure
Seeds
Grain Grain
Straw
Grain Eggs
GrainSeeds
Straw
Grain
Grain
Seeds
Urine Grain
Feed Manure
Manure
Household
Straw
Grain
Manure
Straw Manure
Faeces
GrainGrain
Fababeans
Manure
Meat + milk
Feed
Manure
Barley irrigated
Seeds
Manure
Fertiliser
(Poor) (Medium)
(Wealthier)
Barleyirrigated
Household
Sheep
Prickly pears
Cattle
Chicken
Milk
Manure
Milk
Manure
Manure storage
Feed Manure Meat
Grain
Straw
Feed Manure
Manure
Leaves Fruits
Excreta
Meat Manure
Seed
Fertiliser
Grain
Meat
ExcretaFood
Grain
WasteManure
Straw
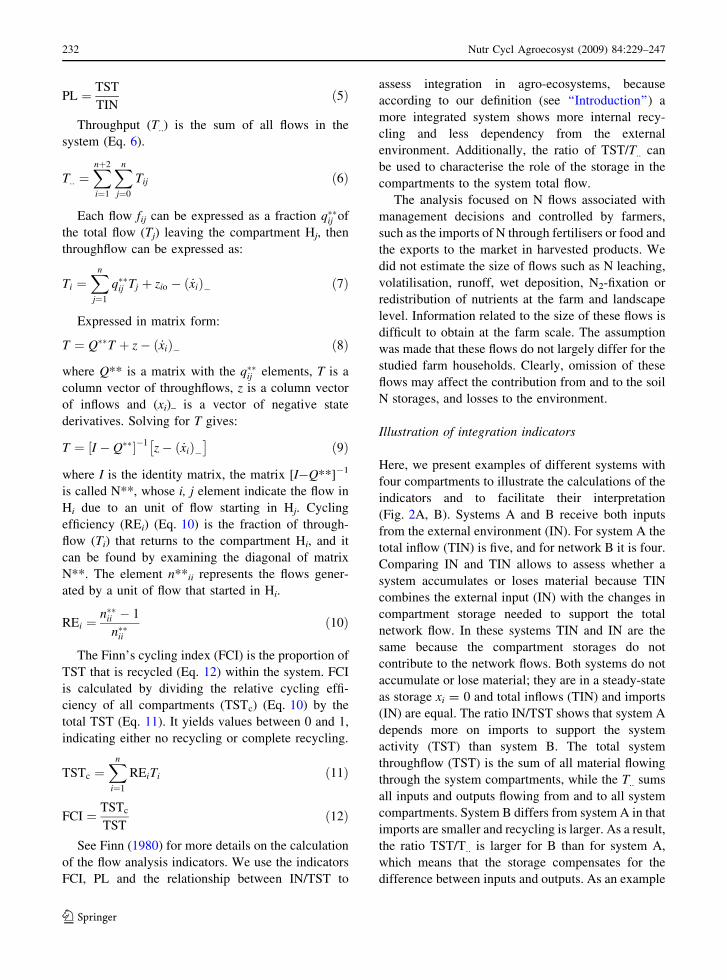
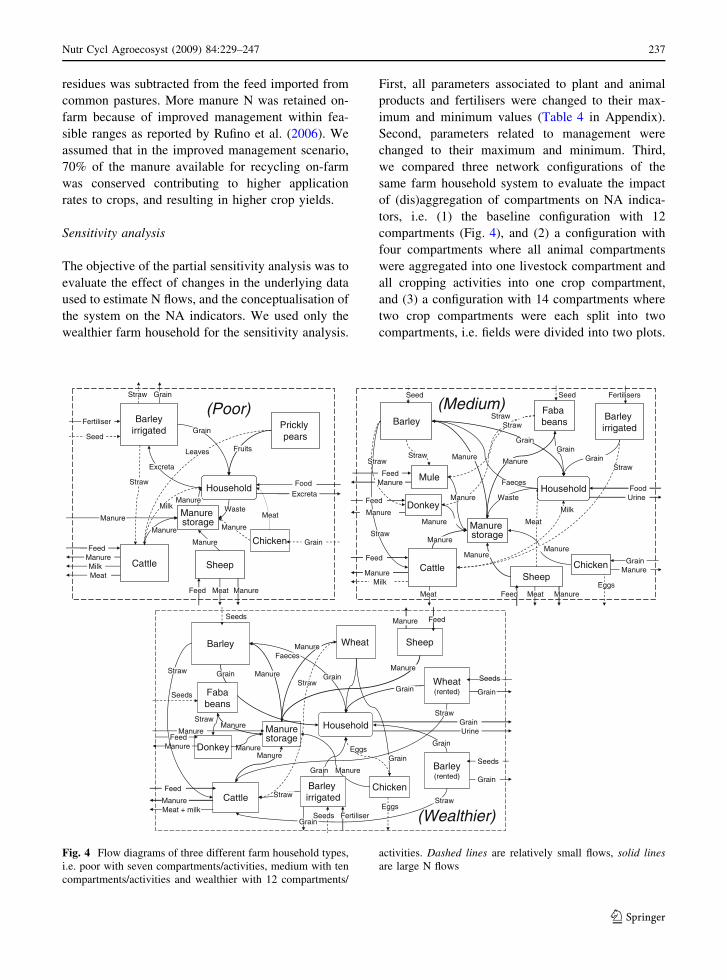
Fig. 4 Flow diagrams of three different farm household types,
i.e. poor with seven compartments/activities, medium with ten
compartments/activities and wealthier with 12 compartments/
activities. Dashed lines are relatively small flows, solid linesare large N flows
Nutr Cycl Agroecosyst (2009) 84:229–247 237
123
Results
The farm households as a network of N flows
The poor, medium and wealthier farm household were
each conceptualised as networks of N flows in Fig. 4.
The poor farm household had 0.3 ha of land, cattle,
sheep and few chickens. Livestock fed mainly with
biomass from communal land and with on-farm
produced crop residues. No feed was purchased to
support animal production. Manure from the corral
was used only as household fuel. Most milk was sold
and only a small portion was used for household
consumption. Two crops were grown, i.e. (irrigated)
barley (Hordeum vulgare L.) and prickly pear (Opun-
tia spp.). Part of the barley harvest was exchanged for
labour and traction by means of share-cropping.
Mineral fertilisers were applied exclusively to the
irrigated barley crop. A large amount of food was
imported because on-farm production could not meet
the household requirements (see Table 5 in Appen-
dix). A significant amount of cash came from off-farm
employment of the family head. There were no other
important sources of income.
The medium wealth farm household had 0.7 ha
with rainfed and irrigated barley, faba beans (Vicia
faba L.), cattle, a mule, a donkey, sheep, and
chickens. Animals were fed on communal land, crop
residues produced on-farm, and purchased feed.
Manure was collected from the corral, composted in
heaps and used as fertiliser. Milk was partly sold and
partly consumed by the household members while
eggs were sold. Mineral fertilisers were exclusively
applied to the irrigated barley crop. Some food was
purchased, but most household consumption was met
by on-farm production (see Table 6 in Appendix).
Cash was generated mainly through the sale of honey,
eggs, sheep hides, and leasing out the mule.
The wealthier farm household had 2.4 ha with
common wheat (Triticum spp.), buckwheat (Fagopy-
rum esculentum), barley and faba beans, cattle, sheep,
donkeys and chickens. The animals were fed on
communal land, with crop residues produced on-farm,
and with purchased supplements. Manure from the
corral was partly used as fertilisers and partly as fuel.
Neither manure nor fertilisers were applied to the
rented land. Milk was used for home consumption.
Half of the grain production of the rented land was
used to pay this rent. Mineral fertilisers were applied
only to the irrigated plots. Household food require-
ments were met by on-farm production and the food
surplus was marketed (see Table 7 in Appendix). The
N flow within each of the three farm households was
dominated by the N supply to the household and the
livestock. The largest N inflow was the result of the
livestock grazing in the common pastures. The
collected livestock excreta was recycled and used as
fertiliser and fuel for cooking. A part of the crop
residues was used to feed livestock but their contri-
bution to the total N flow in the system was relatively
small.
Indicators to assess integration and diversity
Baseline scenario under current management
All farm households depended largely on imported N
(IN) to support the system throughflow (TST)
(Table 3). IN represented between 66 and 70% of
TST for the three farm types. IN comprised N
fertilisers, feed N and food N. Fertiliser N use was
limited in all three farms. The poor farm household
used more fertiliser N on a per hectare basis, and
imported more feed N per tropical livestock unit
(TLU) than the other types. The medium and
wealthier farm households applied manure N (109
and 30 kg ha-1, respectively) while the poor farm
household used manure mainly as fuel. Imported feed
N represented the largest proportion (78–92%) of IN,
with a daily average of 100–150 g N per TLU.
Purchased food N as grain accounted for about
3 kg N per capita per year in the poor and medium
wealth farm households.
The amount of N recycled (TSTc) was small for all
three systems (between 1 and 2.5 kg N per capita) as
compared with the total system throughflow (TST),
and therefore FCIs and path lengths (PL) were also
relatively small. Statistical HR showed that diversity
in the network connections (N flows) increased from
the poor to the wealthier farm households, but
differences were small. The relatively more diverse
and wealthier farm households (HR = 2.4) did not
recycle more N (FCI = 2.2–2.6%) than the relatively
less diverse (HR = 2.2) and poor farm household
(FCI = 2.9%). Since the three farm households
manage their N resources similarly, the degree of
integration in the poor, medium and wealthier farm
households was also similar.
238 Nutr Cycl Agroecosyst (2009) 84:229–247
123
Scenario under improved management
In the alternative management scenario the integra-
tion of farming activities increased (FCI ranged from
4.2 to 7.7%, see Table 3) because the amount of N
recycled (TSTc) more than doubled. The dependency
on external N inputs decreased (IN/TST) from 66–70
to 53–58%, while PL increased only slightly. N flows
of the improved management scenario are shown in
Tables 5, 6, and 7. The diversity in the N flow pattern
also increased somewhat (HR = 2.4–2.6 vs. 2.2–2.4
in the baseline) because the size of internal flows
increased. AMI was slightly reduced because the N
flows were more homogeneously distributed.
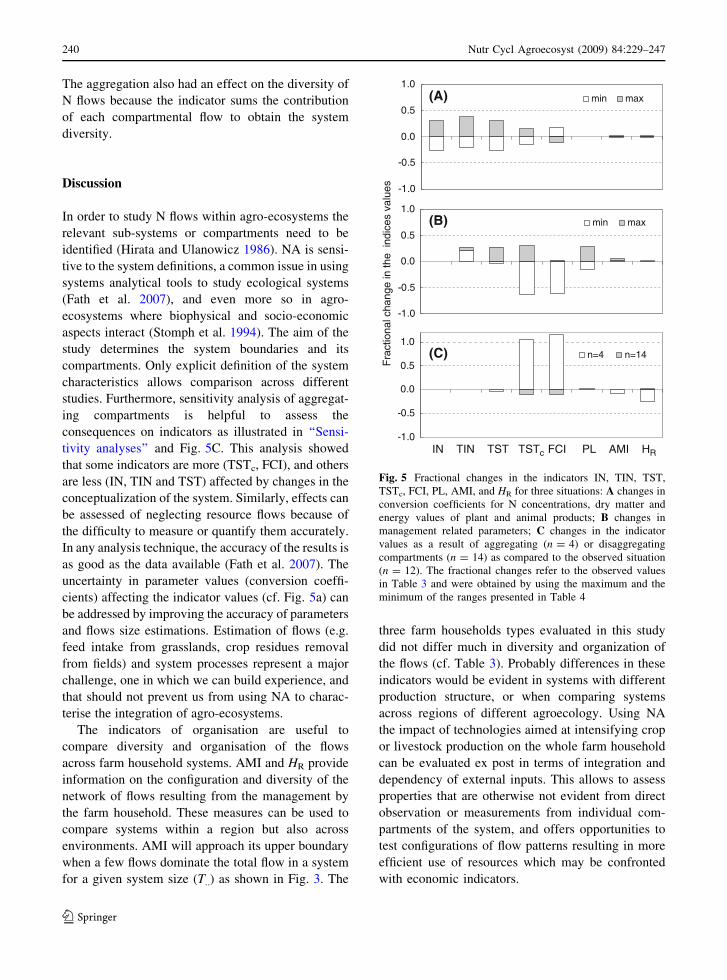
Sensitivity analyses
The change of parameters associated to plant and
animal products and fertilisers to the maximum and
minimum values found in the literature caused a
relative change of 26–29% in IN, TIN, TST, 10–15%
in TSTc and FCI and practically no change in the
other indicators (Fig. 5A). Changes in the conversion
coefficients alter the size of the N flows, and therefore
all the indicators related to system size, activity and
cycling. The change in TSTc and FCI is different than
for the other indicators because there are few cycling
flows in the network, i.e. the change in TSTc is
relatively smaller than the change in TST. PL does
not change as it depends much on the number of
activities which was not altered.
The change in management parameters had a
relatively greater effect on the integration indicators
(TSTc, FCI and PL) (Fig 5B) than the change in
conversion coefficients of plant and animal products
and fertilisers. PL changed because of the changes in
TIN and TST. Management parameters determine the
amount of N retained in the system resulting in a
much larger effect on TSTc, FCI and PL (Fig. 5B).
The conceptualisation of the system has a large effect
on the recycling indicators (TSTc, FCI and PL) and
on the structure/organisation related indicators (AMI,
HR) (Fig. 5C), and relatively no or little effect on the
system size related indicators (IN, TIN and TST). By
removing compartments, the amount of N cycled
increased because we aggregated the flows of several
compartments into one. The total flow in the system
did not change due to the aggregation, and therefore
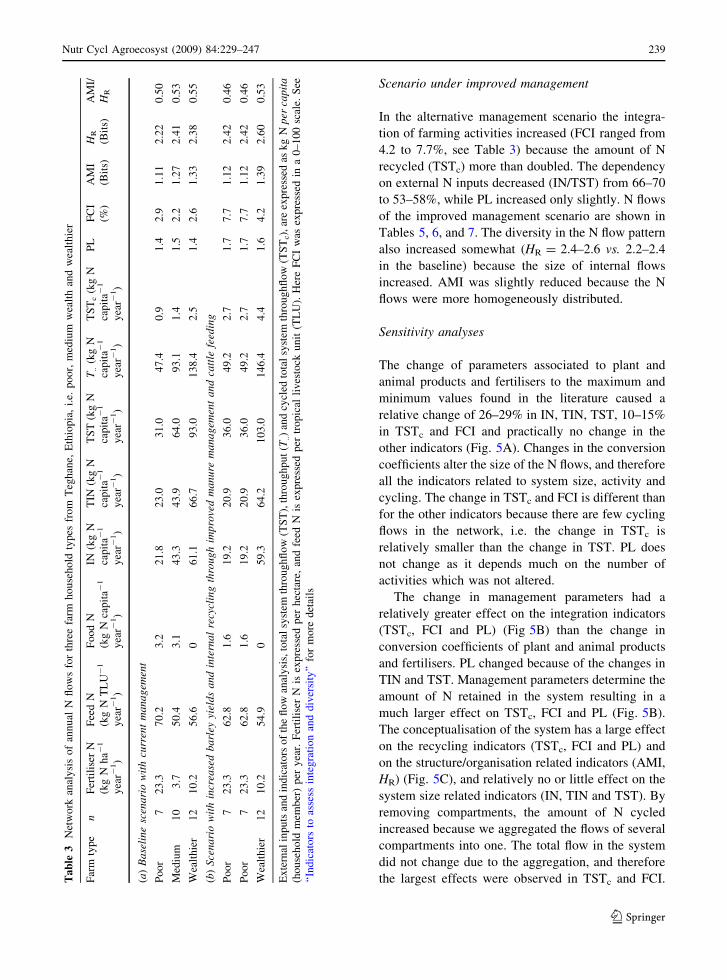
the largest effects were observed in TSTc and FCI.Ta
ble
3N
etw
ork
anal
ysi
so
fan
nu
alN
flo
ws
for
thre
efa
rmh
ou
seh
old
typ
esfr
om
Teg
han
e,E
thio
pia
,i.
e.p
oo
r,m
ediu
mw
ealt
han
dw
ealt
hie
r
Far
mty
pe
nF
erti
lise
rN
(kg
Nh
a-1
yea
r-1)
Fee
dN
(kg
NT
LU
-1
yea
r-1)
Fo
od
N
(kg
Nca
pit
a-1
yea
r-1)
IN(k
gN
cap
ita-
1
yea
r-1)
TIN
(kg
N
cap
ita-
1
yea
r-1)
TS
T(k
gN
cap
ita-
1
yea
r-1)
T..
(kg
N
cap
ita-
1
yea
r-1)
TS
Tc
(kg
N
cap
ita-
1
yea
r-1)
PL
FC
I
(%)
AM
I
(Bit
s)
HR
(Bit
s)
AM
I/
HR
(a)
Ba
seli
ne
scen
ari
ow
ith
curr
ent
ma
na
gem
ent
Po
or
72
3.3
70
.23
.22
1.8
23
.03
1.0
47
.40
.91
.42
.91
.11
2.2
20
.50
Med
ium
10
3.7
50
.43
.14
3.3
43
.96
4.0
93
.11
.41
.52
.21
.27
2.4
10
.53
Wea
lth
ier
12
10
.25
6.6
06
1.1
66
.79
3.0
13
8.4
2.5
1.4
2.6
1.3
32
.38
0.5
5
(b)
Sce
na
rio
wit
hin
crea
sed
ba
rley
yiel
ds
an
din
tern
al
recy
clin
gth
rou
gh
imp
rove
dm
an
ure
ma
na
gem
ent
an
dca
ttle
feed
ing
Po
or
72
3.3
62
.81
.61
9.2
20
.93
6.0
49
.22
.71
.77
.71
.12
2.4
20
.46
Po
or
72
3.3
62
.81
.61
9.2
20
.93
6.0
49
.22
.71
.77
.71
.12
2.4
20
.46
Wea
lth
ier
12
10
.25
4.9
05
9.3
64
.21
03
.01
46
.44
.41
.64
.21
.39
2.6
00
.53
Ex
tern
alin
pu
tsan
din
dic
ato
rso
fth
efl
ow
anal
ysi
s,to
tal
syst
emth
rou
gh
flo
w(T
ST
),th
rou
gh
pu
t(T
..)
and
cycl
edto
tal
syst
emth
rou
gh
flo
w(T
ST
c),
are
exp
ress
edas
kg
Np
erca
pit
a(h
ou
seh
old
mem
ber
)p
ery
ear.
Fer
tili
ser
Nis
exp
ress
edp
erh
ecta
re,
and
feed
Nis
exp
ress
edp
ertr
op
ical
liv
esto
cku
nit
(TL
U).
Her
eF
CI
was
exp
ress
edin
a0
–1
00
scal
e.S
ee
‘‘In
dic
ato
rsto
asse
ssin
teg
rati
on
and
div
ersi
ty’’
for
mo
red
etai
ls
Nutr Cycl Agroecosyst (2009) 84:229–247 239
123
The aggregation also had an effect on the diversity of
N flows because the indicator sums the contribution
of each compartmental flow to obtain the system
diversity.
Discussion
In order to study N flows within agro-ecosystems the
relevant sub-systems or compartments need to be
identified (Hirata and Ulanowicz 1986). NA is sensi-
tive to the system definitions, a common issue in using
systems analytical tools to study ecological systems
(Fath et al. 2007), and even more so in agro-
ecosystems where biophysical and socio-economic
aspects interact (Stomph et al. 1994). The aim of the
study determines the system boundaries and its
compartments. Only explicit definition of the system
characteristics allows comparison across different
studies. Furthermore, sensitivity analysis of aggregat-
ing compartments is helpful to assess the
consequences on indicators as illustrated in ‘‘Sensi-
tivity analyses’’ and Fig. 5C. This analysis showed
that some indicators are more (TSTc, FCI), and others
are less (IN, TIN and TST) affected by changes in the
conceptualization of the system. Similarly, effects can
be assessed of neglecting resource flows because of
the difficulty to measure or quantify them accurately.
In any analysis technique, the accuracy of the results is
as good as the data available (Fath et al. 2007). The
uncertainty in parameter values (conversion coeffi-
cients) affecting the indicator values (cf. Fig. 5a) can
be addressed by improving the accuracy of parameters
and flows size estimations. Estimation of flows (e.g.
feed intake from grasslands, crop residues removal
from fields) and system processes represent a major
challenge, one in which we can build experience, and
that should not prevent us from using NA to charac-
terise the integration of agro-ecosystems.
The indicators of organisation are useful to
compare diversity and organisation of the flows
across farm household systems. AMI and HR provide
information on the configuration and diversity of the
network of flows resulting from the management by
the farm household. These measures can be used to
compare systems within a region but also across
environments. AMI will approach its upper boundary
when a few flows dominate the total flow in a system
for a given system size (T..) as shown in Fig. 3. The
three farm households types evaluated in this study
did not differ much in diversity and organization of
the flows (cf. Table 3). Probably differences in these
indicators would be evident in systems with different
production structure, or when comparing systems
across regions of different agroecology. Using NA
the impact of technologies aimed at intensifying crop
or livestock production on the whole farm household
can be evaluated ex post in terms of integration and
dependency of external inputs. This allows to assess
properties that are otherwise not evident from direct
observation or measurements from individual com-
partments of the system, and offers opportunities to
test configurations of flow patterns resulting in more
efficient use of resources which may be confronted
with economic indicators.
-1.0
-0.5
0.0
0.5
1.0n=4 n=14
-1.0
-0.5
0.0
0.5
1.0min max
-1.0
-0.5
0.0
0.5
1.0min max
Fra
ctio
nal c
hang
e in
the
indi
ces
valu
es
IN TIN TST TSTc FCI PL AMI HR
(A)
(B)
(C)
Fig. 5 Fractional changes in the indicators IN, TIN, TST,
TSTc, FCI, PL, AMI, and HR for three situations: A changes in
conversion coefficients for N concentrations, dry matter and
energy values of plant and animal products; B changes in
management related parameters; C changes in the indicator
values as a result of aggregating (n = 4) or disaggregating
compartments (n = 14) as compared to the observed situation
(n = 12). The fractional changes refer to the observed values
in Table 3 and were obtained by using the maximum and the
minimum of the ranges presented in Table 4
240 Nutr Cycl Agroecosyst (2009) 84:229–247
123
The NA indicators showed that the farm house-
holds were different in size (TST), but equally small
in recycling and dependency on large N imports from
common pastures to support livestock production.
According to the analyses of this study, N cycling in
farm household systems is much smaller compared to
natural ecosystems (Finn 1980) since the principal
aim of agro-ecosystem is to produce food and other
products that are exported from the system. The three
farm types hardly differed in organisation of flows
and diversity although the poor household appeared
to be somewhat less diversified than the wealthier
household. On-farm production of fodder crops could
substitute or supplement the feeds from common
pastures, and add to the opportunities to increase
recycling. However, household objectives and limi-
tations imposed by other farm resources (e.g. labour
constraints) determine whether this strategy could
improve integration.
In the case study, collected excreta contributed to the
manure heap, but most urine from livestock was lost
reducing the amount of recycled N (TSTc). In addition
to mineral fertilisers, nitrogen input of crop activities
comprised household waste and (a part of) human
excreta. Both N sources contribute to the recycled N
(TSTc), and the cycling index of the systems (FCI). The
number of animals largely determined the amount of
imported N, because most of the feed requirements
were met with biomass from communal grazing land.
Wealthy and medium households imported relatively
large amounts of N for feeding livestock, but at least
half of the N excreta returned to the common pastures
during grazing. The amount of recycled N could
increase considerably if the animals were fed with
fodder produced on-farm, but this may compete for
land, labour and other resources.
Integrated systems which use nutrients efficiently
and reduce the dependency on external inputs should be
aimed at, especially in situations where farmers have no
or limited access to external inputs. In marginal
environments such as Northern Ethiopia, where the
availability of external inputs is uncertain (Abegaz et al.
2007), recycling of nutrients for crop and livestock
production may increase the adaptability and reliability
of farm household systems (Lopez-Ridaura et al. 2002).
NA can be used ex ante to compare farm
household systems across environments. In this study
the farm household system was the unit of analysis
but NA may be applied at other aggregation levels
(e.g. village or watershed), requiring a different
conceptualisation of the system. In the quantification
of N flows within the farm household systems we did
not include losses of N through leaching, and gaseous
losses. Provided data is available these flows can be
included in the NA, although estimation of their
importance is highly problematic (Faerge and Magid
2004). Linking integration indicators with farm
economic indicators may enable the identification of
synergies and trade-offs and the design of more
resource use efficient and robust farming systems.
Evaluating the relative importance of different flows
into and within the systems and comparing systems
across regions will be the focus of further research.
Conclusions
NA provides a tool to analyse the degree to which
household activities are integrated. Diversity of farm
household activities does not necessarily lead to inte-
gration of these activities through increased exchange of
nutrient resources. Conceptualising and measuring
processes and flows remain a major challenge in agro-
ecosystems studies, but this should not prevent us from
applying NA that assist us in quantifying integration and
diversity of agro-ecosystems. N cycling indicators of
farm household systems are much lower than those
calculated for natural ecosystems due to export of food
and other products from these systems. The relative
large amounts of N that are withdrawn limit opportu-
nities for recycling within farm household systems. But
still opportunities to increase N cycling in farm
household systems can be indentified using NA.
Increasing the input use to increase harvests, also
increase the amounts of nutrients prone to losses. To our
view, farming system (re)design or a system shift will be
needed to aim at sustainability.
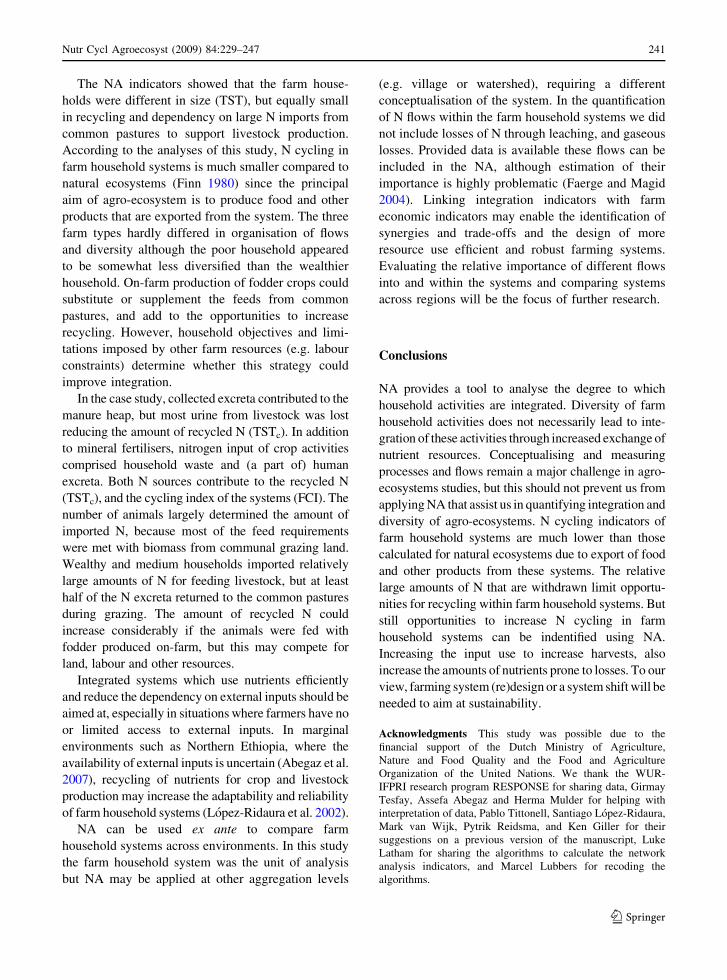
Acknowledgments This study was possible due to the
financial support of the Dutch Ministry of Agriculture,
Nature and Food Quality and the Food and Agriculture
Organization of the United Nations. We thank the WUR-
IFPRI research program RESPONSE for sharing data, Girmay
Tesfay, Assefa Abegaz and Herma Mulder for helping with
interpretation of data, Pablo Tittonell, Santiago Lopez-Ridaura,
Mark van Wijk, Pytrik Reidsma, and Ken Giller for their
suggestions on a previous version of the manuscript, Luke
Latham for sharing the algorithms to calculate the network
analysis indicators, and Marcel Lubbers for recoding the
algorithms.
Nutr Cycl Agroecosyst (2009) 84:229–247 241
123
Open Access This article is distributed under the terms of the
Creative Commons Attribution Noncommercial License which
permits any noncommercial use, distribution, and reproduction
in any medium, provided the original author(s) and source are
credited.
Appendix
See Tables 4, 5, 6, and 7.
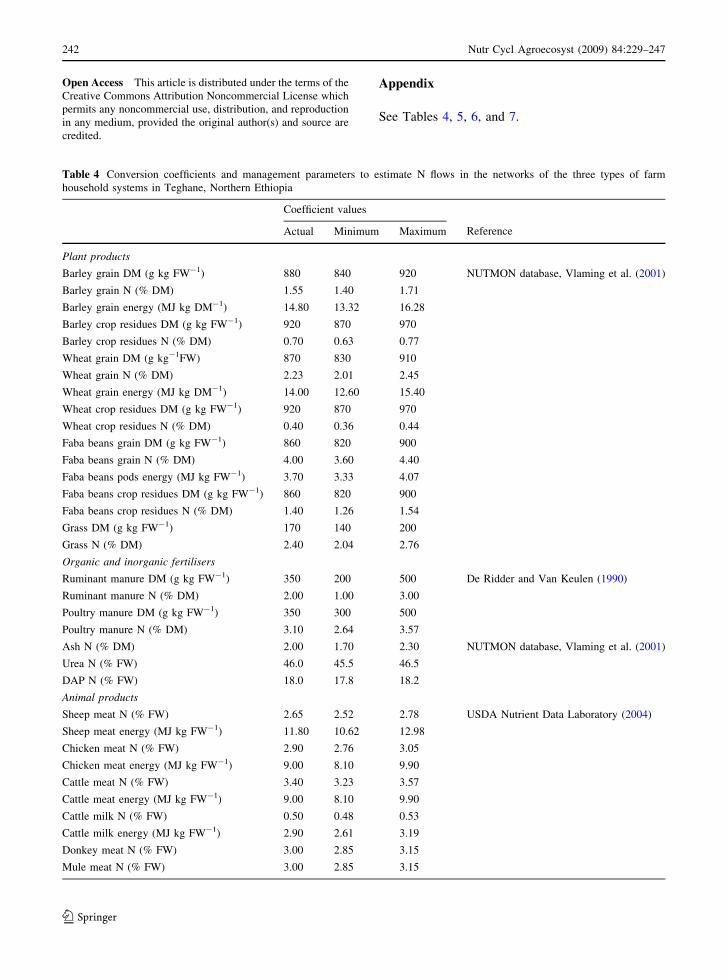
Table 4 Conversion coefficients and management parameters to estimate N flows in the networks of the three types of farm
household systems in Teghane, Northern Ethiopia
Coefficient values
ReferenceActual Minimum Maximum
Plant products
Barley grain DM (g kg FW-1) 880 840 920 NUTMON database, Vlaming et al. (2001)
Barley grain N (% DM) 1.55 1.40 1.71
Barley grain energy (MJ kg DM-1) 14.80 13.32 16.28
Barley crop residues DM (g kg FW-1) 920 870 970
Barley crop residues N (% DM) 0.70 0.63 0.77
Wheat grain DM (g kg-1FW) 870 830 910
Wheat grain N (% DM) 2.23 2.01 2.45
Wheat grain energy (MJ kg DM-1) 14.00 12.60 15.40
Wheat crop residues DM (g kg FW-1) 920 870 970
Wheat crop residues N (% DM) 0.40 0.36 0.44
Faba beans grain DM (g kg FW-1) 860 820 900
Faba beans grain N (% DM) 4.00 3.60 4.40
Faba beans pods energy (MJ kg FW-1) 3.70 3.33 4.07
Faba beans crop residues DM (g kg FW-1) 860 820 900
Faba beans crop residues N (% DM) 1.40 1.26 1.54
Grass DM (g kg FW-1) 170 140 200
Grass N (% DM) 2.40 2.04 2.76
Organic and inorganic fertilisers
Ruminant manure DM (g kg FW-1) 350 200 500 De Ridder and Van Keulen (1990)
Ruminant manure N (% DM) 2.00 1.00 3.00
Poultry manure DM (g kg FW-1) 350 300 500
Poultry manure N (% DM) 3.10 2.64 3.57
Ash N (% DM) 2.00 1.70 2.30 NUTMON database, Vlaming et al. (2001)
Urea N (% FW) 46.0 45.5 46.5
DAP N (% FW) 18.0 17.8 18.2
Animal products
Sheep meat N (% FW) 2.65 2.52 2.78 USDA Nutrient Data Laboratory (2004)
Sheep meat energy (MJ kg FW-1) 11.80 10.62 12.98
Chicken meat N (% FW) 2.90 2.76 3.05
Chicken meat energy (MJ kg FW-1) 9.00 8.10 9.90
Cattle meat N (% FW) 3.40 3.23 3.57
Cattle meat energy (MJ kg FW-1) 9.00 8.10 9.90
Cattle milk N (% FW) 0.50 0.48 0.53
Cattle milk energy (MJ kg FW-1) 2.90 2.61 3.19
Donkey meat N (% FW) 3.00 2.85 3.15
Mule meat N (% FW) 3.00 2.85 3.15
242 Nutr Cycl Agroecosyst (2009) 84:229–247
123
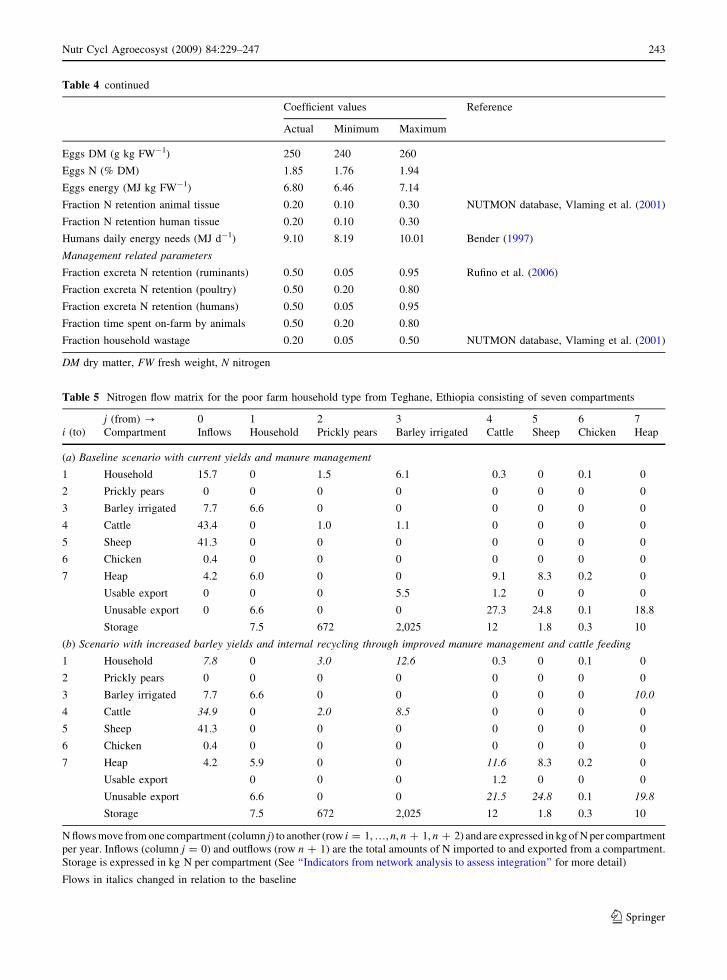
Table 4 continued
Coefficient values Reference
Actual Minimum Maximum
Eggs DM (g kg FW-1) 250 240 260
Eggs N (% DM) 1.85 1.76 1.94
Eggs energy (MJ kg FW-1) 6.80 6.46 7.14
Fraction N retention animal tissue 0.20 0.10 0.30 NUTMON database, Vlaming et al. (2001)
Fraction N retention human tissue 0.20 0.10 0.30
Humans daily energy needs (MJ d-1) 9.10 8.19 10.01 Bender (1997)
Management related parameters
Fraction excreta N retention (ruminants) 0.50 0.05 0.95 Rufino et al. (2006)
Fraction excreta N retention (poultry) 0.50 0.20 0.80
Fraction excreta N retention (humans) 0.50 0.05 0.95
Fraction time spent on-farm by animals 0.50 0.20 0.80
Fraction household wastage 0.20 0.05 0.50 NUTMON database, Vlaming et al. (2001)
DM dry matter, FW fresh weight, N nitrogen
Table 5 Nitrogen flow matrix for the poor farm household type from Teghane, Ethiopia consisting of seven compartments
i (to)j (from) ? 0 1 2 3 4 5 6 7
Compartment Inflows Household Prickly pears Barley irrigated Cattle Sheep Chicken Heap
(a) Baseline scenario with current yields and manure management
1 Household 15.7 0 1.5 6.1 0.3 0 0.1 0
2 Prickly pears 0 0 0 0 0 0 0 0
3 Barley irrigated 7.7 6.6 0 0 0 0 0 0
4 Cattle 43.4 0 1.0 1.1 0 0 0 0
5 Sheep 41.3 0 0 0 0 0 0 0
6 Chicken 0.4 0 0 0 0 0 0 0
7 Heap 4.2 6.0 0 0 9.1 8.3 0.2 0
Usable export 0 0 0 5.5 1.2 0 0 0
Unusable export 0 6.6 0 0 27.3 24.8 0.1 18.8
Storage 7.5 672 2,025 12 1.8 0.3 10
(b) Scenario with increased barley yields and internal recycling through improved manure management and cattle feeding
1 Household 7.8 0 3.0 12.6 0.3 0 0.1 0
2 Prickly pears 0 0 0 0 0 0 0 0
3 Barley irrigated 7.7 6.6 0 0 0 0 0 10.0
4 Cattle 34.9 0 2.0 8.5 0 0 0 0
5 Sheep 41.3 0 0 0 0 0 0 0
6 Chicken 0.4 0 0 0 0 0 0 0
7 Heap 4.2 5.9 0 0 11.6 8.3 0.2 0
Usable export 0 0 0 1.2 0 0 0
Unusable export 6.6 0 0 21.5 24.8 0.1 19.8
Storage 7.5 672 2,025 12 1.8 0.3 10
N flows move from one compartment (column j) to another (row i = 1, …, n, n ? 1, n ? 2) and are expressed in kg of N per compartment
per year. Inflows (column j = 0) and outflows (row n ? 1) are the total amounts of N imported to and exported from a compartment.
Storage is expressed in kg N per compartment (See ‘‘Indicators from network analysis to assess integration’’ for more detail)
Flows in italics changed in relation to the baseline
Nutr Cycl Agroecosyst (2009) 84:229–247 243
123
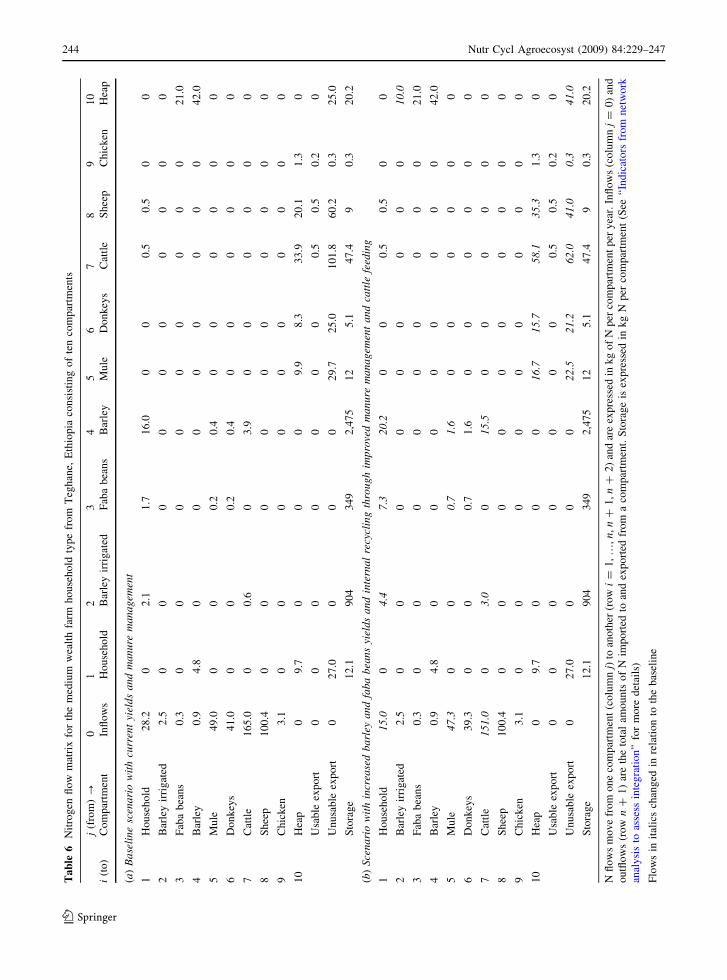
Ta
ble
6N
itro
gen
flo
wm
atri
xfo
rth
em
ediu
mw
ealt
hfa
rmh
ou
seh
old
typ
efr
om
Teg
han
e,E
thio
pia
con
sist
ing
of
ten
com
par
tmen
ts
i(t
o)
j(f
rom
)?
01
23
45
67
89
10
Co
mp
artm
ent
Infl
ow
sH
ou
seh
old
Bar
ley
irri
gat
edF
aba
bea
ns
Bar
ley
Mu
leD
on
key
sC
attl
eS
hee
pC
hic
ken
Hea
p
(a)
Ba
seli
ne
scen
ari
ow
ith
curr
ent
yiel
ds
an
dm
an
ure
ma
na
gem
ent
1H
ou
seh
old
28
.20
2.1
1.7
16
.00
00
.50
.50
0
2B
arle
yir
rig
ated
2.5
00
00
00
00
00
3F
aba
bea
ns
0.3
00
00
00
00
02
1.0
4B
arle
y0
.94
.80
00
00
00
04
2.0
5M
ule
49
.00
00
.20
.40
00
00
0
6D
on
key
s4
1.0
00
0.2
0.4
00
00
00
7C
attl
e1
65
.00
0.6
03
.90
00
00
0
8S
hee
p1
00
.40
00
00
00
00
0
9C
hic
ken
3.1
00
00
00
00
00
10
Hea
p0
9.7
00
09
.98
.33
3.9
20
.11
.30
Usa
ble
exp
ort
00
00
00
00
.50
.50
.20
Un
usa
ble
exp
ort
02
7.0
00
02
9.7
25
.01
01
.86
0.2
0.3
25
.0
Sto
rag
e1
2.1
90
43
49
2,4
75
12
5.1
47
.49
0.3
20
.2
(b)
Sce
na
rio
wit
hin
crea
sed
ba
rley
an
dfa
ba
bea
ns
yiel
ds
an
din
tern
al
recy
clin
gth
rou
gh
imp
rove
dm
an
ure
ma
na
gem
ent
an
dca
ttle
feed
ing
1H
ou
seh
old
15
.00
4.4
7.3
20
.20
00
.50
.50
0
2B
arle
yir
rig
ated
2.5
00
00
00
00
01
0.0
3F
aba
bea
ns
0.3
00
00
00
00
02
1.0
4B
arle
y0
.94
.80
00
00
00
04
2.0
5M
ule
47
.30
00
.71
.60
00
00
0
6D
on
key
s3
9.3
00
0.7
1.6
00
00
00
7C
attl
e1
51
.00
3.0
01
5.5
00
00
00
8S
hee
p1
00
.40
00
00
00
00
0
9C
hic
ken
3.1
00
00
00
00
00
10
Hea
p0
9.7
00
01
6.7
15
.75
8.1
35
.31
.30
Usa
ble
exp
ort
00
00
00
00
.50
.50
.20
Un
usa
ble
exp
ort
02
7.0
00
02
2.5
21
.26
2.0
41
.00
.34
1.0
Sto
rag
e1
2.1
90
43
49
2,4
75
12
5.1
47
.49
0.3
20
.2
Nfl
ow
sm
ov
efr
om
on
eco
mp
artm
ent
(co
lum
nj)
toan
oth
er(r
ow
i=
1,
…,
n,
n?
1,
n?
2)
and
are
exp
ress
edin
kg
of
Np
erco
mp
artm
ent
per
yea
r.In
flo
ws
(co
lum
nj
=0
)an
d
ou
tflo
ws
(ro
wn
?1
)ar
eth
eto
tal
amo
un
tso
fN
imp
ort
edto
and
exp
ort
edfr
om
aco
mp
artm
ent.
Sto
rag
eis
exp
ress
edin
kg
Np
erco
mp
artm
ent
(See
‘‘In
dic
ato
rsfr
om
net
wo
rk
anal
ysi
sto
asse
ssin
teg
rati
on
’’fo
rm
ore
det
ails
)
Flo
ws
init
alic
sch
ang
edin
rela
tio
nto
the
bas
elin
e
244 Nutr Cycl Agroecosyst (2009) 84:229–247
123
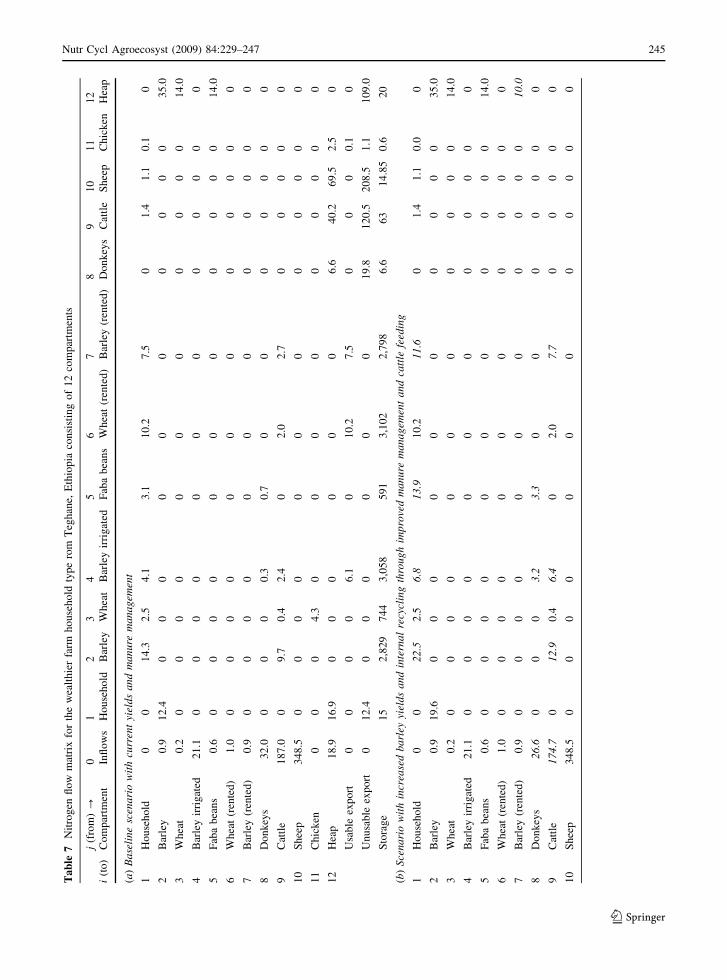
Ta
ble
7N
itro
gen
flo
wm
atri
xfo
rth
ew
ealt
hie
rfa
rmh
ou
seh
old
typ
ero
mT
egh
ane,
Eth
iop
iaco
nsi
stin
go
f1
2co
mp
artm
ents
i(t
o)
j(f
rom
)?
01
23
45
67
89
10
11
12
Co
mp
artm
ent
Infl
ow
sH
ou
seh
old
Bar
ley
Wh
eat
Bar
ley
irri
gat
edF
aba
bea
ns
Wh
eat
(ren
ted
)B
arle
y(r
ente
d)
Do
nk
eys
Cat
tle
Sh
eep
Ch
ick
enH
eap
(a)
Ba
seli
ne
scen
ari
ow
ith
curr
ent
yiel
ds
an
dm
an
ure
ma
na
gem
ent
1H
ou
seh
old
00
14
.32
.54
.13
.11
0.2
7.5
01
.41
.10
.10
2B
arle
y0
.91
2.4
00
00
00
00
00
35
.0
3W
hea
t0
.20
00
00
00
00
00
14
.0
4B
arle
yir
rig
ated
21
.10
00
00
00
00
00
0
5F
aba
bea
ns
0.6
00
00
00
00
00
01
4.0
6W
hea
t(r
ente
d)
1.0
00
00
00
00
00
00
7B
arle
y(r
ente
d)
0.9
00
00
00
00
00
00
8D
on
key
s3
2.0
00
00
.30
.70
00
00
00
9C
attl
e1
87
.00
9.7
0.4
2.4
02
.02
.70
00
00
10
Sh
eep
34
8.5
00
00
00
00
00
00
11
Ch
ick
en0
00
4.3
00
00
00
00
0
12
Hea
p1
8.9
16
.90
00
00
06
.64
0.2
69
.52
.50
Usa
ble
exp
ort
00
00
6.1
01
0.2
7.5
00
00
.10
Un
usa
ble
exp
ort
01
2.4
00
00
00
19
.81
20
.52
08
.51
.11
09
.0
Sto
rag
e1
52
,82
97
44
3,0
58
59
13
,10
22
,79
86
.66
31
4.8
50
.62
0
(b)
Sce
na
rio
wit
hin
crea
sed
ba
rley
yiel
ds
an
din
tern
al
recy
clin
gth
rou
gh
imp
rove
dm
an
ure
ma
na
gem
ent
an
dca
ttle
feed
ing
1H
ou
seh
old
00
22
.52
.56
.81
3.9
10
.21
1.6
01
.41
.10
.00
2B
arle
y0
.91
9.6
00
00
00
00
00
35
.0
3W
hea
t0
.20
00
00
00
00
00
14
.0
4B
arle
yir
rig
ated
21
.10
00
00
00
00
00
0
5F
aba
bea
ns
0.6
00
00
00
00
00
01
4.0
6W
hea
t(r
ente
d)
1.0
00
00
00
00
00
00
7B
arle
y(r
ente
d)
0.9
00
00
00
00
00
01
0.0
8D
on
key
s2
6.6
00
03
.23
.30
00
00
00
9C
attl
e1
74
.70
12
.90
.46
.40
2.0
7.7
00
00
0
10
Sh
eep
34
8.5
00
00
00
00
00
00
Nutr Cycl Agroecosyst (2009) 84:229–247 245
123
References
Abegaz A (2005) Farm management in mixed crop-livestock
systems in the northern highlands of Ethiopia. Doctoral
thesis. Wageningen University, Wageningen
Abegaz A, Van Keulen H, Haile M, Oosting S (2007) Nutrient
dynamics on smallholder farms in Teghane, northern
highlands of Ethiopia. In: Bationo A, Waswa B, Kihara J,
Kimetu J (eds) Advances in integrated soil fertility man-
agement in sub-Saharan Africa: challenges and
opportunities. Springer, Germany, pp 365–368
Agegnehu G, Ghizaw A, Sinebo W (2006) Yield performance
and land-use efficiency of barley and faba bean mixed
cropping in Ethiopian highlands. Eur J Agron 25:202–
207. doi:10.1016/j.eja.2006.05.002
Allesina S, Ulanowicz RE (2004) Cycling in ecological net-
works: Finn’s index revisited. Comput Biol Chem
28:227–233. doi:10.1016/j.compbiolchem.2004.04.002
Baird D, Ulanowicz RE (1993) Comparative study on the tro-
phic structure, cycling and ecosystem properties of 4 tidal
estuaries. Mar Ecol Prog Ser 99:221–237. doi:10.3354/
meps099221
Bender WH (1997) How much food will we need in the 21st
century? Environment 39:6
Christian RR, Fores E, Comin F, Viaroli P, Naldi M, Ferrari I
(1996) Nitrogen cycling networks of coastal ecosystems:
influence of trophic status and primary producer form. Ecol
Modell 87:111–129. doi:10.1016/0304-3800(95)00019-4
Clergue B, Amiaud B, Pervanchon F, Lasserre-Joulin F,
Plantureux S (2005) Biodiversity: function and assess-
ment in agricultural areas. A review. Agron Sust Dev
25:1–15. doi:10.1051/agro:2004049
Dalsgaard JPT, Oficial RT (1997) A quantitative approach for
assessing the productive performance and ecological
contributions of smallholder farms. Agric Syst 55:503–
533. doi:10.1016/S0308-521X(97)00022-X
De Jager A, Nandwa SM, Okoth PF (1998) Monitoring nutrient
flows and economic performance in African farming
systems (NUTMON)-I. Concepts and methodologies.
Agric Ecosyst Environ 71:37–48. doi:10.1016/S0167-
8809(98)00130-3
De Ridder N, Van Keulen H (1990) Some aspects of the role of
organic matter in sustainable intensified arable farming
systems in the West-African semi-arid tropics (SAT). Fert
Res 26:299–310. doi:10.1007/BF01048768
Edwards CA, Grove TI, Harwood RR, Pierce Colfer CJ (1993)
The role of agroecology and integrated farming systems in
agricultural sustainability. Agric Ecosyst Environ 46:99–
121. doi:10.1016/0167-8809(93)90017-J
Ellis F (2000) Rural livelihoods and diversity in developing
countries. Oxford University Press, Oxford
Faerge J, Magid J (2004) Evaluating NUTMON nutrient bal-
ancing in sub-Saharan Africa. Nutr Cycl Agroecosyst
69:101–110. doi:10.1023/B:FRES.0000029680.97610.51
Fath BD, Patten BC (1999) Review of the foundations of net-
work environ analysis. Ecosyst 2:167–179. doi:10.1007/
s100219900067
Fath BD, Scharler UM, Ulanowicz RE, Hannon B (2007)
Ecological network analysis: network construction. Ecol
Modell 208:49–55. doi:10.1016/j.ecolmodel.2007.04.029
Ta
ble
7co
nti
nu
ed
i(t
o)
j(f
rom
)?
01
23
45
67
89
10
11
12
Co
mp
artm
ent
Infl
ow
sH
ou
seh
old
Bar
ley
Wh
eat
Bar
ley
irri
gat
edF
aba
bea
ns
Wh
eat
(ren
ted
)B
arle
y(r
ente
d)
Do
nk
eys
Cat
tle
Sh
eep
Ch
ick
enH
eap
11
Ch
ick
en0
00
4.3
00
00
00
00
0
12
Hea
p1
8.9
22
.10
00
00
01
0.0
56
.29
7.3
2.5
0
Usa
ble
exp
ort
00
00
8.9
01
0.2
11
.60
00
0.1
0
Un
usa
ble
exp
ort
01
9.6
00
00
00
18
.51
04
.41
80
.71
.11
25
.1
Sto
rag
e1
52
,82
97
44
3,0
58
59
13
,10
22
,79
86
.66
31
4.8
50
.62
0
Nfl
ow
sm
ov
efr
om
on
eco
mp
artm
ent
(co
lum
nj)
toan
oth
er(r
ow
i=
1,
…,
n,
n?
1,
n?
2)
and
are
exp
ress
edin
kg
Np
erco
mp
artm
ent
per
yea
r.In
flo
ws
(co
lum
nj
=0
)an
d
ou
tflo
ws
(ro
wn
?1
)ar
eth
eto
tal
amo
un
tso
fN
imp
ort
edto
and
exp
ort
edfr
om
aco
mp
artm
ent.
Sto
rag
eis
exp
ress
edin
kg
Np
erco
mp
artm
ent
(see
‘‘In
dic
ato
rsfr
om
net
wo
rk
anal
ysi
sto
asse
ssin
teg
rati
on
’’fo
rm
ore
det
ails
)
Flo
ws
init
alic
sch
ang
edin
rela
tio
nto
the
bas
elin
e
246 Nutr Cycl Agroecosyst (2009) 84:229–247
123
Finn JT (1980) Flow analysis of models of the Hubbard brook
ecosystem. Ecol 61:562–571. doi:10.2307/1937422
Fores E, Christian RR (1993) Network analysis of nitrogen
cycling in temperate, wetland ricefields. Oikos 67:299–
308. doi:10.2307/3545475
Groot JCJ, Rossing WAH, Lantinga EA, Van Keulen H (2003)
Exploring the potential for improved internal nutrient
cycling in dairy farming systems, using an eco-mathe-
matical model. Neth J Agric Sci 51:165–194
Hannon B (1973) The structure of ecosystems. J Theor Biol
41:535–546. doi:10.1016/0022-5193(73)90060-X
Heymans JJ, Ulanowicz RE, Bondavalli C (2002) Network
analysis of the South Florida Everglades graminoid mar-
shes and comparison with nearby cypress ecosystems. Ecol
Modell 149:5–23. doi:10.1016/S0304-3800(01)00511-7
Hirata H, Ulanowicz RE (1984) Information theoretical-anal-
ysis of ecological networks. Int J Syst Sci 15:261–270.
doi:10.1080/00207728408926559
Hirata H, Ulanowicz RE (1986) Large-scale system perspec-
tives on ecological modeling and analysis. Ecol Modell
31:79–104. doi:10.1016/0304-3800(86)90057-8
Langeveld JWA, Rufino MC, Hengsdijk H, Ruben R, Dixon J,
Verhagen J, Giller KE (2008) Evaluation of economic and
ecological performance of two farm household strategies:
diversification and integration: conceptual model and case
studies. Quantitative approaches in system analysis, no.
29. The C.T. de Wit Garduate School for Production
Ecology & Resource Conservation (PE&RC), Wagenin-
gen, 113 p
Latham LG, Scully EP (2002) Quantifying constraint to assess
development in ecological networks. Ecol Modell
154:25–44. doi:10.1016/S0304-3800(02)00032-7
Leontief WW (1951) The structure of American economy,
1919–1939: an empirical application of equilibrium
analysis. Oxford University Press, New York
Lopez-Ridaura S, Masera O, Astier M (2002) Evaluating the
sustainability of complex socio-environmental systems.
The MESMIS framework. Ecol Indic 2:135–148. doi:
10.1016/S1470-160X(02)00043-2
MacArthur R (1955) Fluctuations of animal populations, and a
measure of community stability. Ecol 36:533–536. doi:
10.2307/1929601
Mageau MT, Costanza R, Ulanowicz RE (1998) Quantifying
the trends expected in developing ecosystems. Ecol Mo-
dell 112:1–22. doi:10.1016/S0304-3800(98)00092-1
Mulder H (2003) A household analysis on income and nutrient
management in Tigray, Ethiopia: a quantitative and qualita-
tive analysis using the nutrient monitoring Tool, NUTMON.
MSc Thesis. Wageningen University, Wageningen
Niehof A (2004) The significance of diversification for rural
livelihood systems. Food Policy 29:321–338. doi:10.1016/
j.foodpol.2004.07.009
Odum EP (1969) Strategy of ecosystem development. Science
164:262–270. doi:10.1126/science.164.3877.262
Pant J, Demaine H, Edwards P (2005) Bio-resource flow in
integrated agriculture-aquaculture systems in a tropical
monsoonal climate: a case study in Northeast Thailand.
Agric Syst 83:203–219. doi:10.1016/j.agsy.2004.04.001
Prein M (2002) Integration of aquaculture into crop-animal
systems in Asia. Agric Syst 71:127. doi:10.1016/S0308-
521X(01)00040-3
Rufino MC, Rowe EC, Delve RJ, Giller KE (2006) Nitrogen
cycling efficiencies through resource-poor African crop-
livestock systems. Agric Ecosyst Environ 112:261–282.
doi:10.1016/j.agee.2005.08.028
Rufino MC, Verhagen J, Hengsdijk H, Langeveld JWA, Ruben
R, Dixon J, Giller KE (2008) Low-cost economic and
environmental performance assessment of farm household
systems: application to mixed crop-livestock systems in
the Ethiopian highlands. J Sustain Agric 32:565–585
Rutledge RW, Basorre BL, Mulholland RJ (1976) Ecological
stability: an information theory point of view. J Theor
Biol 57:355–371. doi:10.1016/0022-5193(76)90007-2
Shannon CE (1948) A mathematical theory of communication.
Bell Syst Tech J 27:379–423
Shannon CE, Weaver W (1949) The mathematical theory of
communication. University of Illinois Press, Urbana
Stomph TJ, Fresco LO, Van Keulen H (1994) Land-use system
evaluation—concepts and methodology. Agric Syst
44:243–255. doi:10.1016/0308-521X(94)90222-2
Ulanowicz RE (1980) An hypothesis on the development of nat-
ural communities. J Theor Biol 85:223–245. doi:10.1016/
0022-5193(80)90019-3
Ulanowicz RE (1997) Ecology, the ascendent perspective.
Columbia University Press, New York
Ulanowicz RE (2001) Information theory in ecology. Comput
Chem 25:393–399. doi:10.1016/S0097-8485(01)00073-0
USDA Nutrient Data Laboratory (2004) USDA ARS, national
nutrient database for standard reference, release 16, from
http://www.nal.usda.gov/fnic/foodcomp/search. Cited 13
April 2007
Van den Bosch H, De Jager A, Vlaming J (1998) Monitoring
nutrient flows and economic performance in African
farming systems (NUTMON)-II. Tool development. Agric
Ecosyst Environ 71:49–62. doi:10.1016/S0167-8809
(98)00131-5
Vereijken PH (2002) Transition to multifunctional land use and
agriculture. Neth J Agric Sci 50:171–179
Vlaming JH, Van den Bosch H, Van Wijk MS, De Jager A,
Bannink A, Van Keulen H (2001) Monitoring nutrient
flows and economic performance in tropical farming
systems (NUTMON). Manual for the NUTMON-toolbox.
Alterra, Green World Research. Agricultural Economics
Research Institute, LEI Wageningen
Nutr Cycl Agroecosyst (2009) 84:229–247 247
123