Embed Size (px)
Citation preview
ANAEROBIC SEQUENCING BATCH REACTOR
FOR THE TREATMENT OF MUNICIPAL WASTEWATER
WONG SHIH WEI
(B.Eng. (Hons.), NUS)
A THESIS SUBMITTED
FOR THE DEGREE OF MASTER OF ENGINEERING
DEPARTMENT OF CIVIL ENGINEERING
NATIONAL UNIVERSITY OF SINGAPORE
2007
i
Acknowledgements
I would like to express my sincere appreciations to my supervisor, Dr. Ng How Yong for his
guidance, inspirations and advice.
Special thanks also to my supportive comrades, Wong Sing Chuan, Tiew Siow Woon and
Krishnan Kavitha; the laboratory staff, Michael Tan, Chandrasegaran and Lee Leng Leng;
advisors, Dr Lee Lai Yoke, Chen Chia-Lung and Liu Ying; and my family and friends.
ii
Table of Contents
Page
Acknowledgements i
Table of Contents ii
Summary vi
List of Tables viii
List of Figures x
Nomenclature xiii
Chapter 1 Introduction 1
1.1 Background 1
1.1.1 The Water Crisis 1
1.1.2 The Energy Crisis 2
1.1.3 Treatment of municipal wastewater 4
1.2 Objectives 5 1.3 Scope of Work 5 Chapter 2 Literature Review 7
2.1 Anaerobic process for wastewater treatment 7
2.1.1 Anaerobic microorganisms and their roles 7
2.1.1.1 Hydrolytic bacteria 9
2.1.1.2 Fermentative bacteria 10
2.1.1.3 Acetogenic & homoacetogenic bacteria 11
2.1.1.4 Methanogens 12
2.1.2 History of research and applications 14
2.1.3 Advantages and disadvantages of anaerobic processes 15
iii
2.1.4 Common applications of anaerobic process 18 2.2 Applicability of anaerobic process for municipal wastewater 19
2.2.1 COD 20
2.2.2 Nitrogen 20
2.2.3 Alkalinity & fatty acids 21
2.2.4 Sulfate 22
2.2.5 Suspended solids 22
2.2.6 Flow rate of the wastewater 24
2.2.7 Temperature of wastewater 25
2.2.8 Concentration of chlorinated compounds 26
2.2.9 Presence of surfactants 26
2.2.10 Size of particles 27
2.3 Sequencing batch reactors 27
2.3.1 Concepts of a sequencing batch reactor 27
2.3.2 Advantages and disadvantages of a batch system 31
2.4 Powdered activated carbon 33
2.4.1 Activated carbon as an adsorbent 34
2.4.2 The adsorption process 35
2.4.3 Effect of PAC on biological activity 36
2.4.4 Soluble microbial compounds 38
2.4.4.1 Definition of soluble microbial products 38
2.4.4.2 Molecular weight distribution of SMPs 40
2.4.4.3 Chelating properties of SMPs 42
2.4.4.4 Toxicity of SMPs 42
2.4.4.5 SMP effect on process performance 42
2.4.4.6 SMPs in anaerobic systems 43
Chapter 3 Materials & Methodology 44
3.1 System set-up 44
3.2 Process Flow 48
3.3 Operating conditions 50
3.4 Seeding procedure 51
iv
3.5 Tests & Analysis 52
3.5.1 Physical & aggregate properties 52
3.5.1.1 Total suspended solids 52
3.5.1.2 Volatile suspended solids 53
3.5.1.3 Sludge volume index 53
3.5.2 Aggregate organic constituents 53
3.5.2.1 Chemical oxygen demand 54
3.5.2.2 Biochemical oxygen demand 55
3.5.2.3 Total organic carbon 56
3.5.3 Biogas composition 57
3.5.4 Volatile organic acids 58
3.5.5 pH value 58
3.5.6 Microscopic images 59
3.5.7 Molecular weight distribution of dissolved organic matter 59
3.5.8 Biostability of biomass 61
3.5.9 Microbiological analysis 62
3.5.9.1 DNA extraction 62
3.5.9.2 Polymerase chain reaction 63
3.5.9.3 Terminal Restriction Length Polymorphism (T-RFLP) 64
Chapter 4 Results & Discussion 65
4.1 Start-up study of AnSBR 65
4.1.1 MLSS & MLVSS at start-up 66
4.1.2 TSS and VSS at start-up 68
4.1.3 COD concentration and removal efficiency at start-up 73
4.1.4 Biogas production at start-up 78
4.2 Performance of AnSBR at different HRT 80
4.2.1 MLSS & MLVSS concentrations at HRT of 16, 8 and 6h 80
4.2.2 TSS and VSS concentrations of feed and effluent and removal efficiency 83
4.2.3 COD concentration of feed and effluent and removal efficiency 88
v
4.2.4 BOD5 concentration of feed and effluent and removal efficiency 94
4.2.5 Biogas composition and production rate at HRT of 16, 8 and 6h 98
4.2.6 Microbial study using T-RFLP fingerprinting 103
4.2.7 Microscopic study of mixed liquor biomass 108
4.3 Enhancement of AnSBR performance using PAC 112
4.3.1 MLSS and MLVSS before and after PAC addition 112
4.3.2 TSS and VSS concentration of feed and effluent 115
4.3.3 tCOD and sCOD concentration of feed and effluent 118
4.3.4 tBOD5 and sBOD5 of feed and effluent 122
4.3.5 Biogas composition and production rate 125
4.3.6 Microscopic image study of mixed liquor biomass 128
4.4 Biostability of sludge in the AnSBR 131
4.5 Molecular weight distribution of AnSBR feed and effluent 134
Chapter 5 Conclusions & Recommendations 137
5.1 Conclusions 137
5.1.1 Start-up study 137
5.1.2 Performance of AnSBR at different HRTs 138
5.1.3 Enhancement of AnSBR performance using PAC 140
5.1.4 Biostability of sludge in AnSBR 141
5.1.5 Molecular weight distribution of AnSBR feed and effluent 141
5.2 Recommendations 142 Reference 144
vi
Summary
An anaerobic sequencing batch reactor (AnSBR) was investigated for the treatment of municipal
wastewater from a local water reclamation plant.
The study showed that for start-up, the AnSBR required 110d to achieve stable performance at a
HRT of 16h compared to only 70d at HRT of 8h. The biomass retention capacity at a start-up
HRT of 16h (6,576 mg MLSS/L) was lower than that of 8h (6,933 mg MLSS/L). On the other
hand, the TSS (HRT of 16h, 8h - 86%, 57%), VSS (86%, 59%) and tCOD (73%, 45%) removal
efficiencies at HRT of 16h were also higher than those of 8h. However, the sCOD removal
efficiency was lower at a HRT of 16h (3.6%) than that observed at HRT of 8h (37%) due to the
slow growth rate of fermentors and methanogens. The average biogas yield was only 0.97 L/d at
a HRT of 16h but 1.7 L/d at a HRT of 8h. The amount of methane gas in the biogas was similar
for both HRTs. At 16h, it was 60% and at 8h, it was 62%.
The AnSBR was operated at 3 different HRTs (16, 8 and 6h) and their performances were
evaluated. The results showed that the AnSBR was able to retain the largest amount of solids at
the HRT of 8h (8,732 mg MLSS/L) because it had a shorter react phase than the HRT of 16h
(6,772 mg MLSS/L) and its decant point was higher than that of HRT of 6h (5,873 mg MLSS/L).
Meanwhile, a higher HRT led to a higher TSS (HRT of 16h, 8h, 6h – 85%, 60%, 28%), VSS
(82%, 70%, 33%), tCOD (74%, 51%, 21%) and sCOD (48%, 47%, 43%) removal efficiencies.
The tBOD5 removal efficiencies were similar at the HRT of 16h and 8h (78%, 82%) but that of
6h was very low (-14%). The sBOD5 removal efficiency was the lowest (37%) at a HRT of 16h
because the growth yield of the fermentors and methanogens were affected by the low organic
loading rate. The sBOD5 removal efficiency was higher at the HRT of 8h (54%) than 6h (47%),
which showed that operating the AnSBR at too low a HRT would adversely affect the
vii
performance of the AnSBR. It took nearly 80d for the biogas to reach the maximum 60%
methane when operating at a HRT of 16h but only 55d when operating at the HRT of 8 and 6h.
Furthermore, at the HRT of 8 and 6h, the maximum methane percentage could reach 70%. Thus,
a shorter HRT enabled the reactor to achieve the same quality of biogas in a shorter time and to
achieve a biogas with a higher methane percentage. T-RFLP fingerprinting was used to study the
microbial community structure in the AnSBR. A change in HRT did not result in significant
changes in the bacteria population but there was a distinct shift in the archaea population.
Powdered activated carbon (PAC) was successful in enhancing the performance of the AnSBR. A
dosage of 10, 15 and 20% (w/w) was added in the AnSBR operating at HRT of 6h and it was
found that there was a large improvement in the suspended solids and organics removal efficiency,
amount of methane produced, as well as the consistency of removal efficiency.
The sludge wasted from the AnSBR had a volatile solids reduction of 5.1% when operating at a
HRT of 16h and 8.5% to 9% when operating at a HRT of 8 and 6h, with and without PAC. These
values met the international standard for assessing sludge biostability which meant that no further
treatment was needed before the disposal of the sludge. Microscopic image analysis found that
there was a slight increase in the biofloc sizes with increasing organic loading rate, while the
addition of PAC in the AnSBR led to a significant increase in the biofloc sizes.
The apparent molecular weight (AMW) distribution of the feed and effluent of the AnSBR
showed a bimodal distribution with AMW of greater than 100 kDa and less than 1 kDa. The
amount of high-MW fractions (>100 kDa) was higher when operated at a longer HRT. The data
also showed that PAC was more successful in removing the high-MW fractions.
viii
List of Tables
Page
Table 2.1 Threshold concentrations of mesophilic methanogens (at initial pH 6.9 – 7.1). ........... 20
Table 2.2 Characteristics of PAC. ................................................................................................. 35
Table 2.3 Factors which cause SMP production, .......................................................................... 39
Table 3.1Equipment activated during different phases of a cycle................................................. 50
Table 3.2 Operating parameters at different HRTs. ...................................................................... 51
Table 3.3 Carbon fractions in wastewater ..................................................................................... 56
Table 3.4 Contents of extraction buffer......................................................................................... 63
Table 4.1 MLSS and MLVSS concentrations at start-up. ............................................................. 66
Table 4.2 Calculated organic loading rate and MLVSS/MLSS ratio. ........................................... 68
Table 4.3 TSS concentrations of feed, effluent and TSS removal efficiency................................ 69
Table 4.4 VSS concentrations of feed, effluent and VSS removal efficiency............................... 70
Table 4.5 Recommended minimum SRT for specific anaerobic process aim............................... 72
Table 4.6 tCOD concentrations of feed, effluent and the removal efficiency. .............................. 74
Table 4.7 sCOD concentrations of feed, effluent and the removal efficiency............................... 75
Table 4.8 Kinetics of anaerobic microorganisms (Metcalf & Eddy, 2003)................................... 76
Table 4.9 Period of stable operation at different HRTs................................................................. 80
Table 4.10 MLSS and MLVSS concentrations at different HRTs. ............................................... 81
Table 4.11 TSS concentrations of feed, effluent and the removal efficiencies at different HRT.. 83
Table 4.12 VSS concentration of feed, effluent and removal efficiency at different HRT. .......... 85
Table 4.13 tCOD concentrations of feed, effluent and removal efficiency at different HRT. ...... 89
Table 4.14 sCOD concentrations of feed, effluent and removal efficiency at different HRT....... 91
Table 4.15 A summary of results of other anaerobic reactors....................................................... 93
Table 4.16 tBOD5 concentration of feed, effluent and removal efficiency at different HRT........ 94
Page
Table 4.17 sBOD5 concentration of feed, effluent and removal efficiency at different HRT. ...... 94
Table 4.18 Average tBOD5, tCOD and tBOD5 to tCOD ratio of the feed and effluent at different
HRT............................................................................................................................................... 97
Table 4.19 Biogas and methane production rate at different HRTs. ........................................... 103
Table 4.20 Summary of equivalent diameter of bioflocs at different HRT................................. 111
Table 4.21 NVSS and MLSS at different PAC dosage. .............................................................. 114
Table 4.22 Biogas and methane gas production rate at different operating conditions............... 127

ix
Table 4.23 Equivalent diameter of bioflocs at different operating condition.............................. 130
Table 4.24 Apparent molecular weight distribution data of AnSBR feed and effluent at different
HRTs. .......................................................................................................................................... 134
Table 4.25 Apparent molecular weight distribution data of AnSBR effluent at different PAC
dosage.......................................................................................................................................... 136
x
List of Figures
Page
Figure 1.1 Increase in world population from 1950 to 2050. .......................................................... 2
Figure 2.1 The electron tower ......................................................................................................... 7
Figure 2.2 Metabolic microbial groups involved in anaerobic wastewater treatment process
(Madigan and Martinko, 2006)........................................................................................................ 9
Figure 2.3 Fermentation process. .................................................................................................. 10
Figure 2.4 Difference between methanogenesis and acetogenesis................................................ 12
Figure 2.5 Reactions involved in and nature of interspecies hydrogen transfer............................ 13
Figure 2.6 Theoretical maximum loading and hydrolysis rates vs Sa/Sb ....................................... 23
Figure 2.7 Typical hourly variations in flow and strength of domestic wastewater...................... 24
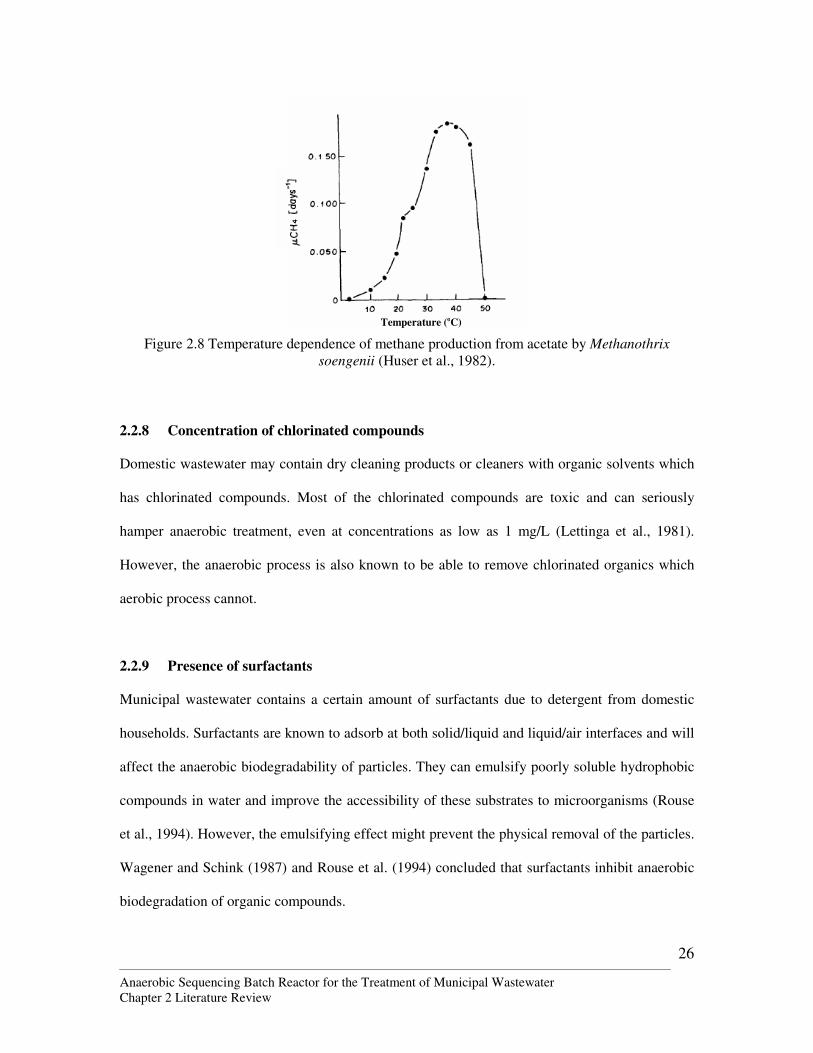
Figure 2.8 Temperature dependence of methane production from acetate by Methanothrix
soengenii (Huser et al., 1982)........................................................................................................ 26
Figure 2.9 Difference between a batch reactor and a continuous-flow stirred tank reactor (CSTR).
....................................................................................................................................................... 28
Figure 2.10 Different phases of a batch reactor in one operating cycle. ....................................... 28
Figure 2.11 Powdered activated carbon. ....................................................................................... 34
Figure 3.1 Photo of AnSBR set-up................................................................................................ 44
Figure 3.2 Raw sewage tank.......................................................................................................... 45
Figure 3.3 Raw sewage transfer tank and temperature controller ................................................. 45
Figure 3.4 AnSBR reactor ............................................................................................................. 46
Figure 3.5 Construction drawing of AnSBR ................................................................................. 47
Figure 3.6 Effluent tank................................................................................................................. 47
Figure 3.7 Pumps........................................................................................................................... 47
Figure 3.8 Schematic diagram of AnSBR ..................................................................................... 49
Figure 3.9 Processing schemes for obtaining molecular weight distribution................................ 60
Figure 3.10 Stirred cell for obtaining molecular weight distribution. ........................................... 60
Figure 3.11 AVSR test set-up........................................................................................................ 61
Figure 4.1 MLSS and MLVSS concentration in AnSBR at start-up,............................................ 67
Figure 4.2 TSS concentration of feed and effluent and TSS removal efficiency at start-up, (a)
HRT 16h; (b) HRT 8h. .................................................................................................................. 69
Page
xi
Figure 4.3 VSS concentration of feed and effluent and VSS removal efficiency during start-up, (a)
HRT 16h; (b) HRT 8h. .................................................................................................................. 71
Figure 4.4 tCOD concentration of feed and effluent and tCOD removal efficiency..................... 73
Figure 4.5 sCOD concentration of feed and effluent and sCOD removal efficiency.................... 74
Figure 4.6 Biogas composition at start-up, (a) HRT 16 h; (b) HRT 8 h........................................ 78
Figure 4.7 Biogas production at start-up, (a) HRT 16h; (b) HRT 8h. ........................................... 79
Figure 4.8 MLSS & MLVSS concentration at HRT of 16 and 6h. ............................................... 81
Figure 4.9 MLSS & MLVSS concentration at HRT of 8h. ........................................................... 82
Figure 4.10 TSS concentration and removal efficiency at HRT of 16 and 6h. ............................. 84
Figure 4.11 TSS concentration and removal efficiency at HRT of 8h. ......................................... 85
Figure 4.12 VSS concentration and removal efficiency at HRT of 16 and 6h. ............................. 86
Figure 4.13 VSS concentration and removal efficiency at HRT of 8h.......................................... 87
Figure 4.14 Photographs of samples, (a) feedwater; (b) HRT 16h effluent (sampled on D150 of
HRT 16h operation; (c) HRT 6h effluent (sampled on D55 of HRT 6h operation). ..................... 88
Figure 4.15 tCOD concentration and removal efficiency at HRT of 16 and 6h............................ 89
Figure 4.16 tCOD concentration and removal efficiency at HRT of 8h. ...................................... 90
Figure 4.17 sCOD concentration and removal efficiency at HRT of 16 and 6h. .......................... 91
Figure 4.18 sCOD concentration and removal efficiency at HRT of 8 h. ..................................... 92
Figure 4.19 BOD5 concentrations of feed, effluent and removal efficiency ................................. 95
Figure 4.20 BOD5 concentrations of feed, effluent and removal efficiency at HRT of 8 h. ......... 96
Figure 4.21 Biogas composition at HRT of 16 and 6h.................................................................. 98
Figure 4.22 Biogas composition at HRT of 8 h............................................................................. 99
Figure 4.23 Volume of biogas produced at HRT of 16 and 6h. .................................................. 100
Figure 4.24 Volume of biogas produced at HRT of 8 h. ............................................................. 102
Figure 4.27 Microscope image of mixed liquor biomass at HRT of 16h. ................................... 109
Figure 4.28 Microscope image of mixed liquor biomass at HRT of 8h. ..................................... 110
Figure 4.29 Microscope image of mixed liquor biomass at HRT of 6 h. .................................... 111
Page
Figure 4.30 (a) MLSS & MLVSS concentration at different PAC dosage; (b) Average MLVSS
and MLNVSS in the AnSBR at different PAC dosage. .............................................................. 113
Figure 4.31 TSS concentration of feed, effluent and the TSS removal efficiency at different PAC
dosage.......................................................................................................................................... 115
Figure 4.32 Average TSS and VSS removal efficiency at different operating conditions.......... 116
xii
Figure 4.33 VSS concentration of feed and effluent, and the TSS removal efficiency at different
PAC dosage. ................................................................................................................................ 117
Figure 4.34 tCOD concentration of feed, effluent and the tCOD removal efficiency at different
PAC dosage. ................................................................................................................................ 118
Figure 4.35 Average tCOD and sCOD removal efficiency at different PAC dosage. ................ 119
Figure 4.36 sCOD concentration of feed, effluent and the sCOD removal efficiency at different
PAC dosage. ................................................................................................................................ 120
Figure 4.37 tBOD5 concentration of feed, effluent and the tBOD5 removal efficiency at different
PAC dosage. ................................................................................................................................ 123
Figure 4.38 sBOD5 concentration of feed, effluent and the sBOD5 removal efficiency at different
PAC dosage. ................................................................................................................................ 124
Figure 4.39 Average tBOD5 and sBOD5 removal efficiency at different PAC dosage. .............. 124
Figure 4.40 (a) Composition of biogas at different PAC dosage , (b) Average percentage of
methane at different PAC dosage. ............................................................................................... 125
Figure 4.41 (a)Volume of biogas produced at different PAC dosage, (b) Average amount of
biogas produced at different PAC dosage. .................................................................................. 126
Figure 4.42 Microscope image of mixed liquor biomass at HRT of 6h with 10% PAC............. 129
Figure 4.43 Microscope image of mixed liquor biomass at HRT of 6h with 15% PAC............. 129
Figure 4.44 Microscope image of mixed liquor biomass at HRT of 6h with 20% PAC............. 130
Figure 4.45 Biostability of anaerobic digester sludge and AnSBR sludge from different operating
condition...................................................................................................................................... 133
xiii
Nomenclature
ADP adenosine diphosphate.
AMW apparent molecular weight
AnSBR anaerobic sequencing batch reactor
ATP adenosine tri-phosphate
AVSR additional volatile solids reduction
BOD, BOD5 5-day biochemical oxygen demand
bp base pair
CAS conventional activated sludge
COD chemical oxygen demand
CSTR continuous stirred tank reactor
DNA deoxyribonucleic acid
EGSB expanded granular sludge bed
emf electromotive force
F/M Food to microorganism
FVSR fraction volatile solids reduction
GPC gel permeation chromatography
HRT hydraulic retention time
kd decay constant
kdH decay constant of heterotrophs
Kj-N kjeldahl nitrogen
Ks half saturation coefficient
MBR membrane bioreactor
MLSS mixed liquor suspended solids
MLVSS mixed liquor volatile suspended solids
MPSA staged multi-phase anaerobic
MW molecular weight
PAC powdered activated carbon
PACT powdered activated carbon treatment
PCR polymerase chain reaction
PLC programmable logic controller
sBOD5 soluble 5-day biochemical oxygen demand
xiv
SBR sequencing batch reactor
sCOD soluble chemical oxygen demand
SMP soluble microbial product
SRT solids retention time
SS suspended solid
SVI sludge volume index
tBOD5 total 5-day biochemical oxygen demand
tCOD total chemical oxygen demand
T-RFLP terminal restriction fragment length polymorphism
TSS total suspended solids
UASB upflow anaerobic sludge blanket
UF ultrafiltration
VAR vector attraction reduction
VFA volatile fatty acid
VSR volatile solid reduction
VSS volatile suspended solids
WRP water reclamation plant
Y growth yield
YH growth yield of heterotrophs
µ specific growth rate
µm max specific growth rate
Anaerobic Sequencing Batch Reactor for the Treatment of Municipal Wastewater Chapter 1 Introduction
1
Chapter 1 Introduction
1.1 Background
There are two major crisis faced by nations worldwide, namely the water and energy crisis.
1.1.1 The Water Crisis
The water crisis is a global issue. Wastewater is generated and dispersed in large amounts such
that one out of six people (1.1 billion) has no access to safe drinking water and two out of six
people (2.6 billion) lack adequate sanitation (WHO and UNICEF, 2004).
Water is a universal solvent which makes it the most important fluid as well the most easily being
contaminated. Although water can be found in a lot of places, only clean and unpolluted water are
useful to us. Only 2.5% of the water in the world is freshwater and two-thirds of it is locked in
icebergs and glaciers. Of what is left, 20% is in remote areas, and much of the rest is in the wrong
place at the wrong time, such as floods and monsoons. As a result, only 0.08% of the water in the
world is available for human usage.
Global water consumption rose six-fold between 1900 and 1995 - more than double the rate of
population growth - and goes on growing as farming, industry and domestic demand increase. By
the year 2020, the World Water Council predicted that 17% more water is needed. This water
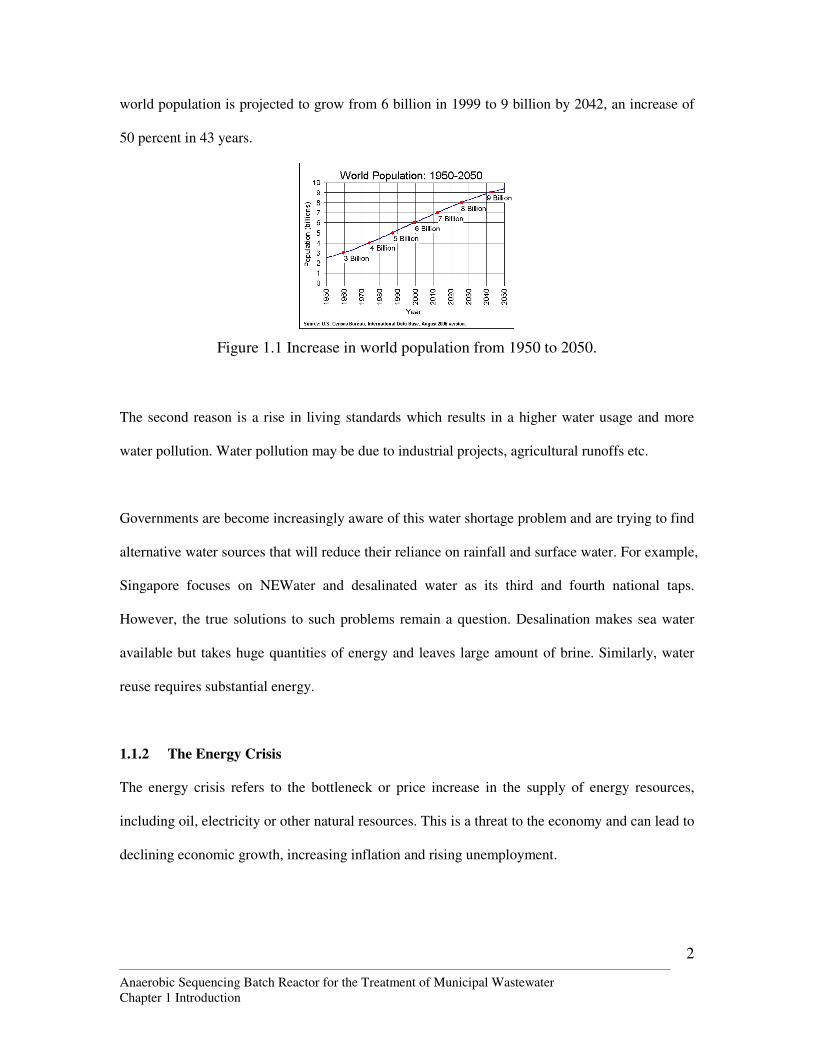
crisis arises due to 2 main reasons. The first reason is the increase in population (Figure 1.1). The
Anaerobic Sequencing Batch Reactor for the Treatment of Municipal Wastewater Chapter 1 Introduction
2
world population is projected to grow from 6 billion in 1999 to 9 billion by 2042, an increase of
50 percent in 43 years.
Figure 1.1 Increase in world population from 1950 to 2050.
The second reason is a rise in living standards which results in a higher water usage and more
water pollution. Water pollution may be due to industrial projects, agricultural runoffs etc.
Governments are become increasingly aware of this water shortage problem and are trying to find
alternative water sources that will reduce their reliance on rainfall and surface water. For example,
Singapore focuses on NEWater and desalinated water as its third and fourth national taps.
However, the true solutions to such problems remain a question. Desalination makes sea water
available but takes huge quantities of energy and leaves large amount of brine. Similarly, water
reuse requires substantial energy.
1.1.2 The Energy Crisis
The energy crisis refers to the bottleneck or price increase in the supply of energy resources,
including oil, electricity or other natural resources. This is a threat to the economy and can lead to
declining economic growth, increasing inflation and rising unemployment.
Anaerobic Sequencing Batch Reactor for the Treatment of Municipal Wastewater Chapter 1 Introduction
3
The world is highly dependent on oil as a source of energy. However, oil depletion is a problem
that is inevitable. Alternative sources of oil like tar sands, shale, coal-to-liquids, ethanol and
hydrogen proved to be less than satisfactory, because they contribute to global warming and
cannot be scaled up on a timely basis. In the meantime, it is speculated that it will take one
nuclear power plant every week until 2050 to fill the oil gap. There will be a uranium shortage
long before 2050 unless more efficient reactors are used. Solar energy seems to be a viable
alternative but it is not always available in all places in sufficient amounts.
The biogas produced by anaerobic treatment of wastewater contains methane which is a
hydrocarbon and energy-rich material also found in natural gas. While the amount of methane
produced by a wastewater treatment plant may not be enough to replace oil as an energy source, it
is certainly worthwhile to tap it to conserve the energy used in wastewater treatment. In addition,
there may be excess to feedback this energy to the public.
A report from the US EPA in April 2005 revealed that worldwide methane from wastewater
accounts for over 575 million metric tons of carbon dioxide equivalent in 2000. Wastewater is the
fifth largest source of anthropogenic methane emissions, contributing approximately 10% of total
global methane emissions in 2000. It is easy to imagine the large amount of energy that can be
recovered if the methane gas is utilized appropriately. In view that most large-scale municipal
wastewater treatment plants in developing and developed countries are aerobic systems right now,
a larger amount of this methane gas can be recovered if anaerobic systems are adopted in the
future.
Anaerobic Sequencing Batch Reactor for the Treatment of Municipal Wastewater Chapter 1 Introduction
4
1.1.3 Treatment of municipal wastewater
Wastewater is water that has been polluted due to anthropogenic activities. Types of wastewater
include domestic, commercial, industrial and agricultural, categorized by their sources as well as
type of contaminants and concentration. Municipal wastewater is a mixture of these different
types of wastewater. Municipal wastewater has a number of constituents, including pathogens
such as bacteria, virus and prions, non-pathogenic bacteria, organics such as faeces, hair, food
and fibres, inorganics such as sand, etc.
Due to the imposition of stricter limits of wastewater discharges and the possibility of water reuse,
there is a greater demand to treat wastewater efficiently. Many researches were done to design
and optimize biological treatment processes. Techniques from the microbiological science, such
as DNA fingerprinting, are used to identify the active mass in the biological treatment processes.
Till now, the conventional activated sludge system is the most common method of wastewater
treatment for the removal of organics and suspended solids. The system can be designed to
perform nutrient removal at the same time. Anaerobic systems have also been commonly used in
many places for the treatment of industrial wastewater and sludge digestion.
The wastewater today is continuously changing in quality and quantity. There are also emerging
health and environmental concerns, new industrial wastes and new regulations. In the meantime,
old wastewater infrastructure needs to be repaired, replaced and its technology updated. Therefore,
it is important that new technologies that are more efficient, convenient and environmentally-
conscious.
Anaerobic Sequencing Batch Reactor for the Treatment of Municipal Wastewater Chapter 1 Introduction
5
1.2 Objectives
The objectives of this project are:
• To study the feasibility of using anaerobic treatment process to treat raw
municipal wastewater obtained from a local water reclamation plant.
• To study the performance of the anaerobic treatment process in terms of effluent
quality, suspended solids and organics removal efficiencies, biogas quality and
quantity.
• To improve the quality of anaerobic treated effluent to reduce the capacity of
aerobic post-treatment processes by powdered activated carbon.
• To study the effect of different operation parameters on the microbial population
in the biomass.
1.3 Scope of Work
The project included the design and fabrication of the Anaerobic Sequencing Batch Reactor
(AnSBR) system. The system was subjected to hydrotest to ensure construction satisfaction.
For the start-up study, the system was seeded and operated at two different hydraulic retention
times (HRT) to determine the effect of organic loading rate on the start-up period required.
Sampling was done two to three times per week. The samples, which included feed and effluent,
were analyzed based on the following parameters:
• Total and volatile suspended solids
• Chemical oxygen demand
Anaerobic Sequencing Batch Reactor for the Treatment of Municipal Wastewater Chapter 1 Introduction
6
• Biochemical oxygen demand
• Total organic carbon
• Biogas composition
• Volatile organic acids
• Nitrogen and other anions
Operational parameters like pH and volume of biogas produced were also monitored daily. Other
tests that were done periodically include molecular weight distribution of the biomass, for the
feed and effluent samples and additional volatile solids reduction for the mixed liquor biomass.
Biomass samples were also extracted for observation under a light microscope.
After the start-up study, the AnSBR systems were being operated at different HRTs to determine
the optimum HRT. Operation parameters will not be changed until a “steady-state” is achieved.
This “steady-state” represented the time when the treated effluent is consistent in quality and the
volume and composition of the biogas is relatively constant. Similarly, samples were collected
two to three times per week and analyzed based on the parameters stated above.
Powdered activated carbon (PAC) was used to improve the performance of the AnSBR system. It
was added into the reactors at low HRTs, when the quality of the treated effluent deteriorated.
Sampling and analyzes were done continuously.
To further understand the system, biomass were collected periodically for microbiological
analysis. Terminal-Restriction Fragment Length Polymerization (T-RFLP) fingerprinting was
used to monitor the dynamics of the microbial consortium in the system.
Anaerobic Sequencing Batch Reactor for the Treatment of Municipal Wastewater Chapter 2 Literature Review
7
Chapter 2 Literature Review
2.1 Anaerobic process for wastewater treatment
2.1.1 Anaerobic microorganisms and their roles
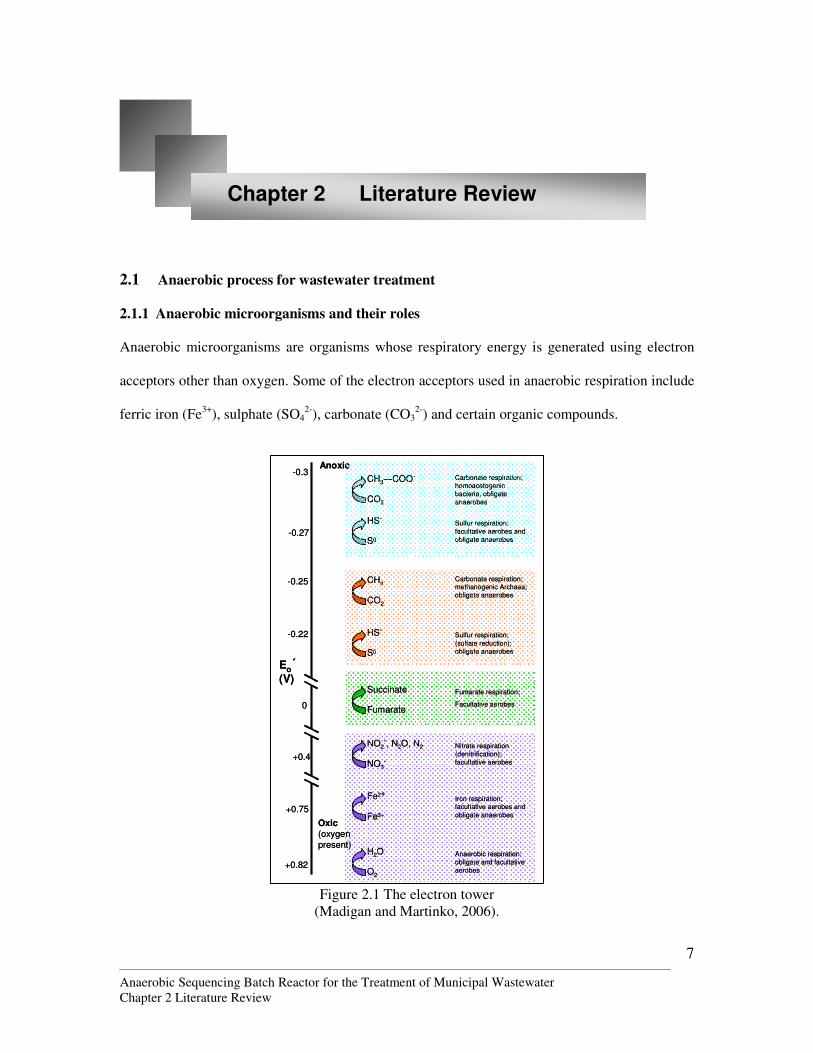
Anaerobic microorganisms are organisms whose respiratory energy is generated using electron
acceptors other than oxygen. Some of the electron acceptors used in anaerobic respiration include
ferric iron (Fe3+), sulphate (SO42-), carbonate (CO3
2-) and certain organic compounds.
Figure 2.1 The electron tower
(Madigan and Martinko, 2006).
CH3―COO-
CO2
HS-
S0
Carbonate respiration;
homoacetogenic
bacteria, obligate
anaerobes
Sulfur respiration;
facultative aerobes and
obligate anaerobes
CH4
CO2
HS-
S0
Carbonate respiration; methanogenic Archaea;
obligate anaerobes
Sulfur respiration;
(sulfate reduction);
obligate anaerobes
Succinate
Fumarate
Fumarate respiration;
Facultative aerobes
NO2-, N2O, N2
NO3-
Nitrate respiration
(denitrification);
facultative aerobes
Fe2+
Fe3+
Iron respiration; facultative aerobes and
obligate anaerobes
H2O
O2
Anaerobic respiration;
obligate and facultative
aerobes
Eo´(V)
Oxic (oxygen
present)
Anoxic-0.3
-0.27
-0.25
-0.22
0
+0.4
+0.75
+0.82
Anaerobic Sequencing Batch Reactor for the Treatment of Municipal Wastewater Chapter 2 Literature Review
8
Compared to the O2/H2O redox couple, these acceptors have a larger reduction potential. Due to
the positions of these compounds on the electron tower (Figure 2.1), less energy is released when
these electron acceptors are used instead of oxygen.
Consortia of microorganisms, mostly bacteria, are involved in the transformation of complex
high-molecular-weight organic compounds to methane (equation 2.1).
Organic matter � CH4 + CO2 + H2 + NH3 + H2S (2.1)
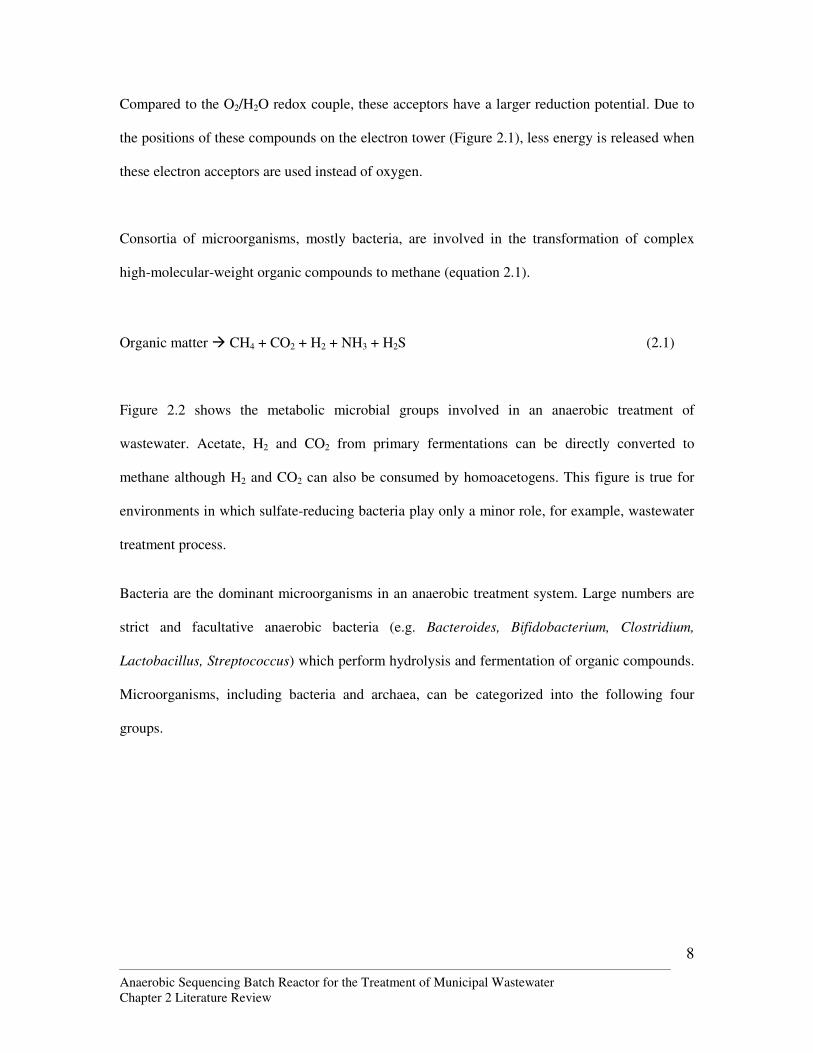
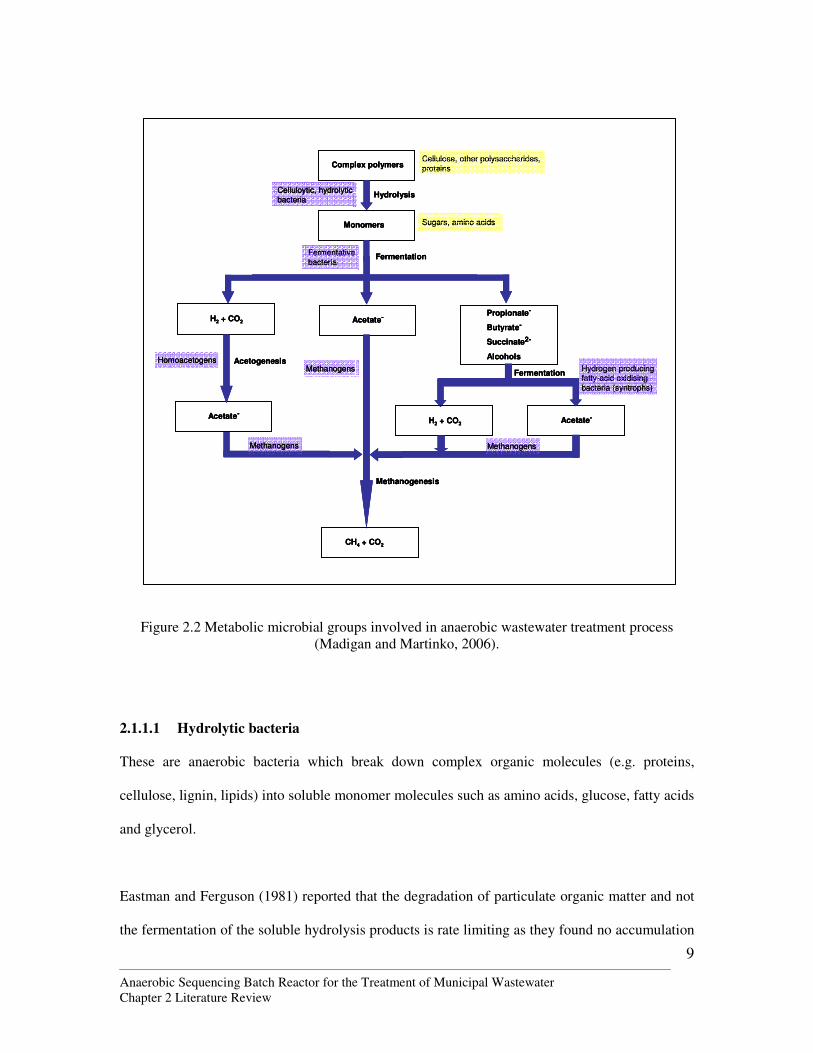
Figure 2.2 shows the metabolic microbial groups involved in an anaerobic treatment of
wastewater. Acetate, H2 and CO2 from primary fermentations can be directly converted to
methane although H2 and CO2 can also be consumed by homoacetogens. This figure is true for
environments in which sulfate-reducing bacteria play only a minor role, for example, wastewater
treatment process.
Bacteria are the dominant microorganisms in an anaerobic treatment system. Large numbers are
strict and facultative anaerobic bacteria (e.g. Bacteroides, Bifidobacterium, Clostridium,
Lactobacillus, Streptococcus) which perform hydrolysis and fermentation of organic compounds.
Microorganisms, including bacteria and archaea, can be categorized into the following four
groups.
Anaerobic Sequencing Batch Reactor for the Treatment of Municipal Wastewater Chapter 2 Literature Review
9
Figure 2.2 Metabolic microbial groups involved in anaerobic wastewater treatment process (Madigan and Martinko, 2006).
2.1.1.1 Hydrolytic bacteria
These are anaerobic bacteria which break down complex organic molecules (e.g. proteins,
cellulose, lignin, lipids) into soluble monomer molecules such as amino acids, glucose, fatty acids
and glycerol.
Eastman and Ferguson (1981) reported that the degradation of particulate organic matter and not
the fermentation of the soluble hydrolysis products is rate limiting as they found no accumulation
Complex polymers
Hydrolysis
Monomers
Cellulose, other polysaccharides,
proteins
Sugars, amino acids
Celluloytic, hydrolytic bacteria
H2 + CO2 Acetate-Propionate-
Butyrate-
Succinate2-
Alcohols
Fermentative
bacteriaFermentation
Acetate-
Homoacetogens Acetogenesis
H2 + CO2 Acetate-
FermentationHydrogen producing fatty-acid oxidising
bacteria (syntrophs)
Methanogens
MethanogensMethanogens
Methanogenesis
CH4 + CO2
Anaerobic Sequencing Batch Reactor for the Treatment of Municipal Wastewater Chapter 2 Literature Review
10
of hydrolysis products in their reactor. Hydrolysis reaction is also known to be relatively slow
especially when there are high levels of cellulose and lignin in the wastewater.
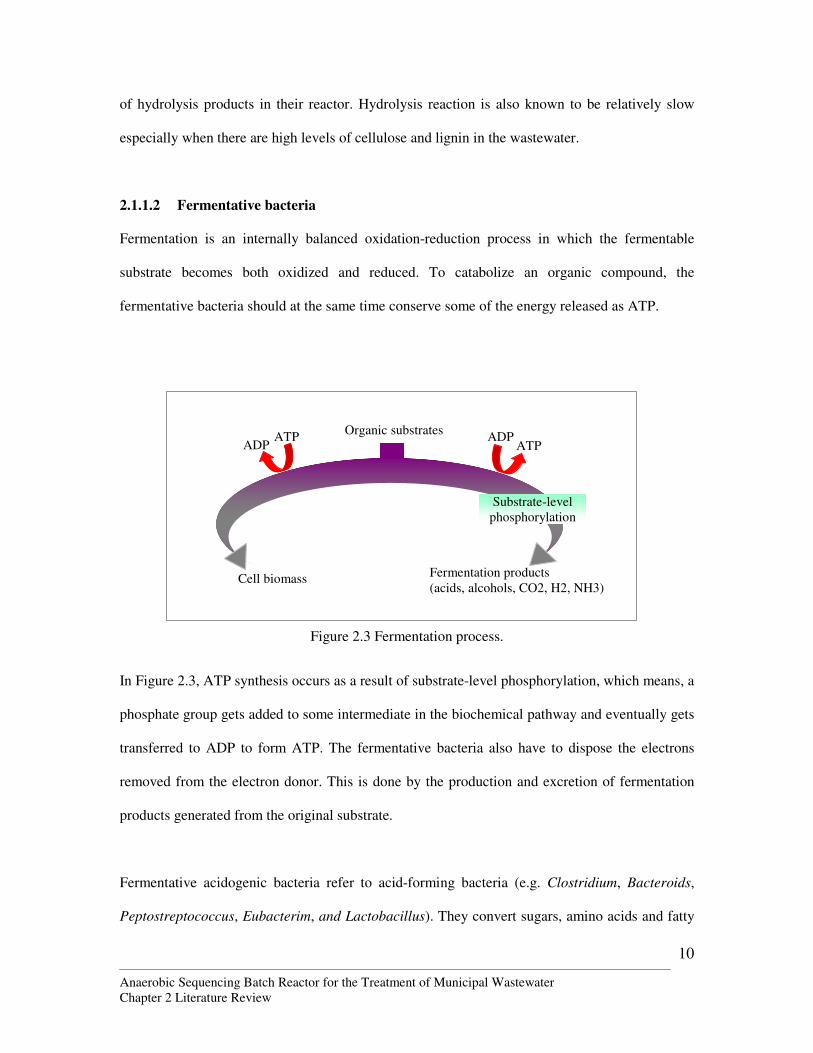
2.1.1.2 Fermentative bacteria
Fermentation is an internally balanced oxidation-reduction process in which the fermentable
substrate becomes both oxidized and reduced. To catabolize an organic compound, the
fermentative bacteria should at the same time conserve some of the energy released as ATP.
Figure 2.3 Fermentation process.
In Figure 2.3, ATP synthesis occurs as a result of substrate-level phosphorylation, which means, a
phosphate group gets added to some intermediate in the biochemical pathway and eventually gets
transferred to ADP to form ATP. The fermentative bacteria also have to dispose the electrons
removed from the electron donor. This is done by the production and excretion of fermentation
products generated from the original substrate.
Fermentative acidogenic bacteria refer to acid-forming bacteria (e.g. Clostridium, Bacteroids,
Peptostreptococcus, Eubacterim, and Lactobacillus). They convert sugars, amino acids and fatty
Organic substrates
Cell biomass Fermentation products (acids, alcohols, CO2, H2, NH3)
Substrate-level phosphorylation
ADP ATP ADP
ATP
Anaerobic Sequencing Batch Reactor for the Treatment of Municipal Wastewater Chapter 2 Literature Review
11
acids to organic acids (e.g. acetic, propionic, formic, lactic, butyric or succinic acids), alcohols
and ketones (e.g. ethanol, methanol, glycerol, acetane), acetate, CO2 and H2.
2.1.1.3 Acetogenic & homoacetogenic bacteria
Acetogenic bacteria are acetate and hydrogen-producing bacteria which convert fatty acids (e.g.
propionic acid and butyric acid) and alcohols into acetate, hydrogen and carbon dioxide. This
group includes the syntrophs like Syntrophomonas, Sytrophobacter and Acetobacter.
Ethanol, propionic acid and butyric acid are converted to acetic acid by acetogenic bacteria vie
the reactions shown in Equation 2.2 to 2.4.
CH3CH2OH + H2O � CH3COOH + 2 H2 (2.2)
CH3CH2COOH + H2O � CH3COOH + CO2 + 3 H2 (2.3)
CH3(CH2)2COOH + 2 H2O � 2 CH3COOH + 2 H2 (2.4)
The production of acetate or certain other fatty acids is energetically advantageous because it
allows the organism to make ATP by substrate-level phosphorylation.
Homoacetogens are a group of strictly anaerobic prokaryotes which can, similar to methanogens,
use CO2 as an electron acceptor in energy metabolism. CO2 is abundant in anaerobic environment
because it is a major product of energy metabolism of chemoorganotrophs. Hydrogen is the major
electron donor for both two types of microorganisms.
Anaerobic Sequencing Batch Reactor for the Treatment of Municipal Wastewater Chapter 2 Literature Review
12
Homoacetogens are categorized together because of their pathway of CO2 reduction, i.e. the
acetyl-CoA pathway. Acetyl-CoA pathway is not a cycle, it involves the reduction of CO2 via two
linear pathways, one molecule of CO2 is reduced to the methyl group of acetate and the other is
reduced to the carbonyl group. This is an overall energy-conserving reaction thus, homoacetogens
can grow at the expense of it. However, additional energy-conserving steps occur because of a
sodium motive force established across the cytoplasmic membrane during acetogenesis. This
allows for further energy conservation.
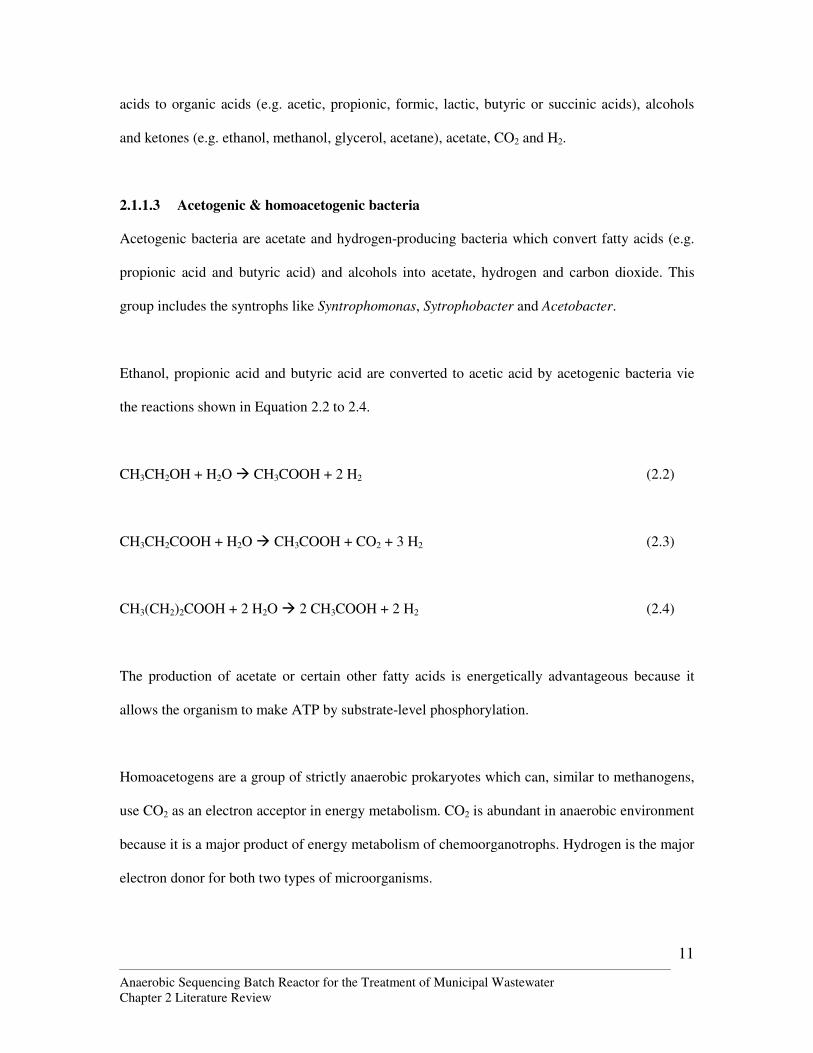
2.1.1.4 Methanogens
Methanogens are a group of strictly anaerobic Archaea which carry out methanogenesis.
Methanogenesis is a series of complex reactions which involve novel coenzymes. Similar to
acetogenesis, methanogens use CO2 as the electron acceptor and hydrogen as a major electron
donor. However there is a difference in free energy released (Figure 2.4).
Figure 2.4 Difference between methanogenesis and acetogenesis.
In anaerobic wastewater treatment systems, the methanogens are of specific concern because not
only is methanogenesis the terminal step in the biodegradation of organic matter, methanogenesis
4 H2
CH4 + 3 H2O CH3COO- + 4 H2O
ATP
HCO3- + H+ 2 HCO3
- + H+
Proton motive force
Proton or sodium motive force plus
substrate-level phosphorylation
Methanogenesis Acetogenesis
∆G0´= -105 kJ ∆G0´= -136 kJ
Anaerobic Sequencing Batch Reactor for the Treatment of Municipal Wastewater Chapter 2 Literature Review
13
also produces methane gas which can be a source of energy. Methanogens show a variety of
morphologies and several taxonomic orders were recognized, based on both phenotypic and
phylogenetic analyses. Physiologically, methanogens are obligate anaerobes thus anaerobic
treatment systems need to be strictly conditioned to culture the methanogens. Only a very few
substrates can be used directly by methanogens, e.g. acetate, that is why methanogens must team
up with partner organisms which can supply them with it - syntrophs.
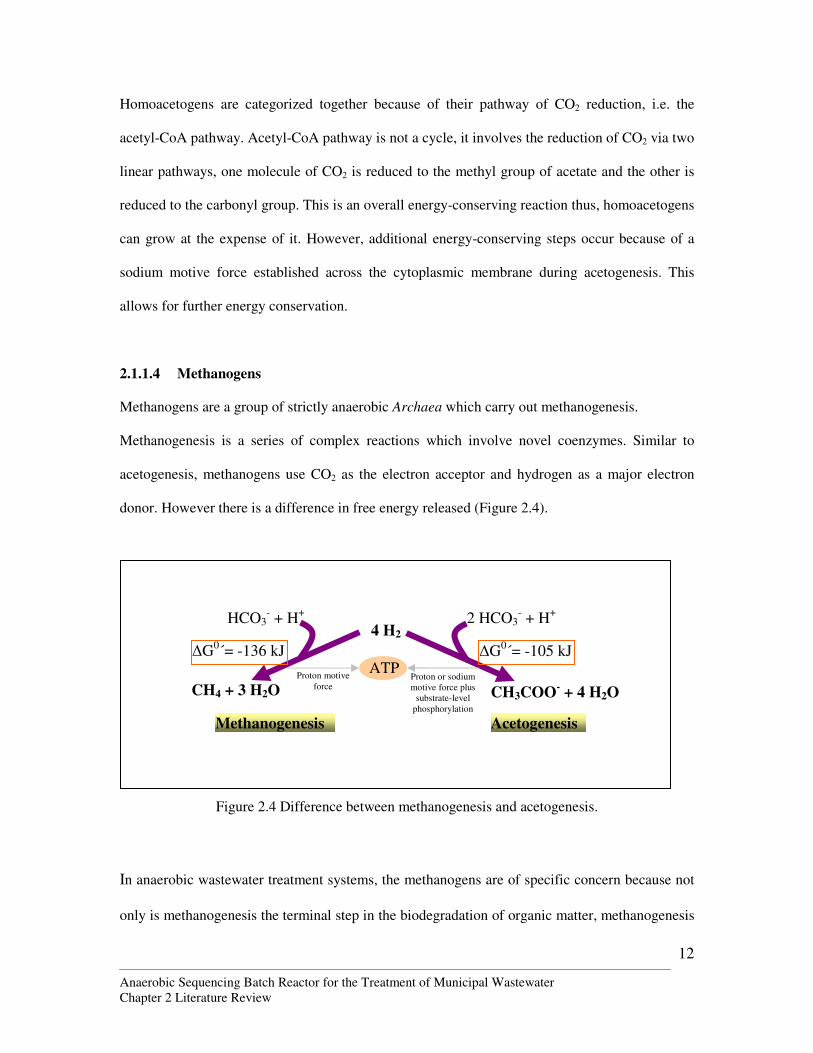
Syntrophy is a situation where two different organisms degrade a substance, conserve energy
doing it and that neither could degrade the substrates separately. A syntrophic reaction required
the production of H2 by one partner linked to H2 consumption by the other, thus also called,
interspecies H2 transfer. Figure 2.5 shows the reactions involved in ethanol fermentation to
methane and acetate by syntrophic association of an ethanol-oxidizing bacterium and a H2-
consuming partner bacterium - a methanogen. The fermenter carries out a reaction that has a
positive standard free-energy change.
Figure 2.5 Reactions involved in and nature of interspecies hydrogen transfer (Madigan and Martinko, 2006).
Ethanol fermentation:
2 CH3CH2OH + 2 H2O � 4 H2 + 2 CH3COO- + 2H+
∆G0´= + 19.4 kJ/reaction
Methanogenesis:
4 H2 + CO2 � CH4 + 2 H2O ∆G0´= - 130.7 kJ/reaction
Coupled reaction:
2 CH3CH2OH + CO2 � CH4 + 2 CH3COO- + 2H+
∆G0´= - 111.3 kJ/reaction
2 Ethanol
2 Acetate
4 H2
CO2
CH4
Syntrophic transfer of H2
Ethanol fermenter
Anaerobic Sequencing Batch Reactor for the Treatment of Municipal Wastewater Chapter 2 Literature Review
14
However, the H2 produced by the fermenter can be used as an electron donor for methanogenesis
by a methanogen. The overall reaction then becomes exergonic and supports the growth of both
partners.
Thus with the right combination of microorganisms, any organic compounds can be converted
into methane.
2.1.2 History of research and applications
As early as the beginning of the 20th century, there were researches conducted on anaerobic
processes to treat wastes. The researches were mainly focused on the use of anaerobic treatment
for digestion of sludge. Bach (1931) concluded that anaerobic treatment was applicable only to
sludge digestion and not for liquid wastes. It was found that only 50% reduction of solids was
possible for sludge digestion even with a long retention time, resulting in a loss of interest in
anaerobic systems for wastewater.
Researchers in the early 1950s recognized the necessity to maintain a high biomass concentration
for an anaerobic treatment system (Stander, 1950; Stander and Snyder, 1950; Schroepfer et al.,
1955; Schroepfer and Zimke, 1959a, b). In 1953, Fullen proposed a treatment system known as
anaerobic contact process which was successful.
McCarty (1964) wrote that it was a fallacy to believe anaerobic treatment as an inefficient process.
Unsuccessful experience with anaerobic digestion was due more to the nature of the organic
material which were not readily biodegradable than the process itself.
Anaerobic Sequencing Batch Reactor for the Treatment of Municipal Wastewater Chapter 2 Literature Review
15
Subsequently, there had been a lot of development in anaerobic treatment processes, especially
that of “high-rate” reactors that can achieve high solids retention. This increased the efficiency of
anaerobic processes and made it possible for the treatment of liquid wastes. However, there is still
a common perception that anaerobic processes are unable to achieve efficient organic removal
when treating low-strength wastewater (COD less than 1 g/L).
In 1992, an anaerobic sequencing batch reactor with gas recirculation for mixing during the
reaction phase was successfully used to treat medium-high strength (1.5 to 2 g COD/L)
wastewater (Pfeiffer et al., 1986; Sung and Dague, 1992). However, it was unable to treat low-
strength wastewater because the biogas produced is too low to provide adequate agitation. Ndon
and Dague (1997) reported the performance of an anaerobic sequencing batch (ASBR) reactor
treating low-strength wastewater at different temperature and hydraulic retention time (HRT). It
was found that even at the lowest temperature of 15 oC, shortest HRT of 12h and lowest substrate
concentration of 400 mg COD/L, the ASBR can achieve over 80% total COD removal. It seemed
that anaerobic process for the treatment of low-strength wastewater is possible after all.
2.1.3 Advantages and disadvantages of anaerobic processes
In both developed and developing countries, the conventional wastewater treatment system
usually consists of the conventional activated sludge process (CAS), which is an aerobic process.
CAS process is energy intensive due to the high aeration requirement and it also produces large
quantity of sludge (about 0.4 g dry weight/g COD removed) that has to be treated and disposed of.
As a result, the cost of operation and maintenance of a CAS system is considerably high. It was
estimated that the cost of aerobic treatment of wastewater is US$50 per inhabitant equivalent per
year (Alaerts et al., 1989) while the cost of anaerobic treatment is half of it (Lens and Verstraete,
Anaerobic Sequencing Batch Reactor for the Treatment of Municipal Wastewater Chapter 2 Literature Review
16
1992). Anaerobic process thus becomes an attractive alternative for tropical or subtropical
countries. The advantages of adopting anaerobic process for treatment include:
1. Biogas (methane, carbon dioxide or hydrogen) can be generated and tapped to recover
energy.
2. Low production of biomass per unit of organics removed.
3. No aeration required.
4. Very high active biomass densities (1% to 3%) can be achieved under favorable
conditions. This means that volumetric reaction times can be increased, reactor size
decreased and the system’s resistance to shock loadings and toxic compounds can be
strengthened.
5. Lower requirement for inorganic nutrients, e.g. nitrogen and phosphorus, due to lower
biomass yields.
6. Anaerobic systems can be left dormant without feeding for extended periods without
severe deterioration in biomass properties. This means that they can be brought back into
service at normal treatment efficiency within very short period of time.
Despite the well-known advantages of anaerobic treatment, there are some disadvantages when
compared to aerobic treatment.
Anaerobic Sequencing Batch Reactor for the Treatment of Municipal Wastewater Chapter 2 Literature Review
17
1. Generally lower substrate removal rate per unit of biomass, typically 1/3 to 1/10 those of
aerobic treatment of similar substrate. This is because anaerobic biodegradation of
organics is usually incomplete, often leaving as much as 50% of the organic matter
unconverted (Chynoweth, 1996).
2. Growth of anaerobic organisms is slow. Hence, anaerobic systems can fail if it is unable
to retain its biomass. Low substrate removal rates and low biomass yields result in a
significantly longer time for initial system start-up and recovery after an upset (1 to 6
months).
However, it is also this characteristic that makes anaerobic system advantageous over
aerobic systems. Low biomass yields lead to low sludge production rate which would
reduce the cost of sludge disposal.
3. High operating temperature required for efficient performance. This limits the application
of anaerobic treatment to tropical or sub-tropical regions
4. Under short hydraulic retention times, it is difficult to avoid accumulation of excessive
residual organic matter and intermediate products such as volatile fatty acids, especially
conventional continuous-flow suspended growth anaerobic reactors.
5. The chemically reduced conditions necessary for anaerobic process produce H2S,
mercaptans, organic acids and aldehydes, which are corrosive and toxic to
microorganisms in the system. Anaerobically-treated effluents usually still contain a
Anaerobic Sequencing Batch Reactor for the Treatment of Municipal Wastewater Chapter 2 Literature Review
18
substantial amount of pathogens, particles, organic and inorganic compounds as well as
ammonia, sulfide and phosphate.
6. Sensitive to certain inhibitory and toxic compounds, such as oxidants (O2, H2O2, Cl2),
H2S, HCN, SO3- and some aromatics.
7. Wilén et al. (2000) reported anaerobic conditions can cause deflocculation of biomass in
the wastewater which only incurred initially in the case of aerobic conditions. This is of a
major concern because the quality of effluent is highly dependent on the efficiency of the
solid-liquid separation process. Eikelboom and van Buijsen (1983) explained that the
growth of anaerobic or facultative anaerobic bacteria between the flocs or the dying of
strictly aerobic organisms in the flocs is the cause of deflocculation. Starkey and Karr
(1984) suggested that it was due to an inhibition of the eukaryote population or an
inhibition of the production of extracellular polymers. Hydrolysis in the EPS matrix takes
place under anaerobic conditions, causing the floc matrix to degrade (Rasmussen et al.,
1994; Nielsen et al., 1996).
2.1.4 Common applications of anaerobic process
Anaerobic treatment systems were found in a widespread of applications, especially for industrial
wastewaters like sugar beet, slaughter house, starch brewery wastewaters, piggery wastewaters
etc. The loadings ranged from 1 to 50 kg COD/m3, the temperatures from 10 to 65 oC and HRT
from a few hours to a few days (Metcalf and Eddy, 2003)
Lettinga et al. (1997) and Verstraete and Vandevivere (1999) reviewed the new generations of
anaerobic treatment system, such as Upflow Anaerobic Sludge Blanket (UASB), Expanded
Anaerobic Sequencing Batch Reactor for the Treatment of Municipal Wastewater Chapter 2 Literature Review
19
Granular Sludge Bed (EGSB) and Staged Multi-Phase Anaerobic (MPSA) reactor systems. These
systems have a higher efficiency at higher loading rates. In addition, they are applicable for
extreme environmental conditions (e.g. low and high temperatures) and to inhibitory compounds.
They can even perform anaerobic ammonium oxidation (anammox) and chemical phosphorus
precipitation. By integrating these processes with other biological methods (sulphate reduction,
micro-aerophilic organisms) and with physical-chemical methods, the cost of treatment of
wastewater can be reduced while at the same time valuable components can be recovered for
reuse.
The most widely used anaerobic treatment is the UASB, which has been built for the treatment of
municipal wastewater in many tropical and sub-tropical regions, e.g. Brazil, Colombia and India,
but also in the temperate regions, e.g. Netherlands and North America. These UASBs operated at
a hydraulic retention time of 6 to 8h and were able to achieve BOD removal efficiencies of 80%
(Mergaert, 1992). In Columbia, a sewage treatment plant consisting of several UASB reactors
followed by polishing ponds was commissioned in 1991 (Van Haandel and Catunda, 1997).
2.2 Applicability of anaerobic process for municipal wastewater
To study the applicability of anaerobic process for municipal wastewater, first, the characteristics
of municipal wastewater has to be understood. The important parameters which has to be noted
include COD, nitrogen, alkalinity & fatty acids, sulfate, suspended solids, flow rate, concentration
of chlorinated compounds (Mergaert, 1992), presence of surfactants and size of particles (Tarek,
2001).
Anaerobic Sequencing Batch Reactor for the Treatment of Municipal Wastewater Chapter 2 Literature Review
20
2.2.1 COD
Min and Zinder (1989) suggested that there is a threshold concentration of substrate, below which
the microorganisms will not be provided with enough energy to support its uptake and
metabolism. This threshold concentration determines the outcome of competition for traces of
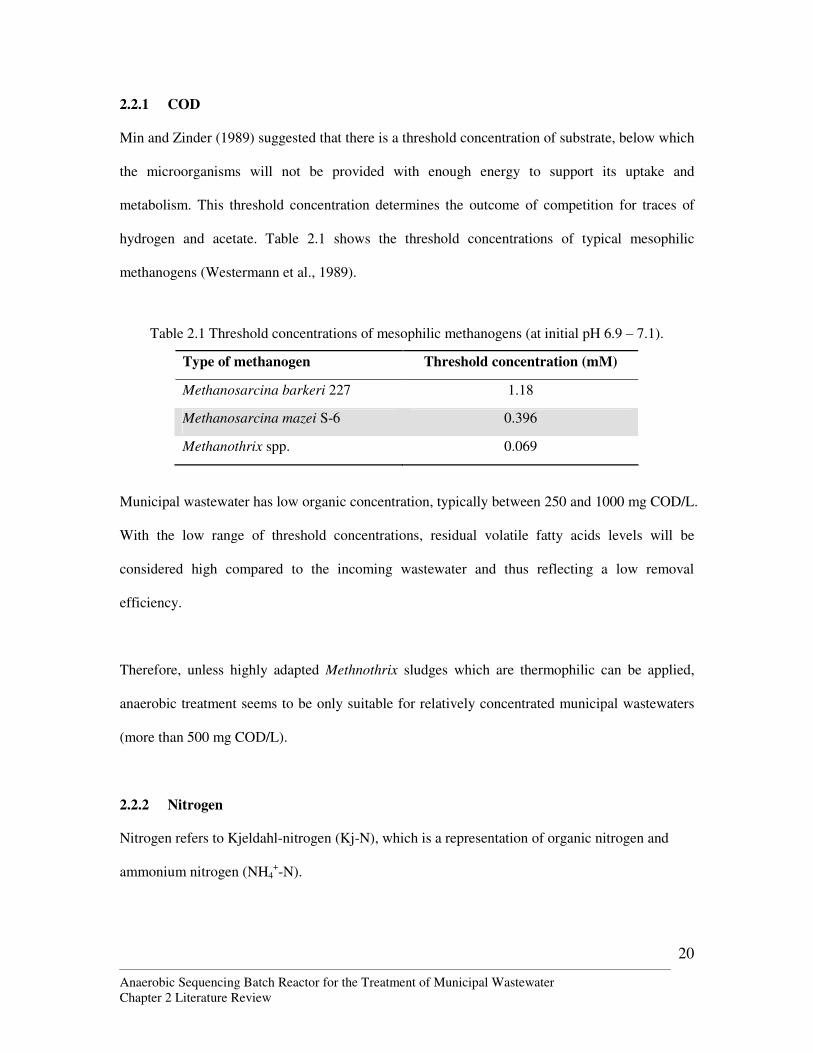
hydrogen and acetate. Table 2.1 shows the threshold concentrations of typical mesophilic
methanogens (Westermann et al., 1989).
Table 2.1 Threshold concentrations of mesophilic methanogens (at initial pH 6.9 – 7.1).
Type of methanogen Threshold concentration (mM)
Methanosarcina barkeri 227 1.18
Methanosarcina mazei S-6 0.396
Methanothrix spp. 0.069
Municipal wastewater has low organic concentration, typically between 250 and 1000 mg COD/L.
With the low range of threshold concentrations, residual volatile fatty acids levels will be
considered high compared to the incoming wastewater and thus reflecting a low removal
efficiency.
Therefore, unless highly adapted Methnothrix sludges which are thermophilic can be applied,
anaerobic treatment seems to be only suitable for relatively concentrated municipal wastewaters
(more than 500 mg COD/L).
2.2.2 Nitrogen
Nitrogen refers to Kjeldahl-nitrogen (Kj-N), which is a representation of organic nitrogen and
ammonium nitrogen (NH4+-N).
Anaerobic Sequencing Batch Reactor for the Treatment of Municipal Wastewater Chapter 2 Literature Review
21
The NH4+-N in municipal wastewater ranges from 25 to 40 mg/L on average which is not a
problem for anaerobic treatment. The typical COD to N ratio for municipal wastewater is 100 is
to 10 (Lettinga et al., 1981).
Due to the low biomass yield of anaerobic microorganisms, the nutrient requirement to support
them is usually low. The minimum amount of nitrogen necessary for the growth of anaerobic
biomass is a COD to N ratio of 100 is to 1.25 (Lettinga et al., 1981). Therefore, nitrogen
concentration in municipal wastewater does not pose a problem for anaerobic treatment.
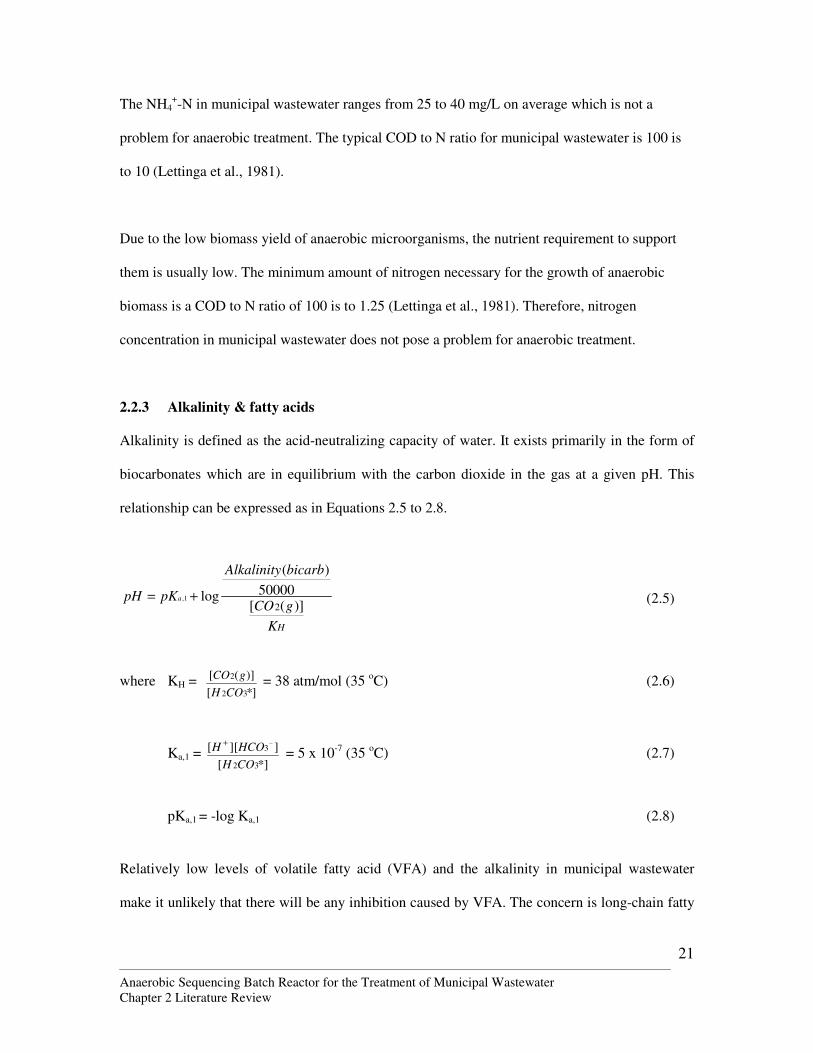
2.2.3 Alkalinity & fatty acids
Alkalinity is defined as the acid-neutralizing capacity of water. It exists primarily in the form of
biocarbonates which are in equilibrium with the carbon dioxide in the gas at a given pH. This
relationship can be expressed as in Equations 2.5 to 2.8.
HK
gCO
bicarbAlkalinity
pKpH a
)]([50000
)(
log2
1, += (2.5)
where KH = *][
)]([
32
2
COH
gCO = 38 atm/mol (35 oC) (2.6)
Ka,1 = *][
]][[
32
3
COH
HCOH−+
= 5 x 10⁻⁷ (35 oC) (2.7)
pKa,1 = -log Ka,1 (2.8)
Relatively low levels of volatile fatty acid (VFA) and the alkalinity in municipal wastewater
make it unlikely that there will be any inhibition caused by VFA. The concern is long-chain fatty
Anaerobic Sequencing Batch Reactor for the Treatment of Municipal Wastewater Chapter 2 Literature Review
22
acids e.g. soaps (50% inhibition at 500 mg/L, Hanaki et al., 1981) which can occur in domestic
sewage. Moreover, higher fatty acids, lipids and triglyceride emulsions degrade very slowly in
anaerobic systems and may cause sludge floatation when its concentration exceeds 100 mg/L.
Eastman and Ferguson (1981) reported that municipal wastewater can contain up to 100 mg/L of
grease and petroleum ether-extractable matter, thus this may be a cause for concern.
2.2.4 Sulfate
Sulfate is a preferred electron acceptor compared to other anoxic electron acceptors. In addition,
Widdel (1988) has found that the optimum temperature of sulfate-reducing bacteria is between 30
and 35 oC while the optimum temperature for methane-producing bacteria is between 35 and 40
oC (Huser et al., 1982; Vogels et al., 1988). Thus, treatment at temperature less than 35 oC, the
sulfate-reducing bacteria is likely to outcompete the methane-producing bacteria.
This may lead to the production and accumulation of sulfides, primarily the soluble form, H2S.
The critical amount for the inhibition of anaerobic microorganisms activities is 50 mg H2S/L.
Sulfate levels in domestic waster are relatively low, unlikely to reach the critical value. However,
post-treatment becomes a requirement to remove the sulfides formed.
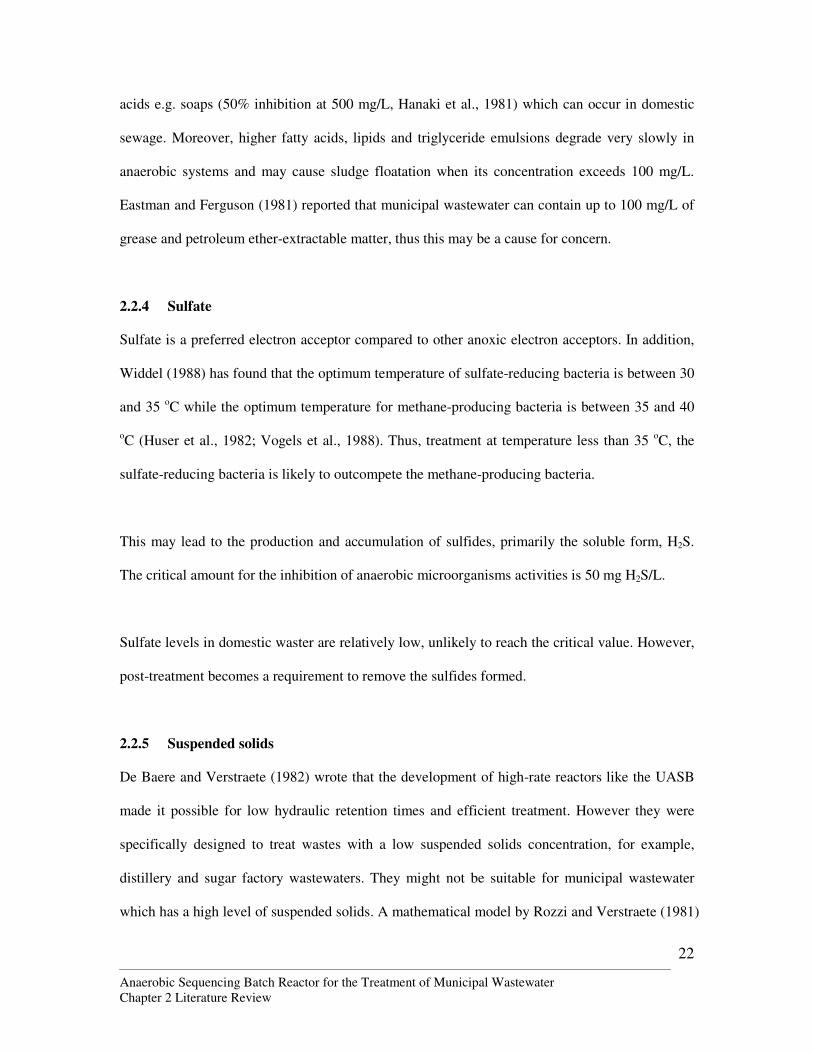
2.2.5 Suspended solids
De Baere and Verstraete (1982) wrote that the development of high-rate reactors like the UASB
made it possible for low hydraulic retention times and efficient treatment. However they were
specifically designed to treat wastes with a low suspended solids concentration, for example,
distillery and sugar factory wastewaters. They might not be suitable for municipal wastewater
which has a high level of suspended solids. A mathematical model by Rozzi and Verstraete (1981)
Anaerobic Sequencing Batch Reactor for the Treatment of Municipal Wastewater Chapter 2 Literature Review
23
was used to estimate the loading rates of suspended solids that anaerobic systems can tolerate.
They concluded that anaerobic upflow treatment, which allow short retention times, is not
applicable to wastewater which has a high amount of suspended solids, unless the suspended
solids has been solubilized e.g. by heat treatment. The amount of particulate COD to soluble
COD in the influent water should not exceed a ratio of VSS/COD of 0.1 (Figure 2.6). De Smedt
et al. (2002) and Aiyuk et al. (2004) also reported that too high solids content in an anaerobic
digester compromises reactor performance and hence granulation.
Figure 2.6 Theoretical maximum loading and hydrolysis rates vs Sa/Sb for a maximum VSS concentration of (Sa) 10 kg. Ltot is the loading rate applicable (kg COD/m3.d), LSa is the suspended solids lading rate (kg VSS/m3.r.d), Sa is suspended solids (kg VSS/ m3), Sb is soluble and colloidal solids (kg sCOD/m3)
(De Baere and Verstraete (1982))
It was thus suggested that municipal wastewater should pass through a primary sedimentation
tank before the anaerobic treatment. However, if a primary sedimentation tank, which occupies a
large land area, is still required for anaerobic treatment, there is one less incentive of replacing the
aerobic treatment with an anaerobic one. Therefore, an anaerobic treatment system which is able
LSa
Ltot
Ltot
LSa
Sa/Sb
Anaerobic Sequencing Batch Reactor for the Treatment of Municipal Wastewater Chapter 2 Literature Review
24
to tolerate a high level of suspended solids, and in turn eliminate the necessity of a primary
sedimentation tank, is desirable.
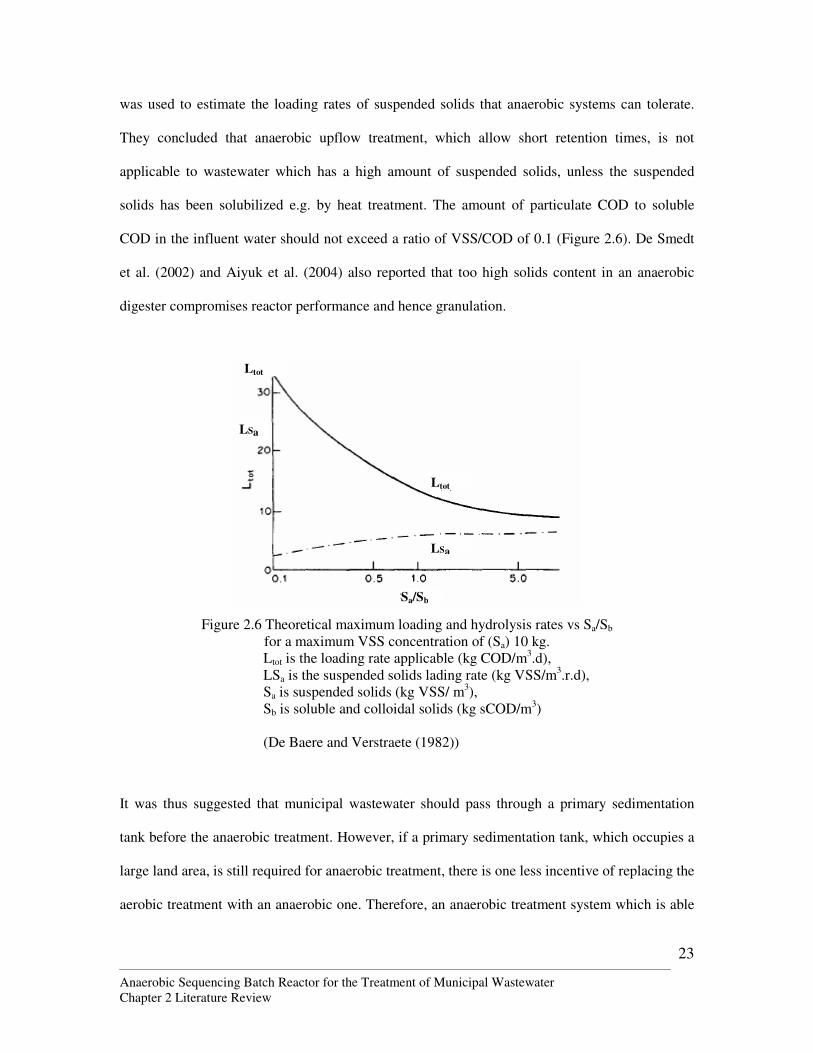
2.2.6 Flow rate of the wastewater
It is well known that municipal wastewater has large fluctuations in organic matter, suspended
solids and flow rate. Biochemical oxygen demand, chemical oxygen demand and suspended
solids concentration may range with a factor of 2 to 10 in half an hour to a few hours (Alaerts et
al., 1989).
There are 2 types of flow variations:
i. Daily variations
Concentration and flow variations may change significantly during the course of a day
(Figure 2.7) (Metcalf & Eddy, 2003). BOD generally follows the flow pattern, with a lag
of several hours. The peak BOD concentration often occurs in the evening.
0
50
100
150
200
250
300
0 2 4 6 8 10 12 14 16 18 20 22 24
Time of day
BO
D c
on
ce
ntr
ati
on
, g
/m3 a
nd
BO
D m
as
s l
oa
din
g,
kg
/h
0
0.02
0.04
0.06
0.08
0.1
0.12
0.14
0.16
0.18
0.2
Flo
w r
ate
, m
3/s
Figure 2.7 Typical hourly variations in flow and strength of domestic wastewater.
Flow rate
BOD concentration
BOD mass loading
Midnight Midnight Noon
Anaerobic Sequencing Batch Reactor for the Treatment of Municipal Wastewater Chapter 2 Literature Review
25
ii. Seasonal variations
For domestic wastewater, neglecting infiltration, the flow rate will vary but not the unit
(per capita) loadings and strength throughout the year. The total mass of BOD and TSS
will increase directly with the population served.
Infiltration tends to decrease the BOD and TSS concentrations, depending on the
characteristics of the water. In cases when the groundwater contains high levels of
dissolved constituents, the concentrations of some inorganic constituents may increase.
Derycke and Verstraete (1986) also found that there is 2.5 to 3 times more organics, in
terms of concentration, in the dry season compared to the wet season.
Thus, any anaerobic system treating municipal wastewater should be at least capable of taking
variations in flowrate of a factor of 2 to 3.
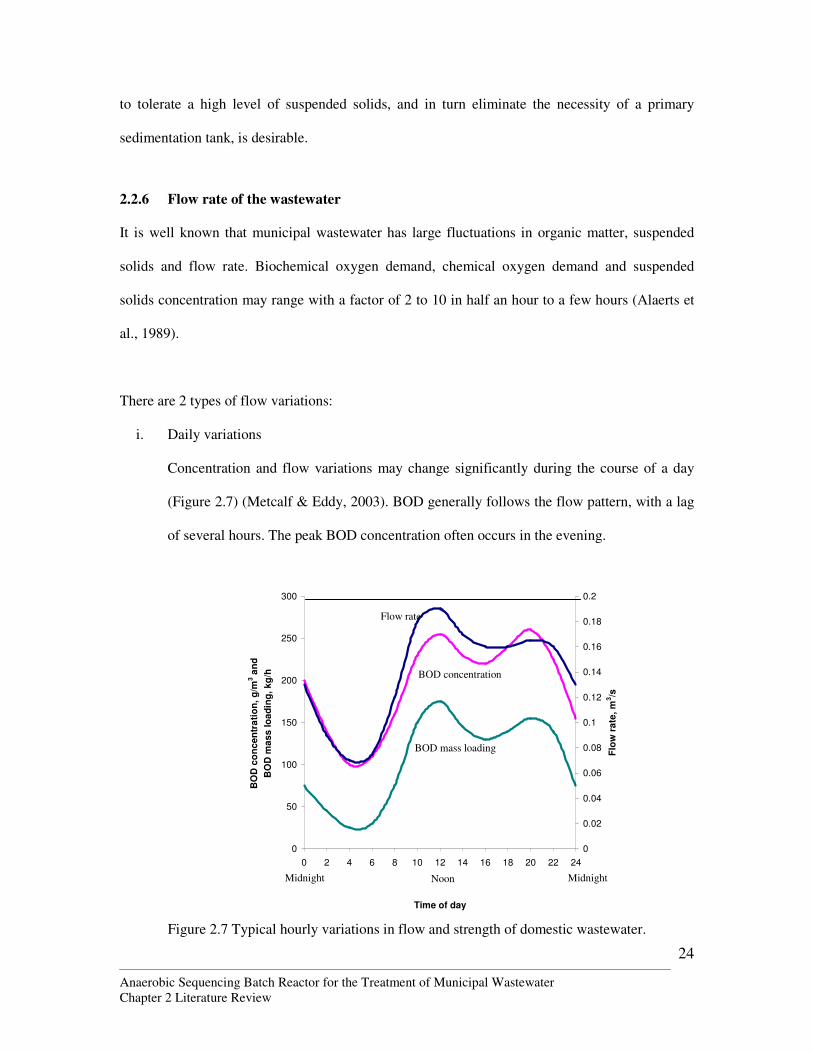
2.2.7 Temperature of wastewater
Microorganisms in anaerobic systems, especially the methanogens, perform only in a specific
range of temperature. The optimal temperature for Methanothrix soengenii, Methanosarcina and
most other methanogens is between 35 and 40 oC (Figure 2.8).
From Figure 2.8, it can be seen that methanogenic activity at below 10 oC is only a few percent of
that at 35 oC. This makes anaerobic treatment feasible only in tropical and sub-tropical regions,
such as Singapore.
Anaerobic Sequencing Batch Reactor for the Treatment of Municipal Wastewater Chapter 2 Literature Review
26
Figure 2.8 Temperature dependence of methane production from acetate by Methanothrix
soengenii (Huser et al., 1982).
2.2.8 Concentration of chlorinated compounds
Domestic wastewater may contain dry cleaning products or cleaners with organic solvents which
has chlorinated compounds. Most of the chlorinated compounds are toxic and can seriously
hamper anaerobic treatment, even at concentrations as low as 1 mg/L (Lettinga et al., 1981).
However, the anaerobic process is also known to be able to remove chlorinated organics which
aerobic process cannot.
2.2.9 Presence of surfactants
Municipal wastewater contains a certain amount of surfactants due to detergent from domestic
households. Surfactants are known to adsorb at both solid/liquid and liquid/air interfaces and will
affect the anaerobic biodegradability of particles. They can emulsify poorly soluble hydrophobic
compounds in water and improve the accessibility of these substrates to microorganisms (Rouse
et al., 1994). However, the emulsifying effect might prevent the physical removal of the particles.
Wagener and Schink (1987) and Rouse et al. (1994) concluded that surfactants inhibit anaerobic
biodegradation of organic compounds.
Temperature (oC)
Anaerobic Sequencing Batch Reactor for the Treatment of Municipal Wastewater Chapter 2 Literature Review
27
Boller (1993), on the study of Zürich City wastewater, reported that the surfactant concentration
was 17 to 22 mg/L and the anionic and non-ionic surfactants make up 91 to 94%.
Elmitwalli et al. (2001), on the study of biodegradability and change of physical characteristics of
particles during anaerobic digestion of domestic sewage, found that these surface-active
components were not biodegraded during digestion, indicated by the development of surface
tension.
2.2.10 Size of particles
The size of particles in domestic sewage affects both biological and physical processes (Levine et
al., 1985). For larger particles, gravitational and drag forces predominate over colloidal forces
(van der Waals attraction and electrostatic repulsion), while for smaller particles (less than a few
µm), colloidal forces are more predominant (Gregory, 1993).
Elmitwalli et al. (2001) found that the maximum conversion to methane at 30 oC was the highest
(86%) for the colloidal fraction, the next is suspended fraction (78%) and the lowest is dissolved
fraction (62%).
2.3 Sequencing batch reactors
2.3.1 Concepts of a sequencing batch reactor
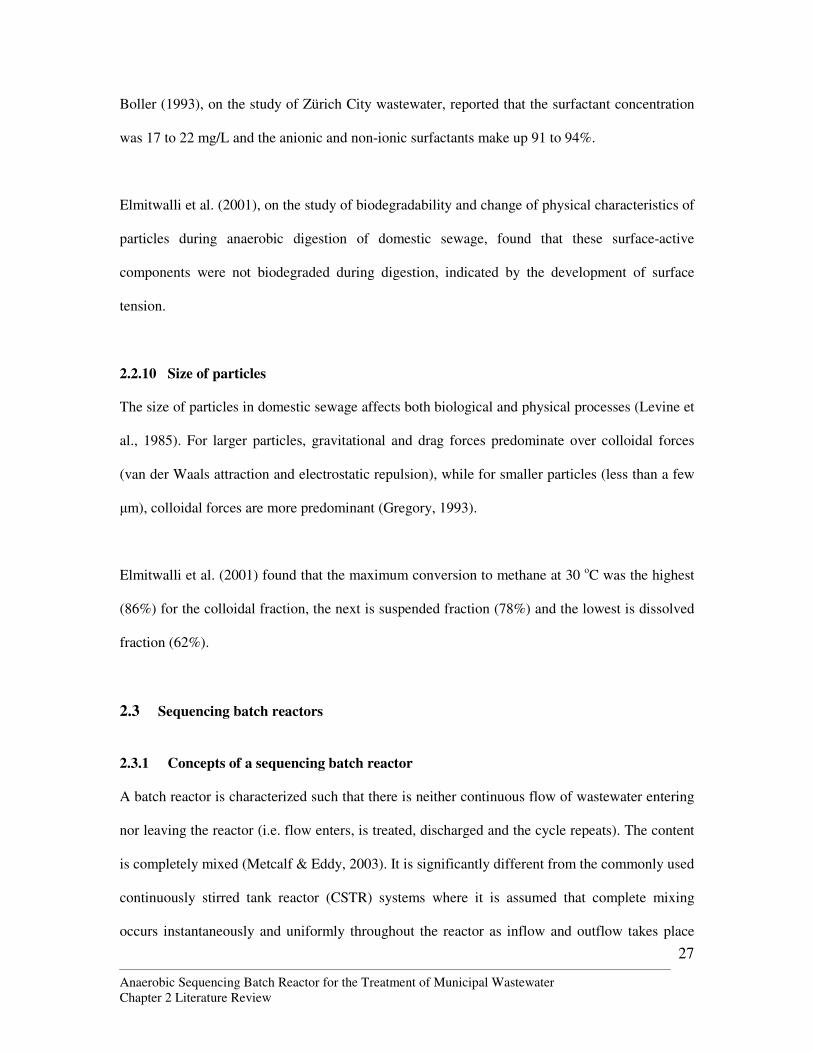
A batch reactor is characterized such that there is neither continuous flow of wastewater entering
nor leaving the reactor (i.e. flow enters, is treated, discharged and the cycle repeats). The content
is completely mixed (Metcalf & Eddy, 2003). It is significantly different from the commonly used
continuously stirred tank reactor (CSTR) systems where it is assumed that complete mixing
occurs instantaneously and uniformly throughout the reactor as inflow and outflow takes place
Anaerobic Sequencing Batch Reactor for the Treatment of Municipal Wastewater Chapter 2 Literature Review
28
simultaneously. Figure 2.9 shows the fundamental difference of the 2 systems by definition
sketches.
Mixer
Batch
Mixer
CSTR
Inflow
Q, C0
Outflow
Q, C
Mixer
Batch
Mixer
CSTR
Inflow
Q, C0
Outflow
Q, C
Figure 2.9 Difference between a batch reactor and a continuous-flow stirred tank reactor (CSTR).
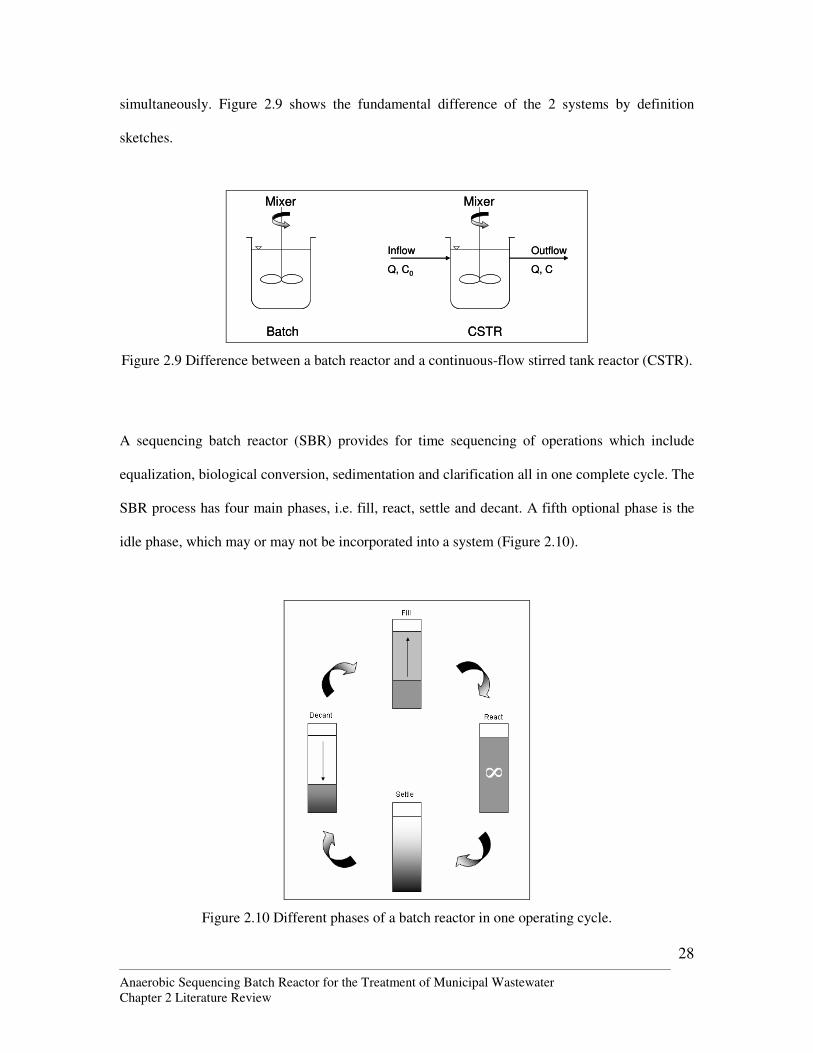
A sequencing batch reactor (SBR) provides for time sequencing of operations which include
equalization, biological conversion, sedimentation and clarification all in one complete cycle. The
SBR process has four main phases, i.e. fill, react, settle and decant. A fifth optional phase is the
idle phase, which may or may not be incorporated into a system (Figure 2.10).
Figure 2.10 Different phases of a batch reactor in one operating cycle.
Anaerobic Sequencing Batch Reactor for the Treatment of Municipal Wastewater Chapter 2 Literature Review
29
i. Fill
The wastewater that is to be treated can be fed into the system through several methods.
• Organic contact and biological reactions are minimized by feeding in the
wastewater at any rate in a quiescent manner near the liquid surface until the tank
is full.
• Wastewater is fed at a low rate with mixing to allow reaction to begin as soon as
Fill phase starts. Thus, substrate concentration is still held relatively low.
• Wastewater is fed at a rate equal to the effluent discharge rate which means the
system acts as an equalization tank.
• Wastewater is added as a batch dump inflow or any other desired inflow rate and
accompanying mixing method to meet the specific treatment objectives.
After the Fill phase, any variations in the wastewater influent no longer have any effect
on the treatment processes taking place inside the reactor except to limit or extend the
total time allowed for them to take place.
Typically, an anaerobic sequencing batch reactor is operated with a fast fill, leading to a
low fill time to cycle time ratio. This operating strategy provides a high initial substrate
concentration. This will enable zero order kinetics with respect to the organic acids that
form, which may lead to an acid formation problem. However, this phenomenon is more
severe if a high strength wastewater is being treated.
ii. React
React phase follows the Fill phase. This is the main period when biodegradation takes
place. Mixing is provided to ensure sufficient contact of the microorganisms with the
substrate. Organics in the wastewater can be acclimatized by exposing them to high
Anaerobic Sequencing Batch Reactor for the Treatment of Municipal Wastewater Chapter 2 Literature Review
30
substrate levels for a short period of time and low levels for a longer period of time.
Similarly, it can be done by maintaining a relatively low substrate level during most of
the Fill and React phase.
High substrate concentration in the reactor in the beginning of the react phase allows a
high food-to-microorganisms (F/M) ratio, which means the rate of substrate uptake is
high.
iii. Settle
In the settle phase, solid-liquid separation is allowed to take place by gravitational force.
Biogas attached to or entrapped by biological solids can also be separated and collected.
After the React phase, substrate concentration in the reactor is low, meaning that the F/M
ratio is low. A low F/M is known to improve the settling properties of biomass.
High settling velocities of the biomass in the SBR is expected. Heavy flocs of diameter
more than 1 mm can sweep down aggregates of smaller flocs. These heavy flocs are able
to form due to the operation regime of the SBR. The gentle stirring of the mixed liquor
supports flocculation and during the Settle phase, quiescent conditions are provided to aid
in settling.
iv. Decant
The treated effluent is withdrawn from the system from above the sludge blanket. It is
usually done at a slow rate to minimize disturbance of the settled solids.
A SBR is also different from other fill and draw systems. It is filled and drawn within a defined
period of time so variations in the influent of the treatment plant has no effect on the process after
Anaerobic Sequencing Batch Reactor for the Treatment of Municipal Wastewater Chapter 2 Literature Review
31
the fill phase of the particular cycle has ended. The cycle is continuously repeated in a defined
and regulated variation of process conditions.
2.3.2 Advantages and disadvantages of a batch system
The SBR technology is regarded as one of the important methods to gain control over structure
and functions of the microbial community in a reactor exposed to varying influent conditions.
Firstly, it has to be understood that the concentration of contaminants in wastewater naturally
varies with time or space, thus feed wastewater has a potentially unsteady-state behavior.
However, conventional systems for wastewater treatment are all unrealistically designed to
operate as steady-state systems. This is because it was always assumed that steady-state
conditions were needed for effluent concentrations to be kept constant and within the permitted
limits. The incorporation of an equalization tank was thought to be able to dampen the impact of
the system’s unsteady behavior but it is not able to equalize variations in mass flowrates.
Therefore these systems, instead of being operated as a steady-state system it is designed for,
become uncontrolled unsteady-state systems. These uncontrolled unsteady-state systems strain to
meet the steady-state demands.
In practice, the factors known to be effective in controlling the structure and function of microbial
aggregates (e.g. activated sludges, biofilms) are difficult to maintain in continuous flow systems.
In such cases, the growth rate differentials needed to mitigate the impact of the forcing function
associated with the mass flow rate of the contaminants are not sufficiently strong. The frequency
and amplitude of the changes needed to control variations in the rate functions cannot be
implemented because the reactor is designed for maximum influent loading so that the discharge
limits can be met during peak loading periods which happened only occasionally. As a result, the
Anaerobic Sequencing Batch Reactor for the Treatment of Municipal Wastewater Chapter 2 Literature Review
32
biological system is subjected to sub-optimal control conditions most of the time even though it is
a controlled unsteady-state system.
Batch system, on the other hand, is a controlled unsteady-state system. Batch systems were first
used in activated sludge processes as a mean of controlling filamentous organisms. Frequent
shifting of activated sludge between aerobic, anoxic and anaerobic zones allows establishment of
microbial communities capable of executing nitrification, denitrification and enhanced biological
phosphate uptake. It appears that short-term unsteady-state conditions, if properly selected and
controlled, are an effective tool to maintain long-term quasi-steady-state conditions. Factors
known to be effective in controlling the structure and function of microbial aggregates are
difficult to maintain in continuous flow systems. As continuous flow systems are mainly designed
for maximum loading, such biological systems often operate at sub-optimal control conditions
although they are controlled unsteady-state. A batch reactor is able to mitigate these shortcomings
of a continuous flow reactor. The batch reactor is able to vary its effective volume by time.
From a microbiological point of view, the key characteristic of SBR technology is the change
between feast and famine in a cycle. Interactions between different microorganisms are optimized
in such fluctuating conditions especially for rich, diverse and effective microbial population.
These microorganisms are trained to utilize even the smallest amount of nutrients and cope with
changing conditions on various time levels. Under different conditions, different groups of
organisms will be switched on or off. Once the system is well established, it will be more robust
and be able to dampen influent fluctuations. Therefore, SBR technology has an obvious
advantage over continuous flow systems in the long run.
Anaerobic Sequencing Batch Reactor for the Treatment of Municipal Wastewater Chapter 2 Literature Review
33
The SBR technology also gives the benefits of being flexible. By controlling operational
parameters, the SBR has the ability to apply environmental pressure on a microbial consortium.
During start-up, the environmental pressure applied will enrich for a given consortium. After
enrichment, further changes in the operational conditions will cause either changes in the
physiological state of the organisms or changes in the reactor products, causing a shift in the
microbial population. This enables operators to control the performance of the system by just
changing the operational parameters.
2.4 Powdered activated carbon
The application of PAC to wastewater has been documented since 1970s. As early as 1972,
Robertaccio et al. has presented a study of treatment of organic chemical plant wastewater with
the du Pont PACT process. The PACT, Powdered Activated Carbon Treatment, is a process by
which PAC is added to an activated sludge system. Subsequently, several reports on this method
have been published (Robertaccio, 1973, 1978, 1979) on treatment of acidic, highly colored,
highly variable wastewater containing heavy metals, and biodegradable as well as non-degradable
organics.
It has been proven that the use of PAC can improve the performance of the conventional activated
sludge process in terms of
1. Higher biochemical oxygen demand removal.
2. Higher chemical oxygen demand and refractory organics removal.
3. Able to stand shock loadings and toxic upsets.
4. Improved sludge settling and dewatering.
5. Reduced foaming in aeration reactor.
6. Effluent has lower toxicity to fish.
Anaerobic Sequencing Batch Reactor for the Treatment of Municipal Wastewater Chapter 2 Literature Review
34
Using PAC is very cost effective especially when a high sludge age (≥50 days) is employed
(Grieves et al., 1978) because PAC does not have to be replaced frequently. It also reduces the
problem of poor sludge settleability and effluent washouts in the conventional activated sludge
systems. Therefore, the amount of sludge to be wasted is reduced, making the process more
economical.
PAC also offers the advantage of providing fresh carbon continuously since it is fed as a new
product and is not recycled through the treatment process. Since PAC is added to the plant
dynamically as a feed chemical, it can be used as when it is required.
2.4.1 Activated carbon as an adsorbent
Activated carbon is a type of adsorbents used to accumulate substances in a solution onto a
suitable interface. It is often used as a polishing step in wastewater treatment after the normal
biological treatment. There are, in principal, many types of absorbents (for example, synthetic
polymeric and silica-based adsorbents) but activated carbon is most commonly used due to its
low cost.
Figure 2.11 Powdered activated carbon.
Activated carbon is prepared by making a char from materials such as almond, woods, bone and
coal. This is a pyrolysis process whereby these materials are heated to a red heat (less than 700 oC)
to drive off the hydrocarbons. Then the char particles are exposed to oxidizing gases such as
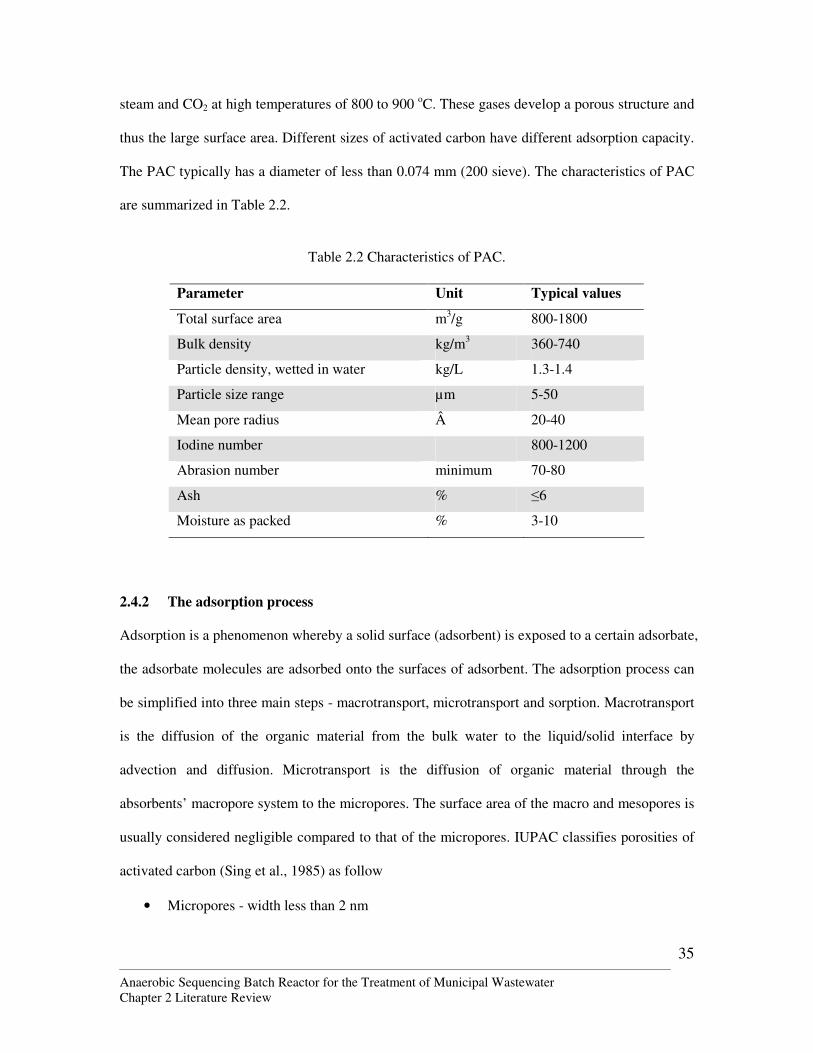
Anaerobic Sequencing Batch Reactor for the Treatment of Municipal Wastewater Chapter 2 Literature Review
35
steam and CO2 at high temperatures of 800 to 900 oC. These gases develop a porous structure and
thus the large surface area. Different sizes of activated carbon have different adsorption capacity.
The PAC typically has a diameter of less than 0.074 mm (200 sieve). The characteristics of PAC
are summarized in Table 2.2.
Table 2.2 Characteristics of PAC.
Parameter Unit Typical values
Total surface area m3/g 800-1800
Bulk density kg/m3 360-740
Particle density, wetted in water kg/L 1.3-1.4
Particle size range µm 5-50
Mean pore radius  20-40
Iodine number 800-1200
Abrasion number minimum 70-80
Ash % ≤6
Moisture as packed % 3-10
2.4.2 The adsorption process
Adsorption is a phenomenon whereby a solid surface (adsorbent) is exposed to a certain adsorbate,
the adsorbate molecules are adsorbed onto the surfaces of adsorbent. The adsorption process can
be simplified into three main steps - macrotransport, microtransport and sorption. Macrotransport
is the diffusion of the organic material from the bulk water to the liquid/solid interface by
advection and diffusion. Microtransport is the diffusion of organic material through the
absorbents’ macropore system to the micropores. The surface area of the macro and mesopores is
usually considered negligible compared to that of the micropores. IUPAC classifies porosities of
activated carbon (Sing et al., 1985) as follow
• Micropores - width less than 2 nm
Anaerobic Sequencing Batch Reactor for the Treatment of Municipal Wastewater Chapter 2 Literature Review
36
• Mesopores - width between 2 and 50 nm
• Macropores - width greater than 50 nm
The solid adsorbents have two important properties, namely
• extremely large surface area to volume ratio
• a preferential affinity for certain constituents in the liquid phase
The kinetics of adsorption of PAC are of crucial importance and typical contact times are in the
order of 1h. The homogeneous surface diffusion model (HSDM) has been successfully applied
for the prediction of the kinetics of adsorption of a range of compounds into activated carbon
(Najm et al., 1991, Knappe, 1996, Sontheimer et al., 1988). The model predicts the diffusion of a
molecule from the external surface of the adsorbent particle, along pore surfaces, to the
adsorption site. The other three mass transfer steps taking place during adsorption, transfer from
bulk liquid to surface film surrounding the particle, transfer through this surface film, and the
adsorption step, are not considered rate limiting in this model. The PAC particles are considered
to be spherical and of homogeneous structure, and Fick’s first law of diffusion is applied for the
calculation of the adsorbent surface concentration as a function of the radial position within the
particle. The change in bulk liquid-phase concentration with time is then calculated using a
mathematical model that is appropriate for the configuration of the system.
2.4.3 Effect of PAC on biological activity
It is recognized that providing a solid surface for a microorganism makes it largely different from
when it is in the bulk liquid. This is in view of pH, ionic strength and concentration of organics.
The availability of a solid surface results in a sorptive interaction between microorganisms and
the solid, and thus there is a stimulation of biological activity.
Anaerobic Sequencing Batch Reactor for the Treatment of Municipal Wastewater Chapter 2 Literature Review
37
Many literatures have stated that there is a synergistic effect when biological activity is combined
with activated carbon.
One of the reasons given was that PAC was able to adsorb the toxic substances which inhibit
biological activities. PAC is known to stabilize the activated sludge system against shock loads
and toxic upsets. Robertaccio (1979) showed that the PACT system can withstand various toxic
attacks, including the highly adsorbable trichlorophenol while a similarly spiked activated sludge
system failed to. Apparently, the PAC particles are predominantly physically associated with the
floc. Once the toxic is absorbed, the inhibitory effects on the biological microorganisms greatly
diminished. This resulted in a treated effluent which has a more stable quality.
Although BOD removal is found to have increased with the addition of PAC, there is no change
in the oxygen uptake rate (Robertaccio, 1972). As BOD tests usually measure biodegradable
substances that are weakly adsorbable, it showed that PAC did not actually adsorbed the organics.
Instead, PAC adsorbed the inhibitory substances and in turn enhanced the performance of the
biological microorganisms.
Zobell (1937) found that bacteria preferred to reside on solid surfaces rather than remain free in
the bulk solution. He speculated that the solid surfaces have the effect of concentrating food and
extracellular enzymes in the environment of microorganisms. It was also concluded that both the
food and the bacteria should be adsorbed on the solid surface for stimulation to take place,
especially in an environment when proteins or other biopolymers serve as a food source. The
concentrating of extracellular enzymes is significant to the overall biological activity.
Anaerobic Sequencing Batch Reactor for the Treatment of Municipal Wastewater Chapter 2 Literature Review
38
In summary, there are two main ways by which PAC is able to stimulate biological activity.
Firstly, it is through the adsorption of toxic and inhibitory substances. Secondly, it is due to the
adsorption of the food source onto the solid surfaces, resulting in the concentration of food for the
organisms, especially in conditions
2.4.4 Soluble microbial compounds
2.4.4.1 Definition of soluble microbial products
One important reason of using PAC in treatment systems is to control the soluble microbial
compounds in the system. Therefore, it is important to study them and their effect on wastewater
treatment systems.
The term, Soluble Microbial Products (SMPs), is used to represent a group of organic compounds
that are released into the bulk solution due to substrate metabolism (usually with biomass growth)
and biomass endogeneous decay. The recognition of this group in wastewater is important in
understanding the models of wastewater treatment. Before this, designs based on Monod model,
which predicted that the effluent concentration of the rate limiting substrate should be
independent of the influent substrate concentration, showed a deviation from the real performance.
Thus it was speculated that SMPs had a greater influence on wastewater treatment characteristics
than previously thought.
Kuo (1993) listed the factors which cause SMP production (Table 2.3):
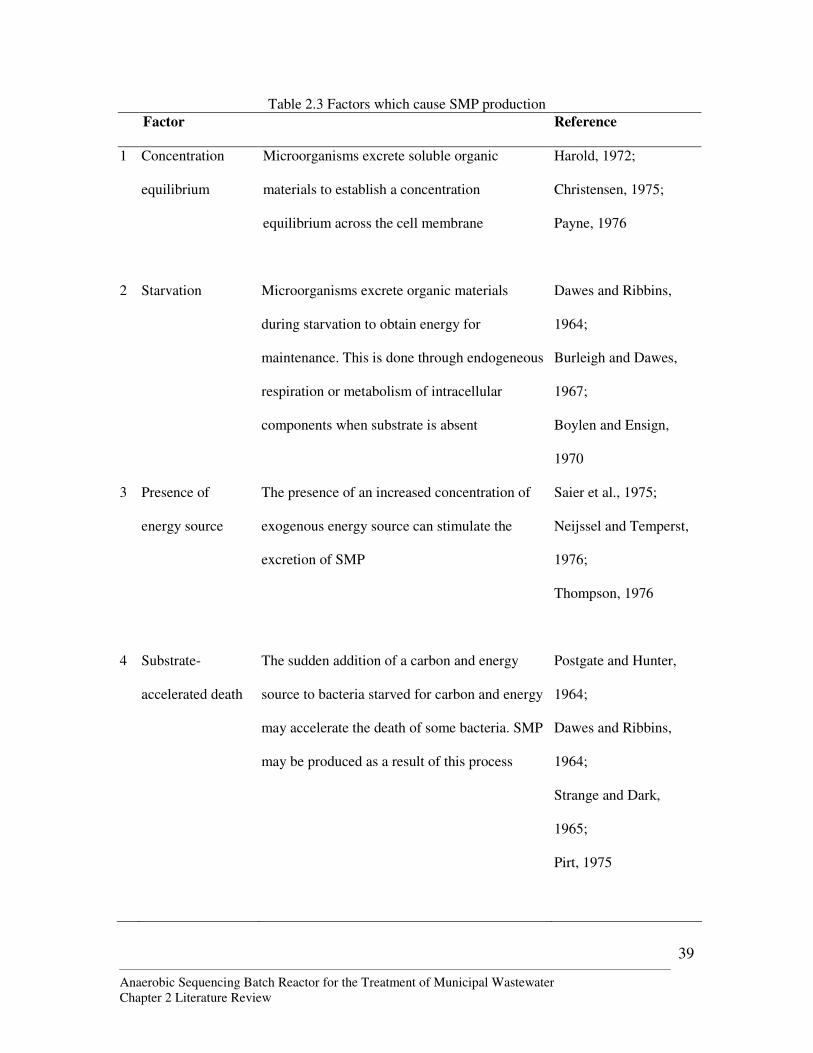
Anaerobic Sequencing Batch Reactor for the Treatment of Municipal Wastewater Chapter 2 Literature Review
39
Table 2.3 Factors which cause SMP production Factor Reference
1 Concentration
equilibrium
Microorganisms excrete soluble organic
materials to establish a concentration
equilibrium across the cell membrane
Harold, 1972;
Christensen, 1975;
Payne, 1976
2 Starvation
Microorganisms excrete organic materials
during starvation to obtain energy for
maintenance. This is done through endogeneous
respiration or metabolism of intracellular
components when substrate is absent
Dawes and Ribbins,
1964;
Burleigh and Dawes,
1967;
Boylen and Ensign,
1970
3 Presence of
energy source
The presence of an increased concentration of
exogenous energy source can stimulate the
excretion of SMP
Saier et al., 1975;
Neijssel and Temperst,
1976;
Thompson, 1976
4 Substrate-
accelerated death
The sudden addition of a carbon and energy
source to bacteria starved for carbon and energy
may accelerate the death of some bacteria. SMP
may be produced as a result of this process
Postgate and Hunter,
1964;
Dawes and Ribbins,
1964;
Strange and Dark,
1965;
Pirt, 1975
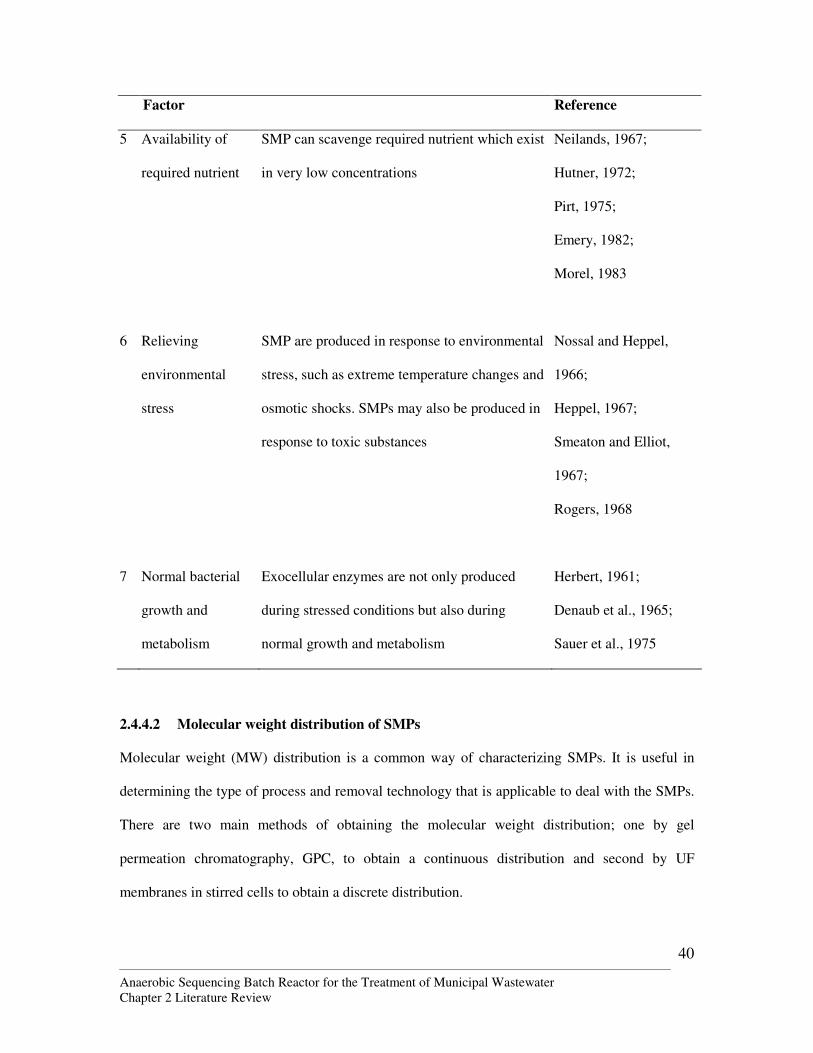
Anaerobic Sequencing Batch Reactor for the Treatment of Municipal Wastewater Chapter 2 Literature Review
40
Factor Reference
5 Availability of
required nutrient
SMP can scavenge required nutrient which exist
in very low concentrations
Neilands, 1967;
Hutner, 1972;
Pirt, 1975;
Emery, 1982;
Morel, 1983
6 Relieving
environmental
stress
SMP are produced in response to environmental
stress, such as extreme temperature changes and
osmotic shocks. SMPs may also be produced in
response to toxic substances
Nossal and Heppel,
1966;
Heppel, 1967;
Smeaton and Elliot,
1967;
Rogers, 1968
7 Normal bacterial
growth and
metabolism
Exocellular enzymes are not only produced
during stressed conditions but also during
normal growth and metabolism
Herbert, 1961;
Denaub et al., 1965;
Sauer et al., 1975
2.4.4.2 Molecular weight distribution of SMPs
Molecular weight (MW) distribution is a common way of characterizing SMPs. It is useful in
determining the type of process and removal technology that is applicable to deal with the SMPs.
There are two main methods of obtaining the molecular weight distribution; one by gel
permeation chromatography, GPC, to obtain a continuous distribution and second by UF
membranes in stirred cells to obtain a discrete distribution.
Anaerobic Sequencing Batch Reactor for the Treatment of Municipal Wastewater Chapter 2 Literature Review
41
It is important to recognize the limitations of these methods. In a GPC analysis, it was found that
some constituents pass through the column more rapidly than the calibrated standards because of
ion exclusion or complex formation. Some other constituents may pass through the column less
rapidly than it should due to adsorption or electrostatic interaction with the column packing. This
would lead to inaccurate results. It is thus important to ensure that there is no chemical interaction
between the column packing, the solvent or eluent or the organic compounds. In GPC analysis,
usually a concentration of the samples is done by freeze-drying or evaporation. This inevitably
changes the sizes of the constituents and again, results in inaccurate data.
The limitations of using UF membranes in stirred cells is mainly due to the uncertainties caused
by membrane pore size distribution, water temperature, cell pressure, solution pH, ionic strength,
as well as the organic constituents’ molecule size, shape and affinity for the membrane materials
(Logan and Jiang, 1990).
Duncan and Stuckey (1999) have summarized the findings on molecular weight (MW)
distribution of SMPs.
• Compounds found in biological effluents have a wide spectrum of MW, from less than
0.5 to more than 50 kDa.
• A greater amount of the compounds in biological effluents have high MW.
• Raw wastewater has a non-normal MW distribution skewed towards very low MW (<0.5
kDa) while effluents has bimodal patterns.
• Operating conditions can significantly affect the MW distribution, for example, a high
SRT will result in more high-MW compounds.
• The type of substrate used in the treatment system can significantly affect the MW
distribution.
Anaerobic Sequencing Batch Reactor for the Treatment of Municipal Wastewater Chapter 2 Literature Review
42
2.4.4.3 Chelating properties of SMPs
There are a number of chelating functional groups found in SMPs, such as carboxylates,
hydroxyls, sulphydryls (–SH), phenols and amines. These compounds act as ligands and complex
with metals commonly found in wastewaters, for example, copper, iron, lead nickel and zinc.
These metals, when exist in high concentrations in wastewater, are toxic for biological treatment
systems. On the other hand, insufficient quantities of these metals also pose a nutrition deficient
problem. The chelators are able to reduce the toxicity of these metals but also make them less
available to the bacteria as micronutrients. Anaerobic microorganisms are known to produce
nickel-chelating SMP which the amount is able to mitigate a relatively high level of nickel
toxicity (Kuo and Parkin, 1996).
2.4.4.4 Toxicity of SMPs
The SMP may actually cause the treated-effluent to be more toxic than the organic components in
the influent. Secondary effluent was detected to show a greater mutagenic response than primary
effluent. In addition, some SMP was found to inhibit nitrification (Chudoba, 1985a). The toxicity
problem becomes more prominent with higher strength wastewater. Treatment of such toxic
aerobic system effluents was proposed using GAC which can effectively adsorb SMP of high
MWs.
2.4.4.5 SMP effect on process performance
Other than exhibiting chelating and toxic properties, SMPs have other effects on treatment
processes. Washington et al. (1970) observed that an accumulation of SMP in a cultivation
medium result in reduction in specific respiration. These SMPs also have a negative effect on the
settling and flocculating characteristics of activated sludge.
Anaerobic Sequencing Batch Reactor for the Treatment of Municipal Wastewater Chapter 2 Literature Review
43
2.4.4.6 SMPs in anaerobic systems
Kuo et al. (1996) found that the normalized production of SMP is lower in anaerobic systems fed
on glucose and phenol. Germirli et al. (1993) also showed that residual COD concentration was
substantially lower for anaerobic treatment processes compared to single-stage aerobic processes.
The amount of refractory compounds released from aerobically degraded biomass is also higher
than that produced by anaerobically degraded biomass. Kim et al. (1990) found that effluent from
an anaerobic treatment of wastewater has less adsorbable than those from an anaerobic/aerobic
effluent and an aerobic effluent. It was also reported that low MW SMPs (MW < 1 kDa) from an
anaerobic treatment system is the most difficult to adsorb (Barker et al., 1999).
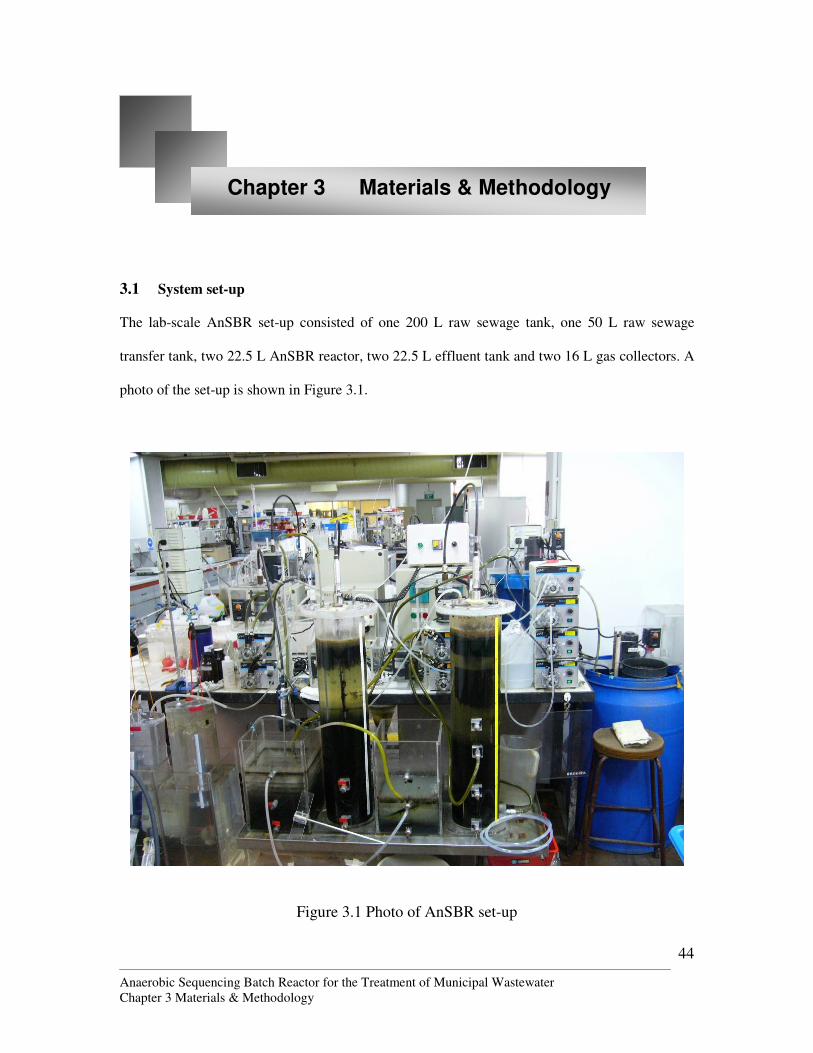
Anaerobic Sequencing Batch Reactor for the Treatment of Municipal Wastewater Chapter 3 Materials & Methodology
44
Chapter 3 Materials & Methodology
3.1 System set-up
The lab-scale AnSBR set-up consisted of one 200 L raw sewage tank, one 50 L raw sewage
transfer tank, two 22.5 L AnSBR reactor, two 22.5 L effluent tank and two 16 L gas collectors. A
photo of the set-up is shown in Figure 3.1.
Figure 3.1 Photo of AnSBR set-up
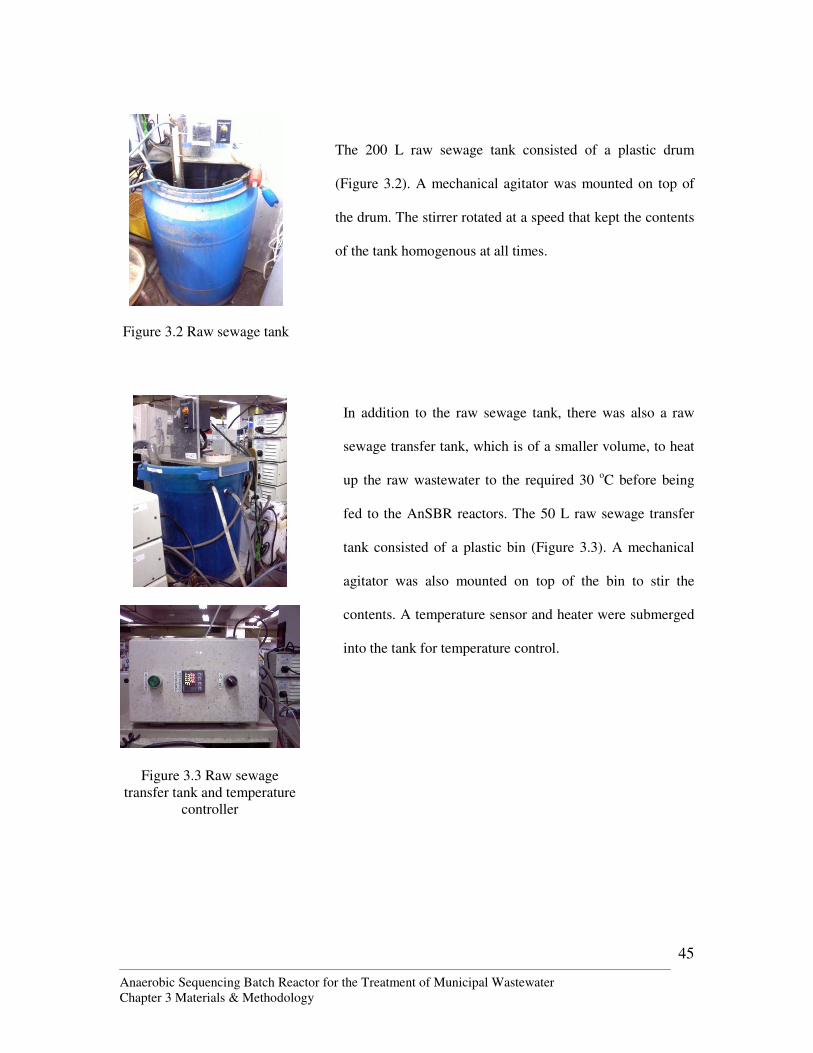
Anaerobic Sequencing Batch Reactor for the Treatment of Municipal Wastewater Chapter 3 Materials & Methodology
45
Figure 3.2 Raw sewage tank
The 200 L raw sewage tank consisted of a plastic drum
(Figure 3.2). A mechanical agitator was mounted on top of
the drum. The stirrer rotated at a speed that kept the contents
of the tank homogenous at all times.
Figure 3.3 Raw sewage transfer tank and temperature
controller
In addition to the raw sewage tank, there was also a raw
sewage transfer tank, which is of a smaller volume, to heat
up the raw wastewater to the required 30 oC before being
fed to the AnSBR reactors. The 50 L raw sewage transfer
tank consisted of a plastic bin (Figure 3.3). A mechanical
agitator was also mounted on top of the bin to stir the
contents. A temperature sensor and heater were submerged
into the tank for temperature control.
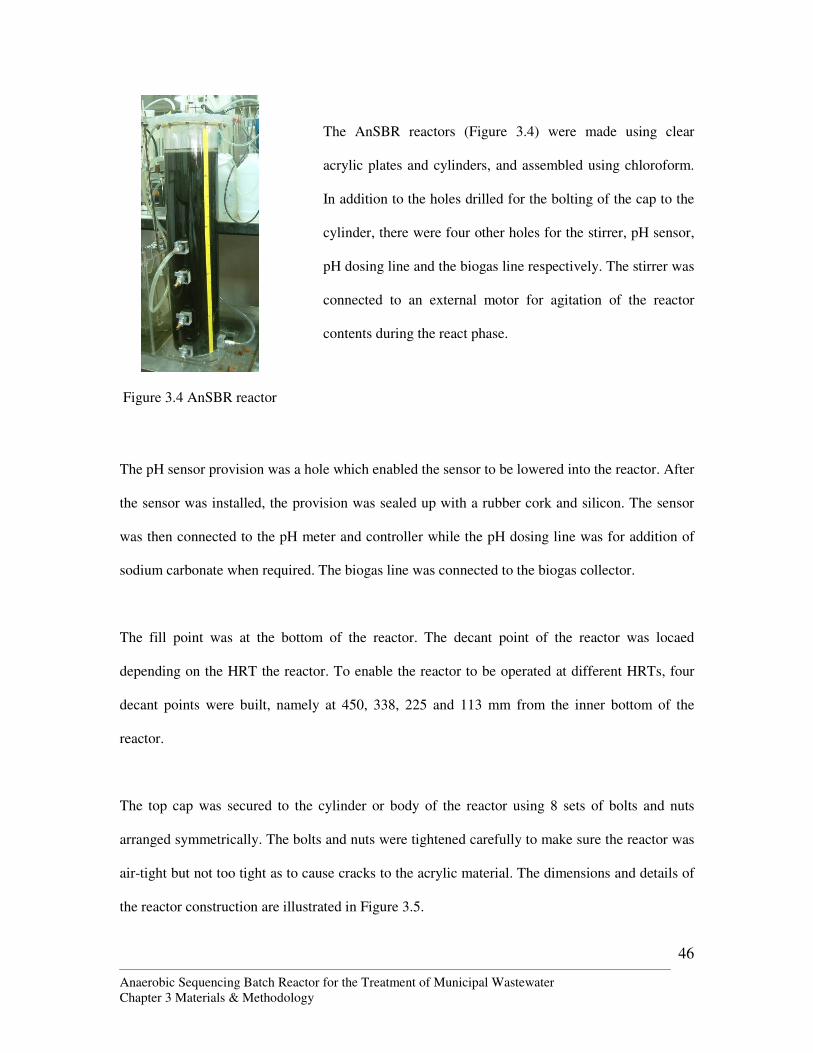
Anaerobic Sequencing Batch Reactor for the Treatment of Municipal Wastewater Chapter 3 Materials & Methodology
46
Figure 3.4 AnSBR reactor
The AnSBR reactors (Figure 3.4) were made using clear
acrylic plates and cylinders, and assembled using chloroform.
In addition to the holes drilled for the bolting of the cap to the
cylinder, there were four other holes for the stirrer, pH sensor,
pH dosing line and the biogas line respectively. The stirrer was
connected to an external motor for agitation of the reactor
contents during the react phase.
The pH sensor provision was a hole which enabled the sensor to be lowered into the reactor. After
the sensor was installed, the provision was sealed up with a rubber cork and silicon. The sensor
was then connected to the pH meter and controller while the pH dosing line was for addition of
sodium carbonate when required. The biogas line was connected to the biogas collector.
The fill point was at the bottom of the reactor. The decant point of the reactor was locaed
depending on the HRT the reactor. To enable the reactor to be operated at different HRTs, four
decant points were built, namely at 450, 338, 225 and 113 mm from the inner bottom of the
reactor.
The top cap was secured to the cylinder or body of the reactor using 8 sets of bolts and nuts
arranged symmetrically. The bolts and nuts were tightened carefully to make sure the reactor was
air-tight but not too tight as to cause cracks to the acrylic material. The dimensions and details of
the reactor construction are illustrated in Figure 3.5.
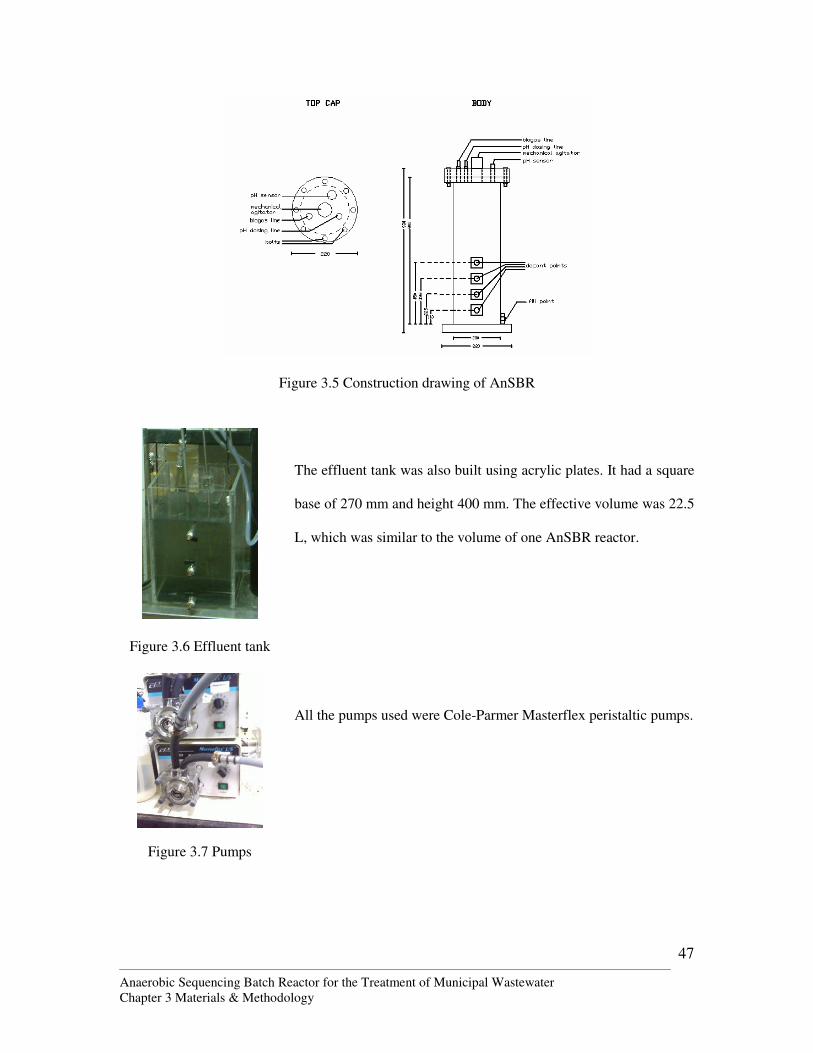
Anaerobic Sequencing Batch Reactor for the Treatment of Municipal Wastewater Chapter 3 Materials & Methodology
47
Figure 3.5 Construction drawing of AnSBR
Figure 3.6 Effluent tank
The effluent tank was also built using acrylic plates. It had a square
base of 270 mm and height 400 mm. The effective volume was 22.5
L, which was similar to the volume of one AnSBR reactor.
Figure 3.7 Pumps
All the pumps used were Cole-Parmer Masterflex peristaltic pumps.
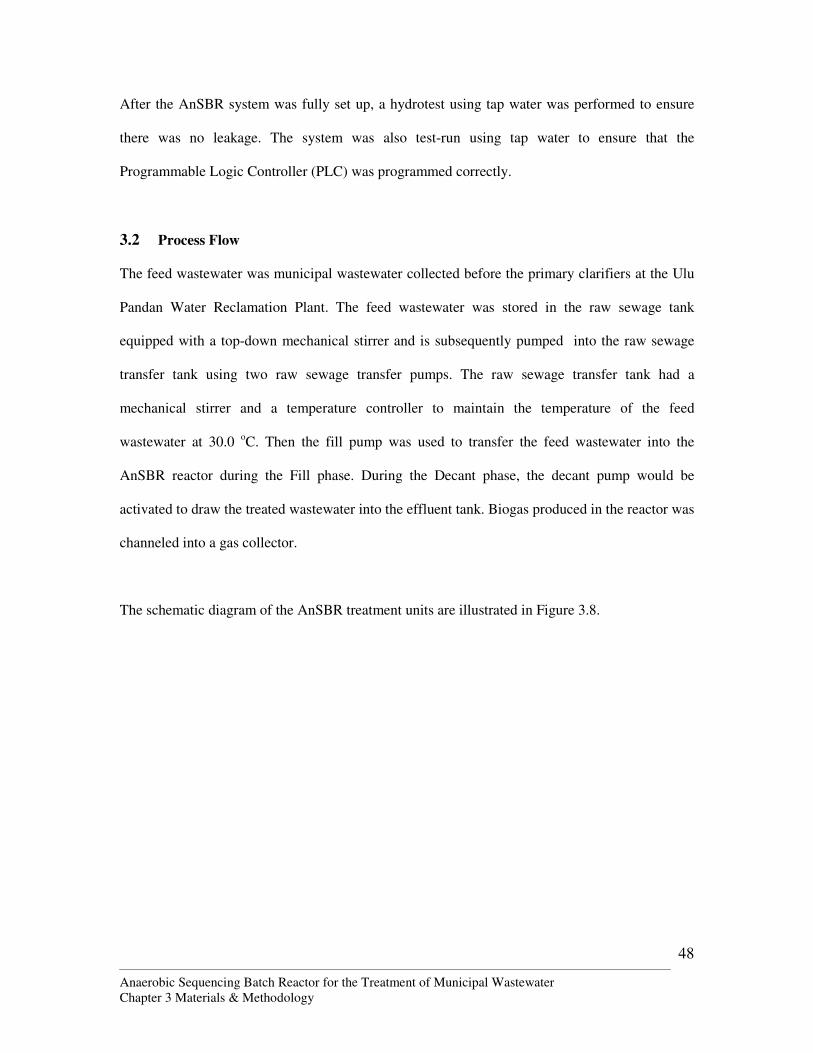
Anaerobic Sequencing Batch Reactor for the Treatment of Municipal Wastewater Chapter 3 Materials & Methodology
48
After the AnSBR system was fully set up, a hydrotest using tap water was performed to ensure
there was no leakage. The system was also test-run using tap water to ensure that the
Programmable Logic Controller (PLC) was programmed correctly.
3.2 Process Flow
The feed wastewater was municipal wastewater collected before the primary clarifiers at the Ulu
Pandan Water Reclamation Plant. The feed wastewater was stored in the raw sewage tank
equipped with a top-down mechanical stirrer and is subsequently pumped into the raw sewage
transfer tank using two raw sewage transfer pumps. The raw sewage transfer tank had a
mechanical stirrer and a temperature controller to maintain the temperature of the feed
wastewater at 30.0 oC. Then the fill pump was used to transfer the feed wastewater into the
AnSBR reactor during the Fill phase. During the Decant phase, the decant pump would be
activated to draw the treated wastewater into the effluent tank. Biogas produced in the reactor was
channeled into a gas collector.
The schematic diagram of the AnSBR treatment units are illustrated in Figure 3.8.
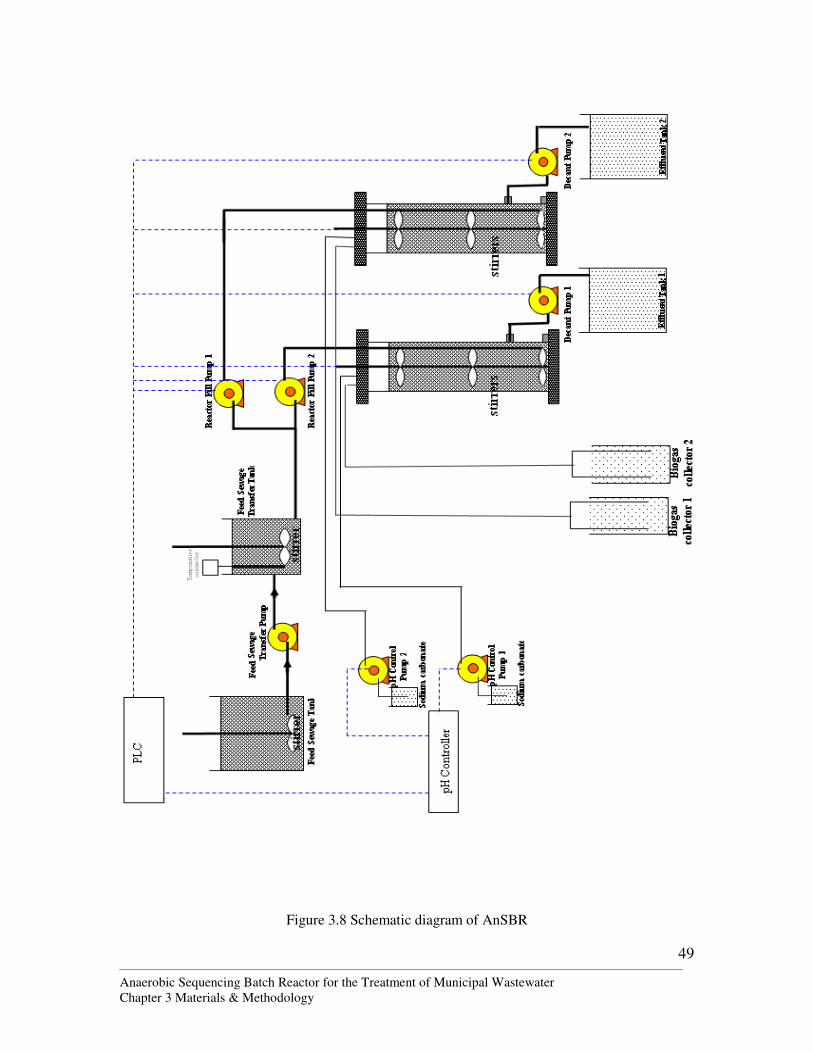
Anaerobic Sequencing Batch Reactor for the Treatment of Municipal Wastewater Chapter 3 Materials & Methodology
49
Figure 3.8 Schematic diagram of AnSBR
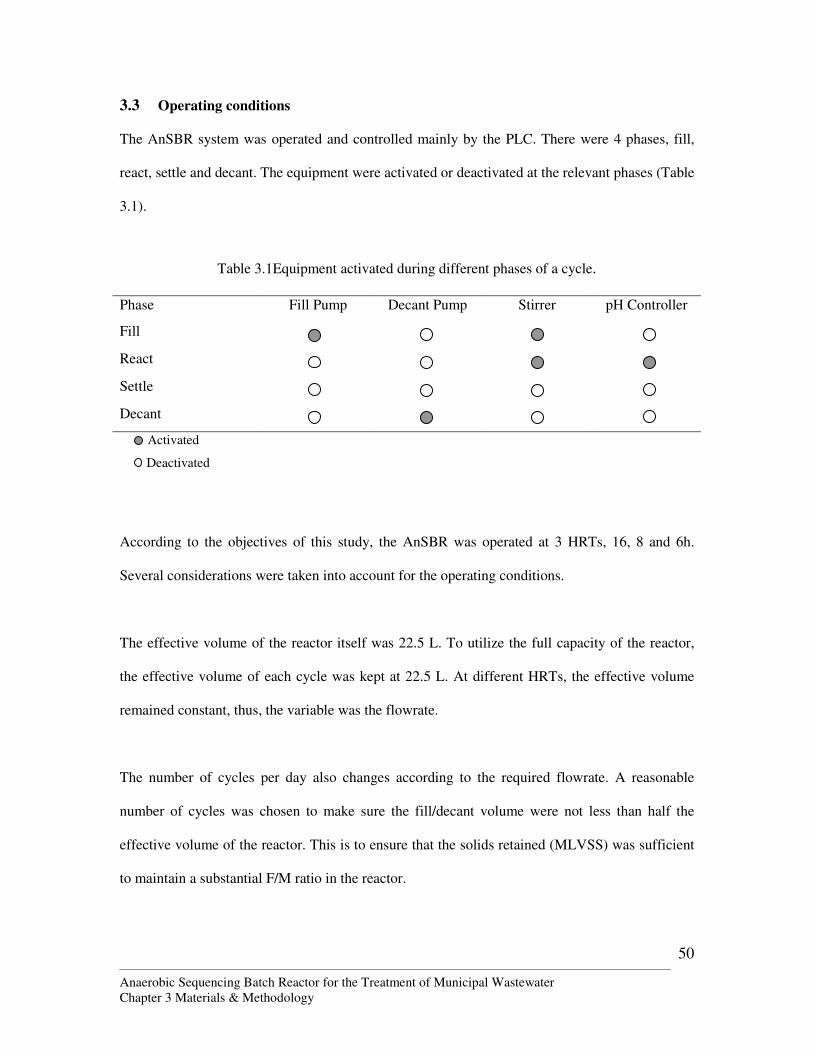
Anaerobic Sequencing Batch Reactor for the Treatment of Municipal Wastewater Chapter 3 Materials & Methodology
50
3.3 Operating conditions
The AnSBR system was operated and controlled mainly by the PLC. There were 4 phases, fill,
react, settle and decant. The equipment were activated or deactivated at the relevant phases (Table
3.1).
Table 3.1Equipment activated during different phases of a cycle. Phase Fill Pump Decant Pump Stirrer pH Controller
Fill
React
Settle
Decant
Activated
Deactivated
According to the objectives of this study, the AnSBR was operated at 3 HRTs, 16, 8 and 6h.
Several considerations were taken into account for the operating conditions.
The effective volume of the reactor itself was 22.5 L. To utilize the full capacity of the reactor,
the effective volume of each cycle was kept at 22.5 L. At different HRTs, the effective volume
remained constant, thus, the variable was the flowrate.
The number of cycles per day also changes according to the required flowrate. A reasonable
number of cycles was chosen to make sure the fill/decant volume were not less than half the
effective volume of the reactor. This is to ensure that the solids retained (MLVSS) was sufficient
to maintain a substantial F/M ratio in the reactor.
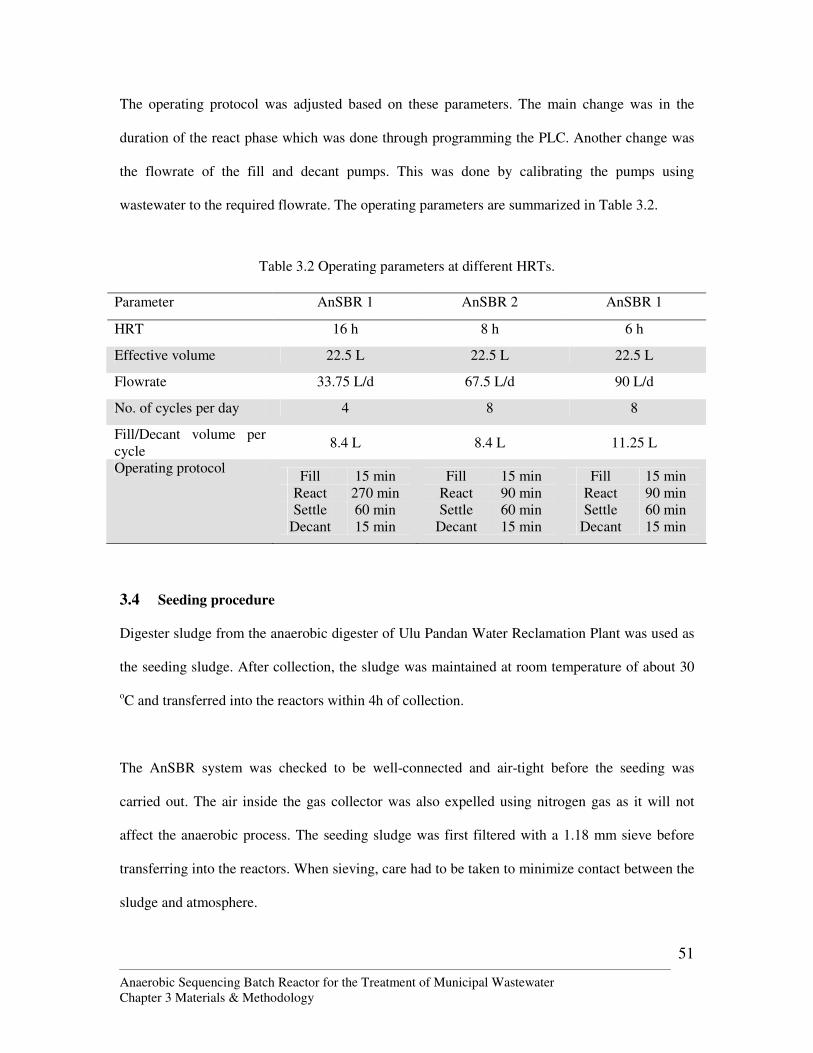
Anaerobic Sequencing Batch Reactor for the Treatment of Municipal Wastewater Chapter 3 Materials & Methodology
51
The operating protocol was adjusted based on these parameters. The main change was in the
duration of the react phase which was done through programming the PLC. Another change was
the flowrate of the fill and decant pumps. This was done by calibrating the pumps using
wastewater to the required flowrate. The operating parameters are summarized in Table 3.2.
Table 3.2 Operating parameters at different HRTs.
Parameter AnSBR 1 AnSBR 2 AnSBR 1
HRT 16 h 8 h 6 h
Effective volume 22.5 L 22.5 L 22.5 L
Flowrate 33.75 L/d 67.5 L/d 90 L/d
No. of cycles per day 4 8 8
Fill/Decant volume per cycle
8.4 L 8.4 L 11.25 L
Operating protocol Fill 15 min
React 270 min Settle 60 min
Decant 15 min
Fill 15 min React 90 min Settle 60 min
Decant 15 min
Fill 15 min React 90 min Settle 60 min
Decant 15 min
3.4 Seeding procedure
Digester sludge from the anaerobic digester of Ulu Pandan Water Reclamation Plant was used as
the seeding sludge. After collection, the sludge was maintained at room temperature of about 30
oC and transferred into the reactors within 4h of collection.
The AnSBR system was checked to be well-connected and air-tight before the seeding was
carried out. The air inside the gas collector was also expelled using nitrogen gas as it will not
affect the anaerobic process. The seeding sludge was first filtered with a 1.18 mm sieve before
transferring into the reactors. When sieving, care had to be taken to minimize contact between the
sludge and atmosphere.
Anaerobic Sequencing Batch Reactor for the Treatment of Municipal Wastewater Chapter 3 Materials & Methodology
52
After the sieving, the sludge was fed into the reactor by using the fill pump, and with the stirrer
on. As the sludge filled up the reactor, the nitrogen gas from the reactor was transferred into the
gas collectors. The gas was then expelled from the collectors periodically.
The reactor was filled with 22.5 L (effective capacity of the reactor) of sludge. The reactor and
gas collectors were then purged with pure nitrogen gas to rid of any residual air.
A sample of the seed sludge was extracted from the reactor after stirring for a few minutes. It had
a MLSS 14300 mg/L and MLVSS 9700 mg/L. Then, the seed sludge was allowed to reside in the
reactor for 24h with stirring before the first cycle was started.
3.5 Tests & Analysis
3.5.1 Physical & aggregate properties
3.5.1.1 Total suspended solids
Total suspended solids (TSS) refer to the portion retained by a filter of pore size 0.45 µm. The
determination of total suspended solids concentration was done in accordance to the standard
methods described by APHA et al. (1998), in Part 2540D. Well-mixed samples were filtered
though a weighed filter paper and the residue obtained was dried in an oven at 103 to 105 oC. The
increase in the weight of the filter paper represented the total suspended solids mass. The total
suspended concentration was calculated by dividing this mass by the volume of samples used
initially.
Anaerobic Sequencing Batch Reactor for the Treatment of Municipal Wastewater Chapter 3 Materials & Methodology
53
Samples were measured as soon as possible after sampling. If this was not permitted, samples
were refrigerated at 4 oC to minimize microbiological decomposition, and measured within 24h.
Samples were brought to room temperature before analysis.
3.5.1.2 Volatile suspended solids
The determination of volatile suspended solids concentration was done in accordance to the
standard methods described by APHA et al. (1998), in Part 2540E. The residue from the total
suspended solids test was ignited to constant weight in a furnace at 550 oC. The weight lost on
ignition was the volatile solids.
Negative errors in volatile solids might result from a loss of volatile matter during drying.
Samples with low volatile solids concentration might be subjected to considerable error. Thus, for
effluent quality, the volatile suspended solids concentration data was supported by total organic
carbon data.
3.5.1.3 Sludge volume index
The sludge volume index (SVI) is the volume in milliliters occupied by 1 g of a suspension after
30 min settling. It is used to monitor the settling characteristics of biomass, which is useful in
routine process control. The determination of sludge volume index was done in accordance to the
standard methods described by APHA et al. (1998), in Part 2710D.
3.5.2 Aggregate organic constituents
Chemical oxygen demand and total organic carbon are used to assess the total amount of organics
present. The measurement of biochemical oxygen demand represents the biodegradable organics
present. The analysis of organics is important in assessing the concentration and general
Anaerobic Sequencing Batch Reactor for the Treatment of Municipal Wastewater Chapter 3 Materials & Methodology
54
composition of organic matter in wastewaters and treated effluents. It is also important in
determining the treatment efficiency of the process.
Samples were measured as soon as possible after sampling. If this was not permitted, samples
were refrigerated at 4 oC to minimize microbiological decomposition, and measured within 24h.
Samples were brought to room temperature before analysis.
3.5.2.1 Chemical oxygen demand
Chemical oxygen demand is a measure of the oxygen equivalent of the organics content that is
susceptible to oxidation by a strong chemical oxidant. COD can be related to BOD, organic
carbon or organic matter empirically. The dichromate reflux method was chosen because of
superior oxidizing ability, applicability to wastewater and ease of manipulation. The oxidation of
most organic compounds was 95 to 100% of the theoretical value. The closed reflux method was
more economical than the open reflux method in the use of metallic salt reagents but the samples
have to be homogenous.
The determination of COD was done in accordance to the Closed Reflux, Titrimetric method
described by APHA et al. (1998), in Part 5520C. The culture tubes and caps were soaked in 5%
acid (HCl) before use. A sample (2.5 mL) was added into a culture tube with 1.5 mL of Digestion
solution, 3.5 mL of sulfuric acid reagent. Cap the tube and invert it several times to mix
completely. The tube was then placed in a block digester which is preheated to 150 oC and reflux
for 2h. The tube was cooled to room temperature before adding 2 to 3 drops of ferroin indicator
and titrating with 0.1 M FAS with stirring. The end point was a sharp change to reddish brown. A
blank and a standard were also prepared for reference and calculations.
Anaerobic Sequencing Batch Reactor for the Treatment of Municipal Wastewater Chapter 3 Materials & Methodology
55
Volatile organic compounds were more completely oxidized because of longer contact with the
oxidant. It is thus important to inspect the tube caps of the culture tubes for breaks.
3.5.2.2 Biochemical oxygen demand
5-day Biochemical oxygen demand, BOD5, measures the amount of oxygen utilized during a 5
days period for the biochemical degradation of organic material (carbonaceous demand) and the
amount of oxygen used to oxidize inorganic material such as sulfides and ferrous iron. It may also
measure the amount of oxygen used to oxidize reduced forms of nitrogen (nitrogenous demand)
unless their oxidation is prevented by an inhibitor.
There are a number of factors which affect the accuracy of BOD5 test data, for example, the
amount of soluble and particulate organics, the amount of settleable and floatable solids, and even
the amount of mixing applied. It is a concern that nitrogenous demand interferes with the BOD5
and affects the accuracy of the data obtained. Usually, an inhibiting chemical is used to reduce
this error. Considering that nitrification reaction is minimum in anaerobic process, the inhibiting
chemical is not introduced in this context.
The BOD5 concentration in the raw wastewater typically exceeds the dissolved oxygen available
in an air-saturated sample. Therefore, it was necessary to dilute the sample before incubation to
bring the oxygen demand and supply into appropriate balance. The dilution water used was added
with nitrogen, phosphorus, trace metals and buffered to ensure the pH is maintained at a level
suitable for bacterial growth. The water used was distilled water.
The determination of BOD5 was done in accordance to the 5-Day BOD Test described by APHA
et al. (1998), in Part 5210B. First, the sample was put into a 250-mL airtight glass bottle, with the
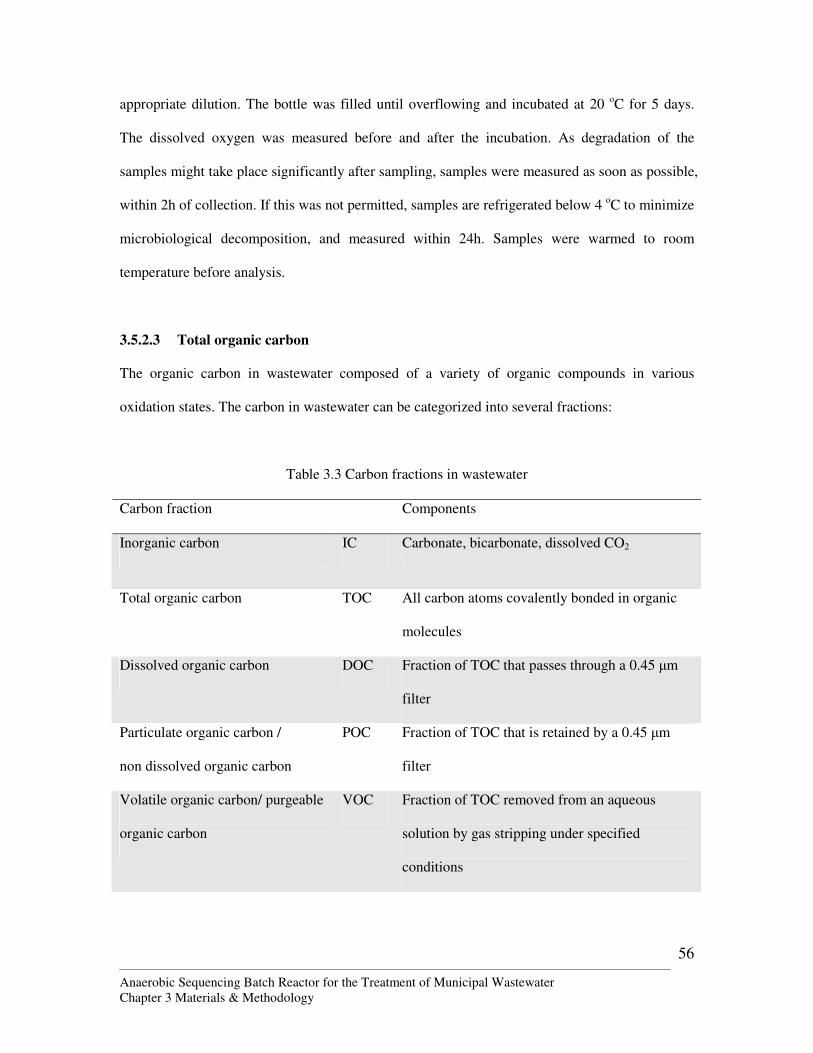
Anaerobic Sequencing Batch Reactor for the Treatment of Municipal Wastewater Chapter 3 Materials & Methodology
56
appropriate dilution. The bottle was filled until overflowing and incubated at 20 oC for 5 days.
The dissolved oxygen was measured before and after the incubation. As degradation of the
samples might take place significantly after sampling, samples were measured as soon as possible,
within 2h of collection. If this was not permitted, samples are refrigerated below 4 oC to minimize
microbiological decomposition, and measured within 24h. Samples were warmed to room
temperature before analysis.
3.5.2.3 Total organic carbon
The organic carbon in wastewater composed of a variety of organic compounds in various
oxidation states. The carbon in wastewater can be categorized into several fractions:
Table 3.3 Carbon fractions in wastewater
Carbon fraction Components
Inorganic carbon IC Carbonate, bicarbonate, dissolved CO2
Total organic carbon TOC All carbon atoms covalently bonded in organic
molecules
Dissolved organic carbon DOC Fraction of TOC that passes through a 0.45 µm
filter
Particulate organic carbon /
non dissolved organic carbon
POC Fraction of TOC that is retained by a 0.45 µm
filter
Volatile organic carbon/ purgeable
organic carbon
VOC Fraction of TOC removed from an aqueous
solution by gas stripping under specified
conditions
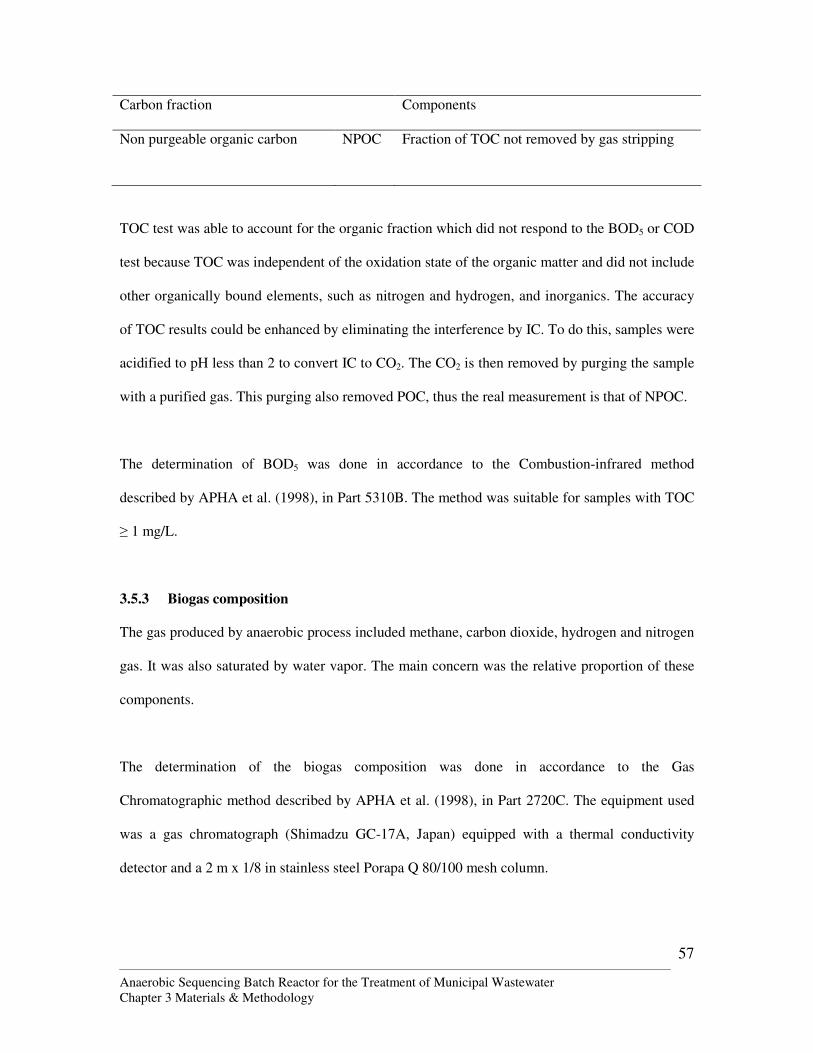
Anaerobic Sequencing Batch Reactor for the Treatment of Municipal Wastewater Chapter 3 Materials & Methodology
57
Carbon fraction Components
Non purgeable organic carbon NPOC Fraction of TOC not removed by gas stripping
TOC test was able to account for the organic fraction which did not respond to the BOD5 or COD
test because TOC was independent of the oxidation state of the organic matter and did not include
other organically bound elements, such as nitrogen and hydrogen, and inorganics. The accuracy
of TOC results could be enhanced by eliminating the interference by IC. To do this, samples were
acidified to pH less than 2 to convert IC to CO2. The CO2 is then removed by purging the sample
with a purified gas. This purging also removed POC, thus the real measurement is that of NPOC.
The determination of BOD5 was done in accordance to the Combustion-infrared method
described by APHA et al. (1998), in Part 5310B. The method was suitable for samples with TOC
≥ 1 mg/L.
3.5.3 Biogas composition
The gas produced by anaerobic process included methane, carbon dioxide, hydrogen and nitrogen
gas. It was also saturated by water vapor. The main concern was the relative proportion of these
components.
The determination of the biogas composition was done in accordance to the Gas
Chromatographic method described by APHA et al. (1998), in Part 2720C. The equipment used
was a gas chromatograph (Shimadzu GC-17A, Japan) equipped with a thermal conductivity
detector and a 2 m x 1/8 in stainless steel Porapa Q 80/100 mesh column.
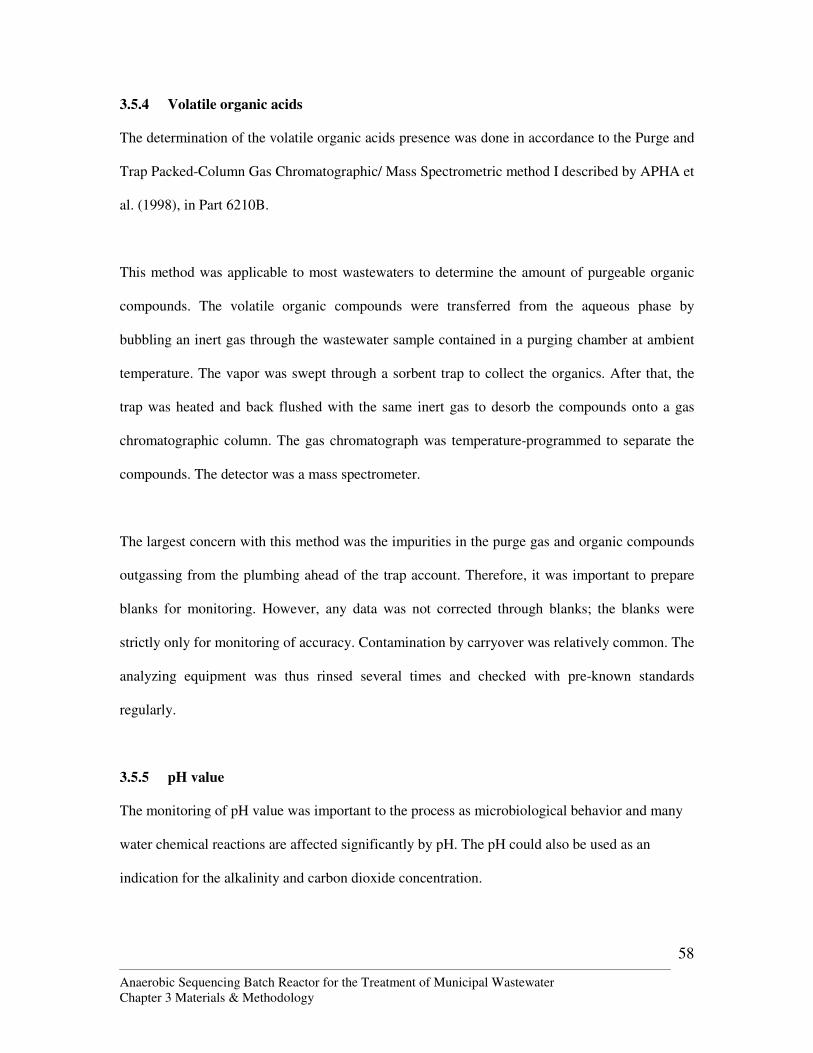
Anaerobic Sequencing Batch Reactor for the Treatment of Municipal Wastewater Chapter 3 Materials & Methodology
58
3.5.4 Volatile organic acids
The determination of the volatile organic acids presence was done in accordance to the Purge and
Trap Packed-Column Gas Chromatographic/ Mass Spectrometric method I described by APHA et
al. (1998), in Part 6210B.
This method was applicable to most wastewaters to determine the amount of purgeable organic
compounds. The volatile organic compounds were transferred from the aqueous phase by
bubbling an inert gas through the wastewater sample contained in a purging chamber at ambient
temperature. The vapor was swept through a sorbent trap to collect the organics. After that, the
trap was heated and back flushed with the same inert gas to desorb the compounds onto a gas
chromatographic column. The gas chromatograph was temperature-programmed to separate the
compounds. The detector was a mass spectrometer.
The largest concern with this method was the impurities in the purge gas and organic compounds
outgassing from the plumbing ahead of the trap account. Therefore, it was important to prepare
blanks for monitoring. However, any data was not corrected through blanks; the blanks were
strictly only for monitoring of accuracy. Contamination by carryover was relatively common. The
analyzing equipment was thus rinsed several times and checked with pre-known standards
regularly.
3.5.5 pH value
The monitoring of pH value was important to the process as microbiological behavior and many
water chemical reactions are affected significantly by pH. The pH could also be used as an
indication for the alkalinity and carbon dioxide concentration.
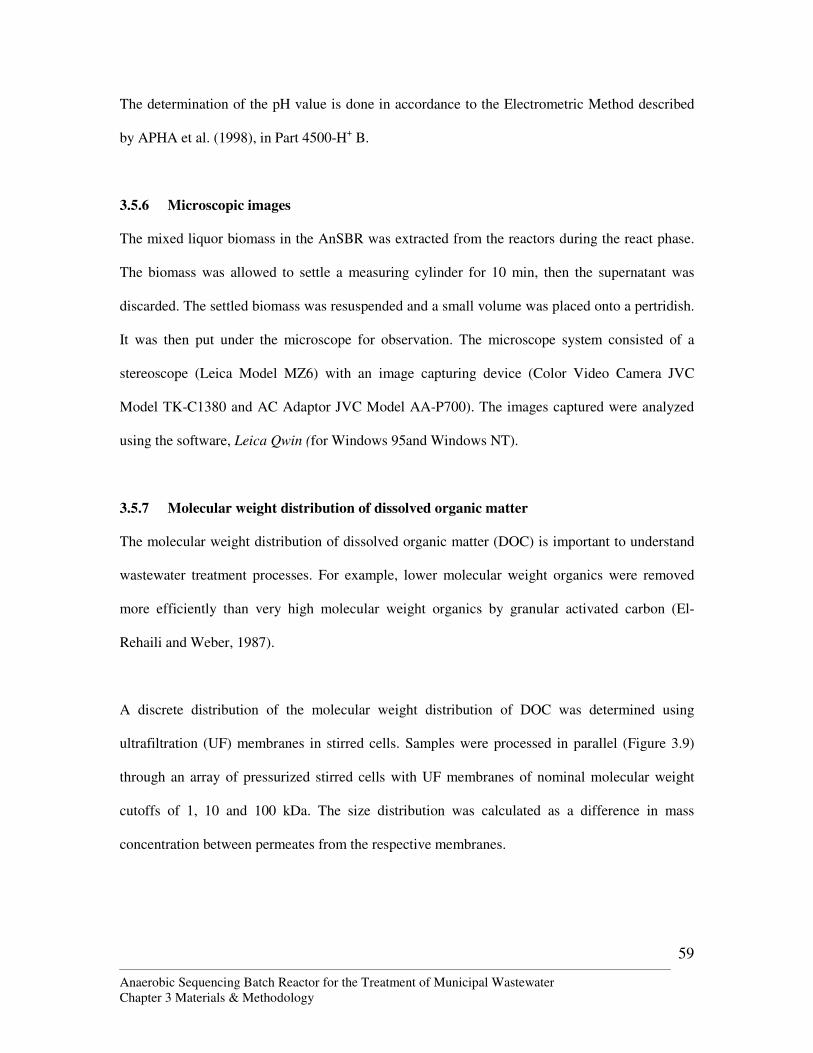
Anaerobic Sequencing Batch Reactor for the Treatment of Municipal Wastewater Chapter 3 Materials & Methodology
59
The determination of the pH value is done in accordance to the Electrometric Method described
by APHA et al. (1998), in Part 4500-H+ B.
3.5.6 Microscopic images
The mixed liquor biomass in the AnSBR was extracted from the reactors during the react phase.
The biomass was allowed to settle a measuring cylinder for 10 min, then the supernatant was
discarded. The settled biomass was resuspended and a small volume was placed onto a pertridish.
It was then put under the microscope for observation. The microscope system consisted of a
stereoscope (Leica Model MZ6) with an image capturing device (Color Video Camera JVC
Model TK-C1380 and AC Adaptor JVC Model AA-P700). The images captured were analyzed
using the software, Leica Qwin (for Windows 95and Windows NT).
3.5.7 Molecular weight distribution of dissolved organic matter
The molecular weight distribution of dissolved organic matter (DOC) is important to understand
wastewater treatment processes. For example, lower molecular weight organics were removed
more efficiently than very high molecular weight organics by granular activated carbon (El-
Rehaili and Weber, 1987).
A discrete distribution of the molecular weight distribution of DOC was determined using
ultrafiltration (UF) membranes in stirred cells. Samples were processed in parallel (Figure 3.9)
through an array of pressurized stirred cells with UF membranes of nominal molecular weight
cutoffs of 1, 10 and 100 kDa. The size distribution was calculated as a difference in mass
concentration between permeates from the respective membranes.
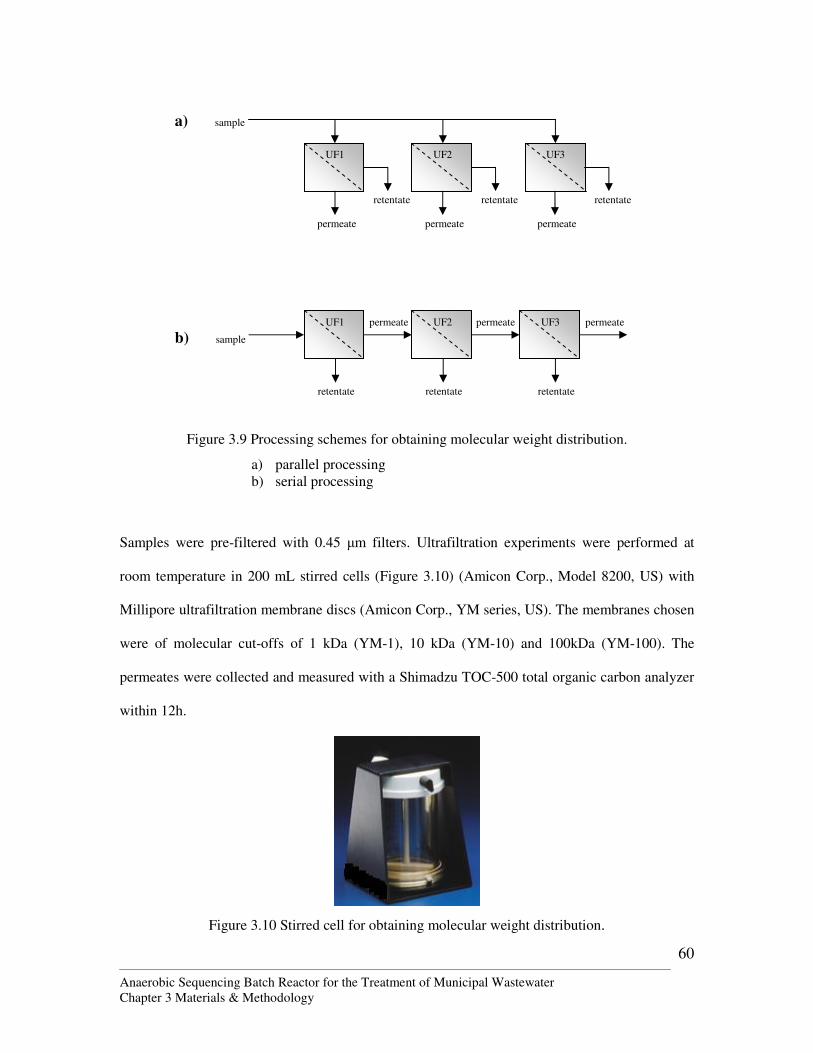
Anaerobic Sequencing Batch Reactor for the Treatment of Municipal Wastewater Chapter 3 Materials & Methodology
60
Figure 3.9 Processing schemes for obtaining molecular weight distribution.
a) parallel processing b) serial processing
Samples were pre-filtered with 0.45 µm filters. Ultrafiltration experiments were performed at
room temperature in 200 mL stirred cells (Figure 3.10) (Amicon Corp., Model 8200, US) with
Millipore ultrafiltration membrane discs (Amicon Corp., YM series, US). The membranes chosen
were of molecular cut-offs of 1 kDa (YM-1), 10 kDa (YM-10) and 100kDa (YM-100). The
permeates were collected and measured with a Shimadzu TOC-500 total organic carbon analyzer
within 12h.
Figure 3.10 Stirred cell for obtaining molecular weight distribution.
retentate retentate retentate
permeate permeate permeate
retentate retentate retentate
permeate permeate permeate
b) sample
a) sample
UF1 UF2 UF3
UF1 UF2 UF3
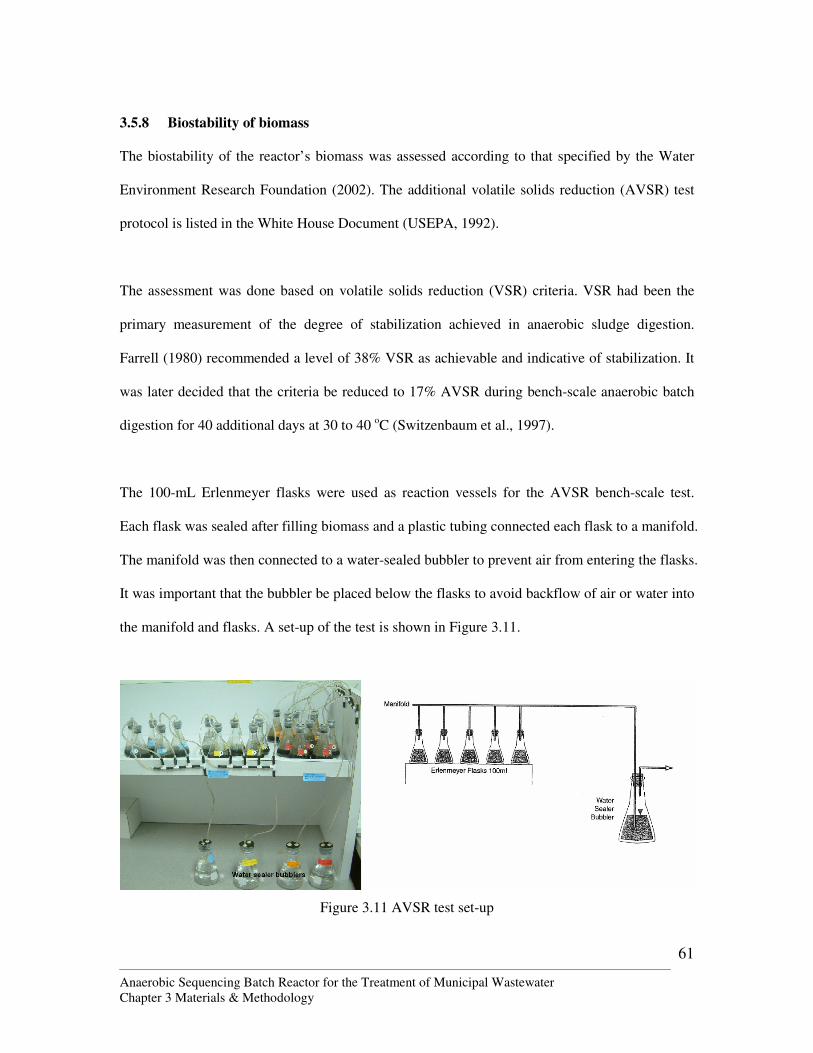
Anaerobic Sequencing Batch Reactor for the Treatment of Municipal Wastewater Chapter 3 Materials & Methodology
61
3.5.8 Biostability of biomass
The biostability of the reactor’s biomass was assessed according to that specified by the Water
Environment Research Foundation (2002). The additional volatile solids reduction (AVSR) test
protocol is listed in the White House Document (USEPA, 1992).
The assessment was done based on volatile solids reduction (VSR) criteria. VSR had been the
primary measurement of the degree of stabilization achieved in anaerobic sludge digestion.
Farrell (1980) recommended a level of 38% VSR as achievable and indicative of stabilization. It
was later decided that the criteria be reduced to 17% AVSR during bench-scale anaerobic batch
digestion for 40 additional days at 30 to 40 oC (Switzenbaum et al., 1997).
The 100-mL Erlenmeyer flasks were used as reaction vessels for the AVSR bench-scale test.
Each flask was sealed after filling biomass and a plastic tubing connected each flask to a manifold.
The manifold was then connected to a water-sealed bubbler to prevent air from entering the flasks.
It was important that the bubbler be placed below the flasks to avoid backflow of air or water into
the manifold and flasks. A set-up of the test is shown in Figure 3.11.
Figure 3.11 AVSR test set-up
Anaerobic Sequencing Batch Reactor for the Treatment of Municipal Wastewater Chapter 3 Materials & Methodology
62
Ten replicates of the samples were measured for total solids (TS) and volatile solids (VS) (APHA,
1998) concentration for each batch of sludge collected. Five of them were measured after 20 days
and the rest were measured after 40 days. The determination of TS concentration was done in
accordance to the standard methods described by APHA et al. (1998), in Part 2540A. Well-mixed
samples were dried in an oven at 103 to 105 oC. The increase in the weight of the filter paper
represented the total suspended solids mass. The total suspended concentration was calculated by
dividing this mass by the volume of samples used initially. The determination of VS
concentration wa done in accordance to the standard methods described by APHA et al. (1998),
in Part 2540A. The residue from the TS test was ignited to constant weight in a furnace at 550 oC.
The weight lost on ignition was the volatile solids.
The results were calculated as
FVSR = )40(
40
VSVSfeedVSfeed
VSVSfeed
×−
− (3.1)
Where FVSR = fraction volatile solids reduction
VSfeed = volatile solids fraction of feed solids VS40 = volatile solids fraction after 40 days of bench-scale digestion
3.5.9 Microbiological analysis
3.5.9.1 DNA extraction
Genomic DNA from the mixed liquor sludge of the reactor was extracted using a chemical lysis
and freeze and thaw method.
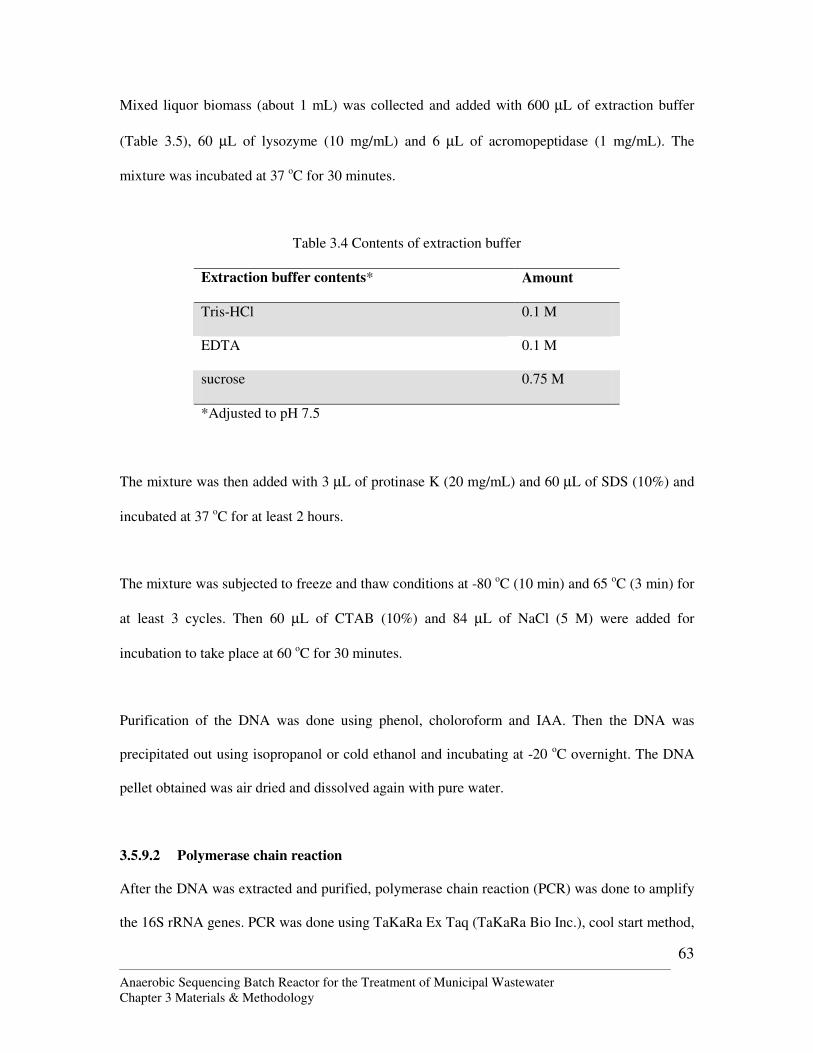
Anaerobic Sequencing Batch Reactor for the Treatment of Municipal Wastewater Chapter 3 Materials & Methodology
63
Mixed liquor biomass (about 1 mL) was collected and added with 600 µL of extraction buffer
(Table 3.5), 60 µL of lysozyme (10 mg/mL) and 6 µL of acromopeptidase (1 mg/mL). The
mixture was incubated at 37 oC for 30 minutes.
Table 3.4 Contents of extraction buffer
Extraction buffer contents* Amount
Tris-HCl 0.1 M
EDTA 0.1 M
sucrose 0.75 M
*Adjusted to pH 7.5
The mixture was then added with 3 µL of protinase K (20 mg/mL) and 60 µL of SDS (10%) and
incubated at 37 oC for at least 2 hours.
The mixture was subjected to freeze and thaw conditions at -80 oC (10 min) and 65 oC (3 min) for
at least 3 cycles. Then 60 µL of CTAB (10%) and 84 µL of NaCl (5 M) were added for
incubation to take place at 60 oC for 30 minutes.
Purification of the DNA was done using phenol, choloroform and IAA. Then the DNA was
precipitated out using isopropanol or cold ethanol and incubating at -20 oC overnight. The DNA
pellet obtained was air dried and dissolved again with pure water.
3.5.9.2 Polymerase chain reaction
After the DNA was extracted and purified, polymerase chain reaction (PCR) was done to amplify
the 16S rRNA genes. PCR was done using TaKaRa Ex Taq (TaKaRa Bio Inc.), cool start method,
Anaerobic Sequencing Batch Reactor for the Treatment of Municipal Wastewater Chapter 3 Materials & Methodology
64
and strictly following the manufacturer’s recommendations. The primers used for PCR are the
eubacterial universal primers 47f (5΄-Cy5-CYTAACACATGCAAGTCG-3΄) and 927r (5΄-
ACCGCTTGTGCGGGCCC-3΄) (Amann et al., 1995) and archaea-specific primers 344f (5΄-Cy5-
ACGG GAGCAGCAGGCGCGA-3΄) and 915r (5΄-GTGCTCCCCCGCCAATTCCT-3΄)
(Hendrik and Muyzer, 2001).
The primers were fluorescent-labeled to facilitate Terminal Restriction Fragment Length
Polymorphism (T-RFLP) fingerprinting subsequently, which was carried out based on the
protocol described by Liu et al. (1997).
The PCR products were purified using the QIAquick PCR purification kit (Qiagen), following the
manufacturer’s recommendations, before performing T-RFLP.
3.5.9.3 Terminal Restriction Length Polymorphism (T-RFLP)
The purified PCR products were digested with three tetrameric restriction nucleases, MspI, AluI
and RsaI. All digestions were carried out for at least 3h at 37 oC, according to the manufacturer’s
instructions. The digested products were denatured at 65 oC for 10 min.
The enzyme-digested products were added with sample loading solution, CEQ DNA size
standard kit-600, well mixed and loaded into the CEQ 8000 automated sequencer (Beckman
Coulter) at 55 oC and 4.8 kV for 2h. The CEQ 8000-genetic analysis system software (Beckman
Coulter) was then used to analyze the lengths of the fluorescents with internal standards.
Anaerobic Sequencing Batch Reactor for the Treatment of Municipal Wastewater Chapter 4 Results & Discussion
65
Chapter 4 Results & Discussion
4.1 Start-up study of AnSBR
It is well known that the start-up of anaerobic systems can be relatively long compared to aerobic
systems because of the slow growth rate of anaerobic microorganisms. Thus this factor becomes
an important consideration when adopting an anaerobic system for wastewater treatment. Once
the start-up phase is successful, an anaerobic system can be left dormant for extended periods
without severe deterioration in biomass properties since it is rather robust. Therefore, it is critical
that the start-up be monitored closely.
A long HRT is hypothesized to be beneficial for the start-up period because it might indirectly
help to increase the SRT of the system by preventing biomass washout and retaining the biomass
in the reactor. Ndon and Dague (1997) showed that anaerobic systems with short HRT have the
following problems:
• high organic loading resulting in the domination of microorganisms which are more
dispersed;
• microorganisms have a longer settling velocity which resulting in poor solid-liquid
separation; and
• high hydraulic loading which caused higher biomass loss in the effluent.
The start-up period of the AnSBR represented the duration of operation starting from D1 until the
time when the performance of the AnSBR was relatively stable. The performance was assessed
through suspended solids removal, organics removal as well as the quality and quantity of the
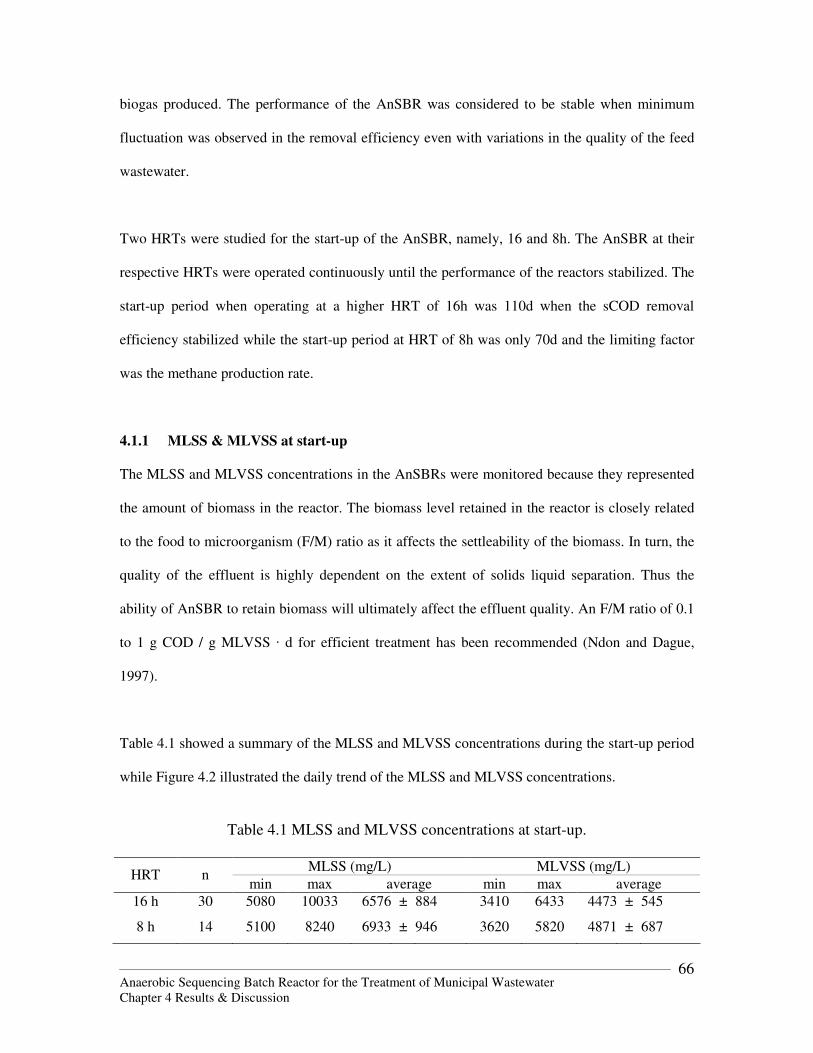
Anaerobic Sequencing Batch Reactor for the Treatment of Municipal Wastewater Chapter 4 Results & Discussion
66
biogas produced. The performance of the AnSBR was considered to be stable when minimum
fluctuation was observed in the removal efficiency even with variations in the quality of the feed
wastewater.
Two HRTs were studied for the start-up of the AnSBR, namely, 16 and 8h. The AnSBR at their
respective HRTs were operated continuously until the performance of the reactors stabilized. The
start-up period when operating at a higher HRT of 16h was 110d when the sCOD removal
efficiency stabilized while the start-up period at HRT of 8h was only 70d and the limiting factor
was the methane production rate.
4.1.1 MLSS & MLVSS at start-up
The MLSS and MLVSS concentrations in the AnSBRs were monitored because they represented
the amount of biomass in the reactor. The biomass level retained in the reactor is closely related
to the food to microorganism (F/M) ratio as it affects the settleability of the biomass. In turn, the
quality of the effluent is highly dependent on the extent of solids liquid separation. Thus the
ability of AnSBR to retain biomass will ultimately affect the effluent quality. An F/M ratio of 0.1
to 1 g COD / g MLVSS · d for efficient treatment has been recommended (Ndon and Dague,
1997).
Table 4.1 showed a summary of the MLSS and MLVSS concentrations during the start-up period
while Figure 4.2 illustrated the daily trend of the MLSS and MLVSS concentrations.
Table 4.1 MLSS and MLVSS concentrations at start-up.
MLSS (mg/L) MLVSS (mg/L)
HRT n min max average min max average
16 h 30 5080 10033 6576 ± 884 3410 6433 4473 ± 545
8 h 14 5100 8240 6933 ± 946 3620 5820 4871 ± 687
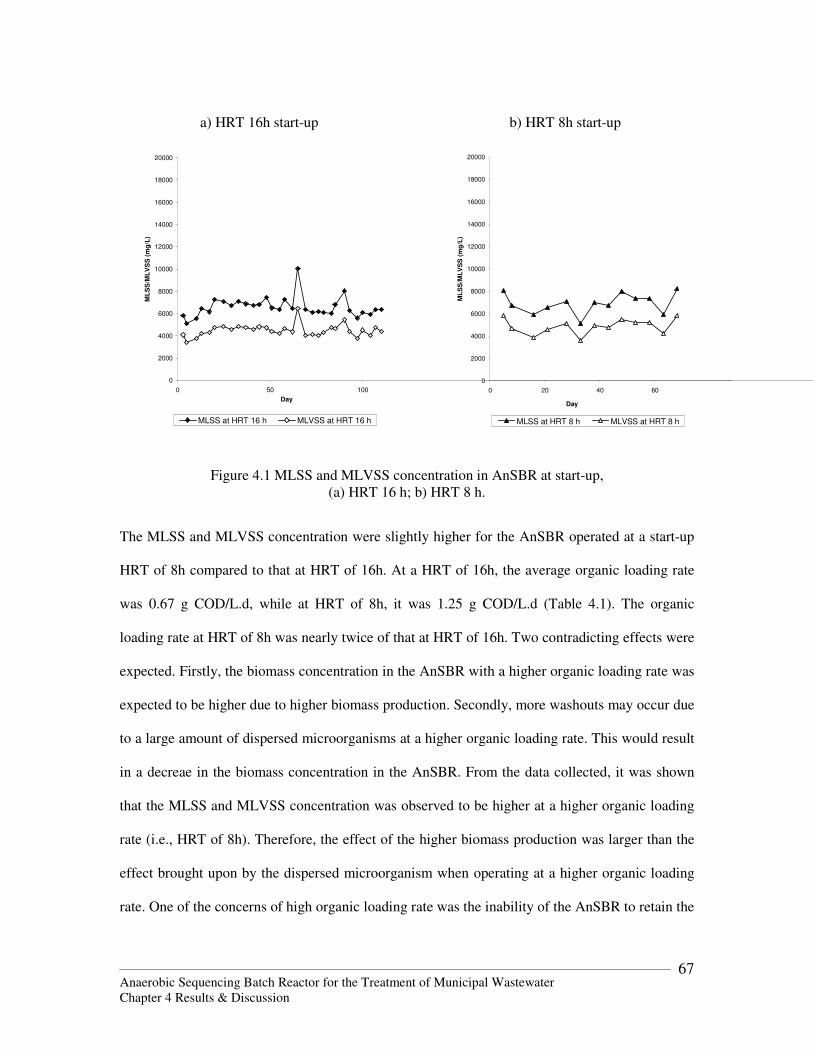
Anaerobic Sequencing Batch Reactor for the Treatment of Municipal Wastewater Chapter 4 Results & Discussion
67
a) HRT 16h start-up b) HRT 8h start-up
0
2000
4000
6000
8000
10000
12000
14000
16000
18000
20000
0 20 40 60
Day
ML
SS
/ML
VS
S (
mg
/L)
MLSS at HRT 8 h MLVSS at HRT 8 h
Figure 4.1 MLSS and MLVSS concentration in AnSBR at start-up, (a) HRT 16 h; b) HRT 8 h.
The MLSS and MLVSS concentration were slightly higher for the AnSBR operated at a start-up
HRT of 8h compared to that at HRT of 16h. At a HRT of 16h, the average organic loading rate
was 0.67 g COD/L.d, while at HRT of 8h, it was 1.25 g COD/L.d (Table 4.1). The organic
loading rate at HRT of 8h was nearly twice of that at HRT of 16h. Two contradicting effects were
expected. Firstly, the biomass concentration in the AnSBR with a higher organic loading rate was
expected to be higher due to higher biomass production. Secondly, more washouts may occur due
to a large amount of dispersed microorganisms at a higher organic loading rate. This would result
in a decreae in the biomass concentration in the AnSBR. From the data collected, it was shown
that the MLSS and MLVSS concentration was observed to be higher at a higher organic loading
rate (i.e., HRT of 8h). Therefore, the effect of the higher biomass production was larger than the
effect brought upon by the dispersed microorganism when operating at a higher organic loading
rate. One of the concerns of high organic loading rate was the inability of the AnSBR to retain the
0
2000
4000
6000
8000
10000
12000
14000
16000
18000
20000
0 50 100
Day
ML
SS
/ML
VS
S (
mg
/L)
MLSS at HRT 16 h MLVSS at HRT 16 h
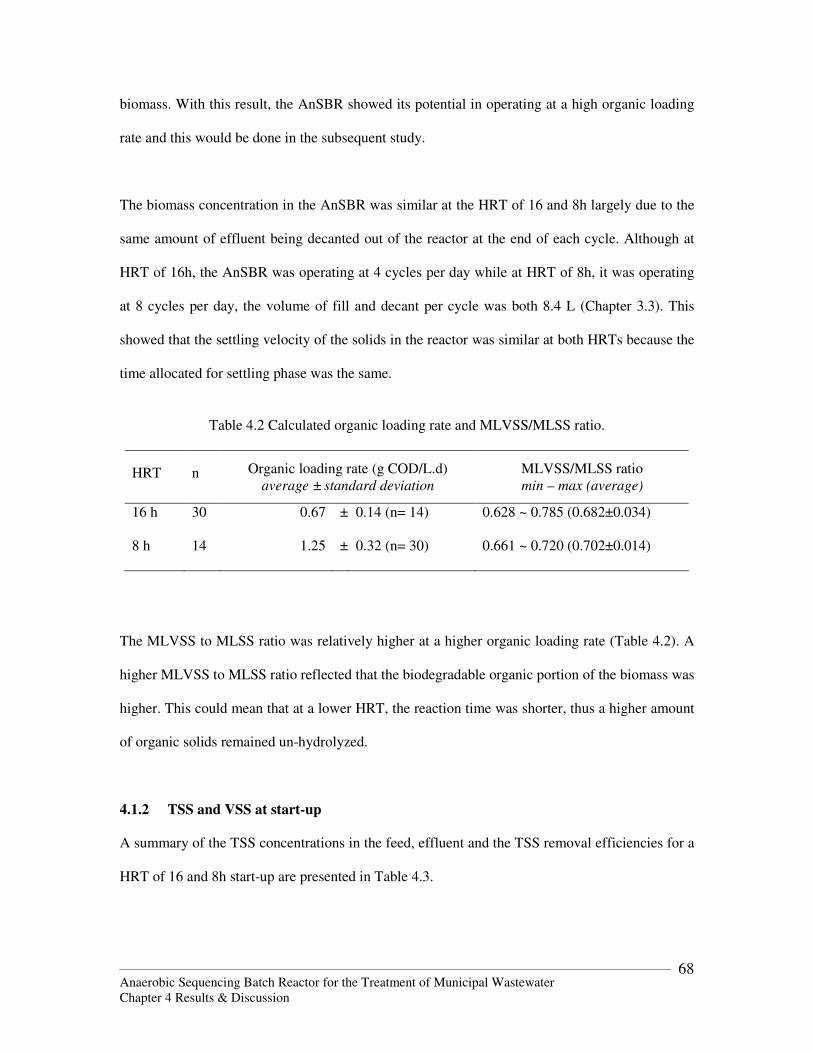
Anaerobic Sequencing Batch Reactor for the Treatment of Municipal Wastewater Chapter 4 Results & Discussion
68
biomass. With this result, the AnSBR showed its potential in operating at a high organic loading
rate and this would be done in the subsequent study.
The biomass concentration in the AnSBR was similar at the HRT of 16 and 8h largely due to the
same amount of effluent being decanted out of the reactor at the end of each cycle. Although at
HRT of 16h, the AnSBR was operating at 4 cycles per day while at HRT of 8h, it was operating
at 8 cycles per day, the volume of fill and decant per cycle was both 8.4 L (Chapter 3.3). This
showed that the settling velocity of the solids in the reactor was similar at both HRTs because the
time allocated for settling phase was the same.
Table 4.2 Calculated organic loading rate and MLVSS/MLSS ratio.
HRT n Organic loading rate (g COD/L.d) average ± standard deviation
MLVSS/MLSS ratio min – max (average)
16 h 30 0.67 ± 0.14 (n= 14) 0.628 ~ 0.785 (0.682±0.034)
8 h 14 1.25 ± 0.32 (n= 30) 0.661 ~ 0.720 (0.702±0.014)
The MLVSS to MLSS ratio was relatively higher at a higher organic loading rate (Table 4.2). A
higher MLVSS to MLSS ratio reflected that the biodegradable organic portion of the biomass was
higher. This could mean that at a lower HRT, the reaction time was shorter, thus a higher amount
of organic solids remained un-hydrolyzed.
4.1.2 TSS and VSS at start-up
A summary of the TSS concentrations in the feed, effluent and the TSS removal efficiencies for a
HRT of 16 and 8h start-up are presented in Table 4.3.
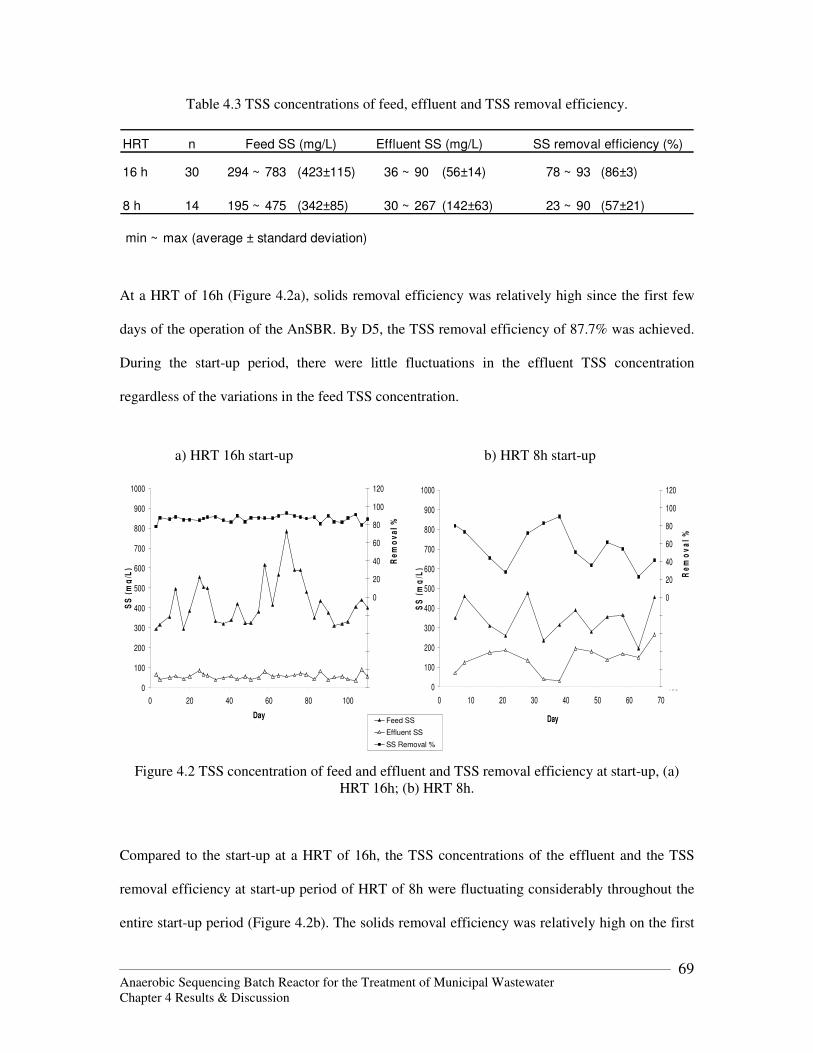
Anaerobic Sequencing Batch Reactor for the Treatment of Municipal Wastewater Chapter 4 Results & Discussion
69
Table 4.3 TSS concentrations of feed, effluent and TSS removal efficiency.
HRT n
16 h 30 294 ~ 783 (423±115) 36 ~ 90 (56±14) 78 ~ 93 (86±3)
8 h 14 195 ~ 475 (342±85) 30 ~ 267 (142±63) 23 ~ 90 (57±21)
min ~ max (average ± standard deviation)
Feed SS (mg/L) Effluent SS (mg/L) SS removal efficiency (%)
At a HRT of 16h (Figure 4.2a), solids removal efficiency was relatively high since the first few
days of the operation of the AnSBR. By D5, the TSS removal efficiency of 87.7% was achieved.
During the start-up period, there were little fluctuations in the effluent TSS concentration
regardless of the variations in the feed TSS concentration.
a) HRT 16h start-up b) HRT 8h start-up
0
100
200
300
400
500
600
700
800
900
1000
0 20 40 60 80 100
Day
SS
(m
g/L
)
-100
-80
-60
-40
-20
0
20
40
60
80
100
120
Re
mo
va
l %
0
100
200
300
400
500
600
700
800
900
1000
0 10 20 30 40 50 60 70
Day
SS
(m
g/L
)
-100
-80
-60
-40
-20
0
20
40
60
80
100
120
Re
mo
va
l %
Figure 4.2 TSS concentration of feed and effluent and TSS removal efficiency at start-up, (a) HRT 16h; (b) HRT 8h.
Compared to the start-up at a HRT of 16h, the TSS concentrations of the effluent and the TSS
removal efficiency at start-up period of HRT of 8h were fluctuating considerably throughout the
entire start-up period (Figure 4.2b). The solids removal efficiency was relatively high on the first
-100
Feed SS
Effluent SS
SS Removal %
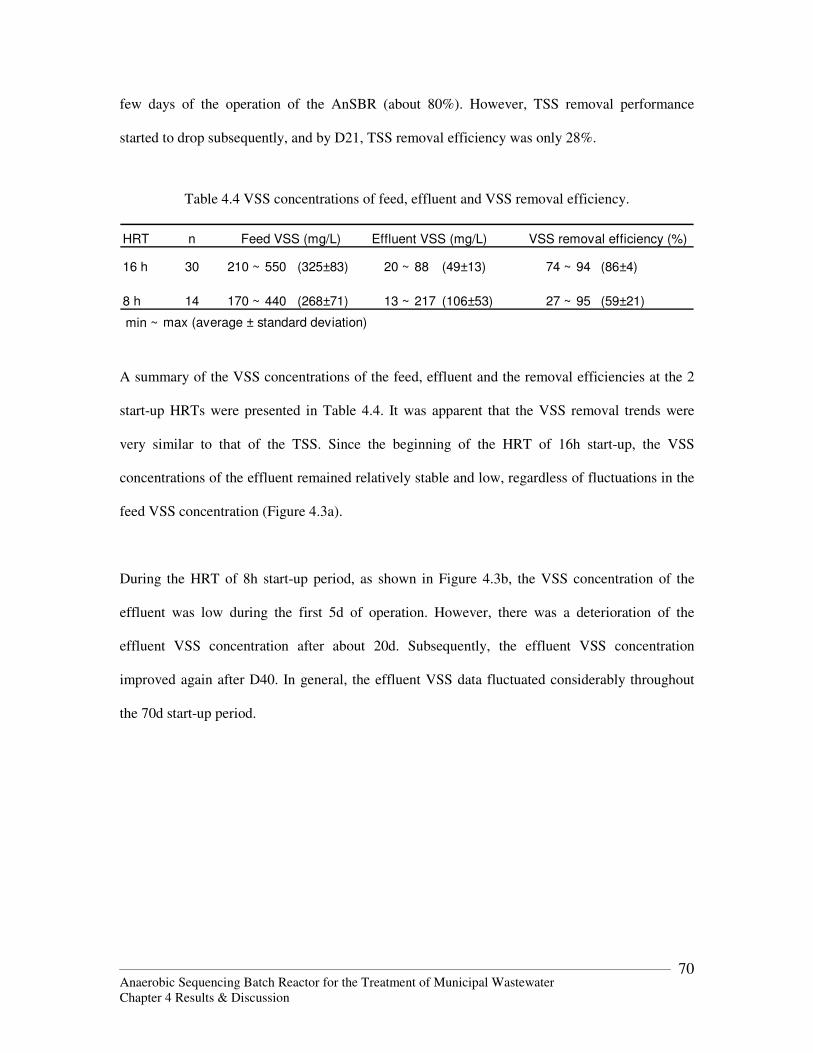
Anaerobic Sequencing Batch Reactor for the Treatment of Municipal Wastewater Chapter 4 Results & Discussion
70
few days of the operation of the AnSBR (about 80%). However, TSS removal performance
started to drop subsequently, and by D21, TSS removal efficiency was only 28%.
Table 4.4 VSS concentrations of feed, effluent and VSS removal efficiency.
HRT n
16 h 30 210 ~ 550 (325±83) 20 ~ 88 (49±13) 74 ~ 94 (86±4)
8 h 14 170 ~ 440 (268±71) 13 ~ 217 (106±53) 27 ~ 95 (59±21)
min ~ max (average ± standard deviation)
VSS removal efficiency (%)Feed VSS (mg/L) Effluent VSS (mg/L)
A summary of the VSS concentrations of the feed, effluent and the removal efficiencies at the 2
start-up HRTs were presented in Table 4.4. It was apparent that the VSS removal trends were
very similar to that of the TSS. Since the beginning of the HRT of 16h start-up, the VSS
concentrations of the effluent remained relatively stable and low, regardless of fluctuations in the
feed VSS concentration (Figure 4.3a).
During the HRT of 8h start-up period, as shown in Figure 4.3b, the VSS concentration of the
effluent was low during the first 5d of operation. However, there was a deterioration of the
effluent VSS concentration after about 20d. Subsequently, the effluent VSS concentration
improved again after D40. In general, the effluent VSS data fluctuated considerably throughout
the 70d start-up period.
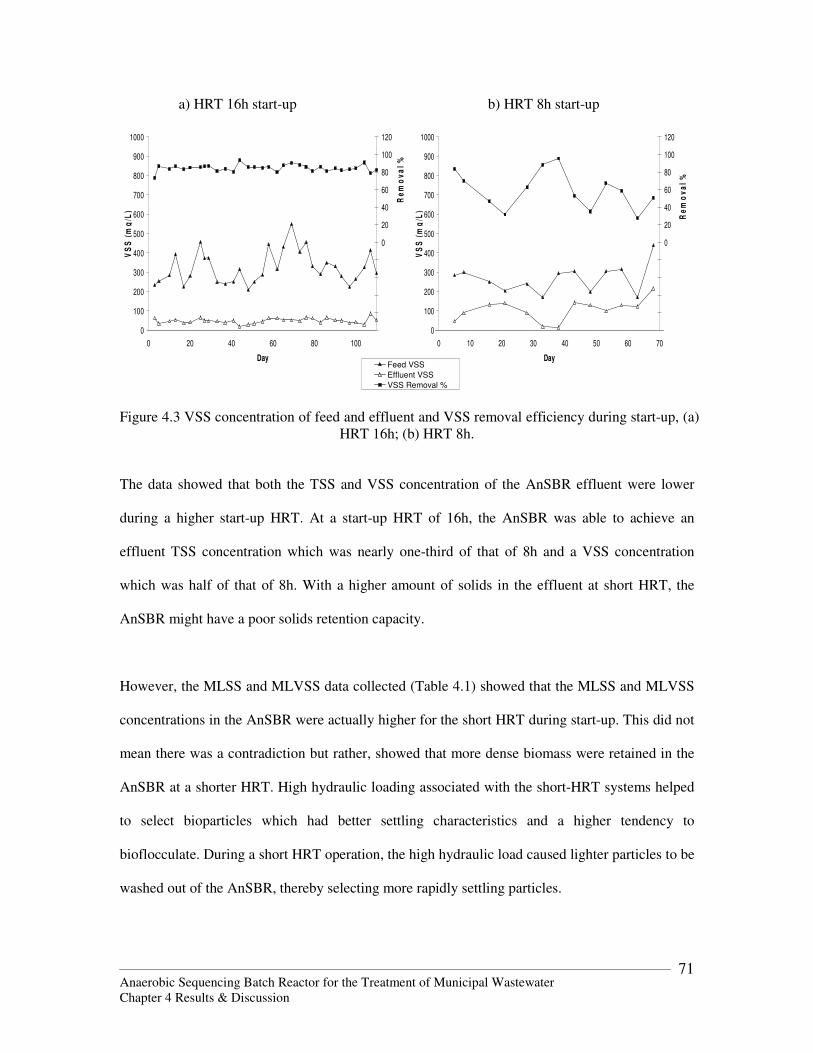
Anaerobic Sequencing Batch Reactor for the Treatment of Municipal Wastewater Chapter 4 Results & Discussion
71
a) HRT 16h start-up b) HRT 8h start-up
0
100
200
300
400
500
600
700
800
900
1000
0 20 40 60 80 100
Day
VS
S (
mg
/L)
-100
-80
-60
-40
-20
0
20
40
60
80
100
120
Re
mo
va
l %
0
100
200
300
400
500
600
700
800
900
1000
0 10 20 30 40 50 60 70
Day
VS
S (
mg
/L)
-100
-80
-60
-40
-20
0
20
40
60
80
100
120
Re
mo
va
l %
Figure 4.3 VSS concentration of feed and effluent and VSS removal efficiency during start-up, (a)
HRT 16h; (b) HRT 8h. The data showed that both the TSS and VSS concentration of the AnSBR effluent were lower
during a higher start-up HRT. At a start-up HRT of 16h, the AnSBR was able to achieve an
effluent TSS concentration which was nearly one-third of that of 8h and a VSS concentration
which was half of that of 8h. With a higher amount of solids in the effluent at short HRT, the
AnSBR might have a poor solids retention capacity.
However, the MLSS and MLVSS data collected (Table 4.1) showed that the MLSS and MLVSS
concentrations in the AnSBR were actually higher for the short HRT during start-up. This did not
mean there was a contradiction but rather, showed that more dense biomass were retained in the
AnSBR at a shorter HRT. High hydraulic loading associated with the short-HRT systems helped
to select bioparticles which had better settling characteristics and a higher tendency to
bioflocculate. During a short HRT operation, the high hydraulic load caused lighter particles to be
washed out of the AnSBR, thereby selecting more rapidly settling particles.
Feed VSS
Effluent VSS
VSS Removal %
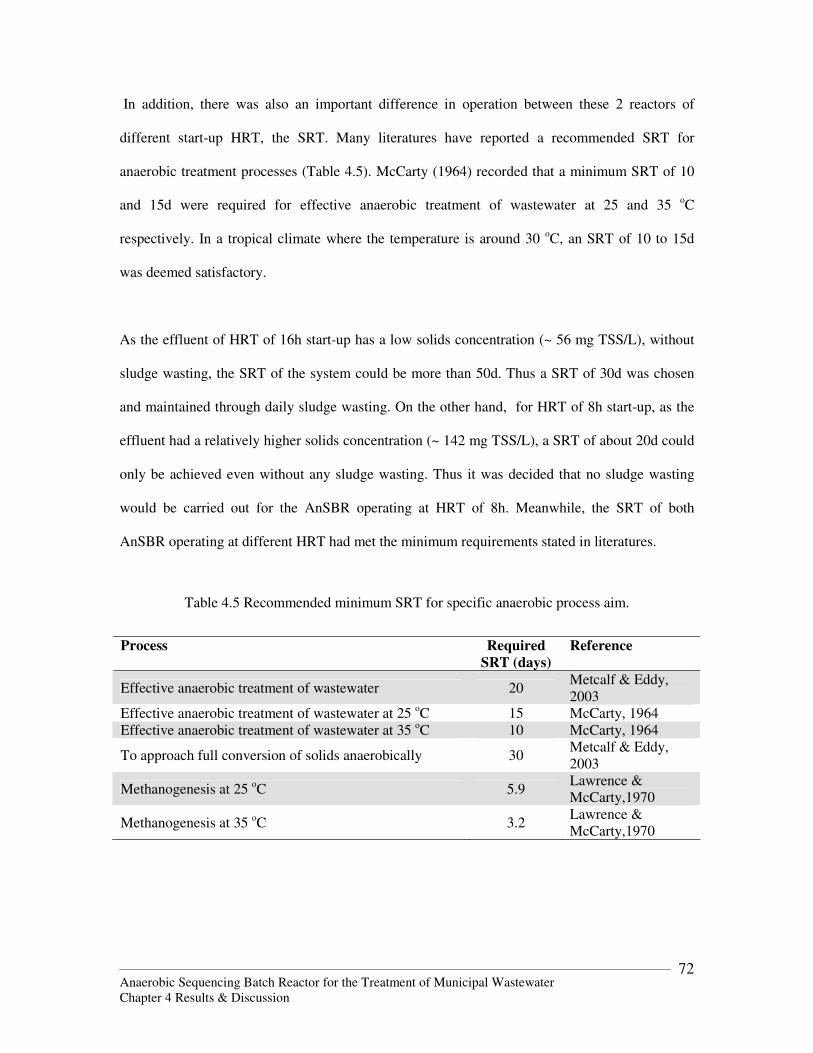
Anaerobic Sequencing Batch Reactor for the Treatment of Municipal Wastewater Chapter 4 Results & Discussion
72
In addition, there was also an important difference in operation between these 2 reactors of
different start-up HRT, the SRT. Many literatures have reported a recommended SRT for
anaerobic treatment processes (Table 4.5). McCarty (1964) recorded that a minimum SRT of 10
and 15d were required for effective anaerobic treatment of wastewater at 25 and 35 oC
respectively. In a tropical climate where the temperature is around 30 oC, an SRT of 10 to 15d
was deemed satisfactory.
As the effluent of HRT of 16h start-up has a low solids concentration (~ 56 mg TSS/L), without
sludge wasting, the SRT of the system could be more than 50d. Thus a SRT of 30d was chosen
and maintained through daily sludge wasting. On the other hand, for HRT of 8h start-up, as the
effluent had a relatively higher solids concentration (~ 142 mg TSS/L), a SRT of about 20d could
only be achieved even without any sludge wasting. Thus it was decided that no sludge wasting
would be carried out for the AnSBR operating at HRT of 8h. Meanwhile, the SRT of both
AnSBR operating at different HRT had met the minimum requirements stated in literatures.
Table 4.5 Recommended minimum SRT for specific anaerobic process aim.
Process Required
SRT (days)
Reference
Effective anaerobic treatment of wastewater 20 Metcalf & Eddy, 2003
Effective anaerobic treatment of wastewater at 25 oC 15 McCarty, 1964 Effective anaerobic treatment of wastewater at 35 oC 10 McCarty, 1964
To approach full conversion of solids anaerobically 30 Metcalf & Eddy, 2003
Methanogenesis at 25 oC 5.9 Lawrence & McCarty,1970
Methanogenesis at 35 oC 3.2 Lawrence & McCarty,1970
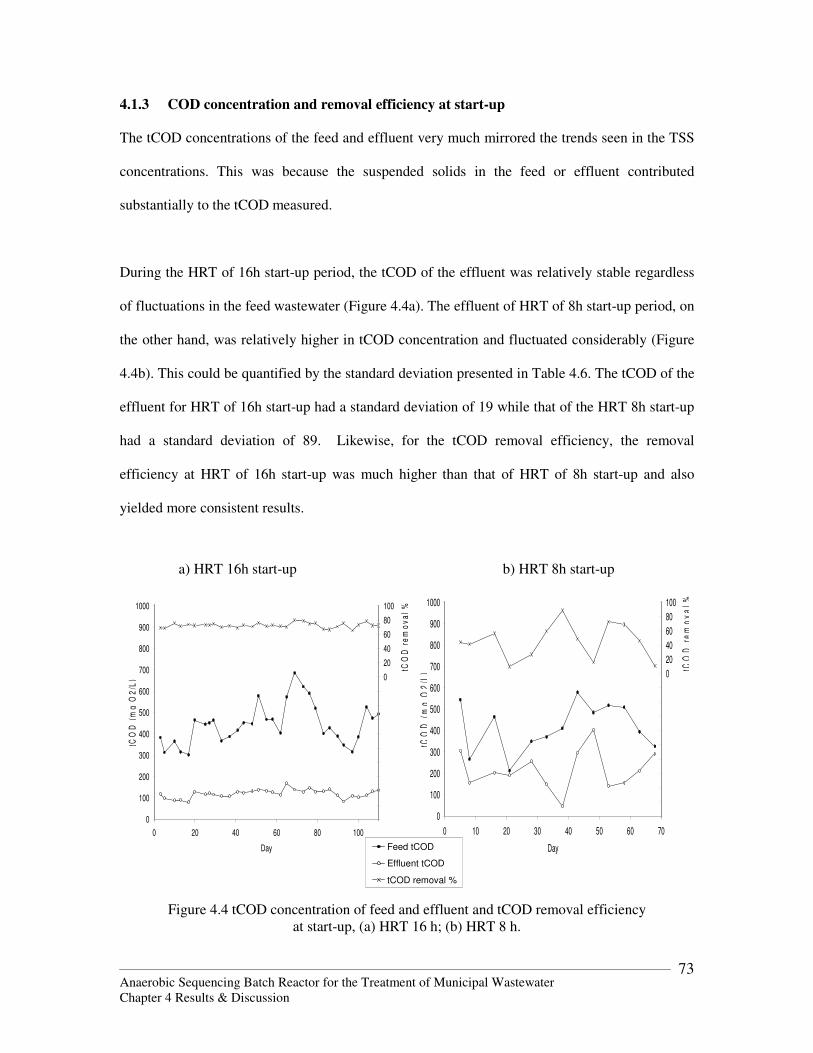
Anaerobic Sequencing Batch Reactor for the Treatment of Municipal Wastewater Chapter 4 Results & Discussion
73
4.1.3 COD concentration and removal efficiency at start-up
The tCOD concentrations of the feed and effluent very much mirrored the trends seen in the TSS
concentrations. This was because the suspended solids in the feed or effluent contributed
substantially to the tCOD measured.
During the HRT of 16h start-up period, the tCOD of the effluent was relatively stable regardless
of fluctuations in the feed wastewater (Figure 4.4a). The effluent of HRT of 8h start-up period, on
the other hand, was relatively higher in tCOD concentration and fluctuated considerably (Figure
4.4b). This could be quantified by the standard deviation presented in Table 4.6. The tCOD of the
effluent for HRT of 16h start-up had a standard deviation of 19 while that of the HRT 8h start-up
had a standard deviation of 89. Likewise, for the tCOD removal efficiency, the removal
efficiency at HRT of 16h start-up was much higher than that of HRT of 8h start-up and also
yielded more consistent results.
a) HRT 16h start-up b) HRT 8h start-up
0
100
200
300
400
500
600
700
800
900
1000
0 20 40 60 80 100
Day
tCO
D (
mg
O2
/L)
-200
-180
-160
-140
-120
-100
-80
-60
-40
-20
0
20
40
60
80
100
tCO
D r
em
ov
al
%
0
100
200
300
400
500
600
700
800
900
1000
0 10 20 30 40 50 60 70
Day
tCO
D (
mg
O2
/L)
-200
-180
-160
-140
-120
-100
-80
-60
-40
-20
0
20
40
60
80
100
tCO
D r
em
ov
al
%
Figure 4.4 tCOD concentration of feed and effluent and tCOD removal efficiency
at start-up, (a) HRT 16 h; (b) HRT 8 h.
Feed tCOD
Effluent tCOD
tCOD removal %
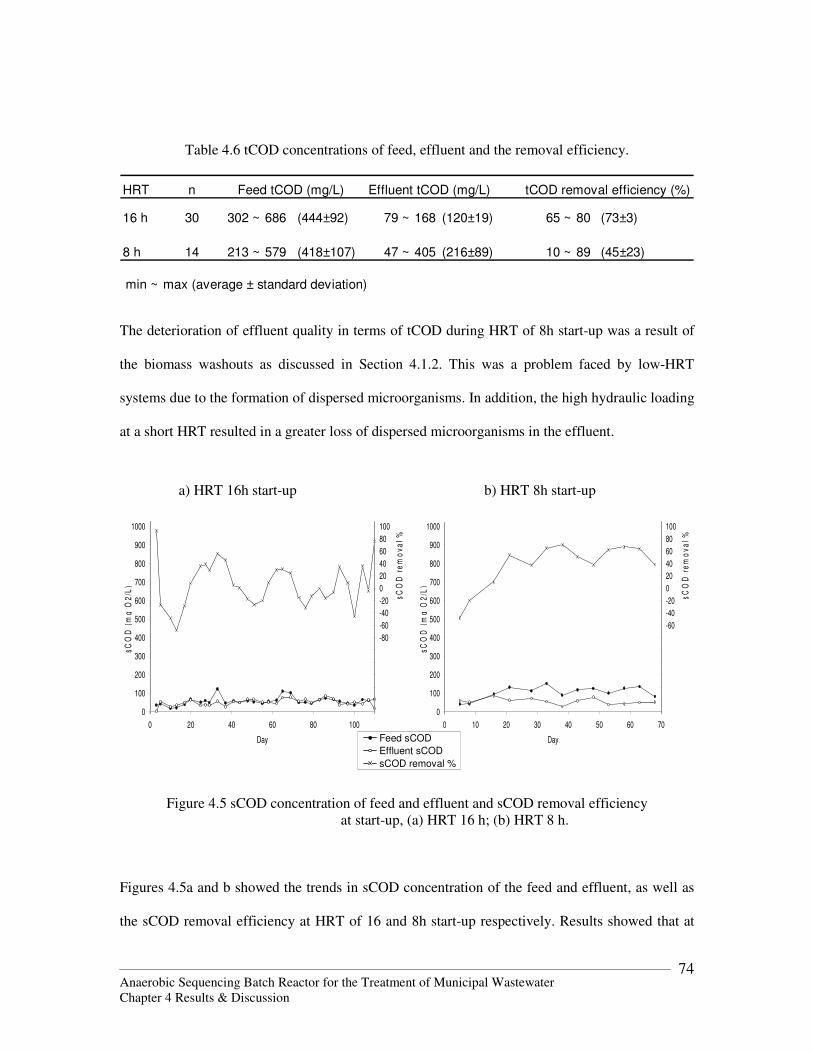
Anaerobic Sequencing Batch Reactor for the Treatment of Municipal Wastewater Chapter 4 Results & Discussion
74
Table 4.6 tCOD concentrations of feed, effluent and the removal efficiency.
HRT n
16 h 30 302 ~ 686 (444±92) 79 ~ 168 (120±19) 65 ~ 80 (73±3)
8 h 14 213 ~ 579 (418±107) 47 ~ 405 (216±89) 10 ~ 89 (45±23)
min ~ max (average ± standard deviation)
Feed tCOD (mg/L) Effluent tCOD (mg/L) tCOD removal efficiency (%)
The deterioration of effluent quality in terms of tCOD during HRT of 8h start-up was a result of
the biomass washouts as discussed in Section 4.1.2. This was a problem faced by low-HRT
systems due to the formation of dispersed microorganisms. In addition, the high hydraulic loading
at a short HRT resulted in a greater loss of dispersed microorganisms in the effluent.
a) HRT 16h start-up b) HRT 8h start-up
0
100
200
300
400
500
600
700
800
900
1000
0 20 40 60 80 100
Day
sC
OD
(m
g O
2/L
)
-200
-180
-160
-140
-120
-100
-80
-60
-40
-20
0
20
40
60
80
100
sC
OD
re
mo
va
l %
0
100
200
300
400
500
600
700
800
900
1000
0 10 20 30 40 50 60 70
Day
sC
OD
(m
g O
2/L
)
-200
-180
-160
-140
-120
-100
-80
-60
-40
-20
0
20
40
60
80
100
sC
OD
re
mo
va
l %
Figure 4.5 sCOD concentration of feed and effluent and sCOD removal efficiency at start-up, (a) HRT 16 h; (b) HRT 8 h.
Figures 4.5a and b showed the trends in sCOD concentration of the feed and effluent, as well as
the sCOD removal efficiency at HRT of 16 and 8h start-up respectively. Results showed that at
Feed sCOD
Effluent sCOD
sCOD removal %
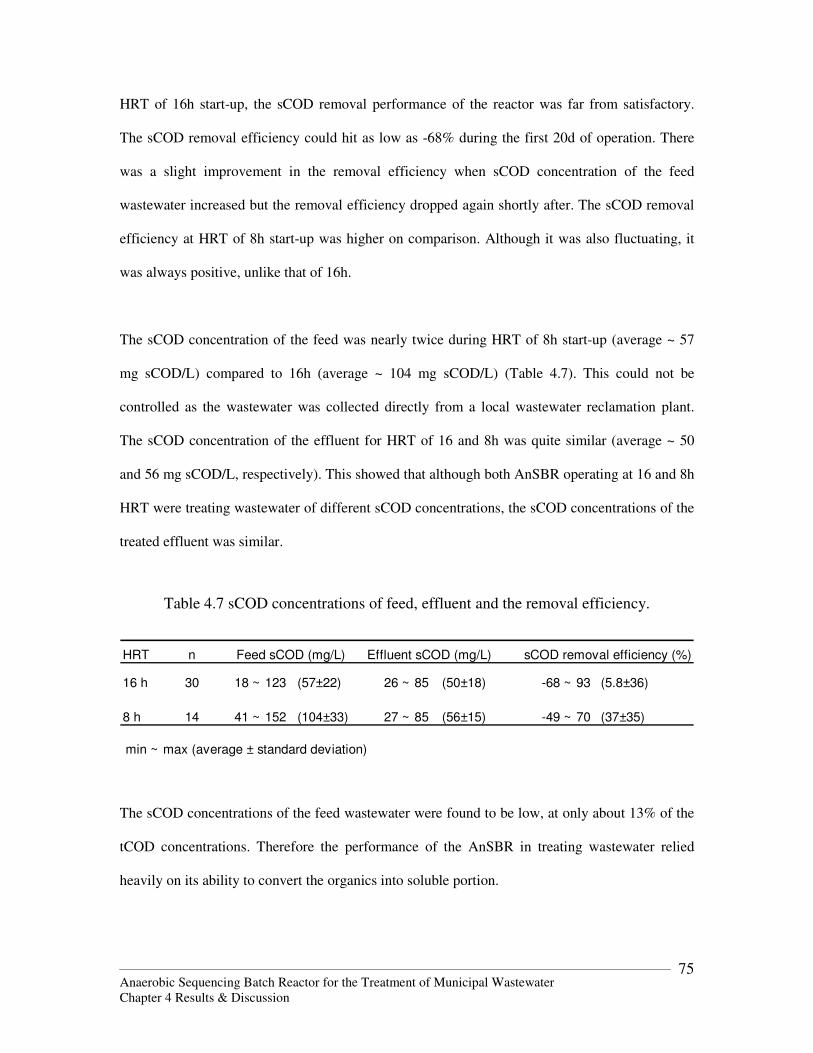
Anaerobic Sequencing Batch Reactor for the Treatment of Municipal Wastewater Chapter 4 Results & Discussion
75
HRT of 16h start-up, the sCOD removal performance of the reactor was far from satisfactory.
The sCOD removal efficiency could hit as low as -68% during the first 20d of operation. There
was a slight improvement in the removal efficiency when sCOD concentration of the feed
wastewater increased but the removal efficiency dropped again shortly after. The sCOD removal
efficiency at HRT of 8h start-up was higher on comparison. Although it was also fluctuating, it
was always positive, unlike that of 16h.
The sCOD concentration of the feed was nearly twice during HRT of 8h start-up (average ~ 57
mg sCOD/L) compared to 16h (average ~ 104 mg sCOD/L) (Table 4.7). This could not be
controlled as the wastewater was collected directly from a local wastewater reclamation plant.
The sCOD concentration of the effluent for HRT of 16 and 8h was quite similar (average ~ 50
and 56 mg sCOD/L, respectively). This showed that although both AnSBR operating at 16 and 8h
HRT were treating wastewater of different sCOD concentrations, the sCOD concentrations of the
treated effluent was similar.
Table 4.7 sCOD concentrations of feed, effluent and the removal efficiency.
HRT n
16 h 30 18 ~ 123 (57±22) 26 ~ 85 (50±18) -68 ~ 93 (5.8±36)
8 h 14 41 ~ 152 (104±33) 27 ~ 85 (56±15) -49 ~ 70 (37±35)
min ~ max (average ± standard deviation)
Feed sCOD (mg/L) Effluent sCOD (mg/L) sCOD removal efficiency (%)
The sCOD concentrations of the feed wastewater were found to be low, at only about 13% of the
tCOD concentrations. Therefore the performance of the AnSBR in treating wastewater relied
heavily on its ability to convert the organics into soluble portion.
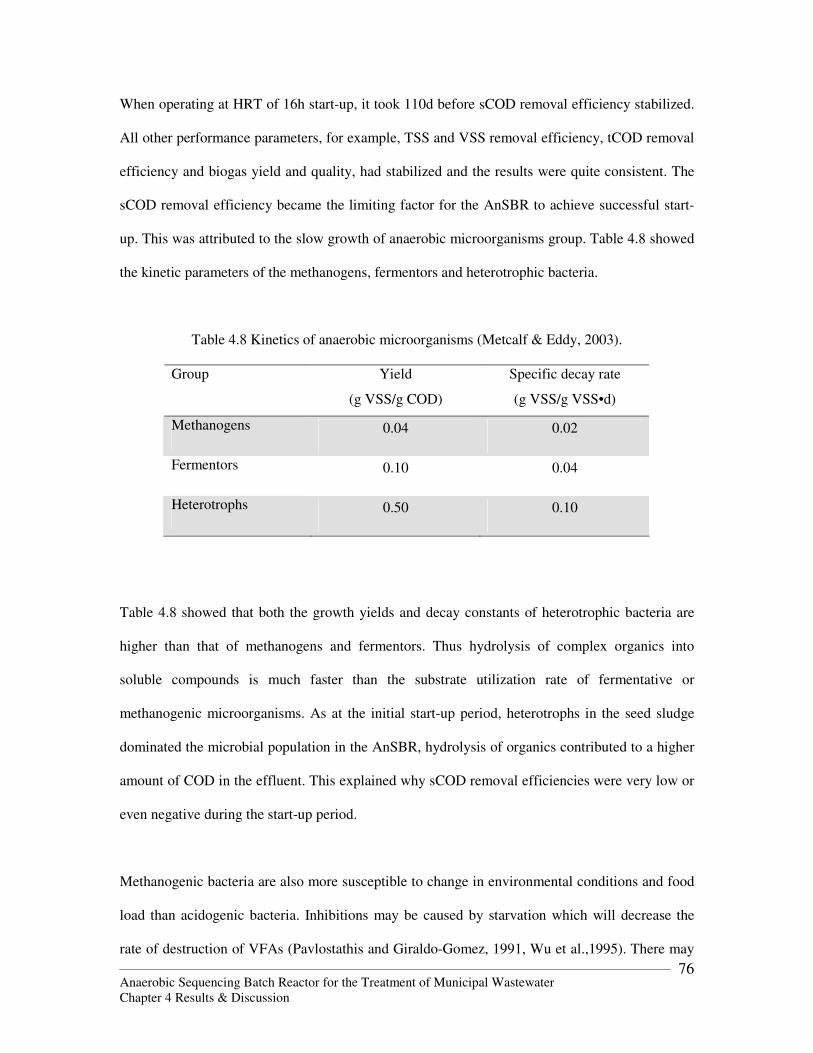
Anaerobic Sequencing Batch Reactor for the Treatment of Municipal Wastewater Chapter 4 Results & Discussion
76
When operating at HRT of 16h start-up, it took 110d before sCOD removal efficiency stabilized.
All other performance parameters, for example, TSS and VSS removal efficiency, tCOD removal
efficiency and biogas yield and quality, had stabilized and the results were quite consistent. The
sCOD removal efficiency became the limiting factor for the AnSBR to achieve successful start-
up. This was attributed to the slow growth of anaerobic microorganisms group. Table 4.8 showed
the kinetic parameters of the methanogens, fermentors and heterotrophic bacteria.
Table 4.8 Kinetics of anaerobic microorganisms (Metcalf & Eddy, 2003).
Group Yield
(g VSS/g COD)
Specific decay rate
(g VSS/g VSS•d)
Methanogens 0.04 0.02
Fermentors 0.10 0.04
Heterotrophs 0.50 0.10
Table 4.8 showed that both the growth yields and decay constants of heterotrophic bacteria are
higher than that of methanogens and fermentors. Thus hydrolysis of complex organics into
soluble compounds is much faster than the substrate utilization rate of fermentative or
methanogenic microorganisms. As at the initial start-up period, heterotrophs in the seed sludge
dominated the microbial population in the AnSBR, hydrolysis of organics contributed to a higher
amount of COD in the effluent. This explained why sCOD removal efficiencies were very low or
even negative during the start-up period.
Methanogenic bacteria are also more susceptible to change in environmental conditions and food
load than acidogenic bacteria. Inhibitions may be caused by starvation which will decrease the
rate of destruction of VFAs (Pavlostathis and Giraldo-Gomez, 1991, Wu et al.,1995). There may
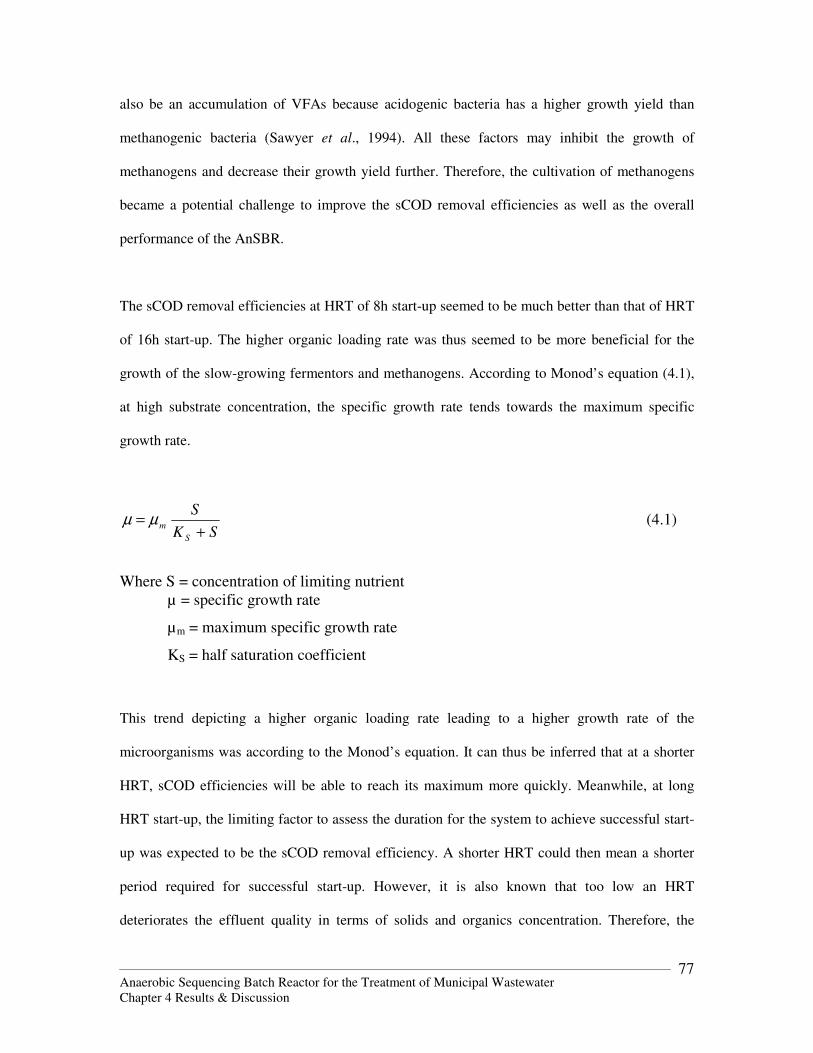
Anaerobic Sequencing Batch Reactor for the Treatment of Municipal Wastewater Chapter 4 Results & Discussion
77
also be an accumulation of VFAs because acidogenic bacteria has a higher growth yield than
methanogenic bacteria (Sawyer et al., 1994). All these factors may inhibit the growth of
methanogens and decrease their growth yield further. Therefore, the cultivation of methanogens
became a potential challenge to improve the sCOD removal efficiencies as well as the overall
performance of the AnSBR.
The sCOD removal efficiencies at HRT of 8h start-up seemed to be much better than that of HRT
of 16h start-up. The higher organic loading rate was thus seemed to be more beneficial for the
growth of the slow-growing fermentors and methanogens. According to Monod’s equation (4.1),
at high substrate concentration, the specific growth rate tends towards the maximum specific
growth rate.
SK
S
S
m+
= µµ (4.1)
Where S = concentration of limiting nutrient µ = specific growth rate
µm = maximum specific growth rate
KS = half saturation coefficient
This trend depicting a higher organic loading rate leading to a higher growth rate of the
microorganisms was according to the Monod’s equation. It can thus be inferred that at a shorter
HRT, sCOD efficiencies will be able to reach its maximum more quickly. Meanwhile, at long
HRT start-up, the limiting factor to assess the duration for the system to achieve successful start-
up was expected to be the sCOD removal efficiency. A shorter HRT could then mean a shorter
period required for successful start-up. However, it is also known that too low an HRT
deteriorates the effluent quality in terms of solids and organics concentration. Therefore, the
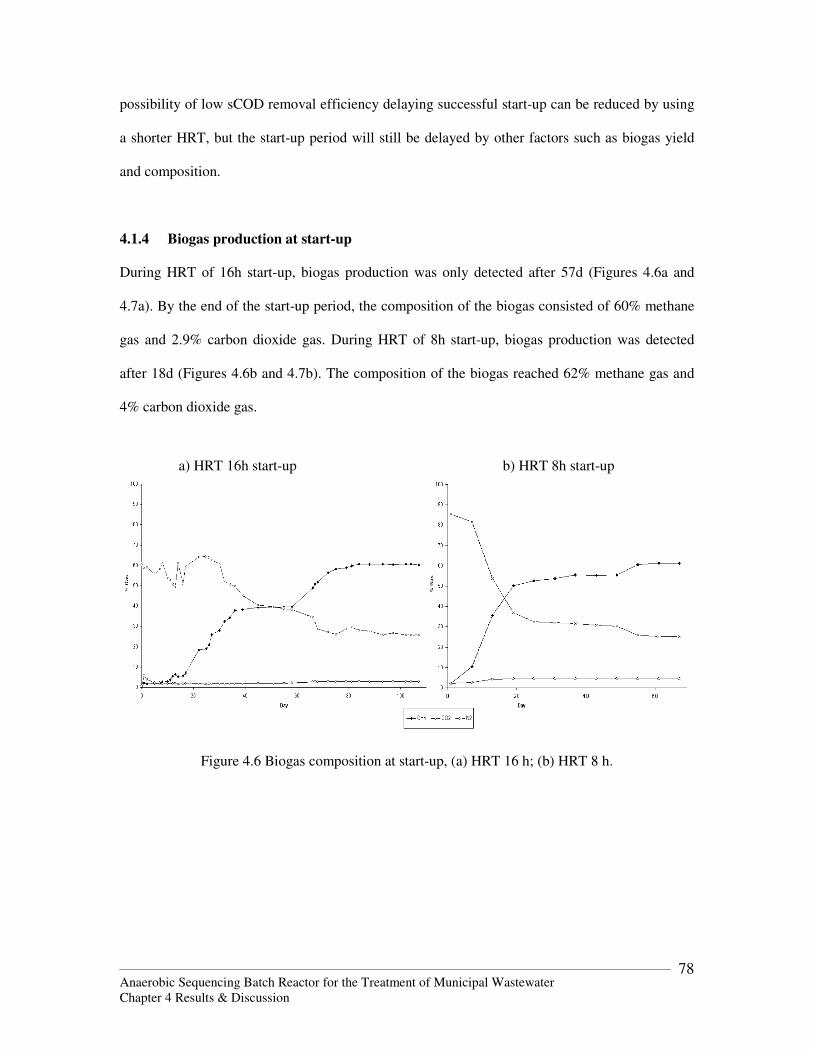
Anaerobic Sequencing Batch Reactor for the Treatment of Municipal Wastewater Chapter 4 Results & Discussion
78
possibility of low sCOD removal efficiency delaying successful start-up can be reduced by using
a shorter HRT, but the start-up period will still be delayed by other factors such as biogas yield
and composition.
4.1.4 Biogas production at start-up
During HRT of 16h start-up, biogas production was only detected after 57d (Figures 4.6a and
4.7a). By the end of the start-up period, the composition of the biogas consisted of 60% methane
gas and 2.9% carbon dioxide gas. During HRT of 8h start-up, biogas production was detected
after 18d (Figures 4.6b and 4.7b). The composition of the biogas reached 62% methane gas and
4% carbon dioxide gas.
a) HRT 16h start-up b) HRT 8h start-up
Figure 4.6 Biogas composition at start-up, (a) HRT 16 h; (b) HRT 8 h.
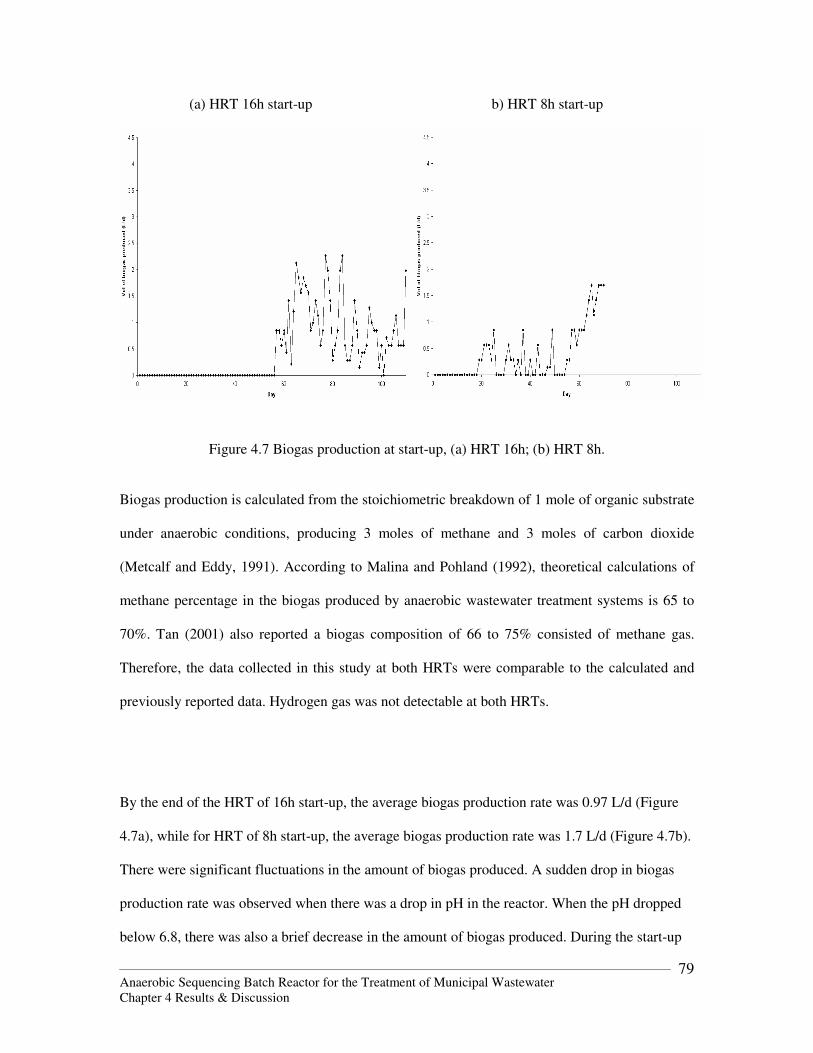
Anaerobic Sequencing Batch Reactor for the Treatment of Municipal Wastewater Chapter 4 Results & Discussion
79
(a) HRT 16h start-up b) HRT 8h start-up
Figure 4.7 Biogas production at start-up, (a) HRT 16h; (b) HRT 8h. Biogas production is calculated from the stoichiometric breakdown of 1 mole of organic substrate
under anaerobic conditions, producing 3 moles of methane and 3 moles of carbon dioxide
(Metcalf and Eddy, 1991). According to Malina and Pohland (1992), theoretical calculations of
methane percentage in the biogas produced by anaerobic wastewater treatment systems is 65 to
70%. Tan (2001) also reported a biogas composition of 66 to 75% consisted of methane gas.
Therefore, the data collected in this study at both HRTs were comparable to the calculated and
previously reported data. Hydrogen gas was not detectable at both HRTs.
By the end of the HRT of 16h start-up, the average biogas production rate was 0.97 L/d (Figure
4.7a), while for HRT of 8h start-up, the average biogas production rate was 1.7 L/d (Figure 4.7b).
There were significant fluctuations in the amount of biogas produced. A sudden drop in biogas
production rate was observed when there was a drop in pH in the reactor. When the pH dropped
below 6.8, there was also a brief decrease in the amount of biogas produced. During the start-up
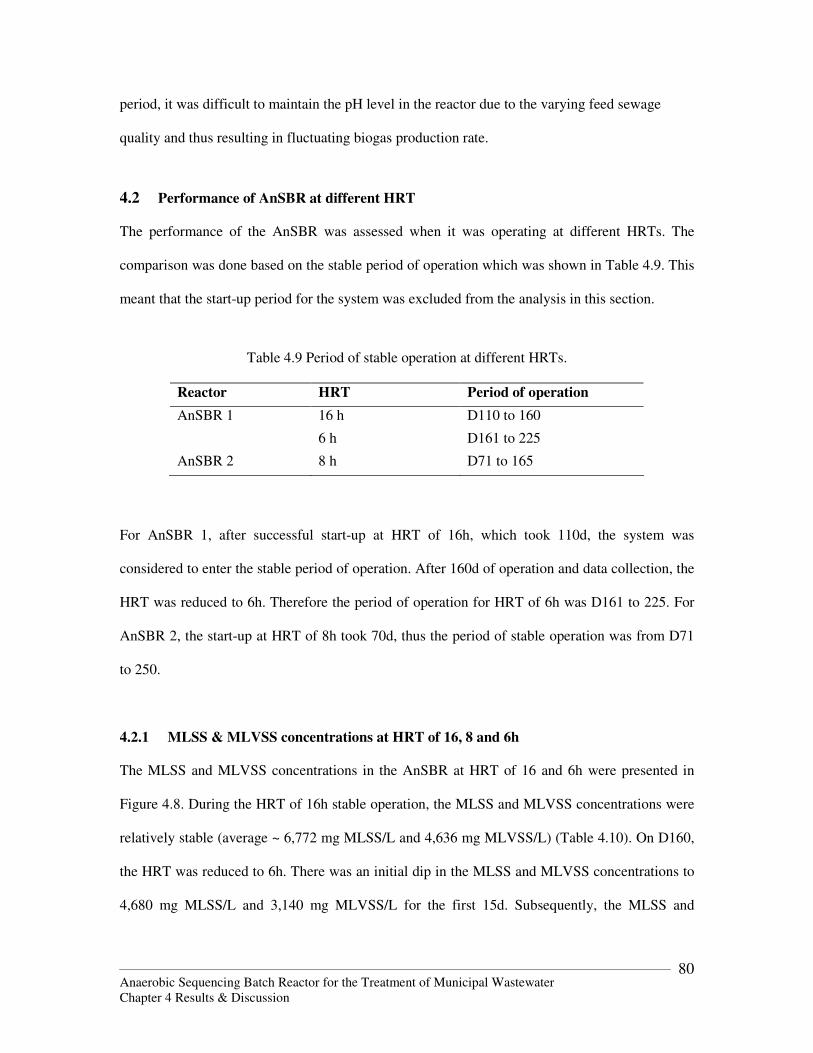
Anaerobic Sequencing Batch Reactor for the Treatment of Municipal Wastewater Chapter 4 Results & Discussion
80
period, it was difficult to maintain the pH level in the reactor due to the varying feed sewage
quality and thus resulting in fluctuating biogas production rate.
4.2 Performance of AnSBR at different HRT
The performance of the AnSBR was assessed when it was operating at different HRTs. The
comparison was done based on the stable period of operation which was shown in Table 4.9. This
meant that the start-up period for the system was excluded from the analysis in this section.
Table 4.9 Period of stable operation at different HRTs.
Reactor HRT Period of operation
AnSBR 1 16 h D110 to 160
6 h D161 to 225
AnSBR 2 8 h D71 to 165
For AnSBR 1, after successful start-up at HRT of 16h, which took 110d, the system was
considered to enter the stable period of operation. After 160d of operation and data collection, the
HRT was reduced to 6h. Therefore the period of operation for HRT of 6h was D161 to 225. For
AnSBR 2, the start-up at HRT of 8h took 70d, thus the period of stable operation was from D71
to 250.
4.2.1 MLSS & MLVSS concentrations at HRT of 16, 8 and 6h
The MLSS and MLVSS concentrations in the AnSBR at HRT of 16 and 6h were presented in
Figure 4.8. During the HRT of 16h stable operation, the MLSS and MLVSS concentrations were
relatively stable (average ~ 6,772 mg MLSS/L and 4,636 mg MLVSS/L) (Table 4.10). On D160,
the HRT was reduced to 6h. There was an initial dip in the MLSS and MLVSS concentrations to
4,680 mg MLSS/L and 3,140 mg MLVSS/L for the first 15d. Subsequently, the MLSS and
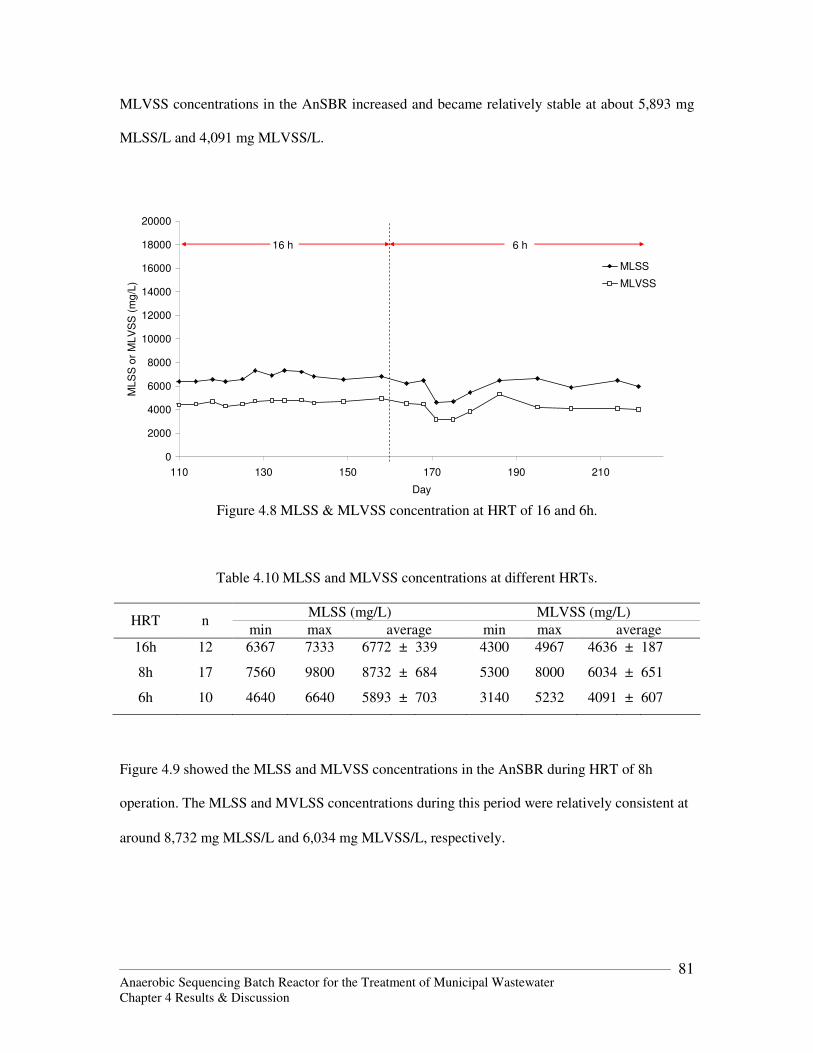
Anaerobic Sequencing Batch Reactor for the Treatment of Municipal Wastewater Chapter 4 Results & Discussion
81
MLVSS concentrations in the AnSBR increased and became relatively stable at about 5,893 mg
MLSS/L and 4,091 mg MLVSS/L.
0
2000
4000
6000
8000
10000
12000
14000
16000
18000
20000
110 130 150 170 190 210
Day
MLS
S o
r M
LV
SS
(m
g/L
)
MLSS
MLVSS
.
16 h 6 h
Figure 4.8 MLSS & MLVSS concentration at HRT of 16 and 6h.
Table 4.10 MLSS and MLVSS concentrations at different HRTs.
MLSS (mg/L) MLVSS (mg/L) HRT n
min max average min max average 16h 12 6367 7333 6772 ± 339 4300 4967 4636 ± 187
8h 17 7560 9800 8732 ± 684 5300 8000 6034 ± 651
6h 10 4640 6640 5893 ± 703 3140 5232 4091 ± 607
Figure 4.9 showed the MLSS and MLVSS concentrations in the AnSBR during HRT of 8h
operation. The MLSS and MVLSS concentrations during this period were relatively consistent at
around 8,732 mg MLSS/L and 6,034 mg MLVSS/L, respectively.
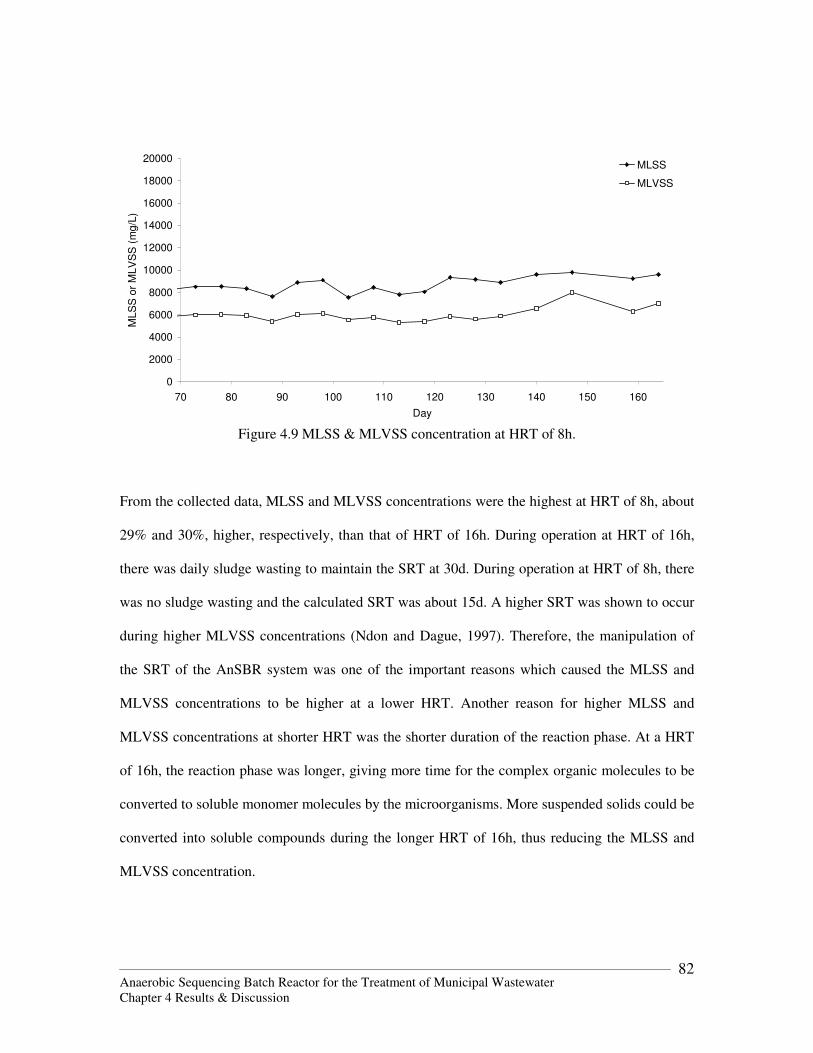
Anaerobic Sequencing Batch Reactor for the Treatment of Municipal Wastewater Chapter 4 Results & Discussion
82
0
2000
4000
6000
8000
10000
12000
14000
16000
18000
20000
70 80 90 100 110 120 130 140 150 160
Day
MLS
S o
r M
LV
SS
(m
g/L
)
MLSS
MLVSS
.
Figure 4.9 MLSS & MLVSS concentration at HRT of 8h.
From the collected data, MLSS and MLVSS concentrations were the highest at HRT of 8h, about
29% and 30%, higher, respectively, than that of HRT of 16h. During operation at HRT of 16h,
there was daily sludge wasting to maintain the SRT at 30d. During operation at HRT of 8h, there
was no sludge wasting and the calculated SRT was about 15d. A higher SRT was shown to occur
during higher MLVSS concentrations (Ndon and Dague, 1997). Therefore, the manipulation of
the SRT of the AnSBR system was one of the important reasons which caused the MLSS and
MLVSS concentrations to be higher at a lower HRT. Another reason for higher MLSS and
MLVSS concentrations at shorter HRT was the shorter duration of the reaction phase. At a HRT
of 16h, the reaction phase was longer, giving more time for the complex organic molecules to be
converted to soluble monomer molecules by the microorganisms. More suspended solids could be
converted into soluble compounds during the longer HRT of 16h, thus reducing the MLSS and
MLVSS concentration.
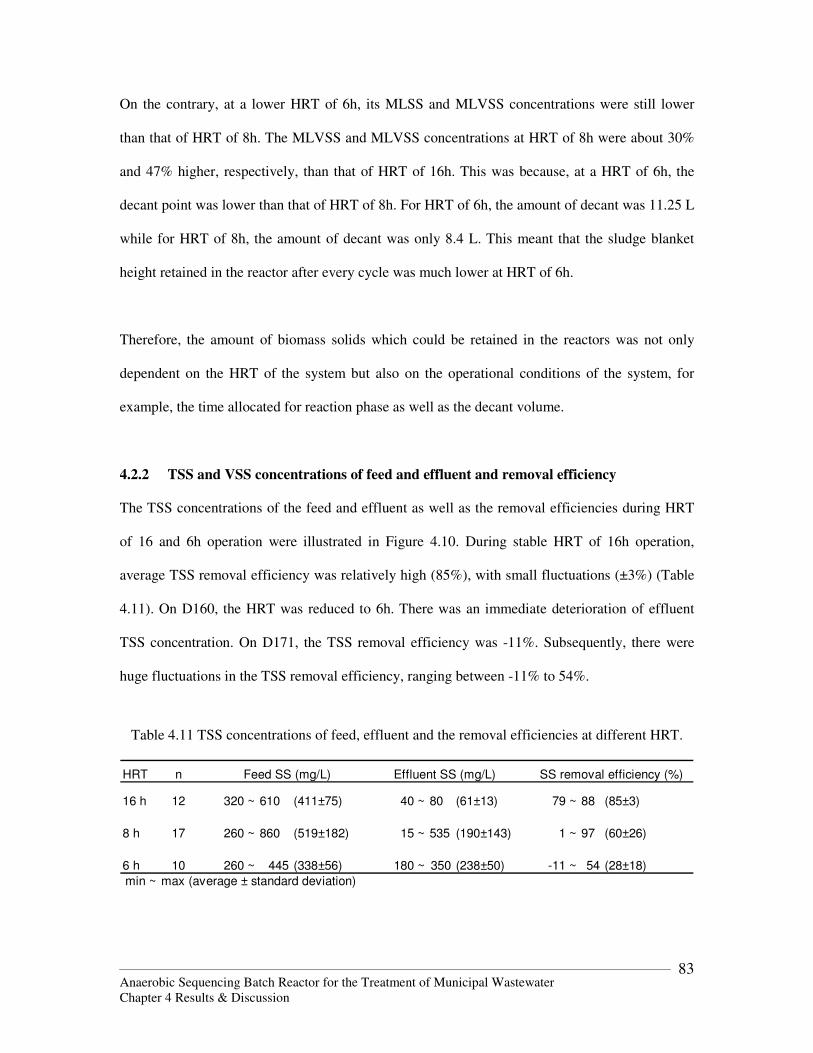
Anaerobic Sequencing Batch Reactor for the Treatment of Municipal Wastewater Chapter 4 Results & Discussion
83
On the contrary, at a lower HRT of 6h, its MLSS and MLVSS concentrations were still lower
than that of HRT of 8h. The MLVSS and MLVSS concentrations at HRT of 8h were about 30%
and 47% higher, respectively, than that of HRT of 16h. This was because, at a HRT of 6h, the
decant point was lower than that of HRT of 8h. For HRT of 6h, the amount of decant was 11.25 L
while for HRT of 8h, the amount of decant was only 8.4 L. This meant that the sludge blanket
height retained in the reactor after every cycle was much lower at HRT of 6h.
Therefore, the amount of biomass solids which could be retained in the reactors was not only
dependent on the HRT of the system but also on the operational conditions of the system, for
example, the time allocated for reaction phase as well as the decant volume.
4.2.2 TSS and VSS concentrations of feed and effluent and removal efficiency
The TSS concentrations of the feed and effluent as well as the removal efficiencies during HRT
of 16 and 6h operation were illustrated in Figure 4.10. During stable HRT of 16h operation,
average TSS removal efficiency was relatively high (85%), with small fluctuations (±3%) (Table
4.11). On D160, the HRT was reduced to 6h. There was an immediate deterioration of effluent
TSS concentration. On D171, the TSS removal efficiency was -11%. Subsequently, there were
huge fluctuations in the TSS removal efficiency, ranging between -11% to 54%.
Table 4.11 TSS concentrations of feed, effluent and the removal efficiencies at different HRT.
HRT n
16 h 12 320 ~ 610 (411±75) 40 ~ 80 (61±13) 79 ~ 88 (85±3)
8 h 17 260 ~ 860 (519±182) 15 ~ 535 (190±143) 1 ~ 97 (60±26)
6 h 10 260 ~ 445 (338±56) 180 ~ 350 (238±50) -11 ~ 54 (28±18)
min ~ max (average ± standard deviation)
Feed SS (mg/L) Effluent SS (mg/L) SS removal efficiency (%)
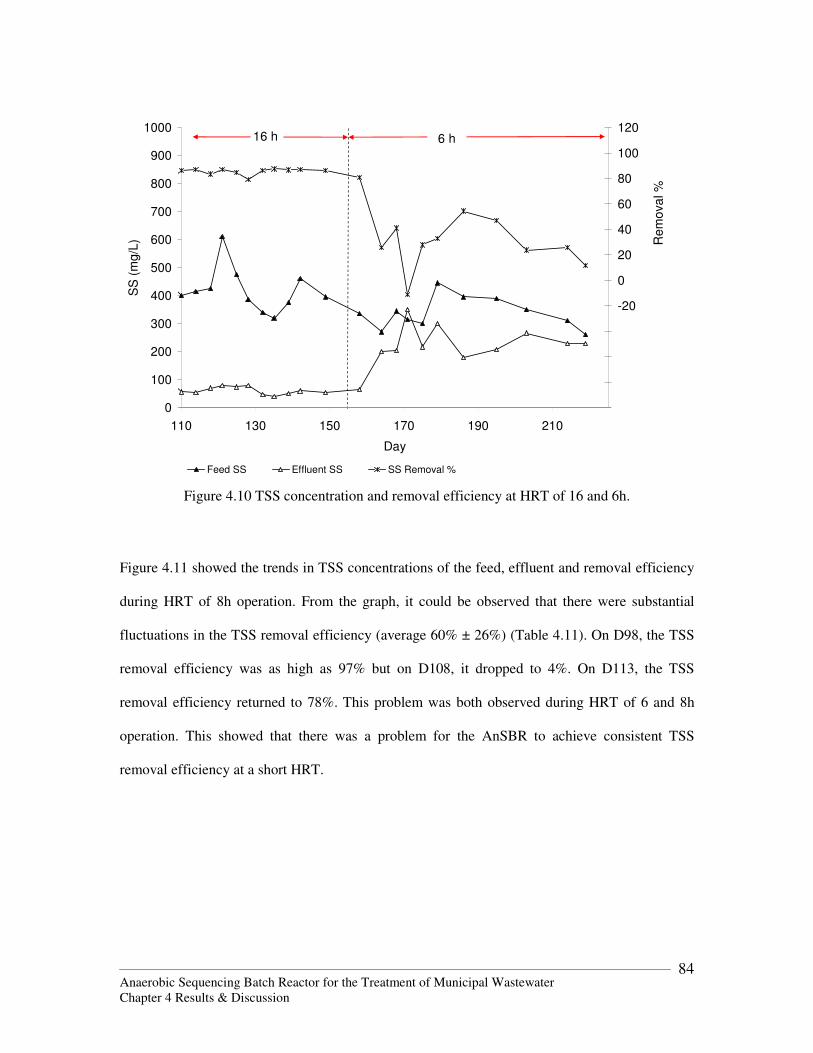
Anaerobic Sequencing Batch Reactor for the Treatment of Municipal Wastewater Chapter 4 Results & Discussion
84
0
100
200
300
400
500
600
700
800
900
1000
110 130 150 170 190 210
Day
SS
(m
g/L
)
-100
-80
-60
-40
-20
0
20
40
60
80
100
120
Re
mo
va
l %
Feed SS Effluent SS SS Removal %
16 h 6 h
Figure 4.10 TSS concentration and removal efficiency at HRT of 16 and 6h. Figure 4.11 showed the trends in TSS concentrations of the feed, effluent and removal efficiency
during HRT of 8h operation. From the graph, it could be observed that there were substantial
fluctuations in the TSS removal efficiency (average 60% ± 26%) (Table 4.11). On D98, the TSS
removal efficiency was as high as 97% but on D108, it dropped to 4%. On D113, the TSS
removal efficiency returned to 78%. This problem was both observed during HRT of 6 and 8h
operation. This showed that there was a problem for the AnSBR to achieve consistent TSS
removal efficiency at a short HRT.
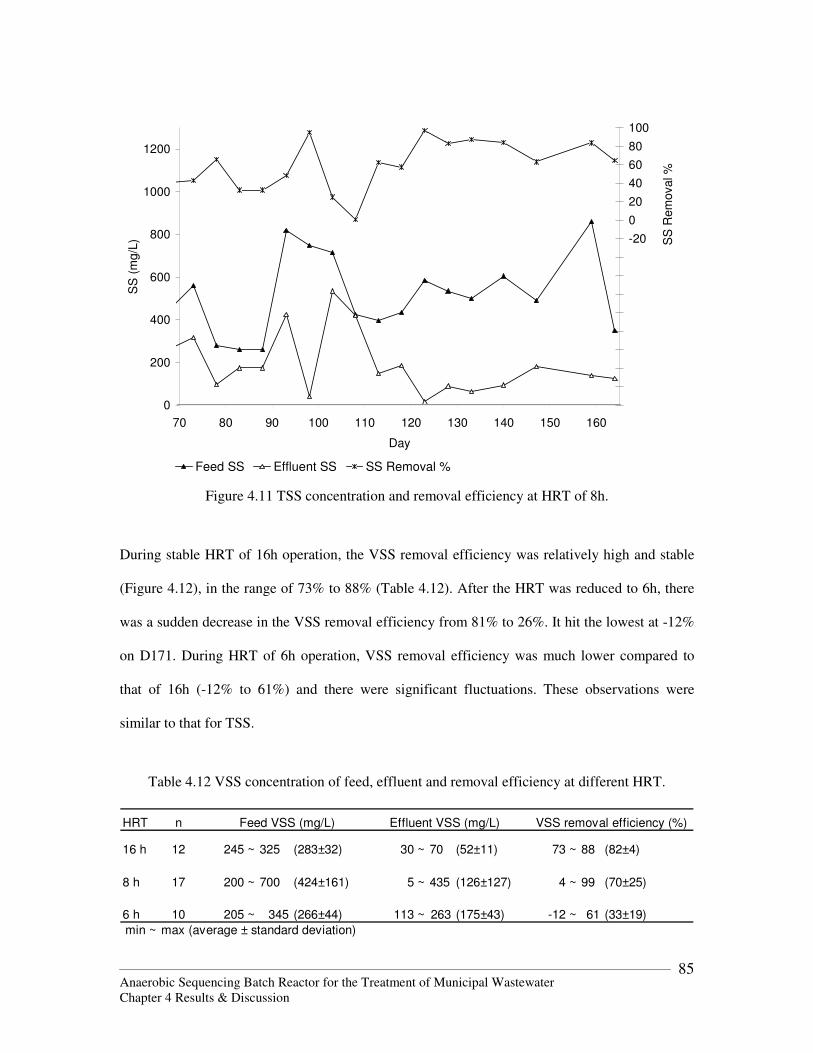
Anaerobic Sequencing Batch Reactor for the Treatment of Municipal Wastewater Chapter 4 Results & Discussion
85
0
200
400
600
800
1000
1200
70 80 90 100 110 120 130 140 150 160
Day
SS
(m
g/L
)
-200
-180
-160
-140
-120
-100
-80
-60
-40
-20
0
20
40
60
80
100
SS
Rem
oval %
Feed SS Effluent SS SS Removal %
Figure 4.11 TSS concentration and removal efficiency at HRT of 8h.
During stable HRT of 16h operation, the VSS removal efficiency was relatively high and stable
(Figure 4.12), in the range of 73% to 88% (Table 4.12). After the HRT was reduced to 6h, there
was a sudden decrease in the VSS removal efficiency from 81% to 26%. It hit the lowest at -12%
on D171. During HRT of 6h operation, VSS removal efficiency was much lower compared to
that of 16h (-12% to 61%) and there were significant fluctuations. These observations were
similar to that for TSS.
Table 4.12 VSS concentration of feed, effluent and removal efficiency at different HRT.
HRT n
16 h 12 245 ~ 325 (283±32) 30 ~ 70 (52±11) 73 ~ 88 (82±4)
8 h 17 200 ~ 700 (424±161) 5 ~ 435 (126±127) 4 ~ 99 (70±25)
6 h 10 205 ~ 345 (266±44) 113 ~ 263 (175±43) -12 ~ 61 (33±19)
min ~ max (average ± standard deviation)
Feed VSS (mg/L) Effluent VSS (mg/L) VSS removal efficiency (%)
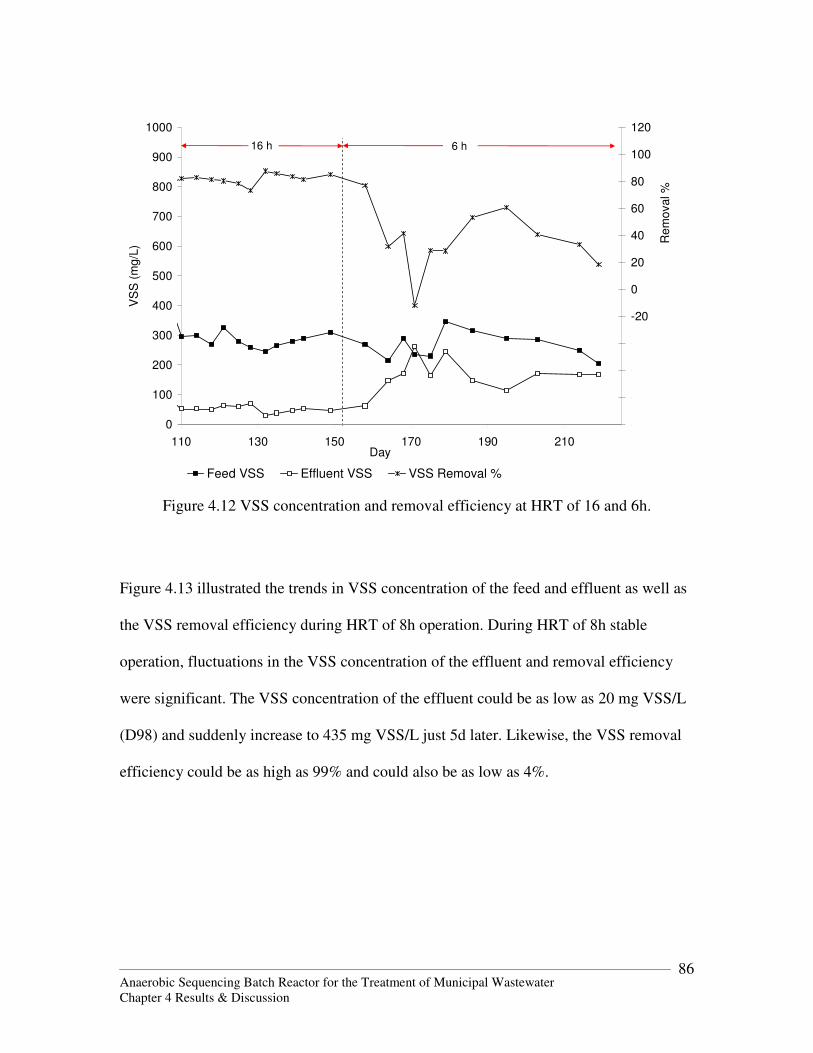
Anaerobic Sequencing Batch Reactor for the Treatment of Municipal Wastewater Chapter 4 Results & Discussion
86
0
100
200
300
400
500
600
700
800
900
1000
110 130 150 170 190 210Day
VS
S (
mg
/L)
-100
-80
-60
-40
-20
0
20
40
60
80
100
120
Re
mo
val %
Feed VSS Effluent VSS VSS Removal %
16 h 6 h
Figure 4.12 VSS concentration and removal efficiency at HRT of 16 and 6h.
Figure 4.13 illustrated the trends in VSS concentration of the feed and effluent as well as
the VSS removal efficiency during HRT of 8h operation. During HRT of 8h stable
operation, fluctuations in the VSS concentration of the effluent and removal efficiency
were significant. The VSS concentration of the effluent could be as low as 20 mg VSS/L
(D98) and suddenly increase to 435 mg VSS/L just 5d later. Likewise, the VSS removal
efficiency could be as high as 99% and could also be as low as 4%.
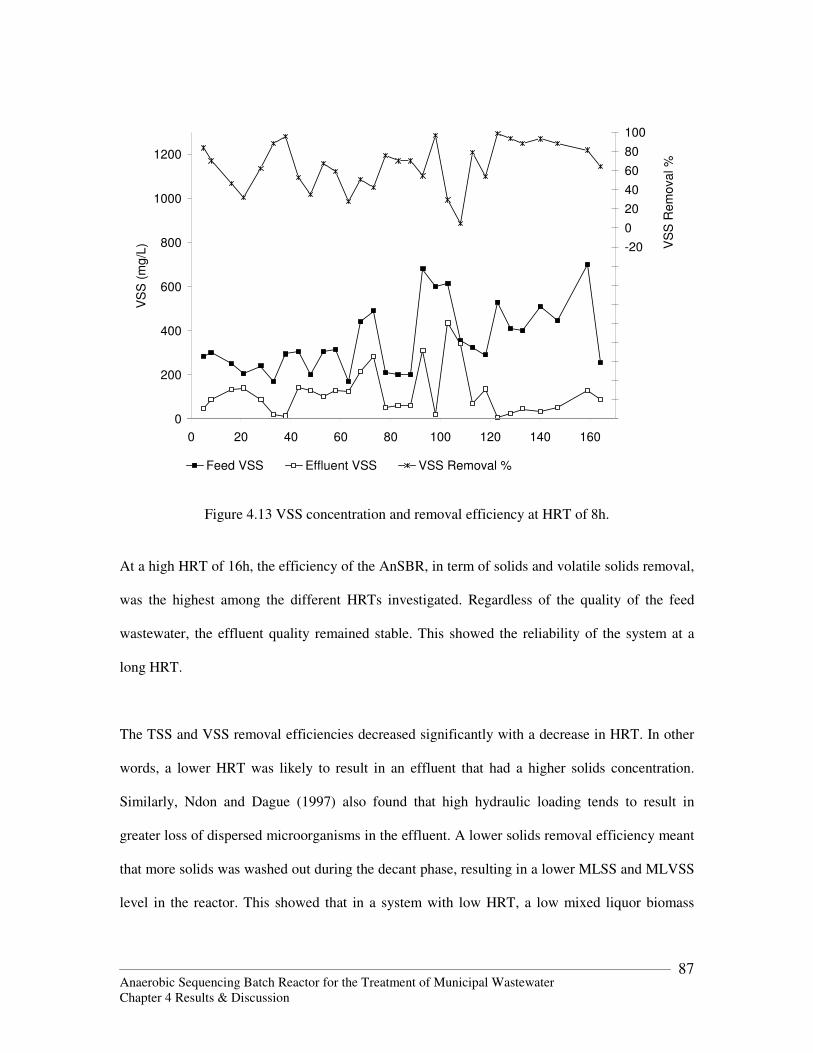
Anaerobic Sequencing Batch Reactor for the Treatment of Municipal Wastewater Chapter 4 Results & Discussion
87
0
200
400
600
800
1000
1200
0 20 40 60 80 100 120 140 160
Day
VS
S (
mg
/L)
-200
-180
-160
-140
-120
-100
-80
-60
-40
-20
0
20
40
60
80
100
VS
S R
em
ova
l %
Feed VSS Effluent VSS VSS Removal %
Figure 4.13 VSS concentration and removal efficiency at HRT of 8h.
At a high HRT of 16h, the efficiency of the AnSBR, in term of solids and volatile solids removal,
was the highest among the different HRTs investigated. Regardless of the quality of the feed
wastewater, the effluent quality remained stable. This showed the reliability of the system at a
long HRT.
The TSS and VSS removal efficiencies decreased significantly with a decrease in HRT. In other
words, a lower HRT was likely to result in an effluent that had a higher solids concentration.
Similarly, Ndon and Dague (1997) also found that high hydraulic loading tends to result in
greater loss of dispersed microorganisms in the effluent. A lower solids removal efficiency meant
that more solids was washed out during the decant phase, resulting in a lower MLSS and MLVSS
level in the reactor. This showed that in a system with low HRT, a low mixed liquor biomass
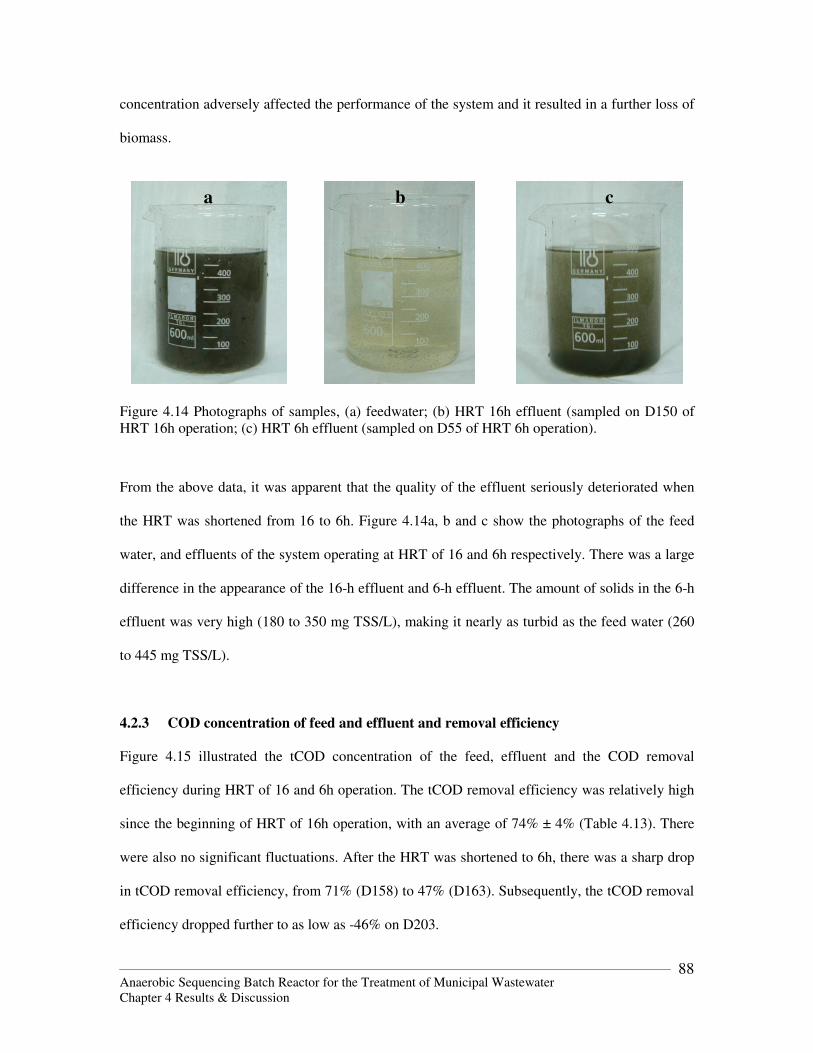
Anaerobic Sequencing Batch Reactor for the Treatment of Municipal Wastewater Chapter 4 Results & Discussion
88
concentration adversely affected the performance of the system and it resulted in a further loss of
biomass.
Figure 4.14 Photographs of samples, (a) feedwater; (b) HRT 16h effluent (sampled on D150 of HRT 16h operation; (c) HRT 6h effluent (sampled on D55 of HRT 6h operation).
From the above data, it was apparent that the quality of the effluent seriously deteriorated when
the HRT was shortened from 16 to 6h. Figure 4.14a, b and c show the photographs of the feed
water, and effluents of the system operating at HRT of 16 and 6h respectively. There was a large
difference in the appearance of the 16-h effluent and 6-h effluent. The amount of solids in the 6-h
effluent was very high (180 to 350 mg TSS/L), making it nearly as turbid as the feed water (260
to 445 mg TSS/L).
4.2.3 COD concentration of feed and effluent and removal efficiency
Figure 4.15 illustrated the tCOD concentration of the feed, effluent and the COD removal
efficiency during HRT of 16 and 6h operation. The tCOD removal efficiency was relatively high
since the beginning of HRT of 16h operation, with an average of 74% ± 4% (Table 4.13). There
were also no significant fluctuations. After the HRT was shortened to 6h, there was a sharp drop
in tCOD removal efficiency, from 71% (D158) to 47% (D163). Subsequently, the tCOD removal
efficiency dropped further to as low as -46% on D203.
a b c
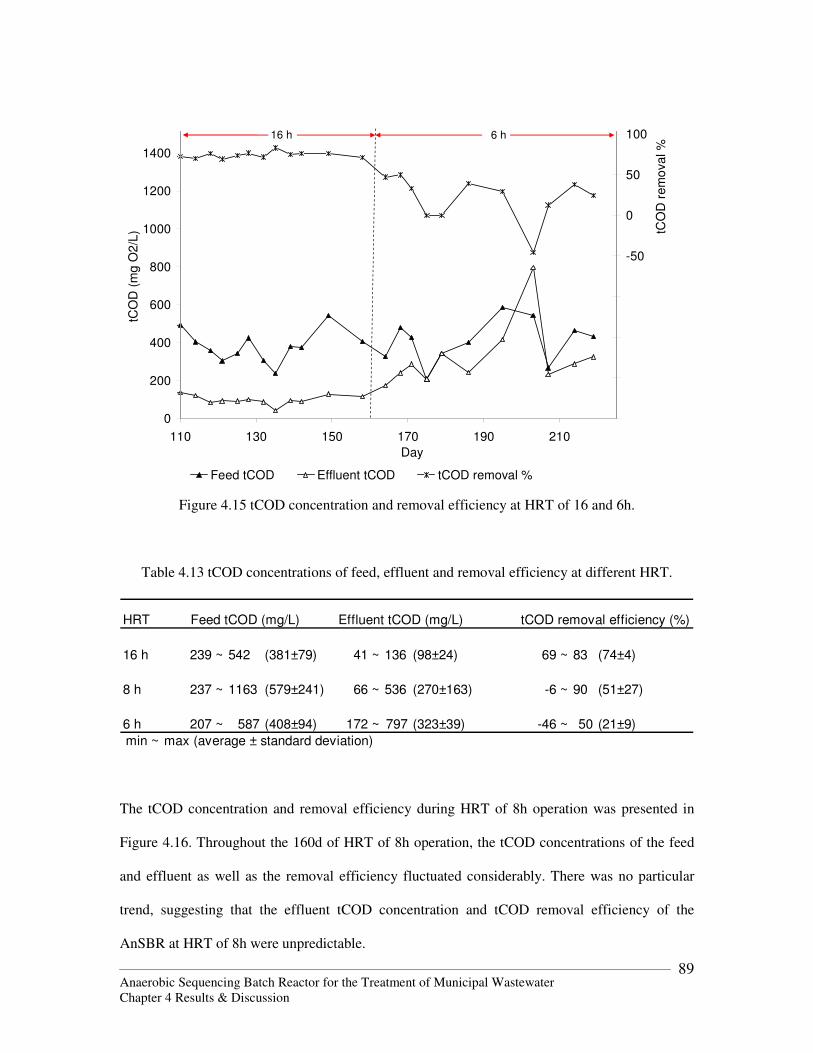
Anaerobic Sequencing Batch Reactor for the Treatment of Municipal Wastewater Chapter 4 Results & Discussion
89
0
200
400
600
800
1000
1200
1400
110 130 150 170 190 210
Day
tCO
D (
mg
O2
/L)
-250
-200
-150
-100
-50
0
50
100
tCO
D r
em
ova
l %
Feed tCOD Effluent tCOD tCOD removal %
16 h 6 h
Figure 4.15 tCOD concentration and removal efficiency at HRT of 16 and 6h.
Table 4.13 tCOD concentrations of feed, effluent and removal efficiency at different HRT.
HRT
16 h 239 ~ 542 (381±79) 41 ~ 136 (98±24) 69 ~ 83 (74±4)
8 h 237 ~ 1163 (579±241) 66 ~ 536 (270±163) -6 ~ 90 (51±27)
6 h 207 ~ 587 (408±94) 172 ~ 797 (323±39) -46 ~ 50 (21±9)
min ~ max (average ± standard deviation)
Feed tCOD (mg/L) Effluent tCOD (mg/L) tCOD removal efficiency (%)
The tCOD concentration and removal efficiency during HRT of 8h operation was presented in
Figure 4.16. Throughout the 160d of HRT of 8h operation, the tCOD concentrations of the feed
and effluent as well as the removal efficiency fluctuated considerably. There was no particular
trend, suggesting that the effluent tCOD concentration and tCOD removal efficiency of the
AnSBR at HRT of 8h were unpredictable.
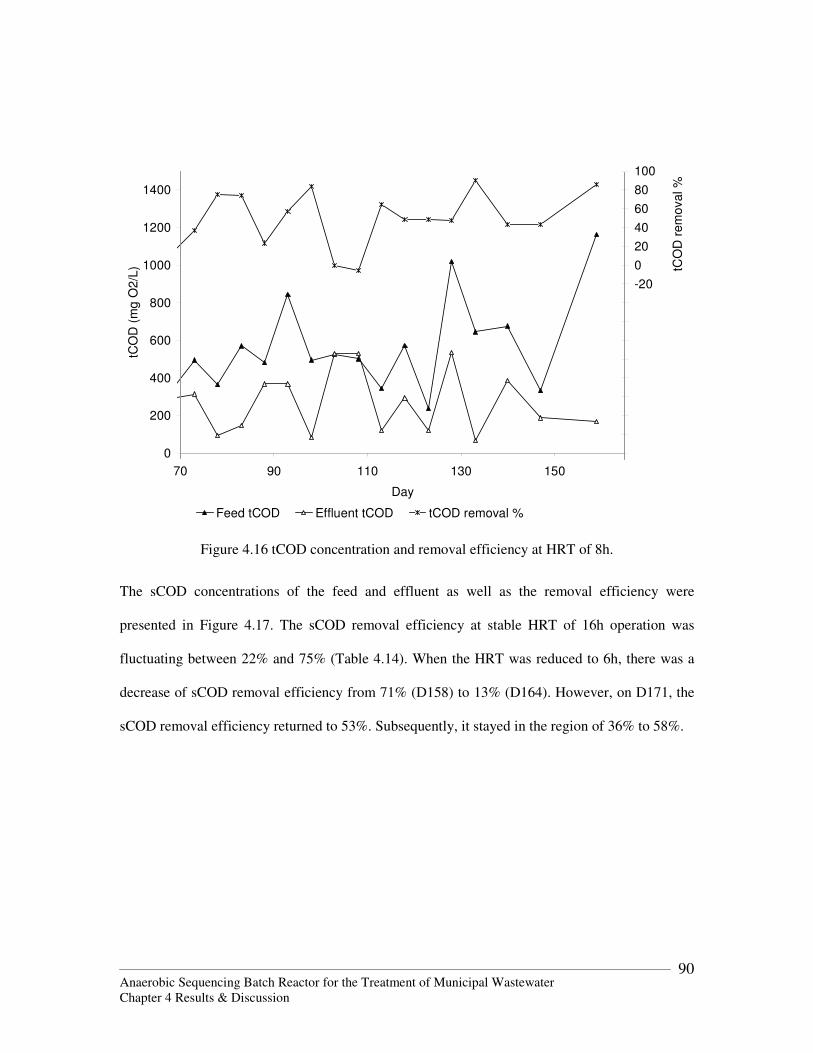
Anaerobic Sequencing Batch Reactor for the Treatment of Municipal Wastewater Chapter 4 Results & Discussion
90
0
200
400
600
800
1000
1200
1400
70 90 110 130 150
Day
tCO
D (
mg
O2
/L)
-200
-180
-160
-140
-120
-100
-80
-60
-40
-20
0
20
40
60
80
100
tCO
D r
em
ova
l %
Feed tCOD Effluent tCOD tCOD removal %
Figure 4.16 tCOD concentration and removal efficiency at HRT of 8h.
The sCOD concentrations of the feed and effluent as well as the removal efficiency were
presented in Figure 4.17. The sCOD removal efficiency at stable HRT of 16h operation was
fluctuating between 22% and 75% (Table 4.14). When the HRT was reduced to 6h, there was a
decrease of sCOD removal efficiency from 71% (D158) to 13% (D164). However, on D171, the
sCOD removal efficiency returned to 53%. Subsequently, it stayed in the region of 36% to 58%.
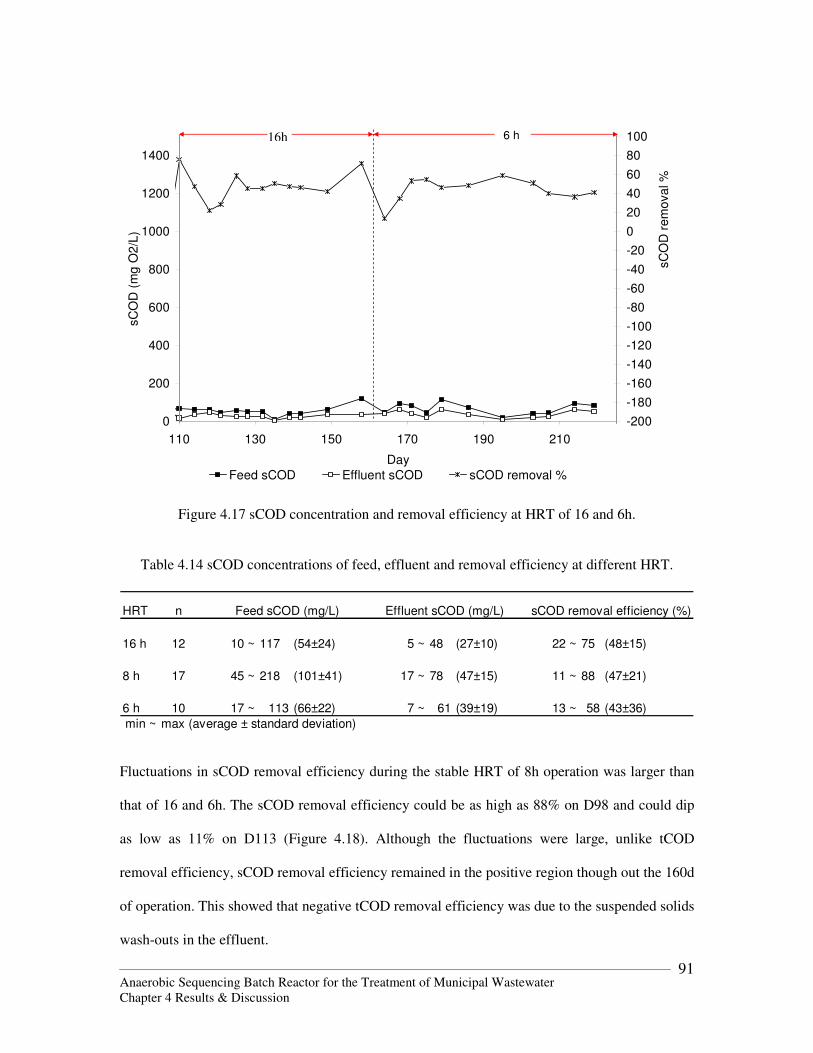
Anaerobic Sequencing Batch Reactor for the Treatment of Municipal Wastewater Chapter 4 Results & Discussion
91
0
200
400
600
800
1000
1200
1400
110 130 150 170 190 210
Day
sC
OD
(m
g O
2/L
)
-200
-180
-160
-140
-120
-100
-80
-60
-40
-20
0
20
40
60
80
100
sC
OD
re
mo
va
l %
Feed sCOD Effluent sCOD sCOD removal %
16 6 h
Figure 4.17 sCOD concentration and removal efficiency at HRT of 16 and 6h.
Table 4.14 sCOD concentrations of feed, effluent and removal efficiency at different HRT.
HRT n
16 h 12 10 ~ 117 (54±24) 5 ~ 48 (27±10) 22 ~ 75 (48±15)
8 h 17 45 ~ 218 (101±41) 17 ~ 78 (47±15) 11 ~ 88 (47±21)
6 h 10 17 ~ 113 (66±22) 7 ~ 61 (39±19) 13 ~ 58 (43±36)
min ~ max (average ± standard deviation)
Feed sCOD (mg/L) Effluent sCOD (mg/L) sCOD removal efficiency (%)
Fluctuations in sCOD removal efficiency during the stable HRT of 8h operation was larger than
that of 16 and 6h. The sCOD removal efficiency could be as high as 88% on D98 and could dip
as low as 11% on D113 (Figure 4.18). Although the fluctuations were large, unlike tCOD
removal efficiency, sCOD removal efficiency remained in the positive region though out the 160d
of operation. This showed that negative tCOD removal efficiency was due to the suspended solids
wash-outs in the effluent.
16h
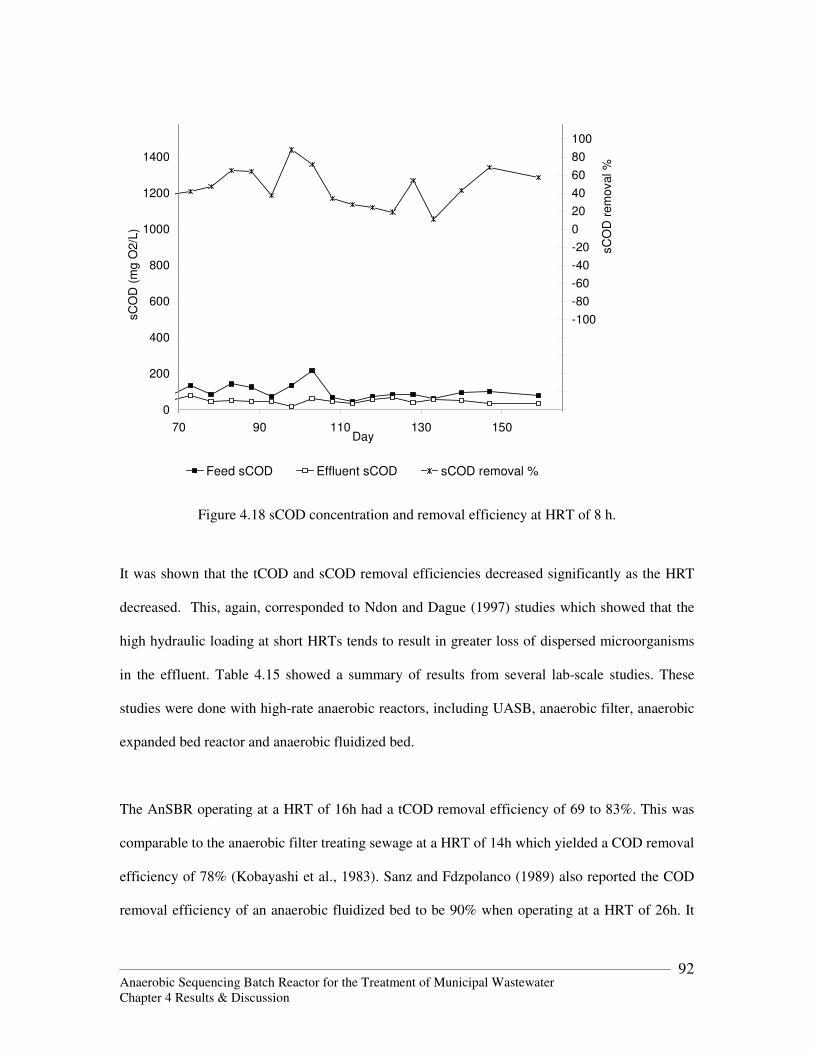
Anaerobic Sequencing Batch Reactor for the Treatment of Municipal Wastewater Chapter 4 Results & Discussion
92
0
200
400
600
800
1000
1200
1400
70 90 110 130 150Day
sC
OD
(m
g O
2/L
)
-200
-180
-160
-140
-120
-100
-80
-60
-40
-20
0
20
40
60
80
100
sC
OD
rem
oval %
Feed sCOD Effluent sCOD sCOD removal %
Figure 4.18 sCOD concentration and removal efficiency at HRT of 8 h.
It was shown that the tCOD and sCOD removal efficiencies decreased significantly as the HRT
decreased. This, again, corresponded to Ndon and Dague (1997) studies which showed that the
high hydraulic loading at short HRTs tends to result in greater loss of dispersed microorganisms
in the effluent. Table 4.15 showed a summary of results from several lab-scale studies. These
studies were done with high-rate anaerobic reactors, including UASB, anaerobic filter, anaerobic
expanded bed reactor and anaerobic fluidized bed.
The AnSBR operating at a HRT of 16h had a tCOD removal efficiency of 69 to 83%. This was
comparable to the anaerobic filter treating sewage at a HRT of 14h which yielded a COD removal
efficiency of 78% (Kobayashi et al., 1983). Sanz and Fdzpolanco (1989) also reported the COD
removal efficiency of an anaerobic fluidized bed to be 90% when operating at a HRT of 26h. It
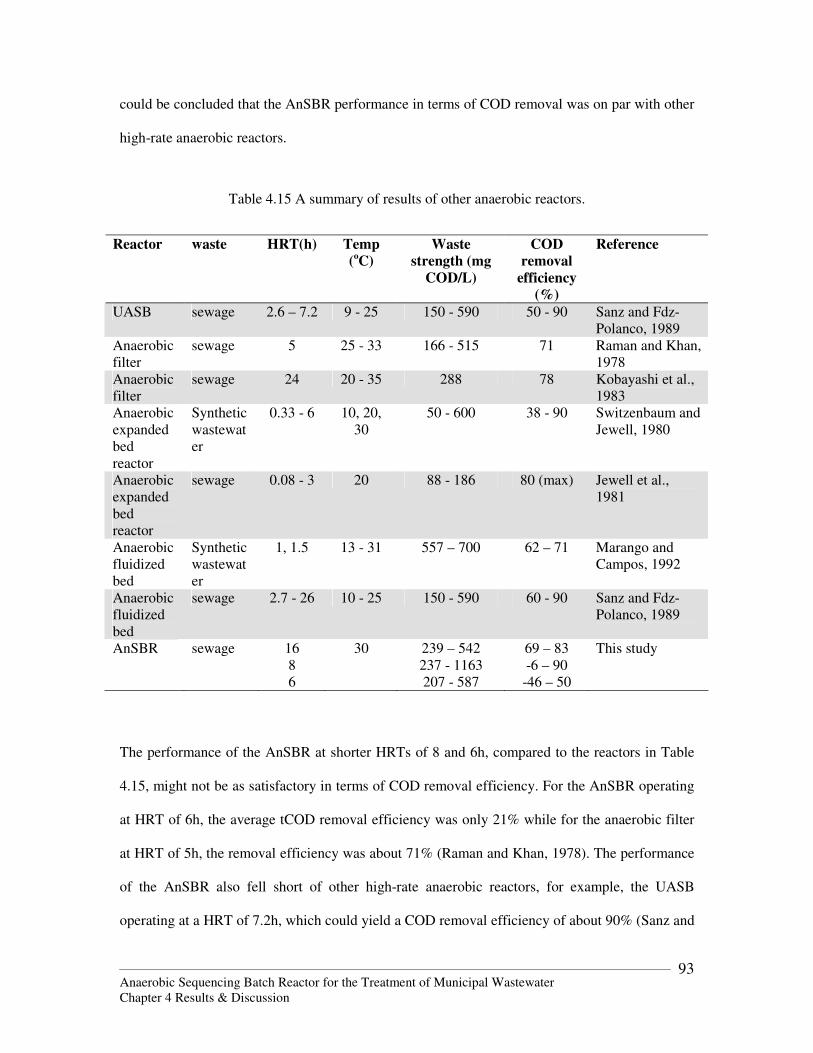
Anaerobic Sequencing Batch Reactor for the Treatment of Municipal Wastewater Chapter 4 Results & Discussion
93
could be concluded that the AnSBR performance in terms of COD removal was on par with other
high-rate anaerobic reactors.
Table 4.15 A summary of results of other anaerobic reactors.
Reactor waste HRT(h) Temp
(oC)
Waste
strength (mg
COD/L)
COD
removal
efficiency
(%)
Reference
UASB sewage 2.6 – 7.2 9 - 25 150 - 590 50 - 90 Sanz and Fdz-Polanco, 1989
Anaerobic filter
sewage 5 25 - 33 166 - 515 71 Raman and Khan, 1978
Anaerobic filter
sewage 24 20 - 35 288 78 Kobayashi et al., 1983
Anaerobic expanded bed reactor
Synthetic wastewater
0.33 - 6 10, 20, 30
50 - 600 38 - 90 Switzenbaum and Jewell, 1980
Anaerobic expanded bed reactor
sewage 0.08 - 3 20 88 - 186 80 (max) Jewell et al., 1981
Anaerobic fluidized bed
Synthetic wastewater
1, 1.5 13 - 31 557 – 700 62 – 71 Marango and Campos, 1992
Anaerobic fluidized bed
sewage 2.7 - 26 10 - 25 150 - 590 60 - 90 Sanz and Fdz-Polanco, 1989
AnSBR sewage 16 8 6
30 239 – 542 237 - 1163 207 - 587
69 – 83 -6 – 90
-46 – 50
This study
The performance of the AnSBR at shorter HRTs of 8 and 6h, compared to the reactors in Table
4.15, might not be as satisfactory in terms of COD removal efficiency. For the AnSBR operating
at HRT of 6h, the average tCOD removal efficiency was only 21% while for the anaerobic filter
at HRT of 5h, the removal efficiency was about 71% (Raman and Khan, 1978). The performance
of the AnSBR also fell short of other high-rate anaerobic reactors, for example, the UASB
operating at a HRT of 7.2h, which could yield a COD removal efficiency of about 90% (Sanz and
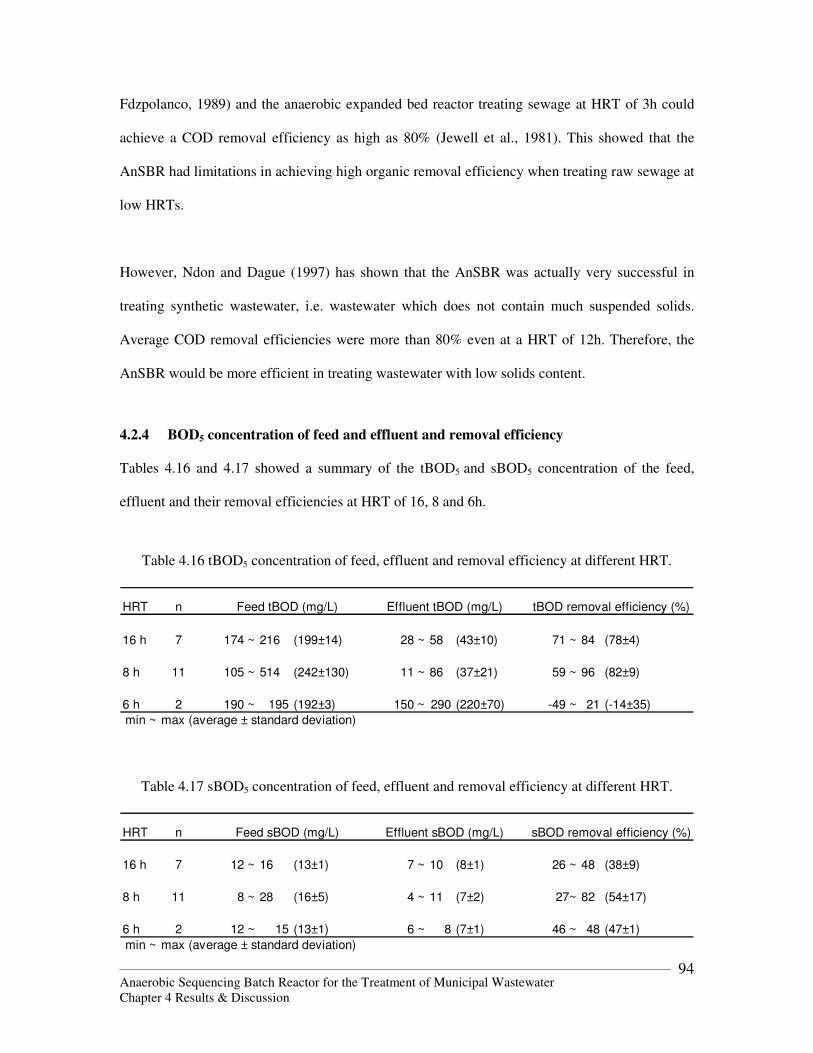
Anaerobic Sequencing Batch Reactor for the Treatment of Municipal Wastewater Chapter 4 Results & Discussion
94
Fdzpolanco, 1989) and the anaerobic expanded bed reactor treating sewage at HRT of 3h could
achieve a COD removal efficiency as high as 80% (Jewell et al., 1981). This showed that the
AnSBR had limitations in achieving high organic removal efficiency when treating raw sewage at
low HRTs.
However, Ndon and Dague (1997) has shown that the AnSBR was actually very successful in
treating synthetic wastewater, i.e. wastewater which does not contain much suspended solids.
Average COD removal efficiencies were more than 80% even at a HRT of 12h. Therefore, the
AnSBR would be more efficient in treating wastewater with low solids content.
4.2.4 BOD5 concentration of feed and effluent and removal efficiency Tables 4.16 and 4.17 showed a summary of the tBOD5 and sBOD5 concentration of the feed,
effluent and their removal efficiencies at HRT of 16, 8 and 6h.
Table 4.16 tBOD5 concentration of feed, effluent and removal efficiency at different HRT.
HRT n
16 h 7 174 ~ 216 (199±14) 28 ~ 58 (43±10) 71 ~ 84 (78±4)
8 h 11 105 ~ 514 (242±130) 11 ~ 86 (37±21) 59 ~ 96 (82±9)
6 h 2 190 ~ 195 (192±3) 150 ~ 290 (220±70) -49 ~ 21 (-14±35)
min ~ max (average ± standard deviation)
Feed tBOD (mg/L) Effluent tBOD (mg/L) tBOD removal efficiency (%)
Table 4.17 sBOD5 concentration of feed, effluent and removal efficiency at different HRT.
HRT n
16 h 7 12 ~ 16 (13±1) 7 ~ 10 (8±1) 26 ~ 48 (38±9)
8 h 11 8 ~ 28 (16±5) 4 ~ 11 (7±2) 27~ 82 (54±17)
6 h 2 12 ~ 15 (13±1) 6 ~ 8 (7±1) 46 ~ 48 (47±1)
min ~ max (average ± standard deviation)
Feed sBOD (mg/L) Effluent sBOD (mg/L) sBOD removal efficiency (%)
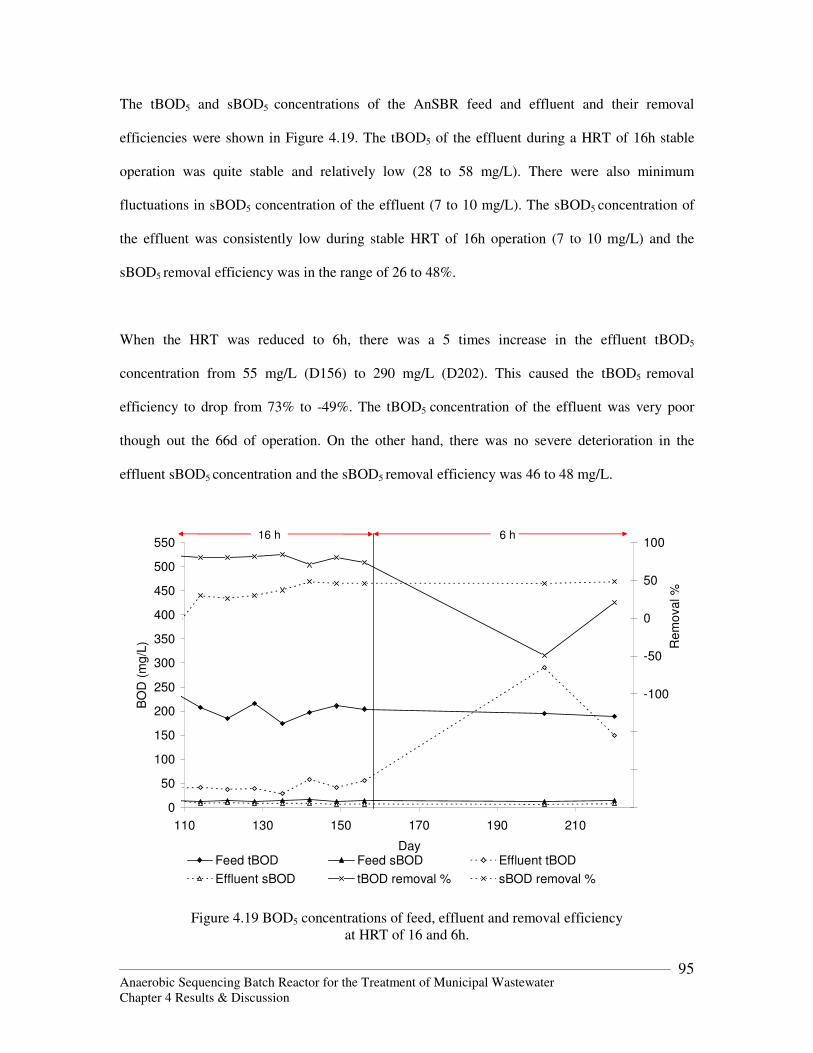
Anaerobic Sequencing Batch Reactor for the Treatment of Municipal Wastewater Chapter 4 Results & Discussion
95
The tBOD5 and sBOD5 concentrations of the AnSBR feed and effluent and their removal
efficiencies were shown in Figure 4.19. The tBOD5 of the effluent during a HRT of 16h stable
operation was quite stable and relatively low (28 to 58 mg/L). There were also minimum
fluctuations in sBOD5 concentration of the effluent (7 to 10 mg/L). The sBOD5 concentration of
the effluent was consistently low during stable HRT of 16h operation (7 to 10 mg/L) and the
sBOD5 removal efficiency was in the range of 26 to 48%.
When the HRT was reduced to 6h, there was a 5 times increase in the effluent tBOD5
concentration from 55 mg/L (D156) to 290 mg/L (D202). This caused the tBOD5 removal
efficiency to drop from 73% to -49%. The tBOD5 concentration of the effluent was very poor
though out the 66d of operation. On the other hand, there was no severe deterioration in the
effluent sBOD5 concentration and the sBOD5 removal efficiency was 46 to 48 mg/L.
0
50
100
150
200
250
300
350
400
450
500
550
110 130 150 170 190 210
Day
BO
D (
mg
/L)
-250
-200
-150
-100
-50
0
50
100
Re
mo
va
l %
Feed tBOD Feed sBOD Effluent tBOD
Effluent sBOD tBOD removal % sBOD removal %
16 h 6 h
Figure 4.19 BOD5 concentrations of feed, effluent and removal efficiency at HRT of 16 and 6h.
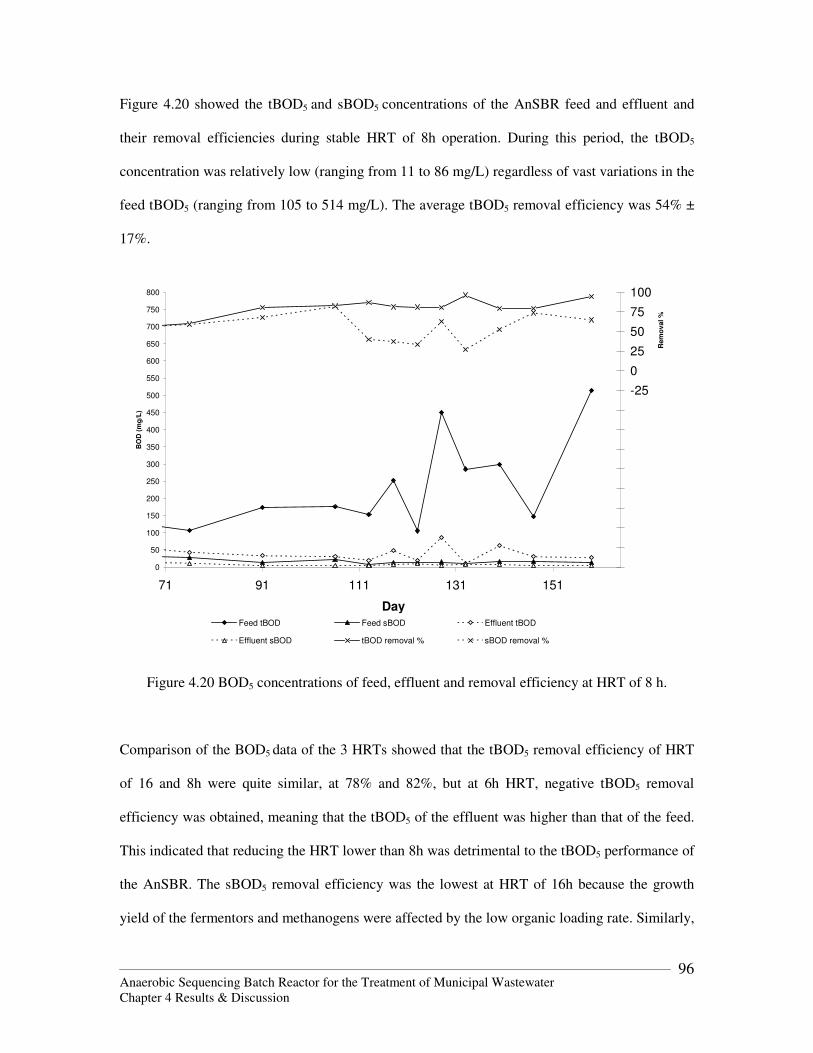
Anaerobic Sequencing Batch Reactor for the Treatment of Municipal Wastewater Chapter 4 Results & Discussion
96
Figure 4.20 showed the tBOD5 and sBOD5 concentrations of the AnSBR feed and effluent and
their removal efficiencies during stable HRT of 8h operation. During this period, the tBOD5
concentration was relatively low (ranging from 11 to 86 mg/L) regardless of vast variations in the
feed tBOD5 (ranging from 105 to 514 mg/L). The average tBOD5 removal efficiency was 54% ±
17%.
0
50
100
150
200
250
300
350
400
450
500
550
600
650
700
750
800
71 91 111 131 151
Day
BO
D (
mg
/L)
-250
-225
-200
-175
-150
-125
-100
-75
-50
-25
0
25
50
75
100
Rem
oval %
Feed tBOD Feed sBOD Effluent tBOD
Effluent sBOD tBOD removal % sBOD removal %
Figure 4.20 BOD5 concentrations of feed, effluent and removal efficiency at HRT of 8 h.
Comparison of the BOD5 data of the 3 HRTs showed that the tBOD5 removal efficiency of HRT
of 16 and 8h were quite similar, at 78% and 82%, but at 6h HRT, negative tBOD5 removal
efficiency was obtained, meaning that the tBOD5 of the effluent was higher than that of the feed.
This indicated that reducing the HRT lower than 8h was detrimental to the tBOD5 performance of
the AnSBR. The sBOD5 removal efficiency was the lowest at HRT of 16h because the growth
yield of the fermentors and methanogens were affected by the low organic loading rate. Similarly,
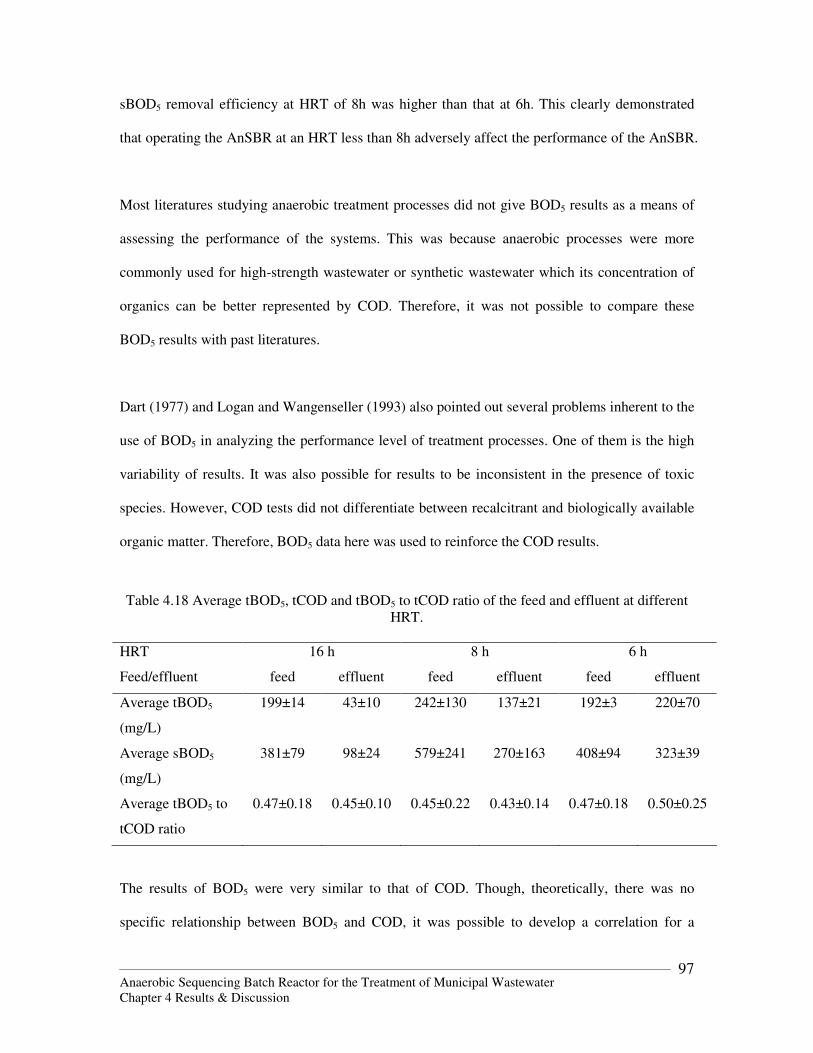
Anaerobic Sequencing Batch Reactor for the Treatment of Municipal Wastewater Chapter 4 Results & Discussion
97
sBOD5 removal efficiency at HRT of 8h was higher than that at 6h. This clearly demonstrated
that operating the AnSBR at an HRT less than 8h adversely affect the performance of the AnSBR.
Most literatures studying anaerobic treatment processes did not give BOD5 results as a means of
assessing the performance of the systems. This was because anaerobic processes were more
commonly used for high-strength wastewater or synthetic wastewater which its concentration of
organics can be better represented by COD. Therefore, it was not possible to compare these
BOD5 results with past literatures.
Dart (1977) and Logan and Wangenseller (1993) also pointed out several problems inherent to the
use of BOD5 in analyzing the performance level of treatment processes. One of them is the high
variability of results. It was also possible for results to be inconsistent in the presence of toxic
species. However, COD tests did not differentiate between recalcitrant and biologically available
organic matter. Therefore, BOD5 data here was used to reinforce the COD results.
Table 4.18 Average tBOD5, tCOD and tBOD5 to tCOD ratio of the feed and effluent at different HRT.
HRT 16 h 8 h 6 h
Feed/effluent feed effluent feed effluent feed effluent
Average tBOD5
(mg/L)
199±14 43±10 242±130 137±21 192±3 220±70
Average sBOD5
(mg/L)
381±79 98±24 579±241 270±163 408±94 323±39
Average tBOD5 to
tCOD ratio
0.47±0.18 0.45±0.10 0.45±0.22 0.43±0.14 0.47±0.18 0.50±0.25
The results of BOD5 were very similar to that of COD. Though, theoretically, there was no
specific relationship between BOD5 and COD, it was possible to develop a correlation for a
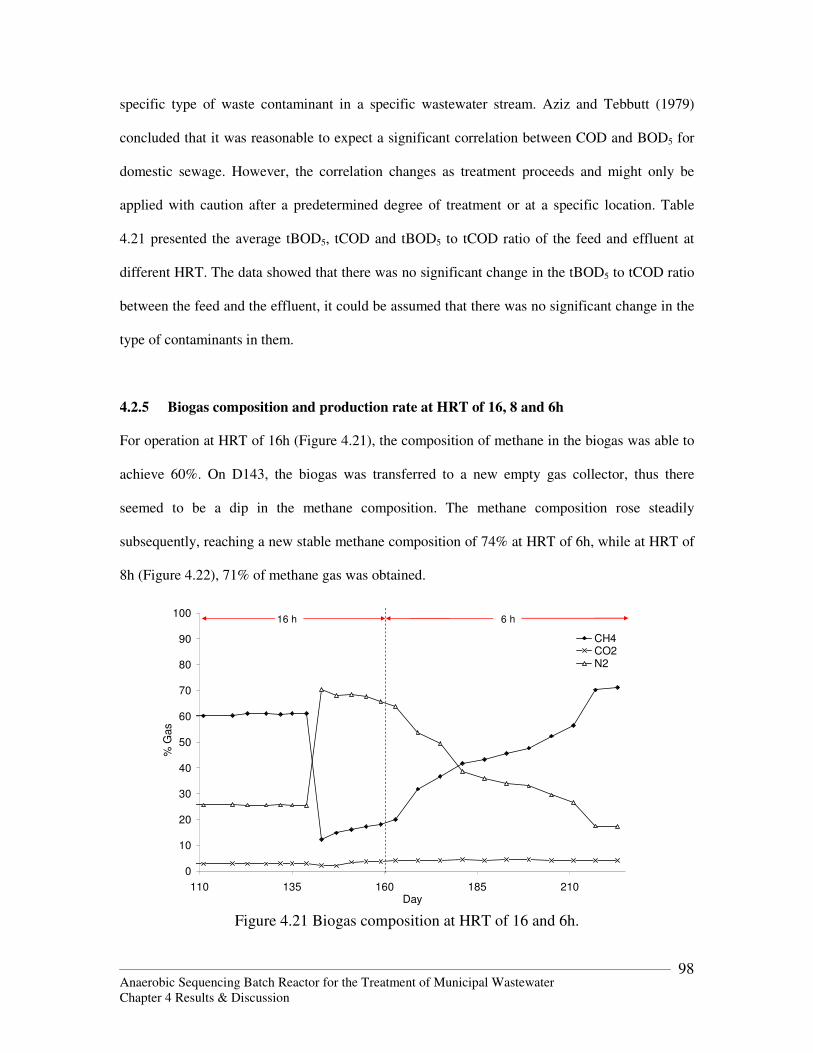
Anaerobic Sequencing Batch Reactor for the Treatment of Municipal Wastewater Chapter 4 Results & Discussion
98
specific type of waste contaminant in a specific wastewater stream. Aziz and Tebbutt (1979)
concluded that it was reasonable to expect a significant correlation between COD and BOD5 for
domestic sewage. However, the correlation changes as treatment proceeds and might only be
applied with caution after a predetermined degree of treatment or at a specific location. Table
4.21 presented the average tBOD5, tCOD and tBOD5 to tCOD ratio of the feed and effluent at
different HRT. The data showed that there was no significant change in the tBOD5 to tCOD ratio
between the feed and the effluent, it could be assumed that there was no significant change in the
type of contaminants in them.
4.2.5 Biogas composition and production rate at HRT of 16, 8 and 6h
For operation at HRT of 16h (Figure 4.21), the composition of methane in the biogas was able to
achieve 60%. On D143, the biogas was transferred to a new empty gas collector, thus there
seemed to be a dip in the methane composition. The methane composition rose steadily
subsequently, reaching a new stable methane composition of 74% at HRT of 6h, while at HRT of
8h (Figure 4.22), 71% of methane gas was obtained.
0
10
20
30
40
50
60
70
80
90
100
110 135 160 185 210Day
% G
as
CH4CO2N2
16 h 6 h
Figure 4.21 Biogas composition at HRT of 16 and 6h.
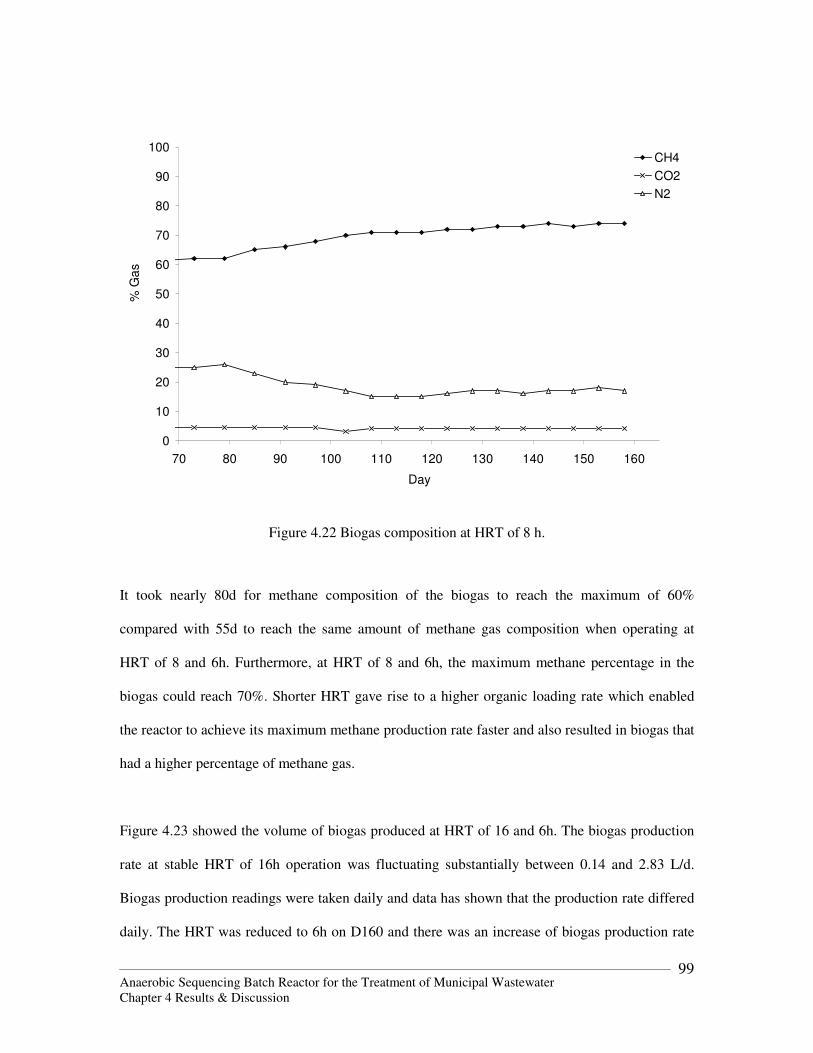
Anaerobic Sequencing Batch Reactor for the Treatment of Municipal Wastewater Chapter 4 Results & Discussion
99
0
10
20
30
40
50
60
70
80
90
100
70 80 90 100 110 120 130 140 150 160
Day
% G
as
CH4
CO2
N2
Figure 4.22 Biogas composition at HRT of 8 h.
It took nearly 80d for methane composition of the biogas to reach the maximum of 60%
compared with 55d to reach the same amount of methane gas composition when operating at
HRT of 8 and 6h. Furthermore, at HRT of 8 and 6h, the maximum methane percentage in the
biogas could reach 70%. Shorter HRT gave rise to a higher organic loading rate which enabled
the reactor to achieve its maximum methane production rate faster and also resulted in biogas that
had a higher percentage of methane gas.
Figure 4.23 showed the volume of biogas produced at HRT of 16 and 6h. The biogas production
rate at stable HRT of 16h operation was fluctuating substantially between 0.14 and 2.83 L/d.
Biogas production readings were taken daily and data has shown that the production rate differed
daily. The HRT was reduced to 6h on D160 and there was an increase of biogas production rate
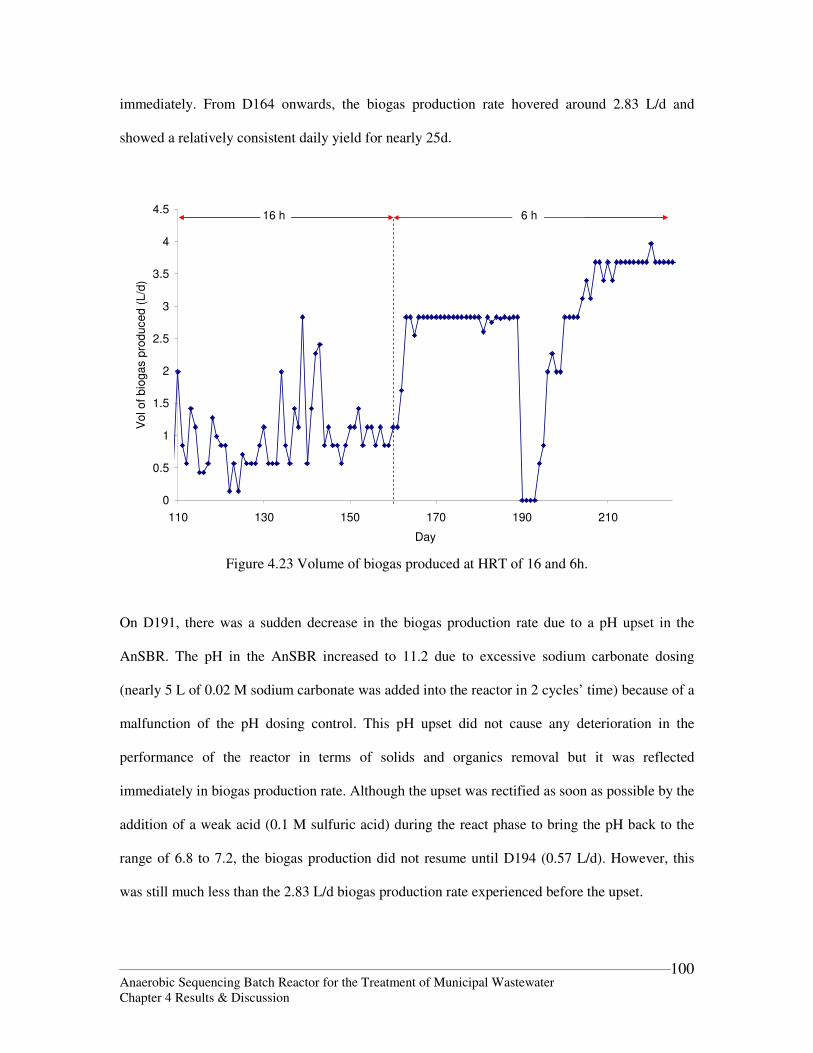
Anaerobic Sequencing Batch Reactor for the Treatment of Municipal Wastewater Chapter 4 Results & Discussion
100
immediately. From D164 onwards, the biogas production rate hovered around 2.83 L/d and
showed a relatively consistent daily yield for nearly 25d.
0
0.5
1
1.5
2
2.5
3
3.5
4
4.5
110 130 150 170 190 210
Day
Vol of
bio
gas p
roduced (
L/d
)
16 h 6 h
Figure 4.23 Volume of biogas produced at HRT of 16 and 6h.
On D191, there was a sudden decrease in the biogas production rate due to a pH upset in the
AnSBR. The pH in the AnSBR increased to 11.2 due to excessive sodium carbonate dosing
(nearly 5 L of 0.02 M sodium carbonate was added into the reactor in 2 cycles’ time) because of a
malfunction of the pH dosing control. This pH upset did not cause any deterioration in the
performance of the reactor in terms of solids and organics removal but it was reflected
immediately in biogas production rate. Although the upset was rectified as soon as possible by the
addition of a weak acid (0.1 M sulfuric acid) during the react phase to bring the pH back to the
range of 6.8 to 7.2, the biogas production did not resume until D194 (0.57 L/d). However, this
was still much less than the 2.83 L/d biogas production rate experienced before the upset.
Anaerobic Sequencing Batch Reactor for the Treatment of Municipal Wastewater Chapter 4 Results & Discussion
101
By D201, which was 10d after the upset, the biogas production rate returned to 2.83 L/d. This
showed that the AnSBR had the capability to withstand pH upsets and was robust enough to
recover within days of upset. An interesting phenomenon was that the biogas production rate did
not just returned to the level before the upset, it further increased to 3.7 L/d (D208). For the next
18d, the biogas production rate was relatively consistent in the range of 3.4 to 4.0 L/d.
It could be observed that when the HRT of the system was decreased from 16 to 6h, there was an
almost immediate increase in the volume of biogas produced per day. This was a different
observation from Tan (2001) who reported that shock loadings caused an accumulation of volatile
fatty acids which decreased the pH and inhibited methanogenic activity. As the limiting factor in
substrate conversion in an anaerobic system was the methane production step, a sudden increase
in organic loading may upset this delicate step. Methanogenesis might not be able to match the
increase in acidogenesis, resulting in an accumulation of acids. According to Gujer and Zehnder
(1983), variations in loading rates usually affect acetate decarboxylation or acetoclastic
methanogenesis, thus the anaerobic reactor will operate in the acidic regime.
The amount of biogas produced by the AnSBR was not significantly affected by the increase in
organic loading partly because
(1) pH control was incorporated in this study. Sodium carbonate was used to maintain the
pH within 6.8 to 7.2,
(2) at long HRT, the wastewater had sufficient alkalinity to buffer the accumulation of
acids, and
(3) the biomass was able to acclimatize to the shock loading and increase the
methanogenesis rate quickly to overcome the acid production
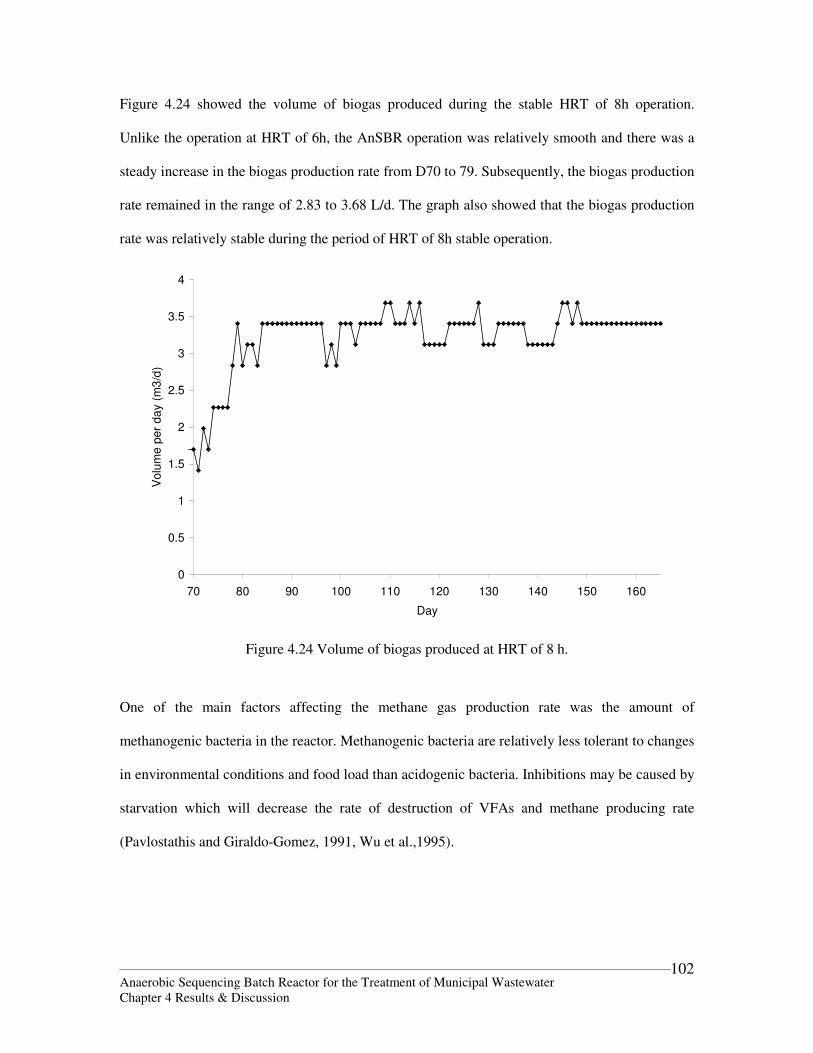
Anaerobic Sequencing Batch Reactor for the Treatment of Municipal Wastewater Chapter 4 Results & Discussion
102
Figure 4.24 showed the volume of biogas produced during the stable HRT of 8h operation.
Unlike the operation at HRT of 6h, the AnSBR operation was relatively smooth and there was a
steady increase in the biogas production rate from D70 to 79. Subsequently, the biogas production
rate remained in the range of 2.83 to 3.68 L/d. The graph also showed that the biogas production
rate was relatively stable during the period of HRT of 8h stable operation.
0
0.5
1
1.5
2
2.5
3
3.5
4
70 80 90 100 110 120 130 140 150 160
Day
Volu
me p
er
da
y (
m3
/d)
Figure 4.24 Volume of biogas produced at HRT of 8 h.
One of the main factors affecting the methane gas production rate was the amount of
methanogenic bacteria in the reactor. Methanogenic bacteria are relatively less tolerant to changes
in environmental conditions and food load than acidogenic bacteria. Inhibitions may be caused by
starvation which will decrease the rate of destruction of VFAs and methane producing rate
(Pavlostathis and Giraldo-Gomez, 1991, Wu et al.,1995).
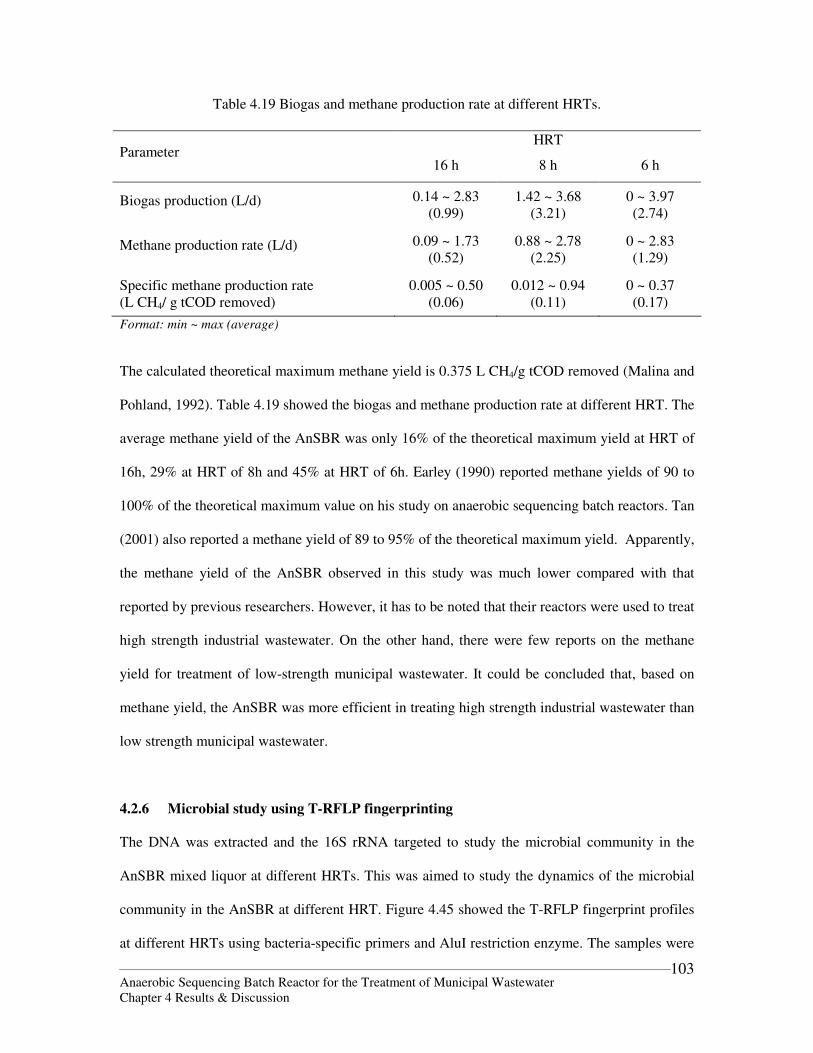
Anaerobic Sequencing Batch Reactor for the Treatment of Municipal Wastewater Chapter 4 Results & Discussion
103
Table 4.19 Biogas and methane production rate at different HRTs.
HRT Parameter
16 h 8 h 6 h
Biogas production (L/d) 0.14 ~ 2.83 (0.99)
1.42 ~ 3.68 (3.21)
0 ~ 3.97 (2.74)
Methane production rate (L/d) 0.09 ~ 1.73 (0.52)
0.88 ~ 2.78 (2.25)
0 ~ 2.83 (1.29)
Specific methane production rate (L CH4/ g tCOD removed)
0.005 ~ 0.50 (0.06)
0.012 ~ 0.94 (0.11)
0 ~ 0.37 (0.17)
Format: min ~ max (average)
The calculated theoretical maximum methane yield is 0.375 L CH4/g tCOD removed (Malina and
Pohland, 1992). Table 4.19 showed the biogas and methane production rate at different HRT. The
average methane yield of the AnSBR was only 16% of the theoretical maximum yield at HRT of
16h, 29% at HRT of 8h and 45% at HRT of 6h. Earley (1990) reported methane yields of 90 to
100% of the theoretical maximum value on his study on anaerobic sequencing batch reactors. Tan
(2001) also reported a methane yield of 89 to 95% of the theoretical maximum yield. Apparently,
the methane yield of the AnSBR observed in this study was much lower compared with that
reported by previous researchers. However, it has to be noted that their reactors were used to treat
high strength industrial wastewater. On the other hand, there were few reports on the methane
yield for treatment of low-strength municipal wastewater. It could be concluded that, based on
methane yield, the AnSBR was more efficient in treating high strength industrial wastewater than
low strength municipal wastewater.
4.2.6 Microbial study using T-RFLP fingerprinting
The DNA was extracted and the 16S rRNA targeted to study the microbial community in the
AnSBR mixed liquor at different HRTs. This was aimed to study the dynamics of the microbial
community in the AnSBR at different HRT. Figure 4.45 showed the T-RFLP fingerprint profiles
at different HRTs using bacteria-specific primers and AluI restriction enzyme. The samples were
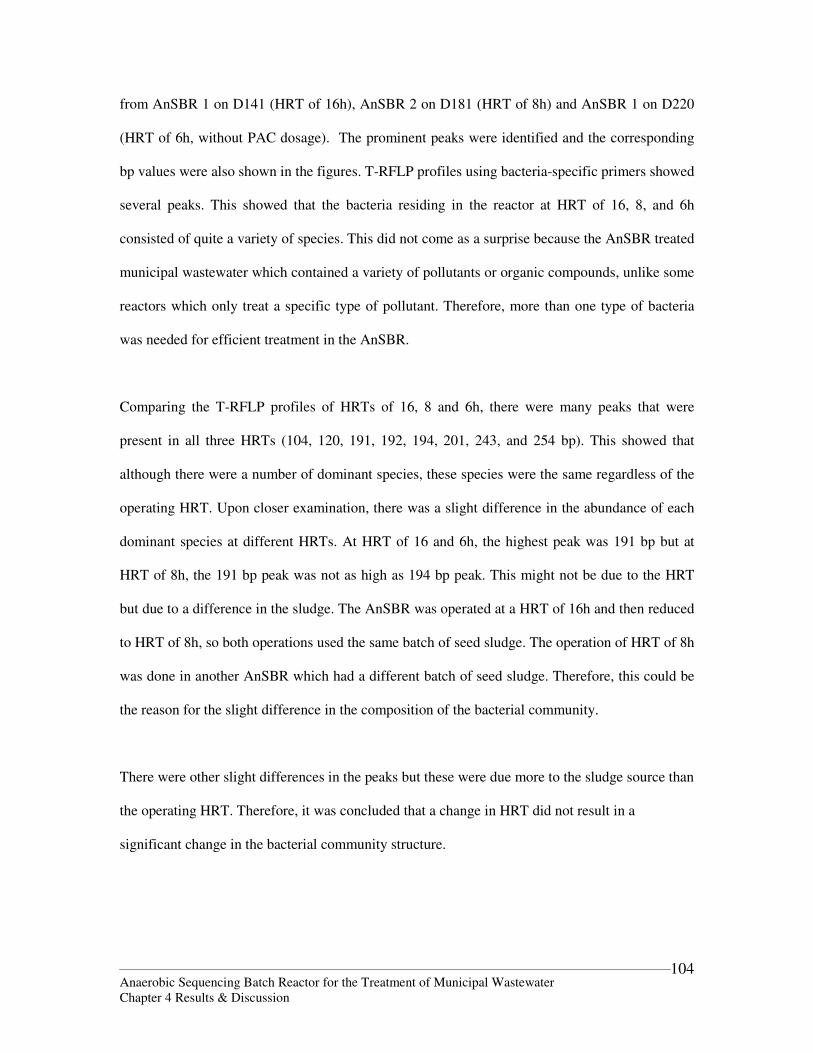
Anaerobic Sequencing Batch Reactor for the Treatment of Municipal Wastewater Chapter 4 Results & Discussion
104
from AnSBR 1 on D141 (HRT of 16h), AnSBR 2 on D181 (HRT of 8h) and AnSBR 1 on D220
(HRT of 6h, without PAC dosage). The prominent peaks were identified and the corresponding
bp values were also shown in the figures. T-RFLP profiles using bacteria-specific primers showed
several peaks. This showed that the bacteria residing in the reactor at HRT of 16, 8, and 6h
consisted of quite a variety of species. This did not come as a surprise because the AnSBR treated
municipal wastewater which contained a variety of pollutants or organic compounds, unlike some
reactors which only treat a specific type of pollutant. Therefore, more than one type of bacteria
was needed for efficient treatment in the AnSBR.
Comparing the T-RFLP profiles of HRTs of 16, 8 and 6h, there were many peaks that were
present in all three HRTs (104, 120, 191, 192, 194, 201, 243, and 254 bp). This showed that
although there were a number of dominant species, these species were the same regardless of the
operating HRT. Upon closer examination, there was a slight difference in the abundance of each
dominant species at different HRTs. At HRT of 16 and 6h, the highest peak was 191 bp but at
HRT of 8h, the 191 bp peak was not as high as 194 bp peak. This might not be due to the HRT
but due to a difference in the sludge. The AnSBR was operated at a HRT of 16h and then reduced
to HRT of 8h, so both operations used the same batch of seed sludge. The operation of HRT of 8h
was done in another AnSBR which had a different batch of seed sludge. Therefore, this could be
the reason for the slight difference in the composition of the bacterial community.
There were other slight differences in the peaks but these were due more to the sludge source than
the operating HRT. Therefore, it was concluded that a change in HRT did not result in a
significant change in the bacterial community structure.
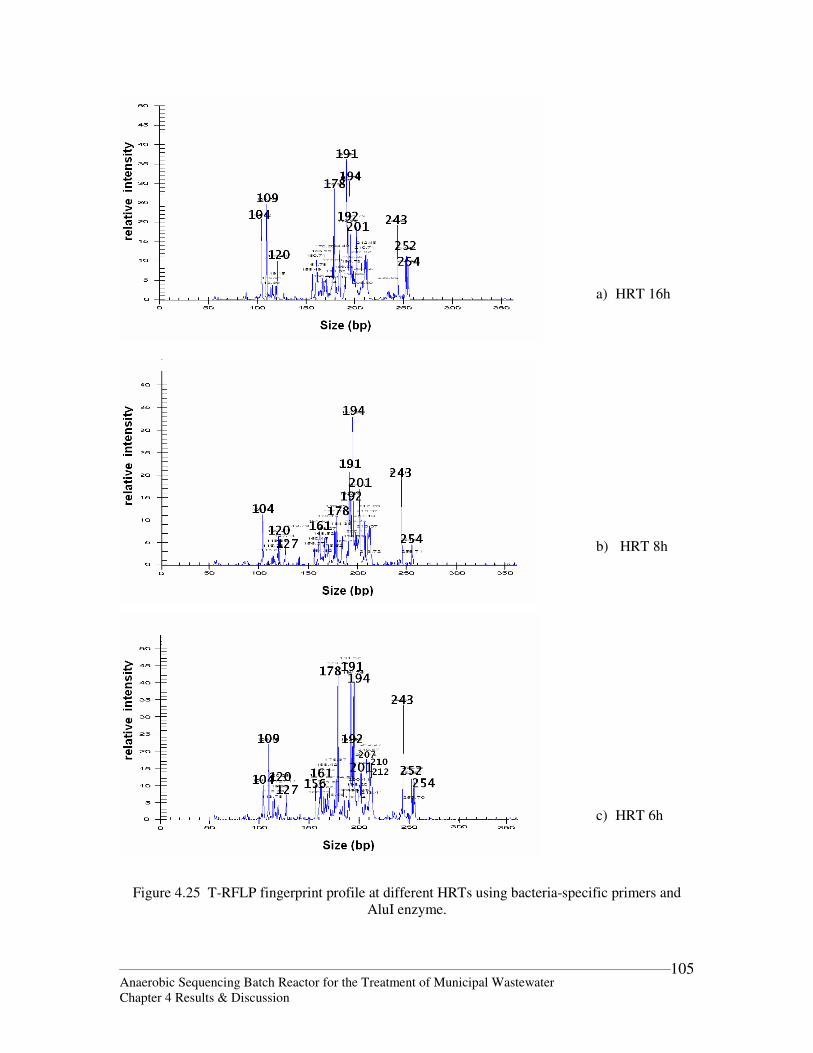
Anaerobic Sequencing Batch Reactor for the Treatment of Municipal Wastewater Chapter 4 Results & Discussion
105
Figure 4.25 T-RFLP fingerprint profile at different HRTs using bacteria-specific primers and
AluI enzyme.
a) HRT 16h b) HRT 8h c) HRT 6h
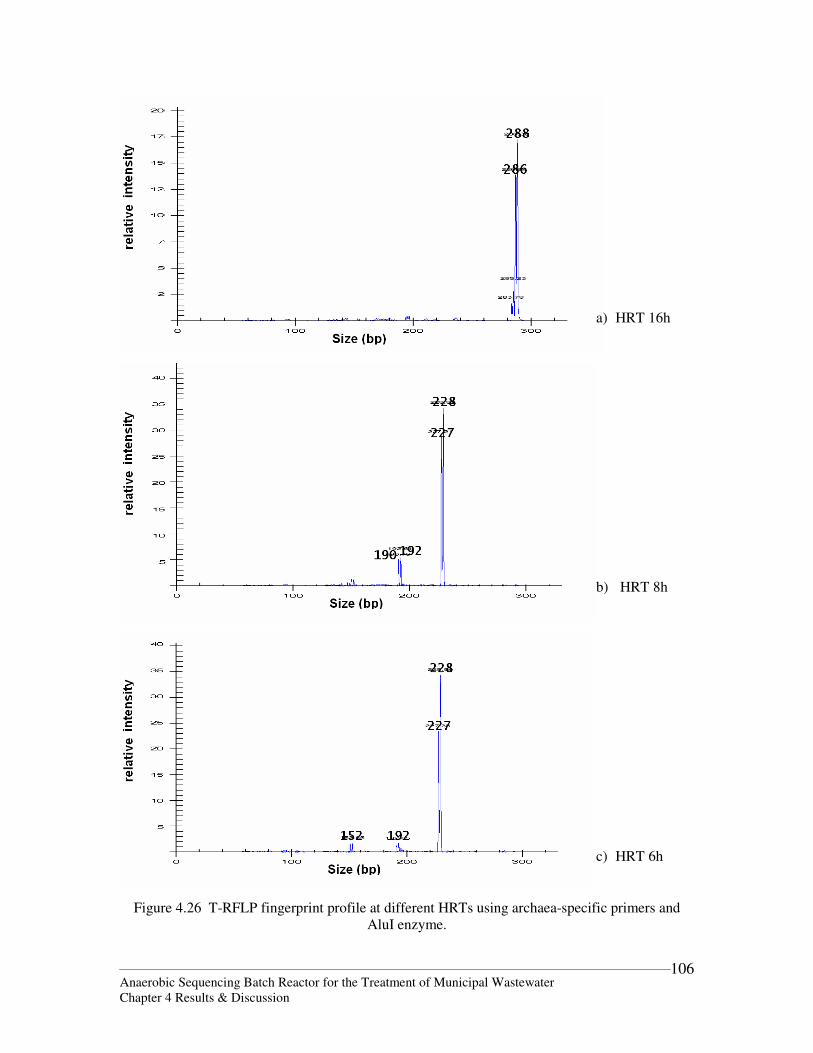
Anaerobic Sequencing Batch Reactor for the Treatment of Municipal Wastewater Chapter 4 Results & Discussion
106
Figure 4.26 T-RFLP fingerprint profile at different HRTs using archaea-specific primers and AluI enzyme.
a) HRT 16h b) HRT 8h c) HRT 6h
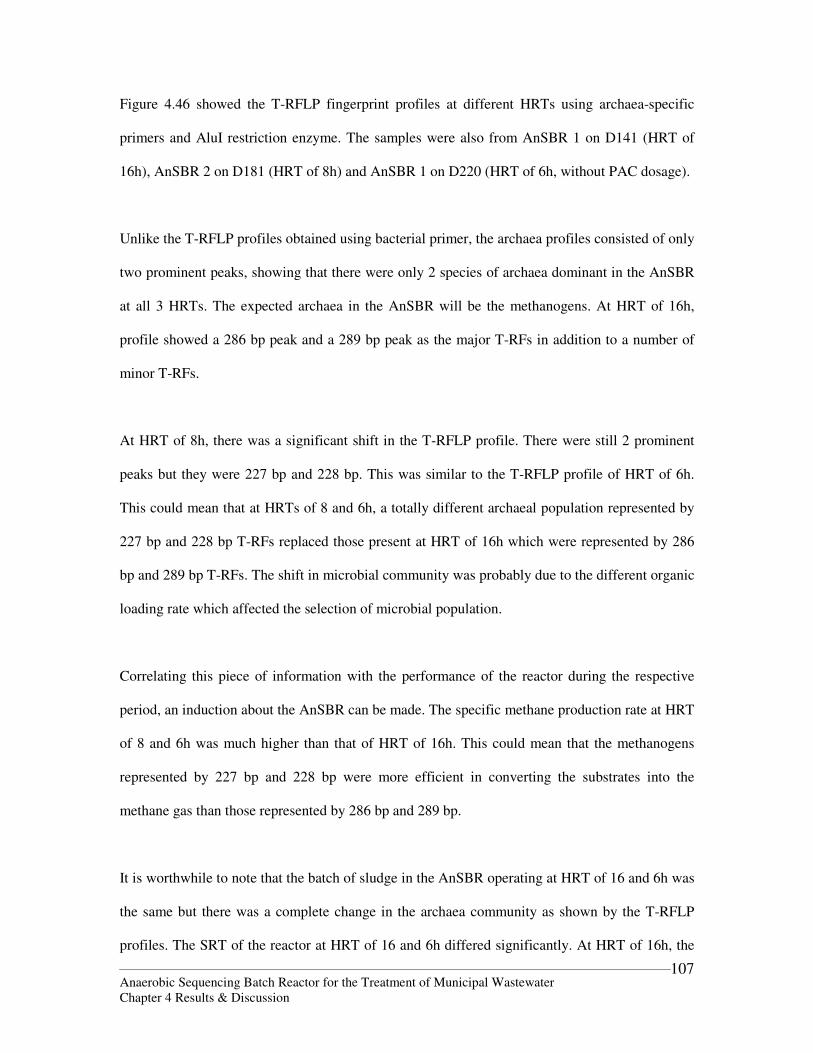
Anaerobic Sequencing Batch Reactor for the Treatment of Municipal Wastewater Chapter 4 Results & Discussion
107
Figure 4.46 showed the T-RFLP fingerprint profiles at different HRTs using archaea-specific
primers and AluI restriction enzyme. The samples were also from AnSBR 1 on D141 (HRT of
16h), AnSBR 2 on D181 (HRT of 8h) and AnSBR 1 on D220 (HRT of 6h, without PAC dosage).
Unlike the T-RFLP profiles obtained using bacterial primer, the archaea profiles consisted of only
two prominent peaks, showing that there were only 2 species of archaea dominant in the AnSBR
at all 3 HRTs. The expected archaea in the AnSBR will be the methanogens. At HRT of 16h,
profile showed a 286 bp peak and a 289 bp peak as the major T-RFs in addition to a number of
minor T-RFs.
At HRT of 8h, there was a significant shift in the T-RFLP profile. There were still 2 prominent
peaks but they were 227 bp and 228 bp. This was similar to the T-RFLP profile of HRT of 6h.
This could mean that at HRTs of 8 and 6h, a totally different archaeal population represented by
227 bp and 228 bp T-RFs replaced those present at HRT of 16h which were represented by 286
bp and 289 bp T-RFs. The shift in microbial community was probably due to the different organic
loading rate which affected the selection of microbial population.
Correlating this piece of information with the performance of the reactor during the respective
period, an induction about the AnSBR can be made. The specific methane production rate at HRT
of 8 and 6h was much higher than that of HRT of 16h. This could mean that the methanogens
represented by 227 bp and 228 bp were more efficient in converting the substrates into the
methane gas than those represented by 286 bp and 289 bp.
It is worthwhile to note that the batch of sludge in the AnSBR operating at HRT of 16 and 6h was
the same but there was a complete change in the archaea community as shown by the T-RFLP
profiles. The SRT of the reactor at HRT of 16 and 6h differed significantly. At HRT of 16h, the
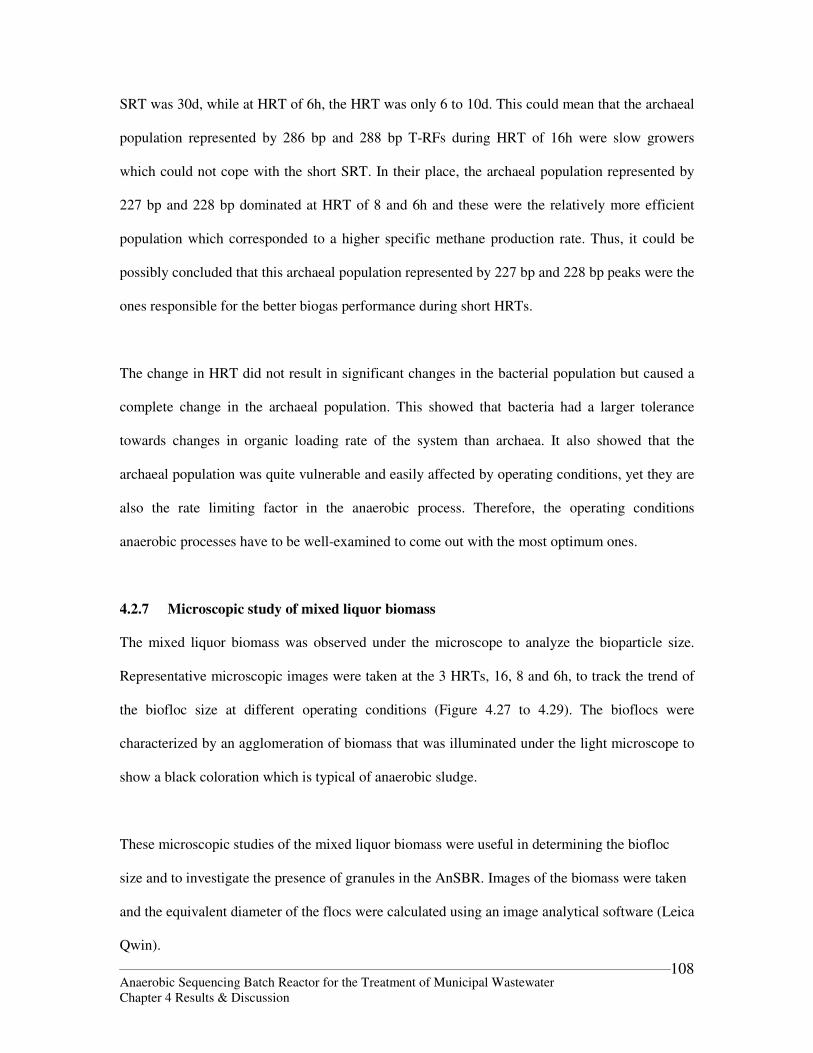
Anaerobic Sequencing Batch Reactor for the Treatment of Municipal Wastewater Chapter 4 Results & Discussion
108
SRT was 30d, while at HRT of 6h, the HRT was only 6 to 10d. This could mean that the archaeal
population represented by 286 bp and 288 bp T-RFs during HRT of 16h were slow growers
which could not cope with the short SRT. In their place, the archaeal population represented by
227 bp and 228 bp dominated at HRT of 8 and 6h and these were the relatively more efficient
population which corresponded to a higher specific methane production rate. Thus, it could be
possibly concluded that this archaeal population represented by 227 bp and 228 bp peaks were the
ones responsible for the better biogas performance during short HRTs.
The change in HRT did not result in significant changes in the bacterial population but caused a
complete change in the archaeal population. This showed that bacteria had a larger tolerance
towards changes in organic loading rate of the system than archaea. It also showed that the
archaeal population was quite vulnerable and easily affected by operating conditions, yet they are
also the rate limiting factor in the anaerobic process. Therefore, the operating conditions
anaerobic processes have to be well-examined to come out with the most optimum ones.
4.2.7 Microscopic study of mixed liquor biomass
The mixed liquor biomass was observed under the microscope to analyze the bioparticle size.
Representative microscopic images were taken at the 3 HRTs, 16, 8 and 6h, to track the trend of
the biofloc size at different operating conditions (Figure 4.27 to 4.29). The bioflocs were
characterized by an agglomeration of biomass that was illuminated under the light microscope to
show a black coloration which is typical of anaerobic sludge.
These microscopic studies of the mixed liquor biomass were useful in determining the biofloc
size and to investigate the presence of granules in the AnSBR. Images of the biomass were taken
and the equivalent diameter of the flocs were calculated using an image analytical software (Leica
Qwin).
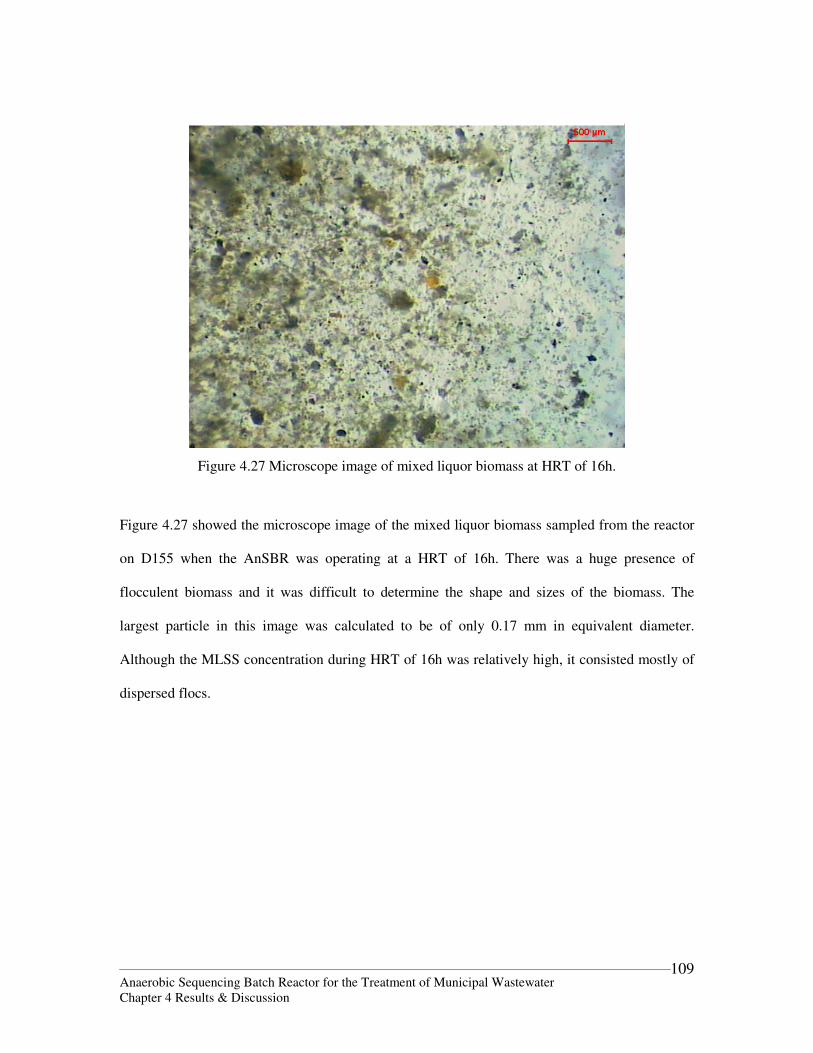
Anaerobic Sequencing Batch Reactor for the Treatment of Municipal Wastewater Chapter 4 Results & Discussion
109
Figure 4.27 Microscope image of mixed liquor biomass at HRT of 16h.
Figure 4.27 showed the microscope image of the mixed liquor biomass sampled from the reactor
on D155 when the AnSBR was operating at a HRT of 16h. There was a huge presence of
flocculent biomass and it was difficult to determine the shape and sizes of the biomass. The
largest particle in this image was calculated to be of only 0.17 mm in equivalent diameter.
Although the MLSS concentration during HRT of 16h was relatively high, it consisted mostly of
dispersed flocs.
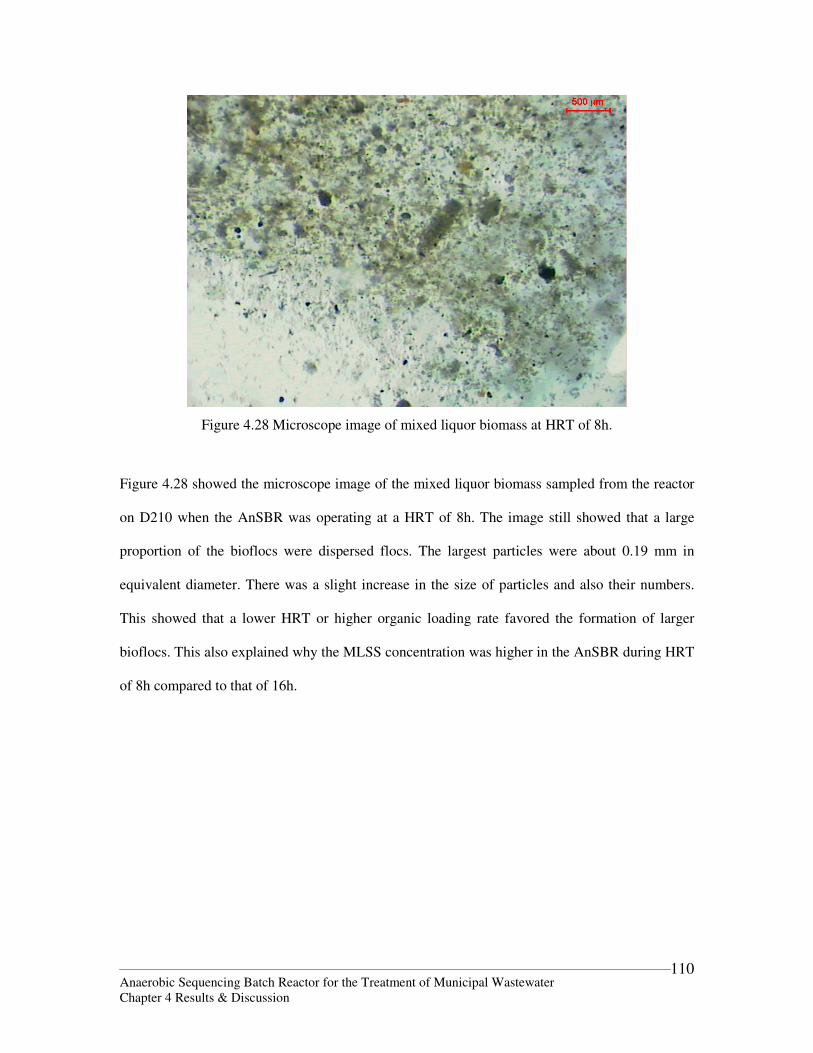
Anaerobic Sequencing Batch Reactor for the Treatment of Municipal Wastewater Chapter 4 Results & Discussion
110
Figure 4.28 Microscope image of mixed liquor biomass at HRT of 8h.
Figure 4.28 showed the microscope image of the mixed liquor biomass sampled from the reactor
on D210 when the AnSBR was operating at a HRT of 8h. The image still showed that a large
proportion of the bioflocs were dispersed flocs. The largest particles were about 0.19 mm in
equivalent diameter. There was a slight increase in the size of particles and also their numbers.
This showed that a lower HRT or higher organic loading rate favored the formation of larger
bioflocs. This also explained why the MLSS concentration was higher in the AnSBR during HRT
of 8h compared to that of 16h.
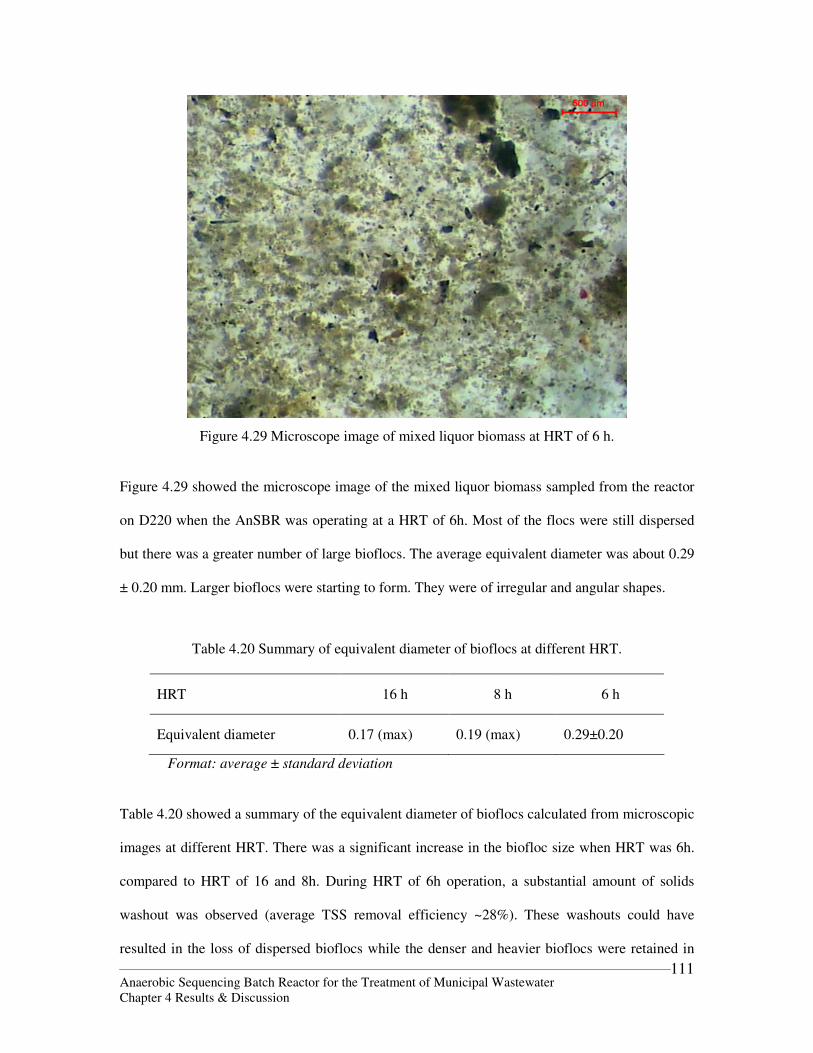
Anaerobic Sequencing Batch Reactor for the Treatment of Municipal Wastewater Chapter 4 Results & Discussion
111
Figure 4.29 Microscope image of mixed liquor biomass at HRT of 6 h. Figure 4.29 showed the microscope image of the mixed liquor biomass sampled from the reactor
on D220 when the AnSBR was operating at a HRT of 6h. Most of the flocs were still dispersed
but there was a greater number of large bioflocs. The average equivalent diameter was about 0.29
± 0.20 mm. Larger bioflocs were starting to form. They were of irregular and angular shapes.
Table 4.20 Summary of equivalent diameter of bioflocs at different HRT.
HRT 16 h 8 h 6 h
Equivalent diameter 0.17 (max) 0.19 (max) 0.29±0.20
Format: average ± standard deviation
Table 4.20 showed a summary of the equivalent diameter of bioflocs calculated from microscopic
images at different HRT. There was a significant increase in the biofloc size when HRT was 6h.
compared to HRT of 16 and 8h. During HRT of 6h operation, a substantial amount of solids
washout was observed (average TSS removal efficiency ~28%). These washouts could have
resulted in the loss of dispersed bioflocs while the denser and heavier bioflocs were retained in
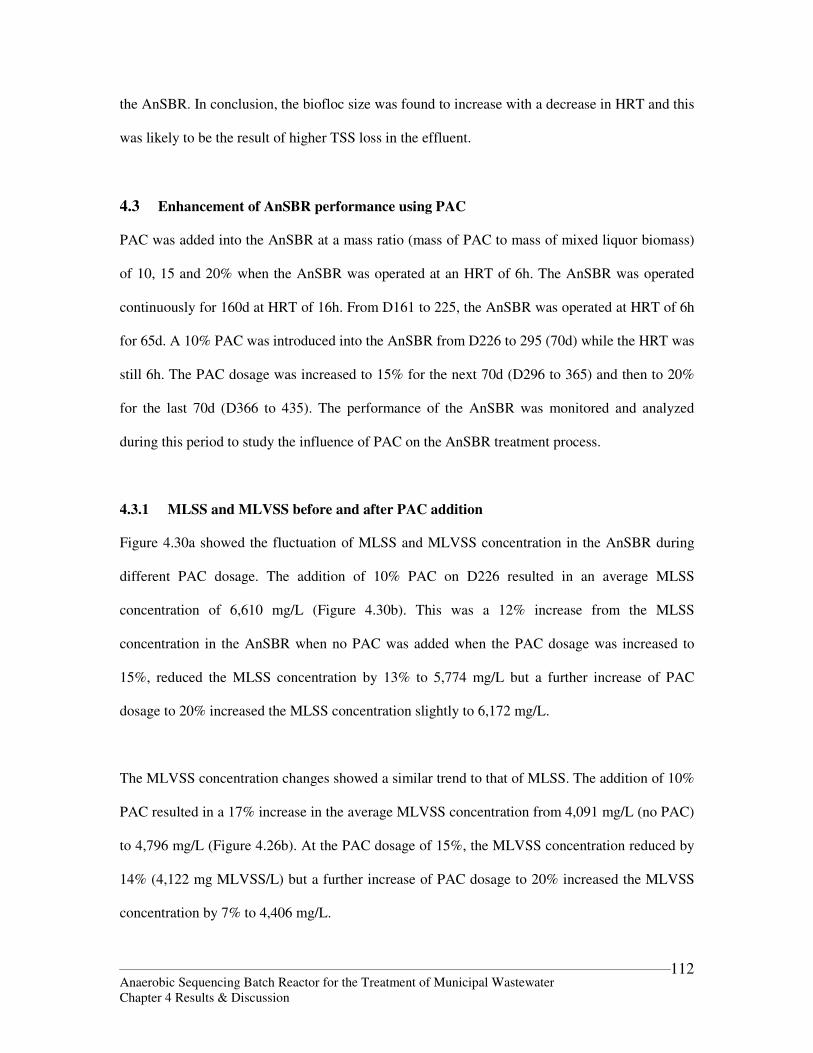
Anaerobic Sequencing Batch Reactor for the Treatment of Municipal Wastewater Chapter 4 Results & Discussion
112
the AnSBR. In conclusion, the biofloc size was found to increase with a decrease in HRT and this
was likely to be the result of higher TSS loss in the effluent.
4.3 Enhancement of AnSBR performance using PAC
PAC was added into the AnSBR at a mass ratio (mass of PAC to mass of mixed liquor biomass)
of 10, 15 and 20% when the AnSBR was operated at an HRT of 6h. The AnSBR was operated
continuously for 160d at HRT of 16h. From D161 to 225, the AnSBR was operated at HRT of 6h
for 65d. A 10% PAC was introduced into the AnSBR from D226 to 295 (70d) while the HRT was
still 6h. The PAC dosage was increased to 15% for the next 70d (D296 to 365) and then to 20%
for the last 70d (D366 to 435). The performance of the AnSBR was monitored and analyzed
during this period to study the influence of PAC on the AnSBR treatment process.
4.3.1 MLSS and MLVSS before and after PAC addition
Figure 4.30a showed the fluctuation of MLSS and MLVSS concentration in the AnSBR during
different PAC dosage. The addition of 10% PAC on D226 resulted in an average MLSS
concentration of 6,610 mg/L (Figure 4.30b). This was a 12% increase from the MLSS
concentration in the AnSBR when no PAC was added when the PAC dosage was increased to
15%, reduced the MLSS concentration by 13% to 5,774 mg/L but a further increase of PAC
dosage to 20% increased the MLSS concentration slightly to 6,172 mg/L.
The MLVSS concentration changes showed a similar trend to that of MLSS. The addition of 10%
PAC resulted in a 17% increase in the average MLVSS concentration from 4,091 mg/L (no PAC)
to 4,796 mg/L (Figure 4.26b). At the PAC dosage of 15%, the MLVSS concentration reduced by
14% (4,122 mg MLVSS/L) but a further increase of PAC dosage to 20% increased the MLVSS
concentration by 7% to 4,406 mg/L.
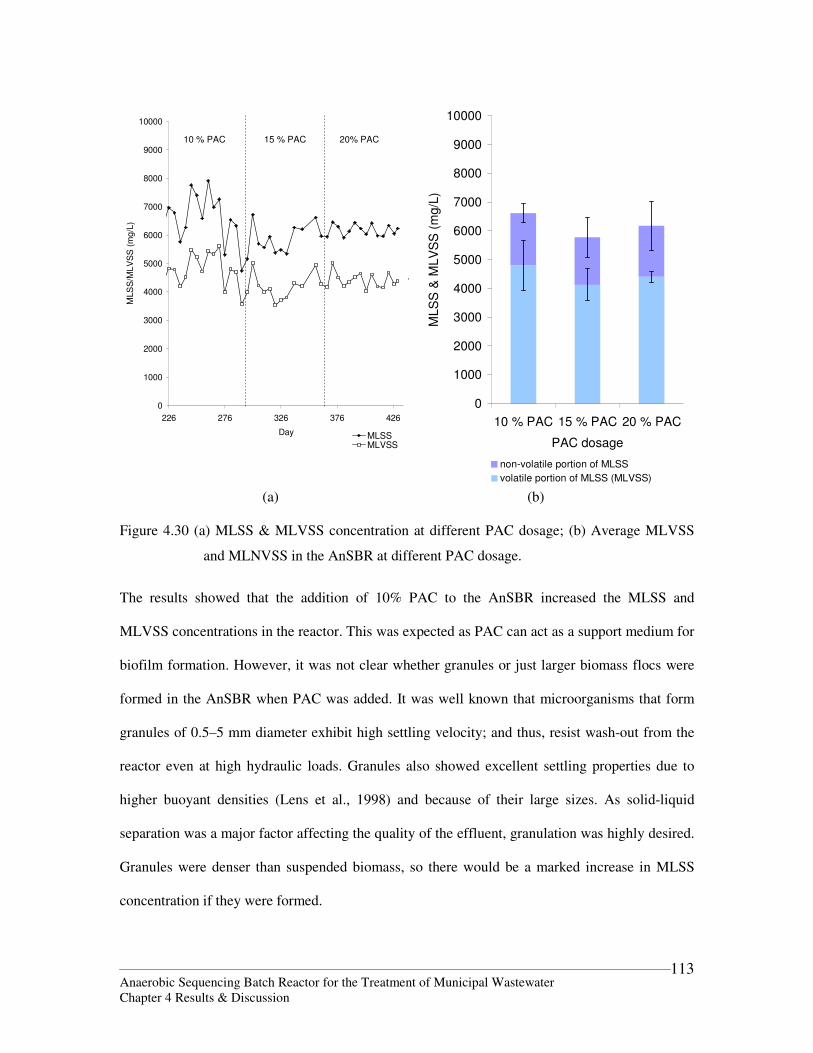
Anaerobic Sequencing Batch Reactor for the Treatment of Municipal Wastewater Chapter 4 Results & Discussion
113
0
1000
2000
3000
4000
5000
6000
7000
8000
9000
10000
226 276 326 376 426
Day
MLS
S/M
LV
SS
(m
g/L
)
MLSSMLVSS
.
10 % PAC 15 % PAC 20% PAC
0
1000
2000
3000
4000
5000
6000
7000
8000
9000
10000
10 % PAC 15 % PAC 20 % PAC
PAC dosageM
LS
S &
MLV
SS
(m
g/L
)
non-volatile portion of MLSS
volatile portion of MLSS (MLVSS) (a) (b) Figure 4.30 (a) MLSS & MLVSS concentration at different PAC dosage; (b) Average MLVSS
and MLNVSS in the AnSBR at different PAC dosage.
The results showed that the addition of 10% PAC to the AnSBR increased the MLSS and
MLVSS concentrations in the reactor. This was expected as PAC can act as a support medium for
biofilm formation. However, it was not clear whether granules or just larger biomass flocs were
formed in the AnSBR when PAC was added. It was well known that microorganisms that form
granules of 0.5–5 mm diameter exhibit high settling velocity; and thus, resist wash-out from the
reactor even at high hydraulic loads. Granules also showed excellent settling properties due to
higher buoyant densities (Lens et al., 1998) and because of their large sizes. As solid-liquid
separation was a major factor affecting the quality of the effluent, granulation was highly desired.
Granules were denser than suspended biomass, so there would be a marked increase in MLSS
concentration if they were formed.
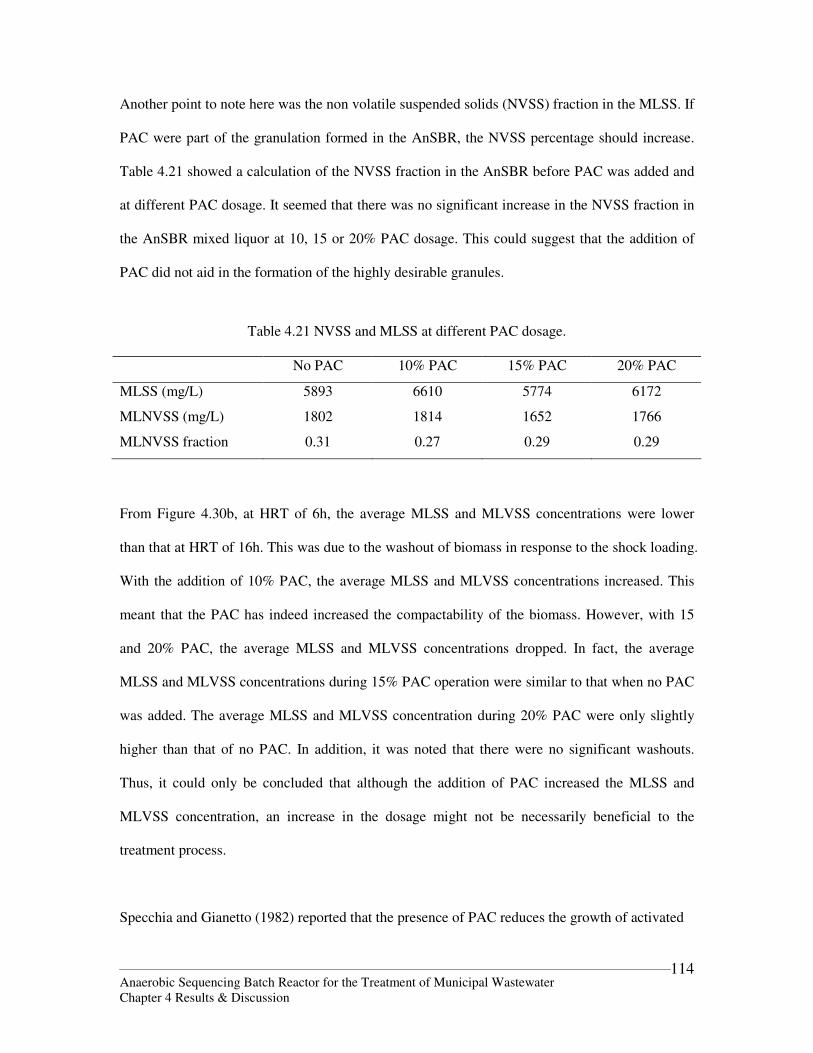
Anaerobic Sequencing Batch Reactor for the Treatment of Municipal Wastewater Chapter 4 Results & Discussion
114
Another point to note here was the non volatile suspended solids (NVSS) fraction in the MLSS. If
PAC were part of the granulation formed in the AnSBR, the NVSS percentage should increase.
Table 4.21 showed a calculation of the NVSS fraction in the AnSBR before PAC was added and
at different PAC dosage. It seemed that there was no significant increase in the NVSS fraction in
the AnSBR mixed liquor at 10, 15 or 20% PAC dosage. This could suggest that the addition of
PAC did not aid in the formation of the highly desirable granules.
Table 4.21 NVSS and MLSS at different PAC dosage. No PAC 10% PAC 15% PAC 20% PAC
MLSS (mg/L) 5893 6610 5774 6172
MLNVSS (mg/L) 1802 1814 1652 1766
MLNVSS fraction 0.31 0.27 0.29 0.29
From Figure 4.30b, at HRT of 6h, the average MLSS and MLVSS concentrations were lower
than that at HRT of 16h. This was due to the washout of biomass in response to the shock loading.
With the addition of 10% PAC, the average MLSS and MLVSS concentrations increased. This
meant that the PAC has indeed increased the compactability of the biomass. However, with 15
and 20% PAC, the average MLSS and MLVSS concentrations dropped. In fact, the average
MLSS and MLVSS concentrations during 15% PAC operation were similar to that when no PAC
was added. The average MLSS and MLVSS concentration during 20% PAC were only slightly
higher than that of no PAC. In addition, it was noted that there were no significant washouts.
Thus, it could only be concluded that although the addition of PAC increased the MLSS and
MLVSS concentration, an increase in the dosage might not be necessarily beneficial to the
treatment process.
Specchia and Gianetto (1982) reported that the presence of PAC reduces the growth of activated
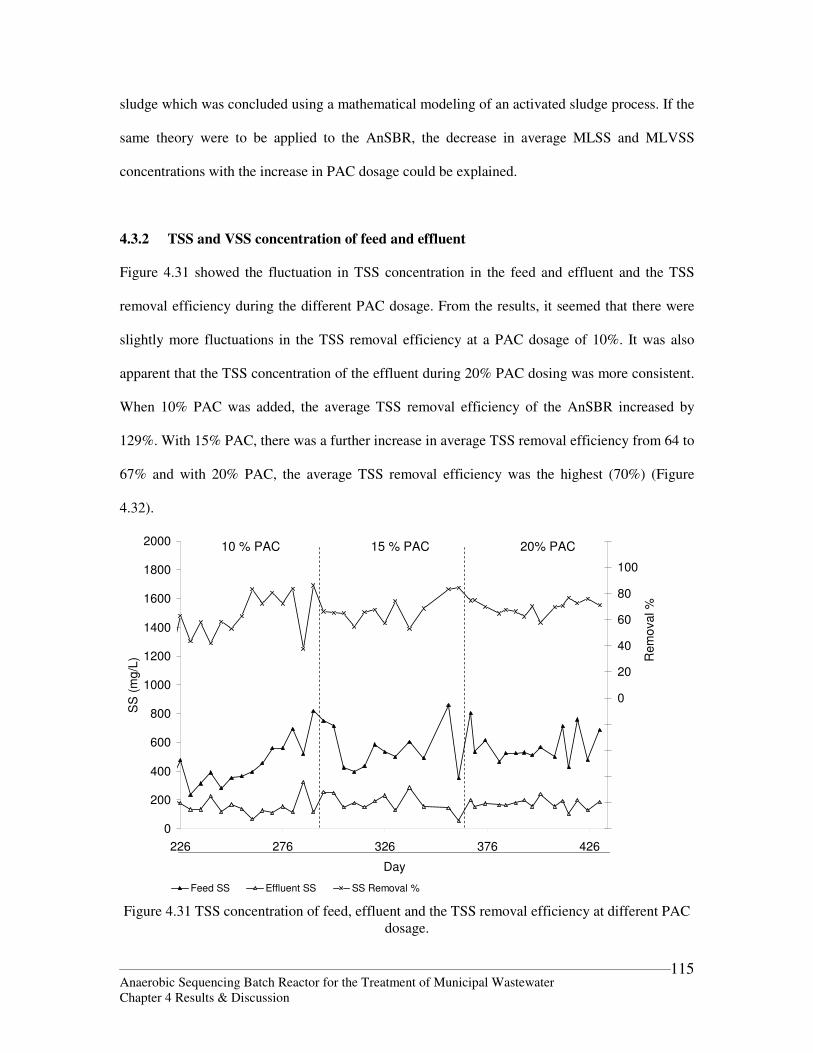
Anaerobic Sequencing Batch Reactor for the Treatment of Municipal Wastewater Chapter 4 Results & Discussion
115
sludge which was concluded using a mathematical modeling of an activated sludge process. If the
same theory were to be applied to the AnSBR, the decrease in average MLSS and MLVSS
concentrations with the increase in PAC dosage could be explained.
4.3.2 TSS and VSS concentration of feed and effluent
Figure 4.31 showed the fluctuation in TSS concentration in the feed and effluent and the TSS
removal efficiency during the different PAC dosage. From the results, it seemed that there were
slightly more fluctuations in the TSS removal efficiency at a PAC dosage of 10%. It was also
apparent that the TSS concentration of the effluent during 20% PAC dosing was more consistent.
When 10% PAC was added, the average TSS removal efficiency of the AnSBR increased by
129%. With 15% PAC, there was a further increase in average TSS removal efficiency from 64 to
67% and with 20% PAC, the average TSS removal efficiency was the highest (70%) (Figure
4.32).
0
200
400
600
800
1000
1200
1400
1600
1800
2000
226 276 326 376 426
Day
SS
(m
g/L
)
-100
-80
-60
-40
-20
0
20
40
60
80
100
120
Re
mo
va
l %
Feed SS Effluent SS SS Removal %
10 % PAC 15 % PAC 20% PAC
Figure 4.31 TSS concentration of feed, effluent and the TSS removal efficiency at different PAC
dosage.
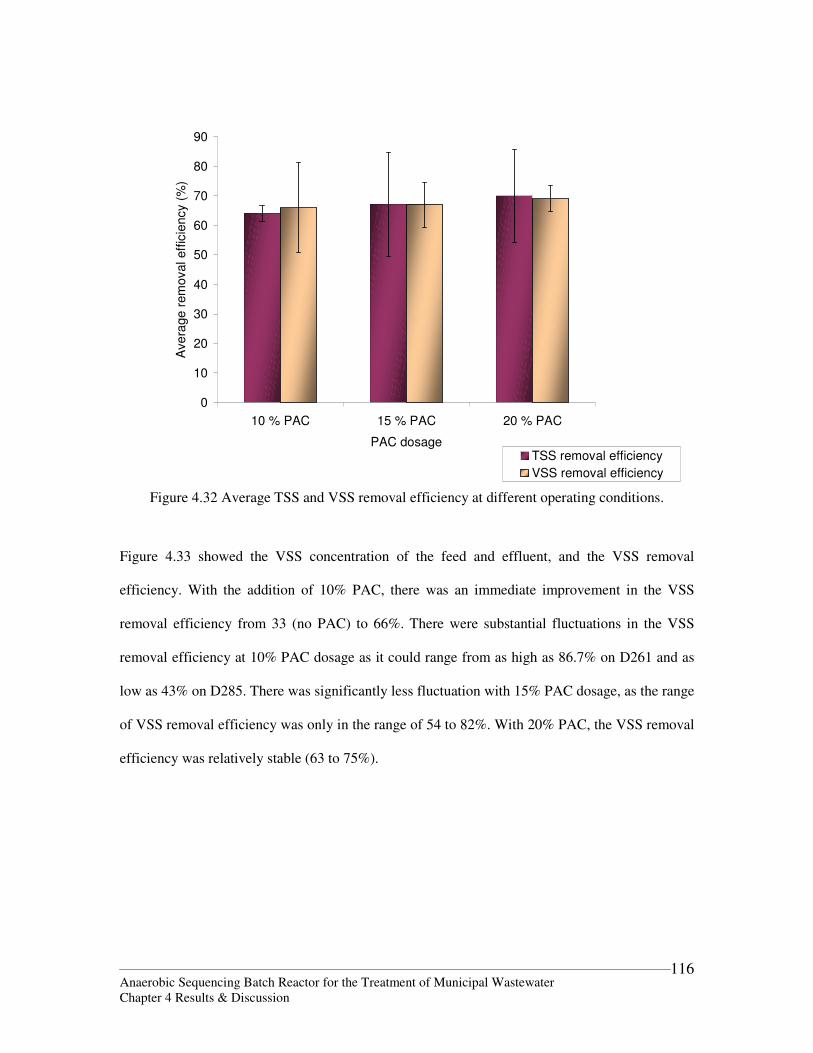
Anaerobic Sequencing Batch Reactor for the Treatment of Municipal Wastewater Chapter 4 Results & Discussion
116
0
10
20
30
40
50
60
70
80
90
10 % PAC 15 % PAC 20 % PAC
PAC dosage
Ave
rage r
em
oval eff
icie
ncy (
%)
TSS removal efficiency
VSS removal efficiency
Figure 4.32 Average TSS and VSS removal efficiency at different operating conditions.
Figure 4.33 showed the VSS concentration of the feed and effluent, and the VSS removal
efficiency. With the addition of 10% PAC, there was an immediate improvement in the VSS
removal efficiency from 33 (no PAC) to 66%. There were substantial fluctuations in the VSS
removal efficiency at 10% PAC dosage as it could range from as high as 86.7% on D261 and as
low as 43% on D285. There was significantly less fluctuation with 15% PAC dosage, as the range
of VSS removal efficiency was only in the range of 54 to 82%. With 20% PAC, the VSS removal
efficiency was relatively stable (63 to 75%).
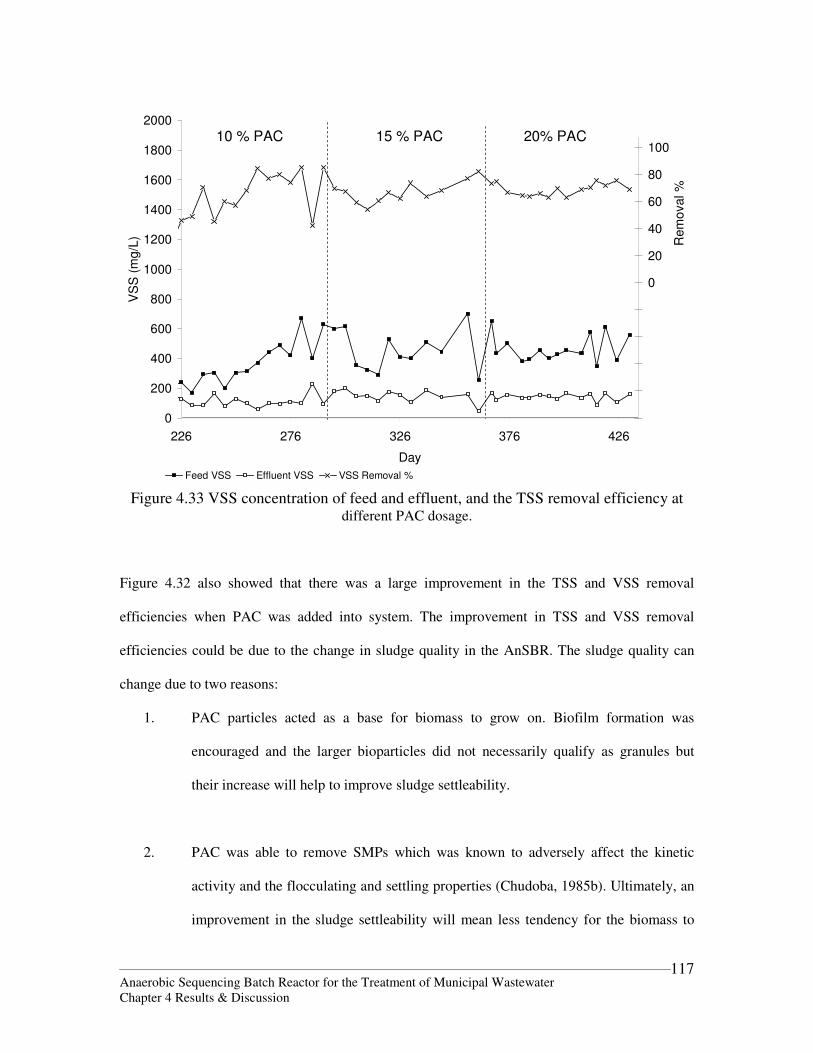
Anaerobic Sequencing Batch Reactor for the Treatment of Municipal Wastewater Chapter 4 Results & Discussion
117
0
200
400
600
800
1000
1200
1400
1600
1800
2000
226 276 326 376 426
Day
VS
S (
mg
/L)
-100
-80
-60
-40
-20
0
20
40
60
80
100
120
Rem
oval %
Feed VSS Effluent VSS VSS Removal %
10 % PAC 15 % PAC 20% PAC
Figure 4.33 VSS concentration of feed and effluent, and the TSS removal efficiency at
different PAC dosage.
Figure 4.32 also showed that there was a large improvement in the TSS and VSS removal
efficiencies when PAC was added into system. The improvement in TSS and VSS removal
efficiencies could be due to the change in sludge quality in the AnSBR. The sludge quality can
change due to two reasons:
1. PAC particles acted as a base for biomass to grow on. Biofilm formation was
encouraged and the larger bioparticles did not necessarily qualify as granules but
their increase will help to improve sludge settleability.
2. PAC was able to remove SMPs which was known to adversely affect the kinetic
activity and the flocculating and settling properties (Chudoba, 1985b). Ultimately, an
improvement in the sludge settleability will mean less tendency for the biomass to
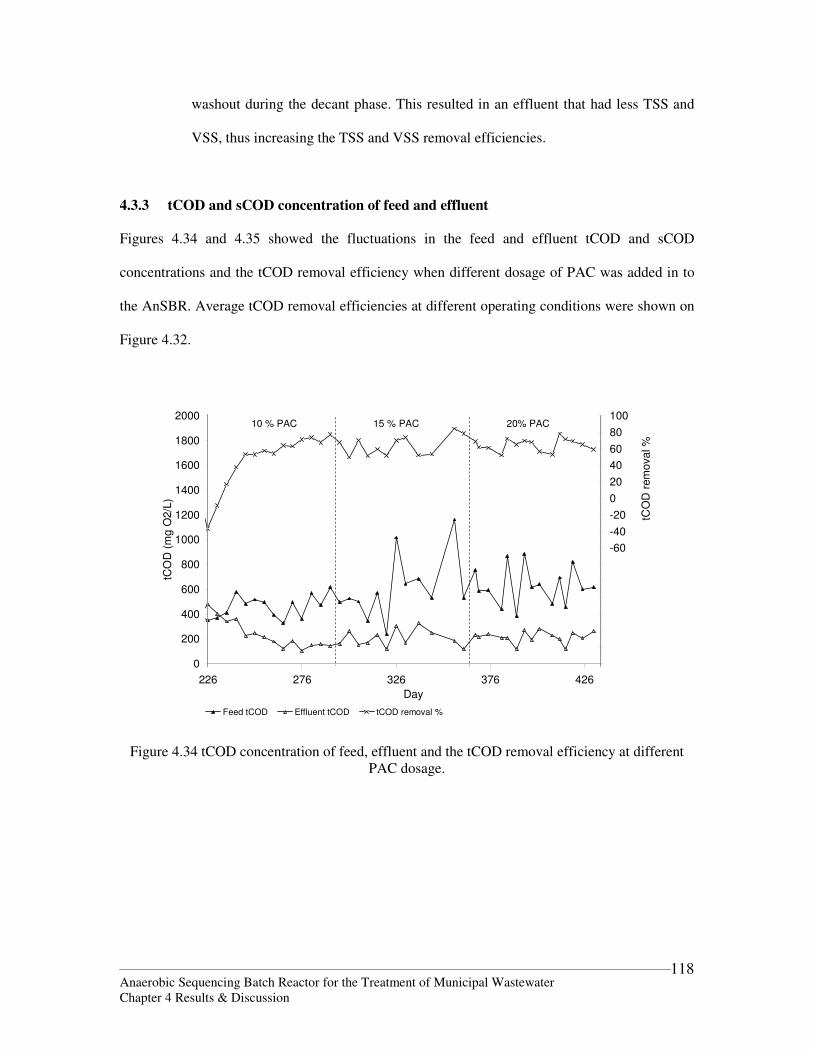
Anaerobic Sequencing Batch Reactor for the Treatment of Municipal Wastewater Chapter 4 Results & Discussion
118
washout during the decant phase. This resulted in an effluent that had less TSS and
VSS, thus increasing the TSS and VSS removal efficiencies.
4.3.3 tCOD and sCOD concentration of feed and effluent
Figures 4.34 and 4.35 showed the fluctuations in the feed and effluent tCOD and sCOD
concentrations and the tCOD removal efficiency when different dosage of PAC was added in to
the AnSBR. Average tCOD removal efficiencies at different operating conditions were shown on
Figure 4.32.
0
200
400
600
800
1000
1200
1400
1600
1800
2000
226 276 326 376 426
Day
tCO
D (
mg
O2/L
)
-200
-180
-160
-140
-120
-100
-80
-60
-40
-20
0
20
40
60
80
100
tCO
D r
em
ova
l %
Feed tCOD Effluent tCOD tCOD removal %
10 % PAC 15 % PAC 20% PAC
Figure 4.34 tCOD concentration of feed, effluent and the tCOD removal efficiency at different PAC dosage.
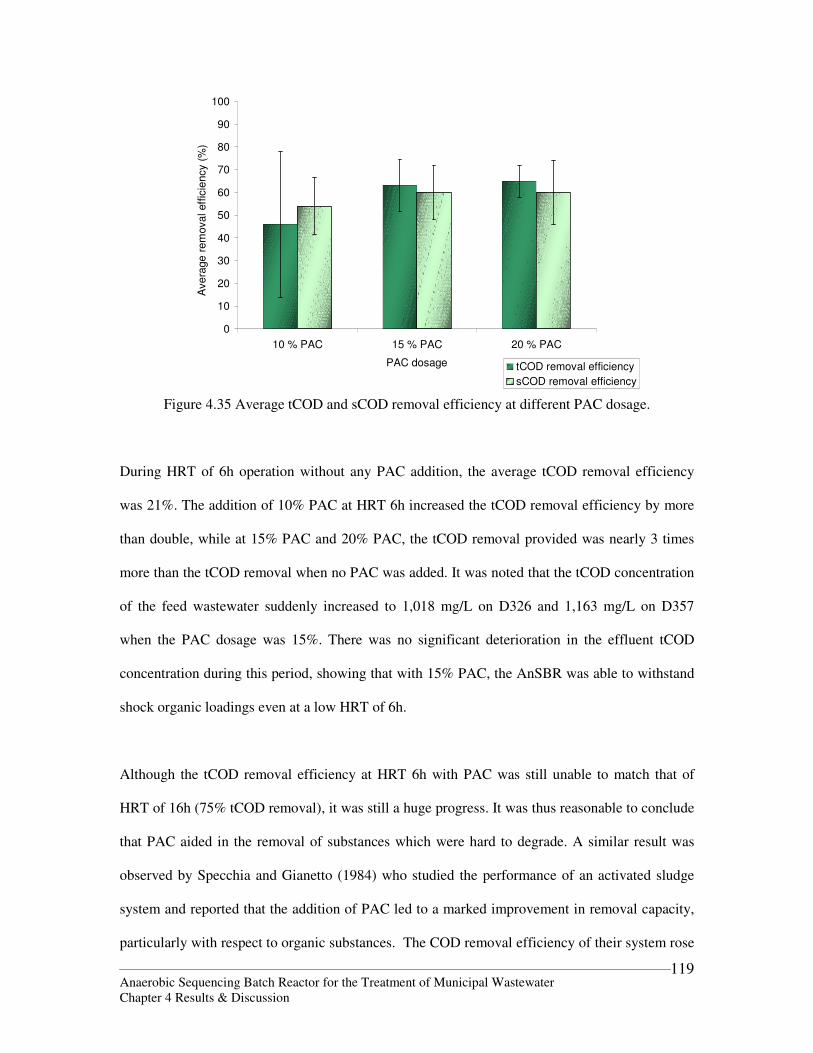
Anaerobic Sequencing Batch Reactor for the Treatment of Municipal Wastewater Chapter 4 Results & Discussion
119
0
10
20
30
40
50
60
70
80
90
100
10 % PAC 15 % PAC 20 % PAC
PAC dosage
Ave
rage
re
mova
l eff
icie
ncy (
%)
tCOD removal efficiency
sCOD removal efficiency
Figure 4.35 Average tCOD and sCOD removal efficiency at different PAC dosage.
During HRT of 6h operation without any PAC addition, the average tCOD removal efficiency
was 21%. The addition of 10% PAC at HRT 6h increased the tCOD removal efficiency by more
than double, while at 15% PAC and 20% PAC, the tCOD removal provided was nearly 3 times
more than the tCOD removal when no PAC was added. It was noted that the tCOD concentration
of the feed wastewater suddenly increased to 1,018 mg/L on D326 and 1,163 mg/L on D357
when the PAC dosage was 15%. There was no significant deterioration in the effluent tCOD
concentration during this period, showing that with 15% PAC, the AnSBR was able to withstand
shock organic loadings even at a low HRT of 6h.
Although the tCOD removal efficiency at HRT 6h with PAC was still unable to match that of
HRT of 16h (75% tCOD removal), it was still a huge progress. It was thus reasonable to conclude
that PAC aided in the removal of substances which were hard to degrade. A similar result was
observed by Specchia and Gianetto (1984) who studied the performance of an activated sludge
system and reported that the addition of PAC led to a marked improvement in removal capacity,
particularly with respect to organic substances. The COD removal efficiency of their system rose
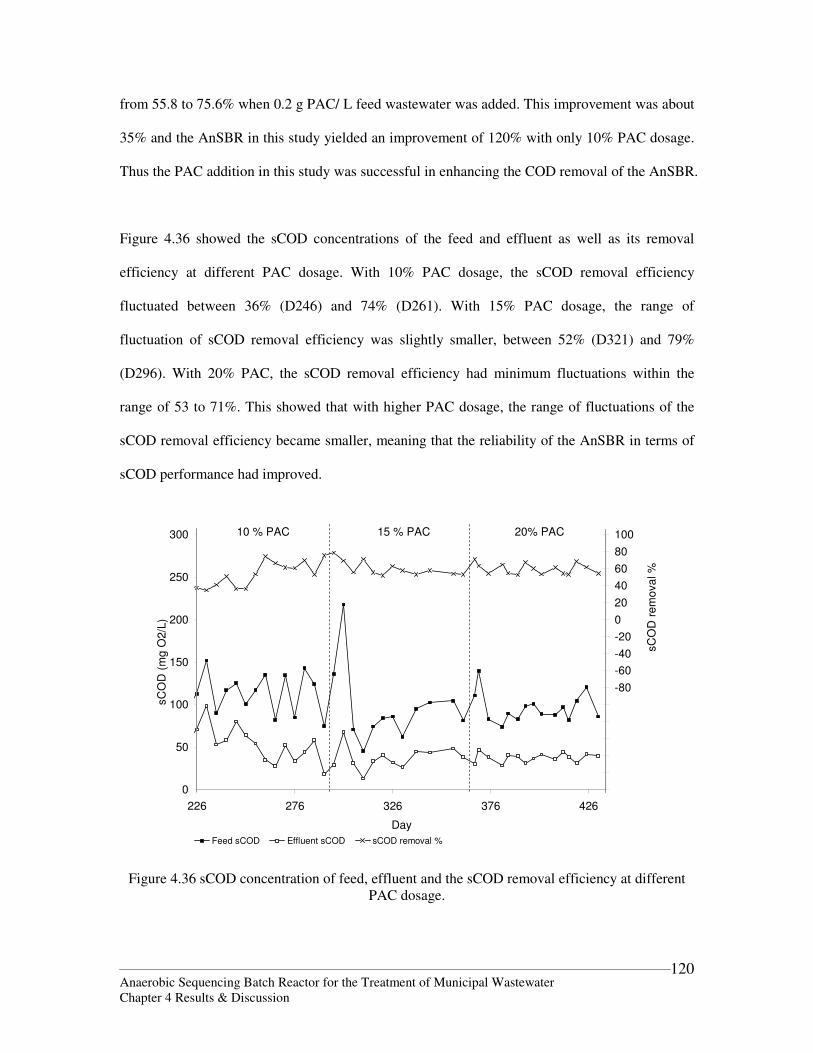
Anaerobic Sequencing Batch Reactor for the Treatment of Municipal Wastewater Chapter 4 Results & Discussion
120
from 55.8 to 75.6% when 0.2 g PAC/ L feed wastewater was added. This improvement was about
35% and the AnSBR in this study yielded an improvement of 120% with only 10% PAC dosage.
Thus the PAC addition in this study was successful in enhancing the COD removal of the AnSBR.
Figure 4.36 showed the sCOD concentrations of the feed and effluent as well as its removal
efficiency at different PAC dosage. With 10% PAC dosage, the sCOD removal efficiency
fluctuated between 36% (D246) and 74% (D261). With 15% PAC dosage, the range of
fluctuation of sCOD removal efficiency was slightly smaller, between 52% (D321) and 79%
(D296). With 20% PAC, the sCOD removal efficiency had minimum fluctuations within the
range of 53 to 71%. This showed that with higher PAC dosage, the range of fluctuations of the
sCOD removal efficiency became smaller, meaning that the reliability of the AnSBR in terms of
sCOD performance had improved.
0
50
100
150
200
250
300
226 276 326 376 426
Day
sC
OD
(m
g O
2/L
)
-200
-180
-160
-140
-120
-100
-80
-60
-40
-20
0
20
40
60
80
100
sC
OD
re
mo
va
l %
Feed sCOD Effluent sCOD sCOD removal %
10 % PAC 15 % PAC 20% PAC
Figure 4.36 sCOD concentration of feed, effluent and the sCOD removal efficiency at different PAC dosage.
Anaerobic Sequencing Batch Reactor for the Treatment of Municipal Wastewater Chapter 4 Results & Discussion
121
There was an increase in the sCOD removal efficiency when PAC was added. With an increase in
dosage of PAC, there was an increase in the sCOD removal efficiency. This showed that PAC
helped to improve the sCOD of the effluent. It is well known that sCOD in treated effluent
consists mainly of SMPs which are difficult to biodegrade. These SMPs may be precursors for
THM or chlorinated organics formation (Namkung and Rittmann, 1998) and pose as a problem
for downstream processes, especially if water reclamation process were to be incorporated.
Activated carbon is recognized as the most effective method for the removal of SMP. Although
the common practice is to use GAC to remove SMPs in aerobically-treated effluent, the same
results were expected for PAC removal of SMPs from anaerobically-treated effluent. However,
very little has been reported regarding the use of activated carbon with an anaerobic process.
Thus, this study demonstrated that PAC has the potential of improving the anaerobically treated
effluent in terms of tCOD and sCOD removal.
The addition of PAC at HRT of 6h did not result in an improvement on the sCOD removal as
high as the improvement on tCOD removal. The addition of 10% PAC only increased the sCOD
removal by 26% but increased tCOD removal by 120%. With the addition of 15 and 20% PAC,
the sCOD removal improved by more than 40% while the tCOD removal efficiency was more
than 3 times of the tCOD removal efficiency when no PAC was added. The tCOD and sCOD data
sets presented for HRT of 6h without PAC in Chapter 4.2.3 showed that tCOD removal
efficiencies were very poor (21%) but the sCOD removal efficiencies were better (43%). Thus,
the main problem with the AnSBR COD performance at HRT of 6h without PAC had more to do
with the COD contributed by the suspended solids in the effluent. The improvement of tCOD
removal efficiency brought about by the addition of PAC was due to the ability of the PAC to
reduce the suspended solids washed out with the decanted effluent. On the other hand, the PAC
did not significantly enhance the methanogenic activity in the AnSBR, thus the sCOD removal
efficiency improvement was not as significant as that of tCOD removal efficiency.
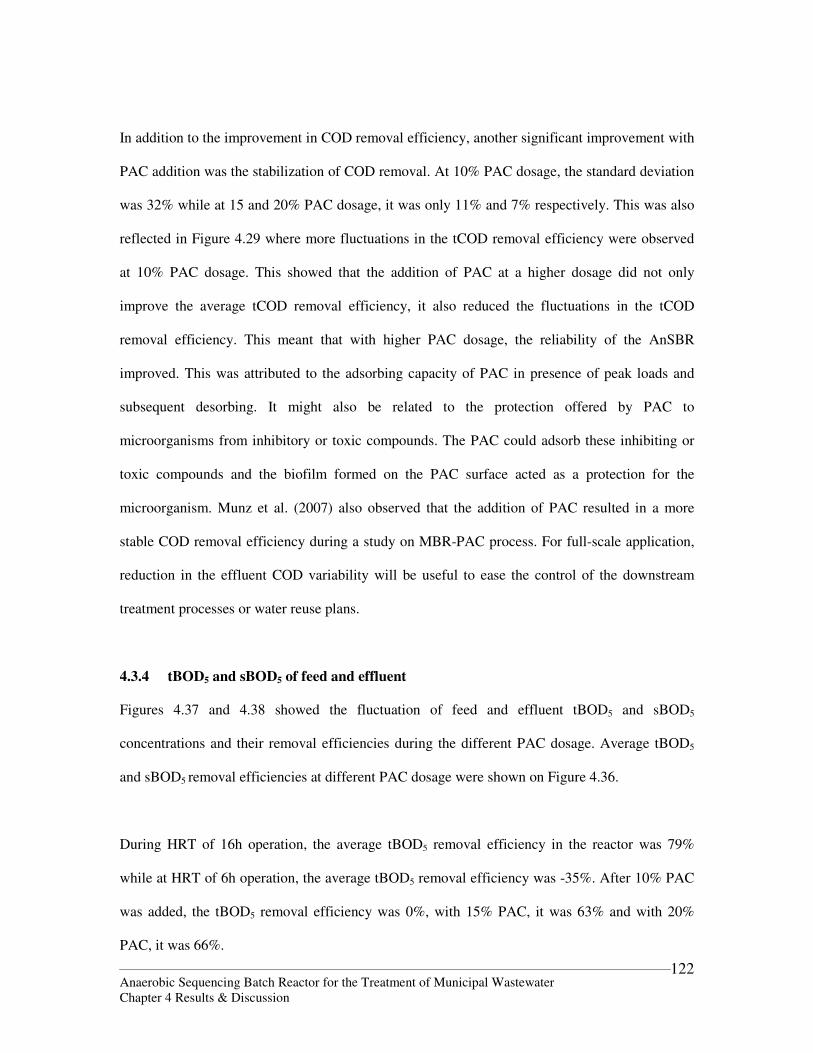
Anaerobic Sequencing Batch Reactor for the Treatment of Municipal Wastewater Chapter 4 Results & Discussion
122
In addition to the improvement in COD removal efficiency, another significant improvement with
PAC addition was the stabilization of COD removal. At 10% PAC dosage, the standard deviation
was 32% while at 15 and 20% PAC dosage, it was only 11% and 7% respectively. This was also
reflected in Figure 4.29 where more fluctuations in the tCOD removal efficiency were observed
at 10% PAC dosage. This showed that the addition of PAC at a higher dosage did not only
improve the average tCOD removal efficiency, it also reduced the fluctuations in the tCOD
removal efficiency. This meant that with higher PAC dosage, the reliability of the AnSBR
improved. This was attributed to the adsorbing capacity of PAC in presence of peak loads and
subsequent desorbing. It might also be related to the protection offered by PAC to
microorganisms from inhibitory or toxic compounds. The PAC could adsorb these inhibiting or
toxic compounds and the biofilm formed on the PAC surface acted as a protection for the
microorganism. Munz et al. (2007) also observed that the addition of PAC resulted in a more
stable COD removal efficiency during a study on MBR-PAC process. For full-scale application,
reduction in the effluent COD variability will be useful to ease the control of the downstream
treatment processes or water reuse plans.
4.3.4 tBOD5 and sBOD5 of feed and effluent
Figures 4.37 and 4.38 showed the fluctuation of feed and effluent tBOD5 and sBOD5
concentrations and their removal efficiencies during the different PAC dosage. Average tBOD5
and sBOD5 removal efficiencies at different PAC dosage were shown on Figure 4.36.
During HRT of 16h operation, the average tBOD5 removal efficiency in the reactor was 79%
while at HRT of 6h operation, the average tBOD5 removal efficiency was -35%. After 10% PAC
was added, the tBOD5 removal efficiency was 0%, with 15% PAC, it was 63% and with 20%
PAC, it was 66%.
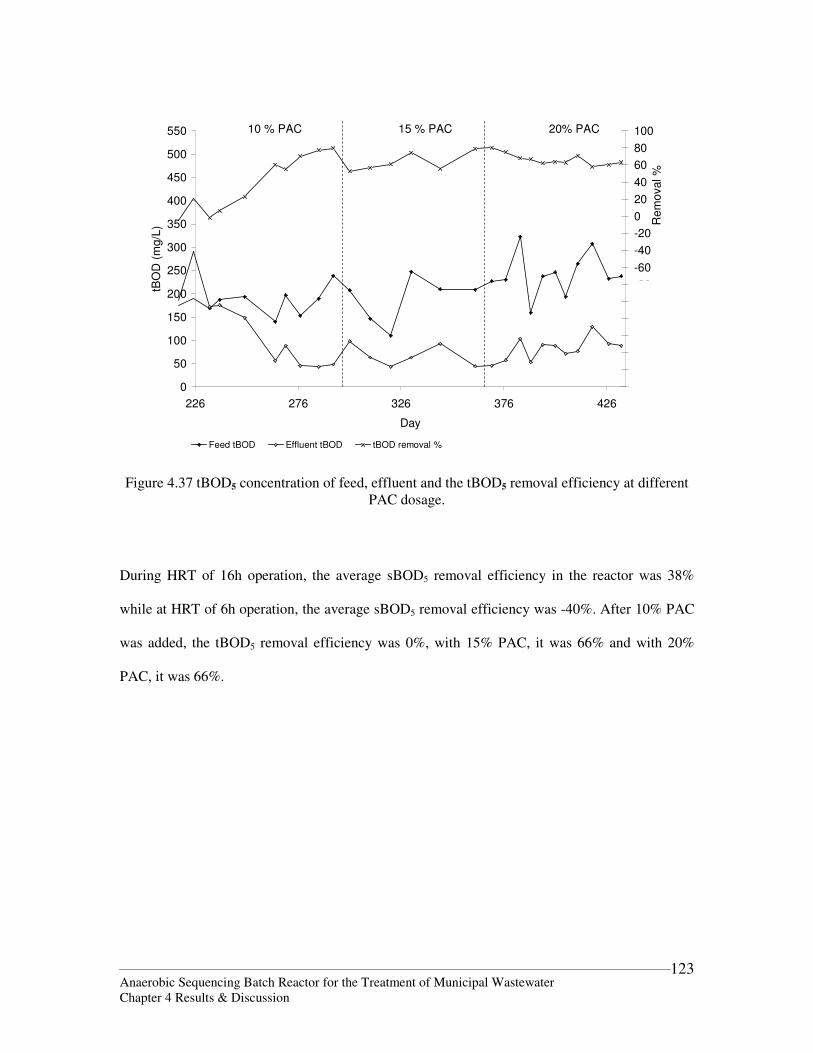
Anaerobic Sequencing Batch Reactor for the Treatment of Municipal Wastewater Chapter 4 Results & Discussion
123
0
50
100
150
200
250
300
350
400
450
500
550
226 276 326 376 426
Day
tBO
D (
mg/L
)
-200
-180
-160
-140
-120
-100
-80
-60
-40
-20
0
20
40
60
80
100
Re
mo
val %
Feed tBOD Effluent tBOD tBOD removal %
10 % PAC 15 % PAC 20% PAC
Figure 4.37 tBOD5 concentration of feed, effluent and the tBOD5 removal efficiency at different
PAC dosage.
During HRT of 16h operation, the average sBOD5 removal efficiency in the reactor was 38%
while at HRT of 6h operation, the average sBOD5 removal efficiency was -40%. After 10% PAC
was added, the tBOD5 removal efficiency was 0%, with 15% PAC, it was 66% and with 20%
PAC, it was 66%.
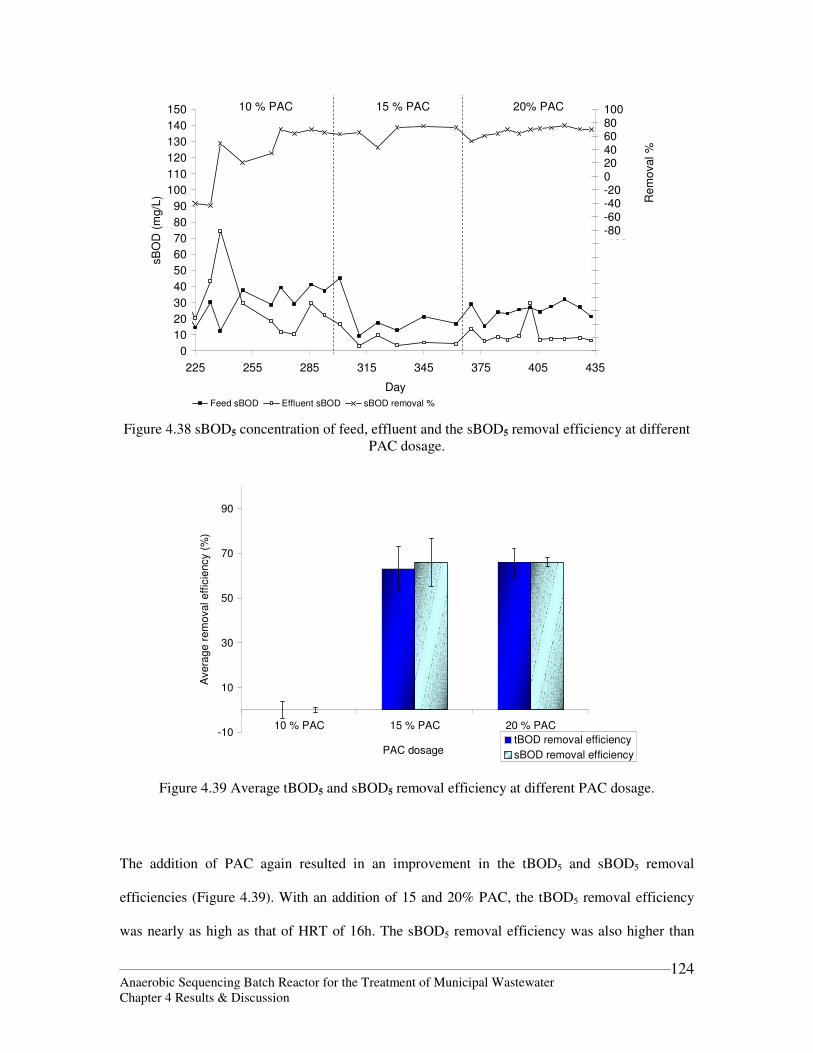
Anaerobic Sequencing Batch Reactor for the Treatment of Municipal Wastewater Chapter 4 Results & Discussion
124
0
10
20
30
40
50
60
70
80
90
100
110
120
130
140
150
225 255 285 315 345 375 405 435
Day
sB
OD
(m
g/L
)
-260-240-220-200-180-160-140-120-100-80-60-40-20020406080100
Re
mo
val %
Feed sBOD Effluent sBOD sBOD removal %
10 % PAC 15 % PAC 20% PAC
Figure 4.38 sBOD5 concentration of feed, effluent and the sBOD5 removal efficiency at different
PAC dosage.
-10
10
30
50
70
90
10 % PAC 15 % PAC 20 % PAC
PAC dosage
Avera
ge
re
mo
val e
ffic
iency (
%)
tBOD removal efficiency
sBOD removal efficiency
Figure 4.39 Average tBOD5 and sBOD5 removal efficiency at different PAC dosage.
The addition of PAC again resulted in an improvement in the tBOD5 and sBOD5 removal
efficiencies (Figure 4.39). With an addition of 15 and 20% PAC, the tBOD5 removal efficiency
was nearly as high as that of HRT of 16h. The sBOD5 removal efficiency was also higher than
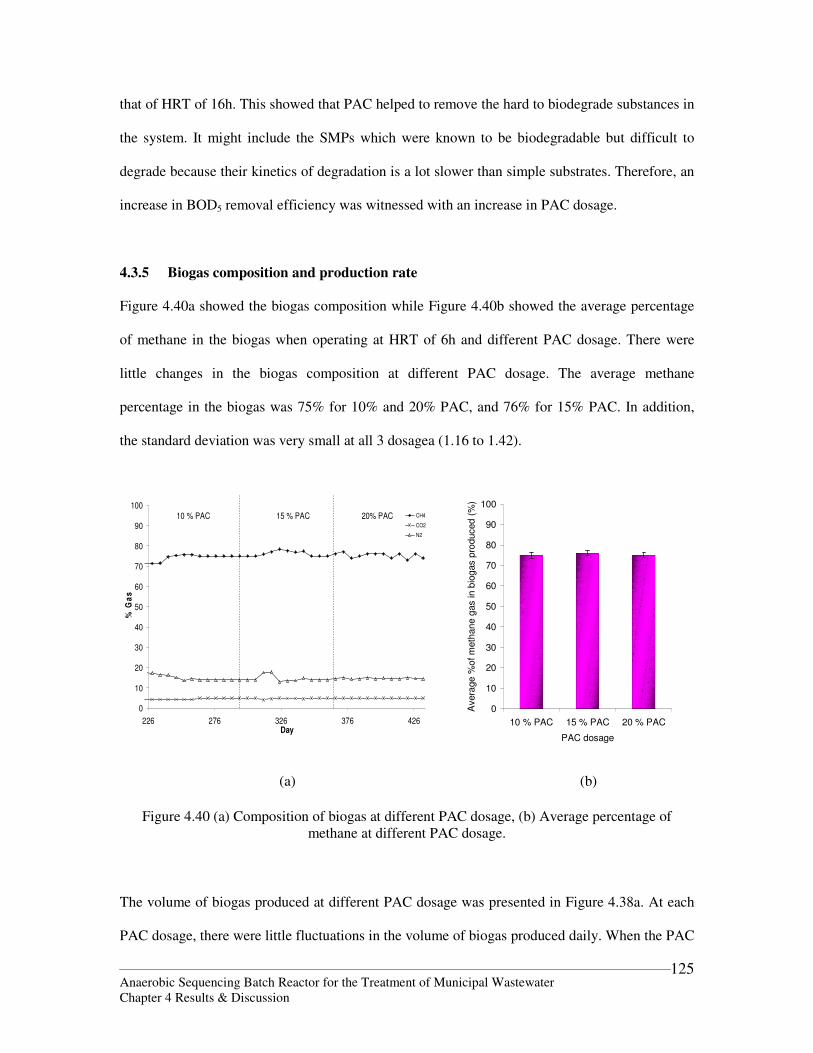
Anaerobic Sequencing Batch Reactor for the Treatment of Municipal Wastewater Chapter 4 Results & Discussion
125
that of HRT of 16h. This showed that PAC helped to remove the hard to biodegrade substances in
the system. It might include the SMPs which were known to be biodegradable but difficult to
degrade because their kinetics of degradation is a lot slower than simple substrates. Therefore, an
increase in BOD5 removal efficiency was witnessed with an increase in PAC dosage.
4.3.5 Biogas composition and production rate
Figure 4.40a showed the biogas composition while Figure 4.40b showed the average percentage
of methane in the biogas when operating at HRT of 6h and different PAC dosage. There were
little changes in the biogas composition at different PAC dosage. The average methane
percentage in the biogas was 75% for 10% and 20% PAC, and 76% for 15% PAC. In addition,
the standard deviation was very small at all 3 dosagea (1.16 to 1.42).
0
10
20
30
40
50
60
70
80
90
100
226 276 326 376 426Day
% G
as
CH4
CO2
N2
10 % PAC 15 % PAC 20% PAC
0
10
20
30
40
50
60
70
80
90
100
10 % PAC 15 % PAC 20 % PAC
PAC dosage
Avera
ge
%o
f m
eth
an
e g
as in b
iog
as p
rod
uced
(%
)
(a) (b)
Figure 4.40 (a) Composition of biogas at different PAC dosage, (b) Average percentage of methane at different PAC dosage.
The volume of biogas produced at different PAC dosage was presented in Figure 4.38a. At each
PAC dosage, there were little fluctuations in the volume of biogas produced daily. When the PAC
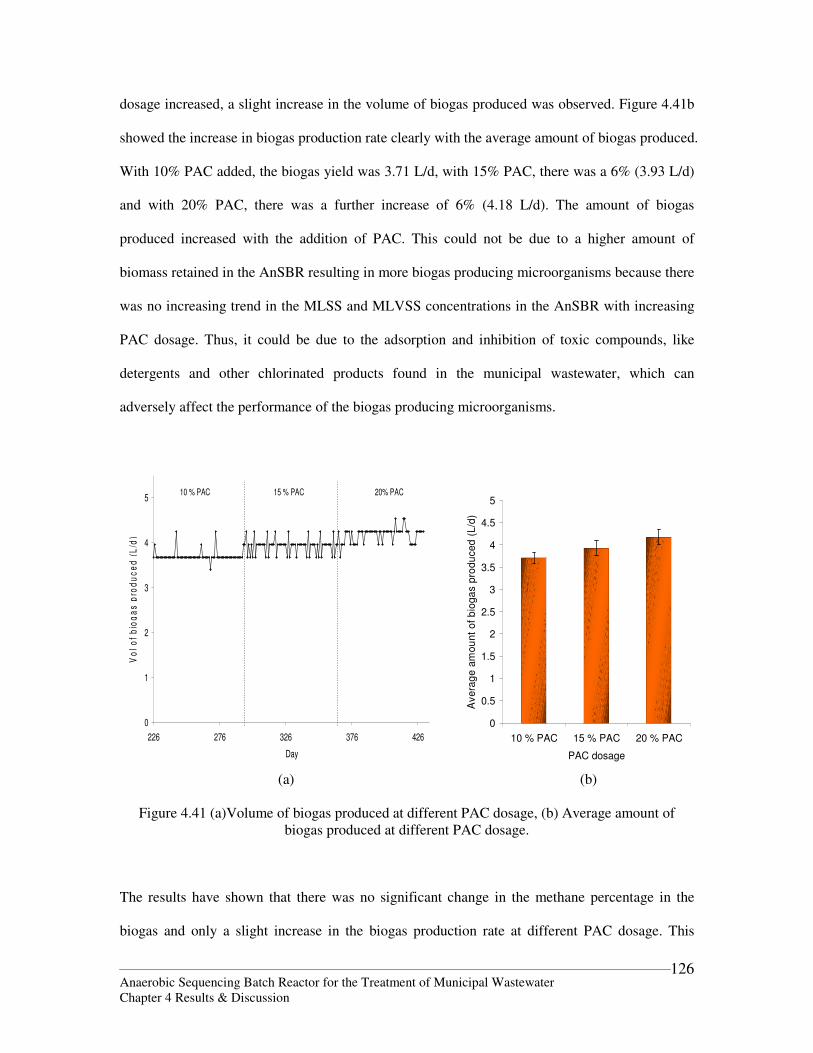
Anaerobic Sequencing Batch Reactor for the Treatment of Municipal Wastewater Chapter 4 Results & Discussion
126
dosage increased, a slight increase in the volume of biogas produced was observed. Figure 4.41b
showed the increase in biogas production rate clearly with the average amount of biogas produced.
With 10% PAC added, the biogas yield was 3.71 L/d, with 15% PAC, there was a 6% (3.93 L/d)
and with 20% PAC, there was a further increase of 6% (4.18 L/d). The amount of biogas
produced increased with the addition of PAC. This could not be due to a higher amount of
biomass retained in the AnSBR resulting in more biogas producing microorganisms because there
was no increasing trend in the MLSS and MLVSS concentrations in the AnSBR with increasing
PAC dosage. Thus, it could be due to the adsorption and inhibition of toxic compounds, like
detergents and other chlorinated products found in the municipal wastewater, which can
adversely affect the performance of the biogas producing microorganisms.
0
1
2
3
4
5
226 276 326 376 426
Day
Vo
l o
f b
iog
as
pro
du
ce
d (
L/d
)
10 % PAC 15 % PAC 20% PAC
0
0.5
1
1.5
2
2.5
3
3.5
4
4.5
5
10 % PAC 15 % PAC 20 % PAC
PAC dosage
Ave
rag
e a
mo
un
t o
f b
iog
as p
rod
uce
d (
L/d
)
(a) (b)
Figure 4.41 (a)Volume of biogas produced at different PAC dosage, (b) Average amount of
biogas produced at different PAC dosage.
The results have shown that there was no significant change in the methane percentage in the
biogas and only a slight increase in the biogas production rate at different PAC dosage. This
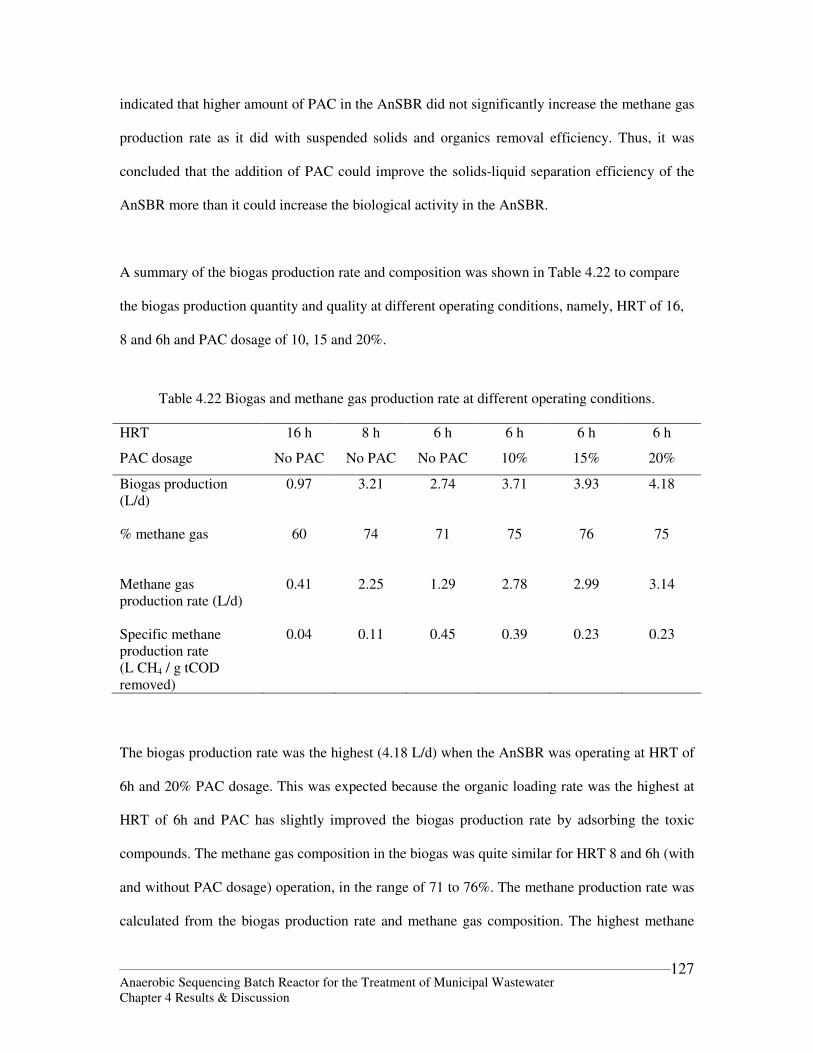
Anaerobic Sequencing Batch Reactor for the Treatment of Municipal Wastewater Chapter 4 Results & Discussion
127
indicated that higher amount of PAC in the AnSBR did not significantly increase the methane gas
production rate as it did with suspended solids and organics removal efficiency. Thus, it was
concluded that the addition of PAC could improve the solids-liquid separation efficiency of the
AnSBR more than it could increase the biological activity in the AnSBR.
A summary of the biogas production rate and composition was shown in Table 4.22 to compare
the biogas production quantity and quality at different operating conditions, namely, HRT of 16,
8 and 6h and PAC dosage of 10, 15 and 20%.
Table 4.22 Biogas and methane gas production rate at different operating conditions. HRT 16 h 8 h 6 h 6 h 6 h 6 h
PAC dosage No PAC No PAC No PAC 10% 15% 20%
Biogas production (L/d)
0.97 3.21 2.74 3.71 3.93 4.18
% methane gas 60 74 71 75 76 75
Methane gas production rate (L/d)
0.41 2.25 1.29 2.78 2.99 3.14
Specific methane production rate (L CH4 / g tCOD removed)
0.04 0.11 0.45 0.39 0.23 0.23
The biogas production rate was the highest (4.18 L/d) when the AnSBR was operating at HRT of
6h and 20% PAC dosage. This was expected because the organic loading rate was the highest at
HRT of 6h and PAC has slightly improved the biogas production rate by adsorbing the toxic
compounds. The methane gas composition in the biogas was quite similar for HRT 8 and 6h (with
and without PAC dosage) operation, in the range of 71 to 76%. The methane production rate was
calculated from the biogas production rate and methane gas composition. The highest methane
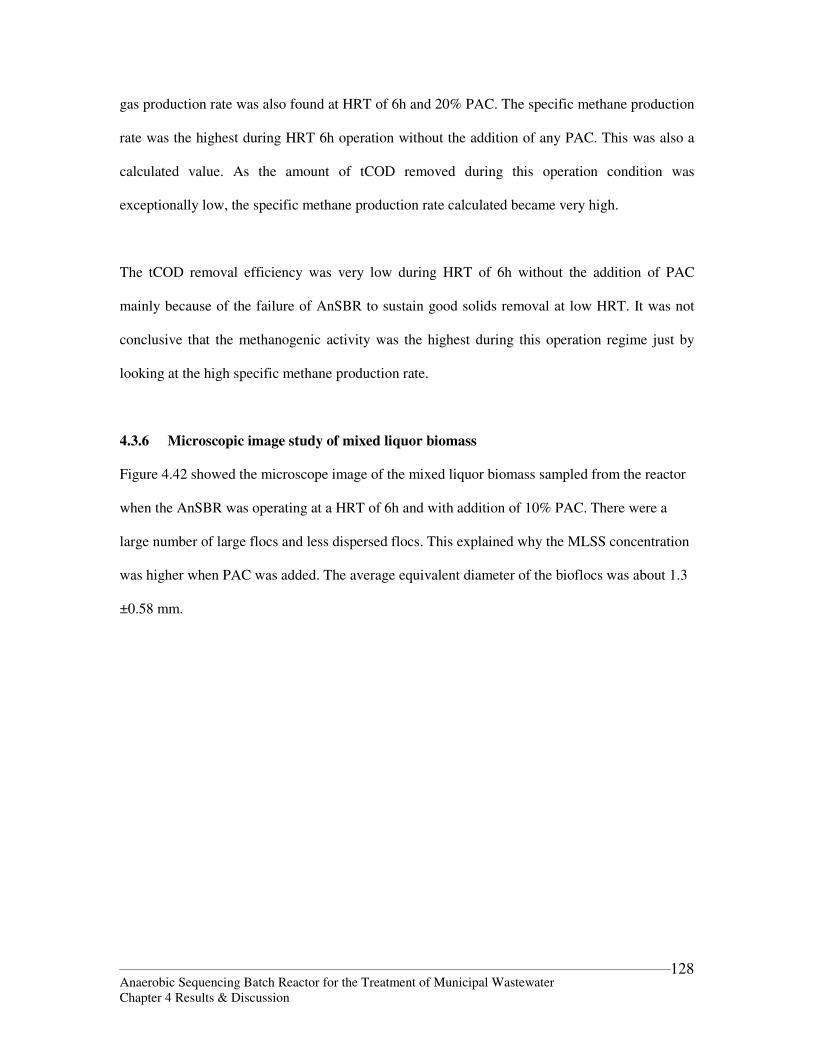
Anaerobic Sequencing Batch Reactor for the Treatment of Municipal Wastewater Chapter 4 Results & Discussion
128
gas production rate was also found at HRT of 6h and 20% PAC. The specific methane production
rate was the highest during HRT 6h operation without the addition of any PAC. This was also a
calculated value. As the amount of tCOD removed during this operation condition was
exceptionally low, the specific methane production rate calculated became very high.
The tCOD removal efficiency was very low during HRT of 6h without the addition of PAC
mainly because of the failure of AnSBR to sustain good solids removal at low HRT. It was not
conclusive that the methanogenic activity was the highest during this operation regime just by
looking at the high specific methane production rate.
4.3.6 Microscopic image study of mixed liquor biomass
Figure 4.42 showed the microscope image of the mixed liquor biomass sampled from the reactor
when the AnSBR was operating at a HRT of 6h and with addition of 10% PAC. There were a
large number of large flocs and less dispersed flocs. This explained why the MLSS concentration
was higher when PAC was added. The average equivalent diameter of the bioflocs was about 1.3
±0.58 mm.
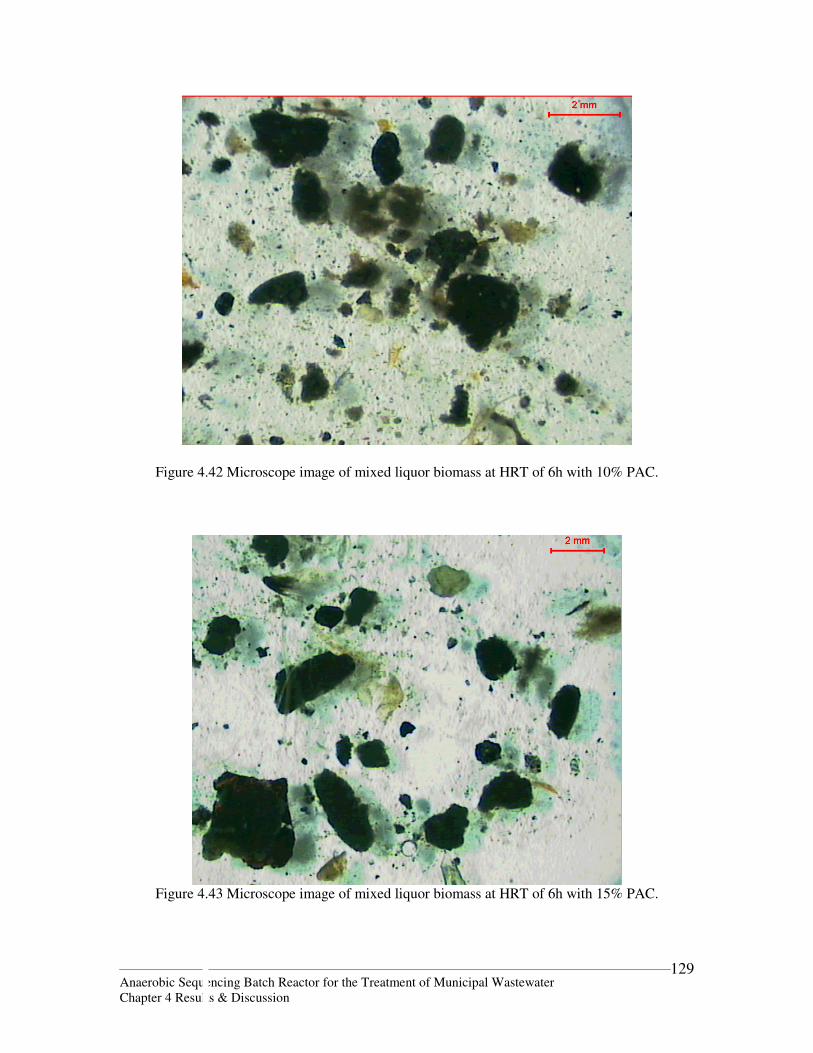
Anaerobic Sequencing Batch Reactor for the Treatment of Municipal Wastewater Chapter 4 Results & Discussion
129
Figure 4.42 Microscope image of mixed liquor biomass at HRT of 6h with 10% PAC.
Figure 4.43 Microscope image of mixed liquor biomass at HRT of 6h with 15% PAC.
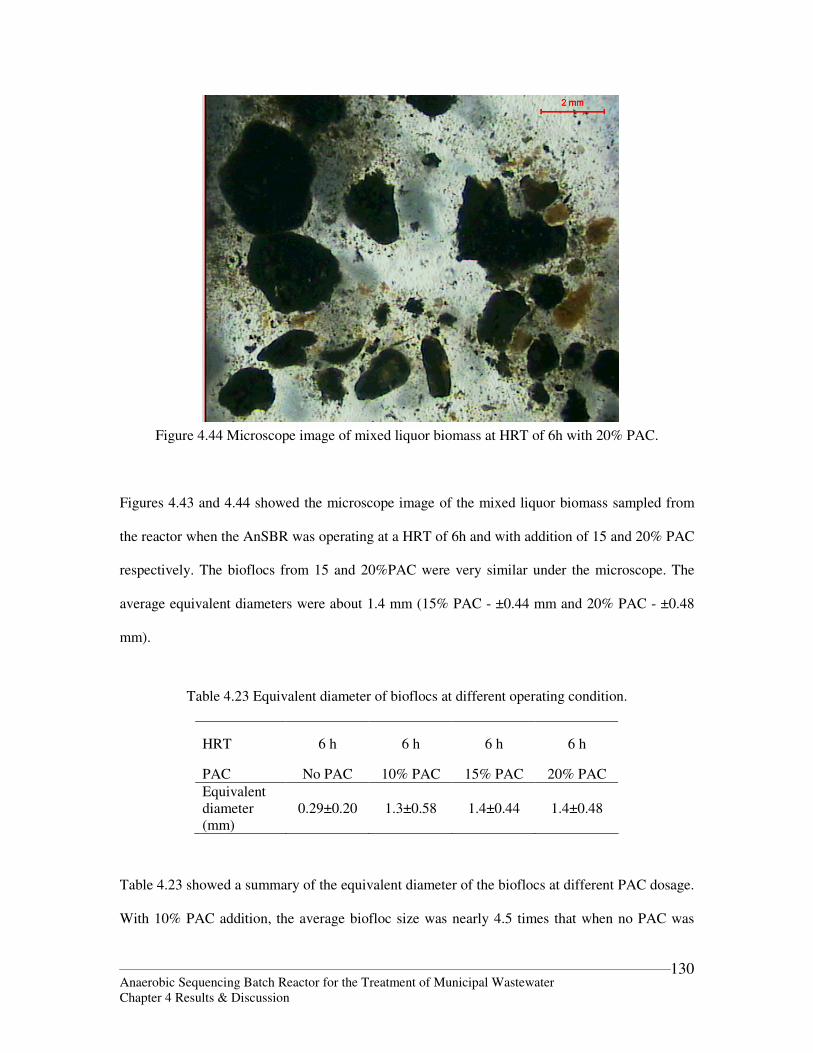
Anaerobic Sequencing Batch Reactor for the Treatment of Municipal Wastewater Chapter 4 Results & Discussion
130
Figure 4.44 Microscope image of mixed liquor biomass at HRT of 6h with 20% PAC.
Figures 4.43 and 4.44 showed the microscope image of the mixed liquor biomass sampled from
the reactor when the AnSBR was operating at a HRT of 6h and with addition of 15 and 20% PAC
respectively. The bioflocs from 15 and 20%PAC were very similar under the microscope. The
average equivalent diameters were about 1.4 mm (15% PAC - ±0.44 mm and 20% PAC - ±0.48
mm).
Table 4.23 Equivalent diameter of bioflocs at different operating condition.
HRT 6 h 6 h 6 h 6 h
PAC No PAC 10% PAC 15% PAC 20% PAC Equivalent diameter (mm)
0.29±0.20 1.3±0.58 1.4±0.44 1.4±0.48
Table 4.23 showed a summary of the equivalent diameter of the bioflocs at different PAC dosage.
With 10% PAC addition, the average biofloc size was nearly 4.5 times that when no PAC was
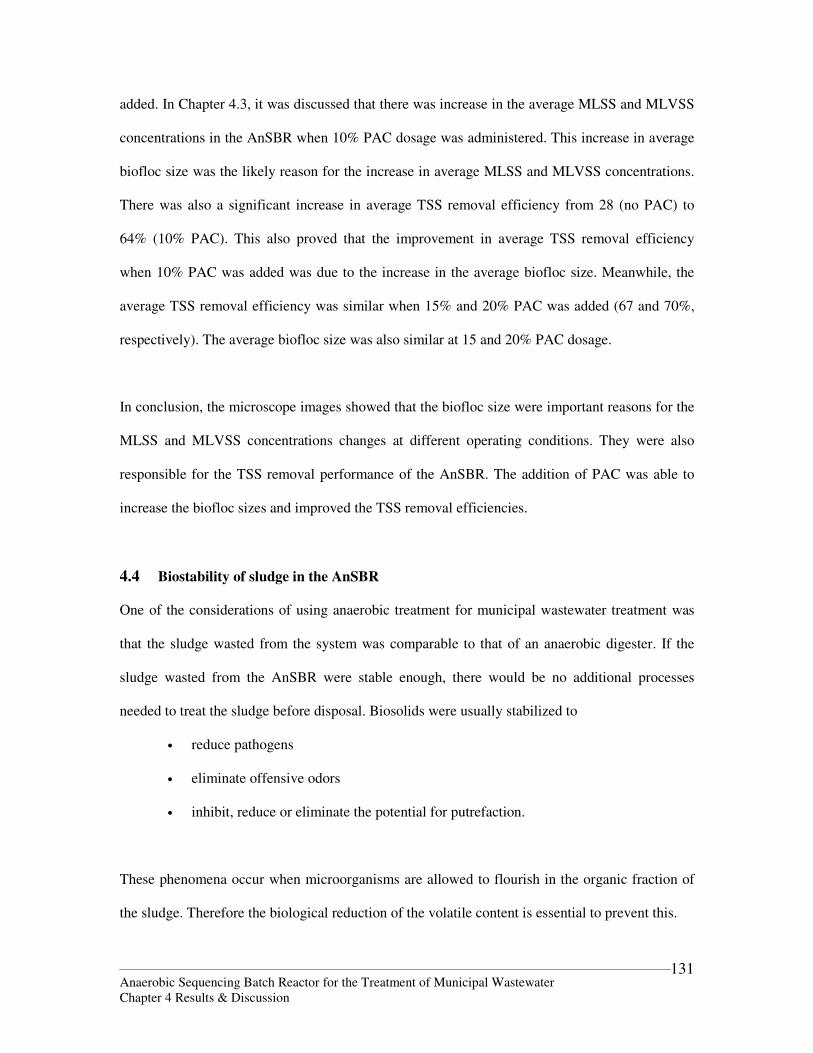
Anaerobic Sequencing Batch Reactor for the Treatment of Municipal Wastewater Chapter 4 Results & Discussion
131
added. In Chapter 4.3, it was discussed that there was increase in the average MLSS and MLVSS
concentrations in the AnSBR when 10% PAC dosage was administered. This increase in average
biofloc size was the likely reason for the increase in average MLSS and MLVSS concentrations.
There was also a significant increase in average TSS removal efficiency from 28 (no PAC) to
64% (10% PAC). This also proved that the improvement in average TSS removal efficiency
when 10% PAC was added was due to the increase in the average biofloc size. Meanwhile, the
average TSS removal efficiency was similar when 15% and 20% PAC was added (67 and 70%,
respectively). The average biofloc size was also similar at 15 and 20% PAC dosage.
In conclusion, the microscope images showed that the biofloc size were important reasons for the
MLSS and MLVSS concentrations changes at different operating conditions. They were also
responsible for the TSS removal performance of the AnSBR. The addition of PAC was able to
increase the biofloc sizes and improved the TSS removal efficiencies.
4.4 Biostability of sludge in the AnSBR
One of the considerations of using anaerobic treatment for municipal wastewater treatment was
that the sludge wasted from the system was comparable to that of an anaerobic digester. If the
sludge wasted from the AnSBR were stable enough, there would be no additional processes
needed to treat the sludge before disposal. Biosolids were usually stabilized to
• reduce pathogens
• eliminate offensive odors
• inhibit, reduce or eliminate the potential for putrefaction.
These phenomena occur when microorganisms are allowed to flourish in the organic fraction of
the sludge. Therefore the biological reduction of the volatile content is essential to prevent this.
Anaerobic Sequencing Batch Reactor for the Treatment of Municipal Wastewater Chapter 4 Results & Discussion
132
The additional volatile solids reduction (AVSR) test has long been the primary measure of the
degree of stabilization achieved. Stability assessment for anaerobically digested sludge is based
on volatile solids reduction (VSR) criteria from the Part 503 rule for vector attraction reduction
(VAR). Jeris et al. (1985) concluded that anaerobically digested sludge could be considered to
have been stabilized if the FVSR was less than 17% during bench-scale anaerobic batch digestion
for 40 additional days at 30 to 40 oC was achieved. This is the basis of Option 2 for VAR in the
Part 503 rule. This criterion is also recommended as a basis for assessing sludge stability
(Switzenbaum et al., 1997).
The sludge collected from the anaerobic sludge digester in the Ulu Pandan Water Reclamation
Plant acted as a control for this set of data. Mixed liquor sludge was collected during each
different operating condition. Figure 4.45 showed the results of the biostability of anaerobic
digester sludge and AnSBR sludge from different operating condition. All the sludge samples
collected fulfilled the criterion for sludge biostability.
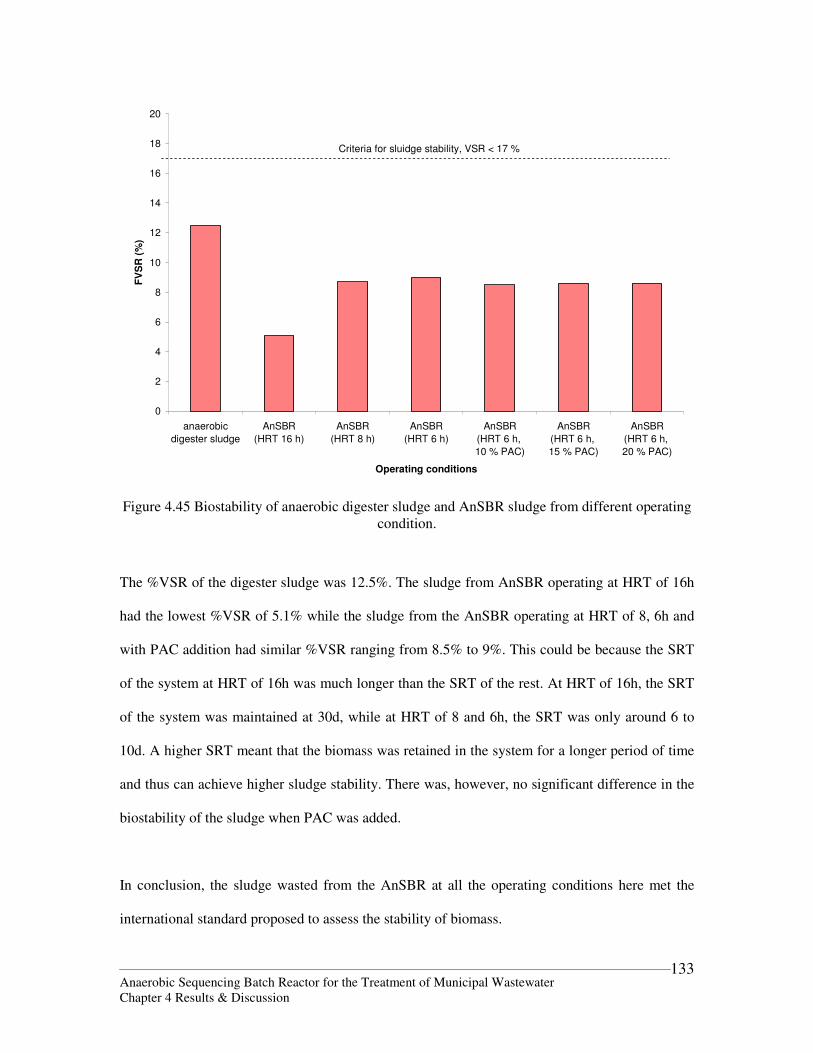
Anaerobic Sequencing Batch Reactor for the Treatment of Municipal Wastewater Chapter 4 Results & Discussion
133
0
2
4
6
8
10
12
14
16
18
20
anaerobic
digester sludge
AnSBR
(HRT 16 h)
AnSBR
(HRT 8 h)
AnSBR
(HRT 6 h)
AnSBR
(HRT 6 h,
10 % PAC)
AnSBR
(HRT 6 h,
15 % PAC)
AnSBR
(HRT 6 h,
20 % PAC)
Operating conditions
FV
SR
(%
)Criteria for sluidge stability, VSR < 17 %
Figure 4.45 Biostability of anaerobic digester sludge and AnSBR sludge from different operating condition.
The %VSR of the digester sludge was 12.5%. The sludge from AnSBR operating at HRT of 16h
had the lowest %VSR of 5.1% while the sludge from the AnSBR operating at HRT of 8, 6h and
with PAC addition had similar %VSR ranging from 8.5% to 9%. This could be because the SRT
of the system at HRT of 16h was much longer than the SRT of the rest. At HRT of 16h, the SRT
of the system was maintained at 30d, while at HRT of 8 and 6h, the SRT was only around 6 to
10d. A higher SRT meant that the biomass was retained in the system for a longer period of time
and thus can achieve higher sludge stability. There was, however, no significant difference in the
biostability of the sludge when PAC was added.
In conclusion, the sludge wasted from the AnSBR at all the operating conditions here met the
international standard proposed to assess the stability of biomass.
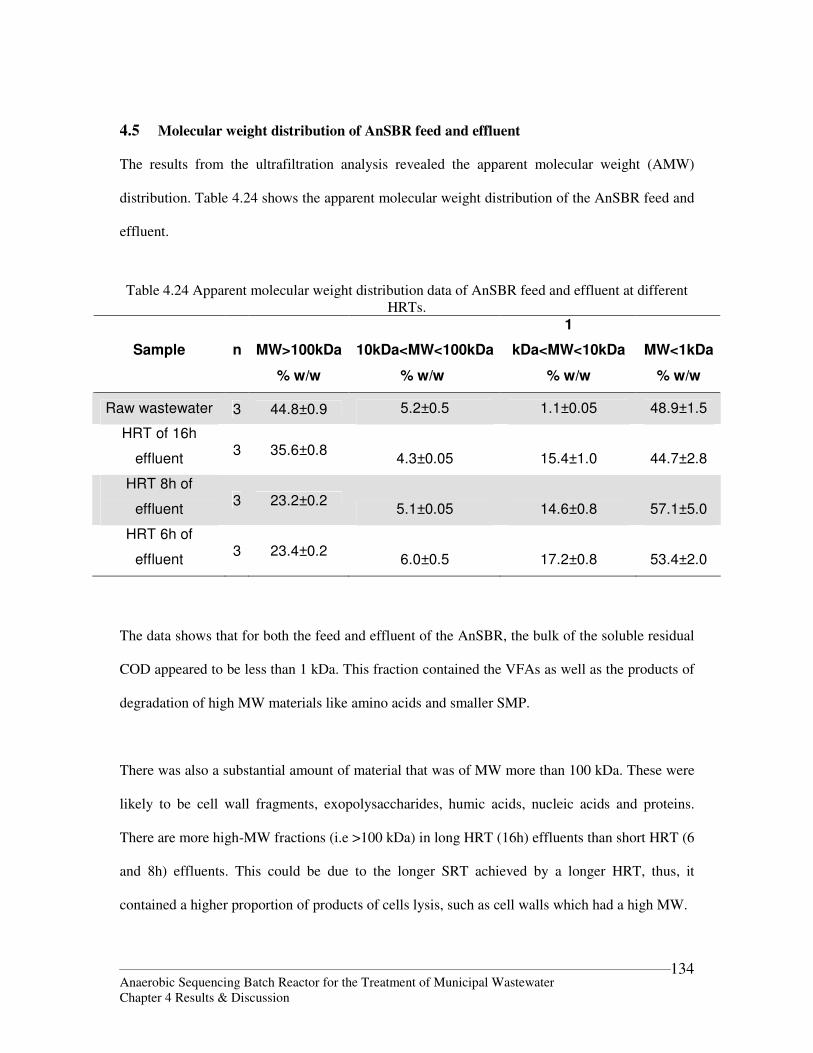
Anaerobic Sequencing Batch Reactor for the Treatment of Municipal Wastewater Chapter 4 Results & Discussion
134
4.5 Molecular weight distribution of AnSBR feed and effluent
The results from the ultrafiltration analysis revealed the apparent molecular weight (AMW)
distribution. Table 4.24 shows the apparent molecular weight distribution of the AnSBR feed and
effluent.
Table 4.24 Apparent molecular weight distribution data of AnSBR feed and effluent at different HRTs.
MW>100kDa 10kDa<MW<100kDa
1
kDa<MW<10kDa MW<1kDa Sample n
% w/w % w/w % w/w % w/w
Raw wastewater 3 44.8±0.9 5.2±0.5 1.1±0.05 48.9±1.5
HRT of 16h
effluent 3 35.6±0.8
4.3±0.05 15.4±1.0 44.7±2.8
HRT 8h of
effluent 3 23.2±0.2
5.1±0.05 14.6±0.8 57.1±5.0
HRT 6h of
effluent 3 23.4±0.2
6.0±0.5 17.2±0.8 53.4±2.0
The data shows that for both the feed and effluent of the AnSBR, the bulk of the soluble residual
COD appeared to be less than 1 kDa. This fraction contained the VFAs as well as the products of
degradation of high MW materials like amino acids and smaller SMP.
There was also a substantial amount of material that was of MW more than 100 kDa. These were
likely to be cell wall fragments, exopolysaccharides, humic acids, nucleic acids and proteins.
There are more high-MW fractions (i.e >100 kDa) in long HRT (16h) effluents than short HRT (6
and 8h) effluents. This could be due to the longer SRT achieved by a longer HRT, thus, it
contained a higher proportion of products of cells lysis, such as cell walls which had a high MW.
Anaerobic Sequencing Batch Reactor for the Treatment of Municipal Wastewater Chapter 4 Results & Discussion
135
From the AMW data collected from the AnSBR study, the data clearly showed a bimodal
distribution. Majority of the compounds in the AnSBR effluent had AMW of greater than 100
kDa and less than 1 kDa. This was similar to what was found by Barker and Stuckey (1999) who
concluded in their review paper that both aerobically- and anaerobically- treated effluents usually
displayed a bimodal molecular weight distribution. Among other researches which showed
similar results, Kuo and Parkin (1996) tried to find out the molecular weight distribution of
anaerobic effluents from anaerobic chemostats. It was found that the molecular weight
distribution was very similar to that of aerobic effluents, i.e. bimodal with the majority of SMP
having AMW less than 1 kDa or greater than 10 kDa while that of AMW between 1 and 10 kDa
was comparatively lower. Schiener et al. (1998) examined the MW distribution of SMP in an
ABR and found that it exhibited a bimodal distribution with 30% having MW less than 1 kDa and
25% greater than 100 kDa. This was very similar to what was found for the AnSBR effluents.
The AnSBR feed also observed a bimodal patterns. However, this was not entirely supported by
literatures. Parkin and McCarty (1981a) found that 50 to 60% of the soluble organic nitrogen and
sCOD in untreated municipal wastewater had AMWs of less than 1.8 kDa as measured by GPC.
Barker and Stuckey (1999) concluded in their review paper that reactor influents generally exhibit
skewed non-normal MW distributions with a predominance of the very low MW fraction (<0.5
kDa). However, it was not stated clearly what type of influent was referred to and it seemed like
they referred to the entire variety of substrate possible, including domestic wastewater, synthetic
wastewater, glucose, phenol, sucrose, etc.
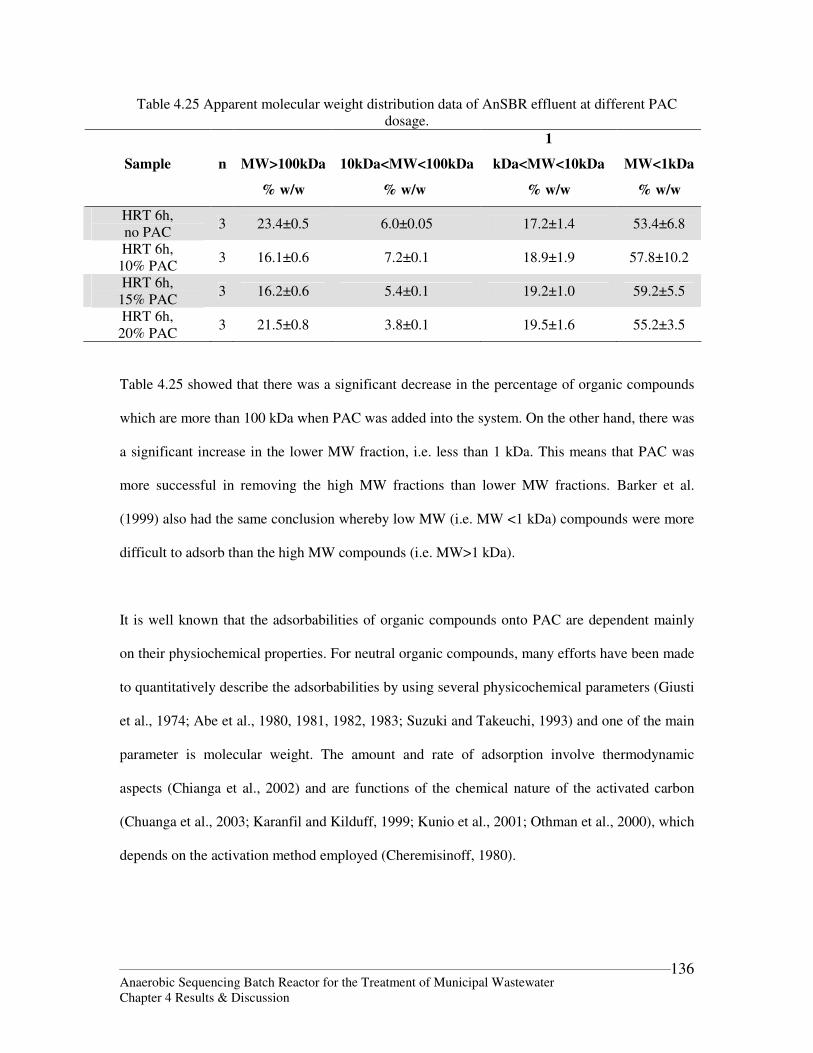
Anaerobic Sequencing Batch Reactor for the Treatment of Municipal Wastewater Chapter 4 Results & Discussion
136
Table 4.25 Apparent molecular weight distribution data of AnSBR effluent at different PAC dosage.
MW>100kDa 10kDa<MW<100kDa
1
kDa<MW<10kDa MW<1kDa Sample n
% w/w % w/w % w/w % w/w
HRT 6h, no PAC
3 23.4±0.5 6.0±0.05 17.2±1.4 53.4±6.8
HRT 6h, 10% PAC
3 16.1±0.6 7.2±0.1 18.9±1.9 57.8±10.2
HRT 6h, 15% PAC
3 16.2±0.6 5.4±0.1 19.2±1.0 59.2±5.5
HRT 6h, 20% PAC
3 21.5±0.8 3.8±0.1 19.5±1.6 55.2±3.5
Table 4.25 showed that there was a significant decrease in the percentage of organic compounds
which are more than 100 kDa when PAC was added into the system. On the other hand, there was
a significant increase in the lower MW fraction, i.e. less than 1 kDa. This means that PAC was
more successful in removing the high MW fractions than lower MW fractions. Barker et al.
(1999) also had the same conclusion whereby low MW (i.e. MW <1 kDa) compounds were more
difficult to adsorb than the high MW compounds (i.e. MW>1 kDa).
It is well known that the adsorbabilities of organic compounds onto PAC are dependent mainly
on their physiochemical properties. For neutral organic compounds, many efforts have been made
to quantitatively describe the adsorbabilities by using several physicochemical parameters (Giusti
et al., 1974; Abe et al., 1980, 1981, 1982, 1983; Suzuki and Takeuchi, 1993) and one of the main
parameter is molecular weight. The amount and rate of adsorption involve thermodynamic
aspects (Chianga et al., 2002) and are functions of the chemical nature of the activated carbon
(Chuanga et al., 2003; Karanfil and Kilduff, 1999; Kunio et al., 2001; Othman et al., 2000), which
depends on the activation method employed (Cheremisinoff, 1980).
Anaerobic Sequencing Batch Reactor for the Treatment of Municipal Wastewater Chapter 5 Conclusions & Recommendations
137
Chapter 5 Conclusions & Recommendations
5.1 Conclusions
The performance of the AnSBR treating municipal wastewater from a local water reclamation
plant was studied under two start-up conditions, namely a HRTs of 16 and 8h. The HRT was then
reduced to 6h to study its capability to perform under a low HRT. A comparison was done to
evaluate the performance of the AnSBR under 3 HRTs, 16, 8 and 6h. Subsequently, powdered
activated carbon was added into the AnSBR (HRT of 6h) at a dosage of 10, 15 and 20% to
investigate its effect on the performance of the AnSBR. The following are the conclusions drawn
from the study.
5.1.1 Start-up study
Using a start-up HRT of 16h, it took 110d for the reactor to achieve stable performance. With
start-up HRT of 8h, it only took 70d. The limiting factor for achieving stability at higher HRT
was the sCOD removal efficiency while at that lower HRT was the biogas quality and quantity.
It was found that a higher organic loading rate increased the amount of solids retained in the
AnSBR. The MLVSS to MLSS ratio also seemed to be relatively higher at a higher organic
loading rate, meaning that the biodegradable organic portion of the biomass was also higher.
The suspended solids removal efficiency was higher at HRT of 16 than 8h and this was
interrelated to the SRT of the system. The tCOD removal efficiency was also higher and more
Anaerobic Sequencing Batch Reactor for the Treatment of Municipal Wastewater Chapter 5 Conclusions & Recommendations
138
consistent when operating at a higher HRT of 16h. This meant that at a higher HRT, the effluent
produced had a higher quality. However, the sCOD removal efficiency was relatively low at HRT
of 16h compared to that of 8h. This was attributed to the slow growth rate of the fermentors and
methanogens compared to other hydrolytic and acidogenic bacteria. Their slow growth rate was
further aggravated by the low organic loading rate at high HRTs, resulting in a suboptimal
condition for these rate limiting microorganisms to grow.
The higher methane production at a lower HRT also showed that a higher organic loading rate
was preferred by the anaerobic microorganisms.
This start-up study has shown that a higher start-up HRT will be able to produce a higher-quality
effluent in terms of suspended solids and COD concentration but the biogas production will be
slower and less than that of a shorter HRT. This resulted in a prolonged start-up period. Therefore
a compromise has to be reached between effluent quality and biogas production to choose a
suitable HRT for start-up.
5.1.2 Performance of AnSBR at different HRTs
The amount of solids that were retained in the AnSBR was lower at HRT of 16 than 8h because
of the longer duration of the reaction phase. This gave the microorganisms more time to convert
the complex organic molecules to soluble monomer molecules. More suspended solids could be
converted into soluble compounds during the longer HRT of 16h, thus reducing the MLSS and
MLVSS concentrations. However, the amount of solids that were retained in the AnSBR was
lower at HRT of 6 than 8h. This contradicted to the reason suggested previously. The lower
MLSS and MLVSS at HRT of 6h was because of the lower decant point in the AnSBR reactor.
Therefore, the amount of biomass solids which could be retained in the reactors was not only
Anaerobic Sequencing Batch Reactor for the Treatment of Municipal Wastewater Chapter 5 Conclusions & Recommendations
139
dependent on the HRT of the system but also on the respective operational conditions of the
system.
The suspended solids and organics removal efficiencies were the highest at HRT of 16h. They
decreased significantly with a decrease in HRT. A shorter HRT resulted in an increase in the
amount of dispersed flocs in the AnSBR, causing a deterioration of the solid-liquid separation
efficiency.
A shorter HRT resulted in a higher specific methane production rate. However, the methane yield
of the AnSBR was not comparable to that presented by previous researches which treated high
strength industrial wastewater. This showed that the AnSBR was more efficient in treating high
strength industrial wastewater than low strength municipal wastewater.
T-RFLP profiles showed that a change in HRT did not result in a significant change in the
bacterial community structure. There were slight differences in the peaks but these were due more
to the sludge source than the operating HRT. The T-RFLP profiles for the archaea consisted of
only two prominent peaks, showing that there were only 2 species of archaea dominant in the
AnSBR at all 3 HRTs. The change in HRT did not result in significant changes in the bacterial
population but caused a complete change in the archaeal population. This showed that bacteria
had a larger tolerance towards changes in organic loading rate of the system than archaea.
The microscopic study of the mixed liquor biomass at different HRT showed a slight increase in
the biofloc sizes when the HRT was decreased from 16 to 8h. However, the biofloc size during
HRT of 6h was significantly bigger than that of HRT of 8h. This was caused by the higher loss of
TSS in the effluent during a shorter HRT operation.
Anaerobic Sequencing Batch Reactor for the Treatment of Municipal Wastewater Chapter 5 Conclusions & Recommendations
140
5.1.3 Enhancement of AnSBR performance using PAC
The MLSS and MLVSS concentrations in the AnSBR were expected to increase with an increase
in the PAC dosage, but results have shown that there was no clear relationship between the two.
There was a large improvement in the TSS and VSS removal efficiencies when PAC was added
into system. The improvement in TSS and VSS removal efficiencies could be due to the change
in sludge quality in the AnSBR. Larger and denser flocs could be formed and SMPs, which were
known to adversely affect the kinetic activity and the flocculating and settling properties, were
removed by the PAC. Therefore, there was less tendency for the biomass to experience a washout
during the decant phase.
There was also an increase in the tCOD and sCOD removal efficiency when PAC was added.
PAC aided in the removal of substances which were hard to degrade. Another significant finding
was that PAC resulted in a more stable COD removal efficiency. The PAC could adsorb these
inhibiting or toxic compounds and the biofilm formed on the PAC surface acted as a protection
for the microorganism. This reduction in the variability of the effluent COD will be very useful,
especially for a plant which has further downstream treatment processes or water reuse plans.
The BOD5 removal efficiency was also found to be higher with a higher PAC dosage. BOD5
included the SMPs and was known to be biodegradable but difficult to degrade because their
kinetics of degradation is a lot slower than simple substrates. PAC was capable of removing the
SMP, thus improving the BOD5 removal efficiency.
The amount of methane gas produced increased with the addition of PAC. This showed that the
addition of PAC favored the growth conditions of the methanogens and thus improving their
Anaerobic Sequencing Batch Reactor for the Treatment of Municipal Wastewater Chapter 5 Conclusions & Recommendations
141
efficiencies. The amount of methane produced also became more stable as the daily production
volume and the biogas and the methane percentage in the biogas was quite consistent.
The PAC has indeed improved the performance of the AnSBR in terms of effluent quality and
biogas production rate. It was also found that a PAC dosage of 10% (w/w) was sufficient to
improve the performance of the AnSBR and any further increase in dosage had resulted in only
slight differences.
The microscopic study of the mixed liquor biomass showed that the addition of PAC resulted in a
significant increase in the biofloc sizes. The images also showed that the amount of PAC dosed
played little part in affecting the size of the bioflocs.
5.1.4 Biostability of sludge in AnSBR
The sludge wasted from the AnSBR at all the operating conditions here met the international
standard (Option 2 for VAR in the Part 503 rule) proposed by Switzenbaum et al.(1997) to assess
the stability of biomass. The biostability of the sludge wasted depended mainly on the SRT of the
system rather than the HRT. The PAC added did not cause any significant changes in the
biostability of the sludge.
5.1.5 Molecular weight distribution of AnSBR feed and effluent
The AMW data showed that both the AnSBR feed and effluent has a bimodal distribution.
Majority of the compounds had AMW of greater than 100 kDa and less than 1 kDa. There were
also more high-MW fractions (i.e >100 kDa) in long HRT (16h) effluents than short HRT (6 and
8h) effluents because of a longer SRT.

Anaerobic Sequencing Batch Reactor for the Treatment of Municipal Wastewater Chapter 5 Conclusions & Recommendations
142
PAC was found to be more successful in removing the high MW fractions than lower MW
fractions. This was because there was a significant decrease in the percentage of organic
compounds which are more than 100 kDa and a significant increase in the lower MW fraction,
i.e., less than 1 kDa, when PAC was added into the system.
5.2 Recommendations
This research study has shown that the AnSBR has the potential of treating municipal wastewater.
In the meantime, optimization of the AnSBR system is desired because the performance of the
AnSBR was still a far cry from aerobic systems in terms of suspended solids and organics
removal. Operation parameters other than HRTs can be studied to improve the AnSBR’s
performance. For example, Shizas and Bagley (2002) found that longer fill times for a given
cycle time improve the performance of an anaerobic reactor treating a rapidly acidifying substrate
such as glucose. They also found that for identical fill-to-cycle time ratios at the same loading
rate, shorter cycle times with lower initial substrate concentrations provide improved ASBR
performance. Therefore, the AnSBR has the potential of achieving better performance by
optimizing such operation parameters.
Considering the quality of the AnSBR-treated effluent, aerobic post treatment is required for
effluents to reach discharge standards. There are many literatures studying anaerobic-aerobic
systems treating a variety of wastewater type (He et al., 2007; Sánchez et al., 2007; Pophali et al.,
2007; Mossvi and Madamwar, 1997). Aerobic post treatment systems are not only required for
further suspended solids and organic removal, it is also needed for the removal of nutrients like
nitrogen and phosphorus. The challenges in treating anaerobically-treated effluent will be
different from treating raw sewage.
Anaerobic Sequencing Batch Reactor for the Treatment of Municipal Wastewater Chapter 5 Conclusions & Recommendations
143
As the AnSBR was used to treat raw sewage water, the variations in the incoming wastewater
becomes a concern. The flow variation, in particular, was expected to affect the performance of
the AnSBR. It is important to study whether the AnSBR will be able to cope with a short-term
change in HRT, in terms of the quality of the effluent as well as its consistency.
Shock toxic loadings on the AnSBR may adversely affect the performance. Although the
anaerobic treatment process is known to be very robust, once upset, it will take a very long time
to recover. Toxic compounds, such as surfactants, detergents, disinfectants and other chlorinated
compounds from industrial sources can be occasionally found in municipal wastewater system. A
study of the effects of such toxicity on the AnSBR and the AnSBR’s tolerance of these
compounds will be beneficial in understanding the risks involved in applying the technology in
full-scale context.
Anaerobic Sequencing Batch Reactor for the Treatment of Municipal Wastewater Reference
144
Reference
Abe I., Hayashi K., Kitagawa M. and Urahata T. (1980) Adsorptive mechanism on activated carbon in the liquid phase. III. The relationship between the physical constants of organic compounds and their adsorbabilities on activated carbon from an aqueous solution. Bull. Chem. Soc. Jpn. 53, 1199-1205.
Abe I., Hayashi K. and Kiatagawa M. (1981) Prediction of adsorptive isotherms of organic
compounds from water on activated carbons. Bull. Chem. Soc. Jpn. 54, 2819-2820. Abe I., Hyashi K., Kitagawa M. and Urahata T, (1982) The adsorption of amio acids from water
on activated carbon. Bull. Chem. Soc. Jpn. 55, 697-689. Abe I., Hayahi K., Kitagawa M. and Hirashima T. (1983) Predictions of adsorbability of organic
compounds from aqueous solution on activated carbon by means of the linear free-energy relationship. Bull. Chem. Soc. Jpn. 56, 1002-1005.
Aiyuk, S. R., Van Haandel, A., Verstraete, W. (2004) Removal of carbon and nutrients from
domestic sewage using a low-cost, integrated treatment concept. Water Research 38, 3031-42.
Amann, R., W. Ludwig, and K.-H. Schleifer, Phylogenetic identification and in situ detection of
individual microbial cells without cultivation. Microbiol Rev, 1995. 59: 143-169. Alaerts, G. J., Veenstra, S., Bentvelsen, M., Lindfield, M., Specker, H., Van Velsen L., Wildschut
L., Lettinga, G., Hulshoff, P. L., and Zuidema, M. (1989) Assessment of the feasibility of anaerobic sewage treatment in developing countries. Reports of the international institute for hydraulic and environmental engineering, Delft, The Netherlands, 178.
Aziz J. A. and T. H. Y. Tebbutt (1979) Significance of COD, BOD, and TOC correlations in
kinetic models of biological oxidation. Water Research 14 319-324. Bach H. (1931) The cardinal points in the art of sludge digestion: a compressed summary of a
quarter century of experience. Sewage Works Journal 3, 562-569. Barker D. J. and D. C. Stuckey (1999) A review of soluble microbial products (SMP) in
wastewater treatment systems. Water Research 33(14), 3063-3082 Barker D. J., Mannucchi G. A., Salvi S. M. L. and Stuckey D. C. (1999) Characterization of
soluble residual chemical oxygen demand (COD) in anaerobic wastewater treatment effluents. Water Research 33(11), 2499-2510.
Anaerobic Sequencing Batch Reactor for the Treatment of Municipal Wastewater Reference
145
Boller M. (1993) Removal of organic matter by physicochemical mechanisms in wastewater treatment plants. Water Science & Technology 27(11), 167-183.
Boylen C. W. and Ensign J. C. (1970) Intracellular substrates for endogenous metabolism during
long-term starvation of rod and spherical cells of arthrobacter crustallopoietes. J. Bact. 103, 578-587.
Burleigh I. G. and Dawes E. A. (1967) Studies on the endogenous metabolism and senescence of
starved sarcinlutea. Biochem. J. 102, 236-250. Cheremisinoff, P.N., 1980. Adsorption mechanisms: the chemistry of organic adsorption on
activated carbon. In: Cheremisinoff, P.N., Ellerbusch, F. (Eds.), Carbon Adsorption Handbook. Ann Arbor Science, New York, pp. 241–279.
Chianga, H.L., Huang, C.P., Chiang, P.C., 2002. The adsorption of benzene and
methylethylketone onto activated carbon: thermodynamic aspects. Chemosphere 46, 143–152.
Christensen H. N. (1975) Biological Transport, 2nd ed. W. A. Benjamin, Reading, MA. Chuanga, C.L., Chiang, P.C., Chang, E.E., 2003. Modeling VOCs adsorption onto activated
carbon. Chemosphere 53, 17–27. Chudoba J. (1985a) Quantitative estimation in COD units of refractory organic compounds
produced by activated sludge microorganisms. Water Research 19(1), 37-43. Chudoba J. (1985b) Inhibitory effect of refractory organic compounds produced by activated
sludge micro-organisms on microbial activity and flocculation. Water Research 19(2), 197-200
Chynoweth David P., John Owens, Robert Legrand, Dick Glick (1996) Renewable methane from
anaerobic digestion of biomass. The Seventh National Bioenergy '96. Dart, M. C. (1977) Industrial effluent. Control and charges. Water Pollut. Control. 76 192. Dawes E. A. and Ribbins D. W. (1964) Some aspects of the endogenous metabolism of bacteria.
Bact. Rev. 28, 126-149. De Smedt, M., Van Ermen, S., Koning, J. (2001) Influence of particulate matter on UASB reactor
performance: pilot and full scale studies. Proceedings of the 9th World Congress on Anaerobic Digestion, Anaerobic Conversion for Sustainability, 531-534.
Derycke D. and Verstraete W. (1986) Anaerobic treatment of domestic wastewater in a lab and a
pilot scale polyurethane carrier reactor. Anaerobic Treatment: A Grown-up Technology, 437-450.
Dubois, M., K.A. Gilles, J.K. Hamilton, P.A. Rebers and F. Smith. Colorimetric method for
determination of sugars and related substances. Anal. Chem., 28(3), pp.350-356. 1956. Duncan J. Barker and David C. Stuckey (1999) A review of soluble microbial products (SMP) in
wastewater treatment systems. Water Research 33(14), 3063-3082
Anaerobic Sequencing Batch Reactor for the Treatment of Municipal Wastewater Reference
146
Eastman J. A. and Ferguson J. F. (1981) Solubilizaition of particulate organic carbon during the
acid phase of anaerobic digestion. Journal of Water Pollution Control Federation 53, 6352-66.
Eikelboom D. H. and van Buijsen H. J. J. (1983) Microscopic sludge investigation manual.
Research Institute for Environmental Hygiene, Delft, The Netherlands. El-Rehaili, A. M. and Weber, W. J. (1987) Correlation of humic substance trihalomethane
formation potential and adsorption behavior to molecular weight distribution in raw and chemically treated waters. Water Research 21(5), 573-582.
Elmitwalli, Tarek A., Jesko Soellner, Arie de Keizer, Harry Bruning, Grietje Zeeman and Gatze
Lettinga (2001) Biodegradability and change of physical characteristics of particles during anaerobic digestion of domestic sewage. Water Research 35(5), 1311-17.
Emery T. (1982) Iron metabolism in humans and plants. Am. Sci. 70, 626-632. Farrell, J. B. 1980. Memoranda submitted to Office of Solid Waste regarding pathogens in sludge,
11/14/78 to 10/20/80. Report submitted to J. J. Covery, October 21, 1980. Unpublished data. Frǿlund, B., R. Palmgren, K. Keiding and P.H. Nielsen. Extraction of extracellular polymers from
activated sludge using a cation exchange resin. Water Res., 30(8), 1749-1758. 1996. Fullen W. J. (1953) Anaerobic digestion of packing plant wastes. Sewage Industrial Wastes 25,
576-585. Germirli F., Orhon D., Artan N., Ubay E. and Görgőn E. (1993) Effect of two-stage treatment on
the biological treatability of strong industrial wastes. Water Sci. Technol. 28(2), 145-154. Giusti D. M., Conway R. A. and Lawson C. T. (1974) Activated carbon adsorption of
petrochemicals. J. WPCF 46(5), 947-965. Gregory J. (1993) The role of colloid interactions in solid-liquid separation. Water Science &
Technology 27(10), 1-17. Grieves C. G., Crane L. W., Venardos D. G. & Ying W. (1978) Powdered carbon enhancement
versus granular carbon adsorption for oil refinery BATEA wastewater treatment. Paper presented at the 51st Annual Conference of Water Pollution Control Federation. Anaheim, CA.
Hanaki K., Matsuo T. and Nagassa M. (1981) Mechanism of inhibition caused by long-chain fatty
acids in anaerobic digestion process. Biotechnology & Bioengineering Symposium 12, 365-380.
Harold F. M. (1972) Conservations and transformation of energy by bacterial membranes. Bact.
Rev. 36, 172-230. He, Ruo, Xin-wen Liu, Zhi-jian Zhang and Dong-sheng Shen (2007) Characteristics of the
bioreactor landfill system using an anaerobic–aerobic process for nitrogen removal. Bioresource Technology 98 2526–2532
Anaerobic Sequencing Batch Reactor for the Treatment of Municipal Wastewater Reference
147
Hendrik S, Muyzer G (2001) Denaturing gradient gel electrophoresis in marine microbial ecology.
In: Paul JH (eds) Methods in microbiology: Marine microbiology. Academic Press, San diego San Francisco New York Boston London Sydney Tokyo, 425–468
Heppel L. (1967) Selective release of enzymes from bacteria. Science 156, 1451-1455. Huser C. A., Wuhrmann K. and Zehnder A. J. B. (1982) Methanothrix soengenii gen. nov. sp., a
new acetotrophic non-hydrogen-oxidizing methane bacterium. Archives of Microbiology 132, 1-9.
Hutner S. H. (1972) Inorganic nutrition. Ann. Rev. Microbiol. 26, 313-346. Jeris, J. S., Ciarcia, D., Chen, E. and Mena, K. (1985) Determining the stability of treated
municipal sludges. EPA 600/2-85-001. Jewell W. J., Switzenbaum M. S. and Morris J. W. (1981)Municipal wastewater treatment with
the anaerobic attached microbial film expanded bed process. J. War. Pollut. Control Fed.
53, 482-490. Karanfil, T., Kilduff, J.E., 1999. Role of granular activated carbon surface chemistry on the
adsorption of organic compounds. 1. Priority pollutants. Environ. Sci. Technol. 33, 3217–3224.
Kim B. R., Anderson S. G. and Zemla J. F. (1990) Effect of biological treatments on COD
adsorption. Water Research 24(4), 457-461. Kobayashi H. A., Stenstrom M, K. and Mah R. A. (1983) Treatment of low strength domestic
wastewater using the anaerobic filter. Wat. Res. 17(8), 903-909. Kunio, E.M., Li, F., Azuma, Y., Yuasa, A., Hagishita, T., 2001. Pore distribution effect of
activated carbon in adsorbing organic micropollutants from natural water. Water Res. 35, 167–179.
Kuo, W. C. (1993) Production of soluble microbial products and their impact on anaerobic
treatment. Ph.D. Thesis, University of Iowa, Iowa City. Kuo W. C. and Parkin G. F. (1996) Characterization of soluble microbial products from anaerobic
treatment by molecular weight distribution and nickel-chelating properties. Water Research 30(4), 915-922
Kuo W. C., Sneve M. A. and Parkin G. F. (1996) Formation of soluble microbial products during
anaerobic treatment. Wat. Environ. Res. 68, 279-285. Lens, P. N. and Verstraete, W. (1992) Aerobic and anaerobic treatment of municipal wastewater.
Profiles on Biotechnology, Universidade de Santiago, 333-356 Lens, P.N.L., Bosch van Den, M.L., Hulshoff pol, L.W., Lettinga, G. (1998) Effect of staging on
volatile fatty acid degradation in sulphidogenic granular sludge reactor. Water Research 32 (4), 1178–1192.
Anaerobic Sequencing Batch Reactor for the Treatment of Municipal Wastewater Reference
148
Lettinga, G., Field J., Vanlier, J., Zeeman, G. and Hulshoff Pol, L. W (1997) Advanced anaerobic wastewater treatment in the near future. Water Science & Technology 35(10), 5-12.
Lettinga G., Roersma R., Grin P., De Zeeuw W., Hulshof Pol L., Van Velsen L.,Hobma S. and
Zeeman G. (1981) Anaerobic treatment of sewage and low strength wastewaters. Proceedings of the 2nd International Symposium on Anaerobic Digestion, Germany pp. 279-302.
Levine A. D., Tchobanaglous G. and Asano T. (1985) Characterization of the size distribution of
contaminants in wastewater: treatment and reuse implications. Journal of Water Pollution Control Federation 57(7), 805-816.
Liu, W. T., Marsh, T. L., Cheng, H. and Forney, L. J. (1997) Characterization of microbial
diversity by determining terminal restriction fragment length polymorphism of 16S ribosomal DNA. Applied and Environmental Microbiology 63, 4516-4522.
Logan, B. E. and Wangenseller, G. A. The HBOD test: a new method for determining
biochemical oxygen demand. Water Environ. Res. 65, 862. Logan B. E. and Jiang Q. (1990) Molecular size distributions of dissolved organic matter. J.
Environ. Eng. Div. ASCE 116(6), 1046-1062. Lowry, O.H., N.J. Rosenbrough, A.L. Farr and R.J. Randall. Protein Measurement with the Folin
Phenol Reagent. J. Biol. Chem., 191(1), 265-175. 1951. Madigan, Michael T. and Martinko, John M. (2006) Brock Biology of Microorganisms, 11th
edition. Pearson Prentice Hall. Malina, J.F., Jr. and Pohland, F.G. (1992) Design of anaerobic processes for the treatment of
industrial and municipal wastes, Vol. 7, pp. 213. Technomic Publishing Company, Inc. Maragno A. J. L. and Campos J. R. (1992) Treatment of wastewater with a low concentration of
organics using an anaerobic fluidized bed reactor. War. Sci. Technol. 25(7), 179-191. McCarty P. L. (1964) Anaerobic waste treatment fundamentals. Chemistry and microbiology.
Public Works Sep, 107-111. Mergaert, A., Vanderhaegen, B. and Verstraete, W. (1992) Applicability and trends of anaerobic
pretreatment of municipal wastewater. Water Resources 26(8), 1025-1033. Metcalf & Eddy (2003) Wastewater Engineering Treatment and Reuse, 4th ed., McGraw-Hill
Companies, Inc. Moosvi, Safia and Datta Madamwar (2007) An integrated process for the treatment of CETP
wastewater using coagulation, anaerobic and aerobic process. Bioresource Technology. In press.
Morel F. M. M. (1983) Principles of Aquatic Chemistry. John Wiley Interscience, New York.
Anaerobic Sequencing Batch Reactor for the Treatment of Municipal Wastewater Reference
149
Munz, G., R. Gori, G. Mori and C. Lubello (2007) Powdered activated carbon and membrane bioreactors (MBRPAC) for tannery wastewater treatment: long term effect on biological and filtration process performances. Desalination 207 (1-3) 349-360.
Namkung E. and Rittmann B. E. (1988) Effects of SMP on biofilm-reactor performance. Journal
of Environmental Engineering ASCE 114(1), 199-210. Ndon, Udeme J. and Richard R. Dague (1997) Effects of temperature and hydraulic retention
time on anaerobic sequencing batch reactor treatment of low strength waster. Water Resource 31(10) 2455-66.
Neijssel O. M. and Tempest D. W. (1976) The role of energy-spilling reactions in the growth of
Klebsiella Aerogenes NCTC 418 in aerobic chemostat culture. Arch. Microbiol. 110, 305-311.
Neilands J. B. (1967) Hydroxamic acidsd in nature. Science 156, 1443-1447. Nielsen P. H., Frǿlund B. and Keiding K. (1996) Changes in exopolymer composition by
anaerobic storage of activated sludge. Applied Microbiology & Biotechnology 44, 823-830. Nossal N. G. and Heppel L. A. (1966) The release of enzymes by osmotic shock from E. coli in
exponential phase. J. Biol. Chem. 241(13), 3055-3062. Othman, M.Z., Roddick, F.A.M., Hobday, M.D., 2000. Evaluation of Victorian low rank coal-
based adsorbents for the removal of organic compounds from aqueous systems. Water Res. 34, 4351–4358.
Parkin G. F. and McCarty P. L. (1981) A comparison of the characteristics of soluble nitrogen in
untreated and activated sludge treated wastewaters. Water Research 15, 139-149 Pavlostathis, S.G. and Giraldo-Gomez, M. (1980) Toxic inhibition of anaerobic biodegradation. J.
Water Pollution Control Federation, 52(3), pp. 472-482. Payne J. W. (1976) Peptides and microorganisms. Adv. Microb. Physiol. 13, 199-221. Pfieffer, W., Rwmpwe, U., Steiner, A., Carozzi, A. and von Mucke, J. (1986) Anaerobic
wastewater treatment – results of a literature review. Proceedings of the water treatment conference, anaerobic treatment a grown-up tenchnology, AQUATECH 86, The Netherlands, 219-231.
Pirt S. J. (1975) Principles of Microbe and Cell Cultivation. Blackwell Scientific, Oxford. Pophali, G.R., R. Khan, R.S. Dhodapkar, T. Nandy, S. Devotta (2007) Anaerobic–aerobic
treatment of purified terephthalic acid (PTA) effluent; a techno-economic alternative to two-stage aerobic process. Journal of Environmental Management. In press.
Postgate J. R. and Hunter J. R. (1964) Accelerated death of Aerobacter aerogenes starved in the
presence of growth-limiting substrates. J. Gen. Microbiol. 34, 459-473.
Anaerobic Sequencing Batch Reactor for the Treatment of Municipal Wastewater Reference
150
Raman V. and Khan A. N. (1978) Upflow anaerobic filter: a simple sewage treatment device. In Proceedings of the International Conference in Water Pollution Control in Developing
Countries. Edited by Ouano E. A. R., LohaniB. N. and Thanh N. C., 639-548. Ramussen H., Bruus J. H., Keiding K. and Nielsen P. H. (1994) Obervations on dewaterability
and physical, chemical and microbiological changes in anaerobically stored activated sludge from a nutrient removal plant. Water Resources 28(2), 417-425.
Robertaccio F. L., Grulich G., Hutton D. G. & Glotzer H. L. (1972) Treatment of organic
chemicals plant wastewater with du Pont PACT process. Paper presented at the 70th National Meeting of the Americal Institute of Chemical Engineers. Dallas, TX.
Robertaccio F. L. (1973) Powdered carbon addition to biological reactors. Paper presented at the
Sixth Mid-Atlantic Industrial Waste Conference. University of Delaware, Newark, DE. Robertaccio F. L. (1978) Combined powdered activated carbon-biological treatment: Theory and
results. Proceedings of the Sec Open Forum on Management of Petroleum Refinery Wastewaters. U.S. Environmental protection Agency, EPA-600/2-78-058, 325- 343.
Robertaccio F. L. (1979) Combined powdered activated carbon-biological treatment: Theory and
results. Activated Carbon Treatment of Industrial Wastewaters. U.S. Environmental Protection Agency, EPA-600/2-79-177, 135-153.
Rogers D. (1968) Osmotic pools in Escherichia coli. Science 159, 531-532. Rouse J. D., Sabatini D. A., Suflita J. M. and Harwell J. H. (1994) Influence of surfactants on
microbial degradation of organic compounds. Critical Reviews in Environmental Science & Technology 24(4), 325-370.
Saier M. H., Feucht B. U. and McCaman M. T. (1975) Regulation of intracellular adenosine
cyclic 3′:5′-mono-phosphate levels is Eschericahia coli and Salmonella typhimurium. J. Biol. Chem. 250 (19), 7593-7601.
Sánchez, E., B. Rincón, R. Borja, L. Travieso, F. Raposo, M.F. Colmenarejo (2007) Aerobic
degradation kinetic of the effluent derived from the anaerobic digestion of two-phase olive mill solid residue. International Biodeterioration & Biodegradation 60 60–67
Sanz I. and Fdz-Polanco F. (1989) Anaerobic treatment ofmunicipal sewage in UASB and AFBR
reactors. Environ.Technol. Lett. 10, 453-462. Sawyer, C.N., McCarty, P.L. and Parkin, G.F. (1994) Chemistry for Environmental Engineering,
4th ed., pp. 658, McGraw-Hill, Inc. Schiener P., Nachaiyasit S. and Stuckey D. C. (1998) Production of soluble microbial products
(SMP) is an anaerobic baffled reactor: composition, biodegradability and the effect of process parameters. Environmental Technology 19, 391-400
Schroepfer G. J., Fuller W. J., Johnson A. S., Ziemke N. R. and Anderson J. J. (1955) The
anaerobic contacat process as applied to packinghouse waste. Sewage Industrial Waste 27, 460.
Anaerobic Sequencing Batch Reactor for the Treatment of Municipal Wastewater Reference
151
Schroepfer G. J. and Ziemke N. R. (1959a) Development of the anaerobic contact process. I. Pilot-plant investigations and economics. Sewage Industrial Waste 31, 164-190.
Schroepfer G. J. and Ziemke N. R. (1959b) Development of the anaerobic contact process. II.
Ancillary investigation and special experiments. Sewage Industrial Waste 31, 697-711. Sing, K. S. W., Everett, D. H., Haul, R. A. W., Moscou, L., Pierotti R. A., Rouquerol, J. and
Siemieniewska, T. (1985) Pure and Applied Chemistry 57, 604. Smeaton J. R. and Elliot W.H. (1967) Selective release of ribonuclease inhibitor from B. subtilis
cells by cold shock treatment. Biochem. Biophys. Res. Commun. 26(1), 75-81. Specchia V. and Gianetto (1982) Powdered activated carbon in an activated sludge treatment
plant. Water Research 18(2), 133-137. Stahl, D., et al., Use of phylogenetically based hybridization probes for studies of ruminal
microbial ecology. Appl. Environ. Microbiol., 1988. 54: 1079-1084. Stander G. J. (1950) Effluents from fermentation industries. Part IV. A new method for increasing
and maintaining efficiency in the anaerobic digestion of fermentation effluent. Journal, Institute of Sewage Purification 4, 438.
Stander G. J. and Synder R. (1950) Effluents from industries. Part V. Re-inoculation as an
integral part of the anaerobic digestion method of purification of fermentation effluents. Journal, Institute of Sewage Purification 4, 447.
Starkey J. E. and Karr J. E. (1984) Effect of low dissolved oxygen concentration on effluent
turbidity. Journal of Water Pollution Control Federation 56(7), 837-843. Strange R. E., Wade H. R. and Ness A. G. (1963) The catabolism of proteins and nucleic acids in
starved Aerobacter aerogenes. Biochem. J. 86, 197-203. Sung, S., Dague, R. (1992) Fundamentals principles of the anaerobic sequencing batch reactor
process. Proceedings of 47th Purdue Industrial Waste Conference, Lewis Publishers, Michigan, 393-407.
Suzuki Y. and Takeuchi Y. (1993) Correlation between physical properties of soluble organic
compounds in water and those equilibrium constants in activated carbon adsorption. J. Jpn Soc. Water Environ. 16(8), 67.
Switzenbaum M. S. and Jewell W. J. (1980) Anaerobic attached-film expanded-bed reactor
treatment. J. War. Pollut. Control Fed. 52, 1953-1965. Switzenbaum, M. S., Moss, L. H., Epstein, E., Pincince, A. B. and Donovan, J. F. (1997)
Defining Biosolids Stability: A Basis for Public and Regulatory Acceptance. Project 94-REM-1, Water Environment Research Foundation, Alexandria, VA.
Tan, K. Y. (2001) Start-up of a pilot-scale anaerobic sequencing batch reactor. M.Eng. Thesis,
National University of Singapore, p. 77.
Anaerobic Sequencing Batch Reactor for the Treatment of Municipal Wastewater Reference
152
Thompson J. (1976) Characteristics and energy requirements of an A-aminoisobutyric acid transport system in Streptococcus lactis. J. Bact. 127(2), 719-730.
Van haandel, A.C. and Catunda, P. (1997) Application and perspectives of anaerobic wastewater
treatment in Latin America. REUR Technological Series 51, 1-26 Verstraete, W. and P. Vandevivere (1999) New and broader applications of anaerobic digestion.
Critical Reviews for Environmental Science & Technology 29(2), 151-173. Vogels G. D., Keltjens K. and Van Der Drift C. (1988) Biochemistry of methane production.
Biology of Anaerobic Microorganisms, Wiley, New York, 707-771. Wagener S. and Schink B. (1987) Anaerobic degradation of nonionic and anionic surfactants in
enrichment cultures and fixed-bed reactors. Water Research 21(5), 615-622. Washington D. R., Clesceri L. S., Young J. C. and Hardt F. W. (1970) Influence of microbial
waste products on the metabolic activity of high solids activated sludge. In Proceedings of 24th Purdue Industrial Waste Conference. Purdue University, West Lafayette, IN, 1103-1117.
Water Environment Research Foundation (2002) Developing Protocols for Measuring Biosolids
Stability. Chapter 5.0, 5-1-15. Westermann, P., B. K. Ahring and R. A. Mah (1989) Threshold acetate concentrations for acetate
catabolism by aceticlastic methanogenic bacteria. Applied Environmental Microbiology 55, 514-515.
Widdel F. (1988) Microbiology and ecology of sulfate- and sulfur-reducing bacteria. Biology of
Anaerobic Microorganisms, Wiley, New York, 469-586 Wilén, Britt-Marie, Kristian Keiding and Per Halkjǽ Nielsen (2000) Anaerobic flocculation and
aerobic reflocculation of activated sludge. Water Resources 34(16), 3933-3942. World Health Organization and UNICEF. (2004) WHO/UNICEF joint monitoring programme for
water supply and sanitation; Water for life, make it happen. WHO Press. Wu, W. M., Jain, M. K., Thiele, J. H. and Zeikus, J. G. (1995) Effect of storage on the
performance of methanogenic granules. Water Research, 29(6), pp. 1445-1452. Zobell C. E. (1937) The influence of solid surfaces upon the physiological activity of bacteria in
sea water. J. Bact. 86 33.