Embed Size (px)
Citation preview
An Integrated Approach to Metabolomics Studies: Discovery to Quantitation on a Single Platform Gina Tan,1 Zeming Wu,2 Andreas FR Hühmer1
1Thermo Fisher Scientific, San Jose, CA, USA; 2Thermo Fisher Scientific, Shanghai, China
Ap
plica
tion
No
te 6
56
Key WordsUntargeted, targeted profiling, metabolite library, compound database, spectral library, Compound Discoverer, TraceFinder, Q Exactive, HRAM, carnitines, acylcarnitines
GoalDemonstrate a comprehensive metabolomics profiling research strategy, with the integration of three mainstream approaches of untargeted component profiling and differential analysis, targeted screening, and targeted quantitation analysis performed on a single MS platform.
Introduction Cellular metabolomics is an important area of study providing valuable insights into changes associated with biochemical reactions and metabolic pathways. Analyzing the metabolic activities of cells has allowed better understanding of intricate cellular processes involved in cancer progression and drug responses. Therefore, the characterization of cancer cell-specific metabolome signatures would provide beneficial information for early diagnosis of cancer and therapeutic cancer research. Mass spectrometry (MS)-based metabolomics has proven to be advantageous in investigating the metabolic profiles of cancer cells. A wealth of information, including the biochemical phenotypes, molecular mechanisms of cancer development, response, and resistance against drug therapy, can all be obtained using mass spectrometry.
Mass spectrometry-based strategies for metabolomics provide both qualitative and quantitative information. This not only enables identification of the metabolite structures in a biological system but also allows the monitoring of changes that occur within a system.
Traditionally, MS-based metabolomics studies can be classified into two primary strategies—a discovery-driven untargeted profiling approach using high-resolution, accurate mass (HRAM) mass spectrometry followed by a hypothesis-driven targeted approach using a triple quadrupole mass spectrometer. The discovery stage detects and identifies potential metabolites that are biologically significant, while the targeted validation stage can confirm and quantify these metabolites across large sample populations to enable functional understanding.
Unfortunately, adopting such a comprehensive metabolomics workflow requires the tedious transfer of methods across different mass spectrometers. The use of a single mass spectrometer that performs both stages of analysis, coupled with intuitive software tools, would be far more attractive than conventional analytical strategies. In this application note, the metabolomics research paradigm shift is demonstrated, with utilization of a hybrid quadrupole-Orbitrap mass spectrometer to achieve both discovery and validation in one instrument. The HRAM qualitative capabilities and triple-quadrupole-like quantitative abilities of the Thermo Scientific™ Q Exactive™ mass spectrometer enables untargeted profiling, targeted profiling, and targeted quantitation to be performed on a single instrument. To showcase this capability, the metabolic profiles of the human pancreatic cancer cell line Panc-1 were investigated and the steps involved are outlined in this application note (Figure 1). The power of the discovery workflow will be enhanced with the use of differential analysis software that provides unbiased differential results followed by targeted profiling and targeted quantitation workflow with the use of routine quantitation software.

Figure 1. Overview of Q Exactive MS-based metabolomics workflow and adopting untargeted and targeted approaches in the study using cell metabolome as the research model.
2
Sample PreparationTo study the intracellular metabolomics profile of G1 high-expressing and normal human pancreatic cancer cell line Panc-1, the target cells were quenched, harvested, and extracted using an optimized and standardized protocol as previously established.1 In brief, the pancreatic cells were flash quenched in liquid nitrogen and harvested, followed by methanol extraction of the cell suspensions.
LC Conditions
Column Atlantis™ HILIC column (2.1 x 100 mm, 3 µm, Waters Corporation)
Flow Rate 300 µL/min
Column Temperature 40 ˚C
Mobile Phases A) 10 mM ammonium formate in 95:5 acetonitrile/water + 0.1% formic acid B) 10 mM ammonium formate in 50:50 acetonitrile/water + 0.1% formic acid
Sample Injection 5 µL Volume
Mobile Phase Refer to Table 1 Gradient
MS Conditions
MS Instrument Q Exactive MS
Source HESI-II probe
Ionization Mode Positive ion
Source Conditions
Sheath Gas Flow Rate 35 arbitrary units
Auxiliary Gas Flow Rate 8 arbitrary units
Spray Voltage 3.5 kV
Capillary Temperature 275 ˚C
S-lens RF Level 50
Heater Temperature 350 ˚C
Full MS
MS Scan Range 80–900 m/z
Resolution 70,000 FWHM @ 200 m/z
Microscans 1
AGC target 1e6
Max IT (ms) 250
Table 1. Mobile phase gradient.
Time (min) %A %B Flow (µL/min) Curve
0 100 0 300 5
1.0 100 0 300 5
20.0 0 100 300 5
24.9 0 100 300 5
25.0 100 0 300 5
30.0 100 0 300 5
ExperimentalChemical and Reagents• Water, Optima™ LC/MS (Fisher Chemical, W6-1) • Formic acid, Optima™ LC/MS (Fisher Chemical, A117-50) • Ammonium formate, Optima™ LC/MS (Fisher Chemical, A115-50)
Equipment• Thermo Scientific™ Dionex™ UltiMate™ 3000 UHPLC system • Q Exactive hybrid quadrupole-Orbitrap mass spectrometer, equipped with heated electrospray ion (HESI) source
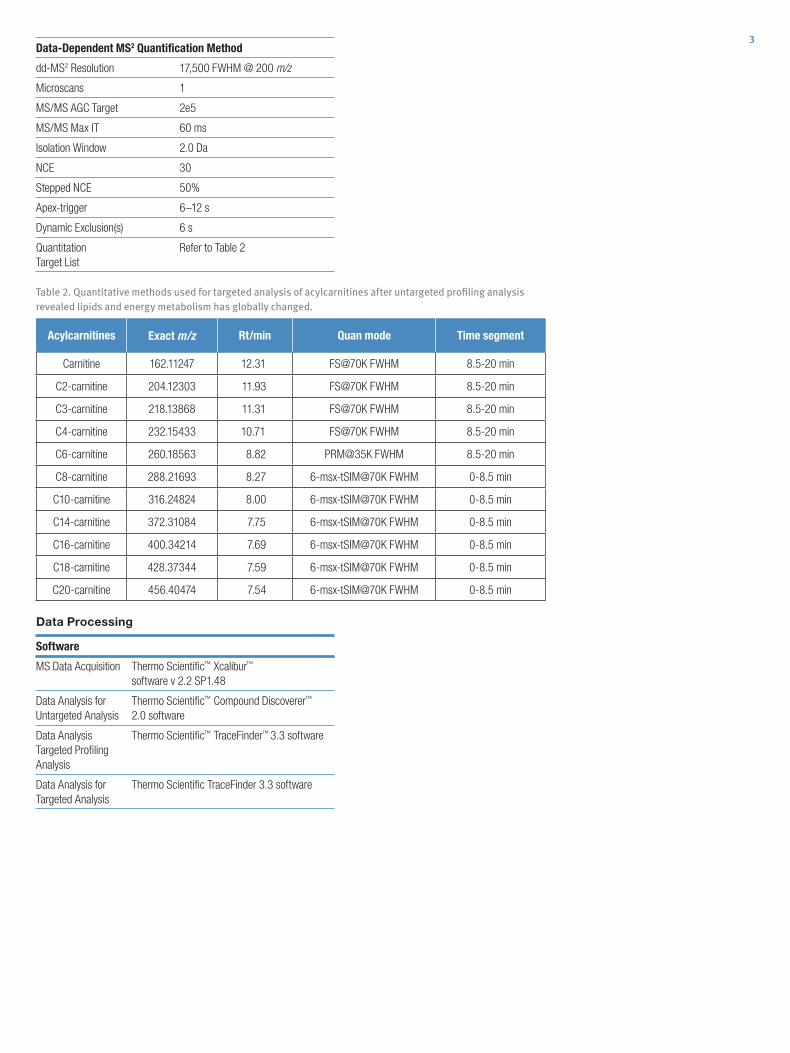
3Data-Dependent MS2 Quantification Method
dd-MS2 Resolution 17,500 FWHM @ 200 m/z
Microscans 1
MS/MS AGC Target 2e5
MS/MS Max IT 60 ms
Isolation Window 2.0 Da
NCE 30
Stepped NCE 50%
Apex-trigger 6–12 s
Dynamic Exclusion(s) 6 s
Quantitation Refer to Table 2 Target List
Software
MS Data Acquisition Thermo Scientific™ Xcalibur™ software v 2.2 SP1.48
Data Analysis for Thermo Scientific™ Compound Discoverer™ Untargeted Analysis 2.0 software
Data Analysis Thermo Scientific™ TraceFinder™ 3.3 software Targeted Profiling Analysis
Data Analysis for Thermo Scientific TraceFinder 3.3 software Targeted Analysis
Table 2. Quantitative methods used for targeted analysis of acylcarnitines after untargeted profiling analysis revealed lipids and energy metabolism has globally changed.
Acylcarnitines Exact m/z Rt/min Quan mode Time segment
Carnitine 162.11247 12.31 FS@70K FWHM 8.5-20 min
C2-carnitine 204.12303 11.93 FS@70K FWHM 8.5-20 min
C3-carnitine 218.13868 11.31 FS@70K FWHM 8.5-20 min
C4-carnitine 232.15433 10.71 FS@70K FWHM 8.5-20 min
C6-carnitine 260.18563 8.82 PRM@35K FWHM 8.5-20 min
C8-carnitine 288.21693 8.27 6-msx-tSIM@70K FWHM 0-8.5 min
C10-carnitine 316.24824 8.00 6-msx-tSIM@70K FWHM 0-8.5 min
C14-carnitine 372.31084 7.75 6-msx-tSIM@70K FWHM 0-8.5 min
C16-carnitine 400.34214 7.69 6-msx-tSIM@70K FWHM 0-8.5 min
C18-carnitine 428.37344 7.59 6-msx-tSIM@70K FWHM 0-8.5 min
C20-carnitine 456.40474 7.54 6-msx-tSIM@70K FWHM 0-8.5 min
Data Processing
4
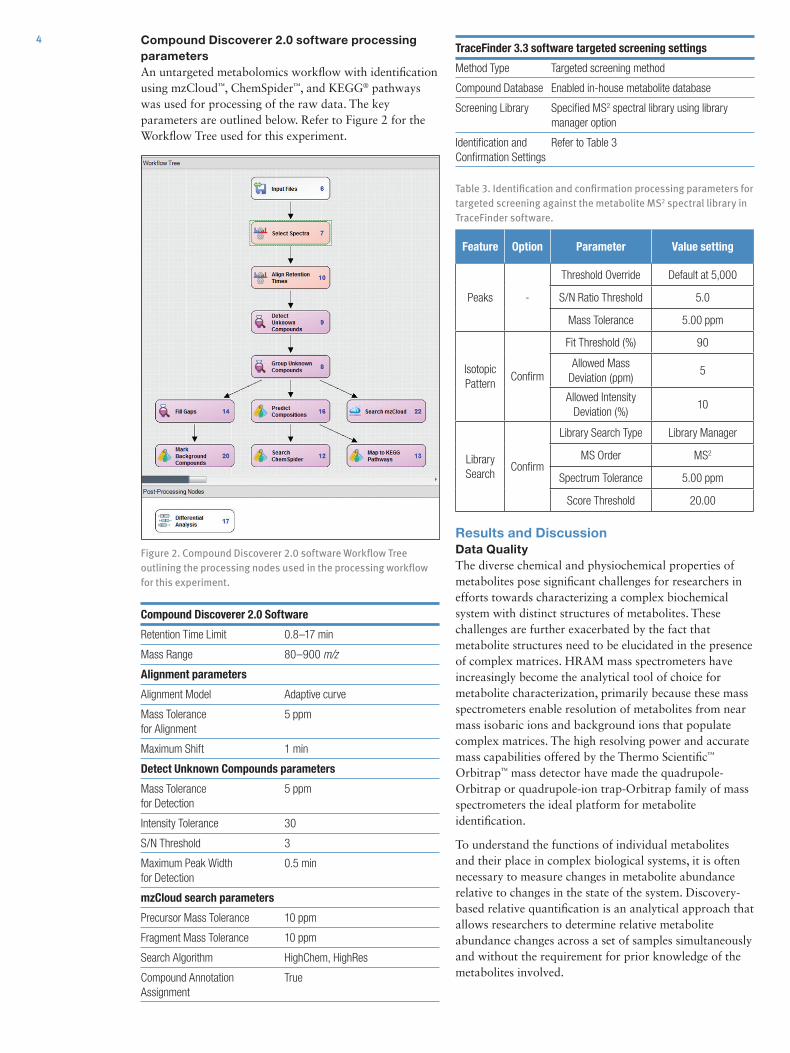
Figure 2. Compound Discoverer 2.0 software Workflow Tree outlining the processing nodes used in the processing workflow for this experiment.
Compound Discoverer 2.0 software processing parametersAn untargeted metabolomics workflow with identification using mzCloud™, ChemSpider™, and KEGG® pathways was used for processing of the raw data. The key parameters are outlined below. Refer to Figure 2 for the Workflow Tree used for this experiment.
Compound Discoverer 2.0 Software
Retention Time Limit 0.8–17 min
Mass Range 80–900 m/z
Alignment parameters
Alignment Model Adaptive curve
Mass Tolerance 5 ppm for Alignment
Maximum Shift 1 min
Detect Unknown Compounds parameters
Mass Tolerance 5 ppm for Detection
Intensity Tolerance 30
S/N Threshold 3
Maximum Peak Width 0.5 min for Detection
mzCloud search parameters
Precursor Mass Tolerance 10 ppm
Fragment Mass Tolerance 10 ppm
Search Algorithm HighChem, HighRes
Compound Annotation True Assignment
TraceFinder 3.3 software targeted screening settings
Method Type Targeted screening method
Compound Database Enabled in-house metabolite database
Screening Library Specified MS2 spectral library using library manager option
Identification and Refer to Table 3 Confirmation Settings
Results and DiscussionData Quality The diverse chemical and physiochemical properties of metabolites pose significant challenges for researchers in efforts towards characterizing a complex biochemical system with distinct structures of metabolites. These challenges are further exacerbated by the fact that metabolite structures need to be elucidated in the presence of complex matrices. HRAM mass spectrometers have increasingly become the analytical tool of choice for metabolite characterization, primarily because these mass spectrometers enable resolution of metabolites from near mass isobaric ions and background ions that populate complex matrices. The high resolving power and accurate mass capabilities offered by the Thermo Scientific™ Orbitrap™ mass detector have made the quadrupole-Orbitrap or quadrupole-ion trap-Orbitrap family of mass spectrometers the ideal platform for metabolite identification.
To understand the functions of individual metabolites and their place in complex biological systems, it is often necessary to measure changes in metabolite abundance relative to changes in the state of the system. Discovery-based relative quantification is an analytical approach that allows researchers to determine relative metabolite abundance changes across a set of samples simultaneously and without the requirement for prior knowledge of the metabolites involved.
Table 3. Identification and confirmation processing parameters for targeted screening against the metabolite MS2 spectral library in TraceFinder software.
Feature Option Parameter Value setting
Peaks -
Threshold Override Default at 5,000
S/N Ratio Threshold 5.0
Mass Tolerance 5.00 ppm
Isotopic Pattern
Confirm
Fit Threshold (%) 90
Allowed Mass Deviation (ppm)
5
Allowed Intensity Deviation (%)
10
Library Search
Confirm
Library Search Type Library Manager
MS Order MS2
Spectrum Tolerance 5.00 ppm
Score Threshold 20.00
5In such workflows, requirements for HRAM and MS/MS identity confirmation becomes absolutely crucial as one needs to be sure that the same compound is being compared across multiple sample sets and that the compound is positively identified. For untargeted profiling or targeted screening, any shifts in mass accuracy or retention time can make it difficult or impossible to identify components accurately. Additionally, HRAM mass spectrometry aids in the resolution of a metabolite of interest from interfering or near mass isobaric ions. The presence of stable mass accuracy in combination with MS2 and retention time (RT) stability provides a robust method not only for metabolite identification but also for quantitation.
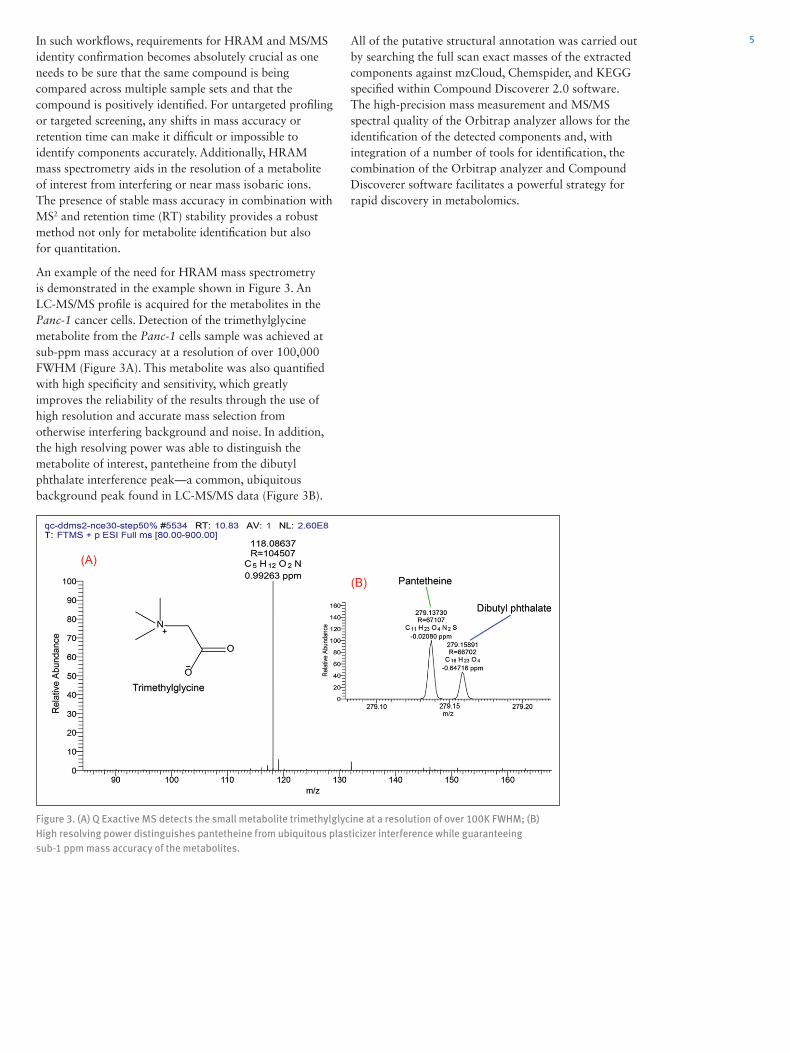
An example of the need for HRAM mass spectrometry is demonstrated in the example shown in Figure 3. An LC-MS/MS profile is acquired for the metabolites in the Panc-1 cancer cells. Detection of the trimethylglycine metabolite from the Panc-1 cells sample was achieved at sub-ppm mass accuracy at a resolution of over 100,000 FWHM (Figure 3A). This metabolite was also quantified with high specificity and sensitivity, which greatly improves the reliability of the results through the use of high resolution and accurate mass selection from otherwise interfering background and noise. In addition, the high resolving power was able to distinguish the metabolite of interest, pantetheine from the dibutyl phthalate interference peak—a common, ubiquitous background peak found in LC-MS/MS data (Figure 3B).
Figure 3. (A) Q Exactive MS detects the small metabolite trimethylglycine at a resolution of over 100K FWHM; (B) High resolving power distinguishes pantetheine from ubiquitous plasticizer interference while guaranteeing sub-1 ppm mass accuracy of the metabolites.
All of the putative structural annotation was carried out by searching the full scan exact masses of the extracted components against mzCloud, Chemspider, and KEGG specified within Compound Discoverer 2.0 software. The high-precision mass measurement and MS/MS spectral quality of the Orbitrap analyzer allows for the identification of the detected components and, with integration of a number of tools for identification, the combination of the Orbitrap analyzer and Compound Discoverer software facilitates a powerful strategy for rapid discovery in metabolomics.
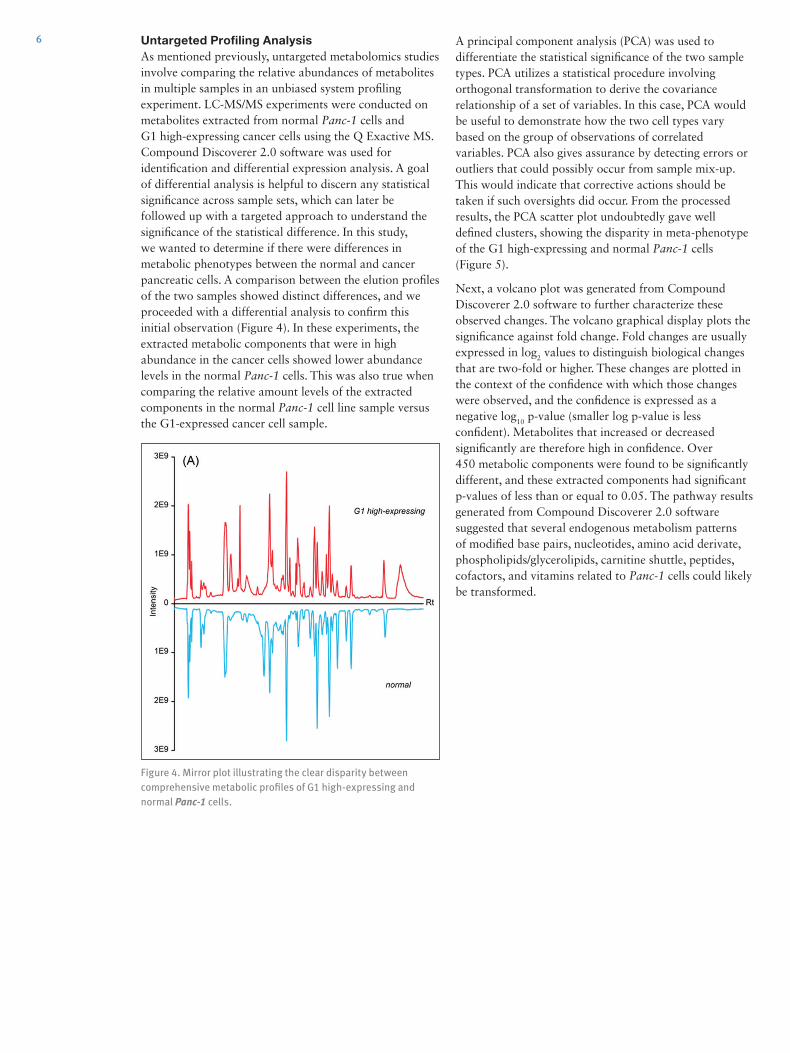
6 Untargeted Profiling AnalysisAs mentioned previously, untargeted metabolomics studies involve comparing the relative abundances of metabolites in multiple samples in an unbiased system profiling experiment. LC-MS/MS experiments were conducted on metabolites extracted from normal Panc-1 cells and G1 high-expressing cancer cells using the Q Exactive MS. Compound Discoverer 2.0 software was used for identification and differential expression analysis. A goal of differential analysis is helpful to discern any statistical significance across sample sets, which can later be followed up with a targeted approach to understand the significance of the statistical difference. In this study, we wanted to determine if there were differences in metabolic phenotypes between the normal and cancer pancreatic cells. A comparison between the elution profiles of the two samples showed distinct differences, and we proceeded with a differential analysis to confirm this initial observation (Figure 4). In these experiments, the extracted metabolic components that were in high abundance in the cancer cells showed lower abundance levels in the normal Panc-1 cells. This was also true when comparing the relative amount levels of the extracted components in the normal Panc-1 cell line sample versus the G1-expressed cancer cell sample.
A principal component analysis (PCA) was used to differentiate the statistical significance of the two sample types. PCA utilizes a statistical procedure involving orthogonal transformation to derive the covariance relationship of a set of variables. In this case, PCA would be useful to demonstrate how the two cell types vary based on the group of observations of correlated variables. PCA also gives assurance by detecting errors or outliers that could possibly occur from sample mix-up. This would indicate that corrective actions should be taken if such oversights did occur. From the processed results, the PCA scatter plot undoubtedly gave well defined clusters, showing the disparity in meta-phenotype of the G1 high-expressing and normal Panc-1 cells (Figure 5).
Next, a volcano plot was generated from Compound Discoverer 2.0 software to further characterize these observed changes. The volcano graphical display plots the significance against fold change. Fold changes are usually expressed in log2 values to distinguish biological changes that are two-fold or higher. These changes are plotted in the context of the confidence with which those changes were observed, and the confidence is expressed as a negative log10 p-value (smaller log p-value is less confident). Metabolites that increased or decreased significantly are therefore high in confidence. Over 450 metabolic components were found to be significantly different, and these extracted components had significant p-values of less than or equal to 0.05. The pathway results generated from Compound Discoverer 2.0 software suggested that several endogenous metabolism patterns of modified base pairs, nucleotides, amino acid derivate, phospholipids/glycerolipids, carnitine shuttle, peptides, cofactors, and vitamins related to Panc-1 cells could likely be transformed.
Figure 4. Mirror plot illustrating the clear disparity between comprehensive metabolic profiles of G1 high-expressing and normal Panc-1 cells.
7
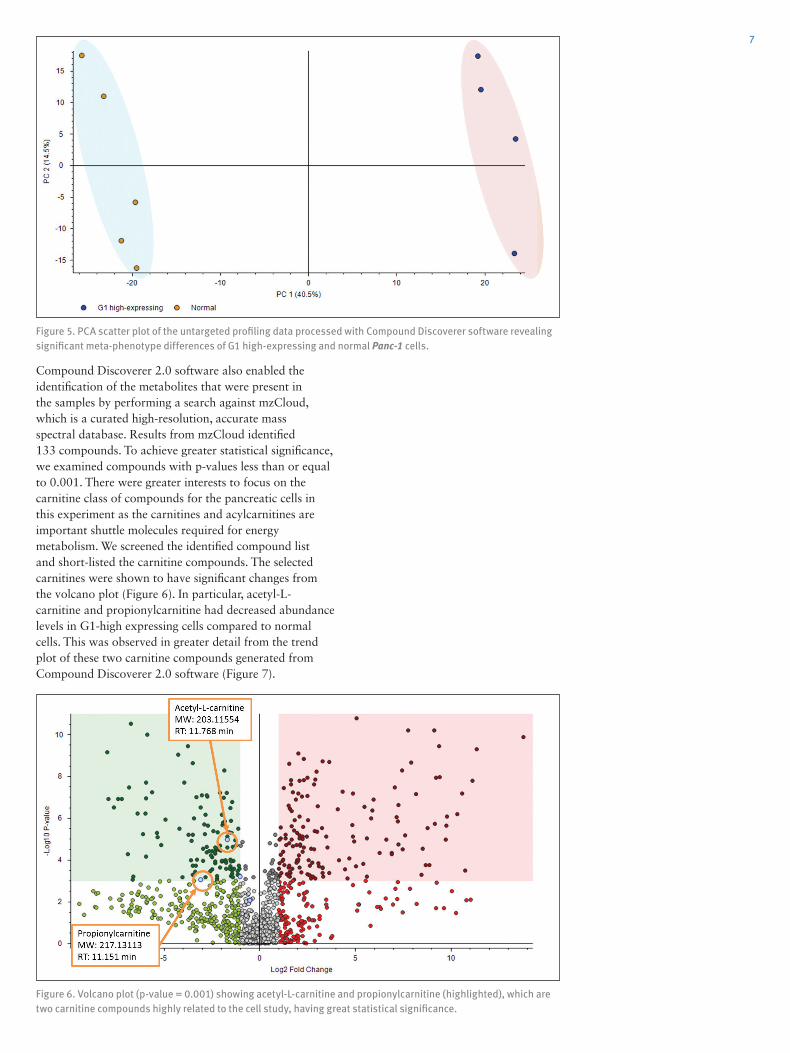
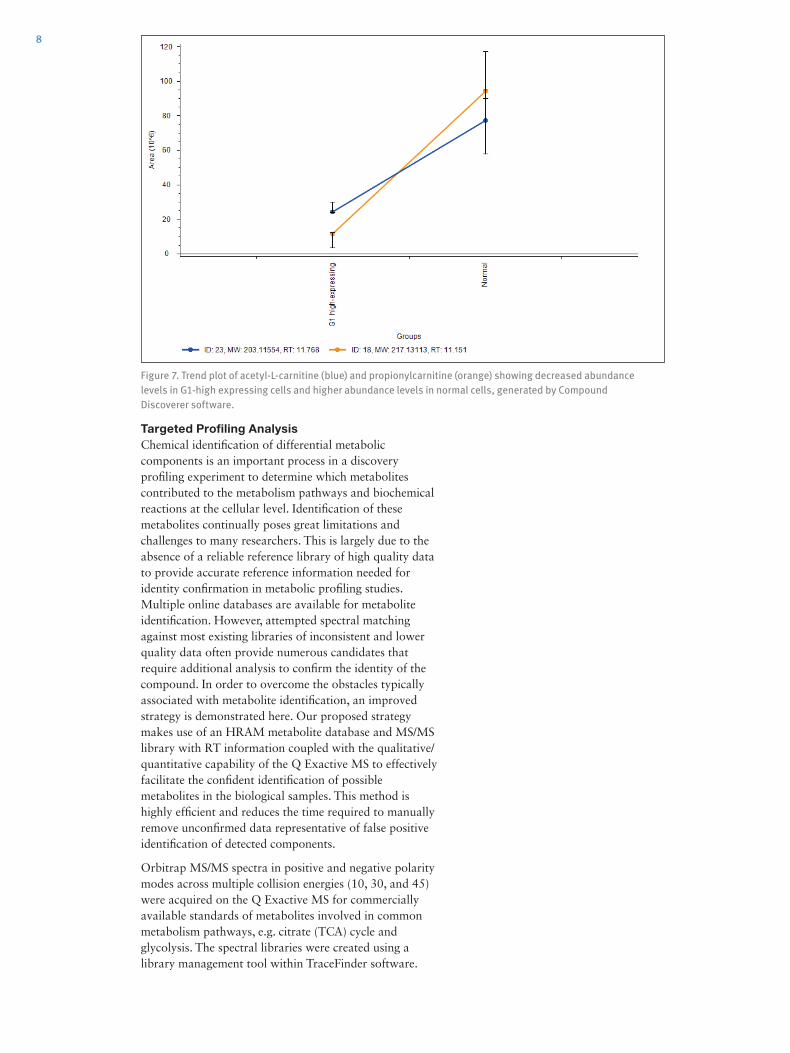
Compound Discoverer 2.0 software also enabled the identification of the metabolites that were present in the samples by performing a search against mzCloud, which is a curated high-resolution, accurate mass spectral database. Results from mzCloud identified 133 compounds. To achieve greater statistical significance, we examined compounds with p-values less than or equal to 0.001. There were greater interests to focus on the carnitine class of compounds for the pancreatic cells in this experiment as the carnitines and acylcarnitines are important shuttle molecules required for energy metabolism. We screened the identified compound list and short-listed the carnitine compounds. The selected carnitines were shown to have significant changes from the volcano plot (Figure 6). In particular, acetyl-L-carnitine and propionylcarnitine had decreased abundance levels in G1-high expressing cells compared to normal cells. This was observed in greater detail from the trend plot of these two carnitine compounds generated from Compound Discoverer 2.0 software (Figure 7).
Figure 5. PCA scatter plot of the untargeted profiling data processed with Compound Discoverer software revealing significant meta-phenotype differences of G1 high-expressing and normal Panc-1 cells.
Figure 6. Volcano plot (p-value = 0.001) showing acetyl-L-carnitine and propionylcarnitine (highlighted), which are two carnitine compounds highly related to the cell study, having great statistical significance.
8
Targeted Profiling AnalysisChemical identification of differential metabolic components is an important process in a discovery profiling experiment to determine which metabolites contributed to the metabolism pathways and biochemical reactions at the cellular level. Identification of these metabolites continually poses great limitations and challenges to many researchers. This is largely due to the absence of a reliable reference library of high quality data to provide accurate reference information needed for identity confirmation in metabolic profiling studies. Multiple online databases are available for metabolite identification. However, attempted spectral matching against most existing libraries of inconsistent and lower quality data often provide numerous candidates that require additional analysis to confirm the identity of the compound. In order to overcome the obstacles typically associated with metabolite identification, an improved strategy is demonstrated here. Our proposed strategy makes use of an HRAM metabolite database and MS/MS library with RT information coupled with the qualitative/quantitative capability of the Q Exactive MS to effectively facilitate the confident identification of possible metabolites in the biological samples. This method is highly efficient and reduces the time required to manually remove unconfirmed data representative of false positive identification of detected components.
Orbitrap MS/MS spectra in positive and negative polarity modes across multiple collision energies (10, 30, and 45) were acquired on the Q Exactive MS for commercially available standards of metabolites involved in common metabolism pathways, e.g. citrate (TCA) cycle and glycolysis. The spectral libraries were created using a library management tool within TraceFinder software.
Figure 7. Trend plot of acetyl-L-carnitine (blue) and propionylcarnitine (orange) showing decreased abundance levels in G1-high expressing cells and higher abundance levels in normal cells, generated by Compound Discoverer software.
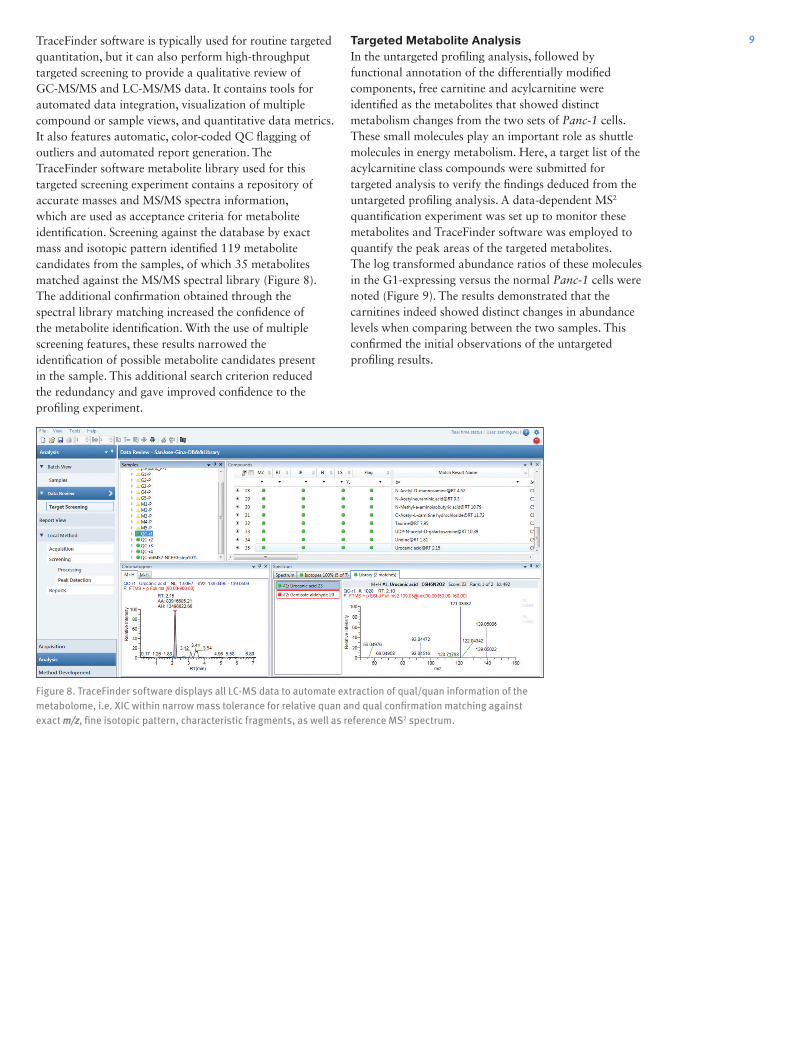
9TraceFinder software is typically used for routine targeted quantitation, but it can also perform high-throughput targeted screening to provide a qualitative review of GC-MS/MS and LC-MS/MS data. It contains tools for automated data integration, visualization of multiple compound or sample views, and quantitative data metrics. It also features automatic, color-coded QC flagging of outliers and automated report generation. The TraceFinder software metabolite library used for this targeted screening experiment contains a repository of accurate masses and MS/MS spectra information, which are used as acceptance criteria for metabolite identification. Screening against the database by exact mass and isotopic pattern identified 119 metabolite candidates from the samples, of which 35 metabolites matched against the MS/MS spectral library (Figure 8). The additional confirmation obtained through the spectral library matching increased the confidence of the metabolite identification. With the use of multiple screening features, these results narrowed the identification of possible metabolite candidates present in the sample. This additional search criterion reduced the redundancy and gave improved confidence to the profiling experiment.
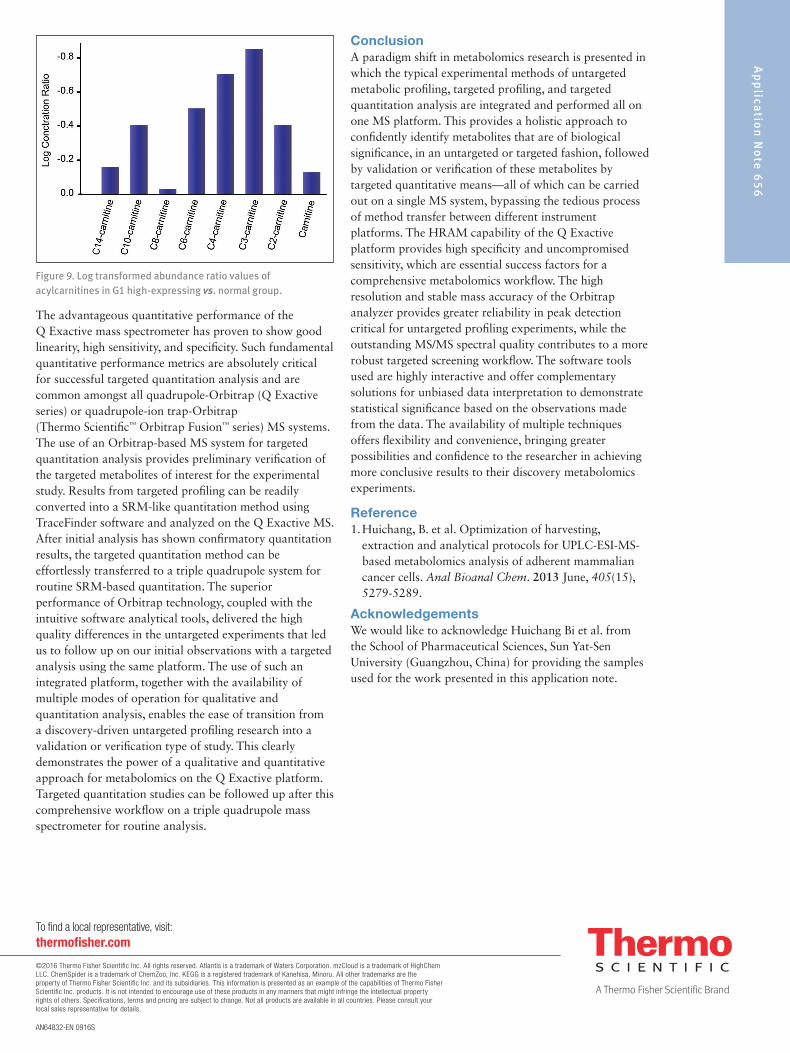
Targeted Metabolite AnalysisIn the untargeted profiling analysis, followed by functional annotation of the differentially modified components, free carnitine and acylcarnitine were identified as the metabolites that showed distinct metabolism changes from the two sets of Panc-1 cells. These small molecules play an important role as shuttle molecules in energy metabolism. Here, a target list of the acylcarnitine class compounds were submitted for targeted analysis to verify the findings deduced from the untargeted profiling analysis. A data-dependent MS2 quantification experiment was set up to monitor these metabolites and TraceFinder software was employed to quantify the peak areas of the targeted metabolites. The log transformed abundance ratios of these molecules in the G1-expressing versus the normal Panc-1 cells were noted (Figure 9). The results demonstrated that the carnitines indeed showed distinct changes in abundance levels when comparing between the two samples. This confirmed the initial observations of the untargeted profiling results.
Figure 8. TraceFinder software displays all LC-MS data to automate extraction of qual/quan information of the metabolome, i.e. XIC within narrow mass tolerance for relative quan and qual confirmation matching against exact m/z, fine isotopic pattern, characteristic fragments, as well as reference MS2 spectrum.
Ap
plica
tion
No
te 6
56
AN64832-EN 0916S
The advantageous quantitative performance of the Q Exactive mass spectrometer has proven to show good linearity, high sensitivity, and specificity. Such fundamental quantitative performance metrics are absolutely critical for successful targeted quantitation analysis and are common amongst all quadrupole-Orbitrap (Q Exactive series) or quadrupole-ion trap-Orbitrap (Thermo Scientific™ Orbitrap Fusion™ series) MS systems. The use of an Orbitrap-based MS system for targeted quantitation analysis provides preliminary verification of the targeted metabolites of interest for the experimental study. Results from targeted profiling can be readily converted into a SRM-like quantitation method using TraceFinder software and analyzed on the Q Exactive MS. After initial analysis has shown confirmatory quantitation results, the targeted quantitation method can be effortlessly transferred to a triple quadrupole system for routine SRM-based quantitation. The superior performance of Orbitrap technology, coupled with the intuitive software analytical tools, delivered the high quality differences in the untargeted experiments that led us to follow up on our initial observations with a targeted analysis using the same platform. The use of such an integrated platform, together with the availability of multiple modes of operation for qualitative and quantitation analysis, enables the ease of transition from a discovery-driven untargeted profiling research into a validation or verification type of study. This clearly demonstrates the power of a qualitative and quantitative approach for metabolomics on the Q Exactive platform. Targeted quantitation studies can be followed up after this comprehensive workflow on a triple quadrupole mass spectrometer for routine analysis.
ConclusionA paradigm shift in metabolomics research is presented in which the typical experimental methods of untargeted metabolic profiling, targeted profiling, and targeted quantitation analysis are integrated and performed all on one MS platform. This provides a holistic approach to confidently identify metabolites that are of biological significance, in an untargeted or targeted fashion, followed by validation or verification of these metabolites by targeted quantitative means—all of which can be carried out on a single MS system, bypassing the tedious process of method transfer between different instrument platforms. The HRAM capability of the Q Exactive platform provides high specificity and uncompromised sensitivity, which are essential success factors for a comprehensive metabolomics workflow. The high resolution and stable mass accuracy of the Orbitrap analyzer provides greater reliability in peak detection critical for untargeted profiling experiments, while the outstanding MS/MS spectral quality contributes to a more robust targeted screening workflow. The software tools used are highly interactive and offer complementary solutions for unbiased data interpretation to demonstrate statistical significance based on the observations made from the data. The availability of multiple techniques offers flexibility and convenience, bringing greater possibilities and confidence to the researcher in achieving more conclusive results to their discovery metabolomics experiments.
Reference 1. Huichang, B. et al. Optimization of harvesting,
extraction and analytical protocols for UPLC-ESI-MS-based metabolomics analysis of adherent mammalian cancer cells. Anal Bioanal Chem. 2013 June, 405(15), 5279-5289.
Acknowledgements We would like to acknowledge Huichang Bi et al. from the School of Pharmaceutical Sciences, Sun Yat-Sen University (Guangzhou, China) for providing the samples used for the work presented in this application note.
Figure 9. Log transformed abundance ratio values of acylcarnitines in G1 high-expressing vs. normal group.
To find a local representative, visit:thermofisher.com
©2016 Thermo Fisher Scientific Inc. All rights reserved. Atlantis is a trademark of Waters Corporation. mzCloud is a trademark of HighChem LLC. ChemSpider is a trademark of ChemZoo, Inc. KEGG is a registered trademark of Kanehisa, Minoru. All other trademarks are the property of Thermo Fisher Scientific Inc. and its subsidiaries. This information is presented as an example of the capabilities of Thermo Fisher Scientific Inc. products. It is not intended to encourage use of these products in any manners that might infringe the intellectual property rights of others. Specifications, terms and pricing are subject to change. Not all products are available in all countries. Please consult your local sales representative for details.


![Metabolomics: An introduction - Semantic Scholar · Metabolomics: An introduction Reza Salek [1], Laura Emery [2], Stephan Beisken [3] Systems Chemical biology Beginner 1 hour This](https://img.dokumen.tips/doc/110x75/5ecfc3e995feb652de103642/metabolomics-an-introduction-semantic-scholar-metabolomics-an-introduction-reza.jpg)