Embed Size (px)
Citation preview
Atmospheric Environment Vol. 25A, No. 3/4, pp. 645~54, 1991. 0004-6981/91 $3.00+0.00 Printed in Great Britain. © 1991 Pergamon Press pie
AN INSTRUMENT FOR THE CLASSIFICATION OF AIRBORNE PARTICLES ON THE BASIS OF SIZE, SHAPE,
AND COUNT FREQUENCY
P. H. KAYE, N. A. EYLES, I. K. LUDLOW and J. M. CLARK* Laser Systems Research Group, Hatfield Polytechnic, Hatfield, Hertfordshire, ALl0 9AB, U.K. and
*CDE, Salisbury, Wiltshire, U.K.
(First received 8 Auffust 1989 and received for publication 11 December 1989)
Abstract--A laser light scattering instrument for the study of airborne particulate material is described. The instrument examines individual particles (primarily in the size range 1-10/~m equivalent diameter) at rates of up to 10,000 s- 1. Each particle is ascribed an asymmetry factor, or asphericity factor, based upon the spatial intensity distribution of the scattered laser radiation. This factor ranges from 0 for perfect spheres to 100 for long fibres. Particles are also ascribed a size parameter based upon the total equivalent scattering from a perfect sphere.
Data may be displayed graphically in terms of size vs count frequency, asymmetry factor vs count frequency, or as an axonometric plot of size vs asymmetry factor vs count frequency. The latter three- dimensional surface is a characteristic signature of the aerosol under examination and preliminary results indicate the possibility of employing this form of data analysis to monitor small changes in aerosol composition, such as, for example, the presence of low concentrations of spheres (droplets) or fibres.
Results are presented for incompressible solid spheres, liquid droplets, and mineral fibres.
Key word index: Optical scattering, laser scattering, particle shape, particle asymmetry, particle sizing, fibres.
1. INTRODUCTION
The use of optical scattering as a means of counting and sizing individual airborne particles is common and is available in a variety of commercial instru- ments. However, the interaction between a particle and an incident electromagnetic wave is a function of the particle's shape and dielectric structure as well as its physical size relative to the wavelength of the radiation. For spherical particles of known refractive index, the spatial intensity distribution of scattered radiation may be predicted exactly by Mie theory (see for example Kerker, 1969). For non-spherical particles such theoretical synthesis is generally intractable ex- cept for special geometric cases such as long cylinders or ellipsoids having specified orientation to the inci- dent radiation. Conventional optical counter-sizer instruments therefore do not attempt to deduce any information about the shape of the scattering particles under examination.
Since most airborne particles, either naturally occurring or man-made, are not perfect spheres, par- ticle shape is an important parameter by which par- ticle species may often be classified. Considerable effort has been addressed both to analyzing the per- formance of conventional commercial optical counter-sizers when faced with non-spherical par- ticles (e.g. Gebhart and Anselm, 1988; Bottlinger and Umhauer, 1988), and to the development of new instruments which may provide some information on particle asymmetry (e.g. Diehl and Smith, 1979; Husar
and Allen, 1980; Kittlinger and Zerull, 1988; Rarity, 1988). This paper describes an instrument of this type.
2. THE AIRBORNE PARTICLE CLASSIFIER (APC)
The Airborne Particle Classifier (APC) is a laser- based instrument designed to assess the feasibility of classifying individual airborne particles on the basis of 'size' and 'shape' parameters--these parameters being determined by measurement and analysis of the spa- tial intensity distribution of laser radiation scattered by the particle. Particle orientation for non-spherical particles is a predominant factor in their scattering characteristics (e.g. Latimer et al., 1978), and the instrument is also to be used to study and improve methods of achieving orientation of non-spherical particles in fluid flow, such that size determination may be achieved with greater accuracy and reliability.
The APC comprises an optical scattering chamber, dedicated data acquisition and pre-processing electro- nics, and a computer (IBM PC-AT) for instrument control, data analysis, and display.
2.1. Scatterin 0 chamber
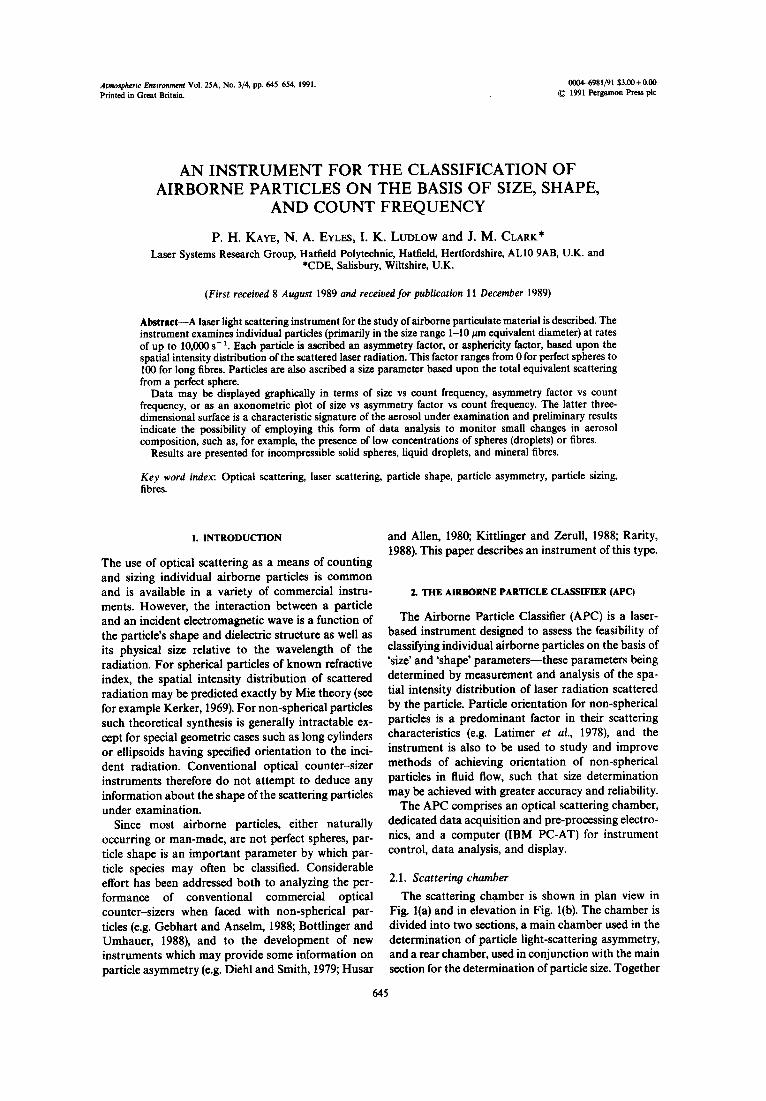
The scattering chamber is shown in plan view in Fig. l(a) and in elevation in Fig. l(b). The chamber is divided into two sections, a main chamber used in the determination of particle light-scattering asymmetry, and a rear chamber, used in conjunction with the main section for the determination of particle size. Together
645
646 P.H. KA~,'E et at.
3 2 PLAN VIEW
Ilalm~Mmumnwmmnln~nllmllllll
IP Detector ~ , Channels
II II ~ ~ Ua) and 1~. nL_lll ~ C, m l x ~ r , ~ t s lid [ ] "~ -1~6 1 HeNe Laser
~ 1 2 Main-Chamber ] [ ~ 3 Rear-Chamber L._J [ [ 4 Photomultiplier Housing Detector Channel E4 5 5 Beam Expander
I 1 6 Iris Diaphragm 7 Cylindrical Lens ~ 8 Scattering Volume
9 Filter for sheath-air
Beam Power Monitor
Samp)e Inlet ELEVATION
Spatial Aperture
2 i 4
Filter
Flowmeter
Pump
Fig. 1. Schematic diagram of the Airborne Particle Classifier (APC). (a) Plan view, (b) elevation from laser.
the chambers measure approximately 20 cm in length. Radiation from a multimode, randomly polarized
5 mW HeNe laser operating at a wavelength of 632.8 nm passes through a beam expander, iris dia- phragm, and cylindrical lens. After reflection from a 45 ° front-silvered mirror, the beam is focussed to an approximately ellipsoidal cross section (2.5 mm
width by ~40/~m depth) at a point within the scattering chamber coincident with the transverse vertical flow of incoming sample air. (The mirror reflectanccs for all incident polarizations are equal to within ,,~4%.) The beam is terminated in a Rayleigh- horn beam dump which incorporates a power moni- toring photodiode. The output of this photodiode is
Classification of airborne articles 647
used to monitor long-term power drift of the laser output.
Particle laden sample air is drawn in through the scattering chamber at a rate of approximately 4 d rain-1. The majority of this airflow is drawn through a high-efficiency filter to provide a particle- free sheath flow for the sample air. Thus the sample air is confined to a column of approximately 1 mm dia- meter at the scattering volume, with a sample volume flow-rate of 600 ml min- x. Individual particles in the sample air traverse the laser beam and produce pulses of scattered radiation of approximately 5 #s duration. Light scattered between 27 and 145 ° to the beam direction is reflected by an ellipsoidal reflector whose first principal focus is coincident with the scattering volume. The reflected light is thus refocussed to the second principal focus where it passes through an iris diaphragm before being collimated by an aspheric lens. The parallel light emerging from the lens is therefore a two-dimensional transform of the three- dimensional spatial intensity distribution falling on the ellipsoidal reflector. The light finally is incident upon three apertured miniature photomultiplier tubes arranged concentrically about the chamber axis. (This optical geometry results in each detector subtending a solid angle of 1.2 steradians at the scattering volume, centred at an angle of elevation from the beam axis of 84°.) These detectors, referred to as detector channels El, E2 and E3, are used in the assessment of particle shape.
Light scattered by the particle into the forward zone (between angles 8 and 27 ° to the laser beam) passes into the rear section of the scattering chamber where it is focussed by a second ellipsoidal reflector onto an aspheric lens combination. This lens combination relays the light onto a fourth photomultiplier, channel E4, the output from which is used in the assessment of particle size. At present, the APC is optimized for a particle size range from 1 to 10/~m diameter.
2.2. Data acquisition electronics
Dedicated electronic processing modules interface the scattering chamber assembly to the host IBM-AT computer. The outputs from the four Detector Chan- nels together with that from the beam-power photo- diode undergo signal conditioning (amplification and 500 kHz low-'pass analogue filtering) before being assigned to individual data processing modules.
Each data processing module contains an eight-bit 'flash' analogue-to-digital (A/D) convertor running continuously at a rate of 4 megasamples s- t, together with dedicated high-speed logic circuitry. This logic circuitry detects the arrival of an incoming signal pulse produced by a particle entering the beam and per- forms a cumulative sampling process to determine both the duration of the pulse, i.e. the number of 250 ns samples recorded (this being a measure of the time-of-flight of the particle through .the beam), and
the area beneath the pulse, i.e. the relative scattered energy produced by the particle on traversing the beam. This digital sampling process allows the magni- tude of the scattered pulse to be determined to signifi- cantly greater precision than would be attainable using a conventional pulse-height measurement tech- nique with similar A/D resolution, as well as providing time-of-flight information for individual particles. The time-of-flight and relative scattered energy data for each particle are stored in random access memory (RAM), again each detector channel being serviced by its own data processing module. This system is cap- able of recording data on all particles for particle throughput rates of up to ~ 10,000 particles s- t. For throughput rates greater than this value, although all particles are counted (up to a maximum of 60,000 particles s-t), the number being processed in the described manner remains fixed at approximately 10,000 s- t.
When the RAM buffers are filled, data are passed to the host computer for post-processing. For the pur- poses of initial testing, data sets relating to 1000 or 10,000 particles have been used, although this figure may be varied at will. Whilst data capture and record- ing is achieved in real-time, the post-processing oper- ations are comparatively slow. It is the authors' inten- tion to upgrade the instrument to achieve real-time analysis of an incoming sample aerosol.
2.3. Shape classification
Spherical particles illuminated by plane, randomly polarized wavefronts will scatter the radiation with cylindrical symmetry about the direction of propaga- tion of the beam (Kerker, 1969). Thus, in the APC, Channels El, E2 and E3 generate equal outputs for perfectly spherical scatterers. For non-spherical scattering particles, the degree of asymmetry in the radially scattering radiation profile will be principally a function of particle shape and orientation. There is some evidence (Latimer et al., 1978; Eisert and Nezel, 1979) that laminar flow systems of the type employed to deliver the sample into the APC can produce some degree of orientation of elongated or fibrous particles-with the long axis lying parallel with the flow. Our early results with the APC indicate that, though present, this orientational effect is small with the current air flow configuration, and that further development in this area is necessary. (See section 3.)
In order to quantify the degree of asymmetry in the radial scattering profiles of non-spherical particles, each particle is assigned an asymmetry factor, Af, based upon the relative energy magnitudes El, E2 and E3 of channels 1, 2 and 3, respectively. This factor is currently evaluated using the following expression:
x/ ( /~- El) 2 + (E-- E2) 2 + (/~- E3) 2 Af ~--- × 40.81
where/~ is the mean of El, E2 and E3, and 40.81 is a scaling factor. Hence equal values of El, E2 and E3
648 P.H. KAvE et al.
(spherical particles) result in an Af =0, whilst maxi- mally asymmetric scattering, i.e. E1 =E3 = 0 and E2 =n where n is a positive value (corresponding to greatly elongated particles oriented parallel to air- flow) results in the maximum possible Af = 100. The method employed to display the asymmetry factor data is described in section 3.
2.4. Size classification
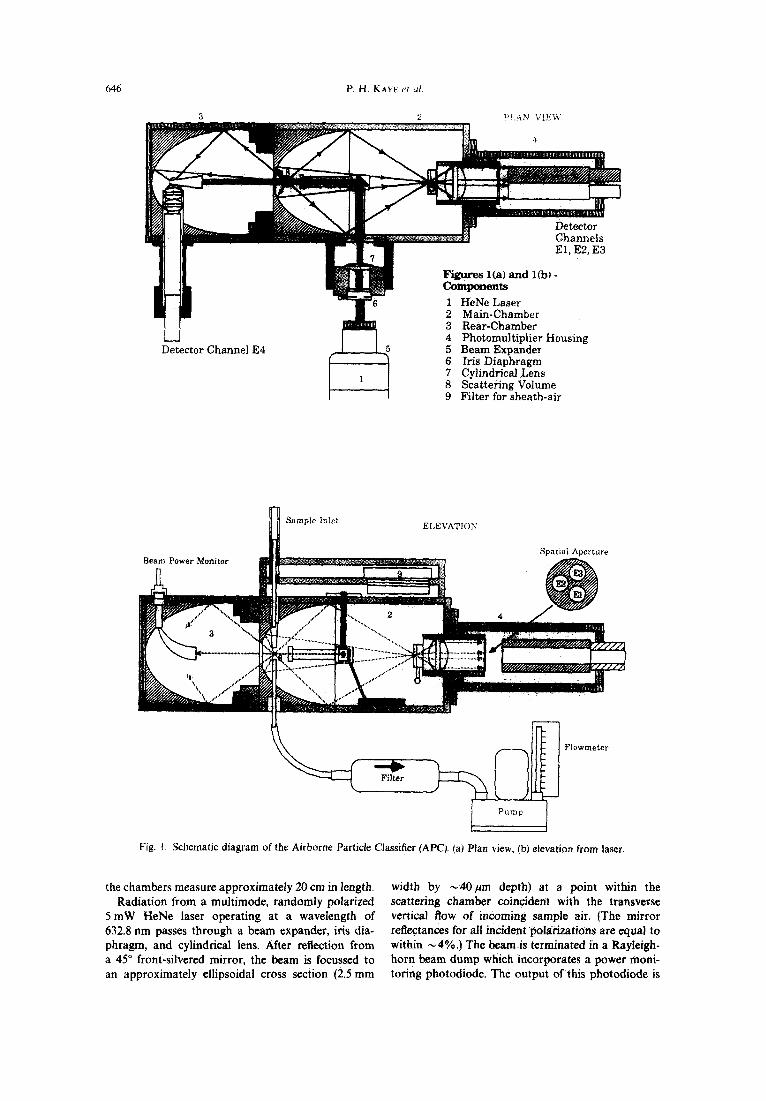
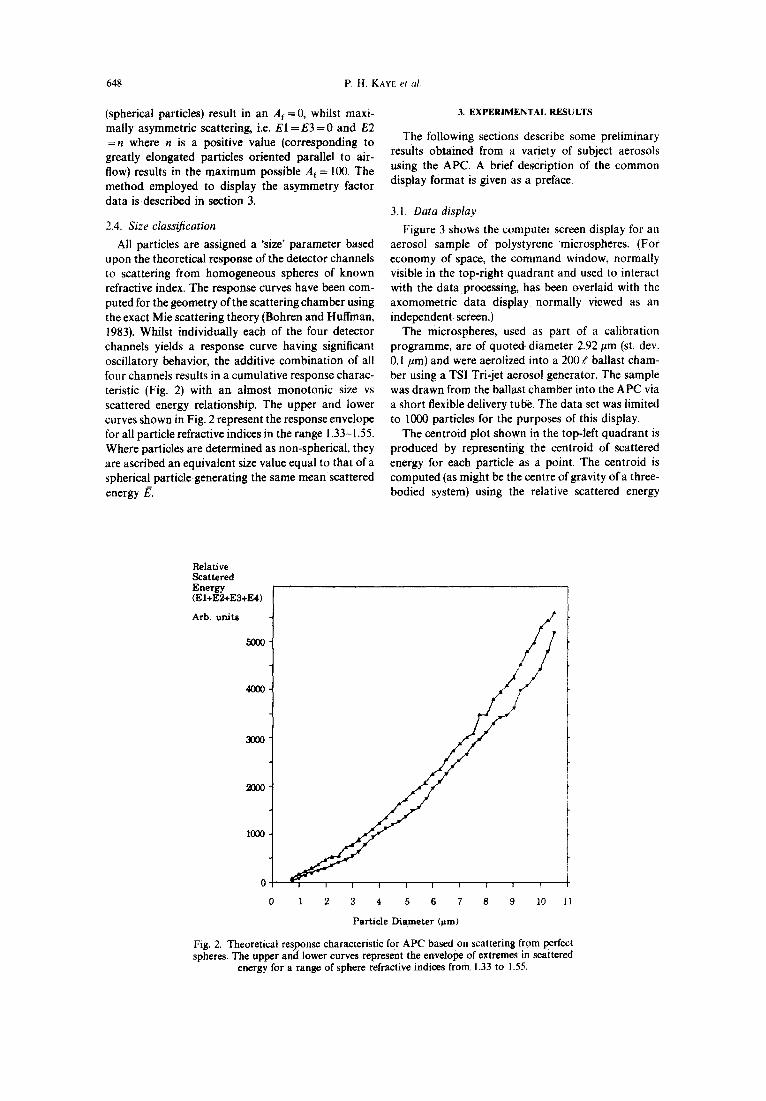
All particles are assigned a 'size' parameter based upon the theoretical response of the detector channels to scattering from homogeneous spheres of known refractive index. The response curves have been com- puted for the geometry of the scattering chamber using the exact Mie scattering theory (Bohren and Huffman, 1983). Whilst individually each of the four detector channels yields a response curve having significant oscillatory behavior, the additive combination of all four channels results in a cumulative response charac- teristic (Fig. 2) with an almost monotonic size vs scattered energy relationship. The upper and lower curves shown in Fig. 2 represent the response envelope for all particle refractive indices in the range 1.33-1.55. Where particles are determined as non-spherical, they are ascribed an equivalent size value equal to that of a spherical particle generating the same mean scattered energy/~.
3. EXPERIMENTAL RESULTS
The following sections describe some preliminary results obtained from a variety of subject aerosols using the APC. A brief description of the common display format is given as a preface.
3.1. Data display
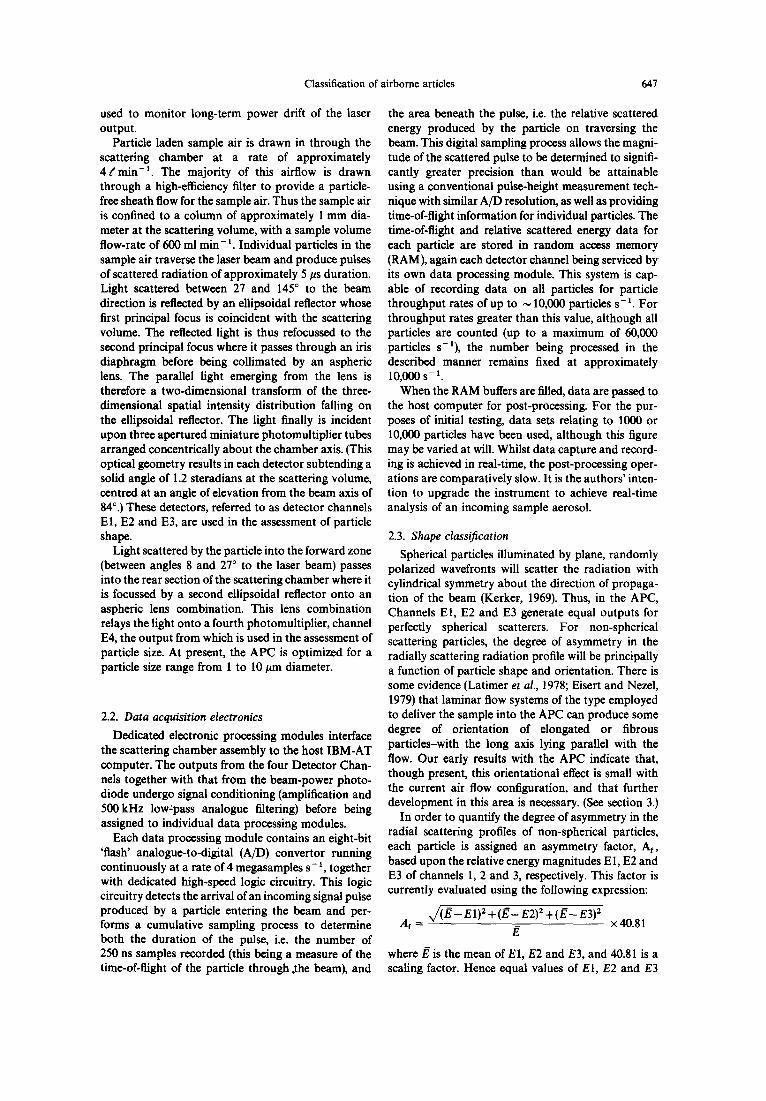
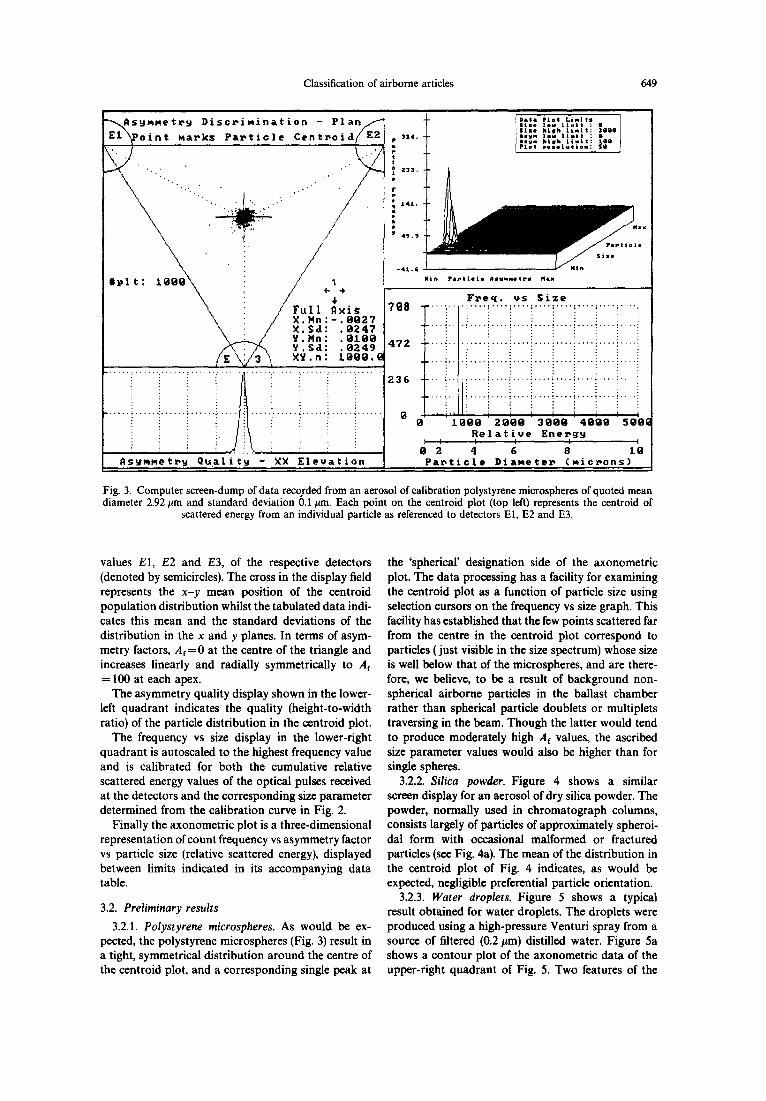
Figure 3 shows the computer screen display for an aerosol sample of polystyrene "microspheres. (For economy of space, the command window, normally visible in the top-right quadrant and used to interact with the data processing, has been overlaid with the axomometric data display normally viewed as an independent screen.)
The microspheres, used as part of a calibration programme, are of quoted diameter 2.92/~m (st. dev. 0.1/Jm) and were aerolized into a 200 f ballast cham- ber using a TSI Tri-jet aerosol generator. The sample was drawn from the ballast chamber into the APC via a short flexible delivery tube: The data set was limited to 1000 particles for the purposes of this display.
The centroid plot shown in the top-left quadrant is produced by representing the centroid of scattered energy for each particle as a point. The centroid is computed (as might be the centre of gravity of a three- bodied system) using the relative scattered energy
Relative Scattered Energy (EI+E2+E3+E4)
Arb. units
5000
4O0O
30OO
20OO
1000
0 ~
0 1 2 3 4 5 6 7 8 9 10 11
Particle Diameter (i~m)
Fig. 2. Theoretical response characteristic for APC based on scattering from perfect spheres, The upper and lower curves represent the envelope of extremes in scattered
energy for a range of sphere refractive indices from 1.33 to !.55.
Classification of airborne articles 649
" ~ s ~ . . e t ~ y D i s e r i N i n a t i o n - P l a n e / " h , . . s . , L , . , t . s i . . t , . o ~ithz'" st.~ttt.it:: 63.eei E ' ' ~ o i . t . a . k s P a . t i ¢ l e C e n t . o i d ( E ~ i , a . ' . . - ' . - " - " : • Asgn k i t h l i n i t : t lO I I
. . . : . . . " . . . . . . . ~ z33 . ~ ,
r r
• ~ 141.
n o ax
49.9
- 4 1 , ~ NAn ~ Nln P a ~ t L a l e AsynmetP~ Hax
~ ~ F ~ e q . v s S i z e ! / F u l l ~ i ~ 7 8 8 : : : : : :
~ , : / X H n : - 8 0 2 7 ! ! i : . ! . : : • / X . S a : . e 2 4 7 . . . . . ! ~ . . . . ! . . . . ! • " ~ . . . . ~ . . . . ~ . . . . :
\ ~ . . ~ / ¥ . M n : . 8 1 0 g : : : : : • " : / N : ~ Y . S a : 8 2 4 9 4 7 2 ~ . . . . ~ ; ? . .
, ,
i i i,i ii i i ! . . . . . . "
8 0 1 0 0 0 2 0 0 0 3 8 8 ~ 4 8 ~ 8 5 0 g ~
R e l a t i v e E n e r g y I I I I I i
, 8 2 4 6 8 1 8
AsymMetry q u a l i t y - XX E l e v a t i o n P a r t i c l e D i a ~ e t e ~ ( ~ i c ~ o n s )
Fig. 3. Computer screen-dump of data recorded from an aerosol of calibration polystyrene microspheres of quoted mean diameter 2.92 #m and standard deviation 0.1/zm. Each point on the centroid plot (top left) represents the centroid of
scattered energy from an individual particle as referenced to detectors El, E2 and E3.
values El, E2 and E3, of the respective detectors (denoted by semicircles). The cross in the display field represents the x-y mean position of the centroid population distribution whilst the tabulated data indi- cates this mean and the standard deviations of the distribution in the x and y planes. In terms of asym- metry factors, Ar = 0 at the centre of the triangle and increases linearly and radially symmetrically to Af = 100 at each apex.
The asymmetry quality display shown in the lower- left quadrant indicates the quality (height-to-width ratio) of the particle distribution in the centroid plot.
The frequency vs size display in the lower-right quadrant is autoscaled to the highest frequency value and is calibrated for both the cumulative relative scattered energy values of the optical pulses received at the detectors and the corresponding size parameter determined from the calibration curve in Fig. 2.
Finally the axonometric plot is a three-dimensional representation of count frequency vs asymmetry factor vs particle size (relative scattered energy), displayed between limits indicated in its accompanying data table.
3.2. Preliminary results
3.2.1. Polystyrene microspheres. As would be ex- pected, the polystyrene microspheres (Fig. 3) result in a tight, symmetrical distribution around the centre of the centroid plot, and a corresponding single peak at
the 'spherical' designation side of the axonometric plot. The data processing has a facility for examining the centroid plot as a function of particle size using selection cursors on the frequency vs size graph. This facility has established that the few points scattered far from the centre in the centroid plot correspond to particles (just visible in the size spectrum) whose size is well below that of the microspberes, and are there- fore, we believe, to be a result of background non- spherical airborne particles in the ballast chamber rather than spherical particle doublets or multiplets traversing in the beam. Though the latter would tend to produce moderately high Af values, the ascribed size parameter values would also be higher than for single spheres.
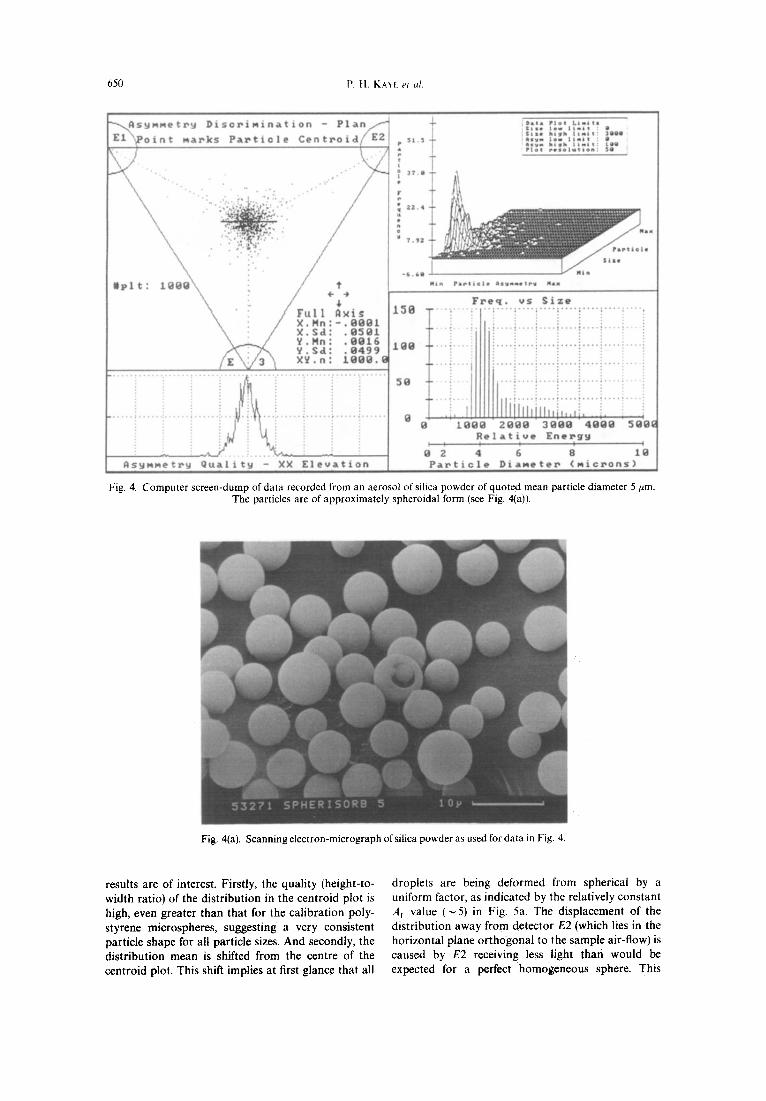
3.2.2. Silica powder. Figure 4 shows a similar screen display for an aerosol of dry silica powder. The powder, normally used in chromatograph columns, consists largely of particles of approximately spheroi- dal form with occasional malformed or fractured particles (see Fig. 4a). The mean of the distribution in the centroid plot of Fig. 4 indicates, as would be expected, negligible preferential particle orientation.
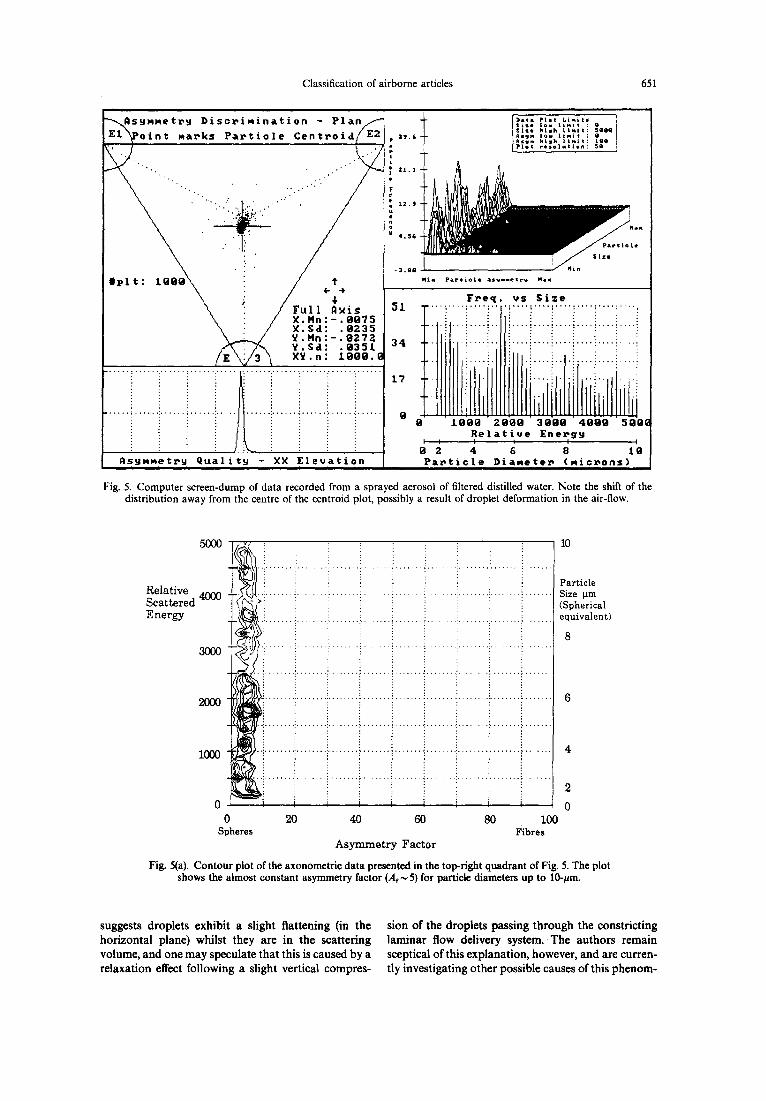
3.2.3. Water droplets. Figure 5 shows a typical result obtained for water droplets. The droplets were produced using a high-pressure Venturi spray from a source of filtered (0.2 #m) distilled water. Figure 5a shows a contour plot of the axonometric data of the upper-right quadrant of Fig. 5. Two features of the
050 P.H. KAYF. e: u/.
~ v ~ e t x , v D i s c P i m i n a t i o n - ~- F l a n .. f " x' : o i n t ~ a m k s P a x ~ t i c l e C e n t x ' o i d ( / E 2 1 1 ~ ~* : ~-
\
\
. :~i ~: ' . .
' ~k ' " ~1. :~ ~ ~" \ ,
~( / ' r
g 2 4
7 . 9 2
\\ ' # p l t : l~Og / ~- . /"
\ /ruli a~i~ )~. Hn : - . 8001
\ / X . S d : . 8501 \ :' Y . M n : . 0 Q I . 6
~ ? ~ Y,Sd: .8499 × k ~ . n : 1 . 8 0 ~ .
. . . . . . ! . . . . . . . . . . . ] . . . . . i1. • . . . . . . . . . . . . . . . . . OI!, A~ymmetx,~ Q u a l i t y X X E l e v a t i o n
i i i i i i i i
D a k a P l o t L l m s t l
¢ l z e ~ A ~ N l i m i t : ~ Q @ 8 ~ $ g m I o ~ l t m l t :
P l o t r e s o l u t i o n : $8
M t n P a r t t e l e A s y ~ m • ~ r ~ M a x
150
1 8 8
50
l l X
F ~ e q . v s S i z e
' " z ~ a 8 ' 3 a s a 4 o ~ o s a ~ q l a t i , ve En,PLg"~ ' /
L Fig. 4. Computer screen-dump of data recorded from an aerosol of silica powder of quoted mean particle diameter 5 #m.
The particles are of approximately spheroidal form (see Fig. 4(a)).
Fig. 4(a). Scanning electron-micrograph ofsitica powder as used for data in Fig. 4.
results are of interest. Firstly, the quality (height-to- width ratio) of the distribution in the centroid plot is high, even greater than that for the calibration poly- styrene microspheres, suggesting a very consistent particle shape for all particle sizes. And secondly, the distribution mean is shifted from the centre of the centroid plot. This shift implies at first glance that all
droplets are being deformed from spherical by a uniform factor, as indicated by the relatively constant Af value (~5 ) in Fig. 5a. The displacement of the distribution away from detector E2 (which lies in the horizontal plane orthogonal to the sample air-flow) is caused by E2 receiving less light than would be expected for a perfect homogeneous sphere. This
Classification of airborne articles 651
~ s ~ M M e t ~ , ~ D i s c r i m i n a t i o n - P l a n / ~
o i n t Mat-ks P a r t i c l e C e n t t - o i d E2
: / F u l l ~ i . / X. Mn : - . 0 0 7 ~
~ , / X . S d : . 0 2 3 5 \ __..__ / g . Iqn : - . 0 2 7 2
~ ¥ . S d : . 0 3 5 1
iiiiiiiiiiiiiiiiiii iiiii iiiii iiiiiiiiiiiiiiiiiiiiiiiiiiiiiiiill [ t s ~ M M e t ~ - ~ q u a l i ~ - XX E l e v a t i o n
Z 9 , 6
~ a t a P l o t L i N i t s [
~ i z t h i g h l l ~ t t : Q e q
2 1 . 3
t 2 . $
4 . $ 6
- $ . 8 e N i A P a i n t i ¢ 1 . l l g . . e t r ~ N I X
q & x
l e
51
3 4
1 7
F ~ e q . vs S i z e
jllj rl ir;iE,iijiill i: ii;ii;iiii,ii,li,iii,i 0 1 0 0 ~ 2 0 0 0 3 9 6 0 4 0 0 0 5 0 0 ~
R e l a t i v e E n e r g y I I I I I I
0 2 4 6 8 1 0 P a r t i c l e D i a M e t e ~ ( M i c r o n s )
Fig. 5. Computer screen-dump of data recorded from a sprayed aerosol of filtered distilled water. Note the shift of the distribution away from the centre of the centroid plot, possibly a result of droplet deformation in the air-flow.
Relative Scattered Energy
! 11 1 i i - " " 4000 Size gm
i i ! -,,,a' equivalent)
8
~ ° ° ~ i J i i i i i i i
1000 4
2 0 I I I I I I i I 0
0 20 40 60 80 100 Spheres Fibres
Asymmetry Factor
Fig. 5(a). Contour plot of the axonometric data presented in the top-right quadrant of Fig. 5. The plot shows the almost constant asymmetry factor (Af ~ 5) for particle diameters up to 10-#m.
suggests droplets exhibit a slight flattening (in the horizontal plane) whilst they are in the scattering volume, and one may speculate that this is caused by a relaxation effect following a slight vertical compres-
sion of the droplets passing through the constricting laminar flow delivery system. The authors remain sceptical of this explanation, however, and are curren- tly investigating other possible causes of this phenom-
652 P.H. KA'~V et al.
enon-- including the effect of a possible residual l inear polarization component in the illuminating laser beam.
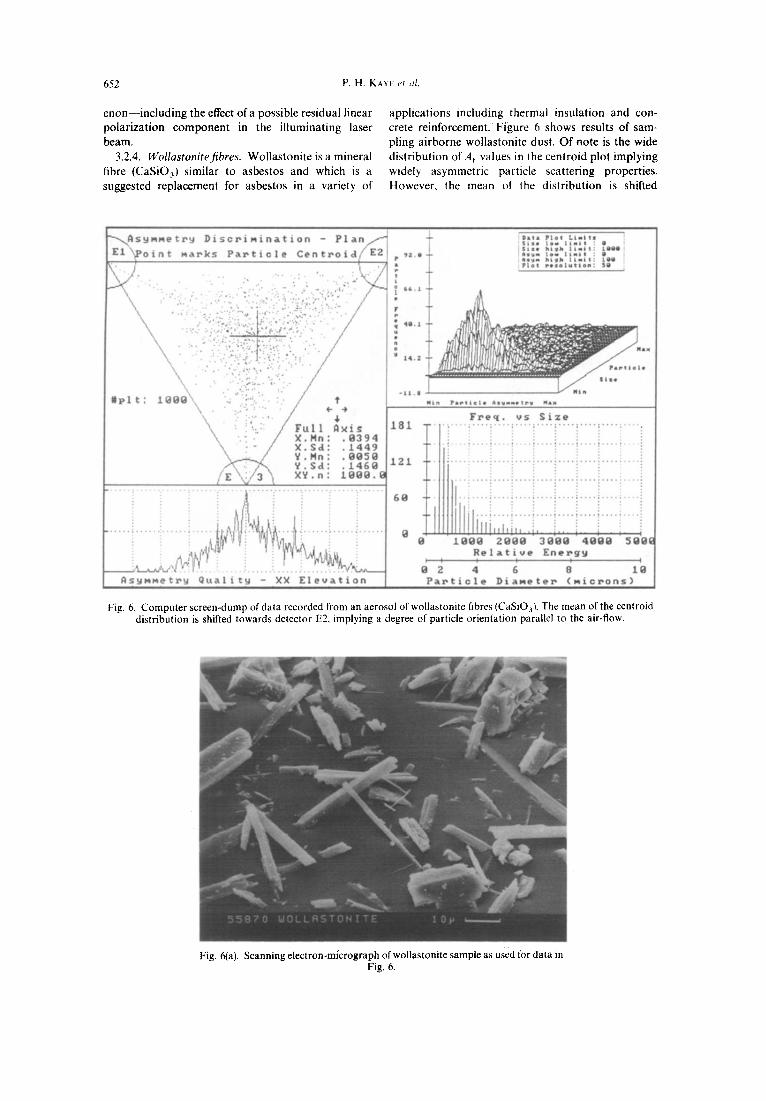
3.2.4. Wol las ton i t e f ibres . Wollastoni te is a mineral fibre (CaSiO3) similar to asbestos and which is a suggested replacement for asbestos in a variety of
applications including thermal insulation and con- crete reinforcement. Figure 6 shows results of sam- pling airborne wollastonite dust. Of note is the wide distribution of Af values in the centroid plot implying widely asymmetric particle scattering properties. However, the mean of the distribution is shifted
~'~xit s ~ ~Me ~ ~,~ D i s o ~ i ~ i n a t i o n PI an / - ~ E l \ ~ o i n t ~ a r k s P a r t i c l e C e n t r o i d / ' E 2
t
• . . . . , . r h
• , ~.
# p i t : l ~ O 0 "~ -; : ...... ?
,I. \ /
/ X,Mn: . 8 3 9 4 , x.S&: . 1449
y..Mn: .0050
. z',,,~,'a 'I x ~ . . : i o o o .
',/,l,~,f,,,/@ l ' r,,']iV~i!,~,vO~,L,ik~l A__.._~,'~", ~'.' if ~ " ' ~ , , ~
A s ! ; ~ e ~ g ~ttalt tg XX Ele~ation
P
,:I : +
' ) " ~ i ~,6 t :
F
1 I0,I
t4.2
Data P l o t L i m i t s S t z a IDw l l ~ i t : S t x o ~i~h l i m i t : t O O @
0 ~ t e ~ h i ~ h l i m i t : t O 0 P l o t r e l o l u t i o n : 50
i i 8 . . . .
H t n P a r t i G l o A s y m m e t r ~ Max
181
121
68
@
Freq. vs ~ize
T ~ .... : ! .... : .... ! .... ! !
IOQO 2~0 3008 4000 500G
Relative Energy ] 1 ~ I I I
O 2 4 6 8 10 Particle Diametep (microns)
Fig. 6. Computer screen-dump of data recorded from an aerosol of wollastonite fibres (CaSiO 3}. The mean of the centroid distribution is shifted towards detector E2, implying a degree of particle orientation parallel to the air-flow.
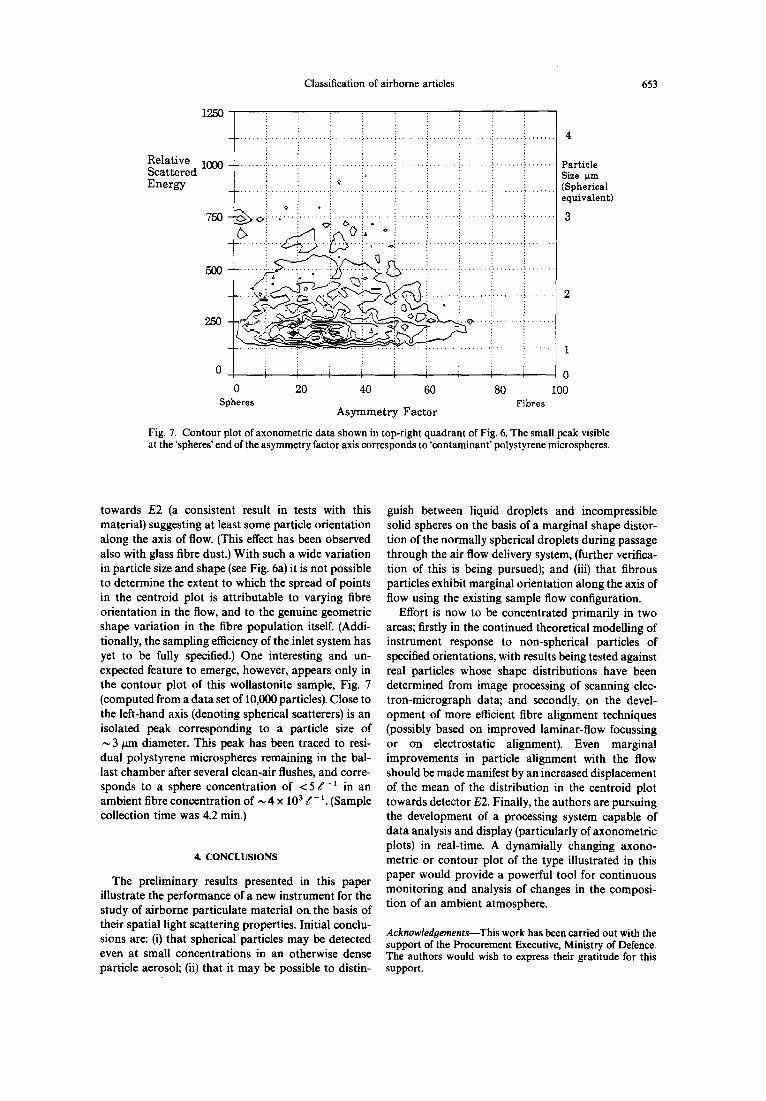
Fig. 6(a). Scanning electron-micrograph of wollastonite sample as used for data in Fig. 6.
Classification of airborne articles 653
Relative Scattered Energy
1250
. . . . . . . . . . . . . . . . . . . . . . . . . . . . . . . . . . . , . . . . . . . . . . . . . . . . . . . . . . . . • . . . . . . . . . . . . . . . . . . . . . . .
I000 ................. i .................................................................
i ~ '
. . . . . . . . . . . . . . . . . i . . . . . . . . . . . . . . . ~ . . . . . . . . . . . . . . . . . . . . . . . . . . . . . . . . . . . . . . . : i <> i ,
750 ~-,~,~. ~,.? • .~ .... i . . . . . . . . : . . . . . i ....... ~ ....... ~ ... . . . . . : . . . . . . . . :
. . . . . . . . ,: . . . . . . . . . . . . , . . . . . . . . . . . . . . . . . . . . . . . . . . • . . . . . . .
500
-~ ~\~ ~ : ' ' i :: ::
2 . 5 0 ~ . % . ~ ~ . : . . ~ . . . . i . . . . . . . . ~ . . . . . .
0 ~ i 0
0 20 40 60 80 100 Spheres Fibres
Asymmetry Factor
Fig. 7. Contour plot of axonometric data shown in top-right quadrant of Fig. 6. The small peak visible at the 'spheres' end of the asymmetry factor axis corresponds to 'contaminant' polystyrene microspheres.
Particle Size ~tm (Spherical equivalent)
3
towards E2 (a consistent result in tests with this material) suggesting at least some particle orientation along the axis of flow. (This effect has been observed also with glass fibre dust.) With such a wide variation in particle size and shape (see Fig. 6a) it is not possible to determine the extent to which the spread of points in the centroid plot is attributable to varying fibre orientation in the flow, and to the genuine geometric shape variation in the fibre population itself. (Addi- tionally, the sampling efficiency of the inlet system has yet to be fully specified.) One interesting and un- expected feature to emerge, however, appears only in the contour plot of this wollastonite sample, Fig. 7 (computed from a data set of 10,000 particles). Close to the left-hand axis (denoting spherical scatterers) is an isolated peak corresponding to a particle size of ~ 3 #m diameter. This peak has been traced to resi- dual polystyrene microspheres remaining in the bal- last chamber after several clean-air flushes, and corre- sponds to a sphere concentration of < 5 E-1 in an ambient fibre concentration of ~ 4 x 10³ E- 1. (Sample collection time was 4.2 min.)
4. CONCLUSIONS
The preliminary results presented in this paper illustrate the performance of a new instrument for the study of airborne particulate material on- the basis of their spatial light scattering properties. Initial conclu- sions arc: (i) that spherical particles may be detected even at small concentrations in an otherwise dense particle aerosol; (ii) that it may be possible to distin-
guish between liquid droplets and incompressible solid spheres on the basis of a marginal shape distor- tion of the normally spherical droplets during passage through the air flow delivery system, (further verifica- tion of this is being pursued); and (iii) that fibrous particles exhibit marginal orientation along the axis of flow using the existing sample flow configuration.
Effort is now to be concentrated primarily in two areas; firstly in the continued theoretical modelling of instrument response to non-spherical particles of specified orientations, with results being tested against real particles whose shape distributions have been determined from image processing of scanning elec- tron-micrograph data; and secondly, on the devel- opment of more efficient fibre alignment techniques (possibly based on improved laminar-flow focussing or on electrostatic alignment). Even marginal improvements in particle alignment with the flow should be made manifest by an increased displacement of the mean of the distribution in the centroid plot towards detector E2. Finally, the authors are pursuing the development of a processing system capable of data analysis and display (particularly of axonometric plots) in real-time. A dynamially changing axono- metric or contour plot of the type illustrated in this paper would provide a powerful tool for continuous monitoring and analysis of changes in the composi- tion of an ambient atmosphere.
Acknowledoements--This work has been carried out with the support of the Procurement Executive, Ministry of Defence. The authors would wish to express their gratitude for this support.
654 P.H. KAYE et al.
REFERENCES
Bohren C. F. and Huffman D. R. (1983) Absorption and Scattering of Light by Small Particles. Wiley, New York.
Bottlinger M. and Umhauer H. (1988) Scattered light par- ticle-size counting analysis--influence of shape and struc- ture. In Optical Particle Sizing: Theory and Practice. Int. Syrup. pp. 363-369. Plenum, New York.
Diehl S. R. and Smith D. T. (1979) Analysis of suspended solids by single particle scattering. Appl. Opt. 18, 1653-1658.
Eisert W. G. and Nezel M. (1979) Internal calibration to absolute values in flow-through particle size analysis. Rev. Sci. lnstrum. 49, 1617.
Gebhart J. and Anselm A. (1988) Effects of particle shape on the response of single particle optical counters. In Optical Particle Sizing: Theory and Practice, Int. Symp., pp.
393-409. Plenum, New York. Husar R. B. and Allen J. (1980) Aerosol Particle Size and
Shape Analysis. Air Pollution Research Laboratory. Wa- shington State University Press, Washington.
Kerker M. (1969) The Scattering of Light and Other Electro- magnetic Radiation. Academic Press, New York.
Killinger R. T. and Zerull R~ H. (1988)Effects of shape and orientation to be considered for optical particle sizing. In Optical Particle Sizing: 11teory and Practice. Int. Syrup., pp. 419-429. Plenum, New York.
Latimer P., Pyle B., Moore C. and Brunsting A. (1978). Effects of asphericity on single particle scattering. Appl. Opt. 17, 3152-3159.
Rarity J. C. (1988) Measurement of particle asymmetry using cross-correlation techniques. Optical Particle Sizing: Theory and Practice. Int. Syrup., pp. 217-238. Plenum, New York.