Embed Size (px)
Citation preview

Atmos. Chem. Phys., 11, 10487–10501, 2011www.atmos-chem-phys.net/11/10487/2011/doi:10.5194/acp-11-10487-2011© Author(s) 2011. CC Attribution 3.0 License.
AtmosphericChemistry
and Physics
An important fingerprint of wildfires on the European aerosol load
F. Barnaba1, F. Angelini1, G. Curci2, and G. P. Gobbi1
1Istituto di Scienze dell’Atmosfera e del Clima, Consiglio Nazionale delle Ricerche (ISAC-CNR), Roma, Italy2CETEMPS-Dipartimento di Fisica, Universita degli Studi dell’Aquila, L’Aquila, Italy
Received: 7 December 2010 – Published in Atmos. Chem. Phys. Discuss.: 21 January 2011Revised: 16 September 2011 – Accepted: 8 October 2011 – Published: 24 October 2011
Abstract. Wildland fires represent the major source of fineaerosols, i.e., atmospheric particles with diameters<1 µm.The largest numbers of these fires occur in Africa, Asia andSouth America, but a not negligible fraction also occurs inEastern Europe and former USSR countries, particularly inthe Russian Federation, Ukraine and Kazakhstan. Besidesthe impact of large forest fires, recent studies also highlightedthe crucial role played by routine agricultural fires in East-ern Europe and Russia on the Arctic atmosphere. An eval-uation of the impact of these fires over Europe is currentlynot available. The assessment of the relative contributionof fires to the European aerosol burden is hampered by thecomplex mixing of natural and anthropogenic particle typesacross the continent. In this study we use long term (2002–2007) satellite-based fires and aerosol data coupled to atmo-spheric trajectory modelling in the attempt to estimate thewildfires contribution to the European aerosol optical thick-ness (AOT). Based on this dataset, we provide evidence thatfires-related aerosols play a major role in shaping the AOTyearly cycle at the continental scale. In general, the regionsmost impacted by wildfires emissions and/or transport areEastern and Central Europe as well as Scandinavia. Con-versely, a minor impact is found in Western Europe and in theWestern Mediterranean. We estimate that in spring 5 to 35 %of the European fine fraction AOT (FFAOT) is attributableto wildland fires. The estimated impact maximizes in April(20–35 %) in Eastern and Central Europe as well as in Scan-dinavia and in the Central Mediterranean. An important con-tribution of wildfires to the FFAOT is also found in sum-mer over most of the continent, particularly in August overEastern Europe (28 %) and the Mediterranean regions, fromTurkey (34 %) to the Western Mediterranean (25 %). Al-though preliminary, our results suggest that this fires-related,
Correspondence to:F. Barnaba([email protected])
continent-wide haze plays a not negligible role on the Eu-ropean radiation budget, and possibly, on the European airquality, therefore representing a clear target for mitigation.
1 Introduction
The uncontrolled use of fire for clearing forest and wood-land for agriculture is estimated to account for up to 90 %of world’s wildland fires (FAO, 2009). The majority of thewildland fires in the European area occurs in the cropland-dominated regions of Eastern Europe and European Rus-sia, with a major role played by former USSR countries asUkraine, Kazakhstan and the Russian Federation. In these re-gions, a remarkable 50–70 % of all fires detected from satel-lite in 2001–2003 were cropland burning (Koronzti et al.,2006). In the Russian Federation, about 90 % of fires in theperiod 2002–2005 were ignited by people (Mollicone et al.,2006).
In terms of emissions, biomass burning during wildlandfires is an important source of trace gases and one of thelargest global contributors to accumulation mode aerosols,i.e., atmospheric particles with diameters<1 µm (e.g., Ka-sischke and Penner, 2004; Reid et al., 2005a). These emis-sions can be transported over long distances, leading to re-gionally elevated aerosol loadings (e.g., Damoah et al., 2004;McMeeking et al., 2006; Hodzic et al., 2007).
The major role agricultural fires in Eastern Europe andRussia play in the composition of the Arctic atmosphere hasbeen recently highlighted (e.g., Generoso et al 2007; Stohl2007; Warneke et al., 2010). Several studies also investi-gated properties and impacts of biomass burning events onaerosol properties at different European sites/regions (e.g.,Formenti et al., 2002; Balis et al., 2003; Pace et al., 2005;Muller et al., 2005; Niemi et al., 2005; Arola et al., 2007;Witham and Manning, 2007; Hodzic et al., 2007; Sciare etal., 2008; Amiridis et al., 2009; Saarnio et al., 2010; Alves
Published by Copernicus Publications on behalf of the European Geosciences Union.

10488 F. Barnaba et al.: An important fingerprint of wildfires on the European aerosol load
et al., 2011). However, being fragmented both in space andtime, this broad literature does not allow to draw a more gen-eral picture of the impact of fires on the aerosol loads at thecontinental scale. Still, meteorological fields over the con-tinent are often favourable to easterly transport, typically inspring (e.g., Chubarova, 2009), when agricultural fire activ-ity is maximum. Current capability of global or regionalchemistry-transport models to include accurately quantifiedfires emissions and reproduce some relevant aerosol proper-ties is also affected by large uncertainties (e.g., Kasischkeand Penner, 2004; Wiedinmyer et al., 2006; Langmann et al.,2009; Menut and Bessagner, 2010). Thus a reliable model-based assessment of the impact of fires on the Europeanaerosol load is also lacking.
In this study we aim at investigating the impact of wild-fires on the European “aerosol optical thickness” (AOT), thisbeing the aerosol optical parameter at the basis of aerosolradiative forcing computations, i.e., at the basis of aerosolclimatic impact evaluations (e.g., Tegen et al., 2000; Marmeret al., 2007). The term wildland fires is employed here todenote open fires of various vegetation (e.g., forests, grass-lands, agricultural residues) and peat that are set by humansor occur naturally (e.g., by lightening), the latter representingan almost negligible portion of the total.
Over Europe and the Mediterranean, the AOT is typi-cally built up by a complex mixture of different componentsof both natural and anthropogenic origin. Marine particlesfrom the surroundings seas and desert dust advected fromthe nearby Sahara desert mix, in variable proportions, withlocal and/or long-range transported pollution produced byhuman activities (e.g., Barnaba and Gobbi, 2004). In thisregion, the AOT yearly cycle typically shows a winter min-imum and a spring/summer maximum (e.g., Yu et al., 2003;Edwards et al., 2004; Papadimas et al., 2008, Chubarova,2009), with some inter-annual and spatial variability. Thisannual AOT behaviour is mainly driven by in-phase annualcycles of major aerosol-source factors (e.g., radiation, whichfavours secondary aerosol formation, and convection, whichfacilitates particles and gases injection and mixing into theatmosphere), and opposite cycles of major aerosol removalagents as wind speed and precipitation (e.g., Koelemeijer etal., 2006; Mehta and Yang, 2008; Papadimas et al., 2008;Chubarova, 2009). Deviations from a “regular”, sinusoidal-like AOT cycle have been however observed in Europe.Some of these deviations are attributable to the transport ofSaharan dust, an important season dependent phenomenonwhich typically maximizes in spring/summer and minimizesin winter (e.g., Moulin et al., 1998; Barnaba and Gobbi,2004; Papayannis et al., 2008). However, other, system-atic seasonal increases of AOT in spring and summer havebeen observed which cannot be attributed, or uniquely at-tributed, to Saharan dust transport, since mainly associated tofine particulate matter (e.g., Aculinin et al., 2004; Chubarova2009; Sicard et al., 2011). Vegetation fires in Eastern Eu-rope or in the Mediterranean countries have been shown to
enhance the local aerosol load, particularly in the hottest pe-riods/countries, when relatively small-scale, human-initiatedfires often develop into uncontrolled widespread fires (e.g,Hodzic et al., 2007; Sciare et al., 2008; Amiridis et al., 2009).
Here we use long term (2002–2007) satellite aerosol andfires observations coupled to atmospheric transport mod-elling (Sect. 2) and set up a methodology to derive monthly-resolved quantitative estimates of the wildfires contributionto the fine fraction AOT in Europe (Sect. 3). Our results pro-vide evidences that, over the whole continent, wildfires playa major role in modulating the AOT yearly cycle, in particu-lar its fine mode fraction.
2 Methods
This study focuses on the 6-year period 2002–2007 and em-ploys (1) AOT data from the MISR sensor on board theNASA-Terra platform (e.g., Martonchik et al., 2009; Kahn etal., 2010), (2) fires data (both Fire Counts, FC, and Fire Ra-diative Power, FRP, data) from the MODIS sensor on boardthe same NASA-Terra platform (e.g., Giglio et al., 2003,2006), (3) forward trajectories computed by means of theNOAA-HYSPLIT Lagrangian integrated trajectory model(Draxler and Hess, 1998).
To investigate the aerosol variability during the year,monthly statistics of significant parameters were consideredand further averaged over seven selected European targetregions covering most of the continent. These regions are(Fig. 1): Scandinavia (5◦ to 28◦ E; 56◦ to 64◦ N, cyan shadedarea), Western Europe (−11◦ to −7◦ E; 46◦ to 56◦ N, ma-genta shaded area), Central Europe (7◦ to 25◦ E; 46◦ to56◦N, green shaded area), Eastern Europe (25◦ to 42◦ E;46◦ to 56◦ N, reddish shaded area), Western Mediterranean(−11◦ to −7◦ E; 36◦ to 46◦ N, orange shaded area), Cen-tral Mediterranean (7◦ to 25◦ E, 36◦ to 46◦ N, bluish shadedarea) and Turkey (25◦ to 42◦ E; 36◦ to 46◦ N, gray shadedarea). Details on the datasets and data processing are de-scribed hereafter.
2.1 MISR AOT data
The MISR instrument (Diner et al., 1998) infers AOT byusing observations of nine cameras pointing at different an-gles and separates aerosol from land scattering based on theangular distribution of the up-welling radiance phase func-tion. Details on the MISR aerosol retrieval can be found inMartonchik et al. (2009). The quality of the MISR aerosolproducts has been carefully evaluated by Kahn et al. (2010)through the comparison with relevant aerosol data from theworldwide AERONET sunphotometer network (Holben etal., 1998). That study shows good quality of the MISR AOTretrievals, with about three-fourth of MISR measurementswithin ±20 % of corresponding AERONET measurements,and about half within±10 %. Focusing specifically on the
Atmos. Chem. Phys., 11, 10487–10501, 2011 www.atmos-chem-phys.net/11/10487/2011/

F. Barnaba et al.: An important fingerprint of wildfires on the European aerosol load 10489
26
Figures 1
2
Figure 1: Monthly mean Fire Counts (FC) from MODIS Terra data in the period 2002-2007 3
(circles). The size and colour of the circles refer, respectively, to the fire count value 4
(FC/1000km2/day) and month of the year (see relevant legends). The map also shows: i) the seven 5
target regions addressed in this study and namely Scandinavia (cyan), Western Europe (magenta), 6
Central Europe (green), Eastern Europe (red), Western Mediterranean (orange), Central 7
Mediterranean (blue) and Turkey (gray); ii) the whole region considered for the FWTD 8
computations (20°W-70°E; 20°N-70°N, delimited by the thick dotted line) and its division into four 9
quadrants Q1-to-Q4 (thin dashed line-delimited areas); iii) the seven Atlantic control regions 10
considered in the study (violet areas, labelled A to I). 11
Fig. 1. Monthly mean Fire Counts (FC) from MODIS Terra data in the period 2002–2007 (circles). The size and colour of the circles refer,respectively, to the fire count value (FC/1000 km2 day−1) and month of the year (see relevant legends). The map also shows: (i) the seventarget regions addressed in this study and namely Scandinavia (cyan), Western Europe (magenta), Central Europe (green), Eastern Europe(red), Western Mediterranean (orange), Central Mediterranean (blue) and Turkey (gray); (ii) the whole region considered for the FWTDcomputations (20◦ W–70◦ E; 20◦ N–70◦ N, delimited by the thick dotted line) and its division into four quadrants Q1-to-Q4 (thin dashedline-delimited areas); (iii) the seven Atlantic control regions considered in the study (violet areas, labelled A to I).
“biomass burning” category, the MISR mean AOT is wellwithin the limits given above. Scenes with a large fraction ofdust or smoke, generally display a poorer agreement.
In this study we employ monthly mean Level 3, 0.5◦×0.5◦
resolution MISR aerosol data (MIL3MAE dataset). We usethe latest released (version 31) AOT dataset (at 555 nm)and the relevant AOT due to the aerosol finest fraction (i.e.,AOT due to particles having effective radius smaller than0.35 µm, hereafter referred to as FFAOT). The AOT datasetis a MISR Validated Stage 3 product (i.e., uncertaintiesare estimated from independent measurements representingglobal conditions) whereas the MISR particle size fractionalAOT amounts are Validated Stage 2 products (i.e., uncertain-ties are estimated from more widely distributed independentmeasurements).
2.2 MODIS fires data
We use monthly mean fires counts (FC, counts/m2 day−1)and fire radiative power (FRP, MW or Mjs−1) data fromMODIS-Terra. The fire detection by satellite is performedexploiting their strong emissions of mid-infrared radiation.MODIS fires retrieval uses a contextual algorithm based onthe brightness temperature derived from the 4 µm and 11 µmchannels (Giglio et al., 2003). Detailed information about theMODIS fire products can be found in Justice et al. (2006).
The FC dataset used in this study is the MODIS-Terraoverpass corrected fire pixel count product available through
the NASA Earth Observation (NEO) portal (http://neo.sci.gsfc.nasa.gov). It is a gridded statistical summary of firepixel information intended for use in regional and globalmodelling with a spatial resolution of 0.5◦ for time periodsof one calendar month (Justice et al., 2006). To provide aview of the typical spatial-temporal variability of fire countsin Europe, the monthly mean number of fires computed overthe whole period addressed here (2002–2007) is shown ascoloured circles in Fig. 1.
Fires release heat energy which propagates in space andfacilitates fire detection by remote sensing. Satellite obser-vations actually measure the rate at which energy is emit-ted by a fire during the combustion, i.e., the Fire Radia-tive Power, FRP (e.g., Kaufman et al., 1998; Giglio et al.,2003; Wooster et al., 2005). This can serve as an indica-tor of the rate at which aerosols (and gases) are released(e.g., Kaufmann et al., 1998). FRP estimated accuracy fromMODIS is of about 15 % (Wooster et al., 2005). In this studywe use MODIS-Terra monthly FRP data at 1◦ resolution(MODIS Active Fire Product MOD14CM1, version V005)available through the Giovanni web-based application (http://disc.sci.gsfc.nasa.gov/giovanni), developed by the NASAGoddard Earth Sciences Data and Information Services Cen-ter (GES DISC) (Acker and Leptoukh, 2007).
www.atmos-chem-phys.net/11/10487/2011/ Atmos. Chem. Phys., 11, 10487–10501, 2011

10490 F. Barnaba et al.: An important fingerprint of wildfires on the European aerosol load
27
q
n1Tn1
n2
Tn2
FRPn2
FRPn1
Target Region
q
n1Tn1
n2
Tn2
FRPn2
FRPn1
Target Region
1
2
Figure 2: Schematic of the procedure used to build the FWTD quantity (2.5°-resolution) used in 3
this study (see Section 2.3.1 for details). The subscript n identifies the starting cell (associated to a 4
fire count value, FC > 25 fire counts/1000km2/day and to a fire radiative power value FRPn); q is 5
the target cell. A single, 10-day forward trajectory Tn starts from the centre of cell n in each day of 6
the month at 10:30 LT. Trajectories are resolved hourly (here represented as trajectory segments). 7
Each target cell q receives contributions from each starting cell n, leading to build up the monthly 8
resolved FWTD field (e.g. Figure 3). FWTD averages over a given Target Region (here represented 9
by the green area) are also obtained from this fields (e.g. Figure 4). 10
11
Fig. 2. Schematic of the procedure used to build the FWTD quan-tity (2.5◦-resolution) used in this study (see Sect. 2.3.1 for details).The subscriptn identifies the starting cell (associated to a fire countvalue, FC> 25 fire counts/1000 km2 day−1 and to a fire radiativepower value FRPn); q is the target cell. A single, 10-day forwardtrajectoryTn starts from the centre of celln in each day of the monthat 10:30 LT. Trajectories are sampled hourly (here represented astrajectory segments). Each target cellq receives contributions fromeach starting celln, leading to build up the monthly resolved FWTDfield (e.g. Fig. 3). FWTD averages over a given Target Region (hererepresented by the green area) are also obtained from this fields (e.g.Fig. 4).
2.3 Forward trajectory computations
We use the NOAA-HYSPLIT Lagrangian integrated trajec-tory model (http://ready.arl.noaa.gov) to compute 10-day for-ward trajectories originating from fires detected in the wholedomain addressed (from 20◦ W to 70◦ E and from 20◦ to70◦ N, dashed line-delimited area in Fig. 1). Trajectoriesare driven by the 1◦-resolution NCEP analyses. We di-vide the domain in a regular 2.5◦-resolution grid and starttrajectories from those grid-cell centres where and whenfires are detected. This resolution is chosen as a compro-mise between good spatial resolution of sources and ac-ceptable computing time. A minimum fire count thresholdof 25 fire counts/1000 km2 day−1 was set to start a trajec-tory computation (which corresponds to an average of 1 firecount/1000 km2 day−1 in the 25, 0.5◦ by 0.5◦ cells that com-pose the 2.5◦ by 2.5◦ grid box). One trajectory per daywas computed for the whole 2002–2007 period, starting at10:30 LT (i.e., close to the Terra overpass time).
The starting altitude of trajectories was set at 500 m a.g.l.Some sensitivity tests were performed by (1) changing thetrajectories starting altitude within the first 1000 m and (2)eliminating those trajectories for which the starting altitude
(500 m) was above the model estimated “atmospheric mixinglayer” in the starting cell. Both tests showed minor (<10 %)changes in the results. Furthermore, the “mixing layer” con-trol reduced the trajectories dataset by about 10 % in summerand up to 40 % in winter. Therefore these options were notused in getting the results presented here.
Overall, a total of about 360 000 forward trajectories is in-cluded in this study.
2.3.1 Coupling fires data and forwardtrajectory computations
With the aim of evaluating the contribution of fires to theAOT, a specific quantity has been defined and used as a proxyfor the coupling of fire emissions with atmospheric disper-sion capabilities. This quantity, in the following referred to asFire Weighted Trajectory Density (FWTD), has been derivedfollowing the methodology detailed below and illustrated inFig. 2. To match the horizontal resolution of the forward tra-jectory computations, we first re-mapped the monthly fieldsof both the Fire Radiative Power and Fire Counts on a 2.5◦
by 2.5◦ grid. Each celln of the European domain considered(area delimited by the dashed line in Fig. 1) is thus associatedto a monthly mean FRP (and FC) value, FRPn (and FCn). Foreach day of the month (starting month, sm), a 10-day forwardtrajectoryTn originating at the centre of celln is computedand sampled at an hourly rate (provided that FCn> 25 firecount/1000 km2/day). For a given cellq along theTn path,we compute the contribution ofTn to q as:
FWTD(am,day,n,q) = FRPn(sm)∑th
exp(−th/τ) (1)
where am is the arrival month (which, depending on the start-ing day, may or not coincide with the starting month, sm),this the time of travel (in hours) from the starting celln to cellq. The sum overth accounts for the fact that a singleTn canspend more time steps over cellq. The exponential decay isused to take into account the typical lifetime of aerosol in thetroposphere (e.g., Rangarajan, 1992; Ahmed et al., 2004; Pa-pastefanou, 2006). In particular, a time constantτ = 5 days(i.e., 120 h) has been set which also allows to avoid sharptransitions at the end of the 10-day forward trajectories (after10 days of travel the FRPn corrected for the exponential de-cay is about 10 % of the original value). Note that this expo-nential decay also reduces the impact on the FWTD quantityof the total error expected on each single trajectory, which isestimated to be 15–30 % of the travel distance.
Integrating the contribution to cellq of each celln (andthus trajectoryTn) of the domain, we get:
FWTD(am,day,q) =
N∑n=1
FRPn(sm)∑th
exp(−th/τ) (2)
Atmos. Chem. Phys., 11, 10487–10501, 2011 www.atmos-chem-phys.net/11/10487/2011/
F. Barnaba et al.: An important fingerprint of wildfires on the European aerosol load 10491
28
1
Figure 3: FWTD fields obtained for the months of April (a) and July (b) as average over the 2002-2
2007 period. 3
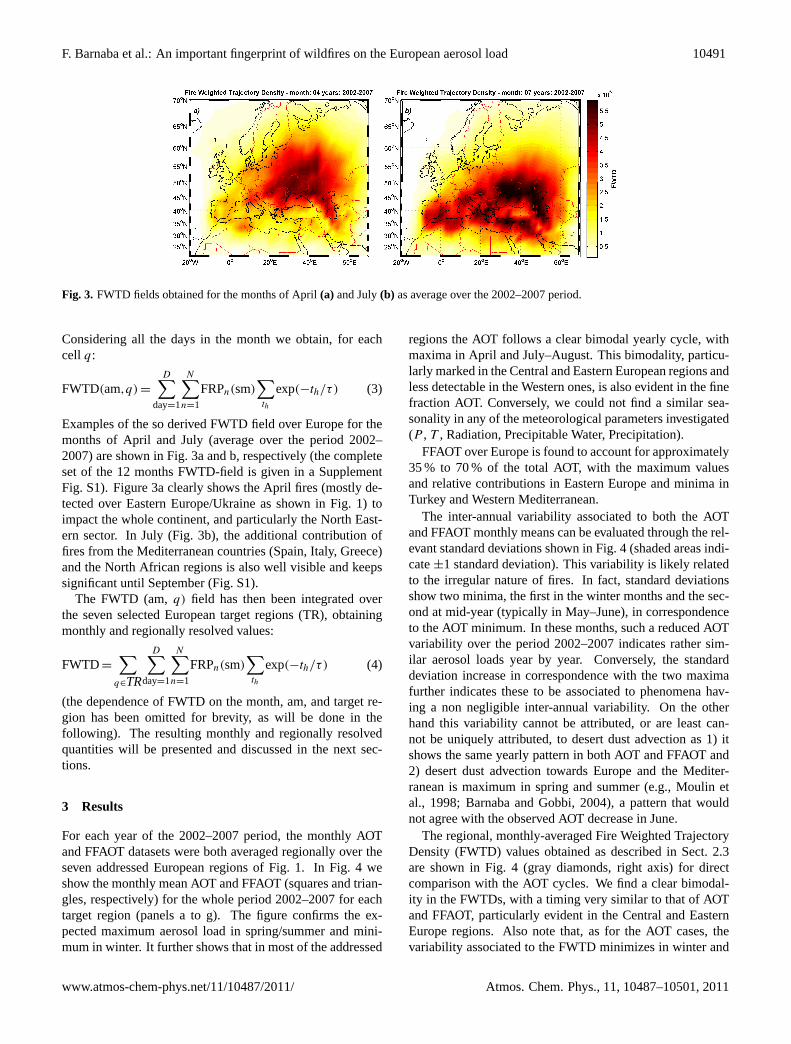
Fig. 3. FWTD fields obtained for the months of April(a) and July(b) as average over the 2002–2007 period.
Considering all the days in the month we obtain, for eachcell q:
FWTD(am,q) =
D∑day=1
N∑n=1
FRPn(sm)∑th
exp(−th/τ) (3)
Examples of the so derived FWTD field over Europe for themonths of April and July (average over the period 2002–2007) are shown in Fig. 3a and b, respectively (the completeset of the 12 months FWTD-field is given in a SupplementFig. S1). Figure 3a clearly shows the April fires (mostly de-tected over Eastern Europe/Ukraine as shown in Fig. 1) toimpact the whole continent, and particularly the North East-ern sector. In July (Fig. 3b), the additional contribution offires from the Mediterranean countries (Spain, Italy, Greece)and the North African regions is also well visible and keepssignificant until September (Fig. S1).
The FWTD (am,q) field has then been integrated overthe seven selected European target regions (TR), obtainingmonthly and regionally resolved values:
FWTD=
∑q∈TR
D∑day=1
N∑n=1
FRPn(sm)∑th
exp(−th/τ) (4)
(the dependence of FWTD on the month, am, and target re-gion has been omitted for brevity, as will be done in thefollowing). The resulting monthly and regionally resolvedquantities will be presented and discussed in the next sec-tions.
3 Results
For each year of the 2002–2007 period, the monthly AOTand FFAOT datasets were both averaged regionally over theseven addressed European regions of Fig. 1. In Fig. 4 weshow the monthly mean AOT and FFAOT (squares and trian-gles, respectively) for the whole period 2002–2007 for eachtarget region (panels a to g). The figure confirms the ex-pected maximum aerosol load in spring/summer and mini-mum in winter. It further shows that in most of the addressed
regions the AOT follows a clear bimodal yearly cycle, withmaxima in April and July–August. This bimodality, particu-larly marked in the Central and Eastern European regions andless detectable in the Western ones, is also evident in the finefraction AOT. Conversely, we could not find a similar sea-sonality in any of the meteorological parameters investigated(P , T , Radiation, Precipitable Water, Precipitation).
FFAOT over Europe is found to account for approximately35 % to 70 % of the total AOT, with the maximum valuesand relative contributions in Eastern Europe and minima inTurkey and Western Mediterranean.
The inter-annual variability associated to both the AOTand FFAOT monthly means can be evaluated through the rel-evant standard deviations shown in Fig. 4 (shaded areas indi-cate±1 standard deviation). This variability is likely relatedto the irregular nature of fires. In fact, standard deviationsshow two minima, the first in the winter months and the sec-ond at mid-year (typically in May–June), in correspondenceto the AOT minimum. In these months, such a reduced AOTvariability over the period 2002–2007 indicates rather sim-ilar aerosol loads year by year. Conversely, the standarddeviation increase in correspondence with the two maximafurther indicates these to be associated to phenomena hav-ing a non negligible inter-annual variability. On the otherhand this variability cannot be attributed, or are least can-not be uniquely attributed, to desert dust advection as 1) itshows the same yearly pattern in both AOT and FFAOT and2) desert dust advection towards Europe and the Mediter-ranean is maximum in spring and summer (e.g., Moulin etal., 1998; Barnaba and Gobbi, 2004), a pattern that wouldnot agree with the observed AOT decrease in June.
The regional, monthly-averaged Fire Weighted TrajectoryDensity (FWTD) values obtained as described in Sect. 2.3are shown in Fig. 4 (gray diamonds, right axis) for directcomparison with the AOT cycles. We find a clear bimodal-ity in the FWTDs, with a timing very similar to that of AOTand FFAOT, particularly evident in the Central and EasternEurope regions. Also note that, as for the AOT cases, thevariability associated to the FWTD minimizes in winter and
www.atmos-chem-phys.net/11/10487/2011/ Atmos. Chem. Phys., 11, 10487–10501, 2011

10492 F. Barnaba et al.: An important fingerprint of wildfires on the European aerosol load
29
1
Figure 4: Monthly mean AOT (squares) and FFAOT (triangles) derived from MISR data in the 2
period 2002-2007 in the seven target regions addressed in this study (panels a to g), and 3
corresponding FWTD values (diamonds, right axis) computed coupling MODIS fires data with 4
forward trajectories computations (see Section 2.3.1 for details). For each variable, shaded areas 5
indicate ± 1 standard deviation. 6
7
Fig. 4. Monthly mean AOT (squares) and FFAOT (triangles) derived from MISR data in the period 2002–2007 in the seven target regionsaddressed in this study (panelsa to g), and corresponding FWTD values (diamonds, right axis) computed coupling MODIS fires data withforward trajectories computations (see Sect. 2.3.1 for details). For each variable, shaded areas indicate±1 standard deviation.
30
1
Figure 5: Absolute (left axis) and percent (histograms, right axis) contribution of the four quadrants 2
Q1, Q2, Q3, Q4 (Figure 1) to the FWTD derived for the seven target regions addressed in this 3
study. 4
Fig. 5. Absolute (left axis) and percent (histograms, right axis) contribution of the four quadrants Q1, Q2, Q3, Q4 (Fig. 1) to the FWTDvalues derived for the seven target regions addressed in this study.
in the mid-year minimum (May–June) between the two max-ima. The FWTD seasonality is mainly driven by the char-acteristic bimodality of the agricultural fire activity in Eu-rope, with two maxima in spring and summer correspond-
ing respectively to the planting and harvesting periods (Ko-rontzi et al., 2006). In summer, an additional contributionfrom natural and/or human initiated fires invigorated by dry-ness and hot temperatures is also expected to contribute to
Atmos. Chem. Phys., 11, 10487–10501, 2011 www.atmos-chem-phys.net/11/10487/2011/
F. Barnaba et al.: An important fingerprint of wildfires on the European aerosol load 10493
the FWTD values observed, especially in the southernmostEuropean regions.
Overall, a good correlation (R ≥ 0.8, Table 1) betweenFFAOT and FWTD values is found in each region but West-ern Mediterranean, confirming the hypothesis that a stronglink exists between the fire source and the observed fineaerosol optical thickness.
To investigate the role of Mediterranean and Eastern Eu-rope fires in generating the patterns shown in Fig. 4, wefurther divided the whole origin region considered for theFWTD computations (dashed area in Fig. 1) into four quad-rants (Q1, Q2, Q3, Q4 in Fig. 1). The absolute and rela-tive contributions from these quadrants to the total FWTDvalues are shown in Fig. 5 (area graphs and histograms, re-spectively). Figure 5 shows fires in the southwest quadrantQ1 (which includes the southern European states of Portu-gal, Spain, Italy, Greece, Slovenia and the others former Yu-goslavia countries as well as Northern Africa) to have an im-portant impact on the total FWTD only in two of the seventarget European regions considered, namely Western Medand Central Med. In fact, in these two regions Q1 fires ac-count for more than 45–50 % of the FWTD during all winter,summer and autumn months. Only in the spring period thiscontribution decreases to about 40 % and 25 % in the Westernand Central Mediterranean, respectively, due to the increas-ing relative weight of Q3 fires. In the other target regions,the portion of FWTD due to fires originating in Q1 maxi-mizes in summer, but its relative contribution keeps lowerthan 20 %. Conversely, fires originating in the NE Euro-pean quadrant Q3 (which includes Ukraine, Moldova, Be-larus, Russia, Kazakhstan) are found to impact the wholecontinent during most of the year, and particularly in spring(see also Fig. 3a). In April, the minimum contribution of Q3fires to the total FWTD is about 45 % (in Western Europeand Western Med) while high contributions are obtained forCentral Med and Central Europe (about 60 %), Turkey andScandinavia (about 70 %) and Eastern Europe (85 %). A mi-nor role is played by Q2 and Q4 fires, whose effects are foundto be mostly local (see for example the Q2 fires impact on theTurkey FWTD values, Fig. 5g).
This analysis suggests a larger impact of springtime agri-cultural fires on the continental AOT with respect to the sum-mer ones, which are mostly associated to the burning of othertype of vegetation (e.g., forests). The more marked finger-print of agricultural fires in spring with respect to summerwas also reported by Sciare et al. (2008) based on long termin situ aerosol measurements performed in Creete (Greece).In particular, rather low OC/EC ratios were observed inspring compared to summer which are more compatible withagricultural waste burning (e.g., Andreae and Merlet, 2001;Hays et al., 2005). The reason for higher enhancement ra-tios of elemental carbon in the agricultural fire plumes withrespect to forest fire plumes reflects the fact that agriculturalfires burn at lower temperatures and tend to smoulder, emit-ting higher concentrations of products from incomplete car-
Table 1. Correlation coefficient (R) between FFAOT and FWTDvalues for the seven regions addressed in this study and CorrectionFactors (CF) derived following Eq. (7) and used to convert FWTDvalues into FFAOT values (Eq. 6).
Target Region R CF (×110)
Western Med (WMed) 0.80 2.6± 1.7Central Med (CMed) 0.88 2.7± 1.3Turkey (TUR) 0.90 3.2±1.7Western Europe (WEU) 0.47 3.1± 5.5Central Europe (CEU) 0.91 3.4±1.7Eastern Europe (EEU) 0.93 2.7± 1.4Scandinavia (SCA) 0.81 7.4± 5.9
bon combustion. From an optical point of view, enrichmentin elemental carbon translates into enhanced aerosol absorp-tion, thus enhanced aerosol extinction and AOT.
3.1 Estimating wildfires contribution to thefine fraction AOT
In this study we assume that the impact of wildfires onthe optical aerosol load is limited to the fine fraction AOT(FFAOT). In fact, being mainly the result of condensa-tion/coalescence processes, biomass burning particles arepredominantly found in this size range (e.g., Reid, 2005a;Janhall et al., 2010). This assumption also allows minimiz-ing in our analysis possible “disturbances” by mineral dust,pollen or marine aerosol particles contributions to the AOT,mainly expected to occur in the coarse aerosol fraction (e.g.,d’Almeida et al., 1991).
Two approaches have been used to estimate the mean con-tribution of wildfires to the European FFAOT. The first oneis based on the measurement-derived FFAOT data, while thesecond one also includes of the FWTD computations formu-lated here (see Sect. 2.3). In the first case (indicated by thesubscript 1) we assume the monthly mean FFAOT values ineach region to be the result of the contribution of a “regionalbackground” (FFAOTRB) plus that of wildfires (FFAOTWF),i.e., for each month,mi , it is:
FFAOT(mi) = FFAOTRB(mi)+FFAOTWF,1(mi) (5)
We then assume the regional background FFAOT to follow asinusoidal behaviour during the year, as supported by clima-tological evidences in mostly unperturbed regions (e.g., Yuet al., 2003).
For each region, the FFAOTRB is thus obtained fittingwith a sine function the measurement-based FFAOT valuesof all those months in which, based on the FWTD computa-tions, the expected wildfires contribution is negligible (Jan-uary, February, November, December) or minimum (May orJune, depending on the region). The FFAOTRB curves ob-tained are shown in Fig. 6 (thin black lines) together with the
www.atmos-chem-phys.net/11/10487/2011/ Atmos. Chem. Phys., 11, 10487–10501, 2011

10494 F. Barnaba et al.: An important fingerprint of wildfires on the European aerosol load
31
1
Figure 6: Each panel (a to g, referring to one of the seven target regions addressed in this study) 2
shows: i) the monthly mean FFAOT as measured by MISR (thick coloured line); ii) the monthly 3
mean wildfires contributions to the FFAOT as estimated from the MISR FFAOT data (FFAOTWF,1, 4
coloured triangles) and from the FWTD computations (FFAOTWF,2, coloured squares, the symbol 5
colour indicating the relative percentage with respect to the total FFAOT, see colour bar); iii) the 6
sinusoidal fit, FFAOTRB, used to derive FFAOTWF,1 (thin black line); and iv) the total FFAOT as 7
reconstructed from FFAOTWF,2 plus the sinusoidal fit, FFAOTRB (see Section 3.1 for details). 8
Fig. 6. Each panel (a to g, referring to one of the seven target regions addressed in this study) shows: (i) the monthly mean FFAOT asmeasured by MISR (thick coloured line); (ii) the monthly mean wildfires contributions to the FFAOT as estimated from the MISR FFAOTdata (FFAOTWF,1, coloured triangles) and from the FWTD computations (FFAOTWF,2, coloured squares, the symbol colour indicating therelative percentage with respect to the total FFAOT, see colour bar); (iii) the sinusoidal fit, FFAOTRB, used to derive FFAOTWF,1 (thin blackline); and (iv) the total FFAOT as reconstructed from FFAOTWF,2 plus the sinusoidal fit, FFAOTRB (see Sect. 3.1 for details).
original MISR FFAOT dataset from which these were com-puted (continuous colour lines). As over Europe the ‘regionalbackground’ also includes an important anthropogenic con-tribution, the FFAOTRB absolute values vary depending onthe region, with lowest values observed in the Western sec-tors as well as in Scandinavia.
The derived FFAOTWF,1 values (Eq. 5) are shown ascoloured triangles in Fig. 6, the colour indicating the relative(%) contribution of FFAOTWF,1 to the total FFAOT.
In the second case (indicated by subscript 2), we assumethe FWTD obtained in each region to be proportional to thewildfires-related FFAOT, through a region-dependent con-version factor, CF, i.e.:
FFAOTWF,2(mi) = CF×FWTD(mi) (6)
The conversion factor is computed only considering thosemonths,mj , characterized by a not negligible wildfires con-tribution, i.e., those months not used to compute the sinu-soidal fit describing FFAOTRB. In particular, for each region,it is:
CF= mean[(FFAOT(mj )−FFAOTRB(mj ))/FWTD(mj )](7)
The CF values obtained in the seven European target regionsaddressed are summarized in Table 1.
The derived FFAOTWF,2 values (Eq. 6) are shown ascoloured squares in Fig. 6, the colour indicating the relative(%) contribution of FFAOTWF,2 to the total FFAOT.
Finally, for direct comparison with the MISR measuredone, the FWTD-based FFAOT is also reconstructed as:
FFAOTFWTD(mi) = FFAOTWF,2(mi)+FFAOTRB(mi) (8)
This is reported as dash-dotted lines in Fig. 6. Figure 6 showsthe two estimates to follow very similar yearly patterns andto have rather close absolute values, except for a few cases(e.g. March values in Western Europe). We then use theiraverage value, FFAOTWF mean (Table 2), as a final indica-tion of the estimated regional, monthly-average contributionof wildfires to the total FFAOT measured by MISR over Eu-rope. This analysis indicates that, in spring and summer, 10to 30 % of the fine aerosol optical thickness in Europe is re-lated to wildfires emissions (Table 2). In April the maximumimpact of wildfires on the fine fraction AOT (relative weightof 20–35 %) is found in Central and Eastern Europe, in Scan-dinavia and in the Central Mediterranean, while in Augustthe wildfires contribution to the FFAOT overcomes 25 % inall the addressed regions but Western Europe. In general, theregions less affected by wildfires emissions and/or transportappear to be the western ones (Western Europe and Western
Atmos. Chem. Phys., 11, 10487–10501, 2011 www.atmos-chem-phys.net/11/10487/2011/
F. Barnaba et al.: An important fingerprint of wildfires on the European aerosol load 10495
Table 2. Monthly, regional values (±1 st. dev.) of the estimated wildfires contribution to the FFAOT, FFAOTWF mean, and (in parenthesis)relative percentage to the total FFAOT.
Region Month
J F M A M J J A S O N D
SCA −0.0006±0.0019 0.0016±0.0003 0.014±0.003 0.033±0.004 0.02±0.01 0.005±0.007 0.012±0.008 0.024±0.002 0.0163±0.0002 0.003±0.008 0.001±0.001 0.0005±0.0004(−2± 7) (4± 1) (22± 4) (35± 4) (21± 12) (7± 11) (17± 12) (29± 2) (25.8± 0.2) (10± 23) (5± 5) (2± 1)
WEU−0.001±0.003 0.002±0.002 0.002±0.002 0.014±0.006 0.001±0.003 0.001±0.002 0.002±0.007 0.001±0.009 0.006±0.001 0.0043±0.0003 0.0013±0.0005 −0.0003±0.0010
(−3± 7) (4± 3) (18± 16) (14± 6) (1± 3) (1± 2) (3± 7) (1± 10) (8± 1) (7± 1) (3± 1) (−1± 2)
CEU−0.003±0.001 0.0018±0.0006 0.021±0.009 0.035±0.006 0.009±0.001 0.004±0.006 0.022±0.006 0.032±0.004 0.0194±0.0005 0.006±0.006 0.0022±0.0004 −0.001±0.002
(1± 2) (3± 1) (21± 9) (27± 5) (8± 1) (3± 5) (18± 5) (25± 3) (21± 1) (11± 10) (5± 1) (−2± 7)
EEU0.001±0.002 0.002±0.002 0.013±0.006 0.04±0.01 0.016±0.003 0.004±0.006 0.032±0.006 0.035±0.005 0.024±0.002 0.007±0.007 0.002±0.001 0.000±0.001
(0± 3) (4± 3) (16± 7) (30± 10) (14± 2) (4± 6) (24± 4) (28± 4) (25± 3) (12± 11) (4± 3) (0± 3)
WMD−0.0002±0.0037 0.0034±0.0007 0.007±0.002 0.008±0.008 0.003±0.006 0.013±0.007 0.018±0.004 0.025±0.003 0.0164±0.0005 0.0111±0.0004 0.002±0.001 0.0002±0.0015
(0± 8) (6± 1) (10± 3) (10± 10) (4± 7) (13± 7) (19± 4) (25± 3) (21± 1) (18± 1) (5± 3) (1± 4)
CMD0.001±0.003 0.003±0.001 0.018±0.003 0.027±0.006 0.006±0.009 0.015±0.006 0.031±0.005 0.035±0.003 0.021±0.004 0.009±0.008 0.003±0.001 −0.0004±0.0028
(2± 5) (4± 2) (19± 3) (22± 5) (5± 8) (12± 4) (23± 4) (26± 2) (19± 4) (11± 10) (4± 2) (−1± 5)
TUR−0.001±0.004 0.0046±0.0002 0.014±0.008 0.021±0.006 0.01±0.01 0.017±0.008 0.036±0.002 0.044±0.005 0.029±0.001 0.016±0.004 0.004±0.001 −0.0004±0.0030
(0± 7) (5.5± 0.2) (14± 9) (18± 5) (6± 10) (14± 7) (27± 1) (34± 4) (29± 1) (21± 5) (6± 2) (0± 5)
Med) while, as expected, the most impacted are Eastern andCentral Europe as well as Scandinavia.
Major uncertainties in Table 2 estimates (i.e., maximumstandard deviations related to maximum difference betweenthe corresponding FFAOTWF,1 and FFAOTWF,2 values) arefound for the months of May and/or June. This is likelybecause in May or June, depending on the region, theFFAOTWF,1 contributions have been necessarily forced to bezero by the sinusoidal fit used, whereas a minimum but notnull contribution (as the one derived from the FWTD, i.e.,FFAOTWF,2), is probably much more realistic.
It is also worth commenting on the good agreement amongthe CF values obtained for the different regions (Table 1), aresult giving robustness to the FWTD-to-FFAOT conversionapproach adopted. The only exception is found for the Scan-dinavia value (more than twice the others CFs), also associ-ated to a rather large variability. The higher CF derived forScandinavia to match the observed FFAOT values suggeststhat the FWTD computations in this region are probably un-derestimated. We speculate this is likely due to an additionalcontribution of fires from regions east of 70◦ E, which are notaccounted for in our study (see Sect. 2.3). In fact, similarlyto what occurs in the Arctic (Stohl, 2007), Siberian/Asianfires might still have a significant impact at the Europeannorthernmost latitudes, particularly in spring, when temper-atures are still low and quasi-isentropic transport of cold airfrom such regions is a potential pathway into the lower tro-posphere. These fires are conversely expected to have minorimpacts over most of continental and Mediterranean Europe.
3.2 On the possible contribution fromintercontinental transport
One question that may arise is whether, and to which extent,the FFAOT pattern observed over Europe is also influencedby intercontinental transport of pollution from other areas. Inparticular, given the general westerly circulation of the mid-latitude Northern hemisphere, transport from North America
might provide a not negligible contribution to the EuropeanAOT (and mainly FFAOT) levels (e.g., Penkett et al., 2003;Huntrieser et al., 2005; Li et al., 2005), which, in principle,could bias our results. To check this possibility we furtherselected nine “control regions” over the Atlantic Ocean, offthe European coasts (labelled A to I in Fig. 1), and appliedour analysis also to these. Boundaries of the control regionswere chosen in order to investigate both latitudinal and lon-gitudinal AOT gradients from Europe as a function of theprevailing atmospheric circulation.
Yearly cycles of the MISR FFAOT in the nine control re-gions are reported in Fig. 7 (thick gray lines). As expected,FWTD values computed for these regions are negligible (atleast two order of magnitude lower than those derived in theseven European target regions and shown in Fig. 4) and aretherefore omitted in the plot.
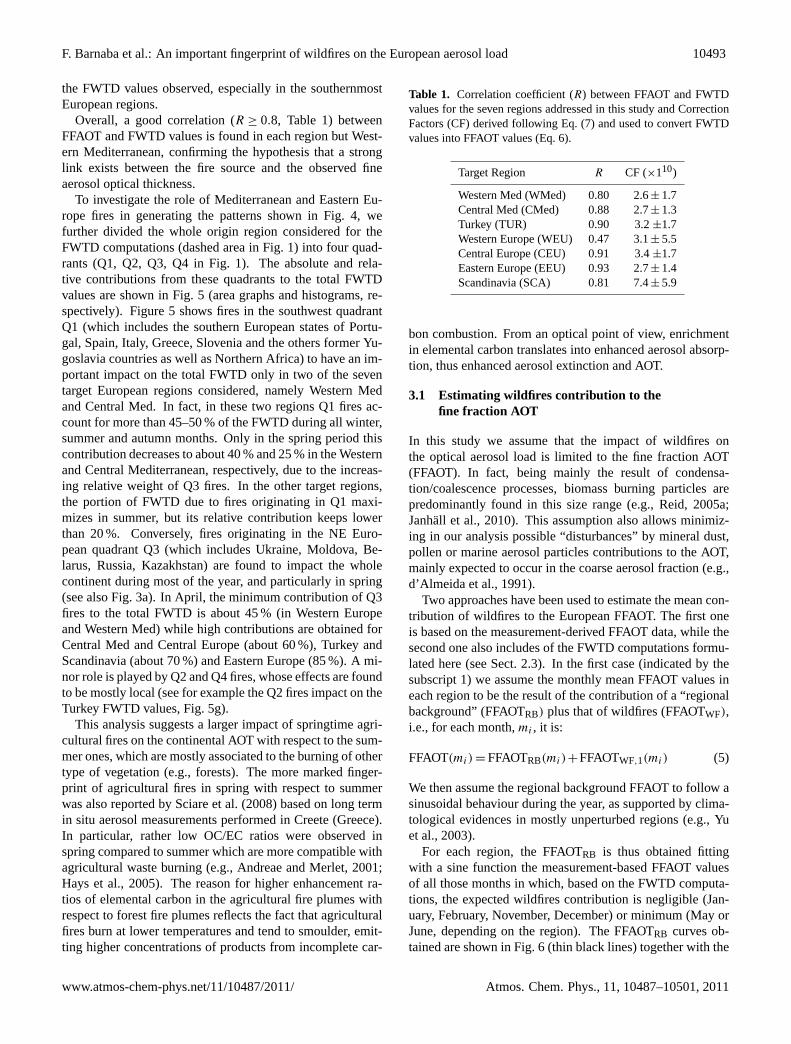
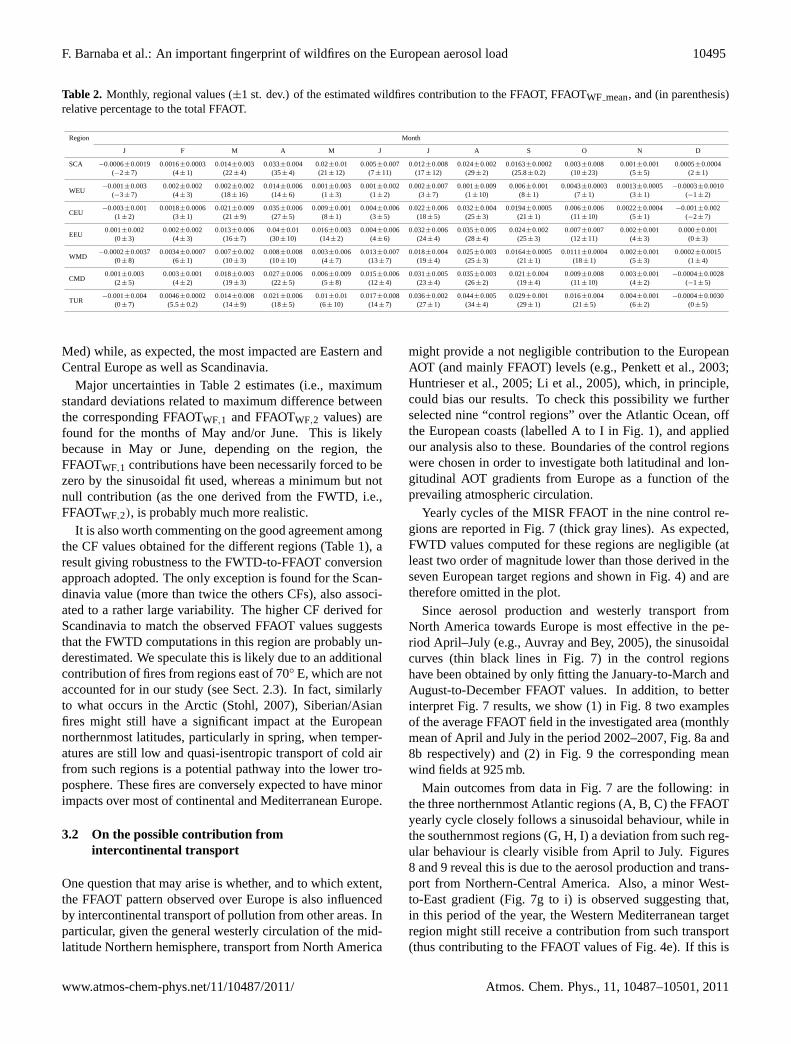
Since aerosol production and westerly transport fromNorth America towards Europe is most effective in the pe-riod April–July (e.g., Auvray and Bey, 2005), the sinusoidalcurves (thin black lines in Fig. 7) in the control regionshave been obtained by only fitting the January-to-March andAugust-to-December FFAOT values. In addition, to betterinterpret Fig. 7 results, we show (1) in Fig. 8 two examplesof the average FFAOT field in the investigated area (monthlymean of April and July in the period 2002–2007, Fig. 8a and8b respectively) and (2) in Fig. 9 the corresponding meanwind fields at 925 mb.
Main outcomes from data in Fig. 7 are the following: inthe three northernmost Atlantic regions (A, B, C) the FFAOTyearly cycle closely follows a sinusoidal behaviour, while inthe southernmost regions (G, H, I) a deviation from such reg-ular behaviour is clearly visible from April to July. Figures8 and 9 reveal this is due to the aerosol production and trans-port from Northern-Central America. Also, a minor West-to-East gradient (Fig. 7g to i) is observed suggesting that,in this period of the year, the Western Mediterranean targetregion might still receive a contribution from such transport(thus contributing to the FFAOT values of Fig. 4e). If this is
www.atmos-chem-phys.net/11/10487/2011/ Atmos. Chem. Phys., 11, 10487–10501, 2011

10496 F. Barnaba et al.: An important fingerprint of wildfires on the European aerosol load
32
1
Figure 7: Each panel (a to i, referring to one of the nine ‘control regions’ A to I of Figure 1) shows 2
the monthly mean FFAOT as measured by MISR (thick gray line) and the relevant sinusoidal fit, 3
FFAOTRB (thin black line). Coloured triangles represent the difference FFAOT - FFAOTRB (the 4
colour code indicating the (FFAOT - FFAOTRB)/FFAOT percentage, as in Figure 6). 5
Fig. 7. Each panel (a to i, referring to one of the nine “control regions” A to I of Fig. 1) shows the monthly mean FFAOT as measuredby MISR (thick gray line) and the relevant sinusoidal fit, FFAOTRB (thin black line). Coloured triangles represent the difference FFAOT -FFAOTRB (the colour code indicating the (FFAOT – FFAOTRB)/FFAOT percentage, as in Fig. 6).
the case, the April-to-July wildfires contributions estimatedfor the Western Mediterranean (Fig. 6 and Table 2) might beoverestimated. Similarly, some deviation from the sinusoidalbehaviour is found in control regions D (July) and E (June–July). The FFAOT field (Fig. 8b) indicates this deviation tobe still due to aerosols advected from North America, which,favoured by the high wind speed (Fig. 9b), reach up to thoselatitudes (Li et al., 2002). In this case a West-to-East gradientis observed (Fig. 7d to f) and the effect is completely lost offthe Irish coasts (Fig. 7f). Thus no impact from such trans-port is expected in the Western Europe region considered inthis study. This is also consistent with black carbon obser-vations at Mace Head (Ireland), where air masses from theAtlantic “clean” sector are found to be recently influencedby human activity only 5 % of the times (Cooke et al., 1997).Rather, the AOT (and FFAOT) peak observed over this re-gion in March (Fig. 4b) is due to an increase in the aerosolload over the ocean, and namely over the English Channeland the Bay of Biscay (not shown here). The reason for suchan aerosol increase in this period of the year is unclear, butthis allows excluding it is due to fires. Due to the frequentalgal blooms in this period of the year (e.g., Lampert et al.,2002; Gohin et al., 2003), we speculate such increase mighteither be a real aerosol signal (e.g., marine organic aerosolproduced from phytoplankton (O’Dowd et al., 2004)) or theresult of the “ocean colour” misinterpreted as aerosols by the
signal inversion scheme. Again, for this month/region theFFAOTFWTD,2 estimate in Fig. 6 is likely more reliable thanthe corresponding FFAOTFWTD,1 one.
Overall, the analysis over the control Atlantic regionspoints to a negligible contamination by westerly particletransport towards Europe on our results, except for the West-ern Mediterranean region.
4 Discussion and conclusions
Wildfires represent an important global source of trace gasesand aerosols and may represent an important climatic vari-able as well as a threat for air quality and the environment ingeneral.
In the European continent agricultural burning, used to re-move crop residues for new planting or clear weeds and brushfor grazing, is a common practice, in particular in EasternEurope and European Russia, where the largest fraction ofwildland fires occurs. Also, a large number of forest fires isregistered in Europe in summer.
A clear identification of the atmospheric effects of thesefires far from the source region is not straightforward, espe-cially in terms of advected particulate matter. In fact, detec-tion of aged smoke is hampered by the important modifica-tions fires-originated particles undergo during the transport,
Atmos. Chem. Phys., 11, 10487–10501, 2011 www.atmos-chem-phys.net/11/10487/2011/
F. Barnaba et al.: An important fingerprint of wildfires on the European aerosol load 10497
33
1
Figure 8: Monthly mean (years 2002-2007) Fine Fraction Aerosol Optical Thickness (FFAOT) as 2
measured by MISR in April (a) and July (b). The seven target European regions and the nine 3
Atlantic control regions are also indicated (red dashed lines). Blank regions indicate missing data. 4
Fig. 8. Monthly mean (years 2002–2007) Fine Fraction AerosolOptical Thickness (FFAOT) as measured by MISR in April(a) andJuly (b). The seven target European regions and the nine Atlanticcontrol regions are also indicated (red dashed lines). Blank areasindicate missing data.
and, particularly in densely populated regions such as Eu-rope, by the chemical transformations and mixing with otherparticles of both anthropogenic and natural origin (e.g. Pereet al., 2009). Numerous studies available in literature re-ported on the impacts of episodic biomass burning events inEurope, but, to our knowledge, these efforts have not yet ledto a comprehensive evaluation of the role these fires play onthe aerosol load at the continental scale.
In this study we used long term (2002–2007) remote sens-ing observation of aerosol optical thickness (AOT) and firescombined with atmospheric transport simulations to start fill-ing this gap. We employed AOT and fires datasets from theNASA Terra MISR and MODIS sensors respectively, whileatmospheric transport has been simulated with the NOAAHYSPLIT Lagrangian integrated trajectory model. Somesimplifications have been made in this preliminary assess-ment, the effect of which need to be further investigated infuture work, as well as the use of other available AOT andfires/burned area datasets, to reach more definitive conclu-sions. For example, the 2.5◦ horizontal resolution of startingpoints used in this study could be refined having at disposalhigher computational resources. However, as the modelledatmospheric transport is not expected to be much affected by
34
1
a)
b)
Figure 9: Monthly mean (2002-2007) wind field at 925 mb in April (a) and July (b) as derived 2
from NCEP/NCAR reanalysis. 3
4
Fig. 9. Monthly mean (2002–2007) wind field at 925 mb in April(a) and July(b) as derived from NCEP/NCAR reanalysis.
a finer resolution (it is basically driven by synoptic winds),the main effect of such improvement will likely convert intoa more careful evaluation of small fires. Also, due to theuse of data from a single, polar satellite we neglected herepossible effects of fire diurnal cycles. Nonetheless, this ap-proximation is expected to have a minor impact on our resultsdue to the weak diurnal cycle of fires generally observed inthe Eurasia region with respect to other areas of the world(Giglio et al., 2006).
Overall, notwithstanding the various simplificationsadopted, our study clearly indicates that, over Europe, wild-fires contribute forming a continent-wide smoky haze. Asobserved in other areas of the world (e.g., McMeeking etal., 2006, Li et al., 2010), this is likely not only caused bythe direct increase in the regional aerosol load, but also viamodifications of the chemical/physical properties of existingaerosol particles in downwind areas.
Our preliminary estimates indicate that in spring and sum-mer, 10 to 30 % of the fine fraction aerosol optical thickness(FFAOT) in Europe is related to wildfires emissions. Possiblecontamination of these results from intercontinental transportof pollution from North America is shown to be almost neg-ligible and limited to the Western Mediterranean region.
In April, when agricultural fires maximize and atmo-spheric circulation is most favourable (remember for exam-ple the dramatic spread to Central and Northern Europe ofthe Chernobyl nuclear plume, in April 1986, e.g. Albercel
www.atmos-chem-phys.net/11/10487/2011/ Atmos. Chem. Phys., 11, 10487–10501, 2011

10498 F. Barnaba et al.: An important fingerprint of wildfires on the European aerosol load
et al., 1988), an evident impact of wildfires is visible overEurope, with maximum contribution to the FFAOT of 20–35 % in Central and Eastern Europe, Scandinavia and Cen-tral Mediterranean. In August the wildfires contribution tothe FFAOT overcomes 25 % all over the continent, with theexception of Western Europe. With respect to the summerfires, partly associated to the burning of forest-type vegeta-tion, our analysis suggests a still underrated impact of springagricultural fires (particularly active in Eastern Europe andex-USSR countries as Ukraine, Kazakhstan and Russian Fed-eration) on the continental AOT. These events should thusrepresent a clear target for mitigation (FAO, 2009).
This finding should be also considered in view of the highpotential of Eastern Europe, and particularly Ukraine, interms of land availability for growing bio-energy feedstocksforeseen for the next 30-years (Fisher et al., 2010), thus em-bodying a source region of renewable energy and greenhousegas emission reductions. In fact, the European Commission’srecent report on the sustainability of biomass (EC, 2010) con-cluded that where forest or agricultural residues are used forheat and power applications, and as long as the biomass pro-duction does not cause any land-use change, the greenhousegas savings of European feedstocks are generally above 80 %compared to the fossil fuel alternative.
Given the proven fingerprints of wildfires in the atmo-spheric column, an aspect that would also merit further in-vestigation is their impact onto the lowest atmospheric lev-els, i.e., on the European air quality. In fact, some evi-dences of an important impact at the ground are availablein literature. For example, the effect of agricultural burningwas well detectable in long-term aerosol measurement per-formed at the ground in Crete, Greece (e.g., Sciare et al.,2008). A 20-to-200 % increase in PM2.5 ground concentra-tions was estimated by Hodzic et al. (2007) over a large partof Europe during the intense fire season that occurred in sum-mer 2003, particularly in Portugal. Unusually high levels ofPM2.5 and PM10 due to long-range transport of smoke fromwidespread agricultural burning and forest fires in westernRussia were observed in the UK in September 2002 and May2006 (Witham and Manning, 2007) and in Finland in April–May 2006 (Saarikoski et al., 2007). More recently, a notnegligible contribution to PM values at European high alti-tude background sites has been attributed to long range trans-port of biomass burning from the Baltic countries, Byelorus-sia, Western Russia and Kazakhstan (Salvador et al., 2010).However, as for the AOT observations, these studies are stillfragmented in space and time so that a comprehensive assess-ment of these effects at the European scale is also missing.A rough estimate from our results would suggest a springand summer contribution of wildfires to monthly-mean PMlevels at the ground of about 10 µg m−3. This was estimatedconsidering a mean wildfires FFAOT of 0.04 (e.g. Fig. 6),uniformly distributed within a 1000 m-thick atmospheric col-umn, assuming a typical mass-to-extinction coefficient of4.0 m2 g−1 (Reid et al., 2005b). Considering the 50 µg m−3
daily threshold (not to be exceeded more than 35 times percalendar year) established by the current European legisla-tion (Directive 2008/50/EC), this contribution would defi-nitely be significant for air quality evaluation purposes.
Supplementary material related to thisarticle is available online at:http://www.atmos-chem-phys.net/11/10487/2011/acp-11-10487-2011-supplement.pdf.
Acknowledgements.We gratefully acknowledge the MODIS andMISR mission scientists and associated NASA personnel for theproduction of the data used in this research effort and the NOAAAir Resources Laboratory (ARL) for the provision of the HYSPLITtransport and dispersion model used in this publication. The MISRdata were obtained from the NASA Langley Research Center At-mospheric Sciences Data Center. MODIS fires count data used inthis study were obtained from the NEO web portal as part of theNASA EOS Project Science Office. MODIS FRP data were pro-duced with the Giovanni online data system (NASA GES DISC) un-der the NASA Northern Eurasia Earth Science Partnership Initiative– NEESPI. The NASA NEESPI Data and Services Center project issupported by NASA HQ through ROSES 2005 NNH05ZDA001N-ACCESS.
We also thank the three anonymous reviewers for their constructivecomments and useful suggestions.
Edited by: A. Laaksonen
References
Acker, J. G. and Leptoukh, G.: Online Analysis Enhances Use ofNASA Earth Science Data, EOS T. Am. Geophys. Un., 88, 14–17, 2007.
Aculinin, A., Holben, B., Smirnov, A., and Eck, T.: Measurementsof aerosol optical properties at the Kishinev site, Moldova, Mol-davian Journal of the Physical Sciences, 3, 214–225, 2004.
Ahmed, A. A., Mohamed, A., Ali, A. E., Barakat, A., Abd El-Hady,M., and El-Hussein, A.: Seasonal variations of aerosol residencetime in the lower atmospheric boundary layer, J. Environ. Ra-dioactivity, 77, 275–283, 2004.
Albercel, A., Martini, D., Strauss, B. and Gross, J.-M.: The Cher-nobyl accident: modelling of dispersion over Europe of the ra-dioactive plume and comparison with air activity measurements,Atmos. Environ., 22, 2431–2444, 1988.
Alves, C., Vicente, A., Nunes, T., Goncalves, C., Fernandes A., Mi-rante, F., Tarelho, L., Sanchez de la Campa, A., Querol, X., Ca-seiro, A., Monteiro, C., and Evtyugi, M.: Summer 2009 wildfiresin Portugal: Emission of trace gases and aerosol composition,Atmos. Environ., 45, 641–649, 2011.
Amiridis, V., Balis, D. S., Giannakaki, E., Stohl, A., Kazadzis, S.,Koukouli, M. E., and Zanis, P.: Optical characteristics of biomassburning aerosols over Southeastern Europe determined from UV-Raman lidar measurements, Atmos. Chem. Phys., 9, 2431–2440,doi:10.5194/acp-9-2431-2009, 2009.
Atmos. Chem. Phys., 11, 10487–10501, 2011 www.atmos-chem-phys.net/11/10487/2011/
F. Barnaba et al.: An important fingerprint of wildfires on the European aerosol load 10499
Andreae, M. O. and Merlet, P.: Emission of trace gases and aerosolsfrom biomass burning, Global Biogeochem. Cy. , 15, 955–966,2001.
Arola, A., Lindfors, A., Natunen, A., and Lehtinen, K. E. J.: Acase study on biomass burning aerosols: effects on aerosol opti-cal properties and surface radiation levels, Atmos. Chem. Phys.,7, 4257–4266,doi:10.5194/acp-7-4257-2007, 2007.
Auvray, M. and Bey, I.: Long-range transport to Europe: Seasonalvariations and implications for the European ozone budget, J.Geophys. Res., 110, D11303,doi:10.1029/2004JD005503, 2005.
Balis, D. S., Amiridis. V., Zerefos, C., Gerasopoulos, E., Andreae,M., Zanis, P., Kazantzidis, A., Kazadzis, S., and Papayannis, A.:Raman lidar and sunphotometric measurements of aerosol, opti-cal properties over Thessaloniki, Greece during a biomass burn-ing episode, Atmos. Environ., 37, 4529–4538, 2003.
Barnaba, F. and Gobbi, G. P.: Aerosol seasonal variability overthe Mediterranean region and relative impact of maritime, conti-nental and Saharan dust particles over the basin from MODISdata in the year 2001, Atmos. Chem. Phys., 4, 2367–2391,doi:10.5194/acp-4-2367-2004, 2004.
Chubarova, N. Y.: Seasonal distribution of aerosol properties overEurope and their impact on UV irradiance, Atmos. Meas. Tech.,2, 593–608,doi:10.5194/amt-2-593-2009, 2009.
Cooke, W. F., Jennings S. G., and Spain T. G.: Black carbon mea-surements at Mace Head, 1989-1996, J. Geophys. Res., 102,25339–25346, 1997.
d’Almeida, G. A., Koepke, P., and Shettle, E. P.: Atmosphericaerosols: global climatology and radiative characteristics, A.Deepak Pub. Hampton, Va., USA, 561 pp., 1991.
Damoah, R., Spichtinger, N., Forster, C., James, P., Mattis, I.,Wandinger, U., Beirle, S., Wagner, T., and Stohl, A.: Aroundthe world in 17 days – hemispheric-scale transport of forest firesmoke from Russia in May 2003, Atmos. Chem. Phys., 4, 1311–1321,doi:10.5194/acp-4-1311-2004, 2004.
Diner, D. J., Beckert, J. C., Reilly, T. H., Bruegge, C. J., Conel, J. E.,Kahn, R., Martonchik, J. V., Ackerman, T. P., Davies, R., Gerstl,S. A. W., Gordon, H.R., Muller, J.-P., Myneni, R., Sellers, R. J.,Pinty, B. , and Verstraete, M. M.: Multi-angle Imaging SpectroRadiometer (MISR) description and experiment overview, IEEETrans. Geosci. Rem. Sens., 36, 1072–1087, 1998.
Draxler, R. R. and Hess, G. D.: An overview of the HYSPLIT4modeling system of trajectories, dispersion, and deposition,Aust. Meteor. Mag., 47, 295–308, 1998.
EC-European Commission: Report from the Commission to theCouncil and the European Parliament on sustainability require-ments for the use of solid and gaseous biomass sources in elec-tricity, heating and cooling, COM(2010)11, 2010.
Edwards, D. P., Emmons, L. K., Hauglustaine, D. A., Chu, D. A.,Gille, J. C., Kaufman, Y. J., Petron, G., Yurganov, L. N., Giglio,L., Deeter, M. N., Yudin, V., Ziskin, D. C., Warner, J., Lamarque,J.-F., Francis, G. L., Ho, S. P., Mao, D., Chen, J., Grechko, E. I.,and Drummond, J. R.: Observations of carbon monoxide andaerosols from the Terra satellite: Northern Hemisphere variabil-ity, J. Geophys. Res., 109, D24202,doi:10.1029/2004JD004727,2004.
FAO (Food and Agriculture Organization): Forest fires and the law- A guide for national drafters based on the Fire ManagementVoluntary Guidelines, FAO LEGISLATIVE STUDY 99, ISBN978-92-5-106151-0, 175 pp., 2009.
Fischer, G., Prieler, S., van Velthuizen, H., Berndes, G., Faaij, A.,Londo, M., and de Wit, M.: Biofuel production potentials in Eu-rope: Sustainable use of cultivated land and pastures, Part II:Land use scenarios, Biomass Bioenerg., 34, 173–187, 2010.
Formenti, P., Boucher, O., Reiner, T., Sprung, D., Andreae, M. O.,Wendisch, M., Wex, H., Kindred, D., Tzortziou, M., Vasaras,A., and Zerefos, C.: STAAARTE-MED 1998 summer airbornemeasurements over the Aegean Sea, 2, Aerosol scattering and ab-sorption, and radiative calculations, J. Geophys. Res., 107, 4451,doi:10.1029/2001JD001536, 2002.
Generoso, S., Bey, I., Attie, J.-L., and Breon, F.-M.: A satellite-and model-based assessment of the 2003 Russian fires: Im-pact on the Arctic region, J. Geophys. Res., 112, D15302,doi:10.1029/2006JD008344, 2007.
Giglio, L., Descloitres, J., Justice, C. O., and Kaufman, Y.: An en-hanced contextual fire detection algorithm for MODIS, RemoteSens. Environ., 87, 273–282, 2003.
Giglio, L., Csiszar, I., and Justice, C. O.: Global distribu-tion and seasonality of active fires as observed with theTerra and Aqua Moderate Resolution Imaging Spectrora-diometer (MODIS) sensors, J. Geophys. Res., 111, G02016,doi:10.1029/2005JG000142, 2006.
Gohin, F., Lampert, L., Guillaud, J.-F., Herbland, A., and. Nezan,E: Satellite and in situ observations of a late winter phytoplank-ton bloom, in the northern Bay of Biscay, Cont. Shelf. Res., 23,1117–1141, 2003.
Hays, M. D., Fine, P. M., Geron, C. D., Kleeman, M. J., and Gullett,B.K .: Open burning of agricultural biomass: Physical and chem-ical properties of particle-phase emissions, Atmos. Environ., 39,6747–6764, 2005.
Hodzic, A., Madronich, S., Bohn, B., Massie, S., Menut, L., andWiedinmyer, C.: Wildfire particulate matter in Europe duringsummer 2003: meso-scale modeling of smoke emissions, trans-port and radiative effects, Atmos. Chem. Phys., 7, 4043–4064,doi:10.5194/acp-7-4043-2007, 2007.
Holben, B. N., Eck, T. F., Slutsker, I., Tanre, D., Buis, J. P., Set-zer, A., Vermote, E., Reagan, J. A., Kaufman, Y. J., Nakajima,T., Lavenu, F., Jankowiak, I., and Smirnov, A.: AERONET – Afederated instrument network and data archive for aerosol char-acterization, Rem. Sens. Env., 66, 1–16, 1998.
Huntrieser, H., Heland, J., Schlager, H., Forster, C., Stohl, A.,Aufmhoff, H., Arnold, F., Scheel, H. E., Campana, M., Gilge,S., Eixmann, R., and Cooper, O.: Intercontinental air pollutiontransport from North America to Europe: Experimental evidencefrom airborne measurements and surface observations, J. Geo-phys. Res., 110, D01305,doi:10.1029/2004JD005045, 2005.
Janhall, S., Andreae, M. O., and Poschl, U.: Biomass burningaerosol emissions from vegetation fires: particle number andmass emission factors and size distributions, Atmos. Chem.Phys., 10, 1427–1439,doi:10.5194/acp-10-1427-2010, 2010.
Justice C., Giglio, L., Boschetti, L., Roy, D., Csiszar, I., Morisette,J., and Kaufman, Y.: Modis Fire Products – Algorithm TechnicalBackground Document (available at:http://modis.gsfc.nasa.gov/data/atbd/atbdmod14.pdf, 2006.
Kasischke, E. S. and Penner, J. E.: Improving global estimates ofatmospheric emissions from biomass burning, J. Geophys. Res.,109, D14S01,doi:10.1029/2004JD004972, 2004.
Kahn, R. A., Gaitley, B. J., Garay, M. J., Diner, D. J., Eck, T.,Smirnov, A., and Holben, B. N.: MISR aerosol product assess-
www.atmos-chem-phys.net/11/10487/2011/ Atmos. Chem. Phys., 11, 10487–10501, 2011

10500 F. Barnaba et al.: An important fingerprint of wildfires on the European aerosol load
ment by comparison with AERONET, J. Geophys. Res., 115,D23209,doi:10.1029/2010JD014601, 2010.
Kaufman, Y. J., Justice, C. O., Flynn, L. P., Kendall, J. D., Prins,E. M., Giglio, L., Ward, D. E., Menzel, W. P., and Setzer, A. W.:Potential global fire monitoring from EOS-MODIS, J. Geophys.Res., 103, 32215–32238, 1998.
Koelemeijer, R. B. A., Homan, C. D., and Matthijsen, J.: Compari-son of spatial and temporal variations of aerosol optical thicknessand particulate matter over Europe, Atmos. Environ., 40, 5304–5315, 2006.
Korontzi, S., McCarty, J., Loboda, T., Kumar, S., and Jus-tice, C.: Global distribution of agricultural fires in croplandsfrom 3 years of Moderate Resolution Imaging Spectroradiome-ter (MODIS) data, Global Biogeochem. Cy., 20, GB2021,doi:10.1029/2005GB002529, 2006.
Lampert, L., Queguiner, B., Labasque, T., Pichon, A., and Lebre-ton, N.: Spatial variability of phytoplankton composition andbiomass on the eastern continental shelf of the Bay of Biscay(north-east Atlantic Ocean). Evidence for a bloom of Emilianiahuxleyi (Prymnesiophyceae) in spring 1998, Cont. Shelf Cont.Shelf Res., 22, 1225–1247, 2002.
Langmann, B., Duncan, B., Textor, C., Trentmannd, J., van derWerf, G.: Vegetation fire emissions and their impact on air pol-lution and climate, Atmos. Environ., 43, 107–116, 2009.
Li, Q., Jacob, D. J., Bey, I., Palmer, P. I., Duncan, B. N., Field, B. D.,Martin, R. V., Fiore, A. M., Yantosca, R. M., Parrish, D. D., Sim-monds, P. G., and Oltmans, J. S.: Transatlantic transport of pollu-tion and its effects on surface ozone in Europe and North Amer-ica, J. Geophys. Res., 107, D13,doi:10.1029/2001JD001422,2002.
Li, Q., Jacob, D. J., Park, R. Wang, Y., Heald, C. L., Hudman, R.,Yantosca, R. M., Martin, R. V., and Evans, M.: North Americanpollution outflow and the trapping of convectively lifted pollu-tion by upper-level anticyclone, J. Geophys. Res., 110, D10301,doi:10.1029/2004JD005039, 2005.
Li, W. J., Shao, L. Y., and Buseck, P. R.: Haze types in Beijingand the influence of agricultural biomass burning, Atmos. Chem.Phys., 10, 8119–8130,doi:10.5194/acp-10-8119-2010, 2010.
Marmer, E., Langmann, B., Fagerli, H., and Vestreng, V.: Di-rect shortwave radiative forcing of sulfate aerosol over Eu-rope from 1900 to 2000, J. Geophys. Res., 112, D23S17,doi:10.1029/2006JD008037, 2007.
Martonchik, J. V., Kahn, R.A., and Diner, D. J.: Retrievalof Aerosol Properties over Land Using MISR Observations,in: Satellite Aerosol Remote Sensing Over Land, edited by:Kokhanovsky, A. A. and de Leeuw, G., Springer Praxis Books,Berlin, 267–293,doi:0.1007/978-3-540-69397-09, 2009.
McMeeking, G. R., Kreidenweis, S. M., Lunden, M., Carrillo, J.,Carrico, C. M., Lee, T., Herckes, P., Engling, G., Day, D. E.,Hand, J., Brown, N., Malm, W. C., and Collett, J. L.: Smoke-impacted regional haze in California during the summer of 2002,Agr. Forest. Meteorol., 137, 25–42, 2006.
Menut, L. and Bessagnet, B.: Atmospheric composition forecastingin Europe, Ann. Geophys., 28, 61–74,doi:10.5194/angeo-28-61-2010, 2010.
Mehta, A. V. and Yang, S.: Precipitation climatology over Mediter-ranean Basin from ten years of TRMM measurements, Adv.Geosci., 17, 87–91,doi:10.5194/adgeo-17-87-2008, 2008.
Mollicone, D., Eva, H. D., and Achard, F.: Human role in Russian
wild fires, Nature, 440, 436–437,doi:10.1038/440436a, 2006.Moulin, C., Lambert, C. E., Dayan, U., Masson, V., Ramonet, M.,
Bousquet, P., Legrand, M., Balkanski, Y. J., Guelle, W., Mar-ticorena, B., Bergametti, G., and Dulac, F.: Satellite climatol-ogy of African dust transport in the Mediterranean atmosphere,J. Geophys. Res., 103, 13137–13144, 1998.
Muller, D., Mattis, I., Wandinger, U., Ansmann, A., Althausen, D.,Stohl, A.: Raman lidar observations of aged Siberian and Cana-dian forest fire smoke in the free troposphere over Germany in2003: Microphysical particle characterization, J. Geophys. Res.,110, D17201,doi:10.1029/2004JD005756, 2005.
Niemi, J. V., Tervahattu, H., Vehkamaki, H., Martikainen, J.,Laakso, L., Kulmala, M., Aarnio, P., Koskentalo, T., Sillanpaa,M., and Makkonen, U.: Characterization of aerosol particleepisodes in Finland caused by wildfires in Eastern Europe, At-mos. Chem. Phys., 5, 2299–2310,doi:10.5194/acp-5-2299-2005,2005.
O’Dowd, C., Facchini, M. C., Cavalli, F., Ceburnis, D., Mircea,M., Decesari, S., Fuzzi, S., Yoon, Y. J., and Putaud, J.-P.:Biogenically-driven organic contribution to marine aerosol,, Na-ture, 431, 676–680, 2004.
Pace, G., Meloni, D., and di Sarra, A.: Forest fire aerosol over theMediterranenan basin during summer 2003, J. Geophys. Res.,110, D21202,doi:10.1029/2005JD005986, 2005.
Papadimas, C. D., Hatzianastassiou, N., Mihalopoulos, N., Querol,X., and Vardavas, I.: Spatial and temporal variability inaerosol properties over the Mediterranean basin based on 6-year (2000–2006) MODIS data, J. Geophys. Res., 113, D11205,doi:10.1029/2007JD009189, 2008.
Papayannis, A., Amiridis, V., Mona, L., Tsaknakis, G., Balis, D.,Bosenberg, J., Chaikovski, A., De Tomasi, F., Grigorov, I., Mat-tis, I., Mitev, V., Muller, D., Nickovic, S., Perez, C., Pietruczuk,A., Pisani, G., Ravetta, F., Rizi, V., Sicard, M., Trickl, T., Wieg-ner, M., Gerding, M., Mamouri, R. E., D’Amico, G., and Pap-palardo, G.: Systematic lidar observations of Saharan dust overEurope in the frame of EARLINET (2000–2002), J. Geophys.Res., 113, D10204,doi:10.1029/2007JD009028, 2008.
Papastefanou, C.: Residence time of tropospheric aerosols in as-sociation with radioactive nuclides, Appl. Radiat. Isotopes, 64,93–100, 2006.
Penkett, S. A., Law, K., Plat,t U. and Volz-Thomas, A.: EuropeanExport of Particulates and Ozone by Long-Range Transport –Overview of Subproject EXPORT-E2, in Towards Cleaner Airfor Europe – Science, Tools and Applications – Part 2. Overviewsfrom the Final Reports of the EUROTRAC-2 Subprojects, editedby: Midgley, P. M. and Reuther, M., ISBN 3-8236-1391-X, 99–118, Margraf Verlag, Weikersheim, 2003.
Pere, J. C., Mallet, M., Bessagnet, B., and Pont, V.: Evidenceof the aerosol core-shell mixing state over Europe during theheat wave of summer 2003 by using CHIMERE simulationsand AERONET inversions, Geophys. Res. Lett., 36, L09807,doi:10.1029/2009GL037334, 2009.
Reid, J. S., Koppmann, R., Eck, T. F., and Eleuterio, D. P.: A reviewof biomass burning emissions part II: intensive physical proper-ties of biomass burning particles, Atmos. Chem. Phys., 5, 799-825,doi:10.5194/acp-5-799-2005, 2005a.
Reid, J. S., Eck, T. F., Christopher, S. A., Koppmann, R., Dubovik,O., Eleuterio, D. P., Holben, B. N., Reid, E. A., and Zhang, J.:A review of biomass burning emissions part III: intensive optical
Atmos. Chem. Phys., 11, 10487–10501, 2011 www.atmos-chem-phys.net/11/10487/2011/

F. Barnaba et al.: An important fingerprint of wildfires on the European aerosol load 10501
properties of biomass burning particles, Atmos. Chem. Phys., 5,827–849,doi:10.5194/acp-5-827-2005, 2005.
Rangarajan, C.: A Study of the Mean Residence Time of the Nat-ural Radioactive Aerosols in the Planetary Boundary Layer, J.Environ. Radioactivity, 15, 193–206, 1992.
Saarikoski, S., Sillanpaa, M., Sofiev, M., Timonen, H., Saarnio,K., Teinila, K., Karppinen, A., Kukkonen, J., and Hillamo, R.:Chemical composition of aerosols during a major biomass burn-ing episode over northern Europe in spring 2006: Experimen-tal and modelling assessments, Atmos. Environ., 41, 3577–3589,2007.
Saarnio, K., Aurela, M., Timonen, H., Saarikoski, S., Teinila, K.,Makela, T., Sofiev, M., Koskinen, J., Aalto, P. P., Kulmala, M.,Kukkonen, J., and Hillamo, R.: Chemical composition of fineparticles in fresh smoke plumes from boreal wild-land fires inEurope, Sci. Total Environ., 408, 2527–2542, 2010.
Salvador, P., Artınano, B., Pio, C., Afonso, J., Legrand, M.,Puxbaum, H., and Hammer, S.: Evaluation of aerosol sourcesat European high altitude background sites with trajectory statis-tical methods, Atmos. Environ., 44, 2316–2329, 2010.
Sicard, M., Rocadenbosch, F., Reba, M. N. M., Comeron, A.,Tomas, S., Garcıa-Vızcaino, D., Batet, O., Barrios, R., Kumar,D., and Baldasano, J. M.: Seasonal variability of aerosol opticalproperties observed by means of a Raman lidar at an EARLINETsite over Northeastern Spain, Atmos. Chem. Phys., 11, 175-190,doi:10.5194/acp-11-175-2011, 2011.
Sciare, J., Oikonomou, K., Favez, O., Liakakou, E., Markaki, Z.,Cachier, H., and Mihalopoulos, N.: Long-term measurements ofcarbonaceous aerosols in the Eastern Mediterranean: evidence oflong-range transport of biomass burning, Atmos. Chem. Phys., 8,5551–5563,doi:10.5194/acp-8-5551-2008, 2008.
Stohl, A., Berg, T., Burkhart, J. F., Fj?raa, A. M., Forster, C., Her-ber, A., Hov, Ø., Lunder, C., McMillan, W. W., Oltmans, S.,Shiobara, M., Simpson, D., Solberg, S., Stebel, K., Strom, J.,Tørseth, K., Treffeisen, R., Virkkunen, K., and Yttri, K. E.: Arc-tic smoke record high air pollution levels in the European Arcticdue to agricultural fires in Eastern Europe in spring 2006, Atmos.Chem. Phys., 7, 511–534,doi:10.5194/acp-7-511-2007, 2007.
Tegen, I., Koch, D., Lacis, A. L., and Sato, M.: Trends in tropo-spheric aerosol loads and corresponding impact on direct radia-tive forcing between 1950 and 1990: A model study, J. Geophys.Res., 105, 26,971–26,989, 2000.
Warneke, C., Froyd, K. D., Brioude, J., Bahreini, R., Brock, C.A., Cozic, J., de Gouw, J. A., Fahey, D. W., Ferrare, R., Hol-loway, J. S., Middlebrook, A. M., Miller, L., Montzka, S.,Schwarz, J. P., Sodemann, H., Spackman, J. R., and Stohl, A.:An important contribution to springtime Arctic aerosol frombiomass burning in Russia, Geophys. Res. Lett., 37, L01801,doi:10.1029/2009GL041816, 2010.
Wiedinmyer, C., B. Quayle, C. Geron, A. Belote, D. McKenzie,X. Zhang, S. O’Neill, K. Klos, Wynne: Estimating emissionsfrom fires in North America for air quality modelling, Atmos.Environ., 40, 3419-3432, 2006.
Witham, C. and Manning, A: Impacts of Russian biomass burningon UK air quality, Atmos. Environ., 41, 8075–8090, 2007.
Wooster, M. J., Roberts, G., and Perry, G. L. W.: Retrieval ofbiomass combustion rates and totals from fire radiative powerobservations: FRP derivation and calibration relationships be-tween biomass consumption and fire radiative energy release, J.Geophys. Res., 110, D24311,doi:10.1029/2005JD006318, 2005
Yu, H., Dickinson, R. E., Chin, M., Kaufman, Y. J., Holben, B.N. Geogdzhayev, I. V., and Mishchenko, M. I.: Annual cycle ofglobal distributions of aerosol optical depth from integration ofMODIS retrievals and GOCART model simulations, J. Geophys.Res., 108, 4128,doi:10.1029/2002JD002717, 2003.
www.atmos-chem-phys.net/11/10487/2011/ Atmos. Chem. Phys., 11, 10487–10501, 2011