Embed Size (px)
Citation preview

GISP2 drilling dome in central Greenland.
Paul A. Mayewski is the Director of the Climate Studies Center and a Professor in the Institute for QuarternaryStudies and Department of Geological Sciences at the University of Maine.
An Ice Core Time MachinePaul A. Mayewski
The Climate Challenge
Intense efforts are underway to determine the history andsignificance of human influences on climate, but our under-standing of climate change is still hampered by how little weknow about existing natural controls on climate. Mountingevidence points to a variety of natural forces that significantlyaffect climate, including variability in the amount of energyemitted by the Sun, planetary orbits, volcanic activity, icedynamics, and changes in ocean circulation. These natural forceshave produced dramatic—and often rapid—climate change.
Earth.book_12_27 1/23/02 11:29 AM Page 160
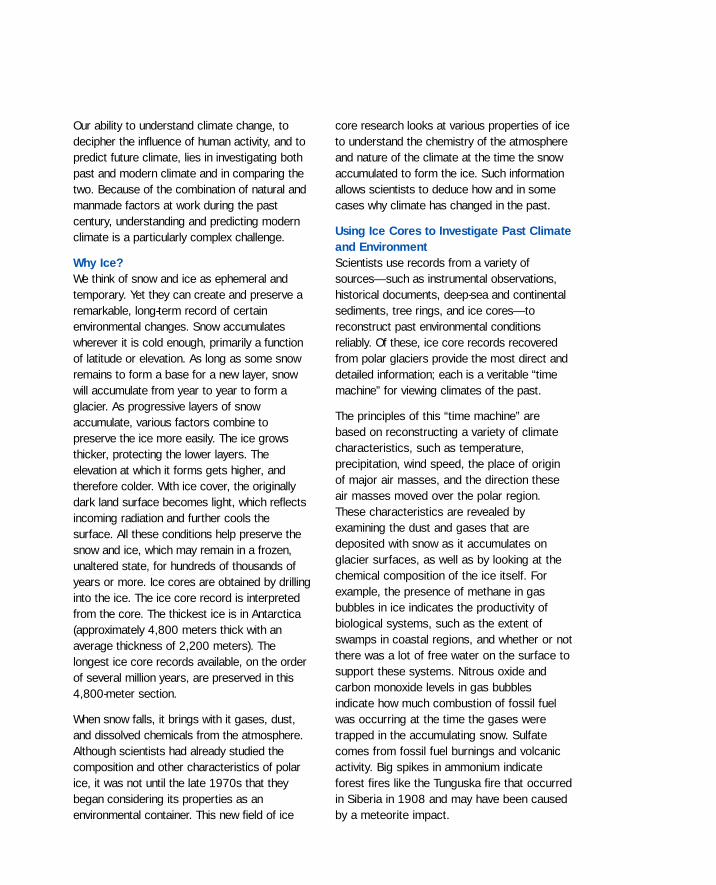
Our ability to understand climate change, todecipher the influence of human activity, and topredict future climate, lies in investigating bothpast and modern climate and in comparing thetwo. Because of the combination of natural andmanmade factors at work during the pastcentury, understanding and predicting modernclimate is a particularly complex challenge.
Why Ice?We think of snow and ice as ephemeral andtemporary. Yet they can create and preserve aremarkable, long-term record of certainenvironmental changes. Snow accumulateswherever it is cold enough, primarily a functionof latitude or elevation. As long as some snowremains to form a base for a new layer, snowwill accumulate from year to year to form aglacier. As progressive layers of snowaccumulate, various factors combine topreserve the ice more easily. The ice growsthicker, protecting the lower layers. Theelevation at which it forms gets higher, andtherefore colder. With ice cover, the originallydark land surface becomes light, which reflectsincoming radiation and further cools thesurface. All these conditions help preserve thesnow and ice, which may remain in a frozen,unaltered state, for hundreds of thousands ofyears or more. Ice cores are obtained by drillinginto the ice. The ice core record is interpretedfrom the core. The thickest ice is in Antarctica(approximately 4,800 meters thick with anaverage thickness of 2,200 meters). Thelongest ice core records available, on the orderof several million years, are preserved in this4,800-meter section.
When snow falls, it brings with it gases, dust,and dissolved chemicals from the atmosphere.Although scientists had already studied thecomposition and other characteristics of polarice, it was not until the late 1970s that theybegan considering its properties as anenvironmental container. This new field of ice
core research looks at various properties of iceto understand the chemistry of the atmosphereand nature of the climate at the time the snowaccumulated to form the ice. Such informationallows scientists to deduce how and in somecases why climate has changed in the past.
Using Ice Cores to Investigate Past Climateand EnvironmentScientists use records from a variety ofsources—such as instrumental observations,historical documents, deep-sea and continentalsediments, tree rings, and ice cores—toreconstruct past environmental conditionsreliably. Of these, ice core records recoveredfrom polar glaciers provide the most direct anddetailed information; each is a veritable “timemachine” for viewing climates of the past.
The principles of this “time machine” arebased on reconstructing a variety of climatecharacteristics, such as temperature,precipitation, wind speed, the place of originof major air masses, and the direction theseair masses moved over the polar region.These characteristics are revealed byexamining the dust and gases that aredeposited with snow as it accumulates onglacier surfaces, as well as by looking at thechemical composition of the ice itself. Forexample, the presence of methane in gasbubbles in ice indicates the productivity ofbiological systems, such as the extent ofswamps in coastal regions, and whether or notthere was a lot of free water on the surface tosupport these systems. Nitrous oxide andcarbon monoxide levels in gas bubblesindicate how much combustion of fossil fuelwas occurring at the time the gases weretrapped in the accumulating snow. Sulfatecomes from fossil fuel burnings and volcanicactivity. Big spikes in ammonium indicateforest fires like the Tunguska fire that occurredin Siberia in 1908 and may have been causedby a meteorite impact.
Earth.book_12_27 1/23/02 11:29 AM Page 161
Precise dating techniques make it possible todefine the annual, and in some cases seasonal,layers of accumulation. Once recovered, thesefrozen pieces of atmosphere are analyzed forover fifty properties. Ice possesses differentphysical as well as chemical characteristics.The size of the crystals, the temperature, andthe density of ice all change seasonally andover time. The electrical conductivity of iceindicates whether it is acidic, a preliminaryindicator of volcanic activity. These datacombine to reveal not only changes in thecomposition of the atmosphere and in theclimate, but also many potential causes of these changes.
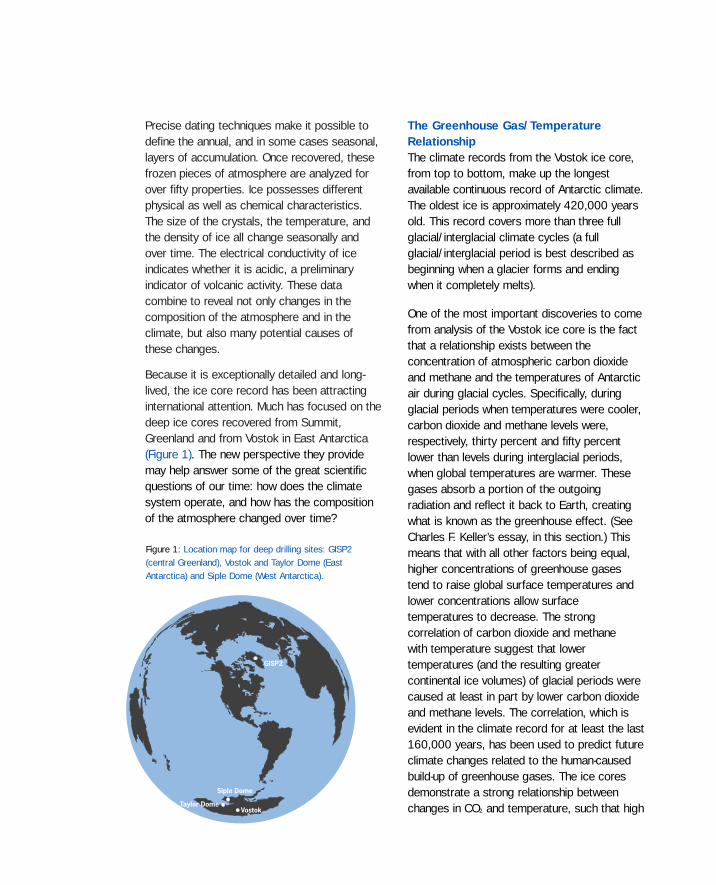
Because it is exceptionally detailed and long-lived, the ice core record has been attractinginternational attention. Much has focused on thedeep ice cores recovered from Summit,Greenland and from Vostok in East Antarctica(Figure 1). The new perspective they providemay help answer some of the great scientificquestions of our time: how does the climatesystem operate, and how has the compositionof the atmosphere changed over time?
The Greenhouse Gas/TemperatureRelationship The climate records from the Vostok ice core,from top to bottom, make up the longestavailable continuous record of Antarctic climate.The oldest ice is approximately 420,000 yearsold. This record covers more than three fullglacial/interglacial climate cycles (a fullglacial/interglacial period is best described asbeginning when a glacier forms and endingwhen it completely melts).
One of the most important discoveries to comefrom analysis of the Vostok ice core is the factthat a relationship exists between theconcentration of atmospheric carbon dioxideand methane and the temperatures of Antarcticair during glacial cycles. Specifically, duringglacial periods when temperatures were cooler,carbon dioxide and methane levels were,respectively, thirty percent and fifty percentlower than levels during interglacial periods,when global temperatures are warmer. Thesegases absorb a portion of the outgoingradiation and reflect it back to Earth, creatingwhat is known as the greenhouse effect. (SeeCharles F. Keller’s essay, in this section.) Thismeans that with all other factors being equal,higher concentrations of greenhouse gasestend to raise global surface temperatures andlower concentrations allow surfacetemperatures to decrease. The strongcorrelation of carbon dioxide and methane with temperature suggest that lowertemperatures (and the resulting greatercontinental ice volumes) of glacial periods werecaused at least in part by lower carbon dioxideand methane levels. The correlation, which isevident in the climate record for at least the last160,000 years, has been used to predict futureclimate changes related to the human-causedbuild-up of greenhouse gases. The ice coresdemonstrate a strong relationship betweenchanges in CO2 and temperature, such that high
GISP2
Siple Dome
Taylor DomeVostok
Figure 1: Location map for deep drilling sites: GISP2 (central Greenland), Vostok and Taylor Dome (EastAntarctica) and Siple Dome (West Antarctica).
Earth.book_12_27 1/23/02 11:29 AM Page 162
A N I C E C O R E T I M E M A C H I N E
temperatures are coincident with increasedlevels of greenhouse gases.
Rapid Climate Change EventsIn the past, the Earth’s climate has experiencedunprecedented swings that occur overdecades—astonishingly fast in geologicterms—and persist for thousands of years.These rapid swings have now been recorded intwo ice cores from central Greenland. This hasdramatically contributed to our understanding ofclimate during the last glacial cycle, the past100,000 years.
In 1993, the Greenland Ice Sheet Project Two(GISP2) successfully drilled to the base of theGreenland Ice Sheet. Along with its Europeancompanion project, the Greenland Ice CoreProgram (GRIP), the resulting record is thelongest (dating back more than 250,000 years),high resolution, environmental record availablefrom the Northern Hemisphere. The layers inthe upper ninety percent of the GISP2 corematch the layers in the GRIP core. This isimportant because it establishes the ice corerecord as reliable and consistent. The findings
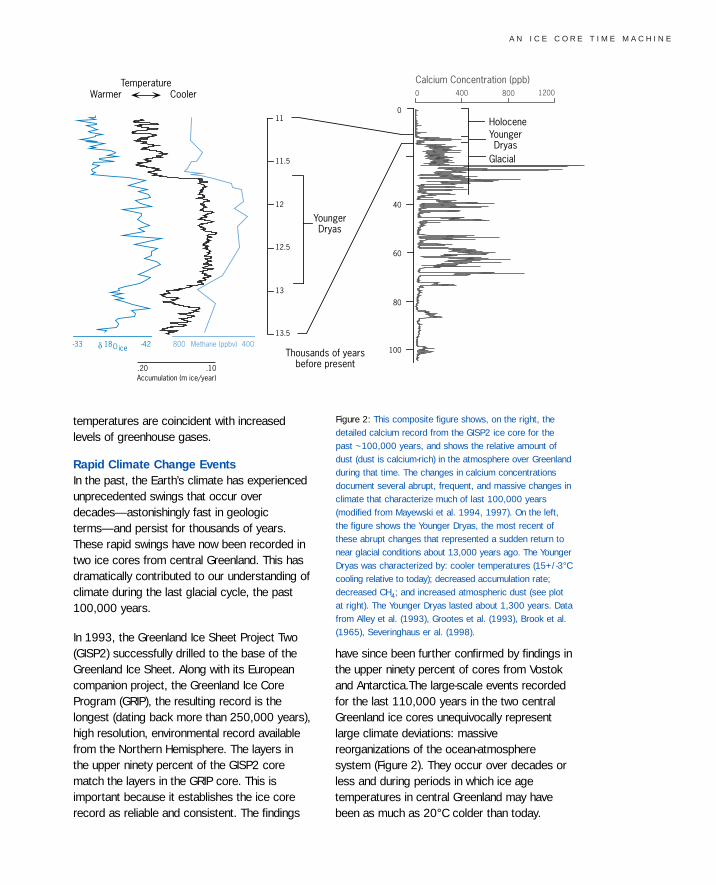
have since been further confirmed by findings inthe upper ninety percent of cores from Vostokand Antarctica.The large-scale events recordedfor the last 110,000 years in the two centralGreenland ice cores unequivocally representlarge climate deviations: massivereorganizations of the ocean-atmospheresystem (Figure 2). They occur over decades orless and during periods in which ice agetemperatures in central Greenland may havebeen as much as 20°C colder than today.
0
40
80
100
0 400
Calcium Concentration (ppb)
Holocene
Glacial
Warmer Cooler
11
11.5
12
12.5
13
13.5
Thousands of yearsbefore present
Temperature
-33 δ 18O ice
.10.20
-42
Accumulation (m ice/year)
800 1200
400800 Methane (ppbv)
YoungerDryas
60
YoungerDryas
Figure 2: This composite figure shows, on the right, thedetailed calcium record from the GISP2 ice core for thepast ~100,000 years, and shows the relative amount ofdust (dust is calcium-rich) in the atmosphere over Greenlandduring that time. The changes in calcium concentrationsdocument several abrupt, frequent, and massive changes inclimate that characterize much of last 100,000 years(modified from Mayewski et al. 1994, 1997). On the left,the figure shows the Younger Dryas, the most recent ofthese abrupt changes that represented a sudden return tonear glacial conditions about 13,000 years ago. The YoungerDryas was characterized by: cooler temperatures (15+/-3°Ccooling relative to today); decreased accumulation rate;decreased CH4; and increased atmospheric dust (see plotat right). The Younger Dryas lasted about 1,300 years. Datafrom Alley et al. (1993), Grootes et al. (1993), Brook et al.(1965), Severinghaus er al. (1998).
Earth.book_12_27 1/23/02 11:29 AM Page 163

These events are of greatest magnitude duringthe glacial period, prior to 14,500 years ago.
The Most Recent Dramatic ClimateChange: The Younger DryasApproximately 13,000 years ago, as ice fromthe last glaciation was rapidly receding, anevent called the Younger Dryas occurred. Thiswas a near return to glacial conditions markedby a number of climate changes (Figure 2): adrop in temperature of about 8–10°C inGreenland, a large decrease in atmosphericmethane concentration, a more than tenfoldincrease in the amount of windblown dust andsea-salt in the atmosphere, and a twofold andgreater increase in the rates of snowaccumulation. These features signal cold, dry,and dusty conditions. High-resolution samplingover early and late stages of the Younger Dryasindicates that this event lasted 1,300 years, butbegan and ended in less than twenty—andperhaps in less than two—years.
The identification of such rapid climate changeevents in the methane record promptedscientists to seek out similar events in otherregions. They looked in the marine records, inrecords such as windblown dust in Asia and treerings that chronicle terrestrial events, and in icecores from other parts of world. Rapid climatechange events are documented in all thesesites, although those in the North Atlantic havetended to be larger. What is not absolutelyestablished is whether or not all of these eventsoccurred at the same time, since no otherrecords can be dated as precisely as theGreenland ice core. A discrepancy in timingcould tell scientists a vast amount about thecauses of the events.
Using Other Natural Records toCorroborate Ice Core FindingsThe scientific process involves looking forrecords in more than one place. This cross-disciplinary approach enables scientists to
check one set of findings against another foraccuracy. Information from different sourcesalso helps establish the scale, timing, andnature of past events. This in turn helpsscientists to understand the possible causes ofpast climate change.
Ice core records provide a useful framework forinterpreting records recovered from othernatural archives. An important source of ancientclimate records is North Atlantic marinesediment cores. These records also varynotably across thousand-year time spans,although the precise timing of events is notknown. Marine sediment cores contain evidenceof past climate change. One such signalconsists of changes in the flux of ice-rafteddebris—rock fragments carried by ice anddeposited on the ocean floor when icebergsmelt. The fragments, which are too large to becarried by ocean currents, record whenicebergs moved farther out into the ocean thannormal. Such massive discharges of ice fromthe land indicate immense instabilities in theshape of the ice. These discharges could becaused by several factors, including a rise insea level, a rise in water temperature, or a dramatic increase in snow accumulation.Another climate signal is the abundance offoraminifera—tiny, hard-shelled marineorganisms that are highly sensitive totemperature change. Particular shapes offoraminifera favor particular temperatures, andthe compositions of their shells also depend onwater temperature. Foraminifera indicate thatduring the last glaciation large pieces ofglaciers were discharged into the North Atlanticat specific times. These discharges appear tocorrelate with rapid climate change eventsdocumented in the ice core record.
Rapid Climate Changes on a Global ScaleEvidence of rapid climate change eventsextends beyond the North Atlantic and polarregions. Marine cores from the Santa Barbara
Earth.book_12_27 1/23/02 11:29 AM Page 164

A N I C E C O R E T I M E M A C H I N E
Basin reveal disturbances in the oceancirculation patterns of the East Pacific region.Marine cores from the western Atlantic correlatewith events in the Greenland ice core records aswell. So does evidence in the form of debrisfrom melting ice caps found in the North Pacificsediment. Abrupt changes in atmospheric circulation and precipitation patterns overeastern Asia that correlate in time with the rapid climate change events are documented by thicklayers of wind-deposited clay (called loess) fromcentral China. Records of ancient fluctuations inalpine glaciers, mountain snowlines, and Andeanvegetation reveal climate fluctuations that alsocorrespond with events recorded in theGreenland ice cores. All of these records combine to form a global picture of climate thathas changed rapidly from time to time.
Scientists have yet to understand fully the timing and complex causes of these glacial-ageclimate fluctuations. However, evidence is building to reveal that some of these climateevents are regularly timed. In addition, thecumulative effect on climate of many forces—such as changes in carbon dioxide, methane,water vapor, dust in the atmosphere (both natural and biogenic), and volcanism—can nowbe demonstrated. Cloud condensation nucleicause water vapor to condense to form thesmall droplets that make up clouds. Clouds areimportant because they affect the radiation balance of Earth, by reflecting sunlight duringthe day and holding the heat in at night. The iceshows chemicals that indicate the relativepresence of clouds.
Although the largest changes in climateoccurred when there were big glaciers in theNorthern Hemisphere, more subtle ones haveoccurred in the past 10,000 years. Researchon the climate records for this timedemonstrates that major changes in climate canoccur over time periods significantly less than
that of a human lifespan. Scientists believe thatcertain rapid climate change events of the past7,000–9,000 years have had a significantimpact on human civilizations.
The Little Ice AgeThe last one to two thousand years offerimportant opportunities for understanding thesubtler variations that influence modern climate.It’s generally agreed that glaciers around theworld and the Arctic sea ice expanded during atleast parts of the thirteenth to nineteenthcenturies, a period called the Little Ice Age(LIA), and that warming occurred in someregions for several centuries prior to that,during what is called the Medieval Warm Period.The LIA had the most abrupt onset (1400–1430A.D.) of any of the rapid climate change eventsof the past 10,000 years, and the onset mayhelp us understand modern climate. It is ourbest analogy for a colder-than-present climate.Based on previous analogues and other rapidclimate change events, the LIA should lastlonger than 600 years. Some scientists suggestthat the climate state that was set up during theLIA may still be in existence, and that the risingtemperatures over the past few decades meanthat the natural climate system has beenperturbed by humans.
The Influence of Human Activity on theAtmosphereHumans have modified their environment sinceancient times, but only since the beginning ofthe Industrial Revolution has their activity had adramatic effect on a global scale. There’s nodoubt that it is affecting the composition of theatmosphere. Over the last 200 years, theworld’s population has increased by more thanfive hundred percent, and the amounts ofcarbon dioxide, nitrous oxide, and methaneemissions have significantly increased as well(Figure 3A). The only continuous, season-to-season record of variability in CO2 started in
Earth.book_12_27 1/23/02 11:29 AM Page 165

1957, and it took several decades for people torealize that measurements were going straightup. The only preceding record of theatmosphere’s composition is archived in theform of gases trapped in ice sheets. Areconstruction of the last 200 years shows atwo-fold increase in methane, a twenty-fivepercent increase in carbon dioxide, and a tenpercent increase in atmospheric nitrous oxideconcentrations. These unprecedented levels arecausing serious concern about the heat balanceof the entire planet. Human activity alsoincreases levels of sulfur aerosols, ozone, and
dust, to mention only a few emissions, whichcan either reinforce or counteract greenhousegas effects on a local or regional scale. There’sstill some doubt as to the degree to whichhuman activity is responsible, but no doubt thatthe increase in all three gases is directly relatedto the population explosion and accompanyingindustrial and land use stresses.
High-resolution analyses from a south Greenlandice core covering the last two centuries clearlydemonstrate the difference between natural,pre-1900 levels of sulfate and nitrate, andtwentieth century levels (Figure 3B).Concentrations have increased markedly sincethe turn of the century because of atmosphericpollution from North America and Eurasia. Thesulfate record is detailed enough to document adecrease during the “Great Depression” of the 1930s, an increase due to renewedindustrial activity that began during World War II,and the effects of the United States Clean AirAct of 1974.
1600
1400
1200
1000
800
Atm
. CH 4
(ppb
v)Bi
llions
of P
eopl
eThe Anthropogenic Impact
5
4
3
2
1
360
340
320
300
280
Atm. C02 (ppm
V)
2000 1950 1900 1850 1800
320
310
300
290
280
270
Atm. N
2 0 (ppbV)
Calendar Years (AD)
Atmospheric CH4
Atmospheric CO2
Atmospheric N2O
World Population
Direct Measurement
Figure 3A: This plot shows changes in the composition ofthe atmosphere over the last 200 years, determined fromanalysis of trapped gasses in Antarctic ice. The recordsshow a rapid buildup of these human-generated (anthro-pogenic) gasses which relate to increasing world population(McEvedy and Jones, 1978). CH4 is methane, C02 is carbondioxide, and N20 is nitrous oxide. Direct measurementstaken since 1957 are also shown (Keeling et al., 1976).Data taken from Etheridge et al. (1992, 1996) for CO2 andCH4 and Machida et al. (1995) for N2O.
Earth.book_12_27 1/23/02 11:29 AM Page 166

A N I C E C O R E T I M E M A C H I N E
The Future of Ice Core ResearchUsing ice cores and other paleoclimate tools,scientists are beginning to understand how themajor features of the global climate systemoperate and how the chemistry of theatmosphere has changed over time periods of 100,000 years. The next challenge is to try to
understand regional climate changes by lookingat records of the last few thousand years in various localities. These records will be the bestanalogue for the way climate is today, becauseit’s in the last 10,000 years that the geographyof the planet—for example, the course of itsrivers and distribution of vegetation—has beenthe same. Not every region can provide icecores, but records from the Arctic, theAntarctic, and Nepal can be studied, and thedata applied to other regions. Studying theseice cores and other climate records requiresmore and more detailed measurements, and increasingly sophisticated techniques forinvestigation.“Trees are an enormous feature in
0
50
100
150
0
50
100
150
Year
1
2
3
NO3-
(ng/g)
ng/g
Pre -Anthropogen icE r a
AnthropogenicE r a
SO4 2-
1800185019001950
Figure 3B: This plot shows varying levels of sulfate (SO42-
upper line) and nitrate (NO3-, lower line) with time.
Measurements were made on the ice core from site 20D in southern Greenland. Examples of volcanic eventsrecorded as spikes in the sulfate record are: 1. Laki (1783); 2. Tambora (1815); 3. Katmai (1912). Modifiedfrom Mayewski et al. (1990).
Earth.book_12_27 1/23/02 11:29 AM Page 167