Embed Size (px)
Citation preview
1
eipagctmptstgu
JsJ
J
Do
J. S. Linsey1
Department of Mechanical Engineering,Texas A&M University,
3123 TAMU,College Station, TX 77843e-mail: [email protected]
E. F. Clausse-mail: [email protected]
T. Kurtoglue-mail: [email protected]
J. T. Murphye-mail: [email protected]
K. L. Woode-mail: [email protected]
Department of Mechanical Engineering,The University of Texas at Austin,
1 University Station,M/C C2200,
Austin, TX 78712
A. B. MarkmanDepartment of Psychology,
The University of Texas at Austin,1 University Station,
M/C A8000,Austin, TX 78712
e-mail: [email protected]
An Experimental Study of GroupIdea Generation Techniques:Understanding the Roles of IdeaRepresentation and ViewingMethodsAdvances in innovation processes are critically important as economic and businesslandscapes evolve. There are many concept generation techniques that can assist a de-signer in the initial phases of design. Unfortunately, few studies have examined thesetechniques that can provide evidence to suggest which techniques should be preferred orhow to implement them in an optimal way. This study systematically investigates theunderlying factors of four common and well-documented techniques: brainsketching,gallery, 6-3-5, and C-sketch. These techniques are resolved into their key parameters,and a rigorous factorial experiment is performed to understand how the key parametersaffect the outcomes of the techniques. The factors chosen for this study with undergradu-ate mechanical engineers include how concepts are displayed to participants (all areviewed at once or subsets are exchanged between participants, i.e., “rotational viewing”)and the mode used to communicate ideas (written words only, sketches only, or a com-bination of written words and sketches). Four metrics are used to evaluate the data:quantity, quality, novelty, and variety. The data suggest that rotational viewing of sets ofconcepts described using sketches combined with words produces more ideas than havingall concepts displayed in a “gallery view” form, but a gallery view results in more highquality concepts. These results suggest that a hybrid of methods should be used to maxi-mize the quality and number of ideas. The study also shows that individuals gain asignificant number of ideas from their teammates. Ideas, when shared, can foster newidea tracks, more complete layouts, and a diverse synthesis. Finally, as teams developmore concepts, the quality of the concepts improves. This result is a consequence of theteam-sharing environment and, in conjunction with the quantity of ideas, validates theeffectiveness of group idea generation. This finding suggests a way to go beyond theobservation that some forms of brainstorming can actually hurt productivity.�DOI: 10.1115/1.4003498�
Keywords: idea generation, empirical study, brainsketching, 6-3-5, C-sketch, gallerymethod, ideation, innovation
Introduction
The ability to invent, create, and innovate is at the very core ofngineering and product development. The initial design phases,ncluding conceptual design, have the most significant impact onroduct cost �1�. Numerous idea generation techniques are avail-ble to assist the engineer in this process. Over 100 formal ideaeneration techniques have been developed in areas such as psy-hology, business, and engineering �2–4�. Techniques range fromhe well-known brainstorming method developed by Osborn �5� to
ethods specific to engineering, such as the theory of inventiveroblem solving �TIPS� �6�. Some of these techniques are meanto be implemented in a group setting, and others are intended forolitary work. Unfortunately, little empirical data exist to guidehe use of methods for engineering design. This paper focuses onroup idea generation techniques and provides guidance on theirse through data provided by a controlled experiment with
1Corresponding author.Contributed by the Design Education Committee of ASME for publication in the
OURNAL OF MECHANICAL DESIGN. Manuscript received October 5, 2009; final manu-cript received December 19, 2010; published online March 10, 2011. Assoc. Editor:
anis Terpenny.ournal of Mechanical Design Copyright © 20
wnloaded 21 Jul 2012 to 128.83.63.20. Redistribution subject to ASME
engineering design teams.One of the first studies using Osborn’s brainstorming method in
engineering design included engineering professionals working ona realistic engineering problem and showed that groups usingbrainstorming produced fewer ideas than the combined efforts ofan equivalent number of individuals working alone �7�. This re-sult, called productivity loss, is consistent with the vast majorityof studies on variations in Osborn’s brainstorming �8�.
One might think that groups would produce more ideas. Asso-ciative memory models from cognitive psychology �9–11� suggestboth why there is productivity loss and ways around it. In thesemodels, memory is treated as a network of concepts. Closely re-lated concepts are connected to each other more strongly than lessrelated concepts. When a concept is brought to mind, it activates�and hence makes more accessible� other concepts that are con-nected to it. In group contexts, the first concept presented by agroup activates a common set of concepts in all group membersand thus tends to lead groups to converge quickly on a small set ofconcepts.
However, if individuals are first able to generate ideas individu-ally and are then exposed to the ideas of other group members,these additional ideas serve as additional ways to access associa-
tive memory. So, after group members are allowed to generateMARCH 2011, Vol. 133 / 031008-111 by ASME
license or copyright; see http://www.asme.org/terms/Terms_Use.cfm
ttppsdfp
eetdmtmmgdt
yigiafio�t
bmeiicsoaptca
0
Do
heir own ideas, ideas provided by other group members can ac-ivate and facilitate the retrieval of additional, and sometimes dis-arate, ideas. Recent studies on engineering design support theotential of idea exchange for promoting new ideas �12–14�. As-ociative memory models are one reason why groups may pro-uce fewer ideas, but there are many other possibilities such asear of evaluation by teammates or production blocking; only oneerson can speak at a time, and this blocks other people �8�.
For other group idea generation techniques, groups are moreffective than the combined individual efforts �15,16�. One suchxample is brainwriting, which uses written communication ratherhan spoken communication. Recent studies have focused on theevelopment and evaluation of more effective idea generationethods in engineering and design related fields, including indus-
rial design and architecture �17–21�. These studies have used aixture of sketches, verbal descriptions of ideas, and physicalodels in the idea generation process. The vast majority of idea
eneration techniques focus on the sentential expression of ideasespite the fact that designers rely heavily on sketches to expressheir ideas during the conceptual phase of design �1�.
An exhaustive comparison of idea generation techniques is be-ond the scope of this paper due to the vast number of techniquesn the literature. Instead, we focus here on a generalization of ideaeneration techniques by systematically dissecting these methodsnto key factors or parameters. A design of experiment �DOE�pproach is utilized to quickly identify the effects of these keyactors. By understanding the factors that influence the success ofdea generation methods, new and better methods may be devel-ped. This type of approach was recommended by Shah et al.19�, and we believe that it facilitates a scientific understanding ofhe methods and their effectiveness.
Our study focuses on four group idea generation methods:rainsketching, C-sketch, 6-3-5, and the first phase of the galleryethod �Figs. 1 and 2�. These methods are gaining popularity and
xposure in the engineering research community, in addition tondustrial application �22�. They also form a diverse set of groupdea generation techniques, which vary in how ideas are ex-hanged and in the types of representations used �written words,ketches, etc.�. To understand the theoretical basis of these meth-ds, we dissect them into two key factors: �1� how a group’s ideasre displayed to other members �“rotational view” or all areosted in “gallery view”� and �2� the form of communication be-ween group members �written words only, sketches only, or aombination of words and sketches�. All other method parameters
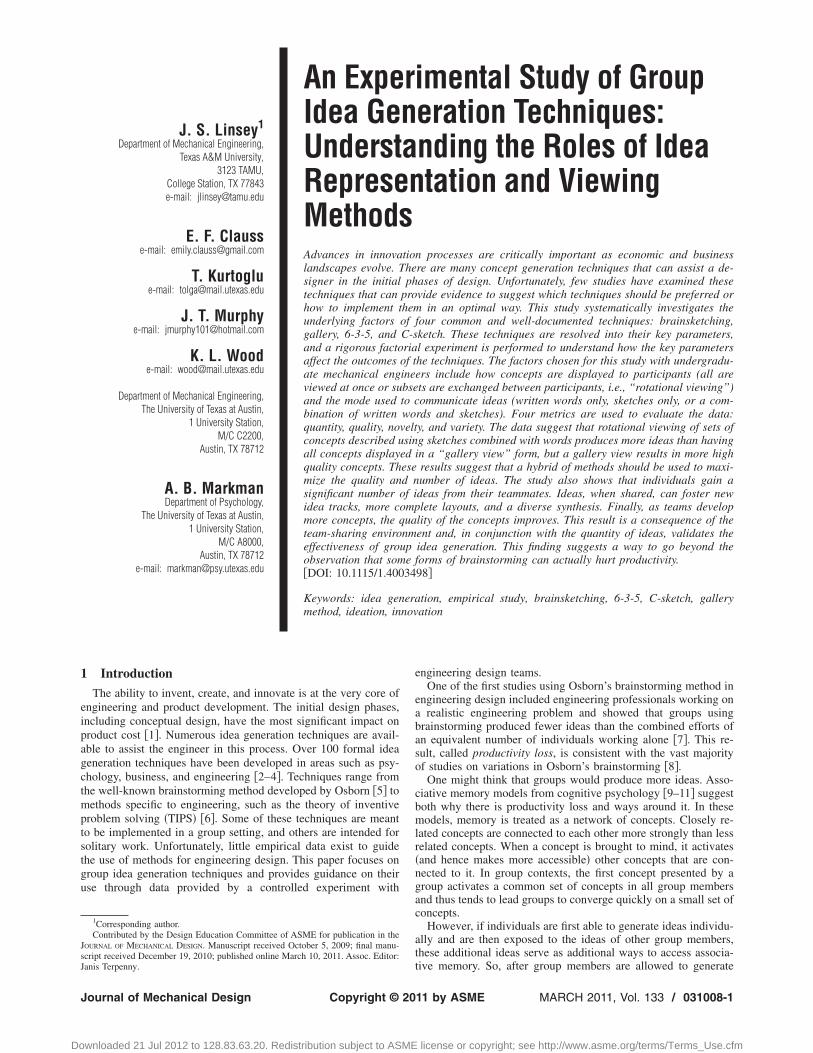
Fig. 1 Illustration of gallery method
re kept constant for all experimental conditions, including the
31008-2 / Vol. 133, MARCH 2011
wnloaded 21 Jul 2012 to 128.83.63.20. Redistribution subject to ASME
quantity of time for idea generation, whether the originator ofideas is identifiable to other participants, and the suspension ofjudgment.
2 Overview and Previous WorkTo place our study in perspective, we begin by reviewing rel-
evant methods of idea generation as well as the set of methodsthat form the basis of our systematic experiment.
2.1 Osborn’s Brainstorming. The term “brainstorming” isfrequently applied to idea generation techniques in general andnot just to the technique developed and named by Osborn. Os-born’s brainstorming begins with a facilitator explaining the prob-lem. A group then verbally exchanges ideas following four basicrules: �1� Criticism is not allowed, �2� “wild ideas” are welcomed,�3� building off each others’ ideas is encouraged, and �4� a largequantity of ideas is sought. Despite the face validity of these rules,much research demonstrates productivity loss in brainstormingcompared with an equal number of individuals working alone �8�.Osborn’s brainstorming has been studied extensively, and itsshortcomings are well-known. Thus, we focus our research ontechniques that incorporate other modes of communication, suchas sketching, into the process. We now turn to a discussion ofthese methods
2.2 Brainsketching. In brainsketching, individuals begin bysilently sketching their ideas on large sheets of paper includingbrief annotations. Group members exchange drawings, and silentsketching continues for another period of time �3�. This techniqueallows for a visual means of expression, and so it is well suited forproduct design. Van Der Lugt used teams of advanced productdesign students to compare brainstorming to a variant of brain-sketching �which included the explanation of ideas between ex-changes� �17�. The brainsketching variant led to more cases inwhich group members built on previously generated ideas thandid brainstorming.
2.3 Gallery. In the gallery method, individuals begin bysketching their ideas silently on large sheets of paper. After a setamount of time, participants discuss their ideas and move aboutthe room studying others’ ideas. This review phase is followed bya second stage of silent sketching �3,23,24�. The review phaseallows team members to clarify their ideas, and it provides socialinteraction �Fig. 1�.
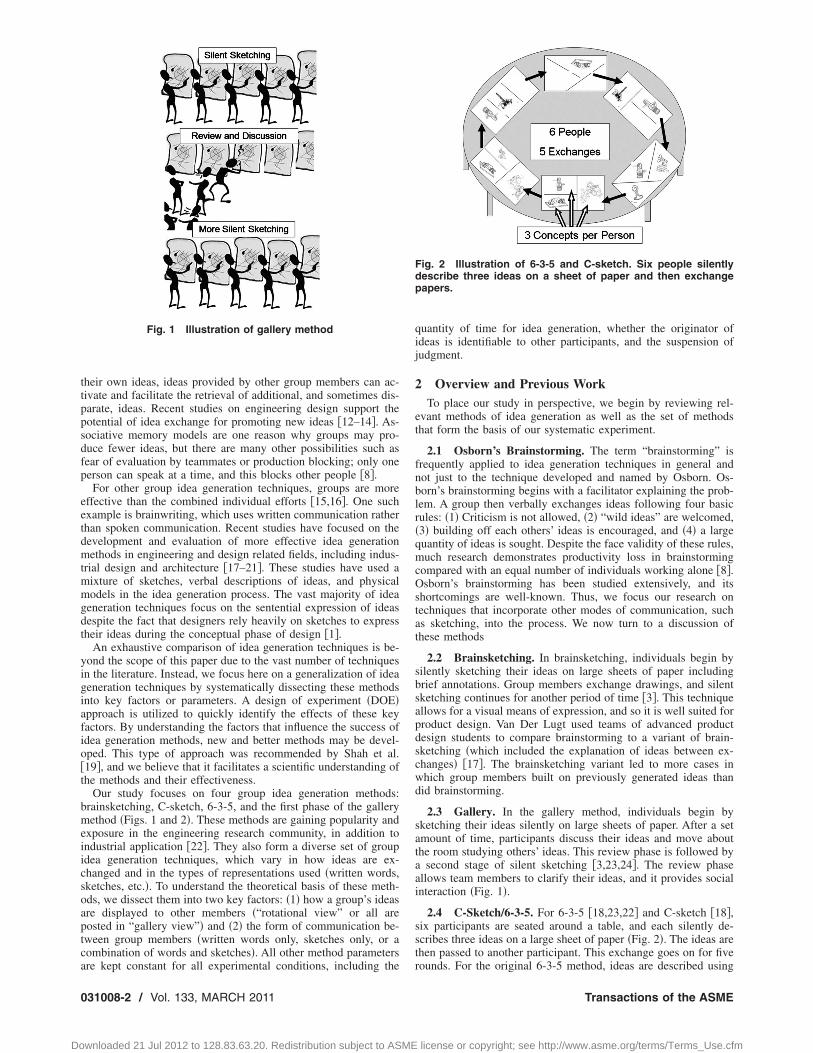
2.4 C-Sketch/6-3-5. For 6-3-5 �18,23,22� and C-sketch �18�,six participants are seated around a table, and each silently de-scribes three ideas on a large sheet of paper �Fig. 2�. The ideas arethen passed to another participant. This exchange goes on for five
Fig. 2 Illustration of 6-3-5 and C-sketch. Six people silentlydescribe three ideas on a sheet of paper and then exchangepapers.
rounds. For the original 6-3-5 method, ideas are described using
Transactions of the ASME
license or copyright; see http://www.asme.org/terms/Terms_Use.cfm

osapOvppvacmgewir
tercrbp
crenrtfnv
brsvdk�t
mowSvcTr
F
O
6CG
B
J
Do
nly words. In contrast, the C-sketch method permits onlyketches. One advantage of C-sketch over 6-3-5 is that sketchesre typically ambiguous, and so one person may misinterpret as-ects of someone else’s sketch, which may lead to new ideas �23�.ther variations of 6-3-5 have also been proposed �3,22�. Oneariation permits annotated sketches �22�. In experimental com-arisons with conditions different from those reported in this pa-er, C-sketch and gallery outperformed 6-3-5 �words only� forariety, quality, and novelty of ideas �23�. Novelty is how uniqueparticular idea is, and variety is how much of the design space is
aptured by a set of ideas. This previous study used groups ofechanical engineering undergraduates, mechanical engineering
raduate students, and professional designers. Each group wasvaluated on all three techniques, and a different design problemas solved for each of the techniques. This design eliminated
ndividual differences as a noise variable but caused the techniqueesults to be confounded with the design problem.
2.5 Potential Influence of the Components of Idea Genera-ion Methods. Much of the variation in formal group idea gen-ration methods is likely attributable to two main parameters: theepresentation used for communication and the method for ex-hanging ideas among participants. These dimensions, as summa-ized in Table 1, in many ways differentiate the methods and maye studied in the context of cognitive science findings. Relevantrior work is discussed here with respect to these dimensions.
In these idea generation techniques, group members communi-ate using some form of external representation. The choice ofepresentation is important because it makes some informationasier to convey than others. The representation is called “exter-al” because it is outside of the head, as opposed to internal rep-esentations that are inside the head �25�. Embodied cognitionheories suggest that external representations are particularly use-ul for difficult tasks such as design because they reduce the cog-itive load by reducing the amount of information that an indi-idual needs to represent internally �26�.
Designers use many different kinds of external representationsecause the design process is cognitively taxing �1,27�. Theseepresentations include sketches, various forms of diagrams, andentential annotations. Some diagrammatic representations areery specific in application, such as force flow diagrams for re-ucing system components, while others such as the techniquenown as the “house of quality” are more generally applicable22,28�. Designers know that these varying forms of representa-ion affect their thinking and therefore the final product �27�.
In addition, the theory of perceptual symbols posits that internalental representations are often based on perception �e.g., vision
r audition� rather than being languagelike amodal representationshose connection to perceptual information is arbitrary �29�.ketches, as external representations, are processed by people’sisual systems, and thus they have mental representations thatlosely resemble internally generated perceptual representations.hus, techniques that involve sketches may allow perceptual rep-
Table 1 Summary of formal idea generation techniques
ormal techniqueForm of external
representationHow ideas are
exchanged
sborn’s brainstorming Spoken word All are viewedat the same time
-3-5 Written word Rotational view-sketch Sketches only Rotational viewallery Sketches and written
word followed byspoken word
All are viewedat the same time
rainsketching Sketches andwritten word
Rotational view
esentations to have a greater influence on idea generation than
ournal of Mechanical Design
wnloaded 21 Jul 2012 to 128.83.63.20. Redistribution subject to ASME
techniques that involve only verbal descriptions.In contrast, many idea generation techniques currently available
emphasize communication through sentential description becausethey were developed for less visually oriented applications such asbusiness. It is fundamental that we understand the utility of thesemethods in engineering and the potential for combining sketchingrepresentations as an integral part of the methods. The importanceof sketches in design is clear �1,27�, highlighted by a recent issueof Design Studies that focused on sketching �Sept. 2006�.Sketches support the transformation of ideas and help preventpremature fixation �27�. Designers also use their sketches to per-ceive and mentally simulate the function of their design, therebysupporting revision and refinement �30,31�.
It is thus clear, based on cognitive science, that the communi-cation of ideas among designers is likely to be significantly influ-enced by the modality in which the idea is presented �e.g., written,sketched, or combination�. This statement is supported by Shah’sresearch. Shah �18� contended that a potential benefit of limitingindividuals in a group to sketches without verbal annotations isthe increased potential for misinterpretations, which can lead togreater novelty and variety of solutions. A participant may misun-derstand a teammate’s sketch, leading the individual to an alter-native idea not intended by the original sketch, thus producing adifferent solution.
The method of exchanging ideas �i.e., “gallery viewing” or “ro-tational viewing”� is also likely to affect the communication ofideas among designers. The viewing conditions influence theamount of visual stimulus available, the evaluation of ideas, andhow teams provide feedback to the individual members. Priorresearch shows that available visual stimuli affect the ideas gen-erated �32�. Rotational viewing allows for only a subset of ideas tobe viewed by each team member at a given time, whereas ingallery view a team’s entire set of ideas is visible. In rotationalviewing, there is no immediate feedback, whereas in gallery view-ing, the individuals can see how their ideas are added to andchanged at all stages of the idea generation process.
2.6 Potential for Verbally Based Techniques to SuppressPerceptual Memory. Many cognitive models of memory theorizethat there are both perceptual and verbal representations �33–36�.There are many forms of evidence for this distinction. We brieflydescribe one. The verbalization of perceptual information can in-terfere with the retrieval of perceptual information from memory�37�. This effect is known as verbal overshadowing. Prior studieshave evaluated an individual’s ability to recall a number of differ-ent types of complex perceptual information, including memoriesof faces. In experiments examining this phenomenon, participantsstudy a series of faces. Some give verbal descriptions of the faces,and others do not. Later, they are all given a face recognition task.In these studies, memory for faces is consistently better whenparticipants did not describe the faces verbally than when theydid. These data suggest that the verbal description interferes withthe perceptual representation of the faces because the visual infor-mation that people use to recognize faces is not the same as thefeatures that people describe when they give a verbal descriptionof a face. Analogously, verbal idea generation techniques maysuppress some of the perceptual information in memory, thus giv-ing sketching based techniques a possible advantage.
2.7 Experimental Approach and Research Questions. En-gineers seek a robust idea generation method for predictably pro-ducing a large quantity of high quality, novel product solutions.For the purposes of this study, an idea unit is defined as a solutionto a single function, and a product solution is all ideas groupedtogether to solve the design problem. At present, there is no singleapproach to idea generation that meets all of these criteria, nor isit clear which idea-generation-method parameters are responsible
for improving outcomes. Using a factorial design of experiments,MARCH 2011, Vol. 133 / 031008-3
license or copyright; see http://www.asme.org/terms/Terms_Use.cfm
oms
trrltrp
3
eteihta2tfsT�3
ptaeps
c
F
GR
0
Do
ur study explores the influence of the representation used to com-unicate ideas and how ideas are displayed to individuals. We
eek to answer the following research questions:
• Question 1: How do the techniques being tested influencethe quantity, novelty, and variety of ideas? Which idea gen-eration method produces the largest quantity, highest quality,largest variety, and greatest novelty?
• Question 2: Does the representation method of ideas inter-play with the display method, or are they independent?
• Question 3: Are certain representations better for producingor improving the quality of solutions? Do certain represen-tations cause bias toward certain types of ideas?
These three research questions are addressed systematically inhe following sections. We discuss our experimental method, met-ics for evaluation, data analysis approach, and a summary of theesults. In addition, we discuss secondary issues such as the fol-owing: Does building off teammate’s ideas improve the quality ofhe idea? These secondary issues are corollaries of the primaryesearch questions and may be investigated directly from the dataroduced from the primary experiment.
Experimental MethodWe conducted a factorial experiment in order to explore the
ffects of two key factors on the outcome of group idea genera-ion. The first factor controls how participants view the ideas;ither all ideas are posted via a gallery �on the wall�, or sets ofdeas are rotated between participants. The second factor controlsow participants represent their ideas. Participants either use writ-en words only, sketches only, or a combination of written wordsnd sketches to communicate ideas to their teammates. A�display of ideas:gallery or rotational view�X3 �representa-ion:words only, sketches only, or words combined with sketches�actorial experimental design is used �Table 2�. No oral discus-ions are allowed during the session; all communication is written.his approach produces methods similar to 6-3-5 �24�, C-sketch
18�, brainsketching �3�, or gallery method �24�, as shown in Table.
The group factorial experiment was conducted over a 2 weekeriod. Participants were asked to sign a confidentiality agreemento minimize the likelihood that other participants would hearbout the problem and spoil the experiment. Additionally, a post-xperiment survey asked participants if they had heard about theroblem and if they had tried to generate ideas prior to the ses-ion.
3.1 Participants. The participants were students from a me-hanical engineering senior design methods course at the Univer-
Table 2 Summary of experimental conditions
actor 1: display
Factor 2: representation
Words only Sketches only Words and sketches
allery view 1 3 5otational view 2 4 6
Table 3 Experimental conditions and similar formal method
Experimental condition Similar formal idea generation method
1 Electronic gallery �38�2 6-3-534 C-sketch5 Gallery6 Brainsketching
31008-4 / Vol. 133, MARCH 2011
wnloaded 21 Jul 2012 to 128.83.63.20. Redistribution subject to ASME
sity of Texas at Austin. Participants’ age ranged from 20 to 35,with 21–24 being typical. Participant teams were chosen becausethey provided a large sample of equally sized groups with expe-rience working as a team. Participants at this level have exposureto significant mechanical engineering theory and have some expe-rience in the design process through class work, internships, andwork experience. More experienced designers have a greater da-tabase of knowledge to draw from, and therefore they may bemore likely to generate a larger number of ideas than less-experienced engineers. However, choosing participants at thesame level of education minimizes the variability in prior experi-ence across groups. We asked a number of questions of partici-pants to find out their previous internships and additional relatedexperience. The amount of experience is expected to be indepen-dent of the parameters under study in this experiment. To verifythis expectation, the participants were polled regarding theirknowledge of other ideation techniques and, in particular, thetechniques used as part of our study. No students in the samplesize had previous knowledge of these techniques, and, thus, nobias was introduced based on the student backgrounds with ide-ation techniques.
The participants were told that they would receive extra creditfor their participation based on the number, quality, novelty, andvariety of solutions they develop. In the design methods course,students work throughout the semester in teams of four to sixmembers. The course assigns teams based on a strategy for im-proved team dynamics based on Myers–Briggs personality types,6-hats, and analytical/fabrication skills, in addition to participants’skills and experience level �39–43�. These team-formation strate-gies do not assess the level of creativity of the participants butinstead try to spread the range of team skills and personality pref-erences across the class. Thus, the variance in the experimentalresults due to these factors should be reduced through the team-formation approach. This method of assignment is not expected toinfluence the results of the study, except for the reduction of vari-ance and uncontrolled effects. For the factorial experiment, 14 ofthe possible 15 teams chose to take part in the experiment andparticipated with their assigned teams. Participants were requiredto sign up as a complete assigned team, and each team partici-pated in the experiment only once.
As part of the design course, students were taught a series ofidea generation techniques including brainstorming, TIPS, infor-mation gathering, patent searching, use of analogy, and a hybridversion of 6-3-5/C-sketch that emphasizes sketching with shortannotations �22�. These methods were taught in a series of five 1h lectures where mandatory class attendance was required on thepart of the students. None of the students in the experiment missedmore than one lecture. The experiment took place after thesemethods had been presented in class. Students have minimal prac-tice with any one of these techniques, and so they should not bebiased to prefer any one particular technique. An advantage of thisprior exposure to ideation techniques though is that participantsare aware of any technical jargon that may arise in describing thetechniques used in the experiment to them.
3.2 Description of the Design Problem. This work drawsfrom both mechanical engineering and cognitive psychology. Thetypical psychology experiment uses participants with no domainknowledge, and so the problems that are being solved in researchon creativity do not require specific domain knowledge to solve.Because we use domain knowledgeable participants in this re-search, we can use real-world problems. Thus, it is crucial that weselect a design problem appropriate for the study. Our goals forchoosing a design problem are making it need-based, so that par-ticipants are motivated to solve it, making it real-world and cur-rently relevant, and choosing a scope that is difficult, withoutobvious solutions, but not so complex that participants cannot findsolutions for it within the time limits of the study.
Based on the above criteria, the problem given to groups is to
design a device to quickly shell peanuts for use in places like HaitiTransactions of the ASME
license or copyright; see http://www.asme.org/terms/Terms_Use.cfm
aptatfwaots
dpttowitri
eTiimwmcausaapoegpn
poTiwastsd
J
Do
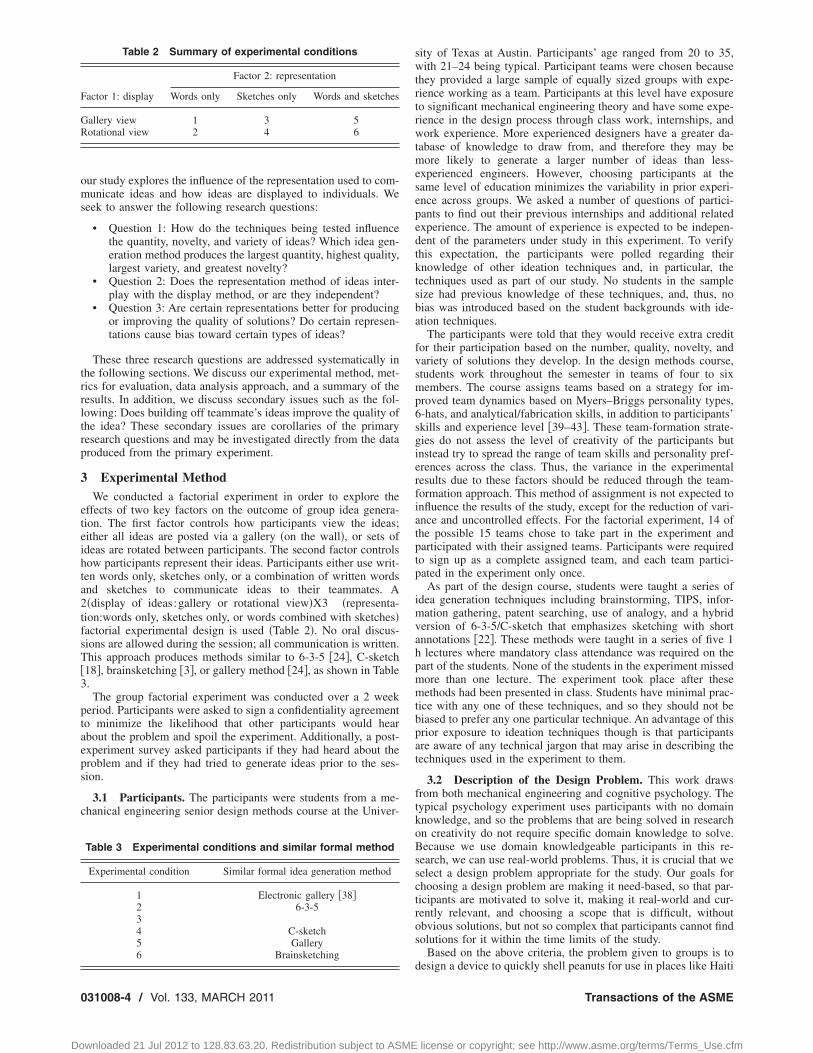
nd West African countries. This problem is based on a real-worldroblem posted on the website ThinkCycle �44�. Participants areold that no electrical energy sources are available. They are given
description of customer needs along with corresponding func-ions �see Fig. 3�. The problem is read to the participants with nourther clarification. This problem was chosen because it is a real-orld problem that a mechanical engineer should be able to solve
nd has a diverse set of available solutions. We did not expect anyf the participants to have extensive prior experience in solvinghis problem, yet shelling a peanut is a task all of the participantshould have experienced.
3.3 Procedure for All Group Conditions. Teams were ran-omly assigned to conditions. For teams with six members, oneerson was randomly assigned to work alone �as a control�, andheir ideas were not included in the team totals. The four-membeream also worked individually as a control. During one session,nly four of the five members were present; thus, their resultsere not considered further. In total, 12 teams of five are included
n the results. Sessions were scheduled at the team’s conveniencehroughout the day and week. All sessions took place in the sameoom, a windowed conference room in the mechanical engineer-ng building.
Participants were each given a unique set of five colored mark-rs and were seated next to each other facing the same direction.he variety of colors makes it difficult for other participants to
dentify the originator of an idea while at the same time allowingdentification by the experimenter. Previous work suggests that
ore ideas are generated when people believe that their responsesill be anonymous, but ideas must be identifiable to the experi-enter to reduce social loafing �45�. Participants were told they
ould use the various colors any way they desired, but three ex-mples of how color could be useful were given to encourage these of multiple colors. These examples include using color tohow different components of a design and variations on an ideand to help explain ideas such as coloring water blue. The ex-mples were intentionally selected to be unrelated to the designroblem and included a sketch of a box with two different stylesf holes and a facet. An additional effect of the markers is thequalization of drawing abilities. Sketches from participants withreater drawing ability look essentially the same as sketches fromarticipants with less ability when using these markers. There iso drastic difference in sketch quality across the participants.
The same experimenter ran all experimental groups. The ex-erimenter read a set of scripted instructions and posted the ideasn the wall or rotationally exchanged ideas between participants.he instructions included a description of the problem, the basic
dea generation rules �5� of seeking a large quantity of ideas alongith encouraging diversity �wild, eccentric, or nonstandard ideas�,reminder that criticism is not allowed, and a statement that the
ession is to test a new idea generation method. The experimenterold the participants how to represent their ideas �words only,ketches only, or a combination of words and sketches� and then
Fig. 3 Design problem description
escribed the viewing method �gallery view or rotational view�.
ournal of Mechanical Design
wnloaded 21 Jul 2012 to 128.83.63.20. Redistribution subject to ASME
The session lasted approximately 50 min with 40 min for ideageneration, followed by a post-session questionnaire.
3.4 Factor 1: Display of Ideas. One key factor in this studyis whether ideas are displayed all at once or whether participantssee only a subset at any given moment. In the gallery view con-dition, all ideas generated by the team are posted on the wall, soall participants can see all of the ideas at the same time. Thisapproach results in a method similar to the gallery method orbrainsketching �3,24�. In the rotational view condition, ideas arepassed around the table, so that each participant sees only a subsetof the ideas at any given moment. This condition is similar to6-3-5 or C-sketch �18,24,22�.
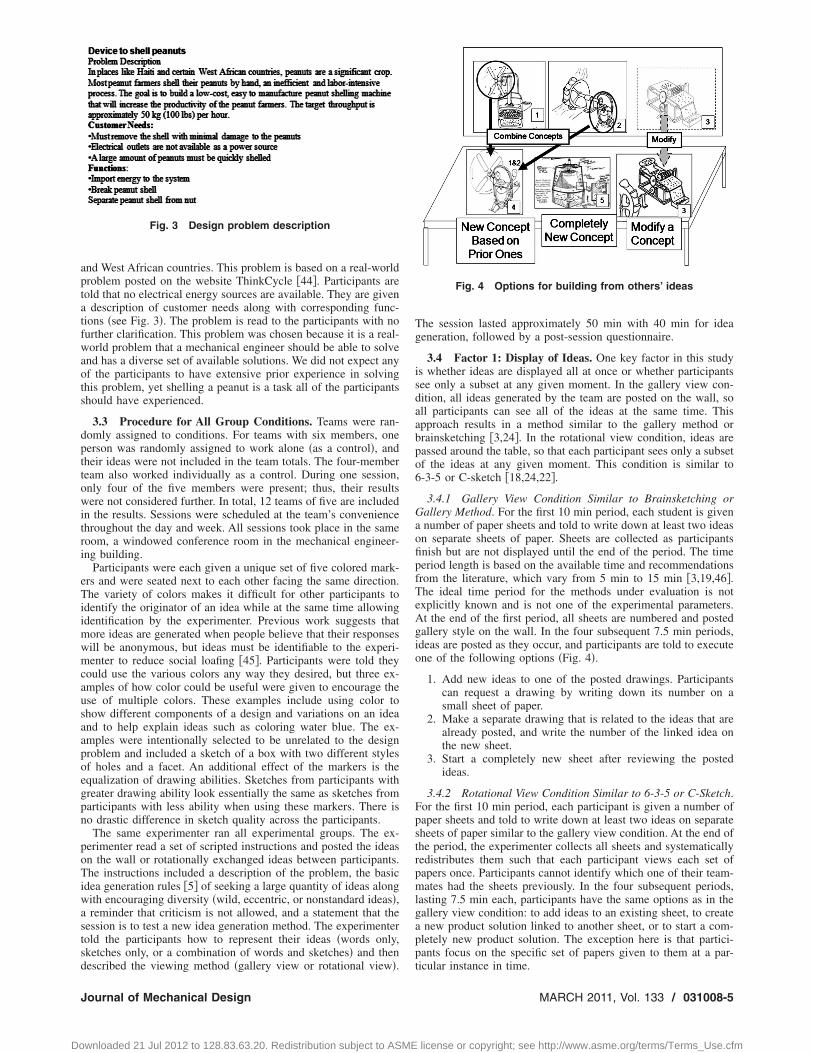
3.4.1 Gallery View Condition Similar to Brainsketching orGallery Method. For the first 10 min period, each student is givena number of paper sheets and told to write down at least two ideason separate sheets of paper. Sheets are collected as participantsfinish but are not displayed until the end of the period. The timeperiod length is based on the available time and recommendationsfrom the literature, which vary from 5 min to 15 min �3,19,46�.The ideal time period for the methods under evaluation is notexplicitly known and is not one of the experimental parameters.At the end of the first period, all sheets are numbered and postedgallery style on the wall. In the four subsequent 7.5 min periods,ideas are posted as they occur, and participants are told to executeone of the following options �Fig. 4�.
1. Add new ideas to one of the posted drawings. Participantscan request a drawing by writing down its number on asmall sheet of paper.
2. Make a separate drawing that is related to the ideas that arealready posted, and write the number of the linked idea onthe new sheet.
3. Start a completely new sheet after reviewing the postedideas.
3.4.2 Rotational View Condition Similar to 6-3-5 or C-Sketch.For the first 10 min period, each participant is given a number ofpaper sheets and told to write down at least two ideas on separatesheets of paper similar to the gallery view condition. At the end ofthe period, the experimenter collects all sheets and systematicallyredistributes them such that each participant views each set ofpapers once. Participants cannot identify which one of their team-mates had the sheets previously. In the four subsequent periods,lasting 7.5 min each, participants have the same options as in thegallery view condition: to add ideas to an existing sheet, to createa new product solution linked to another sheet, or to start a com-pletely new product solution. The exception here is that partici-pants focus on the specific set of papers given to them at a par-
Fig. 4 Options for building from others’ ideas
ticular instance in time.
MARCH 2011, Vol. 133 / 031008-5
license or copyright; see http://www.asme.org/terms/Terms_Use.cfm

tocastta
4
fadi�ragr
reaaatwcsam
poletoo
tsi�ot6aas
mcnfts
sidfd�ps
0
Do
3.5 Factor 2: Representation. The second experimental fac-or prescribes how the participants communicate their ideas tother participants �words only, sketches only with no words, or aombination of words and sketches�. At the end of the sessionsnd after completion of the surveys, participants in either of theketches only conditions labeled their sketches with brief descrip-ions to facilitate evaluation. American mechanical engineers areypically not taught to draw free-hand, and therefore their sketchesre usually difficult to interpret without annotations.
Metrics for EvaluationIt is crucial to have good metrics for evaluating the outcomes
rom idea generation techniques. Unfortunately, these techniquesre not yet well-developed in general. Previous studies have usedifferent methods for measuring outcomes, including quantity ofdeas, number of good ideas, practicality, novelty, and variety15,17,23,47,48�. Commonly used metrics are the quantity of non-edundant ideas and quality rating �8�. Shah et al. �19� developedset of metrics specifically for the evaluation of engineering ideaeneration techniques, including quantity, quality, novelty, and va-iety.
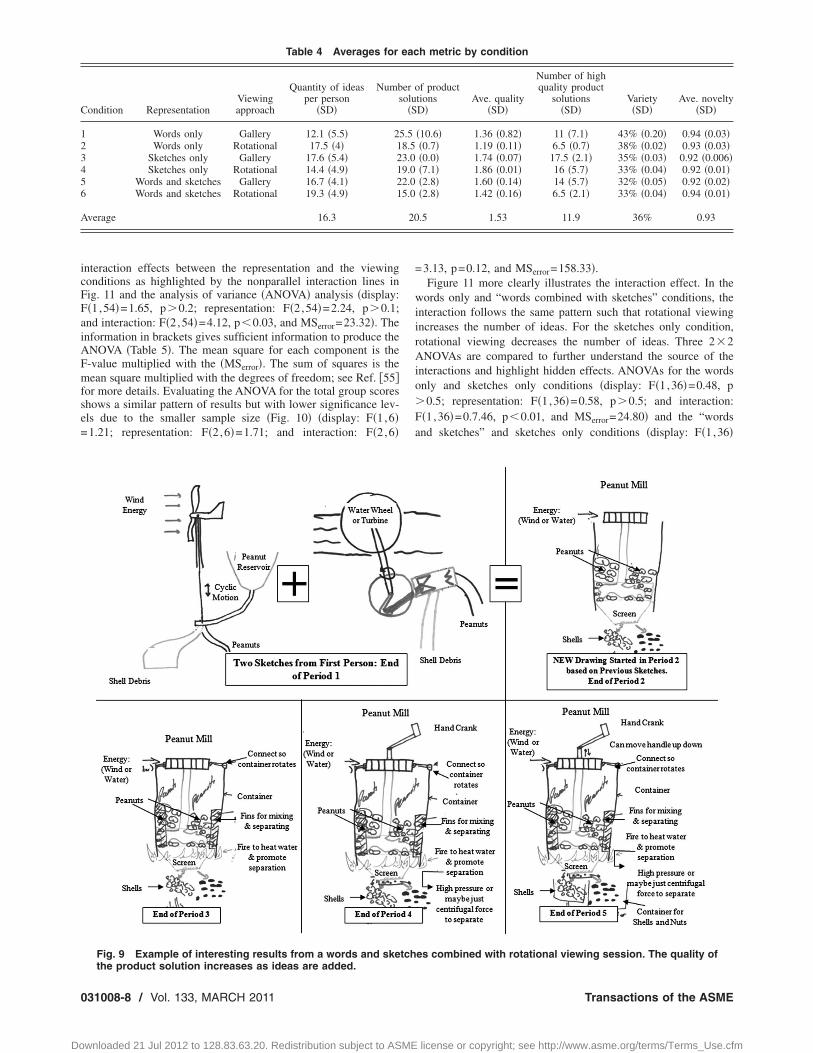
Our study also measures the quantity, quality, novelty, and va-iety of product solutions and the quantity of ideas. However, wextended beyond the current measurement methods by developinglgorithms for the measurements that increase reliability. For ex-mple, three existing solutions for shelling peanuts were sketchednd added to the participants’ results to benchmark and add addi-ional validity to the metrics. Two solutions, which we believedere good solutions to the problem, were aimed at third world
ountries �49,50�, and the third solution, which we felt was a poorolution to this problem, was aimed at a large-scale industrialpplication �51�. Sections 4.1–4.3 describe our extended measure-ent methods in more detail.A product solution is defined as all ideas sketched on a single
age, and a single idea unit is defined as a single solution to onef the device’s functions. Metrics are measured at two differentevels, the product solution and the individual idea. Quality, nov-lty, and variety are only measured at the level of a product solu-ion because many very novel products are unique combinationsf common components, and it is the product solution level that isf most interest.
4.1 Method for Measuring the Quantity of Product Solu-ions and Ideas Within the Product Solutions. Previous re-earch suggests that the number of unique �or nonredundant� ideass important for ensuring the successful development of a product52�. A single product solution is defined as all the ideas containedn a single page unless participants made a clear indication thathe product solution is continued onto another page. Figures 5 and
show examples of a single product solution for “words only”nd “sketches only” conditions. Figure 6 also lists, in the form oftable, the ideas that are contained within the product solution
ketches.A single idea is more difficult to define. A critical element foreasuring the number of ideas is a precise definition of what
onstitutes a single idea. Is a single idea an off-the-shelf compo-ent or piece-part, a single noun phrase, an item that meets anyunction, or something else? This question is particularly difficulto answer when the data are in the form of sketches becauseketches frequently contain many vague details.
Building from the procedure developed by Shah et al. �19�, aet of procedural rules is defined for what constitutes a singledea; see Linsey et al. �52� for more detailed examples. Our basicefinition of an idea is something that solves one or more of theunctions of the design as defined by the functional basis, a clearlyefined and tested language for expressing design functions53,54�. For example, in Fig. 6, if a second participant had pro-osed the idea of using a grate to separate the peanuts and the
hells, it would have been counted as a different idea, whereas if31008-6 / Vol. 133, MARCH 2011
wnloaded 21 Jul 2012 to 128.83.63.20. Redistribution subject to ASME
they had proposed a flat plate with holes rather than the holes inthe drum, this would have been counted as the same idea; seeLinsey et al. �52� for more detailed examples.
However, we must define a second type of idea for cases inwhich participants reframe the problem more abstractly. This situ-ation occurs more frequently when participants use only words fortheir descriptions. These solutions are clearly ideas, but they donot fit defined functions of the functional basis for the stated prob-lem. For example, ideas in this category range from geneticallyengineered peanuts to training squirrels to shell the peanuts. Athird refinement is made for function sharing ideas, that is, fea-tures that perform two or more functions. Function sharing ideascount as a single idea. This choice is made because it providesgreater consistency between judges, leaving less room for inter-pretation of the intended function. Clearly, function sharing isgood design practice, but even if it were possible to create a gooddefinition of function sharing, the importance of innovations thatserve multiple functions will be captured by our quality metrics,not our quantity metrics. Our quantity metric is biased toward afunctional view, but this definition combined with the definition of“reframing” ideas covers virtually every solution encountered.
Fig. 5 An example of one product solution from the wordsonly condition
Fig. 6 Example of one sketched product solution and the list
of ideas contained within the product solutionTransactions of the ASME
license or copyright; see http://www.asme.org/terms/Terms_Use.cfm
Tds
odcntraua
vtpcapirct
Psgccastdgco�
nlu−�poc
QsI�tsdlrtt
rqh
J
Do
his method for measuring the quantity of ideas allows for a highegree of inter-rater agreement and a robust metric, as demon-trated by tests during the experiment.
Three judges independently counted the number of ideas basedn the guidelines given above. Two judges were blind to the con-itions of the experiment and the hypothesis, one of whomounted all of the data. The other two judges each counted aonoverlapping subset. Pearson’s correlation coefficients �55� forhe two sets of judges were 0.99 and 0.95, demonstrating higheliability in the results. Because the counting rules are beingpplied consistently, the analysis of the quantity data is completedsing only the comprehensive judge’s results to minimize the vari-nce due to using different judges.
Once ideas for each team are counted, the score for each indi-idual is found by identifying the originator of each idea based onhe marker color used to write or sketch it. Similarly, the timeeriod the idea was conceived is determined. For gallery viewonditions, the time each sketch is completed and the time ofdditions to it are recorded. The credit is split evenly between thearticipants when multiple participants think of the same idea dur-ng the same time period. This situation occurs frequently for theotational viewing condition and occasionally in the gallery viewondition when two participants are writing down the same idea athe same time.
4.2 Method for Measuring the Variety and Novelty ofroduct Solutions. To measure the variety and novelty of productolutions generated, two independent raters sort the sheets intoroups or bins of similar product solutions, where a given raterhooses what constitutes “similar.” One rater was blind to theonditions of the experiment and the hypotheses. The first evalu-tor formed 34 bins, and the second created 28 bins. The varietycore for a team is measured by the percentage of total bins thathe team’s product solutions occupy. For example, if a team pro-uces product solutions that are sorted into six bins by rater 1, thatroup would receive a variety rating of 6/34 or 17.6%. Pearson’sorrelation �55� between the raters was high, r=0.82. This valuef correlation is in the acceptable range based on the literature55�.
The novelty score for each product solution is a function of theumber of similar product solutions �i.e., number of product so-utions in that particular bin� relative to the total number of prod-ct solutions. Specifically, novelty is equal to 1the frequency an idea occurs and has been used previously
56� �Eq. �1��. This metric fails if a team develops one very novelroduct solution and then creates numerous variations on it. Nonef the teams in this study demonstrated such a result. A highorrelation between raters, again, was observed �r=0.80�,
novelty � 1 − frequency of idea
= 1 −number of very similar concepts
total number of concepts�1�
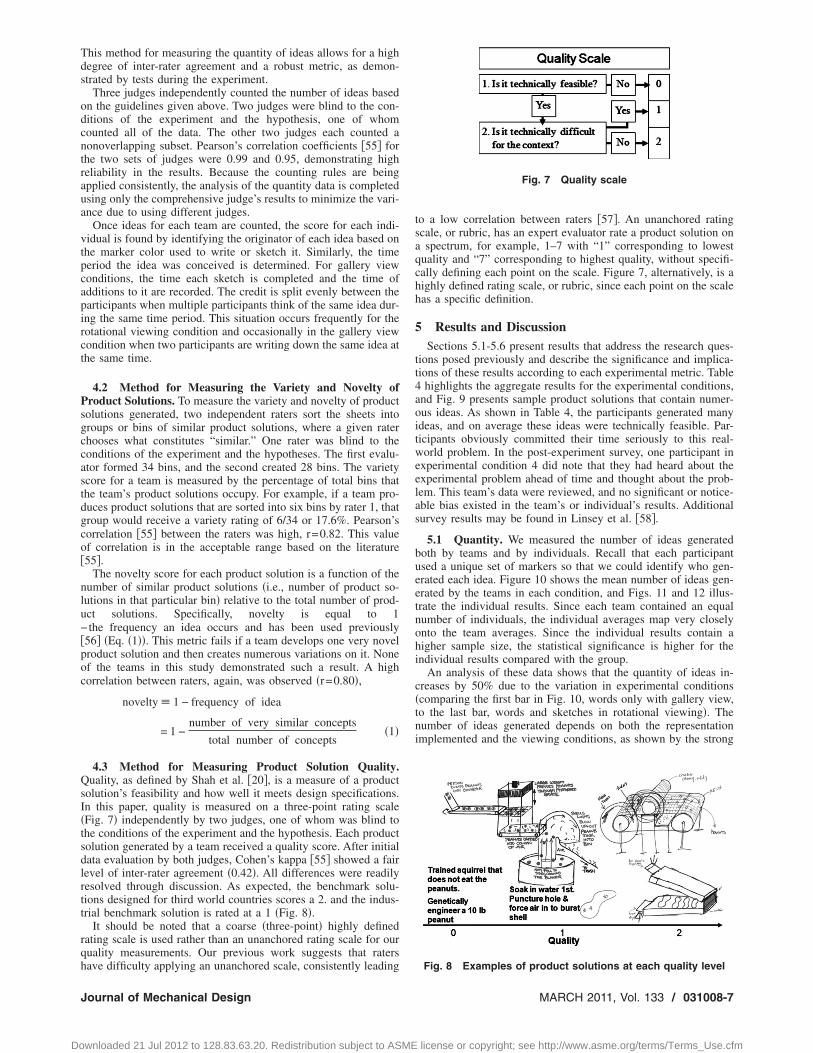
4.3 Method for Measuring Product Solution Quality.uality, as defined by Shah et al. �20�, is a measure of a product
olution’s feasibility and how well it meets design specifications.n this paper, quality is measured on a three-point rating scaleFig. 7� independently by two judges, one of whom was blind tohe conditions of the experiment and the hypothesis. Each productolution generated by a team received a quality score. After initialata evaluation by both judges, Cohen’s kappa �55� showed a fairevel of inter-rater agreement �0.42�. All differences were readilyesolved through discussion. As expected, the benchmark solu-ions designed for third world countries scores a 2. and the indus-rial benchmark solution is rated at a 1 �Fig. 8�.
It should be noted that a coarse �three-point� highly definedating scale is used rather than an unanchored rating scale for ouruality measurements. Our previous work suggests that raters
ave difficulty applying an unanchored scale, consistently leadingournal of Mechanical Design
wnloaded 21 Jul 2012 to 128.83.63.20. Redistribution subject to ASME
to a low correlation between raters �57�. An unanchored ratingscale, or rubric, has an expert evaluator rate a product solution ona spectrum, for example, 1–7 with “1” corresponding to lowestquality and “7” corresponding to highest quality, without specifi-cally defining each point on the scale. Figure 7, alternatively, is ahighly defined rating scale, or rubric, since each point on the scalehas a specific definition.
5 Results and DiscussionSections 5.1-5.6 present results that address the research ques-
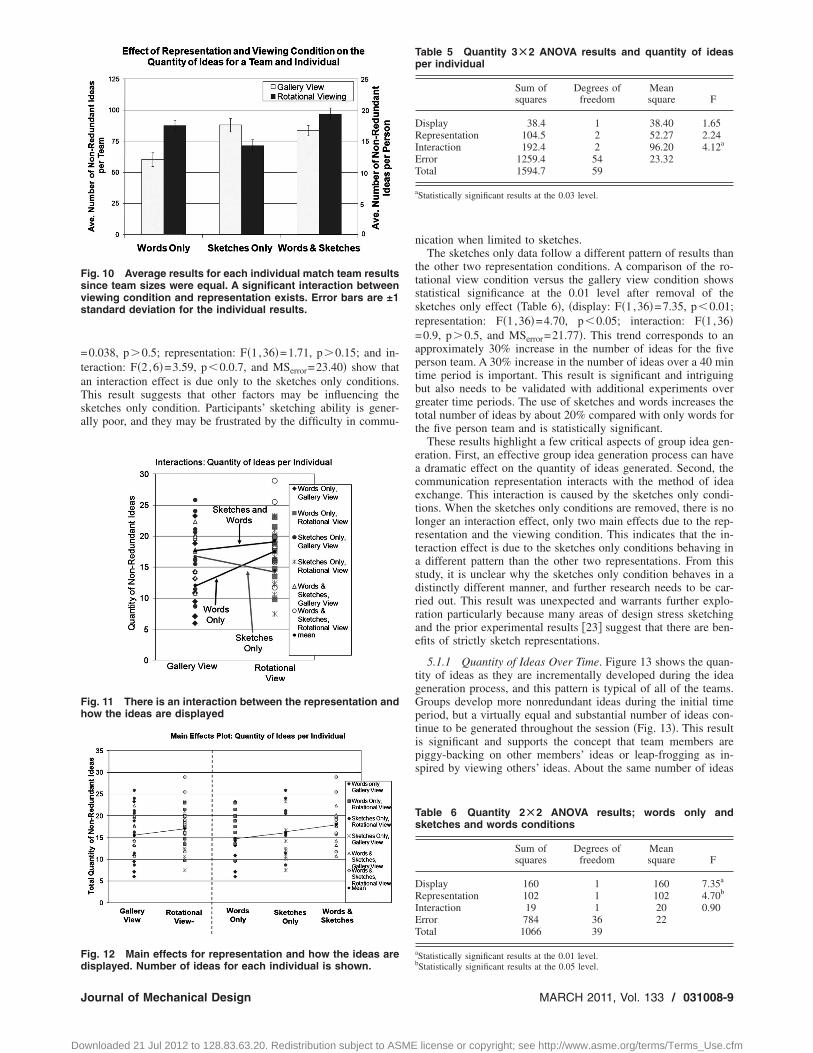
tions posed previously and describe the significance and implica-tions of these results according to each experimental metric. Table4 highlights the aggregate results for the experimental conditions,and Fig. 9 presents sample product solutions that contain numer-ous ideas. As shown in Table 4, the participants generated manyideas, and on average these ideas were technically feasible. Par-ticipants obviously committed their time seriously to this real-world problem. In the post-experiment survey, one participant inexperimental condition 4 did note that they had heard about theexperimental problem ahead of time and thought about the prob-lem. This team’s data were reviewed, and no significant or notice-able bias existed in the team’s or individual’s results. Additionalsurvey results may be found in Linsey et al. �58�.
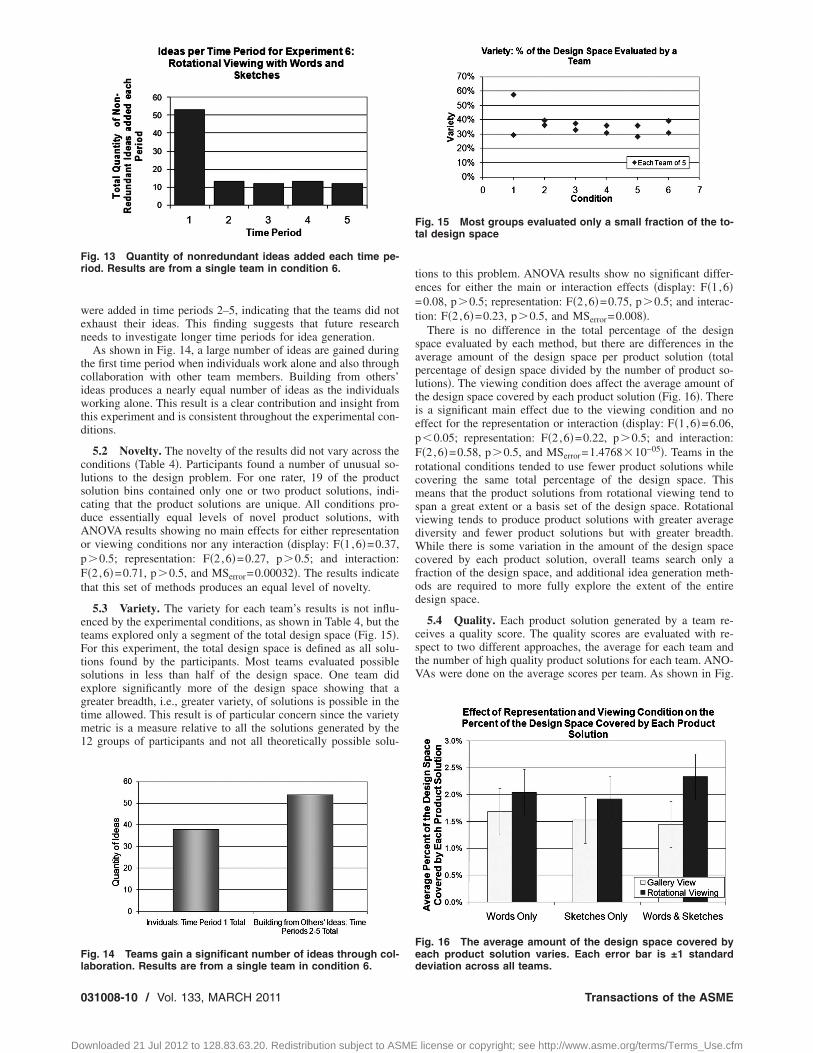
5.1 Quantity. We measured the number of ideas generatedboth by teams and by individuals. Recall that each participantused a unique set of markers so that we could identify who gen-erated each idea. Figure 10 shows the mean number of ideas gen-erated by the teams in each condition, and Figs. 11 and 12 illus-trate the individual results. Since each team contained an equalnumber of individuals, the individual averages map very closelyonto the team averages. Since the individual results contain ahigher sample size, the statistical significance is higher for theindividual results compared with the group.
An analysis of these data shows that the quantity of ideas in-creases by 50% due to the variation in experimental conditions�comparing the first bar in Fig. 10, words only with gallery view,to the last bar, words and sketches in rotational viewing�. Thenumber of ideas generated depends on both the representationimplemented and the viewing conditions, as shown by the strong
Fig. 7 Quality scale
Fig. 8 Examples of product solutions at each quality level
MARCH 2011, Vol. 133 / 031008-7
license or copyright; see http://www.asme.org/terms/Terms_Use.cfm
icFFaiAFmfse=
C
123456
A
0
Do
nteraction effects between the representation and the viewingonditions as highlighted by the nonparallel interaction lines inig. 11 and the analysis of variance �ANOVA� analysis �display:�1,54�=1.65, p�0.2; representation: F�2,54�=2.24, p�0.1;nd interaction: F�2,54�=4.12, p�0.03, and MSerror=23.32�. Thenformation in brackets gives sufficient information to produce theNOVA �Table 5�. The mean square for each component is the-value multiplied with the �MSerror�. The sum of squares is theean square multiplied with the degrees of freedom; see Ref. �55�
or more details. Evaluating the ANOVA for the total group scoreshows a similar pattern of results but with lower significance lev-ls due to the smaller sample size �Fig. 10� �display: F�1,6�1.21; representation: F�2,6�=1.71; and interaction: F�2,6�
Table 4 Averages for
ondition RepresentationViewingapproach
Quantity of ideasper person
�SD�
Numbs
Words only Gallery 12.1 �5.5� 2Words only Rotational 17.5 �4� 1
Sketches only Gallery 17.6 �5.4� 2Sketches only Rotational 14.4 �4.9� 1
Words and sketches Gallery 16.7 �4.1� 2Words and sketches Rotational 19.3 �4.9� 1
verage 16.3
Fig. 9 Example of interesting results from a words and ske
the product solution increases as ideas are added.31008-8 / Vol. 133, MARCH 2011
wnloaded 21 Jul 2012 to 128.83.63.20. Redistribution subject to ASME
=3.13, p=0.12, and MSerror=158.33�.Figure 11 more clearly illustrates the interaction effect. In the
words only and “words combined with sketches” conditions, theinteraction follows the same pattern such that rotational viewingincreases the number of ideas. For the sketches only condition,rotational viewing decreases the number of ideas. Three 2�2ANOVAs are compared to further understand the source of theinteractions and highlight hidden effects. ANOVAs for the wordsonly and sketches only conditions �display: F�1,36�=0.48, p�0.5; representation: F�1,36�=0.58, p�0.5; and interaction:F�1,36�=0.7.46, p�0.01, and MSerror=24.80� and the “wordsand sketches” and sketches only conditions �display: F�1,36�
h metric by condition
f producttionsD�
Ave. quality�SD�
Number of highquality product
solutions�SD�
Variety�SD�
Ave. novelty�SD�
�10.6� 1.36 �0.82� 11 �7.1� 43% �0.20� 0.94 �0.03��0.7� 1.19 �0.11� 6.5 �0.7� 38% �0.02� 0.93 �0.03��0.0� 1.74 �0.07� 17.5 �2.1� 35% �0.03� 0.92 �0.006��7.1� 1.86 �0.01� 16 �5.7� 33% �0.04� 0.92 �0.01��2.8� 1.60 �0.14� 14 �5.7� 32% �0.05� 0.92 �0.02��2.8� 1.42 �0.16� 6.5 �2.1� 33% �0.04� 0.94 �0.01�
.5 1.53 11.9 36% 0.93
es combined with rotational viewing session. The quality of
eac
er oolu�S
5.58.53.09.02.05.0
20
tch
Transactions of the ASME
license or copyright; see http://www.asme.org/terms/Terms_Use.cfm
=taTsa
Fsvs
Fh
Fd
J
Do
0.038, p�0.5; representation: F�1,36�=1.71, p�0.15; and in-eraction: F�2,6�=3.59, p�0.0.7, and MSerror=23.40� show thatn interaction effect is due only to the sketches only conditions.his result suggests that other factors may be influencing theketches only condition. Participants’ sketching ability is gener-lly poor, and they may be frustrated by the difficulty in commu-
ig. 10 Average results for each individual match team resultsince team sizes were equal. A significant interaction betweeniewing condition and representation exists. Error bars are ±1tandard deviation for the individual results.
ig. 11 There is an interaction between the representation andow the ideas are displayed
ig. 12 Main effects for representation and how the ideas are
isplayed. Number of ideas for each individual is shown.ournal of Mechanical Design
wnloaded 21 Jul 2012 to 128.83.63.20. Redistribution subject to ASME
nication when limited to sketches.The sketches only data follow a different pattern of results than
the other two representation conditions. A comparison of the ro-tational view condition versus the gallery view condition showsstatistical significance at the 0.01 level after removal of thesketches only effect �Table 6�, �display: F�1,36�=7.35, p�0.01;representation: F�1,36�=4.70, p�0.05; interaction: F�1,36�=0.9, p�0.5, and MSerror=21.77�. This trend corresponds to anapproximately 30% increase in the number of ideas for the fiveperson team. A 30% increase in the number of ideas over a 40 mintime period is important. This result is significant and intriguingbut also needs to be validated with additional experiments overgreater time periods. The use of sketches and words increases thetotal number of ideas by about 20% compared with only words forthe five person team and is statistically significant.
These results highlight a few critical aspects of group idea gen-eration. First, an effective group idea generation process can havea dramatic effect on the quantity of ideas generated. Second, thecommunication representation interacts with the method of ideaexchange. This interaction is caused by the sketches only condi-tions. When the sketches only conditions are removed, there is nolonger an interaction effect, only two main effects due to the rep-resentation and the viewing condition. This indicates that the in-teraction effect is due to the sketches only conditions behaving ina different pattern than the other two representations. From thisstudy, it is unclear why the sketches only condition behaves in adistinctly different manner, and further research needs to be car-ried out. This result was unexpected and warrants further explo-ration particularly because many areas of design stress sketchingand the prior experimental results �23� suggest that there are ben-efits of strictly sketch representations.
5.1.1 Quantity of Ideas Over Time. Figure 13 shows the quan-tity of ideas as they are incrementally developed during the ideageneration process, and this pattern is typical of all of the teams.Groups develop more nonredundant ideas during the initial timeperiod, but a virtually equal and substantial number of ideas con-tinue to be generated throughout the session �Fig. 13�. This resultis significant and supports the concept that team members arepiggy-backing on other members’ ideas or leap-frogging as in-spired by viewing others’ ideas. About the same number of ideas
Table 5 Quantity 3Ã2 ANOVA results and quantity of ideasper individual
Sum ofsquares
Degrees offreedom
Meansquare F
Display 38.4 1 38.40 1.65Representation 104.5 2 52.27 2.24Interaction 192.4 2 96.20 4.12a
Error 1259.4 54 23.32Total 1594.7 59
aStatistically significant results at the 0.03 level.
Table 6 Quantity 2Ã2 ANOVA results; words only andsketches and words conditions
Sum ofsquares
Degrees offreedom
Meansquare F
Display 160 1 160 7.35a
Representation 102 1 102 4.70b
Interaction 19 1 20 0.90Error 784 36 22Total 1066 39
aStatistically significant results at the 0.01 level.b
Statistically significant results at the 0.05 level.MARCH 2011, Vol. 133 / 031008-9
license or copyright; see http://www.asme.org/terms/Terms_Use.cfm
wen
tciwtd
clscdAopFt
etFtsegtm1
Fr
Fl
0
Do
ere added in time periods 2–5, indicating that the teams did notxhaust their ideas. This finding suggests that future researcheeds to investigate longer time periods for idea generation.
As shown in Fig. 14, a large number of ideas are gained duringhe first time period when individuals work alone and also throughollaboration with other team members. Building from others’deas produces a nearly equal number of ideas as the individualsorking alone. This result is a clear contribution and insight from
his experiment and is consistent throughout the experimental con-itions.
5.2 Novelty. The novelty of the results did not vary across theonditions �Table 4�. Participants found a number of unusual so-utions to the design problem. For one rater, 19 of the productolution bins contained only one or two product solutions, indi-ating that the product solutions are unique. All conditions pro-uce essentially equal levels of novel product solutions, withNOVA results showing no main effects for either representationr viewing conditions nor any interaction �display: F�1,6�=0.37,�0.5; representation: F�2,6�=0.27, p�0.5; and interaction:�2,6�=0.71, p�0.5, and MSerror=0.00032�. The results indicate
hat this set of methods produces an equal level of novelty.
5.3 Variety. The variety for each team’s results is not influ-nced by the experimental conditions, as shown in Table 4, but theeams explored only a segment of the total design space �Fig. 15�.or this experiment, the total design space is defined as all solu-
ions found by the participants. Most teams evaluated possibleolutions in less than half of the design space. One team didxplore significantly more of the design space showing that areater breadth, i.e., greater variety, of solutions is possible in theime allowed. This result is of particular concern since the variety
etric is a measure relative to all the solutions generated by the2 groups of participants and not all theoretically possible solu-
ig. 13 Quantity of nonredundant ideas added each time pe-iod. Results are from a single team in condition 6.
ig. 14 Teams gain a significant number of ideas through col-
aboration. Results are from a single team in condition 6.31008-10 / Vol. 133, MARCH 2011
wnloaded 21 Jul 2012 to 128.83.63.20. Redistribution subject to ASME
tions to this problem. ANOVA results show no significant differ-ences for either the main or interaction effects �display: F�1,6�=0.08, p�0.5; representation: F�2,6�=0.75, p�0.5; and interac-tion: F�2,6�=0.23, p�0.5, and MSerror=0.008�.
There is no difference in the total percentage of the designspace evaluated by each method, but there are differences in theaverage amount of the design space per product solution �totalpercentage of design space divided by the number of product so-lutions�. The viewing condition does affect the average amount ofthe design space covered by each product solution �Fig. 16�. Thereis a significant main effect due to the viewing condition and noeffect for the representation or interaction �display: F�1,6�=6.06,p�0.05; representation: F�2,6�=0.22, p�0.5; and interaction:F�2,6�=0.58, p�0.5, and MSerror=1.4768�10−05�. Teams in therotational conditions tended to use fewer product solutions whilecovering the same total percentage of the design space. Thismeans that the product solutions from rotational viewing tend tospan a great extent or a basis set of the design space. Rotationalviewing tends to produce product solutions with greater averagediversity and fewer product solutions but with greater breadth.While there is some variation in the amount of the design spacecovered by each product solution, overall teams search only afraction of the design space, and additional idea generation meth-ods are required to more fully explore the extent of the entiredesign space.
5.4 Quality. Each product solution generated by a team re-ceives a quality score. The quality scores are evaluated with re-spect to two different approaches, the average for each team andthe number of high quality product solutions for each team. ANO-VAs were done on the average scores per team. As shown in Fig.
Fig. 15 Most groups evaluated only a small fraction of the to-tal design space
Fig. 16 The average amount of the design space covered byeach product solution varies. Each error bar is ±1 standard
deviation across all teams.Transactions of the ASME
license or copyright; see http://www.asme.org/terms/Terms_Use.cfm
1ttpqftmce=aguspm
pt1a�aoiq1cFi
Fi
F=
J
Do
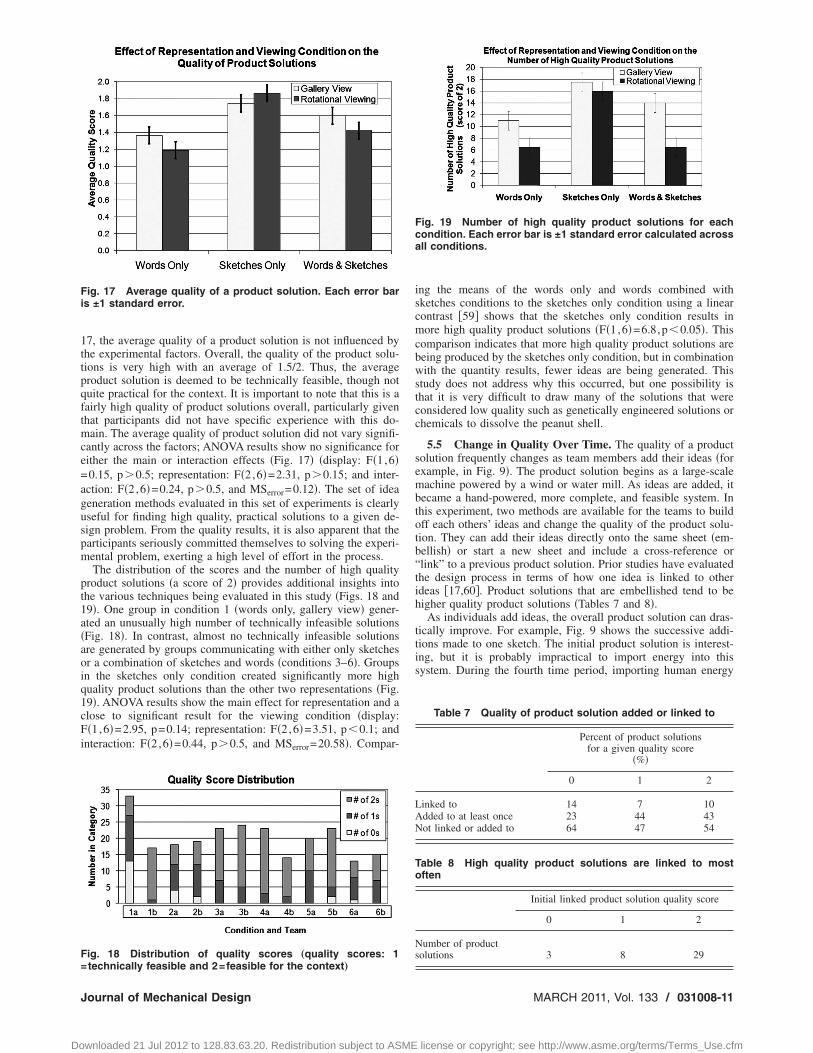
7, the average quality of a product solution is not influenced byhe experimental factors. Overall, the quality of the product solu-ions is very high with an average of 1.5/2. Thus, the averageroduct solution is deemed to be technically feasible, though notuite practical for the context. It is important to note that this is aairly high quality of product solutions overall, particularly givenhat participants did not have specific experience with this do-
ain. The average quality of product solution did not vary signifi-antly across the factors; ANOVA results show no significance forither the main or interaction effects �Fig. 17� �display: F�1,6�0.15, p�0.5; representation: F�2,6�=2.31, p�0.15; and inter-ction: F�2,6�=0.24, p�0.5, and MSerror=0.12�. The set of ideaeneration methods evaluated in this set of experiments is clearlyseful for finding high quality, practical solutions to a given de-ign problem. From the quality results, it is also apparent that thearticipants seriously committed themselves to solving the experi-ental problem, exerting a high level of effort in the process.The distribution of the scores and the number of high quality
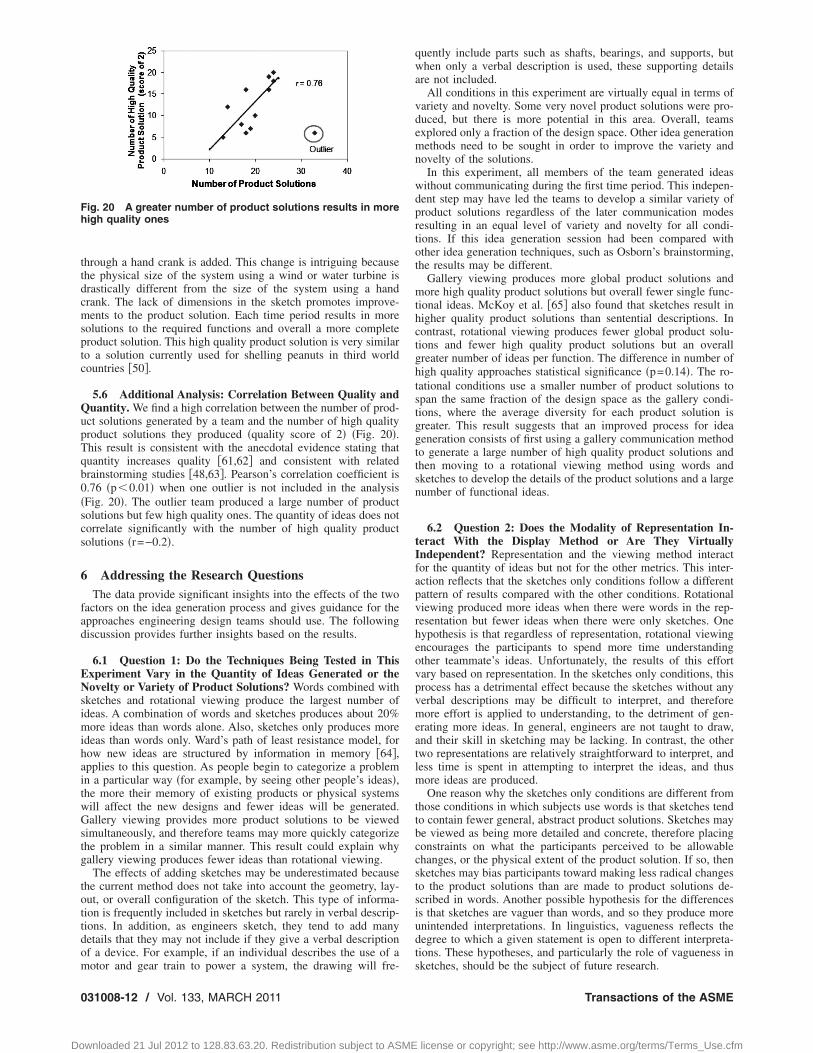
roduct solutions �a score of 2� provides additional insights intohe various techniques being evaluated in this study �Figs. 18 and9�. One group in condition 1 �words only, gallery view� gener-ted an unusually high number of technically infeasible solutionsFig. 18�. In contrast, almost no technically infeasible solutionsre generated by groups communicating with either only sketchesr a combination of sketches and words �conditions 3–6�. Groupsn the sketches only condition created significantly more highuality product solutions than the other two representations �Fig.9�. ANOVA results show the main effect for representation and alose to significant result for the viewing condition �display:�1,6�=2.95, p=0.14; representation: F�2,6�=3.51, p�0.1; and
nteraction: F�2,6�=0.44, p�0.5, and MSerror=20.58�. Compar-
ig. 17 Average quality of a product solution. Each error bars ±1 standard error.
ig. 18 Distribution of quality scores „quality scores: 1
technically feasible and 2=feasible for the context…ournal of Mechanical Design
wnloaded 21 Jul 2012 to 128.83.63.20. Redistribution subject to ASME
ing the means of the words only and words combined withsketches conditions to the sketches only condition using a linearcontrast �59� shows that the sketches only condition results inmore high quality product solutions �F�1,6�=6.8,p�0.05�. Thiscomparison indicates that more high quality product solutions arebeing produced by the sketches only condition, but in combinationwith the quantity results, fewer ideas are being generated. Thisstudy does not address why this occurred, but one possibility isthat it is very difficult to draw many of the solutions that wereconsidered low quality such as genetically engineered solutions orchemicals to dissolve the peanut shell.
5.5 Change in Quality Over Time. The quality of a productsolution frequently changes as team members add their ideas �forexample, in Fig. 9�. The product solution begins as a large-scalemachine powered by a wind or water mill. As ideas are added, itbecame a hand-powered, more complete, and feasible system. Inthis experiment, two methods are available for the teams to buildoff each others’ ideas and change the quality of the product solu-tion. They can add their ideas directly onto the same sheet �em-bellish� or start a new sheet and include a cross-reference or“link” to a previous product solution. Prior studies have evaluatedthe design process in terms of how one idea is linked to otherideas �17,60�. Product solutions that are embellished tend to behigher quality product solutions �Tables 7 and 8�.
As individuals add ideas, the overall product solution can dras-tically improve. For example, Fig. 9 shows the successive addi-tions made to one sketch. The initial product solution is interest-ing, but it is probably impractical to import energy into thissystem. During the fourth time period, importing human energy
Fig. 19 Number of high quality product solutions for eachcondition. Each error bar is ±1 standard error calculated acrossall conditions.
Table 7 Quality of product solution added or linked to
Percent of product solutionsfor a given quality score
�%�
0 1 2
Linked to 14 7 10Added to at least once 23 44 43Not linked or added to 64 47 54
Table 8 High quality product solutions are linked to mostoften
Initial linked product solution quality score
0 1 2
Number of productsolutions 3 8 29
MARCH 2011, Vol. 133 / 031008-11
license or copyright; see http://www.asme.org/terms/Terms_Use.cfm
ttdcmsptc
QupTqb0�scs
6
fad
ENsimihaitwGstg
tottdom
Fh
0
Do
hrough a hand crank is added. This change is intriguing becausehe physical size of the system using a wind or water turbine israstically different from the size of the system using a handrank. The lack of dimensions in the sketch promotes improve-ents to the product solution. Each time period results in more
olutions to the required functions and overall a more completeroduct solution. This high quality product solution is very similaro a solution currently used for shelling peanuts in third worldountries �50�.
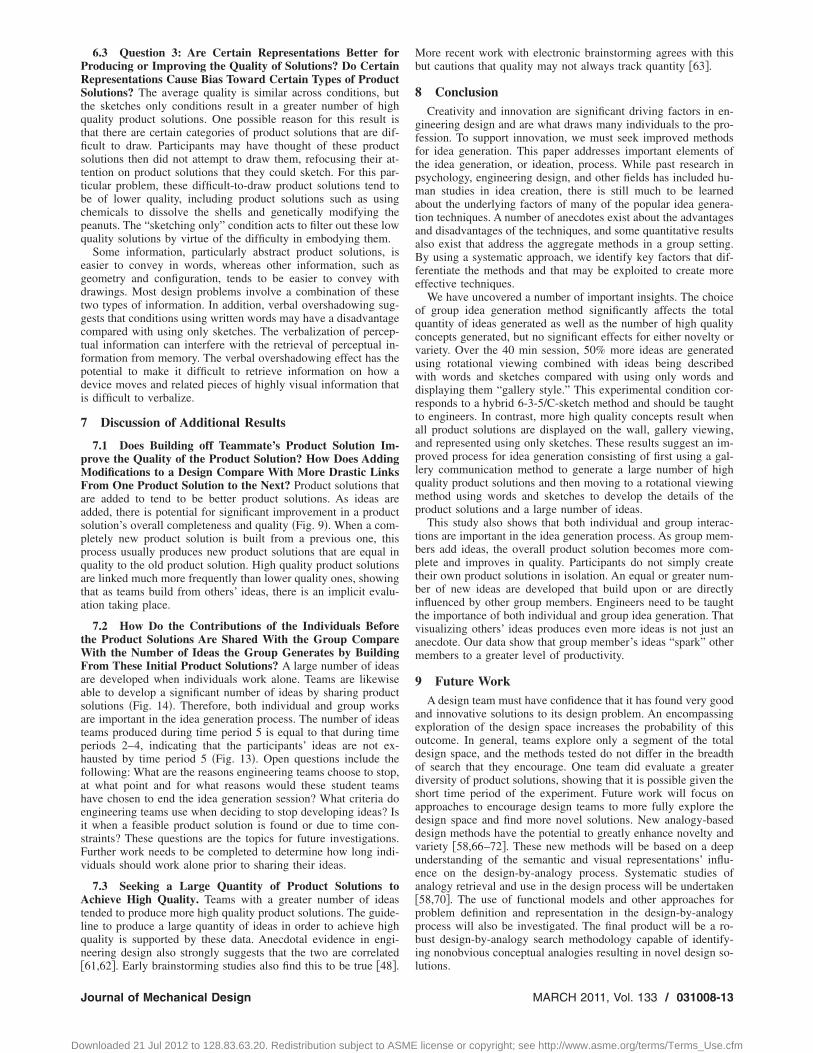
5.6 Additional Analysis: Correlation Between Quality anduantity. We find a high correlation between the number of prod-
ct solutions generated by a team and the number of high qualityroduct solutions they produced �quality score of 2� �Fig. 20�.his result is consistent with the anecdotal evidence stating thatuantity increases quality �61,62� and consistent with relatedrainstorming studies �48,63�. Pearson’s correlation coefficient is.76 �p�0.01� when one outlier is not included in the analysisFig. 20�. The outlier team produced a large number of productolutions but few high quality ones. The quantity of ideas does notorrelate significantly with the number of high quality productolutions �r=−0.2�.
Addressing the Research QuestionsThe data provide significant insights into the effects of the two
actors on the idea generation process and gives guidance for thepproaches engineering design teams should use. The followingiscussion provides further insights based on the results.
6.1 Question 1: Do the Techniques Being Tested in Thisxperiment Vary in the Quantity of Ideas Generated or theovelty or Variety of Product Solutions? Words combined with
ketches and rotational viewing produce the largest number ofdeas. A combination of words and sketches produces about 20%
ore ideas than words alone. Also, sketches only produces moredeas than words only. Ward’s path of least resistance model, forow new ideas are structured by information in memory �64�,pplies to this question. As people begin to categorize a problemn a particular way �for example, by seeing other people’s ideas�,he more their memory of existing products or physical systemsill affect the new designs and fewer ideas will be generated.allery viewing provides more product solutions to be viewed
imultaneously, and therefore teams may more quickly categorizehe problem in a similar manner. This result could explain whyallery viewing produces fewer ideas than rotational viewing.
The effects of adding sketches may be underestimated becausehe current method does not take into account the geometry, lay-ut, or overall configuration of the sketch. This type of informa-ion is frequently included in sketches but rarely in verbal descrip-ions. In addition, as engineers sketch, they tend to add manyetails that they may not include if they give a verbal descriptionf a device. For example, if an individual describes the use of a
ig. 20 A greater number of product solutions results in moreigh quality ones
otor and gear train to power a system, the drawing will fre-
31008-12 / Vol. 133, MARCH 2011
wnloaded 21 Jul 2012 to 128.83.63.20. Redistribution subject to ASME
quently include parts such as shafts, bearings, and supports, butwhen only a verbal description is used, these supporting detailsare not included.
All conditions in this experiment are virtually equal in terms ofvariety and novelty. Some very novel product solutions were pro-duced, but there is more potential in this area. Overall, teamsexplored only a fraction of the design space. Other idea generationmethods need to be sought in order to improve the variety andnovelty of the solutions.
In this experiment, all members of the team generated ideaswithout communicating during the first time period. This indepen-dent step may have led the teams to develop a similar variety ofproduct solutions regardless of the later communication modesresulting in an equal level of variety and novelty for all condi-tions. If this idea generation session had been compared withother idea generation techniques, such as Osborn’s brainstorming,the results may be different.
Gallery viewing produces more global product solutions andmore high quality product solutions but overall fewer single func-tional ideas. McKoy et al. �65� also found that sketches result inhigher quality product solutions than sentential descriptions. Incontrast, rotational viewing produces fewer global product solu-tions and fewer high quality product solutions but an overallgreater number of ideas per function. The difference in number ofhigh quality approaches statistical significance �p=0.14�. The ro-tational conditions use a smaller number of product solutions tospan the same fraction of the design space as the gallery condi-tions, where the average diversity for each product solution isgreater. This result suggests that an improved process for ideageneration consists of first using a gallery communication methodto generate a large number of high quality product solutions andthen moving to a rotational viewing method using words andsketches to develop the details of the product solutions and a largenumber of functional ideas.
6.2 Question 2: Does the Modality of Representation In-teract With the Display Method or Are They VirtuallyIndependent? Representation and the viewing method interactfor the quantity of ideas but not for the other metrics. This inter-action reflects that the sketches only conditions follow a differentpattern of results compared with the other conditions. Rotationalviewing produced more ideas when there were words in the rep-resentation but fewer ideas when there were only sketches. Onehypothesis is that regardless of representation, rotational viewingencourages the participants to spend more time understandingother teammate’s ideas. Unfortunately, the results of this effortvary based on representation. In the sketches only conditions, thisprocess has a detrimental effect because the sketches without anyverbal descriptions may be difficult to interpret, and thereforemore effort is applied to understanding, to the detriment of gen-erating more ideas. In general, engineers are not taught to draw,and their skill in sketching may be lacking. In contrast, the othertwo representations are relatively straightforward to interpret, andless time is spent in attempting to interpret the ideas, and thusmore ideas are produced.
One reason why the sketches only conditions are different fromthose conditions in which subjects use words is that sketches tendto contain fewer general, abstract product solutions. Sketches maybe viewed as being more detailed and concrete, therefore placingconstraints on what the participants perceived to be allowablechanges, or the physical extent of the product solution. If so, thensketches may bias participants toward making less radical changesto the product solutions than are made to product solutions de-scribed in words. Another possible hypothesis for the differencesis that sketches are vaguer than words, and so they produce moreunintended interpretations. In linguistics, vagueness reflects thedegree to which a given statement is open to different interpreta-tions. These hypotheses, and particularly the role of vagueness in
sketches, should be the subject of future research.Transactions of the ASME
license or copyright; see http://www.asme.org/terms/Terms_Use.cfm
PRStqtfisttbcpq
egdtgctfpdi
7
pMFaasppqata
tWFaasatphfaheisFv
Atlqn�
J
Do
6.3 Question 3: Are Certain Representations Better forroducing or Improving the Quality of Solutions? Do Certainepresentations Cause Bias Toward Certain Types of Productolutions? The average quality is similar across conditions, but
he sketches only conditions result in a greater number of highuality product solutions. One possible reason for this result ishat there are certain categories of product solutions that are dif-cult to draw. Participants may have thought of these productolutions then did not attempt to draw them, refocusing their at-ention on product solutions that they could sketch. For this par-icular problem, these difficult-to-draw product solutions tend toe of lower quality, including product solutions such as usinghemicals to dissolve the shells and genetically modifying theeanuts. The “sketching only” condition acts to filter out these lowuality solutions by virtue of the difficulty in embodying them.
Some information, particularly abstract product solutions, isasier to convey in words, whereas other information, such aseometry and configuration, tends to be easier to convey withrawings. Most design problems involve a combination of thesewo types of information. In addition, verbal overshadowing sug-ests that conditions using written words may have a disadvantageompared with using only sketches. The verbalization of percep-ual information can interfere with the retrieval of perceptual in-ormation from memory. The verbal overshadowing effect has theotential to make it difficult to retrieve information on how aevice moves and related pieces of highly visual information thats difficult to verbalize.
Discussion of Additional Results
7.1 Does Building off Teammate’s Product Solution Im-rove the Quality of the Product Solution? How Does Addingodifications to a Design Compare With More Drastic Links
rom One Product Solution to the Next? Product solutions thatre added to tend to be better product solutions. As ideas aredded, there is potential for significant improvement in a productolution’s overall completeness and quality �Fig. 9�. When a com-letely new product solution is built from a previous one, thisrocess usually produces new product solutions that are equal inuality to the old product solution. High quality product solutionsre linked much more frequently than lower quality ones, showinghat as teams build from others’ ideas, there is an implicit evalu-tion taking place.
7.2 How Do the Contributions of the Individuals Beforehe Product Solutions Are Shared With the Group Compare
ith the Number of Ideas the Group Generates by Buildingrom These Initial Product Solutions? A large number of ideasre developed when individuals work alone. Teams are likewiseble to develop a significant number of ideas by sharing productolutions �Fig. 14�. Therefore, both individual and group worksre important in the idea generation process. The number of ideaseams produced during time period 5 is equal to that during timeeriods 2–4, indicating that the participants’ ideas are not ex-austed by time period 5 �Fig. 13�. Open questions include theollowing: What are the reasons engineering teams choose to stop,t what point and for what reasons would these student teamsave chosen to end the idea generation session? What criteria dongineering teams use when deciding to stop developing ideas? Ist when a feasible product solution is found or due to time con-traints? These questions are the topics for future investigations.urther work needs to be completed to determine how long indi-iduals should work alone prior to sharing their ideas.
7.3 Seeking a Large Quantity of Product Solutions tochieve High Quality. Teams with a greater number of ideas
ended to produce more high quality product solutions. The guide-ine to produce a large quantity of ideas in order to achieve highuality is supported by these data. Anecdotal evidence in engi-eering design also strongly suggests that the two are correlated
61,62�. Early brainstorming studies also find this to be true �48�.ournal of Mechanical Design
wnloaded 21 Jul 2012 to 128.83.63.20. Redistribution subject to ASME
More recent work with electronic brainstorming agrees with thisbut cautions that quality may not always track quantity �63�.
8 ConclusionCreativity and innovation are significant driving factors in en-
gineering design and are what draws many individuals to the pro-fession. To support innovation, we must seek improved methodsfor idea generation. This paper addresses important elements ofthe idea generation, or ideation, process. While past research inpsychology, engineering design, and other fields has included hu-man studies in idea creation, there is still much to be learnedabout the underlying factors of many of the popular idea genera-tion techniques. A number of anecdotes exist about the advantagesand disadvantages of the techniques, and some quantitative resultsalso exist that address the aggregate methods in a group setting.By using a systematic approach, we identify key factors that dif-ferentiate the methods and that may be exploited to create moreeffective techniques.
We have uncovered a number of important insights. The choiceof group idea generation method significantly affects the totalquantity of ideas generated as well as the number of high qualityconcepts generated, but no significant effects for either novelty orvariety. Over the 40 min session, 50% more ideas are generatedusing rotational viewing combined with ideas being describedwith words and sketches compared with using only words anddisplaying them “gallery style.” This experimental condition cor-responds to a hybrid 6-3-5/C-sketch method and should be taughtto engineers. In contrast, more high quality concepts result whenall product solutions are displayed on the wall, gallery viewing,and represented using only sketches. These results suggest an im-proved process for idea generation consisting of first using a gal-lery communication method to generate a large number of highquality product solutions and then moving to a rotational viewingmethod using words and sketches to develop the details of theproduct solutions and a large number of ideas.
This study also shows that both individual and group interac-tions are important in the idea generation process. As group mem-bers add ideas, the overall product solution becomes more com-plete and improves in quality. Participants do not simply createtheir own product solutions in isolation. An equal or greater num-ber of new ideas are developed that build upon or are directlyinfluenced by other group members. Engineers need to be taughtthe importance of both individual and group idea generation. Thatvisualizing others’ ideas produces even more ideas is not just ananecdote. Our data show that group member’s ideas “spark” othermembers to a greater level of productivity.
9 Future WorkA design team must have confidence that it has found very good
and innovative solutions to its design problem. An encompassingexploration of the design space increases the probability of thisoutcome. In general, teams explore only a segment of the totaldesign space, and the methods tested do not differ in the breadthof search that they encourage. One team did evaluate a greaterdiversity of product solutions, showing that it is possible given theshort time period of the experiment. Future work will focus onapproaches to encourage design teams to more fully explore thedesign space and find more novel solutions. New analogy-baseddesign methods have the potential to greatly enhance novelty andvariety �58,66–72�. These new methods will be based on a deepunderstanding of the semantic and visual representations’ influ-ence on the design-by-analogy process. Systematic studies ofanalogy retrieval and use in the design process will be undertaken�58,70�. The use of functional models and other approaches forproblem definition and representation in the design-by-analogyprocess will also be investigated. The final product will be a ro-bust design-by-analogy search methodology capable of identify-ing nonobvious conceptual analogies resulting in novel design so-
lutions.MARCH 2011, Vol. 133 / 031008-13
license or copyright; see http://www.asme.org/terms/Terms_Use.cfm

itmnss
A
ttt0ta
R
0
Do
Additional work to more fully understand the various availabledea generation methods and their effects over longer periods ofime is also required. Two factors are explored in this study, but
any more are present in the methods. Further evaluation iseeded to understand the influence of limiting communication toketches and to more fully explain the pattern of results for theketches only conditions.
cknowledgmentThe authors would like to acknowledge the support provided by
he Cullen Endowed Professorship in Engineering, a fellowship inhe IC2 Institute to A.B.M., The University of Texas at Austin, andhe National Science Foundation under Grant No. CMMI-555851. The authors would also like to acknowledge Dr. Mat-hew Green’s assistance with the quantity of ideas measurementnd suggestions on improving the metric.
eferences�1� Römer, A., Weißhahn, G., and Hacker, W., 2001, “Effort-Saving Product Rep-
resentations in Design—Results of a Questionnaire Survey,” Des. Stud.,22�6�, pp. 473–490.
�2� Adams, J. L., 1986, Conceptual Blockbusting, Perseus Books, Cambridge,MA.
�3� Vangundy, A. B., 1988, Techniques of Structured Problem Solving, Van Nos-trand Reinhold, New York.
�4� Higgins, J. M., 1994, 101 Creative Problem Solving Techniques, The NewManagement, Winter Park, FL.
�5� Osborn, A., 1957, Applied Imagination, Scribner, New York.�6� Altshuller, G. S., 1984, Creativity as an Exact Science, Gordon and Breach,
Luxembourg.�7� Lewis, A. C., Sadosky, T. L., and Connolly, T., 1975, “Effectiveness of Group
Brainstorming in Engineering Problem Solving,” IEEE Trans. Eng. Manage.,EM-22�3�, pp. 119–124.
�8� Mullen, B., Johnson, C., and Salas, E., 1991, “Productivity Loss in Brain-storming Groups: A Meta-Analytic Integration,” Basic Appl. Soc. Psych.,12�1�, pp. 3–23.
�9� Collins, A. M., and Loftus, E. F., 1975, “A Spreading-Activation Theory ofSemantic Priming,” Psychol. Rev., 82, pp. 407–428.
�10� Anderson, J. R., 1983, “A Spreading Activation Theory of Memory,” J. VerbalLearn. Verbal Behav., 22, pp. 261–295.
�11� Raaijmakers, J. G., and Shiffrin, R. M., 1981, “Search of AssociativeMemory,” Psychol. Rev., 88�2�, pp. 93–134.
�12� Perttula, M. K., and Liikkanen, L. A., 2006, “Structural Tendencies and Ex-posure Effects in Design Idea Generation,” Proceedings of the ASME DesignEngineering Technical Conference.
�13� Perttula, M., Krause, C., and Sipila, P., 2006, “Does Idea Exchange PromoteProductivity in Design Idea Generation?” CoDesign: International Journal ofCoCreation in Design and the Arts, 2�3�, pp. 125–138.
�14� Perttula, M., and Sipila, P., 2007, “The Idea Exposure Paradigm in Design IdeaGeneration,” J. Eng. Design, 18�1�, pp. 93–102.
�15� Gryskiewicz, S. S., 1988, “Trial by Fire in an Industrial Setting: A PracticalEvaluation of Three Creative Problem-Solving Techniques,” Innovation: ACross-Disciplinary Perspective, Norwegian University Press, Oslo, Norway,.
�16� Paulus, P. B., and Yang, H. C., 2000, “Idea Generation in Groups: A Basis forCreativity in Organizations,” Org. Behav. Hum. Decis. Process, 82�1�, pp.76–87.
�17� Van Der Lugt, R., 2002, “Brainsketching and How It Differs From Brainstorm-ing,” Creat. Innov. Manag., 11�1�, pp. 43–54.
�18� Shah, J. J., 1998, “Experimental Investigation of Progressive Idea GenerationTechniques in Engineering Design,” DETC ‘98, 1998 ASME Design Engineer-ing Technical Conferences.
�19� Shah, J. J., Kulkarni, S. V., and Vargas-Hernández, N., 2000, “Evaluation ofIdea Generation Methods for Conceptual Design: Effectiveness Metrics andDesign of Experiments,” ASME J. Mech. Des., 122, pp. 377–384.
�20� Shah, J. J., Smith, S. M., and Vargas-Hernandez, N., 2003, “Metrics for Mea-suring Ideation Effectiveness,” Des. Stud., 24�2�, pp. 111–134.
�21� Vidal, R., Mulet, E., and Gómez-Senent, E., 2004, “Effectiveness of the Meansof Expression in Creative Problem-Solving in Design Groups,” J. Eng. Design,15�3�, pp. 285–298.
�22� Otto, K., and Wood, K., 2001, Product Design: Techniques in Reverse Engi-neering and New Product Development, Prentice-Hall, Upper Saddle River,NJ.
�23� Shah, J. J., Vargas-Hernández, N., Summers, J. S., and Kulkarni, S., 2001,“Collaborative Sketching �C-Sketch�—An Idea Generation Technique for En-gineering Design,” J. Creat. Behav., 35�3�, pp. 168–198.
�24� Pahl, G., and Beitz, W., 1996, Engineering Design—A Systematic Approach,Springer, New York.
�25� Markman, A., 1999, Knowledge Representation, Lawrence Erlbaum Associ-ates, Mahwah, NJ.
�26� Wilson, M., 2002, “Six Views of Embodied Cognition,” Psychon. Bull. Rev.,
9�4�, pp. 625–636.31008-14 / Vol. 133, MARCH 2011
wnloaded 21 Jul 2012 to 128.83.63.20. Redistribution subject to ASME
�27� Goel, V., 1995, Sketches of Thought, MIT, Cambridge, MA.�28� Greer, J. L., Jensen, D. D., and Wood, K. L., 2004, “Effort Flow Analysis: A
Methodology for Directed Product Evolution,” Des. Stud., 25�2�, pp. 193–214.
�29� Prinz, J. J., and Barsolou, L. W., 2002, “Acquisition and Productivity in Per-ceptual Symbol Systems: An Account of Mundane Creativity,” Creativity,Cognition, and Knowledge: An Interaction, Praeger, Westport, CT.
�30� Suwa, M., and Tversky, B., 1996, “What Architects See in Their Sketches:Implications for Design Tools,” Human Factors in Computing Systems: Con-ference Companion, Association for Computing Machinery �ACM�.
�31� Suwa, M., and Tversky, B., 1997, “What Do Architects and Students Perceivein Their Design Sketches? A Protocol Analysis,” Des. Stud., 18�4�, pp. 385–403.
�32� Goldschmidt, G., and Smolkov, M., 2006, “Variances in the Impact of VisualStimuli on Design Problem Solving Performance,” Des. Stud., 27�5�, pp. 549–569.
�33� Paivio, A., 1986, Mental Representations: A Dual Coding Approach, OxfordUniversity Press, New York.
�34� Mandler, G., 1980, “Recognizing: The Judgment of Previous Occurrence,”Psychol. Rev., 87, pp. 252–271.
�35� Loftus, G. R., and Kallman, H. J., 1979, “Encoding and Use of Detail Infor-mation in Picture Recognition,” J. Exp. Psychol. �Hum Learn�, 5, pp. 197–211.
�36� Bartlett, J. C., Till, R. E., and Leavy, J. C., 1980, “Retrieval Characteristics ofComplex Pictures: Effects of Verbal Encoding,” J. Verbal Learn. Verbal Be-hav., 19, pp. 430–449.
�37� Schooler, J. W., Fiore, S. M., and Brandimonte, M. A., 1997, “At a Loss FromWords: Verbal Overshadowing of Perceptual Memories,” The Psychology ofLearning and Motivation, Academic, New York.
�38� Aiken, M., Vanjani, M., and Paolillo, J., 1996, “A Comparison of Two Elec-tronic Idea Generation Techniques,” Inf. Manage., 30, pp. 91–99.
�39� Jensen, D. D., Murphy, M. D., and Wood, K. L., 1998, “Evaluation and Re-finement of a Restructured Introduction to Engineering Design Course UsingStudent Surveys and MBTI Data,” ASEE Annual Conference.
�40� Jensen, D., and Bowe, M., 1999, “Hands-on Experiences to Enhance Learningof Design: Effectiveness in a Reverse Engineering/Redesign Context WhenCorrelated With MBTI and Vark Types,” ASEE Annual Conference.
�41� Jensen, D., Feland, J., Bowe, M., and Self, B., 2000, “A 6-Hats Based TeamFormation Strategy: Development and Comparison With an MBTI Based Ap-proach,” ASEE Annual Conference.
�42� Jensen, D., and Wood, K., 2000, “Incorporating Learning Styles to EnhanceMechanical Engineering Curricula by Restructuring Courses, IncreasingHands-on Activities, and Improving Team Dynamics,” ASME Annual Confer-ence.
�43� Wood, K., Jensen, D., Bezdek, J., and Otto, K., 2001, “Reverse Engineeringand Redesign: Courses to Incrementally and Systematically Teach Design,” J.Eng. Educ., 90�3�, pp. 363–374.
�44� 2004, Thinkspace: Peanut Sheller, March, http://www.thinkcycle.org/tc-space/tspace?tspace_id�41963
�45� Diehl, M., and Stroebe, W., 1987, “Productivity Loss in BrainstormingGroups: Toward the Solution of a Riddle,” J. Pers. Soc. Psychol., 53�3�, pp.497–509.
�46� Baxter, M., 1995, Product Design: A Practical Guide to Systematic Methods ofNew Product Development, Chapman and Hall, London.
�47� Bouchard, T. J., Jr., 1969, “Personality, Problem-Solving Procedure, and Per-formance in Small Groups,” J. Appl. Psychol., 53�1�, pp. 1–29.
�48� Parnes, S. J., and Meadow, A., 1959, “Effects of ‘Brainstorming’ Instructionson Creative Problem Solving by Trained and Untrained Subjects,” J. Educ.Psychol., 50�4�, pp. 171–176.
�49� Delhagen, W., Hussam, S., Mohdramli, R., and Yi, A., 2003, A Low-CostPeanut Sheller for Use in Developing Nations: Final Application for Ideas,August 2006, http://web.mit.edu/ideas/www/past%20proposals/peanut.pdf
�50� 2006, Full Belly Project, August, http://www.fullbellyproject.org/�51� 2006, American Peanut Council, August, http://www.peanutsusa.com/
index.cfm?fuseaction�home.page&pid�12#Shelling_and_Grading�52� Linsey, J., Green, M. G., Murphy, J. T., Wood, K. L., and Markman, A. B.,
2005, “Collaborating to Success: An Experimental Study of Group Idea Gen-eration Techniques,” ASME Design Theory and Methodology Conference.
�53� Hirtz, J., Stone, R. B., and Mcadams, D. A., 2002, “A Functional Basis forEngineering Design: Reconciling and Evolving Previous Efforts,” Res. Eng.Des., 13, pp. 65–82.
�54� Stone, R., and Wood, K., 2000, “Development of a Functional Basis for De-sign,” ASME J. Mech. Des., 122�4�, pp. 359–370.
�55� Clark-Carter, D., 1997, Doing Quantitative Psychological Research: From De-sign to Report, Psychology, Taylor & Francis, Inc., UK.
�56� Jansson, D., and Smith, S., 1991, “Design Fixation,” Des. Stud., 12�1�, pp.3–11.
�57� Kurtoglu, T., Campbell, M., and Linsey, J., 2009, “An Experimental Study onthe Effects of a Computational Design Tool on Concept Generation,” Des.Stud., 30�6�, pp. 676–703.
�58� Linsey, J., Laux, J., Clauss, E. F., Wood, K., and Markman, A., 2007, “Increas-ing Innovation: A Trilogy of Experiments Towards a Design-by-AnalogyMethod,” ASME Design Theory and Methodology Conference.
�59� Howell, D. C., 2002, Statistical Methods for Psychology, Duxbury, PacificGrove, CA.
�60� Goldschmidt, G., and Weil, M., 1998, “Contents and Structure in Design Rea-
soning,” Design Issues, 14�3�, pp. 85–100.Transactions of the ASME
license or copyright; see http://www.asme.org/terms/Terms_Use.cfm

J
Do
�61� Ulrich, K., and Eppinger, S., 2004, Product Design and Development,McGraw-Hill, New York.
�62� Ullman, D., 1997, The Mechanical Design Process, McGraw-Hill, New York.�63� Briggs, R. O., Reinig, B. A., Shepherd, M. M., Yen, J., and Nunameker, J. F.,
1997, “Quality as a Function of Quantity in Electronic Brainstorming,” 30thHawaii International Conference on System Sciences.
�64� Ward, T. B., 1998, “Analogical Distance and Purpose in Creative Thought:Mental Leaps Versus Mental Hops,” Advances in Analogy Research: Integra-tion of Theory and Data From the Cognitive, Computational, and NeuralSciences, New Bulgarian University, Sofia, Bulgaria.
�65� McKoy, F. L., Vargas-Hernández, N., Summers, J. D., and Shah, J. J., 2001,“Influence of Design Representation on Effectiveness of Idea Generation,”DETC ‘01, 2001 ASME Design Engineering Technical Conferences.
�66� Christensen, B. T., and Schunn, C., 2007, “The Relationship of AnalogicalDistance to Analogical Function and Pre-Inventive Structures: The Case ofEngineering Design,” Mem. Cognit., 35�1�, pp. 29–38.
ournal of Mechanical Design
wnloaded 21 Jul 2012 to 128.83.63.20. Redistribution subject to ASME
�67� Gentner, D., and Markman, A. B., 1997, “Structure Mapping in Analogy andSimilarity,” Am. Psychol., 52, pp. 45–56.
�68� Casakin, H., and Goldschmidt, G., 1999, “Expertise and the Use of VisualAnalogy: Implications for Design Education,” Des. Stud., 20�2�, pp. 153–175.
�69� Ball, L. J., Ormerod, T. C., and Morley, N. J., 2004, “Spontaneous Analogisingin Engineering Design: A Comparative Analysis of Experts and Novices,” Des.Stud., 25�5�, pp. 495–508.
�70� Linsey, J., Murphy, J. T., Wood, K. L., Markman, A. B., and Kurtoglu, T.,2006, “Representing Analogies: Increasing the Probability of Success,” ASMEDesign Theory and Methodology Conference.
�71� McAdams, D. A., and Wood, K. L., 2002, “A Quantitative Similarity Metricfor Design-by-Analogy,” ASME J. Mech. Des., 124�2�, pp. 173–182.
�72� Linsey, J., Tseng, I., Fu, K., Cagan, J., Wood, K., and Schunn, C., 2010, “AStudy of Design Fixation, Its Mitigation and Perception in Engineering DesignFaculty,” ASME J. Mech. Des., 132�4�, p. 041003.
MARCH 2011, Vol. 133 / 031008-15
license or copyright; see http://www.asme.org/terms/Terms_Use.cfm