Embed Size (px)
Citation preview

An experimental research on the flow field of water entry by pressure measurementsHong-Hui Shi and Makoto Kume
Citation: Physics of Fluids (1994-present) 13, 347 (2001); doi: 10.1063/1.1329907 View online: http://dx.doi.org/10.1063/1.1329907 View Table of Contents: http://scitation.aip.org/content/aip/journal/pof2/13/1?ver=pdfcov Published by the AIP Publishing Articles you may be interested in Experimental study of rarefied gas flow near sudden contraction junction of a tube Phys. Fluids 26, 062002 (2014); 10.1063/1.4881940 Experimental research of gas flows through isothermal and non-isothermal membranes AIP Conf. Proc. 1501, 824 (2012); 10.1063/1.4769627 Turbulent mixing measurements in the Richtmyer-Meshkov instability Phys. Fluids 24, 074105 (2012); 10.1063/1.4733447 Pressure-driven capillary viscometer: Fundamental challenges in transient flow viscometry Rev. Sci. Instrum. 82, 125111 (2011); 10.1063/1.3671572 Development and characterization of fast responding pressure sensitive microspheres Rev. Sci. Instrum. 79, 074102 (2008); 10.1063/1.2952502
This article is copyrighted as indicated in the article. Reuse of AIP content is subject to the terms at: http://scitation.aip.org/termsconditions. Downloaded to IP:
130.238.7.43 On: Sun, 05 Oct 2014 13:03:19
PHYSICS OF FLUIDS VOLUME 13, NUMBER 1 JANUARY 2001
This a
An experimental research on the flow field of water entry by pressuremeasurements
Hong-Hui Shi and Makoto KumeDepartment of Mechanical Engineering, Nagoya Institute of Technology, Gokiso-cho, Showa-ku,Nagoya 466-8555, Japan
~Received 14 February 2000; accepted 27 September 2000!
The underwater acoustic field in water entry of a 352 m/s blunt body has been investigated bypressure measurements. The experimental results show that from the initial stage to the later stageof water entry, there are:~1! a high peak pressure caused by the compressible behavior in high speedsolid/liquid impact; ~2! a negative pressure region caused by the expansion waves which aregenerated when the initial primary shock wave detaches from the solid body and the high pressureregion is released; and~3! a significant motion of the fluid particles driven by the shock wave. It isfound that at the entry velocity of this experiment, the shock wave behaves like an acoustic wavein water. The wave has a stronger energy distribution on the forward direction and a weaker energydistribution on the lateral direction. ©2001 American Institute of Physics.@DOI: 10.1063/1.1329907#
BRIEF COMMUNICATIONSThe purpose of this Brief Communications section is to present important research results of more limited scope than regulararticles appearing in Physics of Fluids. Submission of material of a peripheral or cursory nature is strongly discouraged. BriefCommunications cannot exceed four printed pages in length, including space allowed for title, figures, tables, references, and anabstract limited to about 100 words.
royedns
as
adensn
a
iner
ta.4f
haF
afac
iles.
aterasy.een
, thee
ro-ce
uslyro-of
aveveasore
e is
thers,thed the
the0.4
The water entry problem is considered as a classic plem in fluid mechanics because it has a research histormore than 70 years.1 The research was extensively motivatduring World War II for developing underwater weapoand high-speed ships~Richardson,2 May and Woodhull3!.Since then, the research of this topic was often treatedsubsidiary study of supercavitation around hydrofoils,4 sothat the uniqueness of water entry was not paid enoughtention. As a result, it is found that even for the same moconfiguration, the different correlations given by differeresearchers do not agree.5 The recent numerical simulationon water entry in ballistic range6,7 also raise the questiowhether those details neglected in the simulations arelowed.
Figure 1 shows the experimental setup for conductthe pressures measurements in water. A projectile was vcally fired downwards from an Anschuts rifle~made in Ger-many!. The projectile has 5.7 mm diam, 12.3 mm tolength, 2.67 g mass. It is lead slug with density of 11g/cm3. The ‘‘pistol match’’ slugs with the muzzle velocity o35265 m/s made by Dynamit Nobel~Germany! were used.The projectile enters a water tank of 60 cm360 cm380 cmmade from 5 mm thick stainless plates. The water tanktwo windows at each side for optical observation. A PVDneedle hydrophone~Mueller Ingeniertechnik 100/100/1, witha 0.5 mm diam sensitive element! was placed at a positionwhich had a radial distanceR from the impact center andwater depthH. The axis of the hydrophone has an angle oufrom the surface and is on the radiation line from the imp
1070-6631/2001/13(1)/347/3/$18.00 347
rticle is copyrighted as indicated in the article. Reuse of AIP content is sub
130.238.7.43 On: Sun, 0
b-of
a
t-l
t
l-
gti-
l
s
t
point. A Kistler pressure transducer~6205A! was also usedto detect the pressures in the cavities behind the projectTwo two-channel digitizing oscilloscopes~Sony TDS350Pand Hewlett Packard 52520A! were used alternatively torecord the pressure signals. The laser beam above the wsurface was for measuring the velocity of the projectilewell as for determing the beginning time of water entrBecause the length of the projectile and the distance betwthe laser beam and the water surface had been knownvelocity of the projectile could be calculated from the timinterval recorded in the oscilloscope. The time from the pjectile cutting the laser to its contacting on the water surfawas also determined. Since the oscilloscope simultaneorecorded both signals from the photodiode and the hydphone, therefore according to the time of the beginningwater entry and the time when the underwater shock wreached the hydrophone, the velocity of the shock wacould be calculated. Of course, the projectile velocity wexamined by the method of cutting two laser beams befthe pressure measurements.
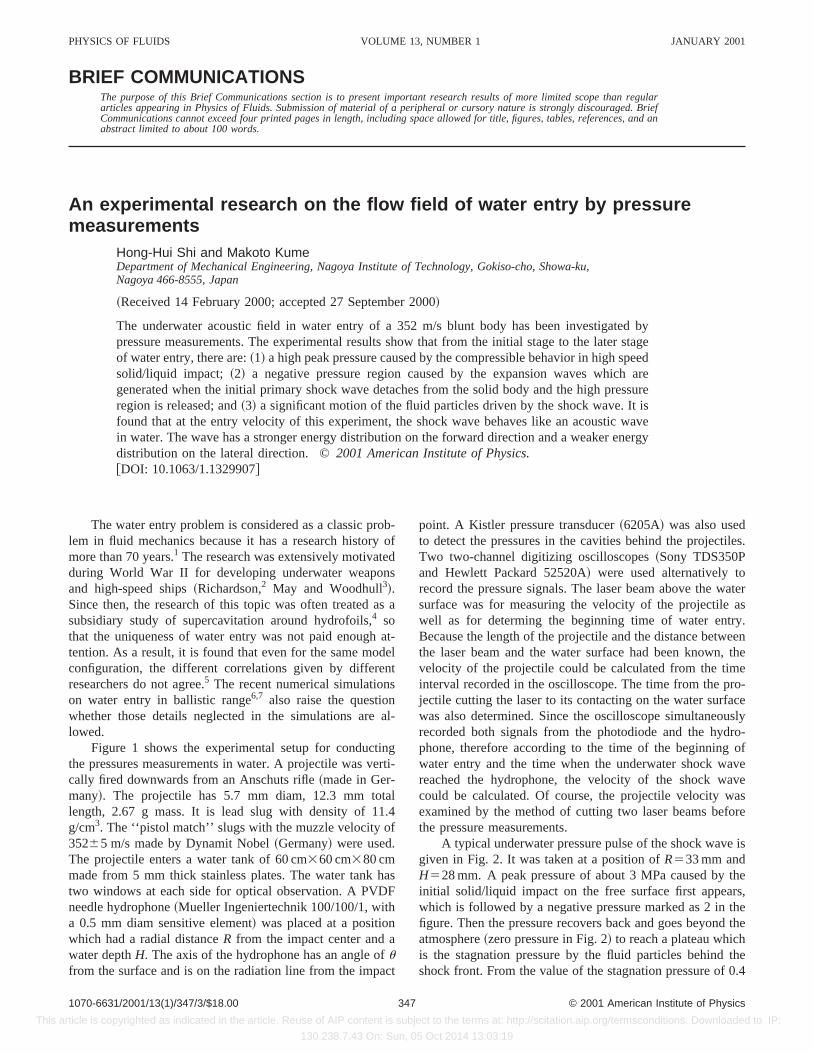
A typical underwater pressure pulse of the shock wavgiven in Fig. 2. It was taken at a position ofR533 mm andH528 mm. A peak pressure of about 3 MPa caused byinitial solid/liquid impact on the free surface first appeawhich is followed by a negative pressure marked as 2 infigure. Then the pressure recovers back and goes beyonatmosphere~zero pressure in Fig. 2! to reach a plateau whichis the stagnation pressure by the fluid particles behindshock front. From the value of the stagnation pressure of
© 2001 American Institute of Physics
ject to the terms at: http://scitation.aip.org/termsconditions. Downloaded to IP:
5 Oct 2014 13:03:19
tye
dt
te
pan-de-i-
hapeisvend,is
ro-the
ucer
e topeakcol-
ndonbythat
toen-ure
ss
ct
ho
vityurel
f the
348 Phys. Fluids, Vol. 13, No. 1, January 2001 H.-H. Shi and M. Kume
This a
MPa ~absolute!, it is known that the particles have a velociof 28 m/s. This practical velocity can not be ignored if somone wants to analyze the stability of the cavity wall.8 It hasbeen found that the stagnation pressure can last a perio0.2–0.3 s. The experimental evidence of the existence ofnegative pressure confirms the mathematical flow patproposed by Korobkin,9 that is, the shock front is followed
FIG. 1. Schematic water entry experiment and setup of underwater premeasurements.
FIG. 2. Pressure signal at the position ofR533 mm andH528 mm. Thenumbers mean:~1! shock wave generated from the initial solid/liquid impaon water surface;~2! negative pressure caused by expansion waves;~3!stagnation pressure induced by the moving fluid particles behind the swave.
rticle is copyrighted as indicated in the article. Reuse of AIP content is sub
130.238.7.43 On: Sun, 0
-
ofhern
by a negative pressure region which is caused by the exsion waves from the free surface after the shock wavetaches from the blunt body. Therefore it is possible to elimnate this negative pressure by choosing a proper nose sof the blunt body, for example, a sharp conical nose. Itunderstood from Fig. 2, that the motions of the shock waand the expansion wave are in a time order of microsecowhile the motion of the fluid particles behind the wavesalmost in a time order of second.
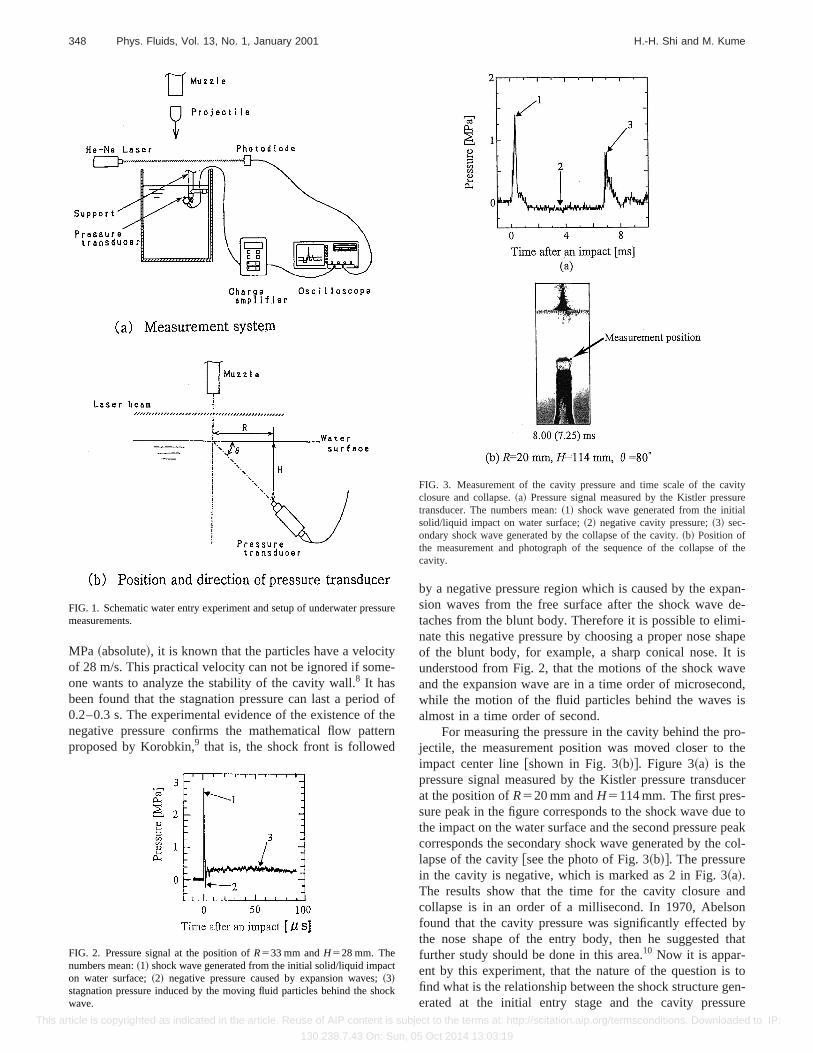
For measuring the pressure in the cavity behind the pjectile, the measurement position was moved closer toimpact center line@shown in Fig. 3~b!#. Figure 3~a! is thepressure signal measured by the Kistler pressure transdat the position ofR520 mm andH5114 mm. The first pres-sure peak in the figure corresponds to the shock wave duthe impact on the water surface and the second pressurecorresponds the secondary shock wave generated by thelapse of the cavity@see the photo of Fig. 3~b!#. The pressurein the cavity is negative, which is marked as 2 in Fig. 3~a!.The results show that the time for the cavity closure acollapse is in an order of a millisecond. In 1970, Abelsfound that the cavity pressure was significantly effectedthe nose shape of the entry body, then he suggestedfurther study should be done in this area.10 Now it is appar-ent by this experiment, that the nature of the question isfind what is the relationship between the shock structure gerated at the initial entry stage and the cavity press
ure
ck
FIG. 3. Measurement of the cavity pressure and time scale of the caclosure and collapse.~a! Pressure signal measured by the Kistler presstransducer. The numbers mean:~1! shock wave generated from the initiasolid/liquid impact on water surface;~2! negative cavity pressure;~3! sec-ondary shock wave generated by the collapse of the cavity.~b! Position ofthe measurement and photograph of the sequence of the collapse ocavity.
ject to the terms at: http://scitation.aip.org/termsconditions. Downloaded to IP:
5 Oct 2014 13:03:19
escmt.teth
susu
ofsunok
ero
r
ck
waria-ha-ro-
notdent.
arch
es-non.ocktheinofveshethererser-
thefic
for
Sci.
ys.
ing
ure
-
tion
vi-No.luids
.
’ J.
of
er
.
a
349Phys. Fluids, Vol. 13, No. 1, January 2001 Underwater pressure measurements of water entry
This a
formed at a later entry stage when the projectile has petrated deeper into water. Perhaps the negative presshown in Fig. 2 makes an important contribution to produa larger negative pressure inside the cavity because sbubble nuclei are existing in water before the experimen
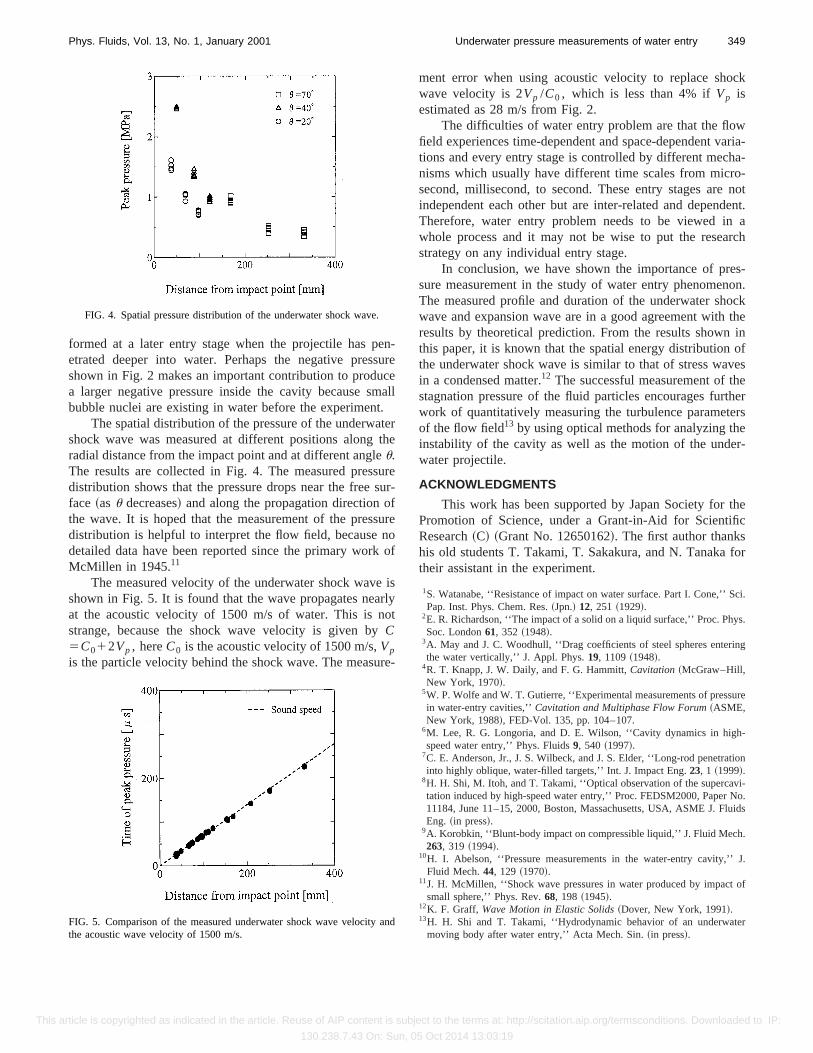
The spatial distribution of the pressure of the underwashock wave was measured at different positions alongradial distance from the impact point and at different angleu.The results are collected in Fig. 4. The measured presdistribution shows that the pressure drops near the freeface ~asu decreases! and along the propagation directionthe wave. It is hoped that the measurement of the presdistribution is helpful to interpret the flow field, becausedetailed data have been reported since the primary worMcMillen in 1945.11
The measured velocity of the underwater shock wavshown in Fig. 5. It is found that the wave propagates neaat the acoustic velocity of 1500 m/s of water. This is nstrange, because the shock wave velocity is given byC5C012Vp , hereC0 is the acoustic velocity of 1500 m/s,Vp
is the particle velocity behind the shock wave. The measu
FIG. 4. Spatial pressure distribution of the underwater shock wave
FIG. 5. Comparison of the measured underwater shock wave velocitythe acoustic wave velocity of 1500 m/s.
rticle is copyrighted as indicated in the article. Reuse of AIP content is sub
130.238.7.43 On: Sun, 0
n-ureeall
re
rer-
re
of
islyt
e-
ment error when using acoustic velocity to replace showave velocity is 2Vp /C0 , which is less than 4% ifVp isestimated as 28 m/s from Fig. 2.
The difficulties of water entry problem are that the flofield experiences time-dependent and space-dependent vtions and every entry stage is controlled by different mecnisms which usually have different time scales from micsecond, millisecond, to second. These entry stages areindependent each other but are inter-related and depenTherefore, water entry problem needs to be viewed inwhole process and it may not be wise to put the reseastrategy on any individual entry stage.
In conclusion, we have shown the importance of prsure measurement in the study of water entry phenomeThe measured profile and duration of the underwater shwave and expansion wave are in a good agreement withresults by theoretical prediction. From the results shownthis paper, it is known that the spatial energy distributionthe underwater shock wave is similar to that of stress wain a condensed matter.12 The successful measurement of tstagnation pressure of the fluid particles encourages furwork of quantitatively measuring the turbulence parametof the flow field13 by using optical methods for analyzing thinstability of the cavity as well as the motion of the undewater projectile.
ACKNOWLEDGMENTS
This work has been supported by Japan Society forPromotion of Science, under a Grant-in-Aid for ScientiResearch~C! ~Grant No. 12650162!. The first author thankshis old students T. Takami, T. Sakakura, and N. Tanakatheir assistant in the experiment.
1S. Watanabe, ‘‘Resistance of impact on water surface. Part I. Cone,’’Pap. Inst. Phys. Chem. Res.~Jpn.! 12, 251 ~1929!.
2E. R. Richardson, ‘‘The impact of a solid on a liquid surface,’’ Proc. PhSoc. London61, 352 ~1948!.
3A. May and J. C. Woodhull, ‘‘Drag coefficients of steel spheres enterthe water vertically,’’ J. Appl. Phys.19, 1109~1948!.
4R. T. Knapp, J. W. Daily, and F. G. Hammitt,Cavitation~McGraw–Hill,New York, 1970!.
5W. P. Wolfe and W. T. Gutierre, ‘‘Experimental measurements of pressin water-entry cavities,’’Cavitation and Multiphase Flow Forum~ASME,New York, 1988!, FED-Vol. 135, pp. 104–107.
6M. Lee, R. G. Longoria, and D. E. Wilson, ‘‘Cavity dynamics in highspeed water entry,’’ Phys. Fluids9, 540 ~1997!.
7C. E. Anderson, Jr., J. S. Wilbeck, and J. S. Elder, ‘‘Long-rod penetrainto highly oblique, water-filled targets,’’ Int. J. Impact Eng.23, 1 ~1999!.
8H. H. Shi, M. Itoh, and T. Takami, ‘‘Optical observation of the supercatation induced by high-speed water entry,’’ Proc. FEDSM2000, Paper11184, June 11–15, 2000, Boston, Massachusetts, USA, ASME J. FEng. ~in press!.
9A. Korobkin, ‘‘Blunt-body impact on compressible liquid,’’ J. Fluid Mech263, 319 ~1994!.
10H. I. Abelson, ‘‘Pressure measurements in the water-entry cavity,’Fluid Mech.44, 129 ~1970!.
11J. H. McMillen, ‘‘Shock wave pressures in water produced by impactsmall sphere,’’ Phys. Rev.68, 198 ~1945!.
12K. F. Graff, Wave Motion in Elastic Solids~Dover, New York, 1991!.13H. H. Shi and T. Takami, ‘‘Hydrodynamic behavior of an underwat
moving body after water entry,’’ Acta Mech. Sin.~in press!.nd
ject to the terms at: http://scitation.aip.org/termsconditions. Downloaded to IP:
5 Oct 2014 13:03:19