Embed Size (px)
Citation preview
An Economic Analysis of the Deepwater Horizon Economic Settlement
by
Cantrell Norman
A thesis submitted to the faculty of the University of Mississippi in partial fulfillment of
the requirements of the Sally McDonnell Barksdale Honors College.
Oxford
May 2017

© 2017
Cantrell Gideon Macon Norman
ALL RIGHTS RESERVED
ii

This thesis is dedicated to my parents, Fabienne and Cooper Norman.
Who, despite having to close their practice as a result of the oil spill, always provided for
us.
iii
Acknowledgements
I express gratitude to my advisor Dr. David Fragoso Gonzalez for countless hours of his
time ensuring the successful completion of this project. His class on international trade
economics, taken prior to the start of this project, nurtured a growing fascination with
economics and a subsequent desire to add my own contribution to the field. His
constructive criticism and unwavering support were vital to the creation of a cohesive and
coherent thesis.
I also express gratitude to my second advisor Dr. Thomas Garrett. He provided
invaluable insight on the procurement of data and statistical analysis. His course, taken at
the beginning of my undergraduate career, was an excellent introduction to the field of
economics. It was also through his encouragement that I pursued studies in econometrics,
which have been crucial for the completion of this project. The original quantitative
model and methodology employed in this project are largely thanks to his direction.
Without both of their knowledge and guidance, this project would not have been possible.
I thank Dr. Mark Van Boening for his genuine interest and his concentrated effort to
make this a more complete work. I am extremely grateful for his time.
iv
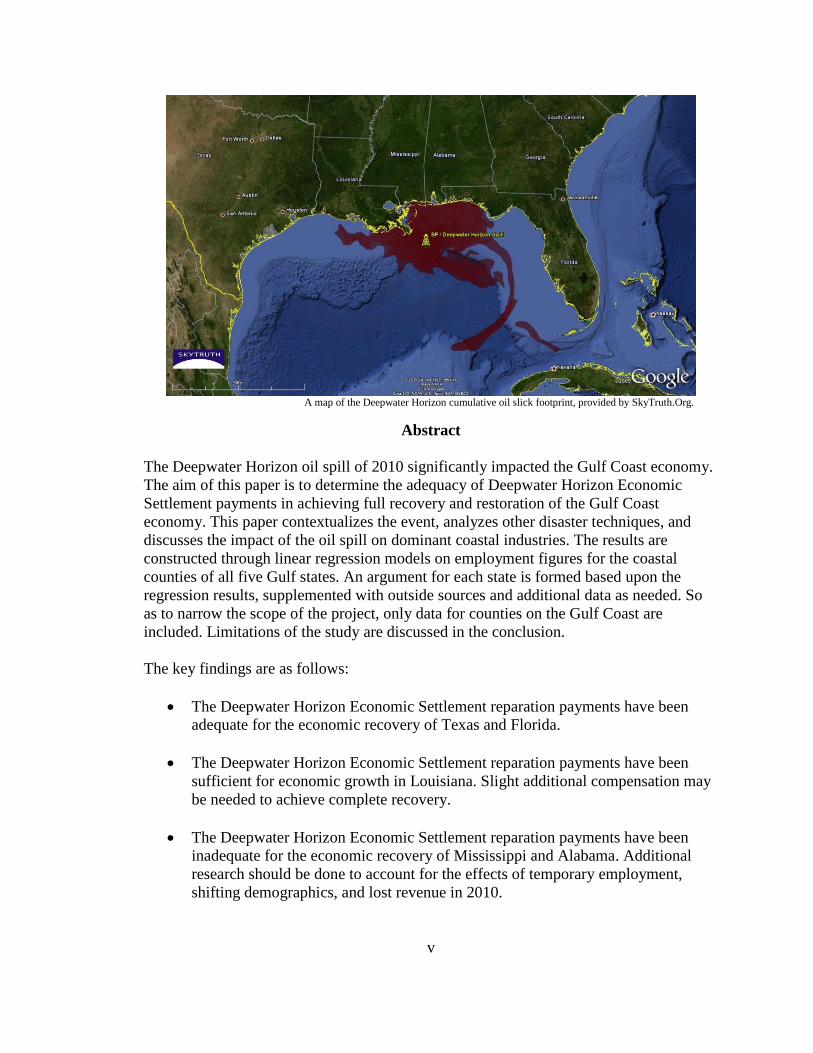
A map of the Deepwater Horizon cumulative oil slick footprint, provided by SkyTruth.Org.
Abstract
The Deepwater Horizon oil spill of 2010 significantly impacted the Gulf Coast economy.
The aim of this paper is to determine the adequacy of Deepwater Horizon Economic
Settlement payments in achieving full recovery and restoration of the Gulf Coast
economy. This paper contextualizes the event, analyzes other disaster techniques, and
discusses the impact of the oil spill on dominant coastal industries. The results are
constructed through linear regression models on employment figures for the coastal
counties of all five Gulf states. An argument for each state is formed based upon the
regression results, supplemented with outside sources and additional data as needed. So
as to narrow the scope of the project, only data for counties on the Gulf Coast are
included. Limitations of the study are discussed in the conclusion.
The key findings are as follows:
• The Deepwater Horizon Economic Settlement reparation payments have been
adequate for the economic recovery of Texas and Florida.
• The Deepwater Horizon Economic Settlement reparation payments have been
sufficient for economic growth in Louisiana. Slight additional compensation may
be needed to achieve complete recovery.
• The Deepwater Horizon Economic Settlement reparation payments have been
inadequate for the economic recovery of Mississippi and Alabama. Additional
research should be done to account for the effects of temporary employment,
shifting demographics, and lost revenue in 2010.
v
Table of Contents 1. Introduction............................................................................................................. 1
2. Literature Review.................................................................................................... 4
2.a. Social Milieu and Context
2.b. Disaster Analysis Approaches
3. Composition of the Gulf Coast Economy............................................................... 8
3.a. Petrochemicals and Energy
3.b. Tourism
3.c. Fishing and Shipping
3.d. Aerospace
3.e. Summary
4. Model Design........................................................................................................ 22
4.a. Methodology
4.b. Scope
5. Regressions and Findings..................................................................................... 27
5.a. Texas
5.b. Louisiana
5.c. Mississippi
5.d. Alabama
5.e. Florida
6. Conclusion............................................................................................................ 35
References
vi
List of Tables
Table 1: 2011 Economic Impacts of the Gulf of Mexico Seafood Industry..................... 16
Table 2: Texas Regression Results................................................................................... 27
Table 3: Louisiana Regression Results............................................................................. 29
Table 4: Mississippi Regression Results........................................................................... 31
Table 5: Alabama Regression Results.............................................................................. 34
Table 6: Florida Regression Results................................................................................. 36
vii
List of Figures
Figure 1: Gulf of Mexico Annual Oil Production (2005-2016)........................................ 10
Figure 2: Mississippi Coastal Counties' Annual Gaming Revenue (2008-2016)............. 12
Figure 3: Alabama Gulf Coast Total Tourism Expenditures (2007-2015)....................... 13
Figure 4: Annual Visitors to Florida (2000-2016)............................................................ 15
Figure 5: Gulfport-Biloxi International Airport Total Passengers (2000-2015)............... 19
Figure 6: New Orleans International Airport Deplaned Passengers (2004-2016)............ 19
Figure 7: Multiple Linear Regression Equations.............................................................. 22
Figure 8: Coastal Counties in BP's Affected Zone Map................................................... 26
Figure 9: Cumulative Payments from the Deepwater Horizon Economic Settlement..... 26
viii
1
1. Introduction
On the morning of April 20, 2010, British Petroleum (BP) was in the final stages
of its large-scale engineering project on the Macondo Prospect. After 74 days of drilling,
the semi-submersible Deepwater Horizon offshore oil rig, positioned 48 miles off the
coast of Louisiana, was sealing its completed oil well approximately 18,000 feet deep. In
what was a low-probability, high-consequence event, a combination of mud, oil, natural
gas, and water surged up the drill pipe. The emergency blowout preventers failed to
deploy and the Deepwater Horizon well leaked 200 million gallons of crude oil into the
Gulf of Mexico. The well was not closed until September 19, 2010, resulting in the
largest offshore oil spill in United States history.
The oil flooded the Gulf of Mexico creating serious ecological and health hazards
at the start of what is usually a prosperous tourist season for the Gulf Coast. The
economic implications were considerable. Tourists did not come visit the attractions,
fishermen and shrimpers could not sell tainted seafood, property prices fell, vessels and
ecosystems were damaged or destroyed. Consequently, consumer demand and economic
activity faltered. Small and big business-owners alike, in seemingly unrelated industries,
had to close their businesses. The Gulf Coast economy was affected across the board.
The Deepwater Horizon oil spill had profound impact on the livelihoods of people
located along the Gulf Coast. Litigation for damages commenced almost immediately.
Starting in June 2010, BP managed individual and business claims through the Gulf
Coast Claims Facility. However, in 2012, with an FBI investigation finding the internal
2
claims process inefficient, the Gulf Coast Claims Facility was replaced by an external,
court-supervised settlement trust program. The Department of Justice (DOJ) also filed
civil and criminal suit against BP and partners -- Transocean and Halliburton -- for gross
negligence and willful misconduct. In addition, local, state, and federal government
entities sued for environmental damage, economic loss, and regulatory infractions. In the
spill's aftermath, BP and partners have paid approximately $4.525 billion in DOJ fines,
$42.2 billion to the Deepwater Horizon Oil Spill Trust, and $18.7 billion for local, state,
and federal claims. The deadline for individual and business claims passed in June of
2015.
While the claims review process for business and individuals remains as of yet
unfinished (< 1.6% remaining as of February 2017), these reparation payments have been
important for compensating economic loss.1 As of 2017, the implications of the oil spill
are still felt along the Gulf Coast, with reports that a flourishing coastal wildlife only
began returning seven years later. The aim of this paper is to determine whether these
Deepwater Horizon Economic Settlement payments to individuals and businesses have
been adequate for achieving full recovery and restoration of the Gulf Coast economy.
As employment is an important measure of the health of an economy, the
employment rate is used to indicate Gulf Coast economic recovery. The results are
constructed through linear regression models on employment figures, provided by the
Bureau of Labor Statistics, for the coastal counties of all five Gulf states. An argument
for each state is formed based off of the regression results, supplemented with outside
sources and additional data as needed. So as to narrow the scope of the project, only data
for counties on the Gulf Coast are included.
1 http://www.deepwaterhorizoneconomicsettlement.com/docs/Court_Status_Report_No_53.pdf
3
The findings are that the Deepwater Horizon Economic Settlement reparation
payments have been adequate for the economic recovery of Texas and Florida. The
findings also show the Deepwater Horizon Economic Settlement reparation payments
have been sufficient for economic growth in Louisiana; slight additional compensation
may be needed to achieve complete recovery. Lastly, the findings are that the Deepwater
Horizon Economic Settlement reparation payments have been inadequate for the
economic recovery of Mississippi and Alabama. Although, additional research should be
done to account for the effects of temporary employment, shifting demographics, and lost
revenue in 2010.
In Section 2, literature relevant to the Deepwater Horizon oil spill is reviewed.
There are two subsections. The first subsection discusses context and social reaction to
the event. The second subsection reviews other disaster analysis approaches. In Section 3,
the composition of the Gulf Coast economy is described. This section lists the dominant
industries most important to the region and the impacts to those industries from the spill.
In Section 4, the methodology and scope of this study are described. In Section 5, the
linear regression results are provided. An interpretation of those results is made for each
Gulf Coast state. In Section 6, a conclusion on the adequacy of Deepwater Horizon
reparation payments for each Gulf Coast state is made.
4
2. Literature Review
2.a. Social Milieu and Context
The aim of this section is to provide context for events surrounding the British
Petroleum oil spill. To the best of the author's knowledge, there has been no in-depth
economic study or critique of the adequacy of BP reparation payments. The majority of
publications and reports instead focus on psychological effects and environmental
impacts of the event. These topics are largely outside the scope of this project, although
there is some room for relevant discussion.
As psychology plays a central role in economic decision making, an evaluation of
psychological factors and how they affect consumers along the Gulf Coast is important.
Grattan et al. (2011) set out to measure the early psychological impacts to fishing
communities in Alabama and Florida, using a community-based participatory research
model with agencies and leaders from Baldwin and Franklin counties. They investigate
acute psychological distress and personal resources for adjustment and adaptation of local
residents. While the primary focus of their report is related to public health, they found
that economic resource loss is associated with long-term psychological and mental health
symptoms and that people at risk of income loss should be specifically targeted for
financial counseling and support. Participants with spill-related income loss are prone to
using behavioral disengagement as a coping strategy -- a counterproductive strategy.
They also found that although oil never reached Franklin County in Florida, fears about
5
seafood safety led to a dramatic reduction in local seafood harvesting, forcing layoffs in
packing houses and transportation because of a lack of product.
The BP oil spill of 2010 resulted in the contamination of the second most
productive fishery in the United States due to oil and chemical dispersants. After the
Deepwater Horizon rig sank, there was an immediate response made by state and federal
agencies to ensure seafood safety. These efforts included developing risk criteria and
establishing thresholds for allowable levels of contaminants, which in turn led to an
almost year-long ban on fishing along the Gulf Coast. "For an area to be reopened to
fishing, it had to meet three criteria: be free of oil for at least 30 days, be free of expected
oil for the next 72 hours based on model trajectories, and pass repeated tests on different
types of seafood (fish and crustaceans) sampled over multiple days for PAHs and DOSS
(the dispersant component of greatest potential concern)."2 While these safeguards were
needed to protect public health, many ecologists thought government entities had not
gone far enough. Rotkin-Ellman et al. (2012) find that Food & Drug Administration
guidelines were too lenient and significantly underestimated seafood contaminants. With
all of the uncertainty, many consumers were simply not willing to risk eating Gulf
seafood. This represented a significant issue as fishing is an important industry and way
of life for the Gulf Coast economy.
2.b. Disaster Analysis Approaches
There are a number of economic market impact studies on natural disasters and
man-made catastrophes. A comparative assessment of other projects' methodologies
regarding disaster analysis is useful for the approach used in this analysis. In particular,
Hurricane Katrina and the Exxon Valdez oil spill had characteristics and consequences
2 Lubchenco et al., "Science in Support of the Deepwater Horizon Response", 2012, pg. 20216.
6
similar to the BP oil spill. As similarities exist between the events, a review of these
disasters is provided in this section.
Hurricane Katrina made landfall on August 29, 2005. Recognized as one of the
worst natural disasters to occur in the southeastern United States, it devastated the Gulf
Coast economy, ecology, and population. Vigdor's (2008) economic analysis, focusing
specifically on the city of New Orleans, takes as a benchmark the pre-Katrina population
and industry employment levels. He utilizes public government labor market statistics
relating to employment, average weekly wage, and labor force participation rates to
supply evidence of the impact of Katrina in the greater New Orleans area. Vigdor asserts,
"Hurricane Katrina changed not only the size but the composition of the city's
population" (pg. 145) which had important contributive effects to economic recovery.
The U.S. Department of Commerce report (2007), prepared by the Economics and
Statistics Administration (ESA), analyzes post-hurricane economic recovery by the
amount of disaster relief paid in the form of individual and public assistance (direct cash
payments or preferential tax treatment from the 2005 Gulf Opportunity Zones Act),
housing recovery by number of occupied housing units, and industry output by share of
aggregate real GDP. Similar to Vigdor, the ESA makes note of pre-Katrina population
and labor force levels but also studies the value of exports from and imports into the Gulf
Coast. Disaster relief cash outlays from the government seem to signify ongoing need
while the end of disaster relief outlays might suggest a full or acceptable level of
economic recovery. The ESA study finds that in the two years after Hurricanes Katrina
and Rita, significant economic recovery was evident in Louisiana and Mississippi.
7
However, economic conditions in the New Orleans, Louisiana and Gulfport-Biloxi,
Mississippi metropolitan areas continue to lag behind.
Cohen (1995), who specifically "...addresses the matter of economic losses from
technological disasters by focusing on coastal oil spills" (pg. 65), measures the social
costs of the Exxon Valdez oil spill for south-central Alaskan fisheries. She does so by
creating a proprietary model on transaction values. "In order to formulate this estimate it
is necessary to determine the harvest volumes and ex-vessel prices for the region's fishery
products that would have been derived in the absence of the accident" (Cohen 1995, pg.
67). While somewhat speculative, tracking transaction values for fisheries can provide an
accurate measure of social cost if upstream and downstream effects and money
multipliers are considered. Upstream effects consider the impact to suppliers, finding and
extracting raw materials for production. Downstream effects consider the impact to
producers, processing inputs into a finished product. If one stage of production
experiences a negative external shock, all members in the process -- to varying extent --
will be negatively impacted. Cohen (1995) makes two pertinent observations: Exxon's
financial compensation to individuals is typically confidential and thus non-public, and
Exxon employed many local residents in cleanup efforts. Cohen (1995) concludes that
the ex-vessel value of the region's fisheries was approximately $393 million in 1989. This
implies that the oil spill's social costs represent 27% of the fisheries' economic value in
1989, and an effect equal to 12% of the resource's worth in 1990.
Given these studies of past disasters, the paper next reviews the composition of
the Gulf Coast economy. The next section lists the dominant industries most important to
the region and the impacts to those industries from the spill.
8
3. Composition of the Gulf Coast Economy
The Gulf Coast region, consisting of Florida, Alabama, Mississippi, Louisiana,
and Texas, is an important economic producer for the United States. According to the
National Ocean Economics Program (NOEP) in 2014, Gulf of Mexico shore-adjacent
counties accounted for 4.82% of total U.S. population, 4.66% of total U.S. employment,
and 5.16% of total U.S. GDP -- $814.1 billion (2009 dollars)3. Economic activity in the
region is dominated by a few key industries: petrochemicals and energy, tourism, fishing
and shipping, aerospace, and agriculture. The goal of this section is to provide an
overview of these industries and to contextualize how they may have been affected by the
spill.
3.a. Petrochemicals and Energy
Access to water and ease of transport, provided by the Gulf of Mexico and the
Mississippi River, made the Gulf Coast the heart of the U.S. petrochemical industry when
oil and gas deposits were discovered in the early twentieth century. Due to the discovery
of Spindletop in Beaumont, Texas (1901), prospectors realized that windfall profit could
be exploited from the natural resource. Considering the numerous surface seeps of
hydrocarbons in Texas and Louisiana, the Gulf Coast was an early prime suspect for
drilling. In the early 1930s, the first on-water drilling experiment was conducted in the
swamps of Louisiana using modified barges. In 1947, the first offshore well (defined as
3 http://midatlanticocean.org/wp-content/uploads/2016/03/NOEP_National_Report_2016.pdf
9
"out of sight of land") was started in the Gulf of Mexico.4 As of September 2015, there
were 33 active Gulf of Mexico offshore drilling rigs. In 2000, Gulf of Mexico rigs
accounted for 50% of active offshore rigs worldwide.5 Additionally, there are 2,366
active offshore petroleum pipelines and existing platforms in Federal gulf waters which
share leasing revenues with Gulf producing states as per the Gulf of Mexico Energy
Security Act of 2006. 6
According to the U.S. Energy Information Administration, offshore Gulf of
Mexico production in federal waters accounts for 17% of total U.S. crude oil production
and 5% of total U.S. dry gas production. For energy production, over 45% of total U.S.
petroleum refining capacity and 51% of gas processing capacity is situated along the Gulf
Coast. In 2015, Texas and Florida respectively led in net electricity generation, while
Texas also led the nation in crude oil production ( ~30% of total U.S. refining capacity)
and natural gas production (~27% of U.S. marketed natural gas). The coastal-Louisiana
Henry Hub, 150 miles from Spindletop, connects 13 major pipeline systems and serves as
the delivery point for the benchmark of natural gas futures traded on the New York
Mercantile Exchange. Louisiana also has 18 operating petroleum refineries, placing it
second only to Texas in both total and operating refinery capacity. In Mississippi, the
Pascagoula coastal refinery can process 330,000 barrels of crude oil per calendar day and
the Grand Gulf Nuclear Station along the Mississippi River is the largest single-unit
nuclear power plant in the nation.
As a result of the BP oil spill, the United States government declared a six-month
deepwater drilling moratorium on May 30, 2010, to remedy growing concerns with
4 http://petrowiki.org/History_of_offshore_drilling_units#The_first_on-water_drilling 5 http://www.eia.gov/todayinenergy/detail.php?id=23032 6 https://skytruth-org.carto.com/viz/6b36c068-1dd0-11e6-b5c7-0e8c56e2ffdb/public_map
10
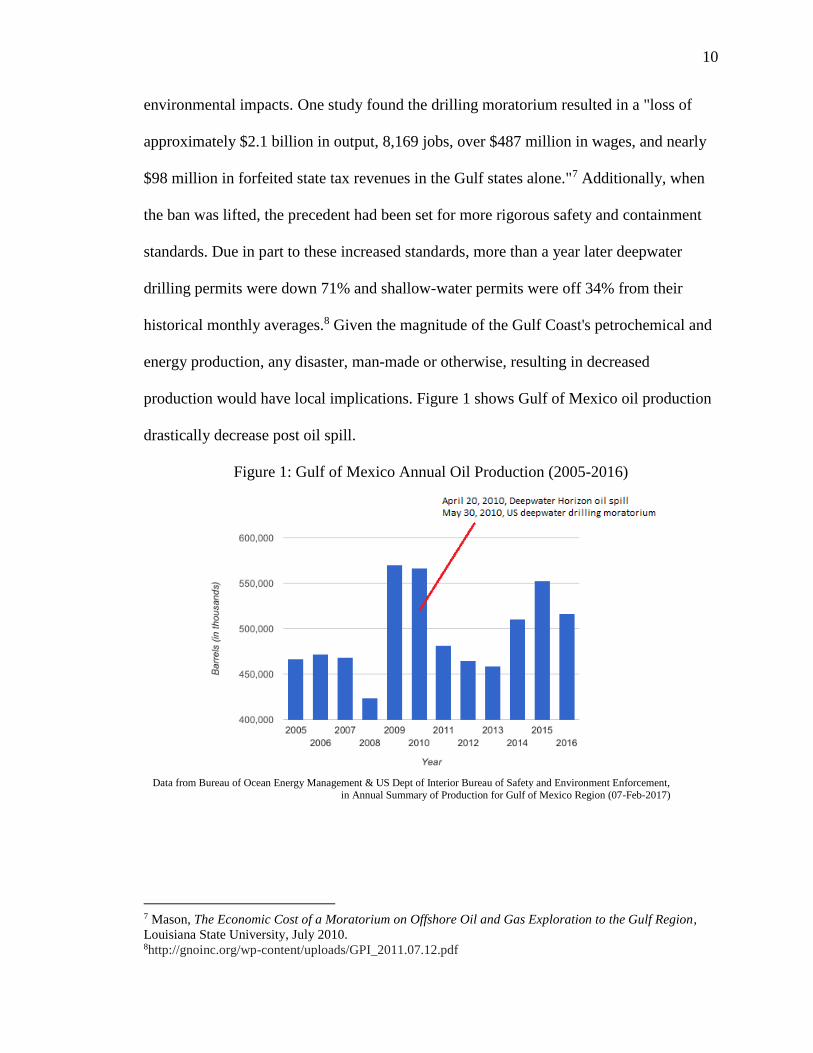
environmental impacts. One study found the drilling moratorium resulted in a "loss of
approximately $2.1 billion in output, 8,169 jobs, over $487 million in wages, and nearly
$98 million in forfeited state tax revenues in the Gulf states alone."7 Additionally, when
the ban was lifted, the precedent had been set for more rigorous safety and containment
standards. Due in part to these increased standards, more than a year later deepwater
drilling permits were down 71% and shallow-water permits were off 34% from their
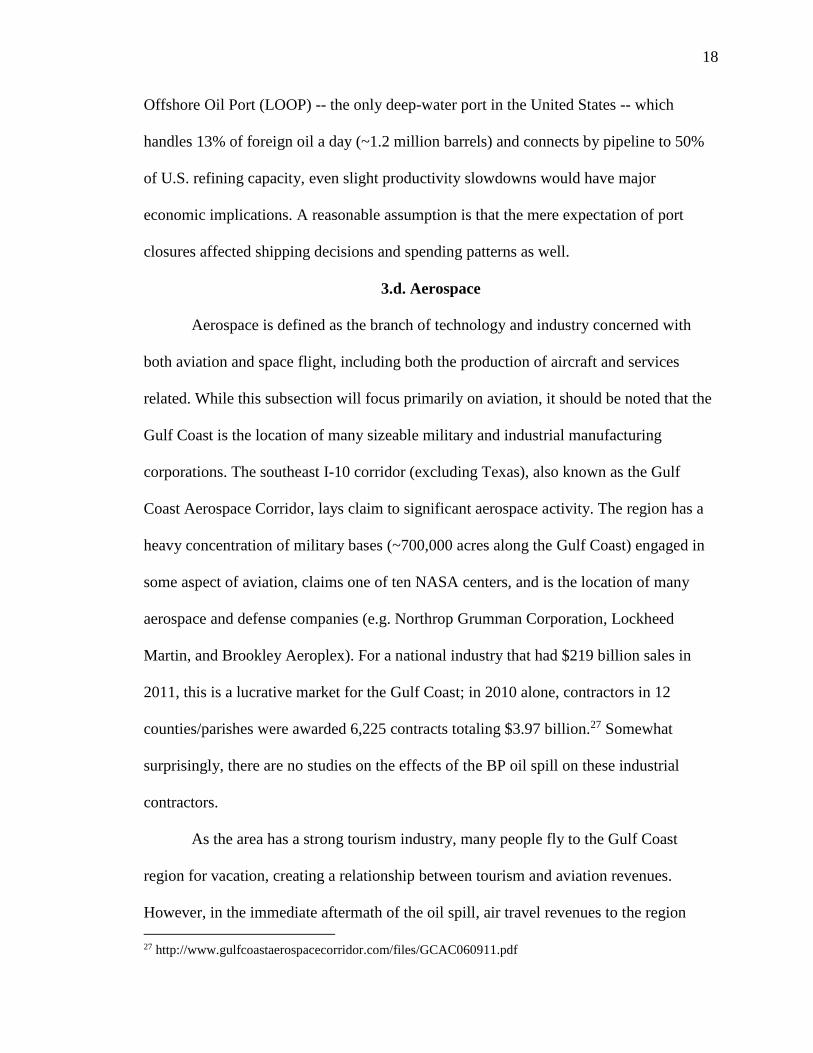
historical monthly averages.8 Given the magnitude of the Gulf Coast's petrochemical and
energy production, any disaster, man-made or otherwise, resulting in decreased
production would have local implications. Figure 1 shows Gulf of Mexico oil production
drastically decrease post oil spill.
Figure 1: Gulf of Mexico Annual Oil Production (2005-2016)
Data from Bureau of Ocean Energy Management & US Dept of Interior Bureau of Safety and Environment Enforcement,
in Annual Summary of Production for Gulf of Mexico Region (07-Feb-2017)
7 Mason, The Economic Cost of a Moratorium on Offshore Oil and Gas Exploration to the Gulf Region,
Louisiana State University, July 2010. 8http://gnoinc.org/wp-content/uploads/GPI_2011.07.12.pdf
11
3.b. Tourism
Over the past decade, expenditures on tourism and travel have steadily risen.
According to the U.S. Travel Association for 2014, total U.S. travel and tourism
expenditures equaled $928 billion, with 8 million direct and 7 million indirect jobs, and
combined tax revenue of $141.5 billion.9 All five states along the Gulf of Mexico boast
year-round tourist attractions. These attractions, including numerous beaches, boating and
fishing activities, gaming and casino locations, and seafood restaurants, bring an
immense amount of visitors and revenue each year. Tourism is the second largest
industry on the Gulf Coast, ranking right behind petrochemicals and energy. According to
a study conducted by Oxford Economics, "...the potential impact of the Deepwater
Horizon oil spill could cost the U.S. coastal economies $22.7 billion over a period of
three years..." in tourism revenue alone.10
Tourism is an important industry for Mississippi: "Without travel and tourism,
there would have been $388.7 million less in General Fund Revenues, 117,685 fewer
total jobs (direct, indirect, induced), $2.79 billion less in total annual payroll associated
with this industry and a decrease in the state's overall quality of life, assuming other
industries remained constant."11 Mississippi's tourism industry is primarily concentrated
around the Gulf Coast cities of Gulfport, Biloxi, and Ocean Springs. The barrier islands
off the coast are common boating attractions and numerous seafood restaurants cater
locally caught fish and shrimp. Biloxi is home to one of the largest gaming and casino
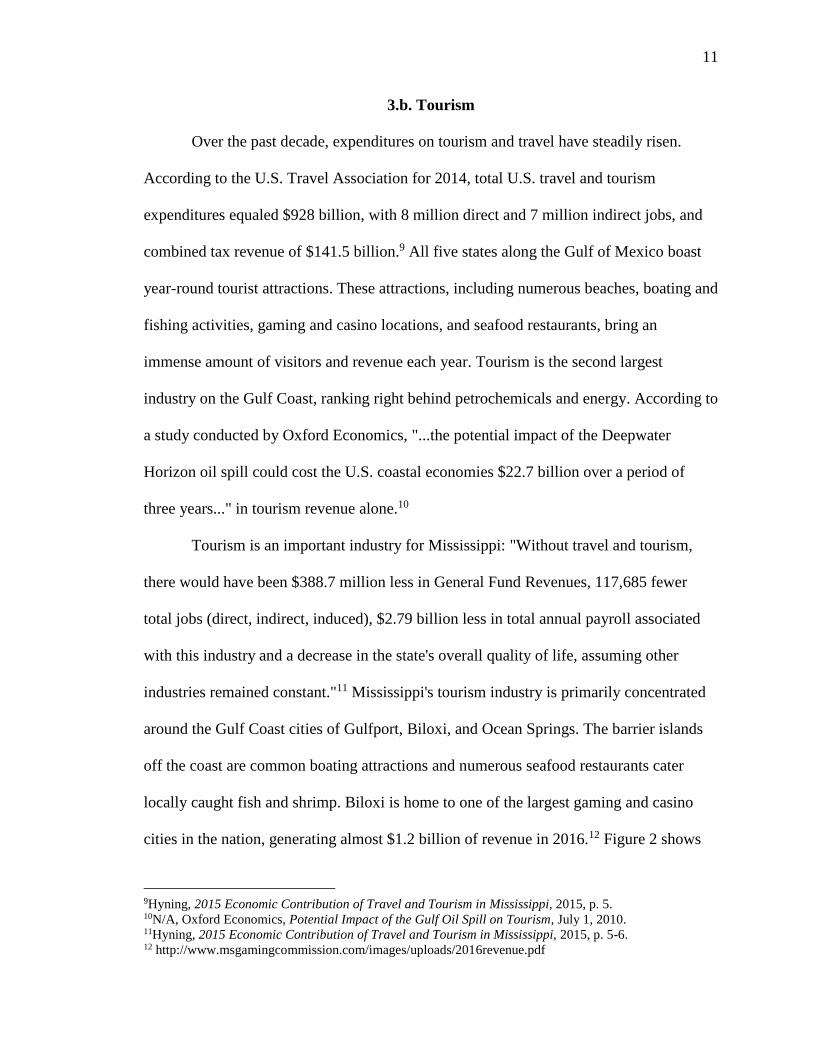
cities in the nation, generating almost $1.2 billion of revenue in 2016.12 Figure 2 shows
9Hyning, 2015 Economic Contribution of Travel and Tourism in Mississippi, 2015, p. 5. 10N/A, Oxford Economics, Potential Impact of the Gulf Oil Spill on Tourism, July 1, 2010. 11Hyning, 2015 Economic Contribution of Travel and Tourism in Mississippi, 2015, p. 5-6. 12 http://www.msgamingcommission.com/images/uploads/2016revenue.pdf
12
Mississippi Gulf Coast gaming revenue. The trend shows gaming revenue decrease with
the economic recession of 2008 and decrease even further post oil spill.
Figure 2: Mississippi Coastal Counties' Annual Gaming Revenue (2008-2016)
Data from MS Gaming Commission and MS Dept. of Revenue
Alabama has many lively beach destinations along the Gulf Coast, including Gulf
Shores, Orange Beach, Perdido Key, Dauphin Island, Fort Morgan, Fairhope, Daphne,
and Mobile. As it did to the Mississippi coast, the BP oil spill tarnished the coastal
destinations' reputation as pristine beach and fresh seafood areas. Accordingly, 2010
experienced a significant lag in tourism activity, especially in the above-average
performing coastal counties of Baldwin and Mobile. While the coastal tourism industry
has since recovered, a large amount of revenue simply did not materialize during the
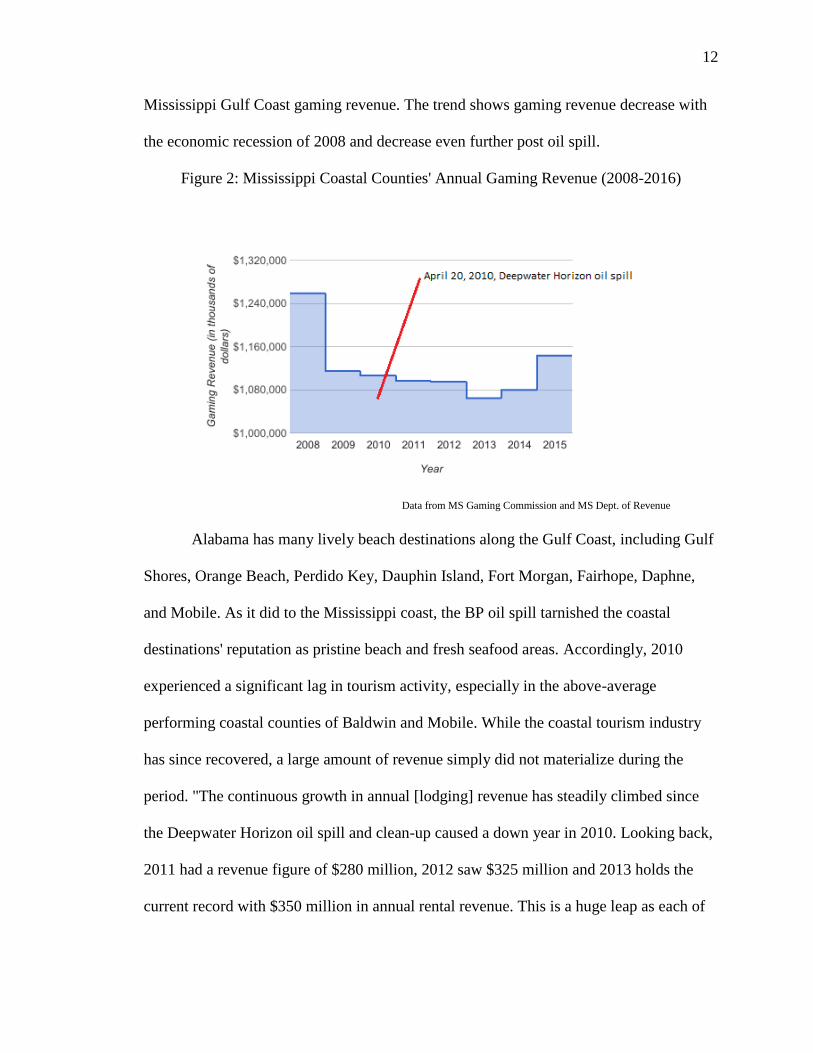
period. "The continuous growth in annual [lodging] revenue has steadily climbed since
the Deepwater Horizon oil spill and clean-up caused a down year in 2010. Looking back,
2011 had a revenue figure of $280 million, 2012 saw $325 million and 2013 holds the
current record with $350 million in annual rental revenue. This is a huge leap as each of
13
the three years prior saw [lodging] revenue totals between $230 and $236 million."13
Figure 3 shows the decrease in Alabama Gulf Coast tourism expenditures in 2010.
Figure 3: Alabama Gulf Coast Total Tourism Expenditures (2007-2015)
Data from Alabama Tourism Department
While Louisiana and Texas have fewer coastal tourist attractions than the other
coastal states, there is one notable exception: the New Orleans metropolitan area. In
2011, tourists in New Orleans spent a record-breaking $5.5 billion.14 In 2012, 9 million
tourists came to the city -- breaking the 2004 record. In 2014, New Orleans area tourism
revenue was estimated to be more than 60% of state total tourism revenue.15 A BP-owned
website states that while "...some speculated that tourism and recreation along the Gulf
would not recover for many years after the 2010 Deepwater Horizon Incident... Such
speculation turned out to be unfounded." While this may or may not be true for the entire
Gulf Coast, it is certainly true for the situation of New Orleans. New Orleans visitation
13 Pugh, "2014 AL Gulf Coast Tourism Revenue", November 8, 2014, pg. 1. 14 This website is owned and operated by British Petroleum.
https://www.thestateofthegulf.com/media/1235/tourism-white-paper.pdf 15 http://www.crt.state.la.us/Assets/Tourism/research/documents/2014-
2015/Louisiana%20Tourism%20Forecast%20Report%204%2015%2015.pdf
14
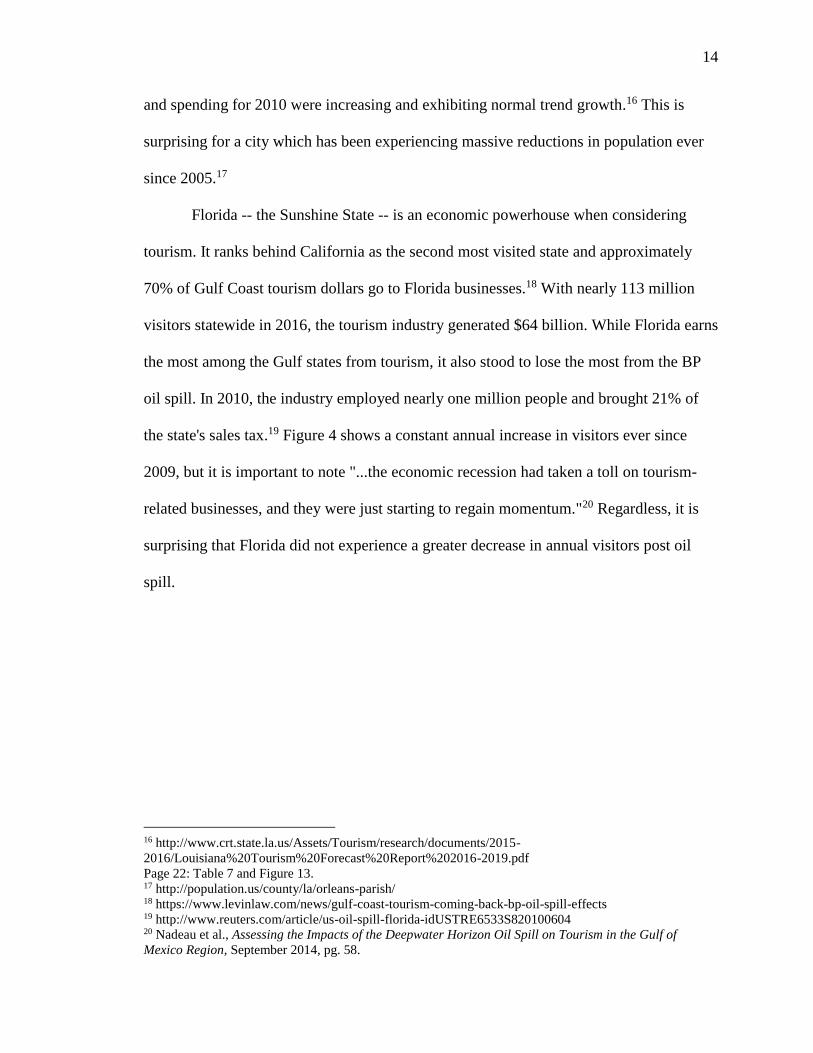
and spending for 2010 were increasing and exhibiting normal trend growth.16 This is
surprising for a city which has been experiencing massive reductions in population ever
since 2005.17
Florida -- the Sunshine State -- is an economic powerhouse when considering
tourism. It ranks behind California as the second most visited state and approximately
70% of Gulf Coast tourism dollars go to Florida businesses.18 With nearly 113 million
visitors statewide in 2016, the tourism industry generated $64 billion. While Florida earns
the most among the Gulf states from tourism, it also stood to lose the most from the BP
oil spill. In 2010, the industry employed nearly one million people and brought 21% of
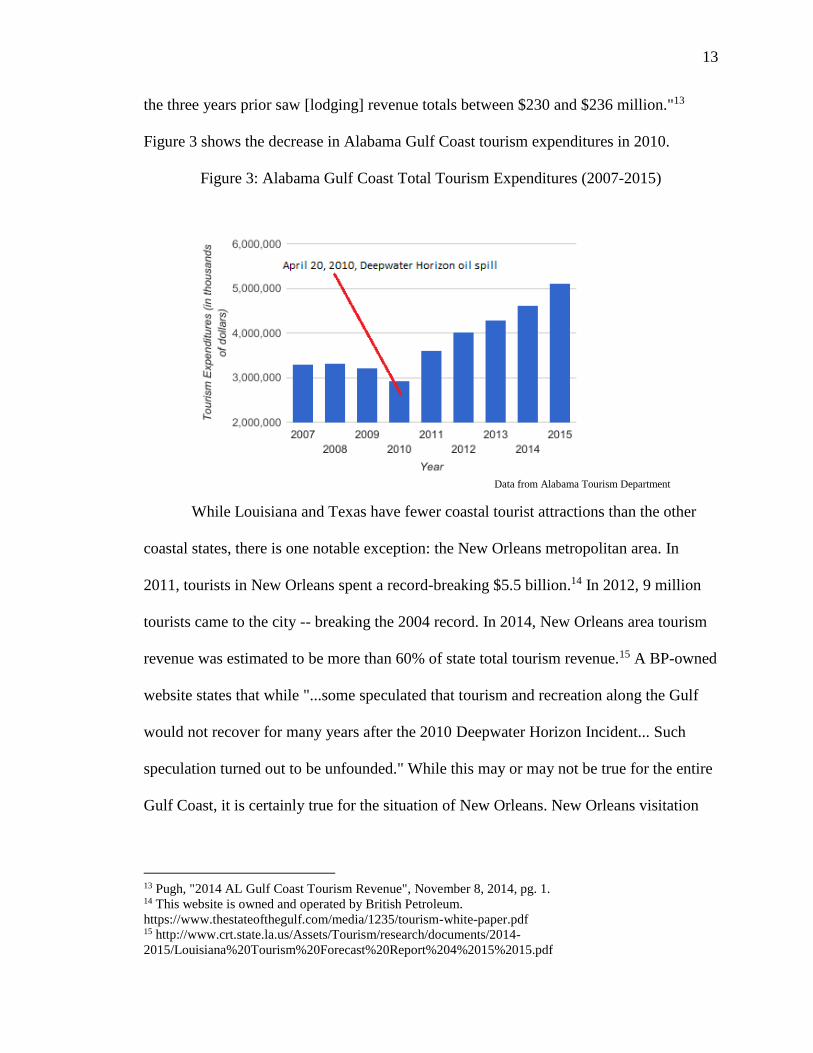
the state's sales tax.19 Figure 4 shows a constant annual increase in visitors ever since
2009, but it is important to note "...the economic recession had taken a toll on tourism-
related businesses, and they were just starting to regain momentum."20 Regardless, it is
surprising that Florida did not experience a greater decrease in annual visitors post oil
spill.
16 http://www.crt.state.la.us/Assets/Tourism/research/documents/2015-
2016/Louisiana%20Tourism%20Forecast%20Report%202016-2019.pdf
Page 22: Table 7 and Figure 13. 17 http://population.us/county/la/orleans-parish/ 18 https://www.levinlaw.com/news/gulf-coast-tourism-coming-back-bp-oil-spill-effects 19 http://www.reuters.com/article/us-oil-spill-florida-idUSTRE6533S820100604 20 Nadeau et al., Assessing the Impacts of the Deepwater Horizon Oil Spill on Tourism in the Gulf of
Mexico Region, September 2014, pg. 58.
15
Figure 4: Annual Visitors to Florida (2000-2016)
Data from Florida Department of Transportation
Tourism is an industry that thrives on positive public perception. After the oil
spill, some destinations were directly affected by the odor, dirty beaches, and tainted
seafood. However, many more "...sections of coastline that never saw oil wash up on
shore were nonetheless affected by public perceptions of the Gulf states as
contaminated."21 Twenty-six percent of people with plans to visit Louisiana postponed or
canceled, with a projected leisure visitor revenue loss of $422 million from 2010 to 2013,
while Texas, Mississippi, and Florida found that 17% postponed or canceled.22 It is clear
that perception overshadowed actual impact and this was a real problem for the tourism
industry along the Gulf Coast.
3.c. Fishing and Shipping
Louisiana and Texas marshlands provide diverse breeding grounds and nurseries
for commercial fishing and shrimping. In 2011, commercial fisherman in the Gulf of
21
N/A, "Tourism Industry Impacts: the Deepwater Horizon spill", Conversations for Responsible Economic
Development, 2014, pg. 1. 22 http://usa.oceana.org/sites/default/files/tourism_impacts_fact_sheet_9-8-15.pdf
16
Mexico region had landing revenue, i.e., revenue accrued when marine life is first
brought to shore, of $818 million. 23 Louisiana, Texas, and West Florida had the highest
landing revenue with $334 million, $239 million, and $164 million respectively. In the
same year, seafood sales from local processors amounted to $500 million in Alabama,
$1.8 billion in Louisiana, $247 million in Mississippi, $2.3 billion in Texas, and $14
billion in Florida. The harvest sector in Texas alone accounted for 5,800 jobs.
Recreational and subsistence fishing also had sizable turnout in 2011, with over 3 million
recreational anglers taking 23 million fishing trips in the Gulf of Mexico. In the same
year, expenditures on fishing trips and durable equipment totaled $9.8 billion. This is all
despite significant disruptions from major storms in 2005 (Hurricanes Katrina and Rita),
in 2008 (Hurricanes Gustav and Ike), and the Deepwater Horizon oil spill which closed
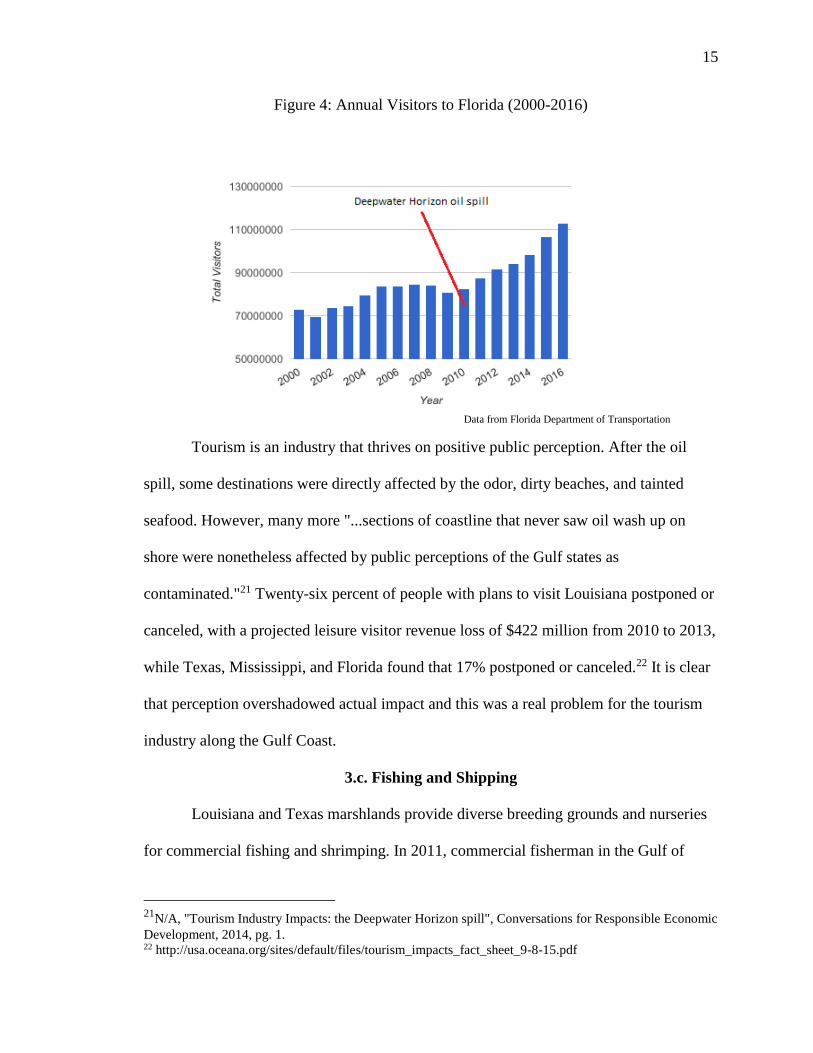
state and federal waters for six months. Table 1 shows selected statistics on the economic
impact of the BP oil spill on the Gulf Coast seafood industry.
Table 1: 2011 Economic Impacts of the Gulf of Mexico Seafood Industry
(in thousands of dollars)
With Imports Without Imports
Jobs Sales Value Added Jobs Sales Value Added
Alabama 11,011 499,805 250,171 10,348 421,295 220,521
Louisiana 32,818 1,801,568 877,911 30,676 1,467,854 762,430
Mississippi 5,550 247,106 125,430 5,439 231,104 119,876
Texas 27,717 2,277,959 1,002,928 22,516 1,357,574 687,876
W. Florida 72,341 14,250,006 4,778,502 10,550 928,929 376,208
Data from US Dept. of Commerce and National Oceanic and Atmospheric Administration,
published in 2011 Gulf of Mexico regional summary
23 https://www.st.nmfs.noaa.gov/Assets/economics/documents/feus/2011/FEUS2011%20-
%20Gulf%20of%20Mexico.pdf
17
Approximately 40% of United States seafood is supplied by the fisheries in the
Gulf. According to a study in 2011, "The oil spill has caused the fishing industry in
Louisiana to lose 77% of their production", a figure which could become much larger as
clams, oysters, and other shell fish are unable to move, thus making them much more
susceptible to contamination from oil and oil dispersants over time.24 U.S. Bureau of
Ocean Energy Management estimates the commercial fishing industry potentially lost a
total of $952.9 million in sales, and up to 9,315 jobs, in the first eight months after the
spill.25 This is a huge, detrimental loss not only for fishermen, but for the Gulf Coast
economy as a whole.
The Gulf of Mexico possesses 11 of the leading 20 U.S. shipping ports by
tonnage. Louisiana, Texas, and Alabama are within the top ten states by waterborne
traffic -- first, second, and tenth, respectively. The Port of South Louisiana and the Port
of Houston are two of the ten busiest ports in the world by cargo volume. the Port of
South Louisiana shipped 267.4 million tons in 2014.26 At the time of the spill, there was
major concern that the Coast Guard would shut down shipping ports to protect the marine
transportation system. As massive cargo ships must collect ballast water to maintain
balance, and a significant amount of shipments in the region are for oil, coke (fuel), coal
and grain, these vessels carrying flammable cargos would be transporting contaminated
water to new locations. While the Coast Guard did not shut down shipping ports,
precautions were taken. Authorities established mobile and offshore vessel-cleaning
stations, but these significantly slowed shipping time. For ports like the Louisiana
24 Jefferson and Bowling, The Economic and Biological Impacts of The BP Oil Spill, 2011, p. 9-18. 25 https://www.data.boem.gov/PI/PDFImages/ESPIS/5/5518.pdf 26
http://www.navigationdatacenter.us/factcard/factcard15v-1.pdf
18
Offshore Oil Port (LOOP) -- the only deep-water port in the United States -- which
handles 13% of foreign oil a day (~1.2 million barrels) and connects by pipeline to 50%
of U.S. refining capacity, even slight productivity slowdowns would have major
economic implications. A reasonable assumption is that the mere expectation of port
closures affected shipping decisions and spending patterns as well.
3.d. Aerospace
Aerospace is defined as the branch of technology and industry concerned with
both aviation and space flight, including both the production of aircraft and services
related. While this subsection will focus primarily on aviation, it should be noted that the
Gulf Coast is the location of many sizeable military and industrial manufacturing
corporations. The southeast I-10 corridor (excluding Texas), also known as the Gulf
Coast Aerospace Corridor, lays claim to significant aerospace activity. The region has a
heavy concentration of military bases (~700,000 acres along the Gulf Coast) engaged in
some aspect of aviation, claims one of ten NASA centers, and is the location of many
aerospace and defense companies (e.g. Northrop Grumman Corporation, Lockheed
Martin, and Brookley Aeroplex). For a national industry that had $219 billion sales in
2011, this is a lucrative market for the Gulf Coast; in 2010 alone, contractors in 12
counties/parishes were awarded 6,225 contracts totaling $3.97 billion.27 Somewhat
surprisingly, there are no studies on the effects of the BP oil spill on these industrial
contractors.
As the area has a strong tourism industry, many people fly to the Gulf Coast
region for vacation, creating a relationship between tourism and aviation revenues.
However, in the immediate aftermath of the oil spill, air travel revenues to the region
27 http://www.gulfcoastaerospacecorridor.com/files/GCAC060911.pdf
19
increased while tourism revenues decreased. The man-made disaster brought a whole
host of specialists to the Gulf Coast to aid in the recovery and protection of the
environment, the closing of the oil well, dismantling of the rig, and other similarly related
services. Although, the effect would be temporary if these specialists left before tourism
picked back up in the following years. One could speculate that coastal tourism is
predominantly by automobile, which might also explain why air travel revenues did not
decrease drastically in 2010.
The Gulf Coast Aerospace Corridor is served by six commercial airports. Three of
four international airports in Mississippi are located along the Gulf Coast. The number of
passengers through the Gulfport-Biloxi International Airport, the largest among them,
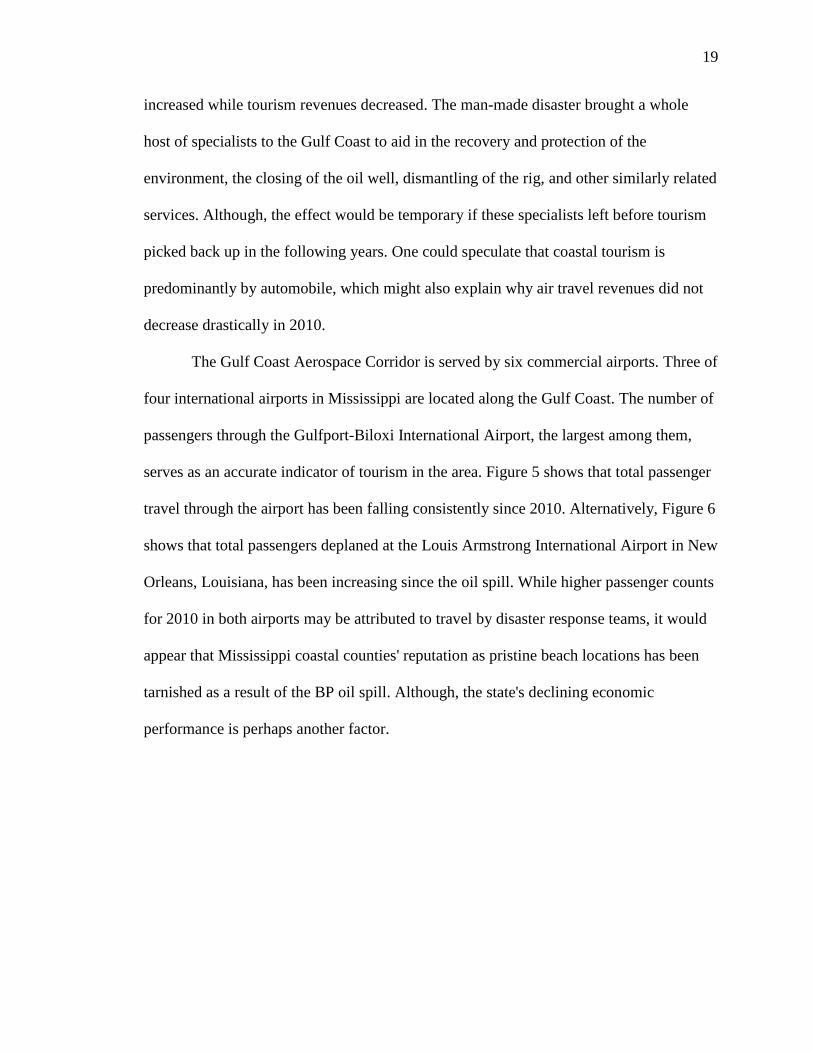
serves as an accurate indicator of tourism in the area. Figure 5 shows that total passenger
travel through the airport has been falling consistently since 2010. Alternatively, Figure 6
shows that total passengers deplaned at the Louis Armstrong International Airport in New
Orleans, Louisiana, has been increasing since the oil spill. While higher passenger counts
for 2010 in both airports may be attributed to travel by disaster response teams, it would
appear that Mississippi coastal counties' reputation as pristine beach locations has been
tarnished as a result of the BP oil spill. Although, the state's declining economic
performance is perhaps another factor.
20
Figure 5: Gulfport-Biloxi International Airport Total Passengers (2000-2015)
Data from Gulfport-Biloxi International Airport (Gulfport/Biloxi, MS)
Figure 6: New Orleans International Airport Deplaned Passengers (2004-2016)
Data from Louis Armstrong New Orleans International Airport
(New Orleans, LA)
21
3.e. Summary
By National Ocean Economics Program (NOEP) definition, the Ocean Economy
is that part of the economy which derives part or all of its inputs from the ocean or Great
Lakes and consists of six sectors unique (marine-related) to the Ocean Economy: Marine
Construction, Living Resources, Minerals, Ship & Boat Building, Tourism & Recreation,
and Transportation. In 2013, these Ocean Economy industries produced 2.17% ($359.32
billion Ocean GDP) of total U.S. GDP ($16,549 billion) and the Gulf of Mexico is
responsible for 30.7% of that amount. Bearing in mind that the Gulf Coast economy also
consists of other non-marine related industries, it is significant that any natural disaster
affecting the Ocean Economy's ability to function would have substantial downstream
implications for other industries. These marine-related activities are important conduits
for growth.
This section gave an understanding of how the BP oil spill affected the Gulf Coast
economy. The next section describes the model used to gauge those impacts on coastal
economic performance.
22
4. Model Design
4.a. Methodology
British Petroleum paid reparations to government entities (i.e., municipal, state,
federal), individuals, and businesses for economic loss. If British Petroleum's reparation
payments rectify actual damage and lost income, the payments should have addressed
injury at all levels of the Gulf Coast economy. Therefore, the Gulf Coast economy should
be performing and growing at a trend similar to that preceding the oil spill --
exemplifying full recovery and compensation. To test this hypothesis, linear regression
analysis is used to determine the adequacy of BP reparation payments on Gulf Coast
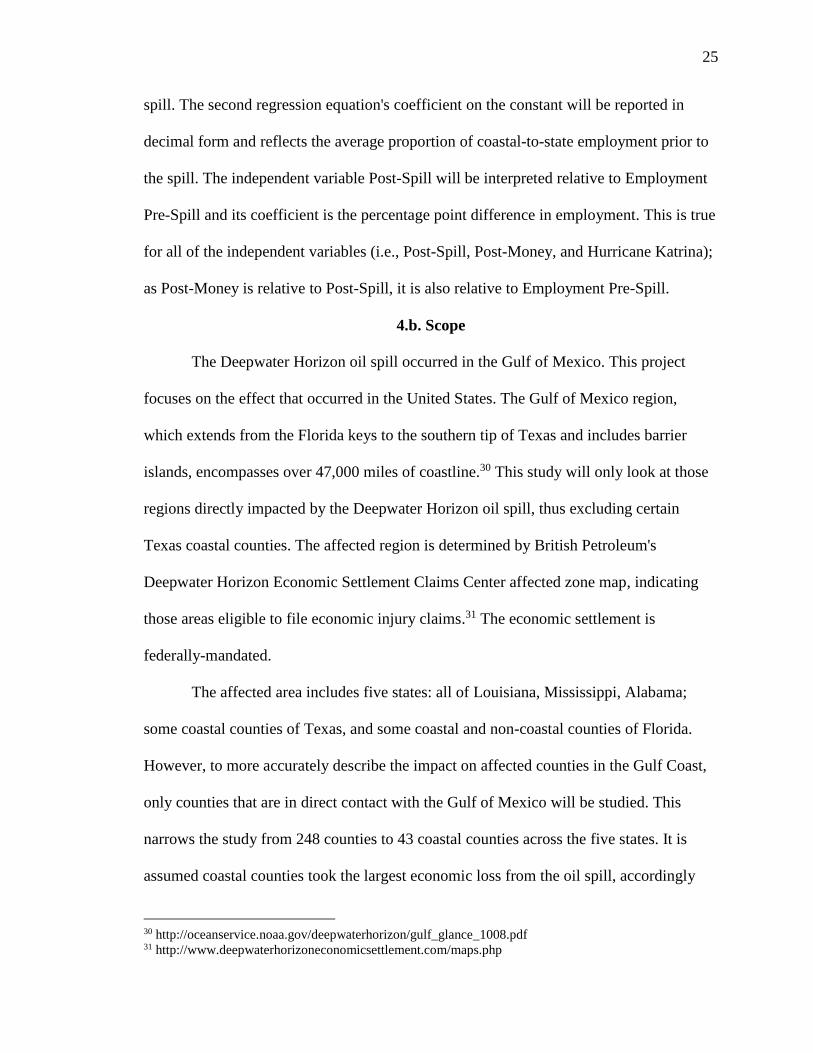
economic performance. The regression models are explained in Figure 7.
Figure 7: Multiple Linear Regression Equations
There are two dependent variables, coastal employment levels in absolute value
and a ratio of coastal-to-state employment. As employment is an important measure of
the health of an economy, the employment rate is used as a response variable to
determine increasing, decreasing, or stagnant economic growth. The second dependent
1.) Regressions on Coastal Employment
Y1 = ß0 + Post-spill (ß1) + Post-money (ß2) + Hurricane Katrina (ß3) + National GDP
(ß4) + µ
2.) Regressions on Percent of State Employment
Y2 = ß0 + Post-spill (ß1) + Post-money (ß2) + Hurricane Katrina (ß3) + National GDP
(ß4) + µ
23
variable incorporates the statewide economic trend and is reported in decimal form. The
employment statistics are provided by the Bureau of Labor Statistics in monthly reports.
The data has been synthesized quarterly to ignore monthly employment variation and
thus capture the broader employment trend.
The reparation payment information is provided by the Deepwater Horizon
Economic Settlement program in court-mandated document reports. The value of each
period's reparation payments were to be used in the regressions as an explanatory
variable, but several problems arose. As Cohen (1995) states, financial compensation to
individuals is typically confidential and thus non-public. Although payment totals are
provided, the stipulations behind the reparations are not. Law firms litigating for
individuals and businesses also take a sizeable portion of won claims, typically ranging
anywhere from 15% to 30% of total settlement, depending on the case.28 Additionally,
while court-mandated reports are provided by the Deepwater Horizon Claims Center, the
reporting periods are irregular and there are missing data. Thus, reparation payments are
not included as a separate independent variable in the regressions, only their latent effect.
A dummy variable for Hurricane Katrina has been included in the model. The
range of data on employment figures is from the first quarter of 2000 to the third quarter
of 2016. The hurricane resulted in a major economic downturn for the Gulf of Mexico
region in 2005, which would have skewed the regressions' results. Thus, a dummy
variable (0=no effect; 1=effect) was included to control for the hurricane's economic
implications. As the timing of the effect was different for each state, effect (1=effect) was
chosen by considering the economic impact to each states' coastal counties as seen
28 This is from the author's personal experience working with a Deepwater Horizon Economic Settlement
claims law firm and from personal conversations with actual claims recipients.
24
through employment figures. Hurricane Katrina's effect on Louisiana is controlled for
three quarters, Mississippi for five quarters, and Alabama for six quarters. Although each
state experienced damage from the storm, the effect of Hurricane Katrina on employment
to the Texas and Florida coastal counties studied in the scope of this project is found to
be negligible; thus, the Katrina dummy variable is not included for these two states.
To account for the national macroeconomic trend and its effect on the Gulf of
Mexico region, national gross domestic product (GDP) is included as an explanatory
variable. The data range for GDP is from the first quarter of 2000 to the third quarter of
2016. GDP is chained in billions of 2009 dollars.
The Post-Spill dummy variable is marked for effect (1=effect) beginning with the
second quarter of 2010, as the spill occurred in April of 2010. The Post-Money dummy
variable is marked for effect (1=effect) beginning with the third quarter of 2012, per the
start of Deepwater Horizon Claims Center's administrator status reports showing first
payments made for economic loss.29 The most important indicators are the explanatory
Post-Spill and Post-Money dummy variables. Their coefficients, measured in terms of
coastal county employment or as a ratio of coastal county-to-state employment, show the
impact of the oil spill and the impact of reparation payments on employment in the Gulf
Coast counties. As employment is used as a measure of general economic performance,
an argument on the adequacy of BP reparation payments for recovery of the Gulf Coast
economy will be made on a state-by-state basis.
The interpretation of the regression coefficients is as follows. The constant of the
first regression equation reflects the average of coastal county employment prior to the
29 http://www.deepwaterhorizoneconomicsettlement.com/docs/v1-
9_5_12_Status_Report_No__1_by_the_Claims_Administrator_of_the_Deepwater_Horizon_Economic_an
d_Property_Damage_Settlement_Agre.pdf
25
spill. The second regression equation's coefficient on the constant will be reported in
decimal form and reflects the average proportion of coastal-to-state employment prior to
the spill. The independent variable Post-Spill will be interpreted relative to Employment
Pre-Spill and its coefficient is the percentage point difference in employment. This is true
for all of the independent variables (i.e., Post-Spill, Post-Money, and Hurricane Katrina);
as Post-Money is relative to Post-Spill, it is also relative to Employment Pre-Spill.
4.b. Scope
The Deepwater Horizon oil spill occurred in the Gulf of Mexico. This project
focuses on the effect that occurred in the United States. The Gulf of Mexico region,
which extends from the Florida keys to the southern tip of Texas and includes barrier
islands, encompasses over 47,000 miles of coastline.30 This study will only look at those
regions directly impacted by the Deepwater Horizon oil spill, thus excluding certain
Texas coastal counties. The affected region is determined by British Petroleum's
Deepwater Horizon Economic Settlement Claims Center affected zone map, indicating
those areas eligible to file economic injury claims.31 The economic settlement is
federally-mandated.
The affected area includes five states: all of Louisiana, Mississippi, Alabama;
some coastal counties of Texas, and some coastal and non-coastal counties of Florida.
However, to more accurately describe the impact on affected counties in the Gulf Coast,
only counties that are in direct contact with the Gulf of Mexico will be studied. This
narrows the study from 248 counties to 43 coastal counties across the five states. It is
assumed coastal counties took the largest economic loss from the oil spill, accordingly
30 http://oceanservice.noaa.gov/deepwaterhorizon/gulf_glance_1008.pdf 31 http://www.deepwaterhorizoneconomicsettlement.com/maps.php
26
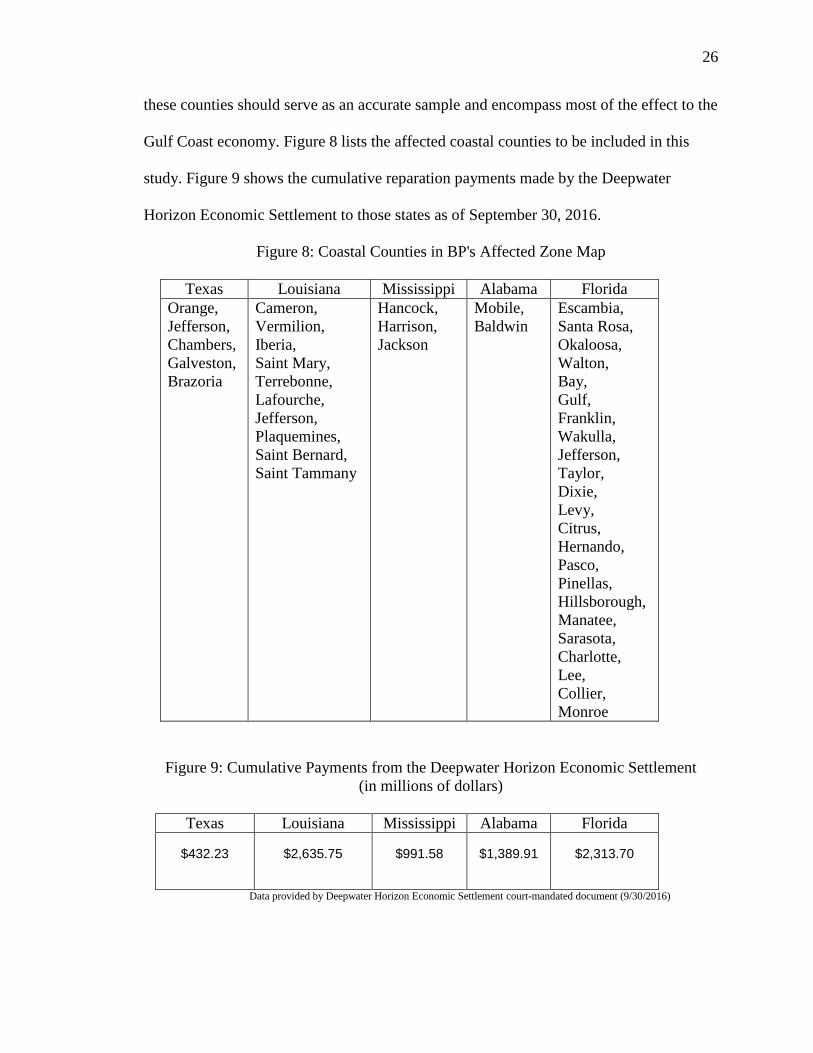
these counties should serve as an accurate sample and encompass most of the effect to the
Gulf Coast economy. Figure 8 lists the affected coastal counties to be included in this
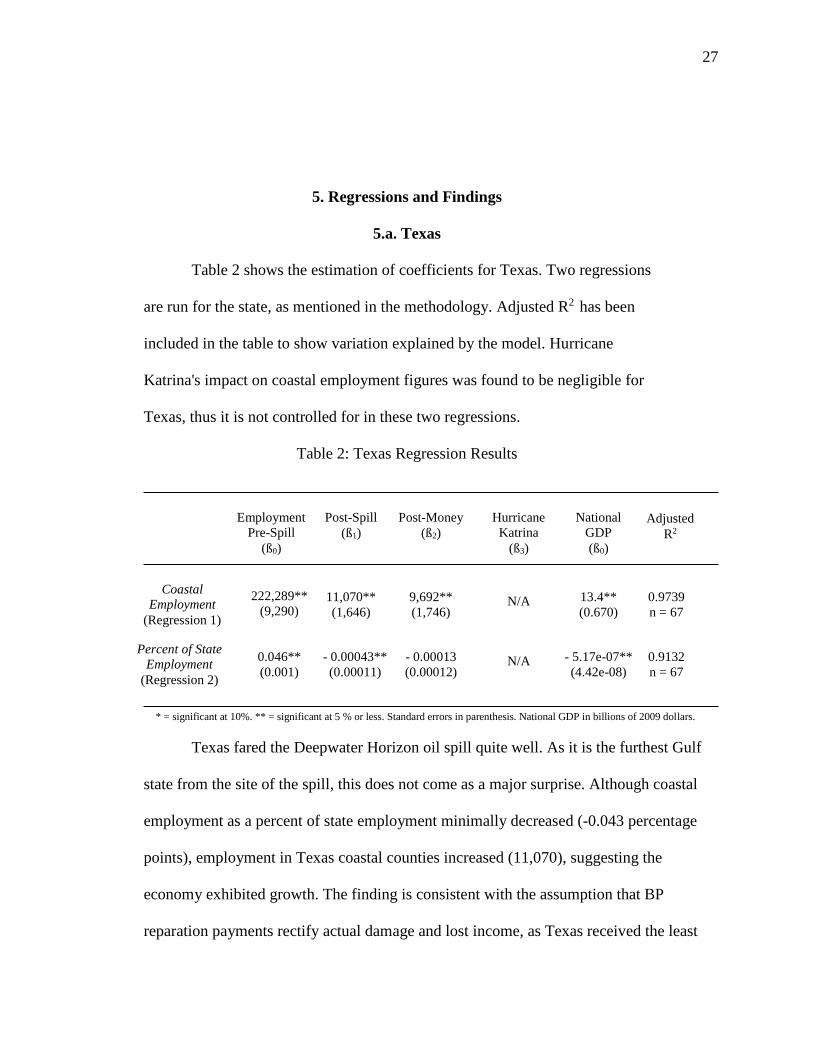
study. Figure 9 shows the cumulative reparation payments made by the Deepwater
Horizon Economic Settlement to those states as of September 30, 2016.
Figure 8: Coastal Counties in BP's Affected Zone Map
Texas Louisiana Mississippi Alabama Florida
Orange,
Jefferson,
Chambers,
Galveston,
Brazoria
Cameron,
Vermilion,
Iberia,
Saint Mary,
Terrebonne,
Lafourche,
Jefferson,
Plaquemines,
Saint Bernard,
Saint Tammany
Hancock,
Harrison,
Jackson
Mobile,
Baldwin
Escambia,
Santa Rosa,
Okaloosa,
Walton,
Bay,
Gulf,
Franklin,
Wakulla,
Jefferson,
Taylor,
Dixie,
Levy,
Citrus,
Hernando,
Pasco,
Pinellas,
Hillsborough,
Manatee,
Sarasota,
Charlotte,
Lee,
Collier,
Monroe
Figure 9: Cumulative Payments from the Deepwater Horizon Economic Settlement
(in millions of dollars)
Texas Louisiana Mississippi Alabama Florida
$432.23 $2,635.75 $991.58 $1,389.91 $2,313.70
Data provided by Deepwater Horizon Economic Settlement court-mandated document (9/30/2016)
27
5. Regressions and Findings
5.a. Texas
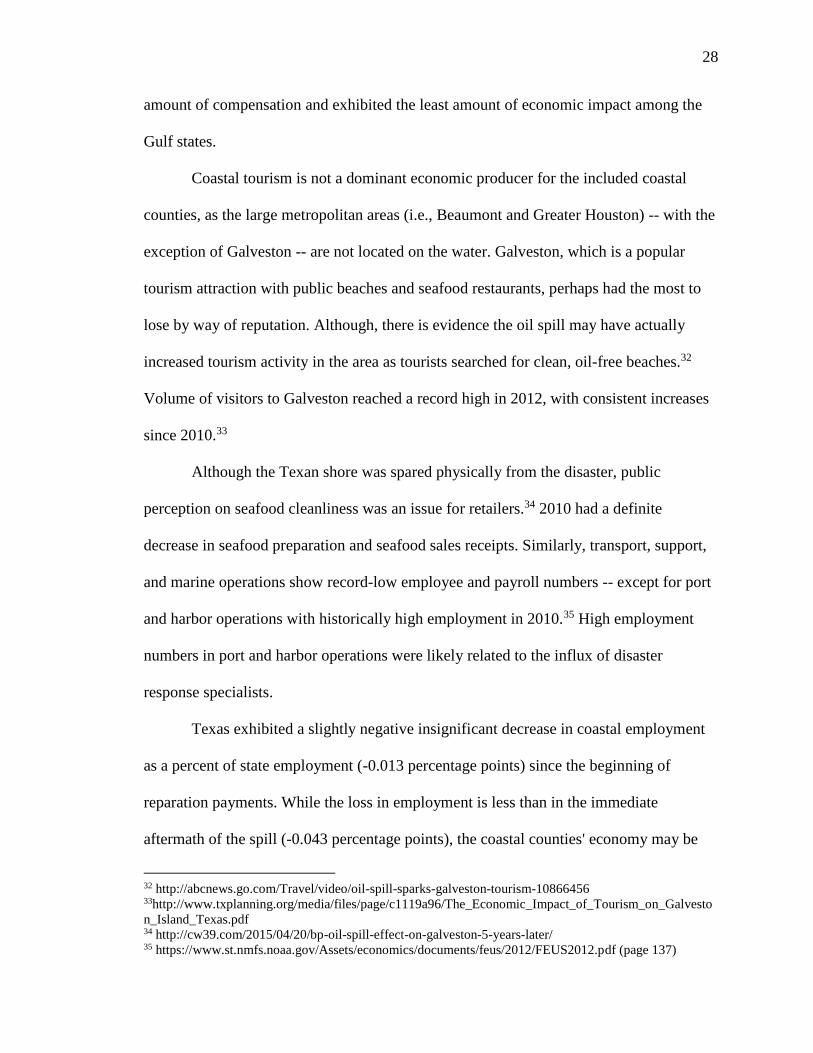
Table 2 shows the estimation of coefficients for Texas. Two regressions
are run for the state, as mentioned in the methodology. Adjusted R2 has been
included in the table to show variation explained by the model. Hurricane
Katrina's impact on coastal employment figures was found to be negligible for
Texas, thus it is not controlled for in these two regressions.
Table 2: Texas Regression Results
* = significant at 10%. ** = significant at 5 % or less. Standard errors in parenthesis. National GDP in billions of 2009 dollars.
Texas fared the Deepwater Horizon oil spill quite well. As it is the furthest Gulf
state from the site of the spill, this does not come as a major surprise. Although coastal
employment as a percent of state employment minimally decreased (-0.043 percentage
points), employment in Texas coastal counties increased (11,070), suggesting the
economy exhibited growth. The finding is consistent with the assumption that BP
reparation payments rectify actual damage and lost income, as Texas received the least
Coastal
Employment
(Regression 1)
Employment
Pre-Spill
(ß0)
Post-Spill
(ß1)
Post-Money
(ß2)
Hurricane
Katrina
(ß3)
National
GDP
(ß0)
Adjusted
R2
222,289**
(9,290) 11,070**
(1,646)
9,692**
(1,746) N/A 13.4**
(0.670)
0.9739
n = 67
Percent of State
Employment
(Regression 2)
0.046**
(0.001)
- 0.00043**
(0.00011)
- 0.00013
(0.00012) N/A - 5.17e-07**
(4.42e-08)
0.9132
n = 67
28
amount of compensation and exhibited the least amount of economic impact among the
Gulf states.
Coastal tourism is not a dominant economic producer for the included coastal
counties, as the large metropolitan areas (i.e., Beaumont and Greater Houston) -- with the
exception of Galveston -- are not located on the water. Galveston, which is a popular
tourism attraction with public beaches and seafood restaurants, perhaps had the most to
lose by way of reputation. Although, there is evidence the oil spill may have actually
increased tourism activity in the area as tourists searched for clean, oil-free beaches.32
Volume of visitors to Galveston reached a record high in 2012, with consistent increases
since 2010.33
Although the Texan shore was spared physically from the disaster, public
perception on seafood cleanliness was an issue for retailers.34 2010 had a definite
decrease in seafood preparation and seafood sales receipts. Similarly, transport, support,
and marine operations show record-low employee and payroll numbers -- except for port
and harbor operations with historically high employment in 2010.35 High employment
numbers in port and harbor operations were likely related to the influx of disaster
response specialists.
Texas exhibited a slightly negative insignificant decrease in coastal employment
as a percent of state employment (-0.013 percentage points) since the beginning of
reparation payments. While the loss in employment is less than in the immediate
aftermath of the spill (-0.043 percentage points), the coastal counties' economy may be
32 http://abcnews.go.com/Travel/video/oil-spill-sparks-galveston-tourism-10866456 33http://www.txplanning.org/media/files/page/c1119a96/The_Economic_Impact_of_Tourism_on_Galvesto
n_Island_Texas.pdf 34 http://cw39.com/2015/04/20/bp-oil-spill-effect-on-galveston-5-years-later/ 35 https://www.st.nmfs.noaa.gov/Assets/economics/documents/feus/2012/FEUS2012.pdf (page 137)
29
moving back to equilibrium as reparation payments -- and related money multiplier
effects -- come to an end. By and large, the Texas economy seems to have recovered
from the oil spill. One conclusion is that the Deepwater Horizon Economic Settlement
payments for Texas have been adequate.
5.b. Louisiana
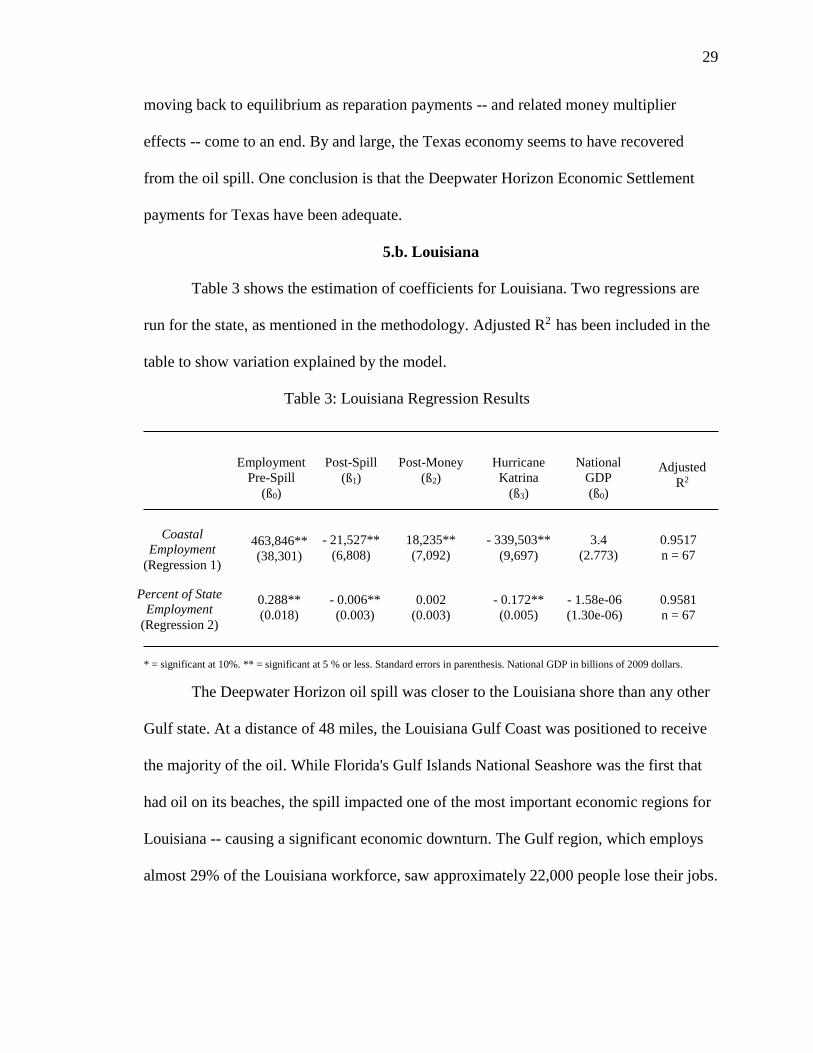
Table 3 shows the estimation of coefficients for Louisiana. Two regressions are
run for the state, as mentioned in the methodology. Adjusted R2 has been included in the
table to show variation explained by the model.
Table 3: Louisiana Regression Results
* = significant at 10%. ** = significant at 5 % or less. Standard errors in parenthesis. National GDP in billions of 2009 dollars.
The Deepwater Horizon oil spill was closer to the Louisiana shore than any other
Gulf state. At a distance of 48 miles, the Louisiana Gulf Coast was positioned to receive
the majority of the oil. While Florida's Gulf Islands National Seashore was the first that
had oil on its beaches, the spill impacted one of the most important economic regions for
Louisiana -- causing a significant economic downturn. The Gulf region, which employs
almost 29% of the Louisiana workforce, saw approximately 22,000 people lose their jobs.
Coastal
Employment
(Regression 1)
Employment
Pre-Spill
(ß0)
Post-Spill
(ß1)
Post-Money
(ß2)
Hurricane
Katrina
(ß3)
National
GDP
(ß0)
Adjusted
R2
463,846**
(38,301)
- 21,527**
(6,808)
18,235**
(7,092)
- 339,503**
(9,697)
3.4
(2.773)
0.9517
n = 67
Percent of State
Employment
(Regression 2)
0.288**
(0.018)
- 0.006**
(0.003)
0.002
(0.003)
- 0.172**
(0.005)
0.9581
n = 67
- 1.58e-06
(1.30e-06)
30
The coastal counties' percent of state employment also decreased more than any other
Gulf state (-0.6 percentage points).
Accordingly, Louisiana has received the largest amount of reparation payments to
compensate for economic damage and lost income, almost $2.636 billion.36 These
payments show a positive relationship with employment. Post-reparation payments,
coastal employment (18,235) and percent of state employment (0.2 percentage points)
have both increased. Although the Post-Money coefficient in the percent of state
employment regression is insignificant at the 10% level or less, the Post-Money
coefficient in the coastal employment regression is highly significant. This suggests the
Louisiana Gulf Coast is recovering. While full recovery has not been achieved,
employment has returned to levels near those prior to the spill. The increase in coastal
employment post-reparation payments (18,235) nearly offset the decline in employment
post-spill (-21,527). This indicates the Deepwater Horizon Economic Settlement
payments for Louisiana are near adequate. Slight additional compensation may be needed
for the coastal economy to achieve complete recovery.
5.c. Mississippi
Table 4 shows the estimation of coefficients for Mississippi. Two regressions are
run for the state, as mentioned in the methodology. Adjusted R2 has been included in the
table to show variation explained by the model.
36 As of September 30, 2016,
http://www.deepwaterhorizoneconomicsettlement.com/docs/Court_Status_Report_No_49.pdf
31
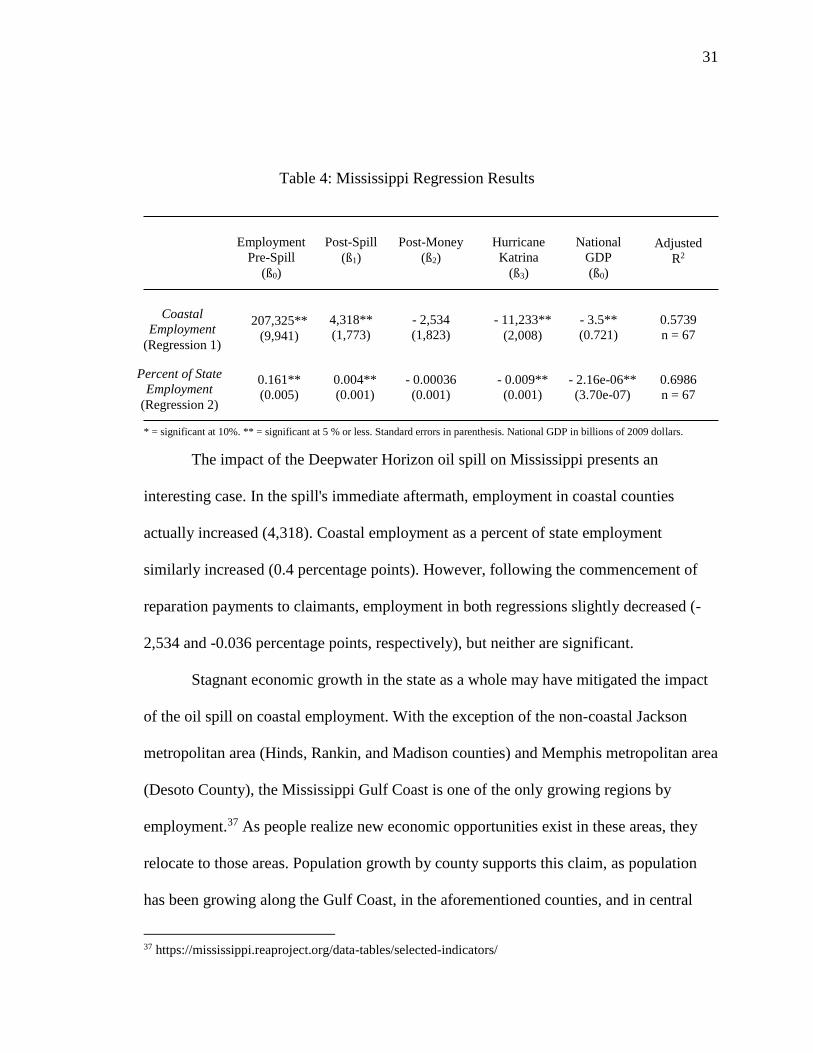
Table 4: Mississippi Regression Results
* = significant at 10%. ** = significant at 5 % or less. Standard errors in parenthesis. National GDP in billions of 2009 dollars.
The impact of the Deepwater Horizon oil spill on Mississippi presents an
interesting case. In the spill's immediate aftermath, employment in coastal counties
actually increased (4,318). Coastal employment as a percent of state employment
similarly increased (0.4 percentage points). However, following the commencement of
reparation payments to claimants, employment in both regressions slightly decreased (-
2,534 and -0.036 percentage points, respectively), but neither are significant.
Stagnant economic growth in the state as a whole may have mitigated the impact
of the oil spill on coastal employment. With the exception of the non-coastal Jackson
metropolitan area (Hinds, Rankin, and Madison counties) and Memphis metropolitan area
(Desoto County), the Mississippi Gulf Coast is one of the only growing regions by
employment.37 As people realize new economic opportunities exist in these areas, they
relocate to those areas. Population growth by county supports this claim, as population
has been growing along the Gulf Coast, in the aforementioned counties, and in central
37 https://mississippi.reaproject.org/data-tables/selected-indicators/
Coastal
Employment
(Regression 1)
Employment
Pre-Spill
(ß0)
Post-Spill
(ß1)
Post-Money
(ß2)
Hurricane
Katrina
(ß3)
National
GDP
(ß0)
Adjusted
R2
207,325**
(9,941)
4,318**
(1,773)
- 2,534
(1,823)
- 11,233**
(2,008)
- 3.5**
(0.721)
0.5739
n = 67
Percent of State
Employment
(Regression 2)
0.161**
(0.005)
0.004**
(0.001)
- 0.00036
(0.001)
- 0.009**
(0.001)
0.6986
n = 67
- 2.16e-06**
(3.70e-07)
32
northern Mississippi (principally Lafayette County) for many years. However, this influx
was already occurring prior to the spill.38 Therefore, population and employment growth
in the Mississippi Gulf Coast have mitigated the impact of the spill on both measures
employment post-commencement of reparation payments.
However, this does not explain the increase in employment immediately after the
spill, prior to reparation payments. The effect may be attributed to the hiring of disaster
response specialists and resulting money multiplier effects. As shown in Figure 5, the
Gulfport-Biloxi International Airport experienced unusually high passenger count in
2010. If this increase in travel was due to disaster response specialists, employment
would have temporarily increased in the spill's aftermath. According to Johnson, "Of the
25,000 people responding to the greatest environmental catastrophe in the history of the
nation, 21,000 are under contract to the foreign oil giant BP."39 An increase of
employment by approximately 4,300 people post-spill is plausible in this context.
However, the increased employment effect only lasted until the protection and
preservation of coastal ecology had been ensured.
Mississippi presents a conflicting case for two reasons. In the immediate
aftermath of the spill, coastal employment in both regressions increased due to the hiring
of disaster response specialists. As the employment was temporary, and contracts
typically did not last longer than a year, the economy eventually began shift back to
equilibrium -- resulting in economic downturn. However, increasing population and
employment in the Gulf Coast counties in tandem with reparation payments has mitigated
that economic downturn. Thus, the impact of the Deepwater Horizon oil spill has been
38 https://www.indexmundi.com/facts/united-states/quick-facts/mississippi/population-growth#map 39 Johnson, "BP's Secret Army Of Oil Disaster Contractors", ThinkProgress, 2010, pg. 1.
33
concealed behind temporary employment and shifting demographics, which explains
slightly negative employment post-commencement of reparation payments.
While the increase in temporary employment and shifting demographics had
positive impact on the Mississippi Gulf Coast, there were due in part to the BP clean-up
efforts. Importantly, these clean-up efforts did not constitute direct compensation from
BP and partners for lost income and economic injury. BP may have paid contractors to
clean up the oil spill, but this was in fact their obligation regardless of economic loss.
Initial reparation payments and resulting economic opportunities may have magnified
population increases for the coastal counties, but this was already occurring naturally
prior to the spill. A reasonable conclusion is that the Deepwater Horizon Economic
Settlement payments for Mississippi have been inadequate as full recovery has not yet
been achieved. However, the extent of inadequacy is indeterminable for two reasons:
temporary employment and shifting demographics. These issues should be addressed
with supplementary data and further linear regression modeling.
5.d. Alabama
Table 5 shows the estimation of coefficients for Alabama. Two regressions are
run for the state, as mentioned in the methodology. Adjusted R2 has been included in the
table to show variation explained by the model.
34
Table 5: Alabama Regression Results
* = significant at 10%. ** = significant at 5 % or less. Standard errors in parenthesis. National GDP in billions of 2009 dollars.
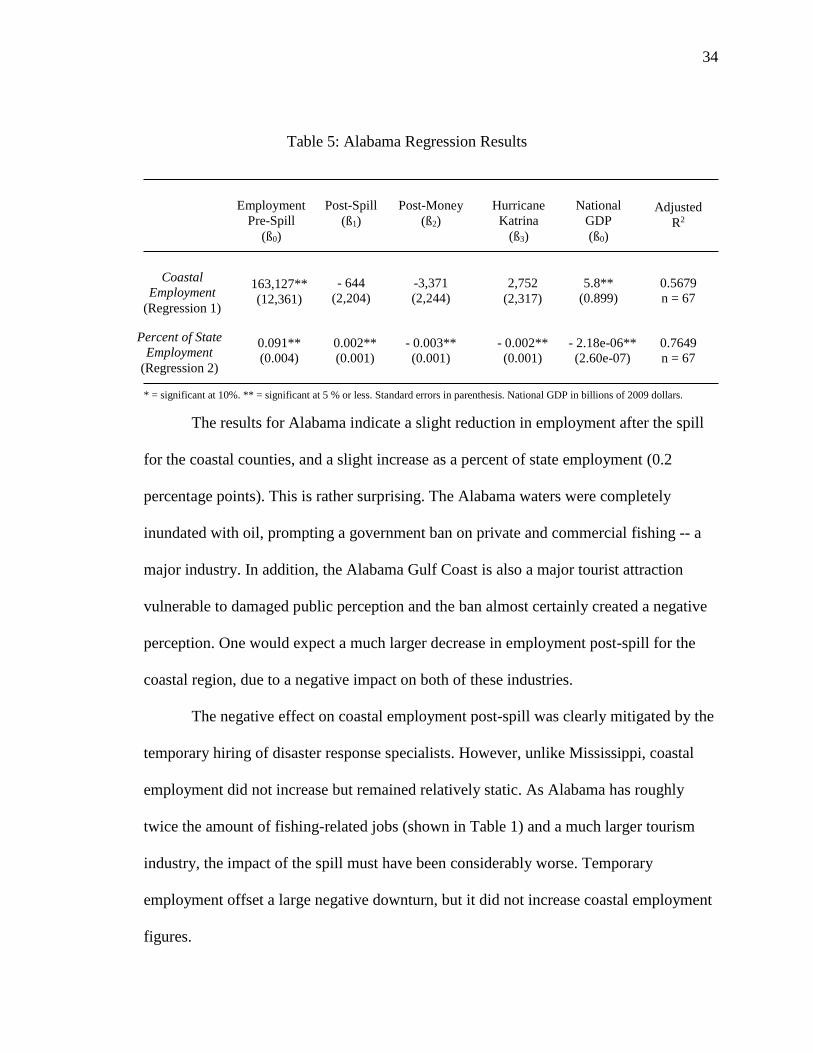
The results for Alabama indicate a slight reduction in employment after the spill
for the coastal counties, and a slight increase as a percent of state employment (0.2
percentage points). This is rather surprising. The Alabama waters were completely
inundated with oil, prompting a government ban on private and commercial fishing -- a
major industry. In addition, the Alabama Gulf Coast is also a major tourist attraction
vulnerable to damaged public perception and the ban almost certainly created a negative
perception. One would expect a much larger decrease in employment post-spill for the
coastal region, due to a negative impact on both of these industries.
The negative effect on coastal employment post-spill was clearly mitigated by the
temporary hiring of disaster response specialists. However, unlike Mississippi, coastal
employment did not increase but remained relatively static. As Alabama has roughly
twice the amount of fishing-related jobs (shown in Table 1) and a much larger tourism
industry, the impact of the spill must have been considerably worse. Temporary
employment offset a large negative downturn, but it did not increase coastal employment
figures.
Coastal
Employment
(Regression 1)
Employment
Pre-Spill
(ß0)
Post-Spill
(ß1)
Post-Money
(ß2)
Hurricane
Katrina
(ß3)
National
GDP
(ß0)
Adjusted
R2
163,127**
(12,361)
- 644
(2,204)
-3,371
(2,244)
2,752
(2,317)
5.8**
(0.899)
0.5679
n = 67
Percent of State
Employment
(Regression 2)
0.091**
(0.004)
0.002**
(0.001)
- 0.003**
(0.001)
- 0.002**
(0.001)
0.7649
n = 67
- 2.18e-06**
(2.60e-07)
35
Post-reparation payments, coastal employment (-3,371) and percent of state
employment (-0.3 percentage points) had larger decreases in employment than
Mississippi, which exhibit slow economic recovery. Similar to Mississippi's case,
Alabama has three growing economic regions: the Huntsville metropolitan area (Madison
County), the Birmingham-Tuscaloosa metropolitan area (Jefferson, Tuscaloosa, and
Shelby counties), and the coastal Mobile metropolitan area (Mobile and Baldwin
counties).40 Population growth by county confirms this trend.41 Although strong
performance by the tourism industry -- starting again in 2011 (shown in Figure 3) -- and
increasing population numbers certainly assisted in Alabama's economic recovery,
consistent economic growth is to be seen.
Alabama's case is similar to that of Mississippi, although comparatively worse.
Temporary employment post-spill returned coastal employment to par, but it did not
increase employment. Post-reparation payments, employment growth was worse than in
Mississippi. Mississippi employs more people along the Gulf Coast -- in all industries --
and thus should see more volatile swings in employment from external shocks, all else
equal. The oil spill had a relatively greater impact on Alabama's large tourism and fishing
industries (shown in Table 1).42 The state is still feeling the effects of those lost revenues.
One conclusion is the Deepwater Horizon Economic Settlement payments for Alabama
have been inadequate; additional research could be done to account for the effects of
temporary employment, shifting demographics, and lost revenue in 2010.
40 https://alabama.reaproject.org/data-tables/selected-indicators/ 41 http://www.indexmundi.com/facts/united-states/quick-facts/alabama/population-growth#map 42 Recall the small post-spill unemployment effect mentioned above was for the costal region as a whole.
36
5.e. Florida
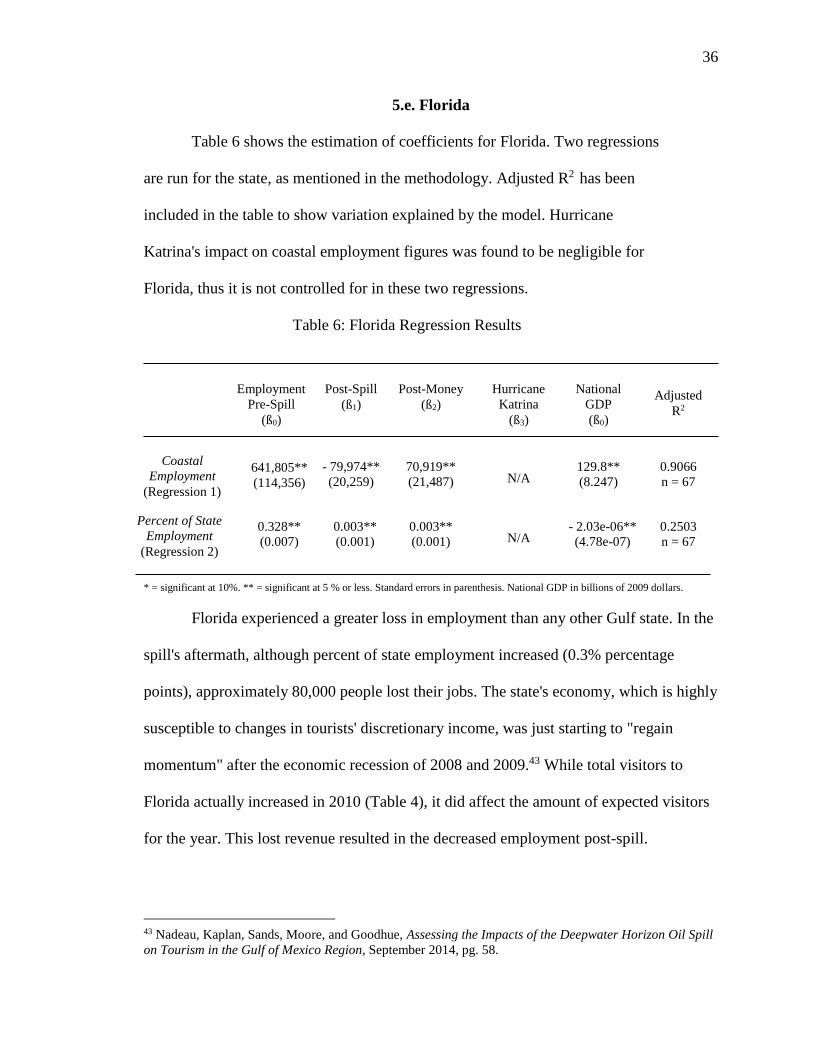
Table 6 shows the estimation of coefficients for Florida. Two regressions
are run for the state, as mentioned in the methodology. Adjusted R2 has been
included in the table to show variation explained by the model. Hurricane
Katrina's impact on coastal employment figures was found to be negligible for
Florida, thus it is not controlled for in these two regressions.
Table 6: Florida Regression Results
* = significant at 10%. ** = significant at 5 % or less. Standard errors in parenthesis. National GDP in billions of 2009 dollars.
Florida experienced a greater loss in employment than any other Gulf state. In the
spill's aftermath, although percent of state employment increased (0.3% percentage
points), approximately 80,000 people lost their jobs. The state's economy, which is highly
susceptible to changes in tourists' discretionary income, was just starting to "regain
momentum" after the economic recession of 2008 and 2009.43 While total visitors to
Florida actually increased in 2010 (Table 4), it did affect the amount of expected visitors
for the year. This lost revenue resulted in the decreased employment post-spill.
43 Nadeau, Kaplan, Sands, Moore, and Goodhue, Assessing the Impacts of the Deepwater Horizon Oil Spill
on Tourism in the Gulf of Mexico Region, September 2014, pg. 58.
Coastal
Employment
(Regression 1)
Employment
Pre-Spill
(ß0)
Post-Spill
(ß1)
Post-Money
(ß2)
Hurricane
Katrina
(ß3)
National
GDP
(ß0)
Adjusted
R2
641,805**
(114,356)
- 79,974**
(20,259)
70,919**
(21,487)
129.8**
(8.247)
0.9066
n = 67
Percent of State
Employment
(Regression 2)
0.328**
(0.007)
0.003**
(0.001)
0.003**
(0.001)
0.2503
n = 67
- 2.03e-06**
(4.78e-07)
N/A
N/A
37
To compensate for economic damage and lost income, BP and partners have paid
almost $2.314 billion to claimants in Florida.44 Post-commencement of reparation
payments, the economy appears to be back on track: coastal employment (70,919) and
percent of state employment (0.3 percentage points) have both increased to sufficient
levels. One conclusion is that the Deepwater Horizon Economic Settlement payments for
the state of Florida are adequate; the Florida Gulf Coast economy is performing and
growing at a trend similar to that preceding the oil spill -- exemplifying full recovery and
compensation.
44 As of September 30, 2016.
38
6. Conclusion
The aim of this paper is to determine whether Deepwater Horizon Economic
Settlement payments to individuals and businesses have been adequate for achieving full
recovery and restoration of the Gulf Coast economy. The results are constructed through
linear regression models on employment figures for the coastal counties of all five Gulf
states. An argument for each state is formed based upon the regression results,
supplemented with outside sources and additional data as needed. It is important to note
that 3.8% of the Deepwater Horizon Economic Settlement claims were not resolved at the
time of data collection.45 This has some, but small, significance on the future condition of
Gulf Coast economic recovery. Nonetheless, the conclusions reached here are accurate:
• The Deepwater Horizon Economic Settlement reparation payments have been
adequate for the economic recovery of Texas and Florida.
• The Deepwater Horizon Economic Settlement reparation payments have been
sufficient for economic growth in Louisiana. Slight additional compensation may
be needed to achieve complete recovery.
• The Deepwater Horizon Economic Settlement reparation payments have been
inadequate for the economic recovery of Mississippi and Alabama. Additional
research could be done to account for the effects of temporary employment,
shifting demographics, and lost revenue in 2010.
45 http://www.deepwaterhorizoneconomicsettlement.com/docs/Court_Status_Report_No_49.pdf
39
A more comprehensive study would look at the effects on individual sectors. It
would include statistics on reparation payments. It would account for related issues with
statistical analysis, such as autocorrelation -- an issue to which time series data are prone.
Finally, a more comprehensive study would look at other economic factors
indeterminable at some point in the future, such as economic recessions and expansions,
which at this point are unknown.
References
Grattan, Lynn M., Sparkle Roberts, William T. Mahan, Patrick K. McLaughlin, W.
Steven Otwell, and J. Glenn Morris. "The Early Psychological Impacts of the
Deepwater Horizon Oil Spill on Florida and Alabama
Communities." Environmental Health Perspectives 119, no. 6 (2011): 838-43.
http://www.jstor.org.umiss.idm.oclc.org/stable/41203353
Lubchenco, Jane, Marcia K. McNutt, Gabrielle Dreyfus, Steven A. Murawski, David M.
Kennedy, Paul T. Anastas, Steven Chu, and Tom Hunter. "Science in Support of
the Deepwater Horizon Response." Proceedings of the National Academy of
Sciences of the United States of America 109, no. 50 (2012): 20212-0221.
http://www.jstor.org.umiss.idm.oclc.org/stable/41830506
Rotkin-Ellman, Miriam, and Gina Solomon. "FDA Risk Assessment of Seafood
Contamination after the BP Oil Spill: Rotkin-Ellman and Solomon
Respond." Environmental Health Perspectives 120, no. 2 (2012): A55-56.
http://www.jstor.org.umiss.idm.oclc.org/stable/41352907
Vigdor, Jacob. "The Economic Aftermath of Hurricane Katrina." The Journal of
Economic Perspectives 22, no. 4 (2008): 135-54.
http://www.jstor.org.umiss.idm.oclc.org/stable/27648281
Economics and Statistics Administration. The Gulf Coast: Economic Recovery Two Years
after the Hurricanes. Report. December 2007. Accessed January 14, 2017.
http://www.esa.doc.gov/sites/default/files/gulfcoast2yrdec2007.pdf
Cohen, Maurie J. "Technological Disasters and Natural Resource Damage Assessment:
An Evaluation of the Exxon Valdez Oil Spill." Land Economics 71, no. 1 (1995):
65-82. doi:10.2307/3146759
Mason, Joseph R. The Economic Cost of a Moratorium on Offshore Oil and Gas
Exploration to the Gulf Region. Report. E.J. Ourso College of Business, Louisiana
State University. July 2010. Accessed March 18, 2017.
http://instituteforenergyresearch.org/wp-content/uploads/2010/07/Mason-
Economic_Cost_of_Offshore_Moratorium.pdf
N/A. Oxford Economics. Potential Impact of the Gulf Oil Spill on Tourism. Report. July
1, 2010. Accessed February 27, 2017.
http://www.gulfcoastdisaster.com/etc/deepwater/files/docs/Gulf_Oil_Spill_Analy
sis_Oxford_Economics_710.pdf
Hyning, Tom V. 2015 Economic Contribution of Travel and Tourism in
Mississippi. Report. 2015. Accessed February 24, 2017.
http://www.visitmississippi.org/app/webroot/files/Mississippi%20Tourism%20Ec
onomic%20Impact%20Report%202015.pdf
Pugh, Aaron. "2014 AL Gulf Coast Tourism Revenue." Gulf Coast Real Estate.
November 8, 2014. Accessed February 24, 2017.
https://www.condoinvestment.com/blog/taxable-tourism-lodging-revenue-for-
2014.html
Nadeau, Lou, Maureen Kaplan, Melanie Sands, Katie Moore, and Charles
Goodhue. Assessing the Impacts of the Deepwater Horizon Oil Spill on Tourism
in the Gulf of Mexico Region. Report. September 2014. Accessed March 12, 2017.
https://www.data.boem.gov/PI/PDFImages/ESPIS/5/5451.pdf
N/A. "Tourism Industry Impacts: the Deepwater Horizon spill." Conversations for
Responsible Economic Development. October 07, 2014. Accessed March 16,
2017. http://credbc.ca/tourism-industry-impacts-the-deepwater-horizon-spill/
Jefferson, John, and Bowling, Nick. The Economic and Biological Impacts of The BP Oil
Spill. Report. Environmental Studies, Hampden-Sydney College. 2011. 9-18.
Johnson, Brad. "BP's Secret Army Of Oil Disaster Contractors." ThinkProgress. June 18,
2010. Accessed March 23, 2017. https://thinkprogress.org/bps-secret-army-of-oil-
disaster-contractors-4e301319e34e#.gvb3oqjoq