Embed Size (px)
Citation preview

An Econometrician Looks at CAPM and Fama-French Models
Paul T. Hunt, Jr.Director of Regulatory Finance and Economics
Southern California Edison Company*
Society of Utility and Regulatory Financial Analysts49th Financial Forum
New Orleans, Louisiana, April 20, 2017
* All opinions expressed herein are those of the author and do not necessarily represent the views of the Southern California Edison Company or its affiliates.

1Society of Utility and Regulatory Financial Analysts 49th Financial ForumApril 20, 2017
• Ph.D. in Economics from Stanford University
• Over 35 years at Southern California Edison Company (SCE)
• Involved in 70+ cases as expert witness
• Cost of capital testimony and case management before California Public Utilities Commission (CPUC)» Generic cases involving more than one utility; outside of General Rate Cases
• Cost of capital testimony before Federal Energy Regulatory Commission» General Rate Cases» Transmission construction work in progress cases
• Co-author, "Cost of Capital in Regulated Industries," in Cost of Capital in Litigation: Applications and Examples (John Wiley & Sons, Inc., 2010); a revised version appears in The Lawyer’s Guide to Cost of Capital: Understanding Risk and Return for Valuing Businesses and Other Investments (ABA (American Bar Association) Publishing, 2014)
My Background
2Society of Utility and Regulatory Financial Analysts 49th Financial ForumApril 20, 2017
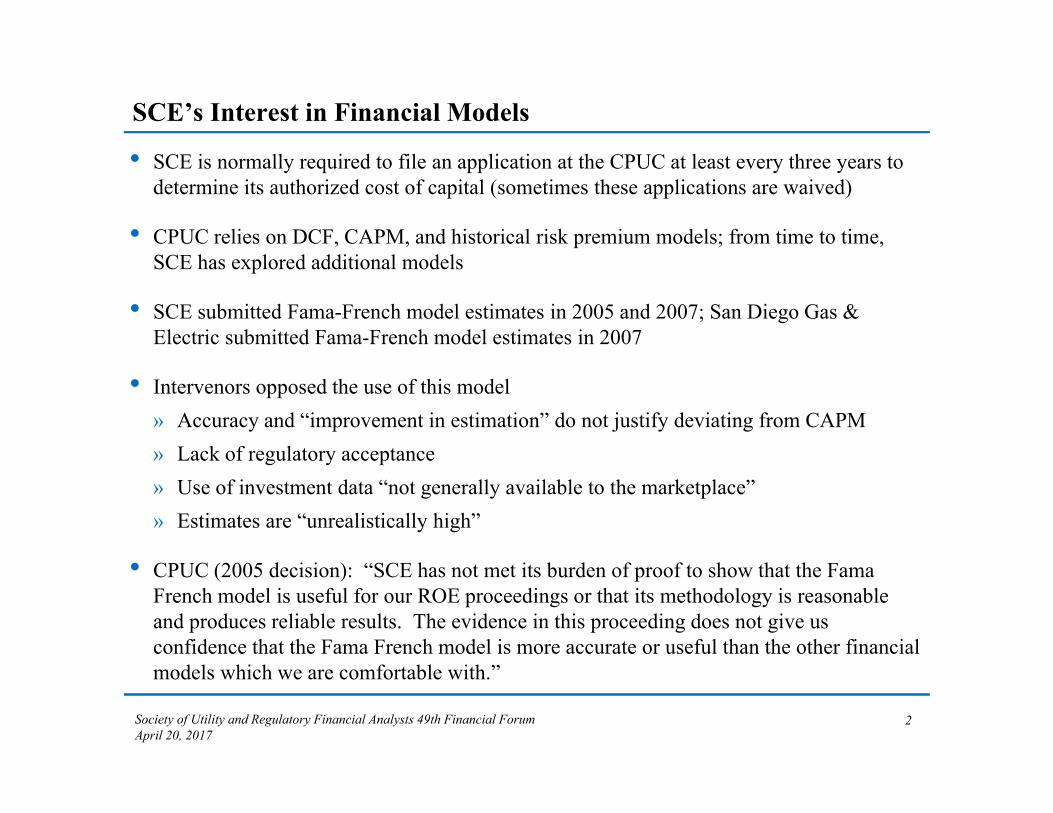
SCE’s Interest in Financial Models
• SCE is normally required to file an application at the CPUC at least every three years to determine its authorized cost of capital (sometimes these applications are waived)
• CPUC relies on DCF, CAPM, and historical risk premium models; from time to time, SCE has explored additional models
• SCE submitted Fama-French model estimates in 2005 and 2007; San Diego Gas & Electric submitted Fama-French model estimates in 2007
• Intervenors opposed the use of this model» Accuracy and “improvement in estimation” do not justify deviating from CAPM» Lack of regulatory acceptance» Use of investment data “not generally available to the marketplace”» Estimates are “unrealistically high”
• CPUC (2005 decision): “SCE has not met its burden of proof to show that the FamaFrench model is useful for our ROE proceedings or that its methodology is reasonable and produces reliable results. The evidence in this proceeding does not give us confidence that the Fama French model is more accurate or useful than the other financial models which we are comfortable with.”

3Society of Utility and Regulatory Financial Analysts 49th Financial ForumApril 20, 2017
Financial Models Compared
• Capital Asset Pricing Model (CAPM)» Developed by Sharpe, Lintner, and Treynor in the 1960s» E (Ri) = Rf + βi [ E (Rm) - Rf ] » Expected return or required return equals risk-free rate plus beta multiplied by the
market risk premium» Currently used in many state jurisdictions in the United States» However, CAPM does not explain all features of observed returns
• Three-Factor Fama-French model (FF3)» Developed by Fama and French in the 1990s» E (Ri) = Rf + Bi E(MKT) + Si E(SMB) + hi E(HML) » Adds size premium (SMB) and financial distress premium (HML) to CAPM model
– SMB is difference in returns between small and big companies– HML is difference in returns between high book-to-market and low book-to-market
companies» Used by SCE in 2005 and 2007 and SDG&E in 2007» Has appeared sporadically elsewhere (Nevada, 2005-2009)
4Society of Utility and Regulatory Financial Analysts 49th Financial ForumApril 20, 2017
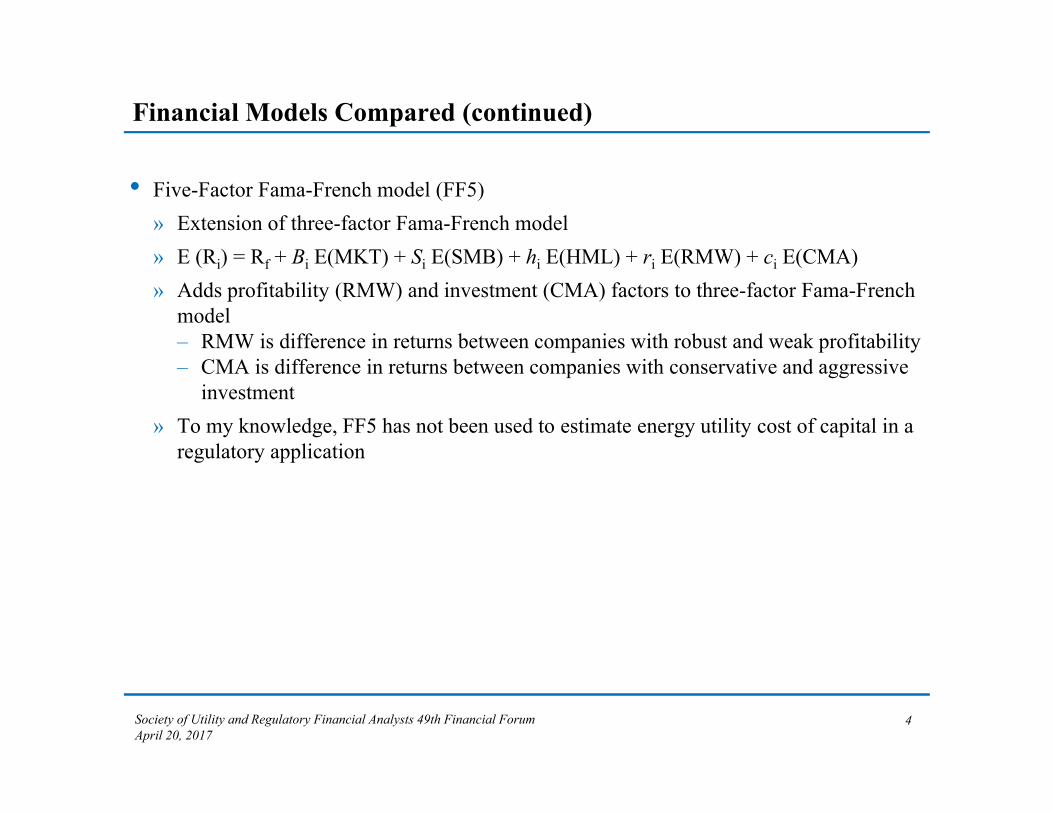
Financial Models Compared (continued)
• Five-Factor Fama-French model (FF5)» Extension of three-factor Fama-French model» E (Ri) = Rf + Bi E(MKT) + Si E(SMB) + hi E(HML) + ri E(RMW) + ci E(CMA)» Adds profitability (RMW) and investment (CMA) factors to three-factor Fama-French
model– RMW is difference in returns between companies with robust and weak profitability– CMA is difference in returns between companies with conservative and aggressive
investment» To my knowledge, FF5 has not been used to estimate energy utility cost of capital in a
regulatory application

5Society of Utility and Regulatory Financial Analysts 49th Financial ForumApril 20, 2017
Research Questions
• Do FF3 and FF5 explain observed returns better than the CAPM?» FF models should, since they are an extension of the CAPM with additional variables» How much better?
• How do FF3, FF5, and CAPM estimates of the cost of equity compare?» In SCE’s previous analyses, FF3 yielded higher estimates of the cost of equity; is that
still true?» What estimates does FF5 produce?
• Are FF3 and FF5 results stable (when compared to prevailing interest rates) over time?» Most regulatory jurisdictions in the United States do not examine cost of capital every
year» If results are unstable over time, or unstable when compared with prevailing interest
rates over time, then use of FF could seriously overestimate or underestimate the true cost of equity for a utility for periods outside the sample period

6Society of Utility and Regulatory Financial Analysts 49th Financial ForumApril 20, 2017
Data, Estimation Periods, and Forecast Period Data
• Sample: 33 Value Line electric utilities (some are dropped due to insufficient data)
• Models estimated for 2012-2016» Each estimation based on five years of monthly historical data ending in December
• Forecast values of factors set equal to historical average from July 1963 (when history begins for RMW and CMA) through the end of the month immediately preceding the estimation period» Example: model for 2016 estimated on monthly data from January 2012 through
December 2016. Forecast values of factors equal historical average from July 1963 through December 2011
• Forecast long-run risk-free rate equals 3.0%

7Society of Utility and Regulatory Financial Analysts 49th Financial ForumApril 20, 2017
Explanatory Ability
• How many individual utility estimates are statistically significant?» F-test on significance of coefficients other than the constant» Other criteria for explanatory ability could be used, but F-test gives a “bright line”
standard
• Generally, the Fama-French estimates have superior explanatory power
Estimation Period CAPM
Fama-FrenchThree-Factor
Fama-FrenchFive-Factor
Number of Utilities
2012-2016 8 5 11 332011-2015 12 7 12 332010-2014 26 18 19 332009-2013 28 26 32 332008-2012 33 32 32 33
Table 3Number of Utilities with Coefficient Estimates at the
5% Level of Significance for the CAPM and FF Models

8Society of Utility and Regulatory Financial Analysts 49th Financial ForumApril 20, 2017
Improvement in Explanatory Power
• Does CAPM or FF explain a greater share of the variation in individual company returns?» Adjusted R-squared measures the proportion of variation in observed returns that is
explained by the CAPM and FF regression models» Adjusted R-squared exacts a penalty as right-hand variables are added
• Fama-French estimates have higher adjusted R-squared values than CAPM estimates; thus have better explanatory power
Estimation Period
Average CAPM
Adjusted R-Squared
Average Fama-FrenchThree-Factor
Adjusted R-Squared
ImprovementOver CAPM
Average Fama-FrenchFive-Factor Adjusted R-Squared
Improvement Over
Three-FactorFama-French
2012-2016 0.0212 0.0292 0.0080 0.0843 0.05512011-2015 0.0481 0.0409 -0.0072 0.0936 0.05262010-2014 0.1237 0.1194 -0.0043 0.1396 0.02012009-2013 0.1702 0.1764 0.0062 0.2352 0.05882008-2012 0.2458 0.2703 0.0245 0.2962 0.0259
Table 2Improvement in Explanatory Power

9Society of Utility and Regulatory Financial Analysts 49th Financial ForumApril 20, 2017
Statistical Significance of SMB, HML, RMW and CMA Coefficients
• Another way to evaluate the performance of FF is to look at the statistical significance of SMB, HML, RMW, and CMA coefficients.» Significance has declined; reflects smaller improvement in explanatory power in later
periods
10Society of Utility and Regulatory Financial Analysts 49th Financial ForumApril 20, 2017
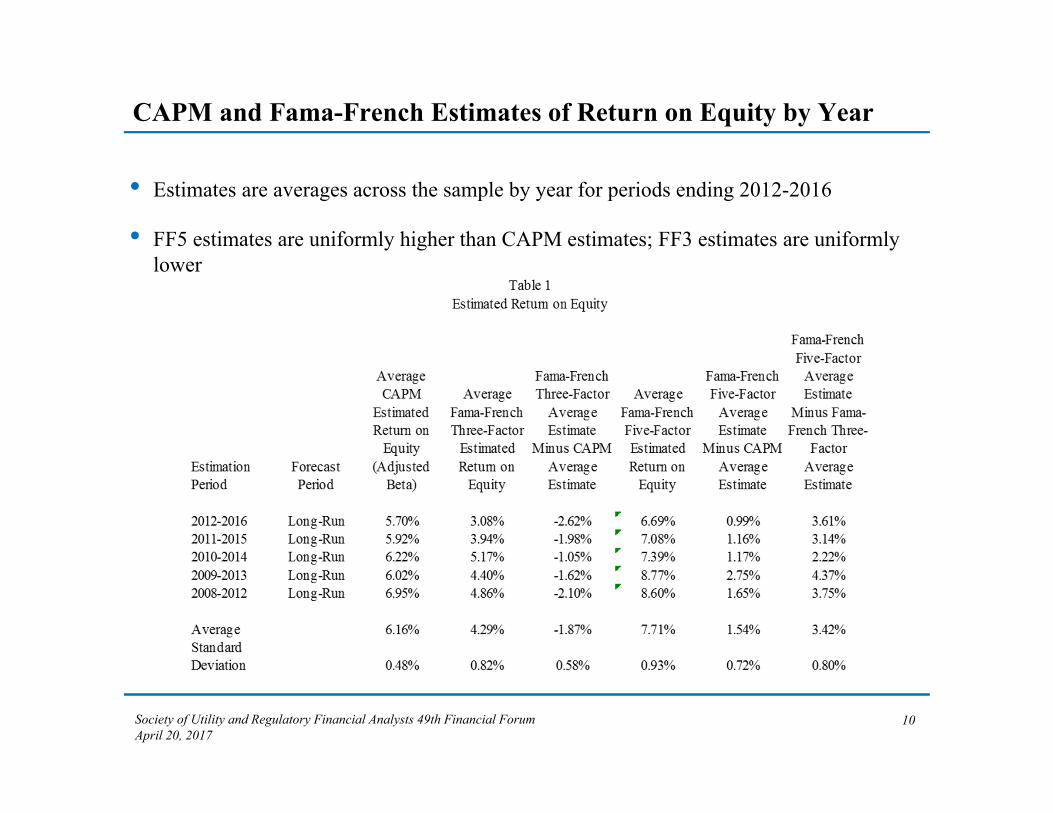
CAPM and Fama-French Estimates of Return on Equity by Year
• Estimates are averages across the sample by year for periods ending 2012-2016
• FF5 estimates are uniformly higher than CAPM estimates; FF3 estimates are uniformly lower

11Society of Utility and Regulatory Financial Analysts 49th Financial ForumApril 20, 2017
Comparisons of Estimated Returns on Equity for 2016
• The distributions of CAPM, and FF5 estimated returns on equity (ROE) for 2016 are shown.» Vertical axis shows number of utility-specific ROE estimates falling within each
interval
0
1
2
3
4
5
6
7
8
9
10
11
12
13
14
15
16
17
18
Num
ber
of U
tiliti
es in
Ran
ge
ROE Ranges
Distribution of 2016 Fama-French Five Factor and CAPM ROE EstimatesFF5 CAPM
12Society of Utility and Regulatory Financial Analysts 49th Financial ForumApril 20, 2017
Conclusion
• The Fama-French model is a viable model for estimating electric utility cost of capital but estimates over recent periods suggest that the five-factor version may be a better choice over the three-factor version
• Inclusion of the Fama-French model in the set of “acceptable” models does not mean that any other model should be removed from that set