Embed Size (px)
Citation preview

An arms dealer shows his wares, the pr ices of which rose dramatical ly when civ i l war broke out in neighbouring Syr ia. Beirut, Lebanon, 2012. © Marwan Tahtah

Price WatchARMS AND AMMUNITION AT ILLICIT MARKETS
INTRODUCTIONIn the run-up to the withdrawal of NATO-led troops—scheduled for the end of 2014—prices for illegal arms in
Afghanistan have soared dramatically. The price for an AK-47 rifle tripled during 2012. As an Afghan civilian explained,
‘People are saying security will collapse, or soldiers will join warlords or the Taliban, so we need something to protect
our families when there’s a crisis’ (Petty, 2012).
The prices of illicit firearms and their relation to security dynamics have attracted interest among journalists and
researchers for some time. In Afghanistan, for example, the recent price increase spurred speculation that the security
situation in the country would soon deteriorate. Analysts also argue that prices provide an indication of arms avail-
ability, ‘demonstrating whether or not they can be easily obtained’ (Karp, 2002, p. 65). Statistical analysis has even
suggested that lower Kalashnikov rifle prices lead to an increased risk of civil war (Killicoat, 2007, p. 258).
Despite continued coverage of arms prices, analysis has been constrained by the difficulties inherent in gathering
information from illicit markets. Most research has relied on second-hand data, often prices quoted in media reports. The
fact that data collectors generally cover different locations and periods of time—while speaking to different sources—
further hampers the comparability of the data. Information on prices for illicitly sold ammunition is particularly scarce.
This chapter seeks to advance current knowledge through a preliminary analysis of price data collected by the Small
Arms Survey between February 2011 and September 2012. This initiative relied on field-based researchers, NGOs, and
other informants with direct access to arms dealers. They collected prices on a monthly basis for both arms and ammu-
nition sold at open-air and underground illicit markets in Lebanon, Pakistan, and Somalia. Consistent with previous
research, surveyed arms dealers and observers identified a series of factors that help to explain variations in the price
of arms and ammunition, including political unrest, activities of armed groups, and official corruption. While recog-
nizing the plurality of these factors, the chapter focuses on the following two questions, drawing primarily from the
quantitative data gathered over the 20-month period:
• Do prices of arms and ammunition exhibit similar variations over time and across locations?
• Is there a relationship between local security-related conditions and the prices of illicit arms and ammunition?
The main findings include:
• Within each surveyed location—Lebanon, Pakistan, and Somalia—the prices of arms and ammunition generally
exhibited similar trend lines.
• Ammunition prices in Lebanon were strongly correlated with reported conflict casualties in neighbouring Syria.
• Behind the generic ‘Kalashnikov’ label hides a variety of models with very different price tags. When different
Kalashnikov variants are available, those chambered for the 7.62 × 39 mm cartridge are much less expensive than
models that use the more recent 5.45 × 39 mm round.
11

252 SMALL ARMS SURVEY 2013
• In addition to calibre, determinants of weapons prices include their condition, the country of manufacture, and
the type of stock (such as wooden or folding)—yet reliable information on some of these features is often hard to
obtain from arms dealers.
• Local perceptions and beliefs associated with particular models also influence arms prices.
• Technical characteristics and local perceptions seem to play a lesser role in determining ammunition prices, result-
ing in smaller price ranges for ammunition than for arms.
This chapter has three sections. The first reviews available literature and presents chapter methodology, data
sources, and limitations. The second section summarizes the main trends and observations emerging from the data
on arms and ammunition prices in the three locations, examining whether the two are correlated. The third section
identifies some of the factors that appear to affect price levels, with a particular focus on local security conditions. Unless
otherwise noted, this chapter draws on investigative and narrative reports submitted by the Survey’s data collectors
in the three countries under review; Annexe 11.1 provides the raw data collected between February 2011 and
September 2012.
UNDERSTANDING ARMS PRICESSmall arms prices have attracted considerable interest from researchers, economists, and policy-makers. This section
reviews current knowledge and presents the data collection process used for this chapter. It also discusses challenges
involved in gathering such information, noting the resulting limitations in the data.
Current knowledge
In places where data on weapons stockpiles and transfers is non-existent, illicit market prices are relied on to provide
an indication of how difficult it is to obtain arms (Karp, 2002, p. 65; Chivers, 2010, p. 381). The most significant quan-
titative study to date compares Kalashnikov rifle price data across countries, using a supply and demand model.1 It
finds that several supply-side factors influence arms prices, noting that:
• The more effective a country’s regulations,2 the higher weapons prices will be.
• Countries with more porous borders tend to have lower weapons prices. [. . .]
• [Rises] in the military spending of neighbouring countries tend to reduce weapons prices in a particular country [. . .].
• [A surfeit of] weapons in post-conflict environments keep[s] prices low and contribute[s] to the risk of conflict through-
out the region for some time after the conflict has ended (Killicoat, 2007, pp. 257–58).
Another particularly significant finding from this study is that ‘cheaper weapons prices lead to an increased risk
of civil war, independently of other conflict risk factors’ (Killicoat, 2007, p. 258). This suggests that monitoring arms
prices has utility from an early warning perspective, with low prices being among the factors that should raise the alarm
about a possible outbreak of conflict.
Research also notes that, once a war has begun, ‘the relationship between weapons prices and the intensity and
duration of conflict takes on a different dynamic’, with arms prices typically increasing dramatically in the early stages
of conflict (Killicoat, 2007, p. 270). Indeed, observers have noted that rising arms prices in Afghanistan, Syria, and Iraq
could reflect ‘rising expectations of violence in the future’ (Petty, 2012; Chivers, 2012a; Barr, 2007). In markets fuelled by
conflict-driven demand, high and rising prices reflect an expectation that the security situation will continue to deteriorate.
Arms prices
typically increase
dramatically in the
early stages of
conflict.

ILLICIT MARKET PRICES 253
In post-conflict settings, prices for military rifles tend to plummet. The FN FAL rifle, for instance, sold for just
USD 500–800 in Libya in February 2012, a sharp decrease when compared with the thousands of dollars it was worth
at the height of the 2011 conflict (Spleeters, 2012a, pp. 16–17). After conflict, more concealable weapons, such as pistols
and the associated ammunition, tend to be sold at inflated prices. Also in Libya in February 2012, the FN Browning
HP pistol sold for USD 2,400–3,200, and a 9 × 19 mm cartridge cost more than USD 6, even though these items were
hardly in demand during the 2011 civil war (Jenzen-Jones, 2013, p. 3; Spleeters, 2012a, p. 17).
Despite continued interest in the prices of illicit arms, many questions remain unanswered. While the Killicoat
study finds that several ‘supply-side’ factors affect arms prices, it also notes that ‘all proxy measures for motivation
proved insignificant for explaining weapons prices’ (Killicoat, 2007, p. 266). The tested proxies included lagged income
growth, the proportion of young men in the population, civil war onset, and homicide rates (p. 264). This means that
existing models do not help explain what motivates individuals to buy weapons.
The inherent difficulties of gathering systematic information from illicit markets represent a second set of limitations.
The available comparative studies have relied on second-hand data—often prices as quoted in media reports—which
can fail to capture important information such as the precise type of weaponry, the quantities traded, the location of
the transaction, and the characteristics of the trading parties (Killicoat, 2007, p. 272). These limitations make the com-
parison of arms prices over time and across settings particularly challenging.
Data on the prices of weapons other than Kalashnikov rifles is rather scarce, despite their importance. As a Lebanese
arms dealer explained in 2010:
I know there is a real problem on the streets right now not just because of the machine guns but because I am
selling so many RPG [rocket-propelled grenade] launchers. People only buy grenades when they think war is com-
ing. An RPG isn’t really a weapon you use to protect your house, but everyone is buying them anyway. Not good
(Prothero, 2010).
Similarly, there is little, if any, available information on prices for illicitly sold ammunition, with a few recent excep-
tions.3 Anecdotal evidence suggests that scarcity of specific types of ammunition makes the associated weapons
unpopular and less used.4 Yet there is insufficient data to confirm this hypothesis.
The data collection process
This chapter analyses arms and ammunition price data collected in the framework of a pilot project initiated in
February 2011. The project was designed to gather information at open-air and underground illicit markets on a regu-
lar basis, with the purpose of generating average monthly prices that can be compared over time. Monthly price data
covering the period February 2011–September 2012 forms the basis for the analysis presented in this chapter.
The project focused on three locations with known, active illicit or informal arms markets where adequate access
to dealers could be established:
• In Lebanon, which lacks open-air arms markets such as those found in Pakistan and Somalia, underground arms
dealers sell a variety of items working from home or on the street.5 The dealers consulted as part of this study
operated in the Bekaa Valley and South Beirut (see Map 11.1).
• In Pakistan, the project monitored the markets of Darra Adam Khel and Bara in the Federally Administered Tribal
Areas (FATA) (see Map 11.2). These arms markets are known not just for their trade in industry-made weapons, but
also for their vibrant local ‘craft’ industry, which is capable of reproducing most industrial models of arms (Shinwari
and Malik, 2004, pp. 10–11; SPADO, 2005, pp. 21–22).6
Prices for military
rifles tend to
plummet in post-
conflict settings.
254 SMALL ARMS SURVEY 2013
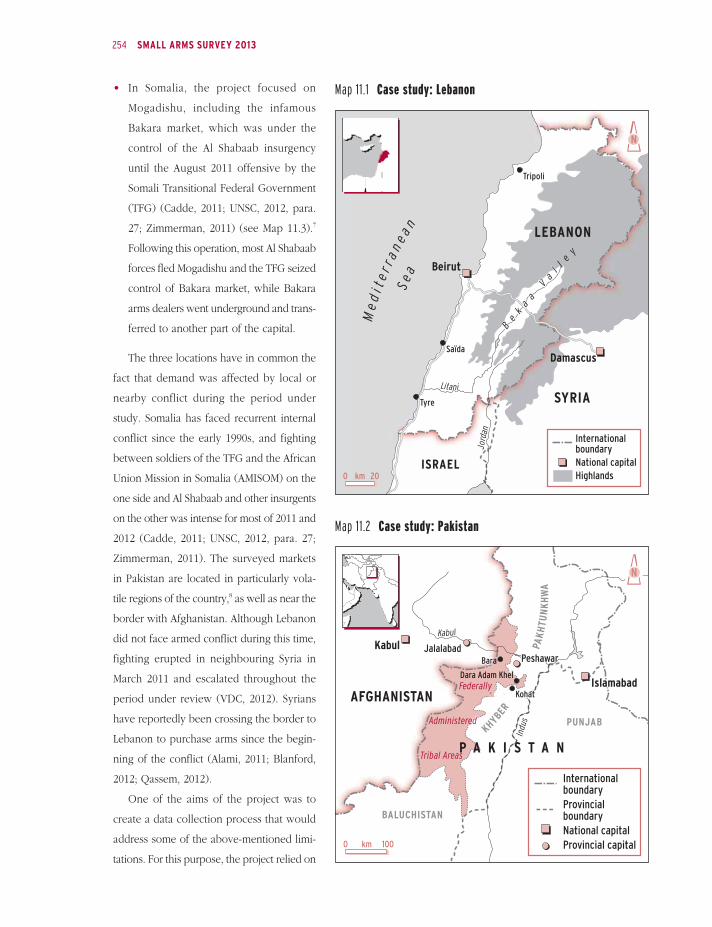
• In Somalia, the project focused on
Mogadishu, including the infamous
Bakara market, which was under the
control of the Al Shabaab insurgency
until the August 2011 offensive by the
Somali Transitional Federal Government
(TFG) (Cadde, 2011; UNSC, 2012, para.
27; Zimmerman, 2011) (see Map 11.3).7
Following this operation, most Al Shabaab
forces fled Mogadishu and the TFG seized
control of Bakara market, while Bakara
arms dealers went underground and trans-
ferred to another part of the capital.
The three locations have in common the
fact that demand was affected by local or
nearby conflict during the period under
study. Somalia has faced recurrent internal
conflict since the early 1990s, and fighting
between soldiers of the TFG and the African
Union Mission in Somalia (AMISOM) on the
one side and Al Shabaab and other insurgents
on the other was intense for most of 2011 and
2012 (Cadde, 2011; UNSC, 2012, para. 27;
Zimmerman, 2011). The surveyed markets
in Pakistan are located in particularly vola-
tile regions of the country,8 as well as near the
border with Afghanistan. Although Lebanon
did not face armed conflict during this time,
fighting erupted in neighbouring Syria in
March 2011 and escalated throughout the
period under review (VDC, 2012). Syrians
have reportedly been crossing the border to
Lebanon to purchase arms since the begin-
ning of the conflict (Alami, 2011; Blanford,
2012; Qassem, 2012).
One of the aims of the project was to
create a data collection process that would
address some of the above-mentioned limi-
tations. For this purpose, the project relied on
Map 11.1 Case study: Lebanon
Map 11.2 Case study: Pakistan
Administered
Kohat
Peshawar
IslamabadKohat
Dara Adam Khel
Bara
Administered
Federally
Tribal Areas
BALUCHISTAN
PUNJAB
PAKHTU
NKHWA
KHYBER
JalalabadPeshawar
Islamabad
Kabul
Kohat
Dara Adam Khel
Bara
Indu
s
Kabul
AFGHANISTAN
P A K I S T A N
0 100km
InternationalboundaryProvincialboundaryNational capitalProvincial capital

ILLICIT MARKET PRICES 255
individuals and institutions with established
access to arms sellers in the selected illicit
markets. The data collectors included, in no
particular order, a local NGO, a journalist,
and vetted local contacts and informants with
experience collecting information from the
surveyed markets. Common working prin-
ciples guided the data collection process.
Specifically, the data collectors:
• inquired about prices of weapons for sale
with a minimum of two local dealers on a
regular basis, preferably twice per month;
• reported monthly minimum and maxi-
mum prices for preselected weapons and
corresponding ammunition that were sold
by local sellers;
• monitored available Kalashnikov variants in each location, distinguishing them by calibre (7.62 × 39 mm or 5.45 ×
39 mm) and by any other features (such as condition or type of stock);
• tracked prices for other available equipment, which consisted primarily of other military rifles of NATO calibre
(5.56 × 45 mm and 7.62 × 51 mm), pistols, general-purpose machine guns, heavy machine guns, and their associ-
ated ammunition; and
• asked dealers to identify any market changes and possible reasons behind them.
The Small Arms Survey then entered monthly minimum and maximum prices for each weapon model and ammu-
nition type in a central database. Weapons and ammunition were generally sold in US dollars (USD) in both Lebanon
and Somalia. In Pakistan, the rupee (PKR) was used at the markets and PKR values were kept for the analysis of trends.
When arms and ammunition prices for Pakistan are provided in USD for comparative purposes, average monthly
exchange rates were used for the conversion.
In all three countries, the data collected typically referred to amounts to be paid for small transactions, usually
involving one or very few weapons. Typical customers included local individuals and businessmen acquiring weapons
and ammunition for self-defence, protection, and other purposes; some probably acted as intermediaries or resellers
of small quantities of weapons, such that some of the sold arms may have ended up with armed groups or other
organizations. Regardless of the end user and use, the prices reviewed here do not refer to large, wholesale purchases.
While this chapter provides unit prices to allow for comparisons, it should be noted that cartridges were usually sold
in packages of 10 in Pakistan, 50 in Lebanon, and 30 to 100 in Somalia.
Caveats
Despite efforts to standardize methodology, full comparability of data across locations remains elusive. In Pakistan,
the data collectors visited different dealers every month; in Lebanon and Somalia, they regularly contacted dealers with
whom they were already acquainted. Even in the context of a single location, different sources sometimes provided
Map 11.3 Case study: Somalia

256 SMALL ARMS SURVEY 2013
conflicting information. In Mogadishu, for instance, the Survey worked with a total of five data collectors, each of
whom consulted different sellers. Two of these data collectors provided reports for most of the 20-month period under
study, yet the other three were not as reliable and were occasionally tasked only with cross-checking specific informa-
tion. At times, the main two data collectors provided contradictory information, especially with respect to Kalashnikov-
pattern rifles (7.62 × 39 mm variants) and 7.62 × 39 mm ammunition, with significant discrepancies in the prices of
these items after the TFG offensive of August 2011. As a result, analysis of Mogadishu data in the chapter relies on
reporting by one data collector who seemed the most reliable based on cross-checking of information, his responses
to probing questions, and the depth of his narrative reports, as well as his ability to provide evidence such as photos
of the materiel sold.
In Pakistan and Lebanon, where the Survey relied mainly on one data-collecting individual and organization, cross-
checking was undertaken mainly through peer review and the checking of other sources.9 Lastly, in the case of
Lebanon, local authorities’ crackdown on dealers and rising tensions in Syria made regular consulting with sellers more
difficult, with the result that the data collector provided incomplete reports between February and September 2012.10
Another challenge lay in distinguishing between weapon types based on limited information provided by dealers.
This was particularly true for Kalashnikov-pattern rifles (7.62 × 39 mm variants), which dealers priced on the basis of
different criteria in each location. In Pakistan, for instance, different price ranges applied based on whether the rifle was
An arms dealer repairs a Kalashnikov rif le at his shop in Landikotal, Pakistan’s Federally Administered Tribal Areas, December 2012. © Shahid Shinwari/Reuters

ILLICIT MARKET PRICES 257
Russian-, Chinese-, or locally made—and
based on its condition (unused or second-
hand). In Lebanon, Russian Kalashnikovs
were sold at a different price than were
Bulgarian, Chinese, and East German vari-
ants, which were all grouped into the same
price range. In Somalia, the condition and
the type of stock (wood or folding) affected
prices. These inconsistent price groupings
resulted in broad price ranges in all three
locations for Kalashnikov-pattern rifles (7.62
× 39 mm variants).
To allow for comparative analysis over
time and across locations, this chapter uses
the average price per month (calculated as
[minimum price + maximum price]/2) as the
unit of analysis. This fails to capture the broad
ranges for generic weapon models, such as
Kalashnikov-pattern rifles (7.62 × 39 mm
variants). The chapter separates Pakistan’s
locally crafted firearm replicas from indus-
trial products, given that industrially pro-
duced weapons cost up to ten times more
than the craft equivalents (see Table 11.1).
Significantly, weapons are also distinguished
by calibre; this point is especially important
with respect to Kalashnikov rifles, since the
AK-74 series is chambered for 5.45 × 39 mm
ammunition, whose availability may differ
from that of original 7.62 × 39 mm cartridges
used in the AK-47 and AKM models.
ARMS AND AMMUNITION PRICESThis section provides a general overview of
the arms and ammunition prices collected
by the Small Arms Survey between February
2011 and September 2012. It focuses on a
limited set of weapons and ammunition types
Cou
ntry
Leba
non
Paki
stan
Som
alia
Indu
stry
-mad
eLo
cally
cra
fted
rep
licas
Type
s of
wea
pon
and
amm
unit
ion
Wea
pon
Amm
uniti
onW
eapo
nAm
mun
ition
Wea
pon
Amm
uniti
onW
eapo
nAm
mun
ition
Pist
ols
Brow
ning
/9 ×
19 m
m2,
008
1.10
Mak
arov
/9 ×
18 m
m
88
80.
6070
0.20
1,681
2.60
Mili
tary
rifl
esAK
-47
and
AKM
var
iant
s/7.
62 ×
39
mm
1,606
1.20
1,205
0.60
148
0.20
731
0.60
AK-7
4/5.
45 ×
39
mm
2,89
91.5
020
50.
30
AKS-
74U/
5.45
× 3
9 m
m4,
073
1.50
FN F
AL v
aria
nts/
7.62
× 5
1 mm
972
0.70
M16
var
iant
s/5.
56 ×
45
mm
2,84
70.
903,
334
0.30
289
0.20
Gene
ral-
purp
ose
mac
hine
gun
PKM
pat
tern
/7.6
2 ×
54R
mm
3,98
40.
70
6,
808
0.70
Heav
y m
achi
ne g
unDS
hK p
atte
rn/12
.7 ×
108
mm
7,99
50.
50
Note
s: A
ll pr
ices
refle
ct th
e av
erag
e of
mon
thly
pric
es fo
r the
per
iod
Febr
uary
201
1–Se
ptem
ber 2
012,
with
the
exce
ptio
n of
loca
lly a
nd in
dust
ry-m
ade
Maka
rov
pist
ols
and
9 x
19 m
m a
mm
uniti
on in
Pak
ista
n (M
arch
201
1–Se
ptem
ber 2
012)
, and
the
Maka
rov
pist
ol a
nd 9
x 19
mm
am
mun
ition
in S
omal
ia
(Oct
ober
201
1–Se
ptem
ber 2
012)
. Ave
rage
am
mun
ition
pric
es a
re ro
unde
d to
the
near
est t
enth
to a
void
fals
e pr
ecis
ion.
For
Pak
ista
n, P
KR p
rices
wer
e co
nver
ted
usin
g av
erag
e m
onth
ly e
xcha
nge
rate
s.
Sour
ce: A
nnex
e 11
.1
Tabl
e 11.
1 Av
erag
e pr
ices
per
uni
t, US
D, F
ebru
ary
2011
–Sep
tem
ber 2
012

258 SMALL ARMS SURVEY 2013
in each location, such as Kalashnikov variants and other locally available military rifles. One type of pistol in each
country and, where available, general-purpose machine guns and heavy machine guns are included for comparison
purposes (see Table 11.1). After identifying the main patterns and trends in the data, the section explores the relation-
ship between the prices of arms and those of ammunition.
Weapons prices
Challenges in interpreting Kalashnikov prices
Prices collected for Kalashnikov variants chambered for 5.45 × 39 mm ammunition—such as the AK-74 and AKS-74U—
were significantly higher than those of 7.62 × 39 mm Kalashnikov variants (see Table 11.1). In Pakistan, based on
average prices over the 20-month period, the more modern AK-74 sold for more than twice the price of 7.62 × 39 mm
Kalashnikov models, almost reaching the price of an M16. In Lebanon, the AKS-74U is also more than twice as
expensive as 7.62 × 39 mm Kalashnikov variants. As a shortened but less accurate version of the AK-74, the AKS-74U
has a high price tag that may reflect local perceptions of this particular weapon. Indeed, it is referred to as the ‘Bin
Laden’ on the Lebanese markets, a reference to photographs and videos of Osama Bin Laden featuring the rifle (see
Table 11.2).11 As a result, its price can exceed that of NATO-calibre weapons such as the M16, which is usually more
expensive than original 7.62 × 39 mm Kalashnikov-pattern rifles. Local perceptions of the more common Kalashnikov
models can also have an impact on prices. In Syria in 2012, the uprising ‘bred a set of popular mythologies into the
minds of the men,’ including the belief that Russian-made Kalashnikovs have ‘diamonds’ in the barrel (Spleeters, 2012b).
At the time, these Russian models were being sold for twice the price of the Bulgarian variants.
It is important to note that a wide variety of arms fall under the 7.62 × 39 mm Kalashnikov category, resulting in
significant price ranges. In September 2012, in Pakistan, the price for reportedly Russian-manufactured 7.62 × 39 mm
Kalashnikovs ranged from about USD 760 for a second-hand model to almost USD 1,900 for a new, unused rifle—a
price ratio of 1:2.5. Meanwhile, local replicas sold for just USD 140. The range of prices in Lebanon for the same month
was narrower, with rifles presented as Russian-made selling for USD 1,750–1,800 compared with the USD 1,400 asked
for reportedly Bulgarian, Chinese, and East German variants. In Mogadishu, data collectors reported higher prices for
folding-stock variants of 7.62 × 39 mm Kalashnikovs than for their wooden-stock equivalents.12
Taken together, these varying and sometimes wide ranges provide further illustration of the limitations of compar-
ing generic ‘Kalashnikov’ prices across settings, especially when the models concerned are not clearly described. This
chapter partly addresses this concern by distinguishing Kalashnikov variants by calibre. The condition and country of
production, as well as popular conceptions around particular weapons, appear to be additional criteria that influence
prices. Yet, as outlined above, such information is difficult to gather in a reliable and systematic fashion, partly because
dealers often provide false information in order to obtain the best possible price, or because they group different types
in a similar price range according to local criteria.
The source of the weapon may also affect prices. In Mogadishu, arms that had leaked from government sources
were usually sold at a lower price than similar models smuggled from Yemen or Puntland, presumably due to the
additional transport costs.13 An outstanding question is that of the reliability of locally produced weapon replicas in
Pakistan. Virtually all original, factory-manufactured models, including automatic firearms, are copied and sold for
a tenth of the price, yet little is known about their actual capabilities and use.
Local perceptions of
weapons can have
an impact on prices.

ILLICIT MARKET PRICES 259
Model Nickname (country of use)
Notes
Makarov pistol Dabanacas (Somalia) In Somali, ‘Dhabano’ refers to cheeks, and ‘Cas’ means ‘Red’. The nickname, which can be trans-lated as ‘red-cheeked’, seems to refer to the red plastic pieces embedded on either side of the pistol’s stock.
7.62 × 39 mm Kalashnikov variants
Circle 11 (Lebanon)
Rocket (Lebanon)
Both names refer to factory markings visible on the rifles. The number 11 inscribed in an oblong circle corresponds to the Polish Lucznik (formerly F.B. Radom) factory marking. ‘Rocket’ appears to refer to the Russian Izhevsk factory marks featuring a triangle and arrow.
5.45 × 39 mm Kalashnikov variants
Kalakov (Pakistan) Appears to be used as a generic term for 5.45 × 39 mm Kalashnikov variants, such as the AK-74. Not to be confused with ‘Krinkov’, a name that was apparently devised by Afghani Mujaheddin during the Soviet invasion of Afghanistan in the 1980s and that refers specifically to the AKS-74U.
AKS-74U Bin Laden (Lebanon) The name harks back to the former Al Qaeda leader’s frequent video appearances with the rifle visible in the background (Chivers, 2010, p. 383).
Locally produced Kalashnikov replicas
TT-Kof* (Pakistan) A combination of ‘TT’ in reference to the Tokarev TT pistol and ‘Kof’ for ‘Kalashnikov’. The use of ‘TT’ seems to derive from the fact that the TT-Kof rifle fires pistol ammunition.
Note: * Prices for the TT-Kof rifle in Pakistan are not analysed in this chapter.
Source: Reina (2012); confidential author correspondence with data collectors, February 2011–September 2012
Table 11.2 Selected nicknames of weapons sold at illicit markets
Top photo: A Makarov p isto l , n icknamed ‘Dabanacas’ (meaning red-cheeked), alongside some khat, Hargeisa, Somal i land, 2010. © Jonah Leff
Middle photo: A video image of Osama Bin Laden with an AKS-74U rifle, June 2001. © AFP/TV grab
Bottom photo : An AK-74 pat tern r i f l e , re fer red to as a ‘Ka lakov , ’ a t Bara market , in Pak is tan ’s Federa l ly Admin istered Tr iba l Areas, 2012. © SPADO
Degrees of volatility
In order to measure the extent to which arms prices varied over time and across locations and types, a ‘coefficient of
variation’14 (CV) was calculated for each weapon model. The CV value expresses price volatility, or the extent to which
the price of a weapon for each month differed from its average price over the entire study period. Higher scores
express higher volatility.
The average CV score across weapon models and locations, and over the study period, was 0.17 (see Table 11.3).
The most volatile prices were those of the FN FAL in Lebanon and 7.62 × 39 mm Kalashnikov variants in Somalia
(CV=0.33), while prices for locally produced replicas of the M16 in Pakistan varied the least (CV=0.04). Prices for
military weapons varied more markedly than those of handguns: military rifles and machine guns scored 0.18 and
0.19 on average, respectively, compared with just 0.13 for pistols. Location also matters: volatility of arms prices was
lower in Pakistan (0.13) than in Lebanon (0.19) and Somalia (0.22).
As might be predicted, a single weapon model can experience varying degrees of volatility in different locations.
This is the case, for instance, for 7.62 × 39 mm Kalashnikov variants, which scored 0.12 in Pakistan, 0.19 in Lebanon,

260 SMALL ARMS SURVEY 2013
Rank Location Type Model Number of months of data analysed
Average price in transaction currency*
Standard deviation
Coefficient of variation
1 Lebanon Military rifle FN FAL 16 972 320 0.33
2 Somalia Military rifle Kalashnikov (7.62 × 39 mm variants)
20 731 238 0.33
3 Somalia Machine gun DShK 20 7,995 2,205 0.28
4 Pakistan Military rifle Locally manufactured AK-74
20 18,313 4,029 0.22
5 Lebanon Military rifle Kalashnikov (7.62 × 39 mm variants)
16 1,606 312 0.19
6 Pakistan Military rifle AK-74 20 261,250 50,507 0.19
7 Somalia Pistol Makarov 12 1,681 307 0.18
8 Lebanon Machine gun PKM 16 3,984 675 0.17
9 Lebanon Military rifle AKS-74U 16 4,073 682 0.17
10 Lebanon Pistol Browning 16 2,008 317 0.16
11 Pakistan Military rifle Locally manufactured Kalashnikov (7.62 × 39 mm variants)
20 13,250 1,957 0.15
12 Pakistan Pistol Locally manufactured Makarov
19 6,316 837 0.13
13 Lebanon Military rifle M16 16 2,847 372 0.13
14 Pakistan Military rifle Kalashnikov (7.62 × 39 mm variants)
20 108,450 13,309 0.12
15 Somalia Machine gun PKM 20 6,808 765 0.11
16 Pakistan Military rifle M16 20 299,625 32,406 0.11
17 Pakistan Pistol Makarov 19 79,842 4,646 0.06
18 Pakistan Military rifle Locally manufactured M16
20 25,900 1,083 0.04
Average 0.17
Notes: * Prices are listed in USD for Lebanon and Somalia and in PKR for Pakistan. CV values are rounded to the nearest hundredth and are listed in descending order.
Source: Annexe 11.1
Table 11.3 Volatility of arms prices, February 2011–September 2012

ILLICIT MARKET PRICES 261
and 0.33 in Somalia (see Table 11.3). While this may sound intuitive, it is significant in that it shows that the prices for
illegal weapons depend more on local dynamics than on a single ‘global’ market.
Perhaps less intuitive, and more significant, is the finding that different weapons in the same location experienced
varying levels of price volatility (see Table 11.3). In Lebanon, not only were volatility scores inconsistent across
models, but price trends for some weapons also seemed to diverge. The most striking divergence is the collapse in the
price of the FN FAL between May and September 2012, while prices for other weapon models continued to increase
or remained stable (see Figure 11.1).
In summary, in the studied markets, the prices of weapons belonging to the same category (for instance, military
rifles) can follow different and sometimes conflicting trajectories in a single location. Moreover, prices for long, auto-
matic, or ‘military-style’ weapons appear to have fluctuated more than those of handguns. Previous research has shown
that supply factors such as the effectiveness of a country’s regulatory system, the military spending of neighbouring
countries, and border porosity help in determining the prices of Kalashnikov rifles (broadly defined) across countries
(Killicoat, 2007, p. 257). The evidence reviewed here suggests that additional factors may influence the prices of arms,
and that their impact on different types of arms varies.
Ammunition prices
Calibre matters
This section examines prices for the types of ammunition corresponding to the above-mentioned weapons. The sur-
veyed ammunition includes rounds that originated in the former Eastern bloc (9 × 18 mm, 7.62 × 39 mm, 5.45 × 39 mm,
7.64 × 54R mm, 12.7 × 108 mm) as well as cartridges of NATO standard (9 × 19 mm, 7.62 × 51 mm, 5.56 × 45 mm).
Figure 11.1 Weapons prices in Lebanon, USD, February 2011–September 2012
Browning pistol 7.62 × 39 mm Kalashnikov variants AKS-74U FN FAL M16 PKM
PRICE PER UNIT (USD)
6,000
5,500
5,000
4,500
4,000
3,500
3,000
2,500
2,000
1,500
1,000
500
0
02/2011 03/2011 04/2011 05/2011 07/2011 09/2011 11/2011 01/201206/2011 08/2011 10/2011 12/2011 02–03/ 2012
03–04/ 2012
05–06/ 2012
09/2012
Source: Annexe 11.1
MONTHS

262 SMALL ARMS SURVEY 2013
Prices for Kalashnikov rifle ammunition were higher for the newer types, with 5.45 × 39 mm rounds (for use in the
AK-74 series) more expensive than the original 7.62 × 39 mm cartridges (used in AK-47 and AKM models). In Lebanon,
the former was 25 per cent more expensive than the latter; in Pakistan, the newer rounds cost more than twice as
much as the older variety (see Table 11.1). NATO 7.62 × 51 mm (for the FN FAL) and 5.56 × 45 mm (for the M16)
were cheaper than Kalashnikov rounds in both Lebanon and Pakistan. AK-74 rifles and their ammunition appear to
be unavailable in Somalia.
Ammunition for pistols was particularly expensive in Somalia, much more so than any other calibre reviewed here.
A single 9 × 18 mm cartridge in Mogadishu cost USD 2.60 on average (see Table 11.1). In comparison, pistol ammuni-
tion cost USD 1.10 in Lebanon and USD 0.60 in Pakistan—prices that are more consistent with those of other locally
available ammunition.
Rank Location Model Number of months of data analysed
Average price in transaction currency*
Standard deviation
Coefficient of variation**
1 Lebanon 7.62 × 51 mm 16 0.70 0.34 0.48
2 Lebanon 7.62 × 54R mm 16 0.70 0.30 0.44
3 Lebanon 5.45 × 39 mm 16 1.50 0.49 0.32
4 Lebanon 5.56 × 45 mm 16 0.90 0.29 0.31
5 Lebanon 7.62 × 39 mm 16 1.20 0.35 0.29
6 Somalia 7.62 × 54R mm 20 0.70 0.15 0.22
7 Pakistan 9 × 18 mm 19 52.20 9.54 0.18
8 Somalia 7.62 × 39 mm 20 0.60 0.10 0.18
9 Lebanon 9 × 19 mm 16 1.10 0.16 0.15
10 Pakistan 7.62 × 39 mm 20 55.50 6.64 0.12
11 Pakistan Locally manufactured 5.56 × 45 mm 20 17.30 1.98 0.11
12 Pakistan 5.45 × 39 mm 20 131.80 13.96 0.11
13 Somalia 12.7 × 108 mm 20 0.50 0.04 0.09
14 Pakistan 5.56 × 45 mm 20 30.10 2.63 0.09
15 Pakistan Locally manufactured 9 × 18 mm 19 18.40 1.41 0.08
16 Somalia 9 × 18 mm 12 2.60 0.17 0.06
17 Pakistan Locally manufactured 7.62 × 39 mm 20 19.30 0.98 0.05
18 Pakistan Locally manufactured 5.45 × 39 mm 20 25.90 1.15 0.04
Average 0.19
Notes: * Prices are listed in USD for Lebanon and Somalia and in PKR for Pakistan. Average ammunition prices are rounded to the nearest tenth to avoid false precision.
** CV values are rounded to the nearest hundredth.
Source: Annexe 11.1
Table 11.4 Volatility scores for ammunition prices, February 2011–September 2012

ILLICIT MARKET PRICES 263
Figure 11.2 Arms and ammunition price trends in Lebanon, Pakistan, and Somalia, February 2011–September 2012
LEBANON
Weapons Ammunition
PRICE INDEX VALUES
3.0
2.5
2.0
1.5
1.0
0.5
0
-0.5
-1.0
-1.5
-2.0
-2.5
-3.0
02/2011 03/2011 04/2011 05/2011 07/2011 09/2011 11/2011 01/201206/2011 08/2011 10/2011 12/2011 02–03/ 2012
03–04/ 2012
05–06/ 2012
09/2012
Note: Correlation: R=0.87; P<0.001.
Source: Annexe 11.1
MONTHS
Technical characteristics appear to have less impact on the prices of ammunition than on those of arms. Reported
prices for ammunition often consisted of single values, not ranges. If price ranges were provided for ammunition, they
were usually much narrower than price ranges for associated weapons.15 This suggests that, while design, year, country
of production, and type of stock are important features in determining the price of a weapon, fewer factors seem to affect
the price of ammunition. Further research and more precise identification of ammunition sold at illicit markets is needed
to confirm this finding, however, as smaller price ranges for ammunition may simply reflect a more homogenous supply.
More consistent trends
Calculating coefficients of variation for ammunition prices makes it possible to measure the extent to which ammuni-
tion prices varied from month to month in relation to the average price. As a result, CV values are comparable not only
across types of ammunition, but also with the CV values for weapons prices.
Overall, ammunition prices seem to have been roughly as volatile as arms prices, with an average CV score of
0.19 compared with 0.17 for arms (see Tables 11.3 and 11.4). Yet, at each location, volatility scores for ammunition
prices were more consistent than those of arms prices. The five most volatile prices relate to ammunition in Lebanon,
whose average CV value is 0.33—significantly higher than the 0.19 average score for Lebanese arms prices. In contrast,
ammunition prices show an average CV score of 0.14 in Somalia and 0.10 in Pakistan, both of which are therefore less
volatile than the prices of arms in the same locations. Ammunition for long, automatic firearms scored highest with a
0.20 CV average, compared with just 0.12 for pistol ammunition.

264 SMALL ARMS SURVEY 2013
SOMALIA
Weapons Ammunition
PRICE INDEX VALUES
3.0
2.5
2.0
1.5
1.0
0.5
0
-0.5
-1.0
-1.5
-2.0
-2.5
-3.0
02/2011 03/2011 04/2011 05/2011 07/2011 09/2011 11/2011 01/201206/2011 08/2011 10/2011 12/2011 02/2012 03/2012 04/2012 05/2012 06/2012 07/2012 08/2012 09/2012
Note: Correlation: R=0.84; P<0.001.
Source: Annexe 11.1
MONTHS
PAKISTAN
Weapons Ammunition Local weapons Local ammunition
PRICE INDEX VALUES
3.0
2.5
2.0
1.5
1.0
0.5
0
-0.5
-1.0
-1.5
-2.0
-2.5
-3.0
02/2011 03/2011 04/2011 05/2011 07/2011 09/2011 11/2011 01/201206/2011 08/2011 10/2011 12/2011 02/2012 03/2012 04/2012 05/2012 06/2012 07/2012 08/2012 09/2012
Note: Correlation, industry-made: R=0.77; P<0.001. Correlation, locally made: R=0.75; P<0.001.
Source: Annexe 11.1
MONTHS

ILLICIT MARKET PRICES 265
Arms and ammunition prices generally followed similar trends. Figure 11.2 compares arms and ammunition prices
across settings using standardized indices. These weapons and ammunition indices were calculated by (1) translating
monthly price values for each type of ammunition and weapon model into standardized Z scores, and then (2) calcu-
lating the average monthly Z score for all weapons and ammunition surveyed in each location.16
Analysis of standardized indices shows that arms and ammunition prices usually evolved in the same fashion and
that they were statistically correlated in all three locations (see Figure 11.2). One exception involves the prices of
industry-made ammunition in Pakistan between February and June 2011, which decreased while the prices of arms
increased. This appears to be the result of the sharp decline in the price of only one type of ammunition, the 5.56 ×
45 mm. During the same period, prices for the other three types of ammunition surveyed in Pakistan either remained
stable or increased slightly. Overall, arms and ammunition prices in Pakistan were still statistically correlated, although
to a lesser degree than in Lebanon and Somalia. In Pakistan, the evolution of prices for industry-made arms and
cartridges differed from those of the locally made materiel.
Does the price of ammunition influence that of arms?
Qualitative research has suggested that the availability of ammunition in an area affected by conflict may have an
impact on the popularity and use of the corresponding weapons. Interviews with fighters, for instance, revealed that
combatants do not care for, and sometimes even dispose of, weapons for which ammunition cannot easily be found
locally.17 Translated into pricing analysis, with other things held constant, this should entail that, when ammunition is
cheap, available weapons that chamber it should be in higher demand, and therefore more expensive. At the same
time, locally available weapons that use scarcer and more expensive ammunition should experience lower demand
and should therefore be cheaper.
For this theory to be tested in ideal conditions, one would need to compare the prices of locally available weapons
that have similar capabilities but that use distinct calibres of ammunition. While the weapons studied in this chapter all
have distinct features and capabilities, the four different types of military rifles under consideration—namely 7.62 ×
39 mm Kalashnikov variants, AK-74 variants, the M16, and FN FAL variants—provide a reasonable basis for com-
parison. Indeed, these rifles use four different calibres of ammunition and, although their design, accuracy, and range
vary, they share several common features. Most important, all four weapons are individual combat rifles and can fire
rounds automatically.
The data collected for this study makes it possible to compare average arms and ammunition prices for Kalashnikov
rifles and associated 7.62 × 39 mm ammunition with those of other common rifles across several locations. In the
surveyed markets of Lebanon and Pakistan, the M16—chambered for 5.56 × 45 mm ammunition—is considered one
of the automatic weapons in highest demand, together with 7.62 × 39 mm Kalashnikov variants. The data includes the
‘generic’ AK-74 for Pakistan and the AKS-74U for Lebanon, both of which are associated with 5.45 × 39 mm ammuni-
tion. In Mogadishu, the market for military rifles is dominated by 7.62 × 39 mm Kalashnikov variants. FN FAL variants
and their distinct 7.62 × 51 mm ammunition can be found in other parts of Somalia, however, namely in Puntland
and Somaliland, for which partial price information was collected. FN FAL rifles were also available in Lebanon.
Based on the data reproduced in Table 11.5, the hypothesis of ‘the cheaper the ammunition, the more expensive
the military rifle’ seems to apply only partially. In Puntland, where the 7.62 × 39 mm round is cheaper than the 7.62
× 51 mm cartridge, 7.62 × 39 mm Kalashnikov-pattern rifles tend to be more expensive than FN FAL variants. In
Arms and ammunition
prices were statisti-
cally correlated in
the three surveyed
locations.

266 SMALL ARMS SURVEY 2013
Eastern bloc NATO
7.62 × 39 mm Kalashnikov variants
7.62 × 39 mm AK-74 AKS-74U 5.45 × 39 mm FN FAL variants
7.62 × 51 mm M16 5.56 × 45 mm
Lebanon 1,606 1.20 4,073 1.50 972 0.70 2,847 0.90
Pakistan 1,205 0.60 2,899 1.50 3,334 0.30
Somalia:Puntland
682 0.80 491 1.30
Somalia:Somaliland
677 1.00 677 1.00
Note: The five rifle types are followed by the ammunition for which they are chambered. Average prices are for the periods February 2011–September 2012 for Lebanon and Pakistan, October 2011–April 2012 for Puntland, and October 2011–
September 2012 for Somaliland. Average ammunition prices are rounded to the nearest tenth to avoid false precision.
Source: Annexe 11.1
Table 11.5 Average arms and ammunition prices for five military rifles of different calibre, in USD
Somaliland, where ammunition for both calibres sells at similar prices, both FN FAL and Kalashnikov variants sold at
around USD 680. Prices in Lebanon and Pakistan are much less conclusive. As noted earlier, both the AK-74 variants
and 5.45 × 39 mm rounds are more expensive than 7.62 × 39 mm Kalashnikov variants and their cartridges in both
countries. The same applies to NATO-standard rifles in Lebanon, with the M16 and 5.56 × 45 mm rounds selling at
Figure 11.3 7.62 × 51 mm ammunition and FN FAL rifle price trends in Lebanon, February 2011–September 2012
FN FAL 7.62 × 51 mm
PRICE EXPRESSED AS STANDARDIZED Z SCORE
3.0
2.5
2.0
1.5
1.0
0.5
0
-0.5
-1.0
-1.5
-2.0
-2.5
-3.0
02/2011 03/2011 04/2011 05/2011 07/2011 09/2011 11/2011 01/201206/2011 08/2011 10/2011 12/2011 02–03/ 2012
03–04/ 2012
05–06/ 2012
09/2012
Note: A standardized Z score indicates by how many standard deviations an observation is above or below the average. Expressing price values as Z scores preserves the overall trend line and makes it possible
to compare the prices of arms with those of ammunition on the same scale.
Source: Annexe 11.1
MONTHS

ILLICIT MARKET PRICES 267
higher prices than the FN FAL and its 7.62 × 51 mm ammunition. Comparisons between what appear to be the most
commonly sold models seem to hold better, however. Compared to 7.62 × 39 mm Kalashnikov variants, the M16 rifle
was more expensive and its ammunition cheaper than its Eastern bloc equivalent in both Lebanon and Pakistan.
An examination of trends should also help in understanding the impact of ammunition prices on those of arms.
If the hypothesis of ‘the cheaper the ammunition, the more expensive the military rifle’ holds true, in case of a decrease
(or increase) in ammunition prices, one would expect an increase (or decrease, respectively) in the price of the associ-
ated arm. The available data does not suggest that changes in ammunition prices systematically affect corresponding
arms prices. The information reviewed above shows that, in each studied location, the prices of arms and ammunition
generally followed similar paths over time (see Figure 11.2). This important finding does not necessarily contradict the
hypothesis of an effect of ammunition prices on those of weapons, however. When weapons and ammunition prices
vary in similar ways, they may be driven by the same external factors, such as conflict-driven demand.
Examining cases where prices varied both markedly and unusually yields interesting results. As discussed above,
in Lebanon ammunition prices were particularly volatile and generally followed patterns exhibited by arms prices. Yet
prices for some specific military rifles and associated ammunition followed opposite paths. The price of the 7.62 × 51
mm cartridge, for instance, initially experienced several months of stability, increased significantly between November
2011 and June 2012, and then remained stable and high in September 2012 (see Figure 11.3). Although the price of
the FN FAL—which is chambered for this type of ammunition—increased until December 2011, it stayed stable and
subsequently decreased in May–June 2012, before collapsing again in September 2012.
Figure 11.4 5.56 × 45 mm ammunition and M16 rifle price trends in Lebanon, February 2011–September 2012
M16 5.56 × 45 mm
PRICE EXPRESSED AS STANDARDIZED Z SCORE
3.0
2.5
2.0
1.5
1.0
0.5
0
-0.5
-1.0
-1.5
-2.0
-2.5
-3.0
02/2011 03/2011 04/2011 05/2011 07/2011 09/2011 11/2011 01/201206/2011 08/2011 10/2011 12/2011 02–03/ 2012
03–04/ 2012
05–06/ 2012
09/2012
Note: A standardized Z score indicates by how many standard deviations an observation is above or below the average. Expressing price values as Z scores preserves the overall trend line and makes it possible
to compare the prices of arms with those of ammunition on the same scale.
Source: Annexe 11.1
MONTHS

268 SMALL ARMS SURVEY 2013
Numerous factors could explain this sudden drop in FN FAL prices. A war reporter suggests, for instance, that more
abundant supplies of the rifle in neighbouring Syria during the same period may have contributed to stabilizing and
decreasing prices in Lebanon.18 Reports also indicate that 7.62 × 51 mm ammunition was particularly scarce and expen-
sive in neighbouring Syria, reaching USD 3 per cartridge and making FN FAL rifles ‘useless’ to fighters (Spleeters,
2012b). This provides additional support for a link—even if anecdotal—between ammunition scarcity in the region on
the one hand and the fall in FN FAL prices in Lebanon on the other. Interestingly, demand for this rifle seems to have
declined in favour of other military rifles for which ammunition prices were decreasing. As Figures 11.3 and 11.4
illustrate, in March–April 2012, at the time the price of the FN FAL was collapsing, that of the M16 began to increase.
In other words, FN FAL buyers might have opted to buy other rifles to compensate for the increase in FN FAL ammu-
nition prices.
Overall, the evidence of an effect of ammunition prices on that of the corresponding weapon is mixed. Counter-
examples are easy to find, and where a relationship appears to exist, other factors may also intervene. Yet some
observations made here are worthy of further investigation. When the most commonly available military rifles—such
as 7.62 × 39 mm Kalashnikov variants and the M16 in Lebanon and Pakistan—are expensive, corresponding ammu-
nition prices tend to be low. Similarly, in cases where several military rifles of different calibre are available, unusual
changes in the prices of ammunition can correspond with a reversal in the price trend of the corresponding arm, as
was the case with 7.62 × 51 mm and the FN FAL rifle in Lebanon.
A Syrian rebel f ighter holds an FAL r i f le , A leppo, Syr ia, August 2012. © Muhammed Muheisen/AP Photo

ILLICIT MARKET PRICES 269
PRICES AND SECURITY-RELATED CONDITIONSThis section examines the relationship between the prices of arms and ammunition and local security-related condi-
tions, in particular situations of instability and insecurity. The objective is to better grasp the extent to which illicit
arms and ammunition prices are connected to local events. Local security conditions are considered using several
data sources. First, the data collectors who monitored prices also submitted narrative reports that relate which factors
arms dealers and other informed individuals identified as drivers of market shifts. Second, the section compares price
data with available quantitative information on local conflict intensity.
Notes from the field
Narrative reports from data collectors propose a series of factors that local dealers and other informants cited when
explaining price variations. Table 11.6 provides a summary of these observations, organizing them according to the
supply and demand framework used in Killicoat (2007, p. 264). While it is beyond the scope of the chapter—and
beyond the possibilities of the collected data—to measure and test each of these factors against price trends, these notes
from the surveyed locations are useful in further refining our understanding of local supply and demand for arms and
ammunition and in identifying paths for future quantitative research.
Although the ‘means/income’ component was not directly mentioned by local sources, the decreasing value of
the PKR was cited as contributing to an increase in the price of foreign-made weapons in Pakistan. In identifying pri-
mary motivations for purchasing arms and ammunition, data collectors often cited local security events, such as nearby
fighting, and political tensions surrounding elections or political appointments. Anticipated security events—such as
the prospective intervention of foreign troops in Somalia—reportedly played a role as well. Lastly, in Pakistan, some
seasonal trends appear to affect prices. The tradition of celebratory shooting during Ramadan and Eid reportedly
increases ammunition prices; in addition, the Taliban’s winter break decreases demand while the traditional spring
offensive stimulates it again.
Changes in or events related to the regulatory regime also appear to have played an important role in determining
prices in the three locations. Local government initiatives to shut down markets or track down dealers were repeat-
edly presented as leading to increased prices in the three locations, as were efforts to monitor and control borders
more closely in Lebanon and Pakistan. A programme by local authorities to buy back automatic weapons in Pakistan
reportedly contributed to an increase in their prices. In Somalia, the Al Shabaab insurgency appeared to set limits
on the prices of certain types of ammunition that were sold at the Bakara market and that were becoming expensive
to procure.
The factors in red in Table 11.6 relate to the prices of specific types of arms and ammunition, as opposed to
prices in general. Since the Killicoat study focuses exclusively on one type of arm, the Kalashnikov rifle broadly defined,
it does not address several of these factors. Yet they confirm some of the observations made above. Although not
reported by the data collector, press reports indicated that sabotaged military rifle ammunition was introduced in
Syria in an attempt to weaken the Syrian opposition (Chivers, 2012b). Such a practice may help explain the decreas-
ing prices in neighbouring Lebanon of certain weapon models and ammunition types in March–April 2012. Finally,
narrative reports suggest a number of factors may influence ammunition prices in Somalia, including fighting in
Yemen—a country where Somali dealers appear to procure part of their ammunition—as well as leakage from AMISOM
and TFG holdings.
Local security
concerns were
primary motivations
for purchasing arms
and ammunition.

270 SMALL ARMS SURVEY 2013
Components Factors identified in Lebanon
Factors identified in Pakistan
Factors identified in Somalia (Mogadishu)
Income/means • Falling value of the PKR (+)
Motivation • Political tensions in Lebanon (+)
• Unrest in Syria (+)• Militarization of conflict
in Syria (+)• Free Syrian Army demand
shifts to more sophisti-cated weapons, (-) for common models, (+) for sophisticated models
• Fighting between Pakistan Army and Taliban in Pakistan (+)
• Fighting across the border in Afghanistan (+)
• Celebratory shooting during Ramadan and Eid, (+) for ammunition
• Self-defence (+)• Spring and traditional
Taliban offensive (+)• Winter (-)• High price of M16 linked to
lower ammunition price, (+) for M16
• Arrival of new models on the market, (-) for old models
• Expectation that Ethiopia will intervene militarily in Somalia (+)
• Al Shabaab orders dealers to arm themselves to defend Bakara (+)
• Rearming of clan leaders due to their exclusion from the parliamentary elections (+)
Regulatory • Tightened border controls (+)
• Seizure by the Lebanese Navy of a ship carrying weapons reportedly destined for Syria (+)
• Pursuit of dealers by authorities (+)
• Borders tightly monitored by authorities (+)
• Closure of Bara and other nearby markets by authorities (+)
• Buyback by local authorities (+)
• Markets reopened, (-) especially for locally crafted weapons
• AMISOM and TFG crack-down on markets (+)
• Al Shabaab flee from Mogadishu (-)
• Prices for certain types of ammunition at Bakara market are controlled by Al Shabaab (-)
Supply costs • Saturation of the Syrian market (-)
• Syrian soldiers sell weap-ons to the opposition and to Lebanese dealers (-)
• Smuggling of arms from Syria into Lebanon (-)
• Defeated Al Shabaab combatants flee and sell their arms (-)
• Fighting in Yemen, (+) for ammunition
• TFG receive large amounts of ammunition (-)
• New deliveries of Kalashnikovs and RPGs smuggled from Yemen (-)
• AMISOM troops sell ammunition in exchange for mobile phone credit (-)
• TFG exchange ammunition for khat or sell it for income due to non-payment of salaries (-)
Notes: Supply and demand components in the first column are taken from Killicoat (2007, p. 264). The symbol (+) indicates that a factor was reported to increase prices; in contrast, (-) reflects that a factor
led to a decrease in prices. Factors in red relate to the prices of specific types of arms and ammunition, as opposed to prices in general, which appear in black.
Sources: data collectors’ monthly narrative reports, February 2011–September 2012
Table 11.6 Local supply and demand factors, as reported by data collectors

ILLICIT MARKET PRICES 271
Do prices correlate with conflict intensity?
The three locations reviewed in this chapter have in common their proximity to armed conflict. These conflicts are
internal, as in Somalia; external, as for Lebanon (Syria); or both internal and external, as for Pakistan (Afghanistan).
Because these conflicts were either starting or already active when the collection of arms prices for this chapter began,
it is not possible to examine whether cheaper prices lead to an increased risk of war.
While quantitative data capturing conflict intensity levels is not available for Somalia, one key event during the
research period is worth highlighting given the study’s focus on markets in Mogadishu. In August 2011, following the
TFG and AMISOM offensive, Al Shabaab withdrew most of its troops from the capital. Following this development,
the insurgents mainly carried out ‘hit-and-run’ operations in Mogadishu (Cadde, 2011); subsequently, they faced
increasingly determined opposition from Kenyan and Ethiopian forces and aligned Somali militias in several parts of
the country (UNSC, 2012, para. 27). As noted in Table 11.6, local sources explained that the withdrawal of Al Shabaab
from Mogadishu and its markets—and the associated decrease in local conflict-driven demand—contributed to stabi-
lizing prices after several months of sustained price increases. Figure 11.2 appears to confirm these interpretations, with
arms prices in particular stabilizing after December 2011.
Statistics on conflict casualties and events, although imperfect, provide a basis for measuring the intensity of the
conflicts in Pakistan and Syria. Monthly data on fatalities in Syria is available from the Violations Documentation Center,
which keeps an account of battle-related deaths among civilians, ‘non-civilians’, and regime forces. The organization
recorded more than 30,000 such deaths between March 2011 and September 2012 (VDC, 2012). Monthly figures show
Bakara market, ten days after Is lamist extremist Al Shabaab mi l i tants who had control led the area withdrew abruptly from the capital , Mogadishu, Somal ia, August 2011 . © John Moore/Getty Images

272 SMALL ARMS SURVEY 2013
a rapid and continuous increase in conflict fatalities starting in November 2011, with levels peaking in August and
September 2012. This spike followed stable fatality levels from March to October 2011.
Strikingly, the Syria fatality trend line closely follows the evolution of both arms and ammunition prices in Lebanon.
This finding lends credence to previous observations that, in some contexts, rising arms prices reflect an expectation
among the local population that the security environment will deteriorate (Barr, 2007; Chivers, 2012a; Petty, 2012).
The particularly strong statistical correlation between fatalities and ammunition prices suggests that ammunition prices
may be an even better indicator of such expectations (see Figure 11.5).
The relationship between arms and ammunition prices and conflict intensity in the FATA and neighbouring Khyber
Pakhtunkhwa (KPK) province of Pakistan is much less conclusive. As noted above, prices in Pakistan were the least
volatile, or fluctuated the least compared to their average value, compared to the prices in the two other locations
studied. Available data on conflict intensity seems highly inconsistent from month to month. Figure 11.6 compares
weapons and ammunition price indices for Pakistan with ‘terrorism-related’ fatality levels derived from the South Asian
Terrorism Portal (SATP, 2012); it also reflects the number of security incidents in FATA and KPK reported by the local
media and assembled by Delve Solutions (2012).
The ‘spiky’ patterns of armed violence in Pakistan are clearly different from the more steady arms and ammunition
price trend lines, showing no statistical correlation. While this finding appears to contradict the above findings from
Figure 11.5 Fatalities in Syria vs. arms and ammunition price trends in Lebanon, February 2011–September 2012
Reported fatalities (Syria) Ammunition (Lebanon) Weapons (Lebanon)
PRICE INDICES AND CASUALTIES EXPRESSED AS STANDARDIZED Z SCORES
3.0
2.5
2.0
1.5
1.0
0.5
0
-0.5
-1.0
-1.5
-2.0
-2.5
-3.0
02/2011 03/2011 04/2011 05/2011 07/2011 09/2011 11/2011 01/201206/2011 08/2011 10/2011 12/2011 02–03/ 2012
03–04/ 2012
05–06/ 2012
09/2012
Notes:
Correlation: Syria fatalities and Lebanon weapons price index: R=0.81; p<0.001.
Correlation: Syria fatalities and Lebanon ammunition price index: R=0.93; p<0.001.
When price data covered two months, the average of the corresponding two months of fatality data was used. A standardized Z score indicates by how many standard deviations an observation is above or below
the average. Expressing values as Z scores preserves the overall trend line and makes it possible to compare indicators of armed violence with the prices of arms and ammunition on the same scale.
Source: price data: Annexe 11.1; Syria fatality data: VDC (2012)
MONTHS

ILLICIT MARKET PRICES 273
Lebanon, the two situations need to be put in context. Price monitoring in Lebanon began as tensions started rising
in Syria; they could therefore be expected to increase as the conflict intensified. On the contrary, tensions and insta-
bility in the FATA and KPK province of Pakistan preceded the price data collection period. If comparable pricing data
had been available for the years reaching back to 2001 and the beginning of conflict in neighbouring Afghanistan, the
analysis might have produced different results.
CONCLUSIONThis chapter uses unpublished time-series data gathered in multiple locations in three countries to revisit and build
upon existing knowledge on arms and ammunition prices at illicit markets. It shows that difficult research conditions
at illicit markets do not preclude the creation of a regular data-collection system or the application of basic controls to
improve the quality of data.
A careful review of gathered information shows that arms prices depend on a greater set of variables than ammuni-
tion prices, including their technical features, local symbolism associated with particular models, and the availability
and price of the associated ammunition. In some cases, sudden, unusual shifts in ammunition prices corresponded
with a reversed shift in the price of the associated military rifles. Variations in the prices of different types of ammuni-
tion also appear to be more consistent, and thus more predictable, than trends in arms prices.
Figure 11.6 Armed violence in KPK and FATA vs. arms and ammunition price trends in Pakistan, February 2011–September 2012
Terrorism fatalities Violent incidents Weapons Ammunition
PRICE INDICES AND ARMED VIOLENCE INDICATORS EXPRESSED AS STANDARDIZED Z SCORES
3.0
2.5
2.0
1.5
1.0
0.5
0
-0.5
-1.0
-1.5
-2.0
-2.5
-3.0
02/2011 03/2011 04/2011 05/2011 07/2011 09/2011 11/2011 01/201206/2011 08/2011 10/2011 12/2011 02/2012 03/2012 04/2012 05/2012 06/2012 07/2012 08/2012 09/2012
Note: A standardized Z score indicates by how many standard deviations an observation is above or below the average. Expressing values as Z scores preserves the overall trend line and makes it possible
to compare indicators of armed violence with the prices of arms and ammunition on the same scale.
Source: price data: Annexe 11.1; terrorism-related fatalities: SATP (2012); violent incidents: Delve Solutions (2012)
MONTHS

274 SMALL ARMS SURVEY 2013
Data limitations constrain the analysis of the relationship between illicit arms and ammunition prices and local
security conditions. Yet available information shows a clear link between illicit market prices in Lebanon and conflict
deaths in Syria. The particularly strong correlation between ammunition prices in Lebanon and fatalities of the first 19
months of the conflict in Syria provides additional evidence of the value of monitoring ammunition prices. In this
context, at least, prices for ammunition appear to be a significant indicator of local insecurity, especially during the
outbreak of war. Yet available reporting from conflict zones has tended to neglect this important piece of the puzzle,
focusing on prices for the most common weapons instead.
The chapter illustrates that a focus on prices for ‘Kalashnikov’ rifles is fraught with limitations, a finding that may
be especially relevant to researchers and reporters. Due to the large number of weapon models possibly falling under
this label, the price range tends to be relatively broad. These weapons are priced and sold based on local prefer-
ences and criteria rather than on precise technical features that would enable their identification. Monitoring a more
diverse selection of arms and, importantly, the corresponding ammunition promises to generate a richer analysis of
illicit markets and of their linkages with local insecurity.
An arms dealer who began trading at the age of ten at h is stal l in Bakara market, Mogadishu, Somal ia, June 2006. © Hannah Al lam/Getty Images

ILLICIT MARKET PRICES 275
ANNEXE Annexe 11.1
Arms and ammunition prices in Lebanon, Pakistan, and Somalia, monthly averages
Year
M
onth
W
eapo
nsAm
mun
itio
n
Brow
ning
7.
62 ×
39
mm
Ka
lash
niko
v va
rian
ts
AKS-
74U
FN F
ALM
16PK
M9
× 19
mm
7.62
×
39 m
m5.
45 ×
39
mm
7.62
×
51 m
m5.
56 ×
45
mm
7.62
×
54R
mm
2011
Febr
uary
1,5
0097
52,
900
500
2,25
03,
250
0.80
0.77
0.77
0.50
0.77
0.46
Mar
ch
1,500
975
2,90
050
02,
250
3,25
00.
800.
770.
770.
500.
770.
46
April
1,7
501,3
003,
625
600
2,65
03,
625
1.30
0.83
1.45
0.52
0.73
0.53
May
1,8
251,5
003,
750
775
2,70
03,
750
1.00
1.00
1.45
0.51
0.73
0.50
June
1,8
751,5
003,
750
775
2,70
03,
750
1.00
1.00
1.45
0.51
0.73
0.50
July
1,9
501,6
003,
875
875
2,65
03,
875
1.00
1.00
1.45
0.51
0.73
0.50
Augu
st
1,950
1,700
3,87
590
02,
800
3,87
51.0
01.0
01.5
00.
510.
730.
50
Sept
embe
r 1,9
501,8
003,
875
950
2,80
03,
875
1.00
1.05
1.50
0.51
0.73
0.50
Octo
ber
1,925
1,775
3,87
51,0
002,
750
3,87
51.0
01.0
51.5
00.
510.
730.
50
Nove
mbe
r 1,9
001,9
253,
750
1,050
2,80
03,
875
1.00
1.05
1.50
0.51
0.73
0.50
Dece
mbe
r 2,
250
1,900
4,75
01,4
003,
000
3,87
51.1
01.5
01.5
00.
701.0
00.
70
2012
Janu
ary
2,
250
1,900
4,75
01,4
003,
000
3,87
51.1
01.5
01.5
00.
701.0
00.
70
Febr
uary
–M
arch
2,
250
1,900
4,75
01,4
003,
000
3,87
51.1
01.6
51.5
00.
801.0
50.
80
Mar
ch–A
pril
2,25
01,9
004,
750
1,400
3,00
03,
875
1.30
1.90
1.55
1.00
1.50
1.05
May
–Jun
e
2,25
01,4
505,
000
1,250
3,60
05,
500
1.20
1.67
2.00
1.50
1.55
1.05
Sept
embe
r 2,
750
1,600
5,00
077
53,
600
5,75
01.3
21.3
23.
001.5
01.3
21.5
0
Leba
non
pric
es (p
er u
nit,
in U
SD)

276 SMALL ARMS SURVEY 2013
Year Month Weapons
Makarov 7.62 × 39 mm Kalash-nikov variants
AK-74 M16 Locally manufac-tured Makarov
Locally manufac-tured 7.62 × 39 mm Kalash-nikov variants
Locally manufac-tured AK-74
Locally manufac-tured M16
2011
February n/a 90,000 157,500 225,000 n/a 18,500 25,000 26,500
March 72,500 85,000 160,000 225,000 5,500 18,500 25,000 26,500
April 72,500 87,500 175,000 250,000 5,500 15,000 25,000 26,500
May 72,500 90,000 200,000 275,000 5,500 12,500 25,000 26,500
June 72,500 95,000 217,500 300,000 5,500 12,500 25,000 26,500
July 72,500 107,500 260,000 300,000 5,000 12,500 18,500 24,000
August 80,000 107,500 285,000 300,000 4,750 12,000 17,000 22,500
September 80,000 105,000 272,500 300,000 5,750 11,500 16,000 25,000
October 81,500 105,000 272,500 305,000 5,750 11,500 15,000 25,000
November 81,500 107,500 265,000 320,000 6,500 11,500 15,000 25,000
December 83,000 109,000 275,000 332,500 7,000 12,500 16,500 26,000
2012
January 83,000 107,500 275,000 340,000 7,000 12,500 16,500 26,500
February 83,000 117,500 285,000 320,000 7,000 12,500 15,750 26,500
March 83,000 117,500 300,000 320,000 7,000 13,000 15,750 26,500
April 83,000 120,000 305,000 325,000 7,000 13,000 15,750 26,500
May 83,000 120,000 300,000 325,000 7,000 13,000 15,750 26,500
June 83,000 122,500 305,000 315,000 7,000 13,000 15,750 26,500
July 83,000 122,500 305,000 300,000 7,000 13,000 15,750 26,500
August 82,500 122,500 305,000 300,000 7,000 13,000 15,750 26,500
September 85,000 130,000 305,000 315,000 7,250 13,500 16,500 26,000
Pakistan prices (per unit, in PKR)

ILLICIT MARKET PRICES 277
Ammunition
9 × 18 mm 7.62 × 39 mm
5.45 × 39 mm
5.56 × 45 mm
Locally manufactured 9 × 18 mm
Locally manufactured 7.62 × 39 mm
Locally manufactured 5.45 × 39 mm
Locally manufactured 5.56 × 45 mm
n/a 48 123 34 n/a 19 28 20
34 48 123 34 19 19 28 20
37 48 123 27 19 19 28 15
37 48 123 25 19 19 28 14
37 48 113 25 19 19 28 14
49 48 118 27 13 16 28 14
50 50 120 29 17 19 25 16
50 54 120 29 17 19 25 16
50 55 120 31 18 19 25 19
55 55 125 32 18 19 25 19
57 56 125 32 19 20 26 20
57 56 130 32 19 20 26 19
60 58 130 31 19 20 25 18
60 63 140 31 19 20 25 18
60 63 150 31 19 20 25 18
60 63 155 31 19 20 25 18
60 63 150 28 19 20 25 17
60 64 150 30 19 20 25 17
60 64 150 30 19 20 25 17
60 64 150 33 19 20 25 17

278 SMALL ARMS SURVEY 2013
Yea
r M
onth
W
eapo
nsAm
mun
itio
n
Mak
arov
7.62
× 3
9 m
m
Kala
shni
kov
vari
ants
PKM
DShK
9 ×
18 m
m7.
62 ×
39
mm
7.62
× 5
4R m
m12
.7 ×
108
mm
2011
Febr
uary
n/
a40
06,
000
4,25
0n/
a0.
320.
400.
40
Mar
ch
n/a
415
6,25
05,
050
n/a
0.41
0.49
0.41
April
n/
a42
55,
750
6,00
0n/
a0.
440.
530.
40
May
n/
a47
55,
750
6,00
0n/
a0.
490.
580.
45
June
n/
a49
05,
750
5,50
0n/
a0.
520.
630.
50
July
n/
a45
05,
200
5,00
0n/
a0.
470.
530.
44
Augu
st
n/a
600
6,50
05,
750
n/a
0.56
0.65
0.52
Sept
embe
r n/
a60
06,
500
5,75
0n/
a0.
580.
660.
52
Octo
ber
1,150
550
7,25
09,
000
2.50
0.65
0.60
0.53
Nove
mbe
r 1,1
5067
57,
750
10,0
002.
500.
650.
600.
50
Dece
mbe
r 1,4
2590
07,
500
10,2
503.
000.
670.
600.
50
2012
Janu
ary
1,4
0092
57,
250
9,75
02.
750.
630.
580.
50
Febr
uary
1,8
2592
57,
250
9,70
02.
500.
630.
580.
50
Mar
ch
1,825
975
7,35
09,
700
2.50
0.68
0.80
0.55
April
1,9
0097
57,
350
9,70
02.
500.
680.
800.
53
May
1,9
0097
57,
350
9,70
02.
500.
680.
900.
53
June
1,9
0096
57,
350
9,70
02.
750.
650.
900.
50
July
1,9
0096
57,
350
9,70
02.
750.
630.
850.
50
Augu
st
1,900
965
7,35
09,
700
2.75
0.63
0.85
0.50
Sept
embe
r 1,9
0096
57,
350
9,70
02.
750.
630.
850.
50
Som
alia
pric
es (p
er u
nit,
in U
SD)

ILLICIT MARKET PRICES 279
Year Month Weapons Ammunition
7.62 × 39 mm Kalashnikov variants
FN FAL variants 7.62 × 39 mm 7.62 × 51 mm
2011
October 600 465 0.75 1.25
November 700 475 0.80 1.25
December 650 500 0.80 1.30
2012
January 650 500 0.80 1.30
February 725 500 0.80 1.25
March 725 500 0.80 1.25
April 725 500 0.80 1.25
Puntland prices (per unit, in USD)
Somaliland prices (per unit, in USD)
Year Month Weapons Ammunition
7.62 × 39 mm Kalashnikov variants
FN FAL variants 7.62 × 39 mm 7.62 × 51 mm
2011
October 625 600 1.00 0.50
November 625 600 1.00 1.00
December 700 650 1.00 1.00
2012
January 660 650 1.00 1.00
February 700 720 1.00 1.00
March 700 850 1.00 1.00
April 670 700 1.00 1.00
May 670 650 1.00 1.00
June 690 670 1.00 1.00
July 700 680 1.20 1.20
August 675 650 1.00 1.00
September 710 700 1.00 1.00
LIST OF ABBREVIATIONSAMISOM African Union Mission in Somalia
CV Coefficient of variation
FATA Federally Administered Tribal Areas
KPK Khyber Pakhtunkhwa
PKR Pakistani rupee
TFG Transitional Federal Government of Somalia
USD United States dollar

280 SMALL ARMS SURVEY 2013
ENDNOTES1 The demand side of the model was adapted from Brauer and Muggah (2006).
2 This study used global indices of government effectiveness and democratic accountability to measure governments’ regulations generally and, by
extension, their ability to implement small arms control legislation (Killicoat, 2007, pp. 264, 266).
3 See, for instance, Chivers (2012a); Jenzen-Jones (2013); and Wepundi et al. (2012, p. 59).
4 See Chivers (2012a); Florquin and Pézard (2005, pp. 54–55); Greene (2006, p. 3); Spleeters (2012b).
5 See Blanford (2011); Ibrahim (2008); Prothero (2010); and Qassem (2012).
6 For a documentary on the Darra arms market, see Vice (2009).
7 From November 2011, the project began collecting prices in Burao, Somaliland. In Puntland, data was also gathered over several months. Unless
indicated otherwise, Somali prices in this chapter refer solely to data collected in Mogadishu, however.
8 See SATP (2012).
9 See, for instance, Alami (2011) and Qassem (2012).
10 Only four reports were received during that period, providing price averages for late February–early March, late March–early April, late May–
early June, and September 2012.
11 See also Chivers (2010, p. 383).
12 Confidential author correspondence with data collectors, September 2012.
13 Confidential author correspondence with a data collector, December 2012.
14 The coefficient of variation in this case is the standard deviation (from the average price) divided by the average price.
15 In Pakistan, for instance, the typical monthly price range for 5.45 × 39 mm ammunition stayed within one per cent of its average price. In contrast,
the price range for the AK-74 rifle (chambered for 5.45 × 39 mm ammunition) reached eight per cent beyond its average value. Confidential author
correspondence with data collectors, February 2011–September 2012.
16 A standardized Z score indicates by how many standard deviations an observation is above or below the average. Indices take into account the
price values of all the weapons and ammunition listed in Table 11.1, with the exception of the Makarov pistol and associated 9 × 18 mm cartridge
in Somalia, for which data was incomplete (covering only 12 months). For Pakistan, different indices were calculated to distinguish the prices of
factory-made arms and ammunition from those of locally crafted materiel.
17 See, for instance, Chivers (2012a); Florquin and Pézard (2005, pp. 54–55); Spleeters (2012b).
18 Author correspondence with Damien Spleeters, freelance journalist, November 2012.
BIBLIOGRAPHYAlami, Mona. 2011. ‘As Arab Spring Continues, Black Markets Boom.’ Al Jazeera. 14 May.
<http://www.aljazeera.com/indepth/features/2011/05/201151410154606644.html>
Barr, James. 2007. ‘The Kalashnikov Index.’ Setting the Desert on Fire. Blog. 12 February.
<http://desertonfire.blogspot.fr/2007/02/kalashnikov-index.html>
Blanford, Nicholas. 2011. ‘As Syrian Uprising Escalates, Business Booms for Lebanon’s Arms Dealers.’ Time. 22 May.
<http://www.time.com/time/world/article/0,8599,2073315,00.html#ixzz29wN5ccPM>
—. 2012. Arms Smuggling between Lebanon and Syria. Unpublished background paper. December. Geneva: Small Arms Survey.
Brauer, Jurgen and Robert Muggah. 2006. ‘Completing the Circle: Building a Theory of Small Arms Demand.’ Contemporary Security Policy, Vol. 27,
No. 1. April, pp. 138–54.
Cadde, Aweys. 2011. ‘TFG and AMISOM Battle Al-Shabaab in Mogadishu.’ Somalia Report. 6 September.
<http://www.somaliareport.com/index.php/post/1516/TFG_and_AMISOM_Battle_Al-Shabaab_in_Mogadishu>
Chivers, C. J. 2010. The Gun. New York: Simon and Schuster.
—. 2012a. ‘Arming for the Syrian War: Do Soaring Prices Predict Escalating Conflict?’ At War Blog. The New York Times. 17 July.
<http://atwar.blogs.nytimes.com/2012/07/17/arming-for-the-syrian-war-do-soaring-prices-predict-escalating-conflict/>
—. 2012b. ‘Syrians Place Booby-Trapped Ammunition in Rebels’ Guns.’ The New York Times. 19 October.
<http://www.nytimes.com/2012/10/20/world/middleeast/syrian-government-booby-traps-rebels-ammunition.html?hp&_r=1&&pagewanted=print>
Delve Solutions. 2012. Chronology of Security Events in KPK and FATA, February 2011–September 2012. Unpublished background paper. Geneva:
Small Arms Survey.

ILLICIT MARKET PRICES 281
ACKNOWLEDGEMENTSPrincipal author
Nicolas Florquin
Contributors
Nicholas Blanford, Jonah Leff, Sustainable Peace and Development Organization (SPADO), Ryan Murray, Pilar Reina,
Delve Solutions, and Robin Gut
Florquin, Nicolas and Stéphanie Pézard. 2005. ‘Insurgency, Disarmament, and Insecurity in Northern Mali, 1990–2004.’ In Nicolas Florquin and Eric
Berman, eds. Armed and Aimless: Armed Groups, Guns, and Human Security in the ECOWAS Region. Geneva: Small Arms Survey, pp. 46–77.
Greene, Owen. 2006. ‘Ammunition of Small Arms and Light Weapons: Understanding the Issues and Addressing the Challenges’. In Stéphanie Pézard
and Holger Anders, eds. Targeting Ammunition. Geneva: Small Arms Survey, pp. 1–13.
Ibrahim, Alia. 2008. ‘Fearing a War, Lebanese Prepare by Buying Up Arms.’ Washington Post. 24 April.
<http://www.washingtonpost.com/wp-dyn/content/article/2008/04/23/AR2008042303433.html>
Jenzen-Jones, Nic. 2013. The Headstamp Trail: An Assessment of Small-calibre Ammunition Found in Libya. Working Paper No. 16. Geneva: Small
Arms Survey.
Karp, Aaron. 2002. ‘Red Flags and Buicks: Global Firearm Stockpiles.’ In Small Arms Survey. Small Arms Survey 2002: Counting the Human Cost.
Oxford: Oxford University Press.
Killicoat, Philip. 2007. ‘What Price the Kalashnikov? The Economics of Small Arms.’ In Small Arms Survey. Small Arms Survey 2007: Guns and the
City. Cambridge: Cambridge University Press.
Petty, Martin. 2012. ‘Insight: Afghans Turn to AK-47, Fearing Taliban Return or Civil War.’ Reuters. 17 December.
<http://www.reuters.com/article/2012/12/18/us-afghanistan-guns-idUSBRE8BH00Y20121218>
Prothero, Mitchell. 2010. ‘Lebanon’s AK Index May Be Pointing to War.’ National. 3 February.
<http://www.thenational.ae/news/world/middle-east/lebanons-ak-47-index-may-be-pointing-to-war>
Qassem, Qassem. 2012. ‘Arms to Syria: Theft, Entrapment, and Tampering.’ Alakhbar English. 31 October. <http://english.al-akhbar.com/print/13217>
Reina, Pilar. 2012. Examples of Nicknames for Arms Sold at Illicit Markets. Unpublished background paper. Geneva: Small Arms Survey.
SATP (South Asian Terrorism Portal). 2012. ‘Fatalities in Pakistan Region Wise: 2012.’
<http://www.satp.org/satporgtp/countries/pakistan/database/fatilities_regionwise2012.htm>
Shinwari, Naveed Ahmed and Salma Malik. 2004. A Situation Analysis of SALW in Pakistan and Its Impact on Security. Islamabad: Community
Appraisal and Motivation Programme.
SPADO (Sustainable Peace and Development Organization). 2005. The Prevalence and Impacts of Small Arms and Light Weapons in North-West Frontier
Province and Federally Administered Tribal Areas (FATA) of Pakistan. Peshawar: SPADO.
<http://www.spado.org.pk/researchandpublications_small_arms.htm>
Spleeters, Damien. 2012a. The FAL Rifle in Libya: During and after the 2011 Conflict. Unpublished background paper. Geneva: Small Arms Survey.
––. 2012b. ‘Guerrilla Country.’ Foreign Policy. 15 October.
<http://www.foreignpolicy.com/articles/2012/10/15/Guerrilla_Country_Syria_Jebel_Zawiya>
UNSC (United Nations Security Council). 2012. Report of the Monitoring Group on Somalia and Eritrea Pursuant to Security Council Resolution 2002
(2011). S/2012/544 of 13 July.
VDC (Violations Documentation Center in Syria). 2012. Online database. Accessed 13 January 2013. <http://vdc-sy.org/index.php/en/>
Vice. 2009. ‘The Gun Markets of Pakistan.’ <http://www.vice.com/the-vice-guide-to-travel/the-gun-markets-of-pakistan>
Wepundi, Manasseh, et al. 2012. Availability of Small Arms and Perceptions of Security in Kenya: An Assessment. Special Report No.16. Geneva and
Nairobi: Small Arms Survey and Kenya National Focus Point on Small Arms and Light Weapons.
<http://www.smallarmssurvey.org/fileadmin/docs/C-Special-reports/SAS-SR16-Kenya.pdf>
Zimmerman, Katherine. 2011. ‘Al Shabaab’s Withdrawal from Mogadishu.’ Critical Threats. Washington, DC: American Enterprise Institute. 7 August.
<http://www.criticalthreats.org/somalia/zimmerman-shabaab-retreat-mogadishu-august-7-2011>