Embed Size (px)
Citation preview
An Approach for Improving Business ProcessManagement in Agile Service Networks
Minor Research Report ofDaniel J. Dubois
Matr. 724123
Advisor: Prof. Christos Nikolaou (University of Crete)
Abstract
La ricerca nell’ambito della gestione dei processi di business si sta fo-calizzando nella ricerca di modi efficaci ed efficienti per adattare i processidi business ai rapidi cambiamenti che si verificano a livello di ambiente,di requisiti, di entità con cui si collabora, e di tipi di prodotti/serviziofferti. In un’epoca in cui ormai il costo per memorizzare e trasmet-tere le informazioni è prossimo allo zero, le aziende moderne, così comeogni individuo comune, possono sfruttare questa caratteristica per incre-mentare l’opportunità di stabilire con altri collaborazioni in grado di in-crementare il loro valore. Sotto questa idea ci si è spostati dal concetto di“catena di valore” a quello più completo e più espressivo di “rete di val-ore”. Quello che si propone in questo lavoro è un metodo per modificaredei pattern strutturali frequenti in questo tipo di reti in modo da poteridentificare e utilizzare le informazioni “intangibili” messe a disposizioneda ogni entità appartenente a tale rete. Il fine ultimo è quello di trovaredelle trasformazioni che, trasferendo la conoscenza in modo più appro-priato (ad esempio attraverso un sistema di gestione delle reputazioni),possano aumentare i livelli di fiducia nella rete e ridurre il rischio nellevarie transazioni, determinando perciò un rilevante aumento del valore.In questo modo dopo ogni riconfigurazione della rete, anche tutti i pro-cessi aziendali sottostanti sono adattati di conseguenza in modo da man-tenere la capacità di perseguire gli obiettivi originali. Il lavoro è statointegrato nell’architettura di un sistema di Business Process Management(SN4BPM) e la metodologia è stata esemplificata attraverso l’analisi diun caso di studio aziendale.
1
Abstract
Business Process Management research is focusing on finding effectiveand efficient ways to adapt Business Processes to rapid changing environ-ments, requirements, collaborating entities, and type of offered services.In the Internet era where the cost of storing information and of diffus-ing it is almost zero, modern companies as well as common individualsmay exploit these features to increase the opportunity of establishing newvalue-creation relationships with others. Under this idea we naturallymoved from a vision of a value chain to a more meaningful concept ofvalue network. What we propose in this work is a method for identifyingsome network patterns for exploiting intangible information provided byparticipating entities. The final purpose of this network transformationis to bring the whole business system to a situation in which it producesmore overall value (in terms of customer satisfaction) with less risk forits participants. This way we obtain a service network whose underlyingbusiness processes are adapted in a seamless way while still reflecting theoriginal goals.
1 IntroductionThe research in Business Process Management (BPM) has traditionally focusedon the study of the interactions among companies in the process of offering aproduct of a service. All the steps that are required to convert some value fromthe form of raw materials and/or knowledge to the supply of a final product ora service usually consists of a transformation process that may involve severalother companies or different entities within the same company. Each step ofthis process adds cost to the whole process in terms of time and money. Anefficient process should be able not only to fulfill the requirements, but also tominimize these costs.
The traditional model for these processes started from the supply chainmodel of Porter [22] where he describes a transformation chain from the Supplierto the Customer (through Manufacturer and Dealer) and then evolved to a moregeneral vision in which the former entities where seen as nodes of a network andtheir collaborations as the links of the network. The common name for thesenetworks has been defined as Value Networks or Service Networks [20].
Research in BPM is thus moving on analyzing all the characteristics on everysingle interactions to provide an estimation of the value created by the entireservice network. To achieve this goal many methodologies have been developedfor defining these interactions in a formal way (e.g., Business Process Languagesand Service Level Agreements), for example by identifying the nature of theproduct/service, the contracts for stating its minimal quality characteristics,and information on how to use the service/product in other transformationsteps.
After this research, decisions in value networks have been taken by usingvalue network analysis tools such as [4] that are able to give quantitative eval-uations on the stability of the network, bottlenecks, the resistance to loss ofinteracting partners, as well as the amount of created valued by considering notonly financial costs and revenues, but also intangible aspects such as knowledge,trust, and competence transfer.
What we focus in this work is to identify some patterns in existing service
2
networks and exploit them to reorganize the network by adding the capabilityto rapidly react to dynamic environment conditions and to changes in businessrequirements. The key technology that we are going to exploit is the informativevalue that is given by adding a concept of feedback to every interaction, and byadding a reputation managing system to support the whole infrastructure. Thefinal goal is to increase the total value produced in the systems, especially interms of knowledge and trust that service network participants may use wheninteracting with unknown entities, thus at the end they will be able to reorganizetheir processes in a more “agile” and secure way.
We will finally show first how to apply this methodology in the BPM lifecycledescribed in the SN4BPM [2] model, and second a case study in which weimprove the agility of an existing Car Sharing service network.
This report is organized as follows. Chapter 2 introduces the concept ofService Network and gives some information on the state of the art. Chapter 3describes the problem of the current approaches in BPM in presence of partic-ular situations such as an environment characterized by dynamism and highlyvariable risk, and presents a possible method for automatically transforming thenetwork for dealing with them. In Chapter 4 we show the methodology appliedto the Car Sharing system, and finally Chapter 5 concludes the report.
2 Background Information and Related WorkIn this chapter we will introduce the concept of Agile Service Network [1], inparticular we will focus on the concept of value, on its meaning, and on existingmethods for evaluating it. In the other sections we will recall some notionsthat will be used in the rest of the report, such as the parallelism betweenbusiness systems and ecosystems, the concept of trust, and an existing modelfor managing business processes in service networks called SN4BPM [2].
2.1 Agile Service NetworksAn Agile Service Network, also known as an Agile Service Value Network, orsimply ASN, is defined as a system of interconnected entities with the followingcharacteristics [20, 19, 11, 21, 8, 7, 17]:
• Each entity may be a company or different roles within the same companythat are able to offer one or more services. For example in the servicenetwork of a telephone company there may be an administrative center,many local telephone centers, a customer service, a billing department,and so on.
• The connections among the entities define the relationships among thepartners. Some of these relationships are defined by “contracts” that statethe tangible value exchange between the two entities in terms of paymentor other forms of value. Other connections reflect the intangible valuethat is exchanged as a side effect of contractual relationships. Accordingto some authors the value may be also negative, in such the case it isusually referred as cost.
• The direction of the connections indicates the source of the value and thedestination of the value.
3
• The entities and their connections are allowed to change with a certainlevel of flexibility: this is often referred as the agility of the service network[24].
There is not a dominant standard yet in the representation of these networks.The graphical formalism is usually the corresponding graph, however differentauthors choose to represent and differentiate tangible/intangible interactionswith dashed lines, as well as coloring each interaction with sequence numbersand cost/benefit differences (for negative and positive values).
2.2 Evaluating Agile Service NetworksThe evaluation problem in Agile Service Networks is divided into two sub-problems: the first focuses on the calculation of the value actually created bythe network and its possible evolution over time, the second focuses on analyz-ing structural characteristics of the network such as, for example, its stability,its resistance to loss of interconnections, and the identification of strengths andweaknesses.
2.2.1 Value in Agile Service Networks
Since Agile Service Networks are strongly related to the concept of Value Net-work we need a proper definition of value [10]. Value is defined as the “benefitsof an agent accrued by his participation in the network minus any costs involvedin setting up the network links directly or indirectly”. The problem with thisdefinition is that it is really high level since this “amount of benefits” is sub-jective and involves not only physical transfers of something, but also for otherforms of intangible goods that may not be easy to quantify.
The work described in [12] describes a possible formalism for estimatingvalue and value evolution in an agile (always evolving) service network. In thiswork all the interactions are expressed in terms of offerings and payment flows(offerings and payments occurred per time unit). Then the total revenues for allofferings exported by each participant are computed and used to estimate futurerevenues. However according to this work the total value is not only a simplesubtraction revenues minus costs, but there is another value-contributing com-ponent that the authors call Satisfaction Index. The satisfaction index measuresthe perceived preference for a relationship and it is usually related to revenueexpectations and other intangible facts such as the brand name, quality ex-pectations, and other factors. The meaning of this index is the capability forthe partner to repeat past successes (and thus past revenues). The evaluationof this index in subjective and may be calculated using interviews, market re-search, questionnaires, polls, etc. One open problem of this work is that thecomputation of the satisfaction index is not trivial, since it embeds all the valueinformation about intangible transactions.
2.2.2 Other Metrics for Evaluating Agile Service Networks
In [9] there is a possible definition for the notion of complexity of a ServiceNetwork that is derived over the Shannon’s notion of entropy in informationtheory [25]. The result is that a typical network may require billions of questionsto determine its full status since it reflects the total complexity of its market.
4
The work from Parolini in [20] describes a methodology called “Value NET ”for taking strategic decisions on the service network by doing a qualitative anal-ysis over it to identify bottlenecks, dominant relationships, and to predict theeffects of possible structure/relationship modifications.
Another work from Allee points out some other metrics that may be directlyderived from a network:
• network stability, which is the capability of the network to keep oncreating value and is expressed by the ratio of tangible to intangible ex-changes whose best value should be 1 since a network with more tangibleinteractions has a high level of transparency and good formal structure,but with less trust and less flexibility; while a network with more intan-gible exchanges is usually characterized by strong personal relationshipsand flexibility, but with some broken formal processes.
• network risk, which is related to the “centrality” of network participants:for example, if a role has a great impact on the creation of value and it isthe only one in the network, it means that the network is risky becausesome roles are overburdened with too many inputs and outputs.
Other works from Allee are related to the concept of knowledge value [3] andon an analysis on how to reconfigure the network by considering intangibles[5, 6, 7]. Additional works that try to understand and measure the value ofservices networks may be found in [28, 8, 11, 26]. It is important to notice thatmany areas of complex networks science such as social network theory [13] areproviding ideas and metrics that may be applied in services networks as well.
2.3 Business as EcosystemsService Networks are usually formal representations of whole Business Networks.The interactions among the actors of these networks may be traditionally coor-dinated in two different ways: using hierarchies and markets.
• Hierarchies are based on a rigid hierarchical organization among the actorsof the network, their cost usually grows very fast as the network becomeslarger and more complex.
• Markets are based on a self-coordination among the actors that is basedon the law of offering and demand. This is less complex and requiresless explicit coordination than hierarchies, but is affected by a problemin the possible loss of the “perfect market conditions”, such as the hidingof information or the creation of external opportunistic relationships forcontrolling and damaging the market.
These coordination methods are usually related to aggressive behaviors of com-panies whose main goal is to try to dominate as many competitors as possible.
In the latest decades another coordination mechanism emerged: the BusinessEcosystem [18] in which each firm may still coordinate in the traditional ways,but with the difference that the final goal is not to remove competitors, but tocooperate with them by establishing some value-creating virtuous circles. Thislast behavior has been called the “keystone behavior” [16]. Examples of key-stone companies are eBay and Amazon since their core business is supporting
5
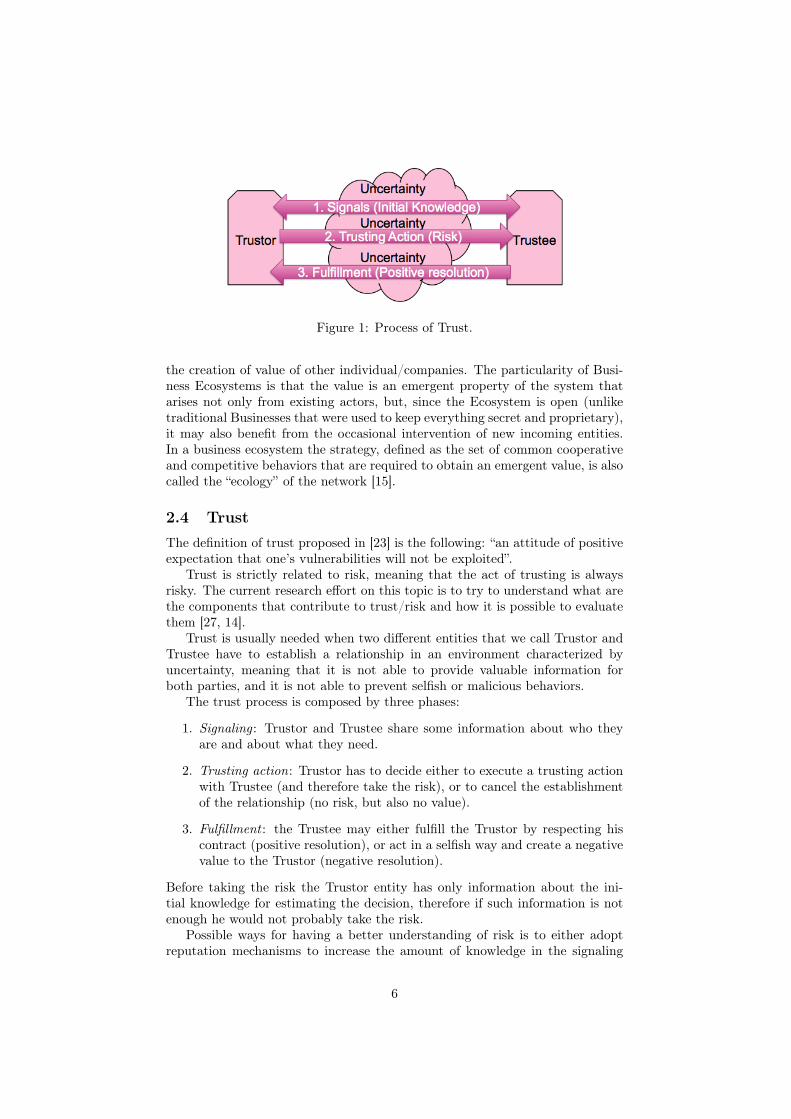
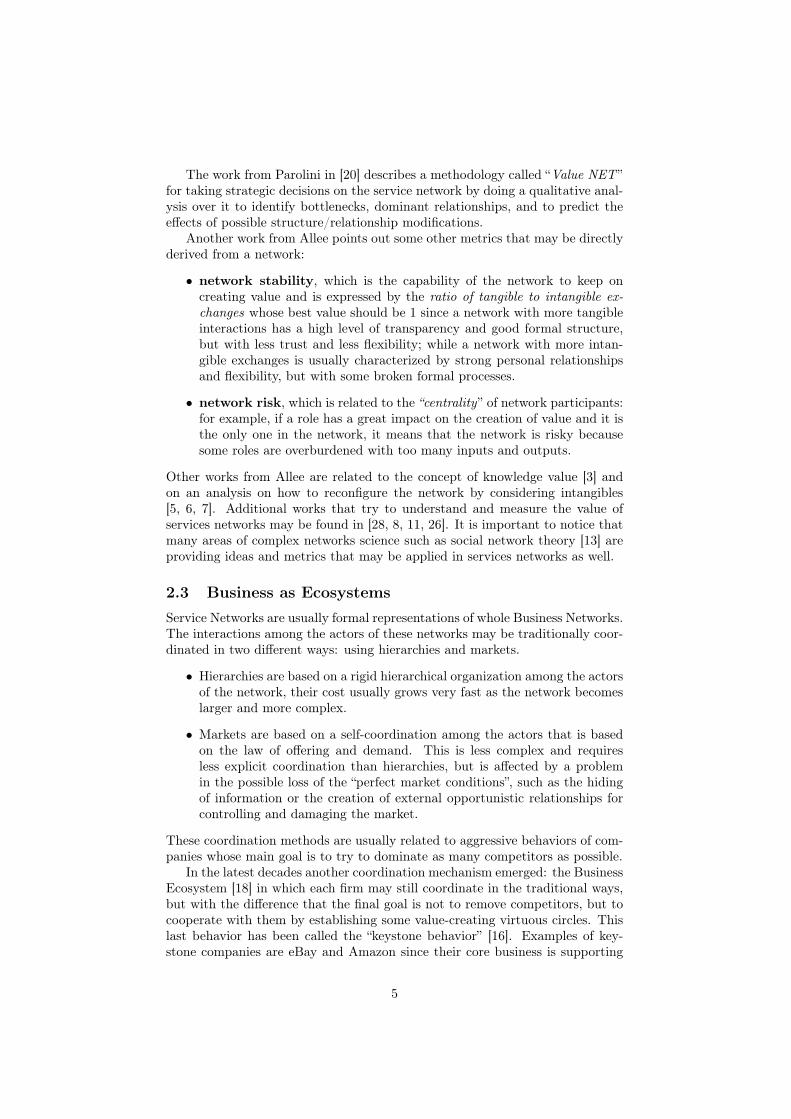
Figure 1: Process of Trust.
the creation of value of other individual/companies. The particularity of Busi-ness Ecosystems is that the value is an emergent property of the system thatarises not only from existing actors, but, since the Ecosystem is open (unliketraditional Businesses that were used to keep everything secret and proprietary),it may also benefit from the occasional intervention of new incoming entities.In a business ecosystem the strategy, defined as the set of common cooperativeand competitive behaviors that are required to obtain an emergent value, is alsocalled the “ecology” of the network [15].
2.4 TrustThe definition of trust proposed in [23] is the following: “an attitude of positiveexpectation that one’s vulnerabilities will not be exploited”.
Trust is strictly related to risk, meaning that the act of trusting is alwaysrisky. The current research effort on this topic is to try to understand what arethe components that contribute to trust/risk and how it is possible to evaluatethem [27, 14].
Trust is usually needed when two different entities that we call Trustor andTrustee have to establish a relationship in an environment characterized byuncertainty, meaning that it is not able to provide valuable information forboth parties, and it is not able to prevent selfish or malicious behaviors.
The trust process is composed by three phases:
1. Signaling : Trustor and Trustee share some information about who theyare and about what they need.
2. Trusting action: Trustor has to decide either to execute a trusting actionwith Trustee (and therefore take the risk), or to cancel the establishmentof the relationship (no risk, but also no value).
3. Fulfillment : the Trustee may either fulfill the Trustor by respecting hiscontract (positive resolution), or act in a selfish way and create a negativevalue to the Trustor (negative resolution).
Before taking the risk the Trustor entity has only information about the ini-tial knowledge for estimating the decision, therefore if such information is notenough he would not probably take the risk.
Possible ways for having a better understanding of risk is to either adoptreputation mechanisms to increase the amount of knowledge in the signaling
6
Figure 2: SN4BPM Lifecycle.
phase or to execute the transaction in a controlled environment rather than ina completely uncertain one. An example of extensive use of reputation is seenon the eBay service network, where the environment is completely uncertain.Another example is given by real estate companies where the act of transfer isusually done in a “protected” environment (public notary) therefore the risk ofnot obtaining what it has been paid for is irrelevant.
Quantitative methods for evaluating trust are several, and often very differ-ent since the perception of trust is different for every Trustor. A possible way, asproposed in [12], is to define it as the willingness to pay for not having the risk(insurance), and representing it as a value transfer (offering) from the Trusteeto the Trustor.
2.5 SN4BPMThe Service Network for Business Process Management [9] is an architecturethat supports the management of Business Processes from the requirementsto the deployment. The architecture provides different levels of abstractionsin terms of layers: the highest is the service network, followed by the processmodels, by the service compositions, and finally by the single service. Thefinal goal of the architecture is to manage the lifecycle of the business processthat, by analyzing requirements and the Service Network model is able to definehigh-level business processes that may be then refined and made executable.
The core part of the architecture is the BPM lifecycle depicted in figure 2.It is composed by a set of continuously iterative phases strictly related to eachother in both directions (bottom-up and top-down):
• Analysis phase: definition of functional and non-functional requirementsof the Service Network that may be expressed in terms of Key PerformanceIndicators (KPIs) and Service Level Objectives (SLOs).
• Modeling phase: high-level business process definition, based on the re-
7
quirements analyzed in the analysis phase and on the characteristics ofthe Service Network.
• Rationalization: Requirements and high-level processes are used to derivethe Service Network Notations (which is another formal way for definingService Networks and interactions among components). These notationscan then be analyzed with quantitative techniques to perform correctiveactions in the analysis or modeling phases.
• IT Refinement/Deployment/Execution: refinement of the abstract pro-cesses to executable ones and their deployment/execution in the IT in-frastructure.
• Monitoring : the metrics used in the analysis phase are monitored and,if there is a change, the whole loop is executed again from the analysisphase. This makes it possible the reorganization of the business processesand therefore contributes to the agility of the service network.
3 Improvement of BPMIn this section we will show how a particular pattern that often appears in ser-vice networks may be exploited to create an improved service network that hasmore value. We will finally show how the rationalization phase of the SN4BPMlifecycle may benefit from this high-level service network model transformation.
3.1 The ProblemWe know from the service network theory that all activities and interactionsamong a set of companies (or roles within the same company) may be alwaysrepresented as a service network. Current research has focused on finding ef-ficient and intelligent ways for reorganizing such network (and therefore theunderlying business processes) in order to maximize its value. In most of theworks these decisions are taken by considering some sort of value function basedon requirements, expected satisfaction, and collaboration alternatives, thereforeeach entity looks for an answer to the following questions:
• Why, as a company, should I belong to this service network?
• Why, as a company, should I choose to interact with company X insteadof company Y?
The answers to these questions are usually analytically (or intuitively) com-puted. Traditional networks tend to be conservative and closed, meaning thatthe role of each participant is fixed. What we want to point out here is toexplain why a service network should check whether to start new cooperationsand to open itself to new value-creating collaborations (as described in section2.3).
In the next paragraph we will describe that this is actually a frequent prob-lem and that there are already several successful case studies in which suchproblem is addressed by doing deep modifications on the service network andon the business processes.
8
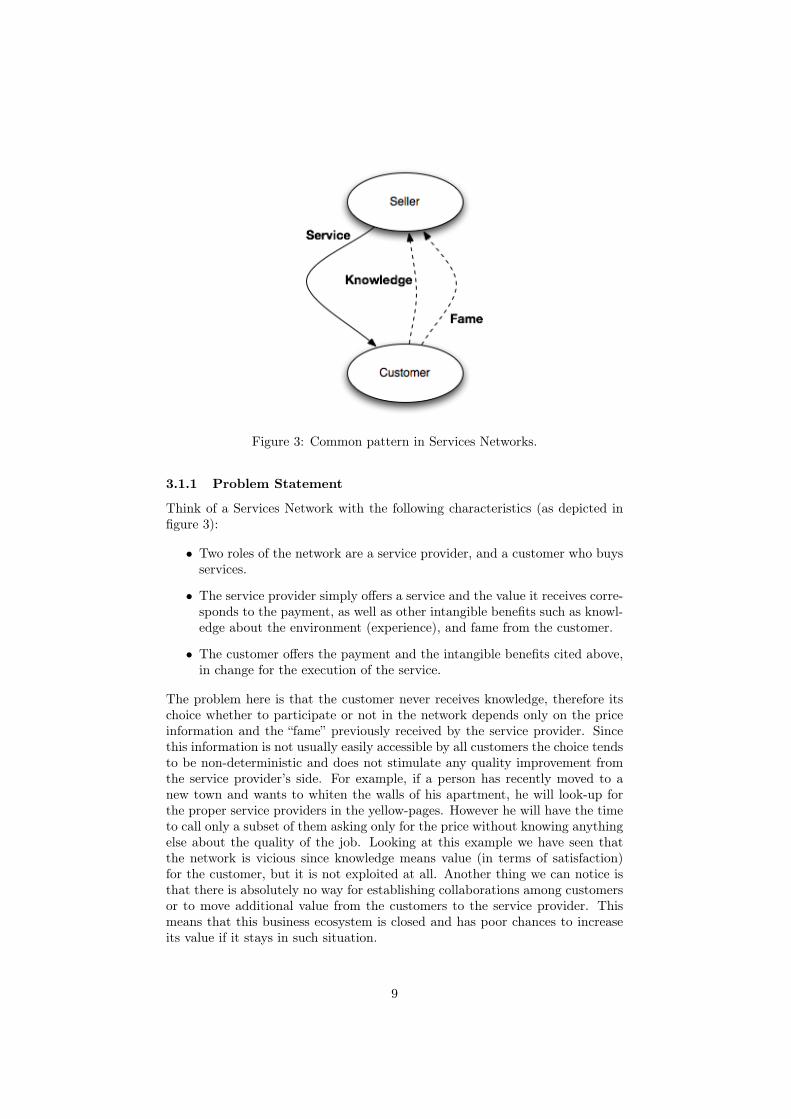
Figure 3: Common pattern in Services Networks.
3.1.1 Problem Statement
Think of a Services Network with the following characteristics (as depicted infigure 3):
• Two roles of the network are a service provider, and a customer who buysservices.
• The service provider simply offers a service and the value it receives corre-sponds to the payment, as well as other intangible benefits such as knowl-edge about the environment (experience), and fame from the customer.
• The customer offers the payment and the intangible benefits cited above,in change for the execution of the service.
The problem here is that the customer never receives knowledge, therefore itschoice whether to participate or not in the network depends only on the priceinformation and the “fame” previously received by the service provider. Sincethis information is not usually easily accessible by all customers the choice tendsto be non-deterministic and does not stimulate any quality improvement fromthe service provider’s side. For example, if a person has recently moved to anew town and wants to whiten the walls of his apartment, he will look-up forthe proper service providers in the yellow-pages. However he will have the timeto call only a subset of them asking only for the price without knowing anythingelse about the quality of the job. Looking at this example we have seen thatthe network is vicious since knowledge means value (in terms of satisfaction)for the customer, but it is not exploited at all. Another thing we can notice isthat there is absolutely no way for establishing collaborations among customersor to move additional value from the customers to the service provider. Thismeans that this business ecosystem is closed and has poor chances to increaseits value if it stays in such situation.
9
3.1.2 Existing Case Studies
Some case studies in which this pattern appears are similar to the whitening oneexplained above. Other possible examples from which we will take inspirationin our methodology are the following:
• A customer (or a company) needs some electronic appliances and goesto a specialized electronic store. The store is offering many services, andtries to provide all the information the customer needs to be sure to sellits goods. However the store has more convenience in selling its goodsrather than sending the customer in another store that is going to sellbetter quality appliances for a lower price. This happens because thereis a conflict of interests in the electronic store that, in order to increaseits immediate profits, decides not to lose the customer, but with the riskof losing customer satisfaction. To solve this problem nowadays there aremany websites (such as ciao.com) that are collecting user feedbacks aboutevery physical and on-line shop in the world as well as about the goodsthey sell.
• Another typical case study is the travel agency case. Travel agenciesusually behave as brokers for selling travel services to customers and pro-viding valuable information. In this case, similarly to the previous one,each travel agency may not have complete information about the marketor may not be specialized in all kind of travels, therefore the customerreceives a service that may not be the most suitable for his needs, whilestill paying a high price. This is another typical case in which the risk isvery high and the user knowledge very low. Also in this sector there hasbeen a proliferating of on-line and physical meta-travel agencies that iscreating networks with a very high value (due to the low cost and to thehigh user satisfaction) because there is a strong collaboration with manydifferent underlying travel companies.
• Car Sharing case. This case will be explained in detail in Section 4, how-ever it may be summarized as the case in which an individual or a companywants to save the money spent on buying and maintaining a new car byeasily relying on hourly car rentals offered by a car sharing company. Apossible improvement of the value network of this scenario will be dis-cussed later.
3.2 IdeasSome possible ideas that come from existing ad-hoc solutions to the servicenetwork fragments identified above are shown here. The key features that wewant to add to the service network to make it more agile are the reputation(to reduce the uncertainty), the transparency in the operations (to contributeto the increase of knowledge and possibly to a transfer of competences), andfinally increase the user (either an individual or a company) involvement in thevalue creation process.
10
3.2.1 Reputation in BPM
Reputation in BPM can be defined as the feedback history that an entity partic-ipating in a business process has received by other entities on previous instancesof the process. This may be seen as either a numeric value or a more detailedwritten review. The purpose of this information is to add a reputation historyto each participant. Participants with a high reputation are considered moretrustable, therefore it corresponds to a risk reduction; while participants withno reputation (or a low one) are considered less valuable than the others. Sincea higher risk usually corresponds to a lower cost it is up to the other participantswhether they should pay in the form of “risk” or in the form of more financialresources. In both situations the decisor has a complete control on the overallrisk of the business process, therefore the final decision will be more rationaland less non-deterministic than situations dominated by uncertainty.
3.2.2 Transparency and Competence Transfer
In the concept of business ecosystem explained in section 2.3 we have seen thatopen ecologies (in terms of having the service network open to new contributors)[15] in literature are characterized by a higher capability to adapt to changesand to create new values from new interactions. Business ecosystems are usuallycharacterized by some keystone participants that enable fruitful collaborationsamong other participants and collect/diffuse large amount of value. In thiscontext an evolution of an existing network into a business ecosystem needs tocreate processes that are transparent. This way every participant is able tolearn information about each phase of the process and especially about howeach request is fulfilled by others. The collected information contributes toa feedback loop that may stimulate the individual participants to develop orto export some of their capabilities to help increase the value of those businessprocesses. Think, for example, of two suppliers who produce a particular kind ofmemory chips that in the next step of the manufacturing process are integratedwith another self-produced type of chips. Both suppliers may enhance theirproduction process by specializing on only a type of chip in normal conditions(thus increasing their efficiency and their value), while still being able to produceboth types when the other participant fails or has an insufficient production. Toachieve this objective the business network should be able to provide the properflow of information and competences to increase the value of each participantand therefore improve its capability to be flexible when the requirements orthe working conditions in which its business processes take place change (forexample to prevent the collapse of the whole network if a company fails).
3.2.3 Final User in Value Creation
Usually service networks focus on interactions among companies and on theirbusiness processes. The role of the final user is usually marginal and is not wellrepresented in the network. The idea we propose here is that the user is not onlythe source of the dominant forms of value (such as financial value, knowledge,and potential satisfaction), but it has also the power to participate actively tothe network. This possibility may be explained by the fact that the same entitymay have more than a single role in the service network, therefore its experience
11
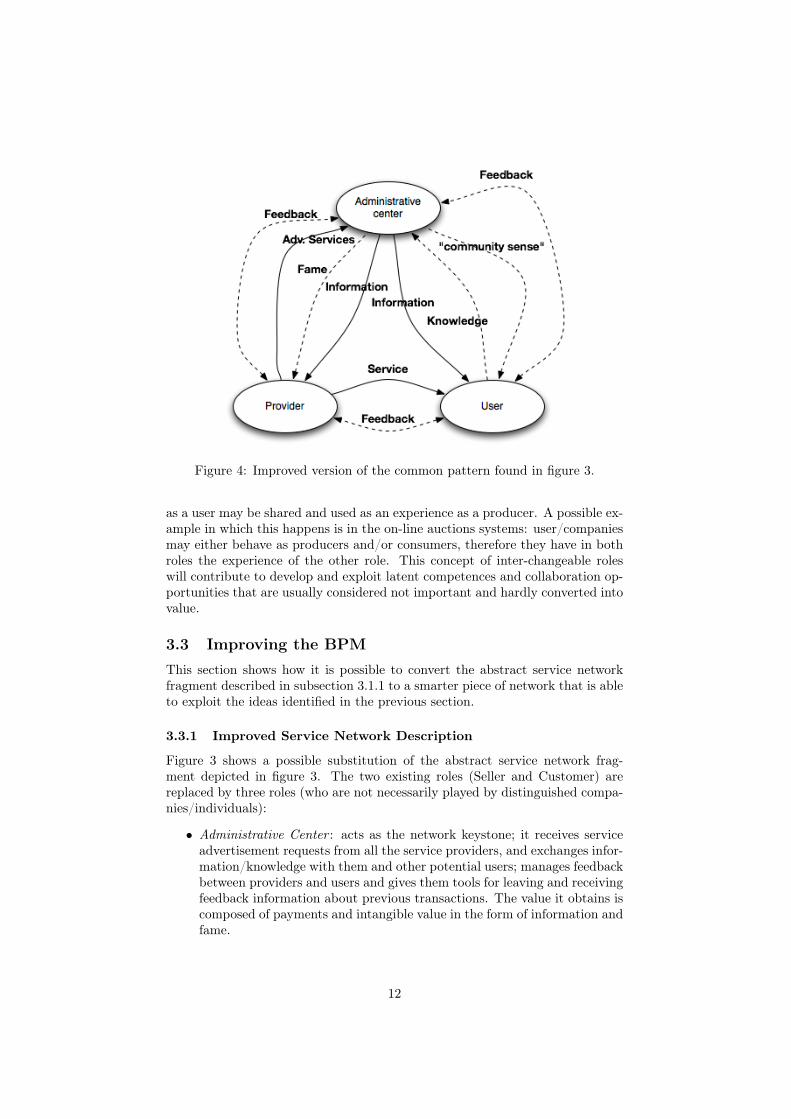
Figure 4: Improved version of the common pattern found in figure 3.
as a user may be shared and used as an experience as a producer. A possible ex-ample in which this happens is in the on-line auctions systems: user/companiesmay either behave as producers and/or consumers, therefore they have in bothroles the experience of the other role. This concept of inter-changeable roleswill contribute to develop and exploit latent competences and collaboration op-portunities that are usually considered not important and hardly converted intovalue.
3.3 Improving the BPMThis section shows how it is possible to convert the abstract service networkfragment described in subsection 3.1.1 to a smarter piece of network that is ableto exploit the ideas identified in the previous section.
3.3.1 Improved Service Network Description
Figure 3 shows a possible substitution of the abstract service network frag-ment depicted in figure 3. The two existing roles (Seller and Customer) arereplaced by three roles (who are not necessarily played by distinguished compa-nies/individuals):
• Administrative Center : acts as the network keystone; it receives serviceadvertisement requests from all the service providers, and exchanges infor-mation/knowledge with them and other potential users; manages feedbackbetween providers and users and gives them tools for leaving and receivingfeedback information about previous transactions. The value it obtains iscomposed of payments and intangible value in the form of information andfame.
12
• Provider : offers information about its services to the administrative centerand offers the actual service to the user; it also contributes to the creationof reputation information. The value it obtains is composed of payments,fame, and reputation.
• User : offers value (usually in the form of a financial payment) in changeof a service from the provider. It also gives information about its requestsand its needs to the administrative center that will be able to process themto better predict how to maximize its satisfaction. The value it obtains iscomposed of the fulfillment of its service request, reputation, and a senseof belonging to a community that may be used to share ideas, experiences,and cooperate with other users/providers to improve in a further way itsparticipation in the next business transactions.
In more formal terms the total value that is created by the old piece of networkand the new one is described by general definition of value taken from [12]:
V =∑
i∈Roles
(Ri − Pi + SATi ×Ri)
where Ri, Pi, SATi, and Ri are respectively the total revenues of participanti, the total payments, the satisfaction index, and its expected revenue in the nextinstance of the same interaction. From the formula it is clear that satisfaction(usually expressed as a number between 0 and 1) measures the probability thatsuch customer (or other customers with the same information) will participateagain in the network, and therefore that he will be able to produce the expectedrevenue.
3.3.2 Considerations on Value
The final outcome of the service network transformation described in the sec-tions above is to increase the total value of the network, therefore if we want toincrease the total value of the network we need to check whether the followingrelation holds before deciding if the system may benefit from the reconfiguration:∑i∈Roles of old fragment
(Ri−Pi+SATi×Ri) <∑
i∈Roles of new fragment
(Ri−Pi+SATi×Ri)
However as we have said in the state of the art section, the actual evalua-tion of the satisfaction perceived by each role as well as other intangibles aresubjective, therefore every tentative of an analytical explanation would neverbe general, but will be based on some assumptions (e.g., the choice to consideran intangible interaction in terms of an abstract revenue/payment rather thanusing it only in the computation of the satisfaction index). Since until now wehave always been in an abstract level we will provide an explanation on why wemay expect an increase in value, however this might not be true in all situationsand a deep understanding of the problem instance is always required beforetaking such decisions.
A possible reason for expecting more value in the enhanced network is that,although actual payments/revenues may be less since there is more choice forthe users, intangible benefits like the information, lower risk and predictablequality tend to be more dominant. Some other intangible offerings that may
13
generate additional value are knowledge, reputation, sense of community, chanceof collaboration, and so on: all of them may have a great impact on the finalsatisfaction that is perceived at each role. A high satisfaction is usually relatedto the quality of the obtained service, its fitness to the actual needs, and otherbenefits that are not contractually defined, but arise as side effects.
Another possible reason for expecting more value is that internal/functionalcosts are likely to be less because participants may focus on their core compe-tences and outsource non-profitable activities.
3.4 Integration in SN4BPMIn the context of the SN4BPM architecture (see section 2.5 for more details) theservice network model transformation above may be automatically recognized.However not every network may benefit by it. In this section we will show whichkind of KPIs may indicate the need of such transformation and how it affectsthe SN4BPM lifecycle.
3.4.1 Special KPIs
The two Key Performance Indicators that we intend to analyze are: Trust (interms of reduction of perceived risk) and Satisfaction (in terms of other intan-gible benefits, such as the chance of collaboration). The formal definition andthe numeric value of these KPIs is always problem-dependent, however theirgeneral meaning is always the same.
Trust. This indicates the level of trust of the network participant of beinginvolved in a business process within the network. This is meaningful in situ-ations in which the environment in characterized by uncertainty and thereforeits base value is low.
Satisfaction. This indicates the potential benefits of the actual participantsrelated to the intangible value of the network.
3.4.2 New BPM lifecycle
With reference to the SN4BPM architecture, the above KPIs may be qualita-tively (and quantitatively, although with some very deep understanding of theenvironment) studied in the Rationalizing part of the life-cycle.
The first additional step of the rationalizing part would be to identify inthe current Service Network Notation model the presence of the pattern de-scribed in section 3.1.1 and to analyze its value before and after applying thetransformation proposed.
To perform this value analysis trust and satisfaction need to be expressedin some way. In this context we propose a general idea on how it is possibleto express them and to predict their impact on the business processes, howevereach individual problem needs to be addressed in a different way, therefore thisis not a task that can be completely automated.
14
Evaluating Trust. We have seen from the State of the Art that this param-eter may be expressed in the form of an insurance value, however accordingto our experience this is more related to a reduction in risk, where the risk,may be expressed as the probability of not receiving value from the transaction.We call this probability function riskij(t) that resembles the risk perceived byparticipant i in his interactions with j at time t. Since a high value meanshigher chances of not receiving value, it may be used as a damping parame-ter for the obtained value (and not the offered one), meaning that it becomesa factor of the revenue function of partner i and to the offerings function ofpartner j. For keeping the expressions as simple as possible we may still embedthis value as an additional cost (insurance) that is proportional to the revenue,however the meaning and its contribution to the final value is always the same.In it important to note that all the partners involved in the process may havea different riskij(t) function, therefore it is not possible to accurately predictopportunistic behaviors. This lack of possibility to predict is desirable since itavoids the occurrence of situations in which opportunistic behaviors are encour-aged, and therefore it avoids the transformation of value-creating virtual circlesto value-depleting vicious ones.
Evaluating Satisfaction. Satisfaction is an indicator that encloses all thepotential value given from intangible interactions that are allowed by the envi-ronment, but that do not appear in the original network fragments. A possible,but not complete, list of value parameters is: the openness of the network tonew value-creating collaborations (i.e., How easy is it for a new business part-ner to join the network? Do all the partners benefit from its contribution?); theincrease in freedom for each partner (i.e., new entities are able to diversify thenumber of exported services); reputation and information flow (i.e., turning anunpredictable environment to a transparent environment). All these parametersmay not be easily expressed as a number, therefore a qualitative study shouldbe possible.
4 Case Study: A Car Sharing CompanyThis section shows how the transformation methodology proposed in section 3may be applied to improve the service network of a Car Sharing Company. Thissection starts with an overview description of the car sharing system, its existingimplementation in Milan and finally a possible idea on a network reconfigurationthat is expected to increase the total value. The analysis has been performedusing an existing value network analysis tool [4].
4.1 Car Sharing OverviewAs the name suggests, the car sharing system is a system for motorized personalmobility that is alternative to traditional public/private transportation. Thesystem is similar to a car rental system, with the difference that it is moreaffordable, has more pick-up/drop-off locations, sessions may have an arbitraryduration (from half a hour to several days), and the access to the service iscompletely automatic (no need of personal interactions or to fill paperworkbefore/after each session).
15
The expected goals and benefits are summarized as follows:
• Reduction in the number of cars in circulation (less traffic, less pollution,more parking slots);
• Reduction in the cost for occasional drivers;
• Remove the need for having a second car.
The typical way in which a traditional car sharing system works is based on threepayments from the customers: an annual subscription fee, a cost per kilometer,and a cost per hour; what the customer obtains is the complete use of the carfor the specified amount of time, kasko insurance, vehicle maintenance, andunlimited fuel.
4.2 Milan’s Car Sharing Company as a Service NetworkThe car sharing network of Milan is composed of the following nodes:
• (many) Customers: the final users of the car sharing system and we oftenrefer to them as the payers.
• (one) Administrative center : owns and coordinates the activities of thecar sharing company.
• (many)Maintenance centers: provide maintenance to car sharing vehicles.
• (many) Suppliers: provide vehicles to the car sharing company.
• (many) Reservation centers: manage bookings (on-line and by phone).
• (many) Garages: provide pick-up and drop-off locations.
• (many) Insurance centers: provide insurances for car sharing vehicles.
• (one) Public Administration: supports the whole network providing finan-cial eco-incentives.
Figure 5 and Table 1 show how the various nodes interact the one withthe other in terms of objects to be transferred (called deliverables using Alleeterminology). Each interaction involves two partners at the time, it is orderedin time, and its nature may be either tangible or intangible. We remind thattangible offerings are usually a contractually defined transfer of objects thatproduces some revenue, while an intangible offering reflects its value in thecomputation of the satisfaction index of the network.
4.2.1 Service Network Analysis
The network analysis using the ValueNetwork.com application [4] has pointedout that the ratio of tangible/intangible interactions is very biased toward tan-gible interactions, there is a weak tie stability of 0.25, and an average degree ofseparation of 0.14 for intangible interactions and 1.75 for tangible interactions.
The general meaning of these results is that the service network is able tocreate value almost only from tangible well-defined interactions. This may be asymptom of lack of trust among participants, so every interaction needs to becontractually defined.
16
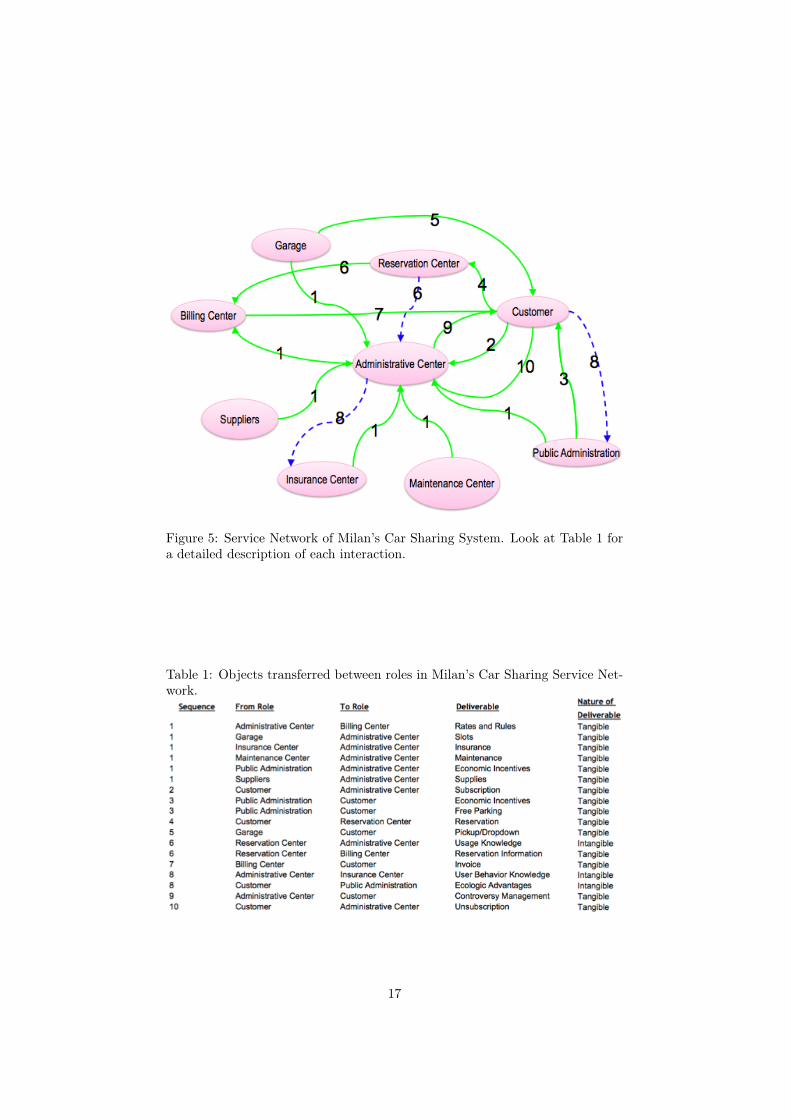
Figure 5: Service Network of Milan’s Car Sharing System. Look at Table 1 fora detailed description of each interaction.
Table 1: Objects transferred between roles in Milan’s Car Sharing Service Net-work.
17
4.2.2 Limitations of this Network
Milan’s car sharing system is not taking over the transportation market, es-pecially private transportation, because the customers simply do not have thefeeling of being in their own car:
• Last minute reservations cannot be usually honored. This means that ifa user has some unpredictable need, he may simply not get the car (itlowers satisfaction).
• Garages are a very limited resource, therefore many potential customersmay not find a garage close by.
• Default insurance is always the most “secure” for the car sharing company,because it does not trust its customers, however not all the customers rep-resent the same risk, making it possible to have a differentiated insuranceoffering.
• The “hourly+kilometer” cost system may not reflect the actual costs: itmay be more convenient for occasional users, but very expensive for ha-bitual users.
In addition to these problems, in order for a customer to take advantage ofcar sharing benefits, he is forced to sell his (second) car. A possible key foraddressing these issues it to increase flexibility and put more realistic costs.Moreover customers may play an active role in the network by sharing theirown cars at their conditions (instead of selling it and being forced to complywith the car sharing company conditions).
4.3 Adding Agility: Agile Car SharingA possible method to overcome the issues of the actual Milan’s car sharingsystem is to perform the following changes to the network:
• Add a new type of users that acts as a car sharing provider (they simplyshare their own car).
• Remove from the administrative center the responsibility of finding sup-pliers, sharing cars, choosing garages, providing maintenance, insurancesand so on: these responsibilities are transferred to the providers.
• Solve the uncertainty problem of the environment by adding a reputationmanagement mechanism for all transactions that occur in the system: thiswill enable a knowledge transfer and an easier evaluation of risk.
• Administrative center becomes a pure coordinator (matchmaker) that pro-vides subscription service, unsubscriptions, conflict-resolution, and possi-bly manages certifications and payments.
The final outcome of all of this is to have an offer that is more differentiated, infact the final cost is likely to be proportional to the quality/risk ratio, the finaluser may have some cash back by sharing his second car, and private companiesthat have many unused vehicles may cooperate with other companies who needthem. Another important characteristic is that not only the satisfaction indexes
18
of the customers increase, but also the new openness of the network enablesthe opportunity for easily replacing the coordinator (Car Sharing company),increases the chance of having roaming agreements among different companies,creates the possibily to have the service also in places that are not covered bylocal coordinators (since a coordinator may not have physical interactions withthe customer, a coordinator may act globally), and finally - as soon as a criticalmass of car sharing vehicles has been reached - it adds much more flexibility inchoosing pick-up/drop-off time.
Nodes in the modified network will be:
• (many) Car Providers: customers who share a car.
• (many) Car Users: customers who use a shared car.
• (many) Garages: entities that provide parking slots to providers and users.
• (many) Insurance centers: provide personalized insurances to providersand users.
• (one) Administrative center : acts as broker between providers and users.
• (one) Reputation center : manages feedbacks and the flow of intangibleinformation.
• (one) Billing center : manages invoices and payments.
• (many) Reservation centers: manage reservations (by phone or by email).
• (one) Public Administration: gives money to the administrative centers orto the user as eco-incentives.
As we have previously done previously figure 6 and table 2 show the variousinteractions among the entities of the network as well as their sequence orderand their nature (tangible/intangible). What is first evident in the networkdiagram is that we have more roles, and a lower average of interactions for eachrole, meaning that complexity (and therefore the expected costs) at local levelis lower. Another important thing is the heavy use of intangible offerings thatis expected to overcome the low-satisfaction issues of the previous network.
The data produced by the ValueNetwork.com application shows a ratio ofintangible/tangible interactions of 0.54:1 that is much close to 1 than the oneof the previous network (0.19:1), moreover we have a higher weak tie stability(0.62) and an average degree of separation of intangibles increased to 1.11 (in-stead of 0.14 of the previous network). The considerations that come from theseresults are the following: coordination in the network is encouraged since it hasmore intangible value transfers (that means more trust) and there are moreentities that can join the network and increase the variety of offered services;in addition, the presence of so much reputation information makes it possibleto increase the flexibility (agility) of the network since each entity has morevariables for taking decisions whether to stay or not in the network, so also thewhole underlying business processes may be adapted and optimized accordingto them.
19
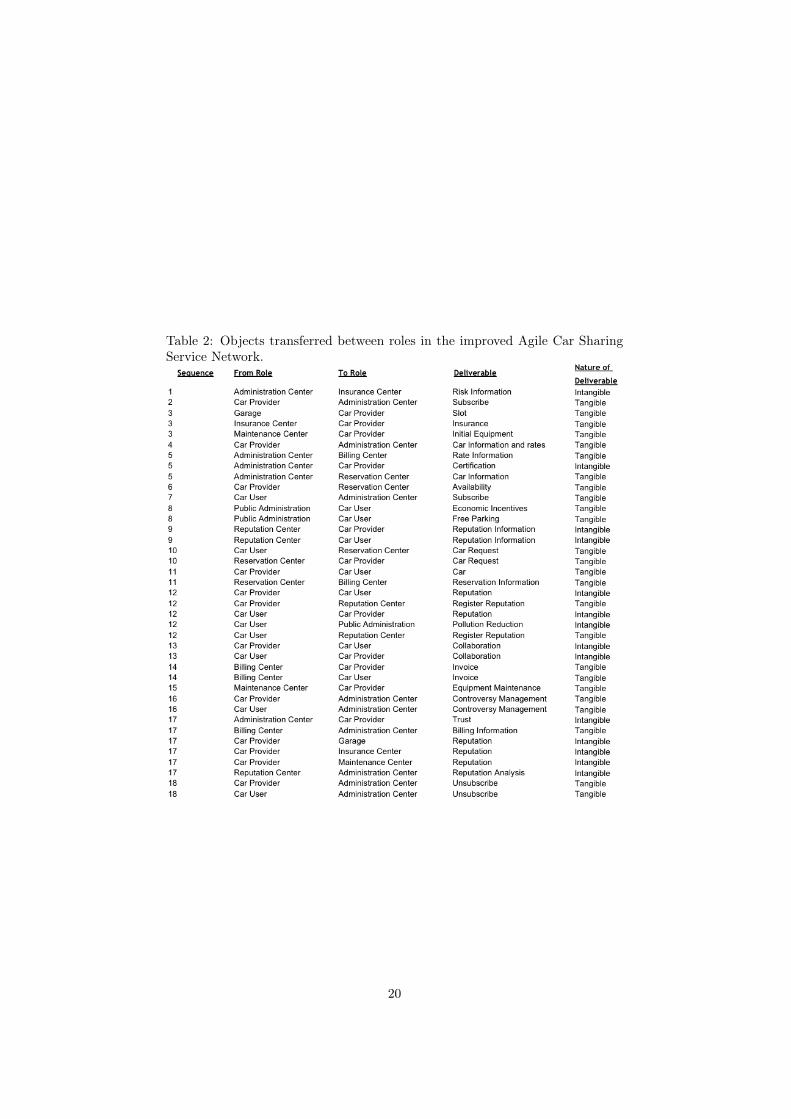
Table 2: Objects transferred between roles in the improved Agile Car SharingService Network.
20
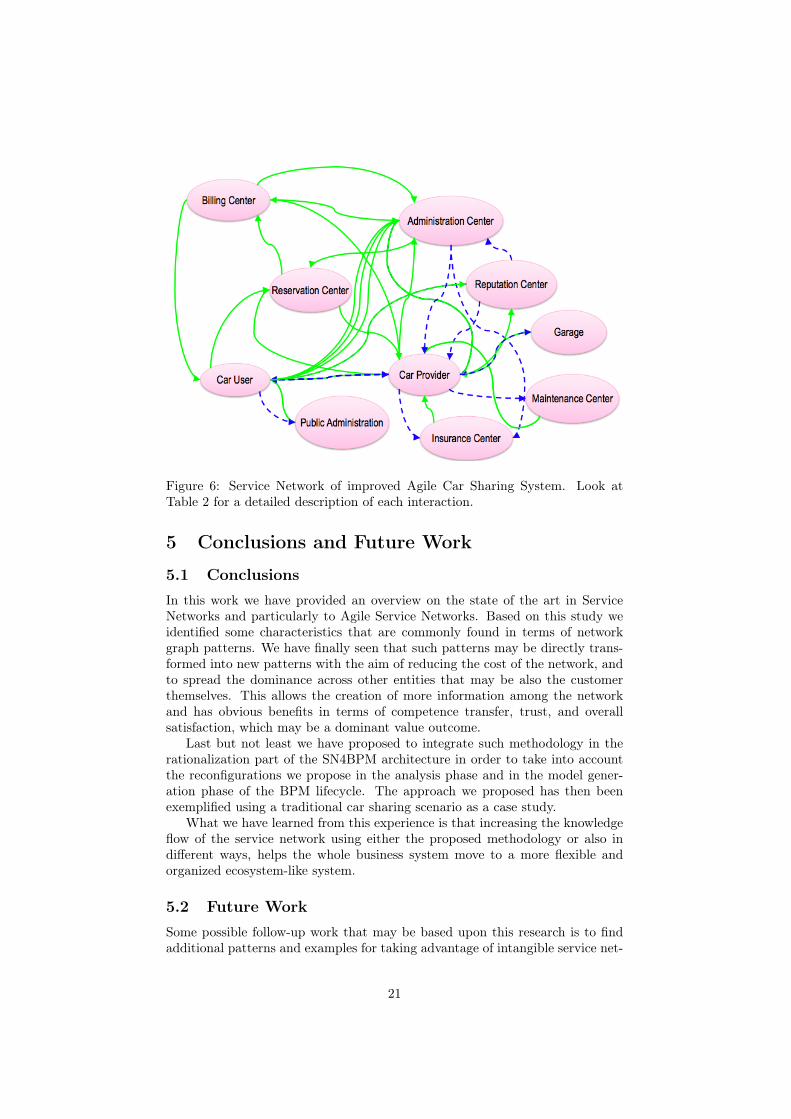
Figure 6: Service Network of improved Agile Car Sharing System. Look atTable 2 for a detailed description of each interaction.
5 Conclusions and Future Work
5.1 ConclusionsIn this work we have provided an overview on the state of the art in ServiceNetworks and particularly to Agile Service Networks. Based on this study weidentified some characteristics that are commonly found in terms of networkgraph patterns. We have finally seen that such patterns may be directly trans-formed into new patterns with the aim of reducing the cost of the network, andto spread the dominance across other entities that may be also the customerthemselves. This allows the creation of more information among the networkand has obvious benefits in terms of competence transfer, trust, and overallsatisfaction, which may be a dominant value outcome.
Last but not least we have proposed to integrate such methodology in therationalization part of the SN4BPM architecture in order to take into accountthe reconfigurations we propose in the analysis phase and in the model gener-ation phase of the BPM lifecycle. The approach we proposed has then beenexemplified using a traditional car sharing scenario as a case study.
What we have learned from this experience is that increasing the knowledgeflow of the service network using either the proposed methodology or also indifferent ways, helps the whole business system move to a more flexible andorganized ecosystem-like system.
5.2 Future WorkSome possible follow-up work that may be based upon this research is to findadditional patterns and examples for taking advantage of intangible service net-
21
work characteristics. Another important aspect that worths investigating is toidentify new models for taking the decision whether to reconfigure the servicenetwork or not. Possible models offered by existing literature include GameTheory models as well as emergent social network analysis techniques. Oneof the other possible outcomes that may complete this work is to provide realmeasured results of the actual application of such technique in a real company.
AcknowledgementsI would like to thank my minor research advisor Prof. Christos Nikolaou andManolis Voskakis for insightful discussions about the topic and all the patienceand support they provided. I would also like to thank my major research advisorElisabetta Di Nitto for some brainstorming sessions on the case study, and finallythe mobility program of the European project S-Cube for providing the financialsupport for traveling abroad to complete this work.
References[1] S-cube deliverable po-jra-2.1.1: State-of-the-art survey on business process
modeling and management, 2008.
[2] S-cube deliverable cd-jra-2.1.2: Initial models and mechanisms for quanti-tative analysis of correlations between kpis, slas and underlying businessprocesses, 2009.
[3] V. Allee. The very human dynamics of knowledge and value conversion.Knowledge in organisations, page 55.
[4] V. Allee. ValueNetworks.com Online Application for Evaluating Value Net-works.
[5] V. Allee. Reconfiguring the value network. Journal of Business Strategy,21(4):36–39, 2000.
[6] V. Allee. A value network approach for modeling and measuring intangibles.Proceedings Transparent Enterprise, Madrid, 2002.
[7] V. Allee. The future of knowledge: Increasing prosperity through valuenetworks. Butterworth-Heinemann, 2003.
[8] A. Barlow and F. Li. Online value network linkages: integration, informa-tion sharing and flexibility. Electronic Commerce Research and Applica-tions, 4:100–112, 2005.
[9] R. C. Basole and W. B. Rouse. Complexity of service value networks: con-ceptualization and empirical investigation. IBM Systems Journal, 47(1):53,2008.
[10] F. Bloch and M. O. Jackson. The formation of networks with transfersamong players. Journal of Economic Theory, 133(1):83–110, 2007.
22
[11] D. Bovet and J. Martha. Value nets: breaking the supply chain to unlockhidden profits. Wiley, 2000.
[12] NS Caswell, C. Nikolaou, J. Sairamesh, M. Bitsaki, CD Koutras, and G. Ia-covidis. Estimating value in service systems: A case study of a repair servicesystem. IBM Systems Journal, 47(1):87–100, 2008.
[13] R. L. Cross and A. Parker. The hidden power of social networks: Un-derstanding how work really gets done in organizations. Harvard BusinessSchool Pr, 2004.
[14] D. Gambetta. Can we trust trust. Trust: Making and Breaking Cooper-ative Relations, electronic edition, Department of Sociology, University ofOxford, pages 213–237, 2000.
[15] M. Iansiti and R. Levien. Strategy as ecology. Harvard Business Review,82(3):68–78, 2004.
[16] M. Iansity and R. Levien. The keystone advantage: What the New Dy-namics of Business Ecosystems Mean for Strategy, Innovation, and Sus-tainability. Harvard Business School Press, 2004.
[17] P. Kothandaraman and D. T. Wilson. The future of competition value-creating networks. Industrial Marketing Management, 30(4):379–389, 2001.
[18] J. F. Moore. Business ecosystems and the view from the firm. AntitrustBulletin, 51(1):31.
[19] R. Normann and R. Ramirez. From value chain to value constellation:designing interactive strategy. Harvard business review, 71(4):65–77, Jul-Aug 1993. LR: 20011126; JID: 9875796; CIN: Harv Bus Rev. 1993 Sep-Oct;71(5):39-40, 42-3, 46-51. PMID: 10129057; ppublish.
[20] C. Parolini. The value net: A methodology for the analysis of valueÐcre-ating systems. In 16th annual international conference of the StrategicManagement Society.
[21] F. K. Pil and M. Holweg. Evolving from value chain to value grid. MITSloan Management Review, 47(4):72, 2006.
[22] M. E. Porter. Competitive advantage: creating and sustaining superiorperformance: with a new introduction. Free Pr, 1998.
[23] Jens Riegelsberger, M. Angela Sasse, and John D. McCarthy. The mechan-ics of trust: A framework for research and design. International Journal ofHuman-Computer Studies, 62(3):381 – 422, 2005.
[24] W. B. Rouse. Agile information systems for agile decision making. Ag-ile information systems: conceptualization, construction, and management,page 16, 2006.
[25] C. E. Shannon and W. Weaver. A mathematical theory of communication,1948. Bell Syst.Tech.J, 27(379):623.
23
[26] D. Straub, A. Rai, and R. Klein. Measuring firm performance at the net-work level: A nomology of the business impact of digital supply networks.Journal of Management Information Systems, 21(1):83–114, 2004.
[27] Y. Sun, Z. Han, W. Yu, and K. J. R. Liu. A trust evaluation framework indistributed networks: Vulnerability analysis and defense against attacks.In IEEE INFOCOM, pages 230–236. Citeseer, 2006.
[28] B. Wetzstein, O. Danylevych, F. Leymann, M. Bitsaki, C. Nikolaou, W. J.van den Heuvel, and M. Papazoglou. Towards monitoring of key perfor-mance indicators across partners in service networks. In Workshop on Ser-vice Monitoring, Adaptation and Beyond, page 7.
24