Embed Size (px)
Citation preview
An Analysis of Life Insurance DemandDeterminants for Selected Asian Economies
and India
Subir SenSenior [email protected]
WORKING PAPER 36/2008 MADRAS SCHOOL OF ECONOMICSGandhi Mandapam Road
September 2008 Chennai 600 025India
Phone: 2230 0304/ 2230 0307/2235 2157Price: Rs. 35 Fax : 2235 4847 /2235 2155
Email : [email protected]: www.mse.ac.in
An Analysis of Life Insurance DemandDeterminants for Selected Asian Economies
and India
Subir Sen
Abstract
During the post-1990 period, services sector in most of the Asianeconomies witnessed growth fuelled by substantial changes in the financialsector of these economies. The insurance industry, in most of the Asianeconomies, ASEAN and SAARC economies in particular, was publiclyowned and remained isolated from participation of either domestic privateinsurers or foreign insurers or participation of both. But, regulatory reformsand policy changes in the ASEAN economies during the post-financialcrisis period and the process of economic liberalization in some of theSAARC countries and China led to phenomenal changes in the growthpattern of the insurance industry in these economies. This study is dividedinto two parts: the first part is focused on four SAARC countries, twocountries from Greater China Region and six ASEAN countries for the 11-year period (1994-2004) to understand economic and other socio-politicalvariables, which may play a significant role in explaining the life insuranceconsumption pattern in these economies. Secondly, an independentexercise is undertaken to re-assess whether or not the variables bestexplaining life insurance consumption pattern for twelve selected Asianeconomies in the panel are significant for India for the period 1965 to2004. Some variables were strongly capable of determining life insurancedemand in both the analytical exercises. However, we also observedcontradictions to earlier studies.
JEL Classification: G22, C33, C32,Keywords: Life Insurance, Insurance Demand, Panel Estimation, Time
Series Analysis.
1
1. Introduction
The growth of the services sector in the Asian economies has
led to substantial changes in the financial sector. The aftermath of Asian
Financial Crisis, affecting the ASEAN economies in particular, saw these
economies resorting to more regulatory measures to enhance delivery
of products with minimal risks and failures. The countries surrounding
the ASEAN economies also went through a phase of economic-
restructuring, the most notable event being the impact of China’s accession
to WTO1. The insurance industry in most of the Asian economies were
both publicly owned and operated. The Government monopoly kept this
segment of the financial market isolated from domestic private or foreign
participation. Barring a few exceptions2, the insurance market, on an
average, remained underdeveloped in terms of insurance density and
penetration. Regulatory changes since mid eighties for opening up of
these markets to private and foreign insurers have been luring global
heavyweight insurers to enter these economies. As more suppliers enter
these markets, the issue is to re-examine the factors that probably elevate
demand for insurance products. This study on four SAARC countries,
two countries from Greater China Region and six ASEAN countries, deals
with this particular issue. After reviewing existing theoretical as well as
empirical literature, we list out a set of variables explaining insurance
consumption and categorize them as economic, demographic, legal and
socio-political variables. Following this, some of these variables were
used to understand whether or not they explain insurance consumption
in the twelve selected Asian economies. Next, we use a time series
Acknowledgements
This work was a result of constant support and motivation from
my research Supervisor Prof. S Madheswaran at ISEC, Bangalore. I thank
Max NewYork Life Insurance Company Ltd. India for sponsoring and
financially supporting presentation of the research findings at the 11th
APRIA meeting, 2007 in Taipei. We thank Prof. J W Kwon, Dr. Ian Webb,
B P Vani and the participants of APRIA meeting 2007 for their valuable
suggestions and insightful comments.
1 Refer Chen and Shih (2004).2 The Japanese insurance industry is highly developed.
2 3
framework to assess how many such significant variables can explain
insurance consumption, and hence, demand for India.
The paper is organized as follows. The paper begins with the
theoretical as well as empirical review of literature on demand for
insurance. Based on the review, we identify the broad researchable issues.
The methodological section is divided into parts explaining briefly the
selection of twelve Asian economies and India followed by choice of
dependent and independent variables and different sources from where
we have collected information on such variables. Next, we specify the
two separate econometric methodologies that are applied in this paper.
The results of the empirical exercises and interpretations are presented
followed by the section summarising the important observations and draw
conclusions.
2. Review of Literature
2.1 Theoretical Studies
The main purpose of this study is to re-assess the validity of
arguments emerging from the existing theoretical and empirical research
works that there are a few variables which can significantly explain the
current and future demand pattern for life insurance products. To
strengthen the researchable issues for the study, we will briefly discuss
selected theoretical studies which had identified indicators motivating
life insurance demand and consumption.
Studies on life insurance consumption dates back to Heubner
(1942) who postulated that human life value has certain qualitative aspects
that give rise to its economic value. But his idea was normative in nature
as it suggested ‘how much’ of life insurance was to be purchased and not
‘what’ was to be purchased. However, There were no guidelines regarding
the kind of life policies to be selected depending upon the consumers
capacity and the amount of risk to be ‘insured’ in the product.
Economic value judgments are made on both the normative as
well as positive issues. Subsequent studies by Yaari (1965), Mossin (1968),
Hakansson (1969), Fisher (1973), Borch (1977) Pissarides (1980)
Campbell (1980) Karni and Zilcha (1985 and 1986), Lewis (1989),
Bernheim (1991) and others gradually incorporated these positive issues.
Their studies assimilated developments in the field of risk and uncertainty
following contributions from von Neumann and Morgenstern (1947), Arrow
(1953), Debreu (1953), to mention a few. The economics of insurance
demand became more focused on evaluating the amount of risk to be
shared/distributed between the insured and the insurer rather than the
questions and methods for evaluation of life or property values at risk.
This was mostly due to association of risk(s) with individual life or property
that called for an economic valuation of the cost of providing insurance.
Life insurance is considered to be a form of saving, competing
with other forms of saving (like bank deposits, securities, and other
contractual savings) in the market. However, the theory of life insurance
demand was developed through the life-cycle hypothesis of consumption.
In the macroeconomic literature, Keynesian consumption hypothesis,
permanent income hypothesis together with the life cycle models explains
individual consumption patterns in relation to income, price and interest

4 5
levels. For example, as developed by Borch (1990), consider a person
with income and consumption represented by a continuous function of
time; y t and c t respectively; his net saving (positive or negative)
over the time interval 0 to t (t being the time of retirement) is given by
the difference between income and utility maximising consumption; given
interest rates for each interval. Income rates become more rapid as the
person approaches t, ceteris paribus, increases savings.
0
tt ts t e e y s c s ds (1)
where, is the rate of interest.
Every person wishes to consume as much as possible, but fail to
do so. Constraints such as debt, premature death and failure to leave
any bequest might severely affect his savings.
Considering the uncertainties associated with the time of death,
equation (1) can be extended to show that an individual can enhance his
life time utility via purchase of a life insurance policy (pure endowment
insurance) and can leave a bequest sum as a portion of his income for
dependents (Yaari, 1965). Borch (1990) proposed sufficient conditions
and showed that saving through life insurance takes place at a higher
rate of interest than conventional saving3 and therefore, escalation in
interest rates will have minimal impact on life insurance demand as in
this case, consumption is for maximising utility.
The role of insurance in equation (1) has been predominantly to
smoothen out consumption over time, make bequests, and repay debts
or to ensure a constant income stream after retirement. The ongoing
discussion also reveals that individuals’ current income and future
anticipated consumption expenditure plays a crucial role in determining
the amount of insurance to be purchased4. The importance of rate of
interest or an ‘impatience’ factor reflecting future preference patterns is
also worth considering. This is because preferences over different
consumption pattern vary from person to person and there are ‘qualitative’
factors which affects such preferences (Borch, 1990).
Simple models of insurance demand were proposed by Pratt
(1964), Mossin (1968) and Smith (1968) considering a risk averse decision
maker endowed with an initial wealth level. The results indicate that
demand for life insurance varies inversely with the amount of wealth an
individual possesses. Hakansson (1969) examined bequest motive in
considerable detail using a discrete-time model of demand for financial
assets in general and life insurance purchase in particular. Pissarides
(1980) extended Yaari’s work to prove that life insurance was theoretically
capable of absorbing all fluctuations in lifetime income. Karni and Zilcha
(1985) developed a methodology towards measuring individuals’ risk
perceptions (risk averse or otherwise) and how such perceptions affect
insurance demand. An important observation made by Mossin (1968)
was regarding insurance coverage as an inferior good. However, Hoy
and Robson (1981) presented a theoretical explanation and later Briys et
3 Please refer Borch (1990) Chapter 4 for details.4 We have abstained from any discussion regarding the form in which insurance is
purchased

6 7
al. (1989) generalised the results showing insurance to be a ‘Giffen’ good.
Lewis (1989) using a theoretical model concluded that the number of
dependents also influences the demand for life insurance.
The conventional utilitarian theories have been adopted to
determine optimal insurance consumption where individuals’ preferences
over different consumption patterns are considered. Although expected
utility theory dominated the analysis of decision making under risk, a
number of studies have found that individuals (consumers) identical in
all respects, might differ in their attitudes towards purchasing insurance.
It is assumed in economic theory that marginal utility of money is
diminishing and it is via maximising expected utility that individuals choose
among financial investment alternatives in the light of uncertainty5. Given
these two assumptions, we can infer whether or not an individual is risk
averse and will demand for insurance.
The ‘prospect theory’ propounded by Kahneman and Tversky
(1979) argued that individuals make decision with respect to a status
quo reference point and gains via purchase of insurance are considered
very little against losses with respect to the reference point. The
development of many more models during early nineties tried to describe
individual behaviour and the effects of ‘framing’ on decision making
(Machina, 1982 and 1987).
In short, the theoretical review yields variables like income, rate
of interest, current consumption and accumulated savings in wealth form
as variables influencing insurance consumption. Demographic and social
variables were also incorporated in theoretical models and their potential
impact on an individual’s life insurance consumption decision was
investigated. Life insurance consumption increases with the breadwinner’s
probability of death, the present level of family’s consumption and the
degree of risk aversion. However, there is no concrete evidence as to
how many such non-economic or additional economic variables can play
a role in theoretical models. In the next section, we explore selected
empirical studies to highlight those variables which were significant in
affecting insurance demand.
2.2 Empirical Studies
This section presents a review of empirical studies on
determinants of life insurance. Most of these studies has focused on
both the demand side factors and the supply side factors.
Fortune (1973) analysed the empirical implications of expected
utility hypothesis of choice under uncertainty for demand for life insurance
and concluded that demand depends on income, non-human wealth and
the rate of discount. Headen and Lee (1974) studied the effects of short
run financial market behaviour and consumer expectations on purchase
of ordinary life insurance and developed structural determinants of life
insurance demand. They considered three different sets of variables:
first, variables stimulating demand as a result of insurer efforts (e.g.
5 The Bernoulli’s solution to the St. Petersburg paradox states that it is expectedutility and not expected monetary value that serves as the rational guide to decisionmaking (Sennetti, 1976).

8 9
industry advertising expenditure, size of the sales force, new products
and policies, etc.); second, variables affecting household saving decision
(e.g. disposable, permanent and transitory income, expenditure
expectation, number of births, marriages, etc.) and thirdly, variables
determining ability to pay and size of potential markets (e.g. net savings
by households, financial assets, and consumer expectation regarding
future economic condition). They concluded that life insurance demand
is inelastic and positively affected by change in consumer sentiments;
interest rates play a role in both short and long run.
Using an international dataset (12 countries over a period of 12
years), Beenstock et al. (1988) found that marginal propensity to insure6
differs from country to country and premium vary directly with real rates
of interest. The study tried to examine the relationship between property
liability insurance premium and income. Truett et al. (1990) discuss the
growth pattern of life insurance consumption in Mexico and United States
in a comparative setting, during the period 1964 to 1984. They assumed
that at an abstract level, demand depends upon the price of insurance,
income level of individual, availability of substitutes and other individual
and environment specific characteristics. Further, they experimented with
demographic variables like age of the insured and size of population
within the age group 25 to 64 and also considered education level of the
population under study to examine its bearing on insurance consumption
decision. Their results show the existence of higher income inelasticity
of demand for life insurance in Mexico at low income levels. Age, level of
education and income were significant factors affecting the demand for
life insurance in both the countries.
Starting with a brief review of Lewis’s theoretical study and an
assumption that inhabitants of a country are homogeneous relative to
those of other countries, the study by Browne et al. (1993) expanded the
discussion on life insurance demand by adding some variables namely,
average life expectancy and enrolment ratio at third level of education.
The study considering 45 countries for two separate time periods (1980
and 1987) concluded that income and social security expenditures are
significant determinants of insurance demand. But, inflation was found
to have a negative correlation. Dependency ratio, education and life
expectancy were not significant but incorporation of religion7, a dummy
variable showed that Muslim countries have significant negative affinity
towards life insurance.
Based on a cross-sectional analysis of 45 developing countries,
Outreville (1996) analysed the demand for life insurance for the period
1986. The study considered variables like agricultural status of the country
in terms of percentage of agricultural labour force in total labour force;
health status of the country in terms of amenities like percentage of
population with access to safe drinking water; percentage of labour force
with higher education and the level of financial development. Some of
6 Marginal propensity to insure is defined as increase in insurance spending whenincome rises by 1US $
7 “Religion can provide weights into individuals … and life insurance consumptionis less in predominantly Islamic countries” studies by Douglas et al. (1982),Henderson et al. (1987), Zelizer (1979) and Warsaw (1986): cited in Browne et al(1993) page 621.

10 11
the variables already discussed above were also considered. Two dummy
variables were used to reflect competition in the domestic market and
foreign insurer participation. The results show that personal disposable
income and level of financial development significantly relates to insurance
development. Since the political philosophy regarding market openness
varies from country to country, market structure dummy appeared to be
significant.
Taking into account the expansion of the service sector, Browne
et al. (2000), tried to explain the differences in property liability insurance
consumption across countries. The analysis focused on the OECD countries
and concluded that in general, insurance purchase is influenced by various
economic and demographic conditions. A separate study based on nine
OECD countries examined the short run and long run relationships
exhibited between economic growth and growth in the insurance industry.
This study by Ward et al. (2000) is a co-integration analysis using annual
real GDP data and total real premiums for the period 1961 to 1996.
Results indicate that country specific factors8 influence the causal
relationship between economic growth and insurance market
development.
Allowing income elasticity to vary as GDP grows for an economy,
Enz (2000) proposed the S-curve relation between per-capita income
and insurance penetration. Using this one factor model one can generate
8 Country specific factors referred to here are attitudes towards risk and riskmanagement, regulatory factors, legal environment, other modes or availability offinancial intermediation, etc.
long run forecast for life insurance demand. Observing the outlier countries
or countries distant from the S-curve plot, it is possible to identify structural
factors like insurance environment, taxation structures, etc. resulting in
such deviations. Therefore, this study too provides meaningful explanations
for variables which can explain insurance consumption.
There are two exhaustive studies on the determinants of life
insurance demand, one taking into consideration only the Asian countries
and the other based on 68 economies. The first study by Ward et al.
(2002) and the second by Beck et al. (2003) revolve around the issues of
finding the causes behind variations in life insurance consumption across
countries. Both the studies briefly highlighted the difficulties in explaining
the low per-capita consumption of insurance in Asian countries with higher
savings rate, a sound capital market in some of them, large and growing
population, with low provision for pensions or other social security. Except
Japan, most of the Asian countries have low insurance density and
penetration figures.
The two main services provided by life insurance: income
replacement for premature death and long-term saving instruments were
the starting point for the study by Beck et al. (2003). They considered
three demographic variables (young dependency ratio, old dependency
ratio and life expectancy), higher levels of education and greater
urbanization as independent factors in explaining insurance demand.
Economic indices like Gini index and human development index were
new additions along with institutional variables reflecting political stability,
access to legal benefits and an index of institutional development. The

12 13
analysis for the time period 1961 to 2000 shows that countries with
developed banking system, high income and lower inflation had higher
life insurance consumption. The association of insurance demand with
demographic characteristics was statistically weak. But, older the
population, higher tends to be the insurance consumption. Insurance as
a luxury good was not reflected through its association with income
distribution.
In contrast, the study by Ward et al (2002) is indicative of the
fact that improved civil rights and political stability leads to an increase in
the consumption of life insurance both in the Asian and OECD regions.
Following Laporta et al (1997, 1998, and 2000) works relating to supportive
aspect of legal environment for finance, they too considered the same
legal variables in determining insurance demand. Analyzing the data from
1987 through 1998 for OECD and Asian countries, they observed that
income elasticity between developed economies and emerging economies
are consistent with “S-curve” insurance growth findings by Enz (2000).
3. Issues and QuestionsThe major issue to start with would be to re-examine the
significant variables that can best fit as determinants of life insurance
demand. Recently, there are a number of studies on single economies:
Hwang and Gao (2003) focused on the Chinese economy; Lim and
Haberman (2004) considered Malaysia; and Hwang and Greenford (2005)
again on Mainland China, Hong Kong and Taiwan. Lenten and Rulli (2006)
explored the time series properties of the demand for life insurance in
Australia using a novel statistical procedure that allows unobservable
components to be extracted.
Zietz (2003) and Hussels et al. (2005) have reviewed the efforts
of researchers to explain consumer behaviour concerning the purchase
of life insurance for almost 50 years. These reviews suggest that the
bulk of empirical exercises found a positive association between increase
in savings behaviour, financial services industry and demand for life
insurance. Taking this forward, our first issue is to see whether or not
per capita gross domestic savings and financial depth influence life
insurance consumption. GDP and Per-capita GDP are often highly
correlated with the proxy variables measuring insurance demand:
Insurance density and penetration. We therefore ignore these two
variables and assume that as income grows, it will add to insurance
demand via rise in the savings component i.e., GDS.
The demographic factors such as dependency ratios, life
expectancy and adult literate population are considered and, in line with
earlier studies, we expect these to be significant in explaining life insurance
demand. It is expected that young dependency ratio will be negatively
related and the rest three demographic variables are expected to have a
positive relation. We have assumed first that consumer price index (CPI)
will be the best proxy for inflation although we have considered log
difference of CPI as an alternative measure for inflation. Lastly we have
the real interest rate, which in our case, is the deposit interest rate
minus inflation. In Table 1, we present our identified ‘potential’
determinants of life insurance consumption with the expected signs for
the cross-sectional analysis.
As already mentioned, this study has two analytical parts and
hence when it comes to researchable issues we are actually trying to

14 15
examine the same set of researchable issues using two separate
methodologies. First, we try to infer which variables can significantly
explain insurance consumption in 12 selected Asian economies. Second,
we use separate data set and cross check whether variables significantly
determining insurance consumption in panel are turning out to be
significant in the Indian case or not. Differences in results are possible
since some of the variables used in the panel and time series analysis
are either different or are considered for a much longer time period. But,
considering the ‘universality’ of some variables, we hypothesise that the
importance of such variables like income, etc. (in terms of expected sign)
in explaining insurance demand will hold true under different frameworks.
For the time series analysis on India, we have included variables
GDP per-capita, total dependency ratio, crude death rate and urban
population growth rate which are supposed to positively stimulate growth
but our price variable is expected to be inversely related.
4. Methodology
Determinants for 12 Asian Economies: The study focuses on 12
selected economies - 4 from the 7 SAARC9 countries (India, Bangladesh,
Pakistan and Sri Lanka); 2 from the Greater China region (China and
Hong Kong) and 6 from the ASEAN10 (Indonesia, Malaysia, Philippines,
Singapore, Thailand, and Vietnam) group. These 12 nations, apart from
being the most promising emerging and growing economies, they are
also struggling to overcome poverty. Except Hong Kong and Singapore,
most of the countries have less than USD 5000 GDP per capita. Six of the
selected economies in our sample have GDP per capita of less than USD
1000. One of the hurdles in empirical exercises pertaining to developing
economies is either limited or non availability of proper macro-economic
data. The availability of data was one key motivating factor behind
selection of economies.
The overall spending on insurance and related products in these
economies is very low when compared to the OECD economies. With
population growth rate above or near 1 percent and a comparatively low
level of insurance consumption – measured by per capita premium, there
ia an indication of the existing economies of scope and the potential for
growth. Although, some of these economies were gripped by the Asian
Financial Crisis, the issue is to create stronger infrastructure for financial
services and thereby boost the underdeveloped insurance market.
These economies display immense diversity in ethnicity, culture
and religion. The legal system too varies, though most of them following
the European legal system due to their colonial influence. Following the
General Agreement on Trade and Services (GATS), most of these
economies agreed to open up their financial sector in general and
insurance in particular, to either domestic private companies or foreign
companies or both. Table 5 shows that most of these countries were
dominated by a large number of insurers but their insolvencies called for
nationalization. It was in the beginning of 90s that regulatory changes
were initiated and implemented which once again opened the insurance
9 South Asia Association for Regional Cooperation; the rest 3 countries are Maldives,Nepal and Bhutan
1 0 The Association of Southeast Asian Nations and the other members are BruneiDarussalam, Cambodia, Laos and Myanmar.

16 17
industry but with more cushions in terms of regulation and supervision.
The 11-year period considered for this study from 1994 to 2004, witnessed
important regulatory changes. During this period, in most of the economies
expansion of life segment of the insurance market gained a particular
momentum. This helped to rejuvenate insurance density. The only
exception from this increasing trend was Pakistan, where actually density
has dropped.
Determinants for India: We examine the determinants explaining the
demand for insurance in general and life in particular for the period
starting 1965 to 2004. A number of changes have taken place during this
selected time horizon. In 1956, the life segment was nationalized: We
witnessed a war and a famine which had adversely affected the economy;
in the late eighties, the process of liberalisation was initiated with the
financial sector reforms in 1991; and lastly 1999 marked the re-opening
of the insurance market and establishment of IRDA. The dependent
variables considered are insurance penetration, insurance density and
net premiums.
Data Source: The panel for 12 selected Asian countries studied for 11
years starting from 1994 to 2004 is constructed using annual aggregate
data from different secondary sources. The Insurance premium figures
are collected from various issues of Sigma, a publication from Swiss Re.
The Economic as well as demographic variables used are collected from
the International Financial Statistics (IFS) 2006 and the World Development
Indicators (WDI) 2006. The explanatory variables in the model are the
economic and demographic variables (refer Appendix: 1). The time series
analysis uses insurance business data available for the period 1965 to
2004 from the Life Insurance Corporation of India and Insurance Regulatory
and Development Authority’s Annual Reports. Data on economic and
demographic variables are collected from WDI 2006, available in local
currency units at current prices. All the economic variables are
transformed to constant 2000 prices.
5. Research Design
Determinants for 12 Asian Economies
We construct two separate panel data regression models. The
models are different since life insurance demand is represented by two
different dependent variables: Insurance penetration and insurance
density. We use panel data because of its advantages in obtaining greater
sources of variations which allow far more efficient estimation of the
parameters and ability to control for individual (cross-section)
heterogeneity. The estimation procedure can identify and estimate effects
which are difficult to determine via pure cross sections or pure time
series data11.
1 1 For complete discussion on Panel Data models please refer to Baltagi (2005) andHsiao (2003).
The specifications of the models to be estimated are as under:
ititiit FINDGDSPCPEN logloglog 21
itititit ADLODRYDRURB logloglog 6543
itLEXRlog7 8 9(1/ )it it itRIR CPI (2)

18 19
ititiit FINDGDSPCDEN logloglog 21
itititit ADLODRYDRURB logloglog 6543
itLEXRlog7 ititit CPIRIR /1log98 (3)
Where, PEN = Insurance penetration; DEN = Insurance density;GDSPC = Gross Domestic Savings per-capita; FIND = Financial depth;URB = Urban population; YDR =Young dependency ratio; ODR = Olddependency ratio; ADL = Adult literacy rate; LEXR = Life expectancy atbirth; RIR = Real interest rate; and CPI = Consumer price index.
Here, subscript i denotes the country, the subscript t represents
time, i are cross-sectional intercept terms, ’s are the slope parameters
and it and íit are random error terms. The model argues that variations
in the independent variables in the 12 selected economies may contribute
to insurance penetration and insurance density.
To address the problems of estimation and inference associated
with panel data, we estimate both the fixed effects model (FEM) and the
random effect model (REM). The FEM does not assume any time effect
and focuses only on cross section effects. An incorporation of a dummy
in (2) and (3) will automatically restrict us to look only for cross section
specific effects. Therefore, although we discussed some of the control
variables specific to religion, market structure and regulation, we have
not considered the same as our objective is to estimate effects of time
variant variables. The REM assumes exogeneity of all the regressors
with random individual effects12. The decision regarding the best model
between FEM and REM is arrived at using the Hausman test.
Determinants for India
We begin our analysis by testing the time-variant variables for
seasonality. We next make appropriate transformations to make the
estimation process free from biases arising due to seasonality of variables
used. However, variables of rate value were not transformed because
they are already in a preferred form as they are a measure of change.
Based on this rationale, the variables of rate value form, i.e., PEN, DEN,
INFR, RIR, TDR, ODR, YDR, CDR, LEXR and urban population growth rate
(URBGR) were not subjected to any transformation13. GDP per-capita,
GDS per-capita, FIND, PRICE, and PREM of the level value form were
transformed by taking the natural logarithm of their level values so that
their coefficients represents elasticity.
To investigate the stationary properties of the selected regressors,
we have considered two different tests: the Augmented Dickey Fuller
(ADF) Test and the Kwiatkowski-Phillips-Schmidt-Shin (KPSS) Test.
Augmented Dickey Fuller (ADF) Test: This test is based on the model
of the form,1
*1
1
p
t t j t j ij
y y y u
(4)
and the pair of hypothesis is; 0 1: 0 : 0H versus H
The t-statistics is calculated for the co-efficient from an OLS
estimation of (i) (Dickey and Fuller, 1979). The null hypothesis is rejected
1 2 Mundlak (1978) cited in Hsiao (2003).
1 3 Refer Appendix 1 for a complete discussion on the explanatory and explainedvariables, their abbreviations and for data sources.

20 21
if the calculated t-statistics is less than the critical value and implies that
the series is stationary and vice versa.
Kwiatkowski-Phillips-Schmidt-Shin (KPSS) Test: The integration
properties of a series yt, may also be tested against a unit root (the null
hypothesis that the series is stationary)
0 1: ~ 0 : ~ 1t tH y I against H y I
Kwiatkowiski et al., (1992) has derived a test for this pair of hypotheses.
If there are no linear trend term than, they start from a t t ty x z ;
where xt is a random walk and 1t t tx x v , where 2~ 0,t vv iid and zt is a stationary process. The new pair of hypotheses is now:
2 20 1: 0 : 0v vH against H .
The test statistics proposed is as under:
T
ttS
TKPSS
1
222
ˆ/1 (5)
where,
t
jjtS
1
; yytt and 2ˆ is an estimator of
the longrun variance of the process zt. The null hypothesis of stationarity
is rejected for larger values of the test statistics KPSS and vice versa.
Based on the two test results, all the series were transformed in
order to make them stationary. The dependent variables used in this
time series analysis are insurance penetration and insurance density.
The models estimated are of the form:
YDRDRURBLEXRPRICERIRNFRDPPC
,O,CDR,,,,,IGDSPC,,GFIND,
fPEN (6)
YDRDRURBLEXRPRICERIRNFRDPPC
,O,CDR,,,,,IGDSPC,,GFIND,
fDEN (7)
Where, GDPPC = Gross Domestic Product per-capita; INFR = Inflation
rate and CDR = Crude death rate.
6. Results and Interpretation
Determinants for 12 Asian Economies
We have dropped GDP per-capita to reduce the high level of
correlation in the fixed effects model and have considered the inverse of
CPI as an indicator of inflation. The discussion in this section is based on
the final results of the models and the summary results are reproduced
in Table 4.
Our results based on the balanced panel, allow us to exploit
both cross-country and time-series variation in the data. The fixed effect
model (Model 1) shows that variations in insurance penetration are
explained by GDS per-capita, financial depth, urbanization, old dependency
ratio, adult literacy, life expectancy and measure of inflation. But, in the
random effect model (Model 2), financial depth, old dependency ratio
and inflation turn out to be significant. From the fixed effects regression,
the F statistics for testing the joint significance of the country effect is
13.19 {F [11,105]}. This is greater than the critical value and the evidence
is strongly in favour of country effect in the data. Also, the Hausman test

22 23
for the fixed and random effect regressions give the test statistics 101.89
with 9 degrees of freedom. The critical value of chi-square with 9 degrees
of freedom is 16.92 at 95 percent level of significance. Thus, we can
reject the fact that the individual effects are uncorrelated with other
regressors in the model. This further suggests that of the two alternatives
we have considered, the fixed effects model (Model 1) is a better choice.
Similarly, when we use insurance density as the dependent
variable to see the impact of variations of the independent variables,
fixed effects model (Model 3) turns out to be a better choice. Model 3
also suggests that there is a significant relation between GDS per-capita,
financial depth, urbanization, old dependency ratio, adult literacy, life
expectancy and inflation.
The regression results obtained from Models 1 and 3 show that
GDS per-capita is having a positive relationship with insurance density
and penetration, respectively. This suggests that, as savings activity
increases, it will push up per capita insurance expenditure and thereby
enhance insurance demand. The significant positive relation between
density and penetration with financial depth suggests that as the financial
sector strengthens, insurance sector too will benefit. Although urbanization
is significant, its sign is contradictory to earlier studies and fails to fulfil
our expectation that the level of urbanization in an economy raises
insurance consumption. For the present study, it suggests that urbanization
will decrease insurance consumption. This may be as a result of rural-
urban migration and a raising share of poor population in the urban
centres in most of the selected economies.
Young dependency ratio has the expected sign but it was found
to be insignificant in all the 4-models. Old dependency ratio is significant
but again its relationship with demand proxies does not corroborate with
earlier studies. It suggests that rising old dependency ratio will taper off
demand. Interestingly, the implication of overall education in an economy
as studied via using adult literate population variable was statistically
significant but failed to confirm the expected relationship. This might
probably give rise to the issue whether or not higher education or a
certain minimum, guarantees awareness of insurance benefits. The last
of the demographic variable studies, the life expectancy of the total
population at birth, was highly significant and suggests that as living
conditions improve enhancing longevity of life, demand for insurance
products would go up. As expected, inverse of inflation is inversely related
with density and penetration and is significant but real interest rate is
not. The relation between inflation with the demand proxies does not
corroborate with earlier studies and hence we conclude that current
interest rate or price situation does not affect insurance consumption
decisions.
Determinants for India
The results obtained are surprising and re-inforces one to probe
further why most of the determinants successful in determining the
demand for insurance in the cross country analysis fail to explain the
Indian scenario. We have considered two dependent variables (i.e.,
insurance penetration and density) and tried to explain the variation in
these by set of economic variables (income, savings, prices of insurance
product, inflation and interest rates) and demographic variables
24 25
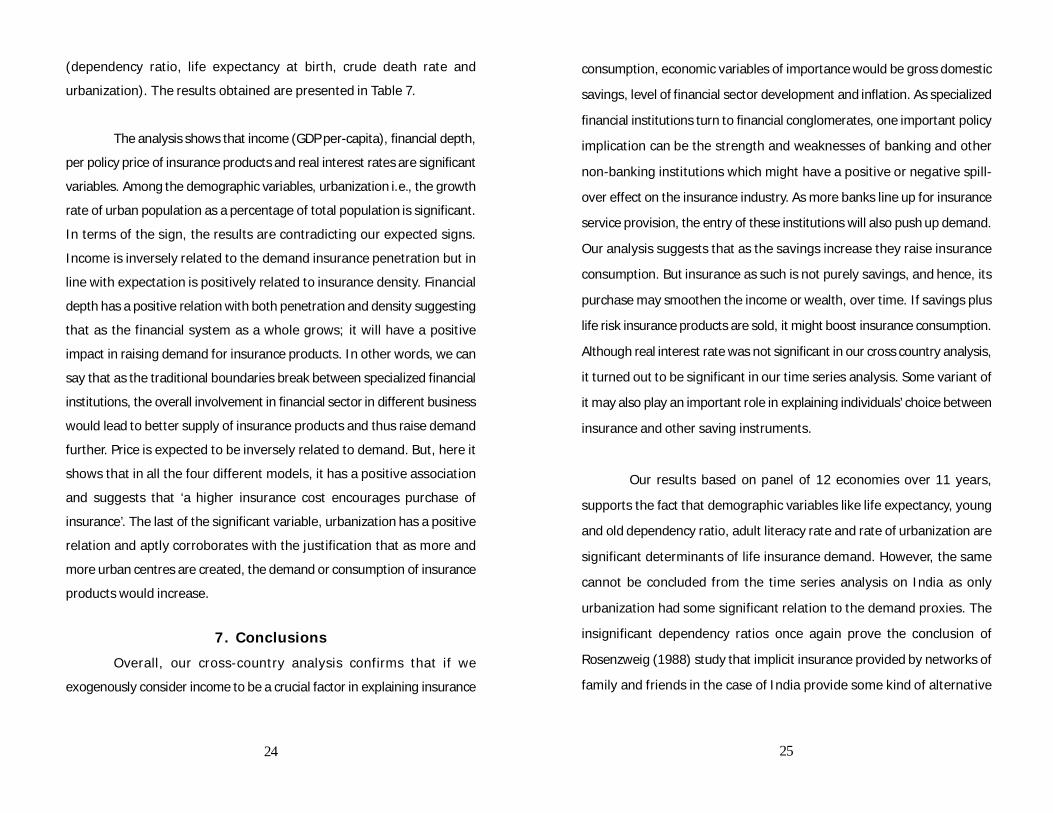
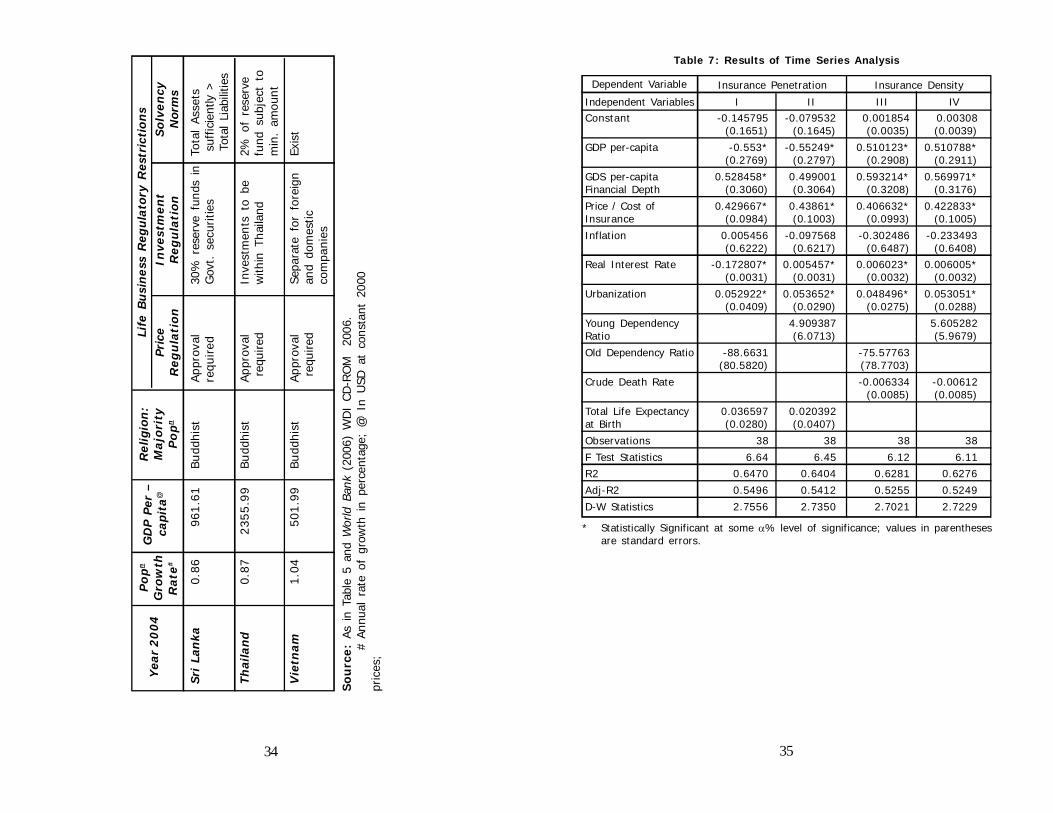
(dependency ratio, life expectancy at birth, crude death rate and
urbanization). The results obtained are presented in Table 7.
The analysis shows that income (GDP per-capita), financial depth,
per policy price of insurance products and real interest rates are significant
variables. Among the demographic variables, urbanization i.e., the growth
rate of urban population as a percentage of total population is significant.
In terms of the sign, the results are contradicting our expected signs.
Income is inversely related to the demand insurance penetration but in
line with expectation is positively related to insurance density. Financial
depth has a positive relation with both penetration and density suggesting
that as the financial system as a whole grows; it will have a positive
impact in raising demand for insurance products. In other words, we can
say that as the traditional boundaries break between specialized financial
institutions, the overall involvement in financial sector in different business
would lead to better supply of insurance products and thus raise demand
further. Price is expected to be inversely related to demand. But, here it
shows that in all the four different models, it has a positive association
and suggests that ‘a higher insurance cost encourages purchase of
insurance’. The last of the significant variable, urbanization has a positive
relation and aptly corroborates with the justification that as more and
more urban centres are created, the demand or consumption of insurance
products would increase.
7. Conclusions
Overall, our cross-country analysis confirms that if we
exogenously consider income to be a crucial factor in explaining insurance
consumption, economic variables of importance would be gross domestic
savings, level of financial sector development and inflation. As specialized
financial institutions turn to financial conglomerates, one important policy
implication can be the strength and weaknesses of banking and other
non-banking institutions which might have a positive or negative spill-
over effect on the insurance industry. As more banks line up for insurance
service provision, the entry of these institutions will also push up demand.
Our analysis suggests that as the savings increase they raise insurance
consumption. But insurance as such is not purely savings, and hence, its
purchase may smoothen the income or wealth, over time. If savings plus
life risk insurance products are sold, it might boost insurance consumption.
Although real interest rate was not significant in our cross country analysis,
it turned out to be significant in our time series analysis. Some variant of
it may also play an important role in explaining individuals’ choice between
insurance and other saving instruments.
Our results based on panel of 12 economies over 11 years,
supports the fact that demographic variables like life expectancy, young
and old dependency ratio, adult literacy rate and rate of urbanization are
significant determinants of life insurance demand. However, the same
cannot be concluded from the time series analysis on India as only
urbanization had some significant relation to the demand proxies. The
insignificant dependency ratios once again prove the conclusion of
Rosenzweig (1988) study that implicit insurance provided by networks of
family and friends in the case of India provide some kind of alternative
26 27
arrangement to take care of life related risks14. Therefore, if we consider
that the older generation in most of the low-income and developing
countries considered consumption of insurance as an unnecessary
expense, the policy recommendation to enhance awareness among the
current generation is via proper information dissemination.
According to Liedtke (2007) insurance should be considered a
key component of economic development and the best mechanism to
take care of multidimensional risks in modern economies. It is necessary
to clear the confusion regarding considering life insurance as a superior
or luxury good among potential consumers in developing countries with
comparatively low per-capita income. But as per-capita income is steadily
creeping up in the selected economies15 with changes in the standard of
living, the suppliers might stimulate demand and increase the availability
of insurance products. This would reduce the scarce and costly outlook
of life insurance products. The study can be extended considering more
variables and dummies to look for the country and time specific factors
affecting demand. The results are of importance to the policy makers if
they are aspiring to elevate insurance density and penetration in the
economies. Most of the selected economies have undergone changes,
particularly in terms of regulatory reforms recently. It would be useful to
take a much bigger sample in terms of countries and periods considered,
to understand why some of the variables behaved so differently than
expected.1 4 The information was collected from the study by Townsend(1995) which dealt
with some of the issues relating to evaluation of risk bearing systems in low-income economies.
1 5 Singapore and Hong Kong are however two countries in the high-income group.
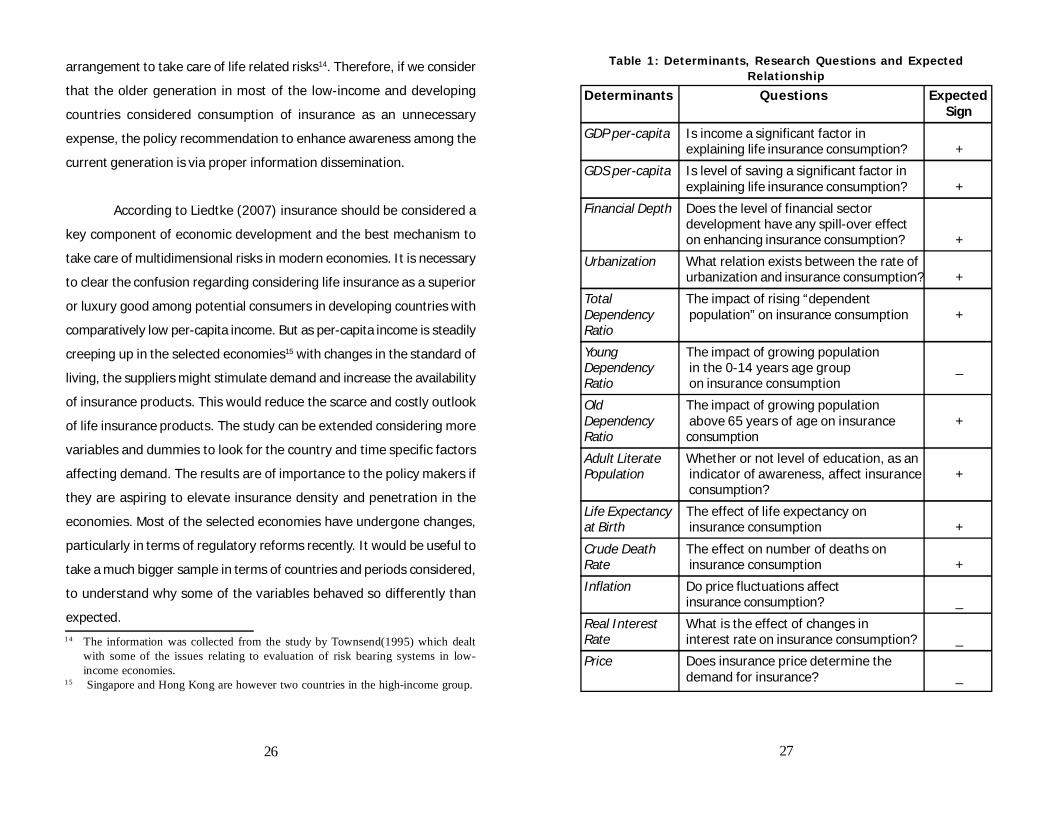
Table 1: Determinants, Research Questions and ExpectedRelationship
Determinants Questions ExpectedSign
GDP per-capita Is income a significant factor inexplaining life insurance consumption? +
GDS per-capita Is level of saving a significant factor inexplaining life insurance consumption? +
Financial Depth Does the level of financial sectordevelopment have any spill-over effecton enhancing insurance consumption? +
Urbanization What relation exists between the rate ofurbanization and insurance consumption? +
Total The impact of rising “dependentDependency population” on insurance consumption +Ratio
Young The impact of growing populationDependency in the 0-14 years age group _Ratio on insurance consumption
Old The impact of growing populationDependency above 65 years of age on insurance +Ratio consumption
Adult Literate Whether or not level of education, as anPopulation indicator of awareness, affect insurance +
consumption?
Life Expectancy The effect of life expectancy onat Birth insurance consumption +
Crude Death The effect on number of deaths onRate insurance consumption +
Inflation Do price fluctuations affectinsurance consumption? _
Real Interest What is the effect of changes inRate interest rate on insurance consumption? _
Price Does insurance price determine thedemand for insurance? _

28 29
Premiums* Density# Premiums* Density# Premiums* Density#
Bangladesh 0.011 0.0001 103.71 0.81 231.48 1.66
China 2027.41 1.71 10752.17 8.58 30584.31 23.60
Hong Kong 25 36 .4 4 4 22 .8 8 49 73 .2 6 7 52 .7 3 14 64 3. 54 21 22 .2 5
India 3652.70 3.99 6306.50 6.31 14716.36 13.63
Indonesia 625.08 3.30 780.79 3.83 1496.19 6.88
Malaysia 1222.39 60.81 1892.14 83.32 3798.01 152.53
Pakistan 211.00 1.77 186.49 1.38 230.14 1.51
Philippines 375.08 5.61 538.99 7.20 795.78 9.75
Singapore 14 76 .5 7 4 31 .6 2 28 37 .7 0 7 18 .0 4 64 37 .3 2 15 32 .7 0
Sri Lanka 0.011 0.0006 73.80 4.05 115.46 5.95
Thailand 1235.20 21.20 1550.48 25.74 2936.49 46.10
Vietnam 0.011 0.0002 35.62 0.46 442.46 5.38
Table 2: Life Insurance Premiums and Penetration Figures forthe 12 Asian Economies
Source: Sigma (various issues), Swiss Re.* in Millions of USD at constant 2000 prices# Life Premiums as percentage of total mid-year population1 Figures are extrapolated
1 9 9 4 1 9 9 9 2 0 0 4
Table 3: Correlations
Per Capita GDS Life Penetration DensityGDP Premium
Per Capita 1.000 -0.080 0.205 0.811** 0.879**GDP
GDS 1.000 0.817** 0.050 -0.057
Life 1.000 0.453** 0.305Premium
Penetration 1.000 0.910**
Density 1.000
** Correlation is significant at the 0.01 level (2-tailed).
Constant -161.993* -59.125* -161.854* -66.253*(39.091) (27.491) (39.378) (28.595)
GDS per-capita 2.997* 0.868 3.190* 1.374(1.0540) (0.855) (1.062) (0.875)
Financial Depth 4.268* 4.296* 4.392* 4.495*(1.352) (1.200) (1.362) (1.209)
Urbanization -0.088* -0.021 -0.087* -0.020(0.0432) (0.016) (0.043) (0.017)
Young Dependency Ratio -6.697 -1.617 -6.804 -1.746*(5.968) (3.901) (6.012) (4.042)
Old Dependency Ratio -8.448* -8.869* -8.152* -8.816(3.639) (3.388) (3.666) (3.447)
Adult Literate Population -11.103 *0.752 -10.775* 0.624(3.212) (0.495) (3.236) (0.523)
Total Life Expectancy 119.749* 20.271 118.448* 23.716at Birth (0.249) (13.940) (22.374) (14.556)
Inflation -8.500* -10.485* -8.414* -10.149*(4.620) (3.911) (4.654) (3.935)
Real Interest Rate 0.119 -0.151 0.109 -0.133(0.249) (0.284) (0.251) (0.279)
Observations 126 126 126 126
F Test Statistics / 2 13.19 101.57 13.15 134.96
R2 Within 0.6467 0.5288 0.6598 0.5639
Between 0.0829 0.5514 0.3265 0.7086
Overall 0.0628 0.4627 0.2588 0.6362
Hausman Test Statistics 101.89 91.03
Table 4: Panel Data Estimation
* Statistically significant; Figures in parentheses are standard errors
IndependentVariables Fixed Effect
RandomEffect Fixed Effect
RandomEffect
Dependent Variable Insurance Penetration Insurance Density
Model 1 Model 2 Model 3 Model 4

30 31
Bangladesh The Department After separation 1984 Not 18of Insurance, from Pakistan Allowed Allowed 1 Publicheaded by the in 1972, 50% privateInsurance state-owned underwritingDirectorate of monopoly life in 1990the Ministry of insurer JibanCommerce. Bima Corporation
was establishedin 1973
China P.R. China Insurance PICC’s1 monopoly 1992; Allowed; 47Regulatory as insurer ended Interim 2002Commission in 1985; 5 new Management Regulations(CRIC) formed public insurer Regulation on Admn.in 1998 created; 4 for foreign of Foreign-
regional insurer Insurance investedexisted Institutions Insurance
allowed Companyforeignentry
Hong Kong Office of the Comparatively the 1997 after it Allowed; 140Commissioner most competitive became PRC’s 104 captiveof Insurance insurance market special insurers in(OCI); 1990 with over administrative operating
204 insurers region from 25countries
India Insurance The Life 100% private 26% equity 16Regulatory and Insurance participation share in 1 PublicDevelopment Corporation Act allowed localAuthority of 1956 merged since 1999 companies(IRDA); 1999 256 life insurers
to form LIC2
Indonesia The Directorate —- —- Allowed 62General forFinancialInstitutionsalong withMinistry ofFinance
Malaysia Ministry of In 1984 Takaful Always open Allowed 7Finance de Insurance Act to Privatefacto regulator permitted insurer Law andwith operations based Regulatoryadministration on Islamic changes inby Bank Negara principles. 1996.Malaysia (BNM)
Pakistan Securities and In 1972, 34 out of 1990 100% Allowed 5 1 PublicExchange 50 existing private entryCommission of insurers were Allowed sincePakistan (SECP); merged to form 19921999 State Life
Insurance Corp.2
Table : 5 Development of Life Insurance Industry*
No. ofInsurersEconomies
RegulatoryAuthority
Pre-Regulatory
Regime
RegulatoryChange
ForeignOwnership Philippines The Insurance Private sector The Republic New foreign 34
Commission was always Act No. 8179 insurer is(Komiyon ng emphasized of 1996 not allowedSeguro) permits 100% to hold a
foreign compositeownership license
Singapore The Insurance Until 1960s the 2000 The In 2000, 8Department of market was market was 49%the Monetary loosely liberalized to restrictionAuthority of regulated direct insurers on foreignSingapore ownership(MAS) in local
companieswas lifted
Sri Lanka The Insurance Insurance Corp. 2001, 100% Up to 90% 10Board of Sri Act in 1961 private foreign 1 PublicLanka; 2001 nationalized the operation investment
life insurance allowed in localIndustry to since 1986 companiesform ICS4
Thailand The Department Market was 1992 25% of 20of Insurance blocked for Insurance foreign(of the Ministry decades till business is ownershipof Commerce) late 1990s relatively in domesticindependent liberal insurers5
from 2002
Vietnam Ministry of Baoviet, a state 1999 Allowed 2 103Finance owned life insurer 2000, foreign Public
started operation approved & companiesin 1996 but was enacted new in 1999initially created set of laws followed byfor non-life 2 in 2000insurance
No. ofInsurersEconomies
RegulatoryAuthority
Pre-Regulatory
Regime
RegulatoryChange
ForeignOwnership
Source:Kwon, W. Jean (2001) “Toward Free Trade in Services: The ASEAN Insurance Market”, IIF
Occasional Paper, No. 3; International Insurance Foundation, Washington, DC.Kwon, W. Jean (2002) “The Insurance Markets of South Asia”, IIF Occasional Paper, No. 4;
International Insurance Foundation, Washington, DC.Kwon, W. Jean (2002) “The WTO and Insurance in Greater China: The Peoples Republic, Hong
Kong, Macau, and Taiwan”, IIF Occasional Paper, No. 6; International Insurance Foundation,Washington, DC.
1 People’s Insurance Company of China; 2 Life Insurance Corporation of India under the control ofGovernment of India; 3 The Corporation established under Article 11 of the Life Insurance(nationalization) Order of 1972 ;4Insurance Corporation of Sri Lanka, renamed the SriLanka Insurance Corporation Ltd. in 1993; 5 to be lifted to 49%;

32 33
Tabl
e 6
: Se
lect
ed E
con
om
ic,
Dem
ogra
phic
var
iabl
es a
nd
Reg
ula
tory
Res
tric
tio
ns
Ban
gla
desh
1.88
402.0
7M
uslim
Not
Kno
wn
Str
inge
nt
Wea
kly
impo
sed
Ch
ina
P.R
.0.
60132
3.1
4Co
nfuc
iani
smApp
rova
l fr
omSt
rict
res
tric
tions
,The
sol
venc
yCI
RCco
nfin
ing
the
area
sm
argi
n is
aof
ins
urer
inv
estm
ent
func
tion
ofto
ban
k de
posi
ts,
insu
rer’s
siz
e of
Gov
t. b
onds
, fin
anci
albu
sine
ssbo
nds,
etc
.m
easu
red
bypr
emiu
ms,
clai
ms,
or
both
.
Ho
ng
Ko
ng
1.16
274
46.3
2Co
nfuc
iani
smSe
lf-re
gula
tory
No
spec
ific
guid
elin
es.
4% o
fm
athe
mat
ical
rese
rves
and
0.3%
of
capi
tal
at r
isk
or $
HK
2 m
illio
n
Indi
a1.
4353
8.3
1H
indu
App
rova
l fr
omStr
inge
nt
Exce
ss o
f th
e I
RD
AN
ot l
ess
than
50%
valu
e of
ins
urer
in a
ppro
ved
Secu
ritie
sov
er its
lia
bilit
yam
ount
val
ue
Ind
ones
ia1.
3590
6.1
9M
uslim
Not
Kno
wn
Tota
l in
vest
. ex
clud
ing
1% o
fm
ortg
age
loan
s sh
ould
Prem
ium
be e
qual
to
tech
nica
lR
eser
ves
rese
rves
Yea
r 2
00
4P
op
n
Gro
wth
Rat
e#
GD
P P
er –
capi
ta@
Rel
igio
n:
Ma
jori
tyP
op
nPr
ice
Reg
ula
tio
nIn
vest
men
tR
egu
lati
on
So
lven
cyN
orm
s
Life
Bu
sin
ess
Reg
ula
tory
Res
tric
tio
ns
Mal
aysi
a1.
86428
9.7
2M
uslim
1996
Ins
uran
ce30
% i
n Bu
mip
utra
Act
ual
valu
atio
nAct
& t
heSh
ares
, ow
ners
hip
of li
abili
ty,
Insu
ranc
esh
are
by e
thni
c M
alay
aggr
egat
eReg
ulat
ion
has
Insu
ranc
epr
ovis
ions
cove
rage
, et
c.re
gard
ing
pric
ing
Pak
ista
n2.
4156
6.0
3M
uslim
To f
ollo
wSt
atut
ory
fund
for
eac
hPre
scrib
es a
sset
SECP
prod
uct
sold
& li
abili
ty v
alua
-G
uide
lines
tion
met
hods
Ph
ilip
pin
es1.
79108
4.9
2Rom
anApp
rova
l fr
omPa
rtia
l/ va
ryin
gA
ggr
egat
eCat
holic
the
com
mis
sion
insu
ranc
eof
the
pre
miu
mCo
vera
ge in
forc
e,ra
tes
subj
ect
to m
in.
amou
nt
Sin
gap
ore
1.31
241
63.9
1Budd
hist
App
rova
l fr
omPa
rtia
l/ va
ryin
gFu
nd s
olve
ncy
prin
cipa
lm
argi
n &
Off
icer
s an
dco
mpa
ny
dire
ctor
s fr
omso
lven
cy m
argi
nIn
sura
nce
Dep
t.&
cer
tific
ate
from
app
oint
edac
tuar
y
Yea
r 2
00
4P
op
n
Gro
wth
Rat
e#
GD
P P
er –
capi
ta@
Rel
igio
n:
Ma
jori
tyP
op
nPr
ice
Reg
ula
tio
nIn
vest
men
tR
egu
lati
on
So
lven
cyN
orm
s
Life
Bu
sin
ess
Reg
ula
tory
Res
tric
tio
ns
Yea
r 2
00
4P
op
n
Gro
wth
Rat
e#
GD
P P
er –
capi
ta@
Rel
igio
n:
Ma
jori
tyP
op
nPr
ice
Reg
ula
tio
nIn
vest
men
tR
egu
lati
on
So
lven
cyN
orm
s
Life
Bu
sin
ess
Reg
ula
tory
Res
tric
tio
ns
Sri
Lan
ka0.
8696
1.6
1Budd
hist
App
rova
l30
% r
eser
ve f
unds
in
Tota
l Ass
ets
requ
ired
Gov
t. s
ecur
ities
suf
ficie
ntly
> T
otal
Lia
bilit
ies
Thai
lan
d0.
87235
5.9
9Budd
hist
App
rova
lIn
vest
men
ts t
o be
2% o
f re
serv
e r
equi
red
with
in T
haila
ndfu
nd s
ubje
ct t
om
in.
amou
nt
Vie
tnam
1.04
501.9
9Budd
hist
App
rova
lSe
para
te f
or f
orei
gnEx
ist
req
uire
dan
d do
mes
ticco
mpa
nies
So
urc
e:As
in
Tabl
e 5
and
Wor
ld B
ank
(200
6) W
DI
CD
-RO
M
2006
.
#An
nual
rat
e of
gro
wth
in
perc
enta
ge;
@ I
n U
SD a
t co
nsta
nt 2
000
pric
es;
Constant -0.145795 -0.079532 0.001854 0.00308(0.1651) (0.1645) (0.0035) (0.0039)
GDP per-capita -0.553* -0.55249* 0.510123* 0.510788*(0.2769) (0.2797) (0.2908) (0.2911)
GDS per-capita 0.528458* 0.499001 0.593214* 0.569971*Financial Depth (0.3060) (0.3064) (0.3208) (0.3176)
Price / Cost of 0.429667* 0.43861* 0.406632* 0.422833*Insurance (0.0984) (0.1003) (0.0993) (0.1005)
Inflation 0.005456 -0.097568 -0.302486 -0.233493(0.6222) (0.6217) (0.6487) (0.6408)
Real Interest Rate -0.172807* 0.005457* 0.006023* 0.006005*(0.0031) (0.0031) (0.0032) (0.0032)
Urbanization 0.052922* 0.053652* 0.048496* 0.053051*(0.0409) (0.0290) (0.0275) (0.0288)
Young Dependency 4.909387 5.605282Ratio (6.0713) (5.9679)
Old Dependency Ratio -88.6631 -75.57763(80.5820) (78.7703)
Crude Death Rate -0.006334 -0.00612(0.0085) (0.0085)
Total Life Expectancy 0.036597 0.020392at Birth (0.0280) (0.0407)
Observations 38 38 38 38
F Test Statistics 6.64 6.45 6.12 6.11R2 0.6470 0.6404 0.6281 0.6276
Adj-R2 0.5496 0.5412 0.5255 0.5249
D-W Statistics 2.7556 2.7350 2.7021 2.7229
Table 7: Results of Time Series Analysis
* Statistically Significant at some % level of significance; values in parenthesesare standard errors.
Dependent Variable
Independent Variables I II III IV
Insurance Penetration Insurance Density
34 35

Figure 1: Insurance Penetration in Selected 12 Asian Economies
Insurance penetration in 12 Asian Economies
0
2
4
6
8
1994 1999 2004Year
Prem
ium
s as
% o
f G
DP
Bangladesh China Hong Kong IndiaIndonesia Malaysia Pakistan PhillipinesSingapore SriLanka Thailand Vietnam
Source: Swiss Re, Sigma (various Issues)
36 37
Gross Domestic It is the sum of value added by allProduct (GDP) resident producers plus any product taxes
(less subsidies) not included in thevaluation of output. Growth is calculatedfrom constant price GDP data in localcurrency unit
GDP per-capita It is gross domestic product divided bymidyear population.
GDS per-capita The gross domestic savings divided bymidyear population.
Consumer Price It reflects changes in the cost to theIndex (CPI) average consumer of acquiring a basket
of goods and services that may be fixedor may change at specified intervals,such as yearly.
Liquid Liabilities as They include bank deposits of generallya % of GDP (for less than one year plus currency. It is theFinancial Depth) sum of currency and deposits in the(FIND) central bank, plus transferable deposits,
electronic currency, plus savings in timeand savings deposits, foreign currencytransferable deposits, certificate ofdeposit and securities repurchaseagreements etc.
Inflation Rate (INFR) Log difference of CPI
Real Interest Rate(RIR) Deposit interest minus inflation
Population Total mid-year population
Total Dependency The ratio of dependent young PopulationRatio (TDR) and dependent old Population to the
working age population-those ages 15 to64
Young Dependency The ratio of dependents - people youngerRatio (YDR) than 15 years of age to the working age
population - those ages 15 to 64
Old Dependency Ratio The ratio of dependents - people older(ODR) than 64 years of age to the working age
population - those ages 15 to 64
Adult Literacy Rate The percentage of people ages 15 and(ADL) older who can, with understanding, both
read and write a short, simple statementabout their everyday life.
Appendix 1: Explanatory and Explained variables
ECONOMIC
DEMOGRAPHIC
Type ofVariable DescriptionVariable Name

Life Expectancy at The number of years a newborn infantBirth (LEXR) would live if prevailing patterns of mortality
at the time of its birth were to stay thesame throughout its life.
Crude Death Rate No. of Deaths per ‘000 population(CDR)
Urban Population The population of the urban(URB) agglomeration, a contiguous inhabited
territory without regard to administrativeboundaries.
Urban Population Percentage change in Urban PopulationGrowth Rate URBGR as a percentage of Total Population
Premiums (PREM) Total Premium generated (net)
Price (PRICE) Ratio of Total First Year Premium Incometo Sum of No. of new individual policiessold and the no. of lives covered undergroup schemes.
Premium Density Total Premiums per-capita(DEN)
Premium Penetration Total Premium as a percentage of Gross(PEN) Domestic Product
(PSAV) Total Premium Income as percentage ofGross Domestic Savings
Type ofVariable DescriptionVariable Name
I N S U R A N C EBUSINESS
Source: Swiss Re (various issues) Sigma; IMF (various issues) International FinancialStatistics; World Bank (2006) World Development Indicators 2006 in CDRom; LIC (various issues) Annual Report and IRDA (various Issues) AnnualReports.
References
Arrow, K.J. (1953), “Le role des valeurs boursières pour la repartition lameilleure des risques. Econométrie”.Translated as: “The Role ofSecurities in the Optimal Allocation of Risk-Bearing,” Review ofEconomic Studies 31, 1964, 91-96.
Arrow, K.J. (1965), “Insurance, Risk and Resource Allocation”. In: G.Dionne and S.E. Harrington (eds.), “Foundations of InsuranceEconomics”, G. Dionne and S.E. Harrington (eds.), KluwerAcademic Publishers, 220-229.
Asvatanakul, J. (2006, “Thailand’s Insurance Industry,” Journal of RiskManagement and Insurance, 11, 1-12.
Babbel, D.F. (1985), “The Price Elasticity of Demand for Whole LifeInsurance,” Journal of Finance, 40, 225-239.
Baltagi, B.H. (2005), Econometric Analysis of Panel Data, John Wiley &Sons, Ltd.
Beck, T. and I. Webb (2003), “Economic, Demographic, and InstitutionalDeterminants of Life Insurance Consumption Across Countries,”World Bank Economic Review, 17, 51-88.
Beenstock, M., G. Dickinson and S. Khajuria (1986), “The Determinantsof Life Premiums: An International Cross-Section Analysis,”Insurance: Mathematics and Economics, 5, 261-270
Beenstock, M., G. Dickinson and S. Khajuria (1988), “The Relationshipbetween Property-Liability Insurance Premiums and Income:An International Analysis,” Journal of Risk and Insurance, 55,259-272.
Bernheim, B.D. (1991), “How Strong are Bequest Motives? Evidence basedon Estimates of the Demand for Life Insurance and Annuities,”Journal of Political Economy, 99, 899-927.
Bernheim, B.D., L. Forni, J. Gokhale and L.J. Kotlikoff (2003), “The Mismatchbetween Life Insurance Holdings and Financial Vulnerabilities:Evidence from the Health and Retirement Study,” AmericanEconomic Review, 93, 354-365.
38 39

Black, K.Jr. and H.D. Skipper Jr. (2003), Life and Health Insurance, PearsonEducation, India.
Blanchet, D. (2007). “Changing Life Cycles and their Impact on Insurance,”Geneva papers on Risk and Insurance, 32, 1-10.
Borch, K. (1977), “Optimal Life Insurance,” Geneva Risk and InsuranceReview, 2, 3-16.
Borch, K. (1990), Economics of insurance. Amsterdam: North-HollandPublisher.
Briys, E., G. Dionne and L. Eeckhoudt (1989). “More on Insurance as aGiffen Good,” Journal of Risk and Uncertainty, 2, 420-425.
Browne, M.J. and K. Kim (1993), “An International Analysis of LifeInsurance Demand,” Journal of Risk and Insurance, 60, 616-634.
Browne, M.J., J. Chung and E.W. Frees (2000), “International Property-Liability Insurance Consumption,” Journal of Risk and Insurance,67, 73-90.
Campbell, R.A. (1980), “The Demand for Life Insurance: An Applicationof the Economics of Uncertainty,” Journal of Finance, 35, 1155-1172.
Cargill, T.F. and T.E. Troxel (1979), “Modelling Life Insurance Savings:Some Methodological Issues,” Journal of Risk and Insurance,46, 391-410.
Chang, Y. and I. Erlich (1985), “Insurance, Protection from Risk, and RiskBearing,” Canadian Journal of Economics, 18, 574-586.
Chen, C. and H. Shih (2004), Banking and Insurance in the New China,Edward Elgar.
Cleeton, D.L. and B.B. Zellner (1993), “Insurance Risk Aversion and theDemand for Insurance,” Southern Economic Journal, 60, 146-156.
Debreu, G. (1953), “Une économie de ¾certain’. Miméo, ºlectricité deFrance”. In: Dionne, G. and S. E. Harrington (eds.) Foundationsof Insurance Economics, Kluwer Academic Publishers.
40 41
Dickey, D.A. and W.A. Fuller (1979), “Estimators of Autoregressive TimeSeries with a Unit Root,” Journal of the American StatisticalAssociation, 74, 427-431.
Enz, R. (2000), “The S-curve Relationship between Per-Capita Incomeand Insurance Penetration,” Geneva Papers on Risk and Insurance,25, 396-406.
Fisher, S. (1973), “A Life Cycle Model of Life Insurance Purchases,”International Economic Review, 14, 132-52.
Fortune, P. (1973), “A Theory of Optimal Life Insurance: Developmentand Tests,” Journal of Finance, 28, 587-600.
Greene, W.H. (2002), Econometric Analysis, Pearson Education Asia.
Hakansson, N.H. (1969), “Optimal Investment and Consumption Strategiesunder Risk, an Uncertain Lifetime, and Insurance,” InternationalEconomic Review, 10, 443-466.
Hammond, J.D., B.D. Houston and R.E. Melander (1967), “Determinantsof Household Life Insurance Premium Expenditures: An EmpiricalInvestigation,” Journal of Risk and Insurance, 34, 397-408.
Hatekar, N. and A. Singh (2004), “Determinants of Life InsuranceConsumption in India: A Cross-State Analysis,” Bimaquest, 4, 3-21.
Headen, R.S. and J.F. Lee (1974), “Life Insurance Demand and HouseholdPortfolio Behaviour,” Journal of Risk and Insurance, 41, 685-698.
Hoy, M. and R.J. Robson (1981), “Insurance as a Giffen Good,” EconomicsLetters 8, 47-51.
Hsiao, C. (2003), Analysis of Panel Data, 2nd Edition, Cambridge UniversityPress.
Hussels, S., D. Ward and R. Zurbruegg (2005), “Stimulating the Demandfor Insurance,” Risk Management and Insurance Review, 8, 257-278.
Hwang, T. and B. Greenford (2005), “A Cross Section Analysis of theDeterminants of Life Insurance Consumption in Mainland China,

Hong Kong, and Taiwan,” Risk Management and InsuranceReview, 8, 103-125.
Hwang, T. and S. Gao (2003), “The Determinants of Demand for LifeInsurance in an Emerging Economy-The case of China,”Managerial Finance, 29, 82-96.
Kahneman, D. and A. Tversky (1979), “Prospect Theory: An Analysis ofDecision under Risk,” Econometrica, 47, 263-291.
Karni, E. and I. Zilcha (1985), “Uncertain Lifetime, Risk Aversion and LifeInsurance,” Scandinavian Actuarial Journal, 109-123.
Karni, E. and I. Zilcha (1986), “Risk Aversion in the Theory of Life Insurance:The Fisherian Model,” Journal of Risk and Insurance, 53, 606-620.
Kwiattkowski, D., P. C. B. Phillips, P. Schmidt and Y. Shin (1992), “Testingthe Null of Stationarity against the Alternative of a Unit Root:How sure are we that the Economic Time Series have a UnitRoot?” Journal of Econometrics, 54, 159-178.
Kwon, H. and B.L. Jones (2006), “The Impact of the Determinants ofMortality on Life Insurance and Annuities,” Insurance:Mathematics and Economics, 38, 271-288.
Kwon, W.J. (2001), “Toward Free Trade in Services: The ASEAN InsuranceMarket,” IIF Occasional Paper, No. 3, Washington, DC:International Insurance Foundation.
Kwon, W.J. (2002), “The Insurance Markets of South Asia,” IIF OccasionalPaper, No. 4, Washington, DC: International Insurance Foundation.
Kwon, W.J. (2002), “The WTO and Insurance in Greater China: ThePeoples Republic, Hong Kong, Macau, and Taiwan,” IIF OccasionalPaper, No. 6, Washington, DC: International Insurance Foundation.
Laporta, R., F. Lopez-de-Silanes, A. Shleifer and R.W. Vishny (1997),“Legal Determinants of External Finance,” Journal of Finance,54, 1131-1150.
Laporta, R., F. Lopez-de-Silanes, A. Shleifer and R.W. Vishny (1998),“Law and Finance,” Journal of Political Economy, 106, 1113-1155.
Laporta, R., F. Lopez-de-Silanes, A. Shleifer and R.W. Vishny (2000),“Investor Protection and Corporate Governance,” Journal ofFinancial Economics, 58, 3-27.
Lenten, L.J.A. and D.N. Rulli (2006), “A Time-Series Analysis of the Demandfor Life Insurance Companies in Australia: An UnobservedComponents Approach,” Australian Journal of Management, 31,41-66.
Lewis, F.D. (1989), “Dependents and the Demand for Life Insurance,”American Economic Review, 79, 452-466.
Liedtke, P.M. (2007), “What’s Insurance to a Modern Economy?” GenevaPapers on Risk and Insurance, 32, 211-221.
Lim, C.C. and S. Haberman (2004), “Modelling Life Insurance Demandfrom a Macroeconomic Perspective: The Malaysian Case,”Research Paper: The 8th International Congress on Insurance,Mathematics and Economics, Rome.
Machina, M.J. (1982), “Expected Utility Theory without the IndependenceAxiom,” Econometrica, 50, 277-324.
Machina, M.J. (1987), “Choice Under Uncertainty: Problems Solved andUnsolved,” Economic Perspectives, 1, 121-154.
Mantis, G. and R.N. Farmer (1968), “Demand for Life Insurance,” Journalof Risk and Insurance, 35, 247-256.
Mossin, J. (1968), “Aspects of Rational Insurance Purchasing,” Journal ofPolitical Economy, 79, 553-568.
Mundlak,Y. (1978), “On the Pooling of Time Series and Cross SectionData,” Econometrica, 46, 69–85.
Outreville, J.F. (1990), “The Economic Significance of Insurance Marketsin Developing Countries,” Journal of Risk and Insurance, 62, 487-498.
Outreville, J.F. (1996), “Life Insurance Markets in Developing Countries,”Journal of Risk and Insurance, 63, 263-278.
42 43
Outrevil le, J .F. (1998), Theory and practice of insurance,Massachusetts: Kluwer Academic Publishers
Pissarides, C.A. (1980), “The Wealth-Age Relation with Life Insurance,”Economica, 47, 451-457.
Pratt, J.W. (1964), “Risk Aversion in the Small and in the Large,”Econometrica, 32, 122-136.
Rosenweig, M. (1988), “Risk, Implicit Contracts and the Family in RuralAreas of Low-Income Countries,”, Economic Journal, 98, 1148-1170.
Sennetti, J.T. (1976), “On Bernoulli, Sharpe, Financial Risk and the St.Petersburg Paradox,” Journal of Finance, 31, 960-962.
Townsend, R.M. (1995), “Consumption Insurance: An Evaluation of RiskBearing Systems in Low Income Economies,” Journal of EconomicPerspectives, 9, 83-102.
Truett, D.B. and L.J. Truett (1990), “The Demand for Life Insurance inMexico and the United States: A Comparative Study,” Journal ofRisk and Insurance, 57, 321-328.
von Neumann, J. and O. Morgenstern (1947), Theory of games andeconomic behavior, 2nd ed. Princeton, NJ: Princeton UniversityPress.
Ward, D. and R. Zurbruegg (2000), “Does Insurance Promote EconomicGrowth? Evidence from OECD Countries,” Journal of Risk andInsurance, 67, 489-506.
Ward, D. and R. Zurbruegg (2002), “Law, Politics and Life InsuranceConsumption in Asia,” Geneva Papers on Risk and Insurance, 27,395-412.
Yaari, M.E. (1964), “On Consumer’s Lifetime Allocation Process,”International Economic Review, 5, 304-317.
Yaari, M.E. (1965), “Uncertain Lifetime, Life Insurance, and the Theoryof the Consumer,” Review of Economic Studies, 32, 137-150.
Zhu, M. (2002), “An Analysis of Demand for Individual Life Insurance inChina,” Journal of Risk Management and Insurance, 7, 28-41.
Zietz, E.N. (2003), “An Examination of the Demand for Life Insurance,”Risk Management and Insurance Review, 6, 159-191.
44

MSE Monographs
* Monograph 1/2006
A Tract on Reform of Federal Fiscal Relations in India
Raja J. Chelliah
* Monograph 2/2006
Employment and Growth
C. Rangarajan
* Monograph 3/2006
The Importance of Being Earnest about Fiscal Responsibility
C. Rangarajan and Duvvuri Subbarao
* Monograph 4/2007
The Reserve Bank and The State Governments : Parterners In
Progress
Y.V. Reddy
* Monograph 5/2008
India’s Dilemmas : The Political Economy of Policy-Making in a
Globalized World
Kaushik Basu
MSE Working Papers
* Working Paper 1/2001
Some Aspects of Inter District Disparities in Tamil Nadu
Raja. J. Chelliah and K.R. Shanmugam
* Working Paper 2/2004
Informal Regulation of Pollution in a Developing Country
Vinish Kathuria
* Working Paper 3/2004
Does Environmental Kuznet’s Curve Exist for Indoor Air
Pollution? Evidence from Indian Household Level Data
Kavi Kumar K.S. and Brinda Viswanathan
* Working Paper 4/2006
Female Labour Migration in India : Insights From NSSO Data
K. Shanthi
* Working Paper 5/2006
Accounting for India’s Forest Wealth
Giles Atkinson and Haripriya Gundimeda
* Working Paper 6/2006
Is Economic Growth Sustainable? Environmental Quality of
Indian States Post 1991
Sacchidananda Mukherjee and Vinish Kathuria
* Working Paper 7/2006
Ground Water Pollution and Emerging Environmental
Challenges of Industrial Effluent Irrigation: A Case Study of
Mettupalayam Taluk, Tamilnadu
Sacchidananda Mukherjee and Prakash Nelliyat
* Working Paper 8/2006
Equalizing Health and Education: Approach of the Twelfth
Finance Commission
D.K. Srivastava
* Working Paper 9/2006
Fuel Demand Elasticities for Energy and Environmental
Policies: Indian Sample Survey Evidence
Haripriya Gundimeda and Gunnar Köhlin
* Working Paper 10/2006
Technical Efficiency in Agricultural Production and its
Determinants: An Exploratory Study at the District Level
K. R. Shanmugam and Atheendar Venkataramani