Embed Size (px)
Citation preview

AN ACOUSTIC ANALYSIS OF VOWEL NASALIZATION IN
PUNJABI SPEAKERS’ PRODUCTION OF ENGLISH IN
PAKISTAN
By Saira Zahid
2010-GCUF-4474-233
Thesis submitted in partial fulfillment of
the requirements for the degree of
MASTERS IN PHILOSOPHY
IN
APPLIED LINGUISTICS
DEPARTMENT OF APPLIED LINGUISTICS
GC UNIVERSITY, FAISALABAD.
August 2010-12

2
DECLARATION
The work reported in this thesis was carried out by me under the supervision of Dr. Asim
Mahmood, Assistant Professor, Department of English Linguistics GC University, Faisalabad, and
Prof. Dr. Sarmad Hussain, University of Engineering and Technology, Lahore.
I hereby declare that the title of thesis “An acoustic study of vowel nasalization in
Punjabi speakers’ production of English in Pakistan” and the contents of thesis are the
product of my own research and no part has been copied from any published source (except the
references, standard mathematical or genetic models /equations /formulas /protocols etc). I
further declare that this work has not been submitted for award of any other degree /diploma.
The University may take action if the information provided is found inaccurate at any stage.
Signature of the Student/Scholar
Registration No :_____________
3
CERTIFICATE BY THE RESEARCH SUPERVISOR
I certify that the contents and form of thesis submitted by Miss Saira Zahid, Registration
No 2010-GCUF-4474-233 has been found satisfactory and in accordance with the prescribed
format. I recommend it to be processed for the evaluation by the External Examiner for the award
of degree.
Signature………………….
Name: ……………………………...
Designation with Stamp……………………….
Coordinator, Department of English Linguistics
Chairperson, Department of English Linguistics
Dean Faculty of Administration and Management sciences

4
SUPERVISORY COMMITTEE
Supervisor
Signature…………………..
Name: ………………………
Designation with Stamp……………………….
Co-Supervisor
Signature…………………..
Name: ………………………
Designation with Stamp……………………….
5
TABLE OF CONTENTS
Contents Page No.
Acknowledgements
List of contents
List of tables
List of figures
Acknowledgement
Abstract 1
Chapter.1. INTRODUCTION 3
1.1.Statement of the problem 3
1.2.Background 4
1.3.key questions 4
1.4.Objectives 5
1.5.Significance 5
1.6.Delimitations 6
Chapter.2. REVIEW OF LITERATURE 7
2.1. Coarticulation 7
2.2. Assimilation 8
2.3. Types of Assimilation 9
2.3.1. Progressive assimilation 9
2.3.2. Regressive assimilation 9

6
2.3.3. Bidirectional 10
2.3.4. Assimilation of voicing, place and manner of Articulation 10
2.4. Nasalization 11
2.5. Types of nasalization 11
2.5.1. Contrastive nasalization 11
2.5.2. Distinctive nasalization 16
2.6. Acoustics of vowel nasalization 18
2.7. Phonetic context and nasalization 23
2.8. Prosodic structures and nasalization 24
2.9. Vowel quality and nasalization 25
2.10. Anticipatory Vs Carryover nasalization 27
2.11. Disordered speech and nasalization 28
2.12. World Englishes 32
2.13. Pakistani English 34
2.14. L1 influence on L2 37
Chapter. 3. METHODS AND MATERIALS 39
3.1. Stimuli 39
3.1.1. English data set 39
3.1.2. Punjabi data set 41
3.2. Respondents 44
3.3. Data collection 44
3.4. Analysis 45
3.5. Measurements 45
7
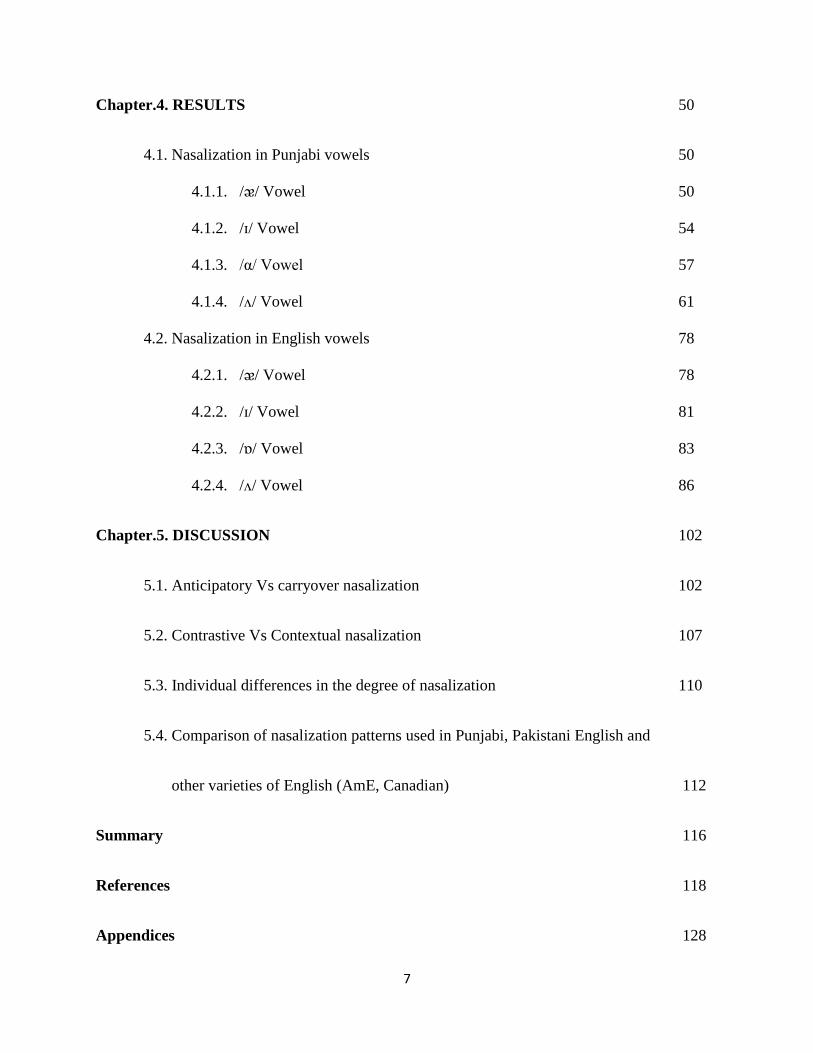
Chapter.4. RESULTS 50
4.1. Nasalization in Punjabi vowels 50
4.1.1. /ᴂ/ Vowel 50
4.1.2. /ɪ/ Vowel 54
4.1.3. /α/ Vowel 57
4.1.4. /ᴧ/ Vowel 61
4.2. Nasalization in English vowels 78
4.2.1. /ᴂ/ Vowel 78
4.2.2. /ɪ/ Vowel 81
4.2.3. /ɒ/ Vowel 83
4.2.4. /ᴧ/ Vowel 86
Chapter.5. DISCUSSION 102
5.1. Anticipatory Vs carryover nasalization 102
5.2. Contrastive Vs Contextual nasalization 107
5.3. Individual differences in the degree of nasalization 110
5.4. Comparison of nasalization patterns used in Punjabi, Pakistani English and
other varieties of English (AmE, Canadian) 112
Summary 116
References 118
Appendices 128

8
LIST OF TABLES
Tables Page No.
Table.2.1. Words Illustrating Contrasts between Oral and Nasal Vowels in
French.
12
Table.2.2. A List of Acoustic Correlates of Nasalization and the APs used to
Acquire them
21
Table.4.1. Frequencies of the nasal peaks and the first formant, averaged
across speakers, repetitions and vowel positions, in English
contextually nasalized vowels and Punjabi contextually and
contrastively nasal vowels. FP1 and FP0 indicate the frequencies of
nasal peaks on which the amplitudes P1 and P0 were measured,
respectively.
47
Table.4.2. .Δ(A1-P0)db and Δ(A1-P1)db Values at the Initial of the Vowels
in “v + n” Context.
65
Table.4.3. Δ(A1-P0)db and Δ(A1-P1)db Values at the Middle of the Vowels
in “v + n” Context.
65
Table.4.4. Δ(A1-P0)db and Δ(A1-P1)db Values at the End of the Vowels in
“v + n” Context.
66
Table.4.5. Δ(A1-P0)db and Δ(A1-P1)db Values at the Beginning of the
Vowels in “v + m” Context.
67
Table.4.6. Δ(A1-P0)db and Δ(A1-P1)db Values at the Middle of the Vowels
in “v + m” Context.
67

9
Table.4.7. . Δ(A1-P0)db and Δ(A1-P1)db Values at the End of the Vowels
in “v + m” Context.
68
Table.4.8. Δ(A1-P0)db and Δ(A1-P1)db Values at the Beginning of the
Vowels in “v + ŋ” Context.
69
Table.4.9. Δ(A1-P0)db and Δ(A1-P1)db Values at the Middle of the Vowels
in “v + ŋ” Context.
69
Table.4.10. Δ(A1-P0)db and Δ(A1-P1)db Values at the End of the Vowels in
“v + ŋ” Context.
70
Table.4.11. Δ(A1-P0)db and Δ(A1-P1)db Values at the Beginning of the
Vowels in “n + v” Context.
71
Table.4.12. Δ(A1-P0)db and Δ(A1-P1)db Values at the Middle of the Vowels
in “n + v” Context.
71
Table.4.13. Δ(A1-P0)db and Δ(A1-P1)db Values at the End of the Vowels in
“n + v” Context.
72
Table.4.14. Δ(A1-P0)db and Δ(A1-P1)db Values at the Beginning of the
Vowels in “m + v” Context.
73
Table.4.15. Δ(A1-P0)db and Δ(A1-P1)db Values at the Middle of the Vowels
in “m + v” Context.
73
Table.4.16. Δ(A1-P0)db and Δ(A1-P1)db Values at the End of the Vowels in
“m + v” Context.
74
Table.4.17. Δ(A1-P0)db and Δ(A1-P1)db Values at the Beginning of the
Contrastively Nasal Vowels.
75

10
Table.4.18. Δ(A1-P0)db and Δ(A1-P1)db Values at the Middle of the
Contrastively Nasal Vowels.
76
Table.4.19. Δ(A1-P0)db and Δ(A1-P1)db Values at the End of the
Contrastively Nasal Vowels.
76
Table.4.20. Δ(A1-P0)db and Δ(A1-P1)db Values at the Beginning of the
Vowels in “v + n” Context.
90
Table.4.21. Δ(A1-P0)db and Δ(A1-P1)db Values at the Middle of the
Vowels in “v + n” Context.
90
Table.4.22. Δ(A1-P0)db and Δ(A1-P1)db Values at the End of the Vowels in
“v + n” Context.
91
Table.4.23. Δ(A1-P0)db and Δ(A1-P1)db Values at the Beginning of the
Vowels in “v + m” Context.
92
Table.4.24. Δ(A1-P0)db and Δ(A1-P1)db Values at the Middle of the Vowels
in “v + m” Context.
92
Table.4.25.
Table.4.26.
Δ(A1-P0)db and Δ(A1-P1)db Values at the End of the Vowels in
“v + m” Context.
Δ(A1-P0)db and Δ(A1-P1)db Values at the beginning of the
Vowels in “v + ŋ” Context.
93
94
Table.4.27 Δ(A1-P0)db and Δ(A1-P1)db Values at the Middle of the Vowels
in “v + ŋ” Context.
94
Table.4.28 Δ(A1-P0)db and Δ(A1-P1)db Values at the End of the Vowels in
“v + ŋ” Context.
95
Table.4.29 Δ(A1-P0)db and Δ(A1-P1)db Values at the Beginning of the 96

11
Vowels in “n + v” Context.
Table.4.30 Δ(A1-P0)db and Δ(A1-P1)db Values at the Middle of the Vowels
in “n + v” Context.
96
Table.4.31 Δ(A1-P0)db and Δ(A1-P1)db Values at the End of the Vowels in
“n + v” Context.
97
Table.4.32. Δ(A1-P0)db and Δ(A1-P1)db Values at the Beginning of the
Vowels in “m + v” Context.
98
Table.4.33. Δ(A1-P0)db and Δ(A1-P1)db Values at the Middle of the Vowels
in “m + v” Context.
98
Table.4.34. Δ(A1-P0)db and Δ(A1-P1)db Values at the End of the Vowels in
“m + v” Context.
99
Table.5.1. Average Δ(A1-P0) and Δ(A1-P1) across Speakers, Repetitions
and Contexts (Regressive, Progressive) in the Middle of Punjabi
Vowels.
113
Table.5.2. Average Δ(A1-P0) and Δ(A1-P1) across Speakers, Repetitions
and Contexts (Regressive, Progressive) in the Middle of English
Vowels.
114
Table.5.3. Average Δ(A1-P0) Values for Pakistani English Vowels,
Measured at the Offset of the Vowels in CVN Context and at the
Onset of the Vowels in NVC Context. The Values are Averaged
across Repetitions and Speakers.
115
Table.5.4. Average Δ(A1-P0) Values stated by Chen (1997) for AME
Vowels, averaged across Repetitions and Speakers.
115

12
LIST OF FIGURES
Figures Page No.
Figure.2.1. Taiwanese Oral Vowels 14
Figure.2.2. Taiwanese Nasal Vowels 15
Figure.3.1. A1, P1, P0 Values Measured in Spectral Slice of Oral and Nasal
Vowel in English
47
Figure.4.1. Average A1-P0 across Four Speakers and Repetitions,
Measured within the Punjabi Vowel /ᴂ/ in Oral and Nasal
Contexts.
51
Figure.4.2. Average A1-P0 across Four Speakers and Repetitions,
Measured within the Vowel /ᴂ/ in Oral and Nasal Contexts.
52
Figure.4.3. Average A1-P0 across Four Speakers and Repetitions,
Measured within the Oral /ᴂ/ and Contrastively Nasal /ᴂ/
Vowel.
53
Figure.4.4. Average A1-P1 across Four Speakers and Repetitions,
Measured within the Vowel /ɪ/ in Oral and Nasal Contexts.
54
Figure.4.5. Average A1-P1 across Four Speakers and Repetitions,
Measured within the Vowel /ɪ/ in Oral and Nasal Contexts.
56
Figure.4.6. Average A1-P1 across Four Speakers and Repetitions,
Measured within the Oral /ɪ/ and Contrastively Nasal /ɪ/ Vowel.
57
Figure.4.7. Average A1-P0 across Four Speakers and Repetitions,
Measured within the Vowel /a/ in Oral and Nasal Contexts.
58

13
Figure.4.8. Average A1-P0 across Four Speakers and Repetitions,
Measured ithin the Vowel /a/ in Oral and Nasal Contexts.
59
Figure.4.9. Average A1-P0 across Four Speakers and Repetitions,
Measured within the Oral /a/ and Contrastively Nasal /a/
Vowel.
60
Figure.4.10. Average A1-P0 across Four Speakers and Repetitions,
Measured within the Vowel /ᴧ/ in Oral and Nasal Contexts.
62
Figure.4.11. Average A1-P0 across Four Speakers and Repetitions,
Measured within the Vowel /ᴧ/ in Oral and Nasal Contexts.
63
Figure.4.12. Average A1-P0 across Four Speakers and Repetitions,
Measured within the Oral /ᴧ/ and Contrastively Nasal /ᴧ/
Vowel.
64
Figure.4.13. 13. Average (A1-P0) across Vowels /ᴂ,a,ᴧ/ and Speakers
(Four)
77
Figure.4.14. Average (A1-P1) across Four Speakers for the Vowel /ɪ/ 78
Figure.4.15. Average A1-P0 across Five Speakers and Repetitions,
Measured within the Vowel /ᴂ/ in Oral and Nasal Contexts.
80
Figure.4.16. . Average A1-P0 across Five Speakers and Repetitions,
Measured within the Vowel /ᴂ/ in Oral and Nasal Contexts.
81
Figure.4.17. Average A1-P1 across Five Speakers and Repetitions,
Measured within the Vowel /ɪ/ in Oral and Nasal Contexts.
83
Figure.4.18. Average A1-P1 across Five Speakers and Repetitions,
Measured within the Vowel /ɪ/ in Oral and Nasal Contexts.
84

14
Figure.4.19. Average A1-P0 across Five Speakers and Repetitions,
Measured within the Vowel /ɒ/ in Oral and Nasal Contexts.
85
Figure.4.20. Average A1-P0 across Five Speakers and Repetitions,
Measured within the Vowel /ɒ/ in Oral and Nasal Contexts.
86
Figure.4.21. Average A1-P0 across Five Speakers and Repetitions,
Measured within the Vowel /ᴧ/ in Oral and Nasal Contexts.
88
Figure.4.22. Average A1-P0 across Five Speakers and Repetitions,
Measured within the Vowel /ᴧ/ in Oral and Nasal Contexts.
89
Figure.4.23. Average (A1-P0) across Vowels /a, ᴧ, ᴂ /and Speakers (Five) 100
Figure.4.24. Average (A1-P1) across Speakers (Five) 101
Figure.5.1. Average Δ(A1-P0) across Vowels (ᴂ, α, ᴧ), Speakers and
Repetitions, in Punjabi Vowels
103
Figure.5.2. Average Δ(A1-P1) across Speakers and Repetitions for Punjabi
Vowel /ɪ/
104
Figure.5.3. Average Δ(A1-P0) across Vowels /ᴂ, ɒ, ᴧ/, Speakers and
Repetitions, in English Vowels
106
Figure.5.4. Average Δ(A1-P1) across Speakers and Repetitions for English
Vowel /ɪ/
106
Figure.5.5. The Δ(A1-P0) and Δ(A1-P1) for Given Contextually Nasalized
Vowels (V) of Punjabi, Averaged across Speakers, Repetitions
and Contexts (Regressive and Progressive). The Δ(A1-P0) and
Δ(A1-P1) for Given Contrastively Nasal Vowels (Ṽ), Averaged
across Speakers and Repetitions.
107

15
Figure.5.6. The Δ(A1-P0) and Δ(A1-P1) for English Contextually
Nasalized Vowels V), Averaged across Speakers, Repetitions
and Contexts (Regressive and Progressive).
108
Figure.5.7. Average Δ(A1-P1) and Δ(A1-P0) across Punjabi Vowels,
Speakers and Repetitions at the Middle of the Vowels.
109
Figure.5.8. Average Δ(A1-P1) and Δ(A1-P0) across English Vowels,
Speakers and Repetitions at the Middle of the Vowels.
110

16
ACKNOWLEDGEMENTS
I am highly thankful to my respectful supervisor Dr. Mohammad Asim Mahmood, Department
of English Linguistics, Govt. College University of Faisalabad. It was his guidance and kind
supervision which helped me to accomplish my thesis in time. Secondly, I want to thank my
worthy co-supervisor Prof. Dr. Sarmad Hussain, University of Engineering and Technology, for
his guidance and the critical input provided on my work. I really appreciate his guidance and
thank him for helping me to resolve the technical issues during the analysis of the data. I want to
thank Dr. Rashid Mahmood and Sir kazim shah for their help and kind behavior.
I wish to pay gratitude to my parents whose prayers, co-operation and support enabled me to
achieve this goal. I also want to thank my brothers and sisters who always stood as a source of
motivation and inspiration for me. I am thankful to my friends especially Ansa, Farhat, Sumera,
Sehrish and Aqeela who always encouraged and motivated me. I also wish to thank my dear
colleagues Aysha, Afia, Asma and Saba whose care for me is really appreciable.
I want to thank Mr. Qaiser, from University of Engineering and Technology, who helped me in
the selection and application of the appropriate statistical test on the data used for this research. I
am really grateful for his support and for giving me his precious time. I am also thankful to
Waseem, Qaiser, Mohsin, Falak Sher and Usman who was the respondents of my study. Their
co-operation made the recording process less laborious.

17
ABSTRACT
This study adopted an acoustic approach to find out vowel nasalization patterns in Pakistani
English. The present study analyzed Punjabi speakers’ production of English words to identify
vowel nasalization pattern. As the phonemic inventory, syllable template and the phonotactic
constraints of Punjabi and English are different, it was hypothesized that the Pakistani English
language users whose L1 is Punjabi apply the Punjabi phonotactic constraints on English which
cause differences in coarticulatory process in their L2 production. The presence or absence of
nasalization in VN (vowel+ nasal consonant) and NV (nasal consonant+ vowel) contexts, its
degree and direction (anticipatory and carryover) were identified, analyzed and explained. For
this purpose, five native Punjabi speakers from Lahore were selected for the collection of data.
All the participants were advanced users of English. They were asked to pronounce a list of
carrier phrases consisting of both Punjabi and English words with different vowels in different
contexts. The speech samples were recorded and then analyzed by the speech processing
software PRAAT. The results depicted a great degree of nasality for regressive nasalization in
both Punjabi and Pakistani English. In English, the speakers showed relatively greater degree of
nasality for the /ɪ/ and / ᴂ/ vowels than /ɒ/ and /ᴧ/. In Punjabi, the /ᴂ/, /ᴂ/, /α/, /α/ and /ɪ/ vowels
showed relatively more degree of nasality than the others. The short vowel /ᴧ/ depicted lesser
degree of nasalization both in English and Punjabi. Pakistani English speakers differed from
AME in terms of the degree of nasalization for different vowels. Pakistani English speakers
showed greater degree of nasality for both low and high vowels while AME prefer low vowels to
nasalize greatly. The values A1-P1 and A1-P0 were measured to study the degree of nasalization.
The mean of Δ (A1-P1) for Pakistani English speakers was 6 db and the mean of Δ(A1-P0)
ranged from 4 db to 6 db. While, for AME, the mean of Δ(A1-P1) ranged from 10 db to 15 db

18
and Δ (A1-P0) ranged from 6 db to 8 db. The present study also helps to validate the claim that
Pakistani English is a separate variety. This study is significant as it may help to identify one of
the areas which might result in the difficulty of communication between native and non native
users of English.

19
Chapter One
INTRODUCTION
Nasalization is a very prominent but less understood feature of many languages spoken in
Pakistan. This research compared the contextual and contrastive nasalization phenomenon in
Punjabi vowels. The contextual nasalization in English vowels produced by Punjabi speakers
was also explored. This study also discussed the anticipatory and carryover directions of
nasalization in both languages. The degree and direction of nasalization in both languages were
determined using acoustic measures. The Punjabi speakers showed the same patterns of
nasalization in their L1 (Punjabi) and L2 (English). The results of this study were compared with
those of AME speakers to study the similarities and differences between the AME and the
English spoken by Punjabi speakers.
1.1. STATEMENT OF THE PROBLEM
The focus of this study was on vowel nasalization in the speech of Punjabi speakers. The
nasalization patterns were explored in Punjabi and Pakistani English. Punjabi has an oral-nasal
contrast for vowels (Bhatia, 2009) but English language has only oral vowels (Hardcastle &
Hewlett, 2006). It was hypothesized that this variation affects the Punjabi native speakers’
production of English language.
This study intended to locate the degree and direction of vowel nasalization by using
acoustic measures. It aimed to use scientific means to validate its findings and intended to
portray them quantitatively. Any determined nasalization patterns of Punjabi were not found, so

20
firstly, the degree and dimension of nasalization were explored in Punjabi and then these results
were compared with those of Pakistani English. After determining the nasalization patterns in
English produced by Punjabi speakers, the results were compared with those of AME.
1.2. BACKGROUND OF THE STUDY
The use of English language has resulted in gaining the status of global language. English has
been recognized as lingua franca. The wide spread of English has caused the emergence of many
varieties and dialects all over the world. In Pakistan also, English has been nativized and
localized. It has emerged as a different variety like Hong Kong English and Indian English etc.
Pakistani people use it with their own patterns and do not follow the native norms. The present
study aimed to explore one of the phonological areas of Pakistani English which distinguishes
Pakistani English from other varieties of English. So, this study aimed to strengthen the view that
Pakistani English is a different variety and also to explore the effect of speakers’ L1 (Punjabi) on
their production of L2 (English).
1.3. KEY QUESTIONS
This research aims to find answers to the following questions:
1. Do Pakistani English language users nasalize vowel sounds because of the neighboring
nasal sounds in VN and NV context?
2. Are some vowels more prone to nasalization than others in Pakistani English?
3. What is the degree of vowel nasalization in Pakistani English?
4. What impact the direction has on nasalization in Pakistani English?

21
5. What are the differences and similarities in vowel nasalization patterns in AME and
Pakistani English variety?
6. What is the direction and degree of nasalization in Punjabi?
7. Do the nasalization patterns of Punjabi affect the nasalization patterns of Pakistani
English?
1.4. RESEARCH OBJECTIVES
This study has the following objectives.
This study aimed to explore the contextual nasalization in Pakistani English.
This research aimed to find out if some vowels are more prone to nasalization than others
in PE.
It aimed to look at the degree of vowel nasalization in Pakistani English.
It sought also to explore the impact of direction on nasalization in Pakistani English.
It also aimed to explore the degree and direction of vowel nasalization in Punjabi.
It aimed to study the differences and similarities in vowel nasalization patterns in AME
and Pakistani English variety.
This research also aimed to study affect of nasalization patterns of Punjabi on the
nasalization patterns of Pakistani English.
It also aimed to find out the inter-varietal differences in the patterns of vowel nasalization
in English and Punjabi.

22
1.5. NEED AND SIGNIFICANCE OF THE STUDY
The present study sought to identify the nature of vowel nasalization in Pakistani English; it is
one of the phonological areas which ELT practitioners should focus while discussing the
intelligibility problems. This research intended to explore one of the areas which may contribute
for communication challenge between Pakistani English users and the native English speakers.
This research is also important as it gives an insight to the language teachers into the nature of
phonological patterns that distinguish between Pakistani English and the other varieties of
English. This study may also help language teachers in the selection of appropriate teaching
methods and strategies that accommodate and highlight the fine distinction of Pakistani English
from the other varieties of English. This research is significant as it seeks also to help in
determining one of the areas which provide a basis for the validation of the claim that Pakistani
English is a separate variety in its own right.
1.6. DELIMITATIONS OF THE STUDY
This research was limited to the study of vowel nasalization in VN (vowel-nasal) and NV (nasal-
vowel) contexts only. The number of selected participants was also limited as they were selected
from pure Punjabi background and specifically from one dialect. Only the speakers with low F0
were selected, so that the harmonics bearing the nasal effect could be traced accurately. Only
four oral vowels of English and four oral and four nasal vowels of Punjabi was selected.

23
Chapter Two
REVIEW OF LIRERATURE
Vowel nasalization is one aspect of the coarticulation. This chapter commences with the broader
phenomenon “coarticulation” leading to the concept of vowel nasalization. Firstly the
coarticulatory and assimilatory process are defined and then the articulation and acoustics of
nasalization are described. It discusses the relevant studies conducted theoretically or practically
to explore nasality phenomenon. The types and directions of nasalization are also discussed.
2.1. COARTICULATION
In connected speech, the physical realizations of sounds are conditioned by segmental context, as
sound segments are highly sensitive to context and show significant influence from neighboring
segments. Such contextual effect is known as coarticulation (Hardcastle & Hewlett, 2006;
Ohman, 1966). Coarticulation is a phenomenon in which the articulatory movements required for
one gesture are often anticipated (anticipatory coarticulation) or carried over (carryover
coarticulation) during the production of an adjacent gesture (Laver, 1994).
Coarticulation is further divided into the processes of assimilation, dissimilation,
reduction and deletion. When a sound is pronounced in connected speech, it may make its
neighboring sound more similar, dissimilar, reduced or deleted (Nathan, 2008; Roach, 2001).
Similar sounds require less articulatory effort than dissimilar sounds. However, sometimes
distinctiveness comes into play, and the speaker is required to make two sounds less similar to

24
one another. So dissimilation is a process by which one segment systematically avoids taking on
a feature of a neighboring segment (Zia, 2002).
Coarticulation occurs in particular contexts e.g. vowel to vowel (Cho, 2004; Magen,
1997; Manuel, 1990; Recasens, 2002), vowel to consonant (Recasens, 1984), consonant to
consonant (Repp & Mann, 1982) and consonant to vowel (Bradlow, 2002; Chen, Slifka &
Stevens, 2007; Li, 2008; Traunmuller, 1999).
There has been no discovered language in which some type or degree of coarticulation is
not to be found, leading it to be taken as a universal phenomenon (Farnetani, 1999). But even
though it is pervasive, it is also significant as a source of cross-language variation, with different
languages showing different patterns and degrees of various types of coarticulation. Ohman
(1966) makes clear that languages differ in their coarticulatory patterns. The process of
coarticulatory nasalization is an example of coarticulation which is extremely common among
languages (Beddor, 1993). However, the degree of nasalization is different among languages,
from subtle as in English (Hammond, 1999; Ladefoged, 2010) to strong as in Portuguese
(Oliveira & Silva, as cited in Kluge et al., 2009). Beddor and Krakow (1999) have studied this
phenomenon and made it clear that English and Thai are the languages which lack oral nasal
contrast for vowels, but they differ in the degree to which the vowel preceding a nasal consonant
is nasalized.
2.2. Assimilation
When speakers distort distinctiveness for the purpose of articulatory ease, they are usually
making the sounds more alike. So, speakers prefer to formulate the easiest sound which most
resembles the neighboring sounds. This is a process that makes two or more neighboring
segments more similar by making the segments share some feature.
25
The sounds may be assimilated totally or partially (Raphael, Borden & Harris, 2007) and most of
the rules are shared by different languages. They all follow certain phonetic rules but they are
also affected by particular phonotactic constraints of that language. So, phonological variations
also play their role along with the phonetic rules in speech. (Li, 2008)
2.3. Types of Assimilation
According to Brannan & Weiss (2007), the process of assimilation has two major categories
based on the direction in which the features are assimilated to one another. The categories are:
• Progressive Assimilation
• Regressive Assimilation
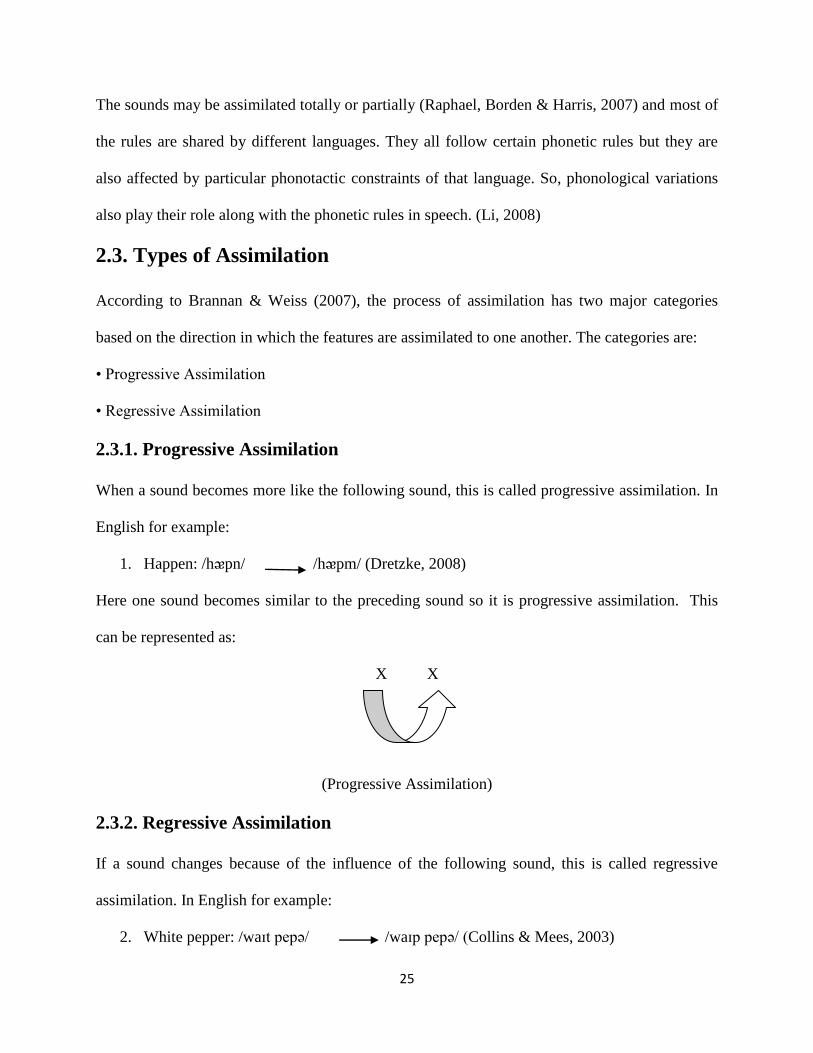
2.3.1. Progressive Assimilation
When a sound becomes more like the following sound, this is called progressive assimilation. In
English for example:
1. Happen: /hᴂpn/ /hᴂpm/ (Dretzke, 2008)
Here one sound becomes similar to the preceding sound so it is progressive assimilation. This
can be represented as:
X X
(Progressive Assimilation)
2.3.2. Regressive Assimilation
If a sound changes because of the influence of the following sound, this is called regressive
assimilation. In English for example:
2. White pepper: /waɪt pepǝ/ /waɪp pepǝ/ (Collins & Mees, 2003)

26
In this example the sound is becoming like the following sound, which is regressive assimilation.
It can be represented graphically as:
X X
(Regressive Assimilation)
2.3.3. Bidirectional Assimilation
The assimilation process may sometimes be bidirectional, which is called fusional assimilation
but it is not very common. (Jun, 1995)
In Urdu for example:
3. /hαnknα/ /hᾶŋkna/ (Zia, 2002)
The vowel is nasalized due to following nasal consonant and /n/ becomes /ŋ/ due to following
/k/.
Assimilation can be of manner, place or voicing.
2.3.4. Assimilation of Voicing, Place and Manner of Articulation
The types of assimilation are described on the basis of voicing, place and manner also. Roach
(2001) divides assimilation into three types: assimilation of voice, assimilation of place,
assimilation of manner. A very common phenomenon in the world's languages is Nasal Place
Assimilation (Mohanan, 1993; Jun, 1995; Shin, 2000).The place of articulation of a nasal
consonant depends on the place of articulation of the following consonant. There are three nasal
phonemes [m, n, ŋ] in English that are all subject to this process. It involves taking the [+nasal]
feature on the segment following the vowel and adding or spreading it to the vowel, making the
value of [nasal] identical for the two segments. The vowel assimilates to the neighboring nasal

27
consonant (Kluge et al., 2009; Mateus & d’Andrade, 2000). This is an example of manner
assimilation.
Over different languages, voicing assimilation is very common. For example in English,
a consonant [+voiced] becomes voiceless when the preceding consonant is voiceless.
Lapped: / læpd/ /læpt/ (Zia, 2002)
Here the consonant (d) becomes (t) when its preceding consonant (p) is voiceless.
2.4. Nasalization
The oral sounds are produced with the complete closure of nasal tract, whereas the nasal sounds
are produced with open velopharyngeal port. The phenomenon of vowel nasalization exists in
almost all the languages of world (Beddor, 1993). But the level of velopharengeal port’s opening
is different from language to language and from speaker to speaker.
All the languages over world have oral vowels, but there are some languages which have
nasal vowels as well. The nasal vowels are never observed to be greater in number than the oral
vowels in any language (Wright, 1986). Different studies have been done on different aspects of
vowel nasalization and have explored various patterns of nasalization. These studies are based on
acoustics (Chen, 1997, 2007), perception (Beddor, 1993) and physiology (Bell-Berti, 1993;
Krakow, 1993).
2.5. TYPES OF NASALIZATION
2.5.1. Contrastive Nasalization
During the production of vowel with neighboring nasal consonants, the languages with
contrastive vowels restrict the level of velum lowering and make vowels less nasalized than the
languages which lack this oral-nasal contrast. The velum lowering is restricted to maintain oral-
nasal contrast and to avoid the contextual nasalization. Herbert (1986) reports that only the

28
languages which have oral- nasal contrast for vowels have this pattern of velum lowering
restriction for oral vowels production in context of nasal sounds. Furthermore, Manuel (1990)
illustrates that the contrast of nasality in vowels and the degree of coarticulation are correlated
inversely.
French is one of the languages which has oral and nasal contrast in their vowel system.
This contrast of nasality in vowels has been explored by a number of linguists through using the
acoustic and articulatory means (Delvaux, 2002; Delvaux & Soquet, 2001; Delvaux, Metens &
Soquet, 2002).
Table.2.1.Words Illustrating Contrasts between Oral and Nasal Vowels in French
Source: From “Vowels and Consonants” by Ladefoged & Disner, 2012, Wiley-Blackwell.
In French, the absence or the presence of nasality in vowels changes the meaning of the
words. For example, the words “/la/, /lã/” and “/lo/, /lo/” have different meanings only because of
the vowels’ oral-nasal contrast. Berger (2007) also states an example of the French words “beau”
/bo/ (“beautiful”) and “bon” /bo/ (“good”) which contrast by the vowel nasalization. So in
29
French, the extent of nasalization changes the meaning of the words, leading it to be a language
which has phonemically contrastive vowel nasalization.
In French, not all the oral vowels have their nasal counterparts. Klopfenstein (2006) states the
example of high vowels /I, y, u/ which do not have the nasal counterparts. A number of studies
have explored the French nasalization patterns focusing on the vowels which have oral-nasal
contrast (Clumeck, 1976; Cohn, 1993; Rochet and Rochet, 1991). But some linguists also have
focused on the vowels which lack this contrast. Spear (2006) has compared the degree of
nasalization for the vowel /i/ which has no nasal counterpart. She measures the degree of
nasalization for the oral vowels /I, Ɛ/ in context of followed by a nasal consonant and by an oral
stop and for the nasal vowel /Ɛ/. To examine the nasalization degree, she measures the bandwidth
between the first formant (F1) and second formant (F2). Her study comes with the following
results:
1. /i/+nasal consonant context shows more degree of nasalization in the vowel /i/ than
/Ɛ/+nasal consonant context.
2. The duration of nasalization is greater in the /i/+nasal consonant context than the /
Ɛ/+nasal consonant context.
These results of Spears’ study illustrate a great degree of contextual nasalization in the vowel
that do not have nasal counterpart. Hence the vowel / Ɛ/ which has oral-nasal contrast has also
some degree of nasalization, indicating that nasalization is not suppressed completely.
Similarly, Delvaux (2002) has measured the degree of nasalization between the French
contrastively nasal vowels and the contextually nasalized vowels. She has measured the
proportional nasal airflow, during the proportion of all the French vowels before a nasal
consonant. Delvaux (2002) reports the results that the degree of nasalization is greater for the

30
vowels which have contrastive nasality than the vowels which adopt nasality from their
neighboring nasal consonants.
Taiwanese, a dialect of Southern Min, is also one of the languages which have oral-nasal
contrast in its vowel system. It has six oral and four nasal vowels. The vowel inventory of
Taiwanese is given below:
Figure.2.1. Taiwanese Oral Vowels
i u
e Ɣ
ͻ
a
Source: From “Nasal-Oral Contrast and the Degree of Nasalization in Taiwanese” by
Kawasaki, 2006,

31
Figure.2.2. Taiwanese Nasal Vowels
i
ẽ
ͻ
ã
Source: From “Nasal-Oral Contrast and the Degree of Nasalization in Taiwanese” by
Kawasaki, 2006,
Taiwanese has words which differ in meaning from each other only because of
contrastive nasality. Kawasaki (2006) states an example of the words “/te/ (bag) and /tẽ/ (to
pinch)” which have different meanings due to the oral-nasal contrast of vowel. Taiwanese has
oral-nasal contrast for vowels, but the phonological environment where this contrast occurs, is
limited. In Taiwanese language vowels in CV syllables are either oral or nasal vowel
(contrastive). The vowels in NṼ syllable are always nasalized and the oral vowels can never
appear in this environment. The vowels in NṼ syllable are always nasalized, while a vowel in
VN syllable is always an oral vowel (Chung, 1996; Pan, 2004).
Kawasaki (2006) compares the degree of nasalization among the contrastive vowels
(oral-nasal) and the contextually nasalized vowels in Taiwanese. He conducts experiment to
judge if the degree of nasalization is greater for the vowels in non contrastive environment than

32
the vowels in contrastive environment. The results confirm that the degree of nasalization for a
nasal vowel in CṼ context (where oral-nasal contrast is present) is greater than the vowels in NṼ
context (which lacks oral-nasal contrast).
Furthermore Huffman (1987) investigates the timing of contextual nasalization in two
West African languages (Akan and Efic), the languages which contrast vowel inventory. Akan is
a language which has oral- nasal contrast in its vowel system while Efic lacks this contrast and
do not have contrastive nasality. Huffman explores the timing of contextual nasalization and
aims to locate the differences in the patterns of contextual nasalization in these two languages.
Contextual nasalization of vowels in Akan may be limited in order to preserve phonemic
nasality. But in Efic there may be extensive nasalization which begin earlier and end later in
vowels because of nasal context.
The results of Huffman’s study show the occurrence of nasality effect earlier in the
vowels in Aken as compared to the Agwagwune vowels. Huffman claims that the oral/nasal
contrast of vowels does not affect the nasalization patterns too much as is generally assumed.
Punjabi language also comes in line with the languages which have oral nasal contrast for
vowels. There are ten oral vowels in Punjabi. It has three short / ɪ, ǝ, ʊ / and seven long / i, e, æ,
a, ɔ, o, u / vowels. All these oral vowels have their nasal counterparts as well. (Gill and Gleason,
1969)
2.5.2. Distinctive Nasalization
Other than contrastive nasalization, there are also languages which have contextual vowel
nasality. Cohn (1993) reports a greater degree of contextual vowel nasalization before a nasal
consonant in English, which lacks a nasality contrast in vowels, than in French, a language with
a nasal-oral vowel contrast.

33
Ladefoget and Disner (2012) describe that the vowel nasalization phenomenon exists in
all the dialects of English language. In English, vowels are tended to assimilate with the nasal
consonants whenever occur in nasal context. Ladegorget and Disner (2012) illustrate the
example of the English word “man”. In such circumstances where a vowel is followed or
proceeded by the nasal sound, all the vowels become throughout nasalized. So in English vowels
are nasalized because of the phonetic context. Vowels in oral context never adopt nasality feature
except in the disordered speech.
Ladefoget and Disner (2012) make comparisons of the spectrums of their own recordings
of the words “mean, min, men, man” where the vowels are in oral context with the words “mean,
min, men, man” where vowels are in the nasal context. After determining acoustic parameters of
nasalization to indicate nasality such as the frequency and the amplitude of the first formant (F1),
they report heavy degree of nasalization in the vowels occurred in nasal context.
It is stated that the behavior of the vowels to be nasalized is not similar for all the vowels.
Different vowels show different tendencies for the degree of nasalization and the nasality effects
are different for all the vowels. They make clear that the presence or the absence of nasality
feature in the vowel does not change the meaning of the word in English as compared to the
languages such as French. Similarly, Hammond (1999) states that the nasalization phenomenon
in English is distinctive as the English language lack minimal pairs for nasal vowels. Rather
nasalization in English is context dependent. So in English, the vowels adopt nasality feature
under the influence of the following or preceding nasal consonant.
Languages having contextual nasalization or contrastive nasalization or even containing
the both types of nasalization differs from each other because of different nasality patterns. There
is evidence that the languages which lack oral/nasal contrast for vowels show extensive degree of

34
nasalization. English language is a good example of heavy nasalization of vowels in nasal
context.
In contrast, Delvaux et al. (2008) describes that the languages which have oral/nasal
contrast for their vowels may limit the degree of contextual vowel nasalization in both high and
low vowels, in order to maintain the oral/nasal contrast between vowels. French allows an
extensive degree of contextual nasalization for the high oral vowels as all the nasal vowels are
mid-low and low vowels in French. So the vowels which have oral and nasal contrast show less
degree of nasal coarticulation than the vowels which have no nasal counterpart.
On the other hand, Al-Bamerni (1983) discusses the extensive degree of velopharengeal
opening for the high back vowels in Gujarati and Hindi, the languages which have contrastive
nasality in their vowel systems. This asymmetry between the degrees of nasalization among
various languages suggests that the extent of nasal coarticulation is not dependent on the
phonemic inventory of languages. Different languages have different patterns of nasalization for
high and low vowels regardless of the presence and absence of oral/nasal contrast for vowels.
2.6. ACOUSTICS OF VOWEL NASALIZATION
The phenomenon of vowel nasalization is very complex to study because of the variation in the
exact acoustic characteristics of nasalization among speakers. The acoustic characteristics of
nasalization are difficult to examine because of the changes in the anatomical structure of the
nasal cavity, vowel quality, and also because of the degree of oral and nasal tract’s coupling.
(Pruthi et al., 2007)
The vowels are nasalized because of the nasal and oral tract’s configuration. The level
of oral and nasal tract’s configuration varies for different degrees of nasalization. The more the
velum lowers: the heavier the vowel is nasalized. So, this variation in configuration between oral
35
and nasal tract introduces change in spectrum at transition between the vowel and the nasal
consonantal sounds (House, 1957). These acoustic effects are transformed in spectra through
introducing nasal poles and zeroes in the region of first formant (F1) and also the shift of vowel
formants (especially F1).
Various acoustic effects of vowel nasalization are explored through multidimensional
ways. Ladefoged and Maddieson (2012) reports that the vowels which have extra nasality feature
are distinguished with reduction in intensity of the first formant (F1) and increase in third
formant (F3). This reduction in the intensity is because of the diversion of acoustic energy from
the oral cavity to the nasal cavity. There is evidence from the perception based experiments using
synthetic stimuli that the reduction in F1 amplitude by 6-8 db is necessary to get a significant
level of nasalization perception (House and Stevens, 1956). But later studies do not support this
assumption providing the view that the degree of F1 amplitude’s lowering is somehow language
and speaker specific. As Chen (1997) reports the results of her study on nasalization, the degree
of F1’s amplitude varies among English speakers and the French speakers. So there is a lack of a
fixed measure of F1 amplitude’s lowering.
Furthermore, the flattening of spectral region is also studied as an indicator of nasality.
Maeda (1982) studies spectral variations in order to investigate the acoustic cues of nasalization.
Analyzing 11 French vowels, Maeda reports that the diversion of energy from oral to nasal tract
flattens the spectral region between 300 Hz and 2500 Hz. Similarly, Stevens (2000) reports that
the widened first formant (F1) and the overall reduced vowel amplitude is the indicator of the
presence of nasality feature in a vowel.
Fant (2004) also illustrates that the nasalized vowel has “a distortion superimposed on the
vowel spectrum” which is significant by the occurrence of nasal peak in the region of low

36
frequencies (below F1) (p. 156). Similarly, Beddor (1991) describes that the vowels with nasality
feature have broader and flatter spectral prominence in the region of low frequency (below F1).
The alterations between vowels and nasal consonants allow coupling to the nasal cavity
which shifts the natural frequencies of vowels and comes with additional poles and zeroes
(Stevens, 2000). So, the antiformants or nasal zeroes are also observed as an indicator of the
energy diversion from oral passage into the nasal cavity (Hayward, 2000).These alterations
introduce the shifts of natural velum opening while production. The nasal peaks will be found on
an average of around 230-950 Hz (Chen, 1997). The first nasal peak which is observed below the
first formant (F1) is of about 230 Hz and the second nasal peak between first and second formant
(F1, F2) frequencies is of about 950 Hz.
When the output of nose and mouth is transformed to nose only, for the production of
nasal consonant, it causes to produce zeroes. The nasal zeroes are dependent on the level of nasal
tract’s coupling (Chen, 1997). These zeroes reduce the amplitude of the first and the second
formants (F1 and F2) (Mou, 2006). These zeroes are dependent on the level of distance between
the opening of velopharyngeal port and the oral constriction. This process will reduce the
spectral peak in accordance to the resonance of cavity below the oral closure. (Stevens, 2000)
Chen (1997) has introduced an acoustic approach for the measurement of nasality in her
study of nasalized vowels of French and English. She finds the reduction of first formant (F1) as
the primary cue of nasalization in vowels and also studies the effect of nasalization on the
harmonics in spectrum. She has distinguished nasalized vowels of French and English
successfully, employing the two parameters which are A1-P0 and A1-P1. Here A1 is the
amplitude of the first formant (F1), P0 is the amplitude of first nasal peak below the first formant
(F1) and P1 is the measure of the amplitude of nasal peak between first formant (F1) and the

37
second formant (F2) of the vowel. So, the results of her study confirm that the amplitude of F1 in
nasalized vowel reduces relative to its amplitude in oral vowel, and the extra nasality peaks are
also noticed.
This measure (A1-P0 and A1-P1) is also been attested by the Pruthi and Espy-Wilson
(2007) on several corpus databases. The list of acoustic parameters tested by Pruthi and Espy-
Wilson is given below.
Table2.2. A List of Acoustic Correlates of Nasalization and the APs used to Acquire them
Acoustic Correlate Proposed Aps
Extra peaks at low
frequencies and the
relative amplitudes
of
these peaks as
compared to the first
formant
amplitude
• sgA1−P0, where A1 is the amplitude of the first formant, and P0 is the
amplitude of an extra peak below F1. The prefix sg implies that a
combination of cepstrally smoothed spectra (s) and group delay spectra
(g) was used to find the exact location of the extra peaks. F1 was
obtained by using the ESPS formant tracker [Talkin, 1987].
• sgA1 − P1, where P1 is the amplitude of an extra peak above F1. The
APs, sgA1 − P0 and sgA1 − P1 are automatically extractable versions of
the APs proposed by [Chen, 1997].
• sgF1 − FP0, where FP0 is the frequency of the extra peak below F1.
• teF 1, correlation between the teager energy profile [Caims, 1996] of
speech passed through a narrowband filter (bandwidth = 100 Hz) and a
wideband filter (bandwidth = 1000 Hz) centered around F1.

38
Extra peaks across
the spectrum
• nPeaks40dB counts the number of peaks within 40dB of the maximum
dB amplitude in a frame of the spectrum.
Reduction in F1
amplitude
• a1 − h1max800 is the difference between A1 and the amplitude of the
first harmonic (H1).
The value of A1 was estimated by using the maximum value in 0-800 Hz.
• a1 − h1fmt is the same as the previous AP except that A1 is now
estimated by using the amplitude of the peak closest to F1 obtained by
using the ESPS formant tracker. The APs a1 − h1max800 and a1 −
h1fmt are automatically extractable versions of the A1 − H1 parameter
proposed by [Huffman, 1990].
Increase in F1
bandwidth
• F1BW is the bandwidth of F1.
Spectral flattening at
low frequencies
• std0 − 1K is the standard deviation around the center of mass in 0-1000
Hz. This AP not only captures the spectral flatness in 0-1KHz, but also
captures the effects of the increase in F1 bandwidth and the reduction in
F1 amplitude.
This AP was proposed by [Glass, 1985].
Source: From “Acoustic Parameters for the Automatic Detection of Vowel Nasalization” by
Pruthi & Espay-Wilson, 2007,
They achieved a satisfactory accuracy rate on each database. Among those results,
96.28% is the highest rate.

39
The differences in the cross-sectional area of the velopharyngeal port and in the timing of
soft palate’s raising and lowering, cause differences into the acoustic demonstration of nasality.
Furthermore, speakers also differ in the properties of their vocal tracts. They can also manipulate
other factors, such as to spread their glottis allowing more coupling between the sub-glottal
system and the rest of the nasal system, to further lower the second formant’s amplitude at the
nasal landmark, which has been considered one of the acoustic correlates of nasalization.(Mou,
2006)
There are many studies which compare the timing and extent of coarticulatory
nasalization between different languages. Sole (1992, 1995) states that the velum lowered earlier
in vowels following nasal consonant in American English than in Spanish. She also claims that
this lowering of velum will be for a greater portion of vowel in American English than in
Spanish. Cohn (1990), Rochet and Rochet (1991) also have explored the same difference in
timing of nasalization between American English and French.
Furthermore, Huffman (1989) investigates the time course of nasalization in English
language. He studies spectral differences between contextually nasalized and oral vowels. In the
analysis of data, nasal poles are traced in the 600 to 1000 Hz frequency range and nasal zeroes
are in 200 to 300 Hz or even above it. The measured time of nasality feature in vowel indicates
that the nasal pole occurs 40 – 50 ms after onset of the vowel or sometimes earlier than this, and
moves up throughout the contextually nasalized vowels.
2.7. PHONETIC CONTEXT AND NASALIZATION
Phonetic context is one of the major factors on which the spatial and temporal degree of vowel
nasalization depends. For example, there will be more extensive coarticulatory nasalization when
the vowel is followed by a nasal and then voiceless oral consonant (VNC) than is followed by a

40
nasal and then the voiced oral consonant (VNC) (Malecot, 1960). Moreover, the vowel will also
be more extensively nasalized when it is followed by a nasal and then the fricative (Ohala and
Busa, 1995).
2.8. PROSODIC STRUCTURES AND NASALIZATION
The degree of vowel nasalization varies because of the prosodic influences also. For example,
the tautosyllabic VN sounds exhibit more nasalization than the hetrosyllabic sequences (Cohn,
1990; Sole, 1995).
Stress also plays very important role in this regard. The vowels in stressed syllables are
more extensively nasalized than in unstressed ones (Schour-up, 1972; Vaissiere, 1988). Krakow
(1993) measures the difference of the degree of nasalization in vowels occurred in nasal
environment. Krakow, conducting his research on American speakers, finds articulatory
evidence for Schourup’s claim. He studies the role of stress in the spatial and temporal patterns
of the velic lowering and raising for different sounds. While doing this, it is noticed that
American speakers make different stress patterns for the given syllable types (/mvˊbvb/ Vs
/mvbvˊb/; /bvˊbvm/ Vs /bvbvˊm/). The velic movement for each vowel following or proceeding
/m/ is measured to look at stress affects.
The results of Krakow’s study indicate that the height of velum is lower for the stressed
vowels adjacent to the nasal consonant /m/. This pattern of velum gestures due to stress reflects
changes in temporal extent of velum movements rather than the spatial differences of the velic
lowering for the nasal consonant. Krakow states an example that “the velic lowering gestures for
the initial /m/ in /maˊbab/ and /mabaˊb/ appeared quite similar both in their timing and spatial
extent, but velic raising from the low position was initiated considerably later in /maˊbab/ than
41
/mabaˊb/”. So, the findings of krakow’s study indicate that the velum lowers at greater degree for
stressed syllables allowing them to be nasalized more extensively than the unstressed ones.
2.9. VOWEL QUALITY AND NASALIZATION
The extent of vowel nasalization varies depending on vowel quality, type and duration also. For
example, in nasal context, long vowels are more tended to be nasalized than the short vowels
(Whalen and Beddor, 1989). Moreover, the lower vowels are more prone to nasalization than
high vowels (Bell-Berti, 1993).
In Mandarin VN syllables, Chen (2000) finds that the degree of nasalization varies with
the height of the vowel. Specifically, the low vowels are tended to have larger, slow and a longer
phase of nasalization as compared to the high vowels. In the same way, Lin (2007) provides the
evidence from his study on loan transitions of the English names (“Tom” and “Tim”) in Chinese
language as /taŋ.mu/ and /ti.mu/. In Chinese word /taŋ.mu/, the extra /ŋ/ has replaced /ɑm/ in the
English word “Tom”, but there is no extra nasal used to substitute /ɪm/ in the word “Tim”. On
this basis, Lin suggests that the vowel /ɑ/ which is a low vowel is perceived longer and more
nasalized than /ɪ/ which is the high vowel.
Bell- Berti (1993) states that in English, low vowels are more prone to nasalization.
Similarly, Krakow (1993) illustrates the nasalization pattern in the native Speakers’ production
of English. The results show that low vowels are more intended to be nasalized than the high
vowels. Furthermore the results of Kluge’s study are consistent with this preference of low
vowels to be nasalized extensively. Kluge (2004) investigates the effect of four vowels /ɪ/, /ᴂ/,
/ᴧ/, /i/ on the production of nasal consonants in mono or disyllabic syllables’ final position. The
findings of her study indicate a great degree of nasalization in low vowels among the four
vowels.
42
Chen (1975) states the nasalization for high and low vowels in different dialects of
Chinese language. She reports a higher degree of nasalization in the low vowels rather than the
mid or high vowels. Hajek (1997) describes the low vowels’ tendency to be nasalized heavily
than the mid and high vowels in Northern Italy.
But there are also a number of studies which proposes greater degree of nasalization in
high vowels as compared to the low vowels. Rochet and Rochet (1991) study nasalization in
Canadian French and English. The results of their study demonstrate that contextual nasalization
in high vowels has a higher level and a longer duration of nasality as compared to the low
vowels.
Delvaux (2008) studies the nasal coarticulatory effect on both high and low vowels in
French and aims to find out some patterns of vowel nasalization phenomenon. The findings of
Delvaux’s study come in line with the Rochert and Rochert (1991) as they also report extensive
carryover nasalization in the high vowels than the low vowels. Hu (2005) reports the case of
nasalization in Ningbo Chinese. The results of his study show the degree of nasality in three
nasalized vowels : / ã/, /ͻ/, /ɪ/. His findings indicate that the high vowel /ɪ/ in Ningbo , has
extensive nasalization than the other two vowels (/ã/, /ͻ/). So, Fang’s study comes in line with
the claim that high vowels are more prone to nasalization.
Nasalization also introduces some change in the vowel height for phonemic nasal vowels
in a number of languages. The vowels are intended to be centralized under the effect of
nasalization. High vowels become lower and the low vowels become higher (Beddor, 1986).
There are also a number of studies on American English which confirms that the high vowels are
tended to be low because of the nasalization influence (Beddor, et al. 1986; Krakow, et al. 1988;
Macmillan et al. 1999)

43
So, languages differ on the basis of nasalization patterns. There is cross linguistic
evidence that some languages favor extensive nasalization for the high vowels than low vowels.
But there are also languages which prefer to nasalize low vowels as compared to high vowels.
Hence, Hajek and Maeda (2000) conclude that low vowels are nasalized extensively in some
languages and the high vowels in others.
2.10. ANTICIPATORY Vs CARRYOVER NASALIZATION
There is evidence that nasalization can take place in both carryover and anticipatory directions.
Different languages show different tendencies regarding the directions of nasalization. So, the
phenomenon of anticipatory and preservative nasalization differs from language to language.
Delvaux (2008)reports that French favors the carryover nasalization than anticipatory
nasalization. As the results of his study show that in the vowels before nasal consonant (VN) the
“nasal airflow onset is either synchronous with oral closure or anticipated through about 25% of
the vowel duration whereas in NV items, nasal airflow remains above zero level through 80% or
more of the vowel” (P. 596). Similarly in CṼ tokens, only some stops, fricatives and liquids
favor anticipatory nasalization, nasal airflow begins in last 25% or even later of the consonant. In
most of the stops, nasality is even delayed. In contrast, all the oral consonants occurring before
nasal vowel are prone to nasalization without any exception.
Basset et al. (2001) also compare the degree of the anticipatory and carryover
phenomenon in the velum behavior during the spontaneous speech production and also compare
the results with the same read speech data in French. They observe a significant difference
between the directions of nasalization in French. Their results are consistent with that of Delvaux
(2008) indicating the preference for preservative nasalization in French.

44
In the same way, Rossato et al. (2003) while measuring the velum height for contextual
and contrastive nasalization phenomenon, confirms the extensive amount of preservative
nasalization in French than the anticipatory nasalization. Hence, there are a number of other
studies also which supports the asymmetry between the regressive and preservative nasalization
in French (Cohn, 1990).
In contrast, Bell- Berti (1993) reports that the vowels become nasalized more
often in the contexts of VN (anticipatory context) rather than in NV context (carryover contexts).
Krakow (1993) states that the vowel nasalization occurs in pre-nasal positions more frequently
and for a longer duration than in post-nasal positions. English language shows extensive
nasalization in regressive direction (Chen 2007). The Akan language is observed to consist of
both carryover and anticipatory contextual nasalization while Agwagwune has strong carryover
coarticulation and a less degree of coarticulation in anticipatory direction (Huffman, 1987).
2.11. DISORDERED SPEECH AND NASALIZATION
Bell- Berti (1980)reports that the ability of speakers to control the coupling between nasal tract
and the oral tract is crucial for the production of normal speech. There are several reasons of
configuration between nasal tract and the vocal tract. This configuration may also be due to the
anatomical or functional problems (Stevens et al., 1986). For example cleft palate patients have
hyper nasality due to the velopharyngeal insufficiencies. Inadvertent nasalization is another
example of speech disorder which causes the velopharyngeal port to be opened excessively in
vowel production. This is a very common problem of deaf speakers (Stevens et al., 1976; Chen,
1995).
These types of speech disorders are because of the speakers’ inability to decouple the
nasal cavity from the oral cavity. Speakers’ inability to decouple nasal and oral tract results into

45
the nasalization or the hyper nasality which transfers the feature of nasality into the purely oral
sounds. So, the people with such speech disorders are even disable to produce oral sounds
because of a continuous coupling between oral and nasal cavities.
Therefore nasalization in the speech of hearing impaired children is one of the types of
deviation from normal individuals which is discussed by Chen et al (2000). Chen (1995) reports
that inadvertent nasalization is one of the abnormalities that cause intelligibility problem for
hearing impaired individuals’ speech. She analyses the speech of hearing impaired children and
compares the results with the nasalization of vowels in the speech of normal hearing individuals.
For this, two professional phoneticians have judged the hearing impaired children’s vowels and
these judgments are performed on a scale of 1 – 9, on which the greater degree of nasality is
indicated by a high score. The average judgments for the normal hearing individuals are 2 – 3 on
the scale, while the hearing impaired individuals receive a wider range of average judgments
ranging from 3.5 to 8.
Chen also measures A1-P1 from the spectra every 10 ms and these measures (A1-P1) are
averaged throughout the duration of a vowel. The analysis of data shows a great degree of
nasalization in the speech of hearing impaired children than that of the normal hearing
individuals. The measurement of A1- P1 is about 10 db or even greater for the normal hearing
persons, while this measure is very low which is about 2 db for the normal hearing persons. So
the findings of Chen’s study confirm that the persons with hearing impairments have a greater
degree of nasality as compared to the normal hearing speakers.
Stevens (1960) analyses the nasalized vowels in the frequency domain implying an
analysis- by- synthesis technique. This analysis-by- synthesis technique enables to determine the
range for the values of parameters related to nasalization. Stevens implements this technique for
46
vowels produced by the hearing impaired children. As they are considered the persons showing
highly significant degree of nasality, which normal hearing speakers can never make. So, the
values taken from the speech of hearing impaired speakers are measured to obtain the extreme
values for nasality. These extreme values can possibly not be taken by the normal hearing
speakers, as they make narrower range of nasalization as compared to the hearing impaired
speakers. Hence Steven’s study of excessively nasalized vowels of hearing impaired speakers
allows to determining the range of the first formant bandwidth and also the frequency separation
for nasalized vowels between their nasal poles and zeroes (Fant, 1960; Stevens, 2000).
Furthermore, surgery for the Sinusits, the paranasal sinuses’ inflammation, also affects
the production of nasal sounds. Most of this surgery “is intended to enhance ventilation of the
paranasal sinuses, and this enhanced ventilation is achieved by the removal of obstructing bone
and soft tissue with enlargement of the sinus drainage openings” (Chen et al, 2000, P.307). This
change in the nasal anatomy introduces variation in the acoustic and perceptual characteristics of
nasal sounds.
Chen and Metson (1997) study the effects of sinus surgery on the speech spectra of
patients’ nasal production. They identified the effect of these anatomical deviations on the
perception and the acoustic characteristics of nasal sounds. For this, they analyze the speech of
five patients (three male and two female), who are the native speakers of English language. The
speech is recorded from the speakers one week before, after one week and one month after the
surgery. The speakers produce utterances with the vowels in both oral and nasal contexts. The
spectral analysis of the nasal sounds /m/ and /n/ before and after the surgery indicate a clear
difference of values.

47
The analysis of the data after surgery shows significant increase in the amplitude of F1
(A1), and decrease in the amplitude of nasal peak (P1). For all of the patients, the averages of
(A1-P1)N after surgery has increased which depicts the less degree of nasality. The average (A1-
P1)N ranges from 11db to 23db for the nasal sounds produced after one month of surgery. In the
same way, Chen and Metson (1997) also analyze the vowel sounds recorded from the patients
before and after their surgery. The acoustic measures (A1-P1, A1-P0) taken at the beginning and
ending of the vowels in both nasal and non-nasal contexts show significant differences in the
degree of nasality. The average A1-P1 if vowels in nasal context, increases by 10 db to 15db
after the surgery (more than one month), as compared to the measures taken before surgery. The
average A1-P0, after surgery, decreases by 4 db to 7db.
The acoustic measures (A1-P1, A1-P0) for the vowels in non-nasal context do not show
statistically significant differences after and before the surgery. So the analysis of nasal
consonants and the nasalized vowels of patients before and after surgery depict that the degree of
nasality decreases after the surgery which is logically because of the change in the nasal
anatomy.
As hearing impairedness is considered one of the causes of hypernasality in speakers.
Cochlear implantation is used to remove this impairedness. In the way, Hassan et al. (2011)
study the influence of cochlear implantation on the nasalance feature of speech in Saudi adults
who are post-lingually hearing impaired. They find a statistically significant difference between
the pre and post implantation nasalance values and come with the conclusion that hearing
impairedness causes hypernasality that can be controlled by proper treatment.
48
2.12. WORLD ENGLISHES
This research comes within the framework of world Englishes. English language has gained the
status of lingua franca and has been recognized as a global language (Crystal, 2004). It has been
nativised in various countries and has resulted in the emergence of new varieties and dialects
(Boltan, 2004). Because of this wide spread of English, various terminologies come into play.
For example “Englishes”, “global language” etc and all these terminologies have different
philosophies behind them.
Different scholars have presented different models of English. Almost at the same time,
three models regarding English varieties have been introduced by three scholars aiming to
characterize English varieties into a conceptual set. Kachru (1982) proposes a model of World
Englishes which is accepted globally. Kachru (1982) divides English speaking native and non-
native countries into three umbrella labels: the inner circle, the outer circle and the expanding
circle. These three circles “represent the types of spread, the patterns of acquisition and the
functional allocation of English in diverse cultural contexts.” (Jenkins, 2003, P. 18). Kachru’s
circular model is based on the “historical context of English, the status of the language, its
geographical distribution and its functions in various regions” (Mohammed, 2010).
He classifies the UK, USA, Canada, Australia, New Zealand, etc into the inner circle.
The inner circle represents the countries where English is the primary language. It comprises the
native speakers of English whose mother tongue is English. The outer circle includes
Bangladesh, India, Pakistan, Malaysia, Singapore etc. It represents the spread of English in the
non-native contexts. The outer circle includes the countries where English has become part of the
chief institutions of the countries and plays its role as a second language in multilingual settings.
49
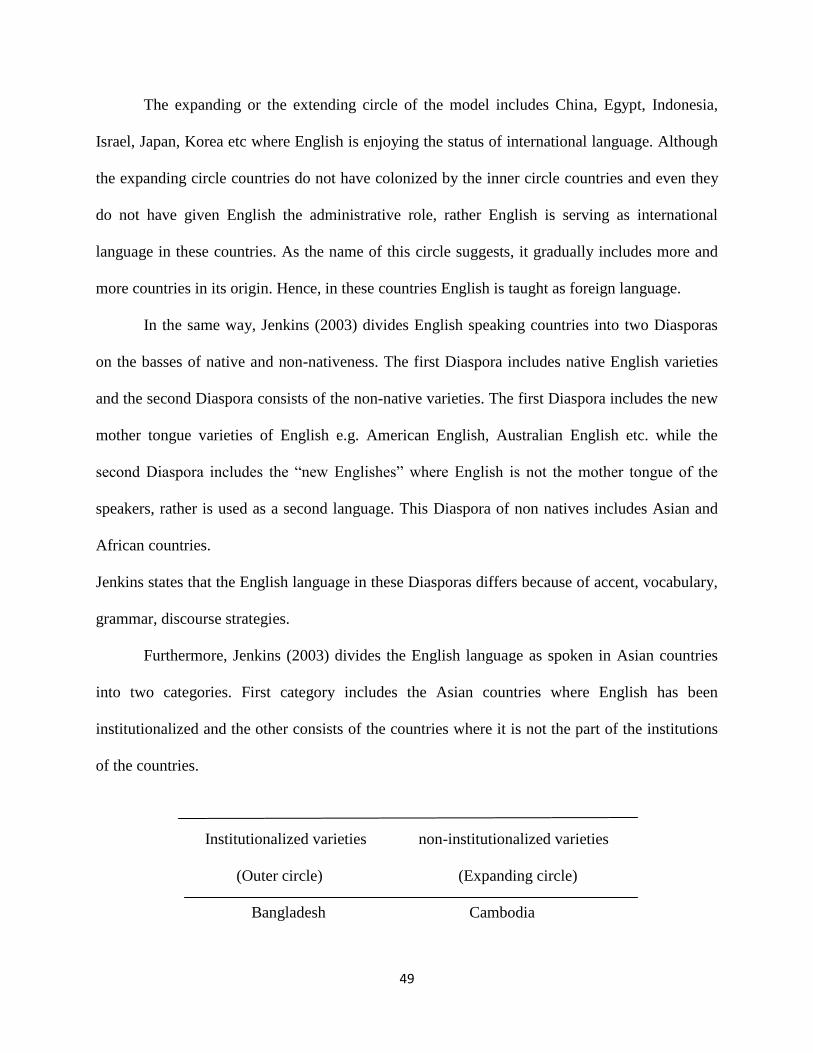
The expanding or the extending circle of the model includes China, Egypt, Indonesia,
Israel, Japan, Korea etc where English is enjoying the status of international language. Although
the expanding circle countries do not have colonized by the inner circle countries and even they
do not have given English the administrative role, rather English is serving as international
language in these countries. As the name of this circle suggests, it gradually includes more and
more countries in its origin. Hence, in these countries English is taught as foreign language.
In the same way, Jenkins (2003) divides English speaking countries into two Diasporas
on the basses of native and non-nativeness. The first Diaspora includes native English varieties
and the second Diaspora consists of the non-native varieties. The first Diaspora includes the new
mother tongue varieties of English e.g. American English, Australian English etc. while the
second Diaspora includes the “new Englishes” where English is not the mother tongue of the
speakers, rather is used as a second language. This Diaspora of non natives includes Asian and
African countries.
Jenkins states that the English language in these Diasporas differs because of accent, vocabulary,
grammar, discourse strategies.
Furthermore, Jenkins (2003) divides the English language as spoken in Asian countries
into two categories. First category includes the Asian countries where English has been
institutionalized and the other consists of the countries where it is not the part of the institutions
of the countries.
Institutionalized varieties non-institutionalized varieties
(Outer circle) (Expanding circle)
Bangladesh Cambodia

50
Bhutan China
Brunei Indonesia
Fiji Japan
Hong Kong Korea
India Laos
Malaysia Maldives
Nepal Myanmar
Pakistan Taiwan
Philippines Thailand
Singapore Vietnam
Sri Lanka
Boltan (2008) states that 18 million people in Pakistan are English users which make Pakistan
the third largest English using Asian country (as cited in Raza, 2008).
2.13. PAKISTANI ENGLISH
Different studies have discussed the idiosyncrasies of Pakistani English which distinguish it from
the other varieties of English. Mahboob and Ahmar (2004) have explored some features of
Pakistani English such as phonology, grammar, lexis and syntax. Moreover, Raza (2008) has
discussed a variety of distinct phonological features of Pakistani English such as rhoticity and
epenthesis etc. Raza’s study comes in line with the claim that the reason of all these differences
is the mother tongue influence in Pakistani English language users’ speech.

51
Hickey (2004) discusses Pakistani English as sharing the characteristics of South Asian
Englishes. Raza (2008), Kachru and Smith (2008) also support Hickey (2004) concerning the
general characteristics of South Asian Englishes. South Asia consists of about a fifth of the
world’s residents. In South Asian region, several varieties of English language have emerged. It
includes the English spoken in Pakistan, India, Bangladesh, Sri Lanka, Nepal and Bhutan
(Crystal, 2004). Some of the phonological features of Pakistani English are described below.
These features demonstrate the variations of Pakistani English from the other varieties of
English.
Rhoticity
Pakistani English is a rhotic variety of English (Mahboob, 2004). Pakistani speakers pronounce
rhotic /r/. Rahman (1990) states that the degree of rhoticity in Pakistan depends on the
sociolinguistic factors. Acording to him, the Pakistani speakers of acrolectal variety of Pakistani
English may not pronouunce /r/ in the postvocalic position. But the speakers of mesolectal and
basilectal varieties of Pakistani English are rhotic. They pronounce /r/ in all the contexts.
Retroflexion of /t/ and /d/
The retroflexion of /t/ and /d/ is also one of the features which make Pakistani English distinct
from RP. The Pakistani English speakers pronounce retroflex stops instead of RP alveolar stops.
Mahboob (2004) states the examples of these retroflex stops in the words “strut” /ɪsʈrᴧʈ/ and
“dress” /ɖres/. Kachru (1992) lists this tendency of pronouncing the RP alveolar stops with
retroflexion as one of the features of Asian languages.
Dentalization /t/ and /d/
Pakistani English speakers pronounce dental stops instead of the RP dental fricative . Mahboob
(2004) states the examples of this change in manner of articulation as in the words “north” /nͻ:r
52
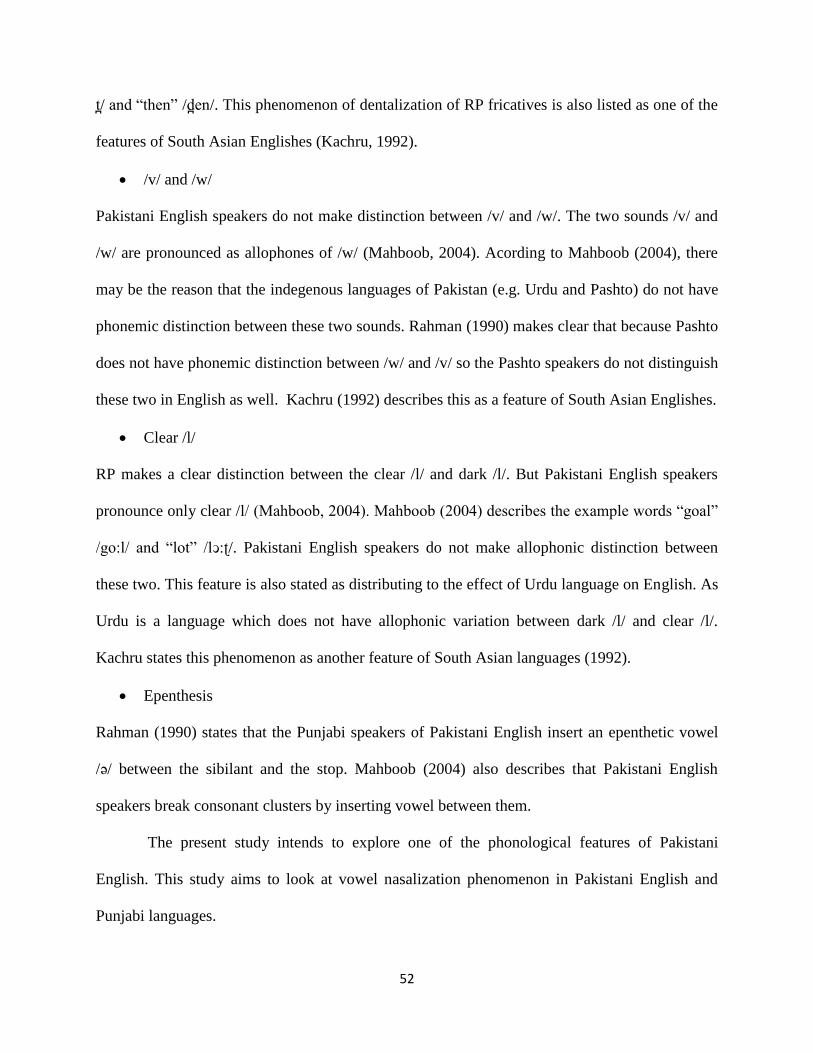
t/ and “then” /den/. This phenomenon of dentalization of RP fricatives is also listed as one of the
features of South Asian Englishes (Kachru, 1992).
/v/ and /w/
Pakistani English speakers do not make distinction between /v/ and /w/. The two sounds /v/ and
/w/ are pronounced as allophones of /w/ (Mahboob, 2004). Acording to Mahboob (2004), there
may be the reason that the indegenous languages of Pakistan (e.g. Urdu and Pashto) do not have
phonemic distinction between these two sounds. Rahman (1990) makes clear that because Pashto
does not have phonemic distinction between /w/ and /v/ so the Pashto speakers do not distinguish
these two in English as well. Kachru (1992) describes this as a feature of South Asian Englishes.
Clear /l/
RP makes a clear distinction between the clear /l/ and dark /l/. But Pakistani English speakers
pronounce only clear /l/ (Mahboob, 2004). Mahboob (2004) describes the example words “goal”
/go:l/ and “lot” /lͻ:ʈ/. Pakistani English speakers do not make allophonic distinction between
these two. This feature is also stated as distributing to the effect of Urdu language on English. As
Urdu is a language which does not have allophonic variation between dark /l/ and clear /l/.
Kachru states this phenomenon as another feature of South Asian languages (1992).
Epenthesis
Rahman (1990) states that the Punjabi speakers of Pakistani English insert an epenthetic vowel
/ə/ between the sibilant and the stop. Mahboob (2004) also describes that Pakistani English
speakers break consonant clusters by inserting vowel between them.
The present study intends to explore one of the phonological features of Pakistani
English. This study aims to look at vowel nasalization phenomenon in Pakistani English and
Punjabi languages.
53
2.14. L1 INFLUENCE ON L2
It is usually believed that people’s perceptions are language specific and that they perceive L2
segments through the filter of their L1 sound system (Best, Mcroberts & Goodell, 2001; Best &
Tyler, 2007; Harnsberger, 2001). Flege (1995) argues that L2 speakers may interpret L2 sounds
through the grid of their L1. This “ensures that nonnative speakers will perceive at least some L2
vowels and consonants differently than do native speakers” (Flege, 1995, p. 237). The
relationship between L1 and L2 plays a very important role in the perception and production of
second language sounds (Flege, 1995).
Consideration of the differences in the way the word-final nasal consonants are
pronounced in English and Brazilian Portuguese is very important to the understanding of the
difficulties that the Brazilian learners of English may find in the identification of English word-
final nasal consonants /m/ and /n/ (Kluge, 2010, Kluge et al., 2007). Similar differences are
found by Aoyama (2003) in English nasal perception by Korean and Japanese speakers.
Anoyama states that Japanese speakers classify /n/ - /ŋ/ as uncategorizable since their L1 does
not distinguish the two. So the relationship between L1 and L2 segments plays an important role
in the perception and production of L2 segments.
The present study intends to see the nasalization patterns in Punjabi at first. Then it owes
to study nasalization patterns in the Punjabi speakers production of English. This study intends to
portray the similarities and differences between the speakers’ production of L1 (Punjabi) and L2
(English).
54
Chapter Three
METHODS AND MATERIALS
This study intends to locate the degree and direction of vowel nasalization by using acoustic
measures. It aims to use scientific means to validate its findings and intended to portray them
quantitatively. This chapter explains the detail of data set, speakers and the analysis techniques
used for this study.
3.1. STIMULI
The stimuli used for this study consisted of two types of data set. One consisted of English words
and the other contained the data of Punjabi words.
3.1.1. English data set
For English data, four vowels /ɪ, ᴂ, ɒ, ᴧ/ of English were used to study the nasalization
phenomenon. Each of these vowels was put in CVN, NVC, CVC contexts. Where C stood for
oral consonants (oral stops), N referred to the nasal consonants / n, m, ŋ / and V referred to the
vowels. Those vowels were selected for this study, which occur in all these contexts (CVN, VCN
and CVC) in English. The vowels were studied first in oral context (CVC) and then were
compared for nasality effect in nasal contexts (CVN, NVC). So, the contextual nasalization was
intended to be studied in English language. The selected vowels in oral contexts are given below
(see 1).
(1)
Bag /bᴂg/

55
Bob /bɒb/
Cup /kᴧp/
Bid /bɪd/
All these four vowels were analyzed in nasal contexts as well. Each of these was held in two
nasal contexts. In CVN context, the vowels followed the nasal consonant / n, m, ŋ / where the
regressive nasalization was studied. The list of words in each context is given in data set (2).
(2)
Ban /bᴂn/ Dam /dᴂm/ Bang /bᴂŋ/
Con /cɒn/ Tom /tɒm/ Bong /bɒŋ/
Pun /pᴧn/ Gum /gᴧm/ Bung /bᴧŋ/
Bin /bɪn/ Dim /dɪm/ King /kɪŋ/
In the second nasal context, vowels were in NVC context i.e. the vowels were preceding the
nasal consonants. So, in NVC context, the degree of progressive nasalization was studied. The
list of words is stated in data set (3).
(3)
Nab /nᴂb/ map /mᴂp/
Knob /nɒb/ mop /mɒp/
Nut /nᴧt/ mud /mᴧd/
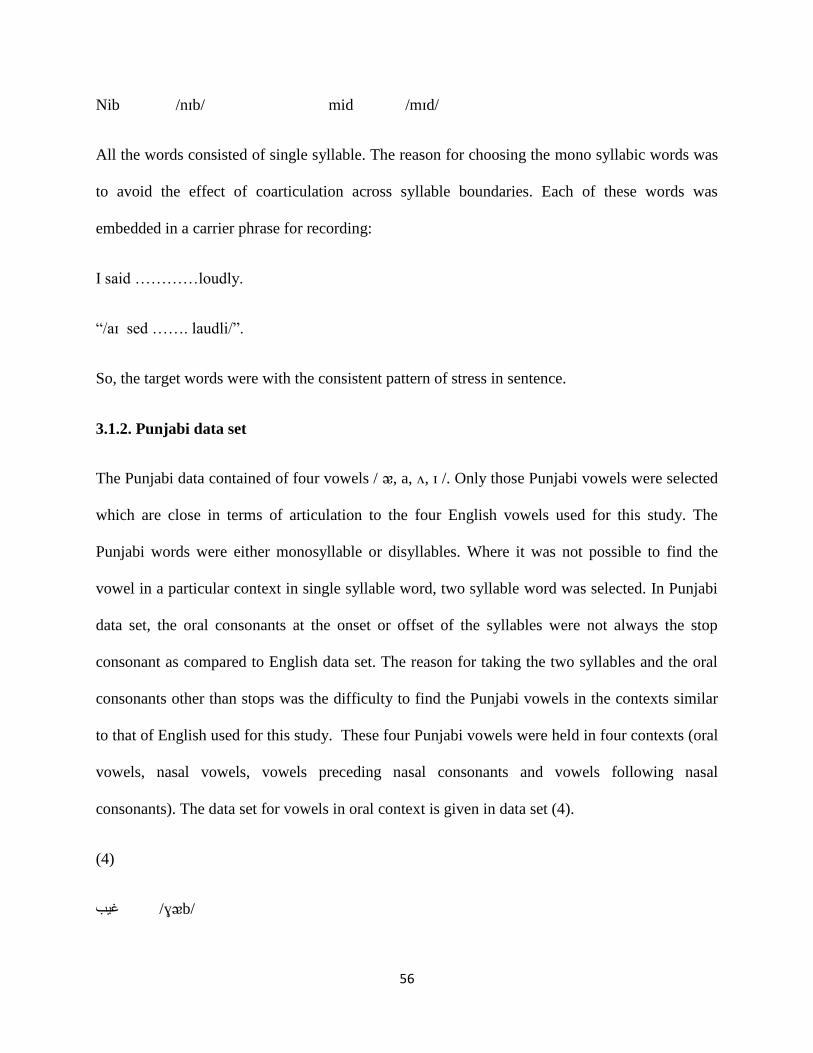
56
Nib /nɪb/ mid /mɪd/
All the words consisted of single syllable. The reason for choosing the mono syllabic words was
to avoid the effect of coarticulation across syllable boundaries. Each of these words was
embedded in a carrier phrase for recording:
I said …………loudly.
“/aɪ sed ……. laudli/”.
So, the target words were with the consistent pattern of stress in sentence.
3.1.2. Punjabi data set
The Punjabi data contained of four vowels / ᴂ, a, ᴧ, ɪ /. Only those Punjabi vowels were selected
which are close in terms of articulation to the four English vowels used for this study. The
Punjabi words were either monosyllable or disyllables. Where it was not possible to find the
vowel in a particular context in single syllable word, two syllable word was selected. In Punjabi
data set, the oral consonants at the onset or offset of the syllables were not always the stop
consonant as compared to English data set. The reason for taking the two syllables and the oral
consonants other than stops was the difficulty to find the Punjabi vowels in the contexts similar
to that of English used for this study. These four Punjabi vowels were held in four contexts (oral
vowels, nasal vowels, vowels preceding nasal consonants and vowels following nasal
consonants). The data set for vowels in oral context is given in data set (4).
(4)
/ɣᴂb/ غیب

57
/pak/ پاک
/kᴧt/ کٹ
/pɪt/ پٹ
Moreover, these four vowels were analysed in two CVN and NVC contexts to study the
contextual nasalization. The vowels following nasal consonants (VN) were selected to study
regressive nasalization in Punjabi (see (5).
(5)
b/ بھینگا /qᴂm/ قیم /bᴂn/ بھینhᴂŋǝ/
/taŋ/ تانگ /ʃam/ شام /pan/ پان
/ᴧŋ/ جنگ /kᴧm/ کم /kᴧn/ کن
/dɪŋ/ ڈنگ /nɪm/ نم /dɪn/ دن
In the second type of syllables, the vowels in nasal contexts were used to analyze preservative
nasality in Punjabi language. In this case the vowel preceded the nasal consonant. The words
used to study presevative nasalization are stated in data set (6).
(6)
/mᴂl/ میل /nᴂr/ نیر
/map/ ماپ /nap/ ناپ
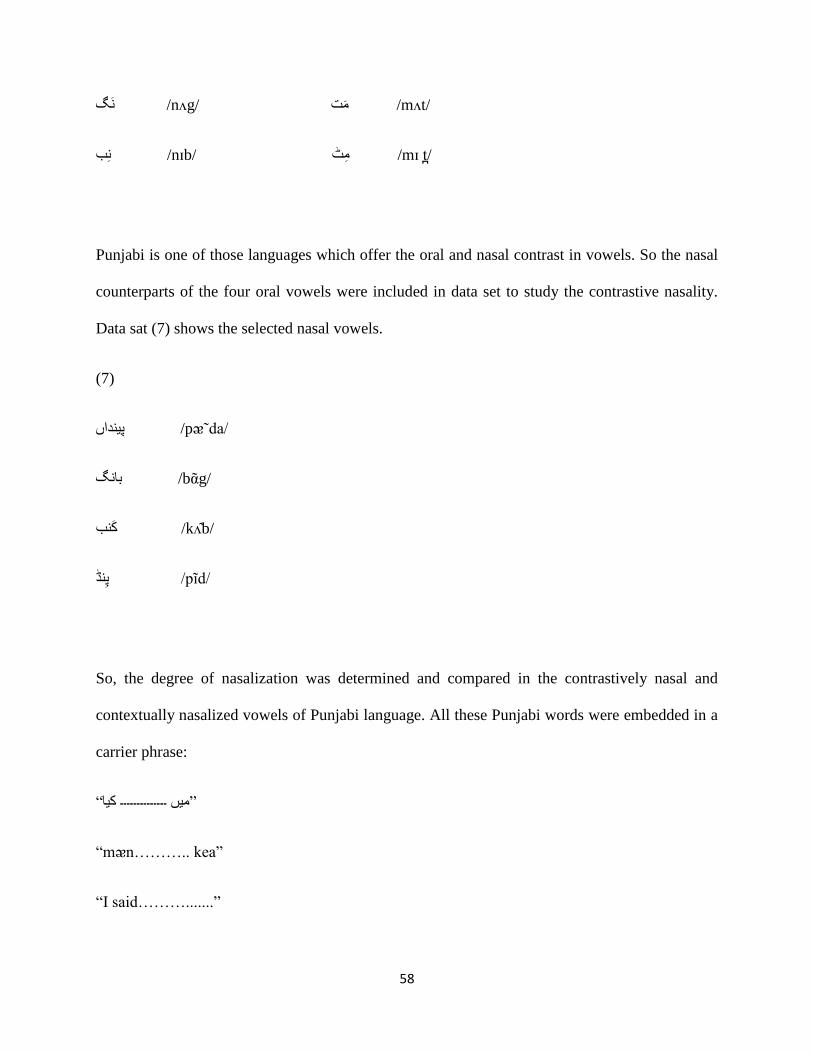
58
/mᴧt/ مت /nᴧg/ نگ
/mɪ t/ مٹ /nɪb/ نب
Punjabi is one of those languages which offer the oral and nasal contrast in vowels. So the nasal
counterparts of the four oral vowels were included in data set to study the contrastive nasality.
Data sat (7) shows the selected nasal vowels.
(7)
/pᴂ˜da/ پینداں
/bᾶg/ بانگ
/kᴧb/ کنب
/pĩd/ پنڈ
So, the degree of nasalization was determined and compared in the contrastively nasal and
contextually nasalized vowels of Punjabi language. All these Punjabi words were embedded in a
carrier phrase:
”میں ۔۔۔۔۔۔۔۔۔۔۔۔۔۔ کیا“
“mᴂn……….. kea”
“I said……….......”
59
3.2. RESPONDENTS
For this study, the participants with low fundamental frequency were selected, so that the
harmonics showing nasality effect could be traced in spectrum accurately. Therefore, male
participants were selected for this study. Their fundamental frequency ranged from 100 to 150
Hz. Five educated users of English with Punjabi L1 participated for the present study. Five
speakers were used to record English data and four of them were used to record Punjabi data.
All the speakers were from one dialect of Punjabi which is Majhi dialect. A questionnaire
was used to determine the dialect of speakers. All the five respondents belonged to Lahore,
Punjab. They all use Punjabi language in their daily life. The age of respondents ranged from 20
to 35 years.
3.3. DATA COLLECTION
All the words (both Punjabi and English), embedded in carrier phrases were written on cards and
given to the respondents for recording. The cards were shuffled after each recording. Five
repetitions of each data set were recorded from each speaker. The data was recorded with five
repetitions of each token from each respondent. So, a total of 1160 utterances have been recorded
and analyzed.
English data = 5 speakers * 5 repetitions * 6 templates * 4 vowels (600)
Punjabi data = 4 speakers * 5 repetitions * 7 templates * 4 vowels (560)
Before getting recordings from the speakers, they all were provided the data cards, so that they
could read the sentences at first and make themselves familiar with the utterances. This activity
was done to minimize the chance of error in the pronunciation of sentences. Then they were
instructed to pronounce the sentences with their normal speech rate (neither too fast and nor too
slow). They were also asked to scratch the card only after pronouncing each utterance
60
completely, so that the noise of scratching cards could be avoided. There was also a proper
distance maintained between the mouth of the respondent and the mic. The Logitech USB
Microphone was used for recording data
3.4. ANALYSIS
The vowels were analyzed by studying the spectrum. For this purpose the software PTAAT was
used. Each vowel was studied at three points: initial, middle and final. The formant values were
measured at these locations to study the differences in vowel portions.
The measurements at medial position were taken by placing the mark at the middle point
of the vowel’s total duration. The measurements at initial point were taken not at start of the
vowel. The very initial and the very last harmonics in the spectrum were not taken into
consideration for analysis because they were completely suppressed due to the effect of
neighboring sounds. So the measurements were taken at initial point after skipping initial
harmonics in the spectrum. The same was done for the readings taken at the end of the vowel.
The measurements were taken after leaving some harmonics at the end of the vowel spectrum.
3.5. MEASUREMENTS
For this study, the methodology introduced by chen (1997) was adopted. Chen introduced an
acoustic approach for the measurement of nasality in her study of nasalized vowels of French
and English. She distinguished nasalized vowels of French and English successfully, employing
two parameters i.e. A1-P0 and A1-P1.
A1 is the amplitude of the first formant (F1),
P0 is the amplitude of first nasal peak below the first formant (F1) and
P1 is the measure of the amplitude of nasal peak between first formant (F1) and the
second formant (F2) of the vowel.

61
The results of her study confirmed that the amplitude of F1 in nasalized vowel reduces relative to
its amplitude in oral vowel, and the extra nasality peaks were also noticed in spectrum. She
compared the measures of A1-P1 and A1-P0 for Oral and nasal vowels. The results of her study
demonstrated that the more the value of A1-P1 and A1-P0 is for vowel the lower that vowel is
nasalized.
Chen (1997) took all these measures at three points: initial, middle and final within all the
vowels. But she did not observe any differences among the measures taken at these three points
in vowels. So she averaged these measures across three positions and got results. One picture of
spectrum taken by Chen’s work is portrayed on the next page. The measured acoustic parameters
of nasalization (A1-P1 and A1-P0) in nasal and oral vowel are displayed. This figure is
illustrating A1-P1 and A1-P0 measures taken at the middle of the oral and nasal vowel.
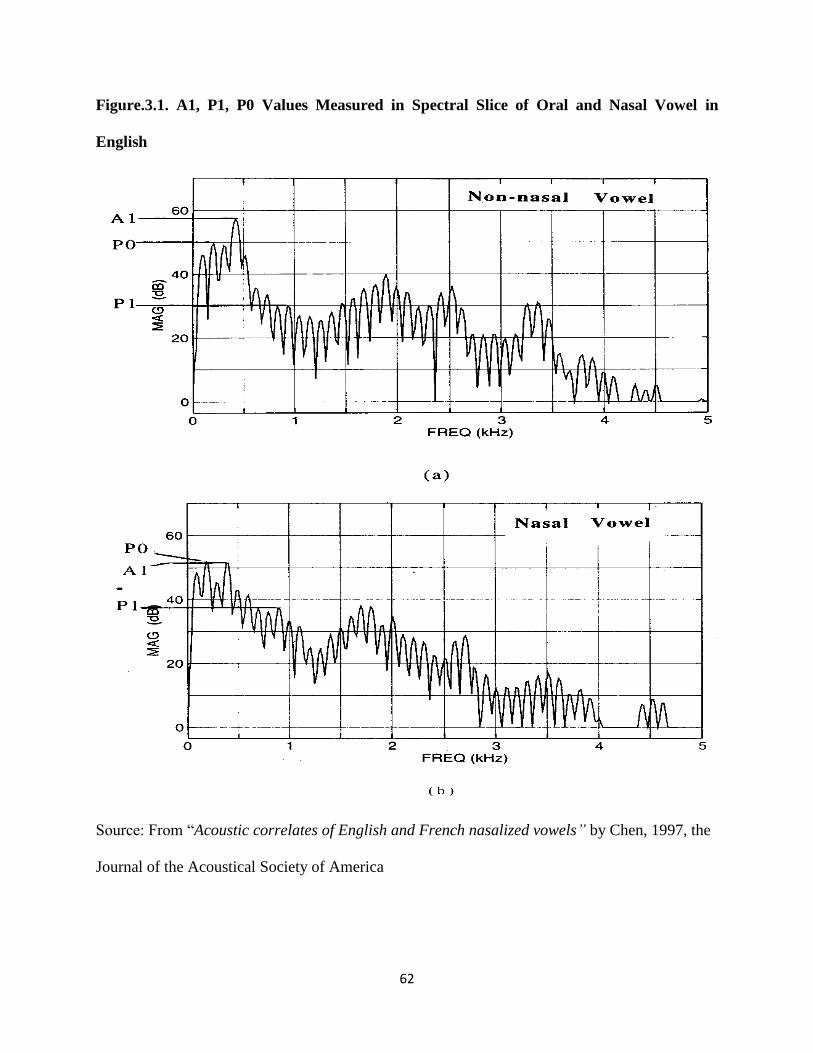
62
Figure.3.1. A1, P1, P0 Values Measured in Spectral Slice of Oral and Nasal Vowel in
English
Source: From “Acoustic correlates of English and French nasalized vowels” by Chen, 1997, the
Journal of the Acoustical Society of America

63
These two measures (A1-P1 and A1-P0) were used to study degree of nasalization in
Punjabi and Pakistani English. In Punjabi the contextually nasal and contrastively nasal vowels
were studied but in English only the contextually nasalized vowels were analyzed because
English lacks oral/nasal contrast for vowels.
For high vowels the values of A1-P1 were measured and for A1-P0 were measured for
low vowels. The reason for taking only P1 for /ɪ/ was the difficulty in measuring FP0 because of
the low F1 of /ɪ/. FP0 is so close to F1 which makes FP0 undistinguished. On the other hand, the
high F1 of /ᴧ/, /ᴂ/ and /ɒ/ makes the measure of FP1 unreliable (Chen, 1997). On the basis of
vowels’ height, Chen proposed A1-P0 for low vowels and A1-P1 for the high vowels as most
reliable measures of nasalization. So, for the present study, the degree of nasalization was
determined in Punjabi and English vowels using A1-P1 for high vowels and A1-P0 for low
vowels.
After determining the degree of nasality in Punjabi and Pakistani English, the results
were compared to see the similarities and differences between these two. These results were
further compared with the values of vowel nasalization in American English, explored by Chen
(1997). All the results of this study are presented in the form of tables and graphics.

64
Chapter Four
RESULTS
The frequency measures at which the values of A1, P1 and P0 were taken in both English
and Punjabi nasalized vowels are given in table 1. There is no significant difference among
frequency prominences at different locations within the same vowel on which the values of A1,
P1 and P0 were taken. So the following table shows the values averaged across speakers,
repetitions and locations (initial, medial, final).
Table.4.1. Frequencies of the nasal peaks and the first formant, averaged across speakers,
repetitions and vowel positions, in English contextually nasalized vowels and Punjabi
contextually and contrastively nasal vowels. FP1 and FP0 indicate the frequencies of nasal
peaks on which the amplitudes P1 and P0 were measured, respectively.
English nasalized
Punjabi nasalized
Vowels Fp0(Hz) F1(Hz) Fp1(Hz) Fp0(Hz) F1(Hz) Fp1(Hz)
/ɪ/ - 409 976 - 423 1021
/ᴧ/ 285 604 - 304 754 -
/ᴂ/ 264 590 - 304 593 -
/ɒ/ 270 584 - - - -
/α/ - - - 300 654 -
Average- 273
303

65
In English nasalized vowels, except /ɪ/, the average Fp0 ranged from 264 Hz to 285 Hz with an
average of 273 Hz across vowels. While in Punjabi nasalized vowels, except /ɪ/, the average Fp0
ranged from 300 Hz to 304 Hz with an average of 303 Hz across vowels. These values are not
much different from the values measured by Chen. She stated the values of Fp0 ranging from 206
Hz to 223 Hz, having the average of 216 Hz across vowels.
In English nasalized vowels, except /ᴧ/, /ᴂ/ and /ɒ/, the average FP1 was 976 Hz. While
for Punjabi nasalized vowels, except/ᴧ, /ᴂ/ and /ɒ/, the FP1 was 1021 Hz. Chen (1997) described
the FP1 in a range of 924 Hz to 1032 Hz, with 966 Hz average across vowels.
4.1. NASALIZATION IN PUNJABI VOWELS
4.1.1. Vowel /ᴂ/
For Punjabi vowel / ᴂ/, the speakers showed significant difference between the oral and nasal
values. At initial portion of the vowel in “v + n” context, two speakers showed statistically
significant difference between the (A1-P0)O and (A1-P0)N values, which reflected the great
degree of nasalization in the vowel in this context. The vowel was nasalized completely by the
two speakers as it was depicting nasality effect even at its onset followed by an oral consonant.
In “v + n” context, all the four speakers showed statistically significant difference
between (A1-P0)O and (A1-P0)N values at the medial point of the vowel / ᴂ/, which reflected
that all the speakers showed the nasality effect at middle portion of the vowel. While the values
of A1-P0 taken at the final portion of oral and contextually nasalized vowels showed the great
effect of neighboring nasal consonant on the offset of vowel. All the speakers showed
statistically significant difference between the measures of (A1-P0)O and (A1-P0)N.
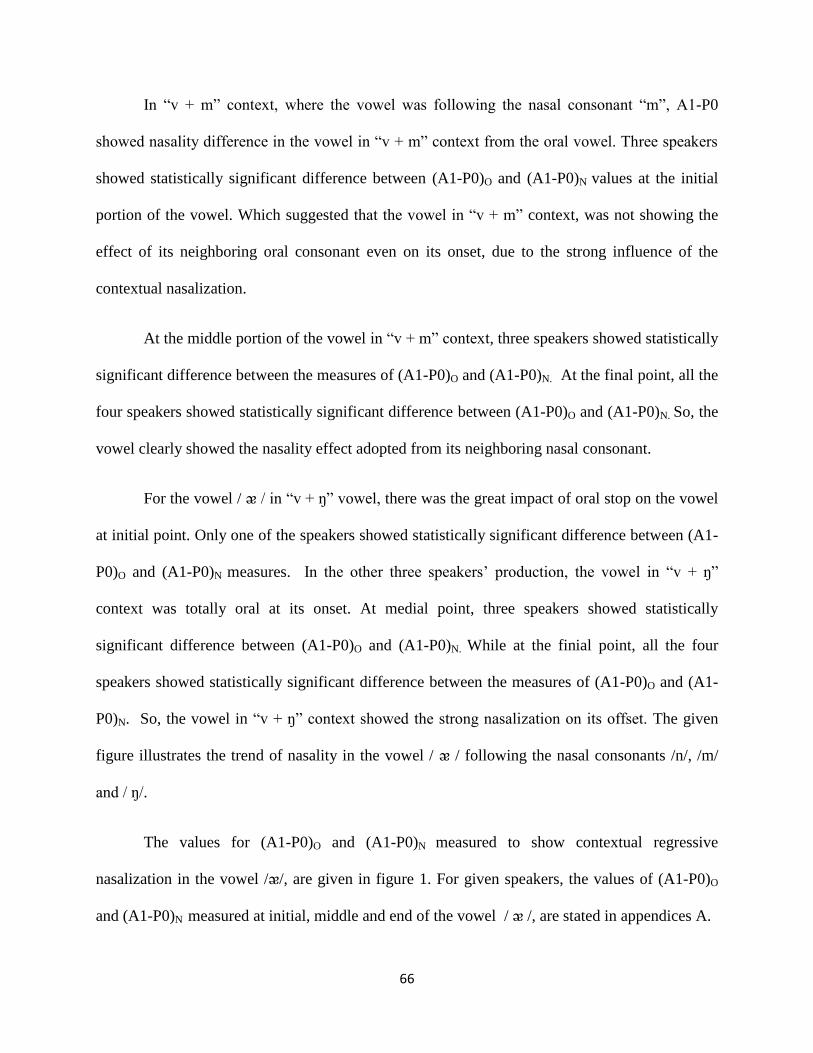
66
In “v + m” context, where the vowel was following the nasal consonant “m”, A1-P0
showed nasality difference in the vowel in “v + m” context from the oral vowel. Three speakers
showed statistically significant difference between (A1-P0)O and (A1-P0)N values at the initial
portion of the vowel. Which suggested that the vowel in “v + m” context, was not showing the
effect of its neighboring oral consonant even on its onset, due to the strong influence of the
contextual nasalization.
At the middle portion of the vowel in “v + m” context, three speakers showed statistically
significant difference between the measures of (A1-P0)O and (A1-P0)N. At the final point, all the
four speakers showed statistically significant difference between (A1-P0)O and (A1-P0)N. So, the
vowel clearly showed the nasality effect adopted from its neighboring nasal consonant.
For the vowel / ᴂ / in “v + ŋ” vowel, there was the great impact of oral stop on the vowel
at initial point. Only one of the speakers showed statistically significant difference between (A1-
P0)O and (A1-P0)N measures. In the other three speakers’ production, the vowel in “v + ŋ”
context was totally oral at its onset. At medial point, three speakers showed statistically
significant difference between (A1-P0)O and (A1-P0)N. While at the finial point, all the four
speakers showed statistically significant difference between the measures of (A1-P0)O and (A1-
P0)N. So, the vowel in “v + ŋ” context showed the strong nasalization on its offset. The given
figure illustrates the trend of nasality in the vowel / ᴂ / following the nasal consonants /n/, /m/
and / ŋ/.
The values for (A1-P0)O and (A1-P0)N measured to show contextual regressive
nasalization in the vowel /ᴂ/, are given in figure 1. For given speakers, the values of (A1-P0)O
and (A1-P0)N measured at initial, middle and end of the vowel / ᴂ /, are stated in appendices A.

67
Figure.4.1. Average A1-P0 across Four Speakers and Repetitions, Measured within the
Punjabi Vowel /ᴂ/ in Oral and Nasal Contexts.
In the vowel /ᴂ/ preceding the nasal consonant “n”, all the four speakers showed
statistically significant difference between the values of (A1-P0)O and (A1-P0)N. So the vowel
showed strong effect of contextual nasalization at its onset. At the medial point of the vowel,
three speakers showed statistically significant difference between (A1-P0)O and (A1-P0)N values.
At the final portion of the vowel, three speakers showed statistically significant difference
between (A1-P0)O and (A1-P0)N values. So, the vowel preceding nasal consonants /n/ and /m/,
adopted nasality effect from its neighboring nasal consonant.
The values for (A1-P0)O and (A1-P0)N measured to show contextual progressive
nasalization in the vowel /ᴂ/, are given in figure 4.2.
-4
-2
0
2
4
6
8
10
12
14
initial middle final
O
v+n
v+m
v+ŋ

68
Figure.4.2. Average A1-P0 across Four Speakers and Repetitions, measured within the
Vowel /ᴂ/ in Oral and Nasal Contexts.
The measures taken at the initial portion of the contrastively nasal vowel, showed no
nasality feature at the onset of the vowel. None of the speakers showed statistically significant
difference between the (A1-P0)O and (A1-P0)N values. While at the middle of the vowel, three
speakers showed statistically significant difference between the values of A1-P0 measured at the
oral vowel and the contrastively nasal vowel. At the final portion of vowel, all the speakers
showed statistically significant difference between the (A1-P0)O and (A1-P0)N values ( see figure
3). That reflected the greater nasality on the offset of nasal vowel.
0
2
4
6
8
10
12
14
initial middle final
O
n+v
m+v

69
Figure.4.3. Average A1-P0 across Four Speakers and Repetitions, Measured within the
Oral /ᴂ/ and Contrastively Nasal /ᴂ/ Vowel.
4.1.2. /ɪ/ Vowel
The vowel /ɪ/, showed clear difference between the A1-P1 values measured at the initial, medial
and final portions of the vowel in different contexts. At the initial point of the vowel /ɪ/ in “v +
n” context, none of the speakers showed statistically significant difference between (A1-P1)O and
(A1-P1)N values, depicting a strong influence of neighboring oral consonant on its onset. At the
middle of the vowel in “v + n” context, two speakers showed statistically significant difference
between (A1-P1)O and (A1-P1)N values. While at the final portion of vowel, three speakers
showed statistically significant difference between the values of (A1-P1)O and (A1-P1)N,
reflecting the contextual nasalization on the offset of the vowel (see figure 7).
At the initial point of the vowel /ɪ/ in “v + m” context, two speakers showed statistically
significant difference between (A1-P1)O and (A1-P1)N values. At the medial portion of vowel /ɪ/,
two speakers showed statistically significant difference between the value of A1-P1 measured in
the vowel in oral context and the vowel in nasal context. While at the final portion, all the four
0
2
4
6
8
10
12
14
initial middle final
O
Ṽ
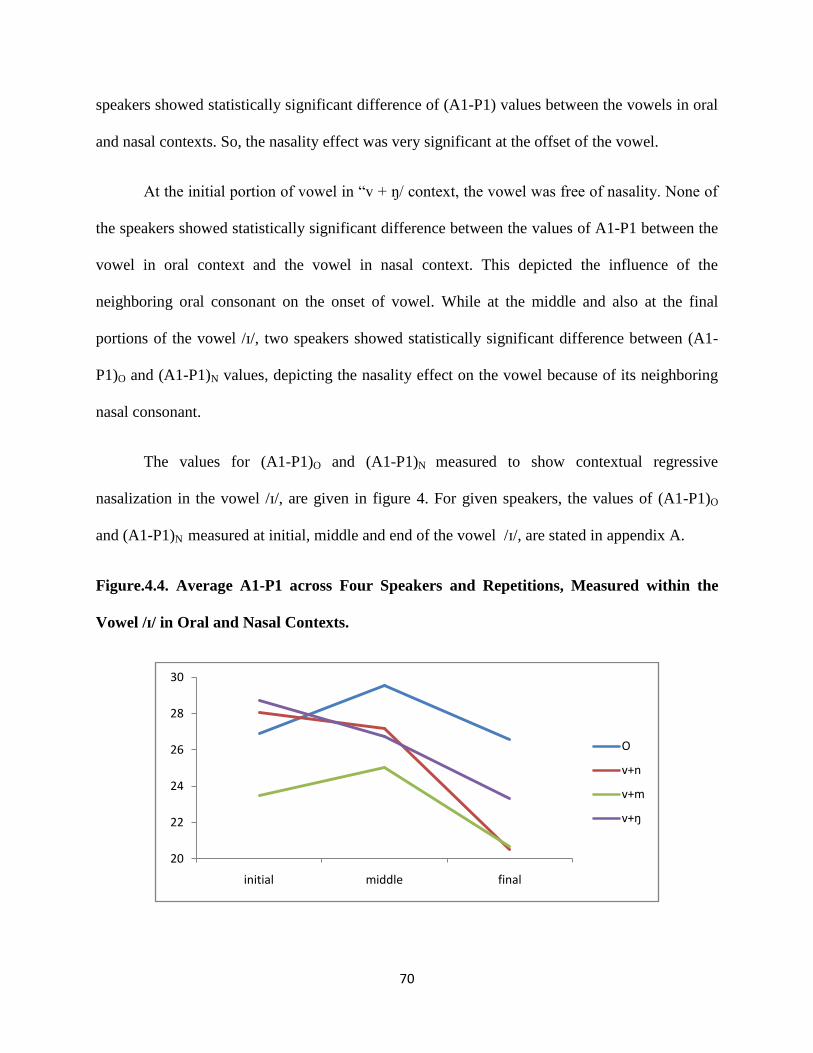
70
speakers showed statistically significant difference of (A1-P1) values between the vowels in oral
and nasal contexts. So, the nasality effect was very significant at the offset of the vowel.
At the initial portion of vowel in “v + ŋ/ context, the vowel was free of nasality. None of
the speakers showed statistically significant difference between the values of A1-P1 between the
vowel in oral context and the vowel in nasal context. This depicted the influence of the
neighboring oral consonant on the onset of vowel. While at the middle and also at the final
portions of the vowel /ɪ/, two speakers showed statistically significant difference between (A1-
P1)O and (A1-P1)N values, depicting the nasality effect on the vowel because of its neighboring
nasal consonant.
The values for (A1-P1)O and (A1-P1)N measured to show contextual regressive
nasalization in the vowel /ɪ/, are given in figure 4. For given speakers, the values of (A1-P1)O
and (A1-P1)N measured at initial, middle and end of the vowel /ɪ/, are stated in appendix A.
Figure.4.4. Average A1-P1 across Four Speakers and Repetitions, Measured within the
Vowel /ɪ/ in Oral and Nasal Contexts.
20
22
24
26
28
30
initial middle final
O
v+n
v+m
v+ŋ

71
The values of (A1-P1)O and (A1-P1)N showed statistically significant difference at initial
portion of the vowel /ɪ/ in “n + v” context, for three speakers. This depicted the nasality effect on
the onset of the vowel preceding the nasal consonant. At the middle of vowel /ɪ/ in “n + v”
context, Three speakers showed statistically significant difference between (A1-P1)O and (A1-
P1)N measures. While at the end of the vowel none of the speakers showed statistically
significant difference between (A1-P1)O and (A1-P1)N for /ɪ/. This reflected that there was no
influence of nasality on the offset of the vowel.
For /ɪ/ in “m + v” context, there was a statistically significant difference between (A1-
P1)O and (A1-P1)N values measured at the initial portion of the vowel, for all the four speakers.
This reflected the nasality influence at the onset of the vowel preceding “m”. At the medial point
of the vowel, the measured values of (A1-P1)O and (A1-P1)N showed statistically significant
difference for two speakers. At the end of the vowel, the vowel was free of nasality effect as no
speaker showed statistically significant results for (A1-P1)O and (A1-P1)N values.
The values for (A1-P1)O and (A1-P1)N calculated to show contextual progressive
nasalization in the vowel /ɪ/, are given in figure 4.5.

72
Figure.4.5. Average A1-P1 across Four Speakers and Repetitions, Measured within the
Vowel /ɪ/ in Oral and Nasal Contexts.
For the vowel /ɪ/ in contrastively nasal context, only one speaker showed statistically
significant difference between the (A1-P1)O and (A1-P1)N measures at initial portion of vowel.
At the middle of the vowel, there was a statistically significant result between (A1-P1)O and (A1-
P1)N, for three speakers. At the final portion of the vowel, three speakers showed statistically
significant difference between the values of (A1-P1)O and (A1-P1)N. Figure 6 illustrates the
values for (A1-P1)O and (A1-P1)N measured to study contrastive nasalization in the vowel /ɪ/.
20
22
24
26
28
30
initial middle final
O
n+v
m+v
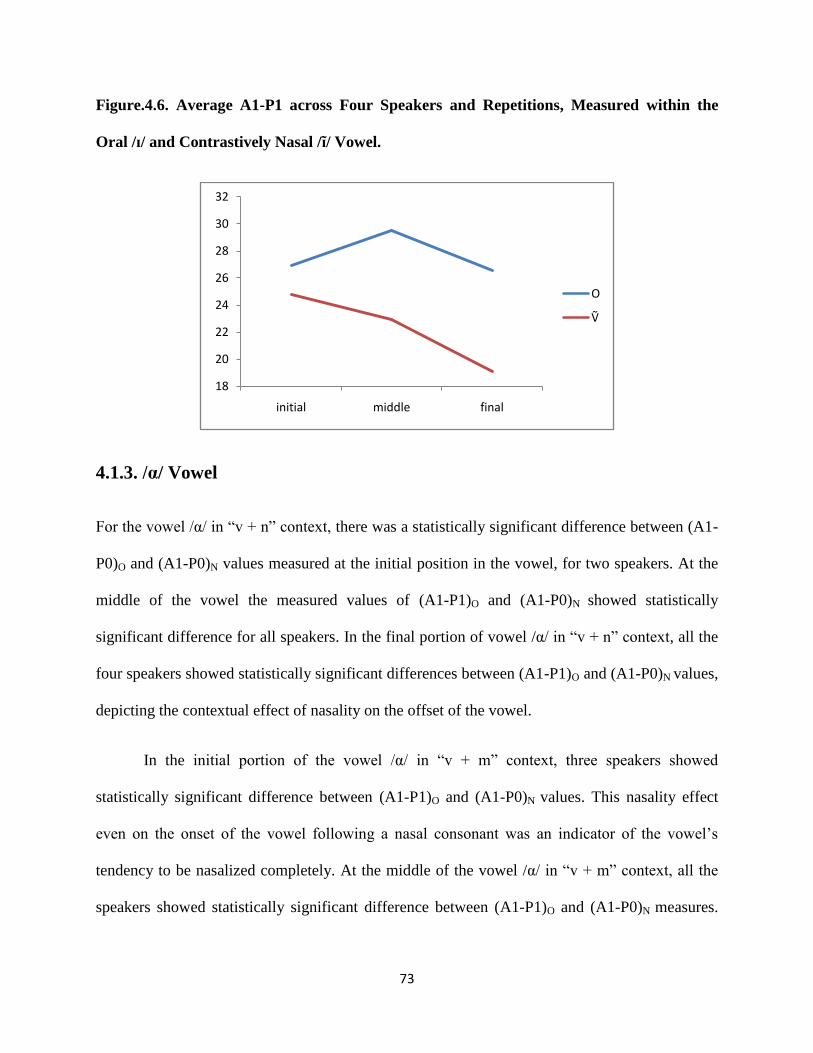
73
Figure.4.6. Average A1-P1 across Four Speakers and Repetitions, Measured within the
Oral /ɪ/ and Contrastively Nasal /ɪ/ Vowel.
4.1.3. /α/ Vowel
For the vowel /α/ in “v + n” context, there was a statistically significant difference between (A1-
P0)O and (A1-P0)N values measured at the initial position in the vowel, for two speakers. At the
middle of the vowel the measured values of (A1-P1)O and (A1-P0)N showed statistically
significant difference for all speakers. In the final portion of vowel /α/ in “v + n” context, all the
four speakers showed statistically significant differences between (A1-P1)O and (A1-P0)N values,
depicting the contextual effect of nasality on the offset of the vowel.
In the initial portion of the vowel /α/ in “v + m” context, three speakers showed
statistically significant difference between (A1-P1)O and (A1-P0)N values. This nasality effect
even on the onset of the vowel following a nasal consonant was an indicator of the vowel’s
tendency to be nasalized completely. At the middle of the vowel /α/ in “v + m” context, all the
speakers showed statistically significant difference between (A1-P1)O and (A1-P0)N measures.
18
20
22
24
26
28
30
32
initial middle final
O
Ṽ
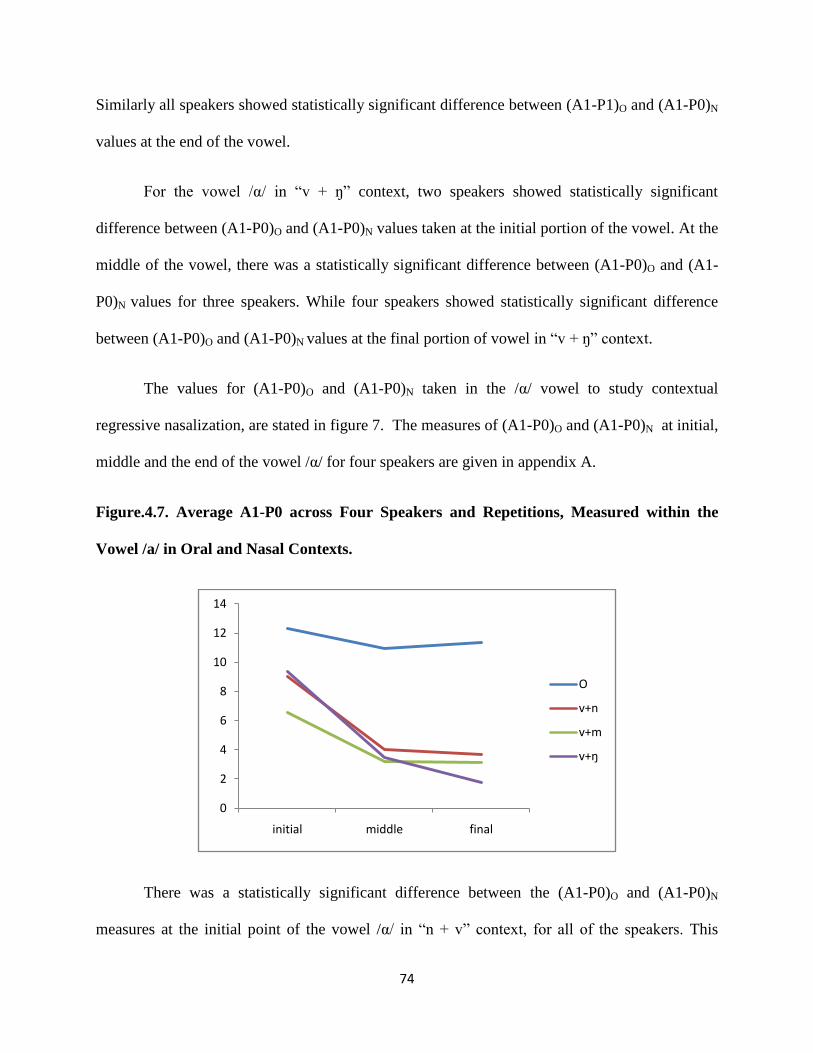
74
Similarly all speakers showed statistically significant difference between (A1-P1)O and (A1-P0)N
values at the end of the vowel.
For the vowel /α/ in “v + ŋ” context, two speakers showed statistically significant
difference between (A1-P0)O and (A1-P0)N values taken at the initial portion of the vowel. At the
middle of the vowel, there was a statistically significant difference between (A1-P0)O and (A1-
P0)N values for three speakers. While four speakers showed statistically significant difference
between (A1-P0)O and (A1-P0)N values at the final portion of vowel in “v + ŋ” context.
The values for (A1-P0)O and (A1-P0)N taken in the /α/ vowel to study contextual
regressive nasalization, are stated in figure 7. The measures of (A1-P0)O and (A1-P0)N at initial,
middle and the end of the vowel /α/ for four speakers are given in appendix A.
Figure.4.7. Average A1-P0 across Four Speakers and Repetitions, Measured within the
Vowel /a/ in Oral and Nasal Contexts.
There was a statistically significant difference between the (A1-P0)O and (A1-P0)N
measures at the initial point of the vowel /α/ in “n + v” context, for all of the speakers. This
0
2
4
6
8
10
12
14
initial middle final
O
v+n
v+m
v+ŋ
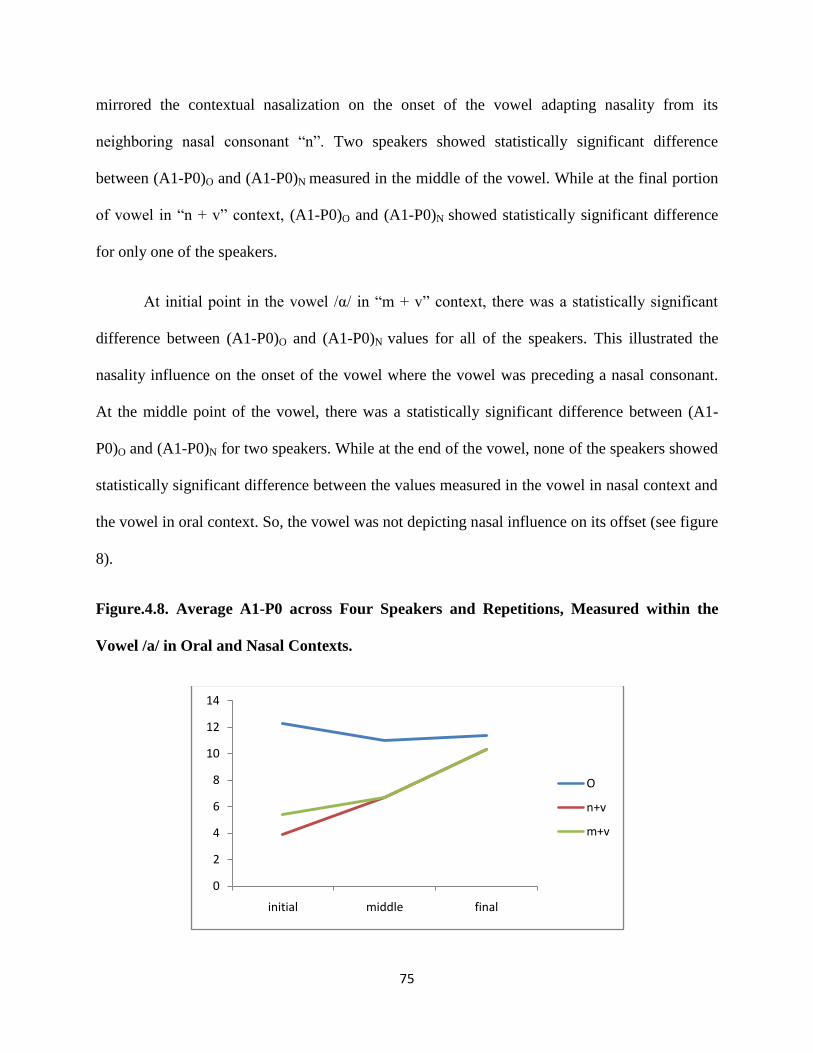
75
mirrored the contextual nasalization on the onset of the vowel adapting nasality from its
neighboring nasal consonant “n”. Two speakers showed statistically significant difference
between (A1-P0)O and (A1-P0)N measured in the middle of the vowel. While at the final portion
of vowel in “n + v” context, (A1-P0)O and (A1-P0)N showed statistically significant difference
for only one of the speakers.
At initial point in the vowel /α/ in “m + v” context, there was a statistically significant
difference between (A1-P0)O and (A1-P0)N values for all of the speakers. This illustrated the
nasality influence on the onset of the vowel where the vowel was preceding a nasal consonant.
At the middle point of the vowel, there was a statistically significant difference between (A1-
P0)O and (A1-P0)N for two speakers. While at the end of the vowel, none of the speakers showed
statistically significant difference between the values measured in the vowel in nasal context and
the vowel in oral context. So, the vowel was not depicting nasal influence on its offset (see figure
8).
Figure.4.8. Average A1-P0 across Four Speakers and Repetitions, Measured within the
Vowel /a/ in Oral and Nasal Contexts.
0
2
4
6
8
10
12
14
initial middle final
O
n+v
m+v

76
For the contrastively nasal vowel /α/, three speakers showed statistically significant
difference between (A1-P0)O and (A1-P0)N at the beginning of the vowel. At the middle of the
vowel, all the four speakers showed statistically significant difference between (A1-P1)O and
(A1-P0)N. While at the end of the vowel, all the four speakers demonstrated statistically
significant results. Figure 9 is depicting the values of (A1-P0)O and (A1-P0)N taken to study the
contrastive nasalization in /α/ vowel.
Figure.4.9. Average A1-P0 across Four Speakers and Repetitions, Measured within the
Oral /a/ and Contrastively Nasal /a/ Vowel.
4.1.4. /ᴧ/ Vowel
For the vowel /ᴧ/ in “v + n” context, none of the speakers showed statistically significant
difference between (A1-P0)O and (A1-P0)N values at the initial portion of the vowel. This
reflected that the vowel is completely oral at its onset. At the middle of the vowel /ᴧ/ in “v + n”
context, three speakers showed statistically significant difference between (A1-P0)O and (A1-
P0)N values. While at the end of the vowel, all speakers showed statistically significant difference
0
2
4
6
8
10
12
14
initial middle final
O
Ṽ

77
between (A1-P0)O and (A1-P0)N measures. This showed that the vowel adopts nasality from its
neighboring nasal consonant.
None of the speakers showed statistically significant difference between (A1-P0)O and
(A1-P0)N values at the initial point of the vowel / ᴧ/ in “v + m” context. So the onset of the vowel
was free from nasality effect. At the middle of the vowel, two speakers showed statistically
significant difference between (A1-P0)O and (A1-P0)N measures. At the end of the vowel /ᴧ/ in
“v + m” context, all the speakers showed statistically significant difference between (A1-P0)O
and (A1-P0)N values, depicting the influence of nasality on the offset of the vowel following a
nasal consonant.
For the vowel /ᴧ/ in “v + ŋ” context, only one speaker showed statistically significant
difference between (A1-P0)O and (A1-P0)N values taken at the beginning of the vowel. At the
middle of the vowel, all the four speakers showed statistically significant difference between
(A1-P0)O and (A1-P0)N measures. While at the end of the vowel, each of the four speakers
showed statistically significant difference between (A1-P0)O and (A1-P0)N values, reflecting the
effect of nasal consonant /ŋ / on the offset of vowel.
The values for (A1-P0)O and (A1-P0)N taken in the / ᴧ / vowel to study contextual
regressive nasalization, are mapped in figure 10. The measures of (A1-P0)O and (A1-P0)N at
initial, middle and the end of the vowel / ᴧ / for different speakers are stated in appendices A.
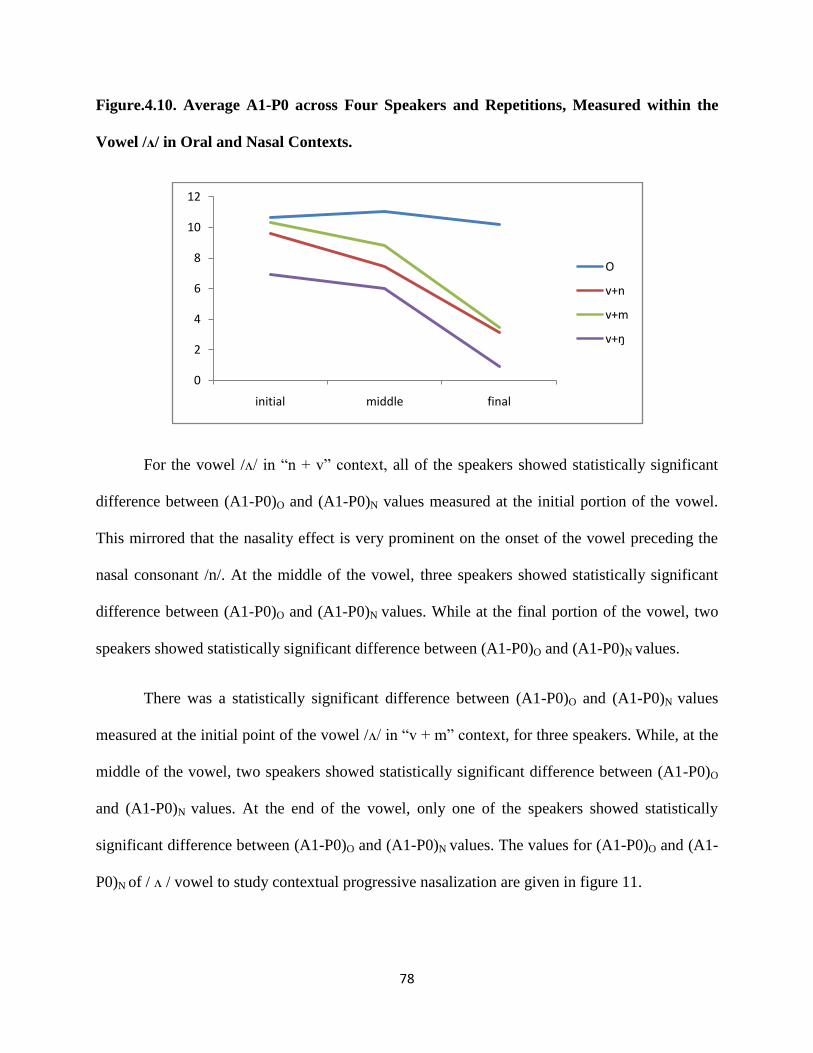
78
Figure.4.10. Average A1-P0 across Four Speakers and Repetitions, Measured within the
Vowel /ᴧ/ in Oral and Nasal Contexts.
For the vowel /ᴧ/ in “n + v” context, all of the speakers showed statistically significant
difference between (A1-P0)O and (A1-P0)N values measured at the initial portion of the vowel.
This mirrored that the nasality effect is very prominent on the onset of the vowel preceding the
nasal consonant /n/. At the middle of the vowel, three speakers showed statistically significant
difference between (A1-P0)O and (A1-P0)N values. While at the final portion of the vowel, two
speakers showed statistically significant difference between (A1-P0)O and (A1-P0)N values.
There was a statistically significant difference between (A1-P0)O and (A1-P0)N values
measured at the initial point of the vowel /ᴧ/ in “v + m” context, for three speakers. While, at the
middle of the vowel, two speakers showed statistically significant difference between (A1-P0)O
and (A1-P0)N values. At the end of the vowel, only one of the speakers showed statistically
significant difference between (A1-P0)O and (A1-P0)N values. The values for (A1-P0)O and (A1-
P0)N of / ᴧ / vowel to study contextual progressive nasalization are given in figure 11.
0
2
4
6
8
10
12
initial middle final
O
v+n
v+m
v+ŋ

79
Figure.4.11. Average A1-P0 across Four Speakers and Repetitions, Measured within the
Vowel /ᴧ/ in Oral and Nasal Contexts.
None of the speakers showed statistically significant difference between (A1-P0)O and
(A1-P0)N values taken at the beginning of the oral and contrastively nasal vowel, respectively. At
the middle of the vowel, three of the speakers showed statistically significant difference between
(A1-P0)O and (A1-P0)N values. While, there was a statistically significant difference between the
(A1-P0)O and (A1-P0)N values measured at the final portion of the vowel /ᴧ/ in contrastively
nasal vowel, for all of the speakers. So the contrastively nasal vowel did not confirm nasality at
its onset. The values of (A1-P0)O and (A1-P0)N for / ᴧ/ vowel to study contextual progressive
nasalization are illustrated in figure 12.
0
2
4
6
8
10
12
initial middle final
O
n+v
m+v

80
Figure.4.12. Average A1-P0 across Four Speakers and Repetitions, Measured within the
Oral /ᴧ/ and Contrastively Nasal /ᴧ/ Vowel.
To summarize the results, the Δ(A1-P0) value was also calculated for low vowels. Δ(A1-
P0) was the measured difference between the average of (A1-P0)O and the average of (A1-P0)N.
The Δ(A1-P1) values was calculated for the high vowel, which was the difference between the
average of (A1-P1)O and the average of (A1-P1)N. The Δ(A1-P0) and Δ(A1-P1) were
calculated for the three portions (initial, middle, final) of vowels in different contexts to see the
degree of contrastive nasalization and contextual (regressive and progressive) nasalization.
For the vowels in “v + n” context, the mean, minima and maxima values for Δ(A1-P0)
and Δ(A1-P1) at the initial portion of vowel, are given in table 4.2. The mean for Δ(A1-P0)
ranged from 1 db to 3 db with the minima ranging from -4 db to 1 db and the maxima ranging
from 3db to 6 db. While the mean for Δ(A1-P0) was -1 db with the minima of -5 and the maxima
of 2 db measured for the high vowel /ɪ/.
0
2
4
6
8
10
12
initial middle final
O
Ṽ

81
Table.4.2. Δ(A1-P0)db and Δ(A1-P1)db Values at the Initial of the Vowels in “v + n”
Context.
vowels
Δ(A1-P0)db Δ(A1-P1)db
Mean min max mean min Max
/ɪ/
-1 -5 2
/ᴂ/ 2 -4 6
/a/ 3 1 5
/ᴧ/ 1 0 3
At the middle of the vowels in “v + n” context, the mean for Δ(A1-P0) ranged from 4 db
to 9 db with the minima ranging from 1 db to 6 and the maxima ranging from 6 db to 15 db.
While the mean for Δ(A1-P1) was 2 db with the minima of -3 db and the maxima of 5db (see
table 4.3).
Table.4.3. Δ(A1-P0)db and Δ(A1-P1)db Values at the Middle of the Vowels in “v + n”
Context.
Vowels
Δ(A1-P0)db Δ(A1-P1)db
mean Min max mean min max
/ɪ/
2 -3 5
/ᴂ/ 9 6 15
/a/ 7 4 10
/ᴧ/ 4 1 6

82
At the final portion of the vowels in “v + n” context, the mean values for Δ(A1-P0)
ranged from 7 db to 9 db with the minima ranging from 5 db to 6db and the maxima ranging
from 10 db to 12 db. For the high vowel, the mean for Δ(A1-P0) was 6 db with the minima of 3
db and the maxima of 10 db. The mean, minima and maxima values for Δ(A1-P0) and Δ(A1-P1)
are given in table 4.4.
Table.4.4. Δ(A1-P0)db and Δ(A1-P1)db Values at the End of the Vowels in “v + n” Context.
vowels
Δ(A1-P0)db Δ(A1-P1)db
mean Min max Mean min max
/ɪ/
6 3 10
/ᴂ/ 9 6 12
/a/ 8 5 10
/ᴧ/ 7 5 10
At the initial portion of the vowels in “v + m” context, the mean for Δ(A1-P0) ranged
from 0 db to 6 db with the minima ranging from -2 db to 3 db and the maxima ranging from 4 db
to 8 db. While for Δ(A1-P1), the mean was 3 db with the minima of 1 db and the maxima of 7
db. The values for Δ(A1-P0)db and Δ(A1-P1) are given in table 4.5.

83
Table.4.5. Δ(A1-P0)db and Δ(A1-P1)db Values at the Beginning of the Vowels in “v + m”
Context.
vowels
Δ(A1-P0)db Δ(A1-P1)db
mean min max Mean min max
/ɪ/
3 1 7
/ᴂ/ 2 -2 5
/a/ 6 3 8
/ᴧ/ 0 -1 4
The values for Δ(A1-P0) and Δ(A1-P1) calculated at the middle of the vowels in “v + m”
context, are given in table 4.6. The mean for Δ(A1-P0) ranged from 2 db to 8 db with the minima
ranging from -3 db to 4 db and the maxima ranging from 6 db to 11 db. While the mean for
Δ(A1-P1) was 4 db with the minima of 0 db and the maxima of 8 db.
Table.4.6. Δ(A1-P0)db and Δ(A1-P1)db Values at the Middle of the Vowels in “v + m”
Context.
vowels
Δ(A1-P0)db Δ(A1-P1)db
mean Min max mean min max
/ɪ/
4 0 8
/ᴂ/ 6 4 8
/a/ 8 4 11
/ᴧ/ 2 -3 6
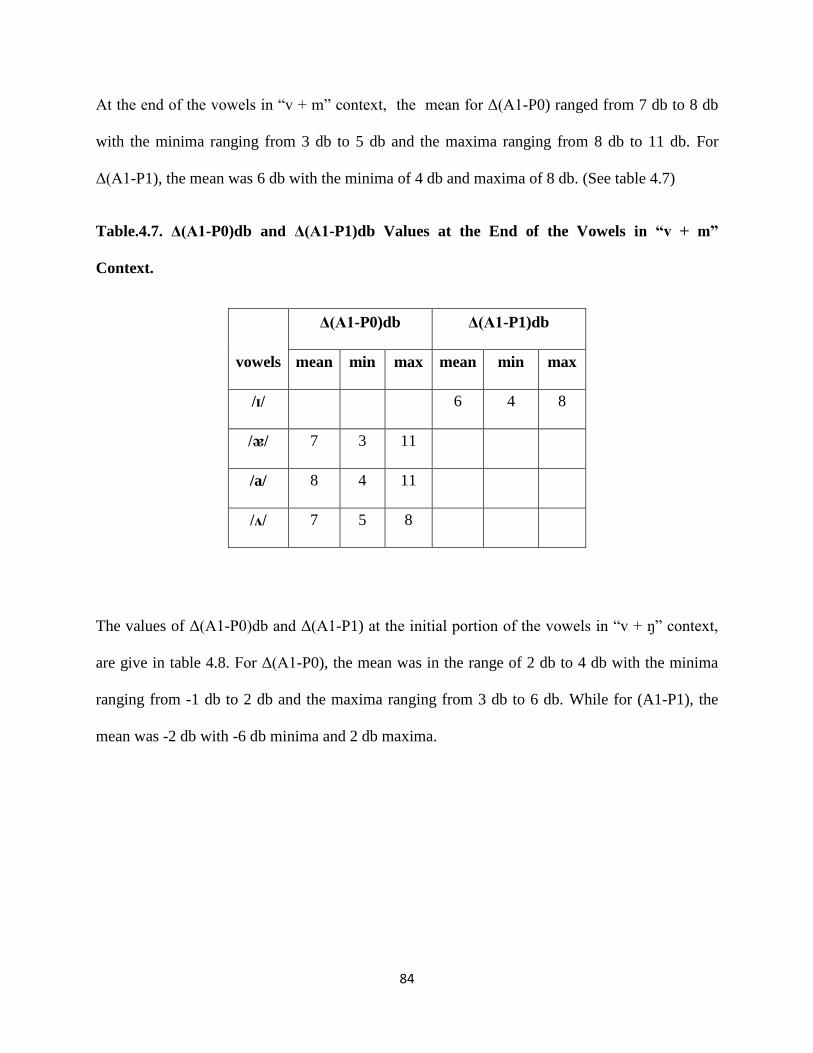
84
At the end of the vowels in “v + m” context, the mean for Δ(A1-P0) ranged from 7 db to 8 db
with the minima ranging from 3 db to 5 db and the maxima ranging from 8 db to 11 db. For
Δ(A1-P1), the mean was 6 db with the minima of 4 db and maxima of 8 db. (See table 4.7)
Table.4.7. Δ(A1-P0)db and Δ(A1-P1)db Values at the End of the Vowels in “v + m”
Context.
vowels
Δ(A1-P0)db Δ(A1-P1)db
mean min max mean min max
/ɪ/
6 4 8
/ᴂ/ 7 3 11
/a/ 8 4 11
/ᴧ/ 7 5 8
The values of Δ(A1-P0)db and Δ(A1-P1) at the initial portion of the vowels in “v + ŋ” context,
are give in table 4.8. For Δ(A1-P0), the mean was in the range of 2 db to 4 db with the minima
ranging from -1 db to 2 db and the maxima ranging from 3 db to 6 db. While for (A1-P1), the
mean was -2 db with -6 db minima and 2 db maxima.

85
Table.4.8. Δ(A1-P0)db and Δ(A1-P1)db Values at the Beginning of the Vowels in “v + ŋ”
Context.
vowels
Δ(A1-P0)db Δ(A1-P1)db
Mean min max mean min Max
/ɪ/
-2 -6 2
/ᴂ/ 2 -1 3
/a/ 3 2 4
/ᴧ/ 4 0 6
At the middle of the vowels in “v + ŋ” context, the mean for Δ(A1-P0) ranged from 5 db
to 8 db with the minima ranging from 2 db to 4 db and the maxima ranging from 6 db to 12 db.
For Δ(A1-P1), the mean was 3 db with the minima of -1 db and the maxima of 4 db. The values
for Δ(A1-P0)db and Δ(A1-P1) are given in table 4.9.
Table.4.9. Δ(A1-P0)db and Δ(A1-P1)db Values at the Middle of the Vowels in “v + ŋ”
Context.
vowels
Δ(A1-P0)db Δ(A1-P1)db
mean min Max mean min Max
/ɪ/
3 -1 4
/ᴂ/ 7 2 12
/a/ 8 4 12
/ᴧ/ 5 4 6

86
The mean for Δ(A1-P1) at the end of the vowels in “v + ŋ” context, was in the range of 5
db to 6 db with the minima ranging from 2 db to 6 db and the maxima ranging from 8 db to 10
db. While the mean for Δ(A1-P1) was 3 db with the minima of 2 db and the maxima of 5 db.
Table 4.10 illustrates the values for Δ(A1-P0)db and Δ(A1-P1) calculated at the end of vowels in
“v + ŋ” context.
Table.4.10. Δ(A1-P0)db and Δ(A1-P1)db Values at the End of the Vowels in “v + ŋ”
Context.
vowels
Δ(A1-P0)db Δ(A1-P1)db
mean min max mean min max
/ɪ/
3 2 5
/ᴂ/ 6 2 10
/a/ 8 6 10
/ᴧ/ 5 4 8
For the vowels in “n + v” context, the mean, minima and maxima values of Δ(A1-P0)db
and Δ(A1-P1) calculated at the initial portion of vowels, are given in Table 4.11. The mean for
Δ(A1-P0) ranged from 6 db to 8 db with the minima ranging from 3 db to 7 db and the maxima
ranging from 7 db to 12 db. While the mean for Δ(A1-P1) was 4 db with 1 db minima and 7 db
maxima.
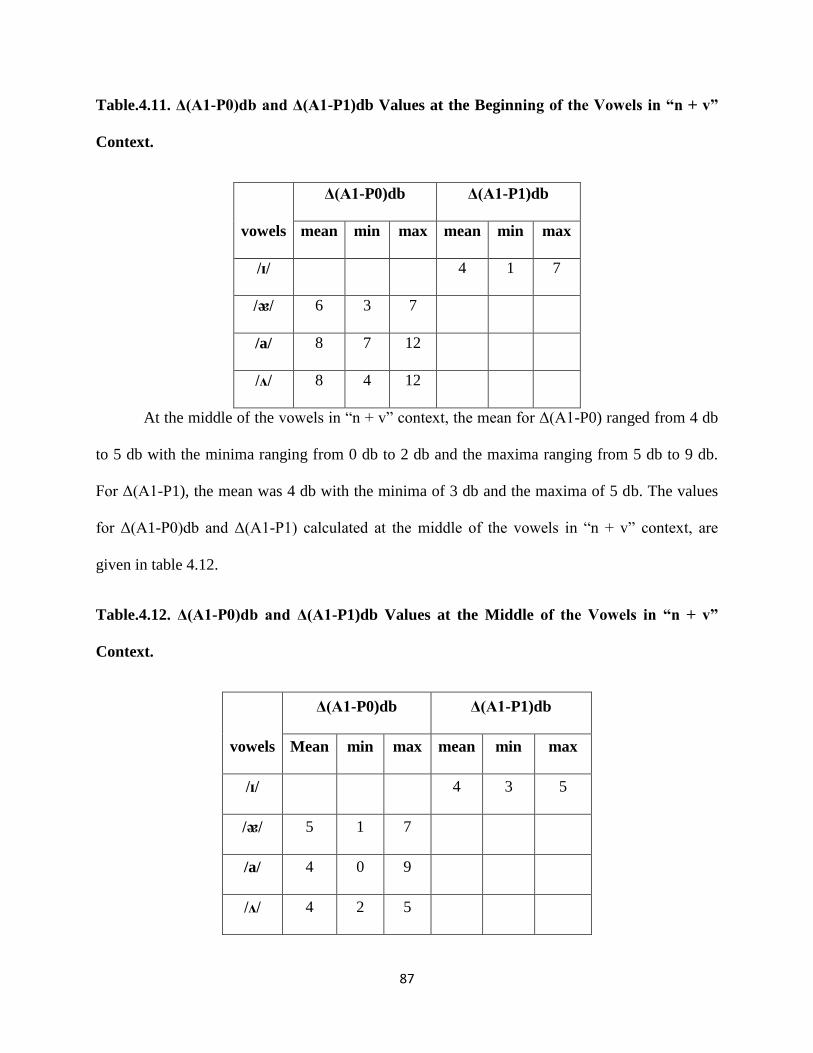
87
Table.4.11. Δ(A1-P0)db and Δ(A1-P1)db Values at the Beginning of the Vowels in “n + v”
Context.
vowels
Δ(A1-P0)db Δ(A1-P1)db
mean min max mean min max
/ɪ/
4 1 7
/ᴂ/ 6 3 7
/a/ 8 7 12
/ᴧ/ 8 4 12
At the middle of the vowels in “n + v” context, the mean for Δ(A1-P0) ranged from 4 db
to 5 db with the minima ranging from 0 db to 2 db and the maxima ranging from 5 db to 9 db.
For Δ(A1-P1), the mean was 4 db with the minima of 3 db and the maxima of 5 db. The values
for Δ(A1-P0)db and Δ(A1-P1) calculated at the middle of the vowels in “n + v” context, are
given in table 4.12.
Table.4.12. Δ(A1-P0)db and Δ(A1-P1)db Values at the Middle of the Vowels in “n + v”
Context.
vowels
Δ(A1-P0)db Δ(A1-P1)db
Mean min max mean min max
/ɪ/
4 3 5
/ᴂ/ 5 1 7
/a/ 4 0 9
/ᴧ/ 4 2 5

88
The mean for Δ(A1-P0) calculated at the final portion of the vowels in “n + v” context,
ranged from 1 db to 2 db with the minima ranging from -1 db to 0 db and the maxima ranging
from 3 db to 4 db. While for Δ(A1-P1), the mean was 0 db with -2 db minima and 3 db maxima
(see table 4.13).
Table.4.13. Δ(A1-P0)db and Δ(A1-P1)db Values at the End of the Vowels in “n + v”
Context.
vowels
Δ(A1-P0)db Δ(A1-P1)db
Mean min max mean min Max
/ɪ/
0 -2 3
/ᴂ/ 2 0 4
/a/ 1 -1 4
/ᴧ/ 2 0 3
For the vowels in “m + v” context, the values of Δ(A1-P0)db and Δ(A1-P1) calculated at
the initial portion of vowels are given in table 4.14. The mean for Δ(A1-P0) was in range of 6 db
to 7 db with the minima ranging from 3 db to 5 db and the maxima ranging from 2 db to 14 db.
For Δ(A1-P1), the mean was 5 db with the minima of 1 db and the maxima of 9 db.

89
Table.4.14. Δ(A1-P0)db and Δ(A1-P1)db Values at the Beginning of the Vowels in “m + v”
Context.
vowels
Δ(A1-P0)db Δ(A1-P1)db
mean min Max mean min Max
/ɪ/
5 1 9
/ᴂ/ 6 5 7
/a/ 7 4 12
/ᴧ/ 7 3 14
At the middle of the vowels in “m + v” context, the mean for Δ(A1-P0) ranged from 3 db to 4 db
with the minima ranging from 0 db to 1 db and the maxima ranging from 6 db to 8 db. While the
mean for Δ(A1-P1) was 3 db with minima of 2 db and the maxima of 4 db. The values for Δ(A1-
P0) and Δ(A1-P1) at the middle of the vowels in “m + v” context are given in table 4.15.
Table.4.15. Δ(A1-P0)db and Δ(A1-P1)db Values at the Middle of the Vowels in “m + v”
Context.
vowels
Δ(A1-P0)db Δ(A1-P1)db
Mean Min max mean min max
/ɪ/
3 2 4
/ᴂ/ 4 0 6
/a/ 4 1 7
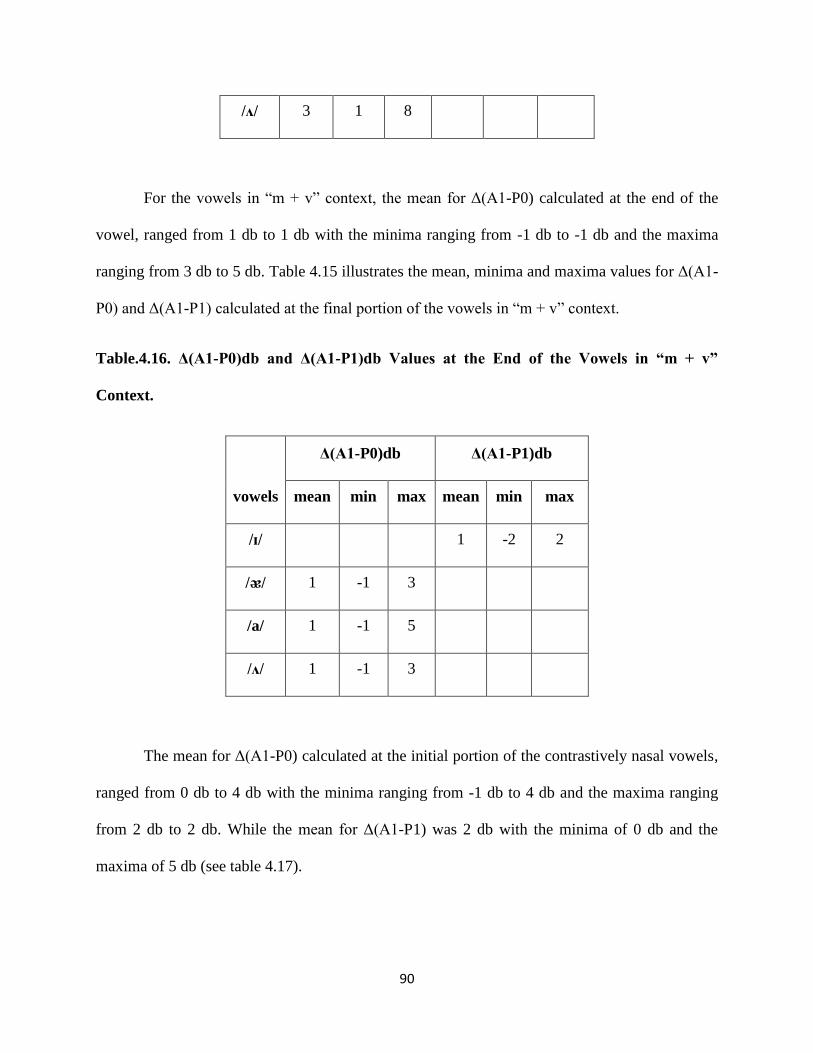
90
/ᴧ/ 3 1 8
For the vowels in “m + v” context, the mean for Δ(A1-P0) calculated at the end of the
vowel, ranged from 1 db to 1 db with the minima ranging from -1 db to -1 db and the maxima
ranging from 3 db to 5 db. Table 4.15 illustrates the mean, minima and maxima values for Δ(A1-
P0) and Δ(A1-P1) calculated at the final portion of the vowels in “m + v” context.
Table.4.16. Δ(A1-P0)db and Δ(A1-P1)db Values at the End of the Vowels in “m + v”
Context.
vowels
Δ(A1-P0)db Δ(A1-P1)db
mean min max mean min max
/ɪ/
1 -2 2
/ᴂ/ 1 -1 3
/a/ 1 -1 5
/ᴧ/ 1 -1 3
The mean for Δ(A1-P0) calculated at the initial portion of the contrastively nasal vowels,
ranged from 0 db to 4 db with the minima ranging from -1 db to 4 db and the maxima ranging
from 2 db to 2 db. While the mean for Δ(A1-P1) was 2 db with the minima of 0 db and the
maxima of 5 db (see table 4.17).
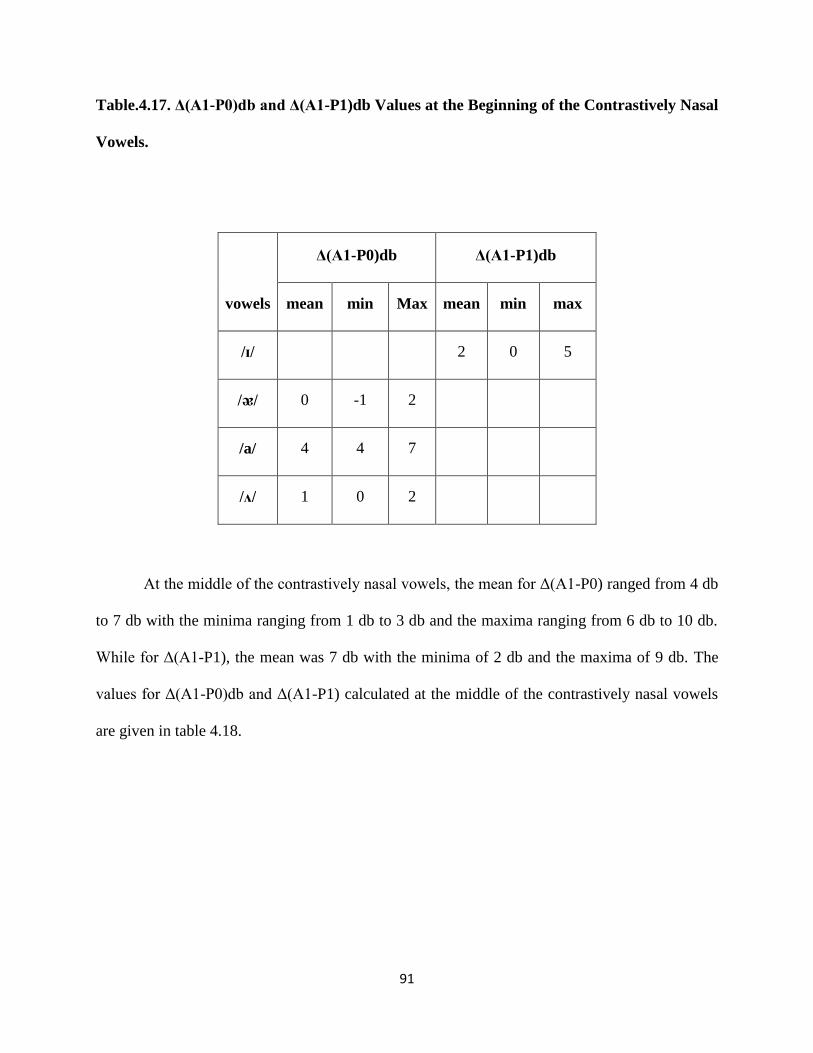
91
Table.4.17. Δ(A1-P0)db and Δ(A1-P1)db Values at the Beginning of the Contrastively Nasal
Vowels.
vowels
Δ(A1-P0)db Δ(A1-P1)db
mean min Max mean min max
/ɪ/
2 0 5
/ᴂ/ 0 -1 2
/a/ 4 4 7
/ᴧ/ 1 0 2
At the middle of the contrastively nasal vowels, the mean for Δ(A1-P0) ranged from 4 db
to 7 db with the minima ranging from 1 db to 3 db and the maxima ranging from 6 db to 10 db.
While for Δ(A1-P1), the mean was 7 db with the minima of 2 db and the maxima of 9 db. The
values for Δ(A1-P0)db and Δ(A1-P1) calculated at the middle of the contrastively nasal vowels
are given in table 4.18.
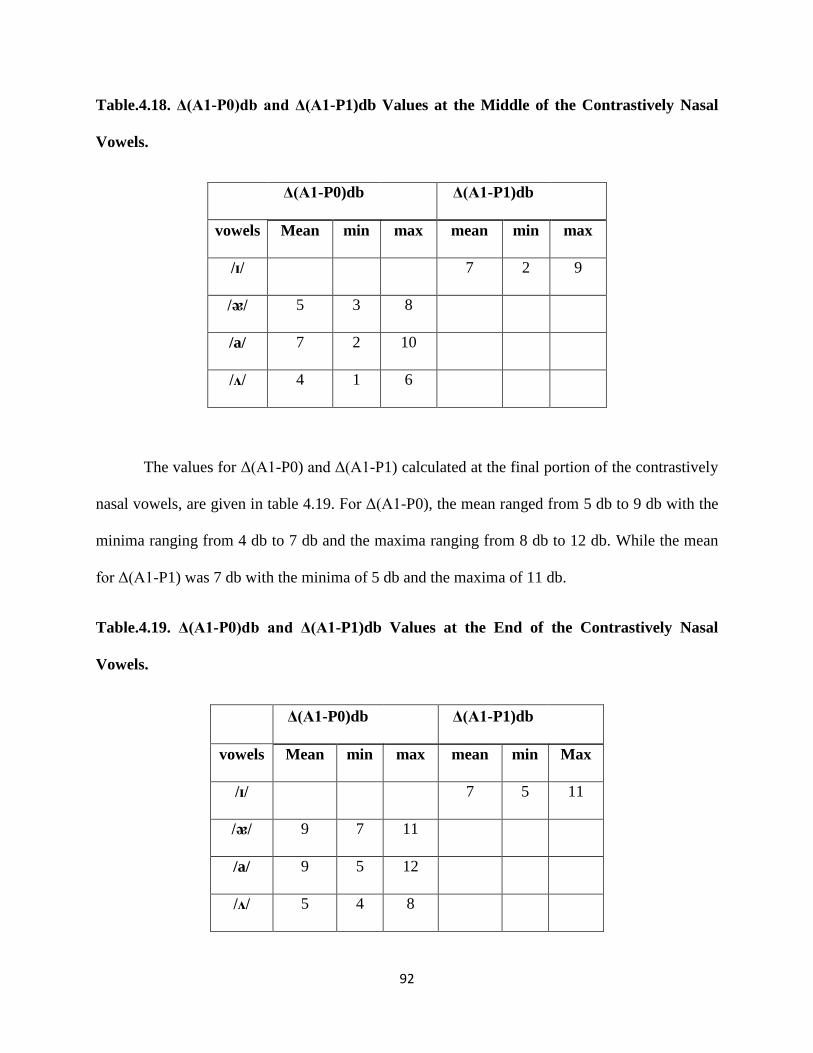
92
Table.4.18. Δ(A1-P0)db and Δ(A1-P1)db Values at the Middle of the Contrastively Nasal
Vowels.
Δ(A1-P0)db
Δ(A1-P1)db
vowels Mean min max mean min max
/ɪ/
7 2 9
/ᴂ/ 5 3 8
/a/ 7 2 10
/ᴧ/ 4 1 6
The values for Δ(A1-P0) and Δ(A1-P1) calculated at the final portion of the contrastively
nasal vowels, are given in table 4.19. For Δ(A1-P0), the mean ranged from 5 db to 9 db with the
minima ranging from 4 db to 7 db and the maxima ranging from 8 db to 12 db. While the mean
for Δ(A1-P1) was 7 db with the minima of 5 db and the maxima of 11 db.
Table.4.19. Δ(A1-P0)db and Δ(A1-P1)db Values at the End of the Contrastively Nasal
Vowels.
Δ(A1-P0)db
Δ(A1-P1)db
vowels Mean min max mean min Max
/ɪ/
7 5 11
/ᴂ/ 9 7 11
/a/ 9 5 12
/ᴧ/ 5 4 8
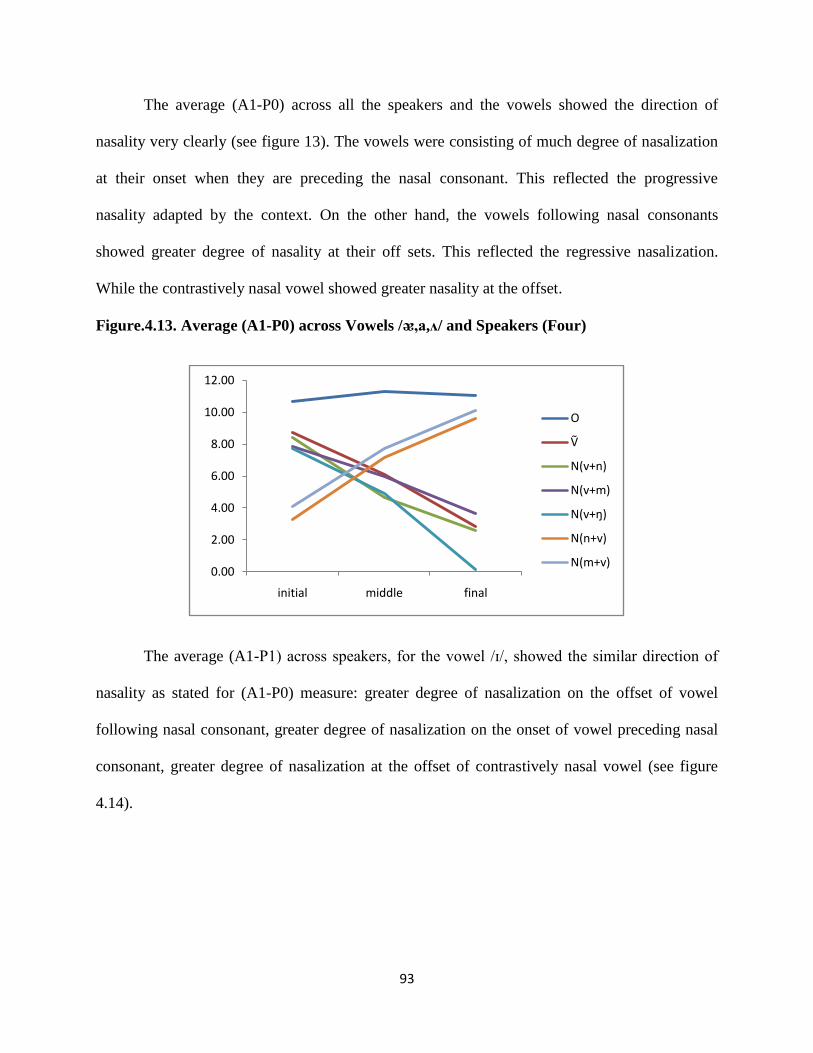
93
The average (A1-P0) across all the speakers and the vowels showed the direction of
nasality very clearly (see figure 13). The vowels were consisting of much degree of nasalization
at their onset when they are preceding the nasal consonant. This reflected the progressive
nasality adapted by the context. On the other hand, the vowels following nasal consonants
showed greater degree of nasality at their off sets. This reflected the regressive nasalization.
While the contrastively nasal vowel showed greater nasality at the offset.
Figure.4.13. Average (A1-P0) across Vowels /ᴂ,a,ᴧ/ and Speakers (Four)
The average (A1-P1) across speakers, for the vowel /ɪ/, showed the similar direction of
nasality as stated for (A1-P0) measure: greater degree of nasalization on the offset of vowel
following nasal consonant, greater degree of nasalization on the onset of vowel preceding nasal
consonant, greater degree of nasalization at the offset of contrastively nasal vowel (see figure
4.14).
0.00
2.00
4.00
6.00
8.00
10.00
12.00
initial middle final
O
Ṽ
N(v+n)
N(v+m)
N(v+ŋ)
N(n+v)
N(m+v)
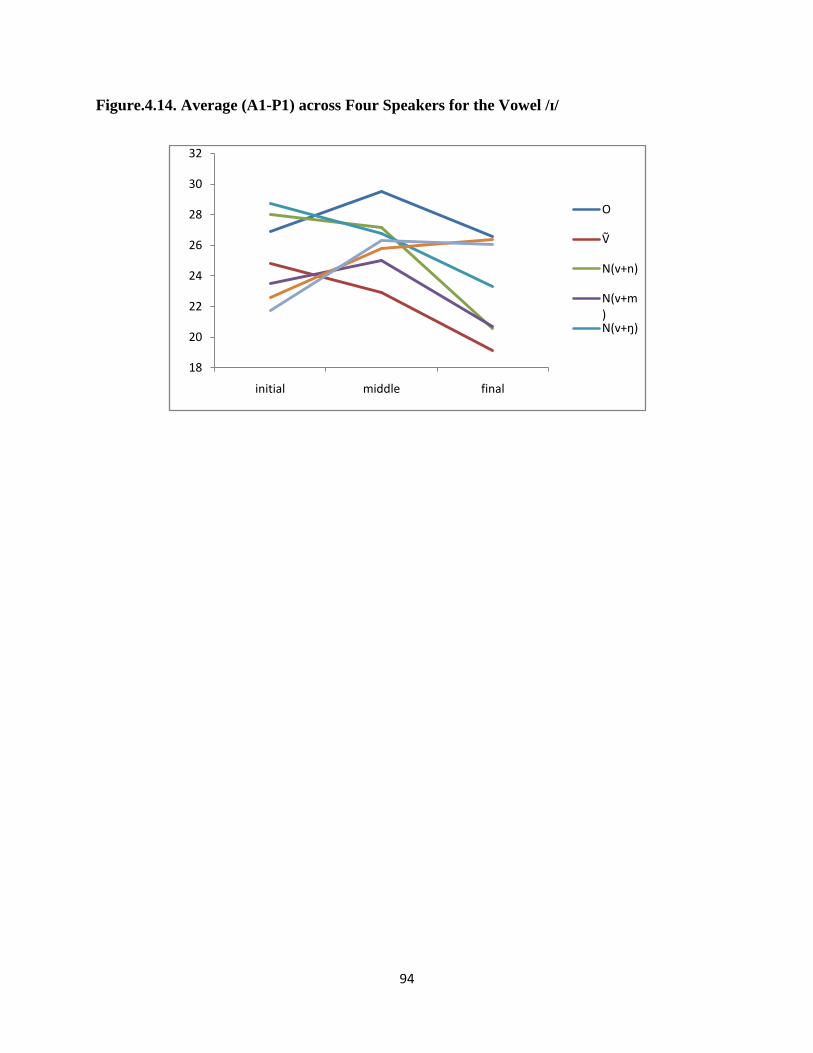
94
Figure.4.14. Average (A1-P1) across Four Speakers for the Vowel /ɪ/
18
20
22
24
26
28
30
32
initial middle final
O
Ṽ
N(v+n)
N(v+m)N(v+ŋ)
95
4.2. NASALIZATION IN PAKISTANI ENGLISH VOWELS
4.2.1. /ᴂ/ Vowel
For the vowel /ᴂ/ in “v + n” context, none of the speakers showed statistically significant
difference between (A1-P0)O and (A1-P0)N values measured at the initial portion of the vowel.
At the middle of the vowel, there was significant difference between (A1-P0)O and (A1-P0)N
values for all of the speakers, depicting the nasality effect on the middle of the vowel. Similarly
all the speakers showed statistically significant difference between (A1-P0)O and (A1-P0)N
values taken at the end of the vowel.
For the vowel /ᴂ/ in “v + m” context, only one speaker showed statistically significant
difference between (A1-P0)O and (A1-P0)N values measured at the beginning of the vowel. So
the vowel was not depicting a greater degree of nasality at its onset following /m/. At the middle
of the vowel in “v + m” context, four of the speakers showed statistically significant difference
between (A1-P0)O and (A1-P0)N value. While at the end of the vowel, there was a statistically
significant difference between (A1-P0)O and (A1-P0)N for all of the speakers, depicting nasality
influence on the vowel.
At the initial portion of the vowel /ᴂ/ in “v + ŋ”, none of the speakers showed statistically
significant difference between (A1-P0) value measured for the vowel in oral and nasal context.
For the middle portion of the vowel in “v + ŋ” context, three of the speakers showed statistically
significant difference between (A1-P0)O and (A1-P0)N values. At the end of the vowel, four of
the speakers showed statistically significant difference between (A1-P0)O and (A1-P0)N
measures.
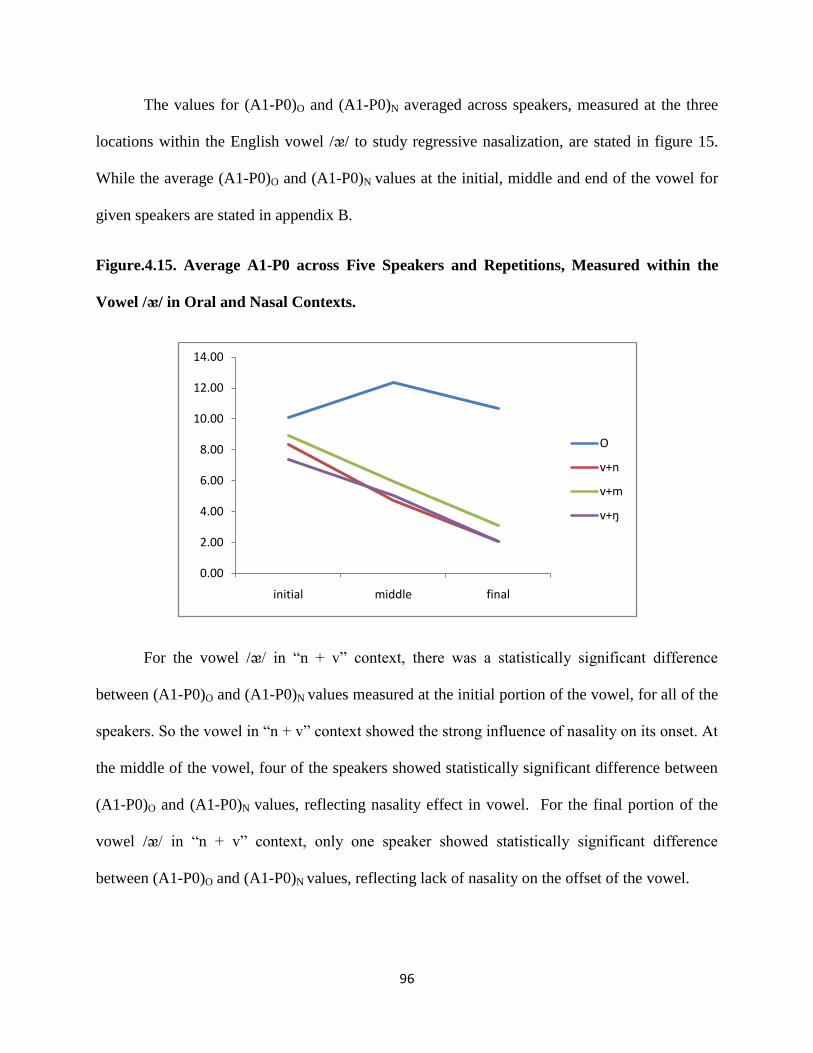
96
The values for (A1-P0)O and (A1-P0)N averaged across speakers, measured at the three
locations within the English vowel /ᴂ/ to study regressive nasalization, are stated in figure 15.
While the average (A1-P0)O and (A1-P0)N values at the initial, middle and end of the vowel for
given speakers are stated in appendix B.
Figure.4.15. Average A1-P0 across Five Speakers and Repetitions, Measured within the
Vowel /ᴂ/ in Oral and Nasal Contexts.
For the vowel /ᴂ/ in “n + v” context, there was a statistically significant difference
between (A1-P0)O and (A1-P0)N values measured at the initial portion of the vowel, for all of the
speakers. So the vowel in “n + v” context showed the strong influence of nasality on its onset. At
the middle of the vowel, four of the speakers showed statistically significant difference between
(A1-P0)O and (A1-P0)N values, reflecting nasality effect in vowel. For the final portion of the
vowel /ᴂ/ in “n + v” context, only one speaker showed statistically significant difference
between (A1-P0)O and (A1-P0)N values, reflecting lack of nasality on the offset of the vowel.
0.00
2.00
4.00
6.00
8.00
10.00
12.00
14.00
initial middle final
O
v+n
v+m
v+ŋ

97
For the vowel /ᴂ/ in “m + v” context, all the speakers showed statistically significant
difference between (A1-P0)O and (A1-P0)N values calculated at the initial portion of the vowel.
At the middle of the vowel, there was a statistically significant difference between (A1-P0)O and
(A1-P0)N measures, for three of the speakers. While at the end of the vowel, none of the speakers
showed statistically significant difference between the values of (A1-P0)O and (A1-P0)N. Figure
16 is showing the pattern of progressive nasalization in the vowel /ᴂ/.
Figure.4.16. Average A1-P0 across Five Speakers and Repetitions, Measured within the
Vowel /ᴂ/ in Oral and Nasal Contexts.
0
2
4
6
8
10
12
14
initial middle final
O
n+v
m+v

98
4.2.2. /ɪ/ Vowel
For the vowel /ɪ/ in “v + n” context, none of the speakers showed statistically significant
difference between (A1-P1)O and (A1-P1)N values measured at the initial of the vowel. So the
vowel was reflecting less influence of contextual nasality on its onset. At the middle of the
vowel, three of the speakers showed statistically significant difference between the values of
(A1-P1)O and (A1-P1)N. While at the end of the vowel in “v + n” context, four speakers showed
statistically significant difference between (A1-P1)O and (A1-P1)N values. So the nasality
affected the middle and the offset greater than its onset.
At the initial portion of the vowel /ɪ/ in “v + m” context, no one of the speakers showed
statistically significant difference between (A1-P1)O and (A1-P1)N values. For the vowel /ɪ/ in “v
+ m” context, two speakers showed statistically significant difference between (A1-P1)O and
(A1-P1)N values measured at the middle of the vowel. While at the end, four speakers showed
statistically significant difference between the values of (A1-P1)O and (A1-P1)N.
For the vowel /ɪ/ in “v + ŋ” context, none of the speakers showed statistically significant
difference between (A1-P1)O and (A1-P1)N values measured at the initial portion of the vowel.
At the middle of the vowel in “v + ŋ” context, four of the speakers showed statistically
significant difference between (A1-P1)O and (A1-P1)N values. At the end of the vowel, there was
a significant difference between (A1-P1)O and (A1-P1)N values, for four of the speakers.
The (A1-P0)O and (A1-P0)N values averaged across speakers, measured at the three
locations (initial, middle and final) within the English vowel /ɪ/ to study regressive nasalization,
are stated in figure 17. The average (A1-P0)O and (A1-P0)N values at the initial, middle and end
of the vowel for given speakers are stated in appendix B.
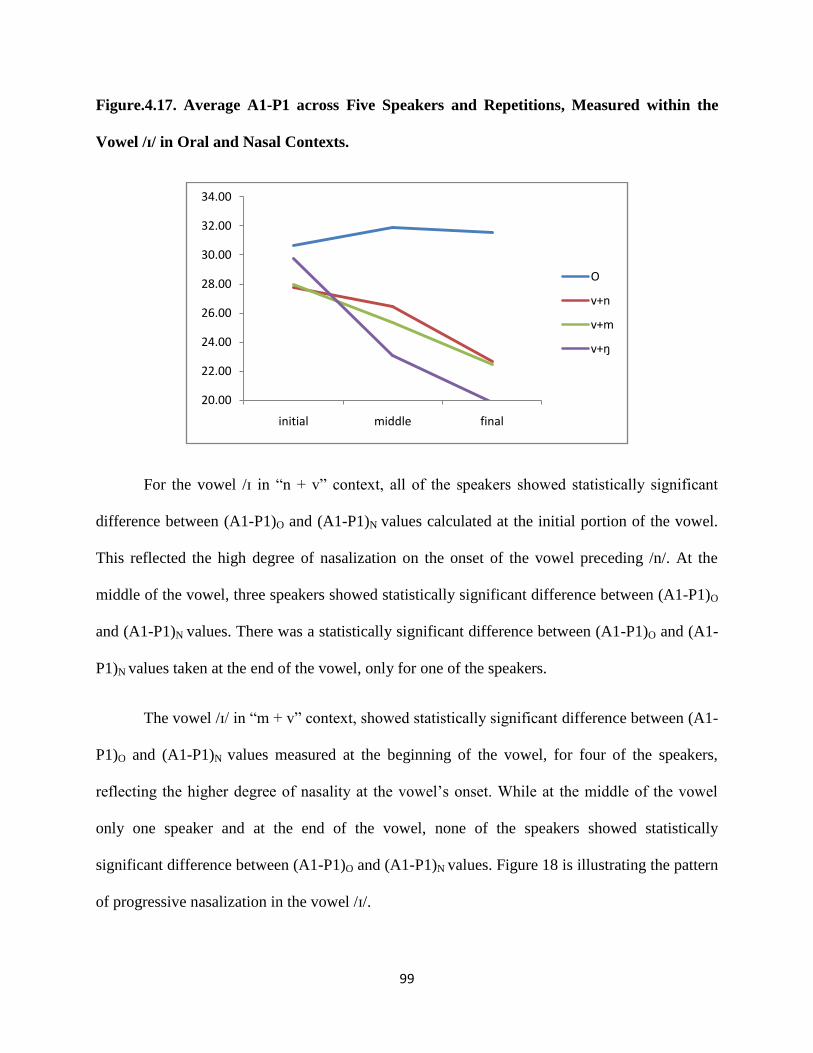
99
Figure.4.17. Average A1-P1 across Five Speakers and Repetitions, Measured within the
Vowel /ɪ/ in Oral and Nasal Contexts.
For the vowel /ɪ in “n + v” context, all of the speakers showed statistically significant
difference between (A1-P1)O and (A1-P1)N values calculated at the initial portion of the vowel.
This reflected the high degree of nasalization on the onset of the vowel preceding /n/. At the
middle of the vowel, three speakers showed statistically significant difference between (A1-P1)O
and (A1-P1)N values. There was a statistically significant difference between (A1-P1)O and (A1-
P1)N values taken at the end of the vowel, only for one of the speakers.
The vowel /ɪ/ in “m + v” context, showed statistically significant difference between (A1-
P1)O and (A1-P1)N values measured at the beginning of the vowel, for four of the speakers,
reflecting the higher degree of nasality at the vowel’s onset. While at the middle of the vowel
only one speaker and at the end of the vowel, none of the speakers showed statistically
significant difference between (A1-P1)O and (A1-P1)N values. Figure 18 is illustrating the pattern
of progressive nasalization in the vowel /ɪ/.
20.00
22.00
24.00
26.00
28.00
30.00
32.00
34.00
initial middle final
O
v+n
v+m
v+ŋ

100
Figure.4.18. Average A1-P1 across Five Speakers and Repetitions, Measured within the
Vowel /ɪ/ in Oral and Nasal Contexts.
4.2.3. /ɒ/ Vowel
For the vowel /ɒ/ in “v + n” context, none of the speakers showed statistically significant
difference between (A1-P0)O and (A1-P0)N values, measured at the initial portion of the vowel.
At the middle of the vowel, four of the speakers showed statistically significant difference
between the values of (A1-P0)O and (A1-P0)N. At the end of the vowel in “v + n” context, there
was a significant difference between (A1-P0)O and (A1-P0)N values, for all of the speakers,
depicting the greater effect of nasal consonant on the offset of the vowel.
The vowel /ɒ/ in “v + m” context, did not show statistically significance difference
between (A1-P0)O and (A1-P0)N values measured at the beginning of the vowel, for any speaker.
At the middle of the vowel, there was a statistically significant difference between the values of
(A1-P0)O and (A1-P0)N, for two of the speakers. While at the end of the vowel, three of the
20.00
22.00
24.00
26.00
28.00
30.00
32.00
34.00
initial middle final
O
n+v
m+v

101
speakers showed statistically significant difference between (A1-P0)O and (A1-P0)N values,
indicating the influence of contextual nasality on the vowel.
For the vowel /ɒ/ in “v + ŋ” context, none of the speakers showed statistically significant
difference between (A1-P0)O and (A1-P0)N values, taken at the beginning of the vowel. At the
middle of the vowel, three speakers showed statistically significant difference between (A1-P0)O
and (A1-P0)N values. While at the final portion of the vowel /ɒ/ in “v + ŋ” context, four of the
speakers showed statistically significant difference between the values of (A1-P0)O and (A1-
P0)N.
The values for (A1-P0)O and (A1-P0)N averaged across speakers, measured at the three
locations within the vowel / ɒ / to study regressive nasalization, are given in figure 19. While the
average (A1-P0)O and (A1-P0)N values at the initial, middle and end of the vowel for given
speakers are stated in appendix B.
Figure.4.19. Average A1-P0 across Five Speakers and Repetitions, Measured within the
Vowel /ɒ/ in Oral and Nasal Contexts.
0.00
2.00
4.00
6.00
8.00
10.00
12.00
14.00
16.00
initial middle final
O
v+n
v+m
v+ŋ

102
For the vowel /ɒ/ in “n + v” context, four of the vowels showed statistically significant
difference (A1-P0)O and (A1-P0)N values measured at the initial portion of the vowel. This
reflected the great degree of nasality at the onset of the vowel preceding nasal consonant /n/. At
the middle of the vowel in “n + v” context, only one speaker showed statistically significant
difference between the values of (A1-P0)O and (A1-P0)N. None of the speakers showed
statistically significant difference between (A1-P0)O and (A1-P0)N values taken at the end of the
vowel, reflecting that the nasality feature is not much dominant at the onset of the vowel.
At the initial portion of the vowel /ɒ/ in “m + v” context, four of the speakers showed
statistically significant difference between (A1-P0)O and (A1-P0)N values (see figure 20). At the
middle of the vowel, one of the speakers showed statistically significant difference between (A1-
P0)O and (A1-P0)N values. While for the final portion of the vowel in “m + v” context, none of
the speakers showed statistically significant difference between (A1-P0)O and (A1-P0)N values.
Figure.4.20. Average A1-P0 across Five Speakers and Repetitions, Measured within the
Vowel /ɒ/ in Oral and Nasal Contexts.
0
2
4
6
8
10
12
14
16
initial middle final
O
n+v
m+v

103
4.2.4. /ᴧ/ Vowel
For the vowel /ᴧ/ in “v + n” context, two of the speakers showed statistically significant
difference between (A1-P0)O and (A1-P0)N values, taken at the initial portion of the vowel. At
the middle of the vowel, three of the speakers showed statistically significant difference between
(A1-P0)O and (A1-P0)N values. While at the end of the vowel, four of the speakers showed
statistically significant difference between (A1-P0)O and (A1-P0)N values. This reflected the
influence of nasality more on the offset and the middle of the vowel than its onset, following
nasal consonant.
There was a statistically significant difference between (A1-P0)O and (A1-P0)N values at
the beginning of the vowel in “v + m” context, for two of the speakers. At the middle of the
vowel, three speakers showed statistically significant difference between the values of (A1-P0)O
and (A1-P0)N. While for the final portion of the vowel, all of the speakers showed statistically
significant difference between (A1-P0)O and (A1-P0)N values. So the nasality effect was more
prominent on the offset of the vowel.
For the vowel /ᴧ/ in “v + ŋ” context, one of the speakers showed statistically significant
difference between the values of (A1-P0)O and (A1-P0)N, take at the initial portion of the vowel.
At the middle of the vowel, three speakers showed statistically significant difference between
(A1-P0)O and (A1-P0)N values. While for the end of the vowel, four speakers showed statistically
significant difference between (A1-P0)O and (A1-P0)N values, reflecting the less influence of
nasality at the onset of vowel and more influence on the middle and the end of the vowel (see
figure 21). The values of (A1-P0)O and (A1-P0)N measured at three locations initial, middle and
beginning of vowel for given speakers are illustrated in appendix B.

104
Figure.4.21. Average A1-P0 across Five Speakers and Repetitions, Measured within the
Vowel /ᴧ/ in Oral and Nasal Contexts.
For the vowel /ᴧ/ in “n + v” context, all the speakers showed statistically significant
difference between (A1-P0)O and (A1-P0)N values, taken at the initial portion of the vowel. At
the middle of the vowel, four speakers showed statistically significant difference between (A1-
P0)O and (A1-P0)N values. While at the end of the vowel, there was a statistically significant
difference between (A1-P0)O and (A1-P0)N values, for two of the speakers.
At the initial portion of the vowel /ᴧ/ in “m + v” context, all speakers showed
statistically significant difference between (A1-P0)O and (A1-P0)N values. At the middle of the
vowel, two speakers showed statistically significant difference between the values of (A1-P0)O
and (A1-P0)N. While for the final portion of the vowel, none of the speakers showed statistically
significant difference between (A1-P0)O and (A1-P0)N values. This reflected the greater nasality
influence on the onset of vowel preceding /m/. Figure 22 mirrors the pattern of progressive
nasalization in /ᴧ/ vowel.
0.00
2.00
4.00
6.00
8.00
10.00
12.00
14.00
initial middle final
O
v+n
v+m
v+ŋ

105
Figure.4.22. Average A1-P0 across Five Speakers and Repetitions, Measured within the
Vowel /ᴧ/ in Oral and Nasal Contexts
For English vowels, the values of Δ(A1-P0) for the low and mid vowels and Δ(A1-P1)
for the high vowel were calculated. Δ(A1-P0) was the difference between the average of (A1-
P0)O and the average of (A1-P0)N. while Δ(A1-P1) was the difference between the average of
(A1-P1)O and the average of (A1-P1)N.
For the initial portion of the vowels in “v + n” context, the mean for Δ(A1-P0) ranged
from 1 db to 2 db with the minima ranging from -3 db to 0 db and the maxima ranging from 4 db
to 6 db. The Δ(A1-P1) was 3 db with the minima of -2 db and the maxima of 9 db. The values
for Δ(A1-P0) and Δ(A1-P1) calculated at the initial portion of vowels in “v + n” context, are
given in table 4.20.
0
2
4
6
8
10
12
14
initial middle final
O
n+v
m+v
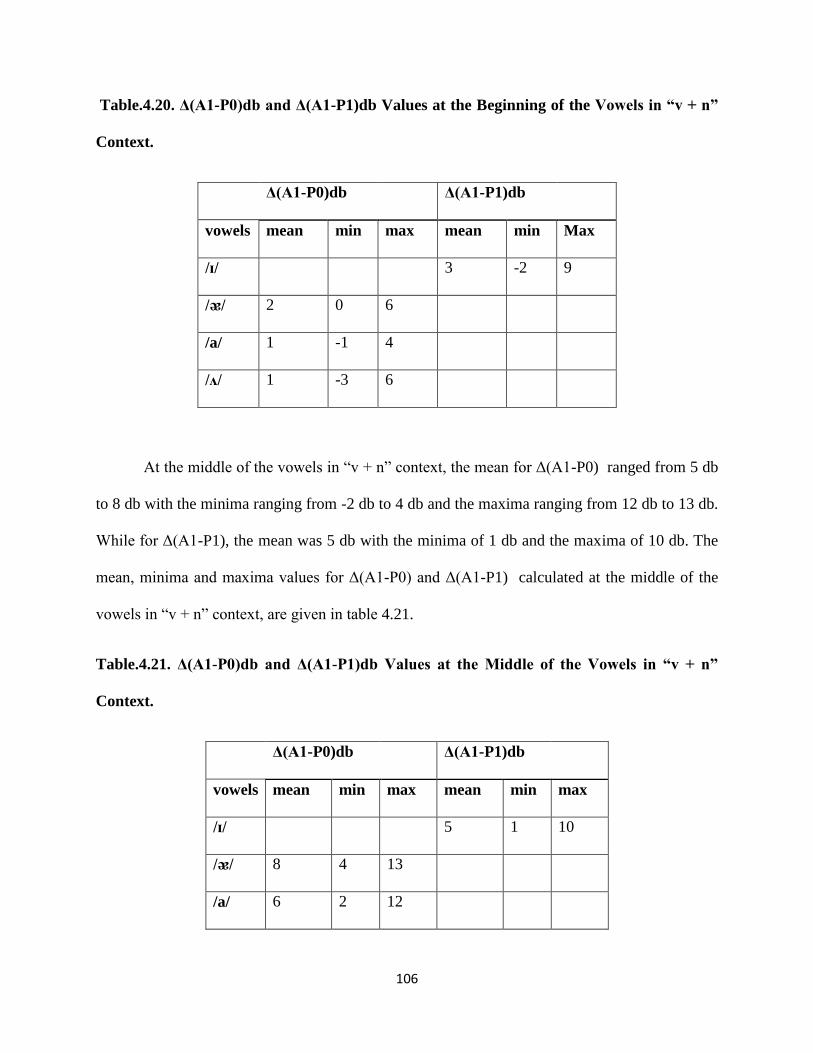
106
Table.4.20. Δ(A1-P0)db and Δ(A1-P1)db Values at the Beginning of the Vowels in “v + n”
Context.
Δ(A1-P0)db Δ(A1-P1)db
vowels mean min max mean min Max
/ɪ/
3 -2 9
/ᴂ/ 2 0 6
/a/ 1 -1 4
/ᴧ/ 1 -3 6
At the middle of the vowels in “v + n” context, the mean for Δ(A1-P0) ranged from 5 db
to 8 db with the minima ranging from -2 db to 4 db and the maxima ranging from 12 db to 13 db.
While for Δ(A1-P1), the mean was 5 db with the minima of 1 db and the maxima of 10 db. The
mean, minima and maxima values for Δ(A1-P0) and Δ(A1-P1) calculated at the middle of the
vowels in “v + n” context, are given in table 4.21.
Table.4.21. Δ(A1-P0)db and Δ(A1-P1)db Values at the Middle of the Vowels in “v + n”
Context.
Δ(A1-P0)db Δ(A1-P1)db
vowels mean min max mean min max
/ɪ/ 5 1 10
/ᴂ/ 8 4 13
/a/ 6 2 12

107
/ᴧ/ 5 -2 12
For the vowels in “v + m” context, the mean for Δ(A1-P0) calculated at the end of the
vowels, ranged from 5 db to 9 db with the minima ranging from 0 db to 5 db and the maxima
ranging from 12 db to 16 db. While the mean for Δ(A1-P1) was 9 db with the minima of 4 db
and the maxima of 15 db (see table 4.22).
Table.4.22. Δ(A1-P0)db and Δ(A1-P1)db Values at the End of the Vowels in “v + n”
Context.
Δ(A1-P0)db Δ(A1-P1)db
vowels mean min max mean min max
/ɪ/ 9 4 15
/ᴂ/ 7 1 12
/a/ 9 5 16
/ᴧ/ 5 0 15
The mean for Δ(A1-P0) calculated at the initial portion of the vowels in “v + m” context,
was in the range of -1 db to 4 db with the minima ranging from -3 db to 3 db and the maxima
ranging from 0 db to 6 db. While the mean for Δ(A1-P1), was 3 db with -2 db minima and 13 db
maxima. The values of Δ(A1-P0) and Δ(A1-P1) calculated at the beginning of the vowels in “v +
m” context, are stated in table 4.23.

108
Tablee.4.23. Δ(A1-P0)db and Δ(A1-P1)db Values at the Beginning of the Vowels in “v + m”
Context.
Δ(A1-P0)db Δ(A1-P1)db
vowels Mean min max mean min max
/ɪ/ 3 -2 13
/ᴂ/ 1 0 5
/a/ -1 -3 0
/ᴧ/ 4 3 6
At the middle of the vowels in “v + m” context, the mean for Δ(A1-P0) ranged from 5 db
to 6 db with the minima ranging from 2 db to 4 db and the maxima ranging from 10 db to 12 db.
For Δ(A1-P1), the mean was 7 db with the minima of 2 db and the maxima of 12 db. The values
for the vowels in “v + m” context calculated at the middle of the vowel, are given in table 4.24.
Table.4.24. Δ(A1-P0)db and Δ(A1-P1)db Values at the Middle of the Vowels in “v + m”
Context.
Δ(A1-P0)db Δ(A1-P1)db
vowels mean Min max mean min max
/ɪ/ 7 2 12
/ᴂ/ 6 3 12
/a/ 5 2 10
/ᴧ/ 6 4 11

109
The values for Δ(A1-P0)db and Δ(A1-P1) calculated at the end of the vowels in “v + m”
context, are given in table 4.25. For Δ(A1-P0), the mean ranged from 6 db to 8 db with the
minima ranging from 2 db to 5 db and the maxima ranging from 11 db to 14 db. While the mean
for Δ(A1-P1), was 9 db with the minima of 5 db and the maxima of 12 db.
Table.4.25. Δ(A1-P0)db and Δ(A1-P1)db Values at the End of the Vowels in “v + m”
Context.
Δ(A1-P0)db
Δ(A1-P1)db
vowels Mean min max mean min max
/ɪ/
9 5 12
/ᴂ/ 8 5 11
/a/ 6 2 11
/ᴧ/ 8 3 14
For the vowels in “v + ŋ” context, the mean for Δ(A1-P0) calculated at the initial portion
of the vowels ranged from 2 db to 3 db with the minima ranging from 0 db to 0 db and the
maxima ranging from 3 db to 6 db. While the mean for Δ(A1-P1), was 1 db with the minima of -
2 db and the maxima of 5 db. The values for Δ(A1-P0) and Δ(A1-P1) calculated at the beginning
of the vowels in “v + ŋ” context, are stated in table 4.26.

110
Table.4.26. Δ(A1-P0)db and Δ(A1-P1)db Values at the Beginning of the Vowels in “v + ŋ”
Context.
Δ(A1-P0)db Δ(A1-P1)db
vowels Mean min max mean min max
/ɪ/ 1 -2 5
/ᴂ/ 3 0 6
/a/ 2 0 3
/ᴧ/ 2 0 4
At the middle of the vowels in “v + ŋ” context, the mean for Δ(A1-P0) ranged from 4 db
to 7 db. For Δ(A1-P0), the minima ranged from 0 db to 4 db and the maxima ranged from 8 db to
10 db. Whereas for Δ(A1-P1), the mean was 9 db with the minima of 3 db and the maxima of 16
db. The values for Δ(A1-P0) and Δ(A1-P1) considered in the middle of vowels in “v + ŋ”
context, are given in table 4.27.
Table.4.27. Δ(A1-P0)db and Δ(A1-P1)db Values at the Middle of the Vowels in “v + ŋ”
Context.
Δ(A1-P0)db Δ(A1-P1)db
vowels mean min max Mean min max
/ɪ/ 9 3 16
/ᴂ/ 7 4 10
/a/ 4 0 8

111
/ᴧ/ 5 1 9
For the vowels in “v + ŋ” context the mean for Δ(A1-P0) calculated at the final portion of
the vowels ranged from 7 db to 9 db with the minima ranging from 4 db to 4 db and the maxima
ranging from 10 db to 13 db. The mean for Δ(A1-P1) was 12 db with the minima of 6 db and the
maxima of 18 db. The mean with minima and maxima values for Δ(A1-P0)db and Δ(A1-P1)
calculated at the final portion of vowels in “v + ŋ” context, are stated in table 4.28.
Table.4.28. Δ(A1-P0)db and Δ(A1-P1)db Values at the End of the Vowels in “v + ŋ”
Context.
Δ(A1-P0)db Δ(A1-P1)db
vowels Mean min max mean min Max
/ɪ/ 12 6 18
/ᴂ/ 9 4 12
/a/ 8 4 10
/ᴧ/ 7 4 13
For the vowels in “n + v” context, the mean calculated at the beginning of the vowels
ranged from 5 db to 8 db with the minima ranging from 1 db to 4 db and the maxima ranging
from 7 db to 14 db. While the mean for Δ(A1-P1) was 10 db with the minima of 5 db and the
maxima of 15 db.(see table 4.29)
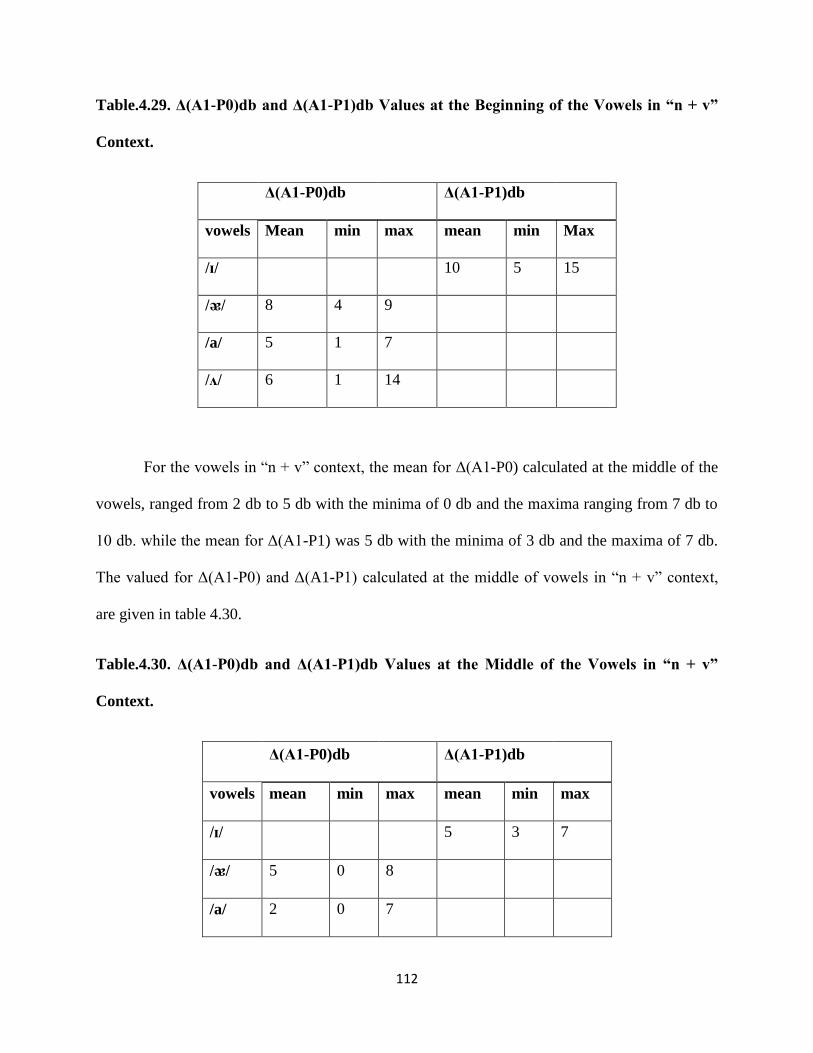
112
Table.4.29. Δ(A1-P0)db and Δ(A1-P1)db Values at the Beginning of the Vowels in “n + v”
Context.
Δ(A1-P0)db Δ(A1-P1)db
vowels Mean min max mean min Max
/ɪ/ 10 5 15
/ᴂ/ 8 4 9
/a/ 5 1 7
/ᴧ/ 6 1 14
For the vowels in “n + v” context, the mean for Δ(A1-P0) calculated at the middle of the
vowels, ranged from 2 db to 5 db with the minima of 0 db and the maxima ranging from 7 db to
10 db. while the mean for Δ(A1-P1) was 5 db with the minima of 3 db and the maxima of 7 db.
The valued for Δ(A1-P0) and Δ(A1-P1) calculated at the middle of vowels in “n + v” context,
are given in table 4.30.
Table.4.30. Δ(A1-P0)db and Δ(A1-P1)db Values at the Middle of the Vowels in “n + v”
Context.
Δ(A1-P0)db Δ(A1-P1)db
vowels mean min max mean min max
/ɪ/ 5 3 7
/ᴂ/ 5 0 8
/a/ 2 0 7

113
/ᴧ/ 5 0 10
At the final portion of vowels in “n + v” context, the mean for Δ(A1-P0) ranged from 0
db to 2 db with the minima ranging from -2 db to 0 db and the maxima ranging from 4 db to 6
db. While the mean for Δ(A1-P1) was 3 db with the minima of 0 db and the maxima of 6 db. the
values for Δ(A1-P0) and Δ(A1-P1) at the end of the vowels in “n + v” context, are illustrated in
table 4.31.
Table.4.31. Δ(A1-P0)db and Δ(A1-P1)db Values at the End of the Vowels in “n + v”
Context.
Δ(A1-P0)db Δ(A1-P1)db
vowels mean min max mean min max
/ɪ/ 3 0 6
/ᴂ/ 0 -2 4
/a/ 2 0 5
/ᴧ/ 1 -2 6
For the vowels in “m + v” context, the mean for Δ(A1-P0) calculated at the initial portion
of the vowels, ranged from 3 db to 7 db with the minima ranging from -1 db to 5 db and the
maxima ranging from 5 db to 11 db. While the mean for Δ(A1-P1) was 8 db with the minima of
6 db and the maxima of 13 db. (see table 4.32)

114
Table.4.32. Δ(A1-P0)db and Δ(A1-P1)db Values at the Beginning of the Vowels in “m + v”
Context.
Δ(A1-P0)db Δ(A1-P1)db
vowels mean min max mean min max
/ɪ/ 8 6 13
/ᴂ/ 7 5 11
/a/ 3 -1 5
/ᴧ/ 6 1 11
At the middle of the vowels in “m + v” context, the mean for Δ(A1-P0) ranged from 2 db
to 5 db with the minima ranging from -2 db to 1 db and the maxima ranging from 5 db to 9 db.
For Δ(A1-P1), the mean was 6 db with the minima of 3 db and the maxima of 10 db. The values
for Δ(A1-P0)db and Δ(A1-P1) counted at the middle of the vowels in “m + v” context, are given
in table 4.33.
Table.4.33. Δ(A1-P0)db and Δ(A1-P1)db Values at the Middle of the Vowels in “m + v”
Context.
Δ(A1-P0)db Δ(A1-P1)db
vowels mean min max mean min max
/ɪ/ 6 3 10
/ᴂ/ 5 -2 8
/a/ 2 1 9

115
/ᴧ/ 3 -1 5
For the vowels in “m + v” context, the mean 0f Δ(A1-P0) calculated at the end of the
vowels ranged from 0 db to 1 db with the minima of -1 db to -2 db and the maxima ranging from
2 db to 3 db. While the mean for Δ(A1-P1) was 1 db with -1 db minima and 3 db maxima.(see
table 4.34)
Table.4.34. Δ(A1-P0)db and Δ(A1-P1)db Values at the End of the Vowels in “m + v”
Context.
Δ(A1-P0)db Δ(A1-P1)db
vowels mean min max mean min max
/ɪ/ 1 -1 3
/ᴂ/ 0 -1 2
/a/ 1 0 3
/ᴧ/ 0 -2 3
The average (A1-P0) across five speakers and the vowels illustrated the direction of
nasalization very clearly in English produced by Punjabi speakers (see figure 23). The vowels
showed greater degree of nasalization at their onset when they occur after the nasal consonant.
This reflected the progressive nasality adapted by the context. On the other hand, the vowels
showed greater degree of nasality at their off sets when they occur before nasal consonant. This
reflected the regressive nasalization.

116
Figure.4.23. Average (A1-P0) across Vowels /a, ᴧ, ᴂ /and Speakers (Five)
The average (A1-P1) across five speakers for /ɪ/ vowel showed the similar direction of
nasalization as the average of (A1-P0) illustrated (see figure 4.24). The vowels showed much
degree of nasalization at their onset while preceding nasal consonant, reflecting the progressive
nasality adapted by the context. On the other hand, the vowels showed greater degree of nasality
at their off sets while following nasal consonant, depicting regressive nasalization.
0.00
2.00
4.00
6.00
8.00
10.00
12.00
14.00
initial middle final
O
N(v+n)
N(v+m)
N(v+ŋ)
N(n+v)
N(m+v)
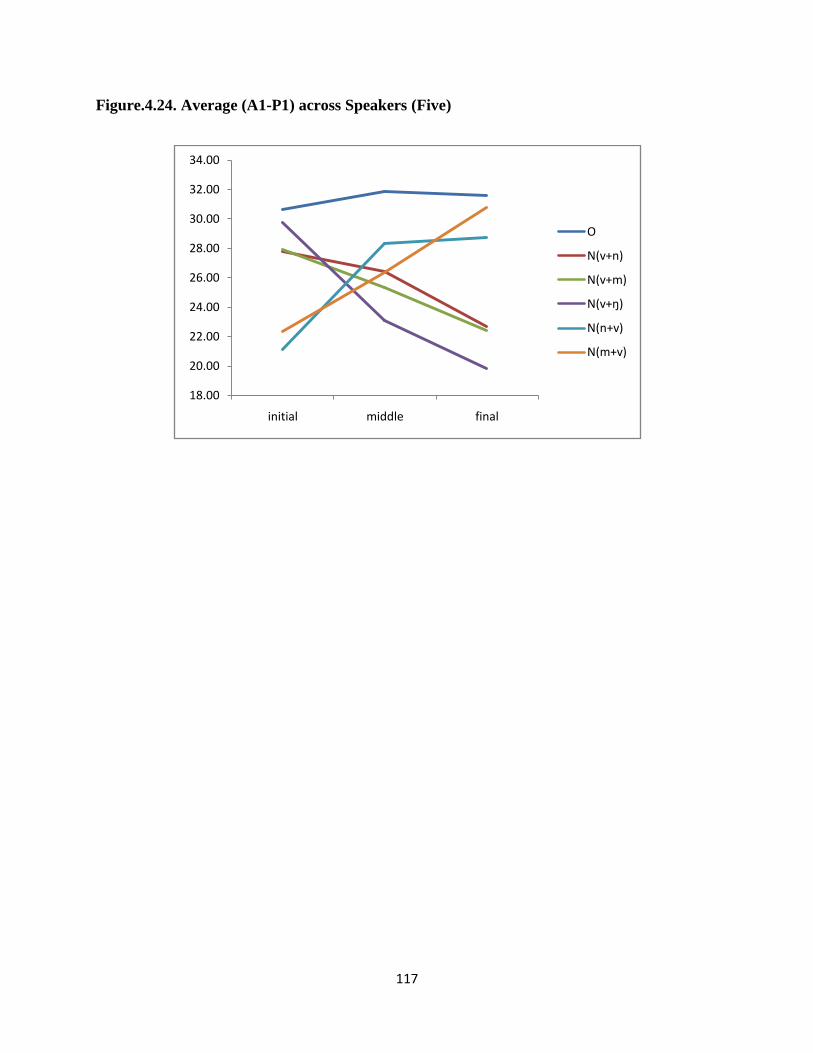
117
Figure.4.24. Average (A1-P1) across Speakers (Five)
18.00
20.00
22.00
24.00
26.00
28.00
30.00
32.00
34.00
initial middle final
O
N(v+n)
N(v+m)
N(v+ŋ)
N(n+v)
N(m+v)
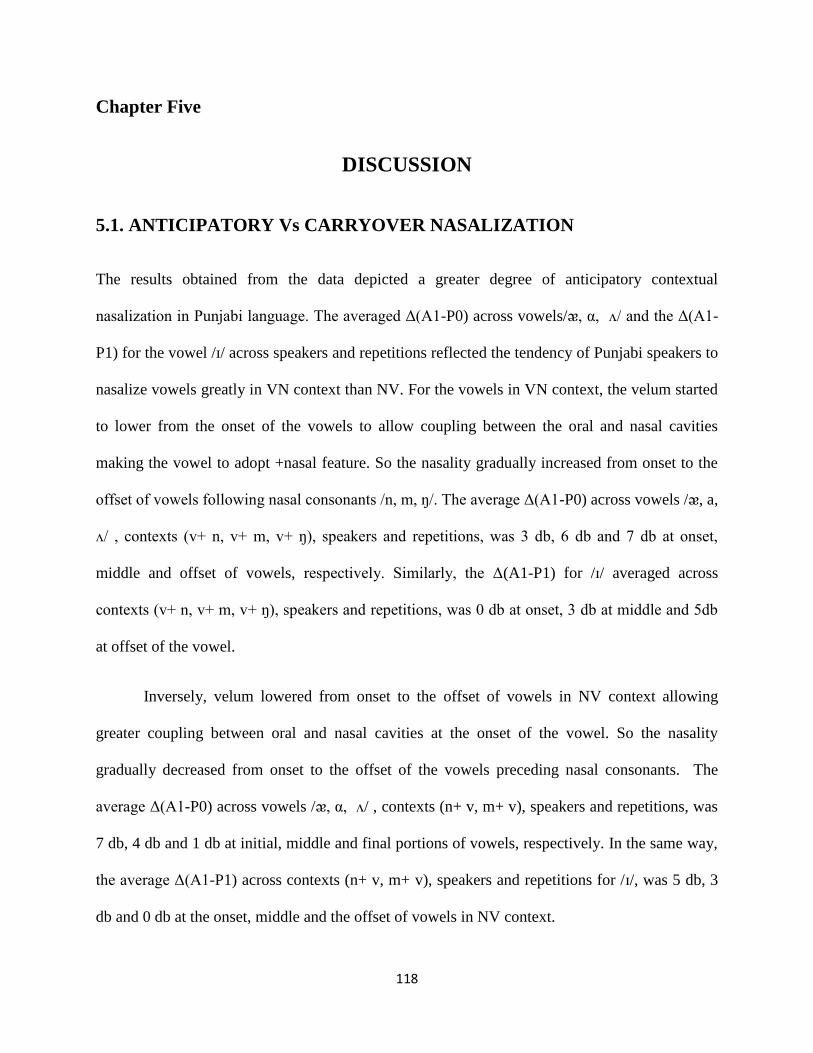
118
Chapter Five
DISCUSSION
5.1. ANTICIPATORY Vs CARRYOVER NASALIZATION
The results obtained from the data depicted a greater degree of anticipatory contextual
nasalization in Punjabi language. The averaged Δ(A1-P0) across vowels/ᴂ, α, ᴧ/ and the Δ(A1-
P1) for the vowel /ɪ/ across speakers and repetitions reflected the tendency of Punjabi speakers to
nasalize vowels greatly in VN context than NV. For the vowels in VN context, the velum started
to lower from the onset of the vowels to allow coupling between the oral and nasal cavities
making the vowel to adopt +nasal feature. So the nasality gradually increased from onset to the
offset of vowels following nasal consonants /n, m, ŋ/. The average Δ(A1-P0) across vowels /ᴂ, a,
ᴧ/ , contexts (v+ n, v+ m, v+ ŋ), speakers and repetitions, was 3 db, 6 db and 7 db at onset,
middle and offset of vowels, respectively. Similarly, the Δ(A1-P1) for /ɪ/ averaged across
contexts (v+ n, v+ m, v+ ŋ), speakers and repetitions, was 0 db at onset, 3 db at middle and 5db
at offset of the vowel.
Inversely, velum lowered from onset to the offset of vowels in NV context allowing
greater coupling between oral and nasal cavities at the onset of the vowel. So the nasality
gradually decreased from onset to the offset of the vowels preceding nasal consonants. The
average Δ(A1-P0) across vowels /ᴂ, α, ᴧ/ , contexts (n+ v, m+ v), speakers and repetitions, was
7 db, 4 db and 1 db at initial, middle and final portions of vowels, respectively. In the same way,
the average Δ(A1-P1) across contexts (n+ v, m+ v), speakers and repetitions for /ɪ/, was 5 db, 3
db and 0 db at the onset, middle and the offset of vowels in NV context.
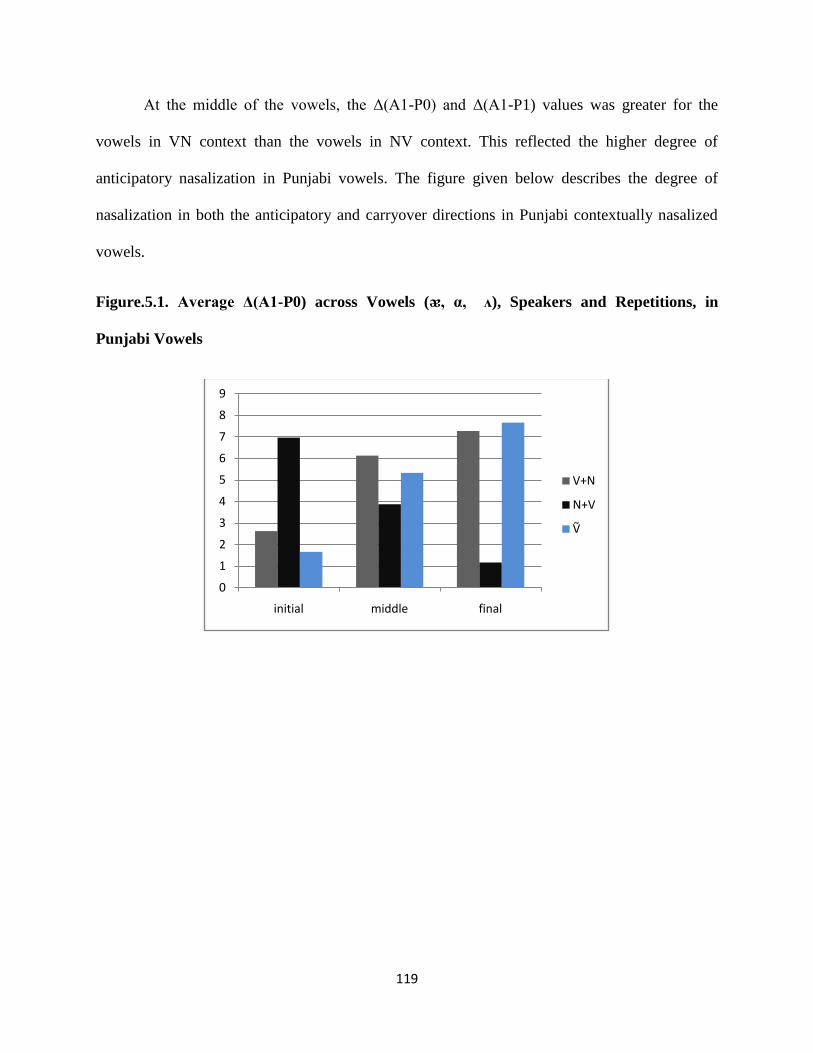
119
At the middle of the vowels, the Δ(A1-P0) and Δ(A1-P1) values was greater for the
vowels in VN context than the vowels in NV context. This reflected the higher degree of
anticipatory nasalization in Punjabi vowels. The figure given below describes the degree of
nasalization in both the anticipatory and carryover directions in Punjabi contextually nasalized
vowels.
Figure.5.1. Average Δ(A1-P0) across Vowels (ᴂ, α, ᴧ), Speakers and Repetitions, in
Punjabi Vowels
0
1
2
3
4
5
6
7
8
9
initial middle final
V+N
N+V
Ṽ

120
Figure.5.2.Average Δ(A1-P1) across Speakers and Repetitions for Punjabi Vowel /ɪ/
The contrastively nasal vowels /ᴂ/, /α/, /ᴧ/ and /ɪ/ in Punjabi showed the tendency of
containing higher degree of nasalization at the offset. Nasality increased gradually from onset to
the offset of contrastively nasal vowels. The average Δ(A1-P0) across vowels /ᴂ, α, ᴧ/, speakers
and repetitions, was 2db, 5 db and 8 db at the onset, middle and offset of the vowels,
respectively. Similarly, the average Δ(A1-P1) across speakers and repetitions for /ɪ/, was 2 db, 7
db and 7 db at the onset, middle and the offset of vowel. This reflected that the velum lowed
gradually from onset to offset.
For Pakistani English vowels in VN context, the average Δ (A1-P0) across vowels /ᴂ, ɒ,
ᴧ/, contexts (v+ n, v+ m, v+ ŋ), speakers and repetitions, was 2 db, 6 db and 7 db on the onset,
middle and the offset of the vowels, respectively. Similarly, the average Δ (A1-P1) across
speakers, repetitions and contexts (v+ n, v+ m, v+ ŋ) for /ɪ/, was 2 db at onset, 7 db at middle and
10 db at the offset of vowel. This reflected that the velum lowered gradually from onset to the
offset of the vowels in VN context, allowing coupling between the nasal and oral cavities while
0
1
2
3
4
5
6
7
8
initial middle final
V+N
N+V
Ṽ
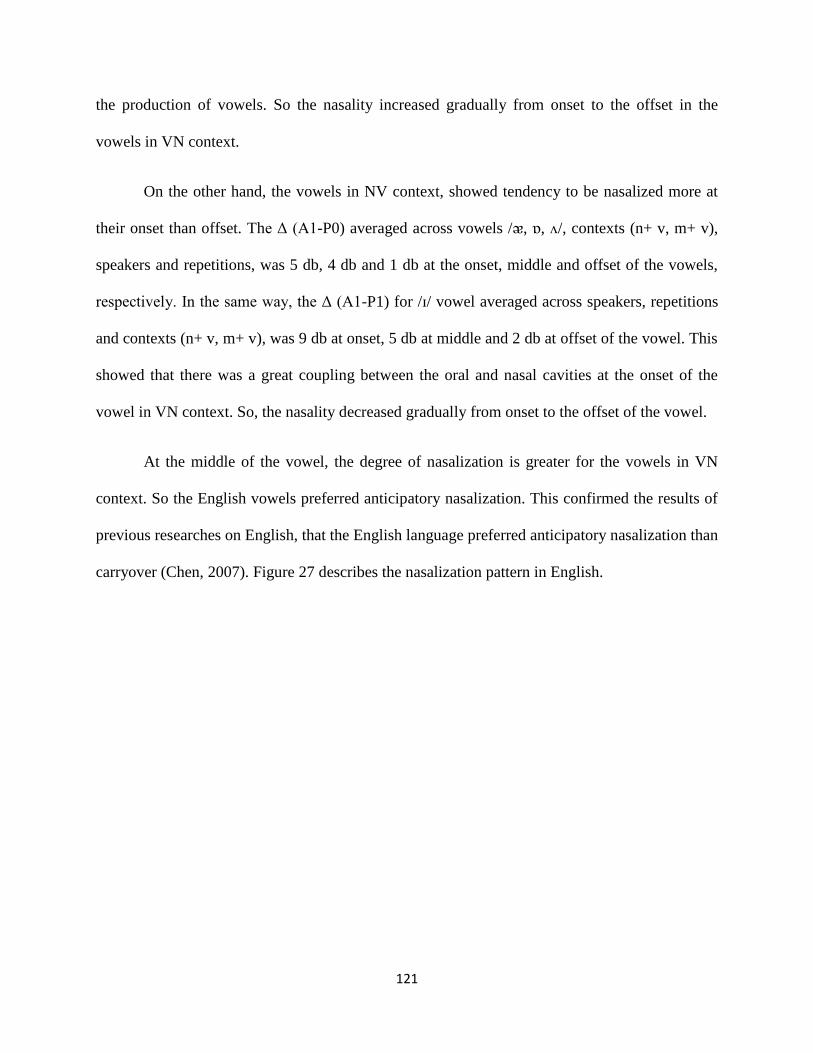
121
the production of vowels. So the nasality increased gradually from onset to the offset in the
vowels in VN context.
On the other hand, the vowels in NV context, showed tendency to be nasalized more at
their onset than offset. The Δ (A1-P0) averaged across vowels /ᴂ, ɒ, ᴧ/, contexts (n+ v, m+ v),
speakers and repetitions, was 5 db, 4 db and 1 db at the onset, middle and offset of the vowels,
respectively. In the same way, the Δ (A1-P1) for /ɪ/ vowel averaged across speakers, repetitions
and contexts (n+ v, m+ v), was 9 db at onset, 5 db at middle and 2 db at offset of the vowel. This
showed that there was a great coupling between the oral and nasal cavities at the onset of the
vowel in VN context. So, the nasality decreased gradually from onset to the offset of the vowel.
At the middle of the vowel, the degree of nasalization is greater for the vowels in VN
context. So the English vowels preferred anticipatory nasalization. This confirmed the results of
previous researches on English, that the English language preferred anticipatory nasalization than
carryover (Chen, 2007). Figure 27 describes the nasalization pattern in English.
122
Figure.5.3.Average Δ(A1-P0) across Vowels /ᴂ, ɒ, ᴧ/, Speakers and Repetitions, in English
Vowels
Figure.5.4. Average Δ(A1-P1) across Speakers and Repetitions for English Vowel /ɪ/
0
1
2
3
4
5
6
7
8
initial middle final
V+N
N+V
0
1
2
3
4
5
6
7
8
9
10
11
initial middle final
V+N
N+V

123
During the production of English sounds, the Punjabi speakers follow the tradition of the
native English speakers to nasalize vowels more in anticipatory direction than carryover. As they
have the same pattern in their L1 (Punjabi), so they made no exception.
5.2. CONTRASTIVE Vs CONTEXTUAL NASALIZATION
In Punjabi, the contrastively nasal vowels did not show statistically significant difference from
contextually nasalized vowels, except /ɪ/. The contrastively nasal vowel /ɪ/ was depicting greater
degree of nasality than the contextually nasalized vowel /ɪ/. (see figure 28)
Figure.5.5. The Δ(A1-P0) and Δ(A1-P1) for Given Contextually Nasalized Vowels (V) of
Punjabi, Averaged across Speakers, Repetitions and Contexts (Regressive and
Progressive). The Δ(A1-P0) and Δ(A1-P1) for Given Contrastively Nasal Vowels (Ṽ),
Averaged across Speakers and Repetitions.
0
1
2
3
4
5
6
7
8
/ᴂ/ /a/ /ᴧ/ /ɪ/
V
Ṽ

124
Figure.5.6. The Δ(A1-P0) and Δ(A1-P1) for English Contextually Nasalized Vowels (V),
Averaged across Speakers, Repetitions and Contexts (Regressive and Progressive).
The Punjabi speakers nasalized the English vowel /ɪ/ with almost same degree of
nasalization as in the Punjabi contrastively nasal vowel /ɪ/. So the degree of nasality was greater
in Punjabi contrastively nasal vowel /ɪ/ and the English contextually nasalized vowel /ɪ/ than the
Punjabi contextually nasalized vowel /ɪ/.
For the other two vowels / ᴂ, ᴧ/, there were no significant difference between the degree
of nasality in the production of both Punjabi and English vowels. The speakers produced these
vowels with almost same degree of nasalization in both Pakistani English contextual and Punjabi
contrastive and contextual environments.
In Pakistani English, the speakers showed relatively greater nasality for the /ɪ/ and / ᴂ/
vowels than /ɒ/ and /ᴧ/ (see figure 29). In Punjabi, the /ᴂ/, / ᴂ/, /α/, /α/ and /ɪ/ vowels showed
0
1
2
3
4
5
6
7
/ᴂ/ /ɒ/ /ᴧ/ /ɪ/
V

125
relatively more degree of nasality than the others. The short vowel /ᴧ/ depicted relatively less
degree of nasalization both in English and Punjabi (see figure 84).
As for as the effect of nasal consonant on the following or preceding vowels was
concerned, all the three consonants /n, m, ŋ/ showed almost same effect on the vowel in Both
Pakistani English and Punjabi language (see figure 5.7).
Figure.5.7.Average Δ(A1-P1) and Δ(A1-P0) across Punjabi Vowels, Speakers and
Repetitions at the Middle of the Vowels.
0
1
2
3
4
5
6
v+n v+m v+ŋ n+v m+v

126
Figure.5.8.Average Δ(A1-P1) and Δ(A1-P0) across English Vowels, Speakers and
Repetitions at the Middle of the Vowels.
5.3. INDIVIDUAL DIFFERENCES IN THE DEGREE OF NASALIZATION
The acoustic effects of nasalization differ across different speakers and vowels as well. Speakers
differed on the basis of their velum lowering for the production of sounds. Different speakers
showed different tendencies to nasalize vowels.
During the production of Punjabi data, speaker WS showed velum lowering throughout
the vowels /α, ᴂ, ɪ / in v+ m context, as for these three vowels, there was a significant difference
between the measures taken at the onset, middle and the offset of vowels from the oral vowels.
This reflected that the vowels /α, ᴂ, ɪ / in v + m context was nasalized completely . He also
nasalized /α, ɪ/ throughout the vowels, as nasalization was distinct in all the measured portions of
the vowels.
0
1
2
3
4
5
6
v+n v+m v+ŋ n+v m+v
127
While for Pakistani English vowels, the speaker WS showed a greater velum lowering for
the vowel /ᴂ/ in v+ m context than the other contexts. Furthermore, he nasalized the English
vowel /ᴧ/ completely in v+ n, v+ m and v+ ŋ contexts. As the vowel /ᴧ/ showed the statistically
significant degree of nasalization at all the portions of vowel for the given speaker.
The speaker QA showed the tendency to completely nasalize the Punjabi vowel /α/ in v+
n, v +m and v+ ŋ contexts. He also nasalized /α/ throughout the vowel. The Punjabi vowel /ᴧ/ in
v+ ŋ context and the vowel /ᴂ/ in v+ n and v + m context showed the tendency to adopt nasality
throughout the vowel for the given speaker (QA). During the production of English speech, the
speaker QA nasalized the vowels /ᴧ, ᴂ / in n+ v context completely, reflecting a statistically
significant difference between (A1-P0)O and (A1-P0)N values measured at the three portions of
the vowels.
For Punjabi vowels, the speaker FA nasalized the vowels /α, ᴂ / in v+ n and v+ m
contexts completely, reflecting that the velum was lowered very earlier to allow coupling
between the nasal and oral cavities , making the vowel take on nasality from even its onset . FA
also nasalized the Punjabi vowel /α/ completely. On the other hand, he showed nasality effect for
the English vowel /ᴧ/ in n + v context, throughout the vowel.
The speaker MO nasalized the Punjabi vowel /α/ in v + ŋ context, the vowel /ᴧ/ in n + v
context, /ɪ/ in v+ m context, completely than the other contexts. Furthermore, he nasalized the
Pakistani English vowel /ᴧ/ in v+ m context, /ɪ/ in n+ v context, completely.
For the Pakistani English vowels, the speaker US did not nasalize any vowel in any
context throughout its length. So, different speakers showed variation in their velum opening for
the production of different vowels in different contexts.

128
There was also variation in taking on nasality for the vowels on the basis of different
speakers and vowel quality. For Pakistani English vowels, the speaker Ws showed greater degree
of nasality for the vowels / ᴧ, ᴂ, ɒ/. While the speaker QA nasalized /ɪ/ with a greater degree
than the other three vowels. The speaker FA nasalized /ɪ, ᴂ/ with higher degree than the other
two vowels. The speaker MO showed greater degree of nasalization for the vowel /ɪ/ than the
other three vowels. While the speaker US nasalized /ᴂ, ɒ/ with higher degree than the other two
vowels.
For Punjabi vowels, the speaker WS showed tendency to nasalize /ᴂ, ᴂ, ɪ/ with a great
degree than the other vowels . The speaker QA nasalized /α, α, ɪ/ vowels greatly as compared to
the other vowels. While the speaker FA showed a greater degree of nasality for /ᴂ, α, α/ vowels
and the speaker MO showed tendency to nasalize /ᴂ, ɪ/ vowels with a great degree than the other
vowels.
However, the speakers nasalized the long vowel /ᴂ/ in both Pakistani English and Punjabi
languages with a great degree . In Punjabi, long vowels /α, α, ᴂ, ᴂ/ showed greater nasality and
the nasal vowel / ɪ/ was also nasalized with higher degree as compared to the others. In English
and Punjabi, /ᴧ/ vowel was pronounced with the minimum degree of nasalization by all the
speakers except WS, he nasalized English vowel /ᴧ/ with higher degree.
5.4. Comparison of nasalization patterns in Punjabi, Pakistani English and
other varieties of English (AmE, Canadian)
This study depicted greater nasality in the high vowel /ɪ/ and the low vowel / ᴂ / of
English. It differed from the other verities of English as it showed the greater degree of nasality
in high and low both vowels. Generally, in American English, low vowels are more prone to

129
nasalization than high vowels (Bell- Berti, 1993; Krakow, 1995; Kluge, 2004). But in Canadian
English, high vowels were nasalized with greater degree as compared to the low vowels (Rochet
and Rochet, 1991).
The mean of Δ(A1-P0) ) measured at the middle of the vowels, ranged from 3 db to 7 db
for Punjabi (table 5.1) and from 4 db to 6 db for Pakistani English vowels (table 36). While the
mean of Δ(A1-P1) ) measured at the middle of the vowels, ranged from 3 db to 7 db for Punjabi
and was of 6db for Pakistani English. Punjabi speakers showed almost similar values of Δ(A1-
P0) and Δ(A1-P1) for Punjabi and English vowels.
Table.5.1.Average Δ(A1-P0) and Δ(A1-P1) across Speakers, Repetitions and Contexts
(Regressive, Progressive) in the Middle of Punjabi Vowels.
Δ(A1-P0)
Δ(A1-P1)
vowels Mean min. max. mean min. max.
/ɪ/
3 2 4
/ᴂ/ 6 4 9
/α/ 6 4 8
/ᴧ/ 3 2 5
/ɪ/
7 2 9
/ᴂ/ 5 3 8
/α/ 7 2 10
/ᴧ/ 4 1 6
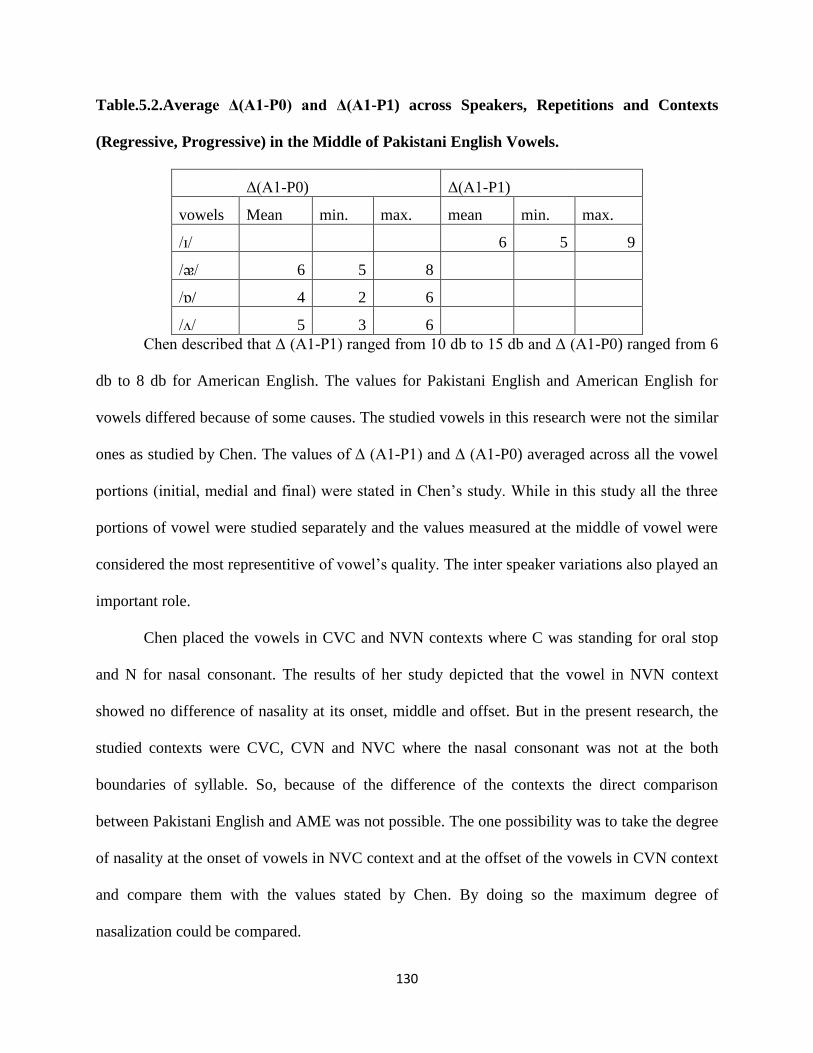
130
Table.5.2.Average Δ(A1-P0) and Δ(A1-P1) across Speakers, Repetitions and Contexts
(Regressive, Progressive) in the Middle of Pakistani English Vowels.
Δ(A1-P0) Δ(A1-P1)
vowels Mean min. max. mean min. max.
/ɪ/ 6 5 9
/ᴂ/ 6 5 8
/ɒ/ 4 2 6
/ᴧ/ 5 3 6
Chen described that Δ (A1-P1) ranged from 10 db to 15 db and Δ (A1-P0) ranged from 6
db to 8 db for American English. The values for Pakistani English and American English for
vowels differed because of some causes. The studied vowels in this research were not the similar
ones as studied by Chen. The values of Δ (A1-P1) and Δ (A1-P0) averaged across all the vowel
portions (initial, medial and final) were stated in Chen’s study. While in this study all the three
portions of vowel were studied separately and the values measured at the middle of vowel were
considered the most representitive of vowel’s quality. The inter speaker variations also played an
important role.
Chen placed the vowels in CVC and NVN contexts where C was standing for oral stop
and N for nasal consonant. The results of her study depicted that the vowel in NVN context
showed no difference of nasality at its onset, middle and offset. But in the present research, the
studied contexts were CVC, CVN and NVC where the nasal consonant was not at the both
boundaries of syllable. So, because of the difference of the contexts the direct comparison
between Pakistani English and AME was not possible. The one possibility was to take the degree
of nasality at the onset of vowels in NVC context and at the offset of the vowels in CVN context
and compare them with the values stated by Chen. By doing so the maximum degree of
nasalization could be compared.

131
As stated above, the analysis of data reflected that the Punjabi speakers showed greater
tendency to nasalize vowels in anticipatory direction while the production of English sounds.
Table 37 shows the maximum degree of nasalization in Pakistani English speakers’ speech. The
values measured at the offset of the Pakistani English vowels in CVN context were similar to
those of AME.
Table.5.3.Average Δ(A1-P0) Values for Pakistani English Vowels, Measured at the Offset
of the Vowels in CVN Context and at the Onset of the Vowels in NVC Context. The Values
are Averaged across Repetitions and Speakers.
Δ(A1-P0)
CVN NVC
vowels Mean Min Max mean Min Max
/ᴂ/ 8 5 12 7 5 10
/ᴧ/ 8 4 14 6 1 12
Table.5.4. Average Δ(A1-P0) Values stated by Chen (1997) for AME Vowels, averaged
across Repetitions and Speakers.
Δ(A1-P0)
Vowels Mean Min Max
/ᴂ/ 8 4 16
/ᴧ/ 8 4 13

132
Chapter Six
SUMMARY
This study analyzed the nasalization patterns in Punjabi and Pakistani English through acoustic
means. Punjabi is a language which has oral and nasal contrast for its vowels but English has
only oral vowels. So the contrastive and contextual nasalization in Punjabi and the contextual
nasalization in Pakistani English were studied. There is evidence in literature that the languages
having contrastive nasality may limit the amount of contextual nasalization. This study intended
to measure the amount of nasality in both contrastive and contextual environments in Punjabi
vowels. The presence or absence of nasalization in /Ṽ/, VN (vowel+nasal consonant) and NV
(nasal consonant+vowel) contexts, its degree and direction (anticipatory and carryover) were
identified. For this purpose, five native Punjabi speakers were selected to collect data. After
determining the degree and direction of nasality in Punjabi, the results were further compared to
the nasalization patterns of Pakistani English. For Pakistani English, the vowels were studied in
VN and NV contexts. They were compared to study the similarities and the differences between
nasalization patterns of the speakers’ L1 (Punjabi) and L2 (English).
The results of this study did not support the view that the nasality contrast for vowels
limits the degree of contextual nasality. All the Punjabi oral vowels in nasal environment (NV,
VN) showed almost the similar degree of nasalization as the nasal vowels, except /ɪ/. This vowel
showed the greater degree of nasality than its oral counterpart /ɪ/.
The results depicted a greater degree of nasality for regressive nasalization than the
progressive nasalization in both Punjabi and Pakistani English. In Pakistani English, there was a
relatively higher degree of nasality for the /ɪ/ and /ᴂ/ vowels than the /ɒ/ and /ᴧ/. In Punjabi, the

133
speakers showed relatively greater degree of nasalization for` /ᴂ/, / ᴂ/, /α/, /α/ and /ɪ/ vowels
than the others. The short vowel /ᴧ/ reflected relatively lesser degree of nasalization both in
Pakistani English and Punjabi language. The mean of Δ (A1-P1) for Pakistani English speakers
was 6 db and the mean of Δ(A1-P0) ranged from 4 db to 6 db. While, for American English, the
mean of Δ(A1-P1) ranged from 10 db to 15 db and Δ (A1-P0) ranged from 6 db to 8 db. As far as
the direction of nasalization was concerned, Pakistani English speakers used similar pattern of
nasalization as the American English speakers. But they differed from the American English
speakers on the basis of the degree of nasalization for the vowels of different quality. Pakistani
English speakers nasalized both low and high vowels greatly while AME show greater nasality
for low vowels.
REFERENCES

134
Al-Bamerni, A. H. A. (1983). Oral, velic and laryngeal coarticulation across languages.
University of Oxford.
Aoyama, K. (2003). Perception of syllable-initial and syllable-final nasals in English by Korean
and Japanese speakers. Second language research, 19(3), 251–265.
Basset, P., Amelot, A., Vaissière, J., & Roubeau, B. (2001). Nasal airflow in French spontaneous
speech. Journal of the International Phonetic Association, 31(1), 87-99.
Beddor, P. (1993). The perception of nasal vowels Phonetics and phonology: Nasals,
nasalization, and the velum (pp. 171-196): Academic press.
Beddor, P. S. (1991). Predicting the structure of phonological systems. Phonetica, 48(2-4), 83-
107.
Beddor, P. S., & Krakow, R. A. (1999). Perception of coarticulatory nasalization by speakers of
English and Thai: Evidence for partial compensation. Acoustical society of America,
106(5), 2868-2887.
Beddor, P. S., Krakow, R. A., & Goldstein, L. M. (1986). Perceptual constraints and
phonological change: a study of nasal vowel height. Phonology Yearbook, 3, 197-217.
Bell-Berti, F. (1993). Understanding velic motor control: studies of segmental context. Phonetics
and Phonology, 5, 63-85.
Berger, M. A. (2007). Measurement of vowel nasalization by multi-dimensional acoustic
analysis. University of Rochester.
Best, C. T., Mcroberts, G. W. & Goodell, E. (2001). Discrimination of non-native consonant
contrasts varying in perceptual assimilation to the listener’s native phonological system.
Acoustical society of America, 109(2), 775-794.
Best, C. T., & Tyler, M. D. (2007). Nonnative and second-language speech perception:

135
Commonalities and complementarities. In O.-S. Bohn & M. J. Munro (Eds.), Language
experience in second language speech learning: in honor of James Emil Flege (pp. 13-
34): John Benjamins publishing company.
Bhatia, T. K. (2009). Punjabi Concise Encyclopedia of languages of the World (pp. 885-890):
Elsevier Ltd.
Boltan, k. (2004). World Englishes The handbook of applied linguistics (pp. 367-396): Wiley-
Blackwell.
Bradlow, A. R. (2002). Confluent talker- and listener-related forces in clear speech production
Laboratory phonology 7 (Vol. 1, pp. 241-274): Walter de Gruyter.
Busa, M. G., & Ohala, J. (1995). Nasal loss before voiceless fricatives: a perceptually-based
sound change. Rivista di Linguistica, 7, 125-144.
Chafcouloff, M., & Marchal, A. (1999). Velopharyngeal coarticulation. Coarticulation: Theory,
data and techniques, 69-79.
Chen, M. Y. (1975). An areal study of nasalization in Chinese. Journal of Chinese Linguistics,
3(1), 16-59.
Chen, M. Y. (1995). Acoustic parameters of nasalized vowels in hearing‐impaired and
normal‐hearing speakers. The Journal of the Acoustical Society of America, 98, 2443.
Chen, M. Y. (1997). Acoustic correlates of English and French nasalized vowels. The Journal of
the Acoustical Society of America, 102, 2360.
Chen, M. Y. (2000). Acoustic analysis of simple vowels preceding a nasal in Standard Chinese.
Journal of Phonetics, 28(1), 43-67.
Chen, M. Y., & Metson, R. (1997). Effects of sinus surgery on speech. Archives of

136
Otolaryngology- Head and Neck Surgery, 123(8), 845.
Chen, N. F., Slifka, J., & Stevens, K. N. (2007). Vowel nasalization in American English:
acoustic variability due to phonetic context. Paper presented at the 16th
ICPHS
conference, Saarbrücken.
Cho, T. (2004). Prosodically conditioned strengthening and vowel-to-vowel coarticulation in
English. Journal of Phonetics, 32, 141–176.
Chung, R. (1996). The segmental phonology of Southern Min in Taiwan: Crane Publishing
Company.
Clumeck, H. (1976). Patterns of soft palate movements in six languages. Journal of Phonetics,
4(4), 337-351.
Cohn, A. (1993). Nasalisation in English: phonology or phonetics. Phonology, 10(1), 43-81.
Cohn, A. C. (1990). Phonetic and phonological rules of nasalization: Phonetics Laboratory,
Department of Linguistics, UCLA.
Collins, B., & Mees, I. M. (2003). Practical phonetics and phonology: A resource book for
students: Routledge.
Crystal, D. (2004). English as a second language: Ernst Klett Sprachen.
Delvaux, V., Demolin, D., Harmegnies, B., & Soquet, A. (2008). The aerodynamics of
nasalization in French. Journal of Phonetics, 36(4), 578-606.
Delvaux, V., Metens, T., & Soquet, A. (2002). French nasal vowels: acoustic and articulatory
properties. Presented at 7th International Conference on Spoken Language Processing
(ICSLP), Vol. 1, pp. 53–56.
Delvaux, V., & Soquet, A. (2001). Discriminant analysis of nasal vs. oral vowels in French:

137
comparison between different parametric representations. Eurospeech, Scandinavia.
Dretzke, B. (2008). Modern British and American English pronunciation: UTB.
Fant, G. (2004). Speech acoustics and phonetics (Vol. 24): Springer.
Farnetani, E. (1999). Coarticulation and connected speech processes The handbook of phonetic
sciences (pp. 371-404): Wiley-blackwell.
Flege, J. E. (1995). Second language speech learning: theory, findings, and problems. Speech
perception and linguistic experience: Issues in cross-language research (pp. 233-277):
York Press.
Gill, H. S., & Gleason, H. (1969). A Reference Grammar of Punjabi/Harjeet Singh Gill/Henry A.
Gleason, Jr: Punjabi University, Department of Linguistics.
Gordon-Brannan, M. E., & Weiss, C. E. (2007). Clinical management of articulatory and
phonologic disorders: Lippincott Williams & Wilkins.
Hajek, J. (1997). Universals of sound change in nasalization (Vol. 31): Wiley-Blackwell.
Hajek, J., & Maeda, S. (2000). Vowel height and duration on the development of distinctive
nasalization. Acquisition and the lexicon, 52.
Hammond, M. (1999). The phonology of English: a prosodic optimality-theoretic approach:
Oxford University Press, USA.
Hardcastle, W. J., & Hewlett, N. (2006). Coarticulation: Theory, data and techniques:
Cambridge University Press.
Harnsberger, J. D. (2001). On the relationship between identification and discrimination of non-
native nasal consonants. Acoustical society of America, 110(1), 489-503.

138
Hassan, S. M., Malki, K. H., Mesallam, T. A., Farahat, M., Bukhari, M., & Murry, T. (2011).
The effect of cochlear implantation and post-operative rehabilitation on acoustic voice
analysis in post-lingual hearing impaired adults. European Archives of Oto-Rhino-
Laryngology, 268(10), 1437-1442.
Hayward, K. (2000). Experimental phonetics: Longman London.
Herbert, R. K. (1986). Language universals, markedness theory, and natural phonetic processes:
Mouton de Gruyter.
Hickey, R. (2004). South Asian Englishes Legacies of colonial English: Studies in transported
dialects (pp. 536-558): Cambridge University Press.
House, A. S. (1957). Analog studies of nasal consonants. Journal of speech and hearing
disorders, 22(2), 190.
House, A. S., & Stevens, K. N. (1956). Analog studies of the nasalization of vowels. Journal of
Speech and Hearing Disorders, 21(2), 218.
Hu, F. (2005). A phonetic study of the vowels in Ningbo Chinese. City University of Hong Kong.
Huffman, M. K. (1987). Timing of contextual nasalization in two languages. The Journal of the
Acoustical Society of America, 82, S115.
Huffman, M. K. (1989). Implementation of nasal: timing and articulatory landmarks: University
Microfilms International.
Jenkins, J. (2003). World Englishes: A resource book for students: Routledge.
Johnson, S. (1997). Theorising masculinity and language. A feminist perspective Language and
masculinity: Wiley-Blackwell.
Jun, J. (1995). Perceptual and articulatory factors in place assimilation: An optimality theoretic
approach: Ph. D. dissertation, UCLA.

139
Kachru, B. B. (1982). English in South Asia English as a world language (pp. 353-383):
University of Michigan Press.
Kachru, B. B. (1992). World Englishes: Approaches, issues and resources. Language Teaching,
25(01), 1-14.
Kachru, B. B. (2005). Asian Englishes: Beyond the canon: Hong Kong University Press.
Kachru, B. B., Kachru, Y., & Sridhar, S. N. (2008). Language in South Asia: Cambridge
University Press.
Kawasaki, T. Nasal-Oral Contrast and the Degree of Nasalization in Taiwanese. (Hosei
University). Retrieved from
http://www.hosei.ac.jp/bungaku/museum/html/kiyo/59/articles/Kawasaki59.pdf
Klopfenstein, M. (2006). Phonetic implementation of phonological categories: the case of
contextual and contrastive vowel nasalization in Ottawa. (Master’s thesis, Wayne State
University). Retrieved from
http://www.ucs.louisiana.edu/~mik7845/klopfenstein_essay.pdf
Kluge, D. C. (2004). The perception and production of English syllable-final nasals by Brazilian
learners. Unpublished master’s thesis. Florianópolis: Universidade Federal de Santa
Catarina.
Kluge, D. C. (2010). The effect of visual cues in the perception of nonnative contrasts. Signotica,
22(2), 257-276.
Kluge, D. C., Reis, M. S., Nobre-Oliveira, D., & Bettoni-Techio, M. (2009). The use of visual
cues in the perception of English syllable-final nasals by Brazilian EFL learners. Recent
Research in Second Language Phonetics/Phonology: Perception and Production.
Cambridge Scholars Publishing, 141-153.

140
Krakow, R., & Beddor, P. S. (1991). Coarticulation and the perception of nasality. Presented at
12th ICPhS, Aix-en-Provence, 5, 38-41.
Krakow, R. A. (1993). Nonsegmental influences on velum movement patterns: syllables,
sentences, stress, and speaking rate. Nasals, nasalization, and the velum, 5, 87-118.
Krakow, R. A., Beddor, P. S., Goldstein, L. M., & Fowler, C. A. (1988). Coarticulatory
influences on the perceived height of nasal vowels. The Journal of the Acoustical Society
of America, 83, 1146.
Krakow, R. A., Beddor, P. S., Goldstein, L. M., & Fowler, C. A. (1988). Coarticulatory
influences on the perceived height of nasal vowels. The Journal of the Acoustical Society
of America, 83, 1146.
Ladefoged, P., & Disner, S. F. (2012). Vowels and consonants: Wiley-Blackwell.
Ladefoged, P., & Johnson, K. (2010). A course in phonetics: Cengage learning.
Ladefoged, P., & Maddieson, I. (2001). Vowels of the world’s languages. Phonology: critical
concepts, 2, 5.
Laver, J. (1994). Principles of phonetics: Cambridge University Press.
Lewis, M. P. (2009). Ethnologue: Languages of the world: SIL International.
Li, Y. (2008). Mandarin Speakers‟ Production of English and Mandarin Post-Vocalic Nasals:
An Acoustic Approach. University of Victoria.
Lin, Y. H. (2007). The sounds of Chinese. Recherche, 67, 02.
Macmillan, N. A., Kingston, J., Thorburn, R., Dickey, L. W., & Bartels, C. (1999). Integrality of
nasalization and F. II. Basic sensitivity and phonetic labeling measure distinct sensory
and decision–rule interactions. The Journal of the Acoustical Society of America, 106,
2913.
141
Maeda, S. (1982). Acoustic cues for vowel nasalization: A simulation study. The Journal of the
Acoustical Society of America, 72, S102.
Magen, H. S. (1997). The extent of vowel-to-vowel coarticulation in English. Journal of
Phonetics, 25, 187-205.
Mahboob, a., & Ahmar, N. H. (2004). Pakistani English: Phonology A handbook of varieties of
English: A multimedia reference tool (Vol. 1, pp. 1003-1016): Walter de Gruyter.
Malécot, A. (1960). Vowel nasality as a distinctive feature in American English. Language, 222-
229.
Manuel, S. Y. (1990). The role of contrast in limiting vowel-to-vowel coarticulation in different
languages. Acoustical society of America, 88, 1286-1298.
Mateus, M. H. M., & d'Andrade, E. (2000). The phonology of Portuguese: Oxford University
Press.
Mohammed, S. (2010). A critical evaluation of Braj Kachru’s three circle model for varieties of
English around the world. Retrieved from
http://www.scribd.com/doc/29732323/A-Critical-Evaluation-of-Braj-Kachru124pm
Mohanan, K. P. (1993). Fields of attraction in phonology The last phonological rule: Reflections
on constraints and derivations (pp. 61-116): University of Chicago Press.
Mou, X. (2006). Nasal codas in Standard Chinese–a study in the framework of the distinctive
feature theory. Ph. D. thesis, Massachusetts Institute of Technology, Cambridge, MA.
Nathan, G. S. (2008). Phonology: A cognitive grammar introduction: John Benjamins publishing
company.
Ohman. (1966). Coarticulation in VCV utterances: Spectrographic measurements. The Journal of
the Acoustical Society of America, 39, 68-151.
142
Pan, H. (2004). Nasality in Taiwanese. Language and Speech, 47(3), 267-296.
Pruthi, T., & Espy-Wilson, C. Y. (2007). Acoustic parameters for the automatic detection of
vowel nasalization.
Rahman, T., & Studies, N. I. o. P. (1990). Pakistani English: The linguistic description of a non-
native variety of English (Vol. 3): National Institute of Pakistan Studies, Quaid-i-Azam
University.
Raphael, L. J., Borden, G. J., & Harris, K. S. (2007). Speech science primer: Physiology,
acoustics, and perception of speech: Lippincott Williams & Wilkins.
Raza, w. (2008). Patterns of Pakistani English, pronunciation and pedagogical priorities. Market
Forces.
Recasens, D. (1984). V-to-C coarticulation in catalan VCV sequences: An articulatory and
acoustical study. Journal of phonetics, 12, 61-73.
Recasens, D. (1991). An electropalatographic and acoustic study of consonant-to-vowel
coarticulation. Journal of phonetics, 19, 179-192.
Recasens, D. (2002). An EMA study of VCV coarticulatory direction. Acoustical society of
America, 111(6), 2828-2841.
Repp, B., & Mann, V.A. (1982). Fricative-stop coarticulation: Acoustic and perceptual evidence.
Journal of the Acoustical Society of America, 71(6), 1562-1567.
Roach, P. (2001). Phonetics: Oxford University Press.
Rochet, A., & Rochet, B. (1991). The effect of vowel height on patterns of assimilation nasality
in French and English. Presented at Xllth International Congress of the Phonetic
Sciences. Aixen-Provence.3,54–57.
Rossato, S., Badin, P., & Bouaouni, F. (2003). Velar movements in French: an articulatory and

143
acoustical analysis of coarticulation.
Schmidt, A. M. (1996). Cross-language identification of consonants. Part 1. Korean perception
of English. Acoustic society of America, 99(5), 3301-3211.
Schour-up, L. C. (1972). A CROSS-LANGUAGE STUDY OP VOWEL NASALIZATION. The
Ohio State University.
Shin, E. (2000). English place assimilation: Optimality theoretic analysis from a functional
approach: ms., Yonsei University.
Solé, M. J. (1992). Phonetic and phonological processes: the case of nasalization. Language and
Speech, 35(1-2), 29-43.
Solé, M. J. (1995). Spatio-temporal patterns of velopharyngeal action in phonetic and
phonological nasalization. Language and Speech, 38(1), 1-23.
Spears, A. (2006). NASAL CORATICULATION IN THE FRENCH VOWEL/i: A PHONETIC
AND PHONOLOGICAL STUDY. University of North Carolina.
Stevens, K. Acoustic Phonetics. 1998: MIT Press.
Stevens, K., Nickerson, R., Boothroyd, A., & Rollins, A. (1976). Assessment of nasalization in
the speech of deaf children. Journal of Speech and Hearing Research, 19(2), 393.
Stevens, K. L. N., & Mou, X. (2006). Nasal codas in Standard Chinese: a study in the
framework of the distinctive feature theory. Massachusetts Institute of Technology.
Stevens, K. N. (2000). Acoustic phonetics (Vol. 30): The MIT press.
Stevens, K. N., Fant, G., & Hawkins, S. (1986). Some acoustical and perceptual correlates of
nasal vowels. In Honor of Ilse Lehiste, edited by R. Channon and L. Shokey (Foris,
Dordrecht, Holland), 241-254.
Traunmüller, H. (1999). Coarticulatory effects of consonants on vowels and their reflection in

144
perception. Paper presented at the 12th Swedish phonetics conference.
Vaissiere, J. (1988). Prediction of velum movement from phonological specifications. Phonetica,
45(2-4), 122-139.
Whalen, D. H., & Beddor, P. S. (1989). Connections between nasality and vowel duration and
height: Elucidation of the Eastern Algonquian intrusive nasal. Language, 457-486.
Wright, J. T. (1986). The behavior of nasalized vowels in the perceptual vowel space.
Experimental phonology, 45-67.
Zia, A. (2002). Assimilation and dissimilation rules in Urdu. Akhbar-e-Urdu.

145
Appendices
APPENDIX A
MEASURED A1-P1 AND A1-P0 FOR PUNJABI VOWELS
The correlate A1-P0 measured at the initial point of Punjabi vowels averaged across repetitions
for different contexts. The studied contexts were the oral (O), contrastively nasal (Ṽ) and
contextually nasalized (N). The boldfaced and italicized numbers indicate p<0.05 between the
Oral and nasal values.
/ᴂ/ vowel
Values Measured at the Initial Portion of Vowel
speakers O Ṽ N(v+n) N(v+m) N(v+ŋ) N(n+v) N(m+v)
WA 6.82 7.42 2.62 3.1 3.54 0.02 0.28
QA 8.92 6.52 12.78 11.24 9.56 2.5 2.82
FA 9.08 8.94 3.02 6.56 6.4 2.64 4.08
MO 11.28 11.52 8.18 6.04 8.42 7.92 6.66
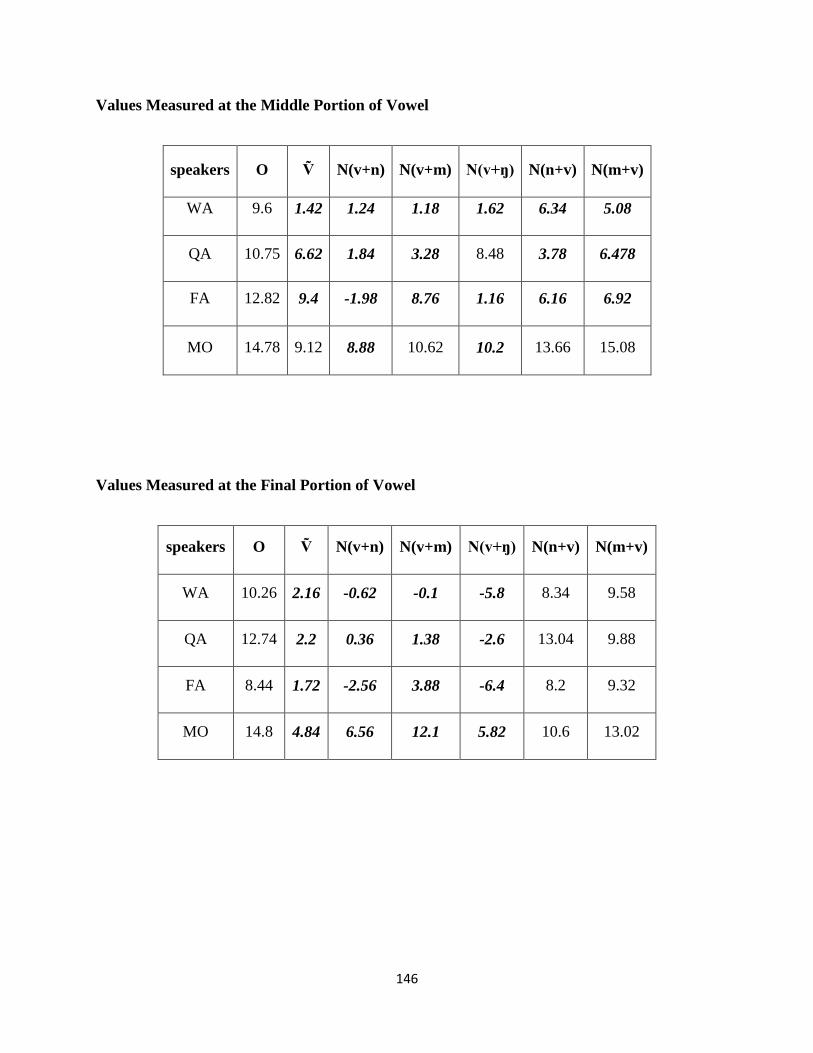
146
Values Measured at the Middle Portion of Vowel
speakers O Ṽ N(v+n) N(v+m) N(v+ŋ) N(n+v) N(m+v)
WA 9.6 1.42 1.24 1.18 1.62 6.34 5.08
QA 10.75 6.62 1.84 3.28 8.48 3.78 6.478
FA 12.82 9.4 -1.98 8.76 1.16 6.16 6.92
MO 14.78 9.12 8.88 10.62 10.2 13.66 15.08
Values Measured at the Final Portion of Vowel
speakers O Ṽ N(v+n) N(v+m) N(v+ŋ) N(n+v) N(m+v)
WA 10.26 2.16 -0.62 -0.1 -5.8 8.34 9.58
QA 12.74 2.2 0.36 1.38 -2.6 13.04 9.88
FA 8.44 1.72 -2.56 3.88 -6.4 8.2 9.32
MO 14.8 4.84 6.56 12.1 5.82 10.6 13.02

147
/α/ Vowel
Values Measured at the Initial Portion of Vowel
speakers O Ṽ N(v+n) N(v+m) N(v+ŋ) N(n+v) N(m+v)
WA 8.88 4.76 6.26 3.5 6.88 2.14 5.24
QA 12.73 5.32 8.2 6.08 9.48 1.22 0.96
FA 11.82 6.38 7.38 3.66 8.14 3.16 3.9
MO 15.68 15.54 14.32 12.9 12.9 9.02 11.46
Values Measured at the Middle Portion of Vowel
Speakers O Ṽ N(v+n) N(v+m) N(v+ŋ) N(n+v) N(m+v)
WA 8.22 3.72 3.4 3.22 4.38 7.78 7.02
QA 10.35 -0.12 -0.04 -1.06 1.2 1.12 3.22
FA 11.38 1.98 3.08 1.08 -0.32 5.18 4.24
MO 13.86 11.5 9.54 9.48 8.52 12.8 12.26

148
Values Measured at the Final Portion of Vowel
speakers O Ṽ N(v+n) N(v+m) N(v+ŋ) N(n+v) N(m+v)
WA 9.1 -0.46 0.64 1.4 -0.52 8.3 9.62
QA 12.25 0 2.44 1.06 3.34 8.2 7.5
FA 9.84 -0.58 2.5 -0.1 -3.94 9.78 9.6
Mo 14.14 9.02 9.26 10.2 8.16 14.98 14.42
/ᴧ/ Vowel
Values Measured at the Initial Portion of Vowel
speakers O Ṽ N(v+n) N(v+m) N(v+ŋ) N(n+v) N(m+v)
WA 7.88 7.92 8.126 8.86 3.3 0.72 4.44
QA 12.32 11.04 11.26 12.54 6.26 0.66 -2.12
FA 10.52 8.66 7.78 6.7 6.88 1.58 3.52
MO 11.8 11.02 11.28 13.16 11.32 7.78 7.64

149
Values Measured at the Middle of Vowel
speakers O Ṽ N(v+n) N(v+m) N(v+ŋ) N(n+v) N(m+v)
WA 8.62 5 2.52 2.76 3.86 5.44 7.28
QA 9.6 4.04 7 12.18 4.62 4.2 2.02
FA 11.52 10.2 10.46 10.52 7.08 7.18 10.1
MO 14.34 10.3 9.82 9.76 8.34 12.2 13.04
Values Measured at the Final Portion of Vowel
speakers O Ṽ N(v+n) N(v+m) N(v+ŋ) N(n+v) N(m+v)
WA 7.58 0.08 -0.42 -0.06 -2.78 4.12 7.66
QA 11.32 6.16 1.48 3.52 3.2 10.4 8.62
FA 9.24 4.8 4.18 3.06 -4.98 9.26 10.02
MO 12.5 8.32 7.4 7.3 8.22 10 11.82

150
The correlate A1-P1 measured at the initial point of Punjabi vowels averaged across repetitions
for different contexts. The studied contexts were the oral (O), contrastively nasal (Ṽ) and
contextually nasalized (N). The boldfaced and italicized numbers indicate p<0.05 between the
Oral and nasal values.
/ɪ/ Vowel
Values Measured at the Initial Portion of Vowel
speakers O Ṽ N(v+n) N(v+m) N(v+ŋ) N(n+v) N(m+v)
WA 25.12 20.1 23.8 19.9 23.16 18 16
QA 25.98 24.28 30.78 25.18 31.66 25.38 25.16
FA 30.82 29.12 33.86 30 33.38 27.2 26.16
MO 25.68 25.72 23.68 18.9 26.74 19.7 19.72
Values Measured at the Middle of Vowel
speakers O Ṽ N(v+n) N(v+m) N(v+ŋ) N(n+v) N(m+v)
WA 24.54 15.7 20.4 18.5 20.2 21.1 21.4
QA 34.75 26 31.44 26.96 30.74 29.73 30.8
FA 32.9 30.7 35.76 33.02 33.76 29.4 30.9
MO 25.9 19.3 21.1 21.6 22.38 22.8 22.2

151
Values Measured at the Final Portion of Vowel
speakers O Ṽ N(v+n) N(v+m) N(v+ŋ) N(n+v) N(m+v)
WA 22.38 17.4 19.74 15.9 20.86 19.34 20.2
QA 31.35 20.76 25.3 23.4 28.6 30.44 29.08
FA 27.9 22.6 22.4 23.2 24.5 29.98 30.3
MO 24.58 15.7 14.7 20.2 19.3 25.68 24.54
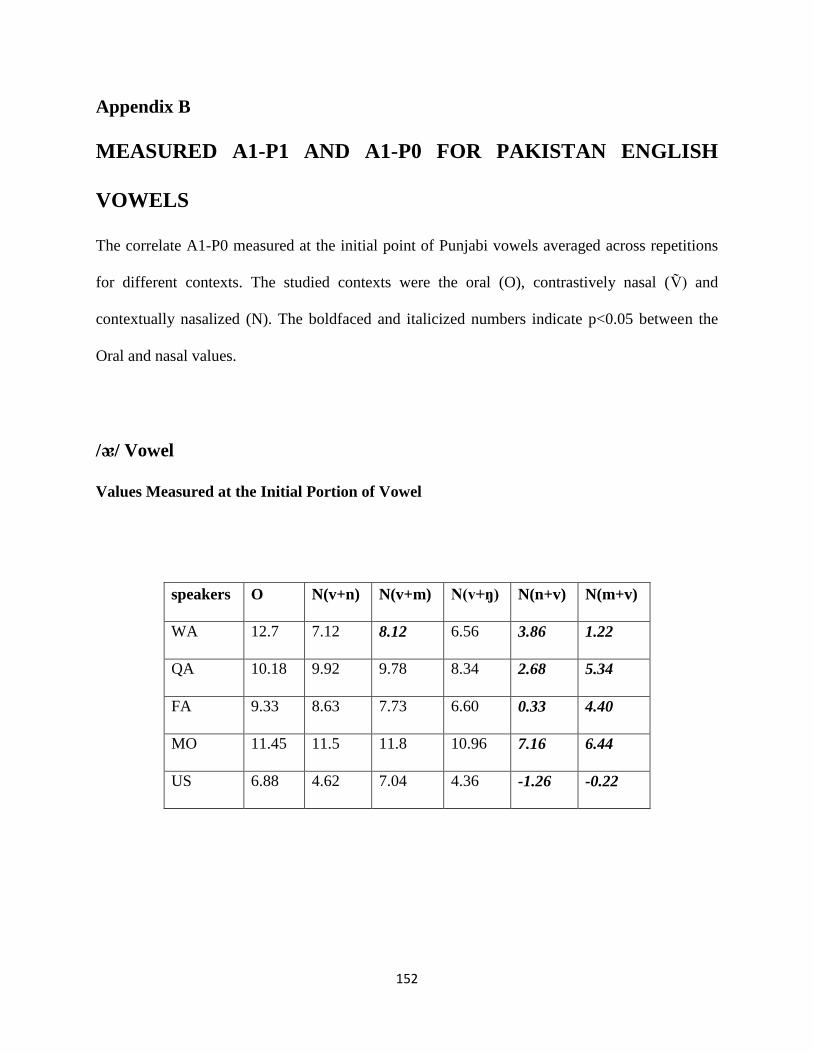
152
Appendix B
MEASURED A1-P1 AND A1-P0 FOR PAKISTAN ENGLISH
VOWELS
The correlate A1-P0 measured at the initial point of Punjabi vowels averaged across repetitions
for different contexts. The studied contexts were the oral (O), contrastively nasal (Ṽ) and
contextually nasalized (N). The boldfaced and italicized numbers indicate p<0.05 between the
Oral and nasal values.
/ᴂ/ Vowel
Values Measured at the Initial Portion of Vowel
speakers O N(v+n) N(v+m) N(v+ŋ) N(n+v) N(m+v)
WA 12.7 7.12 8.12 6.56 3.86 1.22
QA 10.18 9.92 9.78 8.34 2.68 5.34
FA 9.33 8.63 7.73 6.60 0.33 4.40
MO 11.45 11.5 11.8 10.96 7.16 6.44
US 6.88 4.62 7.04 4.36 -1.26 -0.22
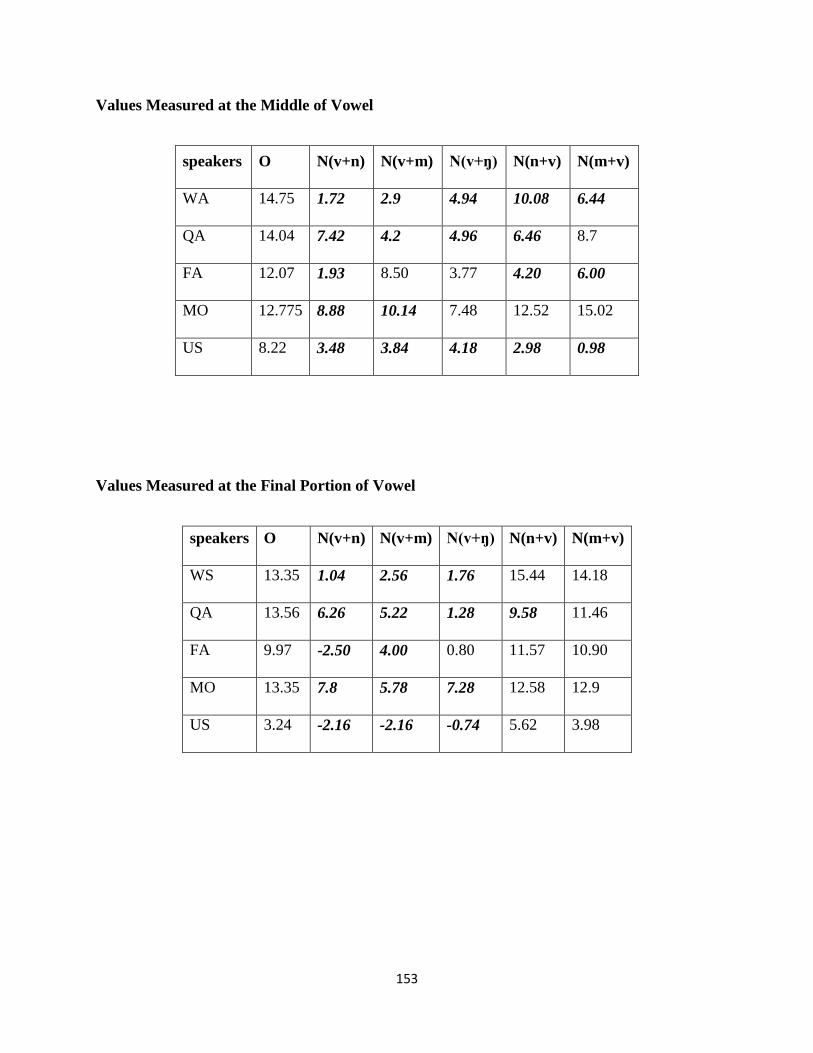
153
Values Measured at the Middle of Vowel
speakers O N(v+n) N(v+m) N(v+ŋ) N(n+v) N(m+v)
WA 14.75 1.72 2.9 4.94 10.08 6.44
QA 14.04 7.42 4.2 4.96 6.46 8.7
FA 12.07 1.93 8.50 3.77 4.20 6.00
MO 12.775 8.88 10.14 7.48 12.52 15.02
US 8.22 3.48 3.84 4.18 2.98 0.98
Values Measured at the Final Portion of Vowel
speakers O N(v+n) N(v+m) N(v+ŋ) N(n+v) N(m+v)
WS 13.35 1.04 2.56 1.76 15.44 14.18
QA 13.56 6.26 5.22 1.28 9.58 11.46
FA 9.97 -2.50 4.00 0.80 11.57 10.90
MO 13.35 7.8 5.78 7.28 12.58 12.9
US 3.24 -2.16 -2.16 -0.74 5.62 3.98
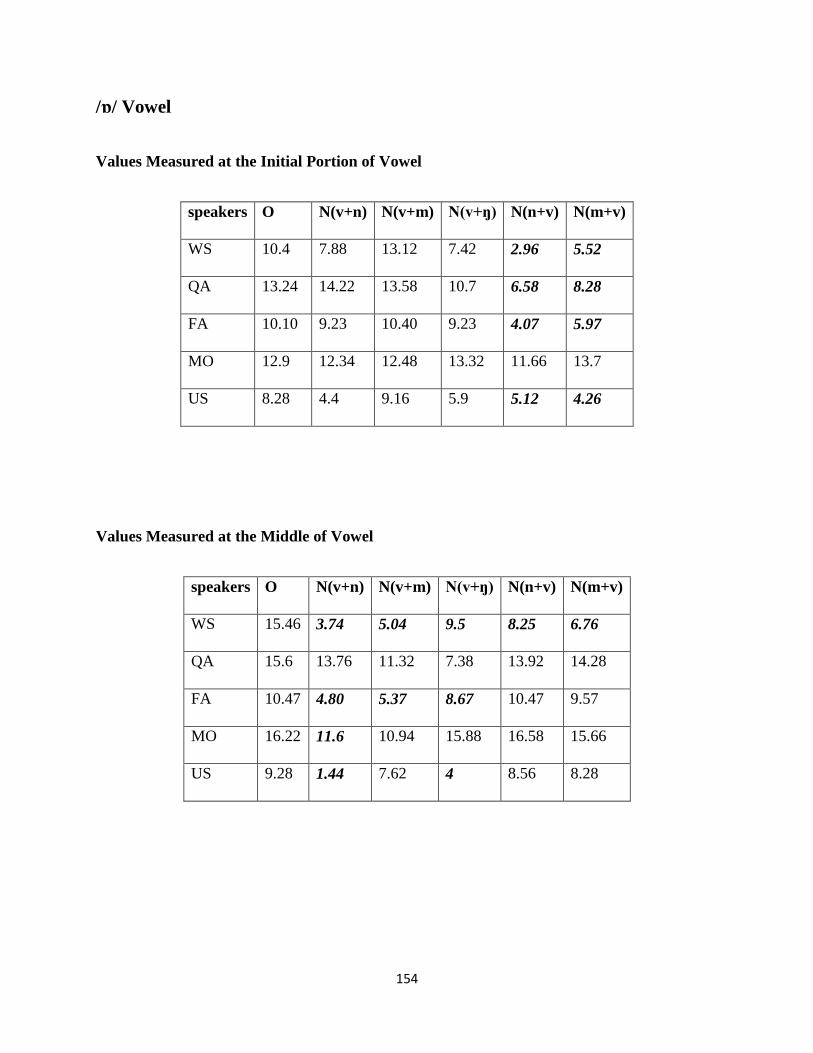
154
/ɒ/ Vowel
Values Measured at the Initial Portion of Vowel
speakers O N(v+n) N(v+m) N(v+ŋ) N(n+v) N(m+v)
WS 10.4 7.88 13.12 7.42 2.96 5.52
QA 13.24 14.22 13.58 10.7 6.58 8.28
FA 10.10 9.23 10.40 9.23 4.07 5.97
MO 12.9 12.34 12.48 13.32 11.66 13.7
US 8.28 4.4 9.16 5.9 5.12 4.26
Values Measured at the Middle of Vowel
speakers O N(v+n) N(v+m) N(v+ŋ) N(n+v) N(m+v)
WS 15.46 3.74 5.04 9.5 8.25 6.76
QA 15.6 13.76 11.32 7.38 13.92 14.28
FA 10.47 4.80 5.37 8.67 10.47 9.57
MO 16.22 11.6 10.94 15.88 16.58 15.66
US 9.28 1.44 7.62 4 8.56 8.28

155
Values Measured at the Final Portion of Vowel
speakers O N(v+n) N(v+m) N(v+ŋ) N(n+v) N(m+v)
WS 15.86 0.2 4.6 6.02 10.58 12.48
QA 15.36 6.08 7.9 4.88 14.62 14.38
FA 9.63 2.97 4.00 1.67 9.40 9.53
MO 14.62 9.18 13.1 10.44 11.72 14.12
US 6.5 -2.72 2.82 -1.72 4.64 5.4
/ᴧ/ Vowel
Values Measured at the Initial Portion of Vowel
speakers O N(v+n) N(v+m) N(v+ŋ) N(n+v) N(m+v)
WS 13.36 7.72 7.86 9.04 -0.42 2.76
QA 11.68 13.46 9.12 10.1 8.1 5.76
FA 6.90 10.30 2.63 6.47 5.60 5.47
MO 13.26 13.17 9.54 11.72 8.60 9.94
US 7.64 4.14 2.9 4.16 -1 -1.32

156
Values Measured at the Middle of Vowel
speakers O N(v+n) N(v+m) N(v+ŋ) N(n+v) N(m+v)
WS 14.44 2.54 3.82 4.96 4.12 9.14
QA 13.84 12.68 10.12 10.02 11.08 9.06
FA 10.73 13.13 5.93 9.53 7.13 8.77
MO 13.4 7.60 9.6 8.26 13.76 14.28
US 8.88 0.3 1.8 5.14 2.36 3.95
Values Measured at the Final Portion of Vowel
speakers O N(v+n) N(v+m) N(v+ŋ) N(n+v) N(m+v)
WS 15.16 -0.2 1.16 2.22 17.12 16.9
QA 13.7 9.12 7.64 7.12 7.88 13.02
FA 9.50 9.27 0.90 5.83 7.50 6.07
MO 14.48 7.5 8.04 5 14.64 13.98
US 5.86 -6.06 -2.66 -1.4 4.95 7.325
The correlate A1-P1 measured at the initial point of Punjabi vowels averaged across repetitions
for different contexts. The studied contexts were the oral (O), contrastively nasal (Ṽ) and

157
contextually nasalized (N). The boldfaced and italicized numbers indicate p<0.05 between the
Oral and nasal values.
/ɪ/ Vowel
Values Measured at the Initial Portion of Vowel
speakers O N(v+n) N(v+m) N(v+ŋ) N(n+v) N(m+v)
WS 28.33 27.98 28.30 27.48 19.88 22.58
QA 27.00 28.66 29.24 28.92 22.20 19.50
FA 42.43 33.60 41.57 37.30 27.23 28.97
MO 29.25 28.68 27.60 28.24 22.30 19.92
US 26.23 19.93 12.98 26.98 13.90 20.63
Values Measured at the Middle of Vowel
speakers O N(v+n) N(v+m) N(v+ŋ) N(n+v) N(m+v)
WS 29.65 23.98 24.55 21.48 24.30 24.65
QA 30.24 26.72 28.18 27.14 27.18 25.70
FA 43.50 36.07 32.67 27.03 36.13 34.00
MO 31.13 21.38 18.92 19.76 25.78 25.28
US 24.95 24.03 22.30 19.94 20.95 22.23
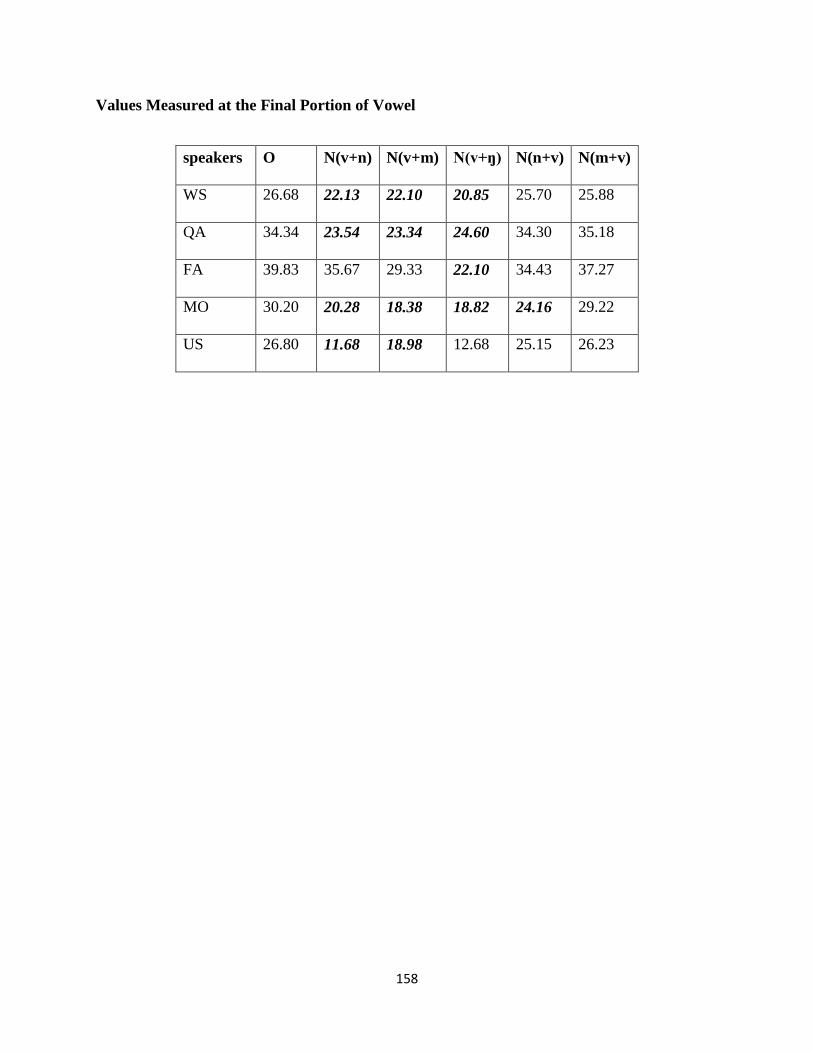
158
Values Measured at the Final Portion of Vowel
speakers O N(v+n) N(v+m) N(v+ŋ) N(n+v) N(m+v)
WS 26.68 22.13 22.10 20.85 25.70 25.88
QA 34.34 23.54 23.34 24.60 34.30 35.18
FA 39.83 35.67 29.33 22.10 34.43 37.27
MO 30.20 20.28 18.38 18.82 24.16 29.22
US 26.80 11.68 18.98 12.68 25.15 26.23