Embed Size (px)
Citation preview
AFC Consultants International
AMUSEMENT PARK
TABLE OF CONTENTS
1 EXECUTIVE SUMMARY..................................................................................................2
2 PROJECT DESCRIPTION ...............................................................................................2
2.1 MAIN GOALS.................................................................................................................2 2.2 SPACE PROGRAM .........................................................................................................3 2.3 INVESTMENT REQUIREMENTS .........................................................................................3 2.4 STAFFING STRUCTURE ..................................................................................................4
3 SERVICE STRATEGY .....................................................................................................4
4 MARKET ANALYSIS .......................................................................................................5
4.1 TARGET MARKET ..........................................................................................................5 4.2 SWOT ANALYSIS .........................................................................................................5
5 MARKETING PLAN .........................................................................................................6
6 FINANCIAL PLAN ...........................................................................................................6
6.1 MAJOR ASSUMPTIONS ...................................................................................................6 6.2 PROJECTED INCOME STATEMENT ...................................................................................8 6.3 PROJECTED BALANCE SHEET ........................................................................................9 6.4 PROJECTED CASH FLOWS ...........................................................................................10 6.5 RATIO ANALYSIS .........................................................................................................11 6.6 BREAK-EVEN ANALYSIS ...............................................................................................11 6.7 SENSITIVITY ANALYSIS.................................................................................................12
7 RECOMMENDATIONS AND KEY SUCCESS FACTORS ..............................................12
8 ECONOMIC IMPACT EVALUATION..............................................................................12
LBN/B7-4100/IB/99/0225/JC20/0105 AFC Consultants International
Marjeyoun - Feasibility Study – Amusement Park V.2 2
1 Executive Summary The proposed project consists in establishing an amusement park in Marjeyoun town. The project will offer attractive games and rides in a secure environment. It will target Marjeyoun caza inhabitants as well as neighboring regions of Hasbaya and Bint Jbeil, as it will be a unique park in this area. The initial investment is estimated at $243,085, which include the equipment, fixtures, furniture and working capital. The park will have a total area of 4,000 square meters and will include an outdoor playground, a coffee shop, a hall for birthdays and a parking lot. The annual rent of the park is assumed at $6,000 The projections are taken over a period of 5 years. The Luna Park is expected to provide average annual net profits of $61,922. The amusement park provides an internal rate of return (IRR) of 29% and a payback period of 4 years 6 months. These results show that the project is feasible. A worst case scenario was developed with the assumption of a lower number of kids playing at the park gave an average net profit of $48,216, an IRR of 23% and a payback period of 5 years 7 months. A best-case scenario based on higher number of kids gave an average net profit of $75,629, an IRR of 35% and a payback period of 3 years 9 months. The amusement park with its activities is expected to positively reshape the economic and social environment of Marjeyoun. It will offer 9 part time job opportunities for Marjeyoun residents and most importantly, it will provide a quality amusement park for the children where special events could also be organized.
2 Project description The project consists in establishing an amusement park in Marjeyoun town, which will offer attractive games and rides in a secure environment. The park will offer entertainment for the whole family. It will be operational during the summer season, i.e. around 4 months per year and will attract families from Marjeyoun and the surrounding cazas. The park will offer the following services:
7 different rides for kids A hall for birthday parties A coffee shop offering snacks, juices, ice cream and Narguilé
2.1 Main goals
To offer entertainment for the kids as well as their parents. Kids enjoy the games and activities while parents can have snacks and beverages along with Narguile at the coffee shop.
To offer an attractive venue for birthdays and other events.
LBN/B7-4100/IB/99/0225/JC20/0105 AFC Consultants International
Marjeyoun - Feasibility Study – Amusement Park V.2 3
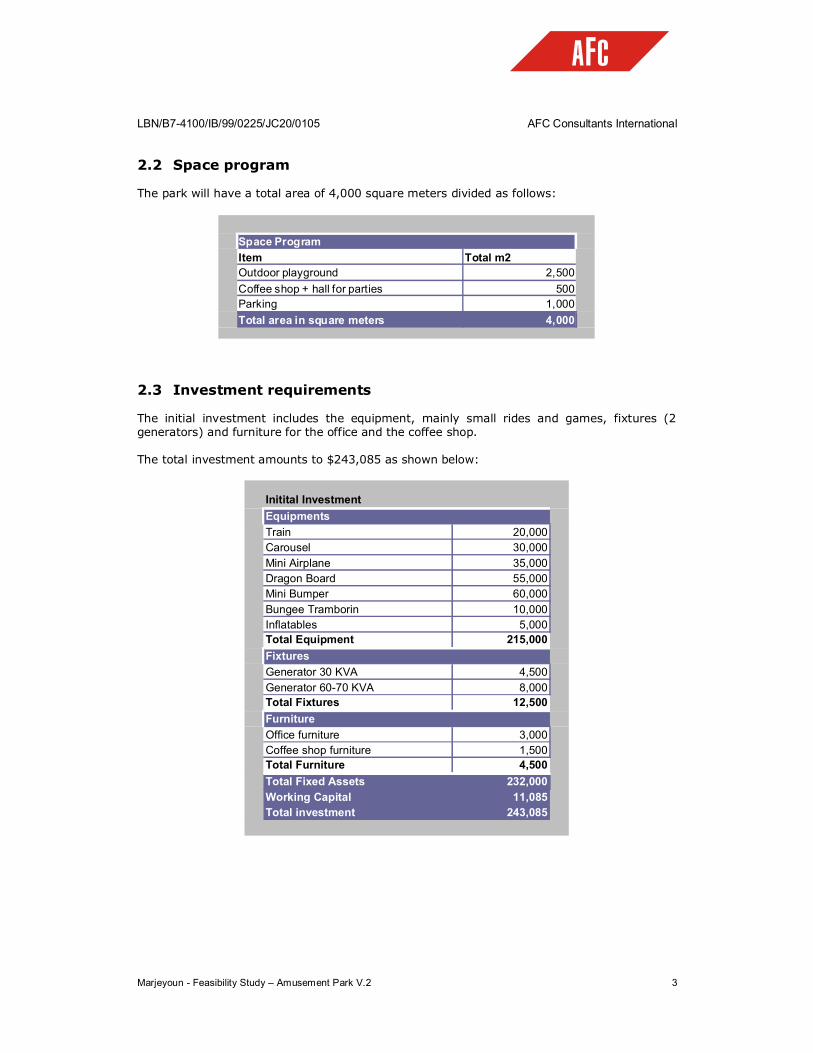
2.2 Space program The park will have a total area of 4,000 square meters divided as follows:
Space ProgramItem Total m2Outdoor playground 2,500Coffee shop + hall for parties 500Parking 1,000Total area in square meters 4,000
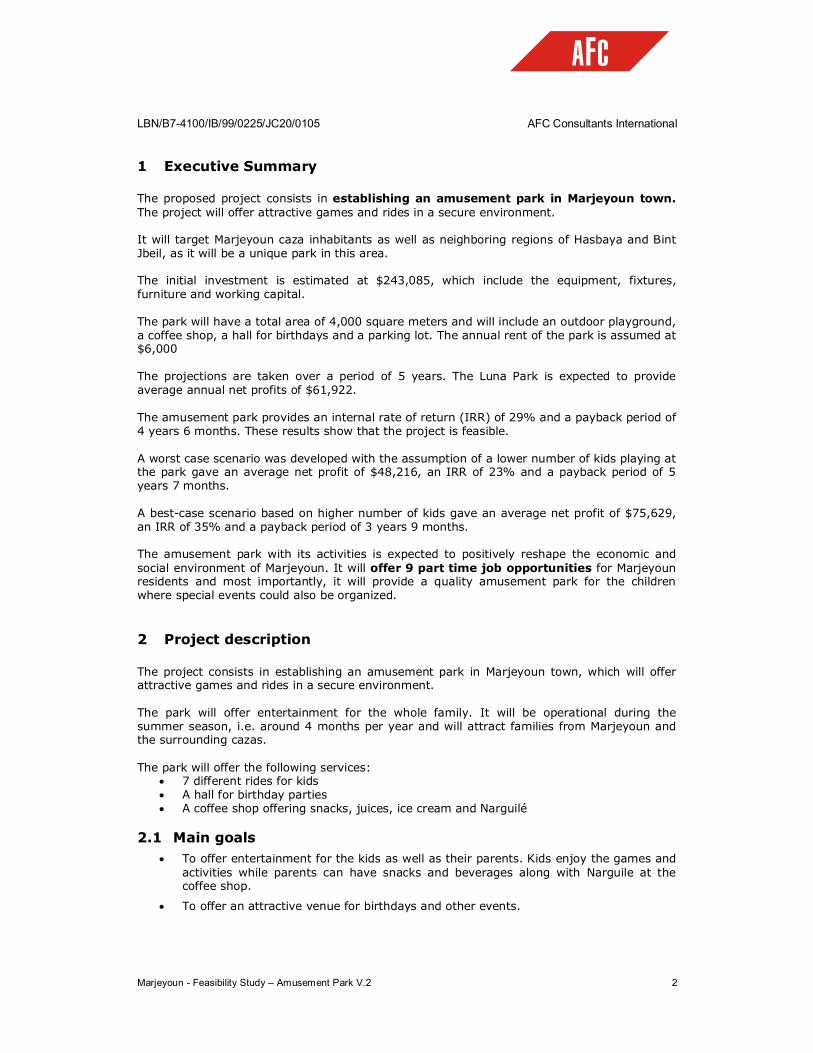
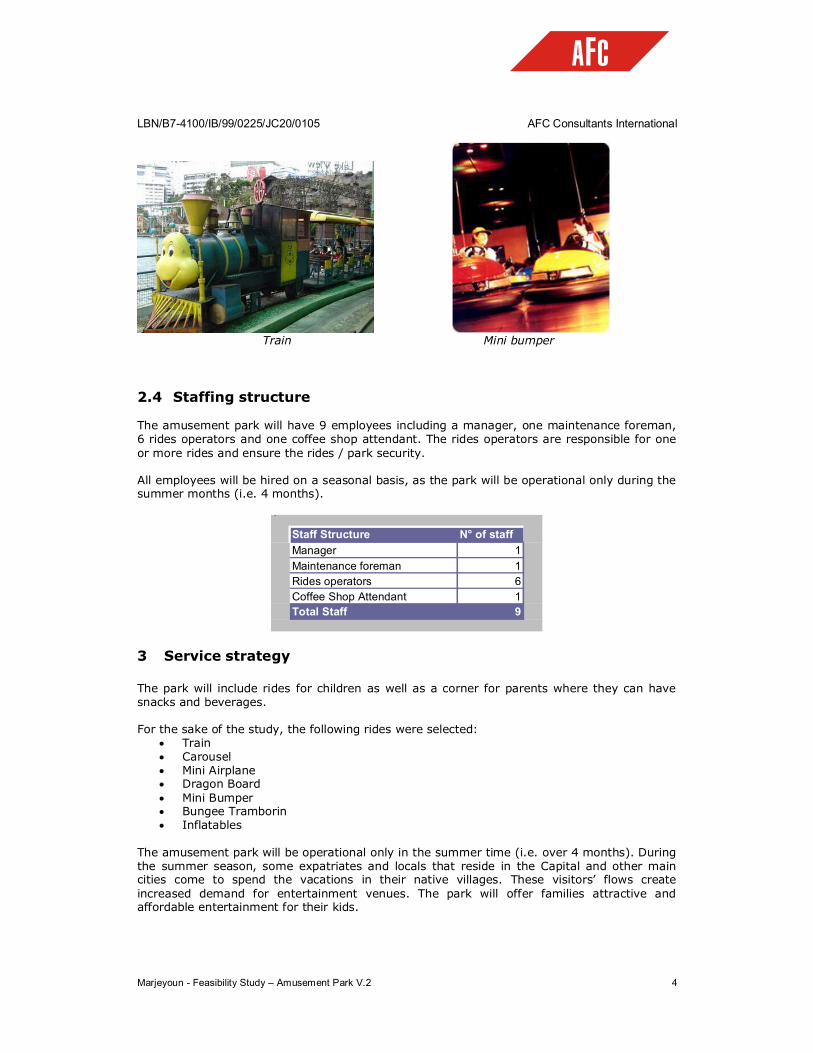
2.3 Investment requirements The initial investment includes the equipment, mainly small rides and games, fixtures (2 generators) and furniture for the office and the coffee shop. The total investment amounts to $243,085 as shown below:
Initital InvestmentEquipmentsTrain 20,000Carousel 30,000Mini Airplane 35,000Dragon Board 55,000Mini Bumper 60,000Bungee Tramborin 10,000Inflatables 5,000Total Equipment 215,000FixturesGenerator 30 KVA 4,500Generator 60-70 KVA 8,000Total Fixtures 12,500FurnitureOffice furniture 3,000Coffee shop furniture 1,500Total Furniture 4,500Total Fixed Assets 232,000Working Capital 11,085Total investment 243,085
LBN/B7-4100/IB/99/0225/JC20/0105 AFC Consultants International
Marjeyoun - Feasibility Study – Amusement Park V.2 4
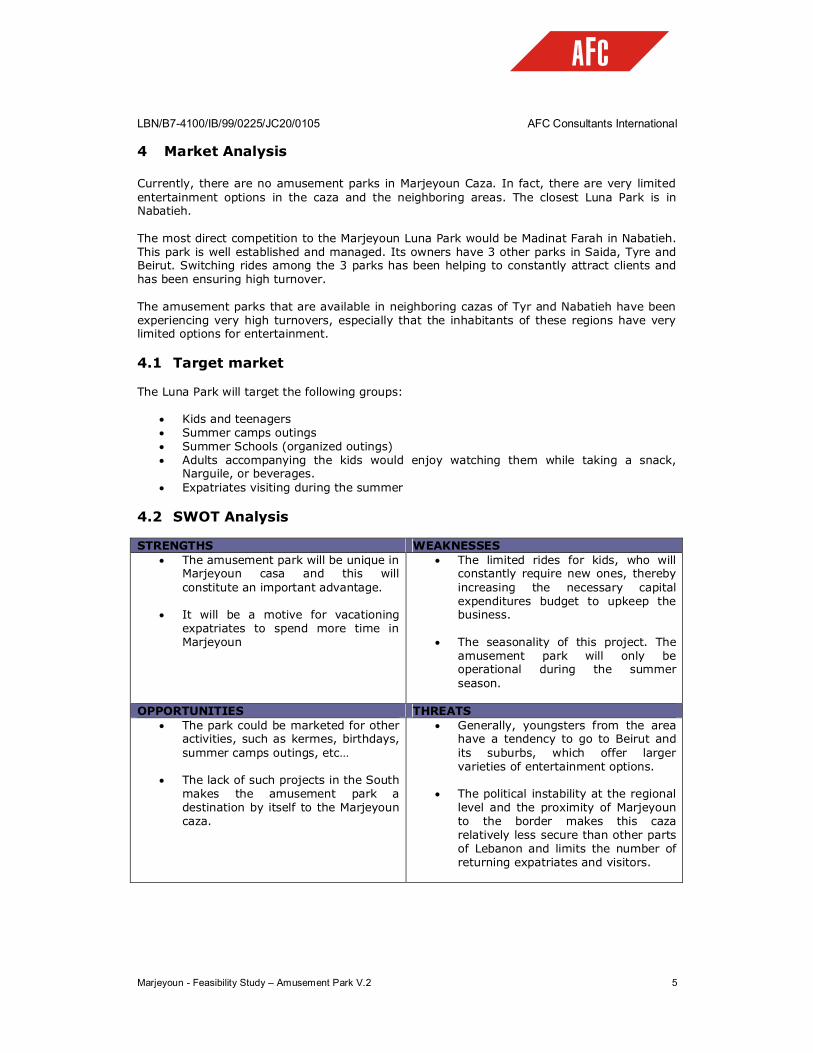
Train Mini bumper
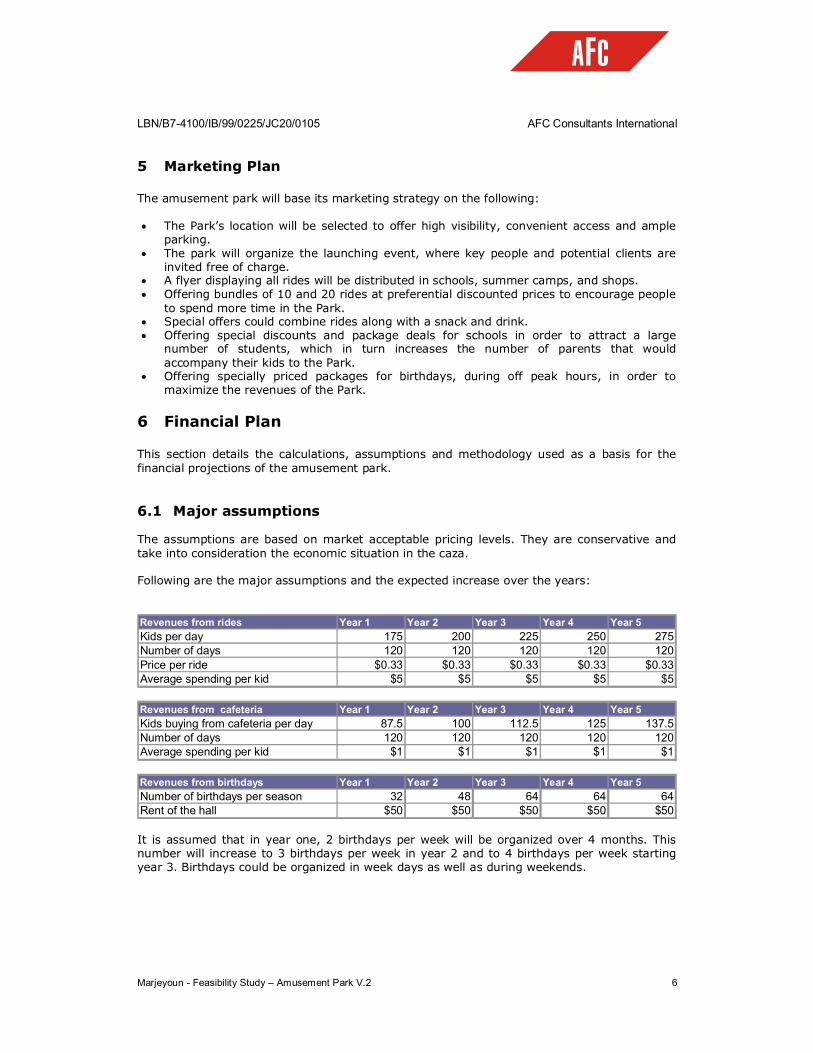
2.4 Staffing structure The amusement park will have 9 employees including a manager, one maintenance foreman, 6 rides operators and one coffee shop attendant. The rides operators are responsible for one or more rides and ensure the rides / park security. All employees will be hired on a seasonal basis, as the park will be operational only during the summer months (i.e. 4 months).
`Staff Structure N° of staffManager 1Maintenance foreman 1Rides operators 6Coffee Shop Attendant 1Total Staff 9
3 Service strategy The park will include rides for children as well as a corner for parents where they can have snacks and beverages. For the sake of the study, the following rides were selected:
Train Carousel Mini Airplane Dragon Board Mini Bumper Bungee Tramborin Inflatables
The amusement park will be operational only in the summer time (i.e. over 4 months). During the summer season, some expatriates and locals that reside in the Capital and other main cities come to spend the vacations in their native villages. These visitors’ flows create increased demand for entertainment venues. The park will offer families attractive and affordable entertainment for their kids.
LBN/B7-4100/IB/99/0225/JC20/0105 AFC Consultants International
Marjeyoun - Feasibility Study – Amusement Park V.2 5
4 Market Analysis Currently, there are no amusement parks in Marjeyoun Caza. In fact, there are very limited entertainment options in the caza and the neighboring areas. The closest Luna Park is in Nabatieh. The most direct competition to the Marjeyoun Luna Park would be Madinat Farah in Nabatieh. This park is well established and managed. Its owners have 3 other parks in Saida, Tyre and Beirut. Switching rides among the 3 parks has been helping to constantly attract clients and has been ensuring high turnover. The amusement parks that are available in neighboring cazas of Tyr and Nabatieh have been experiencing very high turnovers, especially that the inhabitants of these regions have very limited options for entertainment. 4.1 Target market The Luna Park will target the following groups:
Kids and teenagers Summer camps outings Summer Schools (organized outings) Adults accompanying the kids would enjoy watching them while taking a snack,
Narguile, or beverages. Expatriates visiting during the summer
4.2 SWOT Analysis STRENGTHS WEAKNESSES
The amusement park will be unique in Marjeyoun casa and this will constitute an important advantage.
It will be a motive for vacationing
expatriates to spend more time in Marjeyoun
The limited rides for kids, who will constantly require new ones, thereby increasing the necessary capital expenditures budget to upkeep the business.
The seasonality of this project. The
amusement park will only be operational during the summer season.
OPPORTUNITIES THREATS
The park could be marketed for other activities, such as kermes, birthdays, summer camps outings, etc…
The lack of such projects in the South
makes the amusement park a destination by itself to the Marjeyoun caza.
Generally, youngsters from the area have a tendency to go to Beirut and its suburbs, which offer larger varieties of entertainment options.
The political instability at the regional level and the proximity of Marjeyoun to the border makes this caza relatively less secure than other parts of Lebanon and limits the number of returning expatriates and visitors.
LBN/B7-4100/IB/99/0225/JC20/0105 AFC Consultants International
Marjeyoun - Feasibility Study – Amusement Park V.2 6
5 Marketing Plan The amusement park will base its marketing strategy on the following: The Park’s location will be selected to offer high visibility, convenient access and ample
parking. The park will organize the launching event, where key people and potential clients are
invited free of charge. A flyer displaying all rides will be distributed in schools, summer camps, and shops. Offering bundles of 10 and 20 rides at preferential discounted prices to encourage people
to spend more time in the Park. Special offers could combine rides along with a snack and drink. Offering special discounts and package deals for schools in order to attract a large
number of students, which in turn increases the number of parents that would accompany their kids to the Park.
Offering specially priced packages for birthdays, during off peak hours, in order to maximize the revenues of the Park.
6 Financial Plan This section details the calculations, assumptions and methodology used as a basis for the financial projections of the amusement park. 6.1 Major assumptions The assumptions are based on market acceptable pricing levels. They are conservative and take into consideration the economic situation in the caza. Following are the major assumptions and the expected increase over the years:
Revenues from rides Year 1 Year 2 Year 3 Year 4 Year 5Kids per day 175 200 225 250 275Number of days 120 120 120 120 120Price per ride $0.33 $0.33 $0.33 $0.33 $0.33Average spending per kid $5 $5 $5 $5 $5
Revenues from cafeteria Year 1 Year 2 Year 3 Year 4 Year 5Kids buying from cafeteria per day 87.5 100 112.5 125 137.5Number of days 120 120 120 120 120Average spending per kid $1 $1 $1 $1 $1
Revenues from birthdays Year 1 Year 2 Year 3 Year 4 Year 5Number of birthdays per season 32 48 64 64 64Rent of the hall $50 $50 $50 $50 $50 It is assumed that in year one, 2 birthdays per week will be organized over 4 months. This number will increase to 3 birthdays per week in year 2 and to 4 birthdays per week starting year 3. Birthdays could be organized in week days as well as during weekends.
LBN/B7-4100/IB/99/0225/JC20/0105 AFC Consultants International
Marjeyoun - Feasibility Study – Amusement Park V.2 7
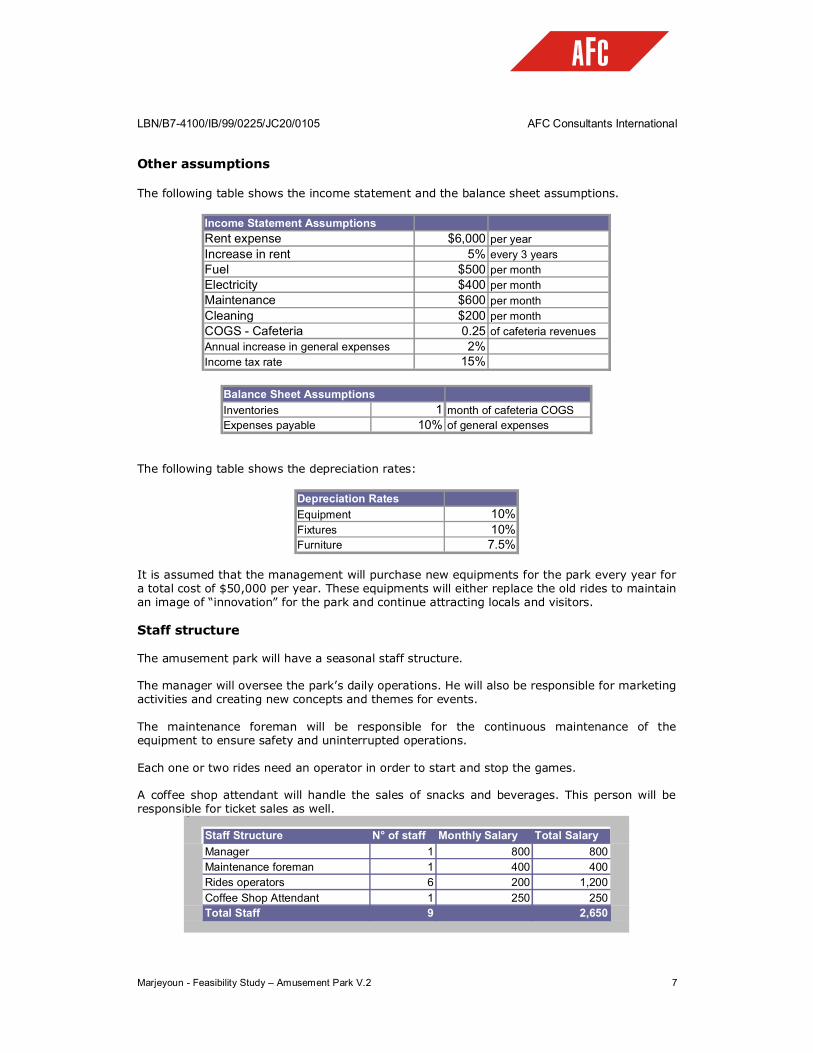
Other assumptions The following table shows the income statement and the balance sheet assumptions.
Income Statement AssumptionsRent expense $6,000 per yearIncrease in rent 5% every 3 yearsFuel $500 per monthElectricity $400 per monthMaintenance $600 per monthCleaning $200 per monthCOGS - Cafeteria 0.25 of cafeteria revenuesAnnual increase in general expenses 2%Income tax rate 15%
Balance Sheet AssumptionsInventories 1 month of cafeteria COGSExpenses payable 10% of general expenses
The following table shows the depreciation rates:
Depreciation RatesEquipment 10%Fixtures 10%Furniture 7.5%
It is assumed that the management will purchase new equipments for the park every year for a total cost of $50,000 per year. These equipments will either replace the old rides to maintain an image of “innovation” for the park and continue attracting locals and visitors. Staff structure The amusement park will have a seasonal staff structure. The manager will oversee the park’s daily operations. He will also be responsible for marketing activities and creating new concepts and themes for events. The maintenance foreman will be responsible for the continuous maintenance of the equipment to ensure safety and uninterrupted operations. Each one or two rides need an operator in order to start and stop the games. A coffee shop attendant will handle the sales of snacks and beverages. This person will be responsible for ticket sales as well.
`Staff Structure N° of staff Monthly Salary Total SalaryManager 1 800 800Maintenance foreman 1 400 400Rides operators 6 200 1,200Coffee Shop Attendant 1 250 250Total Staff 9 2,650
LBN/B7-4100/IB/99/0225/JC20/0105 AFC Consultants International
Marjeyoun - Feasibility Study – Amusement Park V.2 8
6.2 Projected Income Statement
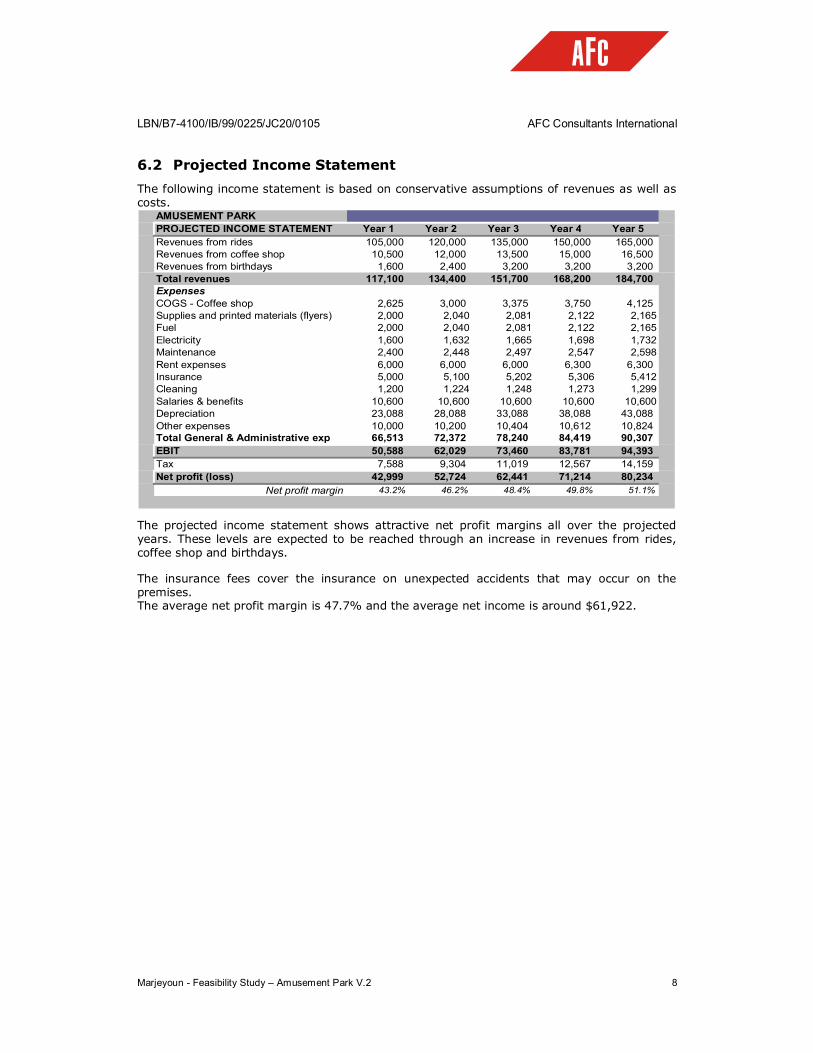
The following income statement is based on conservative assumptions of revenues as well as costs.
AMUSEMENT PARKPROJECTED INCOME STATEMENT Year 1 Year 2 Year 3 Year 4 Year 5Revenues from rides 105,000 120,000 135,000 150,000 165,000 Revenues from coffee shop 10,500 12,000 13,500 15,000 16,500 Revenues from birthdays 1,600 2,400 3,200 3,200 3,200 Total revenues 117,100 134,400 151,700 168,200 184,700 ExpensesCOGS - Coffee shop 2,625 3,000 3,375 3,750 4,125 Supplies and printed materials (flyers) 2,000 2,040 2,081 2,122 2,165Fuel 2,000 2,040 2,081 2,122 2,165Electricity 1,600 1,632 1,665 1,698 1,732Maintenance 2,400 2,448 2,497 2,547 2,598Rent expenses 6,000 6,000 6,000 6,300 6,300 Insurance 5,000 5,100 5,202 5,306 5,412Cleaning 1,200 1,224 1,248 1,273 1,299Salaries & benefits 10,600 10,600 10,600 10,600 10,600Depreciation 23,088 28,088 33,088 38,088 43,088 Other expenses 10,000 10,200 10,404 10,612 10,824 Total General & Administrative exp 66,513 72,372 78,240 84,419 90,307 EBIT 50,588 62,029 73,460 83,781 94,393 Tax 7,588 9,304 11,019 12,567 14,159 Net profit (loss) 42,999 52,724 62,441 71,214 80,234
Net profit margin 43.2% 46.2% 48.4% 49.8% 51.1%
The projected income statement shows attractive net profit margins all over the projected years. These levels are expected to be reached through an increase in revenues from rides, coffee shop and birthdays. The insurance fees cover the insurance on unexpected accidents that may occur on the premises. The average net profit margin is 47.7% and the average net income is around $61,922.
LBN/B7-4100/IB/99/0225/JC20/0105 AFC Consultants International
Marjeyoun - Feasibility Study – Amusement Park V.2 9
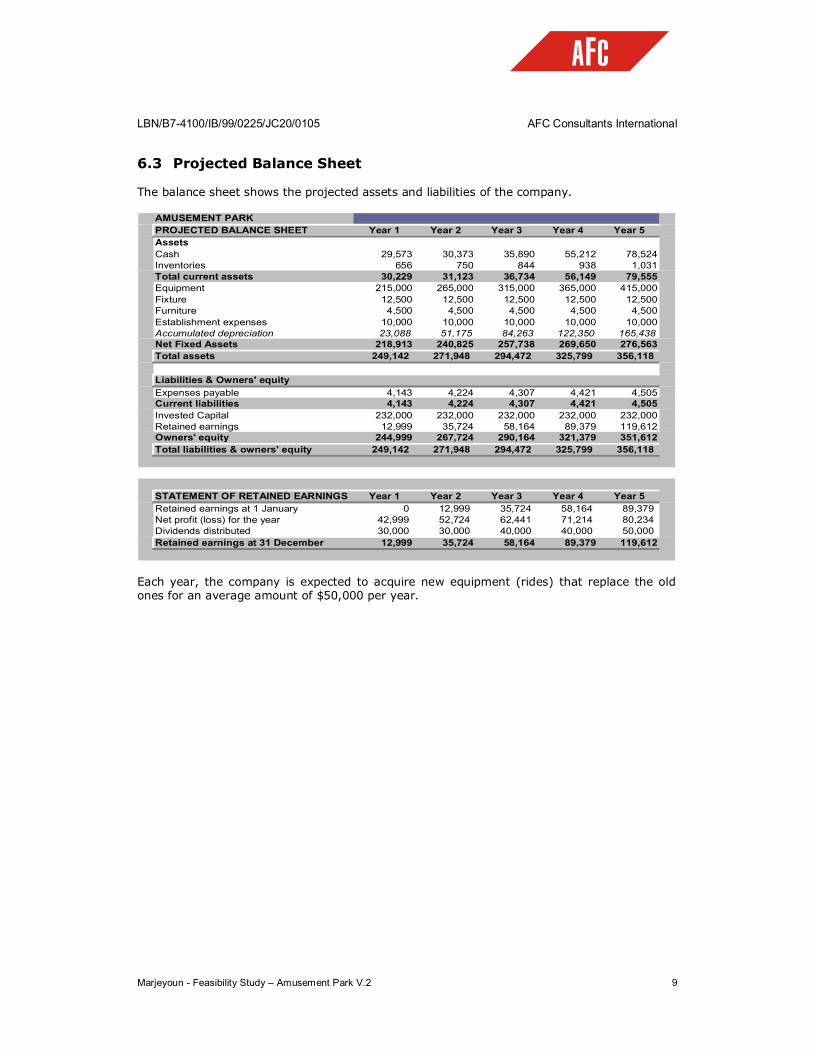
6.3 Projected Balance Sheet The balance sheet shows the projected assets and liabilities of the company.
AMUSEMENT PARKPROJECTED BALANCE SHEET Year 1 Year 2 Year 3 Year 4 Year 5AssetsCash 29,573 30,373 35,890 55,212 78,524Inventories 656 750 844 938 1,031Total current assets 30,229 31,123 36,734 56,149 79,555Equipment 215,000 265,000 315,000 365,000 415,000Fixture 12,500 12,500 12,500 12,500 12,500Furniture 4,500 4,500 4,500 4,500 4,500Establishment expenses 10,000 10,000 10,000 10,000 10,000Accumulated depreciation 23,088 51,175 84,263 122,350 165,438Net Fixed Assets 218,913 240,825 257,738 269,650 276,563Total assets 249,142 271,948 294,472 325,799 356,118
Liabilities & Owners' equityExpenses payable 4,143 4,224 4,307 4,421 4,505Current liabilities 4,143 4,224 4,307 4,421 4,505Invested Capital 232,000 232,000 232,000 232,000 232,000Retained earnings 12,999 35,724 58,164 89,379 119,612Owners' equity 244,999 267,724 290,164 321,379 351,612Total liabilities & owners' equity 249,142 271,948 294,472 325,799 356,118
STATEMENT OF RETAINED EARNINGS Year 1 Year 2 Year 3 Year 4 Year 5Retained earnings at 1 January 0 12,999 35,724 58,164 89,379Net profit (loss) for the year 42,999 52,724 62,441 71,214 80,234Dividends distributed 30,000 30,000 40,000 40,000 50,000Retained earnings at 31 December 12,999 35,724 58,164 89,379 119,612
Each year, the company is expected to acquire new equipment (rides) that replace the old ones for an average amount of $50,000 per year.
LBN/B7-4100/IB/99/0225/JC20/0105 AFC Consultants International
Marjeyoun - Feasibility Study – Amusement Park V.2 10
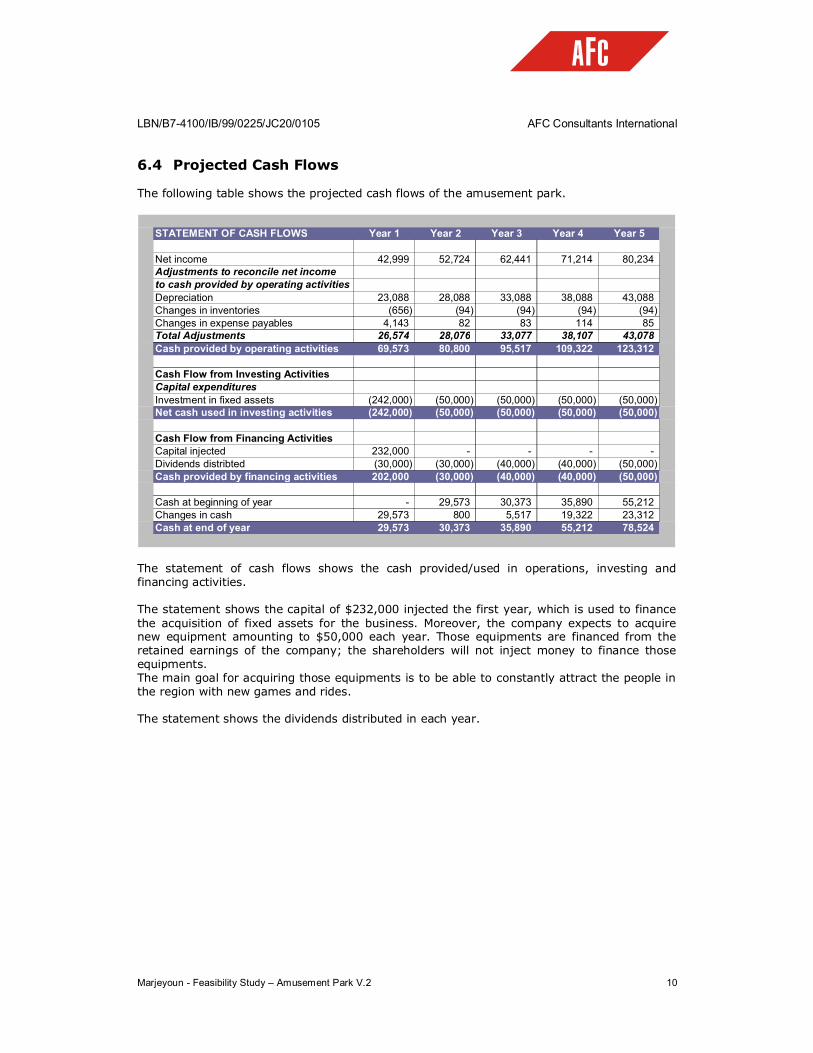
6.4 Projected Cash Flows The following table shows the projected cash flows of the amusement park.
STATEMENT OF CASH FLOWS Year 1 Year 2 Year 3 Year 4 Year 5
Net income 42,999 52,724 62,441 71,214 80,234 Adjustments to reconcile net incometo cash provided by operating activitiesDepreciation 23,088 28,088 33,088 38,088 43,088 Changes in inventories (656) (94) (94) (94) (94) Changes in expense payables 4,143 82 83 114 85 Total Adjustments 26,574 28,076 33,077 38,107 43,078 Cash provided by operating activities 69,573 80,800 95,517 109,322 123,312
Cash Flow from Investing ActivitiesCapital expendituresInvestment in fixed assets (242,000) (50,000) (50,000) (50,000) (50,000) Net cash used in investing activities (242,000) (50,000) (50,000) (50,000) (50,000)
Cash Flow from Financing ActivitiesCapital injected 232,000 - - - - Dividends distribted (30,000) (30,000) (40,000) (40,000) (50,000) Cash provided by financing activities 202,000 (30,000) (40,000) (40,000) (50,000)
Cash at beginning of year - 29,573 30,373 35,890 55,212 Changes in cash 29,573 800 5,517 19,322 23,312 Cash at end of year 29,573 30,373 35,890 55,212 78,524
The statement of cash flows shows the cash provided/used in operations, investing and financing activities. The statement shows the capital of $232,000 injected the first year, which is used to finance the acquisition of fixed assets for the business. Moreover, the company expects to acquire new equipment amounting to $50,000 each year. Those equipments are financed from the retained earnings of the company; the shareholders will not inject money to finance those equipments. The main goal for acquiring those equipments is to be able to constantly attract the people in the region with new games and rides. The statement shows the dividends distributed in each year.
LBN/B7-4100/IB/99/0225/JC20/0105 AFC Consultants International
Marjeyoun - Feasibility Study – Amusement Park V.2 11
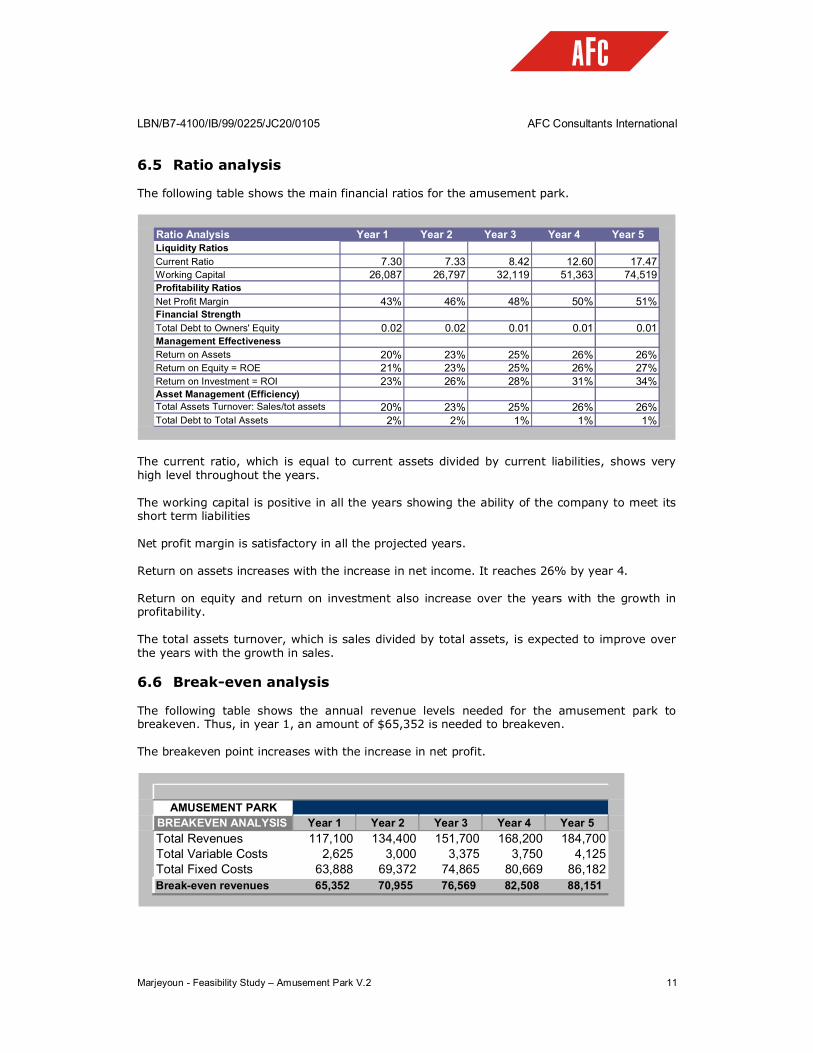
6.5 Ratio analysis The following table shows the main financial ratios for the amusement park.
Ratio Analysis Year 1 Year 2 Year 3 Year 4 Year 5Liquidity RatiosCurrent Ratio 7.30 7.33 8.42 12.60 17.47Working Capital 26,087 26,797 32,119 51,363 74,519Profitability RatiosNet Profit Margin 43% 46% 48% 50% 51%Financial StrengthTotal Debt to Owners' Equity 0.02 0.02 0.01 0.01 0.01Management EffectivenessReturn on Assets 20% 23% 25% 26% 26%Return on Equity = ROE 21% 23% 25% 26% 27%Return on Investment = ROI 23% 26% 28% 31% 34%Asset Management (Efficiency)Total Assets Turnover: Sales/tot assets 20% 23% 25% 26% 26%Total Debt to Total Assets 2% 2% 1% 1% 1%
The current ratio, which is equal to current assets divided by current liabilities, shows very high level throughout the years. The working capital is positive in all the years showing the ability of the company to meet its short term liabilities Net profit margin is satisfactory in all the projected years. Return on assets increases with the increase in net income. It reaches 26% by year 4. Return on equity and return on investment also increase over the years with the growth in profitability. The total assets turnover, which is sales divided by total assets, is expected to improve over the years with the growth in sales. 6.6 Break-even analysis The following table shows the annual revenue levels needed for the amusement park to breakeven. Thus, in year 1, an amount of $65,352 is needed to breakeven. The breakeven point increases with the increase in net profit.
AMUSEMENT PARKBREAKEVEN ANALYSIS Year 1 Year 2 Year 3 Year 4 Year 5Total Revenues 117,100 134,400 151,700 168,200 184,700Total Variable Costs 2,625 3,000 3,375 3,750 4,125Total Fixed Costs 63,888 69,372 74,865 80,669 86,182Break-even revenues 65,352 70,955 76,569 82,508 88,151
LBN/B7-4100/IB/99/0225/JC20/0105 AFC Consultants International
Marjeyoun - Feasibility Study – Amusement Park V.2 12
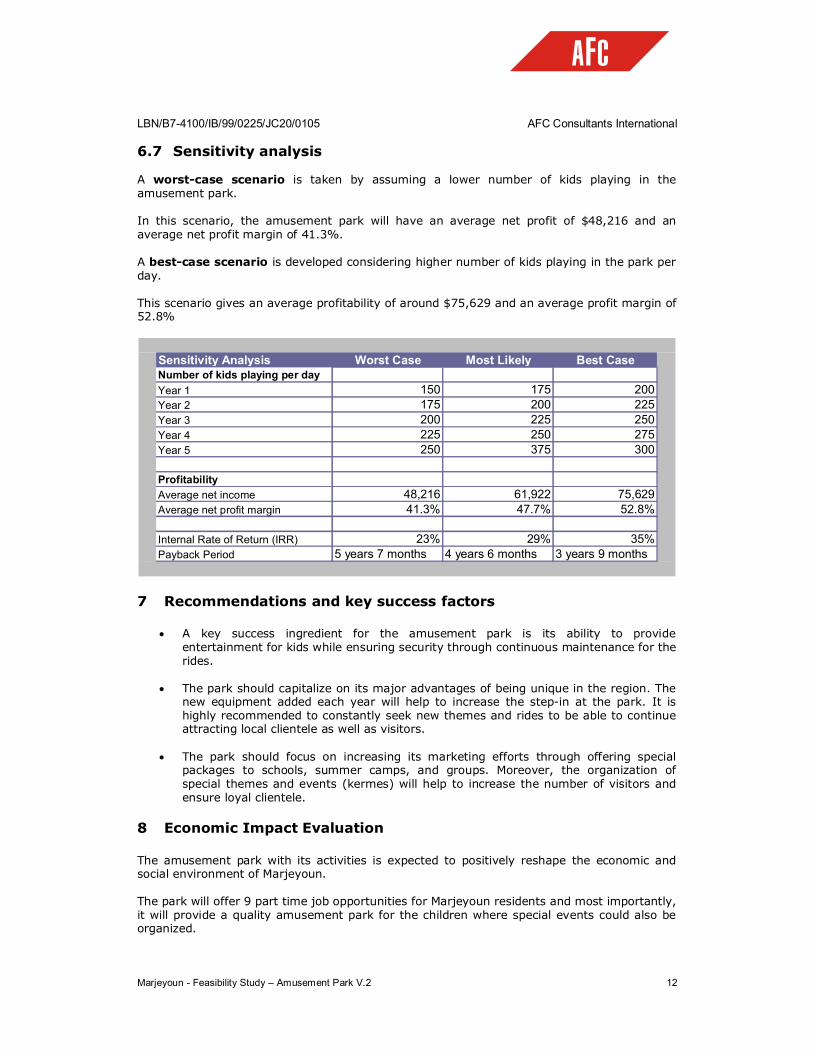
6.7 Sensitivity analysis A worst-case scenario is taken by assuming a lower number of kids playing in the amusement park. In this scenario, the amusement park will have an average net profit of $48,216 and an average net profit margin of 41.3%. A best-case scenario is developed considering higher number of kids playing in the park per day. This scenario gives an average profitability of around $75,629 and an average profit margin of 52.8%
Sensitivity Analysis Worst Case Most Likely Best CaseNumber of kids playing per dayYear 1 150 175 200Year 2 175 200 225Year 3 200 225 250Year 4 225 250 275Year 5 250 375 300
ProfitabilityAverage net income 48,216 61,922 75,629Average net profit margin 41.3% 47.7% 52.8%
Internal Rate of Return (IRR) 23% 29% 35%Payback Period 5 years 7 months 4 years 6 months 3 years 9 months
7 Recommendations and key success factors
A key success ingredient for the amusement park is its ability to provide entertainment for kids while ensuring security through continuous maintenance for the rides.
The park should capitalize on its major advantages of being unique in the region. The
new equipment added each year will help to increase the step-in at the park. It is highly recommended to constantly seek new themes and rides to be able to continue attracting local clientele as well as visitors.
The park should focus on increasing its marketing efforts through offering special
packages to schools, summer camps, and groups. Moreover, the organization of special themes and events (kermes) will help to increase the number of visitors and ensure loyal clientele.
8 Economic Impact Evaluation The amusement park with its activities is expected to positively reshape the economic and social environment of Marjeyoun. The park will offer 9 part time job opportunities for Marjeyoun residents and most importantly, it will provide a quality amusement park for the children where special events could also be organized.